Embed Size (px)
Citation preview

!
!"#$%&#'()*"+,('-./012,&3'%#"1
!
!
Per- and
Polyfluoroalkyl
Substances (PFAS)%%!IMPORTANT) This guidance document was developed for
use on the web. Please review the following disclaimers
before using the PDF version of this web-based document.
• Web-Based formatting may not be optimal when
using this document as a PDF?*
• This is a read-only PDF conversion of the web-based document. Hyperlinks throughout this filehave been disabled.
• Glossary terms are not hyperlinked?*!
*!
July156571Prepared by
The Interstate Technology & Regulatory Council (ITRC)
Per- and Polyfluoroalkyl Substances Team
1

Table of Contents
Home Page ................................................................................................................................ 7 1. Introduction ......................................................................................................................... 10 2. Naming Conventions and Use ............................................................................................ 12
2.1 Environmental Significance .............................................................................................. 14 2.2 Chemistry, Terminology, and Acronyms ………………………………………………………16 2.3 Emerging Health and Environmental Concerns ............................................................... 35 2.4 PFAS Reductions and Alternative PFAS Formulations .................................................... 38 2.5 PFAS Uses ...................................................................................................................... 42 2.6 PFAS Releases to the Environment ................................................................................. 45
3. Firefighting Foam ................................................................................................................ 53 3.1 Foam Formulations .......................................................................................................... 55 3.2 Mechanisms for Release to the Environment ................................................................... 58 3.3 AFFF Procurement and Inventory .................................................................................... 60 3.4 Foam Systems and Operations........................................................................................ 62 3.5 Emergency Firefighting Operations .................................................................................. 64 3.6 Immediate Investigative and Cleanup Actions .................................................................. 71 3.7 Treatment and Disposal ................................................................................................... 73 3.8 Firefighting Foam System Replacement .......................................................................... 75 3.9 Federal, State, and International Regulations and Guidance ........................................... 78 3.10 Foam Research and Development ................................................................................ 82
4. Physical and Chemical Properties .................................................................................... 84 4.1 Challenges and Limitations Related to PFAS and Physical and Chemical Properties ...... 84 4.2 Physical Properties .......................................................................................................... 85 4.3 Chemical Properties ........................................................................................................ 88
5. Fate and Transport ............................................................................................................. 92 5.1 Fate and Transport Introduction ....................................................................................... 92 5.2 Phase Partitioning ........................................................................................................... 95 5.3 Media-Specific Migration Processes .............................................................................. 103 5.4 Transformations ............................................................................................................. 106 5.5 PFAS Uptake into Aquatic Organisms ........................................................................... 111 5.6 PFAS Uptake into Plants .............................................................................................. 115

6. Media Specific Occurence ................................................................................................ 118 6.1 Air .................................................................................................................................. 119 6.2 Soil and Sediments ........................................................................................................ 121 6.3 Groundwater .................................................................................................................. 123 6.4 Surface Water ................................................................................................................ 124 6.5 Biota .............................................................................................................................. 125
7. Health Effects ................................................................................................................... 128 7.1 Human Health Effects .................................................................................................... 128 7.2 Ecological Toxicology .................................................................................................... 135
8. Basis of Regulations ......................................................................................................... 148 8.1 Introduction .................................................................................................................... 148 8.2 Regulatory Programs ..................................................................................................... 149 8.3 Differences in the Available Regulations, Advisories, and Guidance Regulatory ............ 161
9. Site Risk Assessment ....................................................................................................... 169 9.1 Human Health ................................................................................................................ 169 9.2 Ecological Risk Assessment .......................................................................................... 177 9.3 Uncertainty .................................................................................................................... 189
10. Site Characterization ...................................................................................................... 191 10.1 Site Characterization Issues Relevant to PFAS ........................................................... 192 10.2 Initial Steps .................................................................................................................. 194 10.3 Site Investigation ......................................................................................................... 196 10.4 Data Analysis and Interpretation .................................................................................. 199 10.5 Source Identification .................................................................................................... 205
11. Sampling and Analysis ................................................................................................... 208 11.1 Sampling ..................................................................................................................... 209 11.2 Analytical Methods/Techniques ................................................................................... 223 11.3 Data Evaluation ........................................................................................................... 233
12. Treatment Technologies ................................................................................................. 241 12.1 Overview ..................................................................................................................... 242 12.2 Field-Implemented Liquids Treatment Technologies .................................................... 246 12.3 Field-Implemented Solids Treatment Technologies ..................................................... 258 12.4 Incineration .................................................................................................................. 262 12.5 Limited Application and Developing Liquids Treatment Technologies .......................... 263 12.6 Limited Application and Developing Solids Treatment Technologies ........................... 277

12.7 Integrated Remedial Solutions ..................................................................................... 279 12.8 Sustainability of PFAS Treatment ................................................................................ 281 12.9 Improving Evaluation of PFAS Treatment Technologies .............................................. 282
13. Stakeholder Perspectives ............................................................................................... 283 13.1 Stakeholder Concerns ................................................................................................. 285 13.2 Specific Tribal Stakeholder Concerns .......................................................................... 292 13.3 Stakeholder Resources ............................................................................................... 293
14. Risk Communication ...................................................................................................... 294 14.1 Role of Risk Perception: Public Stakeholders and Decision Makers ............................ 295 14.2 Risk Communication Challenges ................................................................................. 297 14.3 Risk Communication Planning and Engagement Tools ................................................ 300
15. Case Studies ................................................................................................................... 312 15.1 Site Characterization Case Studies ............................................................................ 312 15.2 Treatment Case Studies .............................................................................................. 317 15.3 Risk Assessment Case Study ...................................................................................... 331 15.4 Risk Communication Case Study ................................................................................. 334
16. Surface Water Quality ..................................................................................................... 345 16.1 Introduction .................................................................................................................. 345 16.2 Protection of Human Health ......................................................................................... 354 16.3 Protection of Biota ....................................................................................................... 364 16.4 Sampling and Analysis ................................................................................................ 375 16.5 Surface Water Foam .................................................................................................... 379
References ............................................................................................................................ 383 17. Additional Information .................................................................................................... 508
17.1 Additional Information for Media-Specific Occurrence .................................................. 508 17.2 Additional Information for Human Health Effects .......................................................... 525 17.3 Additional Information for Risk Assessment ................................................................. 543
Acronyms .............................................................................................................................. 548 Glossary ............................................................................................................................... 556 Acknowledgements .............................................................................................................. 560 Team Contacts ...................................................................................................................... 573

About ITRC The Interstate Technology and Regulatory Council (ITRC) is a state-led coalition working to reduce barriers to the use of innovative environmental technologies and approaches so that compliance costs are reduced and cleanup efficacy ismaximized. ITRC produces documents and training that broaden and deepen technical knowledge and expedite quality regulatory decision making while protecting human health and the environment. With private and public sector members from all 50 states and the District of Columbia, ITRC truly provides a national perspective. More information on ITRC is available at www.itrcweb.org. ITRC is a program of the Environmental Research Institute of the States (ERIS), a 501(c)(3) organization incorporated in the District of Columbia and managed by the Environmental Council of the States (ECOS). ECOS is the national, nonprofit, nonpartisan association representing the state and territorial environmental commissioners. Itsmission is to serve as a champion for states; to provide a clearinghouse of information for state environmental commissioners; to promote coordination in environmental management; and to articulate state positions on environmental issues to Congress, federal agencies, and the public.
Disclaimer This material was prepared as an account of work sponsored by an agency of the United States Government. Neither the United States Government nor any agency thereof, nor any of their employees, makes any warranty, express or implied, or assumes any legal liability or responsibility for the accuracy, completeness, or usefulness of any information, apparatus, product, or process disclosed, or represents that its use would not infringe privately owned rights. Reference herein to any specific commercial product, process, or service by trade name, trademark, manufacturer, or otherwise does not necessarilyconstitute or imply its endorsement, recommendation, or favoring by the United States Government or any agency thereof. The views and opinions of authors expressed herein do not necessarily state or reflect those of the United StatesGovernment or any agency thereof and no official endorsement should be inferred.
The information provided in documents, training curricula, and other print or electronic materials created by the Interstate Technology and Regulatory Council (“ITRC” and such materials are referred to as “ITRC Materials”) is intended as a general reference to help regulators and others develop a consistent approach to their evaluation, regulatory approval, and deployment of environmental technologies. The information in ITRC Materials was formulated to be reliable and accurate. However, the information is provided “as is” and use of this information is at the users’ own risk.
ITRC Materials do not necessarily address all applicable health and safety risks and precautions with respect to particular materials, conditions, or procedures in specific applications of any technology. Consequently, ITRC recommends consultingapplicable standards, laws, regulations, suppliers of materials, and safety data sheets for information concerning safety and health risks and precautions and compliance with then-applicable laws and regulations. ITRC, ERIS and ECOS shall not be liable in the event of any conflict between information in ITRC Materials and such laws, regulations, and/or other ordinances.The content in ITRC Materials may be revised or withdrawn at any time without prior notice.
ITRC, ERIS, and ECOS make no representations or warranties, express or implied, with respect to information in ITRC Materials and specifically disclaim all warranties to the fullest extent permitted by law (including, but not limited to,merchantability or fitness for a particular purpose). ITRC, ERIS, and ECOS will not accept liability for damages of any kindthat result from acting upon or using this information.
ITRC, ERIS, and ECOS do not endorse or recommend the use of specific technology or technology provider through ITRCMaterials. Reference to technologies, products, or services offered by other parties does not constitute a guarantee by ITRC,ERIS, and ECOS of the quality or value of those technologies, products, or services. Information in ITRC Materials is for general reference only; it should not be construed as definitive guidance for any specific site and is not a substitute forconsultation with qualified professional advisors.
5

PFAS Fact Sheets
This page includes links for the ITRC PFAS fact sheets. The fact sheets are available as PDF files. Several tables
of supporting information are published separately so that they can be updated periodically by ITRC. The fact
sheet user should visit this page to access the current versions of the files.
The references list and an acronyms list are available on the website.
• Naming Conventions (updated August 2020)
• Regulations (updated August 2020)
• PFAS Water and Soil Values Table Excel file– (updated May 2021)
• The Water Table includes the available PFAS water values established by the USEPA, eachpertinent state, or country (Australia, Canada and Western European countries)
• The Soil Table includes the available PFAS soil values established by the USEPA, each pertinentstate, or country (Australia, Canada and Western European countries)
• Basis for PFOA and PFOS Values Tables Excel file (updated March 2020)
• The PFOA Table summarizes the differences in the PFOA values for drinking water in the United
States.
• The PFOS Table summarizes the differences in the PFOS values for drinking water in the United
States.
• History and Use (updated August 2020)
• Fate and Transport and Physical and Chemical Properties (updated August 2020)
• Physical and Chemical Properties Table for select PFAS Excel file (updated April 2020)
• Sampling Precautions and Laboratory Analytical Methods (updated August 2020)
• Site Characterization and Media-Specific Occurrence (updated August 2020)
• Treatment Technologies and Methods (updated August 2020)
• Aqueous Film-Forming Foam (updated August 2020)
• Human and Ecological Health Effects and Risk Assessment (published August 2020)
• Risk Communication (published August 2020)
• Stakeholder Perspectives (published August 2020)
PFAS Explainer Videos
The PFAS Team developed brief explainer videos to accompany the fact sheets. The following links will redirect you
to ITRC’s PFAS Explainer Videos on YouTube:
• ITRC PFAS Team Introduction
• PFAS Naming Conventions
• PFAS History and Use
• PFAS Fate and Transport
• PFAS Remediation
• PFAS Lab Analytical Methods Aqueous Film Forming Foam
Updated November 2020
6

This Interstate Technology and Regulatory Council (ITRC) online document includes the PFAS Technical and Regulatory Guidance Document, PFAS Fact Sheets and Explainer Videos, Training Module Videos and external tables of data and
information prepared by the ITRC PFAS Team. Internal links in the online document will help the reader locate interrelated
topics, refer back to key concepts, and locate references, while external links provide connection to the training module videos, see below, on key topics. Finally, the web-based nature of this document lends itself to updating of key information
in this rapidly evolving subject. It is the intention of ITRC to periodically update the document as significant new information
and regulatory approaches for PFAS develop. The guidance document can be downloaded as a PDF. The Technical and
Regulatory document is designed specifically to support state and federal environmental staff, as well as others (including
stakeholders, project managers, and decision makers), to gain a working knowledge of the current state of PFAS science and
practice. Developed by a team of over 400 environmental practitioners drawn from state and federal government, academia,
industry, environmental consulting, and public interest groups, it also provides a summary of the current understanding of
all aspects of PFAS from a broad perspective. While every effort was made to keep the information accessible to a wide
audience, it is assumed the reader has some basic technical background in chemistry, environmental sciences, and risk
assessment. An Introduction is provided for the document. The document addresses these questions:
Questions Document Sections
What are PFAS?
! Naming Conventions and Use
! Chemistry, Terminology, and Acronyms
! PFAS Uses
! PFAS Releases to the Environment
! Firefighting foams (AFFF)
How do they behave in the environment? ! Physical and Chemical Properties
! Environmental Fate and Transport Processes
! Media-Specific Occurrence
Why are we concerned about PFAS?
! Human and Ecological Health Effects
! Basis of Regulations
! Site Risk Assessment
! Surface Water Quality
How do we evaluate PFAS in the environment? ! Site Characterization
! Sampling and Analytical Methods
! Case Studies
How do we remediate PFAS? ! Treatment Technologies
What are the major concerns of communities and Tribes and how do we
share what we know about PFAS? ! Stakeholder Perspectives
! Risk Communication
7

PFAS Training Module Videos
The PFAS Team developed training module videos to accompany this Technical and Regulatory Document. The following links will redirect you to ITRC’s PFAS Training Module Videos on Youtube:
PFAS introduction
Naming Conventions and Physical and Chemical Properties Production, Uses, Sources and Site Characterization
Sampling and Analysis
Fate and Transport
Human and Ecological Effects
Risk Assessment and Regulations
Treatment Technologies
Aqueous Film-Forming Foam Risk Communication
8

Archived Round Table Sessions
Roundtable Session 1
Roundtable Session 1 Digest
Roundtable Session 2
Published by the Interstate Technology & Regulatory Council, May 2021
ITRC (Interstate Technology & Regulatory Council). 2021. PFAS Technical and Regulatory Guidance Document and Fact
Sheets PFAS-1. Washington, D.C.: Interstate Technology & Regulatory Council, PFAS Team. https://pfas-1.itrcweb.org/"#
9

1 Introduction
A PFAS introduction Video is available.
Per- and polyfluoroalkyl substances (PFAS) constitute a large family of fluorinated chemicals, exceeding several
thousand that might be in commercial use or the environment, that vary widely in their chemical and physical properties. The persistence and mobility of some PFAS, combined with decades of widespread use in industrial
processes, certain types of firefighting foams, and consumer products, have resulted in their being present in
environmental media at trace levels across the globe. PFAS have relatively recently come to the attention of investigators and the public in large part due to the fact that until the early 2000s analytical methods to detect low
levels of PFAS in the environment were available only in a few select research institutions. It was not until the early
2010s that these methods to detect a limited number of PFAS became widely available and had detection limits in
water low enough to be commensurate with levels of potential human health effects. Toxicological studies have
raised concerns regarding the bioaccumulative nature and potential health concerns of some PFAS. As a result, our
understanding of PFAS and the risks they may pose is rapidly evolving.
Broadly speaking, PFAS are characterized as having carbon atoms linked to each other and bonded to fluorine atoms, by which the fluorination imparts properties to the molecule. The carbons may be partially fluorinated
(polyfluorinated) or fully fluorinated (perfluorinated). Modifying characteristics, such as addition of a functional group, other substitutions (for example, chlorine), and partial fluorination, are described in Section 2.2 along with evolving
definitions of PFAS.
This guidance document is designed specifically to support state and federal environmental staff, as well as others
(including stakeholders, project managers, and decision makers), to gain a working knowledge of the current state of PFAS science and practice. Developed by a team of over 400 environmental practitioners drawn from state and
federal government, academia, industry, environmental consulting, and public interest groups, it also provides a
summary of the current understanding of all aspects of PFAS from a broad perspective. While every effort was
made to keep the information accessible to a wide audience, it is assumed the reader has some basic technical background in chemistry, environmental sciences, and risk assessment. The document addresses the following
questions:
Questions Document Sections
What are PFAS?
• Naming Conventions and Use
• Chemistry, Terminology, and Acronyms
• PFAS Uses
• PFAS Releases to the Environment
• Firefighting foams (AFFF)
How do they behave in the environment? • Physical and Chemical Properties
• Environmental Fate and Transport Processes
• Media-Specific Occurrence
Why are we concerned about PFAS?
• Human and Ecological Health Effects
• Basis of Regulations
• Site Risk Assessment
• Surface Water Quality
10

How do we evaluate PFAS in the environment? • Site Characterization
• Sampling and Analytical Methods
• Case Studies
How do we remediate PFAS? • Treatment Technologies
What are the major concerns of communities and Tribes and how
do we share what we know about PFAS? • Stakeholder Perspectives
• Risk Communication
The thousands of chemicals that make up the large family known as PFAS can be divided into two major classes: nonpolymers and polymers. This document focuses primarily on those nonpolymer PFAS that, to date, are most
commonly detected in the environment, particularly the highly persistent perfluoroalkyl acids (PFAAs), some of the better-known replacements for phased-out long-chain PFAAs, and some of the “precursor” chemicals—PFAS that can
break down to form PFAAs. These precursors include polyfluorinated alkyl substances and a subset of polymer PFAS
known as side-chain fluorinated polymers (Washington et al. 2018). Many polymer PFAS, especially certain high–molecular weight fluoropolymers, are insoluble in the environment and not bioavailable, and therefore less of a
concern to human and ecological health (Henry et al. 2018), so are not discussed in detail in this document. As this
paragraph illustrates, it is important to be very clear about which PFAS is being discussed and what its particular physical and chemical properties are, and that is where this document begins.
The physical and chemical properties that make some PFAS persistent and mobile in the environment also make them particularly challenging to analyze and remediate. Analytical methods sensitive enough to detect
environmentally relevant concentrations became widely available in the early 2010s. Although analyte lists continue
to expand, currently available methods still only allow identification of a small fraction of the thousands of PFAS that
have reportedly been created and used since the 1950s. As existing analytical methods improve and new, nontargeted analyses become commercially available, it is likely that additional PFAS and new release sites will be
identified.
Concerns have been raised regarding human health and ecological risks associated with certain PFAS. These are
based on widespread detections of some PFAS in humans and wildlife, evidence that certain PFAS bioaccumulate in
individuals and bioconcentrate in the food chain, and studies reporting multiple toxicological effects in animals and
potential health effects in humans. However, risk assessment of PFAS is hampered by the unique physical and
chemical properties of many PFAS, which result in uncertainty in identifying sources and quantifying source area
mass, complex fate and transport in the environment, poorly understood biological and chemical transformation
pathways, and unique bioaccumulation processes. Moreover, the widespread presence of some PFAS in environmental media and the many potential PFAS sources also complicate interpretation of site data. Data evaluation
methods to help distinguish between site-specific anthropogenic “background” PFAS, PFAS that are site-related, and
PFAS from another nearby source are still being developed.
As with other emerging contaminants, our evolving understanding of PFAS and the volume of scientific studies
makes it difficult for most environmental practitioners to stay current with the critical information about these chemicals.
Meanwhile, public concern about PFAS has created pressure on state and federal agencies to take action, resulting
in a patchwork of evolving regulatory approaches and regulatory standards, screening values, and guidance values. As with any new and evolving area of science, our knowledge is far from complete. We have attempted to alert the
reader to areas where information is still uncertain or conflicting interpretations exist.
Updated May 2021
11
2 PFAS Chemistry and Naming Conventions, History and Use of PFAS, and Sources of PFAS Releases to the Environment The PFAS Team developed two training module videos with content related to this section, they are the Naming Conventions and Physical and Chemical Properties video and the Production, Uses, Sources and Site Characterization video.
PFAS chemistry was unintentionally discovered in 1938 by Roy J. Plunkett at the DuPont Company’s Jackson
Laboratory with the accidental synthesis of polytetrafluoroethylene (PTFE) while conducting commercial
experiments with chlorofluorocarbon refrigerants (Science History Institute 2017).
Since the 1950s, many products commonly used by consumers and industry have been manufactured with or
from PFAS, as the unique physical and chemical properties of PFAS impart oil, water, stain, and soil repellency,
chemical and thermal stability, and friction reduction to a range of products. These products have applications in many industries, including the aerospace, semiconductor, medical, automotive, construction, electronics,
and aviation industries, as well as in consumer products (such as carpets, clothing, furniture, outdoor
equipment, food packaging), and firefighting applications (3M Company 1999; Buck et al. 2011; KEMI 2015; USEPA 2017).
The number of PFAS and their uses have expanded over the years. It has been estimated that the PFAS family
may include approximately 5,000–10,000 chemicals (USEPA 2018). A recent inventory of PFAS identified more
than 4,700 PFAS with Chemical Abstracts Service (CAS) Registry Numbers that could have been, or may be, on the global market (OECD 2018), although the uses of each of these PFAS may not be known (KEMI 2015). Publicly
available health and toxicity studies are limited to only a small fraction of these PFAS, and modern commercially
available analytical technologies typically identify only about 20–30 PFAS but are increasing.
Scientific, regulatory, and public concerns have emerged about potential health and environmental impacts
associated with chemical production, product manufacture and use, and disposal of PFAS-containing wastes.
These concerns have led to efforts to reduce the use of or replace certain PFAS, such as certain long-chain
perfluoroalkyl carboxylates, long-chain perfluoroalkyl sulfonates and their precursors, including two widely
produced, commonly encountered, and most studied compounds: perfluorooctane sulfonic acid (PFOS) and perfluorooctanoic acid (PFOA) (USEPA 2016; WA DER 2017).
PFAS have followed a similar pattern of emergence and awareness exhibited by many other anthropogenic environmental contaminants. Figure 2-1 provides a general timeline of PFAS emergence and awareness that
includes categories of 1) synthesis/development, 2) commercial production, 3) health concerns, 4)
environmental detection, and 5) reduction/alternatives.
12

Figure 2-1. General timeline of PFAS emergence and awareness.
Graphic is intended to provide a general sense of PFAS emergence and awareness (with emphasis on long-chain
perfluoroalkyl acids [PFAAs]) by decade with initial activity or precipitating event indicated for the start of each phase of
emergence. It is not intended to be exhaustive or precise. Reduction/alternatives includes other PFAS that have replaced
legacy chemistry.
Source: J. Hale, Parsons. Used with permission
The objective of this section is to lay a foundation for identifying potential PFAS sources in the environment.
Section Number Topic
2.1 Environmental Significance
2.2 Chemistry, Terminology, and Acronyms
2.3 Emerging Health and Environmental Concerns
2.4 PFAS Reductions and Alternative PFAS Formulations
2.5 PFAS Uses
2.6 PFAS Releases to the Environment
Updated May 2021.
13

2.1 Environmental SignificancePFAS have been and still are widely used, but not all types and uses of PFAS result in the same level of environmental impactand exposure. When considering potential environmental impacts from PFAS, it is critical to be as specific as possible notonly about the particular PFAS involved, but also where and how they are released to the environment. For example, astable, insoluble fluoropolymer such as polytetrafluoroethylene (PTFE) may pose little environmental or health risk once it isin a product, but potentially significant environmental releases may occur if controls are not used during PTFEmanufacturing, when nonpolymer PFAS, such as PFAAs, are used to make the PTFE. Such considerations may help to focusinvestigation resources on major sources.
Figure 2-2 illustrates a conceptual PFAS lifecyle beginning at PFAS synthesis (raw materials). These raw materials are thenused in a variety of manufacturing processes and industrial/commercial applications to create commercial and consumerproducts that contain or were treated with PFAS. Throughout this life cycle, variable types and amounts of PFAS may bereleased to the environment from manufacturing waste streams, fugitive emissions, spills, disposal of PFAS-containing or -treated materials, and general wear and tear of consumer products. Sometimes the intended use of the PFAS product (forexample, firefighting foams) requires direct release to the environment. PFAS from a host of sources also may beaggregated in wastewater treatment plant effluent and sludges, creating secondary release sources. The volume,concentration, and mixture of PFAS released to the environment varies based on the source (process, material, or product),release mechanism(s), and environmental controls employed throughout this life cycle. Exposure to PFAS may occur as (1)direct interaction with the manufacturing process, (2) professional or intensive use of PFAS-containing materials, (3) use ofor contact with commercial and consumer products containing PFAS, or (4) exposure (human or ecological) to environmentalmedia that has been impacted by PFAS. The relative significance of these exposures will also vary widely.
Figure 2-2. Generalized PFAS uses and relative exposure and environmental impact potential from PFAS lifecycle.
This figure is not exhaustive with regard to all sources or release mechanisms from those sources. Multiple sources mayexist at a site, and the relative potential of exposure and environmental impact may vary based on several considerations.
14

Due to the widespread use of PFAS in commercial and consumer products, other minor point and diffuse releases of PFAS to the environment may occur during use and disposal of some PFAS-containing products. Although these may result in locally significant environmental impacts, these releases typically affect smaller geographic areas and have lower total PFAS mass than major sources, such as PFAS chemical manufacturing, PFAS use in certain industries, and application of certain firefighting foams.
Different PFAS products and sources differ in their relative environmental significance, volumes released, distribution mechanisms, area affected, and relative concentration of impacted media. For instance, application of Class B firefighting foam may impact a moderate area relative to air dispersion from fluoropolymer production, but may exhibit higher associated groundwater concentrations near the source area.
The type of PFAS involved also determines the relative environmental significance. Nonpolymer PFAS (both per- and polyfluorinated) and some side-chain fluorinated polymer PFAS are likely to pose greater risks when released to the environment than certain fluoropolymer sources, such as the fluoropolymers PTFE, fluorinated ethylene-propylene (FEP), perfluoroalkoxy polymer (PFA), and ethylene tetrafluoroethylene (ETFE). These fluoropolymers are considered to be polymers of low concern (Section 2.2.2.1) because they are relatively stable, insoluble in the environment, and not bioavailable (Henry et al. 2018). However, environmental impact from the production or manufacturing uses of some fluoropolymers can pose a significant risk if emissions are not properly controlled at the industrial site. Also, releases to the environment from the disposal of fluoropolymers cannot be ruled out, as nonpolymer PFAS (such as the PFAAs used as polymerization aids) may be found at trace levels as impurities and byproducts in some fluoropolymer products (3M Company 1999). Research suggests side-chain fluorinated polymers and fluorotelomer-based polymers are likely to break down into nonpolymer PFAS with time (Li et al. 2018; Washington et al. 2018), although it is documented that one fluoropolymer (PTFE) did not degrade to significant levels of PFAAs during incineration (Aleksandrov et al. 2019).
Finally, another consideration regarding environmental impacts is the issue of anthropogenic (human-caused, not naturally occurring) ambient or “background” levels of PFAS. As discussed in Section 6, the long duration of PFAS use and their release from many types of sources may have resulted in low-level contamination of environmental media worldwide. The implications of such ambient levels of PFAS should be considered in evaluating exposures and risk levels, establishing site action levels and cleanup goals, and identifying PFAS sources.
Updated September 2020.
15

2.2 Chemistry, Terminology, and AcronymsThis section focuses on chemistry, terminology, names, and acronyms for those PFAS most commonly reported in theenvironment, identified in scientific literature, and those PFAS most commonly tested for by current analytical methods.Other important classes of PFAS are introduced. This section also introduces the chemical manufacturing processes thatinfluence the types of PFAS that are found in the environment.
There is no universally accepted definition of PFAS. However, in general, PFAS are characterized as having carbon atomslinked to each other and bonded to fluorine atoms at most or all of the available carbon bonding sites. An early and widelyrecognized technical definition of PFAS is provided by Buck et al. (2011), who defined PFAS as, “highly fluorinated aliphaticsubstances that contain one or more carbon (C) atoms on which all the hydrogen (H) substituents (present in thenonfluorinated analogues from which they are notionally derived) have been replaced by fluorine (F) atoms, in such amanner that they contain the perfluoroalkyl moiety CnF2n+1 –.”
The definition of PFAS continues to evolve to reflect continued study of these compounds and takes different formsdepending on the operational criteria used and the intended scope and application of the included list of chemicals. Forexample, the definition of PFAS used in one study (OECD 2018) expanded the Buck et al. (2011) definition to includechemicals that contain the – CnF2n – moiety in addition to the CnF2n+1 – moiety, which encompasses chemicals with both endsof the carbon-fluorine chain connected to a hydrogen or a functional group, as well as cyclic analogs of linear PFAS.
As another example, the Michigan PFAS Action Response Team (MPART) offered a working description of perfluoroalkylsubstances, stating that the basic chemical structure is a chain (or tail) of two or more adjacent carbon atoms with acharged functional group head attached at one end. The functional groups commonly are carboxylates or sulfonates, butother forms are also detected in the environment. For a linear or branched aliphatic tail, this structure can be written as:CnF2n+1-R where “CnF2n+1” defines the length of the perfluoroalkyl chain tail, “n” is ≥2, and “R” represents the attachedfunctional group head. The tail may be linear or branched, or contain a cyclic portion, but it always contains adjacentfluorinated carbon atoms in a CnF2n+1 – moiety (with n≥2). The functional group may contain one or more carbon atoms,which are included in the total number of carbons when naming the compound (MI EGLE 2020). Section 2.2.4 of thisdocument describes polyfluoroalkyl substances. An emerging subject of discussion is whether the presence of an aromaticcomponent in a chemical’s structure still constitutes classification as PFAS. Arguments for such classification inclusioninclude cases where a perfluorinated compound could result from reaction or biotransformation.
The USEPA’s CompTox Chemicals Dashboard provides a large publicly available resource for PFAS structures and predictedproperties, and has expanded beyond coverage of the OECD list cited above (Williams et al. 2017). This effort has taken twoapproaches to defining PFAS. The first, denoted PFASMASTER (USEPA 2020), was based on a simple join, or combination, ofpublicly available lists of PFAS chemicals reported by other entities, such as the OECD (2018) report. The second approachapplied a small set of structure filters to the entire EPA DSSTox database (currently exceeding 900,000 substances),resulting in a list containing more than 8,000 PFAS structures, denoted PFASSTRUC (USEPA 2020). The PFASMASTER filecurrently exceeds 9,200 substances and includes both PFAS structures (from PFASSTRUC) and structures and non-structurable chemicals (such as mixtures and polymers) from combining several public PFAS lists. Hence, the structure-based filters used in this effort expand the PFAS definition beyond the Buck et al. (2011) and OECD (2018) definitions andare designed to fully encompass publicly available PFAS lists, as well as to be inclusive of small, fluorinated chemicals ofpotential concern to USEPA.
Whereas PFAS definitions such as provided by USEPA’s CompTox Dashboard are designed to be broadly inclusive, regulatoryapplications often must be more circumscribed and precisely worded.
16

General Concepts of Organofluorine Chemistry for PFAS
Organofluorine Chemistry: A branch of organic chemistry involving organic molecules with a carbon-fluorine bond.Organofluorine molecules have many commercial uses. They include PFAS, such as PFOA, shown below:
EXAMPLE: 3D model of a PFOA (perfluorooctanoic acid) molecule, in its acid form.Source: Manuel Almagro Rivas (Own work using: Avogadro, Discovery Studio, GIMP) [CC BY-SA 4.0 ]
(https://creativecommons.org/licenses/by-sa/4.0)], via Wikimedia Commons.https://commons.wikimedia.org/wiki/File:PFOA-3D.png
Gray spheres represent carbon atoms linked together in a chain; there are eight of them, so “octane” is used in thename. Green spheres represent fluorine atoms bonded to carbon atoms. Red spheres represent oxygen atoms. Whitesphere represents a hydrogen atom that dissolves away in water, which makes this an acid. Fluorine atoms areattached to all possible bonding sites, making this perfluorinated. If some of the fluorine atoms were replaced byother atoms (such as oxygen or hydrogen), it would be polyfluorinated. Without the hydrogen, the “head end” takeson a negative charge and can bond to things through electrostatic attraction. The fluorine “tail end” is strong andstable, giving it lipid- and water-repelling properties, but also making it persistent in the environment.
Isomer: A molecule with the same molecular formula as another molecule, but with a different chemical structure.Isomers contain the same number of atoms of each element, but have different arrangements of their atoms. SeeFigure 2-15 for an example; linear and branched PFOS contain the same number of carbon, fluorine, oxygen, andsulfur atoms, but these atoms are arranged differently depending on whether it is a linear or branched isomer ofPFOS.
Homologue Groups and Homologous Series: A group of organic compounds, usually listed in order of increasingsize, that has a similar structure (and therefore also similar properties) and whose structures differ only by thenumber of carbon atoms in the chain. For example, all of the linear and branched isomers of PFOS would be in the C8
homologue group, while all of the linear and branched isomers of perfluorohexane sulfonic acid (PFHxS) would be inthe C6 homologue group. The C4-C12 PFSAs are a homologous series of perfluorosulfonates.
2.2.1 Naming Convention Considerations
“PFAS,” not “PFASs”: The acronym “PFAS” stands for “per-and polyfluoroalkyl substances.” No single chemical within thePFAS family can be both perfluorinated and polyfluorinated, soby definition “PFAS” is plural and a small “s” is not needed.Some authors elect to add a small “s” to this acronym (PFASs)to emphasize the fact that it is plural, but it is not needed.When referring to a single chemical within the PFAS family, itis more accurate to simply name that specific chemical.
There is confusion among the environmentalcommunity and the public due to overgeneralizationwhen describing PFAS and the lack of consistent namingof specific PFAS. The use of consistent namingconventions would reduce confusion and supportclearer communication (Buck et al. 2011; Wang, DeWitt,et al. 2017).
The use of nonspecific acronyms, such as perfluorinatedcompound (PFC), has hampered clarity of investigative
Consistent naming also helps to distinguish PFAS fromother organic compounds that contain fluorine. Asdefined in the literature, PFAS include only fluorinated
17

results. The acronym “PFC” is poorly defined in the scientificliterature, but typically refers to “perfluorinated compounds.”It does not include “polyfluorinated substances,” which areincreasingly recognized as important contaminants at manyPFAS sites.
aliphatic (carbon chain) substances. PFAS do notinclude fluorinated compounds that contain aromatic(carbon ring) features in their structures (for example,active pharmaceutical ingredients, crop protectionagents, or chlorofluorocarbons [refrigerants]). Thisdefinition distinguishes PFAS from the more genericterm “PFC,” which can include aromatic compounds.
In the future, it may be necessary to expand the current naming conventions and acronym approaches to ensure thatstandardized naming is available for additional members of the PFAS family of compounds. Buck et al. (2011) is an open-access paper that provides a more detailed explanation of PFAS terminology, classification, and origins, and recommendsspecific and descriptive terminology, names, and acronyms for PFAS.
Chemicals in the PFAS family can exist in various ionic states(for example, acids, anions, cations), which have importantimplications for their chemical and physical properties. Inmost cases for PFAAs, this section uses the anionic form of agiven PFAS name, as this is the state in which most PFAAsexist in the environment.
CAS numbers are another helpful tool for clearlyidentifying the chemical that is being referenced;however, care must be taken in selecting the correctCAS number to avoid confusion regarding the chemistryand behavior of the chemical being described. SomePFAS may occur in various ionic states, such as acids,anions (negatively charged), cations (positivelycharged), and zwitterions (both positively andnegatively charged dipolar molecules), and each has itsown CAS number (and some have no CAS number). Theionic state determines electrical charge and physicaland chemical properties, which in turn control fate andtransport in the environment and potential humanhealth and ecological effects. The ionic state ofindividual PFAS can result in significantly differentphysical and chemical properties, such as solubility,volatility, and bioaccumulative potential.
2.2.2 Introduction to the PFAS FamilyPFAS are comprised of a wide variety of molecules with different physical and chemical properties and molecular weightswith perfluoroalkyl moieties as common structural features (Cousins et al. 2020). Cousins et al. (2020) noted specifically:
“…the PFAS class comprises distinct substances with very different structures and properties: high-molecular-weightpolymers and high-molecular-weight non-polymers; neutral, anionic, cationic and zwitterionic substances; solids, liquids, andgases; highly reactive and non-reactive (inert) substances; soluble and insoluble substances; and volatile and involatilesubstances. In the environment, some PFAS are mobile and others immobile, and some bioaccumulate while others do not.”
This variety of PFAS with diverse properties is organized in the form of a PFAS family tree (Figure 2-3) that includes twoprimary classes: polymers and nonpolymers. Each class may contain many subclasses, groups, and subgroups, some ofwhich are shown in the figure. This document focuses primarily on those nonpolymer PFAS most commonly detected in theenvironment and those PFAS that may be significant as “precursors” that can transform to more persistent forms.
18

Figure 2-3. The PFAS family.
The family tree is further expanded in Figure 2-4, based on nomenclature provided in Buck et al. (2011), Organization forEconomic Co-operation and Development OECD (2015), and Wang et al. (2017), with further introduction to some of thesechemicals provided later in this section.
Future updates to the family tree and nomenclature are expected to be necessary given the evolving public knowledge ofthese compounds. For example, other PFAS without analytical standards are being identified using nontarget analyses byresearch laboratories (Section 11). These PFAS do not necessarily have an associated CAS number but are being identifiedby molecular structure. Naming conventions and categories of PFAS are developed as a means to communicate, manage,and address this class of many chemicals, which can include alternate naming conventions and a variety of rationales forassigning categories
19

20

Figure 2-4. PFAS family tree.Adapted from a graphic provided courtesy of Paul Caprio, EA Engineering.
A stand-alone PDF version of Figure 2-4 is available.
2.2.2.1 Polymer PFASPolymers are large molecules formed by combining many identical smaller molecules (or monomers (which are shorter chainmolecules with no repeating units)) in a repeating pattern. Oligomers are smaller polymers, with relatively fewer repeatingunits.
The PFAS polymer class includes fluoropolymers, polymeric perfluoropolyethers, and side-chain fluorinated polymers (Henryet al. 2018; Buck et al. 2011; Wang, Cousins, et al. 2013):
Fluoropolymers contain a carbon-only polymer backbone with fluorines directly attached to the carbon.Fluoropolymers include polymers like PTFE, ETFE, copolymer FEP, and PFA, which were historically made usingammonium perfluoroocanoate (APFO) or sodium perfluorooctanoate (NaPFO), which are salts ofperfluorooctanoate (PFOA). Fluoropolymers also include polyvinylidene fluoride (PVDF), which was historicallymade using ammonium perfluoronanoate (APFN), the ammonium salt of perfluorononanoate (PFNA) (OECD2015b ; Buck et al. 2011).The specific fluoropolymers PTFE, FEP, ETFE, and PFA have been referred to as “polymers of low concern”because they have high molecular weight and are extremely stable. PTFE has been demonstrated to not bebioavailable (Henry et al. 2018). Based on this, Henry et al. (2018) suggest polymers of low concern should beconsidered separately from other PFAS when evaluating risk. Polymers of low concern are reported to pose littleenvironmental or health risk once in a consumer product.Polymeric perfluoropolyethers (PFPE) contain a carbon and oxygen polymer backbone with fluorines directlyattached to carbon. Relatively little is known about these chemicals in the environment.Side-chain fluorinated polymers contain a nonfluorinated polymer backbone, off of which fluorinated side chainsbranch. These PFAS include fluorinated urethane polymers, fluorinated acrylate/methacrylate polymers, andfluorinated oxetane polymers. Some side-chain fluorinated polymers may become precursors for PFAAs, Section2.2.3.1, when the point of connection of a fluorinated side chain on a polymer is broken to release a PFAA.
During the manufacture and manufacturing uses of some fluoropolymers, controls are necessary to mitigate potentialreleases of nonpolymer PFAS. Nonpolymer PFAS may be used as processing aids in the manufacture of some fluoropolymerPFAS, and may be found as impurities in some fluoropolymer products, and due to potential degradation of somefluoropolymers (3M Company 1999; CalEPA 2018; Washington et al. 2018), see also Section 5.4.5.
2.2.2.2 Nonpolymer PFASNonpolymer PFAS encompass two major subclasses: perfluoroalkyl substances and polyfluoroalkyl substances, whichinclude many groups and subgroups of chemicals. Figure 2-5 provides general classification and chemical structures,examples of each group, and examples of the primary uses of the nonpolymer PFAS highlighted in Figure 2-3 and Figure 2-4.
Nonpolymer PFAS were selected as the focus of this document because:
they are the PFAS most commonly detected (to date) in humans, biota, and other environmental media andappear to be relatively more abundant at PFAS investigation sites (Section 6)data may be available regarding potential human health and ecological effects from environmental exposure forsome of these chemicals (Section 7)state or federal standards or guidance values may exist for some of these chemicals (Section 8)they are included in most laboratory PFAS analyte lists (Section 11).
21

22

Figure 2-5. Nonpolymer PFAS subclasses discussed in this document.Source: Adapted with permission from Buck, R.C., J. Franklin, U. Berger, J. M. Conder, I. T. Cousins, P. de Voogt, A. A. Jensen,K. Kannan, S. A. Mabury, and S. P. van Leeuwenet. 2011. “Perfluoroalkyl and Polyfluoroalkyl Substances in the Environment:Terminology, Classification, and Origins.” Integrated Environmental Assessment and Management, 7:513-541. Open access.
Copyright 2011 SETAC. http://dx.doi.org/10.1002/ieam.258
2.2.3 Perfluoroalkyl SubstancesPerfluoroalkyl substances are fully fluorinated alkane molecules that include (but are not limited to):
perfluoroalkyl acids (PFAAs) andperfluoroalkane sulfonamides (FASAs).
The basic chemical structure is a chain (or tail) of two or more carbon atoms with a charged functional group (or head)attached at one end. The functional groups commonly are carboxylates or sulfonates, but other forms are also detected inthe environment. Fluorine atoms are attached to all possible bonding sites along the carbon chain of the tail, except for onebonding site on the last carbon where the functional group head is attached. This structure, which is illustrated in Figure 2-6for PFOS and PFOA, can be written as:
CnF2n+1-R
where “CnF2n+1” defines the length of the perfluoroalkyl chain tail, “n” is >2, and “R” represents the attached functional group
head. Note that the functional group may contain one or more carbon atoms, which are included in the total number ofcarbons when naming the compound.
Figure 2-6. The tail and head structure of PFOS and PFOA molecules.
2.2.3.1 Perfluoroalkyl Acids (PFAAs)PFAAs are some of the least complex PFAS molecules. They are essentially non-degradable under normal environmentalconditions. Biotic and abiotic degradation of many polyfluoroalkyl substances may result in the formation of PFAAs. As aresult, PFAAs are sometimes referred to as “terminal PFAS” or “terminal degradation products,” meaning no furtherdegradation products will form from them under environmental conditions. Polyfluoroalkyl substances that degrade to createterminal PFAAs are referred to as “precursors.” Longer chain PFAAs do not degrade to shorter chain PFAAs.
The PFAA group is divided into two major subgroups (as shown in Table 2-1 and Figure 2-4).
Perfluoroalkyl carboxylic acids (PFCAs), or perfluoroalkyl carboxylates, are used commercially and can beformed as terminal degradation products of select precursor polyfluoroalkyl substances, such as FTOHs. Anexample PFCA is PFOA.
Perfluoroalkane sulfonic acids (PFSAs), or perfluoroalkyl sulfonates, also are used commercially and can beformed as terminal degradation products of select precursor polyfluoroalkyl substances, such as perfluoroalkylsulfonamide ethanols (PFOSEs). An example PFSA is PFOS.
Other subgroups of PFAAs are introduced in Section 2.2.3.3. Some of those are compounds that are receiving increasing
23

attention, are being added to commercial laboratory target analyte lists, and are being detected in the environment.
PFAAs are the group of PFAS that make up the majority of PFAS typically included in commercial laboratory target analytelists and are the primary PFAS for which federal or state health-based guidance values have been established. As a result,PFAAs tend to drive site investigation and remediation decisions, so it is helpful to understand the naming conventions forthis class. Many of the commonly detected PFAAs are denoted using the structural shorthand:
PFXY where:
PF = perfluoro
X = the carbon chain length (using the same naming conventions as hydrocarbons based on the number of carbons (forexample, B for butane or 4 carbons, Pe for pentane or 5 carbons)
Y = the functional group (for example, A = carboxylate or carboxylic acid and S = sulfonate or sulfonic acid)
Table 2-1 illustrates how this naming structure works for the PFCAs and PFSAs, which collectively are referred to as PFAAs.
Table 2-1. Basic naming structure and shorthand for PFAAs
X Y Acronym Name Formula CAS No.
B = buta(4 carbon)
A = carboxylate orcarboxylic acid
PFBAPerfluorobutanoate1 C3F7CO2
– 45048-62-2
Perfluorobutanoic acid1 C3F7COOH 375-22-4
S = Sulfonate or sulfonicacid
PFBSPerfluorobutane sulfonate C4F9SO3
– 45187-15-3
Perfluorobutane sulfonic acid C4F9SO3H 375-73-5
Pe = penta(5 carbon)
A = Carboxylate orcarboxylic acid
PFPeAPerfluoropentanoate C4F9CO2
– 45167-47-3
Perfluoropentanoic acid C4F9COOH 2706-90-3
S = Sulfonate or sulfonicacid
PFPeSPerfluoropentane sulfonate C5F11SO3
– 175905-36-9
Perfluoropentane sulfonic acid C5F11SO3H 2706-91-4
Hx = hexa(6 carbon)
A = Carboxylate orcarboxylic acid
PFHxAPerfluorohexanoate C5F11CO2
– 92612-52-7
Perfluorohexanoic acid C5F11COOH 307-24-4
S = Sulfonate or sulfonicacid
PFHxSPerfluorohexane sulfonate C6F13SO3
– 108427-53-8
Perfluorohexane sulfonic acid C6F13SO3H 355-46-4
Hp = hepta(7 carbon)
A = Carboxylate orcarboxylic acid
PFHpAPerfluoroheptanoate C6F13CO2
– 120885-29-2
Perfluoroheptanoic acid C6F13COOH 375-85-9
S = Sulfonate or sulfonicacid
PFHpSPerfluoroheptane sulfonate C7F15SO3
– 146689-46-5
Perfluoroheptane sulfonic acid C7F15SO3H 375-92-8
O = octa(8 carbon)
A = Carboxylate orcarboxylic acid
PFOAPerfluorooctanoate C7F15CO2
– 45285-51-6
Perfluorooctanoic acid C7F15COOH 335-67-1
S = Sulfonate or sulfonicacid
PFOSPerfluorooctane sulfonate C8F17SO3
– 45298-90-6
Perfluorooctane sulfonic acid C8F17SO3H 1763-23-1
24

X Y Acronym Name Formula CAS No.
N = nona(9 carbon)
A = Carboxylate orcarboxylic acid
PFNAPerfluorononanoate C8F17CO2
– 72007-68-2
Perfluorononanoic acid C8F17COOH 375-95-1
S = Sulfonate or sulfonicacid
PFNSPerfluorononane sulfonate C9F19SO3
– 474511-07-4
Perfluorononane sulfonic acid C9F19SO3H 68259-12-1
D = deca(10 carbon)
A = Carboxylate orcarboxylic acid
PFDAPerfluorodecanoate C9F19CO2
– 73829-36-4
Perfluorodecanoic acid C9F19COOH 335-76-2
S = Sulfonate or sulfonicacid
PFDSPerfluorodecane sulfonate C10F21SO3
– 126105-34-8
Perfluorodecane sulfonic acid C10F21SO3H 335-77-3
Un = undeca(11 carbon)
A = Carboxylate orcarboxylic acid
PFUnA orPFUnDA
Perfluoroundecanoate C10F21CO2– 196859-54-8
Perfluoroundecanoic acid C10F21COOH 2058-94-8
S = Sulfonate or sulfonicacid
PFUnSPFUnDS
Perfluoroundecane sulfonate C11F23SO3– 441296-91-9
Perfluoroundecane sulfonic acid C11F23SO3H 749786-16-1
DoD =dodeca(12 carbon)
A = Carboxylate orcarboxylic acid
PFDoDAPerfluorododecanoate C11F23CO2
– 171978-95-3
Perfluorododecanoic acid C11F23COOH 307-55-1
S = Sulfonate or sulfonicacid
PFDoDSPerfluorododecane sulfonate C12F25SO3
– 343629-43-6
Perfluorododecane sulfonic acid C12F25SO3H 79780-39-5
TrD =trideca(13 carbon)
A = Carboxylate orcarboxylic acid
PFTrDAPerfluorotridecanoate C12F25CO2
– 862374-87-6
Perfluorotridecanoic acid C12F25COOH 72629-94-8
S = Sulfonate or sulfonicacid
PFTrDSPerfluorotridecane sulfonate C13F27SO3
– NA
Perfluorotridecane sulfonic acid C13F27SO3H NA
TeD =tetradeca(14 carbon)
A = Carboxylate orcarboxylic acid
PFTeDAPerfluorotetradecanoate C13F27CO2
– 365971-87-5
Perfluorotetradecanoic acid C13F27COOH 376-06-7
S = Sulfonate or sulfonicacid
PFTeDSPerfluorotetradecane sulfonate C14F29SO3
– NA
Perfluorotetradecane sulfonic acid C14F29SO3H NA
NA = not available1Older nomenclature may use butyrate or butyric acid.
Note that for PFCAs, the total number of carbons used for naming the compound includes the carbon in the carboxylic acidfunctional group (COOH). For example, although PFOA has seven carbons in its fluoroalkyl tail, all eight of the carbons in themolecule are used to name it, hence perfluorooctanoate. But in terms of chemical behavior, PFOA would be more analogousto seven-carbon perfluoroheptane sulfonate (PFHpS) than to eight-carbon perfluorooctane sulfonate (PFOS).
Table 2-1 shows the PFAA names and formulas in both the anionic (also referred to as “deprotonated” or negatively charged)and acid (also referred to as protonated or neutral) forms. The anionic form is the state in which PFAAs are found in theenvironment, except in very rare situations (for example, extremely low pH). The anionic and acid forms of PFAA names areoften incorrectly used interchangeably (for example, perfluorooctane sulfonate and perfluorooctane sulfonic acid), and thesame acronym (in this case, PFOS) applies to both forms. However, as discussed below and in Section 4, their physical and
25

chemical properties are different, and it is important to know which form is being described.
Until recently, PFCAs and PFSAs have been the subgroups most commonly tested for in the environment; however, a widerange of PFAS with other functional groups exists for which the same “PFXY” shorthand shown above may or may not apply.For naming conventions for these compounds, please refer to Buck et al. (2011).
2.2.3.2 Long-Chain Versus Short-Chain DistinctionPFAS, predominantly PFAAs, are sometimes described as long-chain and short-chain as a shorthand way to categorize PFCAsand PFSAs that may behave similarly in the environment; however, it is important not to generalize about PFAA behaviorbased only on chain length. As recent research suggests, other factors besides chain length may affect bioaccumulationpotential of PFAS (Ng and Hungerbühler 2014).
According to the OECD (2013):
Long-chain refers to:PFCAs with eight or more carbons (seven or more carbons are perfluorinated)PFSAs with six or more carbons (six or more carbons are perfluorinated)
Short-chain refers to:PFCAs with seven or fewer carbons (six or fewer carbons are perfluorinated)PFSAs with five or fewer carbons (five or fewer carbons are perfluorinated)
Table 2-2 illustrates the differences in the short-chain and long-chain PFCAs and PFSAs.
Table 2-2. Short-chain and long-chain PFCAs and PFSAs
Number of Carbons 4 5 6 7 8 9 10 11 12
PFCAsShort-chain PFCAs Long-chain PFCAs
PFBA PFPeA PFHxA PFHpA PFOA PFNA PFDA PFUnA PFDoA
PFSAsPFBS PFPeS PFHxS PFHpS PFOS PFNS PFDS PFUnS PFDoS
Short-chain PFSAs Long-chain PFSAs
Anions Versus Acids
As noted above, the names for the anionic and acid forms of PFAAs are often used interchangeably, but it is critical to knowwhich form is being discussed because of differences in their physical and chemical properties and behavior in theenvironment (Section 6). Some important things to keep in mind regarding the anionic versus acid forms are:
Most PFAAs are present in environmental and human matrices in their anionic form. For example, PFOS ispresent in the environment in the anionic form, perfluorooctane sulfonate.
Although laboratories may be reporting PFOA or PFOS using the acid form of their name, they are actuallymeasuring the anionic form (for example, perfluorooctanoate or perfluorooctane sulfonate), as this is the formthat exists in the environment.
The acid form and their associated cationic salts have CAS numbers, while the anionic forms may not (Table2-1). For example, PFOS can exist as different salts (cationic), including sodium, lithium, potassium, orammonium. Each of these salts will have a different CAS number:
PFOS, acid form CAS No.: 1763-23-1PFOS, potassium salt CAS No.: 2795-39-3PFOS, ammonium salt CAS No.: 29081-56-9
When the salt or acid exists in water or other liquids, it will dissociate (lose its hydrogen atom), and the salt or
acid will break off and form the anion (for example, COO– or SO3–). Figure 2-7 illustrates the dissociation of PFBA.
26

Figure 2-7. Dissociation of PFBA.
It is most important to distinguish between the acid form and anionic form when reporting the physical andchemical properties. The discussion of PFAS properties in this guidance document generally refers to the anionicform; it will be specifically called out if the acid form is being discussed.
A Note About PFAS Naming in Laboratory Reports (see Section 11)
Even though PFAAs occur as anions in the environment, some laboratories report all of their results in the acidic form,while others may report PFCAs as acids (for example, perfluorooctanoic acid) and PFSAs as anions (for example,perfluorooctane sulfonate). Different naming conventions in laboratory reports have led to confusion regardingexactly which form of the PFAA the labs are measuring. Although the lab is measuring the concentration of PFAAanions present in the sample, where the results are reported as an acid, the lab has adjusted for the H+ cation (whichhas so little mass, this does not affect the resulting concentration). It should be noted that the standards used bylaboratories to perform analyses may be prepared from PFAA salts, as is often the case for sulfonate standards. If so,the lab must adjust the reported concentration to account for the mass of the counterion (typically Na+ or K+). Thecalculation to do this is described in Section 7.2.3 of EPA Method 537 (Shoemaker, Grimmett, and Boutin 2009).
2.2.3.3 Other PFAAsOther PFAAs include:
perfluoroalkyl sulfinic acids (PFSiAs), associated with the electrochemical fluorination (ECF) process and alsooccur as intermediate environmental transformation productsperfluoroalkyl phosphonic acids (PFPAs) and phosphinic acids (PFPiAs), associated with the fluorotelomerizationprocess and used as surfactants
2.2.3.4 Perfluoroalkane Sulfonamides (FASAs)FASAs, such as perfluorooctane sulfonamide (FOSA), are used as raw material in the ECF process to make perfluoroalkylsulfonamide substances that are used for surfactants and surface treatments. FASAs can degrade to form PFAAs such asPFOS.
2.2.3.5 Other Perfluoroalkyl SubstancesOther perfluoroalkyl substances shown on Figure 2-4 include:
perfluoroalkane sulfonyl fluorides [PASFs, such as perfluorooctane sulfonyl fluoride (POSF) and perfluorobutanesulfonyl fluoride (PBSF)], and perfluoroalkanoyl fluorides (PAFs), associated with the ECF processperfluoroalkyl iodides (PFAIs) and perfluoroalkane aldehydes (PFALs), associated with the fluorotelomerizationprocessperfluoroalkyl ether carboxylic acids (PFECAs) and perfluoroalkyl ether sulfonic acids (PFESAs)
As discussed in Section 2.4, some PFECAs have been developed or used as replacements for other PFAS that are phased outof production and use. This includes GenX chemicals (see text box). Other emerging fluorinated replacement PFECAs morerecently detected in the environment, such as perfluoro-2-methoxyacetic acid (PFMOAA), are described in Sun et al. (2016).
27

GenX ChemicalsA PFECA, commonly referred to by the trade name “GenX,” has been used by one manufacturer as a replacement forAPFO (PFOA) as a surfactant and polymerization aid in the production of their PTFE product. GenX actually refers to theGenX processing aid technology, while the major chemicals used include:• hexafluoropropylene oxide (HFPO) dimer acid (HFPO-DA, CAS No. 13252-13-6, also known as 2,3,3,3-tetrafluoro-2-(1,1,2,2,3,3,3-heptafluoropropoxy)propanoic acid [PFPrOPrA] or FRD-903) and
• its ammonium salt (ammonium, 2,3,3,3- tetrafluoro-2-(heptafluoropropoxy) propanoate [CF3CF2CF2OCF(CF3)COO–NH4+,
CAS No. 62037-80-3, also known as FRD -902])(Wang, Cousins, et al. 2013) (Buck 2015) (USEPA 2018).Prior to their use in PTFE production, GenX chemicals were produced as a byproduct of other manufacturing processes (NCDEQ 2018). From the draft GenX Toxicity Assessment document ATSDR (2018), HFPO also is used to manufacture otherHFPO-DA derivatives, fluoropolymers (including polyethers), and other specialty agrochemical, semiconductor, andpharmaceutical applications. HFPO-trimer acid and longer polymer fluorides can be formed from reaction of HFPO-DA.Further discussion of the GenX chemicals is provided in Section 2.4.6. The chemical structure of the ammonium salt isshown in Figure 2-8.
Figure 2-8. Example replacement chemistry structure for GenX Ammonium Salt.
In addition to linear and branched structures, certain cyclic structures have much in common with the noncyclic PFAS andare consistent with the definitions/descriptions provided above. As an example, Figure 2-9 illustrates the structure ofperfluoro-4-ethylcyclohexanesulfonate (PFECHS), which some classify as a PFAS. It is used in airplane hydraulic fluids andhas been found both in the environment (Kaboré et al. 2018; Howard and Muir 2010; De Silva et al. 2011; Lescord et al.2015; Houde et al. 2016) and in human blood (Miaz et al. 2020). The characteristics of PFECHS include:
fully fluorinated six-carbon ringnonaromaticsulfonate active groupperfluorinated two-carbon tail
PFECHS fits the Buck et al. (2011) description by having a fully fluorinated aliphatic tail of one or more carbon atomsattached to a charged functional group head.
28

Figure 2-9. Illustration of perfluoro-4-ethylcyclohexanesulfonate (PFECHS) structure.
Source: Michigan PFAS Action Response Team’s Human Health Workgroup PFECHS Whitepaper (May 15, 2020)(MI EGLE2020)
2.2.4 Polyfluoroalkyl Substances
Polyfluoroalkyl substances and some side-chain fluorinated polymers are increasingly being identified as important tounderstanding the occurrence, fate, and transport of PFAS at release sites and in the environment (OECD 2013; Butt, Muir,and Mabury 2014; Liu and Mejia Avendaño 2013; Wang et al. 2011; Mejia-Avendaño et al. 2020). Figure 2-3 and Figure 2-4highlight the groups of polyfluoroalkyl substances that, to date, have most commonly been detected at PFAS sites (seeBarzen-Hanson et al. 2017; OECD 2018) indicates that of the approximately 4,700 PFAS identified in that study, about 90%were potential precursors to PFAAs.
Polyfluoroalkyl substances are distinguished from perfluoroalkyl substances by not being fully fluorinated. Instead, they havea nonfluorine atom (typically hydrogen or oxygen) attached to at least one, but not all, carbon atoms, while at least two ormore of the remaining carbon atoms in the carbon chain tail are fully fluorinated (Figure 2-5).
The carbon-hydrogen (or other nonfluorinated) bond in polyfluoroalkyl molecules creates a “weak” point in the carbon chainthat may be susceptible to biotic or abiotic degradation. As a result, many polyfluoroalkyl substances that contain aperfluoroalkyl CnF2n+1 group are potential precursor compounds that have the potential to be transformed into PFAAs.
Figure 2-10 provides examples of degradation pathways for environmentally relevant polyfluoroalkyl precursors derivedfrom two PFAS production methods, fluorotelomerization and ECF, respectively (Buck et al. 2011; Liu and Mejia Avendaño2013; Butt, Muir, and Mabury 2014). Note that these figures include some PFAS not discussed in this guidance document,but described in Buck et al. (2011). Refer to Section 5.4, for further information on transformation processes, noting that notall degradation products will be formed through every environmental transformation process.
29

Figure 2-10. Example polyfluoroalkyl substance degradation pathways.(Note that degradation of POSF-based products is for the terrestrial environment, but transformation into lower homologues
of PFCAs and PFSAs in the atmosphere is also possible.)
2.2.4.1 Fluorotelomer SubstancesFluorotelomer substances are polyfluoroalkyl substances produced by the fluorotelomerization process. As shown in Figure2-10, the degradation of fluorotelomer-based substances is a potential source of PFCAs in the environment, but not PFSAs(Buck et al. 2011).
Fluorotelomer-based polyfluoroalkyl substances are named using an “n:x” prefix where “n” indicates the number of fullyfluorinated carbon atoms (n > 2) and “x” indicates the number of carbon atoms that are not fully fluorinated (x > 1). Anexample of a polyfluoroalkyl substance is shown in Figure 2-11, which also illustrates the “n:x” naming convention.
Figure 2-11. Example of a polyfluoroalkyl substance.
The following fluorotelomer substances are those most commonly detected in the environment to date (Section 6):
Fluorotelomer alcohols (FTOH): The n:2 fluorotelomer alcohols (n:2 FTOHs) are key raw materials in theproduction of n:2 fluorotelomer acrylates and n:2 fluorotelomer methacrylates (Buck et al. 2011).
Fluorotelomer sulfonic acids (FTSA): The n:2 fluorotelomer sulfonic acids (n:2 FTSAs) have been detected inenvironmental matrices at sites where aqueous film-forming foam (AFFF) has been used, and also in wastewatertreatment plant effluents and landfill leachate. FTSAs are precursor compounds and can undergo aerobicbiotransformation to form PFCAs (Buck et al. 2011).
Fluorotelomer carboxylic acids (FTCA): These compounds form through the biodegradation of FTOHs (Figure2-10; (Buck et al. 2011; Liu and Mejia Avendaño 2016) and have been detected in landfill leachate. Note that the–COOH functional group on these fluorotelomer compounds means they may have either an even or odd numberof carbons, so they may have n:2 or n:3 prefixes.
30

2.2.4.2 Perfluoroalkane Sulfonamido SubstancesThe subgroups of perfluoroalkane sulfonamido substances shown in Figure 2-4 and discussed below have been detected inthe environment and humans (Buck et al. 2011). Perfluoroalkane refers to the fully fluorinated carbon chain tail, but thesecompounds also contain one or more CH2 groups in the head of the molecule attached to the sulfonamido spacer (Figure2-12). They are either used as raw materials for surfactant and surface treatment products, or they are present asintermediate transformation products of these raw materials. As shown in the degradation pathways in Figure 2-10, someperfluoroalkane sulfonamido substances have been found to degrade to PFOS (Mejia Avendaño and Liu 2015).Environmentally relevant perfluoroalkane sulfonamido substances include:
N-Alkyl perfluoroalkane sulfonamides (N-alkyl FASAs) are intermediate environmental transformation productsthat include N-methyl perfluorooctane sulfonamide (MeFOSA) and N-ethyl perfluorooctane sulfonamide(nEtFOSA).
Perfluoroalkane sulfonamido ethanols (FASEs) and N-alkyl perfluoroalkane sulfonamido ethanols (MeFASEs,EtFASEs, BuFASEs) are raw materials for surfactant and surface treatment products (Buck et al. 2011). Figure2-12 illustrates the structure of NEtFOSE
Perfluoroalkane sulfonamido acetic acids (FASAAs) and N-alkyl perfluoroalkane sulfonamido acetic acids(MeFASAAs, EtFASAAs, BuFASAAs) are intermediate transformation products of FASEs, MeFASEs, EtFASEs, andBuFASEs (Figure 2-10) (Buck et al. 2011).
Figure 2-12. Example of a perfluoroalkane sulfonamido ethanol (FASE).
2.2.4.3 Other Polyfluoroalkyl SubstancesOther polyfluoroalkyl substances shown in Figure 2-4 include:
polyfluoroalkyl ether sulfonic acids (PFESAs)polyfluoroalkyl ether carboxylic acidsother fluorotelomer (FT)-based substances.
As discussed in Section 2.4.6, some PFAS have been developed or used as replacements for other PFAS that are phased outof use and production.
One replacement compound for the use of PFOA as a polymerization aid in the production of PTFE is a polyfluoroether
carboxylate surfactant: ammonium 4,8-dioxa-3H-perfluorononanoate (CF3OCF2CF2CF2-OCHFCF2COO–NH4+ (CAS No.
958445-44-8), commonly referred to by the trade name ADONA (Gordon 2011). The chemical structure is shown in Figure2-13.
Figure 2-13. Chemical structure for ADONA.
Other replacement polymerization compounds for the manufacture of PTFE and polyvinylidene fluoride (PVDF) include cyclicor polymeric functionalized perfluoropolyethers (PFPEs) (Wang, Cousins, et al. 2013). A sample chemical structure is shown
31

in Figure 2-14.
Figure 2-14. Sample chemical structure for a PFPE.
2.2.5 Chemical ManufacturingTo differentiate among PFAS in understanding a conceptual site model for environmental risk assessment, it is important toknow about the chemical manufacturing processes. The various manufacturing processes produce different types of PFAS,such as linear and branched isomers (as discussed in this section), which may affect the environmental fate, treatment,toxicology, and site forensics for these chemicals. The type of PFAS that might be formed by the transformation of precursorPFAS at or related to an environmental release site also may depend on the manufacturing process (refer to the family treein Figure 2-4).
2.2.5.1 ProcessesTwo major processes, electrochemical fluorination (ECF) and fluorotelomerization, have been (and are) used to manufacturePFAS substances that contain perfluoroalkyl chains: side-chain fluorinated polymers, perfluoroalkyl acids and polyfluoroalkylsurfactants (USEPA 2003; Benskin, DeSilva, and Martin 2010; KEMI 2015; OECD 2018). The fluorotelomerization process mayalso be characterized as “oligomerization,” as it involves using tetrafluoroethylene (TFE) monomer and adding one to nineTFE monomers to form a perfluoroalkyl chain (Kissa 2001; Rao and Baker 1994). ECF and fluorotelomerization can be used tocreate some of the same PFAS, as shown on Figure 2-4. PFSAs are produced only using the ECF process, whereas PFCAs canbe produced by both ECF and fluorotelomerization (USEPA 2003; CONCAWE 2016 )
More than 600 intermediate processes have been used to further produce certain PFAS and the associated final products.Further discussion of the intermediate processes may be found in the general scientific literature and numerous textbooksspecifically written about fluorinated organics and fluoropolymers (Banks, Smart, and Tatlow 1994).
Electrochemical Fluorination (ECF)
The Simons ECF process was licensed by 3M in 1945; 3M subsequently built an ECF pilot in 1949 and started commercialproduction in 1951 (3M Company 1999) In the ECF process, an electric current is passed through a solution of an organicfeedstock and liquid anhydrous hydrogen fluoride, which causes the hydrogen atoms to be replaced by fluorine atoms,thereby creating carbon-fluorine bonds (3M Company 1999; USEPA 2003; Buck et al. 2011). ECF is used to createperfluoroalkane sulfonyl fluorides (PASFs), which are the building blocks for other sulfonyl-based PFAS, as well asperfluoroalkyl carboxylate derivatives. These ECF-synthesized PFAS can contain a variable mixture of linear and branchedperfluorinated isomers, as well as other homologues, byproducts, and impurities (USEPA 2003; Buck et al. 2011). Thevariable composition is caused by the process conditions, raw materials, and equipment used by the ECF process (3MCompany 1999; CONCAWE 2016). Subsequent processes (for example, hydrolysis, base neutralization) are then used torefine the compounds (USEPA 2003).
Historically, the ECF process was primarily used to produce POSF-based compounds. This includes PFOS, which is often aterminal degradation product of POSF-based compounds. ECF was also used to produce perfluorooctanyl derivatives (forexample, using perfluorooctane carbonyl fluoride to produce PFOA and its salts, such as APFO). As part of the phaseout ofproduction of select long-chain PFAS in the United States, 3M has ceased using ECF to make certain long-chain PFAS, such asPOSF-based compounds (PFOS and PFHxS) and PFOA (Buck et al. 2011) (Section 2.4.1). 3M’s phaseout did not include other,shorter chain PASF-based products, such as those based on PBSF (3M Company 2018).
Fluorotelomerization
Fluorotelomerization involves the reaction of perfluoroethyl iodide (PFEI, CF3CF2-I) with tetrafluoroethylene (TFE, CF2=CF2) toyield a mixture of even-numbered carbon linear perfluoroalkyl iodides (CnF2n+1-I, n= 4, 6, 8, 10, etc.), commonly known as“Telomer A.” Telomer A is then reacted with ethylene to make “Telomer B” (perfluoroalkylethyl iodides (PFEIs),
32

CnF2n+1CH2CH2-I, n= 4, 6, 8, 10, etc.). Telomer B is reacted to make fluorotelomer alcohols (FTOHs, CnF2n+1CH2CH2-OH, n= 4, 6,8,10, etc.) Telomer A, Telomer B, and FTOHs are the basic raw materials used to manufacture fluorotelomer-basedsurfactant (nonpolymer) and polymer products (Kissa 2001; Rao and Baker 1994).
As part of the USEPA 2010/2015 Stewardship Program (USEPA 2018; Section 2.4.3), eight major global fluorotelomermanufacturers phased out production of long-chain (Table 2-2) fluorotelomer-based products that were potential precursorsto PFOA and other long-chain perfluorocarboxylic acids (PFCAs). Today, the major global fluorotelomer manufacturers arereported to have refined their processes and predominantly manufacture short-chain (C6) fluorotelomer-based products(https://www.americanchemistry.com/ATCS/). Some manufacturers outside of the United States (for example, China, India)have not phased out long-chain PFAS production (Song et al. 2018).
Fluorotelomerization has been primarily used to produce linear (straight-chain) PFAS isomers with an even number of carbonatoms (Buck et al. 2011), although some sources indicate that the process can also produce compounds with an odd numberof carbons and branched chains (Lindstrom, Strynar, and Libelo 2011; Danish EPA 2015).
2.2.5.2 Linear and Branched Isomers of PFASMany PFAS may be present as mixtures of linear and branched isomers (Figure 2-15) depending on the manufacturingprocess that was used. These structural differences are important because they may affect how the compounds behave inthe environment and may provide an indicator of their source. Structural differences are described below:
A linear isomer is composed of carbon atoms bonded to only one or two carbons, which form a straight carbonbackbone. There can be only one linear isomer in a Cn homologue (compounds with the same number of carbonsin their tail) series.In a branched isomer, at least one carbon atom is bonded to more than two carbon atoms, which forms abranching of the carbon backbone. There can be many isomers per Cn homologue series.
Figure 2-15. Linear and one branched isomer of PFOS.
For simplicity, both linear and branched isomers are abbreviated using the same acronym in this document. Note that othernomenclature conventions further identify PFAS by labeling linear isomers (for example, n-PFOS) and branched isomersbased on the location of the branch in the carbon chain (for example, 5m-PFOS) (Benskin, DeSilva, and Martin 2010).
The formula “CnF2n+1-” (where n is greater than or equal to 3) includes linear and branched structures. For example, PFOSand PFHxS are routinely present in environmental samples as a mixture of linear and branched isomers (Beesoon et al. 2011; Beesoon et al. 2012; Benskin, DeSilva, and Martin 2010).
Accurate quantification of PFAS that are mixtures of linear isomers and branched isomers in environmental matrices can bedifficult (Riddell et al. 2009). However, the relative contributions of isomers may be useful in understanding sources of PFASand the age of the source, because the production of isomers varies by manufacturing processes. For example, as discussedabove, the fluorotelomerization process has been primarily used to produce mostly linear PFAAs, whereas the ECF processproduces a mixture of linear and branched PFAA isomers (Table 2-3). Refer to Section 10.3 for more information on PFASsource identification. The presence of linear and branched isomers may also have implications for partitioning, transport,and bioaccumulation (Section 10.5).
Table 2-3. Manufacturing processes and potential PFAAs produced
33

Manufacturing ProcessCommonly Found Polyfluorinated Substance(Precursors)
Potential PFAAs Produced
Fluorotelomerization
FTSA1 Linear PFCAs3
FTCA2 Linear PFCAs3
FTOH Linear PFCAs3
Electrochemical fluorinationFASE
Branched and linear PFCAsBranched and linear PFSAs
FASAABranched and linear PFCAsBranched and linear PFSAs
1Fluorotelomer sulfonate: for example, may be found at AFFF sites2Fluorotelomer carboxylic acids: for example, 5:3 acid may be found in landfill leachate3Under certain instances, can produce mixture of linear and branched PFCAs
Updated May 2021.
34

2.3 Emerging Health and Environmental ConcernsLike other emerging contaminants, knowledge and concern about PFAS in the environment has evolved through a series ofphases discussed in this section:
discovery and/or synthesis of PFAS, followed by growth in commercial production and use (Section 2.2.5)emerging health and environmental concerns, including:
awareness of potential health impacts (Section 2.3.1)analytical developments (Section 2.3.2)detection in the environment (Section 2.3.3)response in science, regulatory, and legal actions (Section 2.3.4)
subsequent efforts to reduce use of contaminants of concern and/or replace the contaminants of concern withalternate technologies and chemicals, accompanied by health and environmental questions about thosechemicals (Section 2.4)
2.3.1 Awareness of Potential Health ImpactsOccupational studies in the 1970s found detections of some PFAS in the blood of exposed workers, and further studies in the1990s reported detections in the blood of the general human population (Buck et al. 2011). In recent years, the presence ofseveral long-chain PFAAs (PFOA, PFOS, PFNA, and PFHxS) have been measured in the low parts per billion (ppb, equivalent tonanograms per milliliter (ng/ml)) range in the blood serum of almost all residents of the United States and otherindustrialized nations (Kato et al. 2015; CDC 2018). These PFAS are present whether or not people were exposed in theworkplace, likely due to the widespread use of PFAS in consumer products and industries (Kannan et al. 2004; Kärrman et al.2006; Olsen et al. 2003). Further information and discussion of studies and human health effects can be found in Section 7.1.
These findings led to increased awareness of PFAAs in the environment, associated human exposure, and the potential forhealth effects. Occupational workers may be more highly exposed, and at risk, than other populations (ATSDR 2018).Laboratory studies using animals and epidemiological studies of human populations show that exposure to some PFAS maybe associated with a wide range of adverse human health effects ( USEPA 2016; USEPA 2016; ASTDR 2018). Toxicity studieshave mostly focused on PFOS and PFOA, as well as some other long-chain PFAAs (Section 7.1). More recently, the toxicologyof other PFAS, such as fluorotelomers and shorter chain PFAAs, as well as replacement PFAS chemicals (such as GenXchemicals, Section 2.4.6), have received increased attention (CONCAWE 2016; USEPA 2016; USEPA 2018).
ATSDR is undertaking a national, multi-site PFAS health study to study how PFAS-impacted drinking water may harm health(ATSDR 2020). The study was authorized by the National Defense Authorization Acts of 2018 and 2019. According toATSDR, “The information learned from the multi-site study will help all communities in the U.S. with PFAS exposures,including those that were not part of the study.” The multi-site health study builds on the Pease Health Study at formerPease Air Force Base in Newington, NH, which effectively serves as a pilot program. The health study is intended to provide abetter understanding of the cause and effect relationship between PFAS at various concentration and specific healthoutcomes based on adults and children. The study is expected to improve upon epidemiological studies with limitedinformation about exposure factors.
2.3.2 Analytical DevelopmentsEarly detection of PFAS in environmental media was hindered by the analytical capability challenges arising from the uniquesurface-active properties of PFAS (Giesy and Kannan 2001; 3M Company 2000). Since the 2000s, methods have been, andcontinue to be, developed with lower detection limits (for example, parts per trillion [ppt]) in water, that are commensuratewith levels of potential human health effects. The number of commercial laboratories that offer PFAS analysis is increasing.Analytical methods continue to be developed and improved to test a variety of media and additional PFAS; these continue toimprove our knowledge of PFAS in the environment and potential human health effects. For further information on analyticalmethods, refer to Section 11.
35

The number of PFAS that can be identified and quantified by analysis has also evolved over time, with longer lists ofcompounds and changing commercial availability linked to evolving health and environmental concerns. Early focus was onPFOA and PFOS, but nationwide testing of drinking water supplies under the USEPA’s Third Unregulated ContaminantMonitoring Rule (UCMR3) led to four additional PFAAs (PFHpA, PFNA, PFBS, PFHxS) gaining greater attention. Moreinformation about UCMR3 is provided in Section 6.3, and a summary of the occurrence data for the six PFAAs analyzedduring UCMR3 is provided in Section 8.2.2.2. UCMR5 is planned for 2023–2025, and is expected include 29 PFAS. InGermany, von der Trenck et al. (2018) presented health- and ecological-based PFAS significance thresholds for 7 of 13priority PFAS for the assessment of contaminated groundwater.
Many state regulatory agencies now request or require testing for an expanded list of long- and short-chain PFAAs, and somepotential precursors to PFAAs, such as fluorotelomers. Other polyfluoroalkyl substances are also receiving increasedattention, as illustrated in Figure 2-16. Many of these PFAS are also summarized in Figure 2-5
Other analytical methods and approaches are available to detect and quantify PFAS not included in the standard methodsmentioned above, including nontarget analysis, total organic fluorine, and total oxidizable precursor assay (see Section 11).
Figure 2-16. Emerging awareness and emphasis on PFAS occurrence in the environment.
Source: J. Hale, Kleinfelder. Used with permission.
2.3.3 Detection in the EnvironmentAlthough some PFAS have been manufactured since the 1950s, PFAS were not widely documented in environmental samplesuntil the early 2000s, as PFAS testing was not widely available until that time. Since the early 2000s, however, theoccurrence of PFAS in the environment has been a very active area of research. The occurrence of certain PFAS has beenreported in a wide variety of matrices, including sediments, surface and groundwater, and wildlife (Kannan et al. 2004;Yamashita et al. 2005; Higgins et al. 2007; Rankin et al. 2016). As noted above, UCMR3 sampling detected PFAS in 4% ofdrinking water supplies across the country, including in 33 states, three territories, and one Native American community (Huet al. 2016). Initially, investigations focused mainly on major releases from manufacturing sources and significant PFAS usessuch as firefighting foam application sites.
In recent years, with more sensitive analytical methods available, studies have detected PFAS (especially PFAAs) in locationsthroughout the globe, even in areas well beyond where they were initially used or manufactured (Houde et al. 2011).Detections of certain PFAS in the environment in various media are detailed in Section 6, and ecological effects are
36

described in Section 7.2.
2.3.4 Growing Awareness and ConcernSocietal awareness and concern about PFAS have increased since regulatory activity began in the early 2000s. Societalawareness and response are documented in the form of scientific progress and health advisories, federal regulatory actions,and legal actions. Major milestones of these are summarized in Figure 2-17. Other milestones, such as the growth ofknowledge and investigation at major manufacturing and DOD sites in various U.S. states, are not discussed here.
Figure 2-17. Growing awareness and concern since the early 2000s.
37

2.4 PFAS Reductions and Alternative PFASFormulationsConcern regarding the persistence, bioaccumulation, and possible ecological and human health effects of long-chain PFAAshas led manufacturers to use replacement PFAS chemistries, which include reformulating or substituting longer chainsubstances with generally shorter chain perfluoroalkyl or polyfluorinated substances that should not degrade to long-chainPFAAs, or replacing manufacturing processes with nonfluorinated chemicals or alternate methods (USEPA 2006; OECD 2017).Manufacturing reductions and phaseouts are described in this section.
2.4.1 3M Voluntary Phaseout of Certain Long-Chain PFASIn early 2000, 3M was the principal worldwide manufacturer of PFOA and POSF-derived PFAS (for example, PFOS) (Buck et al.2011). This represented about 80–90% of global POSF-based production (Prevedouros et al. 2006), with 3M the sole U.S.manufacturer of PFOS (USEPA 2003). In 2000, 3M announced a voluntary, unilateral phaseout (this only applied to 3M) ofPOSF-derived PFAS, which at the time represented more than 95% of the company’s perfluorooctanyl production (3MCompany 2000). The 3M phaseout included the six-, eight-, and ten-carbon PFSAs (PFHxS, PFOS, and PFDS) and relatedprecursors, as well as PFOA (Buck et al., 2011). 3M reportedly completed most of the phaseout by the end of 2002, with theremaining phaseout completed by 2008 (USEPA 2017); (3M Company 2017).
At the time of the phaseout, 3M’s POSF-derived PFAS were used in several applications:
~41% for paper and packaging protectors~36% for textiles, leather, and carpet treatment and fabric protectors~19% as industrial surfactants, additives, and coatings (including electroplating and etching surfactants,household additives, insecticides, and other applications)~3% in firefighting foam (3M Company 2000).
The paper and packaging protectors included POSF-based side-chain fluorinated polymers and phosphate diesters (Wang,Cousins, et al. 2013).
PFOA produced by 3M was primarily used as a fluoropolymer processing aid, with only about 3% of PFOA production used forother applications: mostly in antistatic coatings in medical films, with limited quantities used for electronics applications (forexample, to create a humidity barrier on printed circuit boards and to coat precision bearings with silicone oil) (3M Company2003).
This phaseout applied only to 3M, and only to select PFAS. 3M subsequently used (and reportedly continues to use) ECF toproduce PBSF-based PFAS (for example, the four carbon PFSA: PFBS) (OECD 2013), (Wang, Cousins, et al. 2015)). Any newmanufacture and/or import of the PFAS phased out by 3M requires USEPA review based on the Significant New Use Rules(SNURs) described in Section 2.4.2. Based on the 2012 Chemical Data Reporting effort, no company reported manufacture orimport of PFOS into the United States (reporting was required for quantities greater than 25,000 pounds) (USEPA 2018).
When 3M stopped producing PFOA in the early 2000s, it is reported that the manufacture of PFOA was continued by otherdomestic producers using fluorotelomerization (USEPA 2003). Domestic PFOA production was later phased out by the eightmajor domestic producers as described in Section 2.4.3.
2.4.2 USEPA Significant New Use Rules (SNURs)In conjunction with these voluntary reductions and phase-outs, USEPA used its authority under the Toxic Substances ControlAct (TSCA) to finalize four SNURs between 2002 and 2013 to require notification to USEPA before any manufacture (includingimport) of select PFAS, which include, but are not limited to, some of the PFAS included in 3M’s voluntary phaseout of PFOSand related chemicals (Section 2.4.1). USEPA proposed another SNUR for select PFAS in 2015 that has yet to be finalized,
38

primarily focused on certain PFCAs (e.g., PFOA) and their precursors included in the 2010/2015 PFOA Stewardship Program(Section 2.4.3). For further discussion of the SNURs, including 2020 developments, see Section 8.
2.4.3 USEPA PFOA Stewardship ProgramIn January 2006, USEPA initiated the 2010/2015 PFOA Stewardship Program (USEPA 2006). Most PFOA produced in 2003(around the time of the phaseout described in Section 2.4.1) was used as a processing aid in the manufacture offluoropolymers, such as PTFE (USEPA 2003), and this was likely still the case at the time the stewardship program began.
The eight major manufacturing or processing companies that participated in the program are reportedly those thatmanufactured or processed the majority of these chemicals, including Arkema, Asahi, BASF Corporation (successor to Ciba),Clariant, Daikin, 3M/Dyneon, DuPont, and Solvay Solexis (USEPA 2018). There may be other manufacturing or processingcompanies that did not participate in the program (USEPA 2015). USEPA indicated that the eight participating companiessuccessfully met the program goals, meeting a 95% reduction by 2010 in global facility emissions and product content, andeliminating production (100% reduction) of PFOA, certain longer chain PFCAs (higher homologues such as PFNA and PFDA),and related PFOA precursors (for example, 8:2 FTOH) by 2015 (USEPA 2017). Even though the program goals were met bythe eight companies, the ongoing use of PFOA stock and imported materials has not been fully restricted (USEPA 2018).Products manufactured and imported prior to 2015, and materials with ongoing uses, may still contain these PFAS (USEPA2018), and PFOA may be present as a trace contaminant in some other PFAS and fluoropolymer products (3M Company2003). As discussed in Section 2.4.5, production is ongoing in other nations.
2.4.4 Stockholm Convention on Persistent Organic PollutantsThe Stockholm Convention on Persistent Organic Pollutants (POPs) is a United Nations treaty signed in 2001 aimed atreducing or eliminating the production, use, and release of key POPs. POPs are defined as synthetic, organic compoundsthat, to varying degrees, resist photolytic, biological, and chemical degradation (KEMI 2004, 2015); (USEPA 2017). Chemicalslisted as POPs satisfy screening criteria for persistence, bioaccumulation, long-range environmental transport, and adverseeffects (Stockholm Convention 2001). The Stockholm Convention targets PFAS in these ways:
In 2009, Annex B of the Stockholm Convention (which restricts production and use) was amended to includePFOS (and its salts and POSF), because it is persistent in the environment and is not known to degrade at anyenvironmental condition. Currently, the United States has not ratified the amendment (KEMI 2017)). Annex B isnot an outright ban; it allows certain approved uses and exemptions of POPs. Prior to 2019, approved, ongoinguses for PFOS under Annex B included select applications in photoimaging, semiconductor coatings and etchingagents, metal plating, insect baits, chemically driven oil production, aviation hydraulic fluids, some medicaldevices, and color printer electronic parts (UNEP 2008, 2009).According to the Stockhom Convention website:
In May 2019, Annex B was amended to discontinue several of the previously allowed ongoing uses(UNEP 2019).Annex A was amended in May 2019 to prohibit and/or eliminate the production and use of PFOA (itssalts and PFOA-related compounds), with certain exemptions (UNEP 2019).the POPs Review Committee recommended in October 2019 to list PFHxS (and its salts and relatedcompounds) in Annex A without specific exemptions (UNEP 2019)
2.4.5 Global Manufacture and Use of PFASPFAS are still manufactured globally, despite some PFAS (most notably PFOA and PFOS) no longer being produced in theUnited States, Europe, and Japan (FluoroCouncil 2018). For further information, see OECD’s “Risk Reduction Approaches forPFASs” (OECD 2015). In addition to the domestic reductions discussed in Section 2.4.1 and 2.4.3, some of the phase-outsand restrictions are summarized below.
In 2017, the South Australia state government took initial steps to develop legislation banning environmentally harmfulfoams, such as Class B firefighting foams containing PFAS (SA EPA 2017).
Canada embarked on an Environmental Performance Agreement with four major manufacturers to phase out PFOA andrelated compounds from 2010 to 2015 (CEPA 2006). In 2008, Canada prohibited the use of most PFOS, with selectexemptions such as use of existing stocks of PFOS-based firefighting foams, and then added PFOS to the Virtual EliminationList in 2009 and to the Prohibition of Certain Toxic Substances Regulations in 2016 (CEPA 2018). By 2016, Canada prohibited
39
the import, manufacture, use and sale of PFOS, PFOA, and other long-chain PFCAs (and salts and precursors), with limitedexemptions (CEPA 2018), and subsequently in 2018, Canada proposed further modification to those restrictions(Government of Canada 2018).
In 2009, the European Union (EU), through the European Chemicals Agency (ECHA), regulated PFOS as a POP, and use ofPFOS is limited to certain restrictions (Vierke et al. 2012). In 2017, the EU banned the sale, use, and import of PFOA, its saltsand PFOA-related substances through Annex XVII of the European Chemicals Regulation (REACH), with phase-outs occurringthrough 2032 and certain allowed uses. ECHA is currently considering restrictions for other long-chain PFCAs, their salts andprecursors, as well as other compounds, such as PFHxA (ECHA 2018).
In Japan, there are restrictions on the manufacture, import, export, and use of PFOS and its salts (OECD 2015).
The global reduction anticipated with the U.S. phaseout of PFOA has potentially been offset by increased production of PFOAand related PFAS in China, India, and Russia (OECD 2015). PFAS manufacture began in China in the 1980s (World Bank 2017)(2017), and PFOS production in China increased coincident with the long-chain PFAA phaseout in the United States(CONCAWE 2016) (OECD 2015). In 2016, PFOS and its derivatives were still being produced in Germany, Italy, and China(TTE 2016), but by early 2017, China was the only known producer of PFOS. China has ratified the Stockholm Convention onPOPs and was awarded a grant from the Global Environment Facility (GEF) in 2017 to support the reduction of PFOS in China(World Bank 2017). China has developed some guidance for restriction and limitations of some PFAS (OECD 2015). In Brazil,EtFOSA, which is a precursor to FOSA and PFOS and used in the pesticide sulfluramid, which is still being produced on anindustrial scale, is allowed as an approved use by the Stockholm Convention (Löfstedt Gilljam et al. 2016).
There does not appear to be a comprehensive reference publically available to document the individual PFAS and thequantity of PFAS produced over the years. This is possibly because these data are proprietary, but also due to modificationsto chemistries and products over the years (Lindstrom, Strynar, and Libelo 2011), complexity of the issue, and the generallack of publically available data (OECD 2018). That said, some estimates of production and emissions of select PFAS havebeen made based on the limited available data.
Prevedouros et al. (2006) estimated global emission of PFCAs at about 3,500–8,000 tons between the 1950s and 2002, withapproximately 80% of emissions related to fluoropolymer manufacture (and use), based on overall annual productionestimates of:
APFO (ammonium salt of PFOA)-about 335–525 tons per year between 1951 and 2002APFN (ammonium salt of PFNA)-about 60–225 tons per year between 1975 and 2004POSF (building block for PFOS)-about 9,550 tons per year from 1960 to 2002.
Other production and emissions estimates for PFCAs are available from OECD (2015), and for PFOS and PFOS precursorsfrom Armitage et al. (2009), and Paul, Jones, and Sweetman (2009). OECD (2015) calls for a new, comprehensive survey toevaluate both historical and ongoing emissions.
2.4.6 PFAS-Based Replacement ChemistryWith the emerging awareness of potential health and environmental impacts of some PFAS and related limitations onproduction of some PFAS, such as the SNURs (Section 2.4.2) and 2010/2015 PFOA Stewardship Program (Section 2.4.3),manufacturers began efforts to replace the use of long-chain PFAS chemistries with nonfluorinated chemicals, alternatetechnologies, and/or other, shorter chain PFAS (Wang, Cousins, et al. 2013). For example, decorative chrome platingtypically now uses less toxic chromium III instead of chromium VI so that PFAS are not needed (Wang, Cousins, et al. 2013).
Some of the replacement chemicals are said to achieve the same performance effectiveness of some of their predecessors.A carpet manufacturer has found that performance of fluorine-free alternatives is “equivalent or superior to the fluorinatedtreatments” pg. 66, (CalEPA 2018). Conversely, a 2015 study concluded that there are no nonfluorinated alternatives thatprovide equivalent technical performance in textiles (Danish EPA 2015). PFAS-free AFFF has yet to be demonstrated to meetUS Department of Defense performance specifications, but have been adopted by some other users (Section 3.8.1 and 3.10).
Several studies suggest some of the alternate PFAS chemistries may or may not be less hazardous than the long-chainpredecessors, although publicly available information on most replacement chemicals is limited (Wang, Cousins, et al. 2015)(RIVM 2016); (OECD 2015). Documentation regarding the USEPA’s review of hundreds of “shorter chain-length PFAStelomeric” substitutes is available under the TSCA New Chemicals Program (OECD 2013); (USEPA 2017), and otherdocumentation regarding replacement PFAS chemistries is available from the FluoroCouncil (2017). Draft toxicological
40

evaluations have been provided for public comment by the USEPA for GenX chemicals and PFBS (USEPA 2018) (USEPA2018). For further discussion of toxicity documentation for select PFAAs and replacement chemistries, see Section 7.
Although a full discussion of such PFAS chemistries is not possible here, it is important to be aware of the trend towardshorter chain chemistries, as some of these PFAS increasingly may be detected in the environment. Some replacement PFAShave been detected in the environment and generated public concern and regulatory actions; however, information onsignificant environmental contamination by replacement PFAS is limited, and most are not detected by standard analyticalmethods (Wang, Cousins, et al. 2013). Some PFAS used as replacement chemicals, such as HFPO-DA and ADONA (used asreplacements for APFO/PFOA in PTFE manufacture), and F53B (used as a replacement for PFOS in plating), have recentlybeen added to USEPA Method 537.1 (Shoemaker and Tettenhorst 2018). Treatment processes used to remove thesechemicals from waste streams may not be as effective as with longer chain PFAS (Sun et al. 2016).
Alternate PFAS chemistries are being used to replace long-chain PFAAs that have been phased out of production and/or use.In many cases, although similar legacy PFAAs were manufactured and used by many companies, these same companieshave transitioned to the use of many different types of other PFAS as alternative chemicals. Many of these replacement PFASare structurally similar to their long-chain predecessors, and are typically also manufactured using electrochemicalfluorination (ECF) or fluorotelomerization (Wang, Cousins, et al. 2015) (CONCAWE 2016). Some of these fluorinatedsubstitutes may degrade to form short-chain PFAAs. Some short-chain PFAAs, PFECAs, and related chemicals weremanufactured as early as the 1980s, or earlier (Wang, Cousins, et al. 2015). Some PFAS used to replace long-chain PFAS arepresented below (Hori et al. 2006; OECD 2007; Herzke, Olsson, and Posner 2012; Buck 2015; Wang, Cousins, et al. 2013;Wang et al. 2014; Wang, Cousins, et al. 2015; KEMI 2015; Sun et al. 2016; Holmquist et al. 2016):
short chain homologues of the long-chain PFAAs, including PBSF-based derivatives (for example, 4-carbon chainPFBS in lieu of POSF-based six-, eight-, and ten-carbon chain compounds) in many applications, including surfacetreatmentperfluorohexane sulfonyl fluoride (PHxSF, which can degrade to PFHxS and is considered to be phased out in theUnited States) as an alternative to PFOS, primarily in Chinafluorotelomer-based products such as FTOH, for example, those with a six-carbon perfluorohexyl chain, including6:2 fluorotelomer-based compounds in AFFF formulations and other six-carbon fluorotelomer-based products,side-chain fluorinated polymers, and PFPE products for surface treatment of food contact materialsper- and poly-fluoroalkyl ether substances used as polymerization aids in manufacture of fluoropolymers, suchas GenX chemicals (Section 2.2.3.5) and ADONA used as a replacement for APFO in the manufacture of PTFE, aswell as other types of PFAS, such as cyclic or polymeric functionalized PFPEs as a replacement for APFN in themanufacture of polyvinylidene fluoride (PVDF)6:2 fluorotelomer-based compounds, a PFBS-based compound, and fluorotelomer-based F-53 and F-53B(perfluoroalkyl ether potassium sulfonate) in lieu of PFOS in metal plating applications.
41

2.5 PFAS UsesPFAS have been produced on a commercial scale since the 1950s, and production continues today. The unique physical andchemical properties of PFAS impart oil, water, stain, and soil repellency, chemical and temperature resistance, frictionreduction, and surfactant properties to a wide range of products.
Table 2-4 provides a general (not exhaustive) introduction to some of the uses of PFAS fluorochemistries that are, or havebeen, marketed or used (3M Company 1999)) (Poulsen et al. 2005) (OECD 2006) (Washington State Department of Ecology2012) (OECD 2011) (OECD 2013) (Fujii, Harada, and Koizumi 2013) (OECD 2015) (FluoroCouncil 2018) (Henry et al. 2018).The specific applications for all PFAS are not well documented in the public realm. For example, of the 2,000 PFAS identifiedin a 2015 study, only about half had an associated listed use (KEMI 2015). Further discussion of select uses that may beassociated with potentially significant environmental releases are provided in Section 2.6.
As discussed in Section 2.2.2.1, most polymer PFAS are considered to pose relatively less risk to human health and theenvironment than some nonpolymer PFAS. For this reason, Table 2-4 distinguishes between these two major classes of PFASand where they are used in various industries and products. The major industries and applications summarized in the tableare described in more detail in Section 2.6.1.
Table 2-4. Sample historic and current uses of PFAS
Industry/Application PFAS Type Documented Use and Examples of Some PFAS
Aviation andAerospace
PolymerMechanical components made of fluoropolymers (such as PTFE and PFA tubing,piping, seals, gaskets, cables, and insulators)
NonpolymersHydraulic fluid additives made from PFSA salts (such as PFOS at about 0.1%) toprevent evaporation, fires, and corrosion
AutomotivePolymer
Mechanical components made of fluoropolymers, including wiring and cable, fueldelivery tubing, seals, bearings, gaskets and lubricants, and some polymercoatings on carpets
Nonpolymers Surface treatment for textiles, upholsteries, carpets, leather and exterior surfaces
Biocides (Herbicidesand Pesticides)
Polymer None reported
NonpolymersActive ingredients such as short-chain sulfonamides in plant growth regulators andherbicides, and EtFOSA (sulfluramid) in ant and termite baits; inert enhancingingredients in pesticides; PFPAs and PFPiAs as anti-foaming agents in solutions
Building andConstruction
Polymer
Fluoropolymer membranes and coatings (such as PTFE, PVDF, and/or side-chainfluorinated polymers) in architectural materials (like fabrics, roofing membranes,metals, stone, tiles, concrete, radomes); adhesives, seals, caulks; additives inpaints (for example, low- and no-VOC latex paints), varnishes, dyes, stains,sealants; surface treatment agent and laminates for conserving landmarks
NonpolymersAdditives in paints, coatings, and surface treatments (PASF- and fluorotelomer-based compounds, ammonium salt of PFHxA)
Cable and WiringPolymer
Coatings and jacketings made of fluoropolymers (such as PTFE and PVDF) forweathering, flame, and soil resistance, with cables used in many applications,including communication facilities, antennae, and computer networks
Nonpolymers None reported
42

Industry/Application PFAS Type Documented Use and Examples of Some PFAS
Cosmetics/PersonalCare Products
Polymer Dental floss and micro powders used in creams and lotions.
Nonpolymers Cosmetics, shampoos, nail polish, eye makeup, denture cleaners
ElectronicsPolymer
Fluoropolymers (such as PVDF and PTFE) used in insulators, solder sleeves, printedcircuit boards, cell phones, computers, speakers, and transducers
Nonpolymers Flame retardants for polycarbonate resin (such as the potassium salt of PFBS)
EnergyPolymer
Fluoropolymer films (such as FEP, PVDF) to cover solar panel collectors, electrolytefuel cells, PTFE expansion joint materials for power plants
Nonpolymers Fuel cell and battery electrolyte (such as the lithium salt of PFAAs)
Firefighting/Safety
PolymerFluoropolymers used in firefighting equipment and protective clothing (such asthose woven with PTFE). Other polymer coatings using side-chain fluorinatedpolymers)
NonpolymersCoatings and materials used as water repellents and some Class B foam (maycontain PFCAs, PFSAs, and fluorotelomer-based derivatives), vapor suppression forflammable liquids (for example, gasoline storage)
Food ProcessingPolymer Fluoropolymer fabrication materials (such as PTFE) (liners for trays, ovens, grills)
Nonpolymers May be used as coatings on food packaging
Household Products
PolymerNonstick coatings (fluoropolymers such as PTFE); aftermarket treatment fortextiles, upholsteries, carpets, and leather (such as FT-based side-chainfluorinated polymers)
Nonpolymers
Aftermarket treatment for textiles, upholsteries, carpets, and leather (such asPASFs; floor polishes (such as the ammonium salt of PFDA), coatings, and floorfinishes (PFPAs and PFPiAs) and cleaning agents and alkaline cleaners; automobilewaxes; may include PFAAs, PASF- and fluorotelomer-based derivatives
Medical Products
PolymerFluoropolymers used in surgical patches, cardiovascular grafts, raw materials forhuman body implants (such as catheters, stents, needles, and other) givenbiocompatibility and extremely low coefficient of friction
NonpolymersX-ray film, stain- and water-repellent protective medical fabrics (like surgicaldrapes and gowns) created from PASF- or fluorotelomer-based (meth)acrylatepolymers and polyurethanes
Metal PlatingPolymer None reported
NonpolymersWetting agent, mist suppression for harmful vapors, and surfactants (may includepotassium, lithium, diethanolamine and ammonium salts of PFOS or 6:2 FTS)
Oil ProductionPolymer Lining of gas pipes
Nonpolymers Marketed for and potential instances of use in oil well production
MiningPolymer None reported
Nonpolymers Instances of surfactants used in ore mining flotation
Paper and PackagingPolymer
Oil and grease and water repellent to paper, paperboard, molded pulp products(including food contact materials), and LDPE bags; examples include side-chainfluorinated polymers in which the PASF- or fluorotelomer-based alcohols or theiracrylate or methacrylate esters are attached on side chains
NonpolymersPhosphate ester salts (esterification of PASF or FT-based alcohols with phosphoricacid; PFPEs
43

Industry/Application PFAS Type Documented Use and Examples of Some PFAS
PFAS Production
Polymer Not applicable
Nonpolymers
Emulsion polymerization processing aids for fluoropolymers (such as PTFE, FEP,PFA, PVDF), (co)monomer of side-chain fluorinated polymers; (co)monomer offluoropolymers and to make fluoroelastomers; may use salts of long-chain PFCAs(such as PFOA and PFNA), salts of short-chain PFCAs (such as PFHxA), or PFECAs
Photolithography &Semiconductor
PolymerEquipment raw materials (such as PFA) for molded wafer baskets to handlecorrosive liquids and gases, use as fluids in mechanical vacuum pumps
Nonpolymers Photolithography (such as using PFOS) in manufacture of semiconductor chips
Textiles (Upholstery,Carpets), Leather, andApparel
Polymer
Fluoropolymers (such as PTFE) are used in the construction of outdoor gear,clothing, and housewares; side-chain fluorinated polymers (such as PASF- orfluorotelomer-based (meth)acrylate polymers and -polyurethanes) may be used inoil- and water-repellent and stain release finishing and treatment coatings
NonpolymersPFOA-based chromium treatment for paper and leather. Nonpolymer coatingsused to treat textiles to provide oil- and water- repellent and stain release finishes
Information presented in this table captures potential instances of use but is not intended to indicate universal use. Inaddition, the table is not exhaustive of PFAS use in various industries.
Updated September 2020.
44

2.6 PFAS Releases to the EnvironmentThis section summarizes sources of PFAS releases to the environment that have the potential for significant environmentalimpact, based on the type and magnitude of the release, and the types and concentrations of PFAS associated with thatrelease. These sources are sites where PFAS could be, or are known to have been, released to the environment, even if thesite is not the location where the PFAS were generated or used. Refer to Section 2.1 for a discussion of the relativesignificance of releases and source control, as not all of these facilities will have, or have been documented to have, PFASreleases, and not all releases are of the same magnitude.
These major sources are located both in the United States and abroad, and include:
industrial facilities that produce PFAS or process PFAS, or facilities that use PFAS chemicals or products inmanufacturing or other activities (Section 2.6.1)areas where fluorine-containing Class B firefighting foams are stored, used, or released (Section 2.6.2)waste management facilities, such as landfills (Section 2.6.3)wastewater treatment residuals and areas of biosolids production and application, with more significant impactsassociated with industrial wastewater discharges (Section 2.6.4).
The fate and transport processes and distribution of PFAS in the environment are discussed in Section 5. Media-specificoccurrence data are discussed in Section 6. Information about risk assessment, and human and ecological receptors isincluded in Section 9. Discussion of conceptual site model (CSM) components for each of the PFAS release catagories listedabove is included in Section 10.2.1.
2.6.1 Major Manufacturing and Industry SourcesIndustrial source sites include primary and secondary manufacturing facilities. Primary manufacturing facilities are thosewhere PFAS-containing products are synthesized and made into products or chemical feedstocks, or where PFAS are used asprocessing aids in fluoropolymer production. PFAS processing aids are not intended to be in the final product, but may bepresent at trace quantities (3M Company 2003) (Buck et al. 2011).
Secondary manufacturing facilities may use fluoropolymers and PFAS-based materials produced at primary manufacturingfacilities as part of industrial processes, such as the application of coatings to finished products. In some industrial settings,PFAS are used for worker safety purposes, such as using PFOS-based materials to suppress harmful mists duringelectroplating activities (Section 2.6.1.3).
PFAS composition and release mechanisms will vary for each facility. The composition of PFAS released from industrialfacilities depends on the type of PFAS produced or used by the facility.
The general PFAS release mechanisms and pathways at industrial facilities are illustrated in CSM Figure 2-18 and includewastewater and stormwater discharges; on- and off-site disposal of solid wastes; accidental releases such as leaks and spills;and stack and fugitive emissions. Stack emissions may result in aerial deposition of PFAS to soil and surface water (withsubsequent leaching and infiltration to groundwater) related to the facility (Davis et al. 2007; Shin et al. 2011), as well asshort- and long-range air transport of PFAS. Industrial facilities may also contain areas where fire training or fire responseusing AFFF has occurred, AFFF storage areas, and AFFF fire suppression systems inside buildings. Like many AFFF releasesites, industrial sites may also have releases of co-contaminants (solvents, petroleum products, etc.) that could potentiallyinfluence fate and transport of PFAS.
45

Figure 2-18. CSM for industrial sites.Source: Adapted from figure by L. Trozzolo, TRC, used with permission.
The following subsections provide further details regarding potential sources of PFAS releases to the environment from PFASuse in manufacturing or industrial processes; these are not presented in order of the potential for significance of a release.
2.6.1.1 Building and ConstructionSimilar to other products, the chemical attributes of PFAS have led to advancements in building and construction materials.One particular application has been in composite wood and oriented strand board (OSB). Over the last 50 years, wood-basedmaterials have used numerous additives for product strength and durability. A recent study performed on wood samples andOSB found primarily short-chain PFCAs and PFOA at concentrations ranging from 1.38 to 13.9 micrograms per kilogram(µg/kg) for PFCAs (Bečanová et al. 2016). Furthermore, wood fiber insulation has been shown to contain high amounts ofPFHpA and other 5- to 8-carbon chain PFCAs (Bečanová et al 2016). Many manufacturers use urea- or phenol-formaldehydedue to their performance and low cost; however, the composition of the resins used by many manufacturers is proprietary.
Other materials, including certain types of building insulation (phenolic foam) have shown high amounts of PFOS.Additionally, PFAS (predominantly C8–C20 gamma-omega-perfluorotelomer thiols with acrylamide) have been used in theproduction of light weight concrete, concrete sandwich panels, and lightweight concrete blocks (Bečanová et al. 2016;Posner et al. 2013). The prevalence of these building materials in the construction of fire training areas, AFFF storagefacilities, and other areas potentially exposed to PFAS led to potential issues with demolition waste. The porous nature ofthese materials (for example, concrete, brick) could lead to PFAS adsorption/absorption, representing a potential source ofPFAS when disposed in landfills or recycling facilities (Australia Government DOD 2018).
PFAS, including fluoropolymers such as PTFE, are used in the manufacture of architectural fabrics, such as those used in theconstruction of roof domes, including large stadiums and transportation facilities (FluoroCouncil 2018).
PFOS-related chemicals have several uses in paint and varnishes. They can be used as wetting, leveling, and dispersingagents, and have also been used to improve gloss and antistatic properties. Additionally, they can be used as additives indyestuff and ink. Furthermore, they can be used as pigment grinding aids or as agents to combat pigment flotation problems(KEMI 2004) (RPA 2004). Fluorosurfactants are commonly used in coatings application for substrate wetting, leveling,reduction of surface tension, oil repellency, and dirt pickup resistance (Danish EPA 2015; Posner et al. 2013).
Information received from different suppliers within the paint and varnish industry suggests that fluorinated surfactants ingeneral are much more expensive alternatives compared to other surfactants. Therefore, fluorosurfactants are used only forspecial purposes in paint and varnishes, where it is necessary to gain such a low surface tension that no other(nonfluorinated) alternatives can achieve (Danish EPA 2015).
2.6.1.2 Cable and WiringIn the 1950s the wire and cable industry began to use extruded grades of PTFE. This is a suspension polymerization process,which does not require surfactants, unlike dispersion polymerizations (for example, Teflon-coated pans). Melt extrusion isthe process by which most fluoropolymers are applied to wires. For instance, FEP, PFA, and PVDF are heated to 260°C and
46

then melt extruded over wire to continuous lengths. The equipment used for melt-processable fluoropolymers requirestemperature sensitivity of 427°F. PTFE is processed via paste extrusion for coating PTFE over wires due to its high meltingpoint (ASTSWMO 2015) (Kotthoff et al. 2015) (Lau et al. 2007) (Lindstrom, Strynar, and Libelo 2011) (Oliaei et al. 2013)(Renner 2001) (Trudel et al. 2008). For more information on the safe handling of fluoropolymer resins during processing, seethe Plastics Industry Association (2019) guidance document.
2.6.1.3 Metal Finishing and PlatingElectroplating is a process that uses electric current to apply a metal coating to the surface of an object. Metallic ions in anacidic electrolyte solution are used in the electrochemical deposition of metal coatings to the surface of the cathode (USEPA1996).
PFAS, particularly PFOS, have been used as mist suppressants that are added to metal plating and finishing baths to preventair emissions of toxic metal fumes. In the United States, amendments to the National Emissions Standards for Hazardous AirPollutants (NESHAP) under the Clean Air Act included a requirement to phase out the use of PFOS-based fume suppressants(a fume suppressant that contains 1% or greater PFOS by weight) in chromium electroplating by 2015 (USEPA 2012). Somecountries have phased out the use of PFOS in some electroplating operations, adopting the use of other fluorotelomers (forexample, 6:2 FTS) as a substitute in hard chrome plating operations (Danish EPA 2015), (KEMI 2015) or changing decorativechrome plating operations to employ the less toxic trivalent chromium.
Many different types of electroplating solutions can be used in plating activities, including hard and decorative chromeplating; chromic acid anodizing; nickel, cadmium, or lead plating; metal plating on plastics; and alkaline zinc plating. Chromeelectroplating is the most significant contributor as it relates to PFAS use. In this process, PFAS are used as surfactants toreduce the surface tension of the electrolyte solution. Historically, PFOS was commonly used at a concentration of 5–10% tolimit the development of bubbles and the emission of hexavalent chromium aerosols to workplace air, thereby reducing thepotential hazard to workers posed by hexavalent chromium (USEPA 2009) (OSHA 2013) (Danish EPA 2015).
Studies show use of PFAS in these settings can result in high concentration wastewater discharges (USEPA 2009) and airemissions. Once the electrolyte solution can no longer be used, it may be treated to remove chromium and other metals, butPFOS and other PFAS may be present in effluent and deposited in sewage sludge (Danish EPA 2015). Investigations inMinnesota traced PFOS releases from one chrome plating operation to a wastewater treatment plant (WWTP) where elevatedlevels of PFOS were detected in the biosolids, effluent water, and fish in the receiving surface water (ATSDR 2008). Airemissions from another Minnesota chrome plater were found to have accumulated on the roof of the facility and from therecontaminated stormwater and snow melting from the roof, which in turn contaminated the groundwater, a nearby surfacewater system, and fish (MPCA 2016).
2.6.1.4 Industrial Surfactants and Fluoropolymer ProductionPFAS have been, and currently are, instrumental as surfactants in industrial and commercial production. It is noted thatmany specific surfactant uses of PFAS are not publically available or published (KEMI 2015). Most well documented is thehistorical use of PFOA as a processing aid in the manufacturing of PTFE, where APFO is used to help mix together thechemicals needed to combine units of tetrafluoroethylene (TFE) to make PTFE. Similarly, APFN, the ammonium salt ofperfluorononanoic acid (PFNA), has also been used in the production of PVDF. PVDF polymers that are produced with the aidof APFN are sold in solid phase, with notable residual APFN concentrations (100–200 ppm) (Prevedouros et al. 2006).
Since the voluntary phaseout of PFOA and related PFAS chemistries, replacement chemistries such as ADONA and the GenXprocess chemicals are now used in the production of fluoropolymers.
The PFAAs used as polymerization aids may occur as impurities/residuals in some fluoropolymer products; however, it isdocumented that PTFE does not degrade to significant leves of PFAAs during incineration (Aleksandrov et al. 2019) andfluoropolymers of low concern are shown to be stable (Henry et al. 2018).
PFAS are also used in the manufacturing of plastics and fluoropolymers, rubber, and compression mold release coatings.These have applications in tubing, piping, drums, molds, and resins (Poulsen et al. 2005) (Prevedouros et al. 2006).
2.6.1.5 Paper Products and PackagingSince the 1960s, PFAS have been used as grease-proofing agents on food contact materials (FCM) to prevent oil, grease, andmoisture from foods from leaking through the packaging. This includes coated paper and cardboard such as pizza boxes,microwavable popcorn bags, parchment paper, fast food wrappers, paper cups, pet food bags, and other items (Rao and
47

Baker 1994) (Hekster, Laane, and De Voogt 2003) (Poulsen et al. 2005) (Trudel et al. 2008) (Buck et al. 2011).
The U.S. Food and Drug Administration (FDA) currently approves more than 90 unique monomer and polymer PFAS in FCMs(USFDA 2016). In January 2016, the FDA rescinded approval for three families of long-chain PFAS used in FCMs, but thesehad been voluntarily removed from the market in 2011. N-MeFOSE and NEtFOSE were historically used to produce surfacecoatings for textiles and paper products (Zaggia and Ameduri 2012). PFAS currently used in FCM include polyfluorinatedpolyether-based polymers and shorter chain PFAAs (Wang, Cousins, et al. 2015) (Schaider et al. 2017).
The most common PFAS detected in U.S. fast food wrappers include PFCAs (for example, PFOA and PFHxA), PFSAs (forexample, PFBS), and fluorotelomer sulfonates (for example, 6:2 FTS) (Schaider et al. 2017). Six of 20 FCM tested were foundto contain detectable levels of PFOA even though in 2011 U.S. manufacturers had voluntarily agreed to stop distributing FCMthat were manufactured using PFOA via an FDA initiative. The methodology was not sensitive enough to detect if the PFASswere intentionally added to the packaging material or if they were attributed to unintentional background levels (Schaider etal. 2017). Refer also to Section 2.4.3 on the USEPA 2010/2015 PFOA Stewardship Program, which discusses the phaseout ofPFOA and potential sources of PFOA that may remain in commercial and consumer products.
2.6.1.6 Photolithography/Semiconductor IndustryThe semiconductor industry historically has used PFOS for their surface-active properties in the fabrication of imagingdevices such as digital cameras, cell phones, printers, and scanners (Poulsen et al. 2005). Studies have shownsemiconductor waste streams containing the PFAAs PFBS, PFHxS, PFOS, PFHxA, PFHpA, PFOA, PFNA, PFDA, PFUnA, andPFDoA (Lin, Panchangam, and Lo 2009). Similarly, in photolithography processes, PFOS has been used predominantly inapplying top-layer antireflective coatings (TARCs), bottom antireflective coatings (BARCs), and etchants. Smaller quantitiesof PFOS and longer-chain PFAS have been used in wet etchants, film developers, cleaners, protective coatings, and colorfilters (SIA 2008), with ongoing uses permitted (Section 2.4).
2.6.1.7 Textiles, Leather, and Apparel (Including Carpet and Furniture)Surface treatment of textiles, leather, carpet, and furniture upholstery with PFAS to make them stain, oil, and water repellentoccurs both before (that is, at the factory) and after consumer acquisition for ongoing stain, oil, and water repellency(Prevedouros et al. 2006); (Ahrens 2011); (Herzke, Olsson, and Posner 2012). Aftermarket PFAS-containing stain-repellentproducts for carpets allow consumers to treat carpets and textiles at home (Renner 2001) (Hekster, Laane, and De Voogt2003). Losses to the environment can be related to dry cleaning and laundering activities (Poulsen et al. 2005) (3M Company2000).
Home textiles, including furniture and carpeting, as well as aftermarket PFAS surface treatment products, are also sources oflong-chain perfluorinated chemical exposure (Guo et al. 2009). Textile coating operations may use water-emulsion orpowdered feedstocks that contain greater proportions of PFCAs compared to PFSAs (Lassen et al. 2015) (Gremmel, Frömel,and Knepper 2016). According to California EPA (CalEPA) CalEPA (2018), pg. 12, “The PFAS polymers used in carpets, rugs,and other textiles can contain various amounts of mobile residual raw materials, impurities, or degradation products,including PFAAs and other PFAA precursors such as fluorotelomer alcohols (FTOHs) and perfluoroalkyl sulfonamide alcohols.”Releases to the environment could occur from disposal of carpet cleaning wastewater (CalEPA 2018). Physical degradation ofsome consumer products (such as PFAS-treated textiles and carpets, as well as paper) may be a source of PFAS in housedust (Björklund, Thuresson, and de Wit 2009).
It should be noted that many treated home textiles and carpets are now manufactured with alternatives to long-chain PFAS;however, these products can have a long useful life, making it possible that items previously treated with long-chain PFASare still in use (Brooke et al. 2004). A 2009 study of over 100 consumer products conducted by the USEPA and Arcadisindicated that pretreated carpet, treated upholstery and textiles, as well as other floor treatments, are likely the largestsource of PFAS receptor exposure in American homes (Guo et al. 2009).
Other studies have since shown nonpolymeric PFAS in leather samples and outdoor textiles to impart water, oil and stainresistance; applications include protective clothing, outerwear, footware, umbrellas, tents, and sails (OECD 2013; Waltersand Santillo 2006) (Kotthoff et al. 2015). Durable water repellent (DWR) is a fabric surface finish that creates a protectivebarrier. It is typically added at the factory, but is also available to consumers for apparel maintenance (Brooke et al. 2004).The finishes/treatments are applied to materials in mills/tanneries and as aftermarket applications by professionals or do-it-yourself consumers as aqueous dispersions. In some aftermarket applications, they are applied as solutions in hydrocarbon-based or halogenated solvents (OECD 2013).
48

2.6.1.8 Other Potential Commercial or Domestic Sources of PFAS Releases to the EnvironmentThere is the potential for everyday uses of PFAS to result in relatively smaller releases of PFAS to the environment. Of note,these may include, but are not limited to leaching from materials to media (for example, well construction and plumbingmaterials), discharges to on-site wastewater disposal systems from use of household products and cosmetics, dischargesfrom car washing and waxing, and use of ski waxes (professional ski wax technicians may have significant inhalationexposures to PFAS (Nilsson et al. 2013). Snowmelt and surface waters near ski areas may have measurable PFAS impacts(Kwok et al. 2013).
2.6.2 Class B Fluorine-Containing Firefighting FoamsSome Class B firefighting foams designed for extinguishing flammable liquid hydrocarbon fires and vapor suppression maycontain fluorine. These foams can be a major source of local PFAS release to the environment, with the CSM included inFigure 2-19.
Figure 2-19. CSM for fire training areas.Source: Adapted from figure by L. Trozzolo, TRC, used with permission.
Class B firefighting foams are commercial surfactant solutions that have been (and continue to be) stored and used for firesuppression, fire training, and flammable vapor suppression at military installations and civilian facilities and airports (Hu etal. 2016), as well as at petroleum refineries and bulk storage facilities, and chemical manufacturing plants and storagefacilities (CONCAWE 2016). Additionally, local fire departments in communities have used and may maintain quantities offirefighting foam in their inventories for use in training and emergency response. Facilities that manufactured firefightingfoams and landfills that received firefighting waste are also potential sources. Refer to Section 3 for more detailedinformation about firefighting foams.
2.6.3 Solid Waste Management FacilitiesEnvironmental releases associated with the use of PFAS-containing products are primarily related to management of solidwaste (for example, disposal of used items in a municipal solid waste (MSW) landfill or other legacy disposal areas). Othersolid waste facilities, such as scrap yards and metal salvage facilities, might also be a potential source of release to theenvironment. Some PFAS are considered hazardous waste by some states (Section 8).
Landfills can be sources of PFAS because they are the ultimate repositories for PFAS-contaminated industrial waste, sewagesludge from wastewater treatment facilities, and waste from site mitigation, as well as for PFAS-bearing consumer wastes,such as goods treated with hydrophobic, stain-resistant coatings (Busch et al. 2010) (Eggen, Moeder, and Arukwe 2010). Butthe type and concentration of PFAS vary greatly among landfills, due to variations in the waste streams. Industrial waste canbe a significant source of PFAS in landfills (as well as in wastewater and biosolids), particularly those that accept waste fromfacilities involved in the production or application of PFAS (Oliaei et al. 2013). Although MSW will contain PFAS due to itspresence in so many consumer products, it generally is expected to have lower concentrations than landfills that acceptindustrial waste. Given the production timeline of PFAS, industrial, commercial, and consumer products and waste disposedsince the 1950s are potential sources of PFAS release to the environment. As PFAS manufacturing processes change withtime, the resulting type and composition of waste streams also change. PFAS production and use began several decades
49

before the enactment of federal and state regulations governing waste disposal; as a consequence, environmental anddrinking water impacts from disposal of legacy PFAS industrial and consumer waste have been documented (Oliaei, Kriens,and Weber 2010) (Shin et al. 2011) (MPCA 2017).
Figure 2-20 illustrates common elements of CSMs associated with the potential release scenarios at waste managementfacilities.
Figure 2-20. CSM for landfills and WWTPs.Source: Adapted from figure by L. Trozzolo, TRC, used with permission.
2.6.3.1 Landfill ConstructionLandfills are either lined or unlined (Figure 2-20). MSW landfills constructed since the 1990s are required by federal or stateregulations to install a composite liner, a layer of compacted soil, and a leachate collection system (40 CFR 258.40).Although some states may have implemented construction standards at an earlier date, most landfills constructed beforethe 1990s were not required to have synthetic flexible membrane liners, compacted soil liners, or leachate collectionsystems, causing waste to be in direct contact with underlying soil or groundwater. Construction and demolition (C&D)landfills or nonmunicipal solid waste landfills are subject to the requirements specified in 40 CFR 257 Part A (and if theyintend to accept very small quantity generator waste, they are also subject to 40 CFR 257 Part B). Minimum design criteriafor landfill liners are not specified in 40 CFR 257. Therefore, new C&D and nonmunicipal solid waste landfills may bepermitted and constructed (or new cells added to existing facilities) without synthetic liners. Some states may have morerestrictive requirements. Therefore, unlined landfills (and legacy disposal areas not classified as landfills) have a higherpotential of contributing PFAS to groundwater (Oliaei et al. 2013). Properly constructed and operated modern landfillsprovide one of the few available disposal/management options for PFAS-containing waste, including wastewater solids,remedial/treatment waste, and consumer products.
Landfills are currently required to use a daily cover or alternate daily cover. It is acceptable for alternative daily cover toinclude materials such as sludge, sludge-derived products, shredded automotive parts, spray-on foams, and other materials(Pohland 1993) that are possible sources of PFAS. Landfill caps reduce infiltration of water to waste and may reduce theoverall mass of PFAS entering the environment from a landfill, but more research on their effectiveness is needed (Hamid, Li,and Grace 2018).
Leachate from some MSW landfills has been shown to be a source of PFAS release to the environment (Busch et al. 2010)(Eggen, Moeder, and Arukwe 2010), although the fate and transport processes for PFAS through landfills into leachate arenot well understood at this time. The processes for managing leachate have implications on the ultimate fate and transportof PFAS. Leachate collected from landfills is typically treated on site or transported to either a WWTP or evaporation ponds. Ifliners or leachate collection systems fail, PFAS may directly enter the environment. Modern landfills with properlyconstructed and operated liner and leachate collection systems should generally protect the underlying groundwater fromPFAS releases. Leachate treatment by WWTPs is common prior to discharge to surface water or distribution for agriculturalor commercial use (Lang 2016). However, standard WWTP technologies are generally ineffective at reducing or eliminatingPFAS (Hamid and Li 2016), (Ahrens et al. 2016) (CRC CARE 2017). As a result, the discharge of landfill leachate, even if
50

treated at WWTPs, can be a significant source of release of some PFAS to the environment (Ahrens et al. 2015) (CRC Care2017).
2.6.3.2 Waste AgeLandfills containing sources of PFAS may continue to release PFAS to leachate at slow but relatively steady rates for decadesfollowing initial placement. In modeled anaerobic landfill reactors, most of the release is attributed to biological, notphysical, mechanisms, indicating that the low solubility of the compounds is not solely responsible for slow release ratesfrom landfills (Allred et al. 2015) (Lang et al. 2016). Although landfill leachate PFAS concentrations can be relatively high,landfill leachate discharged to WWTPs for treatment generally is considered a relatively minor source to the environmentbecause the volume of leachate generated annually and sent to a WWTP for treatment is low compared to the flow volumein most WWTPs (Busch et al. 2010). However, legacy industrial waste landfills may constitute a major source of PFAS releaseto the environment (ATSDR 2008) (2012).
2.6.3.3 PFAS CompositionPFAS composition and concentration in leachates vary depending on waste age, climate, and waste composition (Allred et al.2015) (Lang et al. 2017). Relative concentrations of PFAS in leachate and groundwater from landfills are different from thoseat WWTPs and AFFF-contaminated sites. PFAS with fewer than eight carbons tend to dominate landfill leachate because theyare less hydrophobic and therefore more likely to partition to the aqueous phase (Huset et al. 2011) (Higgins and Luthy2007). In particular, 5:3 fluorotelomer carboxylic acid (FTCA) is a common and often dominant constituent of PFAS found inlandfills and is released from carpet in model anaerobic landfill reactors. This compound could prove to be an indicator ofPFAS in the environment originating from landfills (Lang et al. 2017, 2016).
PFAS may also be released to the air from landfills, predominantly as fluorotelomer alcohols (FTOHs) and perfluorobutanoate(PFBA). In one study, total PFAS concentrations were 5–30 times greater at landfills than at background reference sites(Ahrens et al. 2011). PFAS release rates vary with time for a given waste mass, with climate (for example, rainfall) as theapparent driving factor for the variations (Lang et al. 2017; Benskin, Li, et al. 2012). Gas collection systems commonlyemployed at modern landfills should reduce possible PFAS emissions to air.
2.6.4 Wastewater Treatment and Wastewater Treatment Residuals and BiosolidsConsumer and industrial use of PFAS-containing materials, including disposal of landfill leachate and firefighting foam, maydischarge PFAS-containing wastewater to municipal and industrial WWTPs (Lin, Panchangam, and Lo 2009; Ahrens et al.2009) private septic systems, or other wastewater disposal systems.
2.6.4.1 Wastewater TreatmentWWTPs can provide the following pathways for PFAS to the environment (Figure 2-20):
point source discharges of effluentleakage or unintended releases from surface impoundments and structuresair emissionsmanagement and disposal of biosolids and other byproducts generated during the treatment process (Section2.6.4.2).
The composition of PFAS in these media is a function of the different sources to the WWTP influent and the WWTP processes(Chen, Lo, and Lee 2012; Oliaei, D. Kriens, and Kessler 2006; Frömel et al. 2016) (Schultz et al. 2006), including:
type and concentration of PFAS received by the WWTP, particularly those that receive industrial wastewaterdischarges from industrial facilities manufacturing or using PFASbiological and chemical transformation of polyfluorinated substances (that is, precursor PFAS) to intermediateand terminal degradation products, such as PFAAsphysical or chemical partitioning, or both.
Conventional sewage treatment methods used in WWTPs do not efficiently remove PFAAs (Ahrens et al. 2011) (Schultz et al.2006). Even WWTPs with advanced treatment technologies (such as granular activated carbon (GAC), powdered activatedcarbon (PAC), or reverse osmosis (RO)) may not fully remove all PFAS if these systems were not designed with the intent toremove PFAS in addition to other targeted contaminants. Some PFAAs are frequently detected in WWTP effluent (forexample, PFOA and PFBS), with concentrations of some PFAS ranging up to hundreds of ng/L. Ahrens et al. (2011) and Hamidand Li (2016) suggested that WWTP effluent is a major source of PFAAs to surface waters.
51

Evaluation of full-scale WWTPs has indicated that conventional primary (sedimentation and clarification) and secondary(aerobic biodegradation of organic matter) treatment processes can change PFAS concentrations and subgroups. Forexample, studies have shown increased concentrations of PFAAs in effluent, presumably from degradation of precursor PFAS(Schultz et al. 2006), and the possible creation of PFAAs from the oxidation of polyfluorinated precursors during thetreatment process (Oliaei, D. Kriens, and Kessler 2006) (Frömel et al. 2016; Houtz et al. 2018).
PFAS may be concentrated in wastewater solids (for example, sewage sludge) generated throughout the wastewatertreatment process (Schultz et al. 2006). PFAS may also be present in septage (solids removed from septic systems).Depending on waste management and disposal practices, land application or landfill disposal of wastewater solids, biosolids,or septage could potentially contaminate the environment.
Hu et al. (2016) suggested that the presence of WWTPs in an area could be predictive of the presence of PFOS and PFOA indrinking water. PFOS and PFOA are two of the most frequently detected PFAS in wastewater (Hamid and Li 2016). UsingWWTP effluent-impacted surface water as a source of drinking water can, in turn, recycle the PFAS back to the WWTP,recirculating PFAS in the water cycle (Hamid and Li 2016).
At some WWTPs, studies have shown concentrations of PFAS in ambient air at WWTPs to be 1.5–15 times greater thanbackground reference sites (Hamid and Li 2016). Hamid and Li (2016) noted that these elevated air concentrations of totalPFAS include polyfluoroalkyls and that this has important implications considering the potential for their long-range transportand subsequent degradation to recalcitrant PFAAs. PFAS distribution (primarily PFAAs and FTOH, with higher concentrationsof FTOH) changes based on the specific PFAS sources in the effluent and the type of treatment methods employed at theWWTP. Lagoon systems contain a greater fraction of PFAAs.
2.6.4.2 Biosolids Production and ApplicationPFAS (measured as PFCAs and PFSAs) have been found in domestic sewage sludge (Higgins et al. 2005), and PFASoccurrence in biosolids is reported to be prevalent and nationwide (Venkatesan and Halsden 2013). Given that more thanhalf of the sewage sludge produced in the United States is applied to agricultural land as biosolids (USEPA 2017), there is thepotential for release of PFAS to the environment associated with biosolids production and application. PFAS are not known tobe added to biosolids during processing or application.
PFAS may be introduced to the environment through the land application of biosolids as a beneficial soil amendment,potentially allowing PFAS to enter surface water through runoff or to infiltrate to groundwater (Lindstrom et al. 2011). Thepotential effects on groundwater or surface water depend on the amount and composition of PFAS present in biosolids, soilproperties, infiltration rate, and land application practices. PFAS concentrations can be elevated in surface and groundwaterin the vicinity of agricultural fields that received PFAS-contaminated biosolids over an extended period of time (Washingtonet al. 2010). The Washington et al. study was completed in an area that received industrial wastewater discharges fromseveral PFAS-related industrial dischargers. Other studies indicate that the potential PFAS releases from municipal biosolids(for example, those generated from facilities that do not receive PFAS-related industrial discharges), may still impact waterquality, but at an apparent lower relative impact than at the industrial-influenced biosolids application sites (Gottschall et al.2017).
The most abundant PFAS found in biosolids (PFOS and PFOA) are the same as those found in WWTP effluent, althoughbiosolids may also contain other long-chain PFAS (Hamid and Li 2016). Although transformation polyfluorinated substancesto PFAAs in land-applied biosolids has been suggested (Sepulvado et al. 2011), other evidence suggests that somepolyfluorinated substances remain in biosolids-amended soils for many years (Rich et al. 2015).
Application of municipal biosolids as a soil amendment can result in a transfer of PFAS to soil (Sepulvado et al. 2011). ThesePFAS can then be available for uptake by some plants and soil organisms. There are indications that PFAAs can enter thefood chain through the use of biosolids-amended soil (Lindstrom et al. 2011; Blaine et al. 2013; Blaine, Rich, Sedlacko,Hundal, et al. 2014) (Navarro et al. 2017). It is noted, however, that PFAAs present at one municipal biosolids application sitewere not found in grain grown in the application plot (Gottschall et al. 2017). Hamid and Li (2016) suggested that short-chain(< C7) PFAAs in biosolids subsequently used in land applications can lead to contamination of food (Section 5.6).
Updated May 2021.
52
3 Firefighting Foams
The PFAS Team developed a training module video with content related to this section, it is the Aqueous Film-
Forming Foam video.
The purpose of this section is to assist aqueous film-forming foam (AFFF) users (first responders, regulators,
environmental managers and environmental professionals) who manage AFFF releases. The section includes
information about various aspects of using firefighting foams.
Section Number Topic
3.1 Foam Formulations
3.2 Mechanisms for Release to the Environment
3.3 AFFF Procurement and Inventory
3.4 Foam Systems and Operations
3.5 Emergency Firefighting Operations
3.6 Immediate Investigative and Cleanup Actions
3.7 Treatment and Disposal Options
3.8 Firefighting Foam System Replacement
3.9 Federal, State and International Regulations and Guidance
3.10 Foam Research and Development
It should be noted that the priority of firefighters and first responders is to protect life and property. The
information provided supports decision-making about firefighting using AFFF so that potential impacts to the
environment can be minimized and mitigated once the fire emergency is ended, or at such time that sufficient
resources are deployed to the scene to both handle the fire emergency and mitigate the environmental risks
posed by AFFF use. Figure 3-1 illustrates the life cycle considerations of AFFF. The considerations are discussed in sections 3.3 to 3.8.
53

Figure 3-1. Life cycle considerations for AFFF. Source: S. Thomas, Wood, PLC. Used with permission.
54

3.1 Foam Formulations
Class B firefighting foams are commercial surfactant solutions that are designed and used to combat Class B
flammable fuel fires. Class B foams have been (and continue to be) stored and used for fire suppression, fire
training, and flammable vapor suppression at military installations and civilian facilities and airports (Hu et al. 2016), as well as at petroleum refineries and bulk storage facilities and chemical manufacturing plants
(CONCAWE 2016). Additionally, local community fire departments have used and may maintain quantities of
firefighting foam in their inventories for use in training and emergency response. Facilities that manufactured firefighting foams and landfills that received firefighting waste are also potential sources.
All Class B foams are not the same. Although not usually categorized this way from a fire protection viewpoint, they
can be divided into two broad categories from a PFAS perspective: fluorinated foams that contain PFAS and fluorine-free foams (F3) that do not contain PFAS. Figure 3-2 highlights the two broad categories of Class B foams
and their subcategories.
Figure 3-2. Types of Class B foams
Source: S. Thomas, Wood, PLC. Used with permission.
All Class B foams have the potential to create an adverse environmental impact if released uncontrolled to the
environment, particularly if the foam reaches drinking water sources, groundwater, surface water, or other natural waters. For all Class B foams, including F3, there is a potential for acute aquatic toxicity and excessive biological
and chemical oxygen demand, as well as nutrient loading, depending on where the discharge occurs.
This section is focused on AFFF because it is the most widely used and available type of Class B foam. AFFF is a
highly effective type of Class B foam that is especially effective on large liquid fuel fires. AFFF is of particular
concern because it contains PFAS. As discussed elsewhere in this document, many PFAS are highly persistent
and mobile in the environment and are not removed by traditional drinking water treatment methods typically
used by public water suppliers.
55

The fluorosurfactants in AFFF formulations can be produced either using the ECF process or the
fluorotelomerization process. Both ECF-derived and telomer-derived AFFF contain diverse mixtures of PFAS (Barzen-Hanson et al. 2017). The ECF process results in a PFAS mixture dominated by PFAAs—both PFSA and
PFCA homologues, while the fluorotelomerization process exclusively produces AFFF formulations consisting of
polyfluorinated compounds (Houtz et al. 2013). ECF-based AFFF formulations were voluntarily phased out of production in the United States in approximately 2002 (Section 2.4.1). Despite the phaseout, however, ongoing
permitted use of legacy AFFF can still result in long-chain PFAA contamination. Several organizations (for example,
U.S. Department of Defense) commenced replacement of legacy PFOS AFFF with modern fluorotelomer AFFF, but some legacy AFFF remains in service or stockpiled at other facilities (Section 3.7.1).
Fluorotelomer foams have been in use since the 1970s and became the predominant foam after 2001, when the major manufacturer (3M) of long-chain ECF-based foams (legacy PFOS foam) discontinued production.
Fluorotelomerization-derived AFFF is still manufactured and used in the United States but has been reformulated to
limit, if not eliminate, long-chain PFAS; these foams are now referred to as modern fluorotelomer foams. Studies show ECF-based AFFF is the dominant source of PFAS at AFFF-impacted sites, likely due to the longer period of
ECF-based AFFF use and the relative coincidence of implementation of engineering controls for releases with
increased use of telomer-based AFFF (CONCAWE 2016; Anderson et al. 2016).
To further classify AFFF products in terms of current usage and environmental considerations, they can be divided
into three categories, including legacy PFOS AFFF, legacy fluorotelomer AFFF, and modern fluorotelomer AFFF (as
shown in Figure 3-2).
• Legacy PFOS AFFF was manufactured in the United States from the late 1960s until 2002 exclusively by 3M and sold under the brand name “Lightwater” (USDOD 2014). 3M did license some companies
overseas to use their products and formulations. Legacy PFOS AFFFs contain PFOS and
perflouroalkane sulfonates (PFSAs) such as perfluorohexane sulfonate (PFHxS) (Backe, Day, and Field 2013). Although phased out of production in 2002, legacy PFOS AFFFs are the dominant source of
PFAS at AFFF-impacted sites (CONCAWE 2016). Furthermore, because of its long shelf life, stock of
legacy PFOS AFFF could exist at any given fire department today.
• Legacy fluorotelomer AFFF were manufactured and sold in the United States from the 1970s until 2016
and encompass all other brands of AFFF besides 3M Lightwater or their licensed products (Schultz et al. 2006). Although they are not made with PFOA, they contain polyfluorinated precursors (Backe, Day, and
Field 2013) (Place and Field 2012) that are known to degrade to PFCAs, including PFOA (Weiner et al.
2013) (Harding- Marjanovic et al. 2015).
Modern fluorotelomer AFFF was developed in response to the USEPA 2010/2015 voluntary PFOA Stewardship
Program (USEPA 2018). Most foam manufacturers have now transitioned to the production of only short-chain (C6) fluorotelomer- based fluorosurfactants. These modern fluorotelomer AFFFs, or “C6 foams,” do not contain or
break down in the environment to PFOS or PFOA and are currently considered to be less toxic and have
reduced bioaccumulative potential compared to long-chain (C8) fluorosurfactants. But under particular
environmental conditions, breakdown products of C6 foams can include PFHxA, PFPeA, and 5:3 FTCA (Kempisty, Xing, and Racz 2018). Modern fluorotelomer AFFF may contain trace levels of PFOA as an unintended
manufacturing impurity or byproduct.
Fluorotelomer foams, short-chain fluorotelomer foams, and C6 foams are analogous and will be referred to as “modern fluorotelomer foams.” When discussing legacy PFOS or C8 foams, the term “legacy foams” will include
both legacy PFOS AFFF and legacy fluorotelomer AFFF.
56

Legacy foams were first introduced by the naval firefighting services in 1964 (Gipe and Peterson 1972). The U.S.
Naval Research Laboratory (NRL) began research on the development of firefighting foams in the 1960s. This led to advancements in fire suppression performance and increased firefighting safety (US Naval Research Laboratory
2017). In 1969, the U.S. Department of Defense (USDOD) issued military specification MIL-F-24385, which dictates
the performance of all AFFF (with performance standards referred to as “Mil-Spec”). AFFFs shown to perform to MIL-F-24385 requirements are listed on the U.S. military’s AFFF Qualified Product Listing (QPL). The first date AFFF
was placed on this list was May 15, 1970 (MIL-F-24385 QPL/QPD History of Type 6 AFFF). DOD maintains the online
qualified products database (QPD) that lists all AFFF agents that have been tested and qualified by the NRL to meet the Mil-Spec, currently referenced as MIL-PRF-24385, (USDOD 2018). On July 1, 2006, the Federal Aviation
Administration (FAA) required that commercial airports certified under 14 CFR Part 139 purchase only AFFF that is
Mil-Spec compliant (FAA 2006, 2016; 14 CFR 139.317). Recently, the FAA Reauthorization Act modified that
requirement. More information can be found in Section 3.9.3.1.
Different types of AFFF were produced to meet firefighting specifications, such as Mil-Spec, rather than formulated
to contain a specified mixture of PFAS. Firefighting foams are a complex mixture of both known and unidentified PFAS. Multiple AFFF formulations have been produced over the years, and the exact composition of any given
AFFF used or manufactured in any given year is variable (Backe, Day, and Field 2013). However, due to the
production methods, any given AFFF formulation contains complex mixtures of PFAS, many of which can be identified only by nontargeted analytical methods (Barzen-Hanson et al. 2017).
AFFF is typically formed by combining hydrocarbon surfactants, organic solvents, fluorosurfactants, polymers, and
other additives (Kempisty, Xing, and Racz 2018). AFFF concentrates are commercially available in both 3% and
6%. Figure 3-3 illustrates the typical composition of a 3% AFFF concentrate; water/diluent makes up more than 60% of the concentrate, up to 20% is solvents, and as much as 18% is surfactants, of which less than 2% is
fluorosurfactants. When the concentrate is mixed with water, the resulting solution achieves the interfacial
tension characteristics needed to produce an aqueous film that spreads across the surface of a hydrocarbon fuel to extinguish the flame or reduce the hydrocarbon vapors.
Figure 3-3. Typical composition of 3% AFFF concentrate.
Source: S. Thomas, Wood, PLC. Adapted from Kempisty, Xing, and Racz 2018.
57

3.2 Mechanisms for Release to the Environment
Firefighting foam is applied by mixing foam concentrate and water to make the firefighting foam solution, which
typically contains less than a fraction of a percent of fluorinated surfactants once in mixture. When applied to a fire, the foam solution is aerated at the nozzle, yielding finished firefighting foam. Thousands of gallons of foam
solution may be applied during a given event. Figure 3-4 illustrates the use of firefighting foam, how it may be
released to the environment, and potentially affected media. Once released to the environment, AFFF can
contaminate soil, surface water, and groundwater.
Figure 3-4. Release of firefighting foam.
Source: Adapted from figure by J. Hale, Kleinfelder. Used with permission.
Firefighting foams are released into the environment through various practices and mechanisms (Anderson et
al. 2016) (Hale 2016) (Thalheimer 2017) such as:
• low-volume releases of foam concentrate during storage, transfer, or operational requirements thatmandate periodic equipment calibration
• moderate-volume discharge of foam solution for apparatus testing and episodic discharge of AFFF-
containing fire suppression systems within large aircraft hangars and buildings
• occasional, high-volume, broadcast discharge of foam solution for firefighting and firesuppression/prevention for emergency response
• periodic, high-volume, broadcast discharge for fire training
• accidental leaks from foam distribution piping between storage and pumping locations, and from
storage tanks and railcars.
58

AFFF-impacted sites often are also contaminated with petroleum hydrocarbons from unburned fuel. PFAS and
hydrocarbon plumes at these sites may follow the same flow paths, though the extent of contamination may be
significantly different. These co-contaminants, particularly light nonaqueous phase liquids (LNAPLs), may affect
the fate and transport of AFFF- derived PFAS (Guelfo and Higgins 2013) (Lipson, Raine, and Webb 2013)
(McKenzie et al. 2016), see Section 5.2.5. Certain air-based or in situ oxidation remedial activities aimed at
treating co-contaminants may affect PFAS composition, fate, and transport as well (McKenzie et al. 2015).
Additionally, the altered soil and groundwater geochemistry and redox conditions may result in oxidation of some PFAS precursor compounds, degrading them to terminal PFAAs (Harding-Marjanovic et al. 2016; McKenzie et al.
2016; McGuire et al. 2014). For additional detail on fate and transport of PFAS from AFFF releases see Section 5.
The USDOD has undertaken an evaluation of potential firefighting foam contamination at its facilities nationwide
(Anderson et al. 2016). Similar efforts have been undertaken by some states. For example, the Minnesota Pollution Control Agency (MPCA) conducted a statewide survey of firefighting foam use at training sites.
Working with the State Fire Chiefs Association, the MPCA identified more than two dozen locations where Class
B foams were likely used in firefighting training (Antea Group 2011).
Figure 2-19 illustrates common elements of CSMs associated with the potential AFFF release scenarios at fire training areas.
59

3.3 AFFF Procurement and Inventory
This section discusses procurement and inventory of AFFF, including suggestions for storing inventory to minimize
the potential for accidental releases.
3.3.1 Foam Selection and Requirements
Multiple manufacturers in the United States and abroad produce AFFF concentrate in 1%, 3%, or 6%
concentrations. Most AFFF sold or in stock in the United States is either 1) listed by Underwriters Laboratory (UL) based on conformance with UL Standard 162, “Foam Equipment and Liquid Concentrates,” or 2) tested by NRL
and granted qualification by U.S. Naval Sea Systems Command in accordance with the Mil-Spec. Only AFFF
meeting the Mil-Spec is used in military applications and at FAA-regulated airports.
Military and FAA AFFF applications subject to Mil-Spec account for more than 75% of AFFF used in the United States
(Airport Cooperative Research Program ACRP (2017)). Hence, the production of AFFFs has historically been driven by firefighting specifications, such as Mil-Spec, which requires a specific percentage concentration of PFAS. Current
Mil-Spec AFFFs contain
≤ 1% (approx. 0.5–0.6%) fluorosurfactants after the concentrate is mixed with water to create the final foam solution used to extinguish or prevent high-hazard flammable liquid fires; however, the exact AFFF PFAS mixtures
are highly variable. Non- Mil-Spec Class B foams can vary from fluorine-free to having concentrations of PFAS
similar to Mil-Spec AFFF. Furthermore, where fire risk allows it, users who are not subject to Mil-Spec
requirements are less likely to use foam formulations that contain PFAS given the environmental implications and increasing prevalence of F3. However, the knowledge of environmental implications of PFAS was historically
lacking and is still not widely understood by first responders, and there are many historical examples of AFFF use
by municipal fire departments during fire response activities.
3.3.2 AFFF Storage and Handling
AFFF concentrate is available from the manufacturers in containers ranging from 5-gallon buckets to 5,000-
gallon tanker trucks. The most common method of shipping is in 5-gallon buckets, 55-gallon drums, or 265-gallon
intermediate bulk containers. Shipping containers are typically not double walled but made of plastic, steel, or steel reinforced plastic tote construction to resist damage/puncture. Per National Fire Protection Association
(NFPA) 11, Section 4.3.2.3, bulk liquid storage tanks should be fabricated from or be lined with materials
compatible with the concentrate, designed to minimize evaporation of foam concentrate, and stored within the listed temperature limitations (NFPA 2016).
In fire suppression systems, the AFFF concentrate is typically stored in either an atmospheric (non-
pressurized) tank or a bladder tank (pressurized). Atmospheric tanks are single- or double- walled tanks and
can supply proportioning foam concentrate pumps or venturi-based proportioners that feed the suppression system. Atmospheric tank piping arrangements may include recirculation from downstream of the pump back to
the tank. The bladder tanks contain a bladder filled with foam concentrate that is squeezed by water between
the shell of the tank and the bladder. As long as the bladder integrity is maintained, the foam concentrate does not mix with the shell water.
Safety data sheets are provided by all manufacturers for each specific type of AFFF. Labels on shipping
containers conform to U.S. Department of Transportation (USDOT) standards. AFFF and AFFF-impacted materials
(soils and absorption materials), including concentrate being disposed, rinsate, and foam supply system materials, are not currently considered to be hazardous materials under federal regulations. Some individual
states have passed legislation to include PFOS, PFOA, and other PFAS on their hazardous substances list and
otherwise restrict the sale and use of AFFF (for example, (Washington Senate 2018) (New York State 2017). Regulations are discussed further in Section 3.9.
60

Best practice is to treat foam concentrate with caution and to ensure containment until proper disposal. AFFF
materials should be labeled to clearly indicate the contents of the container. It is important that all containers are kept clean so that any signs of leakage can be easily and quickly identified during container inspections, with
the labeling pointed outward for easier reading.
61

3.4 Foam Systems and Operations
Class B firefighting foams are employed globally to fight flammable liquids fires where risk of damage to property
or human life is high. These products are particularly prevalent in airport settings. This section describes common AFFF system operations, including system testing and training. Additionally, information is provided in Section 3.8
for organizations that want to replace legacy PFOS AFFF systems with modern fluorotelomer AFFF or F3.
3.4.1 Fixed System Testing
Fixed fire suppression systems that utilize any of the foam types and application methods are permanent
designs and should incorporate the containment, collection, and runoff components in the event of system
discharge into the design. Examples include flammable liquid warehouse, waste treatment facility, and aircraft
hangar fire suppression systems. New systems should be designed to include foam containment and collection
mechanisms such that foam releases that occur during testing or activation are not released to the environment, or the AFFF can be captured for disposal. AFFF design standards require minimum durations for
foam system discharge to meet the suppression/control requirements and in some cases require specific
volumes of concentrates and foam solution to be contained in on-site storage tanks. Fixed AFFF proportioning systems that are connected to city water mains should be fitted with backflow preventers to protect the city
water mains from potential AFFF contamination.
Codes, standards, and authorities having jurisdiction over fixed system testing, such as NFPA Standards 16 (NFPA
2019) and 25 (NFPA 2017), can require that the equipment produce a foam/foam solution that can be tested and compared to laboratory standards. System testing generates a small amount of foam that should be
contained or controlled by the design to the best extent possible for proper disposal. Foam can be wetted with fog
nozzles/mist to knock down the foam and dilute it. Gentle squeegee and sweeping are required to keep the solution from aspirating during cleanup and dilution. Alternatives, such as testing with water (without foam) or
testing with fluorine-free training foam or surrogate liquids having similar physical properties, may be considered
to minimize disposal issues. Check applicable regulatory requirements for testing to determine frequency and type of testing required, as well as what is specifically mandated for foam type before any alternatives are
considered to ensure compliance with appropriate laws.
3.4.2 Mobile Firefighting Equipment Testing
Firefighting equipment requires inspection, calibration, and testing to ensure reliability and performance to specifications. In accordance with fire protection standards (for example, NFPA Standard 412, (NFPA 2020)
and manufacturer’s recommendations, the testing of mobile firefighting equipment should be conducted
routinely and documented.
Multiple pieces of equipment can be tested or inspected simultaneously. Mobile equipment, including but not
limited to mobile foam extinguishers, firefighting vehicles, and marine craft, can be collected, tested, and cleaned and foam concentrate samples can be collected in a single location to minimize potential impacts. It is
recommended that testing of mobile firefighting equipment is executed at purpose-built facilities specifically
designed to capture and contain all generated foam and wastewater for treatment, reuse, or disposal.
62

Conditions during equipment testing should include secondary containment measures to ensure foam solutions
can be captured and managed and environmental impact minimized. Alternatives to traditional testing methods may be considered, such as:
• Using water or surrogate solutions for training
• Testing equipment indoors
• Spraying into drums or other containers
• Testing within lined pits of spill containment equipment
• Testing with closed-loop AFFF testing systems to minimize and eliminate discharge (for example FAA CertAlert 19-01 (FAA 2019).
Other controls include not testing during adverse weather conditions, not testing where the facility is not
deemed fit for purpose, conducting a risk assessment of the activity, and minimizing foam wastewater volume generated whenever possible. As with fixed fire suppression systems, mobile equipment that complies with NFPA
Standard 412 requires that the equipment produce a foam/foam solution that can be tested and compared to
laboratory-analyzed solutions (NFPA 2020).
3.4.3 Training Exercises
Facilities should have specifically designed areas and structures to conduct training exercises involving flammable liquid fires and foam systems. The fire training areas (FTAs) should be arranged to contain/control the
training site for the safety of the persons being trained. Control of training fires as well as applied foam and/or
foam solutions is maintained by the facility design. The FTA should also be designed for collection/recovery of unburned fuels as well as the foam solution and fire water following the completion of training exercises.
Conducting outside exercises during windy weather conditions should be avoided, as the foam solutions can be
difficult to contain due to natural aspiration and windblown transport.
Past training exercises at airports and military installations employed large quantities of foam/foam solutions. To prevent further releases to groundwater, USDOD issued a policy in January 2016 requiring prevention of
uncontrolled land-based AFFF releases during maintenance, testing, and training activities. Current USDOD policies
prohibit using AFFF with PFOS for testing, maintenance, or training exercises with the exception of shipboard activities.
Consider minimizing the volume of foam used to the greatest extent possible. If permitted by the applicable
regulatory requirements for training, consider entirely discontinuing the practice of using expired legacy AFFF and
modern fluorotelomer AFFF as training foam. Whenever possible, seek fluorine-free alternatives for training events; consider training with water or training foam where practicable, not Class B foam, and certainly not with
Class B foam containing PFAS. Any wastewater or foam generated from training activities should be kept to a
minimum and foam spraying should be restricted to target areas only (not sprayed over wide areas). Preplanning responses that deploy AFFF can identify weaknesses in both AFFF use strategies and in fuel and fire water
runoff and containment. This can also identify the need for calling mutual aid early to assist with containment
tactics.
63

3.5 Emergency Firefighting Operations
Fire response planning in advance can identify various options for firefighting and contingency planning for fire
wastewater capture. Where possible and as setup allows, consider containing and recovering AFFF used for
emergencies for disposal. Use mutual aid resources to assist with containing the fuel and fire water runoff should
your department not have the resources available to fight the fire emergency and contain the runoff (Section 3.4).
Although federal law currently does not prohibit the use of existing stocks of legacy AFFF, any discharge of foam
containing PFAS to public waters can be considered a release of a “pollutant or contaminant” under the
Comprehensive Environmental Response Compensation and Liability Act (CERCLA), 42 U.S. Code § 9601, and therefore may be subject to remediation requirements.
Emergency scenarios vary case by case.
Industrial plant fire brigades and responding emergency crews utilize portable foam generators
or monitor nozzles to apply foam to pooled
flammable liquids (potential fires) or existing fires. In cases where the fire involves a fixed system, it
is critical that an arrangement for
containment/control of runoff is included in the
design. The following are examples of how preplanning can better inform the use and
containment of AFFF at an industrial facility:
• Industrial processes have many components, and only portions of the process are protected by the fixed foam systems. For example, a scrubber, or filter found within industrial smokestacks, may be part of the process that is not protected by the foam system and may be outside the discharge area
where design considerations have been made for containment/control. Emergency response units
may be required to apply foam/water to the location of the scrubber, outside the planning boundaries, in the event the fire that originated in the process was conveyed to the scrubber unit.
• At oil refineries, F3 may be used for small incidents and fluorinated foam reserved for the large tank fires. Fluorine-free and new generation C6 foams have been tested in large-scale tests (involving up
to 40 m foam travel requirements) and could be considered suitable for application to fires involving
some tank sizes and the associated dike area fires. But firefighting foam use is rapidly evolving, and as such, those responsible for tank application foam selection should refer to the latest test results
from any recognized independent source (for example, LASTFIRE) to determine whether F3 could
meet the performance requirements.
• On some remote industrial sites, where no immediate threat to life or property exists, and given the
additional resources necessary to manage the wastewater produced, the best response may be to let the fire burn instead of applying AFFF.
Consideration should be given to parts of facilities not protected by the fixed foam system that could be subject to AFFF application in the event of an emergency incident and opportunity for containment of foam.
64

3.5.1 Best Management Practices (BMPs)
BMPs are key to the use of AFFF in the most environmentally responsible manner with the goal of minimizing risk
from their use. It is important to establish BMPs prior to use in an emergency so that BMP equipment, procedures, and training are already in place. Although firefighting personnel may be aware that the foams they
are using contain chemicals, they may not be aware of the potential environmental effects of AFFF use. Training
of firefighting personnel is important to ensure BMPs are discussed and employed consistently and effectively.
Example BMPs, adapted from the Fire Fighting Foam Coalition (FFFC 2016), are summarized in Table 3-1. Users should follow BMPs to protect themselves, others, and the environment when using AFFF and other foams. Further
BMP guidance can be found in other documents, such as the Best Practice Guidance developed by the Fire Fighting Foam Coalition (FFFC 2016), and the US National Fire Protection Association’s NFPA 11 NFPA (2016).
Users at DOD facilities have other BMPs to follow.
Section 3 provides supporting information for the BMPs presented in Table 3-1, as follows:
Foam selection and storage are discussed in Section 3.3 (AFFF Procurement and Inventory). Use is detailed in Section 3.4 (Foam Systems and Operations).
Planning and mitigation are covered in Sections 3.5 (Emergency Firefighting Operations) and 6
(Immediate Investigative and Cleanup Actions). Disposal is addressed in Section 3.7 (Treatment and Disposal).
This table addresses current operating procedures for selection, storage, use, planning and mitigation. For
complete change- out and transition from AFFF to fluorine-free across an entire system, detailed consideration
should be made regarding performance, compatibility, decontamination, treatment, and disposal.
Table 3-1. BMPs for AFFF (and Other Foams) Selection, Storage, Use, Planning and Mitigation, and Disposal
Life Cycle BMP
Foam Selection
1. Public safety first. Use AFFF and other fluorinated Class B foams only in thefollowing situations:
• Class B liquid fires and/or spills with significant risks to public safety or ofproperty loss, where specific extinguishing rates and burnback times are
necessary
• Facilities where AFFF is required until fluorine-free foam (F3) replacement thatmeets Mil-Spec has been approved
2. Evaluate whether Class B foam is needed for a specific hazard, or if an
alternative technique, such as a fluorine free foam (F3) can provide the needed
level of protection. The proper agent to use for your hazard “must be evaluatedwell in advance of an emergency situation” (FFFC 2016).
65

Life Cycle BMP
Storage
1. Develop a foam inventory and stock tracking system documenting foam composition, date of purchase, lot number, brand, and manufacturer.
2. “Obtain and follow manufacturers’ recommendations for foam concentrate
and equipment” (FFFC 2016). The amount of foam in the system should be at least enough for the group of hazards that simultaneously need to be protected
against.
3. Designate transfer areas and store Class B foam concentrate (all foam, not only AFFF) in a covered area with secondary containment.
4. Design storage tanks to minimize evaporation of concentrate. Label
containers clearly to identify the type of concentrate and its intended
concentration in solution. Keep foam within the temperature limitations provided by the manufacturer.
5. Properly maintain foam systems to prevent accidental discharges. Conduct
regular inspections of tanks, storage containers, and any associated piping and machinery. Any leaks of foam concentrate should be addressed immediately to
minimize environmental impacts. Maintain records of accidental releases,
including date, volume, and foam type. Be cognizant of state and local reporting requirements for releases.
6. Corrosion is generally not an issue with foam concentrates, but exceptions
exist. Manufacturers recommend stainless steel, high-density polyethylene (HDPE), or polypropylene containers for AFFF storage. Avoid using aluminum,
galvanized metal, and zinc in storage tanks, piping, and handling equipment for
foam concentrates (Angus Fire 2017).
7. Ensure compatibility of foams per manufacturer specifications before
change-outs. Do not mix different types or brands of foam concentrates
unless all the foams are compatible. As an example, all foams that meet Mil-
Spec 24385 are considered compatible.
66

Life Cycle BMP
Use
1. Consider the firefighter and public safety first.
2. Eliminate the use of AFFF and other fluorinated “Class B foams for trainingand testing of foam systems and equipment” whenever possible Instead,
use specially designed nonfluorinated, PFAS-free “training foams availablefrom most foam manufacturers.” (FFFC 2016).Be aware that such training
foams result in longer extinguishments and less burnback protection.
3. If the authority having jurisdiction requires testing of equipment or training offirefighters using AFFF, training foams that do not contain fluorinated
compounds are preferred and, in many cases, required. All foams, regardless of
type, should be captured during training and testing.
4. Evaluate firefighting strategy to determine if Class B foam is needed or if aClass A foam or just water can succeed in fighting the fire.
5. Provide containment, treatment, and proper disposal of foam solution. Avoid
direct release to the environment to the greatest extent possible.
6. Collect, treat, and properly dispose of runoff/wastewater from training events
or live fire events to the greatest extent possible. Prevent discharge to storm
drains and surface water to the greatest extent practicable.
7. Use appropriate personal protective equipment (PPE) when handling andusing AFFF and identify how to decontaminate and or dispose of PPE materials
and gear that come into contact with foam.
8. “Follow applicable industry standards for design, installation, maintenance,and testing of foam systems” (FFFC 2016).
9. Keep records of when and where foam is used to respond to incidents,including foam type, manufacturer, brand, and amount used.
10. Make note of any sensitive receptors (for example, streams, lakes, homes,
wells) identified in the vicinity of foam use and report to environmental agenciesas required.
Planning and Mitigation
1. Develop and communicate documented processes for a facility or installation
with the stakeholders and regulatory agencies before a release occurs.
Stakeholders may include local fire department, elected officials, landowners,
interested parties, and local environmental groups.
2. Prepare runoff collection plans, equipment, and training processes for all foam
and those specific to fluorinated Class B foam use.
3. Create mitigation plans for uncontrolled releases of foam concentrate orfoam solution to minimize environmental impacts (FFFC 2016).
4. Quickly and thoroughly clean up any contaminated environmental media after
foam release following established mitigation plans.
5. Design new firefighting systems to accommodate F3s. Consider their different
properties, modes of action, and effectiveness.
6. Prioritize education, training, and preplanning to ensure the safest and most
efficient use of foam and equipment during an incident.
67

Life Cycle BMP
Disposal
1. Proper disposal of foam is imperative. See Section 3.7. When available,consider disposal of AFFF inventory to state collection and disposal programs.
Refer to Interim Guidance on Destroying and Disposing of Certain PFAS and PFAS-
Containing Materials That Are Not Consumer Products (USEPA 2020).
2. Terminate any donation programs for expired or unused AFFF concentrate (for
example, donation to fire training school). Instead, as stated above, encourage
collection/proper storage/disposal of expired or unused AFFF.
3. Monitor developments in new treatment and disposal technologies.
3.5.2 Personal Protective Equipment
The use of personal protective equipment (PPE) is highly recommended when exposure to AFFF, as well as other firefighting foams, is anticipated. A critical aspect of PPE is ensuring the proper use of the equipment. The
equipment should be used correctly, maintained, and decontaminated routinely (Queensland Government 2018).
During the application or immediate cleanup of AFFF foam, the use of a self-contained breathing apparatus or
positive pressure–supplied air respirator is recommended to avoid respiratory exposure. Dermal exposure should also be avoided, as skin contact can result in irritation and dryness. When responding to fires, first
responders should wear appropriate turnout gear, or proximity gear per their specifc department requirements.
PPE cleanup after using AFFF (as well as other foams) is discussed in the next section.
3.5.2.1 Decontamination
Although PPE will prevent initial exposure to AFFF, contamination of the PPE itself can present health risks.
Decontamination of the PPE and personal hygiene are crucial preventative measures in reducing or avoiding
exposure to AFFF, as well as in avoiding cross-contamination.
When handling AFFF concentrate or foam, it is imperative to avoid hand-to-mouth contact. After the use or cleanup
of AFFF, responders should wash hands and use other decontamination procedures to remove any residual
AFFF from the skin.
Responders should remove contaminated clothing and launder before reuse.
PPE should be placed in a bag and container after exposure to AFFF as well as other foams. In 2014, NFPA
released its latest edition of NFPA 1851: Selection, Care and Maintenance of Protective Ensembles for Structural
Firefighting and Proximity Firefighting. This standard provides guidance for proper care of firefighting protective
gear as well as health hazards associated with improper maintenance or contamination of protective equipment
(NFPA 2014). The standard outlines different decontamination measures for turnout gear as well as proximity
gear.
Turnout gear is the general PPE for firefighting. It should be machine washed in warm water in the normal cycle. Turnout gear should be spot treated with warm water, a soft brush, and mild detergent prior to being machine
washed. When hand washing and spot treating PPE, wear protective gloves—either latex or PVC— to avoid skin
contact with any residual AFFF. No fabric softener or bleach should be used. The turnout gear should never be washed in home washing machines, as this practice has the potential to contaminate personal clothing.
Advanced cleaning is suggested at least on a yearly basis (Avsec 2015).
Although PPE decontamination prior to reuse is important, it is equally important to recognize when
decontamination is not possible. In this case, the gear should be discarded in accordance with local, state, and federal regulations.
68
When decontaminating or laundering PPE, the disposition of the waste stream should be considered. The
potential for environmental impacts due to laundering in washing machines is not well defined, but the potential does exist. Regulatory agencies should consider including decontamination procedures when working with
firefighters, refinery safety personnel, and other potential first responders to develop BMPs.
3.5.3 Initial Mitigation Efforts for Firefighting Foam
Initial mitigation efforts following a release of firefighting foam include source control, containment tactics, and recovery tactics. Each is further described in this section.
Discharges of AFFF can occur during firefighting operations, system testing, equipment malfunctions, or incidental
releases. In addition to foam, a large amount of water is often applied when attempting to suppress a fire. Due
to the highly miscible nature of AFFF, the main objective of the initial mitigation efforts should be to reduce the
footprint of contamination by limiting the spread of foam and fire water. This is often done through various containment and recovery tactics while making sure that the release has been abated and response personnel
are safe.
Specific department or facility fire wastewater management considerations may be outlined in a fire response plan, which should include information such as resources available within the facility or department fire protection
jurisdiction to contain and recover fire water, protect sensitive areas (for example, public and private water systems, storm drains, surface water, critical wildlife habitat), and address safety considerations when
conducting water management tactics. By using the fire response plan, first responders familiar with the content
can increase the potential for a successful response while reducing or eliminating any imminent or substantial threat to human health, safety, welfare, or the environment.
3.5.3.1 Source Control
In addition to AFFF application for emergency response, accidental discharge of AFFF can occur from faulty or
malfunctioning equipment such as hard-lined fire suppression systems in aircraft hangars or equipment used to apply or contain foam (for example, fire engines or storage tanks). The first step in any response is to stop the
accidental discharge or release at the source by disabling or shutting off the system, if possible, and then
temporarily or permanently repairing the malfunctioning equipment. By controlling the source, the impact to the
environment is minimized.
3.5.3.2 Containment Tactics
Due to AFFF’s miscible nature, as well as the large amount of water often applied in combination with the foam,
containment tactics that prevent or minimize surface water runoff are critical during and after emergency
response activities. Proper containment tactics may also reduce the footprint of the affected area to make the
containment and cleanup easier.
Depending on resources available to response personnel and conditions of the release, tactics such as
ditching, berming, diking, damming, and blocking storm drains, culverts, or other surface inlets can help to
contain runoff. When using these tactics, it is important to ensure that any digging activity will not result in
breaking through a confining layer that would allow contaminated water to move more quickly into the
subsurface and specifically to groundwater. Several response organizations have tactics manuals available
online for review, including the Spill Tactics for Alaska Responders (STAR) Manual (AK DEC 2014) and Alaska Clean Seas Tactics Manual (Alaska Clean Seas 2017). Most manuals are targeted at tactics proposed to be
conducted after a release of oil or other petroleum products, but most of these tactics will also apply to AFFF
releases. General guidance, similar to this section, on containment tactics to be conducted after a foam discharge has been provided by several other organizations, including the Firefighting Foam Coalition (FFFC
2016, 2018) and the Queensland Department of Environment and Science (Queensland Government 2018).
69
As stated previously in this section, preplanning can greatly assist with prioritizing sensitive areas or locations
that need protection during the mitigation or response effort after an AFFF discharge, as well as the resources
necessary to succeed with this strategy. The containment tactics used and resources required will differ among
sites. Preparedness can be increased by identifying potentially sensitive areas. Also, designing infrastructure such as aircraft hangars with foam- applying fire suppression systems so that the discharged foam is
automatically directed to storage tanks or containment structures can minimize the need for any cleanup. The
DOD has provided guidance via Engineer Technical Letters (USACE 2018) that address containment/disposal system design for AFFF discharges from open systems (such as nozzle and deluge sprinkler systems) and
closed systems (in which individual sprinkler heads are activated only by heat of a fire).
Because no single set of containment tactics is going to be applicable to all facilities or departments where a
foam discharge occurs, it is important for each user to conduct preplanning to identify solutions that fit its facilities, objectives, and specific response scenarios.
3.5.3.3 Initial Recovery Tactics
Recovery tactics can differ depending on the amount of AFFF released, as well as whether the AFFF is discharged
during firefighting operations or accidentally (for example, from malfunctioning equipment). Collection of large
volumes of AFFF concentrate or the 1%, 3%, or 6% AFFF mixture combined with water could require the use of
mechanical devices such as pumps or vacuum trucks, while absorbent material might suffice to clean up after a
smaller release. The AFFF and water mixture has a low flammability and a high flash point, so there is no need to use intrinsically safe pumps or mechanical devices unless other, more flammable compounds are present in the
fire water being recovered.
It may be beneficial to remove affected AFFF saturated materials such as soil and vegetation to reduce or
eliminate surface or subsurface migration of potential contaminants. Removal of contaminated media may reduce
or eliminate the need for additional investigation and cleanup in the future; however, focus during the initial
mitigation effort should be on the more easily recoverable media such as affected waters or slurries. Initiating
recovery tactics as soon as possible after a release of AFFF will greatly reduce the footprint of PFAS-
contaminated materials and lower the cost of the total mitigation effort.
70

3.6 Immediate Investigative and Cleanup Actions
A series of immediate investigative actions can be taken after the use of AFFF at the site of a fire to determine
the level, nature, and extent of the contamination. First responders should collect information regarding the volume of AFFF discharged, its concentration, active ingredients, and discharge location information.
Information about actions to be taken after the immediate actions is included in Section 10, Site
Characterization; Section 11, Sampling and Analytical Methods; and Section 12, Treatment Technologies.
Traditional field-screening methods used for other types of contaminants (for example, PID field screening for
petroleum) are not effective for PFAS due to their unique chemistry, generally low volatility, and lack of
development of colorimetric or reactive chemistry technologies. Some efforts have been made to develop mobile
analytical laboratories, which are covered in Section 10.3.1.2 of this document.
3.6.1 Visual Site Delineation
Visual site delineation refers to outlining the affected area of contamination based on visual clues, such a visible foam and wet ground, as a guide. The extent of foam should be marked using survey tape, lathe, and
pin flags placed to identify locations of AFFF contamination. This technique of determining the initial expanse of
the contamination is simple to perform directly after a discharge and can be useful for reference in future testing
on the site. In addition, photographs of the site taken during or immediately after the incident can be used to determine the extent of AFFF impacts.
3.6.2 The Shake Test
The shake test is an informal qualitative field-screening method that provides a visual analysis of the site
contamination. The shake test can apply to both water and soil-water solutions. In the shake test, a small sample
(10–25 mL) is collected on site by the field personnel and shaken. After it is shaken, if there is foaming in the sample, it should be noted and then submitted for analysis (Transport Canada 2017). Photographs of the
samples may be helpful. The presence of foam implies the sample is contaminated with AFFF. This test is a
good indicator for high concentration contamination. It may not be able to detect lower concentrations of contaminants, so lab testing may still be required.
3.6.3 Initial Investigative Sampling
Investigative sampling is used to determine the nature and extent of contamination, including concentrations at
and surrounding release areas. Initial investigative sampling can help to determine whether additional characterization is necessary, in addition to informing the need for and extent of interim or permanent remedial
actions. Combining the information gained from investigative and confirmation sampling with information from a
CSM will inform project managers as to whether further site characterization and remediation or mitigation efforts
are needed. See Section 5 (Environmental Fate and Transport Processes), Section 10 (Site Characterization) and Section 12 (Treatment Technologies) for additional information on the actions that may be needed following
initial response.
71

3.6.4 Interim Removal
Following the information gathering described above, or possibly prior to initial investigative sampling, additional
source control can be achieved through removal of soils that are expected to be highly contaminated. During an initial removal action intended to target PFAS hot spots, soil excavation can be guided by shake tests (Section
3.6.2). An interim removal is not necessarily designed or expected to remove all contamination but can help to
reduce the migration of PFAS into other media, including groundwater and surface water. To determine how to dispose of the soil, see Section 12 (Treatment Technologies).
3.6.5 Confirmation Samples
Once removal actions take place, confirmation samples are taken to confirm that an excavation or interim removal successfully removed the soil contamination that exceeds applicable regulatory or risk-based levels. If
confirmation sampling determines that soil contamination still exists at levels of concern, additional removal
actions or other types of remediation or mitigation may be required. The type, number, and distribution of confirmation samples is determined on a site-specific basis according to local regulatory guidance.
72

3.7 Treatment and Disposal
BMPs suggest that all AFFF foam concentrate volume be fully accounted for at each storage location, from fire
trucks to suppression systems to storage containers (see Table 3-1). Weights of other AFFF system components requiring disposal should be similarly observed. Disposal certificates for materials bound for removal should indicate
volumes of AFFF concentrate or solution or weights of system components or debris, as applicable. Total
volumes or weights generated for disposal should match that indicated on disposal certificates.
3.7.1 AFFF Concentrate
The disposal of AFFF concentrate is dependent on the product type and the ingredients present in the product to be disposed. Several methods are currently being used for disposal of AFFF concentrate. These include
underground injection wells, hazardous waste landfills, solid waste landfills, incineration, and interim storage
(USEPA 2020). Further information regarding treatment and disposal is presented by USEPA (2020), Stoiber, Evans, and Naidenko (2020), and Aleksandrov et al. (2019).
Most AFFF concentrate has historically been disposed of using incineration in the United States (FFFC 2016). The
effectiveness of incineration, and the temperature and time conditions required to achieve complete PFAS
destruction, are not well understood (USEPA 2020). Legal, technical, and political challenges to incinerating AFFF
exist based on gaps in research on the effectiveness of incineration (Earthjustice 2020). The New York State
DEC prepared a sampling report near one incineration facility in response to concerns about emissions from the
facility (NY DEC 2021).USEPA researchers are currently studying PFAS incineration, sampling and analytical methods development, and industrial field sampling. Thermal stability of PFAS compounds, the ability to fully
capture and identify PFAS compounds and their thermal decomposition byproducts, and the efficacy of emission
control technologies are areas of targeted research (USEPA 2020).
In some cases, disposal via burial of a stabilized concentrate or deep well injection at a licensed hazardous
waste management facility has been used. Manufacturers’ product literature and local regulatory agencies should be consulted for information regarding the specific foam concentrate to be disposed. Stakeholder
concerns regarding AFFF waste disposal practices are presented in Section 13.1.11.
AFFF concentrate bound for disposal should be properly documented as a best practice and in compliance
with state and federal transportation regulations (as discussed in Section 3.3.2) and shipped to the selected disposal facility under a proper manifest or bill of lading. After the concentrate product has been disposed of, a
certificate of disposal may be generated by the disposal facility, transmitted to the product owner, and retained
by the disposal facility. This certificate of disposal may be transmitted to the state regulatory agency for review and maintained on file by the product owner.
As stated in the interim PFAS destruction and disposal guidance (USEPA 2020), one option for addressing disposal concerns related to environmental releases of foam, byproducts, or other possible releases is to store AFFF in
warehouse storage to provide time for completion of studies for destruction, disposal, or stabilization of the
AFFF.
73

3.7.2 Fire – and Flush Water Containing AFFF
Fire water produced during training or emergency response, as well as flush water produced during the rinsing of
firefighting systems and equipment, is managed and disposed of as a generated waste because these waters contain dilute concentrations of PFAS. Practitioners may consult with local regulatory agency personnel ideally
prior to the generation of fire- and flush water so that there is a good understanding of local laws and
regulations governing disposal. Standard practices for foam containment and cleanup should be developed prior to use such that response teams have the needed equipment and training before an event occurs; Table 3-
1 provides additional information for BMPs. Some fire water disposal options are focused on reducing the volume
of wastewater through concentration and disposal of the generated concentrate via incineration, landfilling,
stabilization, or other mechanisms. See Section 3.7.1 for comments related to these disposal methods. Widely used treatment methods, as presented in Section 12 are as follows:
• granular activated carbon treatment
• discharge to and treatment at a wastewater treatment plant
• pumping AFFF-impacted fire water into watertight, secure containment basins and allowing the water
phase to evaporate, leaving behind a solid or semi-solid material containing the AFFF concentrate. The remaining material is then disposed of at a certified waste management facility (USDOD 1997). This
method is an option only in some localities and where climatic conditions are favorable.
74

3.8 Firefighting Foam System Replacement
The AFFF application design is specific for each foam and use. Changing between foam types or application
objectives could require a complete system review and, potentially, redesign and modification of system
components to meet the new objectives or material and performance requirements. When objectives or requirements are changed, each subject system should be evaluated and modified individually to ensure that
operational objectives are met.
Procurement at U.S. aiports is primarily driven by regulatory performance requirements, notably the DOD Mil-Spec, MIL- PRF-24385, as well as FAA requirements (ACRP 2017). DOD recommends complete replacement
of the required AFFF concentrate supply and rinsing of the storage and discharge system prior to refilling with
a different concentrate product (USDOD 2017). This not only prevents any unforeseen incompatibility issues,
but also grealty reduces possible cross- contamination and the uncertainty of AFFF formulations (PFAS
profile/content).
Applicable replacement products standards include NFPA Standards 11 (NFPA 2016) and 16 (NFPA 2019) for foam water sprinkler and foam water spray systems and NFPA Standards 1901 (NFPA 2016) and 412 (NFPA 2020) for
equipment.
3.8.1 Replacement Products
Replacing foams and foam systems generally follows four steps:
1. Assess and understand the specific hazards and application objectives.
2. Ensure that foam product to be adopted is listed and approved for use on the specific assets that are being protected and the hazards that that are being mitigated.
3. Ensure that the foam product storage system and the foam/water application system meet product storage (for example, materials compatibility and storage temperature), proportioning, and
application requirements.
4. Ensure that the selected foam product(s) meet applicable requirements (such as Mil-Spec, Underwriters Laboratories (UL), or Factory Mutual compliance). These organizations audit manufacturers to ensure compliance with their standards.
Where two or more foam products meet applicable performance requirements, the foam with the best
environmental performance should be selected. Alternatives currently available as replacement products for
legacy AFFF include products discussed in the following sections.
75

3.8.1.1 Fluorine-Free Foams (F3)
Most foam manufacturers now produce Class B F3s. Performance of these foams should be evaluated carefully as future purchasing decisions are made. As of September 2019, F3s are not yet approved for use on Class B fires at
federal- and FAA- regulated facilities that require Mil-Spec–compliant AFFF. But a mandate within the FAA
Reauthorization Act of 2018 (enacted October 5, 2018) directs the FAA to stop requiring the use of fluorinated foam no later than 3 years from the date of enactment (October 4, 2021), so F3 use is anticipated at FAA-
regulated facilities in the near future.
There continues to be robust discussion regarding the replacement of AFFF products with F3 formulations. For example, the organization IPEN has published a document titled Fluorine-Free Firefighting Foams (3F): Viable
Alternatives to Fluorinated Aqueous Film-Forming Foams (AFFF), which states that F3 products are as effective in
combating Class B fires as AFFF and concludes that because of the lower environmental impact of F3 products, the use of AFFF should be discontinued (IPEN 2018). The Fire Fighting Foam Coalition (FFFC) produced a three-page
document responding to the IPEN paper, which discusses technical details regarding differences in foam
performance for certain types of Class B fires and performance standards (as opposed to composition standards)
that continue to necessitate the use of AFFF or other fluorochemical products for certain hazards. Additional challenges to the replacement of AFFF with F3 foams are also described in the FFFC document (FFFC 2018).
3.8.1.2 Modern Fluorotelomer Foams
If it is determined that the performance of a fluorinated Class B foam is required for a specific hazard (for
example, the federal regulation requiring AFFF use for military applications, at FAA-regulated airports, and/or other high hazard Class B fires and potential incidents), users should purchase modern fluorotelomer foams. Most
foam manufacturers have transitioned to the production of only short-chain (C6) fluorosurfactants, so it is likely
that any AFFF bought today meets that requirement. But foams made with only short-chain (C6) PFAS may still contain trace quantities (parts per billion) of PFOA and PFOA precursors as byproducts of the manufacturing
process. This should be confirmed with the supplier.
Although there are currently mandated specifications requiring the use of fluorinated foams at airports and
military installations, users should be aware that compounds in modern fluorotelomer foams are regulated by
several states and are known to have probable effects on human health (Section 7.1). Use of these foams may
be restricted to emergency situations only and not for use in firefighting training activities. Local and state
regulations may require reporting of their release, including emergency use. Section 3.9 discusses the current
state of regulations on AFFF use.
76

3.8.2 System Decontamination and Sampling During Foam Replacement
The replacement of Mil-Spec legacy foam with the modern foams requires review of system components,
particularly the proportioning system, to ensure that appropriate system performance will be maintained. During foam replacement, a thorough clean-out of storage tanks and associated pipework is highly recommended prior
to filling with replacement foam concentrate. There is potential for PFOS and PFOA contamination from legacy
AFFF, as described in Section 3.1, and from PFOA and other PFAS from fluorotelomer foams. For nonmilitary applications, legacy AFFF and replacement modern foams may not be compatible. In these cases, the foam
manufacturers should be consulted when a foam change is required and current best practices for foam
replacement, system decontamination, and verification sampling should be considered.
Currently, there are no regulatory guidelines or requirements pertaining to the clean-out of AFFF firefighting systems when foam concentrates containing legacy foams are replaced with alternative foams; however, local
and state governments and other organizations continue to develop policy and guidance on replacing foams. DOD (and other foam users) requires their contractors to perform a triple rinsing step after the legacy AFFF is
removed from a system. The rinse water is containerized and managed as a waste material as presented in
Section 3.3.2. After the rinse water is removed, the modern fluorotelomer AFFF concentrate is added to the system and the system is function tested and placed back into service. Specific department or facility fire
wastewater management considerations may be outlined in the facility or installation spill response plan, which
should include information and resources available within the facility or on the installation to contain and recover AFFF-containing fire water to protect the environment. Organizations should check with local and state
regulatory agencies regarding local policies and guidance for foam change-out. Sampling of rinsate to ensure
that residual contamination has been removed may be considered before adding replacement foams, and
sampling of replacement foams that have gone through the system may provide the best assurance that PFAS will not continue to be released when the systems are used.
77
3.9 Federal, State, and International Regulations and Guidance 3.9.1 Overview
This section summarizes representative information on the regulation of PFAS-containing firefighting foams (AFFF). Although federal law currently does not prohibit the use of existing stocks of legacy AFFF, any discharge of foam
containing PFAS to public waters can be considered a release of a “pollutant or contaminant” under CERCLA, 42
U.S. Code § 9601, and therefore subject to remediation requirements. In February 2019, the USEPA announced in
its PFAS Action Plan that the agency is beginning to evaluate designating PFOA and PFOS as “hazardous substances” through one of the available statutory mechanisms, including potentially CERCLA Section 102 (USEPA
2019).
As of September 2019, AFFF use is explicitly regulated by some states, such as the State of Washington and the State of New York (Table 3-2); however, other states regulate PFOA, PFOS or their salts, and other PFAS in
AFFF as hazardous substances or hazardous waste. These regulations effectively limit the storage and/or
environmental release of legacy AFFF (both legacy PFOS AFFF and legacy fluorotelomer AFFF), as well as
potentially triggering cleanup actions. Similar bills, banning the use of AFFF for testing and training, have been passed in other states such as Arizona, Colorado, Georgia, Kentucky, and Minnesota.
Examples of hazardous substance and hazardous waste regulations, as well as other federal, state, and
international guidance pertaining to AFFF, are presented below. For more information pertaining to the regulation
of PFAS, see Section 8. This section addresses only regulations related to AFFF.
78

Table 3-2. Representative state AFFF regulatory and legislative activity
State
Regulation or Bill
Initial Effective Date
What is Regulated?
Specific Requirement
Reference
New York
6NYCRR Part
597
March
2017
PFOS, PFOA, and
Class B foams
PFOS and PFOA are hazardous
substances. Storage and registration requirements for class B foams if those
foams contain at least 1% by volume of
PFOS and PFOA (acid and salt) and prohibit the release of 1 pound or more
of each into the environment during use.
If a release exceeds the 1-pound threshold, it is considered a hazardous
waste spill and must be reported. Clean-
up may be required under the state’s
superfund or brownfields program (NYDEC 2017). New York’s Chemical
and Bulk Storage regulations may also
trigger further registration and storage requirements for foams that contain one
of the four PFAS designated as
hazardous substances (NY CRR Parts 596-599).
(NY DEC
2017)
Washington
WAC
296-24-33001
July 2020
Class B foams
Class B firefighting foams cannot be
used or discharged for training purposes, and manufacturers of firefighting personal
protective equipment must provide
written notification to purchasers if the equipment contains PFAS. Beginning
July 1, 2020, manufacturers of class B
firefighting foams may no longer manufacture, sell, or distribute for sale
PFAS-containing class B firefighting
foams except for the following uses: applications where the use of a PFAS-
containing firefighting foam is required by
federal law, including but not limited to the requirements of 14 CFR 139.317
(such as military and FAA-certfied
airports ). Other exceptions include:
Petroleum Terminals (as defined in RCW 82.23A.010), Oil Refineries, Chemical
Plants (WAC
296-24-33001)
(Washington State
Legislature
2018)
79

State
Regulation or Bill
Initial Effective Date
What is Regulated?
Specific Requirement
Reference
Virginia
House
Bill
2762ER
Januar
y 2020
PFAS-containing
AFFF
Virginia Department of Fire Programs
and the Virginia Fire Services Board
begin assisting municipal fire
departments to transition to fluorine-
free foams, where possible. Effective
the same date, the bill bans the
discharge or use of PFAS- containing
AFFF foams for testing or training unless the facility has implemented
containment, treatment, and disposal
measures to prevent release to the environment.
(State
of Virginia,
2019)
3.9.2 Take-Back Programs
Several states have implemented “take-back” programs for AFFF. For example, in May 2018, the Massachusetts Department of Environmental Protection (MA DEP), in partnership with the Massachusetts Department of Fire
Services, implemented a take-back program to assist fire departments in the proper disposal of legacy firefighting
foams that could impact water resources (MA DEP 2018). MA DEP provided funding to assist local fire departments
in identifying these foams in their stockpiles and for MA DEP to dispose of them. Any AFFF manufactured before 2003 is eligible under the take-back program. Vermont also announced a take-back program (VT DEC 2018).
Users should contact their state regulatory agency for information on available take-back programs.
3.9.3 Federal Guidance
As of publication, F3s do not meet the performance requirements of the Mil-spec and therefore are not used at federal- and FAA-regulated facilities. A mandate within the FAA Reauthorization Act of 2018 (enacted October 5,
2018) directs the FAA to stop requiring the use of fluorinated foam no later than 3 years from the date of enactment (October 4, 2021), so F3 use is anticipated at FAA-regulated facilities in the near future (FAA 2018).
The National Defense Authorization Act of fiscal Year 2020 (signed into law Dec 20, 2019) requires the DOD to
phase out its use of AFFF at all military installations by Oct. 1, 2024, with limited exceptions, and immediately stop military training exercises with AFFF. The secretary of the Navy must publish specifications for PFAS-free
firefighting foam at all military installations and ensure that the foam is available for use by Oct. 1, 2023.
3.9.4 International Guidance on AFFF
Internationally, there are many governmental agencies that have developed guidance or operational policy for
AFFF. Some examples are briefly presented in Table 3-3.
80

Table 3-3. Representative international AFFF regulatory and guidance activity
Country
Initial Effective Date
What is Regulated?
Specific Requirement
Reference
Canada
January
2018
PFOS, PFOA,
long-chain PFCAs
Canada prohibits the manufacture, use, sale, or import of a number of PFAS-containing chemicals and products, such
as AFFF, that have these chemicals. Canada allows certain exemptions, including the use of AFFF that contains
residual levels of PFOS at a maximum concentration of 10
ppm; the use and import of AFFF contaminated with PFOS
in military equipment returning from a foreign military
operation; and the import, use, sale, and offer for sale of
AFFF that contains PFOA and/or LC-PFCAs used in
firefighting.
(ECCC 2017)
Germany
May 2013
AFFF
The German Federal Environment Agency released a
Guide for the Environmentally Responsible Use of Fluorinated Fire- fighting Foams. The guidance discusses
what AFFFs are, when it is necessary for use, why it
endangers humans and the environment, and the consequences of use.
(German Federal
Environment
Agency 2013)
Australia
July 2016
Firefighting
foam
The Queensland Department of Environment and Heritage
Protection issued an Operational Policy on the Environmental Management of Firefighting Foam. The
objective of the policy was to define the requirements and
expectations for the handling, transport, storage, use, release, waste treatment, disposal, and environmental
protection measures of AFFF.
(Australia
Government DOD 2007)
81

3.10 Foam Research and Development
Current modern AFFF fluorosurfactant alternatives are largely short-chain C6 telomer-based fluorosurfactants.
The fluorosurfactants do persist in the environment, and they have the potential to create breakdown products
that are also persistent. Although numerous fluorine-free alternatives are already on the market, there is still a need to develop novel firefighting foams that provide the desired firefighting performance while not being
harmful to human health and the environment. Research is currently being conducted to further evaluate
modern fluorotelomer and fluorine-free alternatives. Research is discussed below.
3.10.1 Research on Current AFFF
Research is being conducted to provide a better understanding of AFFF in the environment and to develop
novel technologies to clean up or remove AFFF at contaminated sites. Due to the ability of these legacy AFFF to
spread quickly and prevent re-ignition of fuel fires, combined with the fact the USEPA did not require manufacturers to remove their long-chain inventory as part of the 2010/2015 PFOA Stewardship Program, some
legacy stockpiles are still being used today (Barclift 2013).
Since 2017, the Strategic Environmental Research and Development Program (SERDP) has been funding research intended to identify and test F3s that meet the performance requirements defined in MIL-PRF-24385.
New formulations must be compatible with existing AFFF and supporting equipment. Projects include evaluation of persistence and aquatic toxicity of the alternative materials and will provide human health and environmental
impact assessments on the ingredients, formulations, and byproducts being studied. Table 3-4 summarizes the
AFFF alternatives studies supported by SERDP- Environmental Security Technology Certification Program (ESTCP).
Table 3-4 Summary of the AFFF alternatives studies supported by SERDP-ESTCP
Lead Investigator Objectives Expected Completion
Project Link
Dr. Joseph Tsang, Naval Air
Warfare Center Weapons Division
Proof-of-concept for the development of the
next generation of fluorine-free firefighting foam formulations as a replacement for
existing aqueous film-forming foam (AFFF).
The novel foam systems produced in this research are derived from polysaccharide
copolymers and nanoparticles that are
sustainable, nontoxic, and water-soluble (or water-dispersible), and will be applied using
existing military firefighting equipment.
Aug-18 https://serdp-
estcp.org/Program-Areas/Weapons-Systems-
and-Platforms/Waste-
Reduction-and-Treatment-in-DoD-Operations/WP-
2737/WP-2737
82

Dr. John Payne, National
Foam
Improve the understanding of physical and
chemical processes that underline firefighting foams, and how the components of a foam
formulation can deliver the properties required for
good fire-extinguishing performance while minimizing environmental burdens. Statistical
method will be employed to develop a fluorine-free
surfactant formulation that meets the performance
requirements defined in the MIL-F-24385. A lifecycle assessment will compare the
environmental impact of foam type and identify
routes to improving environmental performance.
Sept-19 https://serdp-
estcp.org/Program-Areas/Weapons-Systems-
and-Platforms/Waste-
Reduction-and-Treatment-in-DoD-Operations/WP-
2738/WP-2738
Dr. Ramagopal Ananth, U.S.
Naval Research Laboratory
Develop a fluorine-free firefighting surfactant
formulation that meets the performance
requirements of MIL-F-24385F and is an environmentally friendly drop-in replacement for
the current environmentally hazardous AFFF.
Dec-20 https://serdp-
estcp.org/Program-
Areas/Weapons-Systems-and-Platforms/Waste-
Reduction-and-Treatment-
in-DoD-Operations/WP-2739/WP-2739
The results and full reports of these and future projects will be available at the SERDP-ESTCP website (https://serdp-estcp.org/).Examples of other ongoing research includes:
Petroleum Environmental Research Forum (PERF), 2016. Firefighting Foam Human Health and Environmental Risks at O&G (Oil and Gas) Operations. This project aims to capture the state of
knowledge of the fate, transport, and effects of C8 PFAS AFFF alternatives and identify limitations of
and data gaps in the current studies or data sets to inform risk assessment and risk-based decision-making.
European Chemicals Agency, 2020. Assessment of Alternatives to PFAS-Containing Fire-Fighting
Foams and the Socio-Economic Impacts of Substitution. European Commission, 2020. The Use of PFAS and Fluorine-Free Alternatives in Fire-Fighting Foams.
The Fiscal Year 2020 National Defense Authorization Act (NDAA), passed in December 2019, included
$49M in research funding for AFFF and F3 activities.
Updated May 2021.
83

4 Physical and Chemical Properties
The PFAS Team developed a training module video with content related to this section, it is the Naming
Conventions and Physical and Chemical Properties video.
This section provides information about available physical and chemical properties of PFAS. Understanding of the
physical and chemical properties of PFAS is important for the prediction of their fate and transport in the
environment. The available information about physical and chemical properties varies between the different PFAS. Tabulated values are included in the Physical and Chemical Properties Table (Table 4-1 provided as a
separate Excel file) that is provided as a separate Excel file.
Section Number Topic
4.1 Challenges and Limitations Related to PFAS Physical and Chemical Properties
4.2 Physical Properties
4.3 Chemical Properties
4.1 Challenges and Limitations Related to PFAS Physical and Chemical Properties
Understanding the physical and chemical properties of PFAS is important for the prediction of their fate and
transport in the environment. More specifically, reliable values are very important when attempting to explain the
environmental behavior of PFAS through mathematical fate and transport modeling, where small variations in values can have large implications on predictions (see Section 10.4 on data analysis and interpretation, which
includes a discussion of fate and transport modeling). There is large variation in the depth of published data (a lot
is known about some PFAS, but almost nothing about others) on chemical and physical properties of PFAS. Reliable physical and chemical properties of PFAS are scarce (for example, vapor pressure and Henry’s Law
constants), and some of the available values are estimated using predictive mathematical techniques, which
predict properties of compounds from knowledge of their chemical structure. These are collectively referred to as quantitative structure-activity relationship (QSAR) models. Predicted, as opposed to directly measured,
values are accompanied by additional uncertainty that may be significant in certain fate and transport modeling
scenarios. In addition, many of the available properties are based on the acid form of the PFAA, which is not present in the environment except at low pH. These uncertainties limit confidence in the precision of current fate
and transport models.
The Physical and Chemical Properties Table (Table 4-1 provided as a separate Excel file) summarizes some of the
physical and chemical properties that are available for PFAS.
84

4.2 Physical Properties
This section briefly describes some standard physical properties of PFAS. Additional references for more
information are provided. In addition, the Physical and Chemical Properties Table (Table 4-1 provided as a separate Excel file) summarizes some of the physical and chemical properties that have been published for PFAS
and are discussed in this section.
4.2.1 Physical State/Appearance
Most PFAS are solids, often crystalline or powdery in form, at room temperature; however, shorter chained
compounds (the acid forms of PFCA and PFSA, FTSA and FTOH with a 4- to 6-carbon tail) tend to take liquid form at room temperature (melting point is addressed in Section 4.2.3).
4.2.2 Density
Density (ρ) is the mass per unit volume of a substance. For an individual PFAS compound (or mixture of PFAS)
that exists as a liquid at ambient temperatures, density can influence its behavior in the environment. If the
density of the liquid PFAS is greater than that of water, the liquid PFAS has the potential to migrate downward
through the water column in groundwater or surface water as a dense nonaqueous phase liquid (DNAPL); see ITRC (2003) for discussion on density and solubility impacts on DNAPL behavior.. For example, 4:2 FTOH, which
is a liquid at 20oC and has a density and aqueous solubility of 1.59 g/cm3 and 974 mg/L (Table 4-1), respectively,
would be predicted to behave similarly to carbon tetrachloride (with a density of 1.59 g/cm3 and a solubility of 800 mg/L) if released into the environment as a pure product (also referred to as a neat liquid). However, if 4:2
FTOH dissolved in water, the change in density of the solution relative to water is unlikely to result in a
separate layer. See Sections 5.2.2 and 5.2.4.1 for additional information on the behavior of PFAS in aqueous solutions.
4.2.3 Melting/Boiling Points
Melting and boiling point information refers to the temperature of phase transitions of pure compounds. These
properties determine whether a specific pure PFAS compound will exist as a liquid, solid, or gas under typical environmental temperatures. These data are sparse and can vary among references. Predicted melting and boiling
point values are available for most PFAS, but empirically derived values are not available for entire groups of
chemicals like FTSAs and FASAAs. Predicted values are generally useful in understanding the various physical states of PFAS; however, the accuracy of these results is still unknown and warrants further investigation. Like all
organic carbon compounds, available data indicate that melting and boiling points of PFAS will tend to increase as
the fluorinated chain increases in length. For example, the melting point of PFBA is -17.5°C while the melting point of perfluorotetradecanoic acid (PFTeDA) is 130–135°C. See Table 4-1 for a list of melting and boiling points.
4.2.4 Solubility
Solubility (S) refers to the ability of a given substance, the solute, to dissolve in a solvent. It is measured in terms
of the maximum amount of solute dissolved in a solvent at a specified temperature and pressure. Typical units
are milligrams per liter (mg/L) or moles per liter (mol/L). Currently, experimentally measured data for the solubility of PFAS in water are available for just a few of the more studied compounds such as the PFCAs, PFOS, FTSAs, and
fluorotelomer alcohols. This limited availability of experimental data should be considered when relying on PFAS
solubility data. Most cited values are based on predicted or modeled values and the input values to these calculations may themselves be estimates. Further, because PFCAs and PFSAs can form micelles and
hemimicelles, as discussed in Section 4.2.7, the reported water solubilities may include microdispersions of
micelles in addition to truly solubilized molecules.
85

h
Values of solubility for the acid forms of PFAAs and other PFAS are summarized in Table 4-1. Reported values for
solubility of individual PFAS analytes may vary depending upon the method used to determine solubility, the form of the analyte (that is, acid or salt), pH, salinity, and whether the value is empirical or obtained through modeling.
For example, laboratory studies of water solubilities for PFOS indicate that solubility decreases when the water
salt content increases (3M Company 2000). Other factors may affect the reported value of solubility as well.
4.2.5 Vapor Pressures (Vp)
Vapor pressure is an indication of the tendency of a substance to partition into the gas phase. Vapor pressure is a measure of volatility in that the higher the vapor pressure of a compound, the more volatile it is.
Compounds with higher vapor pressures, because they are in the gaseous phase or sorbed to water vapor in
the atmosphere, have a higher potential for long-range transport. Compounds with lower vapor pressures,
which are more likely to remain in solid or liquid form, are transported only via soil or surface/groundwater (Barton, Botelho, and Kaiser 2008), unless they are dissolved into airborne water droplets or sorbedon airborne
particulates, as discussed in Sections 5.3.2 and 6.1.
Values for vapor pressure of PFAS are summarized in Table 4-1. Very little data on measured vapor pressure values for PFAS exist, and much of the data on PFAS is extrapolated or modeled. Caution must be taken when
using the vapor pressures for PFAAs listed in the Physical and Chemical Properties Table with respect to the acid
or anion form of the compound, which may have very different vapor pressures. Efforts were made to report the
values for the acidic form in Table 4-1, but references are not always clear. These values also should not be used for their corresponding salt form for the same reason (for example, the vapor pressure of ammonium
perfluorooctanoate has been measured experimentally to be three orders of
magnitude lower than the vapor pressure of perfluorooctanoic acid at 25oC (Barton, Botelho, and Kaiser 2009).
4.2.6 Henry’s Law Constant (Kh)
The Henry’s law constant (Kh ), as well as the air-water partition coefficient (Kaw), indicate the relative concentrations of a compound between an aqueous solution and gas phase at equilibrium (air-water distribution
ratio) and provide an indication of the propensity of a chemical to remain dissolved in water versus volatilizing into
the gas phase. A chemical with lower solubility and higher volatility will have a higher Henry’s law constant than a chemical with higher solubility and lower volatility.
For most organic compounds of moderate to low solubility, Kh can be approximated by:
Kh = (Vp)(M)/S
where Kh is the Henry’s law constant, Vp is vapor pressure, M is molecular weight, and S is solubility. This constant
can be expressed in a variety of units or as the inverse (water-air distribution ratio); thus, the units of expression should always be confirmed prior to use of this constant. K also displays nonlinear temperature-dependence and
is typically reported at 25oC,
which is higher than most ambient environmental conditions.
Experimental and modeled Henry’s law constants are available for fluorotelomer alcohols (for example, Wu
and Chang (2011) and Xie, Zhao, et al. (2013)), PFSAs, PFCAs, FTCAs, FTSAs, FASEs, and FASAAs (for example,
Kwan (2001) and Zhang et al. (2010)). For PFAS that can dissociate into anions or cations, as discussed in Section 4.3.2, the Henry’s law constant is pH-dependent and reported constants may not be applicable
depending on the pH conditions within the solution (for example, Rayne and Forest (2009) and Johansson et
al. (2017)). In a study of airborne PFOA release in industrial settings, monitoring above sumps found
concentrations 40 times greater when the pH was 1.8 than at neutral pH, and PFOA release from aqueous solution was found to be several times greater at pH 4 than at pH 7 (Kaiser et al. 2010). Henry’s law constant
values are not presented in Table 4-1.
86

4.2.7 Critical Micelle Concentration
Given the difference in behavior between the “head” and “tail” of a PFAA molecule, these compounds, when in
water, tend to aggregate into micelles (form a sphere with the hydrophobic portion of the molecules on the
inside) when present above a certain concentration. Other aggregates, such as hemimicelles or mixed micelles (micelles composed of a mixture of surfactant-type molecules), can form either independently in solution or at
boundaries occurring between phases (Krafft and Riess 2015). Theoretical threshold concentrations for
aggregation, generally referred to as critical micelle concentrations (CMCs), are presented in Table 4-1. It is
important to note that several studies suggest aggregations may occur at much lower concentrations in groundwater, either due to interactions with particles and/or co-contaminants, or because of spatially variable
concentrations within soil matrices (Brusseau 2018). The formation of these molecular-level assemblies can
impact transport properties and the partitioning at air-water interfaces, as discussed in Section 5.2.
4.2.8 Octanol/Water Partition Coefficient (Kow)
The Kow is defined as “the ratio of a chemical’s concentration in the octanol phase to its concentration in the aqueous phase of a two-phase” (USEPA 2015). The Kow is a useful descriptor of the tendency of a compound to
associate with hydrophobic or hydrophilic substances. Direct measurement of the Kow of alkyl acids has proven
difficult because alkyl acids tend to aggregate at the interface between octanol and water (Kim et al. 2015),
although some researchers have employed nontraditional methods with some success (Jing, Rodgers, and Amemiya 2009). Alternatively, Kow can be estimated using
quantitative tools that predict physical and chemical properties. The Kow values that are typically tabulated for the PFCAs and PFSAs are for the acid form and are therefore not relevant because PFCAs and PFSAs are anionic
within the typical range of environmental pH.
It should be noted that although Kow values for some organic contaminants can be used for estimating Koc and/or uptake in biological systems, they cannot be used for estimating such values for PFAS because they do
not behave like a traditional hydrophobic chemicals (see Section 5.5 for further discussion about PFAS uptake
into aquatic organisms). For these reasons, Kow values are not presented in Table 4-1.
4.2.9 Organic Carbon/Water Partition Coefficient (Koc)
The soil organic carbon/water partition coefficient (Koc) is a metric commonly used to quantify the potential of a
given dissolved compound to associate with, or sorb to, organic matter occurring in soil. Shorter chained PFAS are
more soluble in water, while the longer chain PFAS adsorb and partition more in to sediments (Dalahmeh et al. 2018). Relative to common PFAS like PFOA and PFOS, studies have suggested Koc can be appropriately defined as
a distribution coefficient (Kd) normalized to organic carbon content, thus implying Koc specifically represents the
singular process of hydrophobic interaction (Milinovic et al. 2015). Broader reviews highlight the complexity and
variability of processes that may contribute to the sorption of PFAS and significant differences between laboratory-
and field-scale results (Li, Oliver, and Kookana 2018). These reviews suggest simple relationships may be unreliable for predicting organic carbon partitioning for PFAS (see Section 5.2 for more discussion on partitioning). As such,
the current state-of-science supports Koc being reported in relatively broad ranges on a compound-specific basis.
The Koc values included in Table 4-1, while not an exhaustive list, are an indicator of the number of values currently available for PFAS. Discussion of the use of Koc, including site-specific Koc, in the prediction of PFAS transport in
remedial scenarios is included in Section 10.4.1.
87

4.3 Chemical Properties
This section briefly describes some standard chemical properties of PFAS. Additional references are provided for
more information. In addition, the Physical and Chemical Properties Table (Table 4-1 provided as a separate Excel file) summarizes some of the physical and chemical properties that are available for PFAS.
4.3.1 Carbon-Fluorine (C-F) Bond Properties
The properties of PFAS are principally due to the unique properties of the carbon-fluorine bond. Some key
chemical properties of this bond and the characteristics they impart to PFAS are provided in Table 4-2.
Table 4-2. Fluorine characteristics
Fluorine Characteristic Description Effect Resulting Property of PFAS
High electronegativity
Tendency to attract
shared electrons in a bond
Strong C-F bond
Thermal stability
Chemical stability
(low reactivity)
Polar bond with partial negative charge
toward F
Strong acidity (low pKa)1
Low polarizability
Electron cloud density not easily impacted by the
electric fields of other molecules
Weak intermolecular interactions
Hydrophobic and
lipophobic surfactant properties2
Low surface energy
Small size3 Atomic radius of
covalently bonded fluorine
is 0.72 Å
Shields carbon Chemical stability
(low reactivity)
1When paired with an acid functional group such as a carboxylic or sulfonic
acid 2When paired with a functional group that is hydrophilic (for example, a
carboxylate) 3Smallest of the halogen atoms
Å = angstrom
Properties such as the high electronegativity and small size of fluorine lead to a strong C-F bond, the strongest covalent bond in organic chemistry (Kissa 2001). The low polarizability of fluorine further leads to weak
intermolecular interactions, such as Van der Waals interactions and hydrogen bonding (Kissa 2001). These unique
properties of fluorine give many PFAS their mutually hydro- and lipophobic (stain-resistant) and surfactant properties and make them thermally and chemically stable. But not all of these characteristics (for example,
surface activity) are universal to all PFAS. It is also to be noted that some of the properties, such as
disassociation constants or rate constants, which quantify the stability, are not well established for PFAS at this time.
4.3.2 Functional Group Properties
PFAS functional groups include carboxylates, sulfonates, sulfates, phosphates, amines, and others, as introduced
in Section 2.2.2. These functional groups, including dissociated and undissociated forms, govern many fate and transport
properties of PFAS. The ionic state of a compound determines its electrical charge and its physical and chemical
properties, which in turn control its fate and transport in the environment. For example, the state (anionic or undissociated acid) of a given PFAS may alter aspects such as volatility and bioaccumulative potential.
88

a
As further described below, due to their low acid dissociation constants (Ka), PFAAs are found in the environment in
the anionic (negatively charged) state, except in very rare situations (for example, pH <3).
Functional groups of some PFAS (ionic PFAS) can dissociate into anions or cations in aqueous solution under
appropriate pH conditions. For example, as discussed in Section 2.2.2, PFOA dissociates into the
perfluorooctanoate anion and the hydrogen ion when dissolved in water over a wide range of pH conditions. The ion associated with the fluoroalkyl portion of ionic PFAS, other than PFAAs, can be a negatively charged anion, a
positively charged cation, or a zwitterion. Therefore, PFAS can be classified into four groups based on functional
groups (examples of the structures of many ionic PFAS can be found in Barzen-Hanson et al. (2017):
• anionic–contains one or more acidic functional groups such as carboxylic acids, sulfonic acids, sulfates, and phosphates, and can release a hydrogen ion, thereby forming an anion (see Figure 2-7 for PFBA dissociation)
• cationic–contains one or more basic functional groups such as amines, which can gain a hydrogen ion and form a cation, or have a permanent charge as in the case of a quaternary ammonium group
• zwitterionic–contains two or more functional groups, at least one of which can form an anion and one of which can form a cation
• nonionic–does not dissociate into ions; for example, alcohols.
Based on the behavior of other cationic and anionic surfactants, cationic PFAS are expected to have different
environmental transport characteristics than anionic PFAS (Place and Field 2012). For example, sorption of
organic anions such as PFAA anions is typically suppressed at higher pH due to electrostatic repulsion with the increasingly negative charge from deprotonated oxides and other functional groups present on the soil surface
(Lee and Mabury 2017). Cations can be expected to sorb strongly to soils, which often possess a net negative
charge over a range of environmentally relevant pHs. For example, cationic fluorotelomer-based PFAS in an AFFF product have been found to sorb strongly to soils and sediments (Barzen-Hanson et al. 2017). Zwitterionic
PFAS can be expected to sorb to soils and sediment more strongly than anionic PFAS, but less strongly than
cationic PFAS, owing to the mixed charges on the functional groups. The transport characteristics of specific PFAS are also highly dependent on matrix interactions, and detailed site-specific information is necessary to
accurately predict PFAS transport (Guelfo and Higgins 2013). See Section 5.2.3 for further discussion of
partitioning onto solid matrices.
For PFAAs, the acid dissociation constant Ka is the equilibrium constant for the dissociation of the acid in aqueous
solution into the anion and hydrogen ion, and at dilute to moderate concentrations, is defined by the equation:
K = [anion–]*[H+]/[acid]
where [acid] is the concentration of the undissociated acid form, [anion–] is the concentration of the anion, and
[H+] is the concentration of the hydrogen ion at equilibrium.
The dissociation constant is also commonly expressed as its negative logarithm, pKa, where:
pKa = – log10(Ka)
Higher pKa values indicate that an acid will dissociate less in water at a given pH than will an acid with a lower
pKa. When the pH of a solution equals the pKa, then one of half of the PFAS molecules will exist as the undissociated acid and one half will exist as the dissociated anion. PFAS with pKa values of 4 or less will exist in
aqueous solutions at neutral pH (7) almost entirely as the dissociated acid (see Figure 4-1 for a representation
of reported pKa values for PFOA in relation to environmental pHs from Table 4-1). Because the undissociated
acid and anionic forms of PFAAs have very different physical and chemical properties, it is essential to distinguish
between the undissociated acid form and the anionic form to select the appropriate physical and chemical
parameters for fate and transport evaluations.
89

Figure 4-1. Titration curve for PFOA—relation of pKa to environmental pH.
Source: E. DiFilippo, S.S. Papadopulos & Associates, Inc. Used with permission.
Table 4-1 presents pKa values for PFAS. Limited model-predicted and experimental values are available for most
PFAAs.
4.3.3 Thermal Stability
Thermal stability, the degree to which a chemical remains intact under thermal stress, is an important property to predict how long a chemical will persist in the environment. PFAAs, such as PFOA and PFOS, are extremely
stable, thermally and chemically, and resist degradation and oxidation. Thermal stability of PFAAs is primarily
attributable to the strength of the C- F bond in the fluoroalkyl tail (Kissa 2001). The stability is determined by the specific functional group that is attached to the fluoroalkyl tail. PFCAs and PFSAs are the most stable fluorinated
surfactants. PFAAs decompose at temperatures greater than 400°C, but complete mineralization occurs at
temperatures greater than 1,000°C (Lassen et al. 2013). Reports on temperature needed to destroy PFAS vary, but it seems that to destroy PFAS in soil temperatures upwards of 1,000oC may be required (Colgan 2018). It was
previously reported that limited PFOS, PFOA, and PFHxA mineralization (less than or equal
to 72%) may occur at temperatures of 700oC (Watanabe et al. 2018). In this same study, mineralization reportedly increased to 90% in the presence of granular activated carbon and sodium hydroxide. The thermal
stability is lower for the salts of PFAA compounds and depends on which cation is the counterion. For example,
the 20% decomposition temperature of sodium perfluorooctanoate is 298°C, but it is 341°C for lithium perfluorooctanoate (Kissa 2001). Additionally, salts of PFSAs are more thermally stable than the corresponding
salts of PFCAs (Kissa 2001).
90

4.3.4 Chemical Stability
Like thermal stability, knowledge of the chemical stability of a molecule helps predict its persistence in the
environment. PFCAs and PFSA have been shown to be persistent in the environment. PFCAs are resistant to oxidation under environmental conditions; however, transformation has been demonstrated in the presence of
oxidants under extreme pressure. In contrast, transformation of precursors can be associated with substantial
changes in the physicochemical properties of those compounds (CONCAWE 2016).
In the perfluorinated tail of the alkyl acids, the strength of the C-F bond, shielding of carbon by fluorine, and
inductive effects (caused by fluorine electronegativity) also lead to chemical stability. For example, electron-rich
chemical species called nucleophiles normally would be attracted to the partial positive charge of carbon. If these nucleophiles could get close enough to the carbon to bond, the subsequent reaction could replace a fluorine with
the nucleophile and potentially make the molecule vulnerable to degradation. But the relatively large size of the
fluorine atoms surrounding the carbon (when compared to hydrogen) prevents this from happening
(Schwarzenbach, Gschwend, and Imboden 2003). This is why processes such as hydrolysis, which involve
eliminating one or more fluorines, are ineffective at degrading the perfluorinated tails of PFAAs. Similarly, many
PFAAs are resistant to degradation by oxidative processes that rely on a loss of electrons (Kissa 2001). PFAAs are
also resistant to reductive processes, which involve gaining electrons. Despite having a high affinity for electrons,
fluorine does not have vacant orbitals favorable for accepting additional electrons (Park et al. 2009). In contrast to the stability of perfluorinated tails, polar regions of PFAS (the functional groups), as well as polyfluorinated groups,
can be vulnerable to a range of chemical transformations. See Section 5.4 for further discussion of abiotic and
biotic transformations.
Updated April 14, 2020.
91
5 Environmental Fate and Transport Processes
The PFAS Team developed a training module video with content related to this section, it is the Fate and Transport
video.
This section provides current information about PFAS fate and transport in the environment. Understanding
relevant fate and transport processes for PFAS is critical in evaluating the potential risk from a release, where to
look for PFAS following a release, and what treatment alternatives may be effective. The available information
about fate and transport processes varies between the different PFAS. PFAS fate and transport is a rapidly
evolving field of science.
Section Number Topic
5.1 Fate and Transport Introduction
5.2 Phase Partitioning
5.3 Media-Specific Migration Processes
5.4 Transformations
5.5 PFAS Uptake into Aquatic Organisms
5.6 PFAS Uptake into Plants
5.1 Fate and Transport Introduction
5.1.1 Overview of PFAS Fate and Transport
PFAS fate and transport describes the behavior of these compounds following their release to the environment.
This includes the physical, chemical, and biological processes that influence distribution of PFAS in various media, as well as the extent of migration within and between media (for example, plume development, groundwater
discharge to surface water). Given the wide variety of PFAS, it is not surprising that they collectively exhibit a
wide range of different physical and chemical characteristics that can affect their behavior in the environment. This adds to the complexity of fate and transport assessments and highlights the risk in making broad
assumptions based on the behavior of a few well-studied PFAS.
Understanding relevant fate and transport processes for PFAS is critical in answering several key questions:
What is the potential risk from a PFAS release? An understanding of fate and transport processes
provides the basis for defensible predictions about occurrence, migration, persistence, and potential for exposure.
Where do I need to look for PFAS following a release? Knowledge of PFAS fate and transport
characteristics strongly informs site characterization by providing insight on where efforts should be
focused and developing an appropriate CSM.
How can I treat PFAS? Establishing how these compounds behave in the environment is important in developing and/or selecting PFAS treatment strategies because this helps establish the potential
effectiveness of a particular treatment.
92

5.1.2 Factors Affecting PFAS Fate and Transport
Factors that influence PFAS fate and transport can be broadly divided into two categories:
• PFAS characteristics: Critical factors include the chain length, the ionic state of the compound (for example, the charge(s) carried by the molecule at a typical environmental pH), the type of functional
group(s), and the extent of fluorination (for example, perfluorinated versus polyfluorinated compounds). These properties strongly influence the type and extent of PFAS partitioning and
transformation that can be expected to occur. A description of these physical-chemical properties is
provided in Section 4.
• Site characteristics: Site characteristics generally define the nature of the source but also have an
effect on PFAS-media interactions. Potentially relevant characteristics include soil type (including
properties such as permeability, surface charge, organic carbon content, exchange capacity,
minerology, water content), depth to groundwater, oxidation-reduction conditions, precipitation/infiltration rates, surface water and groundwater flow rates, prevailing atmospheric
conditions, and the presence of co-contaminants.
The characteristics of sites with releases of PFAS often share many similarities with sites having releases of other
contaminants, although there are some source scenarios that are relatively unique to PFAS (see Section 2.6 for
description of source scenarios). Although many PFAS chemicals may share similar characteristics, such as resistance to transformation, those same PFAS may have widely varying physical-chemical properties, such as
those associated with partitioning. As a result, PFAS fate and transport in the environment can be quite different
from other contaminants.
5.1.3 Section Organization
This section includes a detailed description of several processes that are particularly relevant for PFAS fate and
transport and are illustrated in Figure 5-1.
• Partitioning: Both hydrophobic partitioning to organic carbon and electrostatic interactions between charged surfaces and PFAS are discussed, along with the tendency of PFAS to aggregate at air-water interfaces.
These processes can greatly affect migration in the environment by promoting retention within sediments
and unsaturated soils, as well as retardation within groundwater. Varying degrees of retention on solids can
contribute to differential transport where certain PFAS (for example, short-chain, anionic) are more rapidly
transported than others.
• Media-specific processes: The potential impact of processes such as diffusion into low-permeability matrices,
atmospheric transport, and leaching from soil to groundwater are described. Unlike the broader processes of
partitioning and transformation, most of these processes are unique to specific media or a specific cross-
media transport pathway.
• Transformation: Although a number of individual PFAS, such as perfluoroalkyl acids and perfluoroalkyl ether carboxylic acids, are highly persistent due to the strength of the C-F bond, a number of polyfluorinated
substances can be partially degraded via several different biological and abiotic mechanisms.
Transformation of these precursors to PFAAs has been shown to occur in a variety of environmental media and can result in unexpected temporal and spatial trends in PFAS occurrence. The susceptibility of
individual PFAS to transformation processes can also influence how each will bioconcentrate and
bioaccumulate within various biotic species.
• Uptake into biota and plants: Once released into the environment, PFAS will migrate to both terrestrial and
aquatic systems. Uptake into plants can occur within affected areas and may transfer PFAS to wildlife and
humans that consume those plants. Some compounds have a propensity to bioaccumulate and then
biomagnify up the food chain, with relatively low levels in invertebrates and fish and higher levels observed in
animals at the top of the food chain (for example, seals, seabirds, polar bears).
93

Figure 5-1. Fate and transport processes relevant for PFAS.
Source: D. Adamson, GSI. Used with permission.
As noted previously, the physical-chemical properties of PFAS, and the influence of these properties on PFAS fate and transport within environmental media, are critical in determining how these compounds behave after they
are released. To date, our understanding of PFAS fate and transport has relied largely on assumptions based on
these physical-chemical characteristics, even though the specific parameter values have proven challenging to estimate; however, there is an increasing amount of lab- and field-derived data that has improved the empirical
basis for understanding PFAS fate and transport. This section focuses on findings from peer-reviewed studies
that directly evaluated PFAS fate and transport and provided key insight on the processes described above. The
material in this section is also intended to provide a technical basis for subsequent sections on site characterization (Section 10) and treatment of PFAS (Section 12).
94

5.2 Phase Partitioning
5.2.1 Introduction
PFAS most commonly detected in the environment typically have a carbon-fluorine tail and a nonfluorinated head
consisting of a polar functional group (see Section 2.2 for more information about naming conventions and
terminology). The tail is hydrophobic and generally lipophobic (attracted neither to water nor to nonpolar organic matter), while the head groups can be polar and hydrophilic (attracted to water) (Buck et al. 2011). The
competing tendencies of the head and the tail can lead to a widespread yet uneven distribution in the
environment. Given the heterogeneity of subsurface environments, soils with different surface charges, organic
carbon, interfaces between air and water, and interfaces with water and hydrocarbon co- contaminants, multiple partitioning mechanisms should be considered when characterizing PFAS fate and transport. PFAS may also
exhibit different behavior depending on concentration, such as the tendency to form micelles at high
concentrations (Section 5.2.2.2). Although the structure of PFAS makes them generally oil- and water-resistant
in many products (for example, dry surface coatings), in the aqueous phase, PFAS may not exhibit lipophobic tendencies, as shown by the ability of a variety of PFAS to partition to phospholipid bilayers (bacterial membranes)
(Jing, Rodgers, and Amemiya 2009; Fitzgerald et al. 2018).
Important PFAS partitioning mechanisms include hydrophobic effects, electrostatic interactions, and interfacial
behaviors. The hydrophobic effects drive the association with organic carbon in soils, a process PFAS have in
common with other organic contaminants (for example, chlorinated solvents). Electrostatic interactions are a function of the charge of the polar functional group at the head of the molecule. For instance, natural soils and
aquifer materials often have a net negative surface charge that can repel the negatively charged heads of
PFAAs, which are usually present as anions in environmental media. Due to the competing properties of the head and the tail, partitioning to interfaces of environmental media can occur, such as soil/water, water/air, and
water/nonaqueous phase liquid (NAPL) co-contaminants (Guelfo and Higgins 2013; McKenzie et al. 2016;
Brusseau 2018).
5.2.2 Considerations for PFAS Partitioning
5.2.2.1 Pure Phase PFAS
Due to high aqueous solubility, PFAS occurrence as a separate phase in the environment (for example, solid
PFAS, LNAPL PFAS, or DNAPL PFAS) is uncommon. Although PFAS may exist as solid salts, typical product
applications involve miscible solutions that are frequently mixtures of many different compounds. Several of these
compounds exhibit relatively high solubility in water (the Physical and Chemical Properties Table, Table 4-1
provided as a separate Excel file), defined by Ney (1995) as exceeding 1,000 mg/L water. For example, PFOA has
a reported solubility of 9,500 mg/L at 25°C (USEPA 2017). Note that PFAS interactions with NAPL co-contaminants within the subsurface have been reported and can impact migration in the subsurface (Section
5.2.5).
95

5.2.2.2 PFAS Forms Micelles and Foam
A surfactant is a substance that tends to lower the surface tension of a liquid into which it is dissolved. Because many PFAS exhibit this property and are heat stable, they have frequently been used as wetting agents,
including in AFFF to form a thin film of water over the fuel source. As a consequence of lowering the surface
tension of water, foaming may result. The lipophobic/hydrophobic nature of the fluorocarbon tail and the reduction in surface tension can contribute to aggregation at air-water interfaces, potentially retarding PFAS
migration in the subsurface (Brusseau 2018).
At higher concentrations, PFAAs can aggregate into single-component or mixed micelles, where the hydrophilic portions interact with the water phase and the hydrophobic portions interact with each other. These aggregates
can take the form of micelles, hemimicelles, or even simple bilayer structures (Figure 5-2) (also see Section 4.2.7). For PFOS, the concentration above which micelles will form (that is, the critical micelle concentrations (CMC)) has
been cited as 500–5,000 mg/L, but hemimicelles may form at concentrations as low as 0.001 times the CMC (Yu
et al. 2009; Du et al. 2014; Brusseau 2018).
This tendency to aggregate may cause PFAAs to act differently at high concentrations (for example, during
release) and could enhance (or in some cases reduce) adsorption on carbon and minerals in the environment (Yu et al. 2009; Du et al. 2014) depending on the surface charge of the adsorbent surface. For example, adsorption of
the hydrophilic portions of PFAS (that is, the “heads”) onto positively charged absorbent surfaces can contribute to
the formation and accumulation of hemimicelles near surfaces, and this has been reported to increase the near-surface aqueous concentration of PFAS relative to that measured in bulk solution (Yu et al. 2009). At
concentrations exceeding the CMC, PFAS micelles can form visible separate-phase liquid floating on a water
surface (such as a surface water body) due to the lowering of surface tension (Costanza et al. 2019). This can contribute to PFAS enrichment at the air-water interface within surface water, particularly within the surface micro
layer (SML) that is defined as the thin layer (50 μm) of water in contact with the ambient air (Section 16.5.5). This
accumulation can also lead to foam formation above the surface water due to winds, waves, or other turbulent forces that introduce air into the water. In these cases, the presence of natural dissolved organic carbon within
the water body can also enhance foam formation and contribute to enrichment of PFAS in these foams even at
PFAS concentrations that are below reported CMCs (Schwichtenberg et al. 2020). This foam is different from AFFF
because it is likely caused by the aggregation of dissolved-phase PFAS followed by agitation within a surface water body. As discussed in the Surface Water Foam Section (Section 16.5), the formation of this type of PFAS-
containing foam above the surface of the water has been sampled and analyzed near or downgradient of areas
where PFAS have been released (MI EGLE 2021).
96

Figure 5-2. Illustration of the formation of PFAS micelles, hemimicelles, and bilayers. Also shown is an example of aggregation at a positively charged surface. Note that the opposite effect (electrostatic repulsion
of PFAS) can occur if the surface is negatively charged. Source: D. Adamson, GSI. Used with permission.
5.2.3 Partitioning to Solid Phases
PFAS can partition to a number of different solid-phase materials, including soils and sediments (Higgins and
Luthy 2006) and membranes (Fitzgerald et al. 2018). PFAS may also partition to mobile colloids, resulting in
facilitated transport (Brusseau et al. 2019). The partitioning of PFAS to solid-phase minerals is the most widely studied and is thought to occur through two primary processes: 1) adsorption to organic carbon via
hydrophobic interactions, and 2) electrostatic interactions (Higgins and Luthy 2006). The relative contribution
of each process can vary depending on surface chemistry and other geochemical factors.
In particular, understanding the partitioning behavior of PFCAs and PFSAs to soil organic carbon has been the subject of significant research. PFCAs and PFSAs are present as organic anions at relevant
environmental pH values (see Section 4.3.2 ), and are therefore relatively mobile in groundwater (Xiao et al. 2015), but will also tend to associate with the organic carbon fraction of soil or sediment (Higgins and Luthy
2006; Guelfo and Higgins 2013) in the saturated zone. Sorption to organic carbon generally increases with
increasing perfluoroalkyl tail length (Higgins and Luthy 2006; Guelfo and Higgins 2013; Sepulvado et al. 2011; Campos Pereira et al. 2018), indicating that the short-chain PFSAs (for example, PFBS) and PFCAs (for
example, PFHxA) are less retarded than their long-chain counterparts (PFOS and PFOA, respectively). In
addition, PFSAs tend to adsorb more strongly than PFCAs of equal chain length (Higgins and Luthy 2006), and branched isomers are less sorptive than linear isomers (Karrman et al. 2011)
97

Table 4-1, linked in Section 4, presents the range of available organic carbon partitioning coefficients (Koc) for
PFAS commonly observed in the environment. Koc is a soil organic carbon-normalized adsorption coefficient and
may serve as a useful parameter for evaluating transport potential. However, this parameter does not directly
capture any contributions from electrostatic interactions, meaning that estimating retardation in groundwater by
measuring the fraction of organic carbon (foc) in soil in combination with a literature-derived Koc value may underestimate (or in some cases, overestimate) retardation.
Li, Oliver, and Kookana (2018) compiled data from several literature studies to show that the bulk partitioning
coefficients (Kd) estimated for various PFAS included in these studies were best correlated with organic carbon
content and pH. However, a study by Barzen-Hanson (2017) showed a general lack of correlation between soil
parameters (such as organic carbon) and partition coefficients derived for some PFAS, such as anionic
fluorotelomer sulfonates as well as several cationic and zwitterionic PFAS. Anderson, Adamson, and Stroo (2019)
used field data from a large number of sites with AFFF releases to
establish that organic carbon significantly influenced PFAS soil-to-groundwater concentration ratios, and they used
statistical modeling to derive apparent Koc values for 18 different PFAS based on these data. Soil type and the
nature of the organic carbon also strongly influence adsorption of PFAS associated with hydrophobic partitioning. For
example, Zhi and Liu (2018) reported that the PFAS sorption potential of pyrogenic carbonaceous material (for
example, biochar) was 14–780 times higher than humic-based material with a comparable fraction of organic carbon.
Understanding the effects of adsorption associated with hydrophobic partitioning on contaminant transport
typically relies on assumptions that 1) there is equilibrium between contaminants in the solid phase and the aqueous phase, and 2) sorption is reversible. Lab-based and modeling studies have established that
partitioning of PFAS cannot be easily modeled using equilibrium sorption parameters in some cases due to
rate-limited sorption considerations (Guelfo et al. 2020; Brusseau 2020). In idealized systems, PFAS adsorption kinetics vary by constituent, but equilibrium is generally achieved over several days to weeks (Xiao, Ulrich, et al.
2017). However, in surface water bodies and groundwater, adsorption is more likely to be subject to mass
transfer effects, and temporal changes in conditions (for example, episodic releases, precipitation events,
pumping wells) may also make assumptions about equilibrium challenging. The meta-analysis by Anderson, Adamson, and Stroo (2019) showed that PFAS soil-to-groundwater concentration ratios across multiple sites were
strongly influenced by the degree of flushing that had occurred. These results suggest that mass transfer
limitations are contributing to increased soil retention at poorly flushed sites (those with low precipitation and deep groundwater), such that equilibrium assumptions for hydrophobic partitioning are not necessarily valid. In
addition, there is some evidence that PFAS adsorption may be hysteretic, and desorption may occur more slowly
than adsorption for certain PFAS (Higgins and Luthy 2006; Chen, Reinhard, et al. 2016; Zhi and Liu 2018;(Xiao et
al. 2019). Brusseau et al. (2019) showed that PFOS exhibited nonideal adsorption/desorption behavior (tailing) and suggested that these mass transfer limitations could increase the amount of time required to reduce PFOS
concentrations via pumping.
These findings are particularly relevant for strongly adsorbing compounds like PFOS (Chen, Jiao, et al. 2016) and
have important implications for PFAS fate and transport. For example, nonlinear sorption implies that PFAS will adsorb more strongly at low PFAS concentrations than high concentrations. Similarly, if PFAS mass is subject to
rate-limiting sorption, then desorption of a portion of the PFAS mass will occur very slowly (Xiao et al. 2019). As a
result, any portion of the released PFAS that is strongly retained within sediments or the soil matrix may be more persistent but likely less bioavailable and less subject to migration. Lab-based Kd values (derived using adsorption
isotherms) could also likely underestimate the impact of
adsorption during fate and transport modeling (for example, by possibly underestimating the retardation factor).
98

The contribution of electrostatic interactions to partitioning is highly dependent on soil type and soil solution
chemistry. Most soils contain both fixed-charge and variably charged surfaces, such that the net charge on the soil, as well as charge of functional groups of individual PFAS, can be strongly influenced by pH. For example, the
net negative charge on most clay minerals can result in electrostatic interactions with cationic functional groups that
are present on some PFAS; however, many PFAS, such as PFOA and PFOS, are anionic at environmentally relevant pH, such that electrostatic repulsion in soils dominated by negatively charged minerals would enhance the
mobility of anionic PFAS relative to cationic and zwitterionic PFAS. Changes in pH potentially impact these
electrostatic processes by altering surface charges (or possibly the ionic nature of the PFAS). As a result, lower pH values in soils have been shown to enhance sorption by anionic PFAS such as PFOS and other PFAAs (Higgins and
Luthy 2006), although the buffering capacity of some soils (for example, carbonate minerals) may mitigate these
impacts. Furthermore, increased levels of polyvalent cations such as Ca2+ ,which adsorb strongly to permanent
charge sites on clay minerals, can lead to increased partitioning to soil for some PFAS (Higgins and Luthy 2006;
McKenzie et al. 2015), although the effect on cationic and zwitterionic PFAS can vary widely due to charge
differences in the PFAS functional groups (Mejia-Avendaño et al. 2020). In addition, PFAS partitioning due to
electrostatic interactions has been shown to be nonlinear in some cases; Xiao et al. (2019) demonstrated that
sorption of several zwitterionic PFAS to natural soils (for example, loams, clay loams) increased as the PFAS
concentrations decreased. The effects of these various electrostatic interactions can be complex in an
environmental setting and may hinder or facilitate transport of PFAS following a release.
For PFAS such as PFOA and PFOS that are anionic at environmentally relevant pH, measuring the anionic
exchange capacity in representative soils may serve as a positive indicator of the importance of electrostatic
interactions with minerals. However, because soil pH can range considerably, pH can also serve as a useful
measure of potential PFAS mobility. Measurements of cation concentrations or the ionic strength of an aqueous solution may also provide useful information on the potential contribution of electrostatic attraction to enhanced
partitioning (through bridging and/or neutralization of negative surface charges). As noted above, additional
research is needed to further evaluate if any of these bulk parameters can be used predictively for fate and
transport studies (Barzen-Hanson 2017). Regardless, interactions with organic carbon are insufficient to reliably
predict PFAS partitioning coefficients, thus field values may be more appropriate for understanding PFAS
transport (Knight et al. 2019; Anderson et al. 2016; Li, Oliver, and Kookana 2018).
5.2.4 Partitioning to Air
As discussed in greater detail in Section 4.2, reliable data on physical properties that relate to PFAS volatilization, such as vapor pressure and Henry’s Law constants, are scarce. Additionally, volatilization from water
to air of acidic PFAS, such as PFAAs, is affected by pH-dependent, aqueous phase dissociation from more-volatile
acidic species to less-volatile anionic species (Kaiser et al. 2010). Measured vapor pressures are available for some select PFAAs, including the acidic forms of PFOA, perfluorononanoic acid (PFNA), perfluorodecanoic acid
(PFDA), perfluoroundecanoic acid (PFUnA), and perfluorododecanoic acid (PFDoDA) (Barton, Botelho, and Kaiser
2008; Kaiser et al. 2005), as well as FTOHs (Krusic et al. 2005). Henry’s law constants for several PFAS are
reported in Section 4.2.6. For some PFAS that are acidic at environmentally relevant pH, such as PFOS and PFOA, the reported vapor pressures are low and reported water solubilities are high, limiting volatilization from
water to air (USEPA 2000). Other PFAS, such as FTOHs, have specific functional groups that tend to impart
greater volatility. In one study performed by Roth et al. (2020), agitation of AFFF was demonstrated to release gas-phase PFAS, reportedly including PFOA. These experiments were performed in a controlled lab setting
and resulted in detectable concentrations of five FTOHs and 10 PFCAs above background laboratory air
concentrations. The potential for this type of partitioning to occur in field settings was not evaluated, and the veracity of the PFOA detections has been debated ((Titaley, De la Cruz, and Field 2020; Roth et al. 2020).
99

Under certain conditions, particularly within industrial stack emissions, or during fire suppression, incineration,
or combustion, PFAS can be transported through the atmosphere. This can include volatiles like FTOHs that may be present in the gas phase and anionic PFAS that may be sorbed to particulates (Ahrens et al. 2012). In
the latter case, transport occurs through the association of anionic PFAS with airborne aerosols and other small
particulates rather than direct partitioning to the gas phase. For example, PFOA and PFOS have been detected in airborne particulate matter, with PFOA dominant in the smaller, ultrafine particles and PFOS dominant in the
larger, coarser fractions in both urban and semirural areas (Dreyer et al. 2015; Ge et al. 2017). These studies
show that some PFAS can be adsorbed to particulates, likely reflecting the influence of local diffuse sources. As
discussed in Section 5.3, removal of airborne PFAS can occur via wet and dry deposition processes that scavenge particle-bound PFAS or gaseous PFAS that has partitioned into water droplets (Barton, Kaiser, and
Russell 2007; Dreyer et al. 2010). Wet deposition refers to the wash out of PFAS by rain droplets, where PFAS
drops to the ground with no transfer of PFAS to the air (Barton, Kaiser, and Russell 2007). This has been shown to be a relevant mechanism for influencing airborne transport within a few kilometers downgradient of a
major manufacturing source (Barton, Kaiser, and Russell 2007; Davis et al. 2007). Dry deposition is a naturally
occurring process that depends on prevailing environmental conditions and particle characteristics. Since these deposition processes remove PFAS from the atmosphere, they can influence the location and magnitude of
PFAS deposition to terrestrial and aquatic environments.
Kaiser et al. (2010) demonstrated the partitioning of PFOA to workplace air from water and dry surfaces.
Partitioning to air from these substrates appears to depend on conditions within the substrate, with lower pH
environments contributing more PFOA mass to air. The protonated acid form of PFOA has an elevated vapor pressure, which may explain these observations (Kaiser et al. 2005). Interestingly, these authors showed that
more PFOA partitions from dry surfaces than from water and may contribute significantly to workplace exposures
5.2.4.1 Partitioning to Air/Water Interfaces
As described above, PFAS often exhibit surfactant behavior because many display hydrophobic and hydrophilic
properties. The impacts of these properties on transport are complex and have not been extensively investigated. By design, many PFAS will preferentially form films at the air-water interface, with the hydrophobic carbon-fluorine
(C-F) tail oriented toward the air and the hydrophilic head group dissolved in the water (Krafft and Riess 2015)
(Figure 5-3). This behavior influences aerosol-based transport and deposition, and suggests that accumulation of
PFAS at water surfaces will occur (Prevedouros et al. 2006).
This preference for the air-water interface has important implications for PFAS transport in the vadose zone,
where unsaturated conditions provide significant air-water interfacial area (Brusseau 2018; Brusseau et al. 2019).
This includes the potential for enhanced retention in the vadose zone and the capillary fringe, which are the
subject of significant ongoing research. For example, Brusseau (2018) showed that adsorption of PFOS and PFOA at the air-water interface can increase the retardation factor for aqueous-phase transport, accounting for
approximately 50% of the total retention in a model system (well-sorted sand) with 20% air saturation.
As a result, air-water partitioning may contribute to retardation of PFAS in unsaturated soils. Using field data,
Anderson, Adamson, and Stroo (2019) reported that soils with higher clay contents were associated with lower soil-to-water concentration ratios for multiple PFAS. The authors surmised that perhaps the more likely
explanation was that the higher water content within these clay-rich zones (relative to other depth-discrete
zones with more coarse-grained material) decreased the air/water interfacial area available for PFAS partitioning and thus decreased overall soil retention. This pattern is also consistent with the potential for negatively charged
clay surfaces to reduce anionic PFAS adsorption through electrostatic repulsion. Guo, Zeng, and Brusseau
(2020) highlighted the influence of soil type on air-water interfacial accumulation as a retention mechanism in a modeling study that demonstrated retardation factors for PFOS under their experimental conditions as between
233 and 1,355 in sands and 146 and 792 for finer-grained soils. This was attributed to weaker capillary forces
in the sands that resulted in lower water contents and thus more air-filled pore space to promote PFAS partitioning.
100

Note that the simulations performed by Guo, Zeng, and Brusseau (2020) examined only PFOS and did not use
field-derived input parameters, so caution should be exercised when generalizing these results to the broader
family of PFAS. In addition to the influence of soil type described above, ionic strength has been shown to affect
air-water interfacial partitioning whereby PFAS retardation within unsaturated soils appears to be enhanced
with increasing salinity (Lyu and Brusseau 2020).
The tendency for PFAS to accumulate at air-water interfaces has the potential to influence site management decisions at certain sites. This influence could include the following:
• It could slow the rate that some PFAS migrates through the vadose zone to groundwater (breakthrough). As with hydrophobic partitioning, the relative importance of air-water interfacial partitioning is highly dependent on hydrogeologic and geochemical properties (e.g., water content,
salinity) of the formation (Anderson, Adamson, and Stroo 2019), as well as the air-water interfacial
affinity of individual PFAS (Brusseau 2019). In general, air- water interfacial partitioning contributes to
the bulk soil retention such that time scales required for PFOS (and other PFAS that exhibit strong interfacial adsorption characteristics) to reach the underlying groundwater could be on the order of
decades (Guo, Zeng, and Brusseau 2020). This could influence the timing for selecting and
implementing remedies, or even the duration of long-term management programs.
• It could limit the amount of PFAS mass that is transferred to groundwater over a given period of time (mass discharge). Similar to the impact described above, it occurs because a large proportion of the PFAS mass has been shown to be associated with the air-filled pore space and (to a lesser extent)
the solid phase, such that only a small percentage of mass is in the aqueous phase and subject to
deeper infiltration (Guo, Zeng, and Brusseau 2020). Importantly, the interaction between solid phase sorption (i.e., hydrophobic partitioning and electrostatic interactions) and air-water interfacial
partitioning could be important given that mass transfer limitations can create hysteretic desorption
from soils with relatively high organic matter content (Schaefer et al.2021).
The expected influence of air-water interfacial partitioning on PFAS mass retention and soil-to-groundwater
transfer has stimulated interest in incorporating these processes into conceptual site models as well as
predictive fate and transport models. Estimates of the air-water interfacial area and the constituent-specific air-
water adsorption coefficients, as well as direct measurements of mass discharge to groundwater, can help
provide a quantitative basis for these types of models (Guo, Zeng, and Brusseau 2020). In general, air-water
adsorption coefficients for an individual PFAS increase as the concentration decreases because the process
appears to be nonlinear (Freundlich-type partitioning) (Schaefer et al. 2019). This means that retention via this
mechanism is enhanced when PFAS concentrations are more dilute. Air-water adsorption coefficients also
tend to increase as the number of perfluorinated carbons increases (Brusseau 2019; Schaefer et al. 2019). This means that when PFAS are released as a multicomponent mixture, these processes will influence each
compound to a different extent, with less retention of shorter chained PFAS (for example, PFBS, PFPeA) than
longer chained PFAS (e.g., PFOS, PFDA, PFNA) (Silva, Martin, and McCray 2021). Silva, Martin, and McCray
(2021) also showed that preferential adsorption of the more surface-active PFAS within a mixed release is expected to reduce the adsorption of the other, less surface-active PFAS in the mixture. This type of competitive
adsorption would influence the relative breakthrough times for different PFAS within a mixed release.
The potential retardation of PFAS in the vadose zone due to adsorption at the air-water interface is an important
component that should be addressed in the conceptual site model, but the retention of PFAS is based on site-
specific factors. At sites with shallow groundwater tables, or sites where the water content within the vadose zone soils is typically low, air-water interfacial partitioning may not be particularly relevant. As such, detailed
site investigations are critical to understanding how these processes influence PFAS migration through the
vadose zone of a specific site. For example, an extensive study of PFAS concentrations in soil at contaminated sites indicated significant retention of PFAS in the vadose zone over long periods of time, but vertical migration of
PFAS to the water table was also evident, resulting in detectable PFAS in groundwater at a majority of the
investigated sites (Brusseau 2020).
101

In addition, published studies of migration of PFAS in bedrock aquifers are scarce, but many of the processes
controlling sorption in soils will be limited in fractured crystalline bedrock aquifers, resulting in potential for migration of PFAS over longer distances once plumes migrate to the bedrock aquifer.
Figure 5-3. Example of expected orientation and accumulation of PFAS at air-water interface.
Source: D. Adamson, GSI. Used with permission.
5.2.5 Partitioning into NAPL Co-Contaminants
PFAS and petroleum hydrocarbon fuels in the form of NAPLs may commingle at fire training areas, fire response
sites, and other locations where fuels were used or disposed concurrently with PFAS-containing materials. In these
settings, the released petroleum hydrocarbon fuel forms a NAPL into which the PFAS may partition and accumulate along the NAPL/water interface (Brusseau 2018). These processes may result in increased PFAS mass retained in
NAPL source zones, increased PFAS sorption onto the NAPL/water interface and resulting retardation, and greater
persistence of PFAS (Guelfo and Higgins 2013; McKenzie et al. 2016; Brusseau 2018).
The presence of NAPL may have other effects on PFAS. The presence of biodegradable NAPL, such as petroleum
light nonaqueous phase liquids (LNAPLs), may significantly alter the biogeochemistry and oxidation-reduction
conditions in the subsurface. For example, subsurface petroleum LNAPLs remaining from a petroleum-based fire
tend to locally deplete the concentration of oxygen and other electron acceptors and elevate the concentration of methane. The LNAPL creates a localized zone of anoxic reducing conditions where PFAS aerobic transformation
processes are inhibited, and anaerobic transformation processes may occur. These transformation processes are
discussed in more detail in Section 5.4.
102

5.3 Media-Specific Migration Processes
The potential impacts of processes such as diffusion into low-permeability matrices, atmospheric transport, and
leaching from soil to groundwater are described. Unlike partitioning processes, which involve the exchange of
chemicals between media, the following describes processes that occur within specific media that may be important considerations for PFAS migration.
5.3.1 Diffusion In and Out of Lower Permeability Materials
Diffusion is the movement of molecules in response to a concentration gradient. Diffusion in groundwater is
often ignored because diffusion rates are slow relative to advection. However, contaminant mass in
groundwater can diffuse into lower permeability soils or bedrock. Back-diffusion out of these low permeability
materials may result in the long-term persistence of PFAS in groundwater even after source removal and
remediation. Due to the lack of degradation of PFCAs and PFSAs, back-diffusion of these PFAS is also likely to
be a more significant process than for conventional contaminants such as chlorinated solvents. PFAS may also
diffuse into site materials such as concrete. For example, Baduel (2015) reported that PFAS had penetrated 12
cm into a concrete pad at a fire training area, and diffusion was identified as a contributing process.
The potential impacts of diffusion on PFAS persistence in natural soils are a topic of ongoing research.
Determining appropriate diffusion coefficients for the range of PFAS that may be present following a
release is a key element in understanding how this process impacts PFAS persistence.
5.3.2 PFAS Transport via Air
Many PFAS have been measured in air (Section 6.1) and are known to be released to air from a variety of sources (Section 2.6). Air serves as an important transport media for PFAS, allowing PFAS to disperse in all wind
directions, contributing to global dispersion, and leading to localized PFAS deposition to soils and surface water in
the vicinity of emission sources (for example, (Shin et al. 2012) which is of potential concern to site investigations.
The role of atmospheric transport depends on PFAS-specific properties such as vapor-particle partitioning, and
mechanisms can be complex. Aerosols, representing a suspension of solid particles and liquid droplets in the air, provide a variety of environmental media and surfaces within or upon which a range of PFAS partitioning behavior
can be observed. For example, McMurdo et al. (2008) described the release of concentrated PFAS aerosols from
a water surface (where PFAS are often located). Airborne transport of PFAS is a potentially relevant migration
pathway due to the common types of industrial release (for example, stack emissions). The specific means of PFAS releases from industrial sources have not been extensively studied, but could involve processes such as
droplet mobilization from drying and agitation of liquid surfaces.
The importance of other sources, such as combustion emissions or windblown foam from fire training and fire response sites, on the fate and transport of PFAS in air may need to be assessed.
Differences between process temperatures (such as those found in drying operations in textile coating
operations) and ambient air can plausibly be expected to affect PFAS partitioning. Both water droplets and solid
particles can convey PFAS in stack emissions, and some PFAS may exist as vapors at elevated temperatures in
stack exhaust. PFAS partitioning can also change as stack effluent cools, for example, as PFAS-containing
droplets evaporate and leave solid particulate matter.
Technologies such as fabric filters and wet scrubbers are effective at controlling particle emissions, though
applications to PFAS have not been formally evaluated.
103

Once airborne, PFAS can occur in a gaseous state or be incorporated within particulate matter or other aerosols
suspended within the air. The composition of the gas phase will be dependent on the industrial process(es) contributing to emissions. Neutral volatile precursor compounds, such as FTOHs, are often the dominant PFAS
present in the gas phase (Table 17-1A) and can account for at least 80% of the total PFAS mass in ambient air in
an urban area (Ahrens et al. 2012).
Over the open oceans and in remote regions, FTOHs also dominate neutral PFAS and almost all are present in
the gas phase (Bossi R. 2016; Lai et al. 2016; Wang, Xie, et al. 2015; Dreyer et al. 2009). In contrast, ionic PFAS,
such as PFOA and PFOS, characterized by low vapor pressure and high water solubility, tend to be the dominant species found in airborne particulate matter. PFOA is associated with smaller, ultrafine particles, while PFOS is
associated with larger, coarser fractions in both urban and semirural areas (Ge et al. 2017; Dreyer et al. 2015).
Wet and dry deposition are the major mechanisms of removal of PFAS from the atmosphere and can occur from the scavenging of particle-bound PFAS or partitioning of gaseous PFAS to water droplets (Dreyer et al. 2010;
Barton, Kaiser and Russell 2007; Hurley et al. 2004). PFAS are commonly found in precipitation (rain and snow),
with wet and dry deposition estimated to occur on a time scale of a few days (Chen, Jiao, et al. 2016; Lin et al. 2014; Taniyasu et al. 2013; Zhao, Zhou, et al. 2013; Dreyer et al. 2010; Kwok et al. 2010; Liu et al. 2009; Barton,
Kaiser and Russell 2007; Kim and Kannan 2007; Hurley et al. 2004).
Atmospheric deposition can occur as dry or wet deposition, both of which are relevant for PFAS (Barton, Kaiser and Russell 2007, 2010; Dreyer et al. 2010; Taniyasu et al. 2013). During dry deposition, PFAS that are preferentially
associated with liquid or particle phases in air (aerosols) can be naturally deposited onto surfaces via settling,
diffusion, or other processes. When precipitation contributes to washout of these PFAS-containing aerosols,
the process is known as wet deposition. Wet and dry deposition are the major mechanisms for removal of PFAS from the atmosphere and can occur from the scavenging of particle-bound PFAS or partitioning of gaseous
PFAS from water droplets (Dreyer et al. 2010; Barton, Kaiser and Russell 2007; Hurley et al. 2004). Deposition
is considered a sink term for the atmosphere because mass is removed and the potential for longer range atmospheric transport is reduced. However, this same process thus represents a potential source of PFAS to
terrestrial and aquatic environments. Once settled, PFAS adsorbed onto soils or other surfaces (including indoor
surfaces) can be resuspended when particulate matter is disturbed by wind or other physical means. See Section 6.1 for further discussion of atmospheric deposition of PFAS.
Short-range atmospheric transport and deposition can result in PFAS contamination in terrestrial and aquatic systems near points of significant emissions, impacting soil, groundwater, and other media of concern (Davis et
al. 2007). Evidence of releases has been observed in areas where hydrologic transport could not plausibly
explain the presence of PFAS in groundwater, with the extent of contamination reaching several miles from sources and in distribution patterns independent of regional hydrology (Frisbee et al. 2009; Post 2013; Post, Cohn,
and Cooper 2012; NYS DOH 2016; NH DES 2017; VT DEC 2016). Releases of ionic PFAS from factories are
likely tied to particulate matter (Barton et al. 2006), which settle to the ground in dry weather and are also wet-scavenged by precipitation (Slinn 1984; Sehmel 1984).
104

Predictive models have been applied to estimate PFAS deposition (Shin et al. 2012). The American
Meteorological Society/USEPA regulatory model AERMOD system contains modules to estimate both wet and dry deposition of both aerosols and gases (USEPA 2016). It is important to note that validation of these deposition
modules has not been completed. Hence, uncertainty exists, and deposition model predictions should be
interpreted with caution. Nevertheless, the model may be useful in understanding the pattern of PFAS found in soil and groundwater in the vicinity of PFAS emission sources (Shin et al. 2012). Key input parameters for
emissions from a smokestack or vent include the height of the release point and adjacent structures, source
emission rates and particle size distributions, stack effluent properties (temperature and volumetric flow rate),
meteorological data, local topography, and land use characteristics. Temporal variability can be important as AERMOD operates on an hourly basis. Several states have recently engaged in or reviewed AERMOD
applications to industrial sources, and regulatory agencies including the New Jersey Department of
Environmental Protection, New Hampshire Department of Environmental Services, and the Vermont Department of Environmental Conservation can provide valuable information and advice on deposition model
application.
Long-range transport processes are responsible for the wide distribution of neutral and ionic PFAS across the
earth as evidenced by their occurrence in biota, surface snow, ice cores, seawater, and other environmental media in remote regions as far as the Arctic and Antarctic (Bossi R. 2016; Kirchgeorg et al. 2016; Rankin et al.
2016; Wang, Xie, et al. 2015; Codling et al. 2014; Wang et al. 2014; Kirchgeorg et al. 2013; Kwok et al. 2013;
Benskin, Muir, et al. 2012; Cai, Yang, et al. 2012; Cai, Xie, et al. 2012; Cai, Zhao, et al. 2012; Ahrens, Xie, and Ebinghaus 2010; Dreyer et al. 2009; Young et al. 2007). Distribution of PFAS to remote regions far removed from
direct industrial input is believed to occur from both (1) long-range atmospheric transport and subsequent
degradation of volatile precursors and (2) transport via ocean currents and release into the air as marine aerosols (sea spray) (DeSilva, Muir, and Mabury 2009; Armitage et al. 2009; Wania 2007; Ellis et al. 2004).
5.3.3 Leaching
PFAS present in unsaturated soils are subject to downward leaching during precipitation, flooding, or irrigation events that promote dissolution of soil-bound contaminant mass (Sepulvado et al. 2011; Ahrens and Bundshuh
2014). This process can result in PFAS transport from surface soils to groundwater and surface water, because
releases often involve surface applications (for example, AFFF and biosolids) or atmospheric deposition.
Leaching is also potentially relevant for plant uptake and transport of PFAS contained in landfill waste without adequate leachate control (Benskin, Muir, et al. 2012; Yan et al. 2015; Lang et al. 2017). Leaching potential is a
function of media properties (for example, pH, redox conditions, and increased partitioning with organic carbon in
soil), PFAS structural properties (for example, ionic charge and chain length), and site conditions that influence the degree of flushing (for example, precipitation rates and depth to groundwater)(Gellrich, Stahl, and Knepper
2012; Anderson, Adamson, and Stroo 2019).
Although some studies have reported PFAS transport by leaching (Lindstrom et al. 2011; Filipovic et al. 2015; Hellsing et al. 2016; Bräunig et al. 2017), others have observed long-term retention of longer chain PFAS on
shallow soils after extended percolation (Sepulvado et al. 2011; Stahl et al. 2013; Anderson et al. 2016). In a
long-term lysimeter study using a silty soil with some clay and natural rainfall, PFOA and shorter chained PFCAs and PFSAs traveled more rapidly through the soil column than did PFOS (Stahl et al. 2013). However, even after 5
years, 96.88% and 99.98% of the mass of PFOA and PFOS, respectively, remained in the soil. This retention of
PFOA and PFOS may increase the long-term persistence of the (soil- bound) source (Baduel 2015).
105

5.4 Transformations
5.4.1 Introduction
Numerous studies have reported both biotic and abiotic transformations of some polyfluorinated PFAS.
Polyfluorinated PFAS shown to transform are referred to as precursors and typically form PFAAs. However, PFAAs
have not been shown to degrade or otherwise transform under ambient environmental conditions. The
fundamental differences between polyfluorinated precursors and perfluorinated chemicals that affect
transformation potential are the presence, location, and number of carbon-hydrogen (C-H) bonds and potentially
carbon-oxygen (C-O) bonds throughout the alkyl carbon chain. Specifically, PFAS with C-H bonds are subject to a
variety of biotic and abiotic reactions that ultimately result in the formation of shorter chain PFAAs. Although available studies on both biotic and abiotic transformation of polyfluorinated PFAS primarily consist of controlled
laboratory experiments (discussed below), an increasing number of field studies have also been published
demonstrating the relevance of precursors at a variety of sites with different source scenarios (for example,
Weber et al. 2017; Dassuncao et al. 2017).
5.4.2 PFAA Precursors
AAlthough PFAAs are limited to a fairly small number of homologous compounds that differ only with respect to
carbon chain length and the terminal functional group, the number and diversity of polyfluorinated chemicals is vast. Thousands of PFAS are currently thought to exist (or existed) on the global market, and the vast majority
are polyfluorinated (Wang, DeWitt, et al. 2017) (Section 2). However, transformation studies published to date
are available for only of a small subsample of these PFAS, and therefore, much uncertainty exists regarding 1) the extent to which precursor transformation occurs on a global scale, 2) which environmental compartments
represent the majority of transformation, 3) relevant environmental conditions that affect transformation
processes, and 4) transformation rates and pathways. Nevertheless, the fraction of total PFAS that is comprised
of PFAAs, that represent the total composition of PFAS both globally and (in particular) at contaminated sites, should be expected to increase due to transformation over time, over distance, and due to remediation, as
depicted in Figure 5-4.
106

Figure 5-4. Illustration of precursor transformation resulting in the formation of PFAAs.
Source: L. Trozzolo, TRC, and C. Higgins, Colorado School of Mines. Used with permission and based on This Photo by Unknown Author is licensed under CC BY-SA.
5.4.3 Atmospheric Transformations
Although direct emission of PFCAs has declined globally, atmospheric emission of PFCA precursors has been increasing (Thackray and E Selin 2017; Wang et al. 2014). Similarly, emission rates for PFSA precursors are
increasing globally (Löfstedt Gilljam et al. 2016). Atmospheric transport is an important distribution mechanism for
PFAS on both regional and global scales, which has led to documented PFAS occurrence (including PFAAs and PFAA precursors) in remote locations, including arctic regions (Young et al. 2007). Ocean currents also transports
PFAS to arctic regions, although the relative contribution of each mechanism is not well understood (Yeung et al.
2017). Regardless of the relative contributions of atmospheric and oceanic transport, atmospheric transport and subsequent transformation of precursors has been documented as an important source of PFAAs in the
environment (Young et al. 2007).
Widely measured PFCA precursors in the atmosphere include primarily FTOHs (Thackray and E Selin 2017; Young and Mabury 2010; Martin et al. 2002). Wang, Xie, et al. (2015) collected marine atmospheric samples during an
expedition research cruise that spanned the Southern Ocean, Atlantic Ocean, and Arctic Ocean; samples were analyzed for several precursors, including FTOHs, FTAs, FOSAs, and FOSEs. The researchers found that FTOHs
were the predominant species.
Atmospheric transformation of precursors, including FTOHs, may be an important source of PFCAs in the environment, such as those identified in the Arctic (Schenker et al. 2008). Although direct photolysis of PFAS
has not been observed, indirect photolysis of some precursors does occur in the atmosphere and can be a
significant contributor to PFCA deposition (Armitage, MacLeod, and Cousins 2009; Yarwood et al. 2007). For example, hydroxyl and chlorine radicals degrade 8:2 FTOH to PFOA in the atmosphere through reactions with
hydroxyl and chlorine radicals, with similar reactions for 6:2 and 4:2 FTOHs (Ellis et al. 2004) and perfluoroalkyl
sulfonamides, which may degrade to PFCAs and PFSAs (Martin et al. 2006). In addition to FTOH, other semivolatile precursors may also undergo atmospheric transformation to PFCAs (Young and Mabury 2010).
107

Atmospheric transformation of precursors to PFCAs is a multistep process, and the PFCA product yield is a function
of several factors, including ratio of nitros oxides (NOx) and peroxy radicals (RO2) species. High NOx levels result in lower long-chain PFCA yields, thus long-chain PFCA yields are typically higher in remote regions (Young and
Mabury 2010). Thackray and E Selin (2017) calculated theoretical maximum yields for formation of PFOA and PFNA
from 8:2 FTOH that were highly variable, ranging from far less than 1% to 40% (PFOA) or 80% (PFNA), depending on local photochemical conditions.
5.4.4 In Situ Transformations
5.4.4.1 Abiotic Pathways
Abiotic processes shown to cause transformations of precursors in soil and water under ambient environmental
conditions include hydrolysis, photolysis, and oxidation. Hydrolysis of some precursors, followed by subsequent biotransformation, can produce PFSAs. An important example is the production of PFOS from perfluorooctane
sulfonyl fluoride (POSF) (Martin et al. 2010). Other hydrolysis reactions produce PFCAs. In particular, Washington
and Jenkins (2015) showed that the hydrolysis of fluorotelomer-derived polymeric precursors forms monomeric precursors of PFOA and other PFCAs with half-lives of 50–90 years at neutral pH. Also, oxidation of precursors by
hydroxyl radicals can occur in natural waters, with the fluorotelomer- derived precursors being oxidized more
rapidly than electrochemical fluorination (ECF)-derived precursors (Gauthier and Mabury 2005; Plumlee, McNeill, and Reinhard 2009). Shorter chain PFCAs as well as PFSAs such as perfluorobutane sulfonate (PFBS) also can be
produced by oxidation reactions between hydroxyl radicals and sulfonamido derivatives (D’Eon et al.
2006). Finally, in some cases, abiotic precursor transformations may not initially produce any PFAA (for example, the formation of various polyfluorinated sulfonamido intermediate compounds from ECF-derived precursors), though
eventual formation of PFAAs may still be possible.
5.4.4.2 Aerobic Biological Pathways
Evidence of aerobic biotransformation is provided from studies of PFAS composition throughout the continuum
of wastewater treatment (see Arvaniti (2015) for a comprehensive review), field studies at AFFF-impacted sites (for example, Houtz et al. 2013; McGuire et al. 2014; Anderson et al. 2016; Weber et al. 2017), and most authoritatively
from microcosm experiments.
The literature on aerobic biotransformation collectively demonstrates, or indirectly supports, conclusions such as
the following:
• Numerous aerobic biotransformation pathways exist with relatively rapid kinetics.
• All polyfluorinated precursors studied to date have the potential to aerobically biotransform to
PFAAs.
• Aerobic biotransformation of various fluorotelomer-derived precursors exclusively results in theformation of PFCAs, including PFOA.
• Aerobic biotransformation of various ECF-derived precursors primarily results in the formation of PFSAs,including PFOS.
In detail, most commonly studied in microcosm experiments have been the 6:2 and 8:2 FTOHs in soil, sludge,
or aqueous matrices. Although observed degradation rates and intermediates are variable among these studies,
≤ C8 PFCAs have been consistently observed as terminal transformation products (Dinglasan et al. 2004; Wang, Szostek, Buck, et al. 2005; Wang, Szostek, Folsom, et al. 2005; Liu et al. 2007; Saez, de Voogt, and Parsons
2008; Wang et al. 2009). However, a pure culture experiment with P. chrysosporium (a white-rot fungus) reported
much lower PFCA yields with alternate pathways (Tseng et al. 2014). Other telomer-derived polyfluorinated PFAS investigated include the 6:2 fluorotelomer mercapto alkylamido sulfonate (Weiner et al. 2013), the 6:2
fluorotelomer sulfonate (Wang et al. 2011), the 4:2, 6:2, and 8:2 fluorotelomer thioether amido sulfonates
(Harding-Marjanovic et al. 2015), the perfluorooctane amido quaternary ammonium salt (Mejia- Avendaño et al. 2016), the 6:2 fluorotelomer sulfonamide alkylamine, and the 6:2 fluorotelomer sulfonamide alkylbetaine
(D’Agostino and Mabury 2017). All demonstrate the formation of PFCAs with variable rates and inferred pathways. 108

Aerobic biotransformation of various ECF-derived polyfluorinated PFAS has also been demonstrated in several
studies. Studied PFSA precursors include N-ethyl perfluorooctane sulfonamido ethanol (Rhoads et al. 2008; Zhao et al. 2016; Zhang et al. 2017), N- ethyl perfluorooctane sulfonamide (Mejia Avendaño and Liu 2015), and
perfluorooctane sulfonamide quaternary ammonium salt (Mejia-Avendaño et al. 2016). All demonstrate formation
of PFSAs with variable rates and inferred pathways.
5.4.4.3 Anaerobic Biological Pathways
Few studies have been published to date conclusively demonstrating biotransformation of per- and
polyfluorinated PFAS under anaerobic conditions. FTOHs were studied in two instances, demonstrating the
production of stable polyfluorinated acids under methanogenic conditions with much slower kinetics relative to aerobic biotransformation (Zhang et al. 2013; Allred et al. 2015). In a recent study, PFOA and PFOS were
demonstrated to be defluorinated by a specific microbial strain (Acidimicrobium sp. Strain A6) under conditions
where ammonium is oxidized while iron is reduced, a condition known as Feammox (Huang and Jaffé 2019). The
environmental significance of anaerobic biotransformations of polyfluorinated PFAS as sources of PFAAs is uncertain.
5.4.5 Polymer Transformation
Polymeric substances in the PFAS family include fluoropolymers, polymeric perfluoropolyethers, and side-chain fluorinated polymers (Buck et al. 2011). Detailed descriptions of these polymers appear in Section 2.2.2.1. Briefly,
• fluoropolymers are high–molecular weight solid plastics (> 100,000 Daltons, or Da according to Henryet al. (2018)) containing a carbon polymer backbone with fluorine directly attached to backbone
carbon atoms.
• polymeric perfluoropolyethers contain an ether polymer backbone with F directly attached to carbonatoms. These polymeric PFAS are complex and mainly used as surfactants and surface protectants.
• side-chain fluorinated polymers contain a nonfluorinated polymeric backbone with fluorinated sidechains; these are synthesized from telomer-derived precursors.
Polymer transformation research has indicated the following.
• Given the wide range of estimated half-lives, modeling assumptions for estimating the half-lives,
different levels of residuals present in the polymer studied, highly variable molecular weights of the
polymers studied with different surface area and size and with different extraction protocols, the
polymer degradation studies are inconsistent.
• Other environmental conditions that need to be considered are redox, pH, temperature, percent
moisture, and microbial activity in the soil microcosms for these long-term studies.
• Additional research is needed primarily on the biotransformation of side-chain fluorinated polymers, whichare potential precursors to PFAAs.
Side-chain fluorinated polymers are widely used for many commercial and industrial applications as surfactant and
surface- protecting products (Buck et al. 2011). Therefore, understanding the biotransformation potential of these
polyfluorinated polymers is essential. However, few studies have reported on the potential biotransformation of
side-chain polymers—for example, the fluorotelomer-based urethane polymer (Russell et al. 2010). Given the complexity of side-chain fluorinated polymers, there are many discrepancies among these studies. Primarily, the
inability to monitor polymer concentrations is problematic. Because analytical methods for direct quantitation of
polymers are not available, all the studies except Rankin et al. (2014) monitored suspected FTOH degradation products rather than the disappearance of the polymer (Wang, Szostek, Buck, et al. 2005; Liu et al. 2007; Wang et
al. 2009; Dasu, Liu, and Lee 2012; Dasu and Lee 2016). Rankin et al. (2014) qualitatively monitored the
disappearance of the polymer using matrix-assisted laser desorption/ionization time-of-flight (MALDI-TOF) mass spectrometry, in addition to monitoring known degradation products. Also, the presence of impurities or
nonpolymerized residuals (monomers, oligomers, PFCAs, FTOHs, etc.) complicates data interpretation and
potentially confounds conclusions on polymer biodegradation. 109
Finally, the time frame for the biodegradability studies (max = 2 years) is much shorter than the extrapolated half-
lives (decades to thousands of years) of these side-chain fluorinated polymers. Hence, modeling assumptions are also critical sources of variability.
Russell et al. (2008); Russell et al. (2010) investigated the biodegradation potential of two types of side-chain
fluoropolymers, fluorotelomer-based acrylate polymer and urethane polymer in soils for 2 years. Based on the experimental data for PFOA, the estimated half-life of acrylate polymer was 1,200–1,700 years and urethane
polymer was 28–241 years (geometric mean of 102 years). However, the polymer used in this study contained
high residuals. Later, Washington et al. (2009) studied the biodegradation potential of fluorotelomer-based
polyacrylate, which contained low residuals, and based on the experimental data for PFOA, the acrylate polymer half-life was estimated at 870–1,400 years. Further, based on the assumption that degradation is
surface-mediated, the authors also modeled and estimated the half-life for finely grained polymers, which are
typical of commercial products. They did this by normalizing to the estimated surface area of the polymer and derived a half-life of 10-17 years, which suggests fine-grained, side-chain fluoropolymer products may be a
potentially significant source of PFCAs to the environment.
Washington et al. (2015) studied the biodegradability of commercial acrylate polymer for 376 days in soils using exhaustive extractions (Washington et al. 2014) and estimated half- lives ranging from 33 to 112 years. In this
study, it was also observed that the acrylate polymer can undergo OH-mediated hydrolysis in pH 10 water and
it degrades 10-fold faster than in the neutral treatment. This is the only abiotic transformation of side-chain fluorinated polymer reported in the literature, so the mechanism of abiotic degradation needs further
investigation. Another research group, Rankin et al. (2014) studied the biodegradation of laboratory-
synthesized fluorotelomer-based acrylate polymer in soil, plant, and biosolids for 5.5 months. Degradation rates were faster in plants and biosolids than in soils. Even in this study, a broad range of estimated half-lives of 8–111
years was reported. The modeling assumptions used in different studies lead to variability in reported half-lives
(Russell et al. 2008; Russell et al. 2010; Washington et al. 2009; Washington et al. 2010; Washington et al.
2015; Washington et al. 2018).
5.4.6 Practical Implications
Precursor transformation can complicate CSMs (and risk assessments) and should be considered during
comprehensive site investigations. For example, atmospheric emissions of volatile precursors can result in
long-range transport where subsequent transformation and deposition can result in detectable levels of PFAAs in environmental media independent of obvious point sources (Vedagiri et al. 2018). With respect to site-related
precursors, transformation of otherwise unmeasured PFAS into detectable PFAAs is obviously relevant to site
investigations to the extent transformation occurs after initial site characterization efforts. Additionally, differential
transport rates between precursor PFAS and the corresponding terminal PFAA could also confound CSMs if transformation rates are slower than transport rates, as has been suggested (Weber et al. 2017).
To account for otherwise unmeasurable precursors, several surrogate analytical methods have been
developed, including the total oxidizable precursor (TOP) assay (Houtz and Sedlak 2012), particle-induced
gamma-ray emission spectroscopy (PIGE) (Schaider et al. 2017), and adsorbable organic fluorine (AOF) followed by combustion ion chromatography (Wagner et al. 2013). For more information on these surrogate analytical
methods to measure precursor concentrations, see Section 11.2.
110
5.5 PFAS Uptake into Aquatic Organisms
Because of their unique chemical properties and persistence in the environment, some PFAS compounds have
a propensity to bioaccumulate. With the exception of biota exposed to gross contamination (for example, AFFF spill sites), lower levels are observed in invertebrates and fish and higher levels are observed in animals at the
top of the food chain (for example, seagulls, polar bears) (Furl and Meredith 2010; Ahrens and Bundshuh 2014).
Tissue levels of PFAS in the rural environment, compared to lipophilic legacy compounds (for example, polychlorinated biphenyls (PCBs), DDT, mercury), remain relatively low (μg/kg).
Ionized PFAS are polar compounds and thus tend to bind to blood proteins instead of distributing into fatty
tissues. Several studies (Jones et al. 2003; Han et al. 2003) reported that PFOS and PFOA are generally bound
to serum albumin as well as proteins in the liver and kidney and that the binding does not adversely affect
binding of hormones. Thus, traditional methods and models that assume partitioning to lipids to estimate or characterize fate and transport of PFAS in biota (for example, log Kow) cannot be used with this class of
compounds.
In fresh or marine waters, partitioning to biota is generally defined using three operational categories.
• Bioconcentration factor (BCF)–the direct uptake of PFAS by an organism from the water column
(through the gills), measured as the ratio of the concentration in an organism to the concentration in water (typically measured in the laboratory, units typically in L/kg)
• Bioaccumulation factor (BAF)–the amount of PFAS taken up from bioconcentration plus the contribution of PFAS in the diet of the organism (can be measured in the laboratory or field, typically unitless);
• Biomagnification factor (BMF)–an increase in tissue concentration as one moves up the food chain based on a predator/prey relationship (always measured in the field, typically unitless), often defined as the
concentration of chemical in an organism divided by the concentration of chemical in its food.
There are hundreds of publications addressing partitioning of PFAS into biota by all three mechanisms and the subject is too broad to cover in this document. To assist in understanding this process, a sampling of data from
some of the more visible review papers, along with references, is provided in Table 5-1 (as a separate Excel file).
This table includes values for both invertebrates and fish. It is also important to add that due to both the
historical precedence and domination of most media by PFOA/PFOS, most research evaluating PFAS uptake to aquatic organisms has focused on these two compounds.
5.5.1 Bioconcentration
Table 5-1 presents BCFs that are available for aquatic organisms for PFOA, PFDA, PFUnA, PFDoA, PFTA, PFOS, and PFHxS. Information addressing the mechanism of bioconcentration is presented in a study conducted by Martin et
al. (2003), who exposed rainbow trout to relatively pure concentrations of each individual compound for 12 days. This study is very informative because it showed that the uptake of PFAS compounds is directly
proportional to the length of the carbon chain and inversely proportional to the critical micelle concentration
(CMC) (the level at which one half of the molecules are associated as micelles). They also showed that PFAS
accumulated to the greatest extent in the blood, followed by the kidney, liver, and gall bladder, with lower levels accumulating in the gonads, followed by adipose tissue and muscle tissue. This tissue-dependent distribution is
apparently due to PFAS having a high affinity for serum albumin and fatty acid binding proteins.
111

Carboxylates and sulfonates with perfluoroalkyl chain lengths shorter than seven and six carbons, respectively,
could not be detected in most tissues and were considered to have insignificant BCFs. Martin et al. (2003) also showed that sulfonates had greater BCFs, half-lives, and rates of uptake than the corresponding carboxylate of
equal chain length, indicating that hydrophobicity, as predicted by the CMC, is not the only determinant of PFAS
bioaccumulation potential and that the functional group must be considered. PFOA had the lowest BCF, which is
similar to its behavior in the field, having been reported to be relatively inefficient in accumulating in aquatic
organisms. Others have also shown that shorter chain PFCAs and PFSAs (less than eight and six carbons,
respectively) are not readily bioconcentrated or accumulated (Conder et al.
2008; Martin et al. 2013; Houde et al. 2011).
5.5.2 Bioaccumulation
PFAS have accumulated in a variety of wildlife, generally fish-eating species, across the globe. The large amount of literature and inventories of wildlife samples containing PFAS residues attests to the widespread distribution of
these compounds due to multiple global sources, with the majority of sampling being conducted to support
hypotheses on long-range fate and transport, temporal trends, and industrial sources. Interestingly, most work
has been done in the Northern Hemisphere and some authors have opined that levels are lower in the Southern Hemisphere. One study in Australia, however, found among the highest PFOS concentrations reported
worldwide in the livers of dolphins in heavily industrialized regions of South Australia (Gaylard 2017). The study
indicates that the population was the highest it has been in the last 30 years, suggesting PFAS is not adversely
affecting this population.
Many authors will use the terms “bioconcentration” and “bioaccumulation” interchangeably, which is incorrect.
Bioaccumulation can be measured in both the laboratory and the field, although the latter is the preferred
method, as this has more relevance to the real world, including useful data to apply to the protection of public
health (for example, recreational fish consumption). It is also important to state that accumulation should be reported out as a whole-body value, because reporting BCF/BAF according to tissues (blood, liver, kidney) will
overestimate the values.
Mechanistically, bioaccumulation in aquatic organisms is not that different from bioconcentration because diet does not play as big a role in uptake of PFAS as uptake from the water column (Giesy et al. 2010). The
classical paradigm for organic pollutants, known as the “target lipid model,” allows for an accurate prediction of
toxicants (PAHs, PCBs, chlorinated pesticides) in aquatic organisms by simply knowing the water/octanol
coefficient (Kow) of the compound. The uniqueness of PFAS colligative properties means this model does not work
and there is still a lot of uncertainty surrounding the mechanism
of bioaccumulation.
A comparative study by Conder et al. (2008), addressing the differences in bioaccumulation between
perfluorocarboxylates, perfluorosulfonates, and legacy compounds, provides key insights into the understanding
of the disposition of PFAS in aquatic organisms.
• Bioconcentration and bioaccumulation of perfluorinated acids are directly related to the length of each
compound’s fluorinated carbon chain.
• Fluorinated sulfonates are more bioaccumulative than carboxylates of the same carbon chain length.
• Fluorinated carboxylates with seven carbons or fewer (perfluorooctanoate and shorter PFCAs) are not considered bioaccumulative according to promulgated persistent, bioaccumulative, and toxic (PBT) criteria of 1,000–5,000 L/kg.
• PFCAs with seven fluorinated carbons or fewer have low biomagnification potential in food webs.
• More research is necessary to characterize the bioaccumulation potential of carboxylates with longer
fluorinated carbon chains (> 7 fluorinated carbons), as carboxylates with longer carbon chains may exhibit partitioning behavior similar to or greater than PFOS.
112

Table 5-1, which presents some BAFs tabulated from a selection of journal/review articles, validates some of
these insights. For example, in comparing BAFs for PFOA with PFOS across all species, it is clear that the BAFs for PFOA are about two orders of magnitude lower than PFOS. Comprehensive reviews (Ahrens and Bundshuh 2014;
Houde et al. 2008) indicate that PFOS (8 carbon chain) is typically the dominant PFAS in animals. They also show
that in invertebrates, PFOA and PFOS have similar concentrations (~1–10 ug/kg) and that tissue levels generally increase in concentration with an increase in trophic position of the food chain. Ahrens and Bundshuh (2014)
opine that the lower bioaccumulation potential of PFOA may be driven by the shorter (7 carbon) perfluorocarbon
chain than seen in PFOS (8 carbon chain). In any event, it is apparent that, like other persistent compounds, bioaccumulation may take the shape of an inverted U-shaped curve; that is, accumulation is limited on one end
by shorter chain compounds (≤ 7 carbons) and on the other end of the curve by molecular size (for example, ≥ 13
fluorinated carbons).
Finally, it is important to note that PFAS precursors may contribute to the PFAS body burden. Atmospheric
measurements have shown the widespread occurrence of PFAS precursors like FTOHs and perfluorinated sulfonamide alcohols. The concept is that, once absorbed by an organism, the precursor(s) would be metabolized
to PFOA (for example, from 8:2 fluorotelomer alcohol) or to PFOS (for example, from N-ethyl perfluorooctane
sulfonamidoethanol) (Gebbink, Berger, and Cousins 2015; Galatius et al. 2013). Additional research on how PFAS precursor may contribute to the body burden of fish and wildlife will be needed to determine the overall dynamics
involved with the bioaccumulation process.
5.5.3 Biomagnification
Studies of PFAS in the Great Lakes and marine/arctic ecosystems have generally shown that there can be
trophic level biomagnification within a food web, particularly for PFOS and some long-chain PFCAs (Martin et al. 2004; Houde et al. 2006; Houde et al. 2011; Butt et al. 2010; Tomy et al. 2004; 2009). Because the BMF is the
concentration in a predator divided by the concentration in its prey, calculated BMFs are highly variable
depending on what types of tissues were analyzed and what assumptions the researcher made in defining biomagnification relative to the animals’ prey diet (often determined through analysis of stomach contents). Some
authors adjust BMFs according to enrichment based on stable isotopes of carbon and nitrogen, which are termed
“trophic magnification factors” (TMFs). TMFs are believed to be a more objective metric in terms of
biomagnfication between different trophic levels.
Table 5-1 (provided as a separate Excel file) presents BMFs and TMFs calculated for a number of different PFAS
compounds. Most of the values in this table are cited from a review by Franklin (2016), who analyzed the results of 24 peer-reviewed studies reporting field-derived BMFs or TMFs for 14 PFAS (with BMF values ranging over several
orders of magnitude from <<1.0 to >>1.0). Franklin (2016) made the case that “in practice, the study-to-study (and
even within-study) variability of the results is so great that they are of very restricted usefulness for assessing
bioaccumulation potential status.” He attributes this variability to several factors, including differing ways in which the metrics are expressed (for example, individual tissue analyses versus whole body), nonachievement of the
assumed steady-state conditions, uncertainties in feeding ecology, and the metabolism of precursor compounds.
Some of the references cited in Franklin (2016) are discussed below.
Martin et al. (2010) estimated BMFs for a pelagic food web in Lake Ontario, with the lake trout as the top predator.
They were able to show, after adjusting for benthic versus pelagic organisms, that some PFAS compounds biomagnify, with TMFs ranging from 0.51 for FOSA to 5.88 for PFOS. Contrary to other freshwater studies,
Lescord et al. (2015) showed that trophic position did not correlate with the degree of biomagnification. These
authors observed negative relationships between PFAS and stable nitrogen isotope ratios (δ15N) in three out of six lakes, suggesting no biomagnification of PFAS through freshwater arctic food webs. Overall, their results
suggested that a taxon’s horizontal but not vertical position in the food web affects its PFAS concentrations.
113

A study by Houde et al. (2006) looked at PFOS and C8–C14 perfluorinated carboxylates in the bottlenose dolphin
at two marine sites (Sarasota Bay, FL, and Charleston, SC). Based on estimated TMFs, those authors concluded that PFOS and C8–C11 PFCAs biomagnified in this marine food web (Table 5-1, also cited by (Franklin 2016)).
Interestingly, for PFCAs, PFOA had the highest TMF, with values progressively decreasing as chain length
increased. Conder et al. (2008) reported similar results for perfluorinated acids, with BMF values ranging from 0.1
to 20 (geometric mean of 2). They concluded and Lescord et al. (2015) affirmed that PFCAs with less than seven
carbons, and PFSAs with less than six carbons, do not biomagnify and that the bioaccumulation of PFCAs can be
directly related to fluorinated carbon chain length (just as the bioaccumulation of persistent lipophilic compounds
can be related to hydrophobicity). Conder et al. (2008) also noted that the biomagnification of PFCAs in aquatic food webs is lower than that of most persistent lipophilic compounds, with PFOS being the only perfluorinated acid
consistently exhibiting the potential for biomagnification. Finally, Butt et al. (2008) observed biomagnification factors
for PFAS in “ringed seal–polar bear” food webs of the Canadian Arctic. Biomagnification factors were greater than one for C8–C14 PFCAs, as well as for PFOS and PFOSA. Like Houde et al. (2006), they observed a decrease in
BMF as the carbon chain number increased.
114

5.6 PFAS Uptake into Plants
Because PFAS contain a hydrophilic functional group, plants can be expected to take some of these compounds
up through their root systems, after which they would be translocated to stems, shoots, leaves, and fruiting bodies.
Plants growing closer to contaminated sources or irrigated with PFAS-containing water would be expected to accumulate higher concentrations of PFAS compared to plants more distant from the PFAS source (Gobelius,
Lewis, and Ahrens 2017), subject to site-specific conditions such as soil properties. It has already been
documented that the land application of biosolids may contaminate soil with PFAS and that animals fed silage from land-applied fields can have elevated concentrations of PFAS in their tissues (Lindstrom et al. 2011; Skutlarek,
Exner, and Farber 2006). This also raises concerns about contamination of wildlife consuming plants from
agricultural areas. Airborne PFAS emissions from industrial sites in China were found to impact the concentration of PFAS in bark and tree leaves, with the theory that bioconcentration in the latter may occur through the stomata
(Shan et al. 2014).
Understanding uptake of PFAS into plants is critical in evaluating the fate of PFAS among various environmental compartments, particularly along the food chains with implications for human and ecological exposures to PFAS.
Human exposure may occur via consumption of PFAS-impacted produce and dairy and meat products from animals fed with PFAS- impacted plant-based feed. Potential wildlife exposure to PFAS may occur via PFAS taken
up in plants at impacted sites and releases.
The following sections provide an overview of PFAS uptake pathways and mechanisms in plants and bioconcentration/bioaccumulation
5.6.1 Uptake Pathways
Wang et al. (2020) provides an extensive review of uptake and accumulation of PFAS in plants. That study forms
the basis of the overview provided in this section. As described in Wang et al. (2020), uptake of PFAS has been
well documented in different native and planted species to varying degrees. The majority of these studies have focused on PFOA and/or PFOS uptake by agricultural crops, although there are many other PFAS that have
been shown to be subject to plant uptake. Wang et al. (2020) also reported that while most published studies
were conducted under controlled lab conditions, at least 16 field studies were identified. These field studies
typically have focused on point sources of PFAS, including manufacturing sites, fire training areas, wastewater treatment plants, or landfills.
PFAS may be introduced to plants from soil, water, or air by:
• irrigation with impacted water
• land application of biosolids
• leachates from landfills
• impacts or releases at PFAS sites
• emissions and atmospheric deposition
115

Plant uptake is both PFAS- and soil-specific. PFAS with higher aqueous solubilities/diffusivities with less soil/air-
water interface (AWI) retention affinity are often observed with greater uptake potential (bioavailability). For
example, Wang et al. (2020) compiled bioconcentration factors (BCFs) for different PFAS that had been reported
in literature studies; the bioconcentration factor is the ratio of the PFAS concentration in the plant tissue to the
concentration in the soil. This compilation showed the median BCF values for PFBA and other short-chain PFAS were generally more than an order of magnitude greater than the values for long-chain PFAS like PFOA and
PFOS. These patterns confirm that the physical- chemical properties of PFAS influence the extent of plant uptake.
Likewise, physical-chemical soil properties (for example, organic matter content and composition, pH, salinity,
temperature) affect plant uptake of PFAS, although this has not been comprehensively studied. Also, plant
species and physiology (for example, transpiration rate and protein content) are important factors as discussed
below.
PFAS accumulation in plants occurs primarily via root uptake from soil and water (Stahl et al. 2009; Lee et al. 2014; Wen et al. 2013; Zhang et al. 2019). Aerial uptake of PFAS from the ambient environment (vapor-phase
and particle-bound) have also been reported, such as into leaves and bark (Stahl et al. 2014; Jin et al. 2018; Tian et al. 2018; Liu et al. 2019). However, aerial uptake contributes minimally to overall PFAS accumulation in plants
(Wang et al. 2020).
As noted above, availability of PFAS in soil porewater for root uptake is largely dependent on the aqueous solubility of specific PFAS (see Section 4) and controlled by interactions with the soil phases and the AWI (see
Section 5.2.3 ). PFAS in soil porewater migrates toward plant roots by transpiration and diffusion resulting from a
local concentration gradient (Lechner and Knapp 2011). Recent studies by Zhang et al. (2019) and Wen et al.
(2013) indicate a concentration-dependent process in root uptake that is mediated by transport proteins in cell membranes such as aquaporins and anion channels. PFAS enter the vascular tissue after passing through the
root epidermis, cortex, and endodermis via apoplastic and symplastic pathways (Blaine et al. 2013).
Once in the root xylem, PFAS are translocated to different parts of a plant, such as stem, shoots, leaves, fruits,
and grains. The degree of PFAS translocation in these tissues appears to depend on the transpiration stream,
with more PFAS accumulation occurring in parts with greater capacity for sorption or incorporation and receiving greater amounts of water (Krippner et al. 2015; Lechner and Knapp 2011; Gobelius, Lewis, and Ahrens 2017;
Stahl et al. 2009). For example, in carrots, cucumbers, and potatoes grown in soil mixed with PFAS-contaminated
sewage sludge, Lechner and Knapp (2011) found less PFOA and PFOS accumulation in peeled edible parts than in foliage, leaves and stalks., Stahl et al. (2009) found much higher PFOA and PFOS in grains than in straw of
spring wheat, oat, and maize. In trees, Gobelius, Lewis, and Ahrens (2017) evaluated the distribution of PFAS at
an AFFF release site and reported that total PFAS accumulation followed leaves > twigs > trunk/core or roots in
birch and spruce.
5.6.2 Bioconcentration/Bioaccumulation
Table 5-2 (provided as a separate Excel file) contains BCF and BAF values for 14 different PFAS for a variety of
plant species. In the cited plant uptake studies, BCF and BAF are defined as PFAS concentration in
plant(mass/mass) divided by PFAS concentration in soil (mass/mass) and are used interchangeably. This differs
from the definition of BCF and BAF for animals in Section 5.5. A number of BAF values were obtained from studies
in which PFAS was introduced to crops through irrigation water or biosolids-amended soils (Blaine et al. 2013; Blaine, Rich, Sedlacko, Hundal, et al. 2014; Blaine, Rich, Sedlacko, Hyland, et al. 2014). The materials harvested
for analysis included both inedible (for example, plant leaves) and edible portions of crops (fruit, lettuce leaves,
and roots). Other BCFs and BAFs were obtained from investigations of plants exposed to PFAS from soil, groundwater, surface water, or air in close proximity to PFAS release sites (Mudumbi et al. 2014; Zhang et al.
2015; Gobelius, Lewis, and Ahrens 2017).
116

In general, it can be observed that 1) the shorter chain (more water soluble) PFAS are taken up more readily than
the longer chain homologues, and 2) the majority of the plant BCFs and BAFs fall between a range of 0.1 and 10. A BCF or BAF of 1.0 indicates no net accumulation of PFAS from soil to plant. Such a BCF or BAF indicates that the
soils and the plant of interest have the same concentration of PFAS per unit weight. This, however, does not
indicate that an equilibrium condition exists between soils and plants. Some plants, like lettuce, contain a large percentage of water, which may help to explain the relatively high BAF of 56.8 observed by Blaine et al. (2013). In
the controlled studies of edible crops, short-chain PFCAs and PFSAs exhibited greater BAFs compared to long-
chain compounds.
Blaine et al. (2013) studied the uptake of PFAAs by greenhouse lettuce and tomato grown in soils prepared to
mimic an industrially impacted biosolids-amended soil, a municipal biosolids-amended soil, and a control soil (but
incorporated contaminated biosolids equivalent to 10 times higher than the agronomic rates allowed for Class B biosolids), a municipal biodolids-amended soil, and a control soil. BCFs for many PFAAs were well above unity, with
PFBA having the highest BCF in lettuce (56.8) and PFPeA the highest in tomato (17.1) in the industrially impacted
biosolids-amended soil. BAFs for PFCAs and PFSAs were, in general, slightly higher in the industrially impacted
soil than in the municipal soil (∼0.3−0.8 log units). The BCFs for PFAAs in greenhouse lettuce decreased
approximately 0.3 log units per -CF2 group (one carbon, two fluorine groups in a molecule). They also conducted a
limited field study, in which they measured PFAA levels in lettuce and tomato grown in field soil amended with
only a single application of biosolids (at the agronomic rate for nitrogen). The PFAA levels were predominantly below the limit of quantitation (LOQ). In addition, corn stover, corn grains, and soil were collected from several full-
scale biosolids-amended farm fields. At these fields, all PFAAs were below the LOQ in the corn grains and only
trace amounts of PFBA and PFPeA were detected in the corn stover. The Blaine et al. (2013) study confirms that the bioconcentration of PFAAs from biosolids-amended soils depends strongly on PFAA concentrations, soil
properties, type of crop, and analyte. BCFs developed in Blaine et al. (2013) can be seen in Table 5-2.
Gobelius, Lewis, and Ahrens (2017) studied the uptake of 26 PFAS in plants (trees) at an AFFF (fire training) site
with contaminated soil and groundwater. Samples from groundwater and different plant species (birch, spruce, cherry, ash, elder, beechfern, and wild strawberry) and tissues (that is, roots, trunk/cores, twigs, leaves/needles)
were collected. Foliage had the highest BCFs of all tissues, ranging from 0 to 14,000 and accumulated the highest
number ofPFAS (8 out of 26), with birch sap showing BCF values up to 41 for 6:2 FTSA. The highest mean BCFs were found for 6:2 FTSA (472; n = 52), PFOS (28; n = 36), PFHxS (10; n = 42), and PFOA (5; n = 24), which might
correspond to the AFFF composition used at the site.
For PFOA, the mean BCFs (±s.d.) were 18 ± 15 for spruce, followed by birch (1.2 ± 1.5) and cherry (0.25 ± 0.043).
The authors concluded that PFAS were detected in all plant species, and the distribution followed the order of “shoots to roots”—that is, leaves > twigs/stems > trunk > roots. They cited other authors who have shown that
“this order has proven applicable to all samples and species.” Hence, PFAS tend to accumulate in the vegetative
portions rather than in the plant storage tissues.
Updated May 2021.
117

6 Media-Specific Occurrence
The long period of time during which PFAS have been produced and the many sources of PFAS release to the environment have resulted in low-level contamination of most environmental media worldwide. The concentrations
of these human- caused ambient or “background” concentrations may vary widely, based on proximity to industrial
areas, patterns of air and water dispersion, and many other factors. As a result, any claims regarding “universal” values for background levels of PFAS should be viewed skeptically. This section provides a relative understanding
of PFAS concentrations in various environmental media but does not represent an exhaustive literature review.
Note that media-specific occurrences of PFAS are constantly being added in the literature and on state, federal, and other countries’ PFAS websites.
The following sections include figures summarizing the observed concentrations of PFAS that have been
reported in the literature. Important details concerning each study used in developing the figures are included in the tables in Section 17.1. As discussed under PFAS Releases to the Environment (Section 2.6), the presence
of PFAS in environmental media and ecological receptors has been traced to air emissions; direct discharges to
soil, groundwater, and surface water; and leakage from landfills. Sections on Phase Partitioning (Section 5.2) and Media-Specific Migration Processes (Section 5.3) illustrate that PFAS occurrence in the air, aqueous, and solid
phases is highly interrelated. Subsequent sections on Human Health Effects (Section 7.1) and Ecological
Toxicology (Section 7.2) suggest that PFAS risks to human health may result from exposure via drinking water,
groundwater, soils, food, and other media types. Further, ecological impacts are observed on a global scale. This suggests that a complete assessment of PFAS sources and exposure risks, including fate and transport
processes that may drive future exposure concerns, requires understanding of PFAS occurrence across
multiple phases. This section focuses on occurrence in air, soil and sediment, groundwater, surface water, and biota.
PFAS occurrence in several media types is an active area of research. As discussed in Section 11, sampling and
analytical methods are still being optimized and standardized; thus, it is difficult to compare results between
studies and conclusions may change over time. PFAS concentrations presented below for different media often
indicate maximum values; mean or median values are often well below the maximum values reported for
different studies. The processes that influence media- specific PFAS concentrations are illustrated in CSMs
shown in Figure 2-18, Figure 2-19 and Figure 2-20.
Section Number Topic
6.1 Air
6.2 Soil and Sediment
6.3 Groundwater
6.4 Surface Water
6.5 Biota
118

6.1 Air
Certain PFAS are found in ambient air, with elevated concentrations observed or expected in urban areas nearest to major emission sources described in Section 2.6, such as industrial facilities that produce PFAS or use
PFAS chemicals or products in manufacturing; areas where Class B firefighting foams containing fluorine are
used or released; waste management facilities, including landfills and wastewater treatment plants; and areas of biosolids production and application (Barton et al. 2006; Ahrens et al. 2011; Liu et al. 2015). Reported
concentrations for ionic species such as PFOA and PFOS typically fall within a range of about 1–20 pg/m3
(picograms/cubic meter), although concentrations of PFOA as high as 900,000 pg/m3 have been observed near large manufacturing facilities, including in Parkersburg, West Virginia (Barton (Barton et al. 2006).
Concentrations of volatile PFAS such as FTOHs can be in the hundreds of pg/m3 in outdoor air (Figure 6-1A and
Table 17-1A). PFAS have also been observed in indoor air and dust in homes, offices, and other indoor
environments (Figure 6-1B and Table 17-1B). Indoor air concentrations of certain PFAS can be higher than
outdoor air concentrations due to the presence of indoor sources (Fromme et al. 2015; Fraser et al. 2012; Goosey and Harrad 2012; Shoeib et al. 2011; Kaiser et al. 2010; Langer, Dreyer, and Ebinghaus 2010; Strynar
and Lindstrom 2008; Shoeib et al. 2004). Examples of indoor sources of potential PFAS exposure include
stain- and water-resistant coatings used on a number of consumer products, such as carpets, upholstery, clothing, grease-resistant paper, food packaging, and nonstick cookware and ingredients in cleaning products,
personal care products, cosmetics, paints, varnishes, and sealants (ATSDR 2019; Liu et al. 2015; Liu et al. 2014)
(Gewurtz et al. 2009; Guo et al. 2009). PFAS concentrations in indoor air have been reported in the range of about 1–440 pg/m3 for PFOA and PFOS. Concentrations of volatile PFAS such as FTOHs have been reported on
the order of 10,000–50,000 pg/m3 in schools, homes, and offices. Concentrations of FTOHs have been observed
in excess of 300,000 pg/m3 inside commercial buildings (Fromme et al. 2010).
As discussed in Section 5.3.2, short-range atmospheric transport and deposition may result in PFAS contamination in terrestrial and aquatic systems near points of significant emissions, contaminating soil,
groundwater, and other media of concern (Davis et al. 2007), as well as several miles from industrial emission sources (Shin et al. 2011; Post, Cohn, and Cooper 2012) (NYS DOH 2016; NH DES 2017; VT DEC 2016).
Releases of ionic PFAS from factories are likely tied to particulate matter (Barton et al. 2006), which settle to the
ground in dry weather and are also wet-scavenged by precipitation as discussed in Section 5.3.2. Models indicate that deposition depends on amount of PFAS emissions, local topography, particle size, weather
patterns, and release characteristics such as smokestack height, effluent flow rate, and effluent temperature.
In addition to short-range transport and deposition, long-range transport processes are responsible for a wide
distribution of PFAS across the earth, as evidenced by their occurrence in biota and environmental media in
remote regions as far as the Arctic and Antarctic. Long-range transport processes and effects are similar to
atmospheric transport of other recalcitrant contaminants.
119

Figure 6-1A. Observed PFAS concentrations in outdoor air.
Figure 6-1B. Observed PFAS concentrations in indoor air.
120

6.2 Soil and Sediment
PFAS are found in soil and sediment due to atmospheric deposition, exposure to impacted media (for example, landfill leachate or biosolids), and direct discharge. Soil and sediment may act as secondary sources of PFAS via
leaching to groundwater and runoff to surface water through leaching and percolation processes, respectively.
PFAS distribution in soil is complex, reflecting several site-specific factors such as total organic carbon (TOC),
particle surface charges, and phase interfaces (Section 5.2.3). Properties of individual PFAS, such as alkyl chain length and ionic functional group, are also important factors. PFOS, PFOA, and other long-chain PFCAs are
typically the predominant PFAS identified in surface soils and sediments (Zhu et al. 2019; Rankin et al. 2016; Strynar
et al. 2012).
Atmospheric transport and deposition of PFAS occur on regional and global scales. PFAA concentrations in soil
have been observed across a wide range of locations, which suggests that detection of a PFAA in soil does not
always imply a local source (Table 17-2 and Section 5.3.2).
Other environmental sources of PFAS to soil include direct application (for example, AFFF and industrial discharge)
or soil amendment with PFAS-affected media, such as biosolids (Figure 6-2 and Table 17-2). Individual PFAS
concentrations may be above 1,000 μg/kg at AFFF sites. In comparison to AFFF sites, published data on soil PFAS
concentrations in industrial settings are limited (Table 17-2). PFAS soil concentrations at industrial sites may be
highly variable, depending on the nature of PFAS release and proximity to the source. Concentrations at sites with applied biosolids or sludge will vary depending upon application rates, frequency, duration, and
concentration of PFAS in the applied material.
PFAS discharge to surface waters has also affected sediments. Detected concentrations for surface sediments
in lakes and rivers reported in the literature generally range up to approximately 100 μg/kg, and concentrations
and relative distributions of PFAS are variable depending upon types of sources and distance from point sources (Table 17-2). At least one study showed that PFAS concentrations correlate to parameters such as
TOC, nitrogen, and phosphorus in sediment (Qi et al.2016). Dated sediment cores have been used to evaluate
deposition of lead, mercury, and other contaminants through time. A recent study of Great Lakes cores (Codling et al. 2018) suggested that the same techniques will also be applicable to PFAS deposition trends. Reported
values for ∑PFAS in cores ranged from nondetect to 46.6 μg/kg, and concentrations typically increase with time in
the cores. Sediment core analysis may be effective for estimating deposition rates only for a subset of PFAS.
Long-chain PFAS exhibit greater sorption to sediment, with concentration at a given depth interval representing deposition during that time period. Short-chain PFAAs showed less sorption and were more mobile in the sediment
column, and therefore were not effective indicators of PFAS deposition rates. This suggests that as more short-
chain PFAS are used as replacements for PFAS applications, sediment cores will have less utility for evaluating
trends in deposition rates.
121

Figure 6-2. Observed PFAS concentrations in soils and sediment.
122

6.3 Groundwater
USEPA has assembled an extensive data set of the occurrence of six PFAAs in public drinking water. This data set is the result of required monitoring of approximately 4,900 public water systems (all large systems serving
more than 10,000 people, plus a subset of smaller systems) for six PFAAs in finished drinking water at points of
entry to the drinking water distribution system. The study was conducted between 2013 and 2015 under the third Unregulated Contaminant Monitoring Rule (UCMR3) and included the results from treated water that originated
from groundwater wells (n = 22,624), surface water (n = 12,733), and mixed sources (n = 792) (USEPA 2017). A
summary of the UCMR3 occurrence data, including analytical reports, is included in Section 8.2.2.2. One or more PFAAs were detected in 4% of the reporting public water systems (USEPA 2017); however, groundwater sources
had approximately double the detection rate of surface water sources (Hu et al. 2016). In addition, 59 out of
4,905 public water systems (PWSs) reported PFOA and PFOS at concentrations that exceed the USEPA health advisory of 0.07 μg/L (ATSDR 2018); these systems represent 1.3% of all of the PWSs that monitored under
UCMR3. Detections were geographically widespread but showed quantifiable associations with suspected sources,
including industrial sites, military fire training areas, AFFF-certified airports, and wastewater treatment facilities (Hu
et al. 2016). Individual states are collecting information on PFAS occurrence in smaller public water supplies such as schools and mobile home parks that do not meet the threshold to comply with the Unregulated Contaminant
Monitoring Rule, so were not sampled during UCMR3, and for which data are often publicly available, for example,
in New Hampshire at NH DES (2020).
Groundwater occurrence data collected as part of domestic and international studies have also characterized
the range of PFAS concentrations associated with AFFF release sites, industrial facilities, and landfills; examples
of these study results are provided in Figure 6-3 and Table 17-3.
Figure 6-3. Observed PFAS concentrations in groundwater.
123

6.4 Surface Water
Freshwater, marine water, and stormwater PFAS concentrations usually depend on proximity to the point of
release and source concentrations. In addition to releases associated with identified sources, stormwater runoff
from nonpoint sources may contribute significant loads of PFAS to surface water (Wilkinson et al. 2017; Zushi and
Masunaga 2009). The sorption of PFAS to suspended solids may affect surface water PFAS concentrations.
Suspended microplastics may also influence PFAS in surface water (Llorca et al. 2018). Figure 6-4 and Table 17-4
present examples of observed PFOS and PFOA surface water concentrations, organized by source type. In addition to PFOS and PFOA, many other PFAS have been observed in surface waters, including compounds other
than PFAAs. For example, a recent study found perfluoro-2-propoxypropanoic acid (PFPrOPrA also known as the
GenX chemical HFPO-DA) in untreated water drawn from the Cape Fear River in North Carolina at concentrations up to 560 ng/L, and GenX was just one of many non-alkyl acid PFAS identified (Sun et al. 2016). Surface water
occurrence is also an important source of drinking water supply impacts (USEPA 2018; Post et al. 2013).
Figure 6-4. Observed PFAS concentrations in surface water.
124

6.5 Biota
Because PFAS are distributed globally and have a propensity to bioconcentrate, they have been found to be ubiquitous in fish, wildlife, and humans. PFAAs, particularly PFOS, are typically the dominant PFAS detected in
biota (Houde et al. 2011). PFAA concentrations in biota are influenced by uptake and elimination of both PFAAs and their precursors, as well as biotransformation rates of PFAA precursors (Asher et al. 2012; Gebbink,
Bignert, and Berger 2016). Therefore, concentrations of PFAAs observed in biota at one location may not
reflect concentrations in other environmental media.
6.5.1 Plants
Studies show evidence of uptake and accumulation of PFAAs by plants in several settings and applications,
including both controlled experiments and field investigations. Concerns about introducing PFAAs into livestock
or crops have led to investigations of uptake and accumulation in plants (Section 5.6). Uptake mechanisms and
the extent to which native plant species remove and accumulate PFAS have not been as well studied. PFAS may be introduced to plants from soil, water, or air by:
• irrigation water
• the application of biosolids or sludge-amended soils
• soil and groundwater at PFAS sites or near releases of PFAS
• exposure through contact with rainwater and atmospheric deposition
Studies demonstrating plant uptake of PFAAs have focused on irrigated crops (Stahl et al. 2009; Scher et al.
2018), crops in biosolids-amended soil (Yoo et al. 2011; Blaine et al. 2013; Blaine, Rich, Sedlacko, Hundal, et al. 2014), and aquatic plants in constructed wetlands (Chen, Lo, and Lee 2012). Other investigations have focused
on flora exposed to PFAAs in the natural environment (Zhang et al. 2015) or near known PFAS sources (Shan
et al. 2014). Based on bioconcentration factors discussed in Section 5.6, concentrations in plants will generally reflect the same concentrations in soil and, for trees with deep roots, groundwater (Gobelius, Lewis, and
Ahrens 2017).
6.5.2 Invertebrates
Invertebrates act as the main component of the food web base and play a key role in the dynamics of
biomagnification. Aquatic invertebrates can reside in the water column, as well as on (or in) the sediment
substrate. In higher trophic level organisms, PFOS has been documented as the dominant PFAS, with concentrations increasing up the food chain, while PFOA has a lower bioaccumulation potential with similar
concentrations among species of different trophic level animals (Houde et al. 2011; Conder et al. 2008). In
invertebrates, both PFOS and PFOA have maximum values within similar ranges (Ahrens and Bundshuh 2014).
Studies present a PFAS range of approximately 0.1–10 mg/kg in invertebrate tissue, although their sources predominantly address marine organisms (Houde et al. 2011). Similar levels of PFOS have been found in
freshwater invertebrates (< 2–4.3 mg/kg) with a BCF (biota/water) estimated at 1,000 L/kg (Kannan et al. 2005).
Concentrations of PFOS, PFCAs, and heptadecafluorooctane sulfonamide (PFOSA) have been observed in Lake
Ontario invertebrates, ranging from < 0.5 to 280 mg/kg (Martin et al. 2004). The PFAS concentrations in invertebrates were greater than in fish from this lake.
In soil invertebrates, current research indicates that bioaccumulation potential of PFOS is low, as is
biomagnification (increasing concentrations in predators over their prey) from lower to higher trophic level
organisms (CEPA 2017). In biosolids-amended soils, the mean PFAS BAFs in earthworms have been found to range from 2.2 (PFOA) to 198 (PFDoA) g dry weight (dw) soil/g dw worm (Navarro et al. 2016). Maximum BAFs in
earthworms for all PFAS types have been observed at <45 g dw soil/g dw worm for biosolids-amended soils and
<140 g dw soil/g dw worm for soils contaminated with AFFF (Rich et al. 2015). 125

6.5.3 Fish
Accumulation of PFAS in fish is well documented, particularly for PFOS, longer chained PFCAs (with eight or more
carbons), and perfluorodecane sulfonate (PFDS) (Houde et al. 2011; Martin et al. 2013; Conder et al. 2008). PFOS generally has the highest concentrations in fish due to the historically high use of this chemical and its
bioaccumulation potential (Houde et al. 2011). PFDS, long-chain PFCAs, and other PFAS have also been
measured in fish (Houde et al. 2011; Fakouri Baygi et al.2016).
In fish, PFOS tends to partition to tissues of high protein density, including the liver, blood serum, and kidney (Falk et
al.2015; Ng and Hungerbühler 2013). This distribution pattern is contrary to other persistent chemicals, which tend
to partition to adipose tissue. Concentrations of PFOS and other PFAAs tend to be higher in whole fish samples
compared with fillets given that a major fraction of PFAAs is found in the carcasses of fish rather than fillets (Fliedner et al. 2018). PFAA concentrations sometimes increase with fish size; however, the relationship with fish
size is not consistent as observed for other contaminants such as mercury (Babut et al. 2017; Gewurtz et al.
2014).
Fish data for PFOS collected near known sources (for example, AFFF sites) from some key studies are summarized in Figure 6-5 and Table 17-5.
126

6.5.4 Vertebrates
Observed PFAS concentrations in fish.
Most research addressing PFAS concentrations in vertebrates focuses on temporal trends in animals at the top of
the food chain, such as piscivorous birds (for example, seagulls) and mammals (for example, dolphins, seals).
The concentrations are often reported in protein-rich organs known to concentrate PFAS. For example, to evaluate temporal trends between 2002 and 2014, levels of PFAS were measured in liver samples of Indo-Pacific
humpback dolphins and finless porpoises (136–15,300 and 30.5–2,720 ng/g dw, respectively) (Gui et al. 2019).
Livers of Beluga whales in the Artic were the only organ sampled to better understand the relative bioaccumulation of persistent organic compounds (Reiner et al. 2011).
These data using top marine predators as “sentinels” of PFAS are important in terms of assessing whether
concentration trends are increasing or decreasing in the global environment.
Updated September 2020.
127

7 Human and Ecological Health Effects of Select PFAS The PFAS Team developed a training module video with content related to this section, it is the Human and
Ecological Effects video.
This section discusses both the information related to assessing health effects of PFAS in humans (Section 7.1)
and the adverse effects on ecological (nonhuman) species (Section 7.2). Section 7.1 provides information on
human biomonitoring and exposure, toxicokinetics, toxicology in mammalian species, and human epidemiology for
long-chain and short-chain PFAAs and the fluorinated ether carboxylates (FECAs) commonly known as the GenX chemical HFPO-DA and ADONA. The section is supplemented by additional material on each of these topics,
which is included as Section 17.2. Section 7.2 is organized to include ecological toxicology information on
invertebrates (aquatic, benthic, terrestrial), vertebrates (fish, birds, reptiles, amphibians, mammals), and plants. PFAS ecotoxicology data summary tables have been developed as separate Excel spreadsheets.
For further information on the scientific names and carbon chain length of PFAAs addressed in these sections, see
Section 2.2 of this document. Use of the human health effects information in guidance values is discussed in
Section 8.3 and in site risk assessment in Section 9.1.
Section Number Topic
7.1 Human Health Effects
7.2 Ecological Toxicology
7.1 Human Health Effects
The PFAS discussed in this section and in Section 17.2 include perfluorocarboxylic acids (PFCAs) with 4–14
carbons and perfluorosulfonic acids (PFSAs) with four or more carbons. Also covered are two FECAs: ammonium
2,3,3,3-tetrafluoro-2- (heptafluoropropoxy)propanoate (also known as perfluoro-2-propoxypropanoic acid,
PFPrOPrA and as the GenX chemical hexafluoropropylene oxide [HFPO] dimer acid; and 4,8-dioxa-3H-perfluorononanoate, commonly known as ADONA. These FECAs are replacements for PFOA as processing aids
in certain fluoropolymer production. They are included because they are of current interest and health effects
data are available. There is little or no publicly available health effects information for most of the many other
PFAS used in commerce (Section 2.5), including precursors that can be converted to PFAAs in the environment
and in the human body.
The best studied PFAAs are PFOS and PFOA, although considerable information is available for some other
PFAS, including PFNA, PFHxS, PFBA, PFBS, and the GenX chemical HFPO-DA. Laboratory animal toxicology
studies and human epidemiological studies suggest health effects that may occur as a result of long-term
exposure to PFOA and PFOS at environmentally relevant levels. Figure 7-1 summarizes current health effects
information, the references for which are discussed in this section. The other PFAS mentioned above cause
generally similar effects in animal studies, with toxicity generally occurring at higher doses for the short-chain
PFAAs than for long-chain PFAAs. These health effects, discussed in more detail in Sections 7.1.3, and 7.1.4 are
the basis for current guidance values and regulations for PFOA, PFOS, and several other PFAS. These are available in a separate Excel file published regularly by ITRC on the fact sheets page.
128

Figure 7-1. Some health effects of PFOA and/or PFOS identified from published studies (not exhaustive).
USEPA has completed draft toxicity assessments for the GenX chemicals and PFBS (USEPA 2018; USEPA 2018),
and USEPA announced in December 2018 that five additional PFAAs (PFNA, PFBA, PFHxA, PFHxS, PFDA) will be reviewed for toxicity assessment through the Integrated Risk Information System (IRIS), but no timeline has been
established (USEPA 2019).
Much of the information presented here is recent, and new studies continue to become available. Additionally, it
should be noted that it was not possible to include all relevant citations, particularly for those compounds with
large health effects data sets. Further information on the topics in this section can be found in databases such as
the National Library of Medicine’s PubMed (a database containing citations to relevant peer-reviewed publications),
and in reviews such as Kirk (2018) and Lau (2012), and in several chapters of the Agency for Toxic Substances
and Disease Registry (ATSDR) draft toxicological profile (ATDSR 2018), DeWitt (2015), and NICNAS (2018) for PFAS in general; Australian Department of Health Expert Panel, which is a review of systematic reviews since 2013
and key national and international reports since 2015:
• PFOA: Australia Government DOH (2018); USEPA (2016); USEPA (2016) and NJDWQI (2017) NJDWQI (2017)
• PFOS: USEPA (2016); USEPA (2016c); MDH (2019), and NJDWQI (2018) • PFNA: NJDWQI (2015) • PFBS: MDH (2017) and USEPA (2018) • (draft) PFBA and PFHxS: MDH (2018);MDH
(2019) • GenX chemicals: RIVM (2016), Chemours (posted online by (NC DEQ 2018)), and (USEPA
2018) draft Short-chain • PFAAs: Buck (2015) and Danish EPA (2015) • FECAs: Buck (2015)
Human biomonitoring and sources of exposure are addressed in Section 7.1.1. Information on serum levels of
long-chain PFAAs from communities with contaminated drinking water is presented in Table 17-6. The unique
toxicokinetic properties of PFAS are discussed in Section 7.1.2. Table 17-7 summarizes available data on PFAS
elimination half-lives in humans and experimental animals. The numerous reviews of potential epidemiological associations of health endpoints with PFAAs are discussed in Section 7.1.3. Toxicology studies in mammalian
species are summarized in Section 7.1.4, and more detailed toxicology information is presented in Section 17.2.5
and Table 17-8 (provided as a separate Excel file).
Finally, data gaps and research needs are discussed in Section 7.1.5.
129

7.1.1 Human Biomonitoring and Sources of Exposure
Numerous human biomonitoring studies (such as (CDC 2018, 2019; Olsen et al. 2017)) have demonstrated that
certain PFAS, particularly long-chain PFAAs, are present in the blood serum of almost all U.S. residents. Long-chain
PFAAs, with half-lives of one to several years, are slowly excreted in humans. Therefore, serum levels are indicators of long-term exposure to long- chain PFAAs and do not fluctuate greatly with short-term variations in
exposure. Serum PFAA concentrations originate from direct exposure to the compounds and from metabolism of
precursor compounds to PFAAs within the body (reviewed in Kudo (2015)). The largest U.S. general population biomonitoring studies are from the National Health and Nutrition Examination
Survey (NHANES), a nationally representative survey conducted by the Centers for Disease Control and Prevention (CDC), which began monitoring for PFAS in 1999–2000 (Figure 7-2). As can be seen in Figure 7-2, serum PFAS
levels in the general population have declined over time, most notably for PFOS. The most recent NHANES
monitoring data (2015–2016) include seven PFAAs (PFOA, PFOS, PFNA, PFHxS, PFDA, PFUnDA, PFDoA) and one other PFAS (MeFOSAA); four additional PFAS (PFBS, PFHpA, PFOSA, EtPFOSA) that were infrequently detected in earlier
rounds of NHANES were not monitored in 2015–2016 (CDC 2019). Other adult U.S. general population
biomonitoring data come from four studies of blood donors in 2000–2015 (Olsen et al. 2017) and the California Environmental Contaminant Biomonitoring Program (CA OEHHA 2011).
Figure 7-2. Geometric mean serum concentrations (ng/ml) of selected PFAAs (NHANES, 1999-2016).
In the general population, where this is no specific source of PFAS contamination and PFAA concentrations in
drinking water and serum are in the typical “background” range, the primary sources of exposure to PFAAs and
their precursors appear to be food and food packaging, and consumer products (particularly nonpolymer aftermarket treatments and coatings; Section 2.5), and house dust formed from such consumer products (Trudel
et al. 2008; Fromme et al. 2009; Vestergren and Cousins 2009; Beesoon et al. 2012; Gebbink, Berger, and
Cousins 2015). PFAS have been detected in air (ATSDR 2021), and inhalation is therefore an additional potential exposure pathway. Serum levels of PFOS and PFOA documented by NHANES data appear to indicate that the
phaseout of production and use of these chemicals in most products has resulted in decreased PFOS and
PFOA exposures for the general population from these sources. As this occurs, the relative contribution from drinking water to these PFAAs will increase (where they are present in the drinking water).
130

In communities near sources of PFAS contamination, exposures that are higher than those in the general
population can result from ingestion of contaminated drinking water or consumption of fish from contaminated waters. As PFAS concentrations in drinking water increase, the contribution of drinking water to the total body
burden increases and typically dominates an individual’s exposure. Information on serum levels of long-chain
PFAAs from communities with contaminated drinking water in several U.S. states and other nations is found in Table 17-6. Finally, occupational exposures to workers can be higher than exposures from environmental
media.
Specific considerations and exposure routes relevant to PFAS exposures in the fetus, breast-fed and formula-fed
infants, and young children are discussed in Section 17.2. Also see Section 17.2.2 for additional discussion of human biomonitoring and sources of human exposure.
7.1.2 Toxicokinetics
PFAAs have unique toxicokinetic properties as compared to other types of persistent organic pollutants (POPs).
Unlike most other bioaccumulative organic compounds (for example, dioxins, PCBs), PFAAs do not have a high
affinity for adipose tissue (that is, fat). In contrast, PFAAs are water soluble, have an affinity for proteins, and
generally distribute primarily to the liver, blood serum, and kidney (Bischel et al. 2011; Lau 2012, 2015; Kato 2015). PFAAs, GenX chemicals, and ADONA are not metabolized (meaning they do not break down to other PFAS).
However, some PFAS that are PFAA precursors can be metabolized to PFAAs within the body. In general, short-
chain PFAS are excreted more rapidly than longer chain PFAS in humans and other mammalian species. The excretion rates for specific PFAS can vary substantially between species, and in some cases between males and
females of the same species. Table 17-7 summarizes available data on PFAS elimination half-lives in humans and
experimental animals. Half-lives in laboratory animals (rodents and nonhuman primates) generally range from hours to several months for long- chain PFAS, and hours to several days for short-chain PFAS. Human half-lives for
PFAS are longer than in other mammalian species, with estimates of several years for long-chain PFAAs and
several days to one month for shorter chain PFAAs such as PFBA, PFHxA, and PFBS. Because of the much longer
human half-lives, animal-to-human comparisons must account for the much higher internal dose (for example, blood serum level) in humans than in animals from the same administered dose.
Toxicokinetics relevant to developmental exposures to PFAAs are important because developmental effects are considered to be sensitive endpoints for toxicity of long-chain PFAAs, and some human studies have found
associations of long-chain PFAAs with decreased fetal growth. PFAAs cross the placenta (reviewed in Lau (2012)
and Kudo (2015)) and are present in breast milk (Luebker, Case, et al. 2005; White et al. 2009; Kato 2015), and long-chain PFAAs have been found in cord blood, for example, (Wang et al. 2019), and amniotic fluid (Stein et al.
2012; Zhang, Sun, et al. 2013). In human infants, exposures from breast milk result in substantial increases in
long-chain PFAA serum levels during the first months after birth (Fromme et al. 2010; Mogensen et al. 2015).
Exposures to infants from formula prepared with PFAS-contaminated water are also higher than in older individuals due to their higher rate of fluid consumption (USEPA 2011).
Toxicokinetic factors called clearance factors, which indicate bioaccumulative potential, can be used to relate external doses (mg/kg/day) of PFOA and PFOS to steady-state serum levels (ng/L). When combined with average
water ingestion rates (USEPA 2011), these factors can be used to predict that the expected average increases in
the levels of PFOA or PFOS in blood serum from long-term drinking water exposure are 100-fold or greater than the concentration in the drinking water (Bartell 2017; NJDWQI 2017; Post, Gleason, and Cooper 2017).
Finally, toxicokinetics in rodents (Loveless et al. 2006; De Silva et al. 2009) and humans (Zhang, Beesoon, et al.
2013; Gao et al. 2015; Beesoon et al. 2011) may differ among isomers of the same PFAA.
See Section 17.2.3 for additional discussion of PFAS excretion and excretion rates, toxicokinetics relative to developmental exposure, the relationship of human exposure to serum levels, and isomer-specific toxicokinetics.
131

7.1.3 Human Epidemiology Studies
The epidemiological database for long-chain PFAAs is more extensive than for many other environmental
contaminants. Based on publications available through the National Library of Medicine’s PubMed database, well over 100 human studies have examined associations (that is, statistical relationships) between PFAS, primarily
long-chain PFAAs, and a wide variety of diseases and health endpoints (NJDWQI 2018). Some effects, such as
changes in serum lipids, liver biomarkers, uric acid levels, thyroid endpoints, vaccine response, and fetal growth,
have been evaluated in multiple studies and populations, while only one or a few studies were located for many
other effects.
These studies can be categorized based on the type of population evaluated: general population, communities
with contaminated drinking water, or occupationally exposed workers. Almost all of these studies were published
within the past 10 years, with the exception of a small number of occupational studies from a few years prior to
that time.
Although discussion of individual epidemiological studies is beyond the scope of this section and the
corresponding appendix section, evidence for associations and/or causality for some PFAAs and certain health
effects (for example, increased cholesterol, increased liver enzymes, decreased vaccine response, thyroid
disease, and for PFOA, some types of cancer) has been evaluated by various academic researchers and
government agencies. The conclusions of some of these evaluations are discussed briefly below, with additional detail provided in Section 17.2.4.
For some health endpoints, there is general consensus for consistent evidence for association with one or more
long-chain PFAAs, while conclusions differ among evaluations by different groups of scientists for other endpoints.
For additional endpoints, data are too limited to make a conclusion, results are inconsistent, or there is no
evidence for an association. The general reviews cited in Section 17.2.4 include detailed discussions of
epidemiological data for PFOA, PFOS, and PFNA. In- depth reviews for other individual PFAAs (for example, PFHxS, PFDA, PFUnA) are not available.
As shown in Table 7-1, associations in human epidemiological studies of PFAAs (primarily PFOA and PFOS) for some endpoints (for example, increased liver enzymes, decreased fetal growth, decreased vaccine response)
are consistent with animal toxicology studies (Section 7.1.4). For serum lipids (for example, cholesterol),
conflicting observations (increases in humans versus decreases in rodents) may be impacted by differences in
the fat content in the diets of humans versus laboratory animals and/or large differences in the exposure levels in human versus animal studies (Tan et al. 2013; Rebholz et al. 2016).
Associations of some health endpoints with certain PFAAs are generally, although not totally, consistent, and
some evaluations have concluded that the data for certain effects support multiple criteria for causality. However,
risk-based toxicity factors (Reference Doses for noncancer effects and slope factors for cancer risk) developed by
most government agencies are based on dose-response relationships from animal data, with the human data used to support the hazard identification component of toxicity factor development. A major factor that has
precluded the use of human data in the dose-response component of toxicity factor development is the concurrent
exposure to multiple PFAAs in most or all study populations. Because serum levels of co-occurring PFAAs tend to
correlate with each other, it is difficult to determine the dose-response relationship for individual PFAAs.
Notwithstanding, German Human Biomonitoring Commission (2018) the German Environment Agency (2016)
developed Human Biomonitoring Values (serum levels below which adverse effects are not expected) and the
European Food Safety Authority (EFSA 2018) developed Tolerable Weekly Intakes for PFOA and PFOS based on
human data from the general population. These values are lower than many of the values that are based on toxicity data from animals. It is noted that the approaches and policies used to develop these European human-based
values may differ from those used by U.S. agencies in toxicity factor development.
See Section 17.2.4 for additional discussion of epidemiologic studies that have been conducted on PFAS.
132

7.1.4 Animal Toxicology Studies
This section focuses on the most notable toxicological effects in mammalian studies of certain PFCAs, PFSAs, and
FECAs. All PFAS covered in this section for which data are available cause increased liver weight; additional
effects common to some of these PFAS include immune system, hematological (blood cell), and developmental
toxicity, as well as more severe types of liver toxicity. Of the four PFAS that have been tested for carcinogenicity in
rodents, PFOA, PFOS, and the GenX chemical HFPO-DA caused tumors while PFHxA did not.
In general, toxicity is dependent on both intrinsic potency of the compound (Gomis et al. 2018) and its toxicokinetics. Longer chain PFAAs are generally toxic at lower administered doses than shorter chain compounds
because their slower excretion results in a higher internal dose from the same administered dose. Similarly, for those PFAS that are excreted much more rapidly in female rats than in males (Section 7.1.2 and Table 17-7),
higher doses in females than in males are needed to achieve the same internal dose.
Toxicological data from animal studies are used as the basis for almost all human health toxicity factors (for example, Reference Doses, cancer slope factors) for PFAS, with the few exceptions from Europe that are
based on human data (Section 7.1.3); all current PFAS standards and guidance values for environmental
media are based on animal toxicology data (also see Sections 8.3 and 9.1). As is the case for toxicology studies in general, the doses used in most of these studies are higher than the doses to which humans are generally
exposed from environmental contamination. Conversely, unlike most other environmental contaminants, PFAS
have been associated with health effects in humans at much lower exposure levels than the doses used in
animal toxicology studies.
Table 17-8 (provided as a separate Excel file) provides information on toxicological effects in mammalian species
(hazard identification information) for the following PFAS:
• PFCAs including PFBA, PFPeA, PFHxA, PFHpA, PFOA, PFNA, PFDA, PFUnA, and PFDoA
• PFSAs including PFBS, PFPeS, PFHxS, PFHpS, and PFOS
• FECAs including ADONA and the GenX chemical HFPO-DA.
Section 17.2.5 also summarizes information on systemic effects; reproductive and developmental effects, and
chronic toxicity and tumorigenicity of these PFAS.
• Largest publicly available toxicological data sets for: PFOA and PFOS
• Considerable data for: PFBA, PFHxA, PFNA, PFDA, PFBS, and the GenX chemicals HFPO-DA and its ammonium salt
• One or a few studies for: PFHpA, PFUnA, PFDoA, PFHxS, and ADONA
• No toxicological data were located for PFPeA, PFTrDA, PFTeDA, PFPeS, PFHpS, PFNS, or PFDS.
Most studies were conducted in rats and mice, with a few studies in nonhuman primates (monkeys) and other
species such as rabbits. The National Toxicology Program (NTP 2019; NTP 2019) has conducted 28-day studies of
seven PFAS (PFHxA, PFOA, PFNA, PFDA, PFBS, PFHxS, PFOS) in male and female rats that evaluated
numerous toxicological endpoints and provided serum PFAA data for each dosed group; results of these studies
are included in Table 17-8 (provided as a separate Excel file). Although the doses at which effects occurred are
not provided in this section or in the supporting appendix material, it is emphasized that No Observed Adverse
Effect Level (NOAELs) and Lowest Observed Adverse Effect Level (LOAELs) vary widely between compounds for
a given endpoint, between different endpoints for the same compound, and between species (and sexes in some
cases) for the same compound and endpoint. Furthermore, the effects noted may not have been observed in all
studies in which they were evaluated.
133

NTP (2020) has also conducted a chronic carcinogenicity study of PFOA administered in feed to rats that
assessed the contribution of combined gestational and lactational (perinatal) exposure as compared to exposure beginning after weaning. It was concluded that there was clear evidence of carcinogenic activity in male rats
based on the increased incidence of liver tumors and pancreatic acinar cell tumors, and some evidence of
carcinogenic activity in female rats based on increased incidence of pancreatic acinar cell tumors. Non-neoplastic lesions were increased in the liver and pancreas in males and in the liver, kidney, forestomach and thyroid in
females. There were very few significant differences in effects when exposure began in the perinatal period
compared to when it began after weaning.
See Section 17.2.5 for additional discussion of studies in animals that have evaluated the effects of PFAS on noncancer and cancer endpoints.
7.1.5 Data Gaps and Research Needs
Although many studies relevant to health effects of PFAAs have become available in the last few years, important
data gaps remain for most of the PFAAs and FECAs discussed here and in Section 17.2, as well as for many
additional PFAS used in commerce or found in AFFF. The data gaps (discussed in more detail in Section 17.2.6) include:
• Human half-lives and other toxicokinetic data are not available for some PFAS found in drinking water
and other environmental media.
• Currently available data indicate that reactive intermediates may form in the body from the metabolism
of PFAA precursors to PFAAs. More studies are needed to understand the toxicologic significance of these intermediates. With the exception of PFOA, there is a lack of epidemiologic data from communities
exposed to AFFF, PFOS, and/or other PFAS in drinking water.
• Additional toxicology data are needed for some PFAAs found in environmental media, including drinking water. In particular, very little toxicologic data are available for PFHpA, and no information was located for
PFPeA. There is also a need for toxicologic studies on the effects of PFAS mixtures.
• Multigeneration studies of the reproductive and developmental effects of additional PFAS are
needed. Chronic toxicity and carcinogenicity studies are currently available for only four PFAS (PFHxA, PFOA, PFOS, GenX), and are needed for PFHxS, PFNA, ADONA, and other PFAS to which
humans may be exposed.
• The majority of the many thousands of PFAS, including those in commercial use, have very limited or no
toxicity data. This is a critical data gap in health effects information for PFAS.
• Similarly, current NHANES biomonitoring includes only 11 PFAS, primarily PFAAs. There is limited or no biomonitoring data for many other PFAS produced or used in the United States, some of which are
known to be bioaccumulative in humans.
134

7.2 Ecological Toxicology
This section is organized around currently available toxicity information for invertebrates
(aquatic/benthic/terrestrial), vertebrates (fish, birds, reptiles/amphibians, mammals), and plants. Toxicological
data were obtained from a general literature review as well as querying of the USEPA Ecotox Database (USEPA 2019). However, as discussed below, this is an active area of research, and interested readers are encouraged
to query the literature for updated research and reviews. PFAS ecotoxicology data summary tables have been
developed as a separate Excel spreadsheet. The Excel file includes ecotoxicology data for aquatic species
(Table 7-1), non-mammalian terrestrial species (Table 7-2) and mammalian wildlife species (Table 7-3).
It is important to note that neither these spreadsheets nor this section are intended to represent an exhaustive
review of PFAS ecotoxicity studies. Ecotoxicity of PFAS is an area of active research, with new information
emerging regularly. Toxicological effects presented and discussed herein are generally those considered most
relevant to ecological communities—mainly survival, growth, and reproduction. Both acute and chronic exposure
studies are included. Although data have been generated for other toxicological endpoints, these studies are
not the focus of this section, but may occasionally be referenced. Application of these data in ecological risk assessment is discussed in Section 9.2
7.2.1 Introduction
Biomonitoring studies across a variety of organisms, habitats, and geographies show that certain PFAS
compounds can accumulate in wildlife and that exposures are occurring on a global scale (Reiner and Place 2015; Giesy and Kannan 2001). Therefore, it is important to understand how such exposure and bioaccumulation
may manifest in adverse effects, particularly as they relate to ecological communities. Information on
bioaccumulation of PFAS is addressed in Section 6.5. Section 7.1 focuses on the toxicological effects of PFAS on
humans and summarized toxicity data from experimental exposures of laboratory animals. This section provides
an overview of available, published toxicological data relating exposure of PFAS to toxic effects on aquatic,
benthic, and terrestrial organisms, with the goal of broadening the reader’s understanding of known or potential
effects in ecological systems, as well as highlighting areas where more data are needed. This information can also
be applied for use in ecological risk assessments (ERAs), particularly in light of the fact that ecological risk of
PFAS is currently neither well understood nor uniformly assessed or regulated. However, the reader is
encouraged to review the primary source literature from which cited ecotoxicity values have been derived to confirm and understand the basis and assumptions of the cited literature before using this information in an ERA.
This review shows that ecotoxicity data are available for aquatic invertebrates, particularly for PFOA and PFOS,
with most studies focused on aquatic invertebrates. Although there are numerous studies on PFAS exposure in terrestrial vertebrates (for example, mammals, reptiles, birds), and ample toxicological studies in laboratory
animals, there is, overall, relatively little to no ecologically relevant toxicity data for terrestrial vertebrates in the
wild. Although some mechanistic studies have been conducted with aquatic organisms, little has been done
with other organisms and even less has been done with different classes of PFAS in aquatic and terrestrial
wildlife.
The focus of most ecotoxicity studies to date has been primarily on PFOS and PFOA. Therefore, most of the data
discussed and summarized in this section are for those compounds. However, data for other PFAS compounds,
including short-chain PFAS and precursors (Section 2.2), are also presented where available. Given the
historical differences among older analytical methods and more recent advances in analyzing PFAS, the focus
of the ecotoxicity studies covered in this review is generally on those published from approximately the year
2000 and later.
135

PFAS ecotoxicology data summary tables have been developed as a separate Excel spreadsheet containing
toxicity information for PFAS compounds:
• Table 7-1: aquatic and benthic invertebrates, aquatic plants, and fish
• 7-2: terrestrial invertebrates, microorganisms and plants
• Table 7-3: mammalian wildlife
It is important to note that neither this spreadsheet nor this section is intended to represent an exhaustive review of PFAS ecotoxicity studies. Ecotoxicity of PFAS is an area of active research, with new information emerging
regularly. Toxicological effects presented and discussed herein are generally those considered most relevant to
ecological communities—mainly survival, growth, and reproduction. Both acute and chronic exposure studies are included. Although data have been generated for other toxicological endpoints, these studies are not the focus of
this section, but may occasionally be referenced.
In general, studies indicate that PFAS toxicity in invertebrates is chemical-specific and varies with the type of
organism and environmental factors. There is a paucity of field studies for avian and mammalian wildlife species, and confounding factors such as the co-occurrence of other stressors (other pollutants, physical stressors, etc.)
make it difficult to definitively associate PFAS exposure with adverse outcomes. Only one recent avian study on
tree swallow egg hatching outcomes is known to date (Custer et al. 2014), and field-based effects studies on
mammals are difficult to find (ECCC 2018). However, laboratory animal studies suggest potential relationships
between PFAS tissue concentrations and immunological, hematological, liver, kidney, and reproductive effects
(DeWitt 2015; ECCC 2018).
The abundance of biomonitoring data suggests that PFAS exposure is occurring in wildlife; however, the lack of toxicity data for this group of organisms represents a significant data gap. This highlights the need for additional
study of this class of compounds in general, as well as the need for expansion of toxicity studies to a larger group
of PFAS and to a greater variety of taxa, and for field studies that may assess population-level effects.
Relative aquatic toxicity for PFAS is discussed in the following sections using descriptive criteria developed by the USEPA
within their Design for the Environment Program for the Alternatives Assessments and the Safer Choice Program.
These criteria are expressed as relative toxicity based on effects concentrations ranging from less than 0.1
mg/L (very high toxicity) to greater than 100 mg/L (low toxicity); criteria are provided in Table 7-4.
Table 7-4. Hazard criteria for aquatic toxicity studies from USEPA (in mg constituent/L water)
Toxicity Very High High Moderate Low Very Low
USEPA: Aquatic Toxicity (Acute) <1.0 1–10 >10–100 >100 NA
USEPA: Aquatic Toxicity (Chronic)
<0.1
0.1–1
>1–10
>10
NA
Note: Refer to the PFAS ecotoxicology data summary Table 7-1 in the separate Excel spreadsheet for
toxicological endpoints and values.
136

7.2.2 Invertebrates
7.2.2.1 Aquatic There are more toxicity data available for PFOS than for other PFAS compounds. A summary of the range of acute
toxicity to aquatic organisms can be found in Table 7-5. PFAS have a very wide range of toxicities to aquatic organisms under acute exposure scenarios following the USEPA Hazard Criteria (Table 7-4), but overall, they
would be classified as having moderate to low toxicity. One exception with this generalization is that of mussel
exposures to PFOS and PFOA in the marine environment, where no effect was seen at 0.0001 mg/L but was
measured at 0.1 mg/L (Fabbri et al. 2014); this would result in high hazard using the USEPA Hazard Criteria.
Compared to acute studies, there are relatively few chronic studies in aquatic invertebrates. PFAS for which we
have chronic effects data include PFOS, PFOA, and PFNA. Life cycle tests with multiple taxa have been conducted
to evaluate the chronic toxicity of PFOS to freshwater aquatic invertebrates. The chironomid (Chironomus tentans)
is currently reported as having the greatest sensitivity to chronic exposure, where effects are seen at
concentrations less than 0.0023 mg PFOS/L. Studies by Bots et al. (2010) and Van Gossum et al. (2009)
indicated that damselflies (Enallagma cyathigerum) may also be similarly sensitive to PFOS, with NOEC values less than 0.01 mg/L. In the marine environment, a life cycle toxicity test with the saltwater mysid, yielded a
NOEC of 0.24 mg PFOS/L based on growth and number of young produced (Drottar and Krueger 2000). Finally,
there is one chronic study available for PFNA in which a 21-day exposure of Daphnia magna resulted in significant decrease in growth at 0.04 mg/L (Lu et al. 2015).
Some PFAS may potentially cause adverse effects in aquatic invertebrates to span across multiple generations
following the initial exposure. Marziali et al. (Marziali et al. (2019) evaluated effects over 10 generations of C.
riparius initially exposed at 0.01 ug/L of PFOA, PFOS and PFBS; all treatments showed reduced growth in at least
several generations, with no observed induced tolerance to the studied PFAS.
Table 7-5. Summary of aquatic invertebrate ecotoxicity data for PFAS
PFAS Carbon Chain Length
Range of Toxicity Values–EC or LC50 (mg/L)*
References
Acute Studies
PFBA 4 182–521 Ding et al. 2012; Barmentlo et al. 2015
PFBS 4 2,183 Ding et al. 2012
PFHxA 6 1,048 Barmentlo et al. 2015
PFOS
8
59–169 3M Company 2003; Boudreau et al. 2003
PFOS-Marine
8
0.0001–9.4 Fabbri et al. 2014; Robertson 1986
PFOA 8 131–477 Ji et al. 2008; Ding et al. 2012
PFAS Carbon Chain Length
Range of Toxicity Values–EC or LC50 (mg/L)*
References
PFOA-Marine 8 0.0001–0.1 Fabbri et al. 2014
PFNA 9 31–151 Zheng et al. 2011
PFDA 10 26–163 Ding et al. 2012
PFUnA 11 19–133 Ding et al. 2012
PFDoDA 12 28–66.3 Ding et al. 2012
137

Chronic Studies
PFBS 4 LOEC 4.8 Sant et al. 2018
PFOS
8
NOEC <0.0023–94.9 MacDonald et al. 2004; Boudreau et al.
2003 LOEC 0.0023-42.9
PFOA
8
NOEC 3.125– >100 Li 2010; Ji et al. 2008 LOEC 6.25–12.5
PFNA 9 LOEC 0.04 Lu et al. 2015
Note: Refer to the PFAS ecotoxicology data summary Table 7-1 in the separate Excel spreadsheet for toxicological endpoints and values.
EC50 = median effective concentration. The concentration of test substance which results in a 50 percent
reduction in growth or growth rate
LC50 = Concentration that is lethal to 50% of test population
LOEC = lowest observed effect concentration
NOEC = no observed effect concentration
Benthic Organisms and Sediment Toxicity
Toxicity to benthic organisms is generally the result of exposure to the chemical in overlying water and/or
sediment porewater. Effects levels (for example, LC50, EC50, NOEC) based on sediment concentrations (for
example, mg of chemical/kg of sediment) of PFAS were not identified in publicly available studies. Bakke et al. (2010) provided PFOS concentration ranges for sediment quality classified as background, good, moderate, bad,
and very bad. The PFOS threshold for “good” sediment, for which no toxic effects are expected, is 0.22 mg/kg;
however, no toxicity data are provided to justify this value. A few aquatic toxicity studies have been conducted on
benthic organisms for PFAS, with most focusing on PFOS. With so few studies available and with variability in test
organisms and testing methods, it is difficult to define PFAS toxicity thresholds for benthic organisms or to
determine if benthic organisms are similarly sensitive to PFAS compared to other aquatic invertebrates. Table 7-6
summarizes toxicity ranges for PFOS, PFOA, and PFBS in benthic invertebrates from the limited available
information.
138

Table 7-6. Summary of benthic invertebrate ecotoxicity data for PFAS
PFAS # of Effects Conc.*
Range of Toxicity Values (mg/L)
References
Acute (freshwater and saltwater)
PFOS (acid)
n=5
0.00001 (NOEC) – 59 (LC50) Drottar and Krueger 2000; Fabbri et
al. 2014; OECD 2002; MPCA 2007
PFOA (acid) n=2 0.00001 (NOEC) – 0.0001 (LOEC) Fabbri et al. 2014
Chronic (freshwater and saltwater)
PFOS (salt) n=22 <0.0023 (NOEC) – >0.150 (EC50) MacDonald et al. 2004
PFOA (acid)
n=2
0.0089, 100 (NOEC, chronic) MacDonald et al. 2004; Stefani et al. 2014
PFAS # of Effects Conc.*
Range of Toxicity Values (mg/L)
References
PFBS (acid) n=2 0.0077 (NOEC, chronic) Stefani et al. 2014
Note: Refer to Table 7-1 in the separate Excel spreadsheet for the total number of reported effect and no-effect
concentrations (from one or more studies, as well as for toxicological endpoints and values.
7.2.2.2 Terrestrial Invertebrates
Compared to aquatic invertebrates, there are relatively fewer studies on the effects of PFAS on terrestrial
invertebrates. Overall, these few studies indicate a moderate to high toxicity. See Table 7-2 in the separate
Excel spreadsheet for available toxicity information for PFOA and PFOS in terrestrial invertebrates. Brignole et al.
(2003), as summarized in Beach et al. (2006), summarized results of acute oral and dermal studies of PFOS conducted on the honeybee (Apis melifera), although the dose was reported in terms of mass of PFOS per bee,
which may not be relevant for evaluating ecological risks. However, these studies, when converted to a dose per
kilogram of food (2 mg PFOS per kg sugar solution), suggested that PFOS was highly toxic to honeybees. Mommaerts et al. (2011) identified in a chronic oral dosing study on the bumblebee (Bombus terrestris) an LC50
of 1.01 mg PFOS/L sugar water and noted that PFOS exposure caused detrimental reproductive effects
(decreased ovarian size).
Effects on fecundity from exposure to various PFAS compounds have been shown to carry down through
multiple generations in the roundworm Caenorhabditis elegans. Tominaga et al. (2004) conducted a multigenerational study in C. elegans exposed to PFOA, PFOS, and PFNA, finding that concentrations orders of
magnitude lower than those causing lethality decreased worm abundance, and that effects were observed even
in the fourth generation. Other studies have evaluated the mechanisms of PFAS toxicity. Xu et al. (2013)
indicated that exposure to PFOS induced oxidative stress and DNA damage in the earthworm, Eisenia fetida. Stylianou et al. (2019) evaluated food chain transfer of PFOS-treated E. coli to
C. elegans and noted distinct gene expression profiles associated with development, innate immunity, and stress
response.
With regard to soil invertebrate toxicity testing, studies (while few in number) suggest a low to moderate toxicity
of PFOS and PFOA, with toxicity generally occurring on a parts per million scale. Table 7-7 summarizes the
range of acute and chronic toxicity values identified for various terrestrial invertebrates. These studies have
mainly focused on the earthworm Eisenia fetida.
139

Sindermann et al. (2002) conducted a 14-day chronic soil study on E. fetida with PFOS and identified a NOEC of 77
mg PFOS/kg soil, a LOEC of 141 mg/kg, and an LD50 of 373 mg/kg. Other chronic earthworm studies indicated
toxic concentrations of a similar magnitude, with LC50s ranging from 84 mg/kg–447 mg/kg (Mayilswami 2014; Zareitalabad, Siemens, Wichern, et al. 2013). The Norwegian Pollution Control Authority NPCA (2006), as reported
in Danish Ministry of the Environment (2015), conducted acute soil toxicity tests in E. fetida, looking at reproductive
endpoints for PFOA, PFOS, and the short-chain 6:2 fluorotelomer sulfonate (6:2 FTS). Results of this study
indicated that overall the evaluated PFAS exhibited a moderate-high toxicity. Reproductive effects (decreased
number of cocoons, decreased hatchability, and decreased number and weight of juveniles) for PFOS and
PFOA were noted. 6:2 FTS toxicity was found to be less than that for either PFOS or PFOA in the same study.
Karnjanapiboonwong et al. (2018) conducted a 21-day soil study with E. fetida on bioaccumulation, mortality, and
weight loss with PFBS, PFHxS, PFNA, and PFHpA and generally observed no effects at soil concentrations below
100 mg/kg, with the exception of PFBS, which resulted in a modest (although statistically significant) decrease in
survival at 1 mg/kg.
The limited amount of terrestrial invertebrate data presents a data gap; additional toxicity studies are needed to
better characterize ecotoxicological effects in this group of organisms. Additionally, it will be important to understand how field/soil conditions (for example, organic carbon content, pH, etc.) may influence toxicity. For
example, Princz et al. (2018) found that PFOS toxicity for two different species of soil invertebrates was
approximately two to four times greater when organisms were tested on sandy loam versus clay loam soils.
Table 7-7. Summary of terrestrial invertebrate ecotoxicity data for PFAS
PFAS Range of Toxicity Values: NOEC, LOEC (mg/kg) References
Acute Studies
PFAS Range of Toxicity Values: NOEC, LOEC (mg/kg) References
PFOS 77, 141 (survival) Sindermann et al. 2002
PFBS, PFHxS, PFNA, PFHpA 1, 100 (survival) Karnjanapiboonwong et al. 2018
Chronic Studies
PFOS
1, 447 (survival)
1 (growth), 233 (reproduction)
Mayilswami 2014; Xu et al. 2013; Sindermann et al. 2002
Princz et al. 2018; Zhao et al. 2014; Zareitalabad,
Siemens, Wichern, et al. 2013
PFOA 1 (growth), 84 (survival) He, Megharaj, and Naidu 2016; Zareitalabad,
Siemens, Wichern, et al. 2013
6:2 FTS 30 (reproduction), 566 (growth) NPCA 2006
PFBS, PFHxS, PFNA, PFHpA 100 (weight loss, mortality) Karnjanapiboonwong et al. 2018
Note: Refer to Table 7-2 in the separate Excel spreadsheet for toxicological endpoints and values.
140

7.2.3 Vertebrates
The following sections describe available toxicity data for vertebrate species, including fish, amphibians/reptiles,
birds, and mammalian wildlife.
7.2.3.1 Fish
Table 7-8 summarizes the range of toxicity values observed for fish following PFAS exposures. Acute freshwater
LC50 values based on survival for PFOS range from 7.8 to 22 mg/L for Rainbow trout (Oncorhynchus mykiss), to
9.1 mg/L for Fathead minnow (Pimephales promelas) (Robertson 1986; Palmer, Van Hoven and Krueger 2002).
There are relatively few chronic PFOS studies using PFOS, but (Drottar and Krueger 2000) calculated a chronic
NOAEL based on early life stage mortality to be 0.29 mg/L. Palmer, Van Hoven and Krueger (2002) also calculated an acute NOAEL of 6.3 mg/L for Oncorhynchus mykiss. Saltwater acute values based on survival for Oncorhynchus
mykiss were calculated to be
13.7 mg/L.
Other than PFOS, there are limited aquatic ecotoxicity data for ‘other’ PFAS. Within the summary data presented
here, acute exposure durations were 6-days. One study was noted that investigated the chronic toxicity of
PFNA following a 180-day exposure; the LOEC ranged from 0.01-1 mg/L depending on the endpoint (Zheng et al. 2011).
Table 7-8. Summary of fish ecotoxicity data for PFAS
PFAS Carbon Chain Length
Range of Toxicity Values: EC or LC50 (mg/L)
References
PFBA 4 2,200 (developmental); >3,000 (survival) Ulhaq et al. 2013
PFBS 4 450 (developmental); 1,500 (survival) Ulhaq et al. 2013
PFOS
8
7.8–22 (survival) Robertson 1986; Palmer, Van Hoven and
Krueger 2002
PFOA 8 430 (survival) Ulhaq et al. 2013
PFNA 9 84 Zhang et al. 2012
PFDA 10 5 (developmental); 8.4 (survival) Ulhaq et al. 2013
Chronic Studies
PFOS
8
NOEC 0.29; EC50 7.2 Drottar and Krueger 2000; Oakes
et al. 2005
PFAS Carbon Chain Length
Range of Toxicity Values: EC or LC50 (mg/L)
References
PFNA 9 LOEC 0.01 (growth) Zhang et al. 2012
Note: Refer to Table 7-1 in the separate Excel spreadsheet for toxicological endpoints and values.
141

7.2.3.2 Amphibians/Reptiles
There are relatively limited toxicity data available for PFAS effects on amphibians, including several studies on
various species of frogs; no studies on reptiles were found in the literature search. The data available for PFOS
and PFOA show a wide range of effects-based concentrations. Table 7-9 summarizes acute and chronic toxicity
data for amphibians.
More amphibian data are available for PFOS than for other PFAS, and indicate mortality generally tends to occur
at levels of 10 parts per million (ppm) or higher, whereas nonlethal effects may occur at approximately 1–2
ppm (that is, moderate to high toxicity) or lower (Ankley et al. 2004; Yang et al. 2014; Fort et al. 2019).
Ankley et al. (2004) conducted a 5-week study on PFOS toxicity in the northern leopard frog (Rana pipiens) and
observed that LC50s decreased with increasing test duration time; LC50s ranged from 12.5 mg/L at 1 week to 6.2
mg/L at 5 weeks. This study also anecdotally noted the presence of kinked tails, as well as a delayed time to
initial metamorphosis and differences in limb bud and foot paddle emergence in the 1, 3, and 10 mg/L groups. A
PFOS study, based on a 3M study reported in OECD (2002) on another frog species, African clawed frog
(Xenopus laevis), suggested toxicity at concentrations of similar magnitude to those observed in the Ankley study,
and identified inhibition of growth and malformation during development.
Amphibian studies suggest that, while PFOS is more toxic than PFOA, it may be less toxic relative to certain other
PFAS, for example, Yang et al. (2014) and Abercrombie et al.(2021). Brown, Flynn, and Hoverman (2021) found
increased trematode infection in the northern leopard frog resulting from exposure to 0.01 mg/L PFHxS, whereas
no effect was observed for PFOS (however, no such effect was noted in the higher PFHxS treatment dose of 0.1
mg/L; the authors postulated that this could potentially be due to adverse effects of PFHxS to the trematode itself.).
Many of the older amphibian studies focused on early life aquatic exposures. More recent studies suggest that
amphibians may be even more sensitive to PFAS if one looks at later life stages; nonlethal effects other than
survival; growth and reproduction; terrestrial exposure routes; or multiple exposure media. Abercrombie et al.
(2021) indicated LOECs ranging from 0.05-0.12 mg/L for a toad, frog, and salamander exposed to PFOS, PFOA,
or PFHxS in a soil substrate. Flynn et al. (2021) found enhanced PFOS and PFOA toxicity in a spiked sediment outdoor mesocosm study, suggesting that evaluating only aquatic exposures may underestimate toxicity from
exposure to PFAS in multiple media, which is more representative of actual field conditions.
Table 7-9. Summary of amphibian ecotoxicity data for PFAS
PFAS Range of Toxicity Values–NOEC/LOEC (mg/L) References
Acute Studies
PFOS
3.6–81 Yang et al. 2014; Stevens and Coryell 2007; Ankley et al.
2004; OECD 2002
PFOA 115 (mortality) Yang et al. 2014
Chronic Studies (EC10)
PFOS 1 (metamorphosis)–2 (longevity) Fort et al. 2019; Yang et al. 2014
PFOA 5.89 (longevity) Yang et al. 2014
Note: Refer to Table 7-1 in the separate Excel spreadsheet for toxicological endpoints and values.
142

7.2.3.3 Birds
There are currently a limited number of published laboratory studies available that address PFAS toxicity in avian
wildlife species (Newsted et al. 2006; Newsted et al. 2005; Newsted et al. 2007; Newsted et al. 2008; Dennis et
al. 2020; Bursian et al. 2021). The northern bobwhite quail (Colinus virginianus) and the mallard duck (Anas
platyrhynchos) were exposed to PFOS (Newsted et al. 2005; Newsted et al. 2006; Newsted et al. 2007) or PFBS
(Newsted et al. 2008) via the diet. The LD50s reported following acute exposure to PFOS are 61 mg/kg-bw/d and
150 mg/kg-bw/d for the northern bobwhite quail and the mallard duck, respectively (Newsted et al. 2006). In a separate chronic dietary study, Newsted et al. (2007) found that a feed concentration of 10 mg PFOS/kg resulted
in an average daily intake (ADI) LOAEL of 0.77 mg/kg-bw/d based on increased liver weight in female quail. A feed
concentration rate of 50 mg/kg resulted in an ADI LOAEL of 6.4 mg/kg-bw/d based on lethality in mallards (Newsted
et al. 2007).
More recent avian studies on the northern bobwhite (Dennis et al. 2020) and Japanese quail (Bursian et al.
2021) evaluated dietary effects of PFOS, PFOA, PFHxS, and the AFFF formulations from 3M and Ansul. Bursian et
al. (2021) estimated average daily doses causing 50% mortality (ADD50) at 5 days’ exposure ranging from 38
mg/kg-d for PFOS (≥98% chemical grade) to 130 mg/kg-d for PFOS in feed spiked with 3M AFFF, which is a product formulation (see Section 3) that is a mixture of fluorinated and other compounds (LC50 of 351–467 mg/kg of
feed, respectively). More information about AFFF is included in Section 3. This subacute study also evaluated
effects resulting from a mixture of PFOS and PFOA; the authors suggested that these results showed potential
additive effects, and a relative potency of PFOA approximately half that of PFOS (Bursian et al. 2021). Dennis et
al. (2020) evaluated chronic toxicity associated with PFOS and a mixture of PFOS and PFHxS in drinking water on the northern bobwhite quail. Reduced body weight in females and impaired hatching success were observed at
doses lower than those used in the Newsted study (Newsted et al. 2007), deriving a chronic toxic dose of 0.0031
mg PFOS+ PFHxS/kg-bw/d and 0.00245 mg PFOS/kg-bw/d, respective to the previously mentioned endpoints.
Some egg injection studies suggest exposure to PFOS may adversely affect chick development during
incubation. For example, Molina et al. (2006) found that exposure to PFOS lowered the rate of hatching success and caused changes in the liver in the leghorn chicken. However, there is some concern regarding the
use of these data in risk assessments due to issues related to the method of exposure and other
methodological issues that can influence the outcomes of the studies. Although these studies are useful for evaluating mechanisms and creating structure-activity relationships, they may not be appropriate for direct
application in risk assessments.
Quail and mallard appear less sensitive to PFBS relative to PFOS. Acute dietary exposure to PFBS resulted in
NOAELs of 3,160 and 5,620 mg PFBS/kg-feed for the northern bobwhite quail and mallard duck, respectively, for the lethal endpoint; these feed concentrations are equivalent to an ADI of 774 mg/kg-bw/d in quail and 2,190
mg/kg-bw/d in mallard ducks (Newsted et al. 2008). A NOAEC for northern bobwhite quail reproduction following
dietary exposure to PFBS was reported at 900 mg/kg-feed, equivalent to an ADI of 87.8 mg/kg-bw/d.
Although there are few PFAS laboratory toxicity studies for birds, there are even fewer effect-based field studies.
Custer et al. (2012) and Custer et al. (2014) evaluated PFOS exposure in tree swallows, identifying a negative
association between PFOS concentration in eggs (~150 ng/g-ww) and hatching success. One issue with the
findings as suggested by the authors is that the greatest observed effects on hatching were typically found in
areas that likely have co-contamination issues (PCBs, PAHs, mercury); however, the influence of these other
contaminants is still not clear. This issue of effects from co- contaminants came to light when Custer et al. (2019)
conducted a field study evaluating the effects of PFAS on tree swallows in a more isolated area with known PFAS
impacts (Clark’s Marsh near the former Wurtsmith Air Force Base, MI); other potential contaminants were at or below regional anthropogenic background levels. This study resulted in mean PFOS egg concentrations of 662
ng/g-ww, and overall hatching success was not impacted.
143

Groffen et al. (2019) conducted a field study in great tits (Parus major) near a former fluorochemical plant. They
reported median egg concentrations of 48,056 ng/g-ww for PFOS, 18 ng/g-ww for PFOA, and 315 ng/g-ww for PFDS. The authors concluded that reduced hatching success in the birds was associated with a mixture of PFAS
(PFOS, PFDS, PFDoDA, PFTrDA, and PFTeDA) (Groffen et al. 2019). Taken together, a linear relationship between
PFAS exposure and potential effects in avian species remains uncertain; this highlights the importance of
considering co-exposure of common environmental contaminants and PFAS mixtures when reviewing field studies.
Lastly, indirect effects, such as reduction in a local food source resulting from a PFAS release, may potentially
affect bird populations. de Vries et al. (2017), for example, found a decline in abundance of flamingos following a
release of fire-fighting foams containing PFOS and other PFAS to a salt lake; the authors postulated that this
decline was potentially related to a reduction in prey item abundance due to PFOS toxicity. Table 7-10
summarizes the avian studies.
Table 7-10 Summary of avian ecotoxicity data for PFAS
PFAS Range of Toxicity Values References
Acute Studies–Dietary (mg/kg-bw/d)
PFOS LD50s: 38–150 Newsted et al. 2006; Bursian et al. 2021
PFOA ADD50: 68 Bursian et al. 2021
PFBS NOAEL: 774-2,190 Newsted et al. 2008
Chronic Studies – Dietary/ Drinking Water (mg/kg-bw/d)
PFOS LOAEL: 0.00245-0.77 Dennis et al. 2020; Newsted et al. 2007
PFOS + PFHxS LOAEL: 0.0031 Dennis et al. 2020
PFBS NOAEL: 87.8 Newsted et al. 2008
Note: Refer to Table 7-1 in the separate Excel spreadsheet for toxicological endpoints and values.
7.2.3.4 Mammalian Wildlife
PFAS exposure to wildlife is occurring on a global scale and across a variety of habitats (Reiner and Place 2015).
Sections 5.5.2 and 5.5.3 discussed studies that evaluated bioaccumulation of PFAS. Wildlife may accumulate PFAS from
direct exposure to air, dust, water, soil, and sediments, as well as through diet. Maternal transfer of PFAS is also
a relevant exposure route, as these compounds have been shown to cross the placenta (Gronnestad et al. 2017; Houde et al. 2006). PFAS have also been shown to biomagnify, so higher trophic level predators have higher
PFAS levels in tissues compared with prey items (Reiner and Place 2015). Of the PFAS compounds analyzed in
wildlife exposure studies, PFOS is the one most frequently detected, and at the highest concentrations, in tissue
samples (Reiner and Place 2015). Concentrations in biotic media have also been observed to vary with age, sex, and species.
Given the widespread occurrence of PFAS in wildlife, it is important to understand if such exposure manifests
in adverse effects and ultimately how exposure may impact wildlife populations. Laboratory animal models show
that, in general, PFAS compounds are readily absorbed and distributed among protein-rich tissues (liver,
serum, kidney) in mammals, and that certain PFAS (particularly long-chain compounds) have a relatively long
half-life in the body. Toxicity tests on laboratory mammals (mice, etc.) have shown that exposure to PFAS may
result in adverse effects on the hepatic, endocrine, and immune systems; development; and certain types of
cancers, as discussed in Section 7.1.4.
144

Based on the findings from mammalian toxicity studies in laboratory animals, one might expect to find similar
effects in mammalian wildlife (at similar exposure levels). Laboratory studies focusing on growth, reproduction,
and survival effects on laboratory mammals provide data to support the development of toxicity reference values
for use in ERA of wildlife species. Examples of these data are provided Table 7-3 in the separate Excel
spreadsheet, but this table is not intended to be exhaustive. NOAELs and LOAELs can be derived from these
studies for use in ERA as shown (as further discussed in Section 9.2, Ecological Risk Assessment), but these values should be used with caution and understanding of their associated uncertainty. Many of these studies
may have also included other endpoints, such as systemic or metabolic endpoints, that are not typically used
for ERA and may demonstrate effects at lower doses than the growth, reproduction, and survival effects.
Although there are numerous studies evaluating toxicity of PFAS in laboratory animals (as discussed in Section 7.1.4), and there are numerous exposure studies in mammalian wildlife, very few studies have evaluated PFAS
toxicity with respect to wildlife exposures. The studies that have been conducted typically evaluated relationships
between the concentrations of a small number of PFAS compounds in various protein-rich biological media (for example, blood serum, liver) and expression of select biomarkers. One study on sea otters related concentrations
of PFOA and PFOS in liver tissue to health condition and. To possible immune effects (Kannan, Perotta and
Thomas 2006).
Table 7-11 summarizes these studies.
Table 7-11. Summary of PFAS toxicity studies in mammalian wildlife
Species Summary of Findings Reference
Sea otter
Enhydra lutris
Higher PFOS/PFOA concentrations in liver samples found in diseased
otters versus nondiseased group
Kannan, Perotta
and Thomas 2006
Bottlenose dolphin Tursiops truncatus
Significant positive associations between serum total PFAS
concentrations and multiple immunological, hematopoietic, renal,
and hepatic function endpoints
Fair et al. 2013
Wood mouse Apodemus
sylvaticus
Significant positive relationship between liver PFOS concentration and hepatic endpoints (relative liver weight, microsomal lipid peroxidation
level); significant negative association with serum alanine
aminotransferase (ALT) activity
Hoff et al. 2004
Wild pig
Sus scrofa
No significant correlation between PFAS liver concentrations and
multiple blood, hepatic, and immunological endpoints, whereas
significant correlations were observed for other pollutants (for example, dioxin-like compounds, PCBs, organohaline pesticides)
Watanabe et al.
2010
Note: Refer to Table 7-3 in the separate Excel spreadsheet for toxicological endpoints and values.
It is important to note that while certain associations have been observed between PFAS concentrations and
various immunological, hematopoietic, renal, and hepatic function biomarkers, these associations are not
necessarily indicative of actual impairment to an individual organism or within a larger population.
Perhaps one of the biggest challenges with wildlife toxicity studies is that wildlife are exposed to multiple
chemical, biological, and physical stressors, making it difficult to determine whether noted effects are directly
related to PFAS, to other stressors, or to a combination of stressors. The accumulation of other types of POPs, such as PCBs, dioxins, and pesticides, and metals such as mercury, in wildlife has been well established and,
in some studies, related to effects. Arctic mammal studies have reported relationships between organohalogen
exposure and endocrine disruption, reduced immune function, and adverse effects on the liver and other
organs (Letcher et al. 2010).
145

Numerous nonchemical environmental factors such as climate change, habitat loss, and seasonal availability of
food may also confound toxicity studies, making it difficult for field studies to discriminate those effects related
solely to PFAS. As an example, Watanabe et al. (2010) found no association between PFAS levels and a variety
of biomarkers in wild pigs, whereas the study found significant positive associations between these parameters
and other types of contaminants (for example, PCBs) that were also detected in liver tissue samples.
Currently, there are few data points available for mammalian wildlife, and the current literature focuses on
bioaccumulation and specific endpoints that may not be ecologically relevant, as discussed above. Additionally,
studies have traditionally focused on protein-rich tissues such as liver or blood serum, because PFAS preferentially
bind to proteins, which can potentially underestimate the total body burden of PFAS. Thus, exposure cannot be
fully characterized from these studies, and pinpointing correlations between target organ or whole-body effects
and PFAS exposure is not possible at this point in time. A better understanding of mammalian exposures to the
broad spectrum of PFAS compounds, precursor compounds, and mixtures of PFAS, as well as other
environmental contaminants, is critical in advancing this field of study. Given the challenges with conducting field studies, this information could be obtained in part through more robust dosing studies in mammals that are
representative of various wildlife taxa, and on toxicological endpoints that are directly relevant to population-based
effects; however, more field studies are also needed to confirm laboratory models. Groups such as the U.S.
Department of Defense’s Strategic Environmental Research and Development Program (SERDP) and the Environmental Security Technology Certification Program (ESTCP) have recently identified such critical data needs
(SERDP-ESTCP 2017).
7.2.4 Plants
The following sections describe available toxicity data for aquatic and terrestrial plants.
7.2.4.1 Aquatic Plants
Data on the toxic effects of PFAS on aquatic plants are limited, with available studies focusing on PFOS included in
Table 7-1 in the separate Excel spreadsheet. The acute toxicity (EC50s) of PFOS to aquatic plants generally
ranges from roughly 31 to 108 parts per million (mg/L), with NOEC values from the same studies being
approximately 7–30 mg/L; (Boudreau et al.2003; Sutherland and Krueger 2001; Drottar and Krueger 2000).
Chronic effects (EC50s) were found to be similar to acute values, but varied over a wide range, depending on
species and endpoint (2–305 mg/L), with NOECs from the same studies ranging from 0.3 to 11.4 mg/L (Hanson
et al. 2005; Boudreau et al. 2003; Desjardins et al. 2001, Desjardins et al.2001; Desjardins et al. 2001).
7.2.4.2 Terrestrial Plants
There are limited PFAS toxicity data for terrestrial plants; a review of the literature yielded only a few soil phytotoxicity studies, summarized in the See Table 7-2 in the separate Excel spreadsheet and in Table 7-12
below. Brignole et al. (2003) evaluated PFOS exposure (21 days) on a variety of crop plants (alfalfa, onion,
ryegrass, soybean, tomato, flax, and lettuce) using emergence, survival, and shoot height and weight as
endpoints, and demonstrated effects occurring at concentrations ranging from 57 mg/kg to over 1,000 mg/kg.
Other studies (Li 2009; Zhao et al. 2011) conducted on both PFOS and PFOA on multiple crop plants found a wide
range of toxicity among species and also within species for Brassica rapa chinensis. The most sensitive species
may be Triticum aestivum where the 30-day NOEC reported was 1 mg/kg (Zhao et al. 2014). Toxicity may also be moderated by soil characteristics; for example, Zhao et al. (2011) showed that the amount of organic matter in
soil significantly influenced toxicity, where higher organic carbon content decreased both accumulation of PFOA
and PFOS and phytotoxicity. See the Table 7-2 in the separate Excel spreadsheet for a summary of phytotoxicity information for PFOA and PFOS.
146

Table 7-12. Summary of terrestrial plant ecotoxicity data for PFAS
PFAS Range of Toxicity Values–NOEC/LOEC (mg/kg) References
Acute Studies
PFOS <3.9 (growth)– >1,000 (survival) Qu et al. 2010; Zhao et al. 2014; Li 2009; Brignole et al. 2003
PFOA 103 (growth)–812 (growth) Li 2009; Zhao et al. 2011
Chronic Studies
PFOS 1 (growth) Zhao et al. 2014
PFOA 30 (growth) Zhao et al. 2014
Note: Refer to Table 7-2 in the separate Excel spreadsheet for toxicological endpoints and values.
7.2.5 Uncertainties and Conclusions
This section presented ecotoxicological information from an array of studies with the intent of providing the reader with an overview of the types of organisms and ecotoxicity studies available for PFAS compounds in the
current literature. This section also presented available information about the ranges of concentrations of PFAS
(notably, PFOS) in soil, sediment, and water that have been associated with adverse effects. In summary,
ecotoxicity studies demonstrate a wide range of effects concentrations across the various terrestrial and
aquatic biota. In general, aquatic invertebrates appear to be more sensitive to PFOS and other PFAS
compounds than their terrestrial counterparts. Differences in species sensitivities, analytical methods,
environmental substrate, test conditions, and reproducibility of results make it difficult to generalize overall
effects, and some species may be more or less sensitive than others.
Although there are numerous studies on the toxicity of select PFAS to aquatic invertebrates, these studies are
generally limited to a very small number of PFAS compounds (typically PFOS, and to a lesser extent, PFOA). Because PFAS represent a broad spectrum of compounds, it is important to expand ecotoxicity studies in this field
to evaluate additional PFAS, including short-chain and precursor compounds, as well as “next generation”
replacement compounds. Furthermore, the available studies indicate a wide range of effects levels for PFAS compounds in aquatic invertebrates, suggesting a level of complexity that has not yet been adequately assessed.
Significantly fewer toxicity studies are available for other groups of aquatic or benthic organisms, and few to no
studies are available for avian or mammalian wildlife or plants, presenting a significant gap in our understanding of
how the widespread presence of PFAS in the environment may be affecting ecological communities. Additional (or
any) data on toxicological endpoints most relevant to community-level effects, such as survival, growth, and
reproduction, will be extremely beneficial in understanding potential ecological impacts.
Updated May 2021.
147

8 Basis of Regulations The PFAS Team developed a training module video with content related to this section, it is the Risk Assessment
and Regulations video.
This section describes various federal and state regulatory programs that apply to PFAS. Because state regulations for PFAS in environmental media are changing rapidly, only a few state regulations are summarized
in this section, as examples. ITRC also maintains updated tables of PFAS water values, and PFAS soil values from state, federal, and some international countries posted as an Excel file). This section also includes a brief
explanation of examples of various health-based criteria. ITRC also has tables posted as an Excel file of the
basis for PFOA and PFOS values in the United States that is updated periodically.
Section Number Topic
8.1 Introduction
8.2 Regulatory Programs
8.3 Differences in the Available Regulations, Advisories, and Guidance
8.1 Introduction
PFAS became contaminants of emerging concern in the early 2000s. In recent years federal, state, and
international authorities have established a number of health-based regulatory values and evaluation criteria. As
with the case for most emerging contaminants, the regulatory process dealing with PFAS is in various stages of development, and the values and criteria being established vary between individual states, the U.S.
government, and international agencies. This section describes examples of various federal and state
regulatory programs and includes links to tables that provide established PFAS health-based criteria.
The terms “regulatory” or “regulation” are used in this document to refer to requirements that have gone through
a formal process to be promulgated and legally enforceable as identified under local, state, federal, or
international programs. The terms “guidance” and “advisory” apply to all other policies and numerical values.
148

8.2 Regulatory Programs
8.2.1 Background to Regulation of PFAS
The scientific community is rapidly recognizing and evolving its understanding of PFAS in the environment, causing an increased pace of development of guidance values and regulations. Human health protection is the primary
focus of the PFAS regulations, guidance, and advisories developed to date. Regulations and guidance have
focused on the PFAAs, precursor compounds, and FECAs. Like many other emerging contaminants, the
regulatory and guidance values for PFOS and PFOA can vary across programs, with differences due to the
selection and interpretation of different key toxicity studies, choice of uncertainty factors, and approaches used
for animal-to-human extrapolation. The choice of exposure assumptions, including the life stage and the
percentage of exposure assumed to come from non-drinking water sources, may also differ. Thus, both
differences in scientific conclusions and public health policy choices affect the myriad of regulatory and guidance
initiatives for PFAS. See the tables of the basis for PFOA and PFOS values in the United States for the specific
differences underlying drinking water or groundwater regulations and advisories for PFOA and PFOS.
In addition to values that specify health-based concentration limits, agencies have used various strategies to limit the use and release of PFAS. For example, the USEPA worked with the eight primary U.S. PFAS
manufacturers and processors to eliminate PFOA and many PFOA precursors and higher homologues by 2015 (USEPA 2017). Additionally, the Organisation for Economic Co-operation and Development OECD (2015) has
described various international policies, voluntary initiatives, biomonitoring, and environmental monitoring programs
to control PFAS. More information regarding the history of these developments is in Section 2.4.
Authority for regulating PFAS in the United States is derived from a number of federal and state statutes,
regulations, and policy initiatives. This section provides a brief overview of the major federal statutes and
regulatory programs that govern PFAS.
8.2.2 Federal PFAS Regulations
Within the United States, currently both the USEPA and the FDA have regulatory or guidance initiatives for PFAS.
The USEPA has the authority to regulate PFAS under several different acts and programs, as provided below;
however, USEPA has not yet listed PFAS as hazardous wastes or substances under its available statutory
authorities, including the Resource Conservation and Recovery Act (RCRA), Comprehensive Environmental Response, Compensation and Liability Act (CERCLA), Emergency Planning and Community Right-to-Know Act, or
the Clean Air Act. To date, USEPA has also not established regulations for any PFAS under the Safe Drinking
Water Act.
Through the Office of Regulatory Affairs, the Office of Management and Budget maintains a list of regulatory
actions which have been initiated by the USEPA and certain other federal agencies. That list is updated
periodically to give the status of the regulations, and is available at https://www.reginfo.gov/public/Forward?SearchTarget=RegReview&textfield=PFAS.
Through the National Defense Authorization Act for Fiscal Year 2020 (the NDAA), Congress mandated a number of
actions that the Department of Defense (DOD) must comply with on PFAS, while also adding in a number of
separate requirements for the USEPA (https://www.congress.gov/bill/116th-congress/senate-bill/1790/text).
149

Some of the requirements of the NDAA for the DOD include:
• Sharing PFAS monitoring and detection data with municipalities and drinking water utilities that are adjacent to installations
• Providing “a clearinghouse for information” about exposure of DOD personnel and their families or communities to PFAS through drinking water
• Entering into cooperative agreements with States to address testing, monitoring, removal and remediation of any PFAS contaminated media originating from DOD activities
• Providing blood testing for PFAS for all DOD firefighters during their annual physical exam
• Ensuring that no water contaminated with PFOA or PFOS above USEPA’s health advisories from DOD activities is used for agricultural purposes
For the USEPA, some of the requirements of the NDAA include finalizing the 2015 proposed significant new use rule (SNUR) under the Toxic Substances Control Act (TSCA), and adding reporting requirements for certain PFAS
under the Toxics Release Inventory (TRI) program. Both of these are discussed below.
8.2.2.1 Toxic Substances Control Act (TSCA)
TSCA authorizes the USEPA to require reporting, record keeping, testing, and restrictions of chemicals and chemical mixtures that may pose a risk to human health or the environment. Section 5 of TSCA authorizes the
USEPA to issue Significant New Use Rules (SNURs) to limit the use of a chemical when it is newly identified, or
when a significant new use of an existing chemical is identified, before it is allowed into the marketplace (USEPA 2017). From 2002 to 2013, USEPA issued four final SNURs covering 271 PFAS, including PFOS and PFOA. The first
three SNURs covered PFAS included in the 3M Corporation’s voluntary phaseout of PFOS. The 2013 SNUR
required notification to USEPA prior to manufacture or import of seven PFAS that had been reviewed by USEPA under the TSCA New Chemicals Program, but had yet to be commercially manufactured or imported into the United
States. This SNUR also included long-chain PFCAs and their salts and precursors that were used in carpets or to
treat carpets (USEPA 2015). Collectively, these SNURs placed notification requirements on the manufacture
(including import) of specific PFAS for new use. The SNURs allowed for continued, low-volume use of some PFAS in photographic/imaging, semiconductor, etching, metal plating, and aviation industries (USEPA 2017). In January
2015, USEPA proposed another SNUR to require notification to USEPA before any future manufacture (including
import) of PFOA and PFOA- related chemicals, including as part of articles, and processing of these chemicals.
The proposed SNUR did not place a regulatory restriction on the imports of fluoropolymers dispersions and emulsions containing PFOA or its salts (FluoroCouncil 2018). As a result of changes made to section 5(a) of TSCA
when TSCA was amended in June 2016, USEPA undertook developing a supplemental SNUR for the import of
certain long-chain PFCA and PFSAs as part of categories of certain articles (USEPA 2018).
As required by the NDAA, the USEPA finalized the supplemental SNUR in June 2020 and published the final notice
in the Federal Register in July 2020 (https://www.govinfo.gov/content/pkg/FR-2020-07-27/pdf/2020-13738.pdf). The
2020 SNUR designates as a significant new use the manufacture, import, or processing of a specific subset of
long chain perfluorocarboxylates (LCPFAC) for any use that was not ongoing as of December 15, 2015 and for all other LCPFAC chemical substances for which there were no ongoing uses as of January 21, 2015. The SNUR
also prohibits the import of certain LCPFAC as part of a surface coating on articles, and the import of carpet
containing perfluoroalkyl sulfonate chemical substances, without USEPA review.
The USEPA continues to review new PFAS through USEPA’s New Chemicals Program before approving commercialization.
150

8.2.2.2 Safe Drinking Water Act (SDWA)
The SDWA is the federal law that protects public drinking water supplies throughout the nation (USEPA 1974). Under the SDWA, the USEPA has authority to set enforceable Maximum Contaminant Levels (MCLs) for specific
chemicals and require testing of public water supplies. The SDWA applies to all public water systems (PWSs) in
the United States but does not apply to private domestic drinking water wells nor to water not being used for drinking.
The USEPA has not established regulations for any PFAS under the SDWA; however, in its 2019 PFAS Action Plan
(USEPA 2019), the agency indicated that it would take steps to evaluate the need for MCLs for PFOA and PFOS. In February 2020, the agency proposed a preliminary Regulatory Determination to develop drinking water standards
for PFOA and PFOS, and initiated a 60-day public comment period. If the Regulatory Determination is finalized
subsequent to the USEPA’s review of comments, the agency will initiate the process to establish a national primary drinking water regulation (an MCL) for these two PFAS. The SDWA specifies the following three requirements for
making a Regulatory Determination regarding MCL development:
• The chemical may have an adverse effect on the health of persons.
• The chemical is known to occur or there is a substantial likelihood that it will occur in PWSs with a frequency and at levels of public health concern.
• In the sole judgment of the EPA administrator, regulating the contaminant presents a meaningful opportunity for health risk reductions for persons served by PWSs.
More information regarding USEPA’s PFAS Action Plan is found below in this section.
In May 2016, USEPA established a lifetime health advisory (LHA) of 70 ng/L for PFOA and PFOS in drinking water. This
LHA is applicable to PFOA and PFOS individually or in combination if both chemicals are present at concentrations above the reporting limit (USEPA 2016, USEPA 2016). The LHA supersedes USEPA’s 2009 short-term (week to
months) provisional health advisories of 200 ng/L for PFOS and 400 ng/L for PFOA (USEPA 2009). The LHA for
PFOA and PFOS is advisory in nature; it is not a legally enforceable federal standard and is subject to change as new information becomes available (USEPA 2016, USEPA 2016). USEPA states that the LHAs “provide
Americans, including the most sensitive populations, with a margin of protection from a lifetime of exposure to PFOA
and PFOS from drinking water” (USEPA 2016e pg.2).
Much of the current occurrence data available regarding PFAS in public drinking water was generated by USEPA
under the SDWA Unregulated Contaminant Monitoring Rule (UCMR) program (USEPA 2017). USEPA uses the UCMR
to collect data for chemicals that are suspected to be present in drinking water but that do not have health-based
standards set under the SDWA. The third round of this monitoring effort, or UCMR3, included six PFAAs:
• perfluorooctanesulfonic acid (PFOS)
• perfluorooctanoic acid (PFOA)
• perfluorononanoic acid (PFNA)
• perfluorohexanesulfonic acid (PFHxS)
• perfluoroheptanoic acid (PFHpA)
• perfluorobutanesulfonic acid (PFBS).
Samples were collected during a consecutive 12-month monitoring period between 2013 and 2015 from large PWSs serving more than 10,000 people, and a limited number of smaller systems determined by USEPA to be
nationally representative. Based on USEPA’s UCMR3 reported limits of between 10 and 90 ng/L depending on the
specific PFAAs, at least one of the six PFAAs listed above were detected in 194 out of 4,920 PWSs tested (~4%), which serve about 16.5 million people in 36 states and territories (Hu et al. 2016).
151

Occurrence data produced by the UCMR program, not only for PFOA and PFOS, but also for other PFAS as well
(Table 8-1 and Table 17-3) are used by the USEPA and some states to help determine which substances to consider for future regulatory action. All of the data from the UCMR program are published in the National
Contaminant Occurrence Database (NCOD) and available for download from USEPA’s website (USEPA 2017).
Table 8-1. UCMR3 occurrence data for PFOA and PFOS
Exceed LHA (70 ppt) Reporting Limit (ppt) Number of PWSs PWS (%)
PFOS 40 46 0.9
PFOA 20 13 0.3
∑ PFOA + PFOS1 63 1.3
1PWSs that exceeded the combined PFOA and PFOS health advisory (USEPA 2016; 2017)
PFOA and PFOS were listed on Contaminant Candidate List 3 (CCL 3) in 2009 and are currently listed on CCL 4
published in late 2016. Inclusion on the CCL 4 indicates that the USEPA Office of Water was considering deriving
MCLs for these specific PFAS. As noted above, if the USEPA finalizes the preliminary Regulatory Determination for
PFOA and PFOS, it will move the process of MCL derivation to the next step in the regulatory process.
In addition, when the USEPA determines there may be an “imminent and substantial endangerment” from a
contaminant that is present in or likely to enter a PWS, under Section 1431 of the SDWA it may issue emergency
administrative orders (EAOs) to take any action necessary to protect human health if state and local authorities have not acted (42 U.S.C. §300i). USEPA has issued several such EAOs to protect public and private water
supply wells contaminated with PFOA or PFOS (USEPA 2009, 2014, 2015).
USEPA issued a PFAS Action Plan (USEPA 2019) in February 2019 and an update a year later (USEPA 2020). In addition to the evaluation of the need for an MCL for PFOA and PFOS, that Action Plan included the following main
actions that encompass more than just safe drinking water issues:
• Develop interim groundwater cleanup recommendations to address groundwater contaminated with
PFOA and PFOS
• Finalize draft toxicity assessments for Gen X chemicals and PFBS
• Develop additional toxicity values for PFBS, PFHxA, PFHxS, PFNA, and PFDA
• Conduct chemical safety reviews as new PFAS are developed and enter the market and issue proposed supplemental SNURs
• Incorporate the latest research results for additional PFAS into USEPA’s online drinking water treatment database
• Evaluate listing of PFOA and PFOS as hazardous substances
• Evaluate performance and identify costs associated with treatment and remediation approaches to address PFAS in the environment
• Support communities that have PFAS releases by using federal enforcement authorities where relevant and appropriate
• Develop an interactive map providing the public with available information on sources and occurrence of PFAS
• Develop coordinated messaging on PFAS across the federal government
• Develop a risk communications toolbox for PFAS to be used for the public
• Evaluate the listing of PFAS chemicals to the Toxics Release Inventory
• Determine if available data for PFAS are sufficient to establish ambient water quality criteria for human
health
152

• Explore identifying industrial sources that may warrant regulation through national Effluent Limitation
Guidelines and Standards (ELGs) and the setting of minimum levels of control needed for National
Pollutant Discharge Elimination System (NPDES) permits
• Develop toxicity information for a larger group of PFAS and potentially address groups of PFAS
• Add PFAS monitoring to UCMR5, using newer analytical methods for a wider suite of PFAS, while achieving lower minimum reporting levels than earlier UCMRs
• Develop an inventory of PFAS data for media other than drinking water
• Assess ecological risk from PFAS exposure
• Evaluate air transport of PFAS.
8.2.2.3 Comprehensive Environmental Response, Compensation, and Liability Act (CERCLA)—“Superfund”
PFAS, including PFOA and PFOS, are not listed as CERCLA hazardous substances but may be addressed as
CERCLA pollutants or contaminants, for example, as defined by section 101 (33) of CERCLA (40 CFR 300.5). As listed above in Section 8.2.2.2, under its PFAS Action Plan (USEPA 2019), USEPA is evaluating listing PFOA and
PFOS as hazardous substances. The action plan also includes a priority action to develop interim cleanup
recommendations for groundwater contaminated with PFOA and PFOS. The USEPA released a draft recommendation for public comment in spring 2019, which includes using a screening level of 40 ppt for each
(individually) of PFOA and PFOS (hazard index of 0.1), and using 70 ppt combined as a preliminary remediation
goal. CERCLA investigations are beginning to include PFAS when supported by the CSMs (for example, (USEPA 2017). PFAS are often included in a remediation site’s 5-year review, when supported by site-specific information.
According to USEPA, as of April 2018, there were active PFAS investigations occurring at 32 federal facility National
Priorities List (NPL) sites and 17 non-federal sites, and these numbers are expected to continue to increase as
PFAS are included in more remediation programs (Peter Gravatt, Director of USEPA’s Office of Ground Water and Drinking Water, ITRC PFAS team presentation April 24, 2018). Section 9 provides a discussion and
recommendations for how to consider PFAS during a site- specific risk assessment.
CERCLA Protection of Human Health. CERCLA requires, among other things, that Superfund response actions ensure protectiveness of human health and the environment, and compliance with laws and regulations that
constitute “applicable or relevant and appropriate requirements” (ARARs); the statute also provides possible ARAR
waivers in limited circumstances. The lead agency (as defined in 40 CFR 300.5) identifies potential ARARs and to-be-considered values (TBCs), based in part on the timely identification of potential ARARs by states. Risk-based
goals may be calculated and used to determine cleanup levels when chemical-specific ARARs are not available
or are determined not to be sufficiently protective (USEPA 1997). The ARAR process can be complex and can
result in impacts on scope, budget, and public acceptance components of a project (USEPA 2019).
The tables of PFAS water values, and PFAS soil values from state, federal, and some international countries
posted as an Excel file include current state regulatory and guidance values for PFAS. These values are not
necessarily automatically recognized as ARARs and must be evaluated by the lead agency to determine their
ARAR status. In the Superfund program, USEPA regions evaluate potential ARARs, including state standards, on a site-specific basis to determine whether a specific standard or requirement is an ARAR for response decision
and implementation purposes. Determining if a state requirement is promulgated, substantive, and enforceable
are some of the factors in evaluating whether a specific standard may constitute an ARAR or TBC (40 CFR 300.5 2001; 40 CFR 300.400 2019, (g); USEPA 1988, 1991).
153

As mentioned above, risk-based cleanup goals may be calculated when chemical-specific ARARs are not
available or are determined not to be protective (USEPA 1997). The USEPA’s Regional Screening Levels (RSLs) Generic Tables (USEPA 2017) and the RSL online calculator (USEPA 2017) are used by risk assessors to identify
screening levels and preliminary remedial goals for contaminants of potential concern at a site. These goals are
typically based on toxicity values that have been selected in accordance with the USEPA’s published hierarchy (USEPA 2003). Currently, PFBS and the potassium salt of PFBS are the only PFAS listed in the RSL generic
tables. For PFBS and its salt, the generic tables provide a noncancer reference dose (RfD), screening levels for
soil and tap water, and soil screening levels for the protection of groundwater. As stated in its PFAS Action Plan, USEPA is in the process of developing toxicity values for PFBS and GenX chemicals. Draft toxicity assessments
were posted on November 14, 2018, for public review (USEPA 2018, USEPA 2018). When finalized, these toxicity
values may be incorporated into the RSL table for these PFAS, as well. The online RSL calculator currently
supports site-specific calculations for PFBS, PFOA, and PFOS in tap water and soil. The noncancer RfDs derived by
the USEPA Office of Water are provided as Tier 3 toxicity values for PFOA and PFOS. The USEPA 2016 cancer
ingestion slope factor is also provided for PFOA, but screening levels are based on the noncancer endpoint. The
USEPA also provides tables and a calculator for removal management levels (RMLs). In general, RMLs are not final cleanup levels, but can provide a reference when considering the need for a removal action (for example,
drinking water treatment or replacement) (USEPA 2016). Because RSLs and RMLs are periodically updated, they
should be reviewed for revisions and additions before using them. RSLs and RMLs are not ARARs, but they may
be evaluated as TBCs. The USEPA has emphasized that RSLs and RMLs are not cleanup standards (USEPA 2016) and suggests that final remedial goals be informed by a baseline risk assessment so that site-specific
information can be incorporated. Section 9 provides more information on site-specific risk assessment for PFAS.
CERCLA Protection of the Environment. CERCLA requires that remedies also be protective of the environment. Risk-based cleanup goals that are protective of the environment are site-specific and depend in part on the
identification of the ecological receptors to be protected. To date noU.S. regulatory agency has established
ecological criteria for PFAS. Another example of a risk-based goal is a cleanup standard for a chemical in soil that is protective of groundwater quality and is developed on a site-specific basis. Given the challenge associated with
deriving accurate physical and chemical properties for PFAS (Sections 4.1 and 5.1), site-specific values will need
to be derived.
8.2.2.4 Resource Conservation and Recovery Act (RCRA)
RCRA provides USEPA with the authority to regulate hazardous waste management, nonhazardous solid waste
facilities and practices, and underground storage tanks holding petroleum or certain hazardous substances. No
PFAS have been formally listed as RCRA hazardous waste for regulation under this program. However, there are at least a couple of examples where action on PFAS was taken under the auspices of RCRA. For example, in 2004
USEPA pursued violations of RCRA and TSCA at an E.I. DuPont de Nemours and Company (DuPont) facility in West
Virginia due to environmental release of the hazardous constituent PFOA (USEPA 2015). In the case of DuPont, the facility already had a RCRA permit for hazardous waste disposal and was under a Corrective Action Permit. Some
states, Texas, for example, are regulating certain PFAS under their RCRA permits and requiring investigation and
cleanup.
154

In February 2017, a U.S. District Court denied motions to dismiss RCRA “imminent and substantial endangerment”
claims relating to PFAS (Tennessee Riverkeeper, Inc. v. 3M Co., No. 5:16-cv-01029-AKK, 2017 WL 784991 (N.D. Ala. Feb. 10, 2017)). This case involved the alleged continuing contamination of the Tennessee River and associated
public drinking water supplies with PFAS that the plaintiff claims originated from a local manufacturing facility and
two local landfills. There were several arguments that the claims should be dismissed. One argument by the
landfill owners was that the claims were an attack on existing, valid permits that included a solid waste permit authorizing disposal in the landfill of PFAS-bearing materials. The court denied the motion to dismiss, stating that
the permits only authorize disposal of nonhazardous waste, and there is a dispute over whether the PFAS-
containing material is a hazardous waste. Additionally, there are a continually growing number of citizen lawsuits filed under RCRA in state courts throughout the United States. Thus, the applicability of RCRA regulations and
statutes to PFAS does not appear to be settled and can be complicated.
8.2.2.5 Clean Air Act (CAA)
Under the CAA, USEPA is required to regulate toxic air pollutants from large industrial facilities. USEPA may
develop standards for controlling certain air toxic emissions from sources in a specific industry group. Within 8
years of establishing emission standards, USEPA must determine whether the standards are sufficiently
protective of human health and protect against adverse environmental effects. This determination also
considers improvements in air pollution controls and evaluates effective and feasible alternatives.
According to the USEPA (2018) website on PFAS Laws and Regulations, the CAA applies to discharges of PFAS to air under National Emission Standards for Hazardous Air Pollutants; however, there are no air emission standards
for PFAS at this time. There is no indication how far along USEPA is in this process for regulating PFAS under the CAA.
8.2.2.6 Clean Water Act (CWA)
Since 1972, the CWA has given the USEPA authority to control water pollution by regulating discharges into the
nation’s surface water by setting wastewater standards for industry. There are no federal water quality standards
for any PFAS at this time. However, USEPA released the Final 2016 Effluent Guidelines Program Plan in May 2018,
which listed PFAS as a topic for future investigation (USEPA 2018). The USEPA plans to review PFAS surface
water discharges from industrial categories for both long-chain and short-chain PFAS. The regulation of PFAS in
discharge effluents is discussed below in Section 8.2.3.
8.2.2.7 Toxics Release Inventory (TRI) Program
The Toxics Release Inventory (TRI) program requires the annual reporting of environmental releases of
approximately 800 chemicals which the USEPA has concluded cause:
Cancer or other chronic human health
effects Significant adverse acute human
health effects Significant adverse
environmental effects
For chemicals regulated under the TRI, facilities that manufacture, process or use these chemicals in amounts above established levels must submit annual reporting forms for each chemical. As stipulated by the NDAA, the
USEPA finalized a rule requiring 172 PFAS be added to the list of chemicals that must be reported under the TRI
program (USEPA 2020). The PFAS that are subject to TRI reporting requirements include all PFAS listed as an active chemical substance under TSCA’s Section 8(b)(1) inventory. Each of the PFAS has a 100-pound reporting
threshold. Reporting for the 2020 calendar year is due in July 2021; these data – as with all TRI data – will be
publicly- available approximately one year after they were reported (USEPA 2020).
155
8.2.2.8 U.S. Food and Drug Administration (FDA)
One of the responsibilities of the FDA is regulation of “food contact substances” (FCSs), chemicals added to or components of “food contact materials” (FCMs), such as food wrappers and packaging. The FDA currently
regulates certain PFAS used as grease-proofing agents for food packaging via a Food Contact Notification Program
within the Center for Food Safety and Applied Nutrition’s Office of Food Additive Safety. The PFAS used in FCMs and their known degradants and impurities have all undergone review for human health and environmental safety
concerns through the food contact notification process, which required submission of chemical, toxicological, and
environmental information on the FCS itself and on any potential impurities.
Currently, the FDA has banned three perfluoroalkyl ethyl compounds from use in food packaging material (81 FRN 5, Jan. 4, 2016, Indirect Food Additives: Paper and Paperboard Components): diethanolamine salts of mono- and
bis (1 H, 1H, 2H, 2H perfluoroalkyl) phosphates with even-numbered alkyl groups in the range of C8–C18;
pentanoic acid, 4,4-bis [(gamma–omega-perfluoro-C8-20-alkyl)thio]; and perfluoroalkyl substituted phosphate ester acids, ammonium salts formed by the reaction of 2,2-bis[([gamma],[omega]-perfluoro C4–C20 alkylthio) methyl]-
1,3-propanediol, polyphosphoric acid, and ammonium hydroxide. Side-chain acrylate and methacrylate
fluoropolymers are currently approved and used within the United States for FCS.
In July 2020, the FDA announced that three manufacturers had agreed to a voluntary phase out of FCS that
contain 6:2 fluorotelomer alcohol (6:2 FTOH). A fourth manufacturer had previously stopped sales of 6:2-FTOH-containing products in the US. The phase-out will begin in January 2021; the FDA predicted that it may take up to
18 months after that time to exhaust existing supplies of food contact papers that contain 6:2 FTOH (USFDA 2020).
As of August 2020, there were approximately 60 specific FCS with PFAS that are listed on FDA’s inventory of
effective FCS notifications (recognizing its approval for specific uses, designated in the application).
8.2.2.9 Other Federal Agency Actions
Other U.S. federal agencies and programs are actively involved in PFAS-related matters; however, their work
largely focuses on data generation and analysis to help inform regulations/restrictions/regulatory action. These federal programs often provide valuable information, guidance, and resources for state regulatory and public
health agencies. For example, the U.S. Centers for Disease Control and Prevention (CDC) National Health and
Nutrition Examination Survey (NHANES) program provides valuable information about human exposure to chemicals. Since 1999, the NHANES program has been providing an assessment of the exposure of the U.S.
population to a small subgroup of PFAAs. This information is useful to scientists and regulatory agencies to
understand “background” (that is, likely nonsite-related) human exposure levels and trends over time. CDC has recently expanded their NHANES analysis to include evaluation of PFAAs in serum and urine (Kato et al.
2018).
Under the Superfund Amendments and Reauthorization Act of 1986 (SARA) [42 U.S.C. 9601 et seq.] amendment to
CERCLA (or Superfund) [42 U.S.C. 9601 et seq.], the U.S. Department of Health and Human Services, Agency for Toxic Substances and Disease Registry (ATSDR) was established to assess the potential public health risk from
exposure to hazardous substances commonly found at National Priorities List facilities. CERCLA provides ATSDR
with the authority to develop toxicological profiles that describe the health effects of these hazardous substances
and to support site-specific response actions with health consultations and/or exposure investigations. A full description of ATSDR’s actions regarding PFAS is on their web page (ATSDR, 2018). On June 20, 2018, ATSDR
issued a revised draft Toxicological Profile for Perfluoroalkyls for public comment (ATSDR 2018). In this revision, the
agency discussed potential human health risks related to 14 specific PFAS and derived “provisional intermediate Minimal Risk Levels” (MRLs) for PFOA, PFNA, PFOS, and PFHxS. ATSDR stated that these provisional MRLs are
intended to serve as “screening levels” for identifying contaminants and potential health effects that may be of
concern at hazardous waste sites and are not intended to be used for regulatory action, including to define
cleanup or action levels.
156

The U.S. Geological Survey (USGS) has had an emerging contaminants program for over a decade within
which they measure emerging contaminants, including PFAAs, in various environmental media and ecological receptors. The objective of their work is to characterize environmental occurrence, sources, and source
pathways that may contribute to environmental exposure. This has been a useful source of information for
scientists and regulatory agencies on occurrence, fate, and transport of PFAS. Information on the USGS program can be found on their web page (USGS 2017).
The U.S. Department of Defense SERDP and ESTCP are jointly managed with USEPA and the U.S. Department
of Energy to develop the latest science and technology to improve DOD’s environmental footprint and mission
capabilities. Beginning in fiscal year 2011, SERDP and ESTCP have funded a significant number of projects
related to developing a better understanding of PFAS occurrence, fate and transport, ecotoxicity, and remediation treatments, as well as investigating the next generation of fluorine-free firefighting foams. More
information on SERDP and ESTCP funding projects and statements of need can be found on their website
(SERDP-ESTCP 2019).
8.2.3 State PFAS Regulations and Guidance
State regulatory agencies often have the delegated authority to regulate and enforce environmental and
public health requirements, although the 50 states have different priorities, resources, and processes. Several
states have been actively involved with addressing PFAS contamination across multiple regulatory programs.
Examples of key state programs for water, soil, remediation, hazardous substances, and consumer products are described below, and information about regulatory, advisory, and guidance values is discussed in Section
8.2.3.4. The information below is meant to provide examples only; the ITRC tables of PFAS water values, and
PFAS soil values from state, federal, and some international countries posted as an Excel file should be consulted for more current and detailed information.
The ITRC PFAS team and the Environmental Council of States (ECOS) jointly issued a survey to state agencies to
identify the various ways in which each state may be addressing PFAS, as discussed in Section 8.2.3.6.
The following subsections provide several different categories of state-adopted laws and regulations along with examples of each.
8.2.3.1 Product Labeling and Consumer Protection Laws
Several states have programs regulating PFAS in consumer products, including product labeling. Note that due
to the state legislative review and finalization process, only bills that have been finalized into law are discussed
below.
In November 2017, PFOS and PFOA were listed as potential developmental toxicants under California’s Proposition
65 (California Office of Environmental Health Hazard Assessment [CA OEHHA] (2018)). The listing includes labeling
requirements for manufacturers, distributors, and retailers, and will prohibit companies from discharging PFOA or
PFOS (or their related salts) to sources of drinking water if the discharges would result in exposures that exceed a health-based “safe harbor” level, which has not yet been defined as of September 2019 by the state. The
California Department of Toxic Substances Control Safer Consumer Products program is also addressing PFAS.
This program has labeled the entire family of PFAS as “Candidate Chemicals” and is drafting “Priority Product” work plans to evaluate the use of these chemicals on “converted textiles or leathers such as carpet, upholstery,
clothing, and shoes” (CA DTSC 2019) and food packaging (CA DTSC 2019).
157

Washington State has required the reporting of PFOS in children’s products since 2012 (Washington State
Legislature 2008). The 2017 Children’s Safe Products Act update added reporting of PFOA in children’s products starting in January 2019. Washington also tests products for chemicals to ensure manufacturers are reporting
accurate information. In 2018, Washington enacted two laws addressing PFAS in specific products: AFFF
(Washington State Legislature 2018)) and food contact materials (Washington State Legislature 2018). After July 2018, PFAS-containing AFFF is not allowed to be used for training. After July 2020, PFAS-containing AFFF will not
be allowed for sale or distribution. The AFFF sale ban does not apply to the U.S. Department of Defense, FAA, oil
and gas terminals, or chemical plants. The AFFF restrictions do not apply to the use of AFFF in response to fire emergencies. After 2022, PFAS will be banned in food packaging materials if results of the Department of Ecology’s
alternatives assessment identify safer alternatives.
8.2.3.2 State of Washington Chemical Action Plans
Chemical action plans (CAPs) identify, characterize, and evaluate uses and releases of specific persistent, bioaccumulative, and toxic (PBT) chemicals or metals. Washington State prepares CAPs under an administrative
rule (Washington State Legislature 2006). Washington has prepared an interim PFAS CAP and is planning to
release recommendations to address PFAS contamination in 2019. The CAP, as developed so far, recommends
setting state drinking water levels or advisory levels for PFAS, expanding water testing near potential sources of contamination, developing cleanup levels for PFAS, and evaluating and producing best practices for cleaning up
soils, surface water, and groundwater. The CAP also recommends investigating other sources of PFAS by
requiring manufacturers of products containing PFAS to provide information regarding safety of their products and performing assessment of alternatives to PFAS in AFFF, food contact paper, and textiles. More information on the
Washington CAP process for PFAS is available from their web page (Washington State Department of Ecology
2018).
8.2.3.3 Designation of Hazardous Waste or Hazardous Substance
Regulations that target select PFAAs as hazardous wastes or hazardous substances have not been promulgated
in most states. Formal PFAA regulations as hazardous substances have been promulgated in Vermont, New York,
New Jersey, Colorado, and Alaska (ITRC State Survey 2018, unpublished), and are under development in several other states. Vermont regulates PFOA and PFOS as hazardous wastes when present in a liquid at a concentration
> 20 ppt, but allows exemptions for 1) consumer products that were treated with PFOA and are not specialty
products; 2) remediation wastes managed under an approved CAP or disposal plan; and 3) sludge from wastewater treatment facilities, residuals from drinking water supplies, or leachate from landfills when managed
under an approved plan (VT DEC 2016, VT DEC 2016).
In 2017, the New York State Department of Environmental Conservation (NYDEC) finalized regulations that identify PFOA (the acid)and its salt, ammonium perfluorooctanoate and PFOS (the acid) and its salt, perfluorooctane
sulfonate, as hazardous substances that may be found in Class B firefighting foams (NY DEC 2017). The
regulations specify storage and registration requirements for Class B foams that contain at least 1% by volume of one or more of these four PFAS, and prohibit the release of 1 pound or more of each into the environment during
use. If a release exceeds the 1-pound threshold, it is considered a hazardous waste spill and must be reported;
cleanup may be required under the state’s Superfund or brownfields programs (NY DEC 2017).
158

8.2.3.4 Drinking Water, Groundwater, Soil, and Remediation Programs
Several states have developed standards and guidance values for PFAS in drinking water, groundwater, and soil (see the ITRC tables of PFAS water values, and PFAS soil values from state, federal, and some international
countries posted as an Excel file). Many states have either adopted the USEPA LHAs for PFOA and PFOS or
selected the same health-based values, choosing to use the concentrations as advisory, nonregulated levels to guide the interpretation of PFOA and PFOS detections. As with any contaminant of potential concern at a
remediation site, available toxicity values that meet USEPA policy requirements (USEPA 1993, 2003, 2013)) can
be used to derive screening levels for groundwater and soil. As of May 2018, the USEPA has not adopted the
PFOA and PFOS toxicity values as “Tier 3” to officially derive an RSL; however, the necessary information is
available within the online USEPA RSL calculator and screening levels for PFOA, PFOS, and PFBS are readily
available (USEPA 2017). Section 9 provides more information on site-specific risk assessment for PFAS.
In addition to the process using the USEPA RSL calculator discussed above, some states have developed screening levels for PFOA and PFOS in soils assuming direct contact and/or ingestion. See ITRC tables of PFAS
water and soil values and USEPA (2017) At least a couple of states (for example, Alaska, Connecticut) have
developed values for protection of groundwater (ITRC State Survey 2018, unpublished).
Some states, such as California and Minnesota, have “antidegradation” policies aimed at protecting the quality
of groundwater and (in California) high quality (or Tier 2) surface waters. Those polices can be used in decisions
on cleanup and discharge under permits. As an example, in California, the State Water Resources Control Board
adopted Resolution 68-16 as its antidegradation policy. When evaluating the discharge or cleanup of chemicals,
the Regional Water Quality Control Boards are required to initially set the effluent limitation or cleanup standard
at the background concentration of each chemical. This is done regardless of whether there is a drinking water
standard or other health-based value available. Final discharge or cleanup values consider potential health
impacts, designated beneficial uses of the water body, and technical and economic feasibility in their development.
8.2.3.5 Surface Water Discharge and Permitting
National Pollutant Discharge Elimination System (NPDES) permits use a standard process for developing effluent
limits for pollutants. Effluent and receiving water limitations would be established in the same manner as other
pollutants. Michigan is currently the only state with a PFAS discharge standard. The Michigan Department of
Environmental Quality Rule 57 Water Quality Values can be found on their web page (MI EGLE 2019).
8.2.3.6 Other State Regulations or Programs
Another concern for PFAS is in the application of biosolids from municipal wastewater treatment plants to land for
disposal or reuse. In the ITRC 2018 State Survey on PFAS, no state indicated that they had regulations on PFAS in
biosolids application to land. However, Alaska, Delaware, Illinois, Michigan, Montana, New York, Vermont, and Wisconsin were in the process of considering and/or developing such regulations. In March 2019, Maine began
requiring land applicators of biosolids to test for PFOA, PFOS, and PFBS before application, and prohibited
application of biosolids if those PFAAs exceed specific levels (2.5 ppb for PFOA, 5.2 ppb for PFOS, and 1900 ppb for PFBS) (ME DEP 2019). New Hampshire has an ambient air limit for ammonium perfluorooctanoate of 0.05 ug/m3
(24-hour) (NH DES 2016).
On March 6, 2019 California’s Water Resources Control Board held a public meeting where it unveiled its PFAS
Investigation Plan (CA Water Boards 2019). That plan has been reassessed and there is now only a second phase with no timeline. One part of the reassessed plan has been completed which was issuing informational
orders to plating shops. The next set of orders will be issued to wastewater treatment plants (to be completed
spring 2020). After those orders are completed, informational orders will be issued for biosolids application areas and potentially bulk fuel/chemical facilities with AFFF capabilities. Sampling of domestic water supply wells in the
vicinity of these sites is also planned. Results will be available on the CA Water Boards (2020) web page.
159

Finally, some states have issued state regulations or programs related to AFFF. For example, New York,
Vermont, and Massachusetts have established AFFF take-back programs in an attempt to reduce the potential discharge of PFAS associated with AFFF into the environment. Other states (for example, New Hampshire) are in
the process of developing an AFFF take-back programs. See Section 3 for a more detailed discussion on AFFF
and related regulations and guidance.
160

8.3 Differences in the Available Regulations, Advisories, and Guidance Regulatory
Human health protection is the primary focus of the PFAS regulations, guidance, and advisories developed to date. Internationally, including in the United States, the nonpolymer PFAS have been the regulatory focus,
primarily nonpolymer long-chain PFAAs. There are a number of draft toxicity evaluations available for different
PFAS. This is an area of active research. Additional information is presented in Section 7.1 and 17.2.
As of September 2019, regulatory human health–based guidance values and/or standards have been derived for 16 PFAAs, two polyfluoroalkyl precursors, and one fluorinated ether carboxylate (FECA) by state and/or federal
agencies in the United States. The values for these nonpolymeric PFAS vary across programs, with differences
due to the selection and interpretation of different key toxicity studies, choice of uncertainty factors, and
approaches used for animal-to-human extrapolation. The choice of exposure assumptions, including the life stage
and the percentage of exposure assumed to come from non-drinking water sources, also differs. PFOA and
PFOS have the vast majority of regulatory guidance and/or standards available, and the key differences in
regulatory decisions within the United States for those chemicals can be seen in the ITRC tables posted as an
Excel file of the basis for PFOA and PFOS values. These same key decision points also underlie the differences
that exist in the other perfluoroalkyl substance regulatory values, but are not documented in the tables. Some
examples that describe differences in these toxicity values for PFAAs, including some of the bases of these
values, their commonalities are the focus of the remainder of this section.
Table 8-2 provides the underlying definition and context for the various federal regulations, standards, and
guidance values that may apply to PFAS in the United States.
161

Table 8-2. Definition of terms associated with drinking water and/or groundwater standards or guidance Term Acronym Agency Definition Link Minimum Risk Level
MRL CDC ATSDR
An MRL is an estimate of the daily human exposure to a hazardous substance that is likely to be without appreciable risk of adverse noncancer health effects over a specified duration of exposure. MRLs are intended to serve as screening levels to identify contaminants and health effects that may be of concern. MRLs are not intended to define cleanup or action levels for ATSDR or other agencies. (ATSDR 2018) Importantly the MRL is the daily dose, applicable for any oral exposure; it is not a threshold concentration in water or other environmental media.
https://www.atsdr.cdc.gov/mrls/index.asp
Regional Screening Level
RSL USEPA Regions
Default screening level tables including chemical-specific concentrations for individual contaminants in air, drinking water, and soil that may warrant further investigation or site cleanup. Generic screening levels (SLs) are based on default exposure parameters and factors that represent reasonable maximum exposure conditions for long-term/chronic exposures and are based on the methods outlined in EPA’s Risk Assessment Guidance for Superfund, Part B Manual (1991) and Soil Screening Guidance documents (1996
and 2002). It should be emphasized that SLs are not cleanup standards. (USEPA 2019)
https://www.epa.gov/risk/regional-screening-levels-rsls-users-guide#intro
Health Advisory HA USEPA Office of Water
Health advisories provide information on contaminants that can cause human health effects and are known or anticipated to occur in drinking water. EPA’s HAs are nonenforceable and provide technical guidance to state agencies and other public health officials on health effects, analytical methodologies, and treatment technologies associated with drinking water contamination. (USEPA 2019)
https://www.epa.gov/dwstandardsregulations/drinking-water-contaminant-human-health-effects-information
Maximum Contaminant Level
MCL USEPA Office of Water
The highest level of a contaminant that is allowed in drinking water. MCLs are set as close to MCL goals as feasible using the best available treatment technology and taking cost into consideration. MCLs are enforceable standards. (USEPA 2018)
https://www.epa.gov/ground-water-and-drinking-water/national-primary-drinking-water-regulations
As stated above, available PFAS regulations, guidance, and advisories are generally based on human health
protection. However, the available values that are deemed protective of human health vary across international
and U.S. jurisdictions. In general, there are similarities and differences in the understood toxicological effects,
potencies, and modes of action for various PFAAs, and there are differences in the interpretation of relevant
toxicological data for individual PFAAs.
162

Toxicological data from animal species are used as the basis for all of the U.S. PFAS human health toxicity
factors and related standards or guidance. However, the European Food Safety Authority’s PFOA and PFOS tolerable weekly inputs are based on human data. See Section 7 for a review of the toxicology data for PFAS.
Many scientific considerations and decision points are involved in developing human health toxicity factors (such as
RfDs) from animal toxicology data. For PFOA and PFOS, different scientific and regulatory policy conclusions
have been made for nearly each decision point by different agencies. Examples of some of the key differences
will be discussed below. Agency support documents should always be consulted for more specific details. The ITRC tables of PFAS water values, and PFAS soil values from state, federal, and some international countries
posted as an Excel file). and ITRC tables posted as an Excel file of the basis for PFOA and PFOS values in the
United States should be reviewed for more current and detailed information.
8.3.1 Determination of Key Study and Critical Effect
To date, PFAAs and FECA regulations, standards, and guidance have largely been based on potential noncancer
effects. RfDs are used by most U.S. agencies to describe the estimate of a daily oral exposure to the human
population (including sensitive subgroups) that is likely to be without an appreciable risk of deleterious effects
during a lifetime (USEPA 2019). However, the USEPA, New Jersey Drinking Water Quality Institute (NJDWQI), and California OEHHA also considered potential cancer endpoints for PFOA and PFOS, and concluded that PFOA and
PFOS are “suggestive” carcinogens and developed cancer toxicity values (cancer slope factor, CSF) for PFOA, while
only OEHHA developed a CSF for PFOS. The threshold levels derived from RfDs by USEPA and NJDWQI are lower,
that is, more protective, than those based on CSFs; thus, regulating or screening based on chronic noncancer risks was deemed to be protective of potential cancer risk by those entities. The methodology for deriving a chemical-
specific toxicity values is generally applicable to both cancer and noncancer endpoints where dose-response
relationships and weight-of-evidence analyses of available data sets are evaluated, and is described in detail, specific to PFOA and PFOS, below.
The first step in deriving a human health-based toxicity value (that is, RfD) is the review of applicable data to
identify potential human health hazards (toxicity endpoints) based on sensitive effects that are consistently seen
across several studies, are deemed related to an adverse health outcome or its known precursor, and are
relevant to humans based on mode of action considerations. Not all agencies have utilized the same candidate
studies and health endpoints for PFOA and PFOS due to differences in selection criteria and differences in
opinion on the relevancy to human health and on adversity of effects seen in rodent bioassays. Older
assessments relied upon primate studies due to concerns that rodent studies were not relevant to human health
because of rodent-specific modes of action and toxicokinetics (USEPA 2009; NCDENR 2012; MDH 2008). The
more recent derivations of PFOA and PFOS toxicity values are based on rodent studies with lower effect levels
(compared to primate studies), citing potential modes of action that are relevant to humans and improved toxicokinetic models to extrapolate between species. Some agencies, such as the USEPA and NJDWQI, selected
only key studies with serum measurements of PFOA or PFOS, which enable the use of the more advanced
toxicokinetic modeling in serum levels; rodent bioassays without serum measurements were used as supporting studies in weight-of-evidence evaluation and decision-making. In general, all U.S. agencies with RfDs for PFOA
and PFOS agree that liver effects, developmental effects, and/or immune effects are the most sensitive and
relevant endpoints. However, methodologies for selection of the key studies and critical effects, and quantification
of the RfD itself, vary widely. Some examples are discussed below; however, the ITRC tables posted as an Excel
file of the basis for PFOA and PFOS values in the United States should be consulted for more current and detailed information.
163
8.3.1.1 PFOA
USEPA identified a subset of animal studies for their PFOA toxicity value derivation based on sensitivity and human relevancy of the endpoint, exposure durations of greater than 7 weeks, multiple dose groups, use of a
concurrent control, and studies that provided serum data amenable for modeling. Although this last requirement,
studies with measured serum levels, excluded some studies, USEPA noted that the remaining studies encompassed the range of doses evaluated and the LOAELs observed in studies that lacked serum data. The
resulting candidate studies included endpoints such as immune effects (Dewitt et al. 2008), developmental
effects (Lau et al. 2006), increased liver weight and necrosis (Perkins et al.
2004), reduced pup weight (Wolf et al. 2007), reduced relative body weight (BW), and increased relative kidney
weight (Butenhoff et al. 2004). The Lau et al. (2006) developmental study (LOAEL for reduced ossification in
proximal phalanges and accelerated puberty in male mice) ultimately yielded the lowest RfD based on USEPA’s kinetic extrapolation, and was deemed to be protective of the other endpoints (USEPA 2016). USEPA (2016)
reviewed the studies of mammary gland development in mice, but chose not to consider this endpoint as a
potential critical effect due to unknown mode of action and unclear functional significance. Minnesota Department
of Health MDH (2018) selected Lau et al. (2006) for their key study and critical effect, but also identified other
health effects (liver effects, immune system effects, kidney weight changes, and other development effects) as
effects of concern.
Conversely, NJDWQI (2018) determined that the developmental effects noted in Lau et al. (2006) were not
permanent structural changes and had unknown long-term consequences and unclear functional significance.
Additionally, they noted that there was not a typical dose-response relationship in these effects with increasing
dose (the greatest effects for delayed ossification and accelerated puberty occurred at the lowest dose, with less
of an effect at higher doses) (NJDWQI 2017). NJDWQI selected increased liver weight in mice (Loveless et al. 2006)
as their critical effect for PFOA’s RfD. Additionally, they applied an uncertainty factor to account for delayed
mammary gland development, persistent liver toxicity, and other potential developmental effects that they
concluded could occur at lower exposure levels (NJDWQI 2017). NJDWQI determined that the delayed mammary
gland developmental effect (Macon et al. 2011) was a more sensitive critical effect that was scientifically valid;
however, its use as the basis for chemical risk assessment was unprecedented and therefore, ultimately not
chosen. Texas Commission for Environmental Quality (TCEQ) selected the mammary gland developmental effects
in mice (Macon et al. 2011) as their critical effect, stating that it was the most health protective (TCEQ 2016).
TCEQ did not have a requirement that serum PFOA levels be measured in the key study and used administered dose as the dose metric. Rather than selecting just one key study, Maine’s CDC selected six PFOA
animal bioassays across multiple species (rats and mice) with increased liver weight and hepatocyte enlargement
(Lau et al. 2006; Perkins et al. 2004 [three studies with varying conditions]; Sibinski 1987; Butenhoff, Kennedy,
Frame, et al. 2004). MDEP used the geometric mean of the benchmark dose limits from these six studies as their final point of departure (Maine CDC 2014).
164

8.3.1.2 PFOS
Similarly as for PFOA, USEPA identified a subset of animal studies for their PFOS toxicity value derivation based on sensitivity and human relevancy of the endpoint, exposure duration considerations, multiple dose groups, use of
a concurrent control, and studies that provided serum data amenable for modeling. Using toxicokinetic models
and dose-response modeling (both described below) of the selected studies and endpoints, USEPA concluded that the internal dose levels associated with developmental and liver endpoints were similar; endpoints
considered as critical effects included offspring growth and survival, liver weight changes, liver histopathology,
and changes in serum biochemistry indicative of systemic effects.
USEPA did not consider the monkey study from Seacat et al. (2002) appropriate because of the premature deaths
of two of the six male monkeys at the LOAEL. However, this was the key study and critical effect from USEPA’s
provisional health advisory derived in (USEPA 2009) and is the key study (critical effect of increased thyroid-
stimulating hormone, reduced total T3, and reduced high-density lipoproteins) utilized by Maine Department of Environmental Protection (ME DEP) for their PFOS RfD and development of their Remedial Action Guideline (ME
DEP 2016). In 2017, MDH selected the same key study and critical effect for PFOS as the USEPA but added a
database uncertainty factor to the USEPA RfD for potentially more sensitive immune effects (MDH 2017). In 2019,
MDH selected a different key study in mice with immunotoxocity as the critical effect (MDH 2019).
Regarding immune effects, USEPA concluded that there is a concern for PFOS-mediated immune effects, but determined that the available studies (including Dong et al. (2009)) were not amenable to use in RfD derivation.
They state that both human dosing information and low-dose confirmation of immune effects in animals is lacking
(USEPA 2016). The USEPA derived an RfD for PFOS based on decreased neonatal rat BW from the two-
generation study by Luebker, York, et al. (2005) because this key study and critical effect combination yielded the
lowest RfD of the remaining studies (USEPA 2016).
New Jersey derived their PFOS RfD based on the NOAEL for plaque-forming cell response in mice, an indication of
immunosuppression (Dong et al. 2009), as the critical effect to determine their RfD. NJDWQI stated that this
endpoint is more sensitive than the decreased neonatal BW from Luebker, Case, et al. (2005); Luebker, York,
et al. (2005) and this immune effect is supported by other studies in mice and humans (NJDWQI 2018). NJDWQI
(2018) discussed some concerns and issues related to USEPA’s rationale and selection of the to Luebker, York,
et al. (2005) endpoint.
Texas selected a study with hippocampus synapse structure effects (Zeng et al. 2011) as the critical effect to determine their RfD for PFOS. TCEQ (2016) stated that based on their calculations and examination of potential
RfDs, use of Seacat et al. (2002) and protection again thyroid effects may not adequately protect against
potential neurological developmental effects. Thus, TCEQ (2016) used Zeng et al. (2011), based on their
toxicokinetic extrapolation methods (discussed below), for a lower and more health-protective RfD. NJDWQI (2018) concluded that Zeng et al. (2011) provided only “mechanistic information” and did not include this study in
their evaluation. USEPA discussed the results from Zeng et al. (2011) in their PFOS Health Effects Support
Document; however, it is not clear why this study was not moved forward as a potential candidate for the
PFOS RfD (USEPA 2016).
165

8.3.2 Approaches Used for Animal-to-Human Extrapolation
Given that animal laboratory studies serve as the basis for human health risk assessments (HHRAs), derivation of
human health toxicity values requires conversion of the dose administered to the test species to an appropriate human equivalent dose. In lieu of robust chemical-specific toxicokinetic and toxicodynamic information, the
accepted default method to derive the human equivalent dose is by body-weight scaling to the 3/4 power (that
is, BW3/4), which relies upon the known relationship between BW and the various metabolic and physiological functions of humans compared to rodents (USEPA
2011). The use of BW3/4 scaling for deriving an RfD is recommended when the observed effects are associated
with the parent compound or a stable metabolite in the absence of available chemical-specific toxicokinetic
models (USEPA 2011). When the necessary information is available, the preferred approach is to use chemical-specific physiologically based toxicokinetic modeling to convert toxicologically equivalent doses of orally
administered agents from laboratory animals to humans. Another approach may include using chemical-specific
toxicokinetic and toxicodynamic information to derive chemical-specific adjustments. For chemicals such as long-chain PFAAs that exhibit species-specific pharmacokinetic properties, chemical-specific adjustment using
specific information about the species differences is most appropriate. The type of chemical-specific
pharmacokinetic information that is available dictates the complexity of the human equivalent dose
extrapolation method, which may range from (1) using ratios of rodent to human clearance factors, to (2) using complex physiologically based pharmacokinetic models to extrapolate from administered (oral) dose to
internal dose in the rodent, to internal dose in the human, and then to administered (oral) dose in the human.
Nonpolymeric long-chain perfluoroalkyl substances such as PFOA and PFOS exhibit marked differences in
species-specific pharmacokinetics, mainly due to differences in elimination rates (because of higher renal
reabsorption and serum protein binding in humans relative to rodents). To date, a wide range of technical
approaches are employed to address these species-specific differences for PFOA and PFOS. Examples of some
approaches are described here; however, the ITRC tables posted as an Excel file of the basis for PFOA and
PFOS values in the United States should be consulted more current and detailed description of agency
approaches.
The USEPA chose to rely on animal bioassays that collected internal serum measurements for PFOA and PFOS,
then employ a pharmacokinetic model to estimate the animal’s average serum concentrations for each study-
specific exposure duration (USEPA 2016, USEPA 2016). USEPA used the serum concentration at the NOAEL or LOAEL in the animal studies, rather than administered dose, for animal-to-human dose comparison. USEPA then
used a first-order kinetic model for chemical clearance, using previously published single point estimates for
elimination half-lives and volumes of distribution, to convert the serum concentration at the PFOA or PFOS NOAEL or LOAEL in the animal study to an external administered human (oral) dose that would result in the same serum
concentration in humans.
NJDWQI’s recommended MCL for PFOA and PFOS also relied upon studies that included serum measurements
taken close to the end of the dosing period; NJDWQI conducted dose-response modeling and applied uncertainty factors to the internal serum levels measured at the end of the dosing period from the animal bioassays to derive
a target human serum level. NJDWQI then calculated the RfD by applying the same PFOA clearance factors used
by USEPA to convert the target human serum level to an administered dose in ug/kg-day.
Other agencies within the United States used different approaches for PFOA and/or PFOS. For example, Maine
Department of Environmental Protection used all available animal studies (they did not limit their pool to only
those studies with internal serum measurements) and used the ratio of clearance for the animal species over human clearance to convert the animal administered dose to a human equivalent dose. Agencies such as TCEQ
used the ratio of elimination half-lives to convert the rodent administered dose directly to the human equivalent
administered dose.
166

There are only a few toxicity values derived for short-chain PFAAs, and the methods to extrapolate from animal to
human dose also vary and include either the use of BW scaling (allometric scaling of BW animal1/4 divided by BW human1/4) or the ratios of elimination half-lives. The USEPA (2014) derived a subchronic and chronic toxicity value for
PFBS, based on a subchronic rat study, and used body-weight scaling to derive the human equivalent dose. They
stated that based on information available at the time of their derivation, including a lack of definitive information
regarding pharmacokinetic differences between species, the use of BW scaling was most appropriate. USEPA
(2018) has a draft human health toxicity values report for PFBS.
More recently, the French National Agency for Food Safety, Environment, and Labor (ANSES) also used this same
BW scaling approach when deriving their toxicity values for short-chain PFAAs such as PFBS, PFBA, and PFHxA
(ANSES 2017). Use of the allometric BW scaling approach to calculate a human equivalent dose is the default
approach for chemicals that do not exhibit species-specific adsorption, distribution, metabolism, or elimination processes, and absent chemical-specific information.
Chemical-specific support for the use of BW scaling to derive the human equivalent dose for some short-chain PFAAs has been demonstrated in recent studies. For example, Russell, Nilsson, and Buck (2013) and (Luz et al.
2019) found that elimination rates of PFHxA scale by BW, given that there are no known species-specific
elimination mechanisms that dramatically alter elimination kinetics between species. Citing these reasons, the PFHxA toxicity value and related proposed drinking water standard derived by Michigan uses the allometric BW
scaling due to this chemical-specific information. In contrast, the Minnesota Department of Health used the ratio
of human to rodent half-lives to adjust the rodent-administered dose to a human equivalent dose for their derivation of PFBA and PFBS noncancer health risk limits (MDH 2018, 2017). MI also used the ratio of half-lives for
PFBS to calculate the human equivalent dose for toxicity value derivation (MI SAW 2019; MI DHHS 2019).
The estimation of an RfD includes two additional components that are shown in the ITRC tables posted as an Excel file of the basis for PFOA and PFOS values in the United States and includes the selection of the dose-response
method and uncertainty factors. For dose-response evaluation, either the benchmark dose or the study NOAEL or
LOAEL is utilized as the point of departure, as detailed in the tables. Uncertainty factors used include the standard risk assessment extrapolations as detailed in the tables, and also vary by agency.
8.3.3 Exposure Assumptions
For each of the expsosure factors discussed in this section, See the ITRC tables posted as an Excel file of the
basis for PFOA and PFOS values in the United States for the most current information and details.
8.3.3.1 Body Weights, Drinking Water Ingestion, and Exposure Durations
Once a human health toxicity value is derived in units of ug/kg-day (or ng/kg-day or mg/kg-day), the toxicity value
is combined with exposure parameters to result in the ultimate threshold concentration in drinking water (guidance or standard). The choice of exposure parameters used can be a flexible science-based decision
based on default assumptions or chemical-specific data, or may be set based on regulatory framework. The
exposure parameters used under the U.S. CERCLA program (for example, USEPA regional screening levels) include default exposure parameters and factors that represent conditions for long-term/chronic exposures,
including exposure frequency of 350 days per year, exposure duration of 6 years for a 15-kg child who drinks
0.78 L water per day, or 26 years for an 80-kg adult who drinks 2.5 L of water a day. In contrast to CERCLA, drinking water guidance values and standards (MCLs) developed by USEPA or states are generally based on
lifetime exposure using default adult parameters, and they do not usually include a duration of exposure
parameter. For PFOA and PFOS, USEPA and state agencies have not always relied upon these default exposure parameters. Some have decided to utilize exposure parameters that are specific for more sensitive subpopulations
(infants, children, or lactating/pregnant women). For example, MDH developed a toxicokinetic model to estimate the
total exposure to breast-fed and formula-fed infants (Goeden, Greene, and Jacobus 2019), and this model was used to derive standards in Minnesota, New Hampshire, and Michigan.
167

USEPA combined their toxicity values with exposure parameters specific for lactating women. According to USEPA,
this addressed the potential increased susceptibility during pregnancy and lactation. USEPA used the rate of 54 mL/kg-day based on the “consumers only” estimate of combined direct and indirect water ingestion at the 90th
percentile for lactating women from their Exposure Factors Handbook (see table 3-81 in USEPA (2011).)
Vermont used USEPA Office of Water toxicity values for PFOA and PFOS, but combined those toxicity values with
exposure parameters specific for infants (0–1 year of age), assuming a drinking water intake rate of 0.175 L/kgBW-day (Vermont DOH 2016). Texas chose to combine their state-derived toxicity values with exposure parameters
for children (ages 0–6 years); TCEQ (2016) used the default child BW of 15 kg and ingestion of 0.64 L-day,
equivalent to 0.043 L/kg-day of water.
Minnesota is thus far unique in using specific exposure parameters based on exposure to breast-fed and
formula-fed infants for the derivation of the PFOA and PFOS health-based guidance values. They selected the
95th percentile water intake rates or upper percentile breast milk intake rates (USEPA 2011) and calculated breast
milk concentrations by multiplying the maternal serum concentration by a calculated breast milk transfer factor of 5.2% for PFOA and 1.3% for PFOS (MDH 2018, 2019).
8.3.3.2 Relative Source Contribution
Humans can be exposed to nonpolymeric PFAS, including precursor chemicals, via multiple sources, including air,
food, and consumer and industrial products. The most common route of exposure for the general public is via the
diet, including water, and followed by indoor dust, especially for children. The relative source contribution (RSC) term is used in health-based guidance and standards developed by the USEPA under the federal SDWA and
related state programs to account for potential non-drinking water exposures to chemicals. The concept
ensures that when a criterion based on an RfD for noncancer effects is established for a single exposure
pathway, such as drinking water, potential exposures that occur from other pathways are accounted for so that total exposure does not exceed the RfD (USEPA 2014). The default RSC of 20% means that the drinking water
pathway is assumed to contribute only 20% of the RfD, and all other exposure pathways contribute the
remaining 80%. In practice, therefore, the drinking water concentration based on RfD and drinking water consumption assumptions is multiplied by the RSC (for example, 20%) to account for the other pathways. Following
USEPA’s exposure decision tree (USEPA 2000), USEPA determined that significant potential sources other
than drinking water ingestion exist; however, they concluded that information is not available to quantitatively
characterize exposure from all of the different sources. Therefore, USEPA adopted a default RSC of 20% (0.20) for PFOA and PFOS drinking water health advisories. The RSC term generally does not exist in CERCLA/RCRA-based
remediation programs because baseline risk assessments specifically investigate and quantify risks associated with
all potential site-specific exposure routes (not just drinking water), and then consider a receptor’s cumulative risk.
Therefore, there is no downward adjustment to a residential groundwater (termed “tap water” by USEPA) drinking water screening level, for example, to account for potential other exposures—all site-specific exposures are
quantified.
Some state agencies have incorporated RSC when deriving their state guidance/standards for long-chain PFAAs. For example, New Jersey Department of Environmental Protection adopted a 50% RSC for PFNA (NJDWQI 2015)
and a 20% RSC for PFOA and PFOS (NJDWQI 2017, 2018), which they state also “implicitly accounts for greater exposures to breast-fed and formula-fed infants than older individuals.” Minnesota used an RSC of 50% based on
their analysis of biomonitoring serum concentrations from local and national general populations (MDH 2017, MDH
2017).
Updated September 2020
168

9 Site Risk Assessment
The PFAS Team developed a training module video with content related to this section, it is the Risk Assessment
and Regulations video.
This section discusses the specific challenges associated with assessing and characterizing potential risks to
human and ecological receptors exposed to PFAS in the environment. This includes challenges associated with quantifying the degree of exposure, assessing the hazard associated with PFAS, quantifying the dose-response
relationship, and characterizing risks to support effective risk management decision-making. Generally, the
challenges associated with performing a site risk assessment where the release of PFAS to the environment is
suspected are not necessarily unique. Like any other chemical for which there is limited information, knowledge, or other technical complexity, working through the steps necessary to complete a risk assessment would be
similar.
Section 15.3 provides a case study example illustrating how the New Jersey Department of Environmental Protection used risk assessment science to help support the development of fish consumption advisories for
select water bodies in New Jersey. Section 17.3 provides additional information related to PFAS risk assessment,
including (1) exposure pathways relevant for different exposure media, (2) considerations when calculating
exposure point concentrations, and (3) selecting bioconcentration/bioaccumulation factors.
Section Number Topic
9.1 Human Health
9.2 Ecological Risk Assessment
9.3 Uncertainty
9.1 Human Health
9.1.1 Toxicity Assessment
The toxicity assessment of a site risk assessment involves (1) hazard identification and (2) dose-response
assessment. Hazard identification involves determining whether exposures to a chemical can cause an
increased risk of an adverse human health effect; dose-response assessment involves quantifying the
relationship between the degree of exposure to the chemical and the incidence or severity of the potential
adverse effects. More background on each of these steps is detailed in other guidance (USEPA 1989; ITRC
2015) and is not repeated here.
This section discusses specific complications that may be encountered in completing the toxicity assessment for a site risk assessment involving PFAS.
169

9.1.1.1 Availability of Toxicity Values from a Variety of Sources
A toxicity value (for example, oral CSF, systemic inhalation reference concentration) is a numerical expression of the dose- response relationship for a given substance. It is used in combination with estimates of chemical
exposure to calculate quantitative estimates of cancer risk or noncancer hazard (USEPA 1989). Several state,
national, and international regulatory and advisory agencies have developed human toxicity values for various PFAS that could be potentially used in conducting risk assessments or in support of establishing policies for
PFAS risk management. Given this variety of sources, specific complications can be encountered in
determining which toxicity values to use in conducting a risk assessment:
• Selection of toxicity values for PFAS is dependent on which PFAS are present at a given site.
• PFAS identification and quantification may vary based on analytical method. Differences among toxicity
values for PFAS could arise because agencies may rely on different toxicity value derivation methods,
may select critical studies by different criteria, may use different uncertainty factors, and may make
different judgments about the prioritization of individual PFAS for toxicity value derivation (Table 9-1).
• Available toxicity values may change over time as the results of new studies become available. Newer
toxicity values derived by regulatory agencies may be based on more recent and/or different
information, methods, and studies than older values, as well as differences in scientific professional
judgment and/or different statutory policy requirements. These differences are described in more
detail in Section 8.3.
• All values may not be relevant to all jurisdictions. For example, toxicity values developed by the USEPA may not be accepted in some states or in other countries.
Table 9-1. Example of variability in derived noncancer RfDs for PFOA and PFOS
Noncancer Toxicity Values for Human Health Risk Assessment (ng/kg body weight*day)
Source PFOA Basis PFOS Basis
USEPA (2016)
USEPA (2016)
20
Delayed bone development and accelerated male puberty in mice
(following developmental exposure)
20
Reduced growth rate of offspring
(following developmental
exposure)
ATSDR (2018)
DRAFT
3
Behavioral and skeletal effects in
mice (following developmental exposure) Based on a study USEPA
did not select for consideration, and a
newer study from 2016
2
Used same study, but
noted additional effect
(delayed eye opening)
Added a 10X uncertainty factor to
protect for immunotoxicity
There are several options and procedures for selection of toxicity values, as has been described in ITRC guidance (ITRC 2015). For site risk assessments performed in the United States, USEPA, DOD, and other agencies have
recommended a tiered hierarchy (Tier 1–Tier 3) of toxicity value sources to guide selection and use (USEPA 2003,
2013); (ECOS-DOD 2007). This recommendation has since been implemented in numerous USEPA OSWER
(Currently known as Office of Land and Emergency Management) directives (USEPA 1993, 2003) that further
establish a hierarchy and process for selecting toxicity criteria. For PFAS chemicals as of September 2019:
170
• Tier 1 values are peer-reviewed toxicity values published on the USEPA’s Integrated Risk Information System (IRIS).
• There are no PFAS chemicals in IRIS with published values.
• Tier 2 toxicity values include Provisional Peer-Reviewed Toxicity Values (PPRTV).
• Only for PFBS.
• Tier 3 toxicity values include those from additional USEPA and non-USEPA sources. They can include values that may or may not have been peer reviewed. As recommended by USEPA (2003), in using values
from Tier 3 sources, it may be appropriate to prioritize those that are the most current, have a transparent
basis, are publicly available, have been peer reviewed, and are acceptable to local jurisdictions.
• Available toxicity values for PFAS chemicals are Tier 3 values.
• Additional definitions and discussion of PFAS toxicity values that are available for use are provided
in Section 7 and Section 17.2.
9.1.1.2 Lack of Toxicological Values for Many PFAS
There are more than 4,700 PFAS that could have been, or may be, on the global market (OECD 2018), although
the uses of each of these PFAS may not be known (KEMI 2015). More information about PFAS in use is included in
Section 2. A large number of PFAS are considered bioavailable. However, toxicity values have been developed for
only a few PFAS compounds for which sufficient information is available. Because of the lack of hazard and dose-
response information for other PFAS and the extensive level of effort needed to develop toxicity values, there are
no readily available toxicity values for the majority of PFAS.
This lack of information prevents the establishment of compound-specific risk-based concentrations that can be
helpful for a variety of applications, including data screening (used to help guide site investigation) and site-
cleanup decision-making. In the absence of toxicity values, regulatory agencies and the regulated community are left with uncertainty regarding the potential risks associated with human exposure to impacted environmental
media at sites, technically defensible risk management programs may be difficult to create, and the regulated
community cannot be responsive to concerns about environmental risk.
An approach often used in HHRA in the absence of compound-specific toxicity values is to use toxicity values
developed for structurally or chemically similar surrogate compounds with similar biological activity. In the case of PFAS, this would be for PFAS from the same structural subgroup (for example, long-chain perfluorocarboxylic
acids). The use of surrogates, however, introduces uncertainty, because surrogates may produce adverse
health effects by mechanisms different from the compound of concern, the dose-response curve for a surrogate
may be different, and the target organ or toxicity endpoint may be different from the compound of concern. In
the absence of chemical-specific toxicity values, preparation of health risk assessments may be limited to qualitative methods and have a higher level of uncertainty as a result.
Further information and guidance are needed to identify appropriate surrogates for PFAS that do not currently have available toxicity values. As part of their PFAS Action Plan (USEPA 2019), USEPA is working on developing an
approach to PFAS toxicity testing that could lead to a methodology for inferring the toxicology of a given PFAS
based on the toxicology of a PFAS subset. This involves applying computational and high throughput toxicology tools for PFAS toxicity testing on a larger scale to enable faster understanding of potential toxicity for the universe
of thousands of PFAS, most of which have little or no published toxicity data.
9.1.2 Exposure Assessment
The exposure assessment of a site risk assessment involves characterizing the exposure setting, identifying
relevant exposure pathways and scenarios, and quantifying the magnitude, frequency, and duration of potential human exposure to chemicals in environmental media. More background on the performance of exposure
assessments is detailed in other guidance (USEPA 1989; ITRC 2015) and is not repeated here.
171

This section discusses specific complications that may be encountered in completing the exposure assessment
for a site risk assessment involving PFAS. It should be recognized that the exposure assessment does not generally account for the presence of all PFAS at a site due to limitations in analytical methods. Therefore,
there are uncertainties in the characterization of exposures (and associated risks) at PFAS sites that should be
acknowledged in the uncertainty analysis section of the risk assessment.
9.1.2.1 Determining Scenarios for Potential Human Exposure
A site-specific conceptual exposure model should be developed during the planning stage of the HHRA,
confirmed by stakeholders, and updated as additional information and data are obtained, see Section 3 of the RISK-3 guidance (ITRC 2015). The specific exposure scenarios that are applicable to an HHRA for PFAS include
those that could occur in media at the release area (the site) and in media at distant locations (with the extent
depending on PFAS properties and the site setting). In general, an HHRA for PFAS may be complex in comparison to HHRAs for other types of chemicals (for example, due to the persistence of PFAS, the complexities
associated with PFAS toxicity, and complexities associated with estimating future concentrations or modeling
their fate and transport, and the need to include more media than is typical. Figures 9-1, 9-2 and 9-3 are provided below to illustrate conceptual site models (CSMs) for four sources (two sources are illustrated in Figure
9-3) of PFAS. Section 2.6 discusses potential environmental releases of PFAS. A detailed discussion of fate and
transport processes for PFAS and environmental media that may be affected is presented in Section 5.
Figure 9-1. CSM for fire training area.
Source: Adapted from figure by L. Trozzolo, TRC. Used with permission.
172

Figure 9-2. CSM for industrial sites.
Source: Adapted from figure by L. Trozzolo, TRC. Used with permission.
Figure 9-3. CSM for landfills and WWTPs.
Source: Adapted from figure by L. Trozzolo, TRC. Used with permission.
Various exposure scenarios may be possible for a given site, and which specific exposure scenarios should be
included in a HHRA is a site-specific decision.
The highest exposures to PFAS can occur during early life stages (ages 0–18) (Winkens et al. 2017).
Exposures to infants from breast milk of exposed mothers (Figure 9-4) or formula prepared with contaminated water are higher (on a BW basis) than in older age groups (Fromme et al. 2009; Mogensen et al. 2015; Verner et
al. 2016, Verner et al. 2016; Post, Cohn, and Cooper 2012). The higher exposures during pregnancy and to
infants are of concern because fetuses and infants are sensitive subpopulations for developmental effects of some
PFAS, including PFOA and PFOS (USEPA 2016, USEPA 2016), as discussed in Section 7.1. Therefore, exposure scenarios that include fetuses, infants, children, adolescents, and women of childbearing years should be
considered in HHRAs. 173

Figure 9-4. Biological fate of long-chain PFAAs. Figure 9-5 illustrates the predominant exposure pathways. More detailed information about these exposure
pathways, as well as other environmental medium-specific issues affecting potential human exposure scenarios,
are provided in Section 17.3.1.
Figure 9-5. Predominant human exposure pathways.
174

9.1.2.2 Calculating Exposure Concentrations for PFAS via Fate and Transport Models
When using fate and transport models to calculate exposure point concentrations (EPCs) for PFAS, it is important
to note that individual PFAS have different chemical properties that affect their fate in the environment (Section 5).
Some PFAS are mobile, persistent, and bioaccumulative (in wildlife and humans), and others are not. Perfluoroalkyl
acids (PFAAs) are persistent, and long-chain PFAAs bioaccumulate in humans (USEPA 2003; ATSDR 2020; NTP 2016;
CONCAWE 2016). USEPA has compiled an online resource for PFAS information that includes guidance on environmental behavior and site characterization (USEPA 2017). The National Groundwater Association (NGWA)
has also published a resource on PFAS that includes information about fate and transport (NGWA 2017 (NGWA
2017). Additional information is included in Section17.3.2.
When using environmental fate and transport models for estimating EPCs in biota, modeling should be focused on
the part of the organism that may be consumed either by humans or by ecological receptors. PFAS generally bind
to proteins and accumulate in protein-rich tissues, including the blood, liver, and kidneys (ATSDR 2020). Currently,
models for plant uptake are limited, but several studies have documented uptake of PFAS from soil amended with PFAS-contaminated biosolids (Blaine et al. 2013; Blaine, Rich, Sedlacko, Hundal, et al. 2014; Wen et al. 2016).
Section 17.3.3 includes information about selecting bioaccumulation and bioconcentration factor values.
Measured concentrations at exposure points may differ from modeled EPCs. This may be due to other sources of
PFAS (for example, a nearby site that had a PFAS release to the ground and that subsequently leached to
groundwater) also contributing to concentrations at the exposure point and the limitations of the models currently available.
9.1.3 Risk Characterization
The risk characterization of a site risk assessment combines the results of the exposure assessment and the
toxicity assessment to provide a quantitative estimate of risk (ITRC 2015). It also may include a qualitative
narrative designed to provide decision makers with information regarding key assumptions, uncertainties, or other issues that would be important to understand when making risk management decisions. More background
on the performance of risk characterizations is detailed in other guidance (USEPA 1989; ITRC 2015) and is not
repeated here.
Because risk characterization involves combining the toxicity assessment and exposure assessment, the
complexities discussed in Sections 9.1.1 and 9.1.2 manifest themselves in the risk characterization. There are, however, additional specific complications that may be encountered in completing the risk characterization for a
site risk assessment involving PFAS. This section discusses those specific complexities.
9.1.3.1 Assessing the Cumulative Effects of Exposure to PFAS
The overall potential for noncancer effects due to human exposure to more than one chemical is estimated
using the hazard index (HI), which is computed as the sum of calculated chemical-specific hazard quotients (HQ).
As explained by USEPA (1989), “This approach assumes that simultaneous subthreshold exposures to several
chemicals could result in an adverse effect. It also assumes that the magnitude of the adverse effect will be
proportional to the sum of the ratios of subthreshold exposures to acceptable exposures.” Risk characterizations commonly produce initial estimates of HI by calculating the sum of all HQs. When the HI is estimated to be
greater than 1, there may be potential concern for adverse health effects.
However, when this initially estimated HI is greater than 1, refinement of the HI estimate by segregating HIs by
effect and mechanism of action may be appropriate to support a risk management decision.
For PFAS, as discussed in Section 7.1, there are several possible adverse health effects associated with
exposure. Table 9-2 provides a general summary of the possible noncancer adverse health effects associated
with various PFAS. The information in this table can be used to segregate HIs by potential adverse effect in the
risk characterization when risks associated with exposure to specific PFAS are being evaluated. Table 17-8
(provided as a separate Excel file) includes additional limitations and considerations regarding this information.
175

Table 9-2. Summary of potential noncancer health effects of various PFAS
Adapted from (ATSDR 2019) Health Consultation PFAS HC-508.
9.1.3.2 Characterizing Cancer Risk for Exposure to PFAS
As discussed in more detail in Section 7.1, USEPA (2016), USEPA (2016), and USEPA (2018) described PFOA, PFOS,
and GenX as having suggestive evidence for human carcinogenicity. The International Agency for Research on
Cancer (IARC) has also classified PFOA as possibly carcinogenic to humans (Class 2B). (USEPA 2005) carcinogen risk assessment guidance provides for development of a slope factor for chemicals with “suggestive evidence” when
supported by available data. USEPA (2016) has developed a CSF for PFOA of 0.07 mg/kg-day based on testicular
tumors. In the case of PFOS and GenX chemicals, although USEPA concluded that there is suggestive evidence
of carcinogenic potential in humans based upon liver and thyroid impacts observed in chronic rat studies, the results lacked a dose-response relationship. Because of this limitation, USEPA judged the database too limited to
support a quantitative assessment of carcinogenicity. Likewise, the NJDWQI (2018)
developed a slope factor for PFOS of 9 x 10⁻⁶ ng/kg-day for comparison purposes, but concluded that it is too uncertain to use as the basis for a drinking water value.
Although USEPA and some select states have derived oral CSFs for a select few PFAS, risks associated with PFAS
(including derived risk-based values and screening levels) have been primarily based on noncancer effects.
CalEPA’s OEHHA (2019), however, is unique in that they have issued notification levels for drinking water
exposure that are driven by carcinogenicity. This is predominantly because OEHHA applies additional factors in their calculations to reflect what they consider an increased suseptibility of infants and children to carcinogens, and
OEHHA derived a CSF for PFOS, which USEPA did not. For site risk assessments, the derived CSFs developed by
these agencies could be used (for example, USEPA derived an oral CSF for PFOA of 0.07 mg/kg-day).
Further discussion of the carcinogenicity of PFAS is presented in Section 17.2.4.2 (Carcinogenicity), Section
17.2.5.3 (Chronic Toxicity and Tumorigenicity), and Section 8.2.2.3 (CERCLA).
176

9.2 Ecological Risk Assessment
This section discusses the ability to conduct ecological risk assessments of PFAS and summarizes information
that is currently available to conduct ecological risk assessment of PFAS. The information presented is based on a review of current regulatory guidelines from within the United States and other jurisdictions, peer-reviewed
publications, and other sources as noted. Information needed for performing ecological risk assessments exists
only for some PFAS. Much of the information presented was discussed in a workshop held in August 2019 and sponsored by the Society of Environmental Toxicology and Chemistry (SETAC). The workshop focused on the
state-of-the-science supporting risk assessment of PFAS. A breakout group within that workshop focused
specifically on ecotoxicology and ecological risks of PFAS. The expert panel in that breakout group produced a detailed manuscript describing the currently available information, data gaps, and uncertainties, and
approaches to address these needs (Ankley et al. 2020). Some of the information is discussed here with
reference to the original publications
9.2.1 Ecological Effects Assessment
Identification of ecological risk-based toxicity thresholds is a challenge for many PFAS. Toxicity data are available
as discussed in Section 7.2. Some of these data have been used to establish thresholds as discussed below.
Some major considerations for ecological effects assessment are identifying ecological screening thresholds, understanding ecological receptor variability, and evaluating ecological toxicity of mixtures. These are discussed
in the following sections.
9.2.1.1 Ecological Screening Thresholds
The recently published manuscript by Ankley et al. (2020) includes a discussion of media-specific ecological screening thresholds that are available for certain PFAS around the world: PFOS, PFOA, PFBA, PFPeA, PFHxA,
PFBS, and PFHxS. Ankley et al. (2020) did not claim the list of thresholds to be comprehensive of all ecological
thresholds for PFAS around the world. The discussion here in this section presents thresholds that are included within that document with discussion relevant to ITRC’s intended audience. Ankley et al. (2020) can be
referenced for a more detailed discussion and complete table of available thresholds from around the world.
U.S.—Federal Thresholds Currently, there are no ecological risk-based PFAS guidelines or media screening thresholds available that are recommended by the USEPA. In support of the Air Force Civil Engineer Center, Argonne National Laboratory is
currently developing draft ecological screening thresholds for surface water and soil. Values will be developed for
4-, 6-, 8-, 9-, and 10-carbon linear PFCAs and the 4-, 6-, and 8-carbon linear PFSAs (see Section 2 for detailed naming conventions). Work is being completed in consultation with Tri-Services Environmental Risk Assessment
Working Group, and USEPA’s Ecological Risk Assessment Forum (Ankley et al. 2020). However, these values are
draft and are not yet publicly available. The USEPA is also in the process of reviewing available PFAS aquatic toxicity data to evaluate the ability to develop criteria for the protection of aquatic life and is conducting some of
their own laboratory research to support this effort. However, at the time of publication, USEPA has not announced
a schedule for developing PFAS ambient water quality criteria (AWQC) protective of aquatic life or a schedule for a
final decision on whether AWQC will be developed. There have been a number of published studies and reports that follow U.S. federal guidelines (USEPA 1995) for
developing aquatic life criteria. Giesy et al. (2010), Salice et al. (2018); Conder et al. (2020), and Divine et al.
(2020) all calculated thresholds protective of aquatic organisms exposed to PFOS in freshwater environments. Giesy et al. (2010) also reported a Tier II freshwater value for PFBS, while Conder et al. (2020) derived Tier I
values for PFOS in both freshwater and marine environments and for PFOA for freshwater. Divine et al. (2020)
developed Tier I freshwater values for PFOS and PFOA and Tier II values for 23 other PFAS. Tier I values meet the data required described in USEPA (1995) guidelines while Tier II values are developed with methods that
incorporate uncertainty factors when the availability of required data is insufficient.
Section 16.3 provides greater detailed discussion on the methods for developing thresholds protective of aquatic
life. 177

U.S.—Thresholds for Specific States Several states have established some criteria that are intended to protect aquatic organisms in their respective surface waters. The text below is not intended to be exhaustive and only summarizes some of the values that
were available at the time this text was developed (Spring 2021).
In Michigan, AWQC have been established for PFOS and PFOA based on Rule 57 17 (MI EGLE 2019). This rule is
based on the USEPA Great Lakes Initiative (USEPA 1995), which provides procedures and methodologies to derive
numerical criteria that are protective of aquatic ecosystems. Rule 57 presents a two-tiered methodology in which Tier I procedures are essentially the same as the methods used to derive federal national water quality criteria
(NWQC) (USEPA 1985) and Tier II procedures can be used to derive values where the full extent of the toxicity
data requirements of NWQC are not fulfilled. Rule 57 presents procedures to develop three categories of numeric criteria—final chronic values (FCVs), aquatic maximum values (AMVs), and final acute values (FAVs)—which can
be developed under either Tier I or Tier II. Due to the greater uncertainties associated with Tier II values, and given
their lesser data requirements, these values tend to be more conservative than those derived with Tier I methodologies. The PFOA and PFOS numeric criteria for Michigan are all Tier II values due to the limited amount
of peer-reviewed aquatic toxicity data. The final chronic values for the protection of aquatic life (flora and fauna) for
PFOA and PFOS were 880 and 140 µg/L, respectively, while aquatic maximum values were 7,700 and 780 µg/L, respectively. In addition, the Michigan Department of Community Health (MDCH 2015) derived provisional PFOS
surface water values for mammalian and avian wildlife based on Rule 57 guidance. The surface water avian
wildlife value, based on eagles, kingfishers, and herring gull characteristics, was 0.035 µg PFOS/L. The
mammalian wildlife value, based on otter and mink characteristics, was 0.084 µg PFOS/L. The State of Minnesota has also derived several PFAS-based surface water criteria for the protection of aquatic biota. These values are
based on guidelines in Minnesota Rules chapter 7050 (MR7050). Continuous chronic criteria for the protection of
aquatic biota in surface water are available for PFOA (1,700 µg/L) and PFOS (19 µg/L) (Stevens and Coryell 2007; Stevens and Coryell 2007). Florida has established Provisional Surface Water Screening Levels that are in the
same range as those for Minnesota: 1,300 µg/L PFOA in freshwater, 37 µg/L PFOS in freshwater, and 13 µg/L
PFOS in salt water (FL DEP 2020).
In California, the San Francisco Bay Regional Water Quality Control Board (SFB RWQCB) has released Interim
Final Environmental Screening Levels (ESLs) for PFOS and PFOA (SFB RWQCB 2020). These values were specifically developed for use within the jurisdiction of the specific water board, not the state of California, not the
California Department of Toxic Substances Control, and not the entirety of the United States. Other jurisdictions
may use these values, as is often the case with many published thresholds. However, with the number of different
water boards in California, it is important to understand the applicability of these ESLs. These values include groundwater protection levels that are protective for direct exposure to freshwater and marine organisms,
including rare, threatened, and endangered species. The values are based on a 99% protection level (lower 1st
percentile of a species sensitivity distribution [SSD]) compared to a 95% protection level (lower 5th percentile of an
SSD) used for a typical AWQC. There are also groundwater ESLs that are protective of adverse effects to birds
and mammals from the consumption of aquatic prey (Table 9-3). These wildlife protection values (listed by the
SFB RWQCB and in Table 9-3 as secondary poisoning ecotoxicity) are based on values published in Divine et al.
(2020). Separate soil ESLs are included in the SFB RWQCB document that are protective of (1) plants and invertebrates or (2) birds and mammals. There are two soil ESLs for each chemical for both significantly
vegetated and minimally vegetated areas for a total of four distinct values each for PFOS and PFOA as shown in
Table 9-4.
178

Table 9-3. SFB RWQCB groundwater ESLs: Aquatic habitat ecotoxicity levels for PFOS and PFOA (SFB RWQCB 2020)
Protected Organisms PFOS (µg/L) PFOA (µg/L)
Direct exposure ecotoxicity: Freshwater 0.56 540
Direct exposure ecotoxicity: Saltwater 2.6 540
Secondary poisoning ecotoxicity: Freshwater and saltwater 0.075 4.4
Table 9-4. Soil ESLs: Terrestrial habitat levels (SFB RWQCB 2020)
Protected Organisms PFOS (mg/kg) PFOA (mg/kg)
Significantly vegetated areas
Plants and invertebrates 7.7 0.084
Mammals and birds (NOAEL-based) 0.013 0.57
Minimally vegetated areas
Plants and invertebrates 33 0.84
Mammals and birds (LOAEL-based) 0.05 1.1
International Thresholds Environment and Climate Change Canada (ECCC, previously known as Environment Canada) has proposed ecological Federal Environmental Quality Guidelines (FEQGs) for PFOS in surface waters, fish tissue, wildlife
dietary values, and bird eggs (ECCC 2018). The PFOS threshold for surface waters was derived from a SSD
based on long-term toxicity data that included data for amphibians, fish, invertebrates, phytoplankton, and macrophytes. The guideline to protect all aquatic life forms for indefinite exposure periods to PFOS in surface
waters is 6.8 µg/L, and a whole-body fish tissue guideline value of
9.4 mg/kg wet weight (ww) was based on these fish data and bioaccumulation factors for bluegill from Drottar, Van Hoven, and Kruger (2002). The tissue threshold is intended for both freshwater and marine environments. It was
not calculated with both food and water (direct media) BAFs, and thus it could be underprotective. However, Giesy
et al. (2010) did use Drottar, Van Hoven, and Kruger (2002) data to calculate an acute no-effect threshold of 87
mg/kg ww whole-body fish. To protect mammalian and avian consumers of aquatic biota, ECCC derived wildlife dietary toxicity reference values (TRVs) using mammalian studies and avian chronic toxicity data. For mammals,
the dietary value for PFOS was 4.6 µg/kg ww food while
the avian dietary value was 8.2 µg/kg ww food. Based on the avian reproduction studies that were the basis for the dietary values, a guideline of 1.9 µg/g ww whole egg was also derived for PFOS.
179

Screening level assessment values have also been derived for PFOA (Environment Canada 2012). Environment
Canada derived several predicted no-effect concentrations (PNECs) for PFOA for ecological species. PNECs are
intentionally conservative concentrations of chemicals designed to represent a concentration at which no
adverse effects are likely. These PNECs for PFOA were based on LOAEL values from a limited set of single
organism toxicity studies adjusted with uncertainty factors. FEQG values are developed from a distribution of acute
and chronic studies conducted on groups of organisms with an intent to be protective of a set percentage of
organisms in that category (for example, a 95% protection threshold). Thus, these PFOA PNECs are not equivalent to FEQGs, though they still provide utility for screening level ERA. The PNEC for aquatic organisms, based on a
study with the freshwater alga Pseudokirchneriella subcapitata, was 20 µg/L; a mammalian wildlife study based on
cynomolgus monkey (Macaca fascicularis) derived a liver-based PFOA PNEC of 158 µg/kg ww. However, given the uncertainties associated with these values, care should be taken in their application to ERA. FEQGs for PFOA are
currently under development by ECCC (ECCC 2018).
The Australian and the New Zealand Environment and Conservation Council and Agriculture and Resource
Management Council of Australia and New Zealand (ANZECC/ARMCANZ) have established draft protective concentrations for freshwater organisms exposed to PFOS and PFOA. The values, as shown in Table 9-5, were
developed by the Cooperative Research Centre for Contamination Assessment and Remediation of the
Environment (CRC CARE) (2018). Only the freshwater values have been adopted in the PFAS National Environmental Management Plan for Australia and New Zealand (HEPA 2020). The protocol for developing
guideline values in Australia (Warne et al. 2018) includes some specifications for full lifecycle and
multigenerational testing that were not sufficiently represented in the limited available marine studies. Instead,
the freshwater values have been identified as interim thresholds for marine waters. The values from CRC CARE incorporated multiple studies and were based on SSD for each compound. The 90 and 95% protective thresholds
for PFOS are 2.0 and 0.13 µg/L, respectively. These values are within the range of other published values
(Giesy et al. 2010; Qi et al. 2011). A 99% protection value for PFOS was also proposed as 0.00023 µg/L, though this may be below ambient concentrations. It should be noted that the freshwater SSD and subsequent
protection values are influenced by a multigenerational study (Keiter et al. 2012) with zebra fish (Danio rerio) that
produced data that are noticeably lower than other data. Efforts to validate the data by repeating the study and
its methods are ongoing at the US Army Corps of Engineers Environmental Research and Development Center (Gust et al. 2021). The ongoing work includes an expanded and more carefully determined dosing range, greatly
increased replication base on statistical power analysis, expanded analytical chemistry with external validation,
and an expanded suite of endpoints to improve overall toxicological context (Gust et al. 2021). All three of the
PFOS protection values are taken from an SSD that includes studies on the low end that are well below the majority of other data points. Further, as indicated in table B3 of CRC CARE (2018), data used in the SSD include
a mix of effect levels (EC10) and no-effect levels (NOECs). Thus, decisions based on these values should be
made with careful consideration.
For PFOA, the 90 and 95% protective thresholds were 632 and 220 µg/L, respectively; these are similar to those derived in Minnesota and Michigan. Marine threshold values for PFOS were 32 and 7.8 µg/L for the 90 and
95% protective levels. For PFOA, the 90 and 95% protective thresholds for marine water were 14,000 and 8,500
µg/L, respectively. It is of note that the threshold values for marine species were at least 1–2 orders of magnitude greater than those from freshwater. Thus, one should take care in using freshwater toxicity data or
threshold values when evaluating marine and brackish systems, given the apparent differences in species
sensitivity between these two environments. Likewise, caution should be used if employing marine values to
evaluate other PFAS for which there are no freshwater threshold values.
180

Table 9-5. Aquatic thresholds developed by CRC CARE (CRC CARE 2018)
Species Protection (%) PFOS (μg/L) PFOA (μg/L)
Freshwater
80 31 1,824
90 2 632
95 0.13 220
99 0.00023 19
Marine
A number of thresholds for PFOS are also available from the European Union (EU) as described in the Environmental Quality Standards Dossier (EQS) for PFOS (European Union 2011, 2013). These include maximum
acceptable quality standards (MAC-EQS) for freshwater and marine ecosystems, and annual average quality
standards (AA-EQS) for the same ecosystems. Standards are also available for secondary poisoning (that is, consideration of biomagnification through the consumption of contaminated prey). These values are shown in
Table 9-6.
Table 9-6. Environmental quality standards (EQS) for PFOS (European Union 2011, 2013)
Category/Description Units Value
MAC-EQS (freshwater) (European Commission 2011, 2013) μg/L 36
MAC-EQS (marine) (European Commission 2011, 2013) μg/L 7.2
Pelagic Community EQS (freshwater) (European Commission 2011) μg/L 0.23
Pelagic Community EQS (marine) (European Commission 2011) μg/L 0.023
QS biota, sec pois (European Commission 2011) mg/kg (ww) 0.033
QSbiota, sec pois
(freshwater) (European Commission 2011) μg/L 0.002
QSbiota, sec pois
(marine) (European Commission 2011) μg/L 0.00047
EQS (biota) (European Commission 2011, 2013) μg/L 9.1
AA-EQS (freshwater) (European Commission 2011, 2013) μg/L 0.00065
AA-EQS (marine) (European Commission 2011, 2013) μg/L 0.00013
MAC-EQS = maximum acceptable environmental quality standard AA-EQS = annual average environmental quality
standard
QS biota, sec pois = secondary poison standard for concentration in fish tissueQS = quality standardEQS (biota)
– environmental quality standard
Species Protection (%) PFOS (μg/L) PFOA (μg/L)
80 130 22
90 32 14
95 7.8 8.5
99 0.29 3
181

Other Considerations for Thresholds A survey of reports from various regulatory agencies demonstrates that although ecotoxicity data are available for various PFAS, including PFBA, PFBS, and fluorotelomers (including 8:2 FTCA, 8:2 FTUCA, and several FTOHs), to
date these typically consider only a few aquatic species that include D. magna, a green alga, and perhaps a fish
species. Regulations require a robust data set covering several classes of organisms, and due to limitations in the
number of classes of organisms represented in the published peer reviewed data, it is difficult to derive ambient
surface water quality criteria. Lack of relevant toxicity data is a greater issue for terrestrial wildlife given that the
only chronic, reproductive studies with PFOS and PFOA that have been conducted to date are in two species, the
bobwhite quail (Colinus virginianus) and mallard duck (Anas platyrhynchos). No ecologically relevant studies have been conducted with mink or an adequate surrogate. As a result, the development of benchmark or threshold
concentrations for wildlife and aquatic organisms has been slow and incorporates greater levels of uncertainty in
their derivation.
Research on observed effects in benthic invertebrates and other benthic aquatic life with direct exposure to
sediments contaminated with PFAS is limited. There are no published benchmarks and little published research.
Research has focused more on aqueous exposure pathways. Observational data and monitoring have been used
in some cases to develop an understanding of what exposure may be associated with effects. The Norwegian
Pollution Control Agency (NPCA) established a sediment no-effect threshold of 220 µg/kg, a chronic toxicity range
of 220–630 µg/kg, and an acute short-term effects range of 630–3,100 µg/kg (NPCA 2008; Bakke et al. 2010) for
benthic invertebrates. The technical basis for the NPCA values relied on the principles of equilibrium partitioning
(EqP) between sediment and surface water using a partitioning coefficient (Kd). The no-effect sediment value is
based on a PNEC of 72 µg/L from a limited data set and an unspecified Kd. A sediment screening value of 6.7
µg/kg (wet weight) from the United Kingdom’s Environment Agency (2004) was also developed using EqP with a PNEC of 2.5 µg/L and a river sediment Kd of 8.7 L/kg. Simpson et al. (2021) have estimated sediment thresholds of
60 µg/kg PFOS and 250 µg/kg PFOS (both normalized to 1% organic carbon) protective of 99% and 95% of
species, respectively, based on EqP using a Kd of 10 L/kg with an HC1 of 6 µg/L and HC5 of 25 µg/L. HC5 and HC1 are commonly established for contaminants from SSDs developed for the contaminant. These HCx (for example a
HC5) represent the concentration above which the lower x proportion of species in the distribution may see
adverse effects.
All of these sediment thresholds were reported for PFOS concentrations in marine sediments, though they provide some basis for screening level risk decisions for both marine and freshwater. Caution should be
observed in using these values because associated effects, if any, are unclear, and the original work is not
readily available. Caution should also be used in applying these NPCA sediment values from marine waters to freshwater because the freshwater organisms could be more exposed (as explained in Section 9.1.2) and either
more or less sensitive than marine organisms. In its EQSD for PFOS,
the European Union (2011) took the position that there is insufficient data available to confirm the need for a
sediment quality standard and insufficient data to derive a threshold, thus electing not to develop a value.
Similarly, a workgroup in northern Italy concluded that there was no need for a sediment environmental quality standard (EQS) for PFOA, PFBS, PFBA, and PFPeA and that data for a sediment EQS for PFHxA were
insufficient (Valsecchi et al. 2017).
For soil, CRC CARE developed soil screening thresholds from SSDs for both PFOS and PFOA. The Canadian
Council of Ministers of Environment (CCME 2018) have also developed several draft thresholds for PFOS in soil. A
value protective of direct toxicity was developed from an SSD of plant and invertebrate IC25 values (the
concentration at which a 25% reduction in a non-lethal biological measurement, such as growth or reproduction, occurs). Food chain models were used to develop values protective of soil and food ingestion by wildlife. CCME
(2018) also developed a soil screening value protective of aquatic life for use at sites where off-site migration to
nearby surface water bodies may be a concern. These values from CCME were issued draft for public comment, and final FEQGs have not yet been established. Soil threshold values for other PFAS, however, are limited.
182

9.2.1.2 Ecological Receptor Variability
Another major challenge with toxicity assessment for ERA is accounting for the large number of receptor types and the associated unknown variable sensitivity to PFAS. Although it is commonly understood that sensitivity to
contaminants can vary widely across kingdoms or across classes of animals, the challenge for PFAS may be
greater due to the lack of knowledge about this family of compounds. Studies have documented the presence of PFAS in various aquatic species since the 1950s (Danish EPA 2015; Giesy and Kannan 2001, 2002), such as
bottle-nosed dolphins (Houde et al. 2006), seals (Butt et al. 2008), squid (Yang et al. 2012), alligators (Bangma
et al. 2017), and polar bears (Smithwick, Mabury, et al. 2005; Smithwick, Muir, et al. 2005; Greaves and Letcher 2013). The detection of PFAS within organisms is clear
evidence of exposure. Unlike many other commonly detected contaminants, however, the availability of
toxicological data for PFAS is limited relative to the broad range of organisms within which PFAS have been detected.
Standard ERA practice includes developing TRVs that consider measures of exposure and effects that could
adversely impact populations of wildlife (for example, chronic studies on reproduction, growth, and survival). Mammalian studies on numerous sublethal endpoints (for example, systemic, immunological, developmental,
respiratory, cardiovascular, gastrointestinal, ocular, hepatic) have been conducted for PFOS, PFOA, and other
PFAS and are well described in the Toxicological Profile for Perfluoroalkyls (ATSDR 2021), but these are less
commonly used for TRV development for ERAs. These sublethal, mostly systemic or organ function-based TRVs are really only used for ERAs in the absence of reproduction, survival, or growth data. Mammalian TRVs for the
purposes of ERA can be developed for the majority of the Third Unregulated Contaminant Monitoring Rule
(UCMR3) PFAS compounds listed in Section 8.2.2.2. Recommendations for selecting TRVs from available data for conducting ERAs are included in Divine et al. (2020), Conder et al. (2020), and Johnson et al. (2021). Avian
oral dosing studies useful for ERA are less available. The dietary acute and chronic studies by Newsted et al.
(2005); Newsted et al. (2007) examining PFOS exposure in mallard and bobwhite quail were the first published work relevant to ERA. Divine et al. (2020) and Conder et al. (2020) presented the data from their studies as well
as data from other studies and for other PFAS that can be used for selecting avian TRVs. More recent
publications relevant to ERA include that of Bursian et al. (2021), who looked at oral exposure of Japanese quail (Cortunix japonica) to PFOS, PFOA, and AFFF (both 3M and Ansul products), and (Dennis et al. 2020; Dennis et
al. 2021) who looked at northern bobwhite quail exposed to PFOS and PFHxS. Newsted et al. (2005) and Molina
et al. (2006) have also reported the results of bird egg injection studies using PFOS, while Cassone et al. (2012) and Norden, Berger, and Engwall (2016) have published in ovo studies with other PFAS. A caution with interpreting
these egg studies is the uncertainty as to whether naturally accumulated concentrations have the same
adverse effect as concentrations administered via injection in ovo. There also can be differences when
measuring whole egg, yolk, or albumin (Custer, Gray, and Custer 2010). Finally, there is currently not enough data for modeling egg tissue concentration for these chemicals.
Reptiles are among the least studied vertebrate taxa in ecotoxicology (Hopkins 2000; Weir, Suski, and Salice
2010) despite contamination threatening reptile populations worldwide (Gibbons et al. 2000). A recent study
(Furst, Weible, and Salice 2019) exposing brown anoles (Anolis sagrei) to PFOS and PFHxS provides data relevant
to ERA. Measures of apical endpoints included decreased growth of juveniles exposed to PFOS, while exposure to PFHxS resulted in decreased egg viability in female anoles. To date, there are no other published reptile
toxicity data available for any PFAS, although studies have shown PFAS tissue concentrations from some
reptile species (Wang, Zhang, et al. 2013; Bangma et al. 2017).
Amphibian toxicity data are also limited, though more are available than are reptile data. Toxicity tests are
available for eight different PFAS in the USEPA ECOTOX database and address exposure to four different species:
the African clawed frog (Xenopus laevis), western clawed frog (X. tropicalis), Asiatic toad (Bufo gargarizans), and
northern leopard frog (Rana pipiens)(USEPA 2019).
183

A recent study (Flynn et al. 2019) is also available that looked at effects in American bullfrogs (Rana catesbeiana)
exposed to a mixture of PFOS and PFOA. A laboratory bioaccumulation study (Abercrombie et al. 2019) of PFOS
and PFOA in the eastern tiger salamander (Ambystoma tigrinum) and the American toad (Anaxyrus americanus) also provides some useful data for ERA.
For lower trophic-level organisms such as plants and invertebrates, toxicological data are typically generated through studies with direct exposure to spiked media. Studies are available to develop thresholds for use in ERAs, as has
been done by ECCC (2018), CRC CARE (2017), Conder et al. (2020), and Divine et al. (2020). SSDs produced by
CRC CARE (2017) showed lettuce to be more sensitive to PFOS than earthworms, but found the opposite occurred
for PFOA. Divine et al. (2020) calculated Tier I water quality values for PFOS and PFOA, Tier II water quality values for another 21 PFAS, and soil screening values for plants and soil invertebrates for 6 PFAS each. Giesy et al. (2010)
and ECCC (2018) generated PFOS SSDs for freshwater aquatic organisms, from which thresholds were derived.
CRC CARE presented SSDs for PFOS and PFOA for marine waters and for soil to establish their thresholds. Giesy
et al. (2010) noted that some guidelines for developing criteria from SSDs rely heavily on the four lowest effect
concentrations; thus, results can be skewed if one genus or species is significantly more sensitive than others. In
the freshwater SSD for PFOS generated by Giesy et al. (2010), Chironamous tentans (a species of midge) were 40
times more sensitive than the next most sensitive species, the fathead minnow (Pimephales promelas). However,
the ECCC (2018) SSD does not show the same difference in sensitivity with a reported 14- day growth LOEC for
Japanese rice fish (Oryzias latipes) below the C. tentans 10-day NOEC. For marine waters, fish are among the most
sensitive organisms for both PFOS and PFOA as shown in SSDs (CRC CARE 2017), but they are more sensitive
by just an order of magnitude or less. Additional studies by Simpson et al. (2021) and Hayman et al. (2021) have
expanded the understanding of potential toxic effects in aquatic organisms in marine waters but an SSD that
includes data from both of these studies has not been published.
SSDs have not been published for avian, mammalian, reptilian, or amphibian species. Although SSDs could
possibly be generated for laboratory mammalian species exposed to some PFAS, data are insufficient to
generate robust SSDs that are applicable to wildlife species. Mammalian SSDs would include mostly rat and mouse studies with a few monkey and rabbit studies. Extrapolation to other orders would be required. Existing
data would be more conducive to an effects distribution because the number of species within the class of
organisms would be so limited. A limited amount of published data is available for avian, reptilian, or amphibian
animals, but these data are insufficient to determine a robust SSD or even an effects distribution.
Available toxicological data clearly do not adequately cover the range of organisms that are exposed to PFAS or within which PFAS have been detected, nor do the data have much breadth for chemicals beyond PFOS and
PFOA. Sensitivity variation for aquatic organisms is evident from the SSDs, and likely sensitivity ranges for
untested wildlife leave a clear knowledge gap for some or even most ERAs. However, this problem is not unique to PFAS. As with many other bioaccumulative and biomagnifying compounds, this knowledge gap can be addressed
by using available data from surrogate organisms (for example, the closest taxonomic laboratory test species) and
making some assumptions. The uncertainty in the potential difference in sensitivity needs to be acknowledged and discussed within ERAs. However, pending the outcome of quantitative analysis, risk conclusions and even risk
management decisions are possible on a site-specific basis. Although extrapolations with surrogates is a common
practice in ERA, caution should be used and decisions should be made in concurrence with regulatory agencies
or other applicable stakeholders.
184

9.2.1.3 Ecological Toxicity of Mixtures
An additional major challenge in effects assessment for PFAS is considering the toxicity of mixtures. PFAS nearly always occur as complex mixtures in natural environments with multiple PFAS present at concentrations that
vary by site and source of PFAS. At this time there are only limited data available to understand the toxicity of
more than just a few chemicals based on single chemical exposure experiments such as direct toxicity to lower trophic level organisms or dietary exposures to upper trophic level wildlife. Thus, the ability to understand the
toxicity of mixtures is limited by the scarcity of available toxicity data. However, in the absence of such data,
several strategies using structural and physical properties and toxicity information from PFAS with available data
may be helpful to infer potential mixtures effects, including mixtures with PFAS of unknown toxicity. These strategies include the use of in silico predictive techniques (for example, quantitative structure-activity
relationships (QSARs)), using read-across from data-rich PFAS to inform data-poor PFAS, and estimating potential
mixture risk using dose-addition risk assessment methods (for example, hazard index or relative potency factor
approaches). Examples of published studies using QSAR for estimating PFAS toxicity include Hoover et al. (2019), Kovarich et al. (2012), and Cheng and Ng (2019) and additional citations within each of those publications.
These studies typically evaluate an in vitro endpoint (such as cell death (Hoover et al. 2019)) or in silico
measurements (such as the binding ability of known PFAS to specific cellular proteins (Cheng and Ng 2019; Kovarich et al. 2012)) and then use QSAR to estimate how other PFAS would respond to that same endpoint or
target.
Most of these studies aim to fill data gaps for individual PFAS. Since it is not yet clear how PFAS may cause toxicity to various ecological receptors, the applicability of these data to ecological risk assessment of mixtures is unknown.
However, with additional chemical-specific data, methods for estimated combined toxicity, such as hazard index
or relative potency factors, could then be applied. Caution should be used when applying any of these approaches; some of these methods are novel and others may be well established but are predicated on specific
data-supported assumptions that have not been universally accepted. Standardized toxicity tests, such as those
performed with terrestrial and aquatic invertebrates and plants, are available for performing controlled dosing experiments and for exposure tests with field samples containing natural mixtures. Laboratory dosing
experiments with whole mixtures, mixtures of prioritized PFAS, or with specific formulations, and with exposure
concentrations that bracket environmental relevance, are all needed to inform ecological toxicity of mixtures.
There are a number of ongoing research projects investigating simultaneous exposure of ecological receptors
to multiple PFAS (primarily the UCMR3 chemicals) and their precursors, with these studies mostly using binary mixtures (Lee et al. 2017; Flynn et al. 2019; Bursian et al. 2021; Dennis et al. 2020; McCarthy et al. 2021).
However, the relative toxicity, additivity, or synergistic effects of PFAS remain incompletely understood and still
uncertain. McCarthy, Roark, and Middleton (2021) discussed some of the challenges with designing, conducting,
and interpreting toxicity tests with mixtures of PFAS. The understanding of PFAS mixtures is still developing and there is little consensus in the scientific community regarding how to assess the potential adverse impacts of
PFAS mixtures. Complicating a limited understanding of PFAS mixture toxicity is that both absolute and relative
concentrations of PFAS mixtures will vary across sites and across time. Reliance on empirical data such as site-specific toxicity sampling or community structure studies ultimately may be needed to fully understand the
potential impacts of mixtures.
185

9.2.2 Ecological Exposure Assessment
Detections of PFAS in tissues of top predators within both aquatic and terrestrial ecosystems (Section 6.5) points
to ongoing exposure from bioaccumulative and possibly biomagnifying PFAS (Section 5.5.3). Thus, accuracy and realism within exposure and risk estimates for PFAS are important to making informed risk management
decisions. With the challenges of accounting for multiple exposure pathways, building strong food web and
ecological exposure pathway models is an important foundation of PFAS ERAs. Once completed, these models can be used to identify the key receptors and measures of exposure to complete the assessments.
For aquatic ecosystems, published data from laboratory studies and specific field sites are available that include
both BCFs, BAFs, and biota-sediment accumulation factors (BSAFs). These values, some of which are discussed
and presented in Section 5 and Table 5-1 (provided as a separate Excel file), can be used to model the measures of exposure for aquatic ecosystems. (Larson, Conder, and Arblaster 2018) used such data to conduct
food chain modeling in four different avian receptors.
Published values for fish are common; however, to date these values are not standardized in how they are
reported (for example, wet versus dry weight; organic carbon or lipid normalization). Most importantly, these data are highly variant (Table 5-1); Environment Canada (2006) reported that field BAFs for PFOS in Canadian biota
range from 6,300 to 125,000. Burkhard et al. (2012) reported that within published data sources (Giesy et al.
2010; Houde et al. 2006), laboratory and field bioaccumulation metrics usually do not agree. According to Burkhard et al. (2012), field-generated BAFs (wet weight tissue to field water plus some ingestion) for PFOS
exceed BCFs (wet weight tissue to lab water) predicted in the laboratory. This is undoubtedly due to the inability
or inaccuracy of laboratory models to account for both direct and food ingestion exposure pathways. LaRoe et
al. (2017) pointed out that laboratory values include only accumulation across the gill membrane. Thus, ERAs are challenged with attempting to address both pathways. Larson, Conder, and Arblaster (2018) demonstrated
that using environmentally relevant sediment concentrations with standard food chain models with both
BSAFs and BAFs suggested sediment pathways may be underrepresented and studied. Although the combination of direct and ingestion pathways is primarily a challenge for aquatic systems, assessing risk to
wildlife exposed to multiple media (for example, amphibians, semiaquatic wildlife) is also problematic. As noted
by Divine et al. (2020), there are differences between the numeric value of BSAFs developed from field data
versus laboratory methods, and also between values from laboratory studies using the same methods.
In addition to fish, accumulation values for benthic organisms (California black worm, Lumbriculus variegatus,
Higgins (Higgins et al. 2007) and (Lasier et al. 2011); oysters, Ostrea edulis, (Thompson et al. 2011) and pelagic
invertebrates (D. magna), (Dai et al. 2013)) have also been reported. Example BSAF values from Lasier et al. (2011) for PFOS, PFOA, PFNA, PFBS, and PFHpA range from 7 to 49 kg sediment/kg tissue wet weight (as
reported by authors). Divine et al. (2020) and Conder et al. (2020) summarized BSAFs for aquatic invertebrates
and bivalves and for aquatic crustaceans for 15 PFAS. Both reports also discussed a variety of PFAS BAFs for amphibians, aquatic plants, benthic invertebrates, crustaceans, and fish.
There is overlap, as well as difference, in the studies discussed and presented by Conder et al. (2020) and
Divine et al. (2020). Much of this data is also described in Section 5.5. The Conder et al. (2020) report leans
toward describing available data while the Divine et al. (2020) report goes a step further and attempts to apply the data to develop screening values from wildlife food web models, similar to the secondary poisoning values
available in the EU (Table 9-6).
Data for terrestrial systems are limited to primarily plants (agricultural crops) and earthworms, with little available
for vertebrate prey tissue. One exception is Müller et al. (2011), which published data for a soil-to-caribou-to-wolf BAF used by ECCC (2018) in establishing a soil threshold protective of terrestrial carnivores at 2.6 mg PFOS/kg
soil. In nearly all cases, these BAFs and BSAFs are available only for PFOS, though the Lasier et al. (2011) study
can be used to identify BSAFs for five of the six UCMR3 PFAS.
186

Caution should be used in applying any of the published bioaccumulation or biomagnification data for desktop
exposure estimates that are in turn used to justify remedial action. Several factors and uncertainties are associated with performing desktop food chain modeling with the limited amount of published data. Some of these
considerations include the following:
• differences in diets of receptors at investigation sites versus that of studies documented in the
published literature: differences in the proportions of prey items; differences in the uptake and
elimination rates of PFAS or overall bioaccumulation of PFAS by the prey
• differences in physiology between the site receptors and those in published literature: capacity and
magnitude of transformation; metabolism and uptake and elimination rates of PFAS; the amount/composition of protein- containing tissues to which PFAS bind; species home range and
migration
• differences in physiochemical properties of the abiotic media containing PFAS between investigation
sites and published study sites: bioavailability and uptake of PFAS; environmental processes (photolysis, hydrolysis, microbial aerobic and anaerobic metabolism); the presence of precursors. There is not a
sufficient set of bioaccumulation data to date to account for these variations. Such studies were part of
the 2019 Statements of Need for Strategic Environmental Research and Development
Program(SERDP) grant projects.
These uncertainties are not completely unique to PFAS, as there are many other contaminants for which risk
assessments are performed. Though there is some uncertainty with desktop food chain models for PFAS based on abiotic media, quantitative modeling does not need to be avoided. Two conclusions should be reached through
food chain modeling with abiotic media and literature based BAFs/BSAFs/BCFs: either concentrations at the site
are sufficiently low such that it can be concluded that risk to the environment is negligible and acceptable or
concentrations suggest further evaluation by either refined baseline problem formulation or a baseline ecological
risk assessment (BERA). Conducting BERAs for sites with PFAS should not be substantially different from BERAs
for sites with other chemicals. Either in situ or ex situ direct toxicity tests with representative organisms can and
should be performed when exceeding the limited ecological risk thresholds that are available. Likewise, measured
concentrations of PFAS in prey should be obtained if desktop food chain modeled exposure exceeds TRVs. But the biggest challenges for measuring PFAS in biota have to do with the unique analytical chemistry method issues
(Section 11). Challenges such as selecting the correct biota to sample, matching the prey items to the diets of
upper trophic level biota, or obtaining sufficient tissue volume for chemical analysis may exist, but these issues
are not unique to PFAS investigations.
187

9.2.3 Risk Characterization
Some aquatic toxicity data (Table 7-1 provided as a separate Excel file) are available for environmental risk
assessment for a few PFAS, but wildlife data are still incomplete. Adequate, though not abundant, data are available for completing wildlife risk assessment, primarily for PFOS. The ability to complete risk assessments for
other PFAS regularly analyzed and detected in environmental investigations (Section 6) is limited. However, with
the exposure data discussed in Section 5.5 and Section 6.5, and methods discussed in Section 9.2.2, the foundations of a quantitative risk characterization can be completed for PFOS and to an extent, PFOA. Risk
assessment for other PFAS can be made with some conservative assumptions and use of PFOS data as a
surrogate. The ability to combine effects thresholds (Section 7.2) and exposures to characterize risk to
environmental receptors is outlined in a few publicly available sources. McCarthy, Kappleman, and DiGuiseppi
(2017), Conder et al. (2020), and Divine et al. (2020) have identified exposure factors and effects thresholds
that can be used for completing quantitative ERA within current regulatory frameworks. The risk characterization of
any chemical has uncertainty associated with it, and ecological effects characterization for PFAS is no exception.
However, at this time based on the data presented in this section, meaningful PFAS risk management decisions
can be supported in some situations using the current state of ecological risk assessment science. Broad risk management decisions regarding the ecological risk of PFAS should not be made for most risk assessments. In
some cases, with consideration of the knowledge gaps and uncertainties for the site-specific scenarios being
evaluated, stakeholders can work together to reach defendable scientific management decisions. Such risk characterizations using non-site-specific abiotic media, surrogate information, and tools can form the basis of
screening level assessments. These screening assessments can be used to make more informed decisions
regarding the need for site-specific assessments, including the collection of site-specific tissue data. However,
within these screening assessments, discussion of the uncertainties and data gaps and assumptions made should be included to inform the risk management decisions.
188

9.3 Uncertainty
In performing a site risk assessment, including information and a discussion regarding key factors of uncertainty
in the risk characterization can be important. As noted by USEPA (1989), the source and degree of uncertainty
associated with the risk characterization is needed to help decision makers (for example, risk managers,
stakeholders), with sufficient level of detail to allow them to make informed risk management decisions
(National Research Council 2009).
As noted throughout this guidance, while the science of characterizing and evaluating potential risks associated
with PFAS exposure continues to develop, there are still uncertainties that arise in conducting site-specific risk assessments for sites with PFAS impacts. This section lists potentially critical uncertainties that, depending on the
methodologies and assumptions used in a particular site-specific risk assessment, may warrant a discussion to
help decision makers and stakeholders interpret and appropriately use the results of a risk assessment.
9.3.1 Fate and Transport
Site-specific risk assessments typically characterize risks associated with potential contaminant exposure that could occur currently or in the future. To characterize potential future exposures, conservative models are often
used as tools to predict the fate and transport of chemicals in the environment. With regard to PFAS fate and
transport, uncertainties can be introduced as follows:
• Estimating future environmental concentrations due to airborne wet and dry deposition (Section 5.3.2)
• Estimating the transformation of PFAA precursors to PFAA daughter end products (Section 5.4.2, Section 10.4.4) in the environment
• Modeling groundwater transport considering such factors as chemical-specific retardation (Section
10.4.1) and back-diffusion (Section 10.4.3.3)
• Estimating the bioaccumulation/bioconcentration of PFAS (Section 5.5.2, Section 9.2.1, Section 9.2.2) in
a particular animal/plant or via food chain modeling
9.3.2 Human Toxicity
Human health risk assessments typically involve the use of toxicity values that are derived in a manner that is intended to represent a “reasonable conservative estimate” (USEPA 2012) of the dose-response in humans. All of
the toxicity values that have been derived by agencies for PFAS for use in site risk assessments are based upon
animal studies with human studies used to support the hazard identification component of the risk assessment (Section 7.1.4). There is also a lack of toxicity values for many PFAS, which with their absence could result in an
underestimate of the risks associated with PFAS exposure.
Overall, with regard to PFAS human toxicity, uncertainties in conducting a risk assessment can be introduced as
follows:
• Missing dose-response information for site-related PFAS to which receptors could be exposed (Section
7.1, Section 9.1.1.2)
• Using toxicity values for a particular PFAS as a surrogate for another (Section 9.1.1.2)
189

9.3.3 Ecological Toxicity
As with human health risk assessments, ERAs often use TRVs that are generic and not site-specific. These generic
TRVs are conservative by design because they are used for screening purposes (USEPA 2004). Likewise, there is a degree of conservatism incorporated into the derivation of generic criteria (for example, ambient water criteria) to
account for uncertainty (Section 9.2.1).
Overall, with regard to PFAS ecological toxicity, uncertainties in conducting a risk assessment stem from using toxicological information from surrogate organism(s) to evaluate potential risks for organisms for which toxicity
studies do not exist (Section 9.2.1)
9.3.4 Accounting for Nonsite-Related PFAS
Site-specific risk assessments rely on site characterization information (and as needed, modeling) to help
estimate the amount of exposure receptors could be subject to currently or in the future. Given the widespread
presence of PFAS in the environment (Section 6), including the potential of upgradient off-site PFAS impacts to
migrate onto subject properties (Section 10.5), discerning “background” anthropogenic or off-site PFAS impacts
at a site from site-related impacts can be challenging. To streamline risk assessments, it may be conservatively
assumed initially that concentrations of PFAS are entirely site-related. Doing so, however, may overestimate
the risks associated with site-related releases.
Updated May 2021.
190

10 Site Characterization
The PFAS Team developed a training module video with content related to this section, it is the Production, Uses,
Sources, and Site Characterization video.
The intent of this section is not to present general site characterization principles, but to highlight unique
considerations for this family of emerging contaminants. It is assumed that site characterization will follow all
applicable state and federal (CERCLA or RCRA) guidelines. The general principles of site characterization are
similar for PFAS as for any contaminant, in that the physical setting, release specifics, proximity to receptors, and
fate and transport characteristics will determine the sampling locations and requirements. Because of the
toxicity, persistence, mobility, ubiquity, the large number of compounds in this family of chemicals, the
variability and uncertainty of specific compounds and their criteria being regulated, and the emerging nature of PFAS, it is necessary to consider specific concerns in PFAS site characterization efforts.
Section Number Topic
10.1 Site Characterization Issues Relevant to PFAS
10.2 Initial Steps
10.3 Site Investigation
10.4 Data Analysis and Interpretation
10.5 Source Identification
Exposure to PFAS can occur through a variety of transport pathways involving all environmental media, as is
described in Section 5. Because ingestion of water is deemed a major route of exposure in humans, and the
emerging nature of PFAS as contaminants of concern, regulatory interest has in the past several years been centered on this pathway. In turn, this focus has led to an increased emphasis on investigation of the
connection between drinking water sources and groundwater, including direct use of groundwater as drinking
water and connections between surface water and groundwater. Because of this regulatory and investigatory focus, this section places more emphasis on characterization of groundwater plumes than characterization of
other media. Although groundwater may have in the past been more commonly the initial regulatory and
investigatory focus, regulatory focus is broadening to other media such as surface water and biota and as a site-specific characterization process advances data are generally required from one or more other media
including soil, sediment, surface water, stormwater, air, biota, or other media depending upon the nature,
duration, and time of the release.
The guidelines below include general considerations for the most common types of PFAS sites.
191

10.1 Site Characterization Issues Relevant to PFAS
Historical investigations may have missed the potential for PFAS contamination at a site because, until
recently, these chemicals were not regulated, were not considered a health or environmental concern, or PFAS sampling and analytical procedures may not have been available. As a result, PFAS plumes had years to
develop and migrate without detection or characterization. Comparing a site timeline (for example, processes,
layout, chemical use, and release history, and fire training and/or firefighting events when AFFF was used) with the timeline of PFAS development and use, and existing drinking water data (for example, UCMR3) can be
helpful in evaluating the types and potential occurrences of PFAS releases. Once a potential source has been
identified, a site investigation would step out from the source to characterize the nature and distribution of the release. However, if a PFAS site is like one of the many without an identified source (ATSDR 2021), an
understanding of the site timeline or a general understanding of potential PFAS use may not be available. For
sites without a known source release, the investigation approach starts with a review of available site information.
The following are some important considerations that are specific to PFAS sites.
10.1.1 Evolving Science and Regulations
State of the science: Understanding of many aspects of PFAS, such as toxicology and behavior in the environment,
is changing rapidly. This may require reevaluation of earlier assumptions and conclusions throughout the site
characterization process.
Analytical methodologies: Analytical methodologies continue to be developed and improved. Specific attention must
be paid to a wide variety of factors, such as analytical methods, detection/reporting limits, and parameter lists
that are continuing to expand. See Section 11.2, Analytical Methods/Techniques, for more details.
Sampling methodologies: Questions exist regarding cross-contamination potential due to the presence of PFAS in
consumer products; many regulatory agencies require a precautionary approach to sampling prohibiting the use of materials that may be treated with PFAS. See Section 11.1, Sampling, for more details.
Regulatory environment: The regulatory environment remains in flux, with changing regulatory limits, sampling
procedures, and compounds of interest. Investigators must remain vigilant to identify impacts to the site
characterization. See Section 8, Basis of Regulations, for more details.
10.1.2 Source, Fate, and Transport Properties
Sources: PFAS sources are discussed in Section 2.6, PFAS Releases to the Environment, and AFFF releases are discussed in more detail in Section 3.2, Mechanisms for Release to the Environment. There are also “secondary
sources,” such as PFAS concentrating into one portion of a plume (for example, groundwater into surface water)
that then acts as a source to further groundwater contamination.
Pathways: PFAS may be present or migrate via pathways that are not often encountered with
other compounds. For example, PFAS may be
present in groundwater at a site via air deposition and no direct on-site release.
Secondary Sources
Sources created through movement of contaminated media into an area that was previously uncontaminated, (for example, contaminated water from irrigation wells or reuse and application of biosolids), or an area where physical or chemical processes have concentrated PFAS, resulting in an additional source (for example, multi-media interfaces; see Sections 5 and 6).
192

Complex transitions between media: The behavior of PFAS in the environment may deviate greatly from typical
contaminants. Transitions between media may be complex because of specific characteristics of these compounds. For example, PFAS may disperse more upon reaching the water table than is typical for most other
compounds, or a groundwater plume discharging into a surface water body may infiltrate into groundwater
elsewhere, with contamination in the surface water acting as a secondary source. See Sections 5 and 6 for additional detail.
Partitioning: Because of their physical and chemical properties and the variability of those properties, certain PFAS
may partition from water through different mechanisms (including hydrophobic effects, electrostatic interactions,
and interfacial behaviors) to other media or forms, including air, micelles, foam, solids, NAPL, and interfaces
between these phases. Phase partitioning is discussed in more detail in Section 5.2. The partitioning of PFAS to solid-phase minerals is widely studied and is thought to occur through two primary processes: 1) adsorption to
organic carbon via hydrophobic interactions, and 2) electrostatic interactions (Higgins and Luthy 2006). Binding of
PFAS to organic carbon is not as strong as traditional hydrophobic compounds (for example, PCBs, PAHs). Therefore, Koc alone may be a poor predictor of binding of PFAS to organic carbon (Section 4.2.9). Because
various factors can affect adsorption of PFAS to organic carbon, published Koc values for PFAS cover a very
broad range. Certain groundwater or soil conditions may be considered along with the partitioning behavior of the
specific PFAS of interest. Soil parameters that could be considered include the fraction of organic carbon (foc),
which would provide information for evaluating hydrophobic effects. In addition, the soil type (possibly including
surface charge, exchange capacity, grain size, minerology, and water content) could be used to assess
electrostatic interactions and interfacial behaviors. The characteristics of the onsite water that may be valuable
to assess include the cation concentrations or the ionic strength of aqueous solutions, oxidation-reduction conditions, and pH, which could be used to assess electrostatic interactions and interfacial behaviors. Partitioning
has also been found to differ between the unsaturated and the saturated zones because PFAS will tend to
partition at the air-water interface of soil moisture in the unsaturated zone. If PFAS partitioning in the
unsaturated zone is an important consideration for a particular site characterization, consideration should be given to using techniques such as lysimeters or leaching tests in the unsaturated zone, or targeting sampling
the capillary fringe, to better understand fate and transport at a site, particularly at the PFAS source area. In
addition, partitioning between PFAS and NAPL, and between surface water and micelle and/or foam formation, may be a consideration. PFAS partitioning to air may occur from volatilization or adsorption to
airborne aerosols or other small particulates. However, reliable data for physical properties that relate to PFAS
volatilization, such as vapor pressure and Henry’s Law constants, are scarce. Under certain conditions,
particularly within industrial stack emissions, or during fire suppression, incineration, or combustion, PFAS can be transported through the atmosphere and subsequently be deposited. This can include volatiles like FTOHs
that may be present in the gas phase and anionic PFAS that may be adsorbed to airborne aerosols and other
small particulates (Ahrens et al. 2012). See Section 5.2 for more detail and references.
10.1.3 Other Considerations
Widespread use: Because of the widespread use of
PFAS-containing products, there may be multiple locations that act as a source of PFAS at a site. In
addition, PFAS are often detected at low levels in
samples from locations without any apparent or
nearby sources. In those instances there may be a need to evaluate the site-specific anthropogenic
background concentrations and determine their
contribution to PFAS concentrations in environmental media at a site. See, for example,
Strynar et al. (2012).
Site-Specific Anthropogenic Background
Concentrations of PFAS present in environmental media at the site that are not the result of or influenced by site activities or releases.
193

10.2 Initial Steps
A comprehensive site preliminary assessment commonly starts with developing an understanding of potential
PFAS uses in the area, history of the site operations that potentially used the chemicals, air deposition patterns
where PFAS may have been produced or processed (for example, manufacturer with PFAS emissions), and the regional geologic and hydrologic framework as it relates to contaminant transport to surface waters or
drinking water wells. Following the preliminary assessment, a series of site investigations may be required at a
sufficient resolution to capture the effects of the heterogeneities that direct contaminant distribution, fate and
transport, and remediation effectiveness. However, there may be a need to prioritize the evaluation of certain exposure pathways (for example, drinking water wells) during the beginning investigations to quickly assess
potential human exposures and because of constraints on resources and schedule.
When historical PFAS releases occur upgradient of drinking water sources, drinking water sampling may be the
first indication that there is a problem. In areas where there is a concern that a PFAS source may be present, it
is common to identify and sample nearby drinking water sources (for example, groundwater and surface water) to determine if PFAS are present in potable water sources and evaluate the potential exposure to human
receptors. This approach is a policy for the Department of Defense (USDOD 2014). In cases where sources are
not well defined, reconnaissance sampling may be useful to inform the development of the CSM and site investigation. In these instances, drinking water source sampling has preceded typical site investigation work.
Prior to further site characterization, proper notification to consumers and evaluating options to reduce or
eliminate PFAS exposures, including alternative drinking water sources, may be required.
10.2.1 Initial Conceptual Site Model
CSMs are useful tools for the presentation and evaluation of site characteristics, releases, contaminant fate and
transport, and exposure pathways. Generalized CSMs are presented in Figures 9-1, 9-2, and 9-3. The CSMs present most known and potential PFAS source areas, transport mechanisms, and pathways on a simplified
physical setting. The CSMs also illustrate exposure routes and receptors. CSM development is an iterative
process over the project life cycle with information obtained during site investigation, remedy design, and remedy implementation and optimization. Similar to the USEPA’s data quality objectives (DQOs), it relies on a systematic
objectives-based site characterization process (ITRC 2015). The CSM for a PFAS site is developed with information
on PFAS sources and releases (whether occurring on site or off site from groundwater, surface water, sediment,
or air), site characterization, pathways, and potential receptors.
Some specific challenges related to identifying the nature and extent of impacts for CSM development for PFAS
sites are described in the following sections.
10.2.1.1 Surface Water Body Secondary Sources
Because certain PFAS are mobile and resistant to breakdown in the environment, there have been cases of surface water creating very large dilute groundwater plumes through recharge (ATSDR 2008). Infiltration of PFAS
along the course of surface water systems, including tidal zones, may result in widespread secondary sources to
groundwater, further enlarging the contamination area. In situations where PFAS-contaminated surface water is recharging groundwater, investigation of the potentially impacted groundwater should be conducted to fully
characterize site-related contamination. Complicating surface water being a secondary source is that PFAS have
been shown to concentrate at the surface water-air interface (Ju et al. 2008). PFAS contamination may also
concentrate in naturally occurring surface water foam (due to an affinity to organic material in the foam and the
higher PFAS concentrations at the surface water-air interface where the foam is formed).
Therefore, site characterization must consider whether or not surface water bodies are the most downgradient
extent of contamination.
194

10.2.1.2 Receptor Identification
Identification of potential ecological and human receptors as part of development of the CSM first includes identification of potential exposure pathways (for example, PFAS migration in groundwater to downgradient
drinking water wells, creating human exposure to PFAS; or water containing PFAS entering surface water bodies,
creating aquatic life exposure to PFAS). See Section 9 for additional information on receptor identification in the context of risk-based evaluations for PFAS.
195

10.3 Site Investigation
10.3.1 Development of Site Investigation Work Plan
PFAS investigation work plans should take into consideration the information provided in this guidance
document (for example, Sections 2, 4, 5, 6, 9, and 11), including items such as sampling procedures and
equipment to prevent cross- contamination, analytical methods and compounds to be reported, geographically variable and changing regulatory requirements and criteria, and site-specific environmental setting. From a
general perspective the work plan will depend on the type of PFAS source and subsequent transport via various
media. Attention should be paid to potential upgradient or nearby sources and potential secondary sources
from irrigation, sludge, or biosolid application, the use of soils not recognized to be contaminated, and other
anthropogenic factors affecting fate and transport of PFAS-contaminated media, such as discharge from
landfills or wastewater treatment plants (WWTPs).
10.3.1.1 Geologic and Hydrogeologic Investigation
Evaluation of the geologic and hydrogeologic framework associated with the site is critical, and sometimes that
framework may need to be addressed on a regional basis, as the PFAS impacts may extend significant distances from the site.
In development of a work plan, consideration should be given to obtaining adequate information to allow for
applying Environmental Sequence Stratigraphy (ESS) or a similar assessment. ESS is an emerging best practice for understanding the geologic framework and related subsurface contaminant transport pathways, both regionally
and underlying a site. The ESS approach is presented in USEPA Groundwater Issue Paper “Best Practices for
Environmental Site Management: A Practical Guide for Applying Environmental Sequence Stratigraphy to Improve Conceptual Site Models” (USEPA 2017). The amount of information to be collected to complete an adequate
assessment is a site-specific determination based on many factors such as complexity of stratigraphic and
lithologic variability, project objectives, and available budget. High resolution site characterization (HRSC) techniques are normally appropriate to obtain adequate subsurface information (for example, grain size and
permeability) to complete stratigraphic assessments (see https://clu-
in.org/characterization/technologies/hrsc/index.cfm for more information on HRSC). The ESS approach is presented
in USEPA Groundwater Issue Paper “Best Practices for Environmental Site Management: A Practical Guide for Applying Environmental Sequence Stratigraphy to Improve Conceptual Site Models” (USEPA 2017). In addition,
ITRC has guidance on implementing advanced site characterization tools (see https://asct-1.itrcweb.org/).
Geochemical parameters that may be pertinent to potential PFAS migration and possible remedies also require consideration during the investigation. The understanding of soil type (possibly including foc surface charge,
exchange capacity, grain size, minerology, and water content) and groundwater chemistry (possibly including cation
concentrations or the ionic strength of aqueous solutions, oxidation-reduction conditions, and pH) at the site is needed to assess transformation, partitioning (including desorption), and migration in groundwater or soil. These
and other geochemical data can be used to assess the viability of PFAS remedy options should remediation be
necessary. For example, the groundwater’s general chemistry, including cations, anions, total dissolved solids, and fouling parameters (for example, iron, manganese, hardness, biofoulants), as well as other organic compounds in
groundwater, may have a significant impact on the selection, design, and implementation of potential groundwater
remedies.
196

10.3.1.2 PFAS-Specific Tools for Site Screening or Characterization
Investigative techniques to characterize source soils and determine the three-dimensional extent of soil and groundwater contamination should be considered. High-resolution site characterization techniques beyond those
that provide lithologic or hydrologic information and are specific to PFAS are currently limited because reliable
analytical procedures that are cost- effective and can be used for field screening are not readily available. However, analytical procedures that can be used in a mobile laboratory and achieve ng/L detection limits are
becoming available. Use of a mobile laboratory can be expensive and is cost-effective only in specific situations
when a sufficient number of samples can be collected in a short time period to keep the mobile laboratory at or
near its capacity. Use of a mobile laboratory and the quick turnaround of results they provide allow for adaptive
selection of additional sampling locations for delineation or other objectives. One of the main drawbacks associated with current field-screening methods is the inconsistency of results related to varying soil types and
compositions. Other field-screening methodologies have either been tried or are in the research and
development phase, including ion selective electrodes to quantify PFOS and a mobile field-screening unit for PFOS and PFAS, both of which are attempting quantification to ng/L levels (Deeb 2016). Another method in the
development stage is a synergistic approach for the targeted affinity-based capture of PFOS using a porous
sorbent probe that may be able to obtain a detection limit for PFOS in water at about 0.5 ng/L (Cheng et al.
2020).
10.3.2 Nature of PFAS Sources
The nature of primary and secondary PFAS sources at a site will largely determine the extent of PFAS contamination at the site. Multiple factors may contribute to the nature of PFAS sources at a site. Key factors
related to secondary sources to consider in development of a work plan include:
• Leaching from the vadose zone to the saturated zone: PFAS present in unsaturated soils are subject to downward leaching during precipitation or irrigation events that promote desorption of soil-
bound contaminant mass (Sepulvado et al. 2011; Ahrens and Bundshuh 2014; Milinovic et al. 2015).
• Back-diffusion: PFAS dissolved in groundwater that accumulated in lower permeability silt/clay layers
below the water table may diffuse into the higher permeability zones due to changing relative
concentrations (Section 5.3.1).
• Desorption: PFAS resulting from desorption from solids in the vadose or saturated zones and
resolubilizing in porewater or groundwater could occur when adsorption (that is, partitioning) is
reversible (Milinovic et al. 2015); such desorption would have the effect of sustaining PFAS
concentrations in porewater or groundwater.
• Nonaqueous phase liquids (NAPL) dissolution: PFAS entrained in NAPL in the subsurface may be associated with releases of chlorinated solvents and/or petroleum hydrocarbons.
• Other sources: Given the widespread use of some PFAS, additional sources upgradient or within a plume may be contributing to PFAS concentrations at a site. Site-specific anthropogenic background
may be a contributing factor.
• Atmospheric deposition: PFAS are sometimes associated with stack or other air-emission sources and
may contribute to regional PFAS concentrations.
• Overland runoff: Runoff and stormwater conveyance systems can impact surface water locations
downstream of the actual source or groundwater along the course of the conveyance system.
• Groundwater seepage into surface water or surface water seepage into groundwater: Groundwater elevations surrounding surface water bodies (that is, gaining or losing) may influence the extent of a
plume. Seepage rates and directions may change seasonally, with extreme weather events, or
during periods of drought or precipitation.
• Suburface features, including utility lines: Preferential pathways may result from subsurface features. For example, flow may seep into or out of nonwatertight sewer lines based upon groundwater elevations
relative to the utility. The bedding material of a subsurface line may also convey groundwater.
197

Multicomponent mixtures: At some sites, numerous PFAS may be present in one or more source
zones. Mixtures may be present for several reasons, including, but not limited to, the following: multiple sources, varying time frames, and a mixture of compounds introduced during production (Sections 5
and 10.5).
Precursors: Delineating, as practicable, the extent of precursors that may degrade to PFSAs and PFCAs will help the investigator understand sources and potential long-term concentrations.
10.3.3 Extent of PFAS
As with other consituents, a site investigation for PFAS relies upon understanding the extent of sources as well as the extent of contaminant transport. A PFAS release can be localized or highly extensive, both horizontally and
vertically. PFAS may be highly mobile in groundwater. In addition, PFAS plumes may have had years to develop,
as discussed above. Therefore, PFAS plumes may be larger than expected. At some sites, more mobile shorter chain PFAS have been observed to extend relatively farther in groundwater than longer chain PFAS due to
less retardation in groundwater. The partitioning behavior of PFAS is discussed in Section 5.2.
Depending upon site-specific conditions, several pathways need to be considered to assess potential upgradient
sources. PFAS migration in air from industrial or commercial sources can influence soil or groundwater a great distance from larger sources (Section 6.1), for example, see Barton (2010) and Shin et al. (2011). Data from urban
soils and groundwater indicate that for sites near metropolitan areas, there may be measurable contributions of
PFAS from other sources, unrelated to site- specific sources, see the site-specific anthropogenic background text box in Section 10.1.3 and Xiao et al. (2015).
Comingling of contaminants has a potential to impact PFAS extent. For example, for PFAS sites associated with industry, fire training, or emergency response that have a chlorinated solvent or other NAPL source, investigators
need to consider potential effects on PFAS in the subsurface and related data collection requirements.
Laboratory studies have demonstrated that sorption or partitioning of perfluoroalkyl acids may increase in the
presence of trichloroethene DNAPL in bench-scale tests (McKenzie et al. 2016). Conceptual modeling of published PFAS data suggests that NAPL-water partitioning and NAPL- water interface interactions may significantly increase
retardation of some PFAS in source zones (Brusseau 2018). This research suggests that if PFAS and NAPL are
present in media that make effective source treatment unlikely—for example, in low-permeability soils or fractured
rock—that fraction will represent a long-term contributor to groundwater plume persistence. At older sites where in situ (for example, oxidation) or pump and treat methods have been employed to reduce NAPL source areas prior
to awareness of PFAS, those remedies may complicate characterization and distribution of PFAS. Depending upon
the method employed, mobilization of PFAS may have increased (oxidative) or decreased (reductive) following
treatment, and remedial actions may affect distribution and relative concentrations of individual PFAS (McKenzie et
al. 2016; McGuire et al. 2014).
198

10.4 Data Analysis and Interpretation
There are a number of approaches, methods, and tools available for analyzing and interpreting site
characterization data from a wide range of contaminated sites. Examples of approaches, methods, and tools
that may be relevant to PFAS sites are described below.
10.4.1 Retardation Coefficients and Travel Time
It may be helpful to estimate retardation coefficients for PFAS to evaluate contaminant-specific velocity and
travel time in groundwater, particularly for longer PFAS plumes. As discussed in Section 5.2.3, a linear sorption
isotherm is typically assumed for PFAS sorption to organic matter in soil, and sorption coefficients. The Physical
and Chemical Properties Table (Table 4-1) provided as a separate Excel file presents a range of available
organic carbon partitioning coefficients for environmentally relevant PFAS.
However, as noted in Section 5.2, while common PFAS appear to be appropriately defined by linear sorption
relative to organic carbon concentration when sufficient organic carbon is present, the current state-of-science
supports Koc being reported in relatively broad ranges on a compound-specific basis. Section 4.2.9 presents a
discussion of potential limitations in using Koc values as a predictor of sorption and PFAS mobility. It is also important to note that other geochemical factors (for example, pH, presence of polyvalent cations, and electrostatic
processes) may also impact PFAS sorption to solid phases (Section 5.2.3). Due to the uncertainty regarding Koc, it
may be appropriate to evaluate transport of an individual PFAS using a range of partitioning coefficients to
account for uncertainties in this parameter. In addition, empirical estimation of site-specific Koc values in different
areas of a site (for example, source zone versus downgradient plume) may be necessary if quantification of the
retardation coefficient is important to its characterization.
For example, McGuire et al. (2014) described the calculation of site-specific Koc values for various PFCAs and
PFSAs at an AFFF-impacted site. These site-specific Koc values were calculated based on seven pairs of co-located groundwater and soil samples, and fraction of organic carbon (foc) measurements at each sampling
location. The soil samples were collected near or at the water table, which was about 4.6–6.1 m below ground
surface. McGuire et al. (2014) found that there was a range of between one and three orders of magnitude in site-specific Koc values for the PFAAs analyzed. This may reflect the enhanced sorption of PFAS that occurs at
the NAPL-water or air-water interface (Brusseau 2018). There may be smaller ranges in Koc values for PFAAs
at greater depths below the water table and downgradient of a source zone (where NAPL is not present). When using this type of site-specific Koc analysis method, it is also important that the groundwater samples be
representative of conditions where the point soil samples are collected.
As another alternative to the use of Koc values and the assumption of a linear sorption isotherm, in situ or ex situ studies may be used to develop parameters for simulation of PFAS transport. Such studies could allow
development of pseudo-constants to use in model simulations. For example, lysimeter studies were used to
establish relative rates of transport of PFOA and shorter chained PFCAs, and PFSAs as compared with PFOS (Stahl et al. 2013).
Desorption of PFAS from solids in the vadose zone or below the water table could occur when partitioning is
reversible; such desorption would have the effect of maintaining PFAS concentrations in porewater or
groundwater. There is uncertainty regarding the extent to which sorption is irreversible and rate-limited versus
an equilibrium process (Section 5.2.3). It may be important to characterize the extent and kinetics of desorption that may occur as a result of remedial activities at the site.
199

10.4.2 Mass Flux/Mass Discharge
Note that it may be challenging to estimate the relative mass flux contribution of multiple sources at some sites
due to the low PFAS concentrations present in groundwater. In addition, it is important to consider the potential for increases in dissolved mass flux of some PFAS due to biotransformation reactions or desorption between
transects.
ITRC (2010) presented a variety of methods available for estimating mass flux and mass discharge, including
the use of transects of temporary or permanent monitoring wells across the width of a plume. Even simple
methods such as the use of chemical isoconcentration figures to estimate mass discharge may be applicable for an initial order of magnitude estimate. Calibration of solute transport models is another method that may be
used to estimate the mass discharge of PFAS from a source zone or at a point in a plume.
10.4.3 Contributions from Different Sources
The potential impact to a site from multiple sources, particularly in proximity to urban or developed locations,
needs to be accounted for when assessing site data or identifying data gaps. Each source then needs to be
assessed in terms of its specific contributions, and their relative importance or magnitude. Although there are no naturally occurring background levels of PFAS, it may be important to gain an understanding of the Site-
specific anthropogenic background (see the text box in Section 10.1.3) concentrations that may be present at a
site, as these can have significant implications for site characterization, assessing exposures, evaluating ecological and human health risks, and establishing site action and cleanup levels. Most states have guidance
on how to establish site-specific background concentrations for their regulated contaminants.
Tools available to quantify relevant contributions from different types of sources are discussed below.
10.4.3.1 Atmospheric Deposition
Certain PFAS may be present in ambient air and may be elevated near sources such as landfills, WWTPs, fire
training facilities, and manufacturing plants (Section 2.6). Many PFAS exhibit relatively low volatility; however, airborne transport of some PFAS can be a relevant migration pathway for some industrial releases. Sections
5.3.2 and 6.1 provide an overview of transport of aerosols and particulates via air. To assess relative
contributions from atmospheric sources, air sampling for PFAS can be conducted. Additionally, air dispersion models, such as AERMOD or Industrial Source Complex (ISC3) Model, can be employed to estimate airborne
PFAS concentrations and total wet and dry deposition rates at designated receptor locations. Examples where
AERMOD could be beneficial during site characterization activities include sites with no obvious source area and sites in industrial areas with multiple potential sources of airborne PFAS. See Section 2.6 for additional details on
the most typical PFAS source scenarios.
10.4.3.2 Vadose Zone Percolation
Recent research has illuminated the complexities of PFAS fate and transport in the vadose zone. PFAS
surfactant properties can enhance or reduce PFAS sorption, in particular at high concentrations such as those
encountered at release locations (Sections 5.2.2.2 and 5.2.3). At lower concentrations the air-water interface
may have important implications for vadose zone transport (Section 5.2.4). Therefore, model simulations of PFAS transport in the vadose zone should be performed with appropriate caveats.
200

Models such as USEPA’s VLEACH and Seview’s Seasonal Soil (SESOIL) compartment model can simulate one-
dimensional vertical transport in the vadose zone via diffusion, adsorption, volatilization, biodegradation, cation
exchange, and/or hydrolysis; however, these models do not include air-water interface interactions that may be important to the vadose zone migration of PFAS and these models have not been validated for use with PFAS.
For these reasons, these models may not be appropriate for use with PFAS at this time. Most PFAS are resistant
to biotic or abiotic degradation, and in general PFAS are far less volatile than many other contaminants. However, it is noted that certain PFAS are volatile, for example, the FTOHs (Section 4.2.3 and Table 4-1). With the
exception of the few volatile PFAS, the most important vadose zone processes to model are the physical transport
processes.
Analytical leaching methods such as Synthetic Precipitation Leaching Procedure (SPLP), USEPA Method 1312;
Toxicity Characteristic Leaching Procedure (TCLP), USEPA Method 1311; Leaching Environmental Assessment
Framework (LEAF); and others may provide insight into the leachability of PFAS from vadose zone materials. Care
should be taken in selecting a method to assess PFAS leachability that is appropriate for the settings and
parameters that are present and considers the end use of the data.
Given the complexity of predicting the mass discharge from vadose soils to groundwater, along with modeling and leaching methods, direct measures of mass discharge, including the use of soil lysimeters, may be
considered.
10.4.3.3 Back-Diffusion
When evaluating fate and transport of PFAS in a groundwater plume, including time frame for remediation of PFAS,
matrix diffusion may be an important process to consider (Section 5.3.1). As such, the potential impacts of
diffusion on PFAS persistence in natural soils are a topic of ongoing research. Diffusion coefficients for PFAS
are generally uncertain but are in development using measurements and models (Pereira et al. 2014). During
the characterization of PFAS plumes, it may be beneficial to collect PFAS soil samples from the transmissive
zone directly above a silt/clay layer, and at different depths into the silt/clay layer, to evaluate the potential for
back-diffusion to be occurring presently or in the future if there is a decline in PFAS concentrations in the
transmissive zone, see Parker, Cherry, and Chapman (2004) and Chapman and Parker (2005) for an example of
this sampling approach.
10.4.3.4 Upgradient Site Contributions
PFAS persistence in the environment and their
use in a multitude of industrial processes and commercial products result in potential for
nonsite-related inputs, similar to other mobile
contaminants (Figures 9-1, 9-2 and 9-3). Assessment of potential upgradient site inputs is
recommended. The very low health advisory
criteria for groundwater only increase the potential importance of identifying what might otherwise be
considered “minor” upgradient sources and may
result in alternate source identification (Sections 10.3.2 and 10.5).
As part of site investigation of an air deposition release, soil data can be statistically compared to background
samples, evaluated for vertical stratification, and assessed for spatial distribution relative to the potential source. Groundwater data from the site may be compared to data from other locations using cluster analysis to assess
whether there was evidence of othersource terms, or if the site in question appeared to be the sole source.
Alternate Sources
Sources that may exist within, upgradient, or near a site under investigation, that are distinct from the PFAS source being investigated.
201

10.4.4 Transformation Pathways and Rates
As discussed in Section 5.4, the transformation of precursors may result in increasing concentrations of PFAAs
such as PFOS and PFOA along the flow path of a dissolved plume. Transformation reactions may occur due to
aerobic biological or chemical oxidation. For example, McGuire et al. (2014) concluded that infusion of dissolved oxygen to bioremediate hydrocarbons downgradient of a former burn pit also likely caused the transformation of
precursor compounds to PFAAs such as PFHxS. Some methods that may be used to assess the degree to which
transformation is affecting PFAS plume extent and stability include:
• plotting concentration isopleths for precursors and various PFAAs, for example, McGuire et al. (2014)
• use of the total oxidizable precursor (TOP) assay to identify whether precursors are present that may be available for transformation to PFAAs at a point in the plume (Section 11.2.2)
• assessment of ratios of precursor and daughter product species at monitoring wells situated along the centerline of a plume, or the ratio of various PFAAs in various portions of a plume.
For example, McGuire et al. (2014) plotted an isopleth map for the ratio of PFHxS to PFOS
to show that in areas where dissolved oxygen was injected this ratio was as high as 50, and in other areas where bioremediation was not conducted this ratio was less than 1.
• use of concentration trends along a plume centerline and quantitative methods described in USEPA (1998) to estimate precursor transformation rates
• groundwater modeling to demonstrate that the relative plume lengths of different PFAAs with
different retardation coefficients can be explained only through the transformation of precursors, for
example, McGuire et al. (2014).
• a literature review to identify potential precursor transformation mechanisms and evaluate whether
site geochemistry and redox conditions are favorable for the occurrence of these mechanisms.
Another method that may be used to illustrate the occurrence of these transformations is radial diagrams.
See the case study in Section 15.1.1.
Figure 10-1 shows three radial diagrams based on data from an AFFF release site (McGuire et al. 2014). Each radial diagram compares groundwater concentrations at a monitoring well within the oxygen infusion zone to
concentrations at a well approximately 76 m upgradient. The radial diagram shown at the left of Figure 10-1 compares concentrations for five PFCAs between these two wells; the middle diagram shows concentrations
from the TOP assay conducted using samples from each well; and the radial diagram on the right compares
concentrations for four PFSAs.
These radial diagrams illustrate that oxygen infusion into groundwater likely stimulated the production of mainly
PFHxA, PFPeA, PFHxS, and PFBS. The middle radial diagram shows that the difference in TOP assay results
between the upgradient well and the well in the oxygen infusion zone does not explain the large PFAAs concentration increases that were observed at the well in the oxygen infusion zone. The TOP assay results were
low at both wells throughout the area. This suggests that desorption and subsequent transformation of
precursors were occurring within the oxygen infusion zone. These radial diagrams are also useful for evaluating relative concentrations of various PFAAs at each monitoring well. The use of radial diagrams for additional
types of trend analysis is discussed further in Section 10.4.7.
202

Figure 10-1. Radial diagrams showing the production of various PFAAs in the vicinity of an oxygen infusion zone at an AFFF release site remediated for hydrocarbons in groundwater.
Source: G. Carey, Porewater Solutions. Used with permission.
10.4.5 Assessing Plume Stability
In addition to evaluating potential transformations to PFAAs, it may be necessary to evaluate PFAS plume stability – whether the plume is stable, receding, or expanding. Many PFAS plumes are long-lived and mobile. Methods for
evaluating plume stability include qualitative evaluations of temporal plume trends or statistical evaluations such as
Mann-Kendall (ITRC 2013; ITRC 2016; AFCEC 2012; USEPA 2009).
Data uncertainties may have a greater than usual impact on plume stability evaluations because of the low
concentrations assessed. Biotransformation of precursors may also have an impact on plume stability evaluations. As such, more frequent or longer duration monitoring may be required to confirm trends or plume
stability.
10.4.6 Modeling PFAS Fate and Transport
Some modeling of PFAS fate and transport has been conducted recently (Barr 2017; Persson and Andersson
2016). Modeling the fate and transport of PFAS may have significant uncertainty contributed by precursor
concentrations, transformation pathways, and biodegradation rates. In addition, desorption kinetics of PFAS are not currently well understood. Although modeling of PFAS transport may be appropriate under certain
conditions, the uncertainty of PFAS transport simulations requires that the results be qualified. Site-specific
data are important for evaluating some potential model input parameters such as Koc, which can exhibit significant spatial variation. This is particularly true in source zones, the vadose zones, and at
or near the water table. There are situations where modeling of PFAS transport may not be appropriate due to a
lack of site- specific input parameters.
203

10.4.7 Visualization Methods
One of the challenges associated with characterization of PFAS sites is the analysis of trends for a number of
PFAS constituents that may be sampled in soil and groundwater, and then the communication of the results of these analyses to a less technical audience. Typical site characterization visualization methods such as plume
maps, cross-sections, fence diagrams, 3D models may be used to depict the horizontal and vertical extent of
PFAS plumes. Several other visualization methods may be helpful when analyzing PFAS data, including:
• bar charts that show the relative concentrations of individual PFAS constituents at each location to help evaluate PFAS composition trends in soil and groundwater (for example, figures 6 and 7 of 7 Field (2017),
Figure 15-1)
• radial diagrams to illustrate: o transformations of precursors to PFCAs and/or PFSAs along a flow path (for example, see Section
15.1.1)
o relative concentrations of constituents at each sample location to assist with source fingerprinting
and to identify potential risk drivers in different parts of a plume
o locations of potential hot spots o general extent of a PFAS plume.
Case study examples of these different methods are discussed in Section 15.1.
204
10.5 Source Identification
Source identification can be one of the challenges of PFAS investigations. Where records are available that
document leaks, spills, and accidents, there may be a direct connection between sources and contaminant
plumes. Where there are no documented releases, overlapping plumes, and/or known upgradient sources of PFAS contamination, multiple lines of evidence may be needed for source identification or distinguishing
between two or more sources. As such, additional approaches for source identification or distinguishing between
sources may be needed to connect releases to contaminated media. Source identification uses the evaluation of
both typical and advanced chemical analyses to identify and differentiate among sources and age-date release
events. Advanced techniques can include:
• chemical fingerprinting
• signature chemicals
• isotopic fingerprinting
• molecular diagnostic ratios
• radionuclide dating
• microscopic analysis
• Contaminant transport models
Although these techniques have limitations and are relatively new in application to PFAS, some of these tools
have been used to identify regional and local PFAS sources. An overview of PFAS source identification analyses can be found in Dorrance, Kellogg, and Love (2017).
PFAS source identification should include all information regarding release mechanisms, as well as fate and
transport mechanisms, as they are complementary and can cause environmental fractionation, which can
influence chemical profiles. In addition, long-range wind-driven transport and deposition of some PFAS could be considered (Ahrens, Rakovic, et al. 2016; Davis et al. 2007).
Multiple lines of evidence are needed for reliable source identification because of the complexity of PFAS
composition and source formulations, along with the potential for significant formation from precursors within a spill, which diminish the reliability of chemical fingerprinting. Additionally, information related to degradation
expected based on case-specific conditions is needed for defensible chemical fingerprinting. With this being said,
sources of PFAS could be deduced on a case-by-case basis, in particular when multiple independent lines of
evidence are developed and as our knowledge related to fate and transport of different released commercial
formulations improves. Library research, preliminary identification of potential PFAS sources, and information
gathered from patents can assist in the identification of PFAS.
10.5.1 Source Identification Tools
Chemical fingerprinting involves the evaluation of the relative proportions of different substances in a mixture to link contaminants in the environment back to a specific on-site source or sources, an Alternate Source or
Sources (see the text box in Section 10.4.3.4). The data from chemical analyses can be evaluated using various
graphical, statistical, or geospatial techniques. These methods have been commonly used for petroleum and
chlorinated compound source identification and can potentially be applied to PFAS, because the release of PFAS
into the environment generally involves the release of a complex mixture of substances, including different
subclasses of PFAS, as well as homologues and isomers of specific PFAS.
205

PFAAs are produced as a mixture of homologues of different chain lengths (Section 2.2). PFAAs produced by
electrochemical fluorination contain both even and odd chain-length homologues. PFAAs produced by
fluorotelomers contain mostly even chain-length homologues. Most commercial laboratories can report PFCA homologues ranging from C4 to C14 and select PFSA homologues between C4 and C12. USEPA (2009) published
PFCA profiles in various commercial products that showed different patterns of PFCA chain lengths. Chemical
fingerprinting for source identification may be useful for PFAS sites; however, changes in raw materials and
processes over time, as well as environmental fractionation, must be taken into account.
Examples of chemical fingerprinting for PFAS source identification can be found for wastewater treatment plants
(Clara et al. 2008), differentiating AFFF sources (KEMI 2015; Hatton, Holton, and DiGuiseppi 2018) (Section 3),
landfills (Lang et al. 2017; Xiao et al. 2012), surface water (Xie, Wang, et al. 2013), sediment (Qi et al. 2016), and
groundwater (Yao et al. 2014). Multivariate statistical analyses (that is, principal components analysis (PCA), cluster analysis, unmixing models) and geospatial analysis have been used extensively to distinguish PFAS
sources. Guelfo (2017) emphasized the importance of geospatial distribution of PFAS for source identification. Qi
et al. (2016) used PCA–multiple linear regression, positive matrix factorization, and unmix models to identify four PFAS sources (textile treatment, fluoropolymer processing aid/fluororesin coating, textile treatment/metal plating,
and precious metals). Zhang et al. (2016) used PCA, hierarchical clustering, and geospatial analysis to determine
sources in the northeast United States, and Lu et al. (2017) used factor analysis to classify three categories of PFAS in impacted groundwater. Pan, Ying, Liu, et al. (2014) used PCA in water and sediment samples to
distinguish between rural/agricultural and urban/industrial sources.
Evaluation of isomer profiles has been used to assess sources in multiple environments. PFAAs are generally identified as the straight-chain alkyl isomer. However, as discussed in Section 2.2, PFAA that are manufactured by
electrochemical fluorination contain about 20–30% branched-chain isomers, while the fluorotelomerization process produces mainly straight- chain isomers (Prevedouros et al. 2006; Kissa 2001; Parsons et al. 2008).
Laboratories generally report the concentration of a given PFAA as the total of the branched and linear forms;
however, the concentration of the linear isomer and an estimated concentration for the branched isomers can be reported independently. The concentration of branched isomers must be estimated because standards do not yet
exist for most branched-chain PFAA isomers (Section 11.2.1).
Benskin (2011) used the absence of branched PFCA isomers in dated sediment cores of two lakes to support the
conclusion that oxidation of FTOH was the major atmospheric source of PFCAs in the lakes and not direct transport of PFOA. Fredriksson (2016) used isomer profiles along with homologue patterns to assess the sources of PFAS
in avian eggs. The potential for environmental fractionation must be taken into account when evaluating isomer
profiles because linear and branched-chain isomers have different physical and biological properties, adsorption,
and bioaccumulation (Fredriksson 2016; Miralles-Marco and Harrad 2015). Other examples of isomer analysis for PFAS source identification include Shi et al. (2015), Benskin, DeSilva, and Martin (2010), and Karrman et al.
(2011).
PFAS releases into the environment can include fluorinated substances that are not captured by current analytical methods and PFAS target analyte lists. Some of these substances are polyfluorinated and can be
oxidized to form PFAAs that can be measured and reported. Such polyfluorinated substances are called “precursors.” The TOP assay, in which the samples are first oxidized and then analyzed for PFAAs, was
developed to estimate the mass of these precursors. (See Section 11.2.2 for further information on the TOP
assay). The results of PFAS analyses before and after oxidation can be used to generate a two-dimensional PFAS comparison and may be able to support source identification.
206

In practice, the TOP assay has a number of limitations, and the results are subject to interpretation. Although
there is a published TOP procedure (Houtz and Sedlak 2012), each commercial laboratory has developed its own procedure and quality control steps, and these procedures have not been standardized, nor has interlaboratory
validation been conducted. Comparability of TOP assay results between labs may not be possible and should
proceed on a case-specific basis after careful review of the methods used and data validation. Another limitation is the potential for incomplete oxidation of precursors during the analysis in the presence of high levels of TOC or
other compounds.
Quadrupole time-of-flight mass spectrometry (qTOF/MS) can be used to determine both the chemical formula
and structure of unknown PFAS in a sample, but analytical standards are required for unequivocal structural identification (Newton et al. 2017; Moschet et al. 2017; Barzen-Hanson et al. 2017). This method has the
potential to greatly increase the number of identified PFAS and provide more accurate source identification.
Chiral fingerprinting through enantiospecific isomer differentiation is a potential method for source identification,
although its use is still under development. Asher et al. (2012) applied this method to identify PFAS sources to an aquatic foodweb. However, they noted several limitations and assumptions when using this method for
PFAS source identification.
10.5.2 Challenges and Reasonable Expectations
Factors of importance when considering the analysis of source identification of PFAS can include:
• data quality, where care must be taken to ensure that analytical results from different time periods,
different methods, or different labs are comparable, as older data sets may provide incomplete
information when compared to more recent data
• target PFAS list, where a reduced compound list may prevent full differentiation between sources.
Linear versus branched (isomer) distinction may also be important.
• temporal effect, where an understanding of historical production, use, and release of PFAS becomes
important, as is an understanding of differences between samples due to weathering processes that
may be interpreted as different sources
• spatial effect of long-distance air deposition versus local sources
• sample collection procedures to ensure there is no cross-contamination from other sources during sampling
• weight of evidence based on multiple lines of inquiry.
Updated May 2021.
207

11 Sampling and Analytical Methods
The PFAS Team developed a training module video with content related to this section, it is the Sampling and
Analysis video.
Due to the ubiquitous nature of the wide array of PFAS and the low parts per trillion screening levels, all aspects
of a sampling and analysis protocol require a heightened level of rigor to avoid cross-contamination and achieve
the level of accuracy and precision required to support defensible project decisions. This section focuses on
providing the user with the appropriate tools and information to develop a site-specific sampling and analysis program to satisfy the project data quality objectives (DQOs). Accurate, representative data supports the
development of a defensible CSM, and ultimately the final remedy.
Section Number Topic
11.1 Sampling
11.2 Analytical Methods and Techniques
11.3 Data Evaluation
Information on sample collection for PFAS is sparse, with only a handful of guidance documents available for a practitioner to reference. Further, as there are limited peer-reviewed studies (Denly et al. 2019; Rodowa et al. 2020) on the potential for cross-contamination from commonly used sampling materials, most of these guidance documents default to a conservative approach in implementing measures and controls for prevention of cross-contamination (for example, washing cotton shirts with no fabric softener prior to use in the field). Although the actual methods of sample collection are similar to those used for other chemical compounds, there are several considerations for the practitioner when establishing a sampling program for PFAS. This includes selection of proper personal protective equipment (PPE), documentation of protocols for sample handling and decontamination procedures, use of nonbiasing material (for example, tubing, sample bottles, pumps) that could come into contact with the sample, and implementation of quality assurance/quality control (QA/QC) protocols to meet project DQOs, among other considerations. This section will give practitioners the tools needed to prepare a sampling program that adequately addresses project-specific DQOs and limits, to the extent practicable, potential cross-contamination and sources of potential bias.
Additionally, analytical methods are still evolving for PFAS analysis with several in development. Currently, only two USEPA methods are validated and published for the analysis of PFAS: USEPA Method 537.1, Version 2.0 (Shoemaker and Tettenhorst 2020) (which replaced USEPA Method 537.1, and USEPA Method 537 Version 1.1) and USEPA Method 533 (USEPA 2019). These methods are applicable only to finished drinking waters. As a result, laboratories offering modified methods to analyze other media such as nonpotable water, groundwater, soil,
sediment, air, and biota in the absence of published methods. These modifications are not specified in USEPA 537.1 or 533, resulting in variations from laboratory to laboratory and potentially inconsistent data. Because the quantification of PFAS within these media is key to completing a full site characterization, there is a demand for published methods that can accommodate the unique characteristics of each of these matrices and the changing complexity of the PFAS chemistry (our understanding of which continues to evolve). This section provides the essential PFAS-specific elements to understand and implement an analytical program using the USEPA 537.1 and 533 methodologies and touches on the various other qualitative techniques and procedures available to practitioners to meet DQOs and support the development of a defensible CSM.
208

11.1 Sampling
11.1.1 General
Sampling conducted to determine PFAS concentrations in water, soil, sediment, air, biota, and other media is
similar to that for other chemical compounds, but with several additional specific considerations and protocols.
Typical guidance and procedures, such as ASTM International D 4823-95 and D 4448-01, USEPA compendium EPA 540/P-87/001a and OSWER 9355.0-14, USEPA SESDPROC-513-R2, and USEPA SESDPROC-305-R3, remain
the basis for a PFAS sampling protocol.
Examples of special considerations for PFAS sampling include the types of sampling equipment or materials used
due to the widespread uses for and products containing PFAS; field and equipment blanks above and beyond what is normally required; the need for low laboratory quantitation limits; low state and federal screening levels, and in
some cases, cleanup criteria; potential for background sources of PFAS in the environment; and the need for
additional decontamination measures.
Examples of program-specific PFAS sampling protocols include:
• USEPA (2015) Region 4, Science and Ecosystems Support Division, Athens, GA, Field Equipment Cleaning and
Decontamination at the FEC, SESDPROC-206-R3, 2015
• Transport Canada (2017) Per- and Polyfluoroalkyl Substances (PFAS) Field Sampling Guidance
• Government of Western Australia (2016) Interim Guideline on the Assessment and Management of Perfluoroalkyl
and Polyfluoroalkyl Substances (PFAS)
• USDOD EDQW (2017) Environmental Data Quality Workgroup, Bottle Selection and other Sampling
Considerations When Sampling for Per- and Poly-Fluoroalkyl Substances (PFAS)
• State guidance:
• MA DEP (2018) Massachusetts Department of Environmental Protection, Interim Guidance on
Sampling and Analysis for PFAS at Disposal Sites Regulated under the Massachusetts Contingency Plan.
• Washington Department of Ecology (2016) Quality Assurance Project Plan; Statewide Survey of Per-and
Poly-fluoroalkyl Substances in Washington State Rivers and Lakes.
• NH DES (2019) New Hampshire Department of Environmental Services, Laboratory Testing
Guidelines for Per- and Polyfluoroalkyl Substances (PFAS) at Waste Sites, 2019
A comprehensive project-specific quality assurance project plan (QAPP) should be created to address PFAS-
specific considerations. If a QAPP is not created for a project, the sampling and quality assurance and quality control elements outlined in Section 11.1.6 should be included in site-specific work plans. If regulatory
procedures, methods, or guidelines are inconsistent with the needs of a PFAS sampling program, the governing
agency should be contacted directly to determine if an exception can be made or an alternate approach is needed. A CSM should be completed as part of the QAPP, including information on previous site uses, PFAS
use/manufacturing/handling practices, other possible contaminants and their uses, and/or related remediation
activities (for example, granular activated carbon (GAC), in situ treatments, or dig and haul) to determine all possible source areas of PFAS. Because PFAS is not typically analyzed along with other parameters at
traditional remediation sites, and analytical methods are only recently becoming standardized, previous or
ongoing remediation of other contaminants of concern can add a layer of complexity to a site’s geochemistry
and the fate and transport of PFAS.
209

Although some sampling elements (for example, sample bottle, preservation, and hold times) relating to
drinking water sampling are defined by USEPA 537.1 and 533, they do not provide all information that is needed to conduct a sampling event for PFAS. Because USEPA methodologies are still evolving for all other
media, there currently is no USEPA published information relating to media other than drinking water. As a
result, consultants and laboratories have derived their own requirements and protocols for these media, so they have yet to be standardized. It is important that the laboratory/consultant selected has demonstrated the
quality assurances (for example, sample hold time/preservation studies, proficiency testing, and laboratory
accreditation) necessary to providing credible results from their sampling/analysis requirements and protocols. The USEPA is currently working on guidance for sampling/analysis of PFAS in nonpotable water and solids.
Communication with the laboratory before, during, and after sampling is conducted is critical in ensuring that
project needs are met. If a sample is from an area known or suspected to be highly contaminated with PFAS, it is important that this is communicated to the laboratory. Chain of custody should indicate samples that potentially
contain a high concentration of PFAS. The laboratory should screen all samples to select the necessary sample
preparation procedures and to avoid contamination of their laboratory equipment and contamination of other field
samples.
Any water used for field sample blanks (for example, field and decontamination blanks) should be supplied by the laboratory performing the analysis. The laboratory should provide documentation verifying that the supplied water is
PFAS-free. “PFAS- free” is the project-defined concentration that associated blank concentrations must be below
(for example, less than the detection limit or less than half the limit of quantitation (LOQ)) to ensure an
unacceptable bias is not introduced into the sampling and analysis processes. The QAPP should clearly state the project’s definition of PFAS-free. Review of the laboratory’s standard definition of “PFAS-free” upfront is
necessary to ensure that it meets project needs and is a critical step in laboratory selection for a project.
Documentation of verification of PFAS-free water used in sampling should be required to be maintained for data validation purposes.
11.1.2 Equipment and Supplies
Many materials used in environmental sampling can potentially contain PFAS. There is limited published research
or guidance on how certain materials used by field staff or in sampling equipment affect sample results (see Denly et al. 2019; Rodowa et al. 2020). However, a conservative approach is recommended to exclude materials
known to contain the PFAS that are the target of the analysis from a sampling regimen, and such an approach
should be documented accordingly in the QAPP. Obtain and review all Safety Data Sheets (SDSs) before
considering materials for use during PFAS sampling, as product manufacturing formulations can change over time. If PFAS are listed on the SDS, it is recommended that piece of equipment/supply not be utilized. Exclusion from
the SDS does not necessarily mean the equipment/supply is not contaminated with PFAS. PFAS could have been
used not as a component of the equipment/supply, but as a material used in the manufacturing process itself (for example, mist suppressant or mold coating). This can result in the equipment/supply manufactured containing
PFAS. If necessary, materials in question can be sampled and analyzed for PFAS, or thorough decontamination
and collection of equipment blanks can provide sufficient quality assurances. Ultimately, a sampling program
should produce defensible data, and the best way to protect the integrity of samples is to ensure they are not compromised by contaminants originating from sampling equipment or otherwise.
Due to the ubiquitous nature of PFAS, sampling crews must review all materials and sampling protocols to avoid contamination and possible adsorption issues. Materials that may come into contact with samples and therefore
could potentially introduce bias include, but are not limited to:
• Teflon
• polytetrafluoroethylene (PTFE) waterproof coatings containing PFAS
• fluorinated ethylene-propylene (FEP)
• ethylene tetrafluoroethylene (ETFE) 210

• low-density polyethylene (LDPE)
• polyvinylidene fluoride (PVDF)
• pipe thread compounds and tape
A conservative PFAS sampling program may additionally restrict materials that are allowed on the sampling
personnel or in the staging area. A tiered approach is used for materials restrictions in that case, where the first tier would include restrictions on the sampling materials that will come in direct contact with the sample media,
and the second tier would include restrictions on what materials are allowed on sampling personnel or within the
staging area.
Examples of published guidance documents identify materials and equipment that can be used in PFAS-focused
investigations, as well as materials that should be avoided because they are known or suspected to be potential
sources of PFAS are:
• Bottle Selection and other Sampling Considerations When Sampling for Per- and Poly-Fluoroalkyl Substances
(PFAS) (USDOD EDQW 2017)
• Interim Guideline on the Assessment and Management of Perfluoroalkyl and Polyfluoralkyl Substances (PFAS)
Contaminated Sites Guidelines, (Government of Western Australia 2016)
• Wastewater PFAS Sampling Guidance, 10/2018 (MI DEQ 2018)
• General PFAS Sampling Guidance, 10/2018 (MI DEQ 2018)
Sometimes it is impossible or financially infeasible to eliminate materials that affect PFAS results in samples. For
example, these materials might be needed at sites where hazards warrant the use of specific PPE such as Tyvek suits, where PFAS are the secondary or co-contaminant and the primary contaminant requires specific materials
for proper sampling, or where the opportunity to collect a sample occurs before a proper sampling program is
developed. At PFAS sites where co-contaminants are not a factor, the same PPE is required as at traditional sampling sites (a minimum of nitrile gloves and safety glasses).
11.1.3 Bottle Selection
Sample container recommendations are dependent on the analytical method and should be
supplied by the laboratory and laboratory-verified to
be PFAS-free, as defined by the QAPP. USEPA 537.1 requires the use of 250 mL polypropylene
containers and caps/lids for drinking water sampling;
USEPA 533 also requires polypropylene containers and caps/lids but the bottle can be 100-250 mL.
Currently, USEPA has not issued guidance or
analytical methods for any sample media other than
drinking water, but nonpotable water methods guidance is expected to be published in the near
future. Depending on the analytical method used or
program (for example, state or DOD) requirements, polypropylene or high-density polyethylene (HDPE)
bottles with unlined plastic caps are typically used
(USDOD EDQW 2017).
Whole Sample Versus Aliquot
Because the concentration level of PFAS in aqueous samples determines whether the whole sample or an aliquot is used in the laboratory preparation, the sampler should collect an additional volume of each sample in a separate container. Then the laboratory can screen the extra sample for high concentrations without affecting the final sample result. For soil or sediment, obtaining a representative subsample in the laboratory is critical, so the entire sample should be homogenized in the laboratory prior to subsampling. Coordinating with the laboratory is crucial to determine the appropriate sample container volumes for environmental media other than drinking water.
211

Best practices in sample preparation must be used when selecting the size, volume, and representativeness of
samples. To minimize effects from analyte sorption on sample containers, the laboratory must analyze the entire
sample, including the sample container rinsate (USEPA 537.1 and 533). The project screening or applicable regulatory levels and the expected or potential concentration of the analytes are also relevant.
If the sample is known to contain high concentrations (ppm range) of PFAS (for example, AFFF formulations),
loss due to adsorption onto the sample container is negligible and therefore the entire sample does not need to be
used.
11.1.4 Sample Preservation, Shipping, Storage, and Hold Times
USEPA 537.1 and 533 contain specific requirements for drinking water sample preservation, shipping,
storage, and holding times (Shoemaker and
Tettenhorst 2020; USEPA 2019). Currently, there is no USEPA guidance or requirement for other
sample media. The USEPA has indicated that
draft guidance covering nonpotable water sampling methods will be published in the near future. Until
additional information is available, the thermal
preservation, shipping, storage, and holding times contained in USEPA 537.1 or 533 should be used
for all other sample media except biota. Biota
samples (for example, vegetation, fish) should be frozen to limit microbial growth until sample
preparation is performed at the laboratory. Microbial
growth may result in PFAAs values biased high due
to biodegradation of precursor compounds;
however, these effects have not been well
studied. Note that the chemical preservation
required by USEPA Method 537.1, TRIS (Trizma), and
USEPA Method 533, ammonium acetate, is added
for buffering and free chlorine removal and is
applicable to drinking water samples only.
11.1.5 Decontamination Procedures
Sampling equipment should be thoroughly decontaminated before mobilization to each investigation area and between sample locations at each investigation area or as required in the site-specific QAPP. Field sampling
equipment, including oil/water interface meters, water level indicators, nondisposable bailers, and other
nondedicated equipment used at each sample location requires cleaning between uses. The SDSs of detergents or soaps used in decontamination procedures should be reviewed to ensure fluorosurfactants are not listed as
ingredients. Use laboratory-verified PFAS-free water for the final rinse during decontamination of sampling
equipment. Decontaminate larger equipment (for example, drill rigs and large downhole drilling and sampling equipment) with potable water using a high-pressure washer or steam. To the extent practical, rinse parts of
equipment coming in direct contact with samples with PFAS-free water. Heavy equipment is best cleaned within
a decontamination facility or other means of containment (for example, a bermed, lined pad and sump, or a portable, self-contained decontamination booth). Potable water sources should be analyzed in advance for PFAS,
as well as during the sampling event. Wherever possible, rinse equipment with PFAS-free water immediately
before use.
212

An example decontamination procedure is as follows.
• Equipment caked with drill cuttings, soil, or other material will initially be scraped or brushed. The scrapings will be sampled, containerized, and appropriately disposed.
• Equipment will then be sprayed with potable water using a high-pressure washer.
• Washed equipment will then be rinsed with PFAS-free water.
• Decontaminated downhole equipment (for example, drill pipe, drive casing, bits, tools, bailers, etc.) will be placed on clean plastic sheeting (PFAS-free) to prevent contact with contaminated soil and
allowed to air dry. If equipment is not used immediately, it will be covered or wrapped in plastic
sheeting to minimize airborne contamination.
• Field sampling equipment and other downhole equipment used multiple times at each sample location will require cleaning between uses utilizing a four-stage decontamination process. The equipment will
first be rinsed in a bucket containing a mixture of potable water and PFAS-free soap. The equipment
will then be rinsed in each of two buckets of clean potable water. Water used for the final rinse during decontamination of sampling equipment will be laboratory-verified PFAS-free water.
Decontamination solutions should be replenished between sampling locations as needed. Spent
decontamination fluids should be containerized, properly labeled, and appropriately disposed of according to the
investigation-derived waste (IDW) plans addressed in the site-specific QAPP. Heavy machinery or motors should be inspected daily for leaks or problems that may result in an inadvertent release at an investigation area.
11.1.6 Field QC Samples
Field QC samples are a means of assessing quality from the point of collection. Such field QC samples typically
include field reagent blanks, source blanks, equipment rinse blanks, and sample duplicates. Collection and analysis of field QC samples are important for PFAS investigations because of very low detection limits and
regulatory criteria (ppt), to ensure accuracy and representativeness of the results to the sampled media, and to
assess potential cross-contamination due to the ubiquitous nature of PFAS. A sampling program should be designed to prevent cross-contamination and anthropogenic influence. However, the widespread commercial use
(historical and current) of PFAS-containing products, and especially their prevalence in commonly used sampling
materials and PPE, should inform the sampling program. PFAS sites may also have a wide range of concentrations with varying families of PFAS, as well as co-contaminants. Furthermore, PFAS sites have the potential to be high
profile in nature. Therefore, a comprehensive site-specific QAPP addressing DQOs and field QC samples, including
frequency, criteria, and procedures, is vital to a PFAS sampling program (see also Section 11.3, Data Evaluation).
When planning QA/QC sample frequency, the risk of cross-contamination should be considered. Cross-
contamination can occur from several sources, including field conditions, ineffective decontamination, incidental
contact with PFAS-containing materials, and sampling equipment and materials that were manufactured alongside PFAS-containing equipment.
USEPA 537.1 and 533 contain specific requirements for the field QC samples that must accompany drinking
water samples to be analyzed for PFAS. These include a minimum of one field reagent blank for each set of
samples per site and and field duplicates. USEPA specifies the frequency of the field duplicate in terms of
extraction batch (one per extraction batch, not to exceed 20 field samples), not collection frequency. Although USEPA methods are not yet available, media other than drinking water also warrant field QC samples, with
discussion and rationale provided in the following sections. Table 11-1 provides a list of field QC samples typical to
these methods and their typical minimum frequency. Once field QC sample data are obtained, they should be evaluated against the field samples by a person knowledgeable on the DQOs set forth in the site-specific QAPP.
For laboratory QC considerations, see Section 11.2, Analytical Methods/Techniques.
213

Table 11-1. Typical field QC samples
QC Sample
Description Minimum Suggested Frequency
Field reagent blank (field blank)
Laboratory-provided reagent water that, in the
field, is poured into an empty sample bottle or a sample bottle containing only preservative (if
required)
One per day per matrix per sample set
Source water blank
Water collected from potable water source that is utilized during the sampling
processes (such as decontamination and
drilling processes)
One per site, preferably prior to sampling event (if possible)
and at least once during
sampling event
Equipment rinse blank
(decontamination blank)
Final rinse of nondedicated sampling equipment
with laboratory-verified PFAS-free water
One per day per type of
sampling equipment used for
each day of sampling and each matrix sampled
Field duplicate Two samples collected at the same time and
location under identical circumstances
One per day per matrix up to
20 samples
Performance evaluation
(PE) sample
A sample containing known concentrations of
project analytes
One per project per matrix
11.1.6.1 Field Reagent Blank
A field reagent blank (FRB), described in the USEPA 537.1 and 533 for collection of drinking water samples, consists of a sample bottle filled with reagent water and preservatives (same as those used for the samples) in
the laboratory, sealed, and shipped to the sampling site along with the sample bottles. An empty sample bottle
containing only preservatives (same as those used for the samples) is also shipped along with each FRB into which the sampler pours the preserved reagent water and seals and labels the bottle for shipment along with the
samples back to the laboratory for analysis. This ensures that PFAS were not introduced into the samples during
sample collection/handling. A laboratory reagent blank is also analyzed in a laboratory setting to ensure the reagent water meets USEPA 537.1 and 533.
Field blanks may also be warranted during collection of sampling media other than finished drinking water. In lieu
of using a prepared quantity of laboratory reagent water/preservative solution as for drinking water FRB, a field blank can be prepared in the field using laboratory-verified PFAS-free water (may be equivalent to the laboratory
reagent water) and filling an empty sample container in the field, which is then sealed and labeled as a field
blank. This sample will be analyzed in the same manner as the normal samples and can indicate whether or not PFAS were introduced during sample collection/handling, and help to account for additional factors, such as
introduction of contaminated air particulate.
As discussed above, the frequency of FRB samples for finished drinking water sampling is one FRB for every
sample set at each site. A sample set is described in USEPA 537.1 and 533 as “samples collected from the same sample site and at the same time” (Shoemaker and Tettenhorst 2020; USEPA 2019).
214

11.1.6.2 Source Water Blank
Large quantities of water may be necessary to carry out a field sampling program for various reasons, including decontamination and certain drilling techniques (Section 11.1.5, Decontamination Procedures). For equipment
that may come into contact with samples of any media type, a multistep process is common to adequately
prevent cross- contamination. Quantities of laboratory-verified PFAS-free water are generally limited and can be costly. Therefore, potable water sources are typically used in initial decontamination steps. It is imperative that
these water sources be sampled and analyzed the same as normal samples prior to and even during a PFAS
sampling program to ensure that source water is not contributing to PFAS detections in normal samples.
Collect a sample from the source the same way it is collected for use (for example, if the source water is collected through a hose, collect the source water blank from that same hose). If there are unnecessary fittings or
hoses attached for collection of the source water, consider removing them for the duration of the sampling
program to avoid contamination of PFAS that may be present in their materials.
Frequency of collection of source water blanks is up to the professional judgment of the project manager, site
owner, and other stakeholders. The source water should be sampled at least once prior to starting the field
sampling program and once during the sampling event in case the analysis reveals that a different water source
must be found. A more conservative sampling program may include provisions for additional periodic sampling
and/or in cases where the conditions of the source water change.
11.1.6.3 Equipment Rinse Blank
Field equipment rinse blanks (ERBs) are those collected by rinsing a piece of field sampling
equipment/supplies with laboratory-verified PFAS-
free water and collecting the rinse water in a sample container for PFAS analysis. ERB collection is not
required by the USEPA 537.1 or 533 and is
dependent on the sampling media and methods
that are employed at a site. Generally, any equipment that is reused throughout the sampling
program, or nondedicated, and must be
decontaminated, should have an ERB collected from it. That is, if a piece of equipment is
decontaminated, an ERB should be collected from
it prior to its next use. Collection of ERBs can be avoided by using all dedicated or disposable
equipment where possible. However, many of
these options are limited due to the ubiquitous nature of PFAS compounds in many of these
equipment materials.
Field ERB collection frequency is largely up to the professional judgment of the project manager or other
stakeholders and is dependent on the sampling media and methods. For instance, ERBs collected from
decontaminated soil sampling trowels may only warrant a frequency of once per day, whereas ERBs collected from groundwater pumps may warrant an ERB prior to being deployed down each well due to their more
rigorous decontamination procedure and higher contact time with the groundwater being sampled.
Equipment Rinse Blanks (ERBs)
ERBs can be collected from equipment or supplies prior to the sampling event in cases where PFAS content is unknown or suspected or to verify the cleanliness of nondedicated equipment/supplies (Section 11.1.2).
215

11.1.6.4 Field Duplicate
Field duplicate (FD) samples are two samples collected at the same time and location under identical circumstances and treated exactly the same throughout field and laboratory procedures. Analysis from these
identical samples helps evaluate the precision of sample collection, preservation, storage, and laboratory
methods.
USEPA 537.1 and 533 do not specify the frequency of FD collection for finished drinking water samples; however,
they do specify the frequency of preparation (once per extraction batch, not to exceed 20 field samples). A more conservative sampling program may indicate a frequency of one FD per 10 field samples. FD collection frequency
should be discussed with stakeholders as necessary and be evaluated as part of the comprehensive site-specific
QAPP.
11.1.6.5 Performance Evaluation Sample
A PE sample contains project analytes with known concentrations of PFAS. This sample can be submitted to the
laboratory as a single- or double-blind sample. Analysis from this sample provides a positive control from a second
source.
11.1.6.6 Additional QA/QC Samples
Quality assurance replicate samples are defined here as co-located samples, taken at the same time and each
sent to a different laboratory. These types of samples may not be required in all sampling events. Aqueous QA
samples should not be split into two samples from the original container. Analysis from these QA samples
provides a measure of interlaboratory variability.
Trip spike samples are laboratory-spiked matrices that are included in the sampling kit sent to the field. These are
used to evaluate desorption efficacy of the analytical extraction.
11.1.7 Sampling Procedure
Standard sampling procedures can be used at most PFAS sites. However, there may be some exceptions and additional considerations related to PFAS behavior and issues associated with potential use of PFAS-containing
or -adsorbing sampling equipment and supplies, as previously discussed. A site-specific QAPP should contain
the standard operating procedures incorporating these considerations and client requirements. Refer to Section 11.1.2 for materials to avoid during sampling and drilling. Consult the supplier to determine if PFAS-free options
are available. Pretesting any equipment or supplies to be utilized is recommended. The analysis of field reagent
blanks may also provide useful information for equipment that cannot be pretested. ERBs are recommended to
ensure supplies such as bailers, beakers, and dippers are PFAS-free and that decontamination is effective.
11.1.7.1 Drinking Water/Non-Drinking Water Supplies
Sampling a “potable water source,” as defined by the USEPA SDWA (Section 1401(4), August 1998), is conducted according to protocol established in the USEPA Methods 537.1 and 533. This protocol defines sample bottle
preparation, sample collection, field reagent blanks, sample shipment and storage, and sample and extraction
holding times. The drinking water source is further defined here as a public drinking water supply, as opposed to
a private drinking water supply, as it applies to the USEPA 537.1 and 533. The following summarizes the sampling considerations described in this protocol:
• For Method 537.1: Sample bottle is a laboratory-provided 250-mL polypropylene bottle fitted with a polypropylene screw cap. For finished (treated) drinking water sampling only, a preservation agent is
provided inside each bottle prior to sample collection. This agent acts as a buffer (TRIS pH 7, 5 g/L)
and removes free chlorine from chlorine-treated drinking water supplies.
216

• For Method 533: Sample bottle is a laboratory-provided 100-250-mL polypropylene bottle fitted with a polypropylene screw cap. For finished (treated) drinking water sampling only, a preservation agent is
provided inside each bottle prior to sample collection. This agent acts as a buffer (ammonium acetate, 1
g/L) and removes free chlorine from chlorine-treated drinking water supplies.
• The sample handler must avoid PFAS contamination during sampling by thoroughly washing their hands and wearing nitrile gloves.
• Open the tap and flush the water (approximately 3–5 minutes) to obtain a “fresh” sample. Collect the sample while water is flowing, taking care not to flush out preservative. Samples do not need to be
headspace-free. Cap the bottle and, if applicable, shake to completely dissolve preservative.
• Keep sample sealed and place sample on ice for shipment.
• Samples must be chilled during shipment and must not exceed 10°C during shipment.
• Laboratory extraction of the sample must take place within 14 days hold time.
Based on a review of industry experience and guidance, additional considerations for collecting drinking water
samples for PFAS analysis are as follows.
• Ideally, the sample should be collected from a tap or spigot located at or near the well head or pump house and before the water supply is introduced into any storage tanks or treatment units. If the
sample must be collected at a point in the water line beyond a tank, a sufficient volume of water
should be purged to provide a complete exchange of fresh water into the tank and the tap or spigot. If the sample is collected from a tap or spigot located just before a storage tank, spigots located
downstream of the tank should be turned on to prevent any backflow from the tank to the tap or
spigot. Several spigots may be opened to provide for a rapid exchange of water.
• The sample port for a private water supply well will be opened and allowed to flush for at least 15 minutes, when possible. When sampling from a drinking water well that is not in regular use, purge
water until water quality parameters (that is, pH, specific conductance, dissolved oxygen, oxidation-
reduction potential, turbidity, and temperature) have stabilized, to ensure formation water (as opposed
to stagnant well column water) will be sampled. An adequate purge is achieved when the pH and specific conductance of the potable water have stabilized (for example, within 10% across three
consecutive measurements) and the turbidity has either stabilized or is below 10 nephelometric
turbidity units. Note: According to USEPA (2013), pg. 21 “[a] well with an intermittently run pump should, in
all respects, be treated like a well without a pump. In these cases, parameters are measured and the well is
sampled from the pump discharge after parameter conditions have been met. Generally, under these
conditions, 15 to 30 minutes will be adequate.”
• When sampling from a tap, the tap must be protected from exterior contamination associated with being too close to a sink bottom or to the ground. Contaminated water or soil from the faucet exterior
may enter the bottle during the collection procedure because it is difficult to place a bottle under a low
tap without grazing the neck interior against the outside faucet surface. If the tap is obstructed in such
a way that prevents direct collection into the appropriate sample container, it is acceptable to use a smaller container to transfer sample to a larger container. The smaller container should be made of
HDPE or polypropylene and should be either new or decontaminated as specified in Section 11.1.5.
Evaluation of the transfer container is recommended to ensure that it does not introduce a bias.
• When filling any sample container, care should be taken that splashing drops of water from the ground or sink do not enter either the bottle or cap.
• Leaking taps that allow water to discharge from around the valve stem handle and down the outside of the faucet, or taps in which water tends to run up on the outside of the lip, are to be avoided as
sampling locations.
• Disconnect any hoses, filters, or aerators attached to the tap before sampling. These devices can
harbor a bacterial population if they are not routinely cleaned or replaced when worn or cracked and may contain PFAS.
217
Taps where the water flow is not constant should be avoided because temporary fluctuation in line pressure may
cause clumps of microbial growth that are lodged in a pipe section or faucet connection to break loose. A smooth flowing water stream at moderate pressure without splashing should be used. The sample should be collected
without changing the water flow.
11.1.7.2 Groundwater
Groundwater PFAS sampling protocols are the same as those for drinking water sampling as discussed above with the following exceptions and/or additional considerations.
• Nonpotable water does not require a chemical preservative. Clean laboratory-provided HDPE or polypropylene bottles are recommended; typically 125 mL to 1L are used.
• Groundwater is typically sampled from a well, and therefore additional equipment is required. Purging and sampling equipment is constructed from a variety of materials. As a result, there are more
opportunities for contamination of the sample due to the sampling equipment. For example, pumps, bailers, and stopcocks can contain O-rings and gaskets that may be Teflon, or another fluoropolymer,
that can be changed out. The most inert material (for example, stainless steel, silicone and HDPE),
with respect to known or anticipated contaminants in the well(s), should be used whenever possible. The various types of purging and sampling equipment available for groundwater sampling are described
in ASTM International Standard Guide for Sampling Ground-Water Monitoring Wells, D 4448-01 (ASTM 2007)
or Compendium of Superfund Field Operations Methods (USEPA 1987).
• Do not use dedicated sampling equipment installed in existing wells prior to the PFAS investigation
without identifying all materials found within the equipment and reviewing their chemical properties to ensure they are PFAS free. Pumps can be a source of PFAS contamination due to internal
components (for example, bladder pumps that contain Teflon components that can be switched out
for HDPE). Consult with the equipment vendor to determine if they have PFAS-free alternatives. For circumstances that warrant, such as very deep wells or sites with co-contaminants, samples may
be collected in duplicate with and without existing dedicated equipment. If PFAS analyses show
that the equipment does not impact results, the equipment may be kept and used long term. However, this determination is dependent upon project-specific requirements and should be
allowed by a project manager only with full disclosure to all stakeholders. It may also be acceptable
to simply collect an ERB after fully decontaminating equipment containing PFAS components to confirm it does not contribute to groundwater sample concentrations. A site-specific procedure
should be outlined in the QAPP.
• In addition to equipment, ensure tubing and bailing twine are PFAS-free.
• Within the context of sample collection objectives outlined in a site-specific QAPP, the sample location in the water column should consider the potential stratification of PFAS in solution and their tendency
to accumulate at the air/water interface. For more information on stratification, see Section 5.2.
• Do not filter the sample, as filtration may be a source for contamination (Ahrens et al. 2009; Arp and
Goss 2009) or PFAS may be adsorbed to the filter. If filtration is absolutely necessary, it should be performed in the laboratory, using a validated procedure that includes steps to eliminate the bias
that can occur due to sorption issues. As an alternative, laboratory-validated procedures may
include centrifuging the sample due to potential filter sorption or contamination issues.
In cases where co-contaminants require use of PFAS materials, sampling events should be separated to avoid
contamination from these materials. The PFAS sampling event would be completed first, followed by the sampling
event for the co- contaminants. In some cases, it may be acceptable to use the same equipment and concurrent sampling event.
218

11.1.7.3 Surface Water
Surface water PFAS sampling is conducted in accordance with the traditional methods such as those described
in the USEPA’s Compendium of Superfund Field Operations Methods (USEPA 1987) with the following exceptions and/or additional considerations.
• Within the context of sample collection objectives outlined in a site-specific QAPP, the sample location in the water column should consider the potential stratification of PFAS in solution and their tendency
to accumulate at the air/water interface. For more information on stratification, see Section 5.2. If
possible, the transfer container will be lowered sufficiently below the water surface but above the
bottom sediments.
• Transfer containers, such as beakers or dippers, which may be attached to extension rods, should be used if sample containers have preservatives. Sampling by direct sample container
immersion is not recommended.
11.1.7.4 Porewater
Similar in many ways to sampling techniques and equipment used in groundwater sampling for PFAS, porewater purging and sampling involves a variety of materials. The various types of purging and sampling equipment
available for porewater sampling are described in Pore Water Sampling Operating Procedure (USEPA 2013). For PFAS
sampling, peristaltic pumps with silicon and HDPE tubing are typically used for porewater sample collection, along with push point samplers, porewater observation devices (PODs), or drive point piezometers. Push point samplers
and drive point piezometers are made of stainless steel, while PODs consist of slotted PVC pipe and silicon
tubing. PODs and drive point piezometers are permanent, or dedicated, sample points typically installed and used for multiple sample events, whereas push point samplers are used for a temporary sampling location. Otherwise,
the standard procedure for porewater purging and sampling using a peristaltic pump, as described in the
Compendium of Superfund Field Operations Methods (USEPA 1987), can be followed.
11.1.7.5 Sediment
Most core and grab sampling devices are constructed of stainless steel. Some core samplers include an HDPE sleeve inserted in the core barrel to retain the sample. Ensure that materials that contact the media to
be sampled do not have water-resistant coatings that contain PFAS that are the target of the analysis.
Additional PPE may be required for sampling personnel, such as waders and personal flotation devices. Ensure that materials that will potentially contact sampling media do not consist of water-resistant coatings or other
PFAS-containing materials or substances. Refer to Section 11.1.2 for typical materials used during sampling
and drilling.
11.1.7.6 Surface Soil
For surface soil sampling, refer to Sections 11.1.2 and 11.1.5 for equipment and supplies and decontamination procedures. No additional considerations are recommended for PFAS sampling of surface soil.
11.1.7.7 Subsurface Soil
No additional considerations are recommended for PFAS sampling of subsurface soil.
219

11.1.7.8 Fish
The species of fish collected, as well as the portion of fish sampled (whole versus fillet), depends on the project
goals (for example, ecological risk or human health). Studies have shown that the majority of the PFAS in fish are stored in the organs, not the flesh (Martin et al. 2004) (Yamada et al. 2014). Communicating project objectives to
the laboratory is important prior to fieldwork to determine the necessary quantity and quality of tissue, fish handling
requirements, laboratory sample preparation (including single fish or composite fish samples, and whole or fillet preparation), and packing and shipping requirements. Fish or other biota samples should be wrapped in HDPE or
polypropylene bags.
11.1.7.9 Air Emissions and Ambient Air
Currently, there are no multilaboratory-validated, published sampling methods for PFAS in air emissions (for
example, from thermal treatment in manufacturing plants or incinerators). In their absence, sampling and analysis have been performed using modifications of existing USEPA methods. For example, stack testing has
been performed in a few states (New Hampshire, New Jersey) using a modified USEPA Method 5 sampling train.
There are currently no USEPA Federal Reference Methods (FRM) or Toxic Organic Methods (TO series) available specifically for the measurement of PFAS compounds in ambient air. In their absence, some sampling and
analysis of ambient air has been perfomed using modified TO methods, such as TO-13A and TO-9. Both of these
methods make use of high-volume air samplers fitted with both a particulate filter glass fiber filter/quartz fiber filter (GFF/QFF) and sorbent cartridge for the collection of particulate and gaseous phases, respectively. USEPA TO-
13A specifies collection of air samples at a flow rate of
approximately 225 liters/minute, resulting in an air volume greater than 300 m3. The solid sorbent used consists of a “sandwich” of polyurethane foam (PUF) and XAD-2 (polymer of styrene divinyl benzene). PFAS in ambient air
have been measured using both active (with actual flow) and passive (gas diffusion) sampling techniques. The
majority of techniques have made use of solid sorbents such as PUF, XAD-2, and sorbent-impregnated PUF (SIP).
(Finely ground XAD-4 resin is often the sorbent of choice for impregnating the PUF). Active samples also include a particulate filter (glass or quartz fiber) ahead of the sorbent module. To optimize detection limits, high-volume air
samples have been used most often.
Detetion limits of air and emissions methods can be greatly influenced by PFAS artifacts found in the neat filter, sorbent media, or components within the sampler itself. For example, use of Teflon gaskets in high-volume
samplers is not recommended. Field sampling programs must include collection of field blanks as a means of assessing PFAS artifacts present in sampling media and potentially introduced during sample handling in the
field. Other quality control measures that should be considered include collection of duplicate or co-located
samples and the use of isotopically labeled PFAS. The latter compounds are typically applied/spiked by the laboratory into the sorbent media prior to field deployment. These compounds serve to assess analyte (“native
PFAS in air”) collection efficiency, breakthrough, and the accuracy of the combined sample collection and analysis
method on a sample-specific basis.
Passive samplers should also make use of mass-labeled PFAS as a sample-specific quality control measure to account for native PFAS losses during each sampling event. Volatilization of labeled PFAS during the deployment
period provides sampling rates on a site-specific basis and accounts for both temperature and wind influences.
USEPA and European groups (Verein Deutscher Ingenieure [VDI], association of German engineers) are currently
evaluating and investigating which sampling methods might be, in principle, the most suitable to capture PFAS
and resulting byproducts in all fractions of the emissions (particles, moisture, gas phase). An important
consideration is that fluorinated polymers are used in common sampling equipment, which may cause contamination of the samples. For the purposes of PFAS determinations, this material must be replaced.
220

Stack Emissions
Stationary source, or stack, emissions of PFAS have been measured in North Carolina (NC DEQ 2019) and New Hampshire (NH DES 2019) from industrial facilities that synthesized (Chemours, NC) or conducted manufacturing
utilizing (Saint-Gobain, NH) PFAS. These test programs confirmed that stack emissions from industrial facilities
contribute to ground and surface water contamination (NC DEQ 2019). As in the case of ambient air measurements, no USEPA FRMs are available specifically for the measurement of PFAS from stationary sources. In these tests
PFAS were measured using USEPA SW846 Method 0010 (Modified EPA Method 5 Sampling Train) (USEPA 1986),
a method designed for measurement of semivolatile organic compounds.
PFAS can be partitioned in stack emissions into several different fractions due to the physical properties of these
species. At the elevated temperatures typically encountered in stack emissions the vapor pressure can be
sufficiently high that some is present in the gas phase. The lower molecular weight fluorotelomer alcohols
(FTOHs) have lower boiling points and so may primarily be present as vapors. PFAS can adsorb to particulate matter, are highly water soluble, and can dissolve in water droplets if present in the stack. To measure these
partitioned fractions, the stack effluent is sampled isokinetically (that is, the air enters the probe at the same
velocity as it is moving in the stack, to accurately sample particles and droplets) and captured on a heated filter,
an XAD-2 sorbent resin tube, and in water impingers. In some test programs a second XAD-2 sorbent cartridge is included in the sample train to determine if breakthrough has occurred. The filter, sorbent cartridge, and water
impingers are recovered separately, and the sample train components are rinsed with a methanol/ammonium
hydroxide solution.
The four fractions (filter, sorbent, water, and rinse) are extracted as defined in SW846 Method 3542 (Extraction of
Semivolatile Analytes Collected Using SW-846 Test Method 0010) (USEPA 1996) and analyzed by a modified version of
USEPA Method 537 (Shoemaker and Tettenhorst 2018)utilizing isotope dilution. The more volatile (boiling point < 100oC) PFAS can be sampled by modified USEPA Method 18 (Measurement of Gaseous Organic Compound Emissions
by Gas Chromatography) (USEPA 2017), in which the analytes are captured in chilled methanol impingers.
The USEPA Office of Research and Development has been evaluating alternate sampling and analysis
approaches for PFAS air emissions (USEPA 2019). According to the USEPA’s Per- and Polyfluoroalkyl Substances
(PFAS) Action Plan (2/19) (USEPA 2019), a method for sampling and analyzing PFAS in factory stack air emissions is anticipated in 2020. USEPA has been participating in the testing at Saint-Gobain (NH) and Chemours (NC) by
either evaluating alternate sampling methods or performing independent analysis of the stack test samples. As
stated in the Action Plan pg. 51, USEPA is “testing and developing additional methods for possible refinement, including
methods to quantify PFAS precursors; Total Organic Fluorine for a general PFAS detection method; and refinement of non-
targeted high-resolution mass spectrometry approaches for suspect screening and novel PFAS discovery.”
To date, test reports from ten stack tests conducted at Chemours have been published on the North Carolina
Department of Environmental Quality website (NC DEQ 2019). One stack test report from the Saint-Gobain facility has been published on the New Hampshire Department of Environmental Services website (NH DES 2019).
These test reports detail the sampling and analysis methodologies used thus far in measuring PFAS stack
emissions.
221

11.1.7.10 Human Blood, Serum, Tissue
Currently, there is no official or standard method for testing blood, serum, or tissue. Laboratories and the
Centers for Disease Control and Prevention (CDC) are in the process of developing best methods. A procedure
developed by the CDC’s National Center for Environmental Health has been published (CDC 2016). There are also several laboratories advertising this capability; however, the analytical methods and modifications from
validated environmental laboratory protocols will not be consistent between these vendors. Human testing is
outside the scope of this document; however reference points that could be used for comparison of whole blood or serum results to geometric mean serum levels generated from the U.S. population are included in the ATSDR
ToxGuide for Perfluoroalkyls (ATSDR 2020).
11.1.7.11 Potential High Concentration Samples
The CSM or previous sampling may indicate areas of high concentrations of PFAS for which single-use, disposable
equipment is recommended. If single-use is not possible, take additional precautions such as implementing a
greater frequency of ERBs and not reusing equipment to sample potentially low PFAS concentration samples.
High concentration samples should be segregated during shipping to the laboratory, and clearly identified on the Sample Chain of Custody.
Some projects may require the analysis of AFFF product that has been used at the site. All AFFF product samples
must be considered high concentration samples. These samples should be segregated from other samples during sampling and shipping to avoid cross-contamination. Notify the laboratory in advance, if possible, to
expect serial dilutions so that practical quantitation limits can be met for high concentration samples. High
concentration samples should be segregated during shipping to the laboratory, and clearly identified on the Sample
Chain of Custody. When alerted to potential high concentration samples, the laboratory will complete an initial
screen of the sample and proceed with a serial dilution of the sample as necessary.
11.1.7.12 Field Test Kits
Field test kits are available for PFAS but have not been fully evaluated. Although these kits cannot achieve low detection limits, they could be helpful in screening for potential high concentrations of PFAS in the field.
222

11.2 Analytical Methods/Techniques
11.2.1 Quantitative
11.2.1.1 General
Analytical methods are still evolving for PFAS analysis. Currently, very few methods are multilaboratory-validated
and published. Two multilaboratory-validated methods, USEPA 537.1 and USEPA Method 533 have been
published for analysis of finished drinking water samples (Shoemaker and Tettenhorst 2020; USEPA 2019).
• Method 537.1 tests for 18 PFAS analytes (12 PFAAs and 6 other PFAS, including HFPO-DA (a GenX
process chemical). In this method surrogates are added prior to solid-phase extraction (SPE) to
assess for analyte loss due to sample preparation. Internal standards are added to the final sample extract to assess instrument performance.
• Method 533 tests for 25 PFAS analytes (16 PFAAs and 9 other PFAS, including HFPO-DA (a GenX process chemical) and ADONA.
Other methods have been published for media other than finished drinking water. Lists of these methods by
various categories are provided in external tables (Excel spreadsheet).
• External Table 11-2–Published Method Basics. Provides information on basic principles of each method (media
• type, validation status, method type, sample container requirements, holding time, preservation requirements, and analytical instrument.
• External Table 11-3–Published Methods Specifics. Provides more details of the methods such as sample preparation requirements, quantitation scheme, confirmation requirements, quantitation limits, and isomer profile.
• External Table 11-4–Analyte Lists. The method analyte list for each of these methods varies.
• External Table 11-5–Draft Published Methods
Currently, the DOD’s Quality Systems Manual (QSM) for Environmental Laboratories, Version 5.3, Appendix B, table B-15
(USDOD 2019) provides the most current and comprehensive set of quality standards for PFAS analysis. These
performance- based standards outline specific quality processes for sample preparation, instrument calibration, and analysis when working with PFAS. The USDOD (2019), QSM Version 5.3, Appendix B, table B-15 criteria
currently require isotope dilution quantitation of PFAS. The isotope dilution method accounts for interferences
caused by complex sample matrices and bias introduced by sample preparation and instrument issues.
Significant improvements in the trace level analysis of PFAS in environmental and biological matrices can be
attributed to the availability of good chemical standards and their mass-labeled internal standards. There is a need for well-characterized and high-purity branched isomeric standards for the accurate measurement of
branched and linear PFAS isomers. Additionally, innovations and availability of instrumentation and laboratory
supplies that help to eliminate background contamination are being sought. Such advances include the availability of polyetherketone (PEEK) tubing for solvent lines and use of an additional column to delay the
contamination peaks due to impurities in solvents and system components.
Quantification of the branched isomers is often performed using the calibration curve of linear isomers and reported as the total isomers (both linear and branched). Branched isomers interact with adsorbent materials and
analytical columns differently than their linear counterparts, which can make analyses of these PFAS challenging,
especially if there are no branched stable isotopically labeled analog standards available.
223

11.2.1.2 Sample Preparation
Although ASTM International provides analytical methods for waters (D7979) and soils (D7968), there are no USEPA- promulgated analytical methods for nondrinking water matrices. Each laboratory creates their own
method, and the customer should review and confirm that the laboratory method will meet their needs. Care
must be taken to prevent sample contamination during preparation and extraction because the limits of quantitation and detection are 1,000 times below (ppt) those for more routine analyses such as volatiles or
semivolatile analysis (ppb). It is recommended that all supplies be checked and confirmed as PFAS-free prior
to sample preparation. Intermittent contamination can occur due to vendor or manufacturing changes.
For PFAS analysis, isotope dilution analysis (IDA) requires the use of extraction internal standards (EIS) consisting of isotopically labeled analogs of the PFAS targets when available, to be added to the sample at a designated
point in sample preparation or analysis, depending on the sample matrix:
• aqueous samples–added to field samples while in the original container prior to extraction
• solid samples and biota–added after homogenization and subsampling, prior to addition of water or extraction solvent to samples
• serial dilution–added to high concentration samples after final dilution for serial dilution prepared samples
Ensuring a representative sample/subsample for analysis is critical. For aqueous samples the entire sample and rinsate of the sample container received by the laboratory must be extracted by SPE, to recover any PFAS
that adhere to the sample container. Sample filtration is not recommended for sample with high particulate
content because retention of PFAS onto filters has been noted. Centrifuging is often used to reduce sample particulates. Due to limitations in SPE cartridge capacity, samples containing high concentrations of PFAS (for
example, AFFF formulations) may be prepared by serial dilution. These high concentration samples are the only
instance when adsorption onto the sample container is not an issue. The laboratory should prescreen aqueous
samples using the small volume sample that was received to determine if the sample contains PFAS at concentrations too high for SPE sample preparation and may be prepared using serial dilution techniques.
It is recommended that for soil samples, the entire sample collected be homogenized in the laboratory prior to subsampling. Solids are typically extracted using solvent, with the resulting extract being further extracted using
SPE. Cleanup procedures (such as ENVI-Carb) should be used on extracts and all associated batch QC
samples (for example, method blank and laboratory control samples) when matrix interferences (for example, bile salts, gasoline range organics) could be present. Cleanup procedures should always be utilized for preparation of
soil, sediment, and biota. PFAS loss may occur when extracts are evaporated to dryness or at temperature
higher than 60ºC. Care must be taken to avoid these outcomes.
QC samples should be performed in accordance with the QAPP. Common laboratory QC samples included in
PFAS analysis are:
• method blank–(one per prep batch of 20 field samples or fewer) PFAS are ubiquitous and found in many analytical instrument systems, reagents, containers, and common laboratory environments. The
method blank is the same media as associated field samples and undergoes the same sample
preparation procedure as the associated field samples. It is a vital indicator for the analysis.
• instrument blank–(minimum of one prior to start of daily analysis and after samples exceeding the
quantitation range) Instrument blanks must contain internal standards, as they are used to measure background concentrations resulting from instrumentation and supplies and sample carryover.
• sample duplicate –(minimum of one per preparation batch of 20 field samples or fewer) A solid or high concentration sample that cannot undergo SPE is prepared and analyzed in duplicate in a single
laboratory to ensure the laboratory’s subsampling procedures are capable of achieving a known level
of precision as defined in the QAPP.
224

• lab control sample (LCS)–(one per prep batch of 20 field samples) Must contain all of the project-specific PFAS in the same media as associated field samples and is used to evaluate bias associated with
sample preparation as well as analytical processes.
• certified reference material (CRM)–(if available, one per prep batch of 20 field samples or fewer) Unlike LCSs, which contain no matrix interferences, CRMs can be of significant value when dealing with complex matrices such as soil and tissue.
• matrix spike (MS) and MS duplicate (MSD)–(one pair per prep batch of 20 field samples or fewer) An MS/MSD QC pair is not needed if IDA can be used for all of the PFAS of interest because the EIS used
account for the influence of matrix interferences. If such standards are not available for a PFAS of
interest, an MS/MSD QC pair may be warranted to assess the effects of matrix interference on that
specific PFAS.
When IDA is performed or for samples with high concentrations of PFAS, it is recommended that in lieu of an MS
and MSD, an LCS duplicate and sample duplicate be prepared. If samples are prepared using serial dilutions, the
sample duplicate should be prepared using a different aliquot from the same sample bottle to create a second set
of serial dilutions.
11.2.1.3 Sample Analysis
Instrument Type–LC/MS/MS
Currently, the analytical detection method of choice for PFAS analysis is liquid chromatography-mass
spectrometry-mass spectrometry (LC/MS/MS), which is especially suited for analysis of ionic compounds, such as the PFSAs and PFCAs. Gas chromatography-mass spectrometry (GC/MS) can also be used for PFAS analysis,
specifically the neutral and nonionic analytes, such as the fluorotelomer alcohols (FTOHs), perfluoroalkane
sulfonamides, and perfluoroalkane sulfonamido ethanols. At this time, LC/MS/MS analysis of PFAS is available,
whereas GC/MS analysis has very limited commercial availability for PFAS. LC/MS/MS operated in multiple reaction
monitoring (MRM) mode offers a unique fragment ion that is monitored and quantified from a complex matrix. MRM
is performed by specifying the mass-to-charge ratio of the compound of interest for fragmentation within the
MS/MS. This is facilitated by specifying the parent mass of the compound of interest for MS/MS fragmentation and
then monitoring only for product ions. Ions arising from that fragmentation are monitored for by the MS/MS, which yields improved specificity and sensitivity.
Standards Preparation and Storage
Certified analytical standards are available from several manufacturers. Products may have variable purity and
isomer profiles, which may compromise the accuracy, precision, and reproducibility of data. Only certified
standards of the highest purity available, for example, American Chemical Society grade, can be used for accurate quantitation. Standards containing linear and branched isomers are not commercially available for all
applicable analytes. Currently, such standards are available only for PFOS, perfluorohexane sulfonic acid
(PFHxS), 2-(N-methylperfluorooctanesulfonamido) acetic acid (NMeFOSAA), and 2-(N-ethylperfluorooctanesulfonamido) acetic acid (N-EtFOSAA). Technical grades that contain branched and linear
isomers are available for other PFAS, but these standards do not have the accuracy needed for quantitation
purposes. These standards may, however, be qualitatively useful for verifying which peaks represent the branched isomers. Stock standards of PFAS analytes, internal standards, and surrogate standards supplied in
glass ampoules by the manufacturer are acceptable. Manufacturers of the certified analytical standards often
provide laboratories storage and shelf life guidance for stock and working standards.
225

Steps to Help Eliminate Laboratory/Instrument Contamination (Verification of Supplies, Instrument Blanks, Isolator Columns)
Laboratory and instrument contamination is of particular concern for PFAS given that the limits of detection are in the parts per trillion (ppt) range. Additionally, nonpolymer PFAS may be found at trace levels as impurities in some
polymer products (3M 1999). PFAS are found in commonly used laboratory items such as polytetrafluoroethylene
products (PTFE), solvent lines, aluminum foil, and methanol, which could lead to method interferences and elevated baselines in chromatograms if not checked. USEPA 537.1 recommends that all of the above items must
be “less than 1/3 the MRL (minimum reporting limit) for each method analyte under the conditions of analysis by
analyzing laboratory reagent blanks.” (Shoemaker and Tettenhorst 2020) pg. 7. USEPA 533 further specifies that the isotopically labeled analogues and isotope performance standards meet this same requirement (USEPA
2019), pg. 7. The liquid chromatograph can be fitted with an isolator column to separate contamination arising
from the solvent delivery system, which allows for quantitation at low detection limits. Guard columns should be used to protect analytical columns.
Ion Transition Selection (Recommended Transitions for Primary and Confirmation Ions, Including Ratio Criteria)
Quantification by LC/MS/MS may be accomplished using a variety of techniques. For relatively simple matrices
such as drinking water, USEPA 537.1 quantifies analytes by comparing the product ion of one precursor ion and
retention time in samples to calibration standards. For more complex matrices, additional product ions and their ion ratios can be used to distinguish analytes from matrix interference. In an MS/MS system, most analytes can
be fractured into more than one ion. By monitoring the area of each ion and comparing the ratio of those area
counts, a more definitive identification can be made. This identification allows the analyst to distinguish true target analytes from false positives. This more detailed quantification is not required for drinking water matrices, but it is
useful for more complex matrices. It is recommended that two ion transitions from parent to characteristic product
ions be monitored and documented for each analyte, with the exception of PFBA and PFPeA. Ion transition ratio criteria should be determined based on information obtained from analysis of standards and used to detect
potential bias in sample results. To avoid biasing results high due to known interferences for some transitions, the
following are recommended transitions as defined in DOD QSM (2019), Version 5.3, Appendix B, table B-15 (USDOD 2019): PFOA: 413 → 369, PFOS: 499 → 80, PFHxS: 399 → 80, PFBS: 299 → 80, 4:2 FTS: 327 → 307, 6:2
FTS: 427 → 407, 8:2 FTS: 527 → 507, N-EtFOSAA: 584 → 419, and NMeFOSAA: 570 → 419.
Mass Calibration, Calibration Criteria, and Calibration Verification Mass calibration should be performed at setup, after performing maintenance that is required to maintain instrument sensitivity and stability performance, and as needed based on QC indicators, such as calibration
verifications. Mass calibration should be performed according to the manufacturer’s instructions.
USEPA Methods 537.1 and 533 contain requirements for instrument calibration and calibration verification specific
for drinking waters. It is suggested that until other USEPA or ISO methods are published, these criteria should be
used for all nonisotope dilution/internal standard analyses. The instrument should be calibrated at setup and as needed following initial calibration verification (ICV) or continuing calibration verification (CCV) failure. The lowest
calibration point should be a concentration at or below the LOQ. A standard at the LOQ concentration should be
analyzed at least daily to document the instrument’s ability to accurately quantitate down to that concentration.
226

An ICV prepared from a source separate from the calibration standards should be analyzed after each initial
calibration and before sample analyses are performed. The minimum frequency for ICV should be once after each initial calibration, prior to sample analyses. At a minimum, CCV should be done prior to sample analysis on days an
ICV is not analyzed, after every 10 field samples, and at the end of the analytical sequence. CCVs should rotate
in concentration to cover the entire calibrated range of the instrument. For example, as in USEPA 537.1, the calibration acceptance criteria for each analyte are that the lowest calibration point must be within 50–150% of
its known value while the other calibration points must be within 70–130% of true known values. To account for
biases resulting from preparation steps, isotope dilution should be used for quantitation. Isotope dilution is a
quantitation technique that considers sample matrix effects on each individual PFAS quantitation in the most
precise manner possible. This technique quantifies analytes of interest against isotopically labeled analogs of the
analytes, which are added to the sample both prior to and after sample preparation. Addition of EIS prior to
preparation helps account for loss of analyte during the preparation process and for bias associated with the instrumentation. Calibration criteria for methods using isotope dilution can be found in ISO Method 25101 or DoD
QSM Version 5.3, Appendix B, table B-15. Methods using isotope dilution should include isotope analog recovery for
each sample and analyte in data reports. Isotope analog recoveries should be reported, and minimum/maximum isotope analog recoveries may be required by specific analytical procedures. Depending on project DQOs, low
isotope recovery may indicate that quantitation was inadequate; the data are then reported as estimated values.
Instrument Blanks: When Are They Needed, Criteria, and Corrective Actions to Take
Due to the ubiquitous nature of PFAS, instrument blanks are critical in determining if the instrument is potentially
affecting PFAS concentrations in samples. Instrument blanks should be analyzed following the highest calibration
standard analyzed and daily prior to sample analysis. The concentration of each analyte should be ≤ ½ the LOQ. If
instrument blanks indicate contamination following the highest calibration standard, corrective action, such as calibrating with a lower concentration for the highest standard, should be taken. Successful analysis of an
instrument blank following the highest standard analyzed determines the highest concentration for which carryover
does not occur.
Matrix-Specific Information
Drinking Water
Interferences related to the matrix can be caused by the co-extraction of contaminants from the sample. These
matrix interferences can have considerable variation from sample to sample. For example, there are problems
associated with free chlorine in chlorinated finished waters and using TRIS (Trizma; for USEPA Method 537.1) or ammonium acetate (for USEPA Method 533) can help overcome some of these issues.
Potential High Concentration Samples: Postspike Verification of Reporting Limit (RL) for Those Reported as <RL. Samples with concentrations greater than the highest standard will require dilution. As a standard practice,
extrapolation beyond the established calibration is prohibited. The sample may be diluted and the appropriate amount of internal standard is added to match the original concentration. The dilution factor must be accounted
for in the final concentration calculations.
Postspike verification is suggested for samples prepared by a dilution. Analytes that will have a concentration less than the LOQ in the final dilution should be spiked at the LOQ. Recovery information should be reported with
the samples to provide information on the effects of the dilution on quantitation.
227

11.2.2 Qualitative
Several techniques employing indirect measurement have been developed that more comprehensively assess
the range of PFAS contamination at a site. These qualitative techniques are not standardized through a published USEPA method and range in commercial availability. To date, these techniques have not undergone
multilaboratory validation. Data from these qualitative techniques may augment the definitive data from
quantitative methods.
11.2.2.1 Overview of Qualitative Techniques
Because of the large number of PFAS and their varied structural characteristics, a single targeted method on either LC/MS/MS or GC-MS/MS is unable to quantify all PFAS that may be present in a sample. When the release
source is well understood and the types of PFAS present are both known and amenable to regular PFAS analysis methods (for example, LC/MS/MS of ionic PFAS or GC-MS/MS analysis of neutral PFAS), a targeted
analytical approach may be sufficient to adequately characterize a release. For releases that are not well
understood or consist of multiple sources, alternative ways of measuring PFAS in a more comprehensive but
less targeted fashion may be desirable. Additionally, PFAS that are in polymeric form, such as those used in coatings for paper and textiles, are not amenable to LC- and GC-based separation techniques; they may also
not be effectively extracted, even with rigorous methods.
Four primary techniques have been developed to characterize unknown PFAS in a sample. These techniques are not multilaboratory, validated, or promulgated. They are described in more detail in the following sections:
• The total oxidizable precursor (TOP) assay measures PFAA precursors or polyfluorinated compounds that
can be converted to PFAAs by LC/MS/MS.
• Particle-induced gamma-ray emission (PIGE) spectroscopy measures elemental fluorine isolated on a thin surface.
• Adsorbable organic fluorine (AOF) paired with combustion ion chromatography (CIC) measures the combusted organofluorine content of a sample as fluoride on an ion chromatograph.
• High-resolution mass spectrometry techniques, such as quadrupole time-of-flight (qTOF) MS/MS, can tentatively identify PFAS structures through library matching or in-depth data analysis.
11.2.2.2 TOP Assay
Technique Description
The TOP assay (or TOPA) converts PFAA precursor compounds to PFAAs through an oxidative digestion. The increase in PFAAs measured after the TOP assay, relative to before, is an estimate of the total concentration of
PFAA precursors present in a sample, because not all PFAS present will be subject to quantitation or reaction and
some will remain as undetected PFAS. The PFAAs generated have perfluoroalkyl chain lengths equal to, or shorter
than, the perfluoroalkyl chain lengths present in the precursors (Houtz et al. 2013; Houtz and Sedlak 2012; Weber et al. 2017; Dauchy et al. 2017).
228

The TOP assay is a technique developed to estimate oxidizable precursors that can transform to perfluoroalkyl
acids (PFAAs) end products that are included in the target analyte list (Houtz et al. 2013; Houtz and Sedlak 2012). A sample is measured using conventional LC/MS/MS to determine baseline levels of PFAAs present in the sample.
A separate aliquot of the sample is then exposed to a highly basic persulfate solution and then placed in a sealed
container at an elevated temperature (for example, 85°C) to thermolyze persulfate into sulfate radical. At elevated pH, the sulfate radical is scavenged by hydroxide and forms hydroxyl radical, which then converts the free PFAA
precursor compounds to PFAAs. The predominant products (that is, > 95% in control experiments) of the
precursors are the perfluoroalkyl carboxylates, whether or not the precursors contain sulfonamido or telomer
functionalities. After sufficient time has elapsed to convert all the persulfate, the samples are removed from the
heated environment (for example, a water bath), brought to room temperature, and neutralized prior to analysis.
The additional concentration of PFAAs generated after the oxidation step estimates the concentration of oxidizable
PFAA precursors.
The technique can be applied to aqueous (Houtz et al. 2013; Houtz and Sedlak 2012; Houtz et al. 2016; Weber
et al. 2017; Dauchy et al. 2017) and solid samples (Houtz et al. 2013). In most cases, samples need to be
pretreated prior to oxidation to remove competitive organic compounds. For aqueous samples, dilution may be
sufficient, although extraction techniques may be used to further remove matrix effects. Soil samples are
extracted prior to persulfate treatment, and the extracts are cleaned with ENVI-Carb prior to treating the evaporated extract. The specific extraction procedure used may impact which PFAA precursors are retained for
oxidation. For example, acidic extraction procedures may be required to remove cationic precursor compounds
from soils (Barzen-Hanson 2017; Mejia-Avendaño et al. 2017).
Possible Technique Uses
TOP assay may be used to estimate a total concentration of free PFAA precursors in a sample. When measuring
strictly a sample post-TOP assay, the total concentration of PFAS measured may be thought of as a conservative measurement of the sample’s total PFAS concentration. In some cases, oxidation can be incomplete
(Ventia 2019). The total PFAA precursor or total PFAS concentration is considered conservative for the reasons
explained below in Technique Limitations. Because the method depends on a compound containing a perfluoroalkyl group, it is highly specific to PFAS. The chain lengths of the PFAAs generated after oxidation
provide an indication of whether the precursors are predominantly short- or long-chained, although the production
of a particular Cn (where “n” signifies the number of carbons in the alkyl chain) PFAA is not equivalent to the concentration of PFAA precursors containing the same chain length. However, if significant amounts of PFOA are
generated after oxidation, that is an indication that the sample contains a comparable concentration of C8 or
longer PFAA precursor compounds.
TOP assay, the most widely commercially available of the qualitative techniques, is typically accepted as
a means of determining PFAS load on remediation substances to estimate the replacement cycle, but not
for site characterization.
Technique Limitations
As mentioned above, the TOP assay does not easily differentiate between precursors that contain telomer or sulfonamide functionalities, because all these precursors are chemically oxidized primarily to perfluoroalkyl
carboxylates. This is significant because a precursor that would likely form PFOS in the presence of a mixed
consortium of aerobic bacteria will convert to PFOA under the conditions of TOP assay. The production of
branched perfluoroalkyl carboxylates could be attributed to precursors derived from an ECF-based manufacturing process, but environmental samples may not contain the same distribution of branched and linear isomers as
was originally generated from the ECF manufacturing process.
229

TOP assay results in a mixture of PFCA products upon the conversion of fluorotelomer-based compounds (Houtz
and Sedlak 2012). For example, 8:2 FTS was converted to 3% PFNA, 21% PFOA, 27% PFHpA, 19% PFHxA, 12%
PFPeA, and 11% PFBA in control experiments. Because of this effect, two limitations arise. First, the production of
PFOA, for example, is not equivalent to the C8 precursor concentration, because PFOA can be generated from
longer-chain telomer compounds and is only a partial product of C8 telomer products. Second, some shorter
chain PFCA products of telomer compounds are not captured. Only 73% of 6:2 FtS was recovered as PFCA products PFBA and longer in control experiments (Houtz and Sedlak 2012). As a result, TOP assay may
underquantify short-chain PFAA precursors that are telomer-based. Sulfonamido compounds in control
experiments do not exhibit a distribution of products; the Cn precursor forms the Cn PFCA in a 1:1 molar ratio.
TOP assay has not been demonstrated on large molecular weight polymer compounds or newer ether-linked PFAS
such as GenX process chemicals; it is unknown if the oxidative process would liberate PFAAs from these types of
compounds. Because PFAS polymers have shown limited ability to biodegrade (Russell et al. 2008; Russell et al. 2010;
Washington et al. 2009) relative to low molecular weight free PFAA precursor compounds (Wang, Szostek, Buck, et
al. 2005; Lee, D’eon, and Mabury 2010; Wang et al. 2011; Harding-Marjanovic et al. 2015), TOP assay may be
similarly ineffective at converting PFAS polymers to free PFAAs. TOP assay cannot be used to measure large
molecular weight polymeric PFAS unless they are proven to break down in the assay.
For many samples, TOP assay requires adjustments in dilution, sample preparation, or reagent dosing to achieve
complete conversion of PFAA precursors. Standardized quality guidelines are needed to ensure that TOP assay
data reflect full conversion of PFAA precursors.
11.2.2.3 PIGE
PIGE is a nondestructive analytical technique that takes advantage of the unique gamma-ray wavelength
emission of fluorine when impacted with a proton ion beam. The technique is not compound-specific but able to assess total fluorine content of a variety of materials isolated on a thin surface (0.22 mm) (Ritter et al. 2017). The
sample is secured in the instrument and bombarded ex vacuo under a 3.4 MeV beam with an intensity of 10 nA
for approximately 180 s. Two gamma rays characteristic of the decay of the 19F nucleus (110 keV and 197 keV) are measured and the responses integrated. Quantification is achieved with comparison to fluorine-based
calibration standards.
In the published literature, PIGE has been used to demonstrate total organofluorine concentrations in papers and textiles (Ritter et al. 2017; Robel et al. 2017) and food packaging (Schaider et al. 2017). It has also been
used on an experimental basis to evaluate organofluorine concentrations in extracted water and soils, but
those results are not yet available in the peer-reviewed literature.
Possible Technique Uses
PIGE is a rapid screening technique to measure fluorine on surfaces. If a sample does not contain significant
amounts of fluoride or can be prepared to remove inorganic fluoride, PIGE can become a technique specific for
organofluorine; however, it is not specific for PFAS. It is a proven way to measure total fluorine in matrices containing high concentration of fluorine polymeric material, which is a limitation of both TOP assay and AOF. It
also requires relatively minimal sample preparation to analyze fluorine content in commercial products. Sample
preparation of environmental samples for PIGE analysis is likely to require a similar level of sample preparation, along with the limitations of extraction techniques, as TOP assay or AOF.
Technique Limitations
Like AOF, PIGE is not specific to PFAS and, depending on the preparation, it is also not specific to organofluorine. The polymeric compounds that PIGE has been used to detect in consumer products may not contain
perfluoroalkyl groups or be capable of breaking down to free PFAS.
230

PIGE also does not provide any differentiation on PFAS perfluoroalkyl chain length present in a sample. Depending
on how the sample is prepared prior to the instrumental analysis, samples may be biased toward measurement of
long-chain PFAS, as with TOP assay and AOF.
Extraction methods for PFAS in environmental samples have not yet been demonstrated for this technique. When
using SPE to extract environmental aqueous samples prior to PIGE analysis, cartridges that are suitable to
hydrophobic and anionic PFAS may not retain positively charged PFAS of interest. For soil samples, the extraction method also determines the PFAS likely retained. However, by using targeted extraction techniques for
PFAS in environmental samples, the method becomes much more specific for PFAS.
As with AOF, the range of operating conditions for PIGE has not been standardized and so far the technique has been demonstrated with only one commercial lab.
11.2.2.4 Adsorbable Organic Fluorine or Combustion Ion Chromatography
AOF (Wagner et al. 2013) or extractable organofluorine (Miyake, Yamashita, So, et al. 2007; Miyake, Yamashita,
Rostkowski, et al. 2007; Yeung et al. 2008) paired with CIC (AOF/CIC) are complimentary terms for an analysis for
fluorine content of environmental samples. In this application, an aqueous sample is passed through a carbon-based sorbent on which the fluorine-containing organics adhere. The carbon sorbent is then combusted at high
temperatures that should completely decompose the organics into their elemental constituents. The gaseous
stream is passed through deionized water, which is then analyzed for fluorine content (as fluoride) by ion chromatography.
The technique has been demonstrated on human blood samples (Miyake, Yamashita, So, et al. 2007; Yeung et al.
2008) and various environmental aqueous samples (Miyake, Yamashita, Rostkowski, et al. 2007; Wagner et al.
2013; Dauchy et al.2017; Willach, Brauch, and Lange 2016). Presumably, the method could be adapted to other types of matrices to measure organofluorine in soils or biota. The matrices could be extracted for PFAS,
resuspended into an aqueous solution that could adhere to the activated carbon, and then analyzed with CIC. As
with TOP assay, the specific extraction procedures would influence whether some or all PFAS are retained and ultimately measured as combusted fluoride product. Alternatively, it is possible that the technique could be used
without extraction to directly combust organofluorine-containing products.
Possible Technique Uses
AOF can be used to measure PFAS or other fluorine-containing compounds as a total organofluorine
concentration. If the method is available more readily or at a lower cost than LC/MS/MS measurement of PFAS, it
can be a quick screening tool to determine if a significant concentration of fluorine-containing compounds is present in an aqueous sample or other sample from which the organofluorine content can be extracted. A
detection limit of 0.77 µg/L fluorine (13 µg/L PFOS equivalent) (Willach, Brauch, and Lange 2016). was reported for
one laboratory offering the technique, although the detection limit will vary by amount of sample processed and
laboratory conducting the procedure.
Technique Limitations
AOF is not specific to PFAS. If a sample contains relatively high concentrations of non-PFAS that contain fluorine
(for example, fluorine-containing pharmaceuticals), then the organofluorine may be falsely attributed to PFAS
content and bias “total PFAS” concentrations high.
AOF does not provide any differentiation on PFAS perfluoroalkyl chain length present in a sample. Some short-
chain PFAS may be unable to sorb to the activated carbon material that is combusted, but this will depend significantly on laboratory- specific procedures.
231

Extraction methods for PFAS in commercial products and solid samples coupled with this technique have not yet
been demonstrated for this technique. Background fluoride concentrations may be challenging to remove from some matrices and would result in samples biased high for total organofluorine that was actually attributable to
fluoride.
The range of operating conditions for AOF-CIC has not been standardized. In addition to the limitations mentioned
above, some matrices may contain sufficient competitive organics or other materials that coat the activated
carbon to prevent complete retention of organofluorine compounds.
11.2.2.5 High-Resolution Mass Spectrometry (qTOF/Orbitrap)
Technique Description
Quadrupole time-of-flight mass spectrometry (qTOF/MS) can be used to determine both the chemical formula and
structure of unknown PFAS in a sample, but analytical standards are required for unequivocal structural
identification.
High-resolution mass spectrometry has been used to tentatively identify the molecular formulas and structures of
unknown PFAS (Newton et al. 2017; Moschet et al. 2017; Barzen-Hanson et al. 2017). Similar to targeted PFAS analysis, separation techniques such as LC or GC are used to separate compounds in a sample so that individual
PFAS can be resolved. The mass is measured using a time-of-flight or other high-resolution detector, and molecular
formula are proposed. If an MS-MS technique is used, the fragments of the parent compound can be used to piece together the structural arrangement of the compound. To identify compounds that are specifically PFAS
versus other organics present in the sample, compounds with negative mass defects (that is, the accurate mass is
slightly less than the nominal mass) can be selected. Fluorine is one of the few elements that has a negative mass defect, and the inclusion of multiple fluorines in a PFAS molecule means that net mass defect of the
molecule will likely be negative. Compounds that are either 50 or 100 mass units apart also identify homologous
series of PFAS separated by one or two CF2 groups. MS libraries of previously identified PFAS exist for targeted
matching, although they will not definitively identify an unknown compound.
Possible Technique Uses
High-resolution mass spectrometry analysis of PFAS can tentatively identify the structures of unknown PFAS and can also be used, in comparison with analytical standards of known compounds, to semiquantitatively estimate
their concentrations. Because accurate identification of compounds using high-resolution MS is a time-intensive and
expensive process, a high motivation for knowing the exact PFAS structure, for instance in differentiating forensically
between two different sources, may be the biggest driver of its use for PFAS analysis. High-resolution MS is best
suited for media in which unknown PFAS are likely to be present in significant concentrations. When many other non-PFAS compounds are present in the sample, the MS signal of competing compounds will likely obscure the
signal of PFAS. Sample preparation steps can inadvertently or intentionally select for certain types of PFAS. As user
skill and data interpretation time increase, accurate identification of PFAS is likely to improve.
Technique Limitations
High-resolution mass spectrometry cannot definitively identify the exact structure or formulas of PFAS without
comparison to reference materials or analytical standards.
Not all PFAS, even if present in a prepared sample, can or will ionize under the conditions to which the instrument is tuned. A skilled instrument operator may be able to adjust the instrument conditions to match the types of
compounds expected.
False positives are much more likely to result using high-resolution MS than with TOP assay, AOF, or PIGE.
Compounds may be mistakenly identified as PFAS, and if correctly identified, their concentrations may be greatly
over- or underestimated when other compounds are used for comparative quantitative purposes. 232

11.3 Data Evaluation
Evaluation of data involves looking at all the factors that indicate whether the data are:
• precise (agreement between results that are supposed to be similar)
• accurate (how close they are to the true concentrations)
• representative (results characterize the site properly)
• comparable (data compare well to other data)
• complete (all the samples and compounds requested were reported, especially for critical samples
that represent a point of exposure, such as drinking water)
• sensitive (nondetect data reported with concentrations below required regulatory or risk level)
These factors are illustrated in Figure 11-1, and guide users through the process of looking at their data (field
collection and laboratory information) with a critical eye.
The USEPA has guidance to aid in evaluating PFAS drinking water data generated in accordance with USEPA 537,
Data Review and Validation Guidelines for Perfluoroalkyl Substances (PFASs) Analyzed Using EPA Method 537, as well as a technical bulletin to aid in the review of PFAS data generated for all other media, Per- and Polyfluoroalkyl Substances
(PFAS): Reviewing Analytical Methods Data for Environmental Samples. The USDOD EDQW has published PFAS Data
Validation Guidelines, for evaluation of PFAS data generated in accordance with the DoD/DOE Quality System Manual
for Environmental Laboratories, Version 5.3 (USDOD 2020).
Figure 11-1. Data evaluation factors.
Source: H. Albertus-Benham, Wood Environment & Infrastructure, used with permission.
233

11.3.1 Presampling Planning
To ensure the usability of the data, communication with the laboratory that is performing the analysis is important. Until there are accepted methodologies for matrices other than drinking water, it is incumbent on the
data user to collect information about the methodology to be employed by the lab. Figure 11-2 contains laboratory considerations related to data usability in order to plan a sampling program.
Figure 11-2. Laboratory planning considerations for data usability.
Source: H. Albertus-Benham, Wood Environment & Infrastructure. Used with permission.
The most important goal of data usability is to ensure that the PFAS data
generated are usable to meet the stated data needs and that the user understands any limitations in the use of the data due to potential uncertainty
or bias. Overall usability of data is judged by evaluating the quality of the
results compared to the data quality objectives (DQO) of the project. Therefore, establishing these project DQOs and communicating them to the field sampling
team and the laboratory prior to sample collection and sample analysis is vital
to ensuring that the correct methods, correct compounds, and adequate sensitivity are reported for your samples.
Throughout the rest of section 11.3, pre-sampling planning will be indicated by these yellow call-outs.
234

11.3.2 Overall Usability of the Data
Three questions are most important in evaluating data: (1) Have the results exceeded a level of concern?, (2)
Do these results make sense?, and (3) Are data of acceptable quality? To judge whether results have exceeded a level of concern, the potential bias or uncertainty in the data should be evaluated along with the sensitivity of
the results. At a minimum, it is recommended that a report from the laboratory contains a cover letter (or
narrative) explaining sample receipt, analytical methods, and any QC deviations plus data sheets for field samples and QC samples (method blanks, blank spikes), which should also contain results for sample-specific
QC (such as internal standard recoveries). Often the most critical data for a project are the non-detects to prove
the absence of compounds of concern at specific concentration levels (quantitation limits). Therefore, before evaluating QC associated with your samples, the data should be evaluated to ensure that all compounds
required are reported with quantitation limits at or below the project’s required sensitivity objective. If this
sensitivity is not acceptable, then the data may be of very limited use.
If the compound list reported and quantitation limits are acceptable, then the associated QC results (for example,
EIS recoveries, results of blanks, blank spike recoveries, etc.) can be compared to project DQOs to evaluate potential uncertainty in the data. The formal systematic process of this QC evaluation is called data review or
validation. The approach to data validation is well documented, for example, see the USEPA National Functional
Guidelines, January 2017 (USEPA 2017), (USEPA 2018) and DOD/DOE QSM 5.3 tables C-44 and C-45, 2019
(USDOD 2019) and beyond the scope of this document; however, evaluation of all of the QC associated with the sampling and analysis of a set of samples will lead to an understanding of the uncertainty in the data.
Some critical QC issues might result in unusable data or concern for project actions. For example, if the data are
considered biased low based on low QC results and the sample concentrations are at or near the level of concern or an action level, it may be that the true sample concentration actually exceeded the action level.
Conversely, if the sample data are considered biased high based on high QC results and the sample
concentrations are near but below the levels of concern or action level, then there is added certainty that the data do not exceed the action levels.
Once the data have been adequately reviewed for accuracy to determine if
there are limitations to their use or uncertainties to be considered during use, the results should be evaluated by answering the following questions:
• Do field duplicates, if performed, agree, indicating acceptable
precision for the sampling and analysis?
• Do the data from the current sampling event correlate with historical data?
• Do the data make sense from a temporal point of view?
• Do the data from one sampling point to the next make sense
across the project area?
This type of review can point out data trends or areas of concern (for example,
interferences with project analytes) that could not be elucidated by looking at a
single data point and may lead to overall project changes such as a need to increase sampling density to improve data representativeness, correction of
procedures for collecting samples to minimize contamination, changes in
methods of analysis to achieve project sensitivity requirements, etc. Following this review, the data user can determine whether the data set is complete and
sufficient for project decisions and data uses or whether additional samples
need to be collected and analyzed.
Evaluating results may lead to overall project changes such as a need to increase sampling density to improve data representativeness, correction of procedures for collecting samples to minimize contamination, changes in methods of analysis to achieve project sensitivity requirements, etc.
235

11.3.3 Sensitivity
A reporting limit (RL) or quantitation limit (QL) is the limit of accurate quantitation for a specific analyte in a specific
sample after any adjustments have been made for sample amount, dilutions, or percent moisture. Typically, the RL concentration is selected as the lowest nonzero standard in the calibration curve for each analyte. It takes
into account the sample size, matrix effects, and any dilutions made during the analysis of that particular
sample. Because of varying properties between samples, the RL can vary from sample to sample. The RL should
represent the level at which reliable qualitative and quantitative information is routinely reported.
Sensitivity is related to the RL in that sensitivity refers to the capability of a method or instrument to detect a
given analyte at a given concentration and reliably quantitate the analyte at that concentration. If a specified
analyte is not reported by a laboratory to be in a specified sample, it does not necessarily mean that the chemical is not present; it is an indication that the concentration of the analyte may be below the method
sensitivity.
Detected PFAS results between the method detection limit (MDL) and RL
(that is, “J” values) can generally be reported as long as all qualitative identification criteria are achieved. Typical RLs for PFAS are as follows:
• common PFAS analytes in aqueous matrices: 2–8 ng/L
• common PFAS analytes in solid matrices: 0.2–2 ng/g
Sometimes even though lower RLs were planned for, the laboratory may have
to perform dilutions, which causes the RLs to be elevated. Ensure that the
dilution performed by the laboratory was reasonable. If there are elevated
concentrations of specific target analytes or interferences, then the dilution is likely justified and the presence of elevated RLs may not be an issue if these
other target analytes are present at very high levels.
If a dilution was performed and it is not obvious why (for example, low concentrations or nondetect results for
target analytes), then inquire with the laboratory why the dilution was performed. This could happen due to elevated concentrations of nontarget compounds but should be documented.
The RLs can also be affected by the sample preparation parameters, the mass of solid sample or volume of
aqueous sample used in the extraction, or the final volume of the extracts. Typically, laboratories will utilize 100–
250 mL for aqueous sample extractions and 1–5 grams for solid sample extractions. Final extract volumes are
typically between 0.5 mL and 1.0 mL. If a complex matrix is encountered, the sample sizes may be reduced and/or the final extract volumes may be increased, causing the RL to be elevated accordingly.
11.3.4 Target Analyte Lists
Target analyte lists for PFAS will vary by laboratory and regulatory program. The data user should work with the laboratory to ensure that the correct list is being
reported, as dictated by the project objectives. In general, Table 11-4 includes
the common PFAS reported by existing laboratories (Excel file). The selected list may be dependent upon project objectives, as well as the potential source of
PFAS contamination (for example, AFFF, landfill, chromium electroplating).
It is imperative that the RLs (and not the MDLs) for each method are evaluated versus the project screening criteria prior to submitting samples to the laboratory. The RLs should be below the project screening criteria to ensure achievement of project objectives.
The data user should work with the laboratory to ensure that the correct list is being reported, as dictated by the project objectives.
236

11.3.5 Linear and Branched Isomers
It is also important to note that PFOS and PFOA (and other PFAS as well) contain a mixture of linear and branched isomers, which can be significant when the laboratory is quantifying these chemicals. Very few standards are
available for branched isomers. If branched isomers are not included in the sample quantitation by the lab, the
resulting concentrations will be underestimated.
In general, all laboratories should be reporting the sum of the linear and branched isomers for PFHxS, PFOS, PFOA, NMeFOSAA, and N-EtFOSAA because these are the PFAS for which both linear and branched analytical
standards exist. In the absence of a standard that includes branched isomers, only the peak associated with the
linear isomer is integrated. As more analytical standards become available, more PFAS will be reported as linear and branched in the future.
Figure 11-3 shows an example of the integration performed correctly and
incorrectly. It is the responsibility of the data user to ensure that the contracted laboratory is performing the integration of the target PFAS to include both linear
and branched isomers. This requires upfront communication with the laboratory
and a possible independent review of the laboratory raw data by a qualified chemist/data user to verify the integrations were properly performed.
Figure 11-3. LC/MS/MS data illustrating a) complete integration of linear and branched PFOS, and b) partial
integration of PFOS. Discrepancies in concentration will depend on the fraction of branched versus linear PFAS present, but in the current example PFOS concentrations in b) were 20% lower than in a). Source: Bureau Veritas Laboratories, Mississauga, Ontario, Canada. Used with permission.
Ensure that the contracted laboratory is performing the integration of the target PFAS to include both linear and branched isomers.
237

11.3.6 Isotope Dilution Standard Results and Surrogates
The isotope dilution technique involves quantitation of a compound of interest using a labeled isotope of that very
compound. A variety of isotopically labeled analogs (for example, carbon-13 isomers of the compounds of interest) are added to a sample prior to extraction or prior to analysis when extraction is not required. These
isotopically labeled analogs are sometimes referred to as surrogates or as extracted internal standard analytes
as defined in the DOD/DOE (2019) QSM 5.3 and function from a data usability standpoint as both a surrogate standard (calculation of the recovery of the
standard) and as an internal standard (used in the calculation of the target compounds)(USDOD 2019).
Generally, the number of isotopically labeled analogs used in the isotope dilution technique matches the
number of target compounds and exceeds the number of surrogates used in nonisotope dilution procedures. For example, Method 537.1 uses three surrogates for 18 target compounds, while isotope dilution attempts to
use an isotopically labeled analog for each compound being reported. Internal standards are also added to the
sample or extract immediately preceding analysis. For nonisotope dilution analyses, quantitation of the target compounds and surrogates is performed relative to these injection internal standards. The results from the
nonisotope dilution technique report concentrations of the target compounds and recovery results for
surrogates and it is up to the data user to determine the impact (that is, bias) of the extraction and analysis on the sample results (that is, results are not recovery-corrected).
For the isotope dilution methods, quantitation of the target compounds is performed relative to the response of
the isotopically labeled analog, which should recover in a manner similar to how the nonlabeled compounds
recover. Effectively, the sample data are recovery-corrected for losses that might have occurred during sample
processing. The isotope dilution recovery correction procedure greatly improves the accuracy of the analysis and is considered to be an improvement over other techniques for the analysis of complex samples for analytes
requiring high sensitivity. Chemical standards manufacturers are working to make a wider variety of labeled
isotope compounds available to further improve accuracy of the methods for all compounds under investigation (for example, fluorotelomers, precursors, various isomers of carboxylates and sulfonates).
Acceptance criteria or control limits for surrogate and isotopically labeled analog recoveries are either developed
by the laboratory or dictated by the requirements of the project (for example, QAPP-specified criteria, regulatory
criteria, or method criteria). Poor recovery of surrogates in complex matrices is common; however, if a project requires ongoing analysis of a problematic matrix, the laboratory should perform method development to improve
recovery, if possible (for example, change in cleanup procedures, change in the transition ions monitored, etc.).
If the recovery for a surrogate is below criteria in a sample for nonisotope dilution techniques, compounds
associated with this surrogate may be biased low. If surrogate or EIS recovery is very low (for example, < 10% recovery), nondetects associated with the surrogate or EIS may be false negatives and should not be used for
project decisions.
In the case where an isotope dilution extract is analyzed and requires re-analysis at a high dilution, the sample extract may be refortified with labeled isotope compounds for adequate response. In reporting the final data, the
isotope recovery results from the initial analysis should not be used to adjust the data from the secondary dilution analysis. The result from this scenario is no longer quantitated from an isotope dilution but is calculated
from an internal standard calculation and should be noted as such in the case narrative.
238

11.3.7 Blank Contamination
As a consequence of the ubiquitous nature of PFAS, samples that may not
contain PFAS can become contaminated if they come into contact with samples or materials containing PFAS. The types of blanks commonly used
to evaluate contamination are field-based blanks and lab-based blanks. Field-
based blanks include field reagent blank (field blank), source water blank, and equipment rinse blank. Lab-based blanks include method blank, lab reagent
blank, and instrument blank. Reagent, field, trip spike, and method blanks are
prepared and analyzed using the same procedures as for the field samples.
Instrument blanks are analyzed periodically to verify the instrument is clean for analysis of subsequent samples.
The reagent blank is used to evaluate the potential PFAS contamination from
the reagent water source used to generate the field-based and lab-based blanks. A systematic review of all of the blank results compared to the
associated field sample results (the group of samples associated with the field-
based and lab-based blanks or the analytical batch of samples associated with a specific method blank) must be made to determine whether the field sample
results are accurate. For example, if the reagent water source is nondetect for
PFAS, then contamination found in the field-based blanks indicates potential
contamination of the associated field samples from the sample bottle itself and/or during collection, handling, or transport to the laboratory.
However, if a lab-based blank is also contaminated, the contamination observed in the field-based blanks may
have been due to sample handling at the laboratory. If the conclusion of this systematic blank data review is that an associated sample result may have been contaminated, then the sample result is considered to be biased
high or may be a false positive, depending on the magnitude of the blank contamination compared to the field
sample result. A general rule of thumb is that if sample contains a contaminant within 5x the concentration in the associated blank, the results may be biased high or result in a false positive in the sample (USDOD 2019).
11.3.8 Duplicate Results
Laboratory replicates are two separate aliquots of the same sample put through the entire sample preparation
and analytical procedures. Field duplicates are two separate samples collected at the same location at the same
date and time. Laboratory replicates may be performed in lieu of an LCS duplicate or MSD. It should be noted that sometimes laboratories report the results of laboratory replicates performed on samples that are from a
different project (that is, batch QC); if the laboratory replicates reported are not from a sample at the site of
interest, then these results should not be used in the evaluation of sample data.
During data evaluation, the relative percent difference of each detected
analyte versus the acceptance limits should be reviewed. The acceptance
limits should be provided within the laboratory report and are either regulatory- or method-specific. The acceptance limits may have been
provided in a QAPP, or may be laboratory-generated. When both results are <
2x the RL, the potential uncertainty increases and therefore the acceptance criteria may need to be adjusted.
• If both results are < 2x the RL, relative percent difference criteria can be doubled.
• If one result is detected and one result is not detected, then the evaluation will depend on whether the detected result is > 2x the RL or not. If one result is > 2x the RL and the other result is nondetect, then
the variability is considered unacceptable and there may be potential uncertainty in the results for this
sample.
The possible sources of contamination that may occur during field collection activities and sample preparation and analysis and the recommended procedures to minimize contamination have been previously addressed in Section 11.1.
Review regulatory or method- specific acceptance limits with the laboratory, whether from a QAPP or laboratory-generated.
239

Variability in laboratory replicate and field duplicate analyses could be from the sampling process, possibly due to
an inefficient homogenization procedure in the field. It could also be from the laboratory aliquoting process or it
could be due to heterogeneity in the sample matrix. The effect on project objectives will depend on the screening
criteria and how far above or below these criteria the results are. If the results are close to the criteria with significant variability, this may require collection of more samples to better represent the location. If results are
significantly above or below the screening criteria with high variability, it may not adversely affect the ultimate
decision-making process.
11.3.9 Acid Versus Anion Form of PFAAs
The data user must be aware of the form of PFAS the laboratory is reporting when comparing to project screening criteria. PFAS are typically formulated as acids, but they are present in the environment and in
humans in the anionic form. The differences in names used are the result of the different names for the acid
form and the anion form of the chemical (see also Section 2.2.3.1). For example, when perfluorobutanoic acid
(PFBA) disassociates and loses its hydrogen in water, it becomes the anionic form (perfluorobutanoate). This becomes more important when looking at physical and chemical properties of these chemicals, because
whether they exist as an acid, an anion, or a salt (cation) will affect how they behave in the environment.
Typically, laboratories are reporting the acid form of the perfluorocarboxylic acids and the anionic form of the
perfluorosulfonates.
Some target PFAS, such as PFHxS and PFOS, are not available as acids, but rather as their corresponding
potassium or sodium salts (K+ or Na+). These salts are acceptable starting materials for the stock standards provided the measured mass is corrected for the salt content according to the equation below. Note that this
correction will result in a minimal change to the mass of the acid but still must be performed for consistency and
comparability with other results to ensure the data user that the correct form of PFAS is represented in the final concentration.
massacid = measured masssalt * (MWacid/MWsalt)
MWacid = molecular weight of PFAA
MWsalt = molecular weight of purchased salt
CAS numbers will change depending on if the acid or anion form of the PFAS is reported (Table 11-6).
Table 11-6. Example of CAS number differences between acid and anion
Chemical CAS number
PFOA: Perfluorooctanoate (anion) 45285-51-6
PFOA: Perfluorooctanoic acid (acid) 335-67-1
Updated September 2020.
240

12 Treatment Technologies
The PFAS Team developed a training module video with content related to this section, it is the Treatment
Technologies video.
This section provides information about treatment technologies for PFAS in environmental media. Treatment
technologies for PFAS in environmental media are still evolving and it is prudent to use caution in implementing long-term remedies.
Selection of remedial actions should prioritize protection of drinking water supplies and human health, with
consideration of other objectives (such as reducing risk to ecological receptors and environmental resources,
liability, source area mass, mass flux, generation of PFAAs from precursors). At some sites, it might be
reasonable to take short-term site stabilization actions with the intent of applying more robust and cost-effective
technologies as these are developed.
The treatment technologies described in this section are organized by degree of development and
implementation, as well as current confidence in the technology based on peer-reviewed literature and the
professional judgment of the authors. The levels are field-implemented technologies, limited application technologies, and developing technologies.
Section Number Topic
12.1 Overview
12.2 Field-Implemented Liquids Treatment Technologies
12.3 Field-Implemented Solids Treatment Technologies
12.4 Incineration
12.5 Limited Application and Developing Liquids Treatment Technologies
12.6 Limited Application and Developing Solids Treatment Technologies
12.7 Integrated Remedial Solutions
12.8 Sustainability of PFAS Treatment
12.9 Improving Evaluation of PFAS Treatment Technologies
241

12.1 Overview
Treatment technologies exploit a contaminant’s chemical and physical properties to immobilize, remove, or
destroy the contaminant. The stability and surfactant nature of PFAS make many treatment technologies
ineffective, including those that rely on contaminant volatilization (for example, air stripping, soil vapor
extraction) or bioremediation (for example, biosparging, biostimulation, bioaugmentation). Even aggressive
technologies such as thermal treatment and chemical oxidation require extreme conditions beyond typical
practices (for example, extreme temperatures, high chemical doses, extreme pH) to be effective or partially
effective in destroying PFAS.
Treatment technologies can be employed either ex situ or in situ. For example, when groundwater is extracted via pumping from wells and treated, this would be considered an ex situ approach. In contrast, when treatment
materials are injected into the subsurface to immobilize contaminants in groundwater under the surface, this
would be considered an in situ approach. Because existing treatment technologies have generally shown to be inadequate, the unique chemical properties of PFAS often require new technologies or innovative combinations
of existing technologies.
A range of unproven technologies exist for treatment of either liquids or solids that may be performed either in situ or ex situ. However, the most demonstrated technologies for treating PFAS in liquids are limited to the use of ex
situ technologies.
Full-scale treatment of PFAS-impacted liquids or
solids is currently limited to sequestration
technologies that remove or bind PFAS but do not destroy them. Sorption using granular activated
carbon and ion exchange media has been proven
effective at full scale (see Table 12-1, provided as
separate PDF, for references). Transformation or destruction technologies,
including bioremediation, chemical oxidation,
chemical reduction, and thermal technologies, are currently being tested.
This section discusses both proven and emerging
treatment technologies for liquids (waters,
leachates, or other liquid wastes) and solids (soil, sediment, or other solid wastes).
The treatment technologies described in this
section are organized by degree of
development and implementation, as well as current confidence in the technology based on
peer-reviewed literature and the professional
judgment of the authors. Three levels of implementation/confidence are defined as
follows:
• Field-implemented technologies–Technologies that have been demonstrated under full-scale conditions at multiple sites, by multiple practitioners and multiple applications, and are well
documented in practice or peer- reviewed literature. Stakeholder concerns about the
effectiveness of certain treatment technologies, including the testing and analytical approaches to
measure efficiency, are presented in Section 13.1.20.
“Treatment” versus “Remedial Action”
The term “treatment” refers to the application of
certain technologies to specific impacted media to achieve desired remedial action goals or
objectives.
As defined in the Superfund Amendments and
Reauthorization Act (SARA), a “remedial action” is the actual construction or implementation
phase of a site cleanup. Remedial action has
a broader context that includes concepts surrounding targeted clean-up levels and
monitoring but also addresses issues related
to administrative elements, long-range
planning, and remediation/restoration.
242

• Limited application technologies–Technologies that have been
implemented on a limited number
of sites, by a limited number of practitioners, and may not have
been documented in peer- reviewed
literature. These limited application technologies for liquids and solids
are contained in the technology
comparison Tables 12-1 and 12-2 (provided as separate PDF) and
discussed in Section12.5 and
Section 12.6.
• Developing technologies–
Technologies that have been researched at the laboratory or
bench scale, but have not been field
demonstrated. Often, these results are reported by only one group (for
example, one university,
practitioner, or vendor) or lack detailed validation of the treatment
effectiveness or mechanisms.
Experimental techniques to treat
PFAS are under development, but only those technologies that have
some level of publicly available
documentation demonstrating
effectiveness are included here.
The technology evaluations presented herein provide data for PFAS removal. This information varies widely
among technologies and the data provided are based on the reported test conditions and results. Ultimately,
the feasibility of a technology to meet applicable regulatory guidance values and standards often depends on site-specific conditions.
Currently in the United States, the regulatory standards for PFAS treatment are primarily driven by drinking water
mitigation and focused on a small subset of PFAS. PFOS and PFOA are the only two compounds with federal
regulatory guidelines (USEPA 2016, USEPA 2016), and most regulatory discharge criteria for PFAS focus on PFOS and PFOA. Some states have guidelines, and several have regulatory criteria for additional PFAS, but
precursor and short-chain PFAS are generally not considered in regulations or guidance, although that is
changing. The technology evaluation information presented here provides data about all PFAS tested for a given technology. This information varies widely among technologies. Additional information on regulations is
provided in Section 8.
Technology Selection
Selecting a technology to meet treatment targets is dependent on:
• an understanding of PFAS fate and transport a
• well-prepared conceptual site model
• proven remediation technologies
• defined (and achievable) treatment targets a
• stable regulatory environment.
243

12.1.1 Factors Affecting Technology Selection
Selection of a remedy, with confidence that treatment targets can be achieved, depends on a number of key
factors, including the ability to reliably define the nature and extent of contamination, the availability of proven remediation technologies, and the capacity and tools to measure progress and compliance with desired
regulatory criteria. A well- prepared CSM requires adequate information and is also fundamental to
understanding and presenting the rationale and justification for the selected remedy.
Moreover, proven remediation technologies are limited in capacity and demonstrated ability to meet chosen
treatment targets. The comprehensive discussions contained herein reveal many questions and uncertainties that must be addressed.
Factors affecting PFAS remedy selection include:
• characteristics of PFAS. The wide-ranging chemical and physical characteristics of PFAS affect the
treatment effectiveness. Key factors include recalcitrance to common technologies due to the strength
of the carbon- fluorine bond, ionic state (anionic, cationic, and zwitterionic), types of ionic groups (sulfonate or carboxylate), lipo- and hydrophobicity, chain length and branching, partitioning
coefficients, phase behavior, volatility, solubility, acidity, total PFAS mass, and total concentration.
• changes in PFAS properties. Naturally occurring processes or remedial actions for other (commingled) contaminants, such as chlorinated solvents and petroleum hydrocarbons, can
affect PFAS distribution and mobility in groundwater (McGuire et al. 2014). Example changes
include:
• The alkyl functional group of some PFAA precursors may be more readily subject to chemical or biological transformation than the fully fluorinated aliphatic chain (PFAAs).
• Partial degradation of the carbon-carbon bonds in the aliphatic chain reported for some chemical remedies generates short-chain PFAS, which may be more mobile (Guelfo and Higgins 2013).
• Modifications in aquifer properties (for example, redox or pH) during remediation of commingled contaminants results in a conversion of some precursors to the more stable and mobile
PFCAs (McKenzie et al. 2015; McKenzie et al. 2016).
• co-contaminants, organic matter, and geochemistry. The presence of co-contaminants, total
organic carbon, natural organic matter, minerals, and anions can significantly affect remediation.
Some technologies that are designed and implemented to treat PFAS co-contaminants may transform
perfluoroalkyl acid (PFAA) precursors into more stable perfluorocarboxylic acids (PFCAs) (McKenzie et al. 2015).
• community acceptance. Stakeholders, including community members, are often faced with trade-offs in
terms of cost, level of cleanup, and residual contamination as part of remediation efforts.
For those directly engaged in assessing the suitability of PFAS treatment technologies, a structured process for systematic evaluation is currently under development via a SERDP-funded project (ER18-1633). The project
focuses on five lines of evidence to evaluate technology performance and will provide resources to identify relevant information and data gaps and address key questions necessary for that assessment. Additional
information is provided in Section 12.8.
244

12.1.2 Section Organization
The information presented in the following sections reflects the availability of performance results published,
presented, or posted to the internet. Those technologies that have been implemented in the field at multiple sites, by multiple parties, and have peer-reviewed documentation of performance are discussed in Section 12.2
and Section 12.3. Projects funded by SERDP and the Water Research Foundation (WRF) are also highlighted.
This section discusses the following key elements for each of these field-implemented technologies:
• treatment description–background and development of technology
• treatment mechanism–separation, sorption, or destruction
• state of development–applications and degree of commercial availability
• effectiveness–documented treatment effectiveness on PFAS and common co-contaminants along with water quality considerations and pretreatment need and options
• design/operating considerations –critical or unique operational or design needs
• sustainability–footprint, community enhancement, and cost.
Treatment case studies are presented in Section 15.2. Note that air treatment technologies are not included
in this section because the current research is limited to liquid and soil treatment technologies and air
exposures are not presently a regulatory priority.
245

12.2 Field-Implemented Liquids Treatment Technologies
These technologies have been implemented in the field by multiple parties at multiple sites and the results have
been documented well in the peer-reviewed literature. The liquid treatment technologies in this section may be
applied to a variety of PFAS-impacted media, including drinking water (regardless of source), surface water,
groundwater, wastewater, or landfill leachate. At this time, all technologies that are considered “field-implemented” are ex situ treatment systems, meaning PFAS-impacted water is extracted and treated. Although some of the
technologies described in this section have been applied in situ, they are not considered field-implemented at this
time. Not all technologies would be appropriate for all applications. Site-specific evaluation is necessary to identify the best technology alternative for a given treatment media or scenario.
12.2.1 Sorption Technologies
Sorption technologies have been used for both ex situ and in situ water treatment applications. In situ applications
are not covered in this section, because they are still considered “limited application or developing technologies”
as defined in this document. Multiple sorption media types may be used in series for ex situ applications to optimize overall concentration reduction and removal capacity. Adsorption and ion exchange are two “sorption”
mechanisms by which PFAS can be removed from water. Adsorption is a physical mass transfer process that
uses Van der Waals and/or other weak ionic forces to bind the entire PFAS molecule to the surface areas of the adsorptive media. Ion exchange is the exchange of ions of the same charge. Ion exchange targets and binds to
the hydrophilic ionized or functional end of the molecule (for example, the sulfonate in PFOS) while releasing an
equivalent amount of an innocuous ion (for example, chloride) into the treated water. A number of influent water
parameters can therefore be expected to impact the sorption efficiency for a specific PFAS compound. These
include pH, ionic strength, the nature and concentrations of organic co-contaminants present (including naturally
occurring organic matter [NOM]), competing inorganic ions normally present (for example, sulfate, nitrate,
bicarbonate, and chloride), and any suspended solids or potentially precipitating impurities (for example, iron, manganese, calcium carbonate) that can foul and degrade the performance of the media. Pretreatment steps
may be necessary to optimize the performance of such media, including coagulation, precipitation, filtration, pH
adjustment, or oxidant removal. Ion exchange media used for PFAS removal from water use both the adsorption
and ion exchange mechanisms. The use of two or more different media in series can be considered if the
expected increase in overall removal efficiency can be used to justify the increased equipment cost.
Life cycle cost assessments can be used to
compare the long-term cost-performance benefits
of various sorption media types. Spent media
management can be an important cost component. Common options used at the time of
publication for spent media management are off-
site disposal by thermal destruction (via
commercial incineration or cement kilns), reactivation/regeneration for reuse,
and landfilling.
Incineration and thermal reactivation/regeneration
offer the possibility of destruction of PFAS waste
streams, though incineration has received recent
attention due to possible incomplete combustion
and by-product generation and is the topic of current study to better understand the fate of
PFAS. Incineration is discussed in Section 12.4.
Key Cost Considerations for Sorption Media Selection
• PFAS mix and
competitive species • pretreatment needs • influent
concentrations
• flow rate • discharge criteria • media
change-out criteria
• media disposal
246

Related Ongoing Research Funded by SERDP (ER) and Water Research Foundation (WRF)
• ER18-1395 Electrically Assisted Sorption and Desorption of PFASs
• ER18-1417 Molecular Design of Effective and Versatile Adsorbents for Ex Situ Treatment of AFFF-
Impacted Groundwater
• ER18-1052 Remediation of PFAS Contaminated Groundwater Using Cationic Hydrophobic Polymers as
Ultra-High Affinity Sorbents
• ER18-1306 Combined In Situ/Ex Situ Treatment Train for Remediation of Per- and Polyfluoroalkyl
Substance (PFAS) Contaminated Groundwater
• ER18-5015 Removal and Destruction of PFAS and Co-contaminants from Groundwater via Groundwater Extraction and Treatment with Ion-Exchange Media, and On-Site Regeneration,
Distillation, and Plasma Destruction
• ER18-B3-5053: Evaluation and Life Cycle Comparison of Ex-Situ Treatment Technologies for Poly- and Perfluoroalkyl Substances in Groundwater
• WRF 4913: Investigation of Treatment Alternatives for Short-Chain PFAS
12.2.1.1 Granular Activated Carbon (GAC)
Treatment Description: GAC is an effective sorbent media for organics that has historically been used to
reduce contaminants in a variety of water treatment applications. The information contained in this section
describes ex situ GAC treatment in which water is extracted and transferred from the source of contamination and directed through the treatment system.
Treatment Mechanism: Removal of PFAS by GAC is a physical mass transfer process (refer to Section 12.2.1)
from the aqueous phase onto solid media that does not involve or trigger any form of chemical degradation or transformation.
State of Development: GAC is an established water treatment technology proven to effectively treat long-chain
PFAS (such as PFOS, PFOA, and PFNA). The application of GAC as a treatment technology for PFAS removal has been practiced for over 15 years at more than 45 military installations, as well as several industrial sites and
publicly owned treatment works (Forrester 2018) involving private and municipal drinking water supplies.
Effectiveness: The following references were used to support the treatability effectiveness discussion presented
below for long-chain PFAS by GAC: Appleman et al. (2013); Burdick et al. (2016); Cummings (2015); Dickenson (2016); Ochoa-Herrera and Sierra-Alvarez (2008); Szabo (2017) and Woodard, Berry, and Newman (2017). These
references also include more comprehensive bibliographies if further details are needed on specific topics or
studies. Literature and supporting column studies have shown that newly placed GAC can reduce effluent
concentrations for PFAS listed in USEPA Method 537.1 (Shoemaker and Tettenhorst 2018) to below analytical detection limits until initial breakthrough begins to occur. The adsorption removal mechanism is not expected to
transform precursors (for example, telomer alcohols) to terminal PFAS as would be the case when using
advanced oxidation/reduction technology. Because GAC is generally used to treat many common groundwater contaminants, it is capable of also treating most organic co-contaminants that may be present, with the primary
impact being increased GAC consumption due to greater loading per unit of time, which may require more
frequent change-outs.
Individual PFAS have different GAC loading capacities and corresponding breakthrough times (often defined as
the number of bed volumes treated prior to detection in the effluent) (Eschauzier et al. 2012). GAC removal
capacity for PFOS is greater than PFOA, but both can be effectively removed (McCleaf et al. 2017). In general,
shorter chain PFAS have lower GAC loading capacities and faster breakthrough times, but could be effectively
treated if changeout frequency is increased. Figure 12-1 provides an example of removal curves and breakthrough information for a number of PFAS performed at a specific influent concentration based on vendor-supplied column
studies. 247

Figure 12-1. Example GAC removal curves at specific influent concentration (15-minute empty bed contact time).
Source: Used with permission from Calgon Carbon Corporation.
More studies are needed to confirm GAC treatment effectiveness for shorter chain PFAS or to identify
complementary technologies/materials to supplement GAC removal capability. This may include studying the influence on sorption site competition from PFAS precursors that are often not quantified during the GAC system
design. Recent accelerated column tests by vendors have shown the successful removal of a variety of PFAS,
including the butyl (C4), pentyl (C5), and hexyl (C6) compounds (Appleman et al. 2013; Dickenson 2016; Brewer 2017). Functional groups also impact the ability of GAC to adsorb PFAS compounds. Compounds with sulfonate
and sulfonamide groups are more readily adsorbed than those with carboxylates (Appleman et al. 2013;
Dickenson 2016). Studies currently in the developmental stage involve the use of other materials that can modify GAC surfaces to improve removal capabilities. Mixtures of powdered activated carbon, kaolinite, and amorphous
hydroxide have been tested at the bench- and pilot-scale and have shown high removal rates for shorter chain
PFAS in raw AFFF-impacted groundwater (Chiang 2017; Kempisty, Xing, and Racz 2018).
Most GAC full-scale treatment system case studies to date are based on treatment of PFOA and PFOS in the
impacted drinking water sources. As such, limited information is available regarding the treatment of other PFAS.
The full-scale drinking water systems demonstrate that PFOA and PFOS can be removed to below analytical detection limits until breakthrough occurs. More information is available in Table 12-1 posted as a separate PDF.
Treatment of groundwater impacted with PFAS from an AFFF release area contaminated with PFAS such as fire
training areas (FTAs) may require complex pretreatment and more frequent change-outs (higher influent concentrations compared to influent for drinking water treatment systems) and higher operation and maintenance
(O&M) costs.
248

Design/Operating Considerations: Laboratory treatability tests (for example, rapid small-scale column testing
(RSSCT) and accelerated column test (ACT)) are useful for evaluating treatability and determining initial design parameters. Larger scale pilot demonstrations are recommended to establish site-specific design parameters
such as adsorption bed depth; GAC consumption rate to meet a given treatment objective; empty bed contact
times (EBCTs); projections of breakthrough (based on bed volumes treated); and corresponding change-out frequency/costs. Column studies can also be used to compare loading capacity/breakthrough performance for
different types of GAC (for example, different materials, preparation methods, and pore size distributions)
offered by various vendors. These studies should always use site water to ensure that the effects of site-specific
geochemical characteristics are assessed. Alternative analytical screening methods, for example, total oxidizable
precursor (TOP) Assay (Section 11.2.2.2) and particle induced gamma ray emission (PIGE) (Section 11.2.2.3), can be used to better estimate potential total mass load during the GAC remedial design phase. Field performance
of GAC systems often varies significantly from that predicted in the RSSCT and other bench tests. Proper
monitoring is critical to demonstrate that the desired performance is being achieved, especially at system start-up and following media change-out events.
Temporary and permanent GAC systems can be rapidly deployed and require minimal operator attention, if
intensive pretreatment is not needed. The GAC media are placed in packed-bed flow-through vessels generally
operated in series (lead-lag configuration). EBCTs of 10–15 minutes per vessel are typical. PFAS breakthrough is
monitored by testing the water, at a minimum, between the lead and lag vessels. Additional sampling ports can be added (for example, at 25%, 50%, and 75% of the depth of the media). When breakthrough exceeds identified
change-out criteria, the lead bed is taken offline and the spent GAC is removed and replaced with either new or
reactivated GAC. The spent media are disposed off site by thermal destruction or can be thermally reactivated for
reuse. Treatment can be continuous if the lag bed is used as the lead bed while the media in the latter are changed out. Figure 12-2 depicts a simple process flow diagram for a GAC treatment system.
Figure 12-2. Typical GAC treatment system process flow diagram.
Source: Used with permission from Calgon Carbon Corporation.
249

Various GAC base materials (for example, bituminous coal, lignite coal, coconut shells) can be used for adsorption,
though bituminous coal-based GAC has been used for the majority of existing sorption treatment systems for
PFAS and current data show that bituminous-based products are more effective for PFAS removal (McNamara et
al. 2018; Westreich et al. 2018).
Specialized GAC formulations and coconut-based GAC can also be effective. Media selection and life cycle cost
will depend upon a number of factors, including PFAS and co-contaminant concentrations, media availability, and pricing.
GAC treatment applications will evolve as analytical methods improve and regulatory concerns encompass an
increasing number of PFAS. Shorter chain PFAS exhibit faster breakthrough times as mass loading rates increase (Appleman et al. 2013), so particular attention needs to be given to these compounds if their removal
is required. Alternative design optimization approaches or use of other technologies in combination with GAC (for
example, ion exchange (IX) resins discussed in Section 12.2.1.2) can address high O&M costs that can be incurred for GAC treatment involving high influent PFAS concentrations, especially if shorter chain PFAS must be
removed. As discussed in Section 12.2.1.2, specialty single-use and regenerable IX resins have been developed
that have higher loading capacities for shorter chain PFAS. GAC and IX can also be used in series to optimize removal capacity and minimize O&M costs, generally with GAC ahead of IX to remove non-PFAS organics and
longer carbon chain PFAS, followed by IX to remove the shorter carbon chain PFAS. This approach has been
implemented in the field and is presented in a case study in Section 15.2.2.1.
Spent GAC that contains PFAS can be thermally reactivated and reused, which may result in a lower cost media
replacement option versus new GAC. However, some regulatory agencies may not allow the use of reactivated
GAC for drinking water systems. NSF/ANSI standards require that the use of reactivated GAC for drinking water systems involve only media generated by the treatment system owner/operator and cannot include a mixture of
GAC that originated from other sources. The management of spent media should be planned during the life
cycle assessment phase and be documented as the treatment system is executed. Commercial facilities are available for thermal reactivation of spent GAC, which currently are not available for other sorption media and
can offer a potential life cycle cost benefit for spent media disposal. Based on vendor feedback (Mimna 2017),
commercial thermal GAC reactivation is performed at higher operating temperatures than steam or nitrogen
regeneration systems, and may be capable of complete desorption and destruction of PFAS from spent GAC (Watanabe et al. 2016; Yamada et al. 2005). However, similar to incineration, additional studies are needed to
investigate the fate of PFAS in the GAC reactivation process.
Sustainability: GAC ex situ PFAS water treatment systems have unique sustainability considerations as well
as considerations in common with other ex situ PFAS sorption media water treatment systems (treatment
complex construction, utilities, water collection and pumping, and discharge infrastructure). Major sustainability considerations unique to GAC systems are associated with:
raw material collection and
transportation GAC manufacturing and transportation
larger media vessels relative to IX due to longer EBCTs
larger treatment complex size due to larger vessels spent media transportation followed by reactivation, destruction, or disposal.
Multiple resources are available for performing sustainability assessments for sorption remedial designs (Amini et
al. 2015; Choe et al. 2013; Choe et al. 2015; Dominguez-Ramos et al. 2014; Favara et al. 2016; Maul et al. 2014;
Rahman et al. 2014; Ras and von Blottnitz 2012).
250

12.2.1.2 Ion Exchange Resin
Treatment Description: IX is an effective sorbent for other contaminants and has historically been used for a variety of water treatment applications (for example, nitrate, perchlorate, arsenic). To date, IX for PFAS removal
from water is limited to ex situ applications.
IX resin options for removal of PFAS include single-use and regenerable resins. Single-use resins are used until
breakthrough occurs at a pre-established threshold and are then removed from the vessel and currently
disposed of by high temperature incineration or by landfilling, where permitted. Regenerable resins are used until breakthrough but are then regenerated on site using a regenerant solution capable of returning the full
exchange capacity to the resin. Temporary and permanent IX systems can be rapidly deployed.
Related Ongoing Research Funded by SERDP (ER) and Water Research Foundation (WRF):
• ER18-1027 Ex Situ Treatment of PFAS Contaminated Groundwater Using Ion Exchange with Regeneration
• ER18-1063 Regenerable Resin Sorbent Technologies with Regenerant Solution Recycling for Sustainable Treatment of PFASs
• ER 18-5015 Removal and Destruction of PFAS and Co-Contaminants from Groundwater via
Groundwater Extraction and Treatment with Ion-Exchange Media, and On-site Regeneration, Distillation, and Plasma Destruction
• ER 18-1306 Combined In Situ/Ex Situ Treatment Train for Remediation of Per- and Polyfluoroalkyl Substance (PFAS) Contaminated Groundwater
• ER18-5053: Evaluation and Life Cycle Comparison of Ex-Situ Treatment Technologies for Poly- and Perfluoroalkyl Substances in Groundwater
• WRF 4913: Investigation of Treatment Alternatives for Short Chain PFAS
Treatment Mechanism: Removal of PFAS by IX is a physical mass transfer process from the aqueous phase onto
solid media that does not involve any form of chemical degradation or transformation. IX resins with positively charged functional groups can readily remove negatively charged PFAS compounds from water by forming ionic
bonds (the sulfonic and carboxylic acid heads of PFOS and PFOA are negatively charged at the typical range of pH
values found in natural water). Simultaneously, the hydrophobic end of the PFAS structures can adsorb onto the hydrophobic surfaces of the IX resins. This dual removal mechanism can exhibit higher selectivity versus other
sorption media that function largely by adsorption alone.
State of Development: Ion exchange technology has been used since the late 1930 for common water treatment processes like softening, demineralization, and selective contaminant removal. The development and
use of selective resins for PFAS removal is relatively new but already well established. As of 2019, a limited
number of regenerable IX systems have been installed in full-scale applications after successful pilot testing. Collection of data on longer term treatment and on-site regeneration of the IX resin is ongoing at a case study site
(Section 15.2.2.2). In general, the removal capacity of the single- use resin is higher than that of regenerable
resin, and single-use resin can be more fully exhausted in a lead-lag vessel configuration than regenerable resin.
The relative efficiency of regenerable and single-use resins depends upon PFAS and co- contaminant influent
concentrations and treatment goals.
Effectiveness: Selective IX has been demonstrated to reduce concentrations for a broad suite of PFAS at the
bench and field scale for influent concentrations as high as 100s of parts per billion (ppb) total PFAS to below
analytical detection limits in effluent (Kothawala et al. 2017; McCleaf et al. 2017; Woodard, Berry, and Newman
2017). The affinity of such resin for common subgroups of PFAS generally follows the order PFSA > PFCA. Within
each subgroup, affinity increases with increasing carbon chain length, and are not necessarily sequential (that is,
longer chain PFCA may be adsorbed better than shorter chain PFSA).
251

In general, IX resin systems being used for PFAS removal are not installed with the intention of removing co-
contaminants. Co-contaminants (including organic and inorganic compounds) may significantly reduce the removal capacity of IX for PFAS, although this depends on the selectivity of the IX resin. Because of the variability in resin
behavior, as well as groundwater chemistry, influent characterization is needed to assess potential pretreatment
options to remove co-contaminants. Pretreatment is necessary to preserve resin capacity for PFAS removal, particularly in the context of
remediation where complex co-contaminant chemistry is expected. Pretreatment needs for drinking water
applications may be simpler or not required.
Single-use PFAS-selective IX resins are well-suited to treat low-concentration PFAS such as is typically
encountered in potable water treatment systems, where media change-out would be infrequent. Figure 12-3 provides an example of removal curves and breakthrough information for a number of PFAS at the specified
influent concentrations (in the legend) based on vendor-supplied data for a full-scale single-use system.
Figure 12-3. Example of IX removal curves at specific influent concentrations (2.5-minute EBCT).
Source: Used with permission from Purolite Corporation.
252

Regenerable resins are better suited for removal of higher concentration PFAS where the savings realized from reusing the treatment media outweighs the cost of frequent replacement of nonregenerable media. Depending on
the treated water discharge goals, evaluation of regenerable resin could be warranted once influent
concentrations exceed 10 ppb total PFAS, such as would be encountered in groundwater remediation at or near
PFAS release areas. Regenerable resins can be more efficient for treating higher ppb influent levels of PFAS
where the cost of the regeneration system may pay for itself over time as compared to disposal and replacement
cost for single-use resin. An example of typical breakthrough curves for regenerable resin system is shown in
Figure 12-4. On the graph the y-axis is sample concentration/original concentration (C/Co), also note the influent PFAS concentrations (in the legend) in Figure 12-4 are higher (reported in ppb) than presented
in Figure 12-3 (reported in ppt). Additional details on a regenerable resin system are provided in a case study in
Section15.2.2.2. The cost effectiveness for regenerable resin systems increases significantly when a central
regeneration facility can be shared amongst multiple PFAS removal systems. The application of single-use versus
regenerable resins must be evaluated on a site-specific basis.
Figure 12-4. Example of regenerable IX removal curves at specific influent concentrations (2.5-minute EBCT).
Source: Used with permission from ECT2.
Design/Operating Considerations: IX treatment systems are configured similarly to GAC systems. Refer to
Section 12.2.1 for a description of GAC systems that also applies to IX systems. Figure 12-5 depicts a simple
process flow diagram for a single-use IX treatment system.
253

Figure 12-5. Single-use IX process flow diagram.
Source: Used with permission from Purolite Corporation.
IX technology features include:
• high selectivity–single-use IX resins can be used to selectively target more mobile PFAS (for example, shorter chain PFAS), although results will depend on water chemistry
• greater capacity, faster kinetics, and lower EBCT compared with GAC, resulting in smaller vessel size and potentially less frequent media change-out
• ability to consistently reduce PFAS to low ppt levels
• simultaneous removal of ionic co-contaminants
• for regenerable resins, the possibility of reduced operating and disposal costs as compared to single-use IX.
Selective IX requires a relatively short EBCT of 1.5–5 minutes per vessel of resin (Boodoo 2017), hence smaller
resin volumes and smaller, less costly treatment vessels for a specific application. Selective IX resins have shown
high operating capacities when removing trace levels of PFAS (for example, 200,000–300,000 bed volumes; refer to Figure 12-5), resulting in fewer change-outs of spent IX resin and reduced O&M costs.
254

Selective IX resins show much higher selectivity for PFAS compounds than for common anions in water such as
sulfate (SO42-), nitrate (NO3–), chloride (Cl–), and bicarbonate (HCO3–). However, these common anions are generally present in water at about three orders of magnitude higher than PFAS and will be the main competitors for the ion
exchange sites on the resin. As such, they will largely determine the operating capacity of such resins. The choice
between single-use and regenerable resins will in part be determined by the expected service period before the resin must be either replaced (single-use) or regenerated. Regenerable IX resin can be reused for many years if
protected from contact with strong oxidizing agents, foulants, and chemical/mechanical stresses. To date,
insufficient operating data are available for PFAS regenerable systems to understand the long-term durability of
regenerable resin because the first regenerable IX systems were installed in 2018. IX regeneration is a chemical process. The only field-demonstrated regeneration method capable of fully restoring PFAS removal capacity is a
proprietary process using a solvent-brine solution, where the brine dislodges the ionic head of the PFAS molecule
and the solvent desorbs the fluorinated carbon chain (or “tail”) from the IX resin (Woodard, Berry, and Newman 2017; Amec Foster Wheeler 2017). For a regenerable IX system, it is possible to concentrate the regenerant solution and
reuse it by distillation (Nickelsen and Woodard 2017). The distillate residue then contains a concentrated PFAS
waste that can be super-loaded onto specialized resin to create a small volume of solid waste that can be
managed by off- site disposal or potentially through on-site destruction using other technologies currently under
development and discussed in Table 12-1 (provided as separate PDF) (for example, plasma or electrochemical
destruction).
Sustainability: Resin ex situ PFAS water treatment systems have unique sustainability considerations in addition to those shared with other ex situ PFAS sorption media water treatment systems. Major sustainability costs
unique to resin systems are associated with:
• raw material collection and transportation
• resin manufacturing and transportation
• regeneration of multiple-use resin
• generation, use, and disposal or destruction of regeneration residuals
• spent single-use and, eventually, multiple-use media transportation followed by destruction or disposal.
12.2.2 Reverse Osmosis (RO)
RO is a technology used to remove a large majority of contaminants (including PFAS) from water by pushing the water under pressure through a semipermeable membrane as described below. The most common membrane
module configuration is spiral-wound, which consists of flat sheet membrane material wrapped around a central collection tube.
Treatment Description: RO membranes are effective in removing most organic and inorganic compounds from
water solutions. In recent years, new polymer chemistry and manufacturing processes have improved
efficiency, lowering operating pressures and reducing costs. As a result, RO membranes are increasingly
used by industry to concentrate or remove chemicals. RO is commonly used around the world in household
drinking water purification systems, the production of bottled mineral water, self-contained water purification units (for example, for branches of the U.S. military), and industrial applications (for example, water supply to
cooling towers, boilers, and deionized water). The largest application of RO is in desalination.
Treatment Mechanism: RO removes compounds from water solutions by passing pressurized water across a semipermeable membrane. Treated water (permeate) passes through the membrane and the rejected water
(concentrate) is collected for disposal or discharge, depending on the nature of the compounds present.
255

State of Development: RO has been studied in bench-scale studies and pilot plants for wastewater and drinking
water applications, offering the opportunity to compare both treatments operating simultaneously (Tang et al.
2006; Tang et al. 2007; Flores 2013; Glover, Quiñones, and Dickenson 2018; Dickenson 2016; Merino et al. 2016;
Appleman 2014; Snyder 2007). This allows for an understanding of the effectiveness of traditional drinking and
wastewater treatment methods alongside PFAS-specific technologies.
Effectiveness: Pretreatment is important when working with RO membranes. Membranes are highly susceptible to fouling (loss of production capacity) because some accumulated material cannot be removed from the
membrane surface. Therefore, effective pretreatment to remove suspended solids is a necessity for any RO
system. Pretreatment technologies would be specific to the RO feedwater quality.
RO removal of PFAS from various waters (for example, semiconductor wastewater, drinking water, surface water, and reclaimed water) has been studied and several studies have combined RO with nanofiltration (NF). NF is
discussed in Section12.4.3. PFOS removal > 99% was achieved using four different types of membranes over a
wide range of feed concentrations (0.5–1,500 ppm [mg/L]) (Tang et al. 2006). Another study by Tang et al. (2007)
tested five RO and three NF membranes at feed concentrations of 10 ppm PFOS over 4 days. The PFOS rejection and permeate flux performances were > 99% for RO and 90–99% for NF (note that 99.9993% removal
would be required to reduce 10 ppm to the USEPA health advisory of 70 ppt). The use of RO and NF as advanced
drinking water treatments is still limited, but both technologies have been shown to be successful for the removal of longer chain (> C5) PFAAs (Loi-Brügger et al. 2008; Tang et al. 2006).
Thompson et al. (2011) studied the fate of perfluorinated sulfonates (PFSAs) and carboxylic acids (PFCAs) in two
water reclamation plants that further treat water from wastewater treatment plants (WWTPs) in Australia. One
plant (Plant A) used adsorption and filtration methods alongside ozonation; the other (Plant B) used membrane processes and an advanced oxidation process to produce purified recycled water. At both facilities, PFOS,
perfluorohexane sulfonate (PFHxS), perfluorohexanoate (PFHxA), and PFOA were the most frequently detected
PFAS. Comparing the two reclamation facilities, Plant A showed some removal during the adsorption/filtration stages. Overall, however, Plant A failed to completely remove PFOS and the PFCAs shorter than PFNA in chain
length. All PFAS present were removed by RO at Plant B from the finished water to concentrations below detection
and reporting limits (0.4–1.5 ng/L).
Design/Operating Considerations: This section refers to design and operating considerations for both RO and NF
systems. In the process of planning and implementing a membrane filtration system, there are several
important issues that affect system design and operation and could impact system performance and thus PFAS
removal. These issues include membrane flux, water quality, and temperature.
• Membrane Flux: One of the major challenges in the application of membrane technology is fouling (significant flux loss due to continuous accumulation of colloidal and organic matter, precipitation of
inorganic salts, and/or microbial growth). There are several ways to avoid fouling: (1) changing operating conditions, (2) modifying the membrane, and (3) modifying the feed by adding antifoulants
prior to filtration system (pretreatment) (Roux et al. 2005). Adequate pretreatment and appropriate
membrane selection can slow the fouling rate, but the membrane cleaning is an essential step in maintaining the performance of the membrane process. Membrane replacement is a necessary part
of plant operation to maintain the quality of the produced water (Abdul-Kareem Al-Sofi 2001).
Although there are a number of cleaning techniques, such as physical or chemical or a combination
of both, only the chemical cleaning methods are widely used by NF and RO industries for membrane cleaning and regeneration. Spent cleaning solution may contain PFAS and would need to be
managed properly.
256

• Water Quality: Because water quality can have a significant impact on membrane flux, feedwater quality is also a primary design consideration for membrane filtration systems. Poorer water quality
will require lower fluxes, which in turn increase the necessary membrane area and required number
of modules, adding to both the cost and the size of the system. However, pretreatment can often improve feedwater quality at a lower cost than additional membrane area.
• Temperature: Like other water quality parameters such as turbidity and total dissolved solids (TDS) (for
NF/RO systems), the temperature of the feedwater also affects the flux of a membrane filtration
system. Water becomes increasingly viscous at lower temperatures; thus, lower temperatures reduce
the flux across the membrane at constant transmembrane pressure or alternatively require an increase in pressure to maintain constant flux. Because rejection decreases as membrane pores
expand at higher temperatures, more leakage of PFAS across the membrane could occur at higher
operating temperatures.
Sustainability: The environmental footprint for this technology includes energy source and consumption during
treatment system operation, as well as manufacturing/disposal of pretreatment/treatment media (examples may include solids from upstream precipitation/coagulation or microfiltration, used cartridge filters, and worn RO
membrane modules) and cleaning solutions to maintain the membrane. RO requires power for high-pressure
pumps and the management of concentrate, which can be energy-intensive.
An issue inherent to contaminant removal by membrane processes is the disposal of the PFAS-enriched
concentrate, which must be carefully considered. Development of effective treatment methods for the
concentrate entails evaluating significant parameters, such as volume generated, concentration, characteristics of the feedwater, and operational conditions, and using well-verified analytical methods to detect trace amounts
of contaminants. Recycling concentrate to main treatment units is not the only option, and further research on
integrated treatment systems must be performed (Joo and Tansel 2015).The reject stream will contain PFAS-enriched concentrate, which needs to be appropriately managed through treatment, permitted discharge, or
disposal.
12.2.3 Drinking Water Applications
Remedial actions for PFAS-impacted drinking water from private wells and municipal supplies can include providing
alternative drinking water sources, such as bottled water, new nonimpacted source wells or surface water, point
of entry (POE) treatment (also referred to as POET), and point of use (POU) treatment. POE treats water as it enters a home or building (for example, immediately after a pressure tank for a private well system) and POU
treats water at one or more specific locations (for example, at a kitchen faucet where water is typically directly
ingested or used for cooking). POE systems provide “whole supply” treatment while POU provides selected usage point treatment.
NSF International has developed a testing method and protocol, P473: Drinking Water Treatment Units–PFOA and
PFOS, to verify the ability of a water treatment device to reduce PFOA and PFOS to achieve the USEPA health advisory levels of 70 ng/L (NSF International 2018). This method does not evaluate the removal of other PFAS or
other organics, metals, and nonorganic compounds that also may adversely impact water supplies. Current
systems with this certification are mainly small-scale POU systems such as sink faucet filters, refrigerator water
filters, and pour-through filters. It should be recognized that although this certification exists, it is not required. This means that other POU systems as well as POE systems (larger well head or large public-serving systems) may
not be certified under NSF P473 but may be acceptable for treatment of PFOA and PFOS. Public serving system
components are required to be certified through NSF 61, which certifies that they are acceptable for potable water use. Treatment for PFAS in these systems typically uses adsorbents, GAC (Section 12.2.1.1) or IX (Section
12.2.1.2) or RO (Section 12.2.2).
257

12.3 Field-Implemented Solids Treatment Technologies
Field-implemented technologies are those that have been implemented in the field by multiple parties at multiple
sites and the results have been documented well in the peer-reviewed literature. The technologies in this section may be applied to a variety of PFAS-impacted media, including soil, sediments, or sludge. Site-specific evaluation
is always needed to identify the best technology alternative for a given treatment scenario. As with water
treatment, solids treatment can be performed ex situ (for example, excavation or dredging) or in situ (for example, injection or reactive capping). At present, field- implemented solids treatment has been performed almost entirely
ex situ. There are currently two known field-implemented technologies for treating soil contaminated with PFAS:
sorption/stabilization and excavation/disposal.
12.3.1 Sorption and Stabilization
Treatment Description: Amendments are added to the soil and sediment to reduce the potential for PFAS to
mobilize from soil and sediment to groundwater and surface water. For sorption purposes, PFAS-adsorbing
materials (for example, activated carbon) can be applied through in situ soil mixing or ex situ stabilization (for example, pug mill mixing) to reduce the leachability of PFAS from contaminated soil/sediment through physical
and/or chemical bonding.
Sorption and stabilization (considered “immobilization” or “chemical fixation” technologies) is a relatively quick,
simple, and low-cost (relative to off-site disposal) way to reduce ongoing PFAS contamination transport to
waterways and groundwater from source zones. The main disadvantage is that these technologies do not
destroy the contaminants, but rather bind or immobilize them. For some amendments, established test
methods have shown the binding to be stable over the long-term (see below).
Treatment Mechanism: Amendments adsorb or stabilize PFAS to reduce their release from soil. This occurs
primarily through electrostatic interactions between the negative charge on the PFAS functional group and the positive charges on the sorbent and hydrophobic interactions between the amendment and the electronegative
carbon-fluorine chain on the PFAS. Typical amendments that have been demonstrated in the field include
activated carbon and composite materials such as a blend of aluminum hydroxide, kaolin, and carbon specifically designed to treat anionic, cationic, and zwitterionic long- and short-chain PFAS (Kempisty, Xing, and
Racz 2018).
State of Development: Sorption and stabilization techniques using carbon-based amendments are considered
field- implemented technologies. Various amendments have been applied to soil/sediment both in situ and ex
situ. Different delivery methods for amendments, such as injection or in situ mixing (ISM), may provide different
results depending on geology and objectives. Carbon amendments have been modified to enhance their
sorption of PFAS. One patented amendment consists of activated carbon enhanced with amorphous aluminum
hydroxide, kaolin clay, and other proprietary additives (USEPA 2017). This amendment has been used to immobilize PFAS-impacted soil at field-scale in Australia and Europe and at laboratory-scale in the United States.
In 2015, a large-scale project involved the ex situ treatment of 900 tons of PFAS-impacted soil from an airport
site in Australia (Stewart 2017).
258

Effectiveness: Carbon- and mineral-based sorption and stabilization techniques vary in their effectiveness
according to site conditions, PFAS types, and mixing approaches. The PFAS characteristic that determines sorption
is length of carbon-fluorine chain, with longer chains having increased sorption (Xiao, Ulrich, et al. 2017). Some
specifically designed amendments have the ability to bind short- and long-chain compounds using different
mechanisms (Stewart, Lawrence and Kirk 2016). The carbon component binds to the hydrophobic backbone of
longer chain PFAS, while the negatively charged functional groups of the PFAS anions bind electrostatically to the
positively charged surfaces of aluminum hydroxide. Furthermore, the amorphous form of aluminum hydroxide presents a relatively high surface area of positive charges, and the pKa of around 9.1 means that these
surfaces remain positively charged over a wide environmental pH range (~pH 3 to pH 9.1). The kaolin
component contains some negatively charged surfaces that theoretically have the ability to sorb PFAS cations and zwitterions (Stewart, Lawrence and Kirk 2016; Kempisty, Xing, and Racz 2018). However, standard analytical
methods do not quantify cations and zwitterions, and actual field performance on these PFAS compounds is
generally undemonstrated.
The charge on the PFAS compounds affects sorption (for example, cations sorb more readily than zwitterions and
anions). Aquifer and soil chemistry also affect the sorptive ability of PFAS onto the amendments. High organic
content in soil can reduce effectiveness (NGWA 2017). Low pH, the presence of polyvalent cations in the soil, or
treatment amendment also increases sorption, retardation, and metals precipitation. An independent study at the
University of Adelaide, Australia, showed that environmental ranges of pH and ionic strength did not adversely
affect the binding of a specialized amendment to PFOA (Lath et al. 2018). Co-contaminants also play a role in the
effectiveness of PFAS sorption. A recent review article (Li, Oliver, and Kookana 2018) showed that the organic
carbon component of natural soils and sediments plays less of a role in PFAS sorption than once thought; the mineral component of the soil/sediment and the pH conditions play a more important role in PFAS adsorption.
A patented amendment consisting of activated carbon blended with amorphous aluminum hydroxide, kaolin clay,
and other proprietary additives has been field-implemented and was used to successfully immobilize 28 PFAS
analytes in more than 14 different contaminated soils in a lab-based trial from fire training grounds across Australia (Stewart and MacFarland 2017). At average addition rates of around 2.5-5%, PFOS and PFOA in soil
leachates were reduced by 95% to >99% following a 48- hour treatment process.
Sorption and stabilization do not destroy PFAS, and these technologies have not been implemented for enough time to demonstrate long-term stability of amendments for PFAS. However, in independent studies, the Multiple
Extraction Procedure (MEP; USEPA Method 1320) has been used to successfully demonstrate the simulated long-
term stability of immobilized PFAS in amended soils (Stewart and MacFarland 2017). The MEP is designed to simulate 1,000 years of acid rain conditions in an improperly designed sanitary landfill. In another independent
study, the accumulation of PFAS in earthworms and plants was reduced by >90% in soil treated by carbon-based
immobilization compared to untreated soils (Bräunig 2016; Kempisty, Xing, and Racz 2018). The amended soil can be mixed with concrete and other stabilizers to improve performance; however, the concrete increases pH and
may influence binder performance (Ross et al. 2018).
Design/Operating Considerations: To establish design and application parameters for implementation of sorption and stabilization technology in soils, it is necessary to perform site-specific laboratory and/or pilot treatability tests.
Information and quantity of amendment material required (dose rates) for materials can be determined with either simple beaker or jar- type lab treatability tests. These studies are most applicable if site soils and water
are used to ensure that the effects of site- specific geochemical characteristics are assessed. Once the dose of
amendment material is determined, field pilot studies are often conducted to validate lab data and design for
full-scale implementation.
For in situ soil mixing, the amendments are added to soils at the design dose or application rate under controlled
conditions with specific types of equipment designed to perform mixing. In situ soil mixing can be performed on
soils in place with a wide range of standard construction equipment, including excavators, large diameter augers, and in situ blenders. In addition, with in situ soil mixing, soils can be removed and mixed in equipment
such as a pug mill or other similar mixing systems. 259
After implementation of in situ soil mixing, it is important to perform postconstruction quality assurance and quality
control to verify design endpoints. This may include leachability (Toxicity Characteristic Leaching Procedure (TCLP), USEPA Method 1311; Synthetic Precipitation Leaching Procedure (SPLP), USEPA Method 1312; or Multiple
Extraction Procedure (MEP), USEPA Method 1320), hydraulic conductivity (ASTM D5084), and strength tests
(various).
Sustainability: The environmental footprint for sorption and stabilization includes emissions from earthwork
equipment, manufacturing, and transporting amendment material. This footprint can be smaller than
excavation if the treated soil is reused on site. Community impacts include hindrance of redevelopment due to land use restrictions. However, if the land use is not expected to change, such as on active government-
owned aviation or military sites, stabilization with amendments and reuse of the soil may be a viable and
cost-effective approach.
Resources are available for performing a sustainability assessment for sorption and stabilization remedial design,
relating to other contaminants (Goldenberg and Reddy 2014; Hou et al. 2016; Kuykendall and McMullan 2014).
12.3.2 Excavation and Disposal
Treatment Description: This approach involves
removing contaminated soil/sediment for off-site
disposal. The contaminated material is disposed of at a permitted landfill, then the excavated area
is filled with clean backfill. Treatment with
stabilizing agents can reduce PFAS leachability from excavated soils and should be considered
prior to landfilling. Sometimes, excavated
soil/sediment can be treated on site using the sorption and stability approach or thermal
treatment (as discussed in the next section)
followed by soil reuse or off-site disposal.
Treatment Mechanism: This method is intended to
remove PFAS from the source location. Transportation and disposal in a lined landfill is an
option for excavated soil; however, leachate
management should be a consideration at these facilities.
State of Development: Soil excavation and disposal is a well-demonstrated, proven technology. However, PFAS have been reported in landfill leachate (Lang et al. 2017), although the source for PFAS in leachate may be
consumer product waste containing fluorochemicals. In some states, the leachate is not analyzed or regulated
for PFAS. Disposal of PFAS waste to landfills potentially adds to the PFAS contaminant load in the landfill leachate. Some nonhazardous waste landfills do not accept PFAS waste.
Effectiveness: Excavation and disposal of PFAS-contaminated soil effectively removes a source area that may
otherwise serve as a continuing source of groundwater contamination but does not result in destruction of the PFAS unless the soil is incinerated. Disposal of PFAS-impacted soils or wastes into unlined landfills should be
avoided as unlined or improperly lined landfills can be sources of PFAS to the environment.
Soil Containment The focus of this section is to summarize the state of various remediation technologies. Containment is not listed as a specific technology but is commonly utilized for other contaminants and may be suitable for PFAS depending on site-specific conditions.
Containment could include capping to prevent infiltration or exposure, construction of a slurry wall (or similar isolation barrier), addition of sorptive media to prevent migration, or landfill disposal (discussed further in this section and in Section 2.6.3.1). Containment options will depend on site- specific considerations, nature of PFAS materials, and local regulatory requirements.
260

Design/Operating Considerations: Difficulties in finding landfills willing to accept the waste, coupled with rapidly
changing regulations regarding whether PFAS are hazardous or not, make this option less straightforward than
one would expect. Case-by-case inquiries to landfill facility owners is likely the best course of action. Overall, issues related to disposal of PFAS in landfills are similar to issues commonly encountered with other
contaminants. See Section 2.6.3, Solid Waste Management, for additional discussion on this topic.
Sustainability: The environmental footprint for excavation and disposal includes earth-moving equipment emissions, transporting contaminated soil and backfill, and resource extraction (such as borrow area fill material)
of backfill material. Incineration of the contaminated soil and investigation-derived waste (IDW) is energy-intensive and remains a topic of current study to better understand the fate of PFAS, see Section 12.4.
Truck hauling traffic affects the local community by creating additional traffic congestion, noise, and
particulate matter emissions. The cost for this approach is high, but the solution is generally permanent and for
smaller treatment volumes may be cost-competitive. Guidance is available for performing a sustainability assessment for an excavation and disposal remedial design (Cappuyns and Kessen 2013; Goldenberg and
Reddy 2014; Söderqvist et al. 2015; Song et al. 2018).
261

12.4 Incineration
Treatment Description: Incineration is defined as destruction (mineralization) of chemicals using heat. Heat is
applied directly to the PFAS-contaminated solids (soil/sediment/spent adsorbents/waste) or liquids
(water/wastewater/leachate/chemicals). Vaporized combustion products can be captured (precipitation, wet scrubbing) and/or further oxidized at elevated temperature.
State of Development: Incineration is a mature technology that has been used for various solid and liquid wastes.
Effectiveness: Incineration is one of only a few technologies that can potentially destroy PFAS. In December 2020,
USEPA released a draft interim guidance on destruction and disposal of PFAS (USEPA 2020). At the time of
publication, this is an active area of research to evaluate effective destruction temperatures and treatment
time, the potential to generate products of incomplete combustion, stack gas analyses, deposition onto land, and other risk factors.
Design/Operating Considerations: Waste incinerators are fixed facilities. Federal and state permits dictate the
materials processed, core incinerator operations (for example, temperature and time, turbulence), and control of process air, liquid, and solid wastes. Permit and design/construction similarities reduce the operational and
performance differences between individual incinerators.
When considering waste disposal options, transportation costs, energy costs, regulatory approvals, and final
disposition of process waste residues should be evaluated, as these differ among incineration facilities.
Sustainability: The environmental footprint for incineration includes transportation and supplemental fuel for
the incineration process. Incineration of contaminated soil, liquid wastes, and IDW is energy-intensive and PFAS
emissions, including potential PFAS combustion byproducts, from incinerators are currently not well understood
(USEPA 2020). Truck hauling traffic affects the local community by creating additional traffic congestion, noise,
and particulate matter emissions. The cost for this approach is high, but the solution may be cost-competitive for
smaller treatment volumes.
262

12.5 Limited Application and Developing Liquids Treatment Technologies
The treatment technologies presented in this document are provided in a hierarchy defined in Section 12.1,
which is based on level of implementation and confidence derived from widespread, well documented
implementation. The three development levels include field-implemented technologies, limited application technologies, and developing technologies. Both in situ and ex situ technologies are included. It is not always
clear if a limited application or developing technology may be effective in situ, ex situ, or both; therefore, further
distinction is not made in this section.
The field-implemented technologies described in the preceding sections have been applied at multiple sites and are well documented in the available literature. In addition to these well-demonstrated technologies, many technology approaches have been tested in academic and other research laboratories at the bench scale or
have progressed as far as field pilot tests or limited field applications. These limited application technologies are
briefly summarized Table 12-1 for liquids, Table 12-2 for solids (provided as a separate PDF), and appropriate
references are provided. Additional information is provided in the following summary sections.
12.5.1 Sorption Summary
12.5.1.1 In Situ Remediation with Colloidal Activated Carbon
Colloidal activated carbon (CAC) consists of colloidal-sized particles (2 microns diameter on average) in aqueous suspension (the consistency of black-colored water), which can flow into aquifer flux zones upon gravity-feed or
low-pressure injection. After injection, CAC particles will attach strongly to the aquifer matrix, where they can act
as passive sorbents for organic contaminants, including PFAS. This sorption mechanism is detailed in the Section 12.2.1. Due to the small size of the particles, the kinetics of PFAS sorption on colloidal carbon are much faster
than can be achieved with GAC, resulting in higher removal efficiencies (Xiao, Ulrich, et al. 2017). The primary
function of injectable CAC is to immobilize contaminants and prevent their further horizontal and vertical migration
in groundwater, thereby eliminating the risk to downgradient receptors. By flowing CAC into the flux zones of an
aquifer, contaminants moving through the aquifer, as well as those contaminants back-diffusing from lower
permeability zones, are captured and taken out of solution.
CAC may be injected in situ using a grid pattern in source zones to immobilize contaminants, or it may be
injected in a transect pattern perpendicular to the width of a plume to mitigate contaminant flux. Direct push or vertical wells can be used to inject CAC into the subsurface. The longevity will be dependent upon PFAS
composition, rates of mass discharge, presence of co-contaminants, and groundwater geochemistry.
McGregor (2018) discussed the in situ injection of CAC at a site in central Canada to mitigate mass flux of PFOS and PFOA from the source zone. Fire training exercises were carried out at the site in the 1970 and 1980. Prior to CAC
injection, PFOS and PFOA were measured in groundwater monitoring wells at concentrations up to 1,450 ng/L and
3,260 ng/L, respectively. Monitoring wells at the site were screened in a shallow, thin silty sand overburden unit at depths of approximately 5–10 feet below ground surface. CAC was injected into the source zone at low pressure
through temporary wells installed using direct push technology. Postinjection core sampling indicated that CAC
was measured at distances of up to approximately 15–20 feet from the injection wells.
Carey et al. (2019) performed modeling with respect to the above site to predict the theoretical longevity and
performance of the CAC. The study noted that longevity of performance could be extended by increasing the CAC dose, increasing the thickness of the treatment zone perpendicular to flow, or by additional injection upon
breakthrough.
263

12.5.1.2 Coated Sand
Polymer-coated sand is an adsorbent material that has high affinity for organic contaminants. Cyclodextrin
molecules are polymerized by a cross-linking agent and form inclusion complexes with many organics. The adsorbent material has two components: (a) polymer coat (active component that removes the contaminants)
and (b) support base (inactive component); the combination of both provides an adsorbent with high selectivity
and mechanical stability.
The adsorbent showed similar performance in removing PFOA and PFOS as GAC, but one of the key features of
this technology is the high regenerability of the adsorbent (filter) for reuse (Bhattarai, Manickavachagam, and Suri 2014). Another important feature of the technology is that it can remove other organic pollutants such as
chlorinated solvents (for example, trichloroethene (TCE), perchloroethylene (PCE), hexavalent chromium, and
others (Badruddoza, Bhattarai, and Suri 2017). Surface modification has been shown to improve the adsorption of
PFOS (Zhou, Pan, and Zhang 2013) by using organic polymeric surfactants.
12.5.1.3 Zeolites/Clay Minerals (Natural or Surface-Modified)
Zeolites are naturally occurring aluminosilicate compounds that are widely used in chemical separation and
purification due to their high surface area and small uniform pore size among other properties (Tao et al. 2006).
Zeolites are also being increasingly considered as a medium for the sorption of various pollutants, including cationic heavy metals, ammonium, and some volatile organic compounds, due to the aforementioned properties,
as well as their high ion exchange capacity and low cost (Delkash, Ebrazi Bakhshayesh, and Kazemian 2015).
Clay minerals, including natural and surface-modified (see below), are also used as adsorbents and are similar to
zeolites in composition but have different crystalline or chemical structure.
Both zeolites and clay minerals can be used ex situ (that is, pump and treat) by being placed in packed-bed flow-
through vessels or in situ via injection into aquifers. In situ applications are currently lacking in study or field
application.
Zeolite and clay minerals use both ion exchange and adsorption mechanisms to remove PFAS from water. For removal of PFAS, these natural materials have been shown to be inferior to activated carbon or ion exchange
resins (Du et al. 2014). However, synthetic processing of zeolite can create highly siliceous material (Baerlocher 2007) or can incorporate cationic surfactants into the surface structure (aka surface-modified zeolites–SMZ)
(Jiménez-Castañeda and Medina 2017). One study indicated that engineered zeolites with a high Si/Al ratio were
effective at adsorption of PFOS, presumably due to hydrophobic interactions rather than ion exchange (Ochoa-
Herrera and Sierra-Alvarez 2008). Surface-modified clay materials are broadly considered organoclays.
Most available literature is limited to academic laboratory experiments (Ochoa-Herrera and Sierra-Alvarez 2008;
Punyapalakul et al. 2013; Zhou, Pan, and Zhang 2013; Zhou et al. 2010). Du et al. (2014) and Arias Espana,
Mallavarapu, and Naidu (2015) provided comprehensive literature reviews. Two modified clay-based adsorbent products are identified as being used in field pilots or small-scale field trial applications (Arias et al. 2013; Arias
Espana, Mallavarapu, and Naidu 2015) to treat PFOA and/or PFOS.
Related Ongoing Research Funded by SERDP:
• ER18-1652 Destruction of PFAS and Organic Co-Contaminants in Water and Soil Present in Investigation-Derived Waste at DoD Sites Using Novel Adsorbent and Ultrasound
264

High silica materials, such as H-form synthetic mordenite (HSM) and Y-form sodium zeolite (NA-Y80), and
hydrotalcite clay provided adsorption capacities that were equivalent or exceeded powdered activated carbon (PAC). Surfactant-modified clays also performed as well as or better than PAC. It should be noted that none of
these studies were conducted in flow- through column experiments, so applicability to ex situ treatment systems
cannot be assessed. Arias Espana, Mallavarapu,and Naidu (2015) stated that organoclays, clay minerals, and highly siliceous materials have fast kinetics (0.4–3 hr to reach equilibrium), making them suitable for
remediation applications.
12.5.1.4 Biochar
Biochar is a hybrid word rooted in the words “biomass” and “charcoal.” Biochar is a carbon-rich porous solid
that is synthesized by heating biomass, such as wood or manure, in a low oxygen environment (Ahmad et al.
2014). This material has primary applications for carbon sequestration, improvement of soil fertility, and most
recently as an adsorbent for pollutant removal. Biochar is characterized to have high affinity for organic
contaminants, which is dependent on both the pore structure and the surface functional groups of the biochar material (Guo et al. 2017).
Some of the key factors controlling the properties of biochar (for example, pore size composition and hydrophobicity) include the temperature of pyrolysis and biomass feedstock, among others. In many respects,
the properties of biochar are similar to but generally lower than those of GAC for sorptive purposes.
The available literature is limited to academic laboratory batch experiments on the bench-scale (Chen et al. 2011; Inyang and Dickenson 2017; Kupryianchyk et al. 2016; Rahman et al. 2014; Xiao, Ulrich, et al. 2017), with
one published study reporting pilot-scale column operation (Inyang and Dickenson 2017).
12.5.2 Precipitation/Coagulation/Flocculation Summary
Precipitation/coagulation/flocculation is a common pretreatment approach used in wastewater treatment plants for
removing various particles and dissolved constituents. Coagulants, either commodity or proprietary chemicals, can
be added to water (conventional technology) or generated by anode-cathode reactions of metal plates inserted into the water (electrocoagulation). Common examples include:
• inorganic cationic coagulants (for example, alum, iron-based)
• commodity (for example, polyDADMAC) and specialty (for example, Perfluorad)
• polymers electrochemical precipitation
Coagulants assist in the formation of solids. Flocculation is typically conducted by adding a soluble polymer and slowly mixing to allow the particles to agglomerate and grow. Upon solid formation, constituents such as PFAS can
be physically incorporated into, or sorbed onto, the flocculated particulate (which is known as co-precipitation).
The precipitated solids are then separated from the water by sedimentation and/or filtration processes. The solid material containing the PFAS requires disposal, see Table 12-2 for solids (provided as a separate PDF). See
Section 12.3.2 for solids disposal options.
Current literature documents only bench-scale study results on treating PFAS via precipitation, flocculation, or coagulation; therefore, this is considered a partially developed technology. Evaluations have focused on
conventional commodity chemical coagulation (for example, aluminum or ferric salts) and nonconventional coagulation (for example, proprietary chemical coagulants or electrocoagulation). Pilot- and full-scale
applications have not been documented in the United States (Birk 2017).
Nonconventional precipitation (for example, electrocoagulation or advanced chemical precipitants) has shown
more potential for direct PFAS treatment, but has very limited data. High-affinity cyclodextrin polymer has been
tested in bench- scale reactors and was found to have superior removal capacity to GAC (Xiao, Ling, et al.
2017).
265

Related Ongoing Research Funded by SERDP:
ER-2425 Development of a Novel Approach for In Situ Remediation of PFC-Contaminated Groundwater Systems ER18-1026 Rational Design and Implementation of Novel Polymer Adsorbents for Selective
Uptake of PFASs from Groundwater
Electrocoagulation reactors, which range from basic to very sophisticated designs, have been reported to be
highly efficient, compact, relatively low cost, and completely automatable (Baudequin et al. 2011; Lin et al.
2015). Recent studies have found that PFAAs, such as PFOA and PFOS, can be quickly sorbed on the surface of
zinc hydroxide particulates generated by electrocoagulation (Lin et al. 2015).
12.5.3 Nanofiltration (NF)
NF is a form of membrane technology that is pressure-driven and shown to be effective in the removal of PFAS
(Tang et al.2007). This method of filtration provides high water flux at low operating pressure (Izadpanah and
Javidnia 2012). Nanometer-sized membrane pores are used to remove compounds in a process similar to RO, but NF does not remove smaller ions such as chloride and sodium. The most common membrane module
configurations are spiral-wound (consisting of flat sheet membrane material wrapped around a central collection
tube); however, hollow fiber NF modules may also be available for applications with higher fouling potential.
Available data on the removal of PFAS via NF consist of laboratory-scale tests performed on flat sheet
membrane coupons (laboratory-scale sections of the membranes to be tested) and one full-scale drinking water treatment plant using an NF treatment train. Therefore, variations in performance due to fouling, flux, and
concentration distributions in standard spiral- wound membrane configurations have not been characterized
(Boo et al. 2018).
NF membranes tested include the DuPont (formerly Dow FilmTec) membranes NF-270, NF-200, and NF-90, and
the SUEZ (formerly GE Water & Process Technologies) DK membrane. Reported rejections were generally > 95%
for PFAS with molecular weights ranging from 214 grams per mole (g/mol) to 713 g/mol, though some compounds had lower rejections (PFPeA at 70% and perfluorooctane sulfonamide at 90%) (Steinle-Darling and
Reinhard 2008; Appleman et al. 2013).Effective full-scale removal of PFAS by NF membranes was confirmed
based on nondetectable PFAS concentrations (<4 ng/L) in NF permeate (Boiteux 2017). Salt passage for PFOS
was reported to range from < 1% for the tighter NF-90 membrane to about 6% for the looser NF-270 and DK membranes (Tang et al. 2007). As mentioned in Section 12.2.2, an appropriate disposal or treatment of the
membrane concentrate stream needs to be considered, especially the application of high- pressure membranes
for inland communities.
12.5.4 Redox Manipulation Summary
Redox manipulation includes chemical oxidation and reduction technologies. These have been summarized in more detail in Nzeribe et al. (2019). Chemical oxidation for PFAS is a technology approach that is achieved via the
delivery of liquid, slurry, or gaseous oxidants to transfer electrons from a reactive oxidant species to a target
(PFAS) and affect the cleavage of atoms in the PFAS molecular structure. Carboxylic or sulfonic group “heads”
(functional groups) of PFAS are commonly more susceptible to redox transformation than the fluorinated carbon chain “tails.” There is currently a lack of robust evidence of defluorination via chemical oxidation processes. The
mechanisms involving multiple species of free radicals that trigger PFAS oxidation are not well understood. PFAA
precursors are also known to be oxidized to form persistent and terminal PFAAs without further oxidation (Houtz and Sedlak 2012; Anumol et al. 2016). Consequently, care should be taken to monitor site and plume conditions
and understand potential formation and transport of transformation products.
266

Additional mechanistic studies are needed to develop chemical oxidation as a feasible PFAS remediation
approach and to further assess factors that may promote or limit this technology. Common oxidants that have been documented to treat PFAS and other organic contaminants (for example, chlorinated solvents) include
ozone, catalyzed hydrogen peroxide, and persulfate, as discussed further below.
12.5.4.1 Ozone-Based Systems
Ozone can be coupled with other oxidants such as hydrogen peroxide and persulfate to promote the generation of a suite of aggressive free radicals capable of degrading PFAS. An ozone-based system was implemented for the
treatment of PFAS in a single field-scale test by Eberle, Ball, and Boving (2017) using combined ozone and
activated persulfate.
The main pathway and mechanism behind the ozone-based system tested by Eberle, Ball, and Boving (2017) is
unknown, as detailed mechanistic studies have not been performed. However, they suggested that PFAS
reduction in groundwater after treatment was not limited to partial degradation, but it is possible that sorption
also had a role to play in the declining aqueous PFAS concentration. They postulated that activated persulfate could lead to a decline in pH, thereby increasing sorption of PFAS to soil due to increased protonation.
This approach has been partially demonstrated in one field-scale setting, and results are encouraging for application using ex situ or in situ approaches. However, because there is an absence of supporting
mechanistic data, it is likely that other factors could come into play that may promote or limit this technology.
The application of the ozone-based system for the treatment of PFAS has also been evaluated in bench
studies (Lin, Panchangam, et al. 2012; Kerfoot 2014; Huang et al. 2016; Eberle, Ball, and Boving 2017). Lin,
Panchangam, et al. (2012) used an ozone system without and inclusive of hydrogen peroxide addition in an alkaline environment, and Kerfoot (2014) used hydrogen peroxide and ozone bubbles for a bench-scale test of
groundwater from a monitoring well foam firefighting site in Canada. Huang et al. (2016) combined ozone with
photolysis to produce hydroxyl radicals and photogenerated electrons.
In the field demonstration, PFAS concentrations in groundwater were reduced by 21–79% after treatment. Also,
an initial pilot test at a fire training area using ozone and peroxide has shown removal of 98.5% and 92.3% for
PFOS and PFOA, respectively, in groundwater and over 80% for PFOS on saturated soil with proportional release
of fluoride (Kerfoot 2016).
In bench-scale studies, Eberle, Ball, and Boving (2017) decreased PFAS by 99.9% using PFAS-contaminated site
groundwater and spiked deionized water. Eberle, Ball, and Boving (2017) also reported that the system was not
sensitive to other groundwater organics. Kerfoot (2014) reported 89.8% removal of PFOS and > 80% for other
PFAS (PFPeA 89.8%, PFHxA 86.2%n and PFHxS 98.1%). These studies, however, do not confirm destruction through mass balance and analysis of byproducts.
Each of these approaches and test conditions used different water matrices and starting concentrations. It is
difficult to state whether current regulatory levels can be achieved in practice with these technologies, but in
general they appear to be effective as a polishing technology to achieve low part-per-trillion treatment
requirements.
267

2 8
12.5.4.2 Catalyzed Hydrogen Peroxide (CHP)–Based Systems
CHP is one of the strongest oxidant systems used in environmental remediation. It involves reaction of hydrogen peroxide with a catalyst to predominantly generate hydroxyl radicals. Some CHP systems produce
nucleophiles and reductants, including superoxide and hydroperoxide (Mitchell et al. 2014). Common catalysts
include transition metals such as iron (Fenton and Fenton-like reaction) or manganese, chelated metals, and naturally occurring minerals, for example, Watts et al. (2005) and Teel et al. (2007).
Hydroxyl radicals attack the alkyl groups of both PFCAs and PFSAs, but do not attack the perfluoroalkyl chain. As a result, PFCA and PFSA precursors are transformed to PFCAs of related perfluorinated chain length (Bruton
and Sedlak 2017).
Mitchell et al. (2014) demonstrated that superoxide and hydroperoxide (which are nucleophiles and reductants generated as a reaction in CHP but are not chemical oxidants) generated in alkaline pH CHP systems mineralize
PFOA but did not elucidate a mechanism.
Bench-scale testing has been successfully demonstrated. Field deployment of hydroxyl radical-based CHP
systems may be limited due to decomposition of PFAS precursors to PFOA and other PFCAs as unreactive transformation products (Bruton and Sedlak 2017).
CHP systems that predominantly generate hydroxyl radicals partially transform PFAAs to their PFCAs of
related perfluorinated chain length, which are not further transformed (Houtz and Sedlak 2012; Bruton and
Sedlak 2017). Systems that generate superoxide and hydroperoxide have been demonstrated at the bench test
level to mineralize PFOA (Mitchell et al. 2014), but effectiveness with other PFAS is unknown.
12.5.4.3 Activated Persulfate Persulfate anion (S O 2-) is activated to generate reactive radical species, primarily sulfate radicals (2.6 volts, or
V) and hydroxyl radicals (2.7 V). Methods to activate persulfate include transition metals, high pH, and heat activation (Siegrist, Crimi, and Simpkin 2011). Hydroxyl radicals are the predominant radicals formed at high pH
conditions (Furman et al. 2011), while at acidic pH there is greater yield of sulfate radicals (Siegrist, Crimi, and
Simpkin 2011).
PFCAs are attacked by sulfate radicals under acidic conditions, initiating a decarboxylation reaction, where
cleavage of the carbon-to-carbon (C-C) bonds occurs between PFCAs and the carboxyl group (-COOH), forming
unstable perfluoroalkyl radicals (CnF2n+1) (Hori et al. 2010; Lee et al. 2012; Yin et al. 2016). A stepwise series of
decarboxylation and hydrogen fluoride (HF) elimination reactions continues to form shorter chain PFCAs until all PFCAs are mineralized to fluoride and carbon dioxide. PFSAs such as PFOS are unreactive with sulfate radicals
(Park et al. 2016; Bruton and Sedlak 2017). Hydroxyl radicals attack the alkyl groups of both PFCAs and PFSAs, but
do not attack the perfluoroalkyl chain. As a result, PFCA andnPFSA precursors are transformed to PFCAs of related perfluorinated chain length (Bruton and Sedlak 2017). Under alkaline pH conditions the sulfate and hydroxyl
radicals are reactive with the alkyl groups but similarly unreactive with the perfluoroalkyl chain, which is the
basis of the TOP method (Houtz and Sedlak 2012).
Related Ongoing Research Funded by SERDP:
• ER-2423 In Situ Treatment Train for Remediation of Perfluoroalkyl Contaminated Groundwater: In Situ Chemical Oxidation of Sorbed Contaminants (ISCO-SC)
• ER201729 Field Demonstration to Enhance PFAS Degradation and Mass Removal Using Thermally Enhanced Persulfate Oxidation Followed by Pump-and-Treat
• ER18-1545 Innovative Treatment of Investigation-Derived Waste Polluted with Per- and Polyfluoroalkyl
Substance Contaminants and Other Co-Contaminants.
268

4
3
2 4 4 2
2 8 2 3 12 40 3 4
Activated persulfate under acidic conditions has proven effective for PFOA (PFCAs) with nominal 100%
degradation, but PFOS is not transformed. Sulfate radicals and hydroxyl radicals generated by alkaline persulfate
activation transform PFCA and PFSA precursors to PFCAs of related perfluorinated chain length (Bruton and Sedlak 2017).
12.5.4.4 Sonochemical Oxidation/Ultrasound
The sonochemical process relies on the propagation of acoustic waves in liquids at frequencies ranging between
20 kHz and 1,000 kHz (Furuta et al. 2004), which results in cavitation. Operating parameters such as frequency
(Campbell and Hoffmann 2015), power density (Hao et al. 2014), solution temperature, sparge gas, and initial
concentration of PFAS (Rodriguez-Freire et al. 2015) play a significant role in the sonochemical degradation and
defluorination rate of PFAS.
Sonochemical degradation occurs via two mechanisms: localized thermal treatment and free radical destruction
(Rayaroth, Aravind, and Aravindakumar 2016). During cavitation, cyclic formation, growth, and collapse of microbubbles result in an intense increase in temperature and pressure (5000 Kelvin (K) and 2000 atmosphere
(atm)), along with the generation of free radicals (Furuta et al. 2004; Chowdhury and Viraraghavan 2009).
Sonochemical oxidation has been successfully applied for rapid degradation of PFAS to fluoride (F–), sulfate (SO 2-) and carbon dioxide (CO ). Vecitis et al. (2008) reported a complete recovery of SO 2- and >90% defluorination of
PFOA and PFOS with initial concentrations of 0.24 µM and 0.20 µM, respectively, for a field-scale application to
treat groundwater from below a landfill. At bench scale, sonolysis has been reported in the literature as one of
the most effective treatment processes for PFAS-contaminated water, because they almost immediately
mineralize to SO 2-, CO , carbon monoxide (CO), and F– after cleavage of their C-C/C-S bond. Studies have
reported >90 percent degradation and defluorination for PFOA and PFOS (Moriwaki et al. 2005; Vecitis et al.
2008; Cheng et al. 2008, 2010). Gole et al. (2018) demonstrated removal and defluorination of AFFF in a 91-L sonolytic reactor.
12.5.4.5 Photolysis/Photochemical Oxidation
A thorough review of photolysis/photochemical oxidation technology for PFAS decomposition is reported in Wang,
Yang, et al. (2017). Chen, Zhang, and Liu (2007) and Giri et al. (2011) reported removal of PFAS by direct
photolysis at 185 nm. Hori et al. (2004) and Chen, Zhang, and Liu (2007) reported that direct photolysis at 254
nm alone is not very effective because
PFAS do not absorb light at wavelengths >220 nm due to their chemical structure. Chemical reagents/catalysts
such as Fe3+, S O 2−, TiO , heteropolyacid photocatalyst (H PW O ), CO 2−, and IO − when combined with ultraviolet
(UV) (>220 nm) light can effectively decompose PFAS (Hori et al. 2005; Chen and Zhang 2006; Zhang, Pan, and
Zhou 2016; Hori et al. 2007; Wang et al. 2008; Cao et al. 2010). This is due to generation of strong and reactive
oxidative species such as OH•, H•, CO •– and PFAS-Fe complexes. Photochemical oxidation of PFAS is said to be
dependent on the light source (UV or vacuum ultraviolet), initial concentration of PFAS, environmental matrix, temperature, pH, and type of reagent used (Lin, Panchangam, et al. 2012; Giri et al. 2012; Lyu et al. 2015, a; Xu et
al. 2017).
Related Ongoing Research Funded by SERDP:
• ER18-1595 A Combined Photo/Electrochemical Reductive Pathway Towards Enhanced PFAS Degradation
• ER18-1513 Effective Destruction of Per- and Polyfluoroalkyl Substances in Water by
Modified SiC-Based Photocatalysts
• ER18-1515 A Cost-Effective Technology for Destruction of Per- and Polyfluoroalkyl Substances
from DoD Subsurface Investigation-Derived Wastes
• ER18-1599 Pilot Scale Assessment of a Deployable Photocatalytic Treatment System Modified with BiPO4 Catalyst Particles for PFAS Destruction in Investigation-Derived Wastewater
269

The major degradation pathways involved in the photochemical oxidation of PFAS are direct photolysis and
free radical reactions. The C-C bond between PFAS is cleaved with the COOH group to form perfluoroalkyl radicals (Hori et al. 2003; Hori et al. 2008), which then react with water and undergoes hydrogen fluoride elimination to
form shorter chain compounds. These then undergo hydrolysis to form subsequent shorter PFAS (losing CF2
units). During direct photolysis, the C-C and C-S bonds of PFAS are broken by photoelectrons to generate perfluoroalkyl radicals and carbon dioxide (Wang, Yang, et al.2017).
12.5.4.6 Electrochemical Treatment
Electrochemical treatment occurs via anodic oxidation; a variety of materials have been used as anodes. The
treatment effectiveness of PFOS and PFOA using different anodes can vary significantly. Most research on PFAS,
particularly PFOS and PFOA removal, has been conducted using a boron-doped diamond (BDD) electrode due to its mechanical, chemical, and thermal stability (Trautmann et al. 2015; Schaefer et al. 2017). Some other
electrodes, such as lead dioxide (PbO2), titanium oxide (TiO2), titanium suboxide (Ti4O7), and tin oxide (SnO2),
also have the ability to treat PFAS-contaminated water (Ochiai et al. 2011; Zhou et al. 2012; Zhao, Gao, et al. 2013; Liang 2017; Liang et al. 2018). Operating conditions and parameters such as pH (Lin, Niu, et al. 2012; Zhou
et al. 2012), current density, electrolyte type (Song et al. 2010; Zhuo et al. 2012), electrode distance (Lin, Niu, et
al. 2012), initial PFAS concentration, and temperature are important factors that influence electrochemical oxidation of PFAS (Niu et al. 2016).
Electrochemical treatment proceeds via direct and indirect anodic oxidation (Radjenovic and Sedlak 2015; Niu et
al. 2016; Schaefer et al. 2018). In direct electrolysis, contaminants are adsorbed onto and degraded directly at the electrode, while in indirect electrolysis, contaminants are degraded in the bulk liquid in reactions with oxidizing
agents (that is, hydroxyl radicals) formed at the electrode (Radjenovic and Sedlak 2015).
Bench-scale studies have shown success in the degradation and defluorination of PFAS, including short-chain,
long-chain PFAAs as well as PFAA precursors (Chiang 2018). Electrochemical oxidation of precursors may lead to the transient generation of perfluorinated carboxylates (Schaefer et al. 2018). Ultimately, fluoride is released,
with typical recoveries ranging from 60 to 80%; the fate of the remaining fluoride is unknown, but studies have
suggested that losses due to volatile perfluorinated alkanes may occur. Currently, technology has not been tested for PFAS-laden water with low PFAS concentrations. However, it has been tested as a stand-alone technology
for PFAS concentrations at ppb levels and as a destruction technology to destroy concentrated PFAS waste
streams generated from other treatment technologies such as ion exchange resin and ozofractionation (Liang et al. 2018; Chiang 2018). It has been partially demonstrated as an ex situ treatment of PFAS. But in situ
application is also being considered and funded in the SERDP program. The issue of perchlorate formation as a
byproduct during electrochemical oxidation of PFAS has been addressed by Schaefer et al. (2017) using a biological treatment polishing step. The issue can also be minimized by not using sodium chloride as the
electrolyte (Chiang 2018).
The technology has been demonstrated via bench studies and pilot-scale reactor to be very effective for
treatment of short- chain, long-chain PFAAs, as well as most commonly detected PFAA precursors in spike water systems and several remediation-derived waste streams laden with high PFAS concentrations.
270

Related Ongoing Research Funded by SERDP:
• ER-2424 Investigating Electrocatalytic and Catalytic Approaches for In Situ Treatment of Perfluoroalkyl Contaminants in Groundwater
• ER-2718 Synergistic Treatment of Mixed 1,4-Dioxane and PFAS Contamination by Combining Electrolytic
Degradation and Electrobiostimulation
• ER18-1320 Electrochemical Oxidation of Perfluoroalkyl Acids in Still Bottoms from Regeneration of Ion
Exchange Resins
• ER-2717 A Novel Reactive Electrochemical Membrane System for Treatment of Mixed Contaminants
• ER18-1491 Reactive Electrochemical Membrane (REM) Reactors for the Oxidation of Perfluoroalkyl
Compound Contaminated Water
12.5.4.7 Solvated Electrons (Advanced Reduction Processes)
Advanced reduction processes (ARP) has been investigated for the reductive degradation of groundwater
contaminants. ARP involves the combination of activation methods such as ultrasound, ultraviolet, microwaves,
and electron beam with reducing agents (reductants) such as ferrous iron, sulfide, sulfite, iodide, and dithionite
to generate very reactive reducing radicals and the hydrated electrons (e−aq) that mineralize contaminants to less toxic products (Vellanki, Batchelor, and
Abdel-Wahab 2013). The reducing hydrogen radical (H•) and the hydrated electron are strong reductants that
react easily with halogenated organic compounds (Buxton et al. 1988). ARP-induced degradation rates depend on
initial solution pH and reductant concentration (Vellanki, Batchelor, and Abdel-Wahab 2013). Bentel et al. (2019) described insights gained from a structure-activity relationship analysis of the mechanisms involved in the reaction
of solvated electrons with PFAS.
The degradation pathway of PFAS using ARP differs from that of oxidizing agents in that the hydrated electron
(Song et al. 2013) cleaves the C-F bond adjacent to the functional group of the PFAS rather than the C-C or C-S
bond. Qu et al. (2014) proposed that hydrated electrons lead to the reductive cleavage of the C-F bonds, resulting in fluorine elimination from PFOA. Furthermore, they proposed that under UV irradiation, cleavage of the C-C bond
between the COOH group and the perfluoroalkyl group occurred as shorter chain intermediates were detected in
solution. Qu et al. (2014) therefore concluded that two reactions are responsible for the reductive defluorination of PFOA: (1) direct photolysis by UV irradiation, and (2) photoreduction by hydrated electrons.
Reductive processes have proven feasible for degradation of most PFAS, especially PFOS. It should be
recognized that electrons will be scavenged by oxygen, nitrate, and chlorides, and this should be considered
for treatment application. Recent research using UV-activated sulfite demonstrated effective generation of
hydrated (aka solvated) electrons.
Laboratory tests showed >50% defluorination of both PFOS and PFOA within 24 hours (Strathmann 2018).
Related Ongoing Research Funded by SERDP:
• ER-2426 Quantification of In Situ Chemical Reductive Defluorination (ISCRD) of Perfluoroalkyl Acids in Ground Water Impacted by AFFFs
• ER18-1526 Complete Reductive Defluorination of Poly- and Perfluoroalkyl Substances (PFASs) by Hydrated Electrons Generated from 3-Indole-acetic-acid in Chitosan-Modified Montmorillonite
271

2 2 2 2 3
12.5.4.8 Plasma Technology
Plasma technology is a promising destructive PFAS treatment technology. Plasma is formed as a result of an
electrical discharge from the addition of sufficient energy to gas (Jiang et al. 2014) and is classified into two
major groups based on temperature and electronic density: thermal plasma (local thermal equilibrium) and
nonthermal plasma (nonequilibrium plasma) (Bogaerts 2002). Due to lower energy requirements and selectivity, nonthermal plasma is most often used in water treatment processes (Jiang et al. 2014). In water treatment
plasma applications, electrical discharges can be discharged above the liquid surface, directly to the liquid, or in
the form of bubbles in liquids (Locke, Lukes, and Brisset 2012) (Stratton et al. 2017). These electrical discharges
diffuse in liquids to initiate various chemical and physical effects, including high
electric fields, intense UV radiation, shock waves, and formation of strong oxidative and reductive reactive
species (H•, O•, OH•, H O aqueous electrons, H , O , O ), which are effective for the treatment and removal of
contaminants (Lukes, Appleton, and Locke 2004; Lukes et al. 2005; Stratton et al. 2017).
Determination of plasma treatment mechanisms and degradation pathways for PFAS is currently a research focus, and several mechanisms and pathways have been proposed. Takeuchi et al. (2013) proposed that the
main reaction pathway for PFOA by plasma treatment is by thermal cleavage of the C-C bonds resulting in direct
decomposition to gaseous products without formation of shorter chain PFCAs. Others have proposed that PFAS decomposition is due to conversion to unstable radicals during interaction of PFAS with the most energized ions in
the plasma (Hayashi et al. 2015; Obo, Takeuchi, and Yasuoka 2015), or with positive ion(s) generated by the
plasma (Yasuoka, Sasaki, and Hayashi 2011) at the bubble gas-liquid interface. The unstable radicals produced during PFAS decomposition can result in a sequential loss of one carbon within the chain.
Plasma effectively degrades PFAS in a relatively short period of time (30-minute treatment) in both synthetic water
and groundwater. It has been reported that plasma treatment provided 90% degradation of PFOA and PFOS, with
only about 10% of the destroyed PFOA and PFOS being converted to shorter chain PFAAs (Stratton et al. 2017).
The degradation rate is not affected by the presence of co-contaminants. This is an environment-friendly
technology, because there is no demand on pressure or temperature and it does not require significant input of chemicals. Plasma also generates a broad range of reactive species.
Related Ongoing Research Funded by SERDP:
• ER18-1306 Combined In Situ/Ex Situ Treatment Train for Remediation of Per- and Polyfluoroalkyl Substance (PFAS) Contaminated Groundwater
• ER18-1624 Plasma Based Treatment Processes for PFAS Investigation-Derived Waste
• ER18-1570 Application of Non-Thermal Plasma Technology for the Removal of Poly- and Perfluorinated Substances from Investigation-Derived Wastes
• ER18-5015 Removal and Destruction of PFAS and Co-contaminants from Groundwater
272

12.5.4.9 Zero-Valent Iron (ZVI)/Doped-ZVI
ZVI is an inexpensive groundwater remediation technology. It is the most commonly used reductant for in situ groundwater remediation. It is a strong reducing agent capable of successfully reducing major groundwater
contaminants such as chlorinated solvents. Recently nanoscale zero-valent iron (nZVI) has had increased
attention due to its higher reactivity, surface area, and potential in situ injectability compared to the micro-sized ZVI.
In general, the removal of PFAS by ZVI in reductive processes involves the mass transfer of contaminants to the
ZVI surface, and their adsorption and reaction (transformation of contaminants into less toxic/nontoxic species) on the ZVI surface, followed by the desorption and mass transfer of byproducts into solution (Arvaniti et al. 2015).
Because the reduction of contaminants by ZVI is a surface-mediated electron transfer process, the surface
properties of ZVI influence contaminant reactivity.(Arvaniti et al. (2015)) found that PFOS removal using Mg-aminoclay-coated nZVI occurred via adsorption of PFOS to the ZVI surface followed by reduction. A similar
decomposition mechanism for PFOS using ZVI in subcritical water was reported by Hori et al. (2006), who
suggested that adsorption of PFOS onto ZVI played a major role in PFOS decomposition, as fluoride was detected in the treatment solution after treatment.
This technology is highly effective for the removal of PFOS, reacts relatively quickly, and has proven feasible for
degradation of most PFAS.
12.5.4.10 Alkaline Metal Reduction
Alkaline metal reduction involves the use of alkali metals (that is, the reductant) to reduce organic compounds to
their anion radical. Reductive degradation of branched PFOS has been reported with vitamin B12 as a catalyst and Ti(III)-citrate or nanosized zero-valent zinc as a bulk reductant (Ochoa-Herrera et al. 2008; Park, de Perre, and
Lee 2017) where degradation rates increase with increasing solution pH, bulk reductant dose, and temperature.
The degradation pathway of PFAS by alkali metal reduction as postulated by Ochoa-Herrera et al. (2008)
suggests that destruction of branched PFOS isomers occurs via chemical reductive dehalogenation. Park, de Perre, and Lee (2017) suggested that the ability of vitamin B12 to reduce branched PFOS isomer and not linear
is because the branched PFOS isomers possess greater electron density differences that are absent in linear
PFOS isomers. Bench-scale studies have shown success for branched PFOS isomers and have proven to be
efficient (greater than 70% removal; see Ochoa-Herrera et al.
(2008)). In situ applications have not been tested. Removal and defluorination are lower for PFHxS relative to PFOS. Polyfluorinated sulfonate intermediates (C5-C8) are the final products (Park, de Perre, and Lee 2017).
12.5.5 Biodegradation Summary
A limited number of studies have tested microbial degradation of PFAS and many conflicting reports exist, all suggesting that more work needs to be performed to fully understand the biotic transformations of these
compounds.
Microbial degradation of PFAS has been observed to occur only with polyfluoroalkyl substances (Butt, Muir, and Mabury 2014), which contain some carbon-hydrogen bonds instead of C-F bonds (Buck et al. 2011). Recent
research documented the aerobic biotransformation of fluorotelomer thioether amido sulfonate (FtTAoS) over a
40-day period to produce 4:2, 6:2, and 8:2 fluorotelomer sulfonate (FTS), 6:2 fluorotelomer unsaturated carboxylic acid (FTUCA), 5:3 fluorotelomer carboxylic acid (FTCA), and C4 to C8 perfluorinated carboxylic acids (Harding-
Marjanovic et al. 2015). An unintended consequence of biologically mediated transformations is the conversion of
precursors (polyfluorinated) to perfluorinated compounds.
273

PFOA and PFOS have been shown to be resistant to microbial biotransformation under a variety of growth
conditions (Liu and Mejia Avendaño 2013). However, other PFAS, including chemicals in AFFF with nonfluorinated alkyl groups (polyfluorinated substances), are likely amenable to biotransformation. Most recently, defluorination of
PFOA and PFOS were observed using an ammonium oxidizing autotroph (Huang and Jaffé 2019). Upon addition of
PFOA or PFOS (0.1 mg/L and 100 mg/L, respectively) to the A6 culture, shorter chain perfluorinated products and
acetate were observed. Incubations with hydrogen as a sole electron donor also resulted in the defluorination of up to 60% of PFOA and PFOS during 100-day incubations, while total fluorine (organic plus fluoride) remained
constant. Reductive defluorination of perfluoroalkyl substances may be possible, as observed when using
vitamin B12 and Ti(III)-citrate (Ochoa-Herrera et al. 2008). There are no known reports of biotransformation occurring under aerobic and anaerobic conditions.
A limited number of studies have tested microbial degradation of PFAS and many conflicting reports exist, all
suggesting that more work needs to be performed to fully understand the biotic transformations of those
compounds.
Research on the fungal degradation of PFAS has been ongoing due to the wide spectrum of substrate reduction
catalyzed by extracellular ligninolytic enzymes. Experiments with white-rot fungus showed limited degradation of PFOA in microcosm studies under certain conditions (Tseng 2012). The innovative delivery of fungal enzymes
for PFAS treatment requires further research.
The biodegradation of PFAS has been reported in
a few studies as described above and in the following: 8:2 FTOH (Wang et al. 2009), 6:2 FTOH
(Liu, Wang, et al. 2010), 6:2 FTSA (Wang et al.
2011), and N-ethyl perfluorooctane sulfonamidoethanol (Rhoads et al.
2008; Rhoads et al. 2013). Recently the PFOA-
degrading strain YAB1 was isolated from soil that had been impacted by perfluorinated compounds
through acclimation and enrichment culture, where
perfluorooctanoic acid (PFOA) was amended as the sole carbon source (Yi et al. 2016). This strain
was preliminarily identified as Pseudomonas
parafulva based on colony morphology, physiological and biochemical features, and 16S
rRNA gene sequencing. Using shaking flask
fermentation, the maximum tolerable concentration of YAB1 on PFOA was found to be 1,000 mg/L, and
the optimal PFOA concentration for the growth of
YAB1 was 500 mg/L. After 96 hours of culture, the PFOA degradation rate was 32.4%. When 1 g/L
glucose was added to the inorganic salt culture
medium, the degradation rate increased to 48.1%.
Glucose was the best exogenous carbon source for the degradation of PFOA (Yi et al. 2016).
Related Ongoing Research Funded by SERDP:
• ER-2422 Bioaugmentation with
Vaults: Novel In Situ Remediation Strategy for Transformation of
Perfluoroalkyl Compounds
• ER-2127 Remediation of Perfluoroalkyl Contaminated Aquifers using an In Situ
Two-Layer Barrier: Laboratory Batch and Column Study
274

12.5.6 High-Energy Electron Beam (eBeam)
High-energy electron beam (eBeam) is a high efficiency, flow-through, nonthermal, chemical-free technology that
utilizes electron accelerators to generate large numbers of highly energetic electrons from electricity (Cleland 2011;
Pillai and Shayanfar 2016). The technology has been commercialized globally for pasteurizing foods, sterilizing medical devices, cross- linking polymers, and eliminating insects and pests from fresh produce (Cleland 2011; Pillai
2016; Pillai and Shayanfar 2016; Zembouai et al. 2016). It provides a form of ionizing irradiation that does not
involve the use of radioactive isotopes. The amount of energy from eBeam that is absorbed by an irradiated material per unit mass is called dose. The absorbed dose during eBeam treatment depends on the type and
thickness of the material, the beam power, and the length of time the material is exposed to the electron beam
(Waite 1998).
eBeam is applicable for use on soil and liquid matrices for many purposes: disinfection of sewage sludge
(Praveen et al. 2013; Waite 1998); remediation of heavy hydrocarbon-contaminated soils (Briggs 2015); and remediation of volatile organic compounds (VOCs) and semivolatile organic compounds in liquid wastes such as
groundwater, wastewater, and landfill leachate (USEPA 1997). During irradiation of water, three primary
reactive species are formed: solvated electrons and hydrogen radicals, which are strong reducing species, and hydroxyl radicals, which are strong oxidizing species. This creates both advanced reduction and oxidation
processes without the addition of any chemicals. The absolute concentration of radicals formed during
irradiation is dose- and water quality-dependent, but it has been measured at greater than millimolar (mM) levels
in potable, raw, and secondary wastewater effluent (Waite 1998).
Researchers at Texas A&M University recently
demonstrated defluorination of PFOA in aqueous samples by eBeam technology (Wang et al. 2016).
The study measured defluorination efficiency as a
functionof molar concentration of free fluoride ions
and initial molar concentration of PFOA to be
treated. Final defluorination efficiencies ranged
from 34.6 to 95% under various increasing
concentrations of nitrate, alkalinity, and fluvic acid.
The defluorination is possibly due to the formation of aqueous electrons and the formation of
secondary radicals (Wang et al. 2016). An
additional study further demonstrated eBeam-mediated defluorination of PFOS and PFOA with
decomposition efficiencies of 95.7% for PFOA and
85.9% for PFOS in an anoxic alkaline solution (pH =
13). Radical scavenging experiments indicated that the aqueous electron and hydrogen radical were
important in the eBeam degradation of PFOA and
PFOS (Ma et al. 2017). Further evaluation of this technology for treating other PFAS (polyfluorinated
precursors and other long- and short- chain
PFAAs) in soil and water, as well as testing over a range of concentrations, will be necessary to
further understand treatment performance potential
and to identify any deleterious byproducts.
•
275

12.5.7 Surface Activation Foam Fractionation
The surfactant nature of PFAS make them prone to accumulation at surface interfaces. Surface activation foam
fractionation (SAFF) is a process that generates fine air bubbles rising through a narrow water column. PFAS that
accumulate at the top of the column as foam are vacuumed off for separate disposal. Using hundreds of columns,
PFAS is progressively stripped out until drinking water standards have been achieved. The process reduces the
volume of PFAS-contaminated water. The base technology was developed and built in Australia and is currently
operating at full-scale for the Australian Department of Defence, Army Aviation Centre Oakey (AACO) base near Toowoomba, Queensland. The AACO water treatment plan was commissioned on May 13, 2019 and treats 66,000
gpd.
A small one-day field trial in Williamtown, New South Wales, has also been applied in situ in an existing downhole groundwater monitoring well using compressed air introduced at the base of the well and harvesting of PFAS-
rich foam at the top of the well (Phillips et al. 2018). This trial demonstrated that >C6 PFAS molecules could be
removed from the treatment well annulus where hydrogeology could replenish the treatment well with a continuous supply of impacted groundwater. Further research to optimize the downhole foam fractionation
engineering design is warranted.
12.5.8 Deep Well Injection
A potential alternative to treatment may be the use of on-site or off-site underground injection waste disposal
wells for liquids containing PFAS. This approach eliminates discharges to surface water and groundwater, which
could be a consideration given the present climate of varying discharge limitations for PFAS. Class I wells, as
defined by USEPA, are acceptable for both hazardous and nonhazardous liquid wastes (USEPA 2019). The USEPA has published guidance on the requirements for the use of injection wells, which include siting,
construction, operation, monitoring, testing, record keeping, reporting, and closure (USEPA 2019). The USEPA has
also studied the risks associated with underground injection wells (USEPA 2001), and these risks should be considered for the use of underground injection wells for PFAS-laden water. This option may be most attractive as
a disposal option for high concentration liquids, such as RO reject water, anion exchange regeneration fluids,
wastewater from manufacturing sites, and landfill leachate.
276

12.6 Limited Application and Developing Solids Treatment Technologies
The treatment technologies presented in this document are provided in a hierarchy defined in Section 12.1,
based on level of implementation and level of confidence in the technology from peer-reviewed literature and
extent of documented performance. The three development levels include field-implemented technologies, limited application technologies, and developing technologies. Where appropriate in the text both in situ and ex
situ technologies are discussed. However, it is not always clear if a limited application or developing technology
may be effective in situ, ex situ, or both, thus further distinction between in situ and ex situ is not made in this
section. Table 12-2 (provided as separate PDF) presents limited application and developing technologies for solids, which may be applicable to soil, sediments, biosolids, or other solid media, including PFAS-laden materials
(for example, GAC, resin, scrubbers, filters). Thermal treatment warrants further discussion as a limited
application technology because it has been field-demonstrated at multiple sites by multiple practitioners but has not been well documented in peer-reviewed literature.
12.6.1 Sorption and Stabilization/Solidification
Limited application and developing materials being demonstrated or developed for sorption and stabilization
include minerals (for example, organically modified clays) or stabilization agents (for example, Portland cement). Stabilization/solidification through mixing with cementitious materials (for example, Portland cement or other
amendments) can be applied to encapsulate PFAS-impacted soil/sediment to restrict PFAS leaching or migration.
In situ solidification is always performed with soils in place, and it is necessary to use specialized equipment and maintain careful control over the addition of amendments and water content. In situ solidification is intended to
yield a high-compressive-strength monolith that has low permeability. A bench-scale study (Sörengård, Kleja, and
Ahrens 2019) indicated that solidification using a binder (combination of Portland cement, fly ash, and ground granulated blast-furnace base slag) at a ratio of 9:1 reduced leaching for 13 out of 14 PFAS (except for PFBS).
Introducing additional additives (for example, activated carbon, surface- modified clays) at a 2% concentration can
further reduce leaching of PFAS in solidification-treated soil.
12.6.2 Thermal Treatment
Thermal treatment is defined as mobilization or destruction, or both, of chemicals using heat. This can be
accomplished by thermal desorption or thermal destruction. Heat is applied directly to the PFAS-contaminated soil/sediment.
Ex situ thermal treatment has been demonstrated (450–954°C) at field pilot-scale studies by a few technology vendors and is considered a partially demonstrated technology (Endpoint Consulting 2016; Enviropacific 2017;
Colgan et al. 2018; Grieco and Edwards 2019). The effectiveness depends upon the ability to deliver heat to
achieve sufficient and evenly distributed temperature at field scale cost-effectively. The pilot studies conducted
have reported >90% removal of PFAS from soil when high heat has been applied.
In addition, lower temperature thermal desorption has been demonstrated to be effective for PFAS at 350–400°C on the bench scale. During a recent proof of concept laboratory bench test, 99.99% removal of PFAS from soils
was demonstrated while heating the target volume to 400°C (Crownover et al. 2019; DiGuiseppi, Richter, and
Riggle 2019).
No documented examples of in situ thermal treatment for PFAS-impacted soil have been identified. However,
the ex situ testing at 350–400°C suggests that these temperatures are sufficient for desorption of PFAS and
therefore in situ treatment is potentially feasible for PFAS. In situ thermal treatment for PFAS is an energy-
intensive treatment method. Its environmental footprint includes the energy source and consumption during
treatment system operation, as well as manufacturing and installation of heating system materials.
277

At bench, pilot, and field scales, limited data sets are available and data gaps still exist mainly regarding fate of
PFAS and air emissions (Lassen et al. 2013; USEPA 2020). Another concern is the volatilization of hydrogen fluoride, which could pose serious health and safety issues and could compromise equipment components.
Hydrofluoric acid and other non-PFAS off- gas concerns can be managed through conventional off-gas
treatment systems (scrubbers). Although air emissions from the thermal treatment of PFAS have not been
thoroughly studied at the field scale to date, PFAS destruction via high temperature air incineration and subsequent acid-gas scrubbing is a common practice during carbon reactivation (Mimna 2017).
Related Ongoing Research Funded by SERDP:
• ER18-1501 Hydrothermal Technologies for On-Site Destruction of Site Investigation Wastes
Contaminated with Per- and Polyfluoroalkyl Substances (PFASs)
• ER18-1556 Small-Scale Thermal Treatment of Investigation-Derived Wastes (IDW) Containing Per- and
Polyfluoroalkyl Substances (PFAS)
• ER18-1572 Evaluation of Indirect Thermal Desorption Coupled with Thermal Oxidation (ITD/TO) Technology to Treat Solid PFAS-Impacted Investigation-Derived Waste (IDW)
• ER18-1593 Demonstration of Smoldering Combustion Treatment of PFAS-Impacted Investigation-Derived Waste ER18-1603 Field Demonstration of Infrared Thermal Treatment of PFAS-Contaminated
Soils from Subsurface Investigations
278

12.7 Integrated Remedial Solutions
The information above focuses on in situ and ex situ technologies available to treat (that is, destroy, stabilize, or
remove) PFAS in water and soil. There are also nontreatment remediation approaches that may be employed at
PFAS sites, including source zone or plume containment or mass flux reduction, excavation and off-site disposal, underground injection, and institutional controls. These approaches can be used alone or together with
one or more treatment methods. This discussion provides some examples of remedial strategies that
incorporate multiple approaches.
12.7.1 Combined Technologies for Treatment of PFAS and Co-Contaminants
In a drinking water context, PFAS removal may be an isolated treatment objective without interference from co-
contaminants; treatment may include a single technology such as GAC. However, for groundwater remediation, particularly associated with PFAS release/source areas, PFAS compounds are typically present with other
contaminants. For example, plumes emanating from former fire training areas may consist of PFAS in addition to
petroleum hydrocarbons and chlorinated solvents that require different treatment approaches. Natural
groundwater geochemistry, such as high metals or organic carbon concentration, can reduce PFAS treatment
technology effectiveness and efficiency. A combined remedy approach, using multiple technologies
simultaneously or in series, is generally required to optimize PFAS removal in these situations.
For example, McGregor (2018) documented a case study in which CAC was successfully injected to mitigate the mass flux of PFOS and PFOA from a source zone at a site in Ontario. At the same time, a slow-release oxygen
amendment was injected to facilitate the aerobic biodegradation of petroleum hydrocarbons that co-occurred
with PFAS in one part of the site. This is also an example of applying combined remedies in different areas of
the site.
In some cases, the remediation of co-contaminants has affected the fate of PFAS compounds in plumes.
Precursor compounds may be transformed in situ to PFCAs or PFSAs through aerobic biological transformation or
transformed in situ to PFCAs through chemical oxidation. For example, (McGuire et al. 2014) presented a case study of an AFFF release site where oxygen infusion is believed to have resulted in accelerated transformation of
precursors to PFHxS and PFCAs in part of the plume. This indicates that it is important to consider the potential
influence of co-contaminant remediation on PFAS transformation or transport.
12.7.2 Addressing Source Areas and Plume with Multiple or Combined Remedies Using Multiple Types of Treatment Alternatives
It may be necessary at some sites to address both mass flux from source areas into groundwater and to
contain or control plume migration.
The most commonly used plume containment alternative for PFAS plumes involves groundwater extraction with
ex situ treatment. Options for reduction in mass flux leaving a source zone are partly discussed in the (ITRC 2008) Enhanced Attenuation of Chlorinated Organics guidance manual, although many of these are applicable to
PFAS sites also. Mass flux reduction strategies for PFAS sites may include:
• injecting CAC to mitigate flux from the source zone (McGregor 2018), or at one or multiple locations within a groundwater plume
• capping part of a site to reduce infiltration through a PFAS source zone above the water table
• excavating shallow soil (although this may not have much benefit if there is a PFAS source zone below the depth of excavation)
• engineering management of surface water runoff to mitigate nonpoint sources at or upgradient of a
site (ITRC 2018)
• upgradient interception/diversion of groundwater to reduce the flux through a source zone below the
water table.
279

12.7.3 Combined Technologies for Efficient PFAS Treatment
Because ultimate destruction of PFAS requires high-energy processes, combining practices that concentrate
PFAS followed by destruction offers an opportunity for more efficient and cost-effective treatment. Examples
of concentration processes that enable follow-on destruction include, but are not limited to:
• pump and treat using a regenerable ion exchange resin
• foam fractionation
• membrane separation
• reverse osmosis
Examples of destructive processes that are able to destroy separated waste, many of which are under
development or have had limited application to date, are provided in Sections 12.5.4 and 12.5.6. Incineration is
an example of another destructive technology which is a demonstrated full-scale application, though incineration
has received recent attention due to possible incomplete combustion and/or by-product generation and is the topic of current study to better understand the fate of PFAS, see Section 12.4.
280

12.8 Sustainability of PFAS Treatment
Federal and state environmental protection agencies have published myriad green remediation best
management practice fact sheets and guidance documents covering a variety of remediation topics and emphasizing the minimization of environmental cleanup footprints (USEPA 2012, 2018), including methods to
quantify the environmental footprint (USEPA 2019). The best management practice fact sheets for excavation
and surface restoration, implementing in situ thermal technologies, and (more generally) materials and waste
management may offer supplemental sustainability information to that already included alongside the
remediation technologies presented within this section (USEPA 2008, 2012, 2013).
Applying such a framework for PFAS cleanup projects, the environmental impact drivers for PFAS cleanup
technologies that should be considered include the life cycle environmental footprint of all facets of the cleanup,
including project site preparation; installation of the remedy; materials, equipment, and energy used to operate the remedy; waste materials generated by the cleanup technology; and demolition and deconstruction of the
remedy. In alignment with greener cleanups, green and sustainable remediation recommends the “the site-
specific employment of products, processes, technologies, and procedures that mitigate contaminant risk to receptors while making decisions that are cognizant of balancing community goals, economic impacts, and
environmental effects” (ITRC 2011, 2011, p. 3). Economic and quality of life impacts to the community can be
alleviated by early incorporation of green and sustainable remediation best management practices, including
meaningful stakeholder engagement, creation of employment opportunities, and advancement of the local community’s skill set to help manage treatment systems and public outreach (USEPA 2012).
Lastly, climate change vulnerability and adaptation measures of remedial technologies should also be considered
to ensure resiliency in the implemented remedial action (USEPA 2013, 2014).
In alignment with sustainability principles, performance of early and meaningful risk communication can assist professionals in raising the community’s awareness of environmental hazards, empowering community
participation in risk reduction measures, and increasing the quality of life for the community impacted by
contamination and related risk management activities (USEPA 2007). Several environmental and public health
regulatory agencies have prepared information documents to assist professionals in performing effective risk
communication for PFAS sites, for example, see ATSDR (2018).
In addition, a communication plan can be developed to assist with information dissemination and stakeholder engagement (Emmett et al. 2009). Section 14 provides further in-depth guidance on risk communication planning
and performance. A risk communication toolbox is also being developed to help decision makers through the
planning process and provide tools to assist with meeting performance metrics at each planning step. Additional guidance on stakeholder concerns and engagement is provided within this document in Section 13.
281

12.9 Improving Evaluation of PFAS Treatment Technologies
Significant effort has been completed with respect to reviewing and compiling comparative information on PFAS
treatment technologies. In a number of instances, proponents of innovative treatment technologies have claimed
success in removing or destroying PFAS with limited confirmation of performance. For example, removal
mechanisms may not have been proven, byproducts may not have been measured, and the effect of the
technology in actual environmental matricies, at environmentally relevant concentrations, on PFAS mixtures, or
with co-contaminants present may be unknown.
To guide future assessments and investments in developing PFAS treatment technologies, a SERDP project has
prepared suggested lines of evidence, recommended metrics, and decision tools to assess the effectiveness of
PFAS treatment technologies. These lines of evidence and decision-making tools can be used to identify
priorities and next steps to advance a given technology, assess whether a technology is ready for field demonstration, and identify key areas of uncertainty regarding technology performance.
Further SERDP-funded work (ER18-5053) is focused on developing a comprehensive assessment framework for ex situ PFAS treatment technologies and generating data to compare established and emerging approaches
on a life cycle assessment and costing basis.
Related Ongoing Research Funded by SERDP:
• ER18-1633 Lines of Evidence to Assess the Effectiveness of PFAS Remedial Technologies
• ER18-5053 Evaluation and Life Cycle Comparison of Ex Situ Treatment Technologies for Per- and Polyfluoroalkyl Substances (PFASs) in Groundwater
Updated May 2021.
282

13 Stakeholder Perspectives
This section identifies the concerns of stakeholders who have been or may be affected by PFAS contamination.
In this section, we summarize many of the concerns that have been expressed by local communities, tribes, and environmental groups. Evaluation of exposure levels and potential human health consequences are of
paramount concern to stakeholders.
Section Number Topic
13.1 Stakeholder Concerns
13.2 Specific Tribal Stakeholder Concerns
13.3 Stakeholder Resources
The term “stakeholder” is defined broadly by ITRC as members of environmental organizations, community
advocacy groups, tribal entities or other citizens’ groups that deal with environmental issues, or a concerned citizen who is not a member of any organization or group. Public stakeholders, such as advocacy groups, often
speak for the communities that are affected by environmental issues. In this document, a differentiation is made
between public stakeholders and interested parties (responsible parties, state regulators, and owners and
operators of contaminated sites).
Stakeholders share greater ownership of outcomes when they can influence site characterization, remedy
selection, and long-term site management. Because PFAS compounds are so abundant in consumer products, stakeholders are also concerned with the production and eventual use of these products and are
seeking safer alternatives and sometimes outright bans. Environmental regulators and responsible parties
also benefit from informed, constructive stakeholder involvement because it can help them make better
decisions, reduce the likelihood of costly, time-consuming repeated work, and allow those in affected
communities to have a voice in governing the long-term use of land, water, and other resources. Often,
stakeholders such as long-time residents have unique site knowledge as well as a major stake in the
remedial outcome.
Developing site-specific characterization and remediation strategies for communities and tribal organizations
can be controversial, because there are many misconceptions about PFAS. The lack of scientific knowledge about many of these PFAS compounds will be an impediment for educating the public. Therefore, early and
effective community engagement emphasizing timely access to test data, transparency, and responsiveness
is imperative. Community engagement may be able to address many stakeholder concerns and help to
communicate risks. The ITRC Risk Communication Toolkit for Environmental Issues and Concerns includes information about stakeholder engagement and is published as a separate document.
This section identifies the concerns of stakeholders who have been or may be affected by PFAS contamination.
Because it is an emerging contaminant and has been detected in ecological receptors (animals and plants) and
blood serum in many humans, there are many individuals who are potentially affected worldwide.
In this section, we summarize many of the concerns that have been expressed by local communities, tribes, and
environmental groups. Evaluation of exposure levels and potential human health consequences are of paramount concern to stakeholders. The list of concerns below is not all inclusive, as developments in science
and identification of contaminants in the environment are likely to lead to additional concerns. This list was
developed from general research on PFAS, direct communication and involvement with environmental and community groups, a consultant for one of the tribes, and extensive review of news reports. It is intended to
highlight the concerns that have been expressed by various groups. It is not intended to be a definitive statement
of the technical merits of those concerns.
283

The following is a list of the concerns that have been identified. Detail of these concerns follows.
• Lack of advisories for thousands of PFAS compounds
• Desire for one standard or screening level for PFAS compounds
• Lack of advisory standards or screening levels for PFAS in environmental media other than drinking water
• Lack of advisory standards for human consumption of food
• Lack of occupational standards
• Lack of ecological risk guidelines
• Lack of comprehensive monitoring information
• Precautionary approach
• Safety of short-chain substitutes
• AFFF release sites and Unused AFFF disposal
• Duty to warn AFFF responders
• Limitations in sampling and analysis methods
• Limited programs for health monitoring and blood testing
• PFAS in food packaging
• Potential PFAS contamination in recycling and compost
• Lack of disclosure by product manufacturers
• Lack of disclosure of information on the health effects of
PFAS Responsibility for sampling and treatment on
private property
• Lack of scientific evidence that current PFAS cleanup methods and remedies are fully protective of human and ecological health and prevent toxic emissions
• Stormwater discharges that may contain PFAS
Psychological effects
• Economic consequences of local PFAS contamination
Stakeholders who use this document should consider that much of the information is very technical.
Nevertheless, it aims to lay a framework by which to understand this set of compounds, the foundational nature of the science, and many of the uncertainties.
284

13.1 Stakeholder Concerns
13.1.1 Lack of Advisories for Thousands of PFAS Compounds
As of September 2019, USEPA has set health advisories for only two of the over 4,000 PFAS compounds: PFOA
(perfluorooctanoic acid) and PFOS (perfluorooctane sulfonate). The lifetime health advisory has been set at 70
nanograms per liter (ng/L or parts per trillion) for the combined concentrations of PFOA and PFOS in drinking water. The health consequences of many PFAS compounds remain uncertain. Firm conclusions relating individual
PFAS compounds to specific health outcomes remain elusive (Guelfo et al. 2018).
13.1.2 Desire for One Standard or Screening Level for PFAS Compounds
Many stakeholders believe that PFAS should be treated as a class of chemicals, similar to how PCBs or dioxin are
currently regulated. Given the lack of toxicological information for the vast majority of PFAS, when even less is
known about the potential additive and synergistic effects associated with PFAS mixtures, many stakeholders
support testing for total PFAS as the preferred screening method, rather than limited compound-specific testing
using target analyte lists (CSWAB 2018). For example, the Conservation Law Foundation in New England put forth a petition requesting that PFAS in drinking water be regulated as a group with a treatment technique drinking water
standard. See https://www.nhpr.org/post/activists-ask-new-england-states-regulate-pfas-chemicals-class#stream/0
and https://www.mass.gov/lists/pfas-information-a-petition-for-rulemaking-to-establish-a-treatment-technique-drinking-water. However, many PFAS, like certain fluoropolymers, need significantly less toxicological information
because of their inability to enter cells to cause adverse effects (Henry et al. 2018).
13.1.3 Lack of Advisory Standards or Screening Levels for PFAS in Environmental Media other than Drinking Water
With the exception of regional soil screening levels for PFOS, PFOA, and PFBS, there are no federal standards or screening levels for monitoring environmental media (air, soil, and surface water and groundwater not used
for drinking), and no federal requirements that compel such monitoring. USEPA is planning to develop interim
recommendations regarding groundwater for PFOS and PFOA. USEPA is planning to develop interim cleanup recommendations to address groundwater contaminated with PFOA and PFOS. Section 8 includes information
about regulations, guidance, and advisories for PFAS. There are few limits by the federal and most state
governments on PFAS in biosolids being applied to land for food and/or nonfood crops, nor on concentrations
in surface water that may affect fish and consumers of fish. PFAS, including PFOA and PFOS, have been detected in biosolids produced at a wastewater treatment plant (WWTP), and in soil, surface waters, and
leachate from landfills. WWTP sludge is commonly applied to land as a soil amendment. Botanical uptake by
crops such as corn, hay, and soybeans is suspected. Section 5.6 and Section 6.5.1 discuss plant uptake of
PFAS. In addition, PFAS in surface water also creates an exposure pathway that potentially affects ecological and human health.
285

13.1.4 Lack of Advisory Standards for Human Consumption of Food
Some states have issued new fish consumption advisories for lakes and rivers after tests confirmed the
presence of PFAS in surface water. Section 15.3 includes a case study example about a recently enacted fish consumption advisory by the New Jersey Department of Environmental Protection.
In February 2018, the Environmental Protection Authority of Victoria, Australia, “assessed waterfowl from three
wetlands to better understand the extent and distribution of PFAS contamination ahead of the duck hunting
season. PFAS was detected in waterfowl from all three wetlands.” “In May and June 2018, the agency conducted a more extensive study into PFAS concentrations in waterfowl from 19 wetlands around the state …Waterfowl
tissue samples were found to contain variable PFAS concentrations. Perfluorooctane sulfonate (PFOS) and
perfluorohexane sulphonic acid (PFHxS) concentrations in waterfowl from nine wetlands exceeded Food Standards Australia and New Zealand (FSANZ) trigger points for investigation. As a result, health risk
assessments were undertaken on the samples that exceeded FSANZ trigger points for investigation, and health
advisories were issued” (Environmental Protection Authority Victoria 2019)p.1.
In addition, PFOS is accumulating in the Arctic. The Alaska Community Action on Toxics (ACAT) reported that “A study on the presence of PFOS in the livers of arctic animals revealed elevated PFOS levels in almost all species studied.” Furthermore, it reported that “In a recent study of foods consumed by a Canadian Inuit population,
traditional foods were more widely contaminated and contained higher concentrations of PFCs [PFAS] than
nontraditional foods. Caribou had the highest concentrations of perfluorinated compounds (PFCs), including PFOS.”
(A Report for the Delegates of the 4th Conference of the Parties Stockholm Convention on Persistent Organic Pollutants, see https://www.akaction.org/wp-content/uploads/2013/03/POPs_in_the_Arctic_ACAT_May_2009.pdf). At the
request of the Yupik people of St. Lawrence Island, the ACAT is conducting a study to determine the safety of the
traditional foods they eat for subsistence.
13.1.5 Lack of Occupational Standards
Workplace exposures seems to be poorly studied and there are no standards for occupational exposure for
PFAS. Workers at paper mills and wastewater treatment plants where PFAS have been documented in indoor air, as well as developers and industrial users of PFAS, do not have specific occupational standards.
13.1.6 Lack of Ecological Risk Guidelines
There is wide concern that ecological receptors have been or will be harmed by releases of PFAS to the
environment (Section 7.2). Currently, there are no federal risk-based ecological guidelines or thresholds for environmental media. Ecotoxicity studies are generally limited to a relatively small number of PFAS compounds
(typically PFOA and PFOS). It is important to expand studies in this field to evaluate additional PFAS, including
short-chain precursor compounds as well as “next- generation” substitute compounds. Several states have established some criteria that are intended to protect aquatic organisms in their respective surface waters.
Section 8.2.3 includes more information about state regulation of PFAS. In addition, the ITRC also maintains
updated tables of PFAS water values, and PFAS soil values from state, federal, and some international
countries posted as an Excel file https://pfas-1.itrcweb.org/fact-sheets/.
286

13.1.7 Lack of Comprehensive Monitoring Information
Many stakeholders are concerned that most individuals and communities do not have any testing for PFAS.
America’s Water Infrastructure Act of 2018 requires drinking water systems serving more than 3,300 people to test for unregulated contaminants pursuant to USEPA’s Unregulated Contaminants Monitoring Rule (UCMR). However,
sampling for UCMR4 (USEPA 2016), which occurred between 2018-2020 did not include any PFAS compounds in
its analyte list. Many stakeholders are concerned that an opportunity to better understand the magnitude of PFAS contamination on public water systems (PWSs) will not be taken. Prior to this new law, only drinking water
systems that served more than 10,000 people were required to monitor for unregulated contaminants.
Contaminants covered by the UCMR include PFOA, PFOS, 1,2,3-TCP, hexavalent chromium, and 1,4-dioxane.
Additionally, smaller PWSs and private wells were not included in the third round of USEPA’s required monitoring
(Unregulated Contaminant Monitoring Rule, UCMR3). The new testing requirement, which goes into effect in 2021,
is expected to add more than 5,000 drinking water systems to the list of systems that are required to test for
these unregulated contaminants. However, the UCMR4 does not cover PFAS
(https://environblog.jenner.com/corporate_environmental_l/2018/10/new-law-requires-widespread-testing-for-unregulated-co ntaminants.html). UCMR5 is going to test for some PFAS chemicals.
More information about the UCMR3 data is included in Section 8.2.2.2. It is estimated that approximately six million residents of the United States have drinking water that exceeds the health advisory for PFOA or PFOS, or
both (APHA 2016). Moreover, there is no ongoing federal requirement for PFAS testing of any drinking water
systems or private wells. Some states (for example, New Hampshire) have initiated testing of private wells in certain locations where there is a high potential for PFAS contamination. The Washington State Department of
Health recently announced that it will be conducting additional testing for PFAS at several hundred untested water
systems. The state of Michigan is also testing all public community water systems for PFAS (see https://www.michigan.gov/pfasresponse/0,9038,7-365-88059—,00.html).
13.1.8 Precautionary Approach
Given the lack of toxicological data for the great majority of PFAS compounds and mixtures, many stakeholders
want a precautionary approach to the use, treatment, and analysis of PFAS-containing chemicals. This precautionary approach presumes compounds of similar structure may be expected to have similar modes of
action and pose a similar risk to human health and the environment, lacking evidence to the contrary.
13.1.9 Safety of Short-chain Substitutes
Many stakeholders are concerned with the use of substitute short-chain PFAS. After concerns arose that PFOA and PFOS (both long-chain PFAS) have health risks at very low concentrations, industry began to develop and
substitute them with shorter chain PFAS. Although some short-chain PFAS appear to be less bioaccumulative, the
publicly available data are limited. Short-chain PFAS are persistent, degrade into extremely persistent forms, and tend to be more water soluble and more mobile than long-chain PFAS. Because of their greater water solubility,
studies indicate short-chain substitutes are more readily taken up by plants than longer chain PFAS, including food
crops (Higgins 2017). In their Interim Chemical Action Plan for PFAS, the Washington State Department of Ecology
and Washington State Department of Health (2019 p. 1) states that short-chain PFAS are difficult to remove from
water, noting further “Without additional health and safety data, it is impossible for us to evaluate whether short-
chain replacments are safe substitutes. If environmental exposures to short- chain PFAS are found to pose
health risks to people or the environment, mitigation will be difficult and expensive.” Finally, in the Helsingør
Statement (Scheringer et al. 2014) and the Madrid Statement on Poly- and Perfluoroalkyl Substances (Blum et al. 2015), scientists and other professionals expressed concerns about the embrace of short-chain PFAS as
preferable replacements for long-chain PFAS.
287

13.1.10 AFFF Release Sites
Many stakeholders believe that all potential AFFF release sites should be investigated, and where necessary,
potential exposure should be mitigated. Investigations to date have identified the use of AFFF as one of the main sources of PFAS releases to the environment, and AFFF releases have been responsible for PFAS
contamination of multiple drinking water sources. Although AFFF foams typically contain less than 2% total PFAS,
thousands of gallons of foam mixture may be applied during a given event, and the concentrations of concern for PFAS are very low (below 100 parts per trillion (ppt)). Typical locations where AFFF is stored and used include
civilian airports, military bases, chemical plants, municipal fire departments, oil refineries, bulk fuel storage
facilities and terminals, and crash sites. AFFF was used abundantly for training purposes at military bases with flight operations and at civilian airports. Additional information is presented in the ITRC AFFF fact sheet and in
Section 3.
13.1.11 AFFF Disposal
Stakeholders are concerned that the disposal method (incineration) for unused AFFF is not regulated and that there may be dangerous byproducts. The military is planning to collect and destroy unused firefighting foam that
contains PFOS and PFOA (USDOD 2018). More than 3 million gallons of the foam and related waste have been
retrieved by the military. In a 2017 request for AFFF disposal research project proposals (U.S. Air Force 2017), the
Air Force acknowledged that the foam, which was designed to resist extremely high temperatures, is difficult to burn and that “the high-temperature chemistry of PFOS and PFOA has not been characterized, so there is no
precedent to predict products of pyrolysis or combustion, temperatures at which these will occur, or the extent of
destruction that will be realized.” With unregulated chemicals, there are no protocols that require incineration to reach certain temperatures. (See https://theintercept.com/2019/01/27/toxic-firefighting-foam-pfas-pfoa/)
13.1.12 Duty to Warn AFFF First Responders
Aside from standard workplace safety requirements regarding hazardous materials right-to-know, there has been no legal duty to warn or to require notice of hazards to first responders who handle AFFF. Several studies have
concluded that some PFAS were elevated in blood of first responders. The New Hampshire Department of Health
and Human Services PFC Blood Testing Program (NH DHHS 2016) results indicate the geometric mean levels of PFOS and PFHxS in firefighters were elevated versus the geometric mean levels of those who had not worked
as firefighters. Numerous other studies indicated that blood serum levels were elevated in firefighters (LeMasters
et al. 2006; Jim ey al. 2006; (Dobraca et al. 2015). It is difficult to tease out whether these higher levels are
related to exposures to AFFF, PFAS in firefighter gear (clothing), or consumption of water from PFAS-
contaminated drinking-water wells in affected communities, especially those that may be located near training
facilities that have used AFFF.
288

13.1.13 Limitations in Sampling and Analysis Methods
Stakeholders are concerned that current PFAS site investigations may not adequately define the types and
total mass of PFAS present, due to limitations in analytical methods (see Section 11) that are still evolving. Moreover, the PFAS family of compounds contains thousands of chemicals, but standard analytical methods can
identify only a few dozen.
A related concern is that the new specification for shorter chain AFFF published by the Department of Defense
(USDOD 2018; NAVSEA 2017) still allows concentrations of PFOA and PFOS up to 800 ppb in AFFF concentrate, because that is the lowest concentration of either PFOA or PFOS that can be measured in the concentrate with
current analytical methods. This is because the overall high concentrations of the many chemicals in the AFFF
concentrate “swamp” the lab instrument, interfering with its ability to detect any individual compound except when it is present at high concentrations. The new, short-chain AFFF formulations are fluorotelomer-based, so PFOS
(and other PFSAs) should not be present and PFOA may be present only as contamination from the production
process (as discussed in Section 3.1), but without analytical methods to prove this users cannot know for certain
if the new AFFF products are PFOS- and PFOA-free. The ITRC AFFF fact sheet and Section 3 include more information about AFFF specifications.
13.1.14 Limited Programs for Health Monitoring and Blood Testing
Some PFAS (for example, PFOA, PFOS) bind to proteins in the blood, making blood testing a means of
investigating human exposure to PFAS. Many communities where PFAS has been detected have asked that the government establish a program for blood serum testing and long-term health monitoring so that they can better
understand any health risks associated with PFAS exposure. Some states have provided limited testing on people
in high-impact areas. For example, New Hampshire provided blood serum testing for people who worked on, lived on, or attended childcare on an AFFF-impacted site and were exposed to contaminated drinking water (NH DHHS
2016). New Hampshire also performed blood tests in selected towns where people used private wells that tested
above health advisories for PFOA and PFOS. However, many state and local governments are wary of blood testing programs because there is no correlation between the PFAS level in blood serum and any definitive
health effects. People who participate in such tests are usually informed of their results and provided context
about how they compare with national and location-specific averages. It does not appear that any long-term
program has been established to monitor the health outcomes of exposed populations. If there is no assistance
from the government, many community members cannot afford to have their blood tested.
13.1.15 PFAS in Food Packaging
Many stakeholders are concerned that food packaging containing PFAS leaches into food. Food packaging, such
as bowls, plates, clamshells, trays, and pizza boxes, often includes PFAS for anti-grease resistance, and PFAS is
sometimes used in the molding process to manufacture paper plates and containers. A 2008 FDA study found that “fluorochemical paper additives do migrate to food during actual package use,” and oil and grease “can
significantly enhance migration of a fluorochemical from paper” (Begley et al. 2008).
There is only limited peer-reviewed information regarding PFAS transfer to food. One study documented that 6:2 FTOH moves from dishware or containers into food (Yuan et al. 2016). A Canadian analytical lab found
that PFBA moves from cupcake liners into cupcakes (CEH 2018).
289

The FDA has approved 20 next-generation, short-chain PFAS for coating paper and paperboard used to serve food.
The FDA Effective Food Contact Substance Notifications database is available online (FDA 2018). Concerns have
been raised that these compounds have not been adequately tested for human impact. Because of trade secrecy laws with regard to patents, the government does not publicly disclose the identity of the specific
chemicals in food packaging. However, according to The Intercept (Lerner 2016), in documents filed with the
USEPA, under TSCA section 8(e) requirements, DuPont (2010) reported that substitute PFAS, called GenX chemicals, used to produce food contact paper could pose a “substantial risk of injury,” including cancerous
tumors in the pancreas and testicles, liver damage, kidney disease, and reproductive harm.
The State of Washington has enacted a law to ban PFAS use in food packaging. Not only does PFAS in food packaging pose potential risks to consumers of the food, but the used packaging may end up in compost or
landfills. Compost is eventually applied to soil and potentially transferred to certain food crops. If it goes to a landfill, it potentially ends up in the landfill’s leachate.
13.1.16 Potential PFAS Contamination in Recycling, Compost, and Fertilizer
Carpeting, furniture, and numerous other items containing PFAS are often recycled. There is concern that the
recycled materials are often used in products where the consumer has no way of knowing whether it is has PFAS contamination. Biosolids from wastewater treatment plants are used in some composts and fertilizers and
PFAS sampling is not part of the screening process for these products. Additionally, more testing and regulation
is needed for land-applied paper mill waste. Paper mill waste is exempt from the Resource Conservation and Recovery Act (RCRA) as a beneficial reuse. Composting of paper mill waste to make fertilizer, which, for example,
is still done in Michigan, should get more attention. It is difficult to know which mills make “waterproof” or food
contact papers.
13.1.17 Lack of Disclosure by Product Manufacturers
Some stakeholders are concerned that chemical and product manufacturers are not required to disclose when they sell, make, or use PFAS in their products. For example, sturdy, waterproof and heat-resistant products are
produced for the construction industry. Additionally, there is lack of disclosure and transparency concerning the
composition of AFFF. AFFF suppliers claim that formulations are proprietary.
13.1.18 Lack of Disclosure of Information on the Health Effects of PFAS
Some stakeholders are concerned that politics may delay or even prevent the full disclosure of PFAS toxicity
information. For example, the release of ATSDR’s Draft Toxicological Profile for PFAS was reportedly delayed
because of concerns about the public response. This example, if replicated, leads to distrust and reduces the
efficacy of risk communication. Additionally, collected health data may not be clearly and fully shared or explained
to stakeholders.
13.1.19 Responsibility for Sampling and Treatment on Private Property
When off-site contamination is suspected or discovered, stakeholders believe that the responsible parties
should be accountable for establishing an entire program to deal with the problem. This includes sampling and analysis, disclosure of PFAS content, health monitoring, and if appropriate, remediation and mitigation. Upon
detection of PFAS above state or EPA limits, responsible parties should be required to provide affected residents
with alternative water supplies. Additionally, stakeholders believe that the cost of the program, including long-
term treatment and monitoring, should be borne by responsible parties.
290

13.1.20 Lack of Scientific Evidence that PFAS Cleanup Methods and Remedies Are Fully Protective of Human and Ecological Health and Prevent Toxic Emissions
Stakeholders believe that treatment systems should be monitored for effectiveness. There is also concern that
disposal or regeneration of GAC canisters, resins, and byproducts will add contaminant loads of PFAS compounds
to the air, land, and water. Companies that treat spent carbon filters that contain PFAS cannot document full destruction of all PFAS. Some claim all PFAS are destroyed, yet the research they cite is only on PFOS and PFOA
destruction.
13.1.21 Stormwater and PFAS Manufacturing Discharges that May Contain PFAS
PFAS, including PFOA, have been detected at the storm drain outfalls at active facilities. Stakeholders are
concerned that most NPDES effluent permits do not require PFAS sampling and the magnitude of PFAS
concentrations in such discharge remains unknown. Older and inactive facilities’ discharge areas, many of which
have not been sampled for PFAS, can also act as long-term sources of PFAS in soil.
13.1.22 Psychological Effects
It was reported at one EPA community forum that children in some communities are scared to drink water, and
blood level values have become an identity. This has occurred in other communities where contaminated
drinking water supplies have the effect of deterring children from drinking clean water.
13.1.23 Economic Consequences of Local PFAS Contamination
Individuals have voiced concerns about significant economic consequences on property values and businesses.
In one instance, because PFAS was detected in water used by dairy cattle, they had difficulty selling the milk
products.
Stakeholders are particularly concerned about facilities located in economically disadvantaged communities.
These communities need the economic benefits of a facility but have few resources to demand enough testing of air emissions and of potential health impacts on the community.
291

13.2 Specific Tribal Stakeholder Concerns
Tribes share many concerns with other stakeholders; however, they differ from other stakeholders in several
key aspects. The 573 federally recognized tribes are each culturally, governmentally, and socially unique. Some
tribes view any level of contamination of their lands and natural and cultural resources as unacceptable. Many
tribes have culturally significant or sacred areas, which may include springs, mountains, hunting areas, plant-
gathering areas, or burial sites. When culturally significant or sacred areas are affected, traditional
methodologies that nontribal environmental professionals rely on (such as the applicable exposure scenarios
or factors for a risk assessment) may not be sufficient to portray the effect to a tribe. For example, some
plants and animals can have tremendous cultural or religious importance to a tribe, including birds and
feathers, game animals, and herbs. Additionally, many tribal cultural ceremonies include the use of water.
Other areas of difference include diet (for example, some tribes consume more fish per capita) and growing
crops or grazing animals on areas fertilized by biosolids from wastewater treatment facilities.
Tribes are sovereign entities that have established government-to-government relationships with federal, state, and local governments—relationships that must be recognized in the decision-making process. When a PFAS-
contaminated site affects a tribe, the project timeline must include tribal approvals in addition to other typical
agency approvals. Sampling, research, and services on tribal lands generally require institutional review board
or tribal council approval. Each sovereign nation operates differently, ranging from tribes that have no research
capacity to tribes that have a full review board with a formal application process. The initial steps in the approval process may include drafting a proposal, preparing a poster or podium presentation, and presenting to the tribal
government.
Once tribal approval is granted and the project commences, the practitioner must obey tribal protocol with respect to cultural practices. The tribe may reserve the right to retain the findings in the case of exploratory
research and restrict publication. Regulatory findings for water and soil concentration, level of treatment, and
monitoring are first reported to the tribe’s department of environmental quality or natural resources and then forwarded to state environmental organizations and USEPA.
Most of the tribal concerns are listed in Section 13.1. However, as mentioned above, there may be some distinctions that are important to tribes:
• PFAS in surface waters and lakes may have a higher level of concern when they are used for fishing, given that tribal members rely on these water bodies.
• Drinking water and irrigation water in the arid Southwest are limited, and there is heightened concern
that tribes will be unduly impacted if drinking or irrigation water is contaminated.
• Tribal lands are often close to installations that used AFFF (notably DOD) or other industrial sources of
PFAS (manufacturers, leather tanneries).
• Where biosolids have been applied to tribal farmlands or grazing lands, there is a need to survey these tribal lands. In some cases, cities may have paid tribal communities to spread biosolids from
WWTPs that may have been contaminated with PFAS.
• Activities on and near tribal lands may have involved use of PFAS-containing chemicals that could impact tribal members working in these facilities through inhalation and dermal exposure.
• Landfills on tribal lands that accepted outside waste need to be sampled for PFAS contamination, which may be in the landfill leachate. Companies that paid a fee to the tribes to use their land
managed many of these landfills. Although most required sampling, often the sampling plans did not include sampling landfill leachate for PFAS.
• A big issue facing tribes is that tribal environmental offices and budgets are typically small, and they do
not have the people or money to perform appropriate site investigations to determine if they have PFAS
in their community.
292

13.3 Stakeholder Resources
Below are a number of resources for communities. These resources are websites of major environmental
organizations and projects that specifically deal with PFAS. These groups aim to help environmental and
community groups to better understand the issues and science about PFAS.
https://cswab.org/pfas/about-the-pfas-campaign/ and
https://cswab.org/wp-content/uploads/2010/09/List-of-military-fire-and-crash-training-sites-2014.pdf
https://pfasproject.com (A project of Northeastern
University) https://earthjustice.org/features/breaking-down-
toxic-pfas
http://www.testingforpease.com
https://www.civilianexposure.org/the-military-covers-up-the-extent-of-pfas-contamination-across-the-country-while-it-
continu es-to-poison-hundreds-of-communities/
https://toxicfreefuture.org/science/chemicals-of-concern/pfas-nonstick-nightmare/
http://gatehousenews.com/unwellwater/
https://www.ewg.org/interactive-maps/2017_pfa/
https://www.ewg.org/research/report-110-million-americans-could-have-pfas-contaminated-drinking-water
https://www.ewg.org/research/pfas-chemicals-contaminate-us-military-sites
https://www.ewg.org/research/many-fast-food-wrappers-still-coated-pfcs-kin-carcinogenic-teflon-chemical
https://greensciencepolicy.org/highly-fluorinated-chemicals/
https://www.sixclasses.org/videos/highly-fluorinated-chemicals
https://toxicsaction.org/issues/pfas-water-contamination/
https://www.ucsusa.org/center-science-and-democracy/preserving-science-based-safeguards/toxic-threat-pfas-contamination
-military-bases
https://www.nrdc.org/experts/anna-reade/epa-finds-replacements-toxic-teflon-chemicals-are-also
https://silentspring.org/research-area/about-highly-fluorinated-chemicals-pfass
https://clu-in.org/contaminantfocus/default.focus/sec/Per-_and_Polyfluoroalkyl_Substances_(PFASs)/cat/Policy_and_Guidance/
USEPA conducted five community engagement events and one event with tribal representatives during the
summer of 2018. Meeting materials, information, and summaries of each event are provided on USEPA’s website: https://www.epa.gov/pfas/pfas-community-engagement A series-specific topics of concern and associated social
factors identified from presentations by public and community stakeholders during the USEPA PFAS community
meetings held in 2018 are provided in the ITRC Risk Communication Toolkit for Environmental Issues and Concerns is published as a separate document.
Updated September 2020.
293

14 Risk Communication
The PFAS Team developed a training module video with content related to this section, it is the Risk Communication video.
The ability to communicate potential risks to human health and the environment is a vital skill to facilitate
community participation and decision-making. Risk communication can be particularly challenging when dealing
with science that is rapidly evolving, as in the case with PFAS. Communicators must grapple with competing interpretations of uncertain science and risk management strategies, while earning community trust and promoting
meaningful engagement. This section addresses PFAS risk communication challenges and risk communication
tools with PFAS-specific examples. Case studies that demonstrate successful risk communication planning and performance are included in Section 15.4.
Section Number Topic
14.1 Role of Risk Perception
14.2 Risk Communication Challenges
14.3 Risk Communication Planning and Engagement Tools
According to USEPA’s Risk Communication in Action: The Risk Communication Workbook (USEPA 2007, p.1), the
overall purpose of risk communication is to assist affected communities [to] understand the processes of risk
assessment and management, to form [scientifically valid] perceptions of the likely hazards, and to participate in
making decisions about how risk should be managed. Risk is the relationship between the probability of harm associated
with an activity and vulnerability of exposed elements (Slovic 1987; Slovic 2003).
The ITRC Risk Communication Toolkit for Environmental Issues and Concerns is published as a separate
document. In addition, guidance on general performance of risk communication for contaminated sites is provided in Risk Communication in Action, the Risk Communication Handbook, (USEPA 2007); Decision Making at Contaminated Sites:
Issues and Options in Human Health Risk Assessment, (ITRC 2015); and Improving Dialogue with Communities: A Risk
Communication Manual for Government, New Jersey Department of Environmental Protection, (Hance 1991).
The following subsections present risk communication challenges of PFAS and provide PFAS-specific risk
communication information for components of risk communication planning.
294

14.1 Role of Risk Perception: Public Stakeholders and Decision Makers
It is essential for decision makers to understand stakeholders’ risk perceptions of the hazard. Stakeholders
include, but are not limited to, the community, public entities, potential responsible parties, regulatory
agencies, and municipal and state officials. Risk perception for PFAS is challenging to address because the
science is rapidly evolving, the exposure is perceived as involuntary, the risk mangagement strategies are a moving target, and health impacts are greatest for the most sensitive populations. The risk management
strategies can be a moving target because of these challenges.
The environmental management community is acting largely on the basis of growing evidence of health risks and general precaution as our understanding of PFAS exposure and associated risk is continuously redefined. In
this context, risk amplification and attenuation can serve as guiding principles to better understand stakeholder context and site-specific factors contributing to stakeholders’ perceived risk to proposed risk management
strategies.
14.1.1 Role of Risk Perception and Public Stakeholders
In a scenario of risk amplification, stakeholders perceive their risk to a hazard as a major concern while experts
assess the hazard as carrying a lesser degree of risk (for example, low or moderate) (Kasperson and Kasperson
1996). In the context of PFAS, risk perception is heightened by uncertainties and variability among policies and
standards due to developing sampling methodologies and analytical procedures; new scientific information on
health effects, risk assessment evaluations, and treatment technologies (NGWA 2017); and overall confidence/trust
in the proponent or lead organization that is communicating risk. Additional human health and exposure factors that
heighten risk perception for PFAS are summarized in Section 14.2, Risk Communication Challenges.
This heightened sense of risk may result in opposition to proposed risk management strategies, such as source
control (in which there is scientific uncertainty pertaining to the “safe” level of exposure, if any, without risk).
To address risk amplification challenges, it is important to build trust among the community by maintaining
transparent communication of these uncertainties and variabilities early in the project life cycle (USEPA 2005, 2007). New data findings and research on PFAS should be regularly shared with impacted stakeholders. Current
knowledge, including uncertainties and information about variability of potential susceptibility to health effects in
individuals with the same exposures, should be conveyed accurately in an understandable manner.
Uncertainties in individual causation and variability in regulatory guidance can cause the affected individuals to lack confidence in current scientific knowledge. Therefore, a risk communication project team should communicate
these uncertainties to the affected individuals in collaboration with risk assessors, community involvement
coordinators, and community members to develop site-specific messaging. It is important to understand that
standards for the same chemical often differ depending on the entity setting them. This is not unexpected,
because standard-setting guidance is not simply a mathematical formula. Risk assessment approaches used in standard-setting processes include best professional judgment in the selection of the factors involved. In addition,
a collaborative effort can be made to develop performance metrics, supplemental to cleanup standards, that
evaluate how the action will lead to measurable increased protection for public health and the environment, thus
leading to the development of targets or objectives (Hadley, Arulanantham, and Gandhi 2015) that offer reductions in risk. These metrics are referred to as secondary risk management performance metrics and can
be used to communicate and evaluate success of a proposed PFAS risk management strategy, as well as assist
with alleviating stakeholder concerns associated with uncertainty. Examples of applicable secondary risk
management performance metrics in the context of PFAS are reduction in contaminant bioavailability/loading, source control/removal, and mitigation of exposure pathways (NGWA 2017; Harclerode et al. 2016).
295

Furthermore, risk amplification can be heightened when a community perceives that they have limited control over
risk. Explicit efforts to share control reduce outrage and risk amplification (Sandman 2013). Therefore, it is
essential to create an atmosphere of collaboration. In situations where an open public forum is met by public outrage, it important to be compassionate and lend a listening ear. Acknowledgment and documentation of
questions that cannot be answered communicates transparency and can be a first step toward building trust.
Effective participation is presented in the ITRC Risk Communication Toolkit for Environmental Issues and
Concerns.
In contrast, in a risk attenuation scenario, experts judge hazards as relatively serious while stakeholders do not
pay attention or pay comparatively little attention to that risk event (Kasperson and Kasperson 1996). This
diminished sense of risk results in challenges in stakeholder participation in risk mitigation activities (“Why do we
need to spend money/do testing, etc., for this?”). In the context of PFAS, risk mitigation and monitoring measures include participation in blood testing, installation of a water treatment system, and use of an alternate water
source. To address risk attenuation challenges, site-specific risk perception factors related to inaction can be
identified via stakeholder engagement and integrated into a communication plan (NGWA 2017; Harclerode et al. 2015; Harclerode et al. 2016).
14.1.2 Role of Risk Perception and Decision Makers
Due to the evolving science of PFAS, project managers, risk assessors, and risk communicators can also
become caught in between those who amplify risk and those who deny risk. As noted, uncertainty in the toxicity
and risk can lead to lack of consensus on how to evaluate risk and proposed risk management strategies. Due to risk amplification, there may be an elevated demand to take action to reduce potential risks beyond what is
even technically and/or financially feasible. The underlying uncertainty feeding this risk amplification may also
lead to opposition to proposed risk management strategies from some decision makers prior to establishment of the “right number” to dictate such action. When communicating with the public, it is essential to mitigate
downplaying or embellishing risk due to lack of consensus on risk among decision makers.
Strategies should be implemented by the lead organization to navigate this rift to craft an approach and communicate a plan that is most likely to be reasonable and protective. One strategy is to incorporate the
community’s needs and values to place a greater weight on how risk management is considered. A second strategy is to develop secondary risk management objectives to help evaluate how interim and long-term action
will lead to measurable increased protection for public health and the environment (Hadley, Arulanantham, and
Gandhi 2015; Harclerode et al. 2016). These complexities highlight the importance of formulating a robust risk
communication plan and team, including community and third-party involvement, as needed, as well as considering the dimension of perception as part of the risk communication process.
Case studies that showcase implementation of meaningful and effective community participation and inclusion of a
third, neutral party to facilitate implementation of a successful risk communication strategy for PFAS-impacted
communities are included in Section 15.4.
296

14.2 Risk Communication Challenges
There are many general challenges to risk communication about any environmental situation, including diversity of audience backgrounds, importance of establishing trust among the parties, and clearly communicating about
the scientific and regulatory requirements. ITRC’s Risk Communication Toolkit for Environmental Issues and
Concerns includes a more detailed discussion of these challenges.
Emerging contaminants, and more specifically PFAS, pose unique challenges to achieving meaningful and
effective risk communication. There is often divergent information available from different sources about the
potential severity and uncertainty associated with exposure and adverse health impacts that may result from
exposure, and the need for treatment or response actions. For example, people will do their own research, which may result in conflicting information. Communicators need to be prepared to explain the choices and
decisions made regardless of the conflicting information. Some of the risk communication challenges for PFAS
are discussed in the following sections.
14.2.1 Regulatory
There are regulatory challenges for emerging contaminants, see Section 8.
• PFAS are emerging contaminants, which means that they are the subject of intensive investigation, so new information, and thus our understanding of hazard, exposure, and risk, are
emerging and evolving. This can challenge us to rethink determinations of protectiveness within very short time scales.
• Federal and state standards, guidance, and policies for PFAS are not uniform and are available for only a handful of compounds.
• Regulatory standards and health advisories are in the parts per trillion range, and it is difficult to explain
to a layperson what these low levels mean in terms of risk, or how they were derived.
14.2.2 Fate and Transport
There are technical and scientific challenges and uncertainties around fate and transport of PFAS in the
environment, see Section 5.
• There are many sources for PFAS and many of them have multiple release mechanisms, so simply explaining where the PFAS came from and how it got into the environment can be complicated.
• Most people have only a very basic understanding of (and lots of misconceptions about)
chemistry, geology, environmental systems, and groundwater. Risk communicators often need to provide this context before even discussing site or chemical specifics.
• Fate and transport behaviors differ among individual PFAS (although broad generalizations can be
made based on chain length and functional groups).
• The environmental persistence, solubility, and mobility of PFAAs can result in:
• very large impacted areas encompassing a wide range of environmental settings and potential transport pathways
• complex transport pathways between interconnected environmental systems (groundwater-surface water; air-soil-groundwater; etc.).
• The multiplicity of sources and pathways can create a sense that everything is equally contaminated and dangerous. Communicators need to help people understand the variability in the degree of contamination and relative risk related to each pathway.
• We are still identifying new PFAS sources (for example, PFAS from compost sites).
• Precursor transformation can affect how a PFAS site will evolve, but this is not well understood.
• Knowledge about uptake by plants and animals is increasing, but it is often difficult to answer questions
about specific species.
297
14.2.3 Toxicological/Epidemiological Information and Risk Assessment
There are challenges and unknowns for toxicological and epidemiological information about PFAS, see Sections 7.1
and 17.2.
• One of the greatest challenges to risk communicators is having to craft messaging in the face of often
intense disagreements over the interpretation of available science and the magnitude of uncertainty;
we are communicating health risks when the risks are not fully known or characterized.
• While human studies may conclude that there is evidence that elevated exposure to PFAS
increases the risk of certain health effects, it is not possible to relate a current health effect in a
specific individual to PFAS exposure or to predict whether future health effects will occur on an
individual basis.
• There is reliable toxicological information for only a small subset of PFAS.
• There is a select subset of PFAS that has been studied in sufficient detail to support risk
assessment and remedial decision-making.
• Athough most people have low levels of PFAS in their blood serum from consumer products and diet (anthropogenic background), certain populations may have elevated exposure due to localized
sources, such as aqueous firefighting foam (AFFF) and industrial discharge, which can contaminate
environmental media, particularly drinking water, leading to increased blood serum PFAS to levels that may increase the risk to human health.
• Communities often learn that they have been unknowingly exposed to PFAS for up to several decades prior to the discovery of their presence.
• Blood serum levels of certain PFAS can remain elevated for many years post-exposure, while levels of other PFAS decrease more rapidly, and currently there is no accepted method to hasten the reduction
of PFAS blood levels. Individuals may be part of PFAS biomonitoring studies or can obtain their individual blood serum levels on their own. These individuals have access to information for comparison to
regional and national reported levels, and thus may be more informed on their personal exposure than
the medical practitioner.
• There is a need to provide understandable and informative public health advice to exposed individuals,
including woman of childbearing age and pregnant woman who are making decisions about whether to nurse and/or use water known to be contaminated with PFAS to prepare formula (Section 7.1).
14.2.4 Technical
There are technical challenges in the areas of site characterization and treatment technologies, see Section 10
and 12.
• There may be issues in the identification of responsible parties due to the difficulty in distinguishing
between low levels of PFAS from use of consumer products (anthropogenic background) and PFAS
contamination resulting from discrete sources, such as industrial uses.
• Although a subset of PFAS can be effectively removed by established treatment technologies, effective
methods for the remaining compounds are in development.
298

14.2.5 Analytical Ability
There are technical challenges in laboratory analytical methods and field sampling, see Section 11.
• There are numerous PFAS compounds in existence, yet not all can be measured. Sampling methodologies and analytical procedures to measure PFAS concentrations are still being developed and
refined.
• Units used for reporting PFAS concentrations in environmental media and blood serum are not uniform, and can thereby confuse the audience.
• There are difficulties in clearly and concisely communicating unknowns and limitations of analytical
technologies related to the understanding of the extent of PFAS present in the environment, exposure pathways, and magnitude of the potential risk.
14.2.6 Challenges to Risk Communication around Health Risks
When performing risk communication, it is essential to acknowledge that individuals may receive their information
from a variety of sources, which may provide conflicting or inconsistent messaging. As presented in Section 7.1,
there is a growing body of research pertaining the adverse health impacts of PFAS in humans and laboratory animals. The discussion potential human health risks from PFAS exposure has been taken up in multiple venues,
including peer-reviewed scientific studies, news media, and public comments on draft government documents
and proposed regulations. The severity and uncertainty of adverse health impacts that may be associated with PFAS and the need for subsequent action has been communicated in an inconsistent manner. Because of the
seriousness of potential health effects such as cancer, developmental delays and altered immune system
response, as well as the persistence of PFAS in the human body, there is a case for prudence and
precautionary mitigation practices to reduce exposures even in the absence of unequivocal human health consequences.
The risk communication challenge around health risks lends itself to a scenario in which stakeholders, including
potential responsible parties and federal and state regulatory agencies, are not in consensus on the risk
assessment and management strategy. Consistent messaging about uncertainties is essential for risk
communication to be successful and to best help those in need. If stakeholders are in debate about the level of risk, then communicate by informing the public that all parties are striving to get the risk evaluation “right” but
that there may be a delay in taking action. Communities that may be impacted may request an interim measure,
such as an alternate water source, to alleviate concerns with potential exposure. Interim measures coupled with
public outreach and community involvement can be a cost-effective risk management strategy in the short term.
Public outreach should include measures being taken as well as associated milestones for future actions
toward making a more informed risk management decision that utilizes limited resources efficiently, while
integrating stakeholder values and community needs.
299

14.3 Risk Communication Planning and Engagement Tools
Prior to preparing risk communication materials and performing outreach, a project team should develop a risk communication plan to ensure there is a robust risk communication process in place from the outset. A risk
communication plan is critical to guide decision makers to determine modes of information transfer as well as
stakeholder engagement methods and tools that are appropriate and applicable for identified target stakeholders and site-specific characteristics. As stakeholder concerns and site characteristics are further
defined, the communication team will need to continuously revisit the steps of communication planning. The ERIS
PFAS Risk Communications Hub is a resource for risk communication information such as state FAQs, case studies and other resources.
14.3.1 Risk Communication Planning Model
The ITRC Risk Communication Toolkit for Environmental Issues and Concerns presents a risk communication
planning model which has eight components or spokes on the wheel, as shown on Figure 14-1. At the center is
review and evaluate. This suggests that communication is two-way, ongoing and continuous, allowing for review of
where you are in your outreach efforts and where you may need to go.
This planning model, adapted from the work of NJDEP (2014), facilitates development of project-specific communication plans to be developed at each stakeholder engagement and/or outreach phase of a project. Of
note, the NJDEP 2014 document relied on the work of Caron Chess, Billie Jo Hance, and Peter Sandman,
Environmental Communication Research Program, Cook College, Rutgers University, as published by the New Jersey Department of Environmental Protection. The model is interactive, which allows for new information to be
incorporated into the plan so that the outreach can be modified accordingly. This approach encourages
establishing ongoing dialogue between the lead organization and all stakeholders so that the resulting outreach plan reflects the priotities and concerns from all of the parties. This will help you develop a robust risk
communication plan. The aspects of the risk communication planning model are briefly summarized here.
• Issue identification helps you to clearly understand what the situation is in order to develop a responsive
and effective risk communication plan.
• Goals are the big picture or ultimate impact that is desired for a project, issue or situation.
• Identification of communities with whom you need to establish a dialogue and those who wish to talk with
your organization is important.
• Community assessment is needed to gain a deeper insight into stakeholder concerns and values
that facilitate the development of a dialogue.
• Messages are the information you want/need to share with audiences about the issue or case, a question that you need them to answer, or both.
• A communication method is the means by which you communicate with your audiences.
• Once you have a clear goal, understand stakeholder concerns, know your message and have
selected your method, it is time to lay out the strategy in order to implement the plan.
• Evaluation is the systematic collection of information about activities, characteristics, and outcomes of
projects to make judgments about the project, improve effectiveness, or inform decisions about future
programming.
• Many risk communication efforts require an ongoing presence or outreach to stakeholders. A debrief
meeting is an opportunity for you to review the results of the evaluation and will identify what follow-up,
if any is needed.
300

Figure 14-1. Communication plan process diagram.
Source: Modified from NJDEP 2014.
General information about risk communication planning is included in the ITRC Risk Communication Toolkit for
Environmental Issues and Concerns document. This toolkit is a good resource for information about risk
communication basics and tools. The toolkit can aid decision makers using this process and provide tools to assist with meeting performance metrics at each planning step. In addition, Minnesota Department of Health has
developed the Drinking Water Risk Communication Toolkit, which can be accessed at
https://www.health.state.mn.us/communities/environment/water/toolkit/index.html.
The following subsections are risk communication resources and tools with PFAS examples. The PFAS case studies
in Section15.4 offer examples of community and stakeholder assessment strategies.
301

14.3.2 PFAS Risk Communication SMART Goals and Objectives
This section includes some examples of SMART (specific, measurable, attainable, relevant, and timely) goals for
PFAS. In addition, example messages are included.
Example SMART Goals
Example of Communication of Goals
Issue: The governor established an independent PFAS science advisory panel of national experts to provide guidance to the state on protectiveness of criteria and develop science-based recommendations that will guide
the administration and legislature on the best regulatory policy moving forward.
Goal: The PFAS Science Advisory Panel will complete a report within 6 months that will provide a general
understanding of human health risks associated with PFAS in the environment. These science-based data will be used to develop a regulatory response that the administration and legislature will take and implement by (date).
Example of Assessing Stakeholder Concerns
Issue: Due to public health concerns, the state agency will conduct a statewide study of PFAS levels in X public
water supplies at X schools that operate their own (private) wells by (date.)
Goal: By (date), the environmental agency will develop an inventory and location map of sites where PFAS has been used or disposed; prioritize sites for further investigation based upon the potential to impact drinking water
supplies (based upon state groundwater maps, site history, and site ownership); incorporate data into a GIS-based data management system; and develop and implement a plan to sample private and or public water wells
to assess potential impacts to drinking water supplies from prioritized sites.
For this example:
• specific: develop an inventory and location
• map measurable: testing
• attainable: implement a plan to sample private and public water
• supplies relevant: testing at prioritized sites will define impact
• timely: by X date
Example of a short-term SMART goal (from the Little Hocking Water Association case study, Section 15.4.1).
• By (date), the community is informed via the municipal website, flyers, and canvassing that bottled water is available as an alternate water source and utilized by 85% of the population.
• After (months), the extent of the impacted water supply is known via well testing and communicated to the community via a public meeting, municipal website, and newsletter.
Example of a long-term SMART goal (from the Little Hocking Water Association case study)
• By (date) and after (months), using a community-first strategy that includes the establishment of a
community advisory committee and using multiple methods of communication—media, social media, internet, and meetings—determine whether the study area residents’ blood PFOA levels are elevated
and provide actions that 12,000 residents can take to produce a measurable reduction of PFOA blood
levels.
302

14.3.3 Community Identification and Mapping Tools
Due to the persistent and recalcitrant nature of PFAS and its presence in the public drinking water supply,
numerous and variant federal, state, private, and public stakeholders can be impacted. Actor mapping is a tool
to help guide a communication team to lay out, track, and update stakeholder roles and relationships. During
this exercise, practitioners learn who is the most affected by site information and decisions, as well as their level
of interest and influence.
The outcome of the tool will assist in identification of unengaged/disinterested stakeholder populations, identify
needs for relationship and/or capacity building, develop a site-specific communication team, and target outreach
resources toward affected and unengaged/disinterested stakeholder populations. In the context of PFAS, this is
of particular importance to identify and address affected groups who may not be participating in preventive and
mitigation measures (such as an interim drinking water supply and a fishing ban) and/or at sites in which
stakeholder groups are facing conflict resolution.
Simplified examples of an actor-linkage matrix and interest-influence matrix are presented, followed by resources to perform complex actor mapping, such as social network analysis. The examples provided are
not representative of an existing project; stakeholder roles and relationships vary on a project-specific basis.
303

Example Context: A PFAS site consisting of a groundwater plume that has impacted drinking water supply wells and
has identified contaminants in the local fish population.
Example 1: Actor-Linkage Matrix: A tool that assist practitioners in describing relationships among stakeholders
through codes (Reed et al. 2009) (Figure 14-2).
Figure 14-2. Example actor-linkage matrix.
Example 1: Actor-Linkage Matrix Evaluation
Identify unengaged stakeholder populations: potentially anglers and tourism business operators
Facilitate relationship/capacity building: utilize the relationship between the responsible party and water purveyor to restore relationship between the responsible party and water users
Identify and develop the communication team: team consists of a representative for the lead organization
and for each regulatory agency, responsible party, water purveyor, and each low-power stakeholder group
Target communication strategy resources: increase information transfer to unengaged stakeholder
populations and rebuild intermittent and conflicted relationships with water users in alignment with risk
communication strategy SMART goals
The same example is used for the interest-influence matrix.
304

Example Context: A PFAS site consisting of a groundwater plume that has impacted drinking water supply wells and
has identified contaminants in the local fish population.
Example 2: Interest-Influence Matrix: A tool that assist practitioners in identifying the stakes that social actors
(stakeholders) have in a cleanup project. Identified stakeholders are placed in a matrix according to their relative interest and influence (Reed et al. 2009) (Figure 14-3).
Figure 14-3. Example interest-influence matrix.
Example 2: Interest-Influence Matrix Evaluation
Identify unengaged stakeholder populations: lead organization (for example, state agency or responsible party) (high-power) stakeholders have the role to engage lower power stakeholders who may not be
currently engaged or are disengaged
Facilitate relationship/capacity building: utilize high-interest stakeholders to build relationships with lower interest stakeholders, particularly ones with low power (such as the anglers)
Identify and develop the communication team: team comprised of the lead organization and each regulatory
agency, responsible party, water purveyor, and a representative of each low power stakeholder group Target communication strategy resources: increase information transfer to unengaged stakeholder
populations and rebuild relationships with low-interest stakeholders in alignment with risk communication
strategy SMART goals.
305

14.3.4 Social Factors Vision Board Tool
Stakeholder risk perception and associated social factors shape individuals’ attitudes toward management of
hazards that affect personal safety and public health, and play an important role in supporting legitimacy and
compliance with policies and protection measures. Due to the evolving state of the science of PFAS, including appropriate risk management strategies and relevant public policy, the present public attitude toward legitimacy
and acceptance of proposed policies and strategies is hindered.
The success of public outreach in terms of exerting a positive influence on community stakeholders and in preventing and mitigating their exposure to a risk is based on site-specific physical, psychological, sociological,
and demographic characteristics or “social factors.” Identification of these social factors among individual stakeholder groups can assist practitioners in refining engagement methods and outreach materials to maximize
benefits to the community and meet specific needs of the targeted public sector. A vision board can be used as a
medium for stakeholders to rate their level of importance and/or interest on applicable social factors. Identified factors can then be used to further develop SMART goals and key messages, develop public outreach materials,
and select engagement methods. The overall objective is to gain deeper insight into stakeholder concerns,
values, and preferred communication method to facilitate a two-way street knowledge transfer and capacity building towards a successful risk management strategy. A social factors vision board tool can be used as starting
materials for an engagement survey and interview. The target audience for this tool is an established community
advisory group or a periodic outreach meeting, focus group, or decision maker stakeholders’ group.
The vision boards (see ITRC RC Social Factors Vision Board attachment) developed for this toolkit are focused on a specific topic of concern and associated social factors identified from presentations by public and community
stakeholders during the USEPA PFAS community meetings held in 2018.
Note that the vision boards for a specific project are living documents. The statements/questions and social
factors should be updated to represent project-specific conditions and stakeholder concerns. Social factors
presented on the toolkit vision boards are representative of affected communities’ perceptions as opposed to
expert opinion based on scientific studies. This toolkit was prepared as an example to provide a starting point
for practitioners to understand the present needs and concerns of a PFAS-affected community. In addition, the
rating system presented in each board is interchangeable to any social factor topic. More information on using the social vision board are provided in the ITRC Risk Communication Toolkit for Environmental Issues and Concerns
document.
14.3.5 PFAS Key Messages
A message is information you want/need to share with communities about the issue or concern, a question that
you need them to answer, or both. It is linked to the case specific goal and addresses key points about the issue
that were learned through the community assessment. You start with the community and their concerns.
Effective messages reflect what your target group needs are as well as what you need to communicate. In the
case of emerging contaminants, elements of a message are likely to include: what is known and unknown about
a contaminant, acknowledgement of uncertainty; commitment to share new information when it is learned;
explanation of how decisions will be made with respect to protecting public health and remediating the problem, etc.
Message mapping is a process for developing your information so that it is concise and includes the information
that is critical to convey. The objective is that the message is simple, yet comprehensive enough, and includes the most pertinent information relevant to your issue. A mapped message starts with a question, responds with
three key ideas, is no more than twenty-seven words, and takes no longer than nine seconds to deliver. An
example of key messages developed for a PFAS site is provided in Table 14-1. Additional resources on key messaging and mapping is provided in the the ITRC Risk Communication Toolkit for Environmental Issues and
Concerns document.
306

Table 14-1. Message Mapping Worksheet
Source: (Covello, Minamyer, and Clayton 2007)
Stakeholder:
Community member
Question/Concern/Issue:
What are PFAS and why is the state concerned about them?
Key Message/Fact 1 PFAS are a
family of human-made chemicals in
many products used by consumers and industry.
Key Message/Fact 2:
PFAS are emerging
contaminants of concern.
Key Message/Fact 3:
Some PFAS may adversely
impact human health.
Keywords:
Supporting Facts 1.1 PFAS are a large group of thousands
of manufactured compounds,
produced and used for over 60 years. Some PFAS are still in use, some are
not.
Keywords:
Supporting Facts 2.1 PFAS are a contaminant of
active scientific research.
Scientific knowledge is changing rapidly.
Keywords:
Supporting Facts 3.1 PFAS can build up in the
body (bioaccumulate) and
take a long time to leave the body.
See also this website for a template of the message mapping
worksheet: https://www.orau.gov/cdcynergy/erc/content/activeinformation/resources/Covello_message_mapping.pdf
Keywords:
Supporting Facts 1.2
PFAS have been used in coatings for textiles, paper products, and
cookware and to formulate some
firefighting foams, and have a range of applications in the aerospace,
photographic imaging,
semiconductor, automotive, construction, electronics, and aviation
industries.
Keywords:
Supporting Facts 2.2
Laboratory methods may or may not exist to detect all the PFAS
contaminants that we know
about; methods are developing
and evolving with the emerging science.
Keywords:
Supporting Facts 3.2 Some PFAS, such as PFOA,
have been found to impact fetal development and are passed to
babies through nursing and
bottles.
Keywords: Keywords:
Supporting Facts 3.3 Studies in exposed humans
suggest that some PFAS may
cause high cholesterol, higher liver enzymes in blood,
decreased response to
vaccines, decreased birth weight, and testicular and
kidney cancer.
Keywords: Supporting Facts 2.3
Supporting Facts 1.3 Federal and state regulations are
PFAS are found throughout the changing as the scientific
knowledge
environment, in people, and in animals evolves; this leads to guidance and
and fish. recommendations that may vary
across the country.
307

14.3.6 Communication and Engagement Tools
14.3.6.1 Public Outreach
Public health and regulatory agencies have developed several public outreach materials to inform stakeholders
about PFAS, from the compounds’ origins and environmental distribution to exposure pathways, associated
health effects, and management strategies. Outreach tools include community education classes to inform and
support high school teachers, medical professionals, journalists, and municipal water managers. The following
provides a summary of available resources for accessing and developing public education materials for PFAS-
impacted communities. Although printed public education materials are effective at communicating information,
techniques that include face-to-face communication, such as open house meetings, focus groups, and door-to-
door canvassing, are often more effective at addressing fears and building trust. Additionally, face-to-face
communication provides an opportunity for practitioners to learn from the public and other impacted stakeholders.
The ITRC Risk Communication Toolkit for Environmental Issues and Concerns document includes Guidance for
Writing Analytical Results Letter, Guidance for Writing Press Releases.
14.3.6.2 Fact Sheets and Frequently Asked Questions (FAQs)
To achieve effective risk communication, it is essential for public education materials to be presented in a clear
and simple manner that is understandable by nonscientists and speaks to a broad audience. Common rules of
thumb include writing at a sixth-grade comprehension level, using simple terminology, and providing materials in
multiple languages for nonnative speakers. Over the past few years, environmental and public health agencies, nonprofit advisory groups, trade associations, and regulatory agencies have prepared numerous fact sheets and
FAQ documents on PFAS-related topics to inform stakeholders, including concerned residents, agricultural and
recreational entities, water purveyors, end users, public health professionals, and others. These public education materials developed specifically for PFAS-impacted communities are typically available on the organization’s
website.
Fact sheets, FAQs, and other public outreach material should be distributed in multiple modes to maximize
audience reach and increase opportunity for engagement. Recommended modes of distribution include mailings,
websites, local municipal health departments, public health professional offices, public libraries, and
information booths at community events.
The ITRC Risk Communication Toolkit for Environmental Issues and Concerns document includes additional
information about FAQs.
• Compilation of PFAS Fact Sheets, Frequently Asked Questions (FAQs) and other resources
developed by the Association of State and Territorial Health Officials (ASTHO) and the Environmental
Council of the States (ECOS) are available:
• https://www.astho.org/PFAS/
https://www.eristates.org/projects/pfas-risk-communications-hub/
308

14.3.6.3 Active Centralized Information Repository
Unlike a “passive” repository of site documentation at a central location, an “active” repository refers to a
platform that remains up to date on site findings and enables two-way exchange of information among decision
makers and the impacted community. A common platform for an active repository is a centralized website that contains a complete compilation of site documentation (among all agencies); frequent updates on site activities,
health information and regulatory policy; and a depiction of the CSM (such as a source-exposure pathway
graphic and geologic maps). The website should also contain a platform to facilitate stakeholder involvement by providing an opportunity for them to ask questions, submit information, and join a listserv (an application that
distributes messages to subscribers on an electronic mailing list).
Examples of centralized websites can be found at the following web links:
• Michigan Department of Environmental Quality, Michigan PFAS Action Response Team (MPART):
https://www.michigan.gov/pfasresponse/
Michigan agencies representing health, environment, and other branches of state government have joined
together to investigate sources and locations of PFAS contamination, to take action to protect people’s drinking water, and to keep the public informed as we learn more about this emerging contaminant.
• New Hampshire Department of Environmental Services (NHDES), NH PFAS
Investigation: https://www4.des.state.nh.us/nh-pfas-investigation/
NHDES maintains a website to update interested parties on NHDES’s investigation into the presence of PFAS in New
Hampshire. The website includes a map that shows PFOA and PFOS data from water samples collected around
the state.
• Vermont Department of Environmental Conservation (VDEC), Vermont PFOA Contamination Response: https://dec.vermont.gov/pfas/pfoa
Numerous Vermont agencies, including VDEC, Department of Health (VDH), Emergency Management, Agency of
Agriculture, and Agency of Education have joined together to investigate and address PFAS contamination in
Vermont. VDEC and VDH have created and maintained web pages to push information out to the public as it
becomes available to keep the public informed of the PFAS issue.
Not all stakeholders have access to the internet, and depending upon the seriousness of the site’s
situation, it may be appropriate to hold regular meetings and/or office hours to provide more than one
mode for stakeholders to obtain information and engage with decision makers.
14.3.6.4 Community Education
Individual stakeholder groups and individuals themselves process information in a variety of modes and media.
An effective risk communication strategy takes this factor into consideration and encompasses multiple forms of
outreach. In addition to informative materials, such as fact sheets, stakeholder meetings and interactive
sessions (such as poster presentations, question and answer sessions) can be held to involve individuals in the learning and understanding process. Prior to selection of a method, an audience assessment should be
conducted to determine how a community communicates and to learn what tool is the most effective to use.
309
Community Education Example—Bennington College Community Education Strategy, Vermont
In 2016, PFAS were discovered in the public water system of Hoosick Falls, New York, and in hundreds of private residential wells in Petersburgh, NY, and North Bennington, Vermont. In response to this nearby problem,
Bennington College asked how the scientific resources of a college or university might become a civic resource
in times of environmental uncertainty. After some discussion about how to maintain the scientific and educational integrity of the college while also being a good neighbor to impacted communities, Bennington College decided
to open the doors of its science classrooms to the problem of PFAS contamination. This was done primarily in
two ways: (1) a new introductory class on PFOA was offered to local communities free of charge, and (2)
students in more advanced science classes in chemistry and geology worked to produce independent data on PFAS contamination in the region. More information about both of these strategies is below.
Many residents impacted by PFAS voiced a desire to learn about the science of the problem even as there was a
recognition that much of that science was currently quite difficult for residents to grasp. Indeed, many of the risks
and ramifications of PFAS contamination are currently published in daunting regulatory reports and peer-reviewed
research articles (often behind paywalls). Addressing these concerns, Bennington College designed a new class to
review the chemical properties, environmental pathways, and policy concerns of PFOA, entitled “Understanding PFOA.” This class also taught residents how to collect water samples for PFAS analysis at a commercial lab and
how to interpret laboratory results from PFAS analysis. Bennington College has offered this class every spring to
local residents since 2016, free of charge. A number of local teachers, journalists, nurses, elected officials,
parents, and students enrolled, and the class has become a vehicle for the community to get up to speed on the
science of PFAS so they can engage the issue more productively.
Bennington College also put together faculty-led research teams to produce independent data on PFAS
contamination in conversation with community questions. Bennington College realized that impacted communities often had interesting questions about PFAS that fell outside of the urgent protocols of state
agencies, which rightfully focused on safeguarding public health. These community questions, however,
provided useful pathways to educate residents about the problem and to encourage local participation in research into PFAS contamination. Working with residents of Hoosick Falls, Petersburgh, and North Bennington,
the college helped investigate a number of community concerns, such as:
• “Is there any PFOA in my maple syrup?”
• Bennington College tapped two maple trees in the spring and analyzed the sap, finding 8.8 parts per trillion (ppt) of PFOA in the sap of a maple tree about 1,000 feet from a plastics plant
and 2.3 ppt of PFOA in the sap a maple tree about a mile from the plant.
• “My well had high levels of PFOA but now I have a filtration system in my basement. If my well was contaminated for years, I wonder if there might be any residual PFOA in my water pipes. Could any
built-up PFOA still be contaminating the water coming out of my kitchen faucet?”
• Bennington College analyzed water from the kitchen faucet from three homes with high levels
of PFOA in their well and a point of entry treatment filtration system (Hoosick Falls house, 2,100 ppt of PFOA in well; Petersburgh house, 1,800 ppt of PFOA in well; North Bennington
house, 3,000 ppt of PFOA in well). In all three homes, PFAS were nondetectable in water from
the kitchen sink.
• “When the state tested my well, they found PFOA levels just below the health guidance level and thus
we did not get a filtration system. How stable are detected levels of PFOA in the groundwater?”
• Bennington College reviewed data from over 200 residential wells that had been sampled and analyzed for PFOA at least twice in one year. They found an average variation of 24% in
individual wells. PFOA levels increased in about half of the wells and decreased in about half
the wells. This increase and decrease did not have an obvious spatial pattern (for example, a plume moving in one direction) but appeared to be fairly randomly scattered across the
sampling area.
310

More information about Bennington College’s ongoing engagement with PFAS can be found at
www.bennington.edu/pfoa.
Updated September 2020.
311

15 Case Studies Currently the PFAS team had identified case studies supporting the following sections:
• Section 10 Site Characterization
§ Section 12 Treatment Technologies § Section 9 Risk Assessment
§ Section 14 Risk Communication
15.1 Site Characterization Case Studies
15.1.1 Case Study—Data Visualization at an AFFF Release Site
McGuire et al. (2014) and McGuire (2013) presented a detailed characterization of a subset of PFAS soil and groundwater concentrations, focused on PFAAs in the vicinity of a former unlined burn pit where fire training
activities were conducted up to 1990. Data presented in McGuire et al. (2014) were used for this visualization
example. For brevity, this example shows relative concentration trends between shallow and deep soil samples
collected at six borings where total PFAA concentrations exceeded 5,000 ug/Kg in shallow soil. The inset map in the top left of Figure 15-1 shows the former burn pit location, as well as the locations of these six borings (S-2, S-
4, S-5, S-6, S-7, and S-10). Shallow soil samples were collected at a depth of approximately 2 ft below ground
surface (ft bgs) (0.61 m), and the deep soil samples were collected at the water table, which is approximately 15–20 ft bgs (4.6–6.1 m) on average.
Figure 15-1. Comparison of shallow and deep soil samples at an AFFF release site.
Source: G. Carey, Porewater Solutions. Used with permission.
312

The bar chart in Figure 15-1a compares concentrations of shallow and deep soil concentrations for total PFAAs at
these six boreholes and clearly demonstrates that shallow PFAA soil concentrations are much higher than deeper soil concentrationsat the water table. This figure indicates that there is likely attenuation that limits vertical migration
of PFAAs. McGuire (2013) attributed this to the high clay content of vadose zone soils, and high VOCs and TOC in
this area, which may enhance retardation.
A different type of bar chart is shown in Figure 15-1b to illustrate the composition of the main PFAA constituents in
shallow soil samples (PFHxS, PFOS, PFHxA, PFOA). Review of Figure 15-1b reveals the following trends:
• In three of the six boring locations, PFOS is greater than 95% of total PFAA concentrations in shallow soil.
• In the other three borings, PFOS is less than 50% of total PFAAs. These borings have higher relative concentrations of PFHxS, PFHxA, and PFOA.
• PFHxS, PFOS, PFHxA, and PFOA combined represent at least 80% of total PFAA concentrations in shallow soil.
The difference in PFOS composition shown in Figure 15-1b suggests that some borings were drilled in an area
that was influenced by a mixture of different AFFF products, whereas other borings with a high proportion of PFOS
may be influenced primarily by AFFF produced using electrochemical fluorination.
Figure 15-1c shows the same type of bar chart with relative percent of total PFAA concentrations for the deeper
soil samples collected at the water table. Comparison of Figures 15-1b and 15-1c indicates that there is a clear
difference in PFAA composition between the shallow and deep soil samples. PFOS is very low in terms of relative
concentrations in deep soil samples, compared to the shallow soil samples where PFOS makes up a higher proportion of the total PFAA concentration. This may be due to enhanced retardation of PFOS in the vadose zone
relative to the other compounds (PFHxS, PFHxA, and PFOA), which is consistent with the relative site-specific Koc
values determined by McGuire et al. (2014). In addition, Figure 15-1c shows that these four compounds typically represent only around 50% of total PFAA concentrations in the deep samples, which suggests that shorter chain
compounds are more prevalent at the water table and in underlying groundwater, most likely due to precursor
transformations.
Radial diagrams may also be used as visual aids to illustrate spatial and/or temporal trends for individual PFAS
constituents or total concentrations for various PFAS groups. As an example, Figure 15-2 presents a radial
diagram map showing trends for various PFSAs (PFOS, PFHxS, PFBS) as well as perfluorohexane sulfonamide
FHxSA, which is a precursor to PFHxS. The radial diagram legend in the top right portion of Figure 15-2 shows that the four axes are arranged in order of FHxSA, PFOS, PFHxS, and PFBS. There are two data series shown on
the radial diagram legend: (1) the blue-filled data series, which represents PFAS constituent concentrations at
monitoring well location; and (2) a darker blue outline that represents maximum source concentrations at well GW13, which is situated directly adjacent to the former burn pit area. This latter data series is a reference and
is the same at all monitoring well radial diagrams. Including this reference data series makes it easier to
visualize changes in concentrations throughout the plume. The radial diagram legend also shows how symbols
may be plotted to represent where constituents were not detected in a groundwater sample. Another option for radial diagram symbols is to indicate where concentrations are above groundwater cleanup criteria at each well
location (not shown). The compound axes are logarithmic in this example, to allow for visualization of order of
magnitude concentrations between wells, or between compounds at any one well location.
313

Figure 15-2. Radial diagrams illustrating PFSA trends at an AFFF release site.
Source: G. Carey, Porewater Solutions. Used with permission.
Groundwater flow in this area is generally to the south/southeast. The main radial diagram map shown in
Figure 15-2 facilitates an analysis of how concentrations for these four constituents vary along the groundwater
flow path downgradient from the former burn pit area, and how concentrations vary across the width of the plume. For example, the radial diagram shown at GW01, which is located inside the footprint of the former burn
pit, indicates that concentrations of the longer chain compounds (FHxSA and PFOS) are similar to those in the
nearby well at GW13, whereas PFHxS and PFBS are about an order of magnitude lower at GW01 then GW13. The radial diagrams also clearly show that groundwater downgradient of the DO infusion wells (triangle symbols) has
low to non-detect FHxSA, indicating that aerobic transformation of this precursor has occurred downgradient of
these infusion wells (Section 10.4.4).
Although not shown with this case study, radial diagrams are also helpful for visualizing redox indicator trends, to confirm whether redox conditions are favorable for the transformation of precursors to PFAAs. Examples of a modified radial diagram method used for redox zone delineation are presented in Carey et al. (1999) and Carey
et al. (2003).
314

15.1.2 Case Study—Application of Radial Diagrams
Figure 15-3 presents another type of application of radial diagrams for visualizing certain PFAS trends, in this
case for an aquifer contaminated with PFAS from several fire training areas in the vicinity of Uppsala, Sweden. The blue outlines shown in Figure 15-3 represent the boundaries of eskers (deposits formed by streams flowing
beneath a glacier), which essentially act to channel groundwater flow in the aquifer. The legend shown on Figure
15-3 indicates that the four axes of the radial diagram now represent concentrations of 6:2 FTS (which dominates the other FTSs), total PFCAs, total PFSAs, and total concentrations of other chemical-specific precursors.
Symbols are shown to represent non-detects at each well location.
Groundwater flow in the main aquifer channel is from northwest to southeast (parallel to the river channel) and is
to the west in the inset box shown in the bottom center of Figure 15-3.
Figure 15-3. PFAS composition in groundwater.
Source: G. Carey, Porewater Solutions. Used with permission.
315

Examples of trends that are evident based on the radial diagram map (Figure 15-3)
include:
• All chemical-specific precursors are nondetect in the main aquifer channel, indicating that precursors
were effectively attenuated closer to the fire training areas.
• PFSA and PFCA concentrations appear to be declining along the main flow channel (for example, downgradient of G8 and G9.
• Concentrations of precursors in the vicinity of the fire training areas shown in the inset map are
much higher than in the main groundwater flow channel. This indicates that precursors may be attenuating prior to reaching the main flow channel in this area, due to sorption, biotransformation,
and/or possibly discharge to the nearby creek.
• The combination of elevated PFCAs and PFSAs, as well as high 6:2 FtS near at least two of the fire training areas, indicates that AFFFs produced using telomerization were used at one point at some of
these fire training areas.
316

15.2 Treatment Case Studies
Several well-developed technology case studies are presented in the following sections. Additional information
on other water treatment case studies is summarized in Table 15-1 provided as a separate Excel file.
15.2.1 Granular Activated Carbon (GAC)
Case Study: Granular Activated Carbon System—Oakdale, Minnesota (Contributed by Virginia Yingling, Minnesota Department of Health, used with permission)
Background Oakdale is a suburban community located east of St. Paul, Minnesota, with a population of approximately 28,000.
Prior to state or federal laws regulating such waste disposal, industrial wastes from a PFAS manufacturer were
disposed of in a privately operated 55-acre unlined dumpsite (Oakdale Disposal Site, 1940–1960) and in the Washington County Landfill, a permitted 40-acre unlined municipal landfill in Lake Elmo, Minnesota (1969–1975). In
2005, PFAS were detected in six of the eight operating Oakdale city drinking water supply wells.
Eight PFAS have been detected in groundwater associated with these sites, with PFBA, PFHxS, PFOA, and PFOS being present at the highest concentrations. PFAS have also contaminated a stream that drains the wetlands
that comprise part of the Oakdale Disposal Site and PFAS re-infiltration has contributed to groundwater contamination in areas not immediately downgradient of the waste disposal sites. Both sites underwent remedial
activities in the 1980 to address industrial solvents and in 2009–2011 to address PFAS. These actions included
soil and waste excavation with on- and off-site encapsulation, and groundwater pump and treat (GAC) for
hydraulic containment.
The regional groundwater flow direction at both sites is to the south-southwest toward the Mississippi River,
approximately 8 miles away. The primary source for PFAS impacts to groundwater appears to be the Oakdale
Disposal Site, but the Washington County Landfill may have contributed to the contamination in the easternmost
city wells.
Water Characteristics
The maximum concentrations detected to date in the city wells are shown in Table 15-2 along with the relevant Minnesota health-based guidance values for PFAS in drinking water.
Table 15-2. Maximum concentrations of PFAS in drinking water from Oakdale city wells.
Chemical Maximum Concentration Detected in Any Oakdale City Well (µg/L)
Minnesota Department of Health’s Health-Based Guidance Value (µg/L)
PFBA 2.15 7
PFBS 0.136 3 (acute), 2 (chronic, subchronic)
PFPeA 0.176 None established
PFHxA 0.382 None established
PFHxS 0.142 0.047
PFOA 0.871 0.035
PFOS 1.38 0.015
NOTE: All concentrations reported as of August 2019 and guidance values reported are as of December 2019.
317

The Minnesota Pollution Control Agency (MPCA), Minnesota Department of Health (MDH), City of Oakdale, and the
chemical manufacturer agreed to address the situation by constructing a GAC treatment plant to treat the water
from the two most highly contaminated wells. In addition, the city shut off one well and drilled a replacement
well north of the contaminated area. Other wells with PFAS detections are used seasonally and to maintain
pressure throughout the distribution system, but the pumping schedule is managed to ensure PFAS remain
below MDH guidance values in the water delivered to the community. This includes meeting the MDH’s Health Risk Index, which is a toxic equivalency quotient (TEQ)-like assessment of the additive toxicity of multiple PFAS.
Treatment Technology Design Details
The GAC treatment facility (Figure 15-4) began operations in October 2006. It consists of ten filter vessels (each
containing
20,000 lbs. of GAC) set up in five parallel lead-lag pairs (shown below) housed in a 7,000 ft2 facility. The system
treats 2,500 gallons per minute with a minimum empty bed contact time (EBCT) of 10 minutes per vessel. The water is combined back into one stream, chlorinated and fluoridated to meet state and federal standards, and
then piped to the distribution system.
Figure 15-4. GAC treatment system, Oakdale, MN.
Source: Courtesy of the Minnesota Department of Health.
318

System Performance The city and MDH monitor the PFAS concentrations in the influent, lead vessel effluent (that is, between
vessels), and post–treatment facility effluent (Figures 15-5 and 15-6). Monitoring currently occurs quarterly for
the first three quarters following GAC change-out and monthly in the final quarter prior to change-out.
The GAC is changed out approximately every 12 months to prevent breakthrough of any PFAS above MDH
guidance values. GAC change-out may involve a complete replacement of all GAC or just the lead vessel GAC and
change of flow to make the former lag vessel the new lead vessel. This will depend on the effluent concentrations
at the time of change-out. Initial removal rates are 100% (below analytical limit of detection) for all seven PFAS
analyzed (PFBA, PFPeA, PFHxA, PFOA, PFBS, PFHxS, PFOS).
Breakthrough order follows the expected sequence of shorter chain and PFCAs preceding longer chain and PFSAs.
PFBA breakthrough of the full system typically occurs within 2 months after a complete GAC replacement, but because the influent PFBA does not exceed its health-based guidance value of 7 µg/L, this does not pose a health
risk and does not trigger any response actions. Interestingly, PFBA effluent concentrations eventually exceed
influent concentrations, presumably due to PFBA desorbing in the presence of more readily sorbed, longer chain
PFAS. As shown in the graphs below, PFOS has broken through the full system only once (2012; max effluent
concentration = 0.019 µg/L) and PFOA has broken through only four times (2010, 2012, 2015, 2018; max effluent concentration = 0.086 µg/L). At no time did any PFAS exceed the then-current health-based guidance values.
Figure 15-5. Influent and effluent concentrations for PFOS.
Source: Courtesy of the Minnesota Department of Health.
319

Figure 15-6. Influent and effluent concentrations for PFOA.
Source: Courtesy of the Minnesota Department of Health.
Costs
Capital costs for the GAC treatment facility were approximately $2.5 million. Annual operation and maintenance (O&M) costs, including sampling and GAC change-out, are approximately $250,000.
15.2.2 Ion Exchange (IX) Resins
Ion exchange resins can be utilized as single-use, where the media is disposed when it has reached the limit of
its sorptive capacity, or regenerable, where the resin is regenerated and reused indefinitely (theoretically). The
following two case studies outline field applications for these two related technologies.
320

15.2.2.1 Single-Use IX
Case Study: Horsham Township, Pennsylvania (Contributed by Francis Boodoo, Purolite Corporation, used with permission)
Background
The township of Horsham, Pennsylvania, located close to an AFFF release site, supplies drinking water to 7,800
residential, commercial, and industrial customers using 15 deep water wells. In 2014, five of the wells were
confirmed to be impacted with PFAS. PFOS and PFOA were found in two wells at concentrations approaching the
USEPA 2009 provisional health advisories (HAs) of 200 ppt and 400 ppt, respectively. These wells were immediately taken out of service. In June 2016, one month after EPA issued final HAs of 70 ppt for the combined
concentrations of PFOS and PFOA, three more wells were removed from service due to elevated concentrations.
The township began purchasing supplemental water from a nearby water supplier and began installing GAC filters to remediate and return the five impacted wells to service. Responding to consumer concerns, the
township adopted an aggressive removal plan to reduce average PFOS/PFOA concentrations to less than 1 ppt
(essentially to nondetect levels) in its entire water system by the end of 2016. In addition to GAC filtration, the township started up a 50-gallon-per-minute selective ion exchange (IX) resin pilot in November 2016 on Well 10 to
evaluate the performance of the resin in consistently reducing PFOS/PFOA to nondetect levels. A temporary 1-
year permit was obtained from Pennsylvania Department of Environmental Protection (PA DEP) to install the resin pilot downstream of an existing GAC pilot that had been started up 20 days earlier. This was the first permit
issued by the state of Pennsylvania for treating PFAS in drinking water using ion exchange resin.
Influent Water Characteristics Influent concentration of a total of seven PFAS during the test period from November 2016 to August 2018 was
an average of 103 ppt, a minimum of 78 ppt, and a maximum of 147 ppt. Individual PFAS concentrations are shown in Table 15-3.
Average influent values for PFOS and PFOA were 34.1 and 20 ppt, respectively, somewhat lower than EPA’s 70
ppt combined HA. Other influent geochemical parameters included sulfate at 8–23 ppm, nitrate at 10–11 ppm, alkalinity at 148–232 ppm, chloride at 35–50 ppm, pH at approximately 7.5, TDS at 296–358 ppm, suspended
solids at 0.5–0.6 ppm, TOC at 0.2 ppm, and one sample detection for 1,1-dichloroethane at 37 ppt.
Table 15-3. Influent PFAS Characteristics of Well 10 *
nanograms per liter (ng/L) (or parts per trillion (ppt)) PFBS PFHpA PFHxS PFHxA PFNA PFOS PFOA Total PFAS
Lab Detection
Level
1
1
2
1
2
2
1
Minimum 6 4 17 6 27 13 78
Average 9 5 28 9 34 20 103
Maximum 14 8 41 13 2 48 40 147
* PFBS =perfluorobutanesulfonate; PFHpA = perfluoroheptanoate; PFHxA = perfluorohexanesulfonate; PFHxA = perfluorohexanoate; PFNA = perfluorononanoate, PFOS = perfluorooctanesulfonate, PFOA =
perfluorooctanoate, PFAS = total poly- and perfluoroalkyl substances
321

Treatment Technology Design Details: GAC and Ion Exchange System Well 10, with a peak design flow rate of 100 gpm, was used for large-scale piloting at a reduced flow rate of 50
gpm under the terms of the permit from PA DEP. The water was first passed through a 20-micron suspended solids filter, then in series through two 2.5-ft diameter stainless steel vessels, each vessel containing 20 cubic feet
of bituminous GAC. EBCT for each charge of GAC amounted to 2.8 minutes or a total of 5.6 minutes for the two
GAC vessels; linear velocity was approximately 10 gpm/ft2. The township recognized that EBCT was lower than the 10–20 minutes specified in the PA Public Water Supply design manual and that linear velocity, even though it
complied with the PWS, was higher than the typical 4 gpm/ft2 used for GAC; however, the township and PA DEP
considered the design acceptable for the low levels of PFAS measured and for the temporary nature of the pilot. After initial treatment by the GAC pilot, the water was passed through a 2.5-ft diameter vessel containing 20 cubic
feet of Purolite Purofine PFA694E selective resin. Bed depths for both the GAC and resin media were
approximately 34 inches. Sampling points were installed on the outlet of each vessel. An extra sampling point was installed in the resin polishing vessel at two-thirds of the resin bed depth. This allowed monitoring
corresponding to EBCT of 1.8 minutes at the two-thirds sampling point and 2.8 minutes EBCT for the entire resin
bed. The two-thirds sampling point would provide advanced notice of PFAS breakthrough.
System Performance The entire system became operational on November 29, 2016. PFOS and PFOA sampled at the two-thirds point
of the resin bed remained consistently at nondetect levels until rising to 2.6 ppt on day 394 and 4 ppt on day 472
(see Figure 15-7). For reporting purposes, the township decided to use a minimum reporting level of 2.5 ppt for
each of PFOS and PFOA; values below the minimum reporting level would be considered nondetect. Once the PFOA concentration reached 2.6 ppt at the
two-thirds sampling point for the resin, the treated water was diverted to the local sanitary sewer in keeping with the
PA DEP permit. PA DEP has since granted permission to bypass the GAC system to enable performance evaluation of just the resin.
On day 514, with permission from PA DEP, the two GAC vessels were taken out of service while the raw water was
routed directly to the resin vessel, which continued to operate. In this way, the performance of the resin could be
evaluated without pretreating with the GAC. The resin operated for 639 days before PFOA was detected at a
concentration of 2 ng/L of PFOA in an effluent sample from the resin bed. At that point the concentrations of
PFBS, PFHxS, and PFOS were still at nondetect levels. Operating capacity of the resin at that point was
equivalent to treating 511,000 bed volumes (BVs) of water based on two-thirds of the resin volume, or 329,000
BV based on the entire volume of resin.
Following successful and consistent performance of the resin-only system, PA DEP has issued an operating permit
for use of resin only in a pair of lead-lag ion exchange vessels. Similar permits have also been issued at neighboring townships.
322

Figure 15-7. Combined PFOS/PFOA breakthrough.
Source: F. Boodoo, Purolite Corporation. Used with permission.
Even though PFOS and PFOA were the initial targets for reduction, consistent reduction of other short- and long-
chain PFAS to nondetect levels was also achieved after passage through the resin. For conciseness, only total PFAS breakthrough graphs are shown in Figure 15-8, but the order of breakthrough observed was PFHxA < PFHpA <
PFOA < PFNA < PFBS < PFHxS < PFOS.
Figure 15-8. Combined breakthrough of total PFAS.
Source: F. Boodoo, Purolite Corporation. Used with permission.
323

Costs
The proposed permanent full-scale system is designed for a peak flow rate of 100 gpm with a pair of lead-lag vessels for the media. Design for ion exchange will include one 20-micron cartridge filter followed by two 4-ft
diameter vessels with resin bed depth of 36 inches and EBCT of 2.8 minutes. Design for GAC will be one 20-
micron cartridge filter followed by two 6-ft diameter vessels with GAC bed depth of 60 inches and EBCT of 10.6 minutes.
Annual operating cost, including replacement media, labor, trucking, spent media profiling, and incineration, is
estimated at approximately $8,000 and $15,000, respectively, for ion exchange and GAC. These estimates are based on a very conservative operating capacity estimate of 350,000 BVs for a lead-lag pair of resin vessels; a
generous capacity of 34,000 BVs is assumed for the GAC system. Operating costs are estimated at $0.16 and
$0.29 per 1,000 gallons of water treated by the resin and GAC systems, respectively. Larger vessels needed for the GAC system will further add to the cost of using GAC versus the PFAS-selective resin.
15.2.2.2 Regenerable IX
Case Study: Regenerable Ion Exchange Resin Pilot Test and Full-Scale Application (Contributed by Steve
Woodard, ECT2, and Nathan Hagelin, Wood Group, used with permission)
Background
The Air Force Civil Engineering Center (AFCEC) is conducting ongoing response activities to remove and remediate
groundwater impacted by poly- and perfluoroalkyl substances (PFAS) at the former air force base in New Hampshire. The two primary PFAS compounds found at the site are perfluorooctanoic acid (PFOA) and
perfluorooctane sulfonate (PFOS), at combined concentrations (PFOA+PFOS) above the USEPA lifetime health
advisory (LHA) of 0.07 micrograms per liter (µg/l). In 2015, the USEPA issued an administrative order to establish
maximum hydraulic containment of PFAS compounds to reduce source zone mass and mitigate migration of PFAS
compounds to off-site receptors.
AFCEC responded by contracting with Wood Group, PLC, to conduct a side-by-side pilot test in 2016, comparing
the performance of Emerging Compound Treatment Technologies’ (ECT2) regenerable ion exchange (IX) resin
and bituminous GAC. The resin outperformed GAC and was selected for full-scale implementation, mainly on its
life cycle cost advantages, as determined by the results of the pilot study.
To evaluate the resin’s ability to be regenerated, regeneration trials were conducted throughout the pilot test
using a proprietary regeneration procedure with a solution of organic solvent and brine. Overall, PFAS removal
results for the regenerated resin were consistent with new resin, as shown in Figure 15-9. Extended follow-on pilot
testing utilized multicycling to confirm the effectiveness of the regeneration procedure to restore the resin’s PFAS
removal capacity. The regenerable resin system was selected for full-scale application, based on system
performance and a favorable life cycle cost comparison.
324

Figure 15-9. Postregeneration breakthrough curve (total PFAS).
Source: Steve Woodard, ECT2, and Nathan Hagelin, Wood Group, PLC. Used with permission.
Influent Water Characteristics
Table 15-4 provides a summary of influent PFAS concentrations observed throughout the pilot test. Total PFAS
concentrations ranged from 65 to 112 µg/l, with an average of 94 µg/l. Average influent concentrations for PFOS
and PFOA were 26 and 12 µg/l, respectively. Influent general chemistry parameters included pH of 6.8, alkalinity of 115 milligrams per liter (mg/l), TDS of 230 mg/l, total suspended solids of less than 2 to 5.6 mg/l, sulfate of
17 mg/l, TOC of 4.5 mg/l, and chloride ranging from 30 to 250 mg/l.
325

Table 15-4. Influent PFAS Concentrations
Influent Concentration Observed During Pilot Test (µg/L)
Analyte Analyte Acronym Low High Average
6:2 Fluorotelemer sulfonate
6:2 FTS 15 22 18
8:2 Fluorotelemer sulfonate
8:2 FTS 0.055 0.3 0.23
Perfluorobutane
sulfonate
PFBS 0.81 1.3 1.1
Perfluorobutanoic acid PFBA 0.89 2.1 1.3
Perfluoroheptane
sulfonate
PFHpS 0.85 1.4 1.1
Perfluoroheptanoic acid PFHpA 1.6 2.2 1.9
Perfluorohexane
sulfonate
PFHxS 18 25 22
Perfluorohexanoic acid PFHxA 5.9 8.9 7.7
Perfluorooctanoic acid PFOA 9.1 13 12
Perfluoronananoic acid PFNA 0.046 0.082 0.054
Treatment Technology Design Details for Full-Scale System
The permanent full-scale resin system was designed for a maximum flow rate of 200 gpm (0.76 m3/min), with
influent total PFAS concentrations of approximately 90 µg/l. The primary project objective was to consistently produce treated water with combined PFOS plus PFOA concentrations below the USEPA lifetime health advisory
(LHA) of 0.07 micrograms per liter (µg/l). The full-scale IX resin system was installed between fall 2017 and spring
2018, and the system officially commenced operation in April 2018.
Figure 15-10 shows a process flow diagram of the treatment system. The pretreatment portion includes bag filters to remove suspended solids and 6000-lb backwashable liquid GAC pretreatment filter to remove iron. The
PFAS removal system consists of two parallel trains of lead-lag regenerable IX resin vessels, each 86″ tall x 36″ diameter, packed with 49 cubic feet of ECT’s SORBIX A3F regenerable resin. These vessels are designed to
operate up-flow during normal operation, and down- flow during regeneration. Two parallel, 86″ tall x 36″ diameter
polish vessels are filled with IX resin for PFAS polishing, including short chains. The polish vessels operate in the down-flow mode and contain a blend of IX resins tailored to the general water chemistry and PFAS species and
their relative concentrations.
Influent Concentration Observed During Pilot Test (µg/L)
Perfluorooctane sulfonate PFOS 4.2 32 26
Perfluoropentanoic acid PFPeA 3.1 5.1 4.2
Sum of PFAS – 65 112 94
326

Figure 15-10. Block flow diagram of full-scale treatment system.
Source: Steve Woodard, ECT2, and Nathan Hagelin, Wood Group, PLC. Used with permission.
The in-vessel regeneration system (Figures 15-11 and 15-12) consists of a regenerant solution holding tank and
pump skid. The regenerant solution is a mixture of organic solvent and brine, which effectively strips PFAS from
the IX resin and then flows into a spent regenerant holding tank. The spent regenerant is recycled for reuse in
the next regeneration cycle by using a distillation and super-loading process. First, the spent regenerant is
transferred to a solvent recovery unit. Solvent makes up the majority of the regenerant solution and is recovered through distillation, given its low boiling point relative to water, and transferred to the regenerant supply tank for
reuse in the next regeneration cycle. The remaining distillate residue, known as the “still bottoms,” is a low-
volume, high PFAS concentration brine solution. The still bottoms are pumped through super-loader vessels that contain a proprietary resin blend, transferring the PFAS mass onto the super-loaded media. Super-loading is
the process by which a relatively small volume of highly concentrated PFAS solution is passed very slowly through
a small volume of media. The long EBCT approaches equilibrium (isotherm) conditions, thereby maximizing PFAS mass transfer onto the media and minimizing the amount of solid waste requiring disposal or incineration.
327

Figure 15-11. Regenerable and polish IX resin vessel skids.
Source: Steve Woodard, ECT2, and Nathan Hagelin, Wood Group, PLC. Used with permission.
328

Figure 15-12. Resin regeneration system.
Source: Steve Woodard, ECT2, and Nathan Hagelin, Wood Group, PLC. Used with permission
System Performance
The PFAS remediation system has been successfully treating the groundwater since system start-up in April
(Figure 15-13). Through December 2018, the effluent water quality from the IX resin system has been consistently
nondetect for the monitored PFAS compounds, including the short-chain species, readily achieving compliance with the treatment objective of
0.70 µg/l LHA target for PFOS and PFOA. Although 6:2 FTS has not been detected in samples collected from the IX
vessel effluent, it has been detected in the system effluent and is believed to be the result of transformation
processes that are not yet understood.
329

Figure 15-13. Influent and treated effluent total PFAS concentrations.
Source: Steve Woodard, ECT2, and Nathan Hagelin, Wood Group, used with permission
The system has been operated in the 35- to 70-gpm range since start-up, somewhat less than the design flow
rate. This has been done to accommodate higher than anticipated influent iron concentrations that have resulted in the requirement for frequent bag filter change-outs. The resulting extended EBCTs in both the
backwashable GAC pretreatment vessel and the IX resin vessels have resulted in better than projected PFAS
removals. Also, the resin regeneration schedule has been modified to accommodate the lower flow rate by removing one of the two parallel trains from service. This has allowed the resin vessels to be loaded closer to
design values. Four resin regenerations have been performed successfully through December 2018; however,
the IX media regenerated through December 2018 was not loaded to the full design capacity due to the reduced flow during early operation. Operational modifications have been made to address and correct minor
challenges with the distillation system, and regenerant recovery and super-loading processes have proven
successful. The original super-loading media is still operational, having removed and concentrated greater than
99.99% of the recovered PFAS mass; therefore, no PFAS waste has needed to be hauled off site to date.
Costs
The capital cost for the regenerable IX was $2.9M for all treatment equipment, process piping, pumps,
instrumentation, and system electrical. It does not include project management, construction management, the
extraction network and field piping, or the building and building mechanical or electrical systems.
330

15.3 Risk Assessment Case Study
The New Jersey Department of Environmental Protection (NJDEP) Division of Science, Research, and
Environmental Health conducted an initial assessment of PFAS impacts at a select group of surface water bodies in New Jersey (NJDEP 2018) (Figure 15-14). The results of fish tissue sampling from each site were used in a
risk assessment methodology to determine the need for fish consumption advisories for PFAS in each of those
water bodies.
Figure 15-14. Map of water bodies included in NJDEP fish tissue study.
Overall, fish tissue samples from up to 12 different species were collected from 11 specific water bodies
throughout the state. The water bodies were selected for sampling based upon their location relative to possible
PFAS sources and the likelihood that they could be used for recreational fishing. Samples were analyzed for 13
PFAS (PFBA, PFPeA, PFHxA, PFHpA, PFOA, PFNA, PFDA, PFUnA, PFDoA, PFBS, PFHxS, PFOS, and PFOSA), and
as presented in Figure 15-15, the results indicated that the predominant PFAS detected in the fish tissues was PFOS.
331
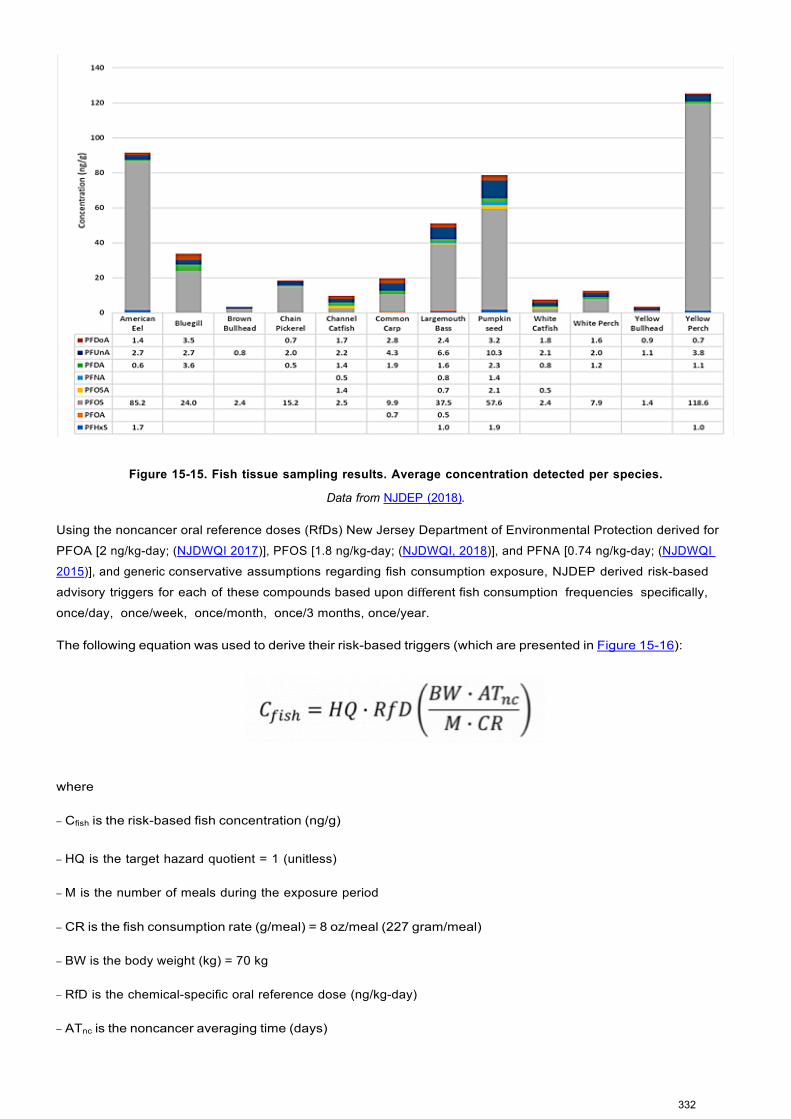
Figure 15-15. Fish tissue sampling results. Average concentration detected per species.
Data from NJDEP (2018).
Using the noncancer oral reference doses (RfDs) New Jersey Department of Environmental Protection derived for
PFOA [2 ng/kg-day; (NJDWQI 2017)], PFOS [1.8 ng/kg-day; (NJDWQI, 2018)], and PFNA [0.74 ng/kg-day; (NJDWQI
2015)], and generic conservative assumptions regarding fish consumption exposure, NJDEP derived risk-based
advisory triggers for each of these compounds based upon different fish consumption frequencies specifically,
once/day, once/week, once/month, once/3 months, once/year.
The following equation was used to derive their risk-based triggers (which are presented in Figure 15-16):
where
– Cfish is the risk-based fish concentration (ng/g)
– HQ is the target hazard quotient = 1 (unitless)
– M is the number of meals during the exposure period
– CR is the fish consumption rate (g/meal) = 8 oz/meal (227 gram/meal)
– BW is the body weight (kg) = 70 kg
– RfD is the chemical-specific oral reference dose (ng/kg-day)
– ATnc is the noncancer averaging time (days)
332

Figure 15-16. Risk-based fish advisory triggers.
Data from NJDEP (2018).
Because of concerns associated with the potential developmental health effects associated with these chemicals
and given a lack of acute toxicity values for these compounds, NJDEP did not recommend advisory levels for the
once/3 months and once/year exposure frequencies for high risj populations (young children, pregnant and lactating women, women of childbearing age), and the once/month value is the least frequent consumption
category recommended for these high risk populations.
A comparison of the derived risk-based advisory levels with the measured concentrations in fish tissue samples from each of these waterways resulted in NJDEP recommending the following fish consumption advisories for the
general population (Figure 15-17).
Figure 15-17. NJDEP fish advisories for general population.
Data from NJDEP (2018).
333

15.4 Risk Communication Case Studies
15.4.1 Little Hocking Water Association (LHWA), Ohio
The communication and community participation strategy used for residents served by the Little Hocking Water
Association (LHWA) in southwest Ohio produced effective results in motivating actions by individuals, government,
and industry which led to a significant, measurable reduction in residents’ blood PFOA levels.
A community-first strategy was implemented at the Little Hocking, Ohio, site to effectively communicate scientific
results and findings in a manner that embodies the principles of community-based participatory research
(CBPR). This type of strategy combines scientific methodology with community capacity-building strategies to address the disparities and power imbalances among stakeholder groups (business owners, residents,
regulatory, and responsible party). If properly implemented, CBPR can result in trust rebuilding, management of
environmental justice matters, empowerment to those affected by providing information for informed action, and
improved research and data collection (Viswanathan (Viswanathan et al. 2004; Hartwig, Calleson, and Williams 2006; O’Fallon, Tyson, and Dearry 2000; Executive Order 12898 1994). The following is a case study summary of
the Little Hocking, Ohio, site (Emmett et al. 2006; Emmett et al. 2009; Emmett and Desai 2010).
15.4.1.1 Site Description
The LHWA is a rural water authority that serves several small communities with a total population of approximately 12,000 residents in 4,000 households. The reticulation system extends around 25 miles into Ohio
from Little Hocking, a small rural community along the Ohio River in Washington County, Appalachian Ohio.
Based on the 2010 U.S. Census, the total population of Little Hocking was 263, predominately Caucasian, majority between the ages of 18–64 years, and 21.5% of individuals live below the poverty level. The water intake
wells for the LHWA are located directly across the Ohio River from a Teflon production plant that used ammonium
perfluorooctanoate (APFO, the ammonium salt of PFOA). This plant was physically located in West Virginia;
therefore, the enforcement and regulation of the plant and its emissions fell to the West Virginia agencies.
Since the 1950, the plant was known to historically release APFO into the air and water and to dispose of byproducts containing APFO in local landfills (WV DEP 2002). APFO readily converts to its anionic form, PFOA, in the
environment. When tested in 2001 and 2002, the LHWA source wells had levels ranging from 0.855 ppb to 7.69
ppb. Community concerns were raised because PFOA detections in the water supply were considerably higher
than any reported PWS in the United States at the time. Prior to the study summarized here, there was no information about the sources of PFOA that was being detected in human blood in widespread locations. In the
absence of this information, the West Virginia Department of Environmental Protection convened the C-8
Assessment of Toxicity Team, and developed a health protective screening level for water at 150 ppb. In addition, an interim action level of 14 ppb was established by a USEPA Consent Order with the responsible party. In August
2002, groundwater borings advanced in the LHWA well field contained PFOA concentrations up to 78 ppb. A class
action suit was initiated, and distrust increased among the affected community and both the government and
responsible party.
To investigate community concerns about potential PFOA contamination of residents in the LHWA district, a
partnership was formed between the University of Pennsylvania School of Medicine, a local health provider, and
the Decatur Community Association, made up of residents living within the LHWA district. The partnership
obtained an environmental justice research grant from the National Institute of Environmental Health Sciences.
The research was designed to engage the affected community on all aspects of the study to determine (1)
whether blood PFOA levels were elevated in the community, compared with Philadelphia residents and with
published population values; (2) if blood PFOA levels were elevated, was the source air, water, or some other
combination of exposures; and (3) if levels were elevated, were there changes in certain biomarkers of potential
toxic effects.
334

A community advisory committee (CAC) was formed with local residents served by the water supply, local
physicians, state and federal government representatives, a health researcher, and a school system representative. A community project coordinator was employed as a communication enabler. The CAC met
quarterly and all meetings were open to the public with the only participation restrictions being that the attorneys
and plant representatives were not permitted to take part in the discussions. Community advice was particularly sought as to which scientific questions to address, development and wording of questionnaires, communications
with residents, and citizen concerns. The CAC utilized newsletters to keep local residents and other stakeholders
informed. These newsletters and CAC meeting minutes were posted on a CAC study website.
The study team collected blood serum PFOA, hematologic and biochemical biomarkers, a questionnaire to obtain
information on demographic and occupational information, and health conditions from a stratified random sample of residents in the LHWA reticulation area. The median blood PFOA levels for residents were
approximately 80 times those of the general population and similar to levels reported for production workers at the
fluoropolymer facility. PFOA levels were higher in children and the elderly. Residents using LHWA water who
worked in production areas of the plant had PFOA levels that reflected additive effects from both exposure
pathways. Residents who primarily used well water for domestic purposes had PFOA levels that correlated with
the PFOA concentration in well water. No impact was seen from living in areas with higher estimated air levels.
15.4.1.2 Community-First Communication Strategy
After data had been collected from participants, but before any results were available, the CAC discussed and
developed a communication strategy. For this purpose, the CAC developed a set of general principles for
communication and a list of priority targets representing the community’s preferred order for communication of results:
LHWA Residents’ General Principles for Communications, from Emmett and Desai (2010) and Emmett et al. (2009).
• Results should be released promptly, but not before the investigators are comfortable in doing so.
• Individual participants should receive their results first to avoid participants first learning study results
from the press, neighbors, or friends.
• The press should be informed in a manner that is both timely and allows the investigators to
control the message as much as possible.
• The study must remain a credible source of information.
• Communications should maximize constructive responses to the
findings. Communications should minimize pointless concern.
• Questions from individuals should be answered promptly.
LHWA District Residents’ List of Priority Targets for Communication of Results, from Emmett et al. (2009).
• study participants and community (residents of the water district)
• community advisory committee
• relevant authorities and representatives (county and state health departments, state Department of Environmental Protection, local water authorities, state and federal elected government
representatives for the area, local townships, sheriffs’ departments, USEPA)
• local medical providers
• local media
• national media, as necessary.
335

Once the general principles of engagement were established, the CAC developed a communication strategy and
plan. The CAC determined that the strategy required multiple modes of engagement that enforced consistent simple messages and consideration of careful timing to mitigate development of inaccurate perception of risk and
management strategies. The communication plan was a “living document” to facilitate continued integration of
stakeholder input, regulatory development, and scientific advancement. The sequence of communications commenced with mailings to participants at the end of July 2005 and culminated in a community meeting on
August 15, 2005, where full results were presented.
15.4.1.3 Results and Use of Risk Communication Tools
1. Notifications to Participants and Authorities—Biomonitoring results were sent via next-day-delivery mailings to individual study participants. These results included the individual’s blood PFOA and biomarker levels
as well as comparative information on PFOA levels (including blood levels for national and site facility
workers, general US population, and community neighborhoods) and a toll-free telephone number to contact a study physician with any questions. Letters containing aggregated, not individual, results
were sent simultaneously to identified authorities and CAC members, to ensure that recipients would
be able to respond appropriately to inquiries from the public.
• Lessons and Takeaways: Calls often needed to be returned after business hours. Most
concerns focused on higher levels in children and the elderly, and possible interactions of elevated PFOA levels and particular medical conditions.
2. Initial Press Release and Briefing—Key local and regional media were identified and informed of the communication plan around the date the participant letters were sent. An initial press release and
briefing were made the second day after the results were mailed to ensure that participants did not first learn of the issue through the press, while still providing investigators an opportunity to be the
primary source of information to the press. Identified media representatives and national news
outlets were invited to the news briefing. The release simply identified that levels in LHWA residents were much higher than those in the general US population, and that water had been identified as
the major source of exposure. Interested stakeholders were urged to attend a community meeting
where comprehensive results would be released and discussed. • Lessons and Takeaways: The reporting by local and national media did not misconstrue information
and local media participated as per the communication plan. The CAC perceived the media
coverage as constructive. The community expressed great satisfaction that participants had received their results first.
3. Closed Rehearsal of Community Presentation—A full closed-door rehearsal presentation (summarized in the subsequent bullet) was presented by the study team to the CAC prior to the community
meeting. The closed rehearsal ensured that the community meeting presentation was as inclusive
and useful as possible. • Lessons and Take-Away: The CAC requested a presentation that was careful and simple to
understand, incorporating a clear visual map so that residents could locate their residences
with respect to the study results. During rehearsal, the CAC members provided feedback on the order of the agenda, comprehensibility of slides, choice of wordings to accord with
terminology and usage in the area, structure of the presentation, and dealing with likely
questions.
336

4. Community Meeting—The meeting commenced with “ground rules,” such as lawyers were not to solicit clients and questions were to follow the presentation. It was also communicated that continual
stakeholder feedback is a success factor of the communication plan. In addition, representatives from the facility were invited to attend but were not permitted to present. The 45-minute presentation
given by the study team detailed partnership objectives and study methods, results, and
recommendations. A two-hour question and answer period followed the presentation. A summary of the study, recommendations (including the use of bottled water), sources of information, and how to
access a study physician were distributed to all attendees on exit. The meeting summary and
information on accessing free bottled water were mailed to households in the LHWA district and local
authorities and representatives. • Lessons and Takeaways: The meeting proceeded in a constructive manner as CAC community
members had predicted and not in the angry manner outside public relations experts had
predicted. Any anger was directed at the responsible party and not at the investigators.
5. Publication of Results and Information—Following the community meeting, a newsletter with test result summaries was issued. A website with meeting presentation slides, test results, and FAQs was also
developed. A summary of results was sent to all LHWA district residents.
• Lessons and Takeaways: The website received many hits. The study and recommendations did not prove controversial. The practitioners did not encounter antagonistic relationships between
the different parties.
6. Availability to Answer Questions—Physicians from the study team made themselves available to the public to answer questions from individuals and also from treating health care professionals.
• Lessons and Takeaways: This service was appreciated. Questions mostly focused on the impact on residents with particular conditions such as liver and kidney disease. The many uncertainties
surrounding the risk to humans were openly acknowledged.
15.4.1.4 Effectiveness of Communications
On the day results were presented and approximately 2 weeks after the initial press release, the responsible party announced that it would make free bottled water available to LHWA district residents (3 liters per day per
person). Seventy- eight percent of eligible households accepted the offer.
Sixteen months after dissemination of the study results, a follow-up study of participants was made, which
included repeat blood PFOA levels and questions about any changes in water usage. Sixty-five percent of
those in the initial study participated in the follow-up, of whom 95 percent had made some change in their residential water usage in a way that would be expected to reduce PFOA intake. Eighty-eight percent had
followed study recommendations to switch to using bottled water. The group median blood PFOA had declined
26%, consistent with a large effect for a pollutant with a half-life of approximately 4 years in humans.
USEPA used the results to enter into a consent agreement with DuPont to provide bottled water for the other
impacted communities near the plant with >0.5 ppb of PFOA in water, and the states of Minnesota and New Jersey set provisional standards for PFOA levels in drinking water.
Lessons and Takeaways: The results and communications strategy resulted in 95% of participants had made a
change to their water source. This response greatly exceeds the usual level of response seen with public health
interventions. All parties, individuals, corporations, and governments acted in a prudent way with the disseminated information. Not all residents reacted by adopting the specific recommendations from the study; the alternate
actions some individuals took are consistent with the information being incorporated into individuals’ own risk
perceptions and with the development of a free market of solutions (individual decision making based on available information).
337

15.4.1.5 Case Study Summary
The Little Hocking Community-First Communication Strategy resulted in a great increase in alternate water source use by impacted community members and subsequently, a reduction in community PFOA blood levels. The success
of the communication plan at the Little Hocking site was underlain by the four dimensions of risk communication:
• Understanding: Investigators worked with the community through the CAC to establish the
communities’ preferences and priorities in the form of a communication strategy and plan to maintain simplified and consistent messaging among stakeholder groups and interested
parties, such as the media.
• Perception: Risk perception factors were incorporated into the outreach strategy, including residents’ knowledge of PFOA biomonitoring results and associated illnesses, ability to access
a physician, presence of vulnerable subpopulations (higher PFOA levels in children and the
elderly), proximity of individual residences to elevated concentrations within the study area (sense of a safe place), and possible interactions of elevated PFOA levels and particular
medical conditions.
• Participation: The affected community actively participated in all components of the
communications.
• Evaluation: Success and effectiveness of the communication process were assessed
based on feedback from the CAC, surveys of residents, and review of newspaper articles and
other media content. In addition, a follow-up study was performed that addressed the
effectiveness in terms of lowered blood levels of PFOA and a questionnaire about whether
and how community members had changed their drinking water source as a result of the risk communication strategy.
15.4.2 State-Led Community Involvement Case Studies
The Environmental Council of the States (ECOS), in collaboration with the USEPA Office of Research and
Development and the Association of State and Territorial Health Professionals, has developed a series of case
studies presenting how state regulatory agencies are performing risk communication to PFAS-impacted stakeholders: https://www.ecos.org/documents/state-level-risk-communication-of-pfas-and-habs/
15.4.3 Washington County, MN: A State’s Approach to Risk Communication
Washington County is home to 3M’s Cottage Grove manufacturing facility as well as several disposal facilities
where PFAS had been routinely disposed. Beginning in 2002, the State of Minnesota pursued drinking water investigations at the 3M facility and later near 3M’s waste disposal sites in Washington County. According to the
2010 US Census, the population of Washington County, Minnesota was about 238,136, with the majority being
Caucasian and between the ages of 18 and 64. Over 1,800 private wells, four major aquifers, eight municipal
water supply systems, and over 150 square miles of groundwater were affected by the contamination. This
impacted the drinking water supply of over 140,000 residents. After they were determined as the responsible
party, 3M remained involved in the remediation efforts and paid for the majority of sampling throughout the
county in coordination with MPCA.
This case study is discussed in the context of the risk communication plan.
15.4.3.1 Identify the Issue
The most widespread PFAS compound found in the region is PFBA. Additional prominent compounds include PFOS, PFOA, PFHxS. PFPeA, PFHxA, and PFBS which were always present as a mixture. When investigations
began in 2002, there were many challenges to determining the impact for people as the science was in the
very beginning stages of development. Therefore, MDH developed health-based guidance for PFOA and PFOS
and the MDH lab developed the method to analyze water sample for PFOA and PFOS. As the science has progressed, MDH continues to update methods and health-based guidance.
338

Site communications are organized and performed in collaboration primarily between the Minnesota Department
of Health and the Minnesota Pollution Control agencies. However, as with other PFAS sites, the site covers multiple local, county and state entities. Communications frequently entail only one or a few cities rather than the
entire site. They may also need to be coordinated through all the cities and the county. This leads to multiple
plans with multiple partners that are specific to an issue or communications plans developed for a specific project. The fundamental traits of successful risk communication over time and with all stakeholders for MDH
include: empathy, care, competence, expertise, honesty, dedication, and commitment.
15.4.3.2 Set Goals
General communication goals and objectives for the site:
Goal: Inform people about potential hazards to their person, property, or community and help them to
make informed decisions about risks to their health.
• Objective: Develop approved message blocks for PFAS topics and house in accessible format to encourage consistent information is used for all materials developed.
• Objective: Provide regular updates about remediation activities at stakeholder group
meetings including agency PFAS training meetings, county workgroup meetings, city council meetings and public meetings
• Objective: Provide regular updates about health risks as scientific information changes/evolves at stakeholder group meetings including agency PFAS training meetings,
county workgroup meetings, city council meetings and public meetings
Goal: Encourage people to take precautions to reduce exposure to PFAS
• Objective: Homes with contaminated drinking water are issued drinking water advisories and
either connected to the city water or supplied with GAC filters that are maintained by the state.
• Objective: Keep updated information about actions people can take to lower their exposure to PFAS on MDH website and MPCA website.
• Objective: Mobilize stakeholder groups in the county or local communities to encourage people
in their area to participate in remediation activities and processes offered by MPCA and
contractors.
Goal: Provide background information and present risks in an understandable way, using plain-
language messaging.
• Objective: Provide opportunities for people impacted by contamination to connect with
appropriate staff to find information and to ask questions if concerned. Objective: User test materials using MDH Plain Language
• Workgroup Goal: Bring new information as soon as available to build trust
• Objective: Provide public meetings with open house sessions before and after a main presentation to bring new information to community
• Objective: Provide availability sessions to encourage concerned people impacted by changes to learn more about their individual situations.
Project specific communications goals example:
Since 2002, there have been multiple changes in PFAS health based values provided by MDH, analytical
advances which have impacted lab results, an investigation that looked at PFAS in garden produce and dust, multiple biomonitoring studies, fish monitoring and consumption guidance, drinking water and source water
investigations, and a study to test point-of-use water treatment devices. All of these projects and scientific
advances have resulted in specific communications to affected communities with goals and objectives tailored to
the issue or project.
339

15.4.3.3 Identify Communities and Constraints
MDH catered their risk communication strategy to the following:
Residents of affected communities
Local governments: cities, townships, and their staff of varying
sizes Washington County public health and environmental
staff Legislators
Other state agencies including MPCA
Constraints include the size of the area and the multiple local governments. The character of each township
and city vary widely with different capacities to manage local information dissemination to affected residents.
This requires communicators to develop relationships with each stakeholder group. The risks and impacts of
PFAS contamination are managed differently for those on public water and private wells. Therefore, the correct
information needs to be available in many different forms for different stakeholders.
15.4.3.4 Community and Stakeholder Assessment
Minnesota’s risk communication strategy in response to the Washington County PFAS drinking water contamination
has been centered around community engagement and forging strong relationships with community members.
Building these relationships enabled them to build trust with the community and develop new communication channels.
The Minnesota Department of Health (MDH), in conjunction with the Minnesota Pollution Control Agency (MPCA),
maintains a hands-on risk communication approach. Information about community needs for information is
gathered through regular update meetings with stakeholder groups and local government leaders. Public meetings, availability sessions and face to face interactions with community members during remediation activities
provides a base of information for the ongoing communication efforts. MDH also maintains a 24/7 email and
phone line for people to access with concerns or for information about site activities.
Minnesota had been engaging directly with affected communities since 2002. Having had a long-standing
relationship with affected communities, MDH has a history of responding to the specific needs of the affected
communities and has tailored its messaging to their knowledge level. Although basic information about PFAS is
always available, the general level of knowledge amongst key stakeholders is high. For this reason and with these communities, MDH representatives lead with high-level information, as the attendees to the public meetings
typically are interested in specific updates as opposed to rudimentary background information.
15.4.3.5 Identify Messages
MDH maintains a message block document with approved message blocks about a variety of topics for internal
staff use. This document serves as the basis for specific information sheets developed for different stakeholder
activities. It is also a resource to answer questions from concerned community members. Topics include health
risk of PFAS, MDH guidance value information, current site activities, exposure information, fish consumption
guidance, swimming, cumulative health risk, breastfeeding and health risks, PFAS and links to health problems, testing blood for PFAS, biomonitoring information, gardening and PFAS, and results of MN Cancer Surveillance
System reports.
MDH notes the importance of discussing the scientific method with stakeholders to remain transparent about
their course of action. They also share new knowledge as it becomes available and do not wait until they have a
perfect message or until they know all of the facts to engage with the community. In an effort to uphold their
principle of transparency, MDH acknowledges points of uncertainty and are clear about what they do not know
when communicating with the public.
340

The messages are presented in different ways to different communities depending on the level of understanding
that a community has about PFAS. For example, we had several meetings in 2018 for communities. One
meeting was to a community which had not had PFAS contamination issues until 2018. The information for this community was presented in more of an elementary, broad overview style and level. Another presentation in the
same month was to a neighboring community that had been involved with PFAS contamination since 2002. The
presentation focused more on what the new information was rather than PFAS basics as the community had a more developed understanding of PFAS.
Examples of specific messages:
• Testing is available for households on private wells that would like their drinking water tested for PFAS. If test results show elevated levels, options are available from the MPCA for treating the
water andreducing exposures. Currently, PFAS levels found in the drinking water supply in
impacted communities have been within the margin of safety for the current drinking water
guidance values, and outright negative health effects from these exposures are not expected
with what is currently known about PFAS exposures and health effects.
• Affected water supplies are safe to use to water produce in
home gardens.
• Biomonitoring Data Shows Interventions are working
• Because of the extreme persistence and mobility of these compounds, a PFAS megaplume developed which is much larger than early modeling predicted. One of the primary factors in
this was the unanticipated transport of PFAS via surface water and then re-infiltration to
groundwater far away from the source areas – a transport pathway not typically seen in persistent environmental contaminants, which tend to adsorb to organic carbon in soils and
sediments.
Figure 15-18 includes biomonitoring data for three PFAS compounds over the time period from 2008 to 2012.
This study shows that although we can’t answer questions about health effects, we can demonstrate the work
we are doing to reduce exposures has paid off.
Figure 15-18. Biomonitoring Data
Source: Courtesy of the Minnesota Department of Health
341

15.4.3.6 Select Communication and Engagement Tools
MDH’s risk communication strategy facilitates community engagement and open dialogue.
• Engaging with stakeholders and communities as soon as possible when there is any change in risk
management of PFAS. Builds trust over time that MDH will be there to support and help communities.
• MDH sends the right people/experts/staff to deliver messages. Over time, staff have built relationships
with stakeholders.
• When interacting with people impacted by the site, staff stays until all questions are answered –
whether it is a phone call, a public meeting or availability session
• MDH has a service-oriented approach to community engagement. They recognize that educating the
community members will carry a ripple effect. Attendees from the meetings who learn through the
presentations and the open house format will then take the information and share it with other
members of the community.
MDH used the following strategies to connect with and inform the affected communities:
• Hosting Public Meetings: Public meetings have been a significant part of community engagement in Washington County. MDH has held public meetings in an open house, presentation, and Q&A
format. An open house is followed by a presentation given to the attendees, after which they provide a time for questions and answers, followed by additional open house time. Participants are able to
ask questions about their particular situations in an open forum setting or in one-to-one conversations.
For example, in Spring 2017, MDH in collaboration with MPCA held two presentations in different areas
of Washington County. The city of Cottage Grove meeting attracted 130 people. In Lake Elmo, a region where the majority of residents have private wells, approximately 120 people attended the
public meeting.
• Hosting Availability Sessions/Office Hours: MDH organized opportunities to provide people with time to
interact with staff one on one and ask questions. Typically, MDH held these events after major
sampling events happened or when new or updated information was released. MDH extended these opportunities upon request of the community. The events were widely used. In an event held in Fall
2017, the office hours held in Lake Elmo where the majority of residents have private wells attracted
45 people. With the affected area being so large, personal communication was helpful in establishing
relationships with members of the community.
• Providing Online Resources: The MDH website outlined the history of PFAS in Minnesota as well as actions they have taken and health-based guidance information. An electronic online sampling request
form was available on the MDH website. An electronic map on the website shows where MDH is sampling and community members could see and check their property’s location in relation to the PFAS
contaminated sites. MDH also had a widely used email address for residents to ask questions directly
to the department. They could also subscribe to the government’s delivery email list to get new information directly to their inbox.
• Communicating with Local Government: MDH prioritized communication with local government because it was a useful tool in keeping the communities informed. They visited city councils to provide
updates on the PFAS investigations. They also provided technical support to local governments and
their staff that were responsible for protecting public drinking water.
• Using the Media: MDH used press releases and interviews to disseminate information. Social media became a useful tool as well.
342

15.4.3.7 Implement Strategy
Strategies implemented included:
• Drinking Water Advisories: Over 2700 private wells have been sampled in the East Metro and over 1,
100 drinking water advisories have been issued. Homes that have been issued drinking water advisories are either connected to city water or provided bottled water and/or GAC filters maintained by
the state. MDH and MPCA collaborated to communicate and coordinate action for this work.
• Public Water Systems: There are five community public water supplies in the East Metro that have individual wells above the MDH health-based guidance values. All of these cities put in place interim
measures to manage their public water supply systems to provide drinking water at or below the MDH health-based guidance values. MDH collaborated with these communities to provide information to
residents.
• Messages to Community: After developing health-based guidance values for PFAS compounds, MDH sought to explain to the community what these values mean and what concerns they address. They
also explained the next steps in their action plan.
• Reiterating Commitment: MDH drives home the message that they are committed to bringing updated
information to the communities to inform them of the status of their efforts. This assures the
community that MDH is determined to support them and address their concerns.
• Collaboration with Other Stakeholders: MDH collaborated with MPCA on a response to the PFAS contamination. Any message that were released to the public by MDH was in conjunction with MPCA.
ATSDR also developed a community engagement book which has guided MDH’s risk communication
strategy. Additionally, MDH worked closely with city administrators and community leaders to keep them informed prior to the public meetings.
• Concessions: When drinking water levels were found to be above guidance values in private wells, bottled water was provided by MPCA until a GAC system can be installed.
15.4.3.8 Evaluate, Debrief and Follow Up
Continuous improvement of risk communications and activities through evaluation and through providing
feedback loops with stakeholders supports the ongoing implementation strategies described above. The sampling and remediation activities have been widely successful in part due to the community engagement and
communications efforts that have built trust in the community for the state agencies.
Evaluation methods used to understand effectiveness of communications content and process include one on
one surveys at events, hot washes with partner agencies after communications efforts, and feedback from
community leaders at regular update meetings.
Continuously improving, refining, and developing materials to meet community concerns and needs that are
identified by inquiries or contacts staff have with community members. Contacts are primarily through 24/7 email
and phone line as well as in person while in the field or at public events.
Materials have been developed in many formats over the years and have changed due to capacity for communities
to use various methods and MDH capacity to produce them – video, face to face meetings, print, social media in
coordination with partners. Investigations and other information have also resulted from community concerns.
These include Cancer Incidence Reports, home and garden study, site-specific meal advice for fish consumption, point-of-use filter testing, clinician information sheet, and an information sheet about testing blood for PFAS.
343

15.4.3.9 Successful Outcomes
The Minnesota Department of Health has been very successful in community engagement:
• They have earned the trust of the community, and residents are assured that MDH is working hard to
solve the issue at hand. The number of people participating in sampling and remediation speaks to
the efforts made to connect with affected people. Exit surveys from public events have shown that
people feel staff are working hard and are good at the work they do.
• MDH also has invested their resources in research and has made strides in understanding the health impacts of the PFAS contamination their state is facing. Many of the investigations and projects were
in response to concerns collected through contacts with community members and leaders. These
include Cancer Incidence Reports, home and garden study, site specific meal advice for fish
consumption, point-of-use filter testing, clinician information sheet, and an information sheet about testing blood for PFAS.
• They have used biomonitoring to demonstrate that their efforts have reduced the PFAS levels in
people’s bodies. This has provided the community with tangible evidence that the work they are doing is
making a difference.
15.4.3.10 Lessons Learned
• It is vital to be on the ground and engage with the community face-to-face. This helps build trusting
relationships with the community which has facilitated the remediation efforts and supported reducing
exposures to PFAS for community members.
• The cross-agency effort to address the PFAS concerns in Minnesota is a challenge and takes effort to
coordinate, but over time has been an effective strategy to address exposures to PFAS in a timely
manner.
• Dealing with residential homes and homeowners can be complex. Because PFAS is a complex emerging contaminant for which research and information is constantly evolving, it can be a
challenging to return to residents with new guidance values based on new health risks. The
information has to fit for those who are familiar with PFAS and those who are new homeowners or
residents in affected communities.
• It is important to learn what information residents are looking for and relay it in an articulate manner
and in a way that is useful to them. Another concern Minnesota residents have had is a potential decline in property value, but this concern has faded with time.
• Additionally, it is important to be understanding and sympathetic toward the affected residents when
they are upset. They are concerned for the well-being of their families.
15.4.3.11 Better Practices Moving Forward
Moving forward, MDH notes that sites across the state have similar circumstances and similar concerns. The
lessons learned from sites they have already worked with have been beneficial in refining their approach with
other affected communities and contaminants. They have had success with duplicating their strategies and
methods at other sites. Although the general principles have been effective, every community is slightly different.
MDH takes the time to understand the dynamics of each particular community and tailor their risk communication
methods accordingly.
Updated September 2020.
344
16 Surface Water Quality
The purpose of this section is to support the PFAS Technical and Regulatory Guidance Document (PFAS Guidance
Document) users (state and federal environmental staff, stakeholders, project managers, and decision makers)
to gain a working knowledge of the current state of PFAS science and practice for surface water quality. The section does not include calculated criteria, rather it provides available information and references that can then
be used to support development or review of criteria or guidance values to protect surface water quality.
Section Number Topic
16.1 Introduction
16.2 Protection of Human Health
16.3 Protection of Biota
16.4 Sampling and Analysis
16.5 Surface Water Foam
16.1 Introduction
This section provides information to help fill in the gaps related specifically to concerns with PFAS-impacted surface water and associated receptors. Several states have expressed a need for technical information to
support the development of surface water quality criteria (WQC) or guidance values for uses other than
drinking water, including but not limited to habitat for fish and other aquatic life. USEPA (2020) developed recommendations and provided derivation methods for surface water criteria “for determining when water has
become unsafe for people and wildlife using the latest scientific knowledge.” States and tribal governments
may, and sometimes do, develop their own numerical criteria. To protect human health, the states and tribal
governments may also establish water body–specific fish consumption advisories for certain aquatic species. These advisories are recommendations and not enforceable. This section provides technical information
regarding PFAS in surface water that individual states and tribal governments can consider individual states
and tribal governments when developing criteria according to their own processes and policies. This information focuses on two main issues. First is the protection of human health from a variety of potential exposures to
PFAS in surface water, such as drinking water, consumption of fish and other aquatic species, and from
recreational activities. Second is the protection of biota, based on available ecotoxicity data, bioaccumulation and concentration factors, and aquatic-dependent wildlife considerations, among others.
As of the writing of this document, there are few formally established surface water criteria for any PFAS that are
protective of uses of surface water other than as drinking water. Florida, Minnesota, and Michigan are examples
of states that have aquatic life protection values (https://pfas-1.itrcweb.org/fact-sheets/).
In addition to the well-established issues associated with PFAS in surface water, such as use of the surface water
as a source of drinking water and accumulation of PFAS in biota, this section also includes a discussion of a
relatively new issue related to surface water: PFAS-containing foam. Investigations in at least three states—
Minnesota, Michigan, and Wisconsin—have found that concentrations of PFAS in surface water, or discharging to
surface water, at sufficient levels can generate foam on surface water. That foam acts to remove PFAS from the
water column, but also acts as a secondary source of PFAS as the foam leaves the surface water and is deposited
in other locations.
345

16.1.1 Beneficial Uses
One of the first steps in developing the criteria is to determine the beneficial uses that are to be protected for
the water body of concern. These have usually been developed by the state organization responsible for water quality and/or water resources for the state. That regulatory agency assesses potential beneficial uses and
assigns appropriate designated uses for a water body. As examples, in Massachusetts this task is the
responsibility of the Massachusetts Department of Environmental Protection, while in California it is under the purview of the nine Regional Water Quality Control Boards that establish potential beneficial and designated uses
for the water bodies for each region. The process for establishing these beneficial uses in most instances
follows protocol developed by USEPA (2020).
With the potential adverse health effects associated with the ingestion of certain levels of various PFAS, negative impacts on beneficial uses of surface water may occur. Table 16.1 provides a fairly comprehensive list of potential
beneficial uses for surface water. This table is a compendium taken from the Water Quality Control Plan (Basin Plan) for
the California Regional Water Quality Control Board, Central Valley Region, Fourth Edition, Sacramento and San Joaquin River
Basins (RWQCB-CVR 2016). Different jurisdictions use different lists of beneficial uses. The list in Table 16-1 is used
for illustration. For an evaluation of PFAS, the list may be substantially reduced in order to focus on those that are
appropriate, as the presence of PFAS may not have an impact on a particular use (for example, navigation). In the
table the list has been reduced by separating the beneficial uses that may be impacted by PFAS (light blue) and those that are not likely to be (light green). The list can be further reduced by combining several of the uses that
evaluate similar issues, such as aquatic toxicity. As an example, the beneficial uses listed as WARM, COLD, EST,
WILD, BIOL, and RARE (see Table 16.1) are each designed to protect aquatic species that have a range of attributes. The beneficial use for shellfish could be added to that grouping by expanding the evaluation under it to
include benthic organisms and sediment quality.
Table 16-1. Beneficial Uses
Source: Adapted from RWQCB-CVR (2016)
Beneficial Use
Description
Does PFAS Have Impact on Use? Covered in this Section
1.
Municipal and Domestic
Supply, Use as Drinking Water (MUN)
Uses of water for community, military, or individual water supply systems,
including, but not limited to, drinking
water supply.
Yes
2.
Agricultural Supply (AGR) Uses of water for farming,
horticulture, dairy operations, or
ranching.
Yes
3.
Primary Water Contact Recreation (REC-1)
Uses of water for recreational
activities involving body contact with
water, where ingestion of water is reasonably possible.
Yes
4.
Groundwater Recharge (GWR) Uses of water for natural or artificial
recharge of groundwater.
Yes
5.
Commercial and Sport Fishing (COMM)
Uses of water for commercial or
recreational collection of fish,
shellfish, or other organisms.
Yes
346

6.
Aquaculture (AQUA)
Uses of water for
aquaculture or mariculture
operations.
Yes—not all components
covered under other beneficial uses—harvesting
of aquatic plants for human
consumption
7.
Warm Freshwater Habitat (WARM) Uses of water that support warm
water ecosystems.
Yes—combine with COLD
8.
Cold Freshwater Habitat (COLD) Uses of water that support cold water ecosystems.
Yes—combine with WARM
9.
Estuarine Habitat (EST)
Uses of water that support estuarine ecosystems.
Yes—combine with WARM
and COLD for ecotoxicity for all of the aquatic
species
10.
Wildlife Habitat (WILD)
Uses of water that support
terrestrial or wetland ecosystems.
Yes—food chain issues, in addition to WARM, COLD,
and EST
11.
Spawning, Reproduction,
and/or Early Development
(SPWN)
Uses of water that support high quality aquatic habitats suitable for
reproduction and early development
of fish.
Yes
12.
Shellfish Harvesting (SHELL) Uses of water that support habitats suitable for the collection of filter-feeding
shellfish.
Yes
347

Beneficial Use
Description
Does PFAS Have Impact on Use? Covered in this Section
13.
Hydropower Generation (POW)
Uses of water for hydropower
generation.
No—PFAS not expected to
impact POW
14.
Industrial Process Supply (PRO) Uses of water for industrial activities that depend primarily on water quality.
No—as below for IND
15.
Freshwater Replenishment (FRSH)
Uses of water for natural or artificial
maintenance of surface water quantity or quality.
No—issues covered under other beneficial
uses
16.
Non-contact Water/Secondary
Contact Water Recreation (REC-2)
Uses of water for recreational activities involving proximity to
water, but where there is generally
no body contact with water, nor any likelihood of ingestion of water.
No
17.
Preservation of Biological
Habitats of Special Significance (BIOL)
Uses of water that support designated
areas or habitats, such as established refuges, parks, sanctuaries, ecological
reserves, or Areas of Special
Biological Significance, where the preservation or enhancement of
natural resources requires special
protection.
Not covered individually—
covered under WARM, COLD, EST, and WILD
18.
Rare, Threatened, or
Endangered Species (RARE)
Uses of water that support aquatic habitats necessary, at least in part, for
the survival and successful maintenance of plant or animal
species established under state or
federal law as rare, threatened, or endangered.
Not covered individually—
covered under WARM,
COLD, EST, and WILD
19.
Migration of Aquatic Organisms (MIGR)
Uses of water that support habitats
necessary for migration or other temporary activities by aquatic
organisms, such as anadromous fish.
No—issues already covered under other
beneficial uses
20.
Industrial Service Supply (IND)
Uses of water for industrial activities that do not depend primarily on water
quality, such as mining and cooling
water.
No—concern is the discharge of the water to
another location
21.
Navigation (NAV)
Uses of water for shipping, travel, or other transportation by private, military,
or commercial vessels.
No—PFAS not expected to
impact navigation
348

Refining the list of beneficial uses reduces the number of evaluations to the following groupings:
1. Aquatic toxicity to both water column and benthic organisms. This beneficial use combines those listed as WARM, COLD, EST, WILD, BIOL, RARE, and SHELL in Table 16-1.
2. Protection of human health from ingestion of PFAS when surface water is used as drinking water. Listed as MUN in Table 16-1. The values for this are already covered in Section 8 and in updated tables
(https://pfas-1.itrcweb.org/fact-sheets/), and discussed further below.
3. Protection of human health from exposure to PFAS in the consumption of aquatic organisms, including benthic organisms. In Table 16-1 this encompasses the beneficial uses listed as COMM, AQUA, and SHELL.
4. Protection of human health from contact with and ingestion of PFAS in surface water during recreational activities such as swimming and fishing. This beneficial use is listed as REC-1 in
Table 16-1.
5. Use of the surface water as an agricultural supply (AGR). Use of the surface water in this manner would allow for
the uptake of PFAS into plants used for human and animal consumption, stock watering of animals
used for human consumption and animal consumption, as well as recharge of excess water to groundwater or other surface water bodies (return water).
6. Groundwater recharge is also included, but the issues are the same as those for MUN, AGR, and IND as listed in Table 16-1.
These beneficial use groupings were used to identify the topics to be included in the remainder of this section.
16.1.2 Existing Methods of Protecting Surface Water for Beneficial Uses
This section provides information about the existing methods that regulatory agencies or organizations with
jurisdiction use for protecting surface water bodies from discharges of various pollutants. This information
provides context for what may be implemented to address potential sources of PFAS in surface water.
After establishing the beneficial uses for a given body of water (lake, stream, creek, estuary, ocean) the
regulatory agency or organization implements processes designed to protect those beneficial uses. Typically,
this begins with establishing water quality protectiveness standards/criteria or guidance values to protect those
specific beneficial uses. As an example, to protect aquatic species, values are established for protection of the health of the fish to allow them to continue to exist in the environment and breed without curtailment. If the fish
species is fished for human consumption, then values are also established to allow for fishing to occur without
unacceptable effects on those consuming the fish. As values are established for each of the beneficial uses
assigned for the water body, the most stringent of the values can be used as the value that is protective of all the designated beneficial uses. In that instance, that value would be used for comparison to other beneficial use
values instead of individual values for drinking water and fish protection. For PFAS those values are just
beginning to be established.
Once the protective value for the water body has been established, regulatory mechanisms exist to protect the
water body to maintain or reduce the concentrations to below the protective values. Discharges to surface water
are regulated by state- or federally issued permits. Effluent limits are established in those permits for
constituents that could pose a threat to water quality. Establishing appropriate chemical-specific effluent limits
protects beneficial uses. The effluent limitations are set so that the concentrations in the surface water body stay
below the protective values. In addition to chemical-specific effluent limitations, the permits typically establish
acceptable toxicity limitations that must be met in the total effluent. Both effluent and toxicity limitations can take
into account mixing with the surface water body within a permitted mixing zone (dilution).
349

If a water body already has concentrations that are greater than the protective value, then the regulatory agency
can establish total maximum daily loads (TMDLs). The TMDLs identify maximum mass discharges for the chemicals that exceed protective values and are used to identify mass loading limits on discharges in the
watershed for that water body. Additionally, TMDLs have a component for evaluation of nonpoint sources of
discharge within the watershed that include the chemical of concern. If needed, regulations of these nonpoint discharges could be adopted to also limit those discharges. Often, best management practices are established
as the control mechanism for nonpoint discharges. If nonpoint discharges are the primary contributor of the
pollutant, alternate approaches, such as watershed restoration plans, may be established in lieu of TMDLs. These plans can include best management practices and pollutant minimization components.
During times when a protective value is exceeded and before corrective measures are taken to bring concentrations down below those values, temporary use restrictions can be issued to protect users of the water
body. Examples of such restrictions include banning recreation or issuing fish advisories that recommend
restricting consumption of various fish species. If the water is being used as a source of drinking water, additional water treatment could be required.
Effluent limitations, TMDLs, watershed restoration plans, and use restrictions have been effective in protecting
beneficial uses and reducing risk to receptors for numerous chemicals. It is likely that these measures will also
be useful in addressing PFAS.
16.1.3 Status of State and Federal Surface Water Protection Efforts Regarding PFAS
At the time of publication, there were no national
surface water values for PFAS in the U.S., and only a handful of states have addressed PFAS in
surface water; a more recently updated summary
of values is available at (https://pfas-1.itrcweb.org/fact-sheets/). Many of the challenges
or obstacles to developing surface water
criteria are the same as for groundwater, including the large number of individual PFAS,
many of which lack toxicity and published physical and chemical properties data. In addition, surface
water is used in a greater number of ways than
groundwater, representing potential direct exposure routes through dermal contact and water
ingestion, and indirect exposure through
consumption of fish and shellfish. USEPA is
currently assessing whether there is sufficient
data to develop human health and aquatic life
criteria for PFOA and PFOS under the Clean
Water Act. The agency is also evaluating potential approaches for developing their own criteria.
350
At the state level, surface water criteria development has taken a range of approaches. Alaska has adopted
health advisory levels for surface water used as drinking water. These levels are used as action levels and are not enforceable under the Clean Water Act. Michigan, Minnesota, and Florida developed their own statewide
criteria based on water and fish consumption using state-specific inputs and addressed PFOA and PFOS. Other
states are in the process of collecting data or evaluating what approach to take to develop their own criteria in the absence of federal guidelines. Wisconsin is collecting surface water and fish tissue data to support calculation of
surface water values. New Hampshire and Vermont have released detailed reports outlining potential strategies
and associated costs and timing for developing state criteria. The plan from Vermont describes how its Agency of Natural Resources has developed a framework to establish water quality standards and how it may apply to
developing such standards for protection of human health and aquatic life from PFAS. The report concludes that
technical challenges and the constraints of deriving water quality criteria (WQC) for PFAS are “logistically difficult,
would take a long time, and be very expensive.”
It recommends developing fish consumption advisories, tracking USEPA development of aquatic biota criteria for
PFAS, incorporating USEPA criteria when they are developed, and continued collaboration with New England
states on developing plans for deriving water quality standards (Vermont DEQ 2020). The number of states that have established values for protection of aquatic life is small and includes Michigan and Florida. A table of state-
established values can be found at https://pfas-1.itrcweb.org/fact-sheets/.
Surface water criteria are generally established by the states, either by adopting values recommended by USEPA per section 304(a) of the Clean Water Act, or by calculating state-specific criteria that must be approved by USEPA.
States have specific responsibilities when setting surface water criteria and submitting that information to USEPA:
• Water bodies must have an appropriate designated use or
uses. The WQC must support those uses.
• Antidegradation policies to protect high-value waters must be adopted. The status of waters must be monitored.
• The standards must be revisited on a regular basis and if a revision is required, the state must obtain USEPA approval.
Most states are still in the process of assessing the extent of PFAS in their surface waters, some only at specific potential source areas.
16.1.4 Survey of States
In the spring of 2020, the ITRC PFAS team sent a survey to the states to gather information on their efforts to address PFAS in surface water. The survey included questions on what media states are monitoring for PFAS,
whether PFAS have been detected in surface water, if the states have fish consumption advisories in place for
any PFAS, and if the states are contemplating developing surface water quality criteria or guidelines. Other questions addressed the availability of data and information on sampling methods, PFAS-containing foam, and
whether states have restrictions to minimize the discharge of PFAS to surface water.
A total of 42 states submitted responses. A summary of key responses is provided in Figures 16-1A-D. These
show that of the different media being sampled, 80% of the states are sampling surface water (Figure 16-1A),
and of those sampling for various PFAS in surface water, almost 60% detected one or more PFAS (Figure 16-1B). It was determined that 75% of states do not have any criteria, guidance, limits, or standards for PFAS in
surface water (Figure 16-1C); however, it is noted that 16% do have some protective measure for surface water
that is used as drinking water and 16% have guidance related to fish consumption advisories. Lastly, although 46% of the states were not considering development of criteria for PFAS in surface water, almost 40% felt they
needed more information (Figure 16-1d); the remainder are currently developing criteria in response to proposed
legislation, legislative mandates, or in response to department-level initiatives. For states that have developed surface water quality values, twice as many states reported using USEPA guidance for developing the values
versus those using other procedures and methods.
351

352

Figure 16-1A–D. Summary of Key Responses from the ITRC State Survey (2020)
Given the rapid pace in the state-of-the-science for PFAS and the desire for PFAS regulations in many states, it is
likely there are updates since the time the survey was conducted. However, the PFAS team used the
information from the survey to inform what areas to focus on in this surface water quality section and to document the fundamentals for states to consider when developing surface water quality protective values for
PFAS. Where relevant, pertinent information from the survey is included in Sections 16.2–16.5.
For states that have developed standards/guidance/limits, these protective values can be found in tables produced by ITRC that are periodically updated at https://pfas-1.itrcweb.org/fact-sheets/.
353

16.2 Protection of Human Health
This section discusses the human health aspects of PFAS in surface water. There are other sections in this
document that discuss general human health–related PFAS issues in detail that supplement the information in
this section. Those sections are Section 7.1, Human Health Effects and Section 9.1, Site Risk Assessment,
Human Health.
Under the federal Clean Water Act, states must adopt water quality standards that consist of both designated
uses and numerical and/or narrative criteria to protect these uses. As described in Section 16.1, a designated
use (also called a “beneficial use” or “designated beneficial use”) in some states is a use of surface waters that
is considered desirable and should be protected. As noted in Table 16-1, surface waters have many different
beneficial uses, some of which are relevant to human health and some that are not. Uses that are most relevant
to human exposure and are considered for most chemicals include municipal and domestic supply (also
referred to as drinking water use); agricultural supply (also commonly referred to as irrigation); primary contact recreation; secondary contact recreation/noncontact water recreation; commercial, subsistence, and sport
(recreational) fishing (referred to in some states as fish ingestion); and aquaculture (also focused on fish
ingestion).
In relation to beneficial uses, the exposure pathways for contaminants in surface water that most warrant
consideration of human health for PFAS are included in Table 16-2.
Table 16-2. Exposure Pathways in Relation to Beneficial Uses
Beneficial Use Associated Human Exposure Pathway for PFAS
Municipal and domestic supply; use as drinking
water
Drinking water ingestion and dermal contact during household use; secondary uses may
include irrigation for home gardening and
produce consumption
Commercial, subsistence, and sport
(recreational) fishing
Consumption of aquatic organisms (fish and
shellfish) that may bioaccumulate PFAS from
surface water
Beneficial Use Associated Human Exposure Pathway for PFAS
Primary contact water recreation
Incidental ingestion and dermal contact with water
and/or foam during immersion activities such as swimming, waterskiing
Non-contact/secondary contact water recreation
Dermal contact with water and/or foam during
nonimmersion activities such as wading, boating, fishing; exposures considered to be
insignificant for PFAS
Agricultural supply
Consumption of crops, dairy products, and meat that may bioaccumulate PFAS from
irrigation water; some states may also consider
direct contact with irrigation water
Aquaculture Consumption of aquatic organisms (fish and shellfish) that may bioaccumulate PFAS from
aquaculture water
354

Regulatory agencies use relevant and appropriate use-specific exposure factors combined with chemical-
specific toxicity factors (reference doses; cancer slope factors) to develop ambient water quality criteria (AWQC) that are protective of human health for these uses and exposure pathways. The exposure pathways usually
considered in development of AWQC are drinking water ingestion (for waters designated for drinking water use)
and consumption of aquatic organisms.
At this time, exposure pathways involving ingestion are considered to be the most significant PFAS exposure
sources. Recreational uses of surface waters for secondary contact activities, such as wading and boating, which
do not involve immersion but may result in dermal contact with water, are considered to be insignificant sources of PFAS exposures. See Sections 17.2.2 and 17.2.3.
Human health criteria for contaminant concentrations in surface water that are protective of fish consumption
are also relevant to PFAS exposures. Additionally, some states have developed fish consumption advisories
that recommend the frequency of consumption for recreationally caught fish based on levels of contaminants, including PFAS, measured in fish tissue from certain geographic regions or in specific water bodies (Section
16.2.2.6).
The salinity of the surface water body influences the beneficial uses considered. Saline water criteria consider only the consumption of aquatic organisms (fish and shellfish), while freshwater criteria may consider exposure
through consumption of aquatic organisms and/or drinking water. The designated uses for freshwater bodies
may vary from state to state based on policy and/or actual uses as some water bodies may not support both potable use and aquatic biota consumption. Thus, criteria can be developed for the fish/shellfish consumption
pathway alone or for the potable use and fish/shellfish consumption pathways combined. Surface water criteria
are usually not developed for potable use alone and generally defer to guidelines such as maximum contaminant levels (MCLs) and maximum contaminant level goals (MCLGs) developed by USEPA and other agencies under
drinking water programs. The combined use criterion will be more stringent than the criterion for consumption
of organisms only for reasons detailed below.
16.2.1 Input Factors for Development of Surface Water Criteria and Fish Consumption Advisories
Section 16.2.2 includes information and an example equation used to develop human health criteria for relevant exposure pathways. Section 16.2.2.6 provides information and an example equation used to develop fish
consumption advisory triggers.
16.2.1.1 Toxicity Values
The toxicity values used for both human health criteria and fish consumption advisories are reference doses (RfD,
ng/kg/day or mg/kg/day) for noncarcinogenic effects and cancer slope factors (mg/kg/day) for carcinogenic
effects. States may base their WQC and fish consumption advisories on toxicity values recommended by USEPA
or toxicity values from sources other than USEPA, or develop their own toxicity values. The toxicity values used for
PFAS vary among agencies based on different choices of critical toxicological effect, uncertainty factors, exposure
assumptions, and other considerations.
Currently, the USEPA has not established surface water criteria for any PFAS, and toxicity values are available for
only a limited number of PFAS. When information becomes available to develop surface water criteria for a PFAS, USEPA may follow a tiered process in selection of toxicity values, as it has done when developing criteria for other
contaminants. When USEPA last updated its human health criteria (USEPA 2015), its primary source of updated
toxicity values was the Integrated Risk Information System (IRIS), whose scientists are currently developing toxicity values for the following five PFAS: perfluorodecanoic acid (PFDA), perfluorononanoic acid (PFNA), perfluorohexanoic
acid (PFHxA), perfluorohexane sulfonic acid (PFHxS), and perfluorobutanoic acid (PFBA) (USEPA 2020).
355

Other sources of toxicity values, for contaminants other than PFAS, reviewed by USEPA in its update of human
health criteria include:
• USEPA Office of Pesticide Programs
• USEPA Office of Pollution Prevention and Toxics, USEPA Office of Water
• USEPA Office of Land and Emergency Management (for example, Provisional Peer Reviewed Toxicity
Values (PPRTVs))
• S. Agency for Toxic Substances and Disease Registry (ATSDR)
• Health Canada
• California EPA’s Office of Environmental Health Hazard Assessment
The USEPA (2015) updates used a toxicity factor from one of the non-IRIS sources listed above if no IRIS toxicity
factor was available, or if the toxicity factor from another source used a newer study or a more current risk assessment approach than IRIS.
For PFOS and PFOA, this document provides a table of toxicity factors (and their basis) currently used in water
standards and guidance values developed by USEPA and individual states. This table is discussed and can be
accessed from Section 8.3. In addition to the reference doses that it developed for its drinking water health advisories, the USEPA (2014) generated PPRTVs for PFBS, and more recently released draft toxicity assessments
for PFBS and GenX for public comment (USEPA 2018). USEPA published the final PFBS toxicity assessment in 2021
(USEPA 2021). The USEPA’s PFAS Action Plan, which was first developed in 2019 and updated in 2020 (USEPA 2020), states that USEPA will evaluate additional PFAS for development of toxicity values, including the five PFAS
being evaluated by IRIS that are mentioned above. Currently, USEPA IRIS has developed draft systematic review
protocols for these five PFAS (USEPA 2019).
16.2.1.2 Protected Populations and Target Risk Levels
The protected populations that are considered in the development of surface water criteria for human health
typically include adults. In some cases, other populations, such as lactating women, women of childbearing age, children, and infants, may also be explicitly considered separately, depending on the nature of the chemical and
the exposure route. As discussed in Section 16.2, the human health criteria most relevant to PFAS consider
ingestion of aquatic organisms (fish and shellfish) and/or drinking water. In general, exposure from ingestion of
aquatic organisms will likely be greater than exposure from drinking water for PFAS such as PFOS that bioaccumulate in aquatic life.
In the development of human health WQC based on standard exposure assumptions, the relative doses from
fish consumption and drinking water are dependent on the bioconcentration factor (BCF) or bioaccumulation factor (BAF). The assumed daily dose from fish consumption (22.5 g/day) is greater than the assumed daily dose from
drinking water ingestion (2.4 L/day) for bioaccumulative PFAS such as PFOS (see Sections 16.2.1.3 and
16.2.1.4). However, exposures to bioaccumulative PFAS in drinking water are higher in infants, particularly in
those that are breastfed, than in adults, and infants are considered to be a sensitive subpopulation for adverse
effects of PFAS (Goeden, Greene, and Jacobus 2019). In contrast to human health criteria for surface water,
drinking water guidelines for PFAS developed by USEPA (USEPA 2016, USEPA 2016) and some states are
based on exposure assumptions or exposure modeling for sensitive life stages (for example, lactating women,
infants (Post 2021)). Minnesota (MPCA 2020) has recently used modeling of early-life exposure in formula-fed and breastfed infants, as well as a higher fish consumption rate specific to women of childbearing age (MPCA
2020), to develop a human health surface water criterion for PFOS; they also developed a human health-based
criterion for PFOS in fish tissue.
356
A target cancer risk level is used along with the cancer slope factor in calculation of criteria based on carcinogenic
effects. The selection of the lifetime cancer risk level is a policy choice, not a scientific decision, and the target
cancer risk level (for example, 1 in 100,000 or 10-5; 1 in 1,000,000 or 10-6) differs among states, which is one
reason why criteria based on cancer risk can vary among different states. When chemicals have the potential to
exert both carcinogenic and noncarcinogenic effects (for example, PFOA), the final criterion may be based on the
lower of the criteria based on cancer and noncancer effects. Criteria for noncarcinogenic effects are developed
such that exposure to the contaminant will not exceed the RfD.
16.2.1.3 Exposure Factors
The exposure factors typically considered in development of criteria for ingestion of drinking water and/or aquatic
organisms include assumed body weight, drinking water and/or aquatic organism (fish/shellfish) consumption rates,
and relative source contribution (RSC). These exposure factors and their use in developing criteria are described below.
As previously stated, the default adult body weight is usually used when developing human health criteria. USEPA
currently recommends a default adult body weight of 80 kg for development of human health criteria (USEPA
2015). However, some states’ criteria are based on the older recommended value of 70 kg. Alternative body weight assumptions for specific ages, sexes, or other subgroups can be found in the USEPA Exposure Factors
Handbook (USEPA 2011), and certain states may use these values.
States typically use default ingestion rates recommended by the USEPA for the specified environmental media, for example, drinking water or fish tissue; however, some states use state-specific values, especially for fish
ingestion. The adult drinking water consumption rate is usually used for human health criteria. In 2015, USEPA updated its recommended default adult drinking water consumption rate for human health criteria from 2 L/day to
2.4 L/day (USEPA 2015). It is noted that the relevant body weight-normalized exposure parameter (L/kg/day) is
0.03 L/kg/day with the updated body weight and ingestion volume, which represents a very small change from 0.029 L/kg/day based on the older values. Similarly, USEPA also updated the default rate of 22 g/day for fish
consumption from the previous value of 17.5 g/day (USEPA 2015). Some states consider state- or region-specific
rates that have been developed based on consumption data from their region, including higher consumption rates by tribes and/or for subsistence fishing in some cases (USEPA 2014).
Under current (USEPA 2000) guidance, an RSC is used when a human health criterion is based on an RfD
(noncancer effects), and USEPA used an RSC USEPA (2015) in its updates of noncarcinogenic criteria. The RSC
is the percent of total exposure assumed to come from exposure arising from surface water (ingestion of water
and aquatic organisms, or ingestion of organisms only) at the criterion concentration. It is intended to ensure that total exposure from all sources (surface water and non-surface water–related) does not exceed the RfD.
USEPA guidance specifies an RSC of 20–80 percent, with a default of 20 percent (the most stringent possible
value) when data to derive a chemical-specific value are not available (USEPA 2015). Some states and USEPA use the 20 percent default value in their PFAS drinking water guidelines, while other states (for example, MN, NH,
NY) use higher RSC values based on estimates of non-drinking water exposures from human biomonitoring data or
in consideration of certain life stages.
16.2.1.4 Bioaccumulation, Bioconcentration, and Biomagnification Factors
Three types of factors can be used by risk assessors to relate environmental concentrations of a chemical (for
example, in water, sediment, soil, or prey) to concentrations within certain organisms. These factors include
bioaccumulation factors (BAF), bioconcentration factors (BCFs), biomagnification factors (BMFs) and associated
trophic magnification factors, each of which are defined in the text box below. These factors are frequently used for risk assessment of biota such as fish and shellfish consumption by human fish consumers, as well as wildlife.
The USEPA has outlined methods for developing BAFs, which are recommended for risk assessment of most
chemicals, whereas BCFs and BMFs typically provide useful information about the fate, transport, and ecological risks of chemicals (USEPA 2003).
357

Certain PFAS are highly bioaccumulative in aquatic
organisms such as fish, and this is especially true for long-chain PFAS such as PFOS. For the risk
assessment of bioaccumulative and
bioconcentrating chemicals such as PFAS, BAFs or BCFs should represent the tissues that are
consumed by humans (for example, fillets or
muscle tissue) and should also represent the trophic level of the fish species of interest (for
example, secondary consumer or top-level
predatory fish). Both BAFs and BCFs are specific to
the chemical and organism in which it is detected. For BCFs, BAFs, or BMFs, larger values indicate
greater accumulation in organisms, which in turn
result in lower surface water criteria. At this time BCFs, BAFs, and BMFs for PFAS are primarily based
on measured data. Examples of these values for
PFAS in aquatic organisms are available in Table 5-1 (as a separate Excel file) and discussed in
Section 5.5.
When the standard USEPA equation shown in the text box in Section 16.2.2 is used with standard exposure
assumptions (drinking water ingestion – 2.4 L/day; fish consumption – 22 g/day) to develop human health
criteria, the assumed contribution to total exposure from fish consumption is greater than from drinking water when the BCF or BAF is >110. As the numerical value of the BCF or BAF increases, the proportion of assumed
exposure from fish consumption continues to increase. Given the mathematical impact of BAFs, BCFs, and
BMFs on resulting WQC, there are several considerations for data use and applicability. One example of these considerations is the applicability of values estimated from studies on nonnative species or from water bodies
with different water chemistry from the sites intended for protection. The use of central tendency versus upper
percentile values may result in less stringent criteria but may be less appropriate in cases where BAFs for a
given compound vary by orders of magnitude. The USEPA encourages the use of site- specific modification to BAF, BCF, and BMF selection where such decisions are appropriate and scientifically defensible (USEPA
2000).
358
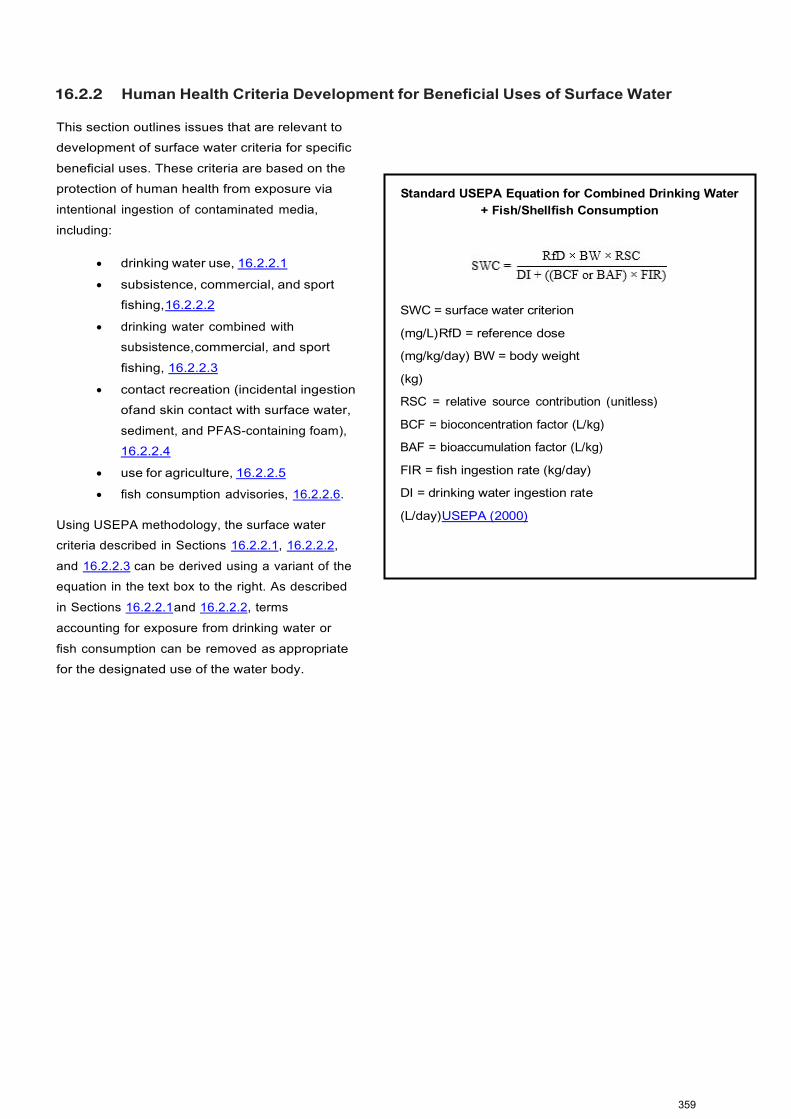
16.2.2 Human Health Criteria Development for Beneficial Uses of Surface Water
This section outlines issues that are relevant to development of surface water criteria for specific
beneficial uses. These criteria are based on the protection of human health from exposure via
intentional ingestion of contaminated media,
including:
• drinking water use, 16.2.2.1
• subsistence, commercial, and sport fishing, 16.2.2.2
• drinking water combined with subsistence, commercial, and sport
fishing, 16.2.2.3
• contact recreation (incidental ingestion of and skin contact with surface water,
sediment, and PFAS-containing foam), 16.2.2.4
• use for agriculture, 16.2.2.5
• fish consumption advisories, 16.2.2.6.
Using USEPA methodology, the surface water criteria described in Sections 16.2.2.1, 16.2.2.2,
and 16.2.2.3 can be derived using a variant of the equation in the text box to the right. As described
in Sections 16.2.2.1 and 16.2.2.2, terms
accounting for exposure from drinking water or
fish consumption can be removed as appropriate for the designated use of the water body.
359

16.2.2.1 Waters Designated for Domestic/Municipal Supply (Drinking Water Use)
As noted earlier, surface waters that are designated only for drinking water use may use drinking water
guidelines already developed by USEPA or state agencies as WQC. Current state and federal drinking water guidelines for PFAS are found in ITRC’s Tables of PFAS Water and Soil Values (https://pfas-1.itrcweb.org/fact-
sheets/). Some states derive this type of surface water criterion using the equation above but omit the
denominator terms for bioaccumulation/bioconcentration factors and fish ingestion rates. This equation determines a drinking water value based on human health risk assessment but does not include consideration
of analytical or treatment removal factors. Additional discussion of drinking water guidelines may be found in
Section 8.3.3.
Numerically, surface water quality criteria for the protection of drinking water may be the same as or differ from
drinking water standards such as MCLs, which apply to public water systems, or ambient groundwater quality
standards. Drinking water standards such as MCLs are often higher than the strictly health-based goals derived
by the previously described equation due to analytical and treatment limitations, while surface water criteria do not consider these factors. However, almost all the current state and federal drinking water guidelines for PFAS
are set at health-based goals because analytical and/or treatment removal considerations are not included as
limiting factors in the development of the guidelines. Some states may have the authority to adopt existing drinking water values, such as MCLs, as surface water quality criteria for the protection of drinking water
sources. This varies due to states’ regulatory authorities and definitions of surface waters considered
acceptable for potable use. Alternatively, some states may derive criteria that differ from drinking water
guidelines due to consideration of drinking water use combined with other designated uses such fish/shellfish consumption.
16.2.2.2 Waters Designated for Subsistence, Commercial, and Sport (Recreational) Fishing (Consumption of Aquatic Organisms [Fish and Shellfish] Only)
Surface water criteria for fish and shellfish consumption rely on assumptions about consumption rates as
well as the relationship between chemical concentrations in water and the resulting tissue
concentrations in consumed aquatic organisms.
Default fish consumption rates recommended by USEPA and choices made by states to reflect regional
consumption patterns were discussed in Section 16.2.1.3. The quantifiable relationship between chemical concentrations in water and the concentrations in tissue is represented by transfer factors such as BCFs, BAFs, or
BMFs, which are defined in Section 5.5 and included in the text box in Section 16.2.1.4.
The equation used to derive this type of criterion, using USEPA methods, would be the equation in the box above but omitting the drinking water ingestion rate. This equation relies on toxicity values (Section 16.2.1.1)
and exposure factors (Section 16.2.1.3), as well as BAFs or BCFs for the specified chemical. More stringent toxicity values, higher exposure factors (for example, fish consumption rates), or larger BAFs or BCFs result in
lower surface water criteria. For example, criteria based on the higher fish intake rates for subsistence fish
consumers would be more stringent than criteria based on the average intake rates for U.S. consumers or sport fishers. Depending on state level or regional policies, such criteria may be developed separately for sport
(recreational) and subsistence fishing practices. Aquaculture operations may be required to meet similar criteria
for rearing, harvesting, or selling fish depending on the regulatory authority of certain states. This type of surface
water criteria is typically developed in consideration of fish, especially predatory fish, as these are more commonly caught and consumed by the public than are shellfish. However, similar criteria can be developed for
shellfish (for example, bivalves and crustaceans) using similar risk assessment methods.
360

16.2.2.3 Waters Designated for Combined Use as Drinking Water and for Subsistence, Commercial, and Sport (Recreational) Fishing
Freshwaters may support and/or be designated for both drinking water and fish consumption beneficial uses. This requires consideration of factors discussed in Sections 16.2.2.1 and 16.2.2.2. The full equation in the box
above provides the USEPA method for deriving this type of criteria. Default input values would be similar to
those listed for each use separately. Surface water criteria established for both drinking water and fish consumption will be more stringent than
criteria for either use alone.
16.2.2.4 Waters Designated for Contact Recreation
WQC for recreational contact, such as swimming and wading, consider exposure primarily due to incidental
ingestion and dermal contact with surface water, sediments, and potentially PFAS-containing foams. There is no standardized equation for development of criteria protective of exposure to recreational water, but certain equations
in the USEPA’s Risk Assessment Guidance for Superfund (RAGS) provide a framework for developing screening
levels for recreational contact (USEPA 2004). Specifically, equations for estimating chemical intake by incidental ingestion of water and dermal absorption from water during swimming or wading are available in Chapter 3 of the
RAGS Part E, Supplemental Guidance for Dermal Risk Assessment (USEPA 2004). There are several gaps in the
current literature that limit the application of these equations, including scant information on skin permeability of several PFAS and how distribution in the water column influences dermal contact. Currently available information on
partitioning of PFAS to air and the air/water interface is reviewed in Sections 5.2.4 and 5.2.4.1.
Dissolved-Phase PFAS At this time, primary or secondary contact recreation with surface water is not expected to be a significant
pathway for human exposures to PFCAs and PFSAs (for example, PFOS) as compared to drinking water or to
consumption of aquatic organisms. Current evidence suggests that PFAS are poorly absorbed through the skin
(discussed in Section 17.3.1.2). Studies performed by some state agencies estimated the risks associated with observed PFAS concentrations in water via recreational exposures such as swimming, and concluded that the
risks were low (MDHHS 2019, MDH 2019, Vermont DEQ 2020, MPCA 2020). Recreational screening levels are
likely to be orders of magnitude higher than concentrations that are protective of consumption fish/shellfish, drinking water use, or some estimates of toxicity toward aquatic wildlife. However, there is uncertainty regarding
dermal absorption capabilities (for example, skin permeability coefficients) of most PFAS, both short- and long-
chain, that would have a significant impact on derived guidance values. One additional area of concern may
come with inhalation in an environment where water-to-air transfer may occur from aerosol-borne PFAS in sea sprays or dam mist near known source areas (Johansson et al. 2019). Knowledge in these areas and knowledge
regarding the volatilization and inhalation potential of PFAS is very preliminary, still evolving, and subject to
change (see Section 5.3).
361

PFAS in Foams In contrast to dissolved-phase PFAS, PFAS-containing foam may occur at and above the air-water interface on surface waters. Observations concerning PFAS-related foams present in surface waters have been reported in
several states and present concerns for exposure from prolonged skin contact or incidental ingestion by small
children. Unlike PFAS dissolved in water, foams may remain on the skin for a longer period, which may elicit public concerns. There are currently no WQC for the formation of foams, but some states may consider developing
contact standards for exposure to foams. As noted above, a critical parameter in developing risk-based
screening levels for recreational contact is the skin permeability coefficient, which is a measure of dermal
absorption. There is currently high uncertainty and limited information available regarding skin permeability for PFAS (see Section 17.3.1.2), and this lack of data poses major challenges to risk assessment for human
dermal contact with PFAS. It is anticipated that exposure to PFAS-containing foam on surface waters poses a
significantly lower risk to human receptors than direct ingestion from food and water, but if combined with drinking water or occupational exposure, could pose an added toxicological burden.
Using a similar approach to that described above, along with USEPA guidance (USEPA 2000, 2011, 1989), some states may decide to develop surface water criteria for PFAS-related foams. However, these surface water
criteria would likely be far higher than any criteria needed to protect surface water for other uses by humans and
wildlife and would be applicable to a limited number of sites. Some states, such as Minnesota, have published qualitative guidelines (MPCA 2020). In the future, some states may develop human health-based criteria for
PFAS-containing foams in surface waters that would be protective of recreational exposures such as swimming
and wading. It is also challenging to sample foam in surface waters, as described in Section 16.5.
16.2.2.5 Waters Designated for Agricultural Supply
One of the beneficial uses of fresh water is agricultural supply, for irrigation of crops for direct human
consumption and silage for dairy or beef livestock that may ultimately lead to indirect human consumption (milk or
beef ingestion). Since PFAS are known to bioaccumulate and have been detected in edible crops, produce, dairy, and meats (Section 5.6) (ATSDR 2018; USFDA 2019), there are potential concerns regarding acceptable levels
of PFAS in surface water that will be protective of human health if used for irrigation of crops and silage.
The rapidly expanding literature about PFAS uptake into crops is useful in identifying a few general trends and is discussed in depth in Sections 5.2.3 and 5.6. The potential for PFAS bioaccumulation in plants ranges from low
(0.1) to approximately 10 times the soil concentration in many studies, although plants with high water content (for example, lettuce) could exhibit considerably higher bioaccumulation of certain PFAS (see Table 5-2, provided
as a separate Excel file and discussed in Section 5.6.2). Chain length is a significant factor in availability for uptake
into plants. While both longer chain and shorter chain PFCAs and PFSAs may be taken up by plant roots, there is generally greater translocation and distribution of shorter chain PFAS into the remainder of the plant, including the
aboveground tissues (Section 5.6.2). In general, there is greater accumulation in vegetative tissues (for example,
leaves and stems) than in storage tissues such as fruits and seeds (Section 5.6.2).
There is currently no USEPA guidance for development of surface water criteria for irrigation and livestock
watering. However, approaches have been developed by some states, and other countries such as Canada
(ECCC 2017), that consider human dermal and inhalation exposure to irrigation water and consumption of
irrigated produce (for example, University of Florida (2018)). These references may be consulted for additional information on irrigation and livestock protection.
362

16.2.2.6 Fish Consumption Advisories Based on Consumption Frequency
Fish consumption advisories are health-protective recommendations developed by states for frequency of
consumption of recreationally caught fish meals. These advisories may be applicable statewide, in certain regions of a state, or to specific water bodies or reaches/segments of water bodies. Fish consumption advisories are not
surface water criteria and are not regulatory in nature. The advisories may be issued for the general public, and
they may be more stringent for specific groups of people at higher risk, such as women of childbearing age, pregnant or nursing women, or children. At the time of publication of this document, several states (for example,
AL, CT MI, MN, NJ, WI) have issued fish consumption advisories for PFAS, particularly PFOS.
Advisories are developed by comparing fish tissue concentrations in wet weight (“triggers”)
that do not result in unacceptable risks for
consumption of meals at different frequencies (for
example, unlimited [daily]; once per week, once per month, once per year) with concentrations of
the contaminant measured in fish tissue. The
advisories may be species- and water body–specific, based on data for PFAS tissue
concentrations from the species in the water
body, or they may apply regionally and/or to multiple species.
Typically, limits are developed for muscle fillets of
commonly caught and consumed fish, often
accompanied by a recommendation to avoid consumption of skin, fat, and other nonmuscle
parts of the fish. If there are populations whose
consumption patterns exceed the assumptions of the advisory (for example, consumption of whole
fish), there may be a potential for insufficient
protection.
Assumptions and parameters used in the calculation of fish tissue trigger levels include:
1. the reference dose for each PFAS
2. a consumer’s body weight (BW)
3. the size of the fish meal
The generalized equation for development of fish
tissue trigger concentrations based on noncancer
effects used for fish consumption advisories are
shown in the text box; a different equation (not shown) would be used for advisories based on
cancer risk.
363

16.3 Protection of Biota
16.3.1 Overview and Purpose
This section presents the technical methods and information needed to develop or review surface water criteria
for PFAS that would be protective of aquatic life and their uses. There are other sections in this document
where general ecological issues associated with PFAS are discussed in detail, and that information supplements the information contained in this section. That additional information can be found in Section 7.2,
Ecological Toxicology, and Section 9.2, Ecological Risk Assessment.
The types of aquatic life to be protected are usually defined by the various beneficial uses related to surface water that are described in Section 16.1.1. USEPA guidance (USEPA 1985) for derivation of such criteria are
primarily intended to protect all but the most sensitive aquatic organisms from exposure to chemicals in surface
water or sediment porewater. Considerations also exist to derive criteria for protection of aquatic-dependent avian and mammalian wildlife via
calculation of a “final residue value” that can factor into final selection of the chronic criterion (USEPA 1985), or a
more explicit “wildlife criterion” using methods presented for the Great Lakes Initiative (GLI; (USEPA 1995)).
Aquatic life criteria share the levels of protection afforded by the Clean Water Act and USEPA guidelines (USEPA
1985) in that criteria are derived using toxicity tests with aquatic organisms in which survival, growth, and
reproduction are measured. These data are compiled to derive criteria intended to protect against unacceptable
adverse effects to most animal taxa in the aquatic community, which is most commonly calculated to represent
protection of approximately the 95th percentile of tested aquatic genera. As a result, acute and chronic criteria
concentrations are generally said to represent protection of all but 5% of the most sensitive aquatic species.
Criteria can also be lowered to protect particularly important species such as recreationally or economically important species or listed threatened or endangered species.
The following sections summarize the general USEPA methods available for derivation of aquatic life criteria for
PFAS, with a focus on how to select the most appropriate toxicity test endpoints related to USEPA guidance (USEPA 1985). Available ecotoxicity data are then summarized for all freshwater and marine aquatic species
relevant for derivation of aquatic life criteria, including invertebrates, vertebrates, and algae/vascular plants.
This section closes with a summary of information necessary to develop criteria to protect aquatic-dependent
wildlife such as birds or mammals, including permissible tissue PFAS concentrations, bioaccumulation and
bioconcentration factors, and other food chain effects.
16.3.1.1 Derivation of Aquatic Life Protection Criteria—Methods Summary
The general approach for derivation of aquatic life criteria, according to USEPA guidance (USEPA 1985), is
briefly summarized below, along with the definition of key terms. The first step is to compile acute and chronic
toxicity data that meet the USEPA (1985) guidelines for the relevance and reliability of each study. This evaluation for scientific relevance and reliability largely focuses on test duration, survival in the control treatment, and
methods, with distinctions made between acute (short-term) or chronic (long-term) studies. For example, acute
toxicity studies must have an exposure duration of 96 hours (although 48 hours is acceptable for more short-lived species, such as cladocerans and midges), organisms must not be fed during the study, and the endpoint
must be mortality, immobilization, or a combination of the two. Chronic toxicity studies must be conducted using
exposure durations that encompass the full life cycle or, for fish, early life stage and partial life cycle studies. The
acceptable endpoints for chronic tests include survival, growth, and reproduction (see Section 16.3.1.4). The duration of chronic studies may be many days, weeks, or months.
364

To develop criteria that are protective of the diverse array of aquatic biota, an extensive database representing
multiple test species, genera, and taxa is required. A minimum database of acceptable studies representing at least eight specific taxonomic families of aquatic organisms is also required. This is done to ensure that criteria
are derived based on data that represent the widest possible range of likely sensitivities encountered in the
environment. These minimum database requirements differ for freshwater versus saltwater species as
presented in Table 16-3.
Table 16-3. Minimum database requirements for derivation of aquatic life criteria (USEPA 1985)
Freshwater Saltwater
A bony fish in the family Salmonidae Two families in the phylum Chordata
A second family of bony fish (preferably a
commercially or recreationally important warm
water fish)
A family in a phylum other than Arthropoda or Chordata
A third family in the phylum Chordata Either the Mysidae or Penaeidae family
For each species with acceptable acute toxicity data, the species mean acute value (SMAV) is calculated as the
geometric mean of available 48- to 96-hr median lethal concentrations (LC50s) or median effect concentrations
(EC50s) for each species. The genus mean acute value (GMAV) is then calculated as the geometric mean of
available SMAVs for each genus. The lowest 5th percentile of the distribution of available GMAVs is identified as the final acute value (FAV), which is divided by two to determine the criterion maximum concentration, which is more
commonly termed the “acute criterion.” The criterion continuous concentration, or “chronic criterion” can either be
calculated using the same 5th percentile calculation as the FAV if all eight minimum database requirements are
met, or if they are not met by dividing the FAV by the ratio of acute to chronic effects, termed the acute to chronic
ratio (ACR). The ACR is determined from those species with both acute and chronic data available usually as a
geometric mean of the available species ACRs. ACR values are one of the factors used to derive chronic surface
water criteria for chemicals (USEPA 2008). They may also be used in the development of aquatic life screening values when acute toxicity data may be available but not enough chronic toxicity data are available for a
chemical. Generally accepted ACR values have not yet been developed for PFAS and would need to take into
account the diversity of chemical structures and behavior of PFAS. See the discussion in Section 16.3.2 regarding the availability of acute and chronic data for select PFAS.
Freshwater Saltwater
A planktonic crustacean
Three other families not in the phylum Chordata
(may include Mysidae or Penaeidae, whichever was not used above)
A benthic crustacean Any other family
An insect
A family in a phylum other than Arthropoda or
Chordata
A family in any order of insect or any phylum not already represented
365

16.3.1.2 Problem Formulation
Recently, USEPA has been developing ambient water quality criteria documents following an ecological risk
assessment framework (USEPA 1992) to provide a logical approach to criteria derivation based on the chemical’s
characteristics, fate and transport, and mode of toxic action. This information for PFAS is summarized below to assist with the development of a conceptual model and identification of endpoints needed for states to derive
aquatic life criteria.
16.3.1.3 Conceptual Model
A conceptual model consists of a written and/or graphical representation of the linkages between the exposure
characteristics of the chemical and the ecological endpoints of relevance to criteria derivation. PFAS will be
transported to surface waters from direct soil runoff, groundwater discharge, atmospheric deposition, or point
source discharges (see Figure 17-1). Once transported into surface waters, PFAS exposures to aquatic
organisms will occur via two main pathways: direct from water (bioconcentration) and via the organism’s diet as
well as water (bioaccumulation). These pathways are also described and quantified in Section 5.5.
Biomagnification is also an important factor for some PFAS (for example, those with carbon chain lengths of eight
or more) (Section 5.5). Section 16.3.3 describes procedures to evaluate uptake of PFAS in aquatic-dependent
wildlife.
This simple conceptual model suggests that aquatic life criteria for PFAS will need to consist of two different kinds
of toxicological information:
• Toxicity data generated from water-only exposures
• Toxicity data with effects measured on the basis of receptor tissue concentration and diet, from
which bioaccumulation and bioconcentration factors are estimated to back-calculate to a protective
PFAS concentration in water (see Section 16.3.3.3).
Toxicity data measured on the basis of receptor tissue concentration can also be used to derive purely tissue-
based aquatic life protection criteria for PFAS. Tissue-based aquatic life criteria would be subject to less
uncertainty because the effects levels directly relate toxic dose and exposure pathways, and because BAFs or
BCFs would not be needed to back-calculate to
a water concentration. This approach has recently been used for methylmercury (USEPA 2010) and selenium (USEPA 2016) in fish in which tissue-based criteria concentrations take precedence over water column-based
concentrations.
16.3.1.4 Assessment Endpoints
Assessment endpoints represent the expression of environmental values to be protected by the
management framework (USEPA 1992). In the case of ambient water quality criteria, the values to be protected are aquatic life and their uses. As discussed in Section 16.3.1, the levels and types of protection
are those afforded by the Clean Water Act and USEPA guidelines (USEPA 1985). These guidelines specify
protection of all but 5% of the most sensitive aquatic organisms with respect to survival, growth, and
reproduction.
366

16.3.1.5 Measurement Endpoints
Measurement endpoints represent the direct empirical measurements of chemical exposure and biological
effects that are used to ultimately represent the assessment endpoint (USEPA 1992). For PFAS, the relevant
measurement endpoints are as follows:
Measures of exposure: Given the conceptual model noted above, PFAS measurements would need to
include both direct aqueous concentrations and aqueous concentrations estimated using appropriate
bioaccumulation or bioconcentration factors (see Section 16.3.3 and Section 9.2.2). Sufficient single
chemical toxicity data for aquatic life criteria mainly exist for only PFOA and PFOS, although Tier II
methods have been used by Giesy et al. (2010) for PFBS and by Divine et al. (2020) for acute and chronic values for 21 PFAS. Mixture studies for commonly detected PFAS are limited with no consensus
on additivity, synergism, or antagonism. Thus, it is difficult to determine at this time whether measures
of exposure could be considered additive for either PFOA + PFOS, or even for other PFAS.
Measures of effect: According to USEPA guidance (USEPA 1985), measures of effect (either acute or
chronic) are limited to those representing survival, growth, and reproduction. Therefore, only PFAS toxicity
endpoints that either directly measure, or can directly represent, these endpoints should be used for
derivation of aquatic life criteria. According to toxicity data summarized in Section 16.3.2 below (and in Section 7.2), available PFAS toxicity endpoints include several sublethal endpoints that could
potentially be used to represent growth or reproduction. These include endpoints such as
development, percent emergence, time to metamorphosis, and development of malformations.
Therefore, states will need to determine whether or not these sublethal effects can be considered
reliable quantitative measures of chronic effects of relevance to development of criteria.
USEPA developed some logical considerations for this determination relative to endocrine-disrupting
chemicals. These considerations may be applicable to PFAS (USEPA 2008).
16.3.2 Availability of Ecotoxicological Data
Toxicity data for establishing surface water quality criteria are available in peer-reviewed sources, mainly the
primary literature. As noted in Section 7.2, most aquatic toxicity data are for PFOS, PFOA, and several other PFAS,
including PFNA, PFBA, and PFBS. It is worth noting that USEPA has curated peer-reviewed sources of ecotoxicity data for PFAS into the USEPA ECOTOXicology Knowledgebase. As of August 2020, USEPA reported they had
conducted a comprehensive literature search and systematic review for >300 PFAS and added ecological toxicity
data to ECOTOX from 692 references. These efforts are continuing (USEPA 2019).
This section provides a high-level overview of the available ecotoxicity data retrieved at the time and does not
represent an exhaustive literature review for the classes of organisms specifically required for developing aquatic life surface water quality criteria. As noted in Section 7.2, the ecological toxicology of PFAS is an active
area of research and users are encouraged to query the literature for updated values. Furthermore, states that
undertake criteria development should thoroughly review the studies discussed here and others that are subsequently published to determine if they meet regulatory requirements prior to using them for WQC
development.
When developing surface water quality criteria protective of aquatic receptors, several criteria should be met when selecting appropriate studies, such as inclusion and adequate control animal responses and availability of
details on experimental design. Test animals should be native and have reproducing wild populations. Also, note
that many published endpoints are based on nominal rather than measured PFAS exposures; where measured
concentrations are used, they can range from very low to very high percentages of the nominal values (<10–240%). Thus, it is recommended to use measured concentrations for establishing criteria.
367

The following sections highlight available data, or lack thereof, for the various taxonomic families required for WQC
development (refer to Table 16-3 and Section 16.3.1.1).
16.3.2.1 Bony Fish
Aquatic criteria development requires toxicity data for a salmonid species and one other species of bony fish. Fish
toxicity studies are mainly focused on PFOS, for which data for multiple bony fish species (for example, rainbow
trout (Oncorhynchus mykiss), sheepshead minnow (Cyprinodon variegatus), fathead minnow (Pimephales promelas),
and zebrafish (Danio rerio) are available. As discussed in Section 5.5, PFOS preferentially accumulates in fish tissue relative to other PFAS. Overall, the data for other PFAS are generally limited to a single species or are lacking
entirely (see Table 7-1, link in Section 7.2).
16.3.2.2 Salmonids
Acute salmonid studies on the rainbow trout (O. mykiss) have been conducted under both fresh- and saltwater
conditions for PFOS. EC50 range from 17 mg/L to 22 mg/L (Robertson 1986; Palmer, Van Hoven, and Krueger
2002); a no observed effect concentration (NOEC) was reported at 6 mg/L (Palmer, Van Hoven, and Krueger 2002). No chronic studies were identified for this or other salmonid species.
16.3.2.3 Other Fish Species
Several acute and chronic studies are available for non-salmonid species (see Table 7-1, link in Section 7.2)
and for PFAS other than PFOS. Data from these studies indicate acute toxicity of PFOS on the same order of
magnitude as that observed for the rainbow trout, with some species perhaps even more sensitive; LC50s for
zebrafish (D. rerio; a freshwater native to Asia) and fathead minnow (P. promelas, a freshwater native to North America) were approximately 10 mg/L, with EC50 and NOECs ranging between 1.5 and 3 mg/L (Drottar and
Krueger 2000; Ulhaq et al. 2013). Data from an acute test on the North American saltwater species sheepshead
minnow (C. variegatus) for PFOS suggest this species is less sensitive than its freshwater counterparts, with EC50 greater than 15 mg/L (Palmer, Van Hoven, and Krueger 2002).
Chronic studies of PFOS toxicity are more limited; only two studies of P. promelas were identified and indicated a
NOEC of approximately 0.3 mg/L and EC50 of 7 mg/L (Drottar and Krueger 2000; Oakes et al. 2005) for early life stage development.
Acute and/or chronic zebrafish toxicity studies are also available for PFOA, PFBS, PFNA, PFBA, and PFDA. Acute
toxicity is highly variable, but in general, these compounds appear to be less toxic than PFOS, with LC/EC50 reported up to 3,000 mg/L; the exception to this generality is PFDA, where an EC50 of 5 mg/L was reported (Ulhaq
et al. 2013). Chronic toxicity data in this species for these compounds are more limited, but the few available
studies suggest chronic toxicity may occur at substantially lower concentrations; for example, Zhang et al. (2012) reported a LOEC of 0.01 mg/L for growth/weight was for PFNA.
16.3.2.4 Other Aquatic Chordates—Amphibians
Amphibians represent an alternative class of aquatic/semi-aquatic chordates for which PFAS toxicity studies have
been conducted. There are currently limited PFAS toxicity data available for amphibians, but this class of
organisms is becoming more widely studied. Nearly all the available amphibian studies entail acute studies in aquatic life stages (with mortality as the endpoint) on PFOS exposures to several species, including Xenopus laevis
(African clawed frog), Rana pipiens (northern leopard frog), Rana nigromaculata (black-spotted frog), Pseudocris crucifer
(spring peeper), and Bufo gargarizans (Asiatic toad). Of these, R. pipiens and P. crucifer are native to North America. Amphibian data are discussed in Section 7.2 and summarized in Table 7-9 for PFOS and PFOA. These studies
indicate mortality is observed in amphibians at water concentrations over 10 mg/L, with chronic toxicity occurring at
lower levels (although within the range of acute toxicities), and that PFOA is less toxic than PFOS.
368

16.3.2.5 Crustaceans
Freshwater Acute
Acute toxicity data for freshwater crustaceans are focused on various daphnids (see Table 7-1, link in Section
7.2), with some data on freshwater shrimps such as the cherry shrimp (Neocaridina denticulate) (Li 2009). The
largest number of publications are on the water flea, Daphnia magna, where 24–48-hour survival data are
available for PFBA, PFOA, PFNA, PFDA, PFUnDA, PFDoDA, and PFOS. For most other freshwater species, acute toxicity data are limited to PFOA and PFOS.
Chronic
A smaller number of specific PFAS have been assessed for chronic toxicity in freshwater crustaceans. This includes PFOA, PFBS, PFOS, and GenX salt (ammonium 2,3,3,3-tetrafluoro-2-(heptafluoropropoxy)-propanoate)
(Drottar and Krueger 2001). The 21-day survival and reproduction assay with daphnids is reported for both PFOS and PFOA (see Table 7-1, link in Section 7.2). A series of studies evaluated bioavailability of certain PFAS with
respect to exposure cofactors such as dissolved proteins, organic carbon composition, and other solutes (Xia, Dai,
et al. 2015; Xia, Rabearisoa, et al. 2015; Xia et al. 2013). Although these studies do not estimate ECs or LCs for
specified PFAS, they demonstrate that abiotic factors require consideration for exposure assessment and comparison across aquatic toxicity studies.
Saltwater Acute
Two short-term studies (96 hours) provide some data on the acute toxicity of PFOS in marine crustaceans.
The two tested species, both mysid shrimp, are Siriella armata and Mysidopsis bahia, for which NOECs of 0.550—
1.25 mg/L (Drottar and Krueger 2000; Mhadhbi et al. 2012) were derived; however, the values for S. armata were based on nominal concentrations (Mhadhbi et al. 2012). Additional studies are needed to evaluate other PFAS,
as well as to discern differences in acute toxicity among benthic, epibenthic, and pelagic crustacean species.
Chronic
There are very few laboratory-based chronic toxicity studies available for marine crustaceans. One study was a
35-day growth, reproduction, and survival assay for PFOS using mysid shrimps (Mysidopsis bahia) (Drottar and
Krueger 2000); values summarized in Table 7-1, link in Section 7.2). Simpson et al. (2021) more recently conducted a comprehensive study of PFOS sediment, overlying water, and/or porewater exposure to various
benthic marine/estuarine species, reporting chronic effects data for an amphipod (Melita plumulosa), a copepod
(Nitocra spinipes), and a crab (Macrophthalamus sp.).
While there are multiple studies regarding the occurrence of PFAS in wild-caught crustaceans, there is little
information on biological effects. There is one recent report on wild-caught eastern school prawn (Metapenaeus
macleayi) that found associations between metabolomic profiles and certain PFAS, but the exposure history for
the animals was unknown (Taylor et al. 2019).
369

16.3.2.6 Mollusks
Freshwater Acute
For freshwater mollusks, toxicity studies of PFOA and PFOS are limited to five species: bladder snail (Physa acuta),
fatmucket clams (Lampsilis siliquoidea), black sandshell mussels (Ligumia recta), Unio ravoisieri, and zebra mussels
(Dreissena polymorpha) (Li 2009; Hazelton et al. 2012; Fernández-Sanjuan et al. 2013; Amraoui, Khalloufi, and Touaylia 2018). The fatmucket and black sandshells are native to North America, whereas the remaining three are
nonnative to the U.S. or are invasive species, as in the case of zebra mussels. Following 24- to 96-hour
exposures, Hazelton et al. (2012) estimated lower EC50s for PFOS than for PFOA in both fatmucket clams and
black sandshell mussels, where larvae were more sensitive than juveniles toward PFOS.
Chronic
Assessments of chronic effects in freshwater mollusks are limited to a single study with water concentrations
that were much higher than those detected at most remediation sites. Following a 28-day exposure to PFOS,
Hazelton et al. (2012) observed impaired growth effects in larval and juvenile fatmucket clams as determined
by reductions in larval viability (LOEC of 0.0045 mg/L) and impaired metamorphosis (LOEC of 0.0695 mg/L),
respectively. Fernández-Sanjuan et al. (2013) evaluated the physiological responses of nonnative and invasive
zebra mussels toward a mixture of PFOA and PFOS (0.001—1 mg/L, 10 days), but did not report any mortality.
Saltwater Acute
Acute toxicity studies for marine mollusks are currently limited to PFOA, PFNA, PFOS, and PFDA. A larger body of literature exists on occurrence and tissue concentrations in mussels and oysters, but almost none of these
assessed whole or suborganism level effects. Two 96-hour acute toxicity tests reported NOECs for mortality in Unio
complamatus (20 mg/L) and eastern oyster (Crassostrea virginica) (18 mg/L) (Drottar and Krueger 2000).
Chronic
Chronic studies for sublethal effects of PFAS on bivalve mollusks are limited to a few marine species, including
green mussels (Perna viridis), Mediterranean mussels (Mytilus galloprovincialis) and California mussels (Mytilus
californianus). In vitro and in vivo studies of California and Mediterranean mussels offer some information relative
to effects on xenobiotic transport proteins and enzymatic activities, respectively (Stevenson et al. 2006; Balbi et
al. 2017; Gülsever and Parlak 2018), but do not quantify ECs, NOECs, or LOECs for whole-organism exposures.
A series of studies using green mussels reported on multiple endpoints following 7-day exposures to PFOS, PFOA, PFNA, and PFDA. These studies evaluated biochemical markers of altered xenobiotic metabolism (Liu,
Gin, and Chang 2014), genotoxicity (Liu et al. 2014), oxidative stress (Liu, Chang, and Gin 2014), and
immunotoxicity (Liu and Gin 2018) and reported NOECs ranging from 0.010-0.100 mg/L (PFOA and PFNA) down
to 0.001-0.01 mg/L (PFOS and PFDA). Simpson et al. (2021) reported chronic no-effects levels for two species of
bivalve mollusks (Tellina deltoidalis and Soletellina alba) of 0.22 mg/L and ≥ 0.85 mg/L, respectively.
370

16.3.2.7 Aquatic Insects
Freshwater Toxicity data for aquatic insects (for example, midges, mayflies, dragonflies) are available in the literature, although they mainly stem from acute studies of PFOS, PFOA, and PFNA in the freshwater midge species
Chironomous riparius and C. tentans (see Section 7.2.2.1). Of the aquatic invertebrate species, the chironomids
are currently reported as having the highest sensitivity to PFOS (MacDonald et al. 2004). Acute effects are
observed to generally occur at water concentrations of approximately 60 mg/L or greater, with chronic effects
induced at concentrations less than 0.002 mg/L (see Section 7.2.2.1).
Toxicity data for other orders of aquatic insects are very limited, although some studies indicate that the
odonates may also be highly sensitive to PFAS exposures. Van Gossum et al. (2009) found behavior changes following long-term (4-month) exposure of PFOS to damselflies (Enallagma cyathigerum) with NOECs reported
from 0.010 mg/L to 0.100 mg/L. Bots et al. (2010) conducted a lifetime exposure study of PFOS on E. cyathigerum,
finding adverse effects on egg development, larval hatching, development and survival, metamorphosis, and body
mass, with NOECs ranging from less than 0.010 mg/L (for metamorphosis) to over 10 mg/L (for egg hatching success).
Saltwater No toxicity information was found on marine insects.
16.3.2.8 Algae/Vascular Plant Data
Section 7.2.4.1 provides a summary of aquatic plant toxicity data. Data on the toxic effects of PFAS on aquatic
plants are limited to studies that evaluated PFOS exposures on several algal/microalgal species, on duckweed
(Lemna gibba), and on watermilfoil (Myriophyllum spicatum). Acute toxicity of PFOS in freshwater aquatic plants has been found to range from approximately 30–100 mg/L, with chronic values generally about tenfold lower.
In a chronic study on a saltwater species of diatom (Skeletonema costatum) Desjardins et al. (2001) reported
observed effects at approximately 3 mg/L. Simpson et al. (2021) reported a chronic NOEC of > 4.2 mg/L for
growth rate as an endpoint.
16.3.3 Aquatic-Dependent Wildlife
This section considers aquatic-dependent wildlife (primarily birds and mammals) in developing surface water criteria for PFAS. It is important to note that the development of such criteria is still in its infancy because (i) there
are few laboratory or field studies with data on the toxicity of PFAS to wildlife, (ii) data of sufficient/appropriate
quality on the concentration of PFAS in the diet of aquatic-dependent wildlife are limited, and (iii) the unique
properties of PFAS make the modeling of food chain uptake complicated. The following sections briefly discuss why aquatic-dependent wildlife should be considered and present methods that can be used to derive surface
water quality criteria for their protection.
371

16.3.3.1 Why Consider Aquatic-Dependent Wildlife?
As described in Section 16.3.1, the focus for deriving surface water quality criteria is primarily on protecting aquatic
life (for example, plankton, benthic invertebrates, fish, shellfish). However, it has long been recognized that wildlife species may be more sensitive than aquatic species toward certain contaminants as a result of dietary exposure,
particularly if the contaminant is bioaccumulative (USEPA 1985, 1989, 2005).
Because some PFAS are known to be bioaccumulative (see Section 5.5), it cannot be assumed that surface water quality criteria derived for the protection of aquatic life will also be protective of aquatic-dependent wildlife.
Protection of aquatic- dependent wildlife is of importance at contaminated sites, particularly for wildlife with
smaller home ranges that coincide with the extent of PFAS impacts (Conder et al. 2020; Divine et al. 2020). In
developing risk-based screening levels (RBSLs) for different classes of receptors, Divine and coworkers found that
for some PFAS, RBSLs for aquatic-dependent wildlife are lower than RBSLs for aquatic life. Lastly, due to the
long-range transport for some PFAS (see Section 5.3), there could be a need for surface water quality criteria
protective of aquatic-dependent wildlife in remote areas where management actions to address human exposure may not address ecological exposures.
16.3.3.2 Surface Water Quality for the Protection of Wildlife
The principal approach to developing protective surface water quality for wildlife is to use standard desktop wildlife
exposure models to solve for a media concentration that results in exposure being equal to a selected toxicity
threshold. In modeling exposure, such an approach either uses measured contaminant concentrations in the tissue of the prey/forage or relies on BAFs (to estimate prey/forage tissue concentrations). The same toxicity
threshold can be used in either case. Another approach is to determine a critical concentration in the tissue of a
prey item that is protective of the wildlife receptor. The advantage of this “body burden” approach is that it avoids the uncertainties associated with relying on BAFs; however, it entails the collection of site-specific tissue
data for implementation.
These two approaches are discussed in the following sections.
16.3.3.3 Calculation of a Protective Surface Water Quality Value for Aquatic-Dependent Wildlife
In 1995, USEPA published the Great Lakes Water Quality Initiative (GLI) Technical Support Document for Wildlife
Criteria (USEPA 1995). The GLI Technical Support Document provided technical information on the derivation of surface water quality criteria to protect birds and mammalian wildlife. The method is similar to that used to derive
noncancer human health criteria and relies on the use of BAFs in a food chain model to back-calculate a surface
water value (USEPA 2017). USEPA has used this method for chemicals such as DDT, PCBs, 2,3,7,8-TCDD, and mercury, for which aquatic life-based criteria were modified to become more stringent in order to incorporate
adverse effects to wildlife (USEPA 1995). States and tribes bordering the Great Lakes, as well as other states,
such as California, have since adopted this approach to derive aquatic-dependent wildlife surface water quality
criteria.
The GLI Technical Support Document (USEPA 1995), Section III, provides the equations needed to calculate a
protective surface water quality value for birds and mammals from exposure via food and water ingestion (see text
box).
372

By extension, this method can be used in the
development of surface water values for PFAS. The GLI approach uses five representative species
(bald eagle, herring gull, belted kingfisher, mink,
and river otter), because these species are likely to be subjected to the highest exposure from
bioaccumulative contaminants through the aquatic
food web. However, depending on the conceptual model under evaluation, it might be more
appropriate to select different representative
species (for example, sandpiper species given
their relatively high incidental ingestion of sediment). Giesy et al. (2010) provided good
examples of using the GLI approach to calculate
surface water criteria for trophic level IV predatory birds for two compounds, PFOS and PFBS.
The GLI Technical Support Document includes
tables with values for the exposure parameters (body weight, water and food ingestion rates, as
well as prey/forage trophic level). Other sources of
receptor-specific exposure parameters can be found in USEPA’s Wildlife Exposures Factor
Handbook USEPA (1993), Conder et al. (2020),
and Divine et al. (2020). However, it is a best
practice to select exposure parameters that are most representative of the populations living
within the area to which the criteria will be
applied. Climate, temperature, habitat, and many other factors specific to the region underlying the
studies that are the basis of the exposure factors
can vary significantly.
Key PFAS-specific components to this approach
are the selection of, and sources for, BAFs to estimate prey or forage tissue concentrations, and
the wildlife toxicity data for PFAS (no observed
adverse effect levels [NOAELs] and lowest
observed adverse effect levels [LOAELs]).
As noted in Section 16.2.1.4, given the influence
of BAFs on calculation of a water quality value,
their use and applicability need to be carefully
considered. Information on a literature review and selection of
BAFs is provided in Section 5, with a compilation of
BAFs and their sources presented in Table 5-1 (see link in Section 5.5).
373

As noted, there are currently few PFAS toxicity data for wildlife in the scientific literature or standard toxicity
databases. Furthermore, given the minimum toxicity database requirements for developing Tier I criteria (see USEPA (1995)), it is unlikely these requirements will be met for individual PFAS at the current time. Note that the
GLI technical support document does provide guidance on developing Tier II wildlife values for contaminants with
limited toxicity data (USEPA 1995). Conder et al. (2020) and Divine et al. (2020) are good sources of PFAS toxicity reference values (TRVs) for avian and mammalian wildlife that not only include tables of recommended values, but
also provide guidance on reviewing toxicity studies reported in the literature and selecting the values. Additionally,
Table 7-3 presents TRVs derived for mammalian wildlife.
16.3.3.4 Calculation of a Protective Prey/Forage Tissue-Based Value
USEPA published a science advisory board consultation document on tissue-based criteria for “bioaccumulative”
chemicals as proposed revisions to aquatic life guidelines (USEPA 2005). The approach is based on the
recognition that for bioaccumulative chemicals, there is a need to develop criteria that account for multiple routes
of exposure such as the diet, sediment, and water.
The approach is similar to that for developing a water-based value in that it is based on a daily dietary dose of a
chemical that is protective of most sensitive species and integrates it with exposure potential to estimate a
chemical concentration in the dietary tissue of representative species, also referred to as a wildlife value (WV). The advantage of this approach over the water-based approach is that it eliminates the uncertainty associated
with using BAFs but requires the sampling of appropriate prey biota for implementation.
The equation in the text box below used to develop a tissue-based WV is based on the GLI model for aquatic-dependent birds and mammals but expressed as the chemical concentration in the diet rather than in water (see
USEPA (2005), Section 4.4). As discussed above, sources of exposure information can be found in USEPA (1993, 1995), Conder et al. (2020), and Divine et al. (2020).
Note that if the target aquatic-dependent wildlife is exposed via several trophic levels, a WV will need to be
calculated for each trophic level using BAFs, or if available, applicable BMFs for the targeted aquatic-dependent wildlife receptor (see Table 5-2, Section 5.5). This will then guide which species of prey/forage to target when
monitoring for compliance.
Because this approach was developed to address
the bioaccumulation of lipophilic chemicals, it assumes the chemical contribution from water is
negligible, which, as discussed in Section 5.5.2,
may not be the case for some PFAS. Furthermore,
it does not consider dietary intake via the incidental ingestion of sediment, which as noted
above, can be included depending on the species
of wildlife being evaluated. As indicated by Larson, Conder, and Arblaster (2018), incidental
sediment ingestion could be a significant
contributor to exposure to aquatic-dependent wildlife.
374

16.4 Sampling and Analysis
This section reviews the collection and analysis of surface water, biota, and surface sediment from aquatic systems. In most instances, the precautions taken to minimize biasing the concentrations of PFAS in the
samples from sampling equipment and/or sampler protective clothing, among others, are the same as those
described in Section 11.1 when sampling groundwater, surface soils, or fish. There are some unique aspects about where to collect a surface water sample that are discussed in this section. For analysis, the methods
used for PFAS in drinking water, soil samples, plant material, and groundwater described in Section 11.2 are
also used for surface water, biota, and surface sediment. Issues and recommendations unique to sampling PFAS-containing foam are covered in Section 16.5.
16.4.1 Surface Water Sampling
Surface water bodies include, but are not limited to, oceans, bays, estuaries, lakes, streams, ponds, creeks, springs, wetlands, reservoirs, and artificial impoundments. The sample collection for PFAS from a surface water
body is essentially the same as for other chemicals or pollutants. Standard operating procedures for sampling equipment have the same limitations, such as PFAS-free samplers, that are used for collection of samples from
potable water systems or groundwater monitoring wells. See Section 11.1 for general sampling techniques and
equipment requirements for PFAS sampling, including examples of PFAS-specific sampling protocols, and Section 11.2 for analytical methods and techniques.
In addition to USEPA’s Compendium of Superfund Field Operations Methods (USEPA 1987) for general guidance on
sampling surface water, Michigan (MI EGLE 2021; MI DEQ 2018) and New York (NY DEC 2021) have recently
developed guidance specifically for PFAS. Some examples of sampling consideration in a moving water body such as a creek include:
• sampling far enough downstream from the suspected source to allow for adequate mixing
• collecting samples from the upstream side of the sampler to minimize compromising the sample
• collecting the sample from mid-depth in the thalweg (that is, along the natural direction of water flow, below the air/surface water interface but above the surface water/surface sediment interface)
• depending on your sampling objectives, collecting samples from multiple depths to provide the necessary information. This is due to the potential for stratification of PFAS concentrations through the
water column and the location of the receptors of concern (i.e., benthic organisms or fish).
Due to chemical properties of PFAS, concentrations in the surface water near the discharge location may be higher at or near the surface. Collecting samples only from the surface may inform you of the worst-case scenario but may not provide information on locations away from the discharge point, such as at a water intake
for domestic and industrial use. The same concern applies to PFAS-containing foam. Including this foam in the
sample will bias the PFAS concentration high due to the elevated concentrations in the foam (see Section
16.5.5).
Additional considerations for surface water sampling during site characterization are noted below in Section 16.4.5.
375

16.4.2 Biota Sampling
Because some PFAS are known to accumulate in aquatic biota and in some instances may drive the development of surface water quality criteria (see Sections 16.2.2.2 and 16.3.3), sampling for biota may be an
important component of a monitoring program or health assessment. The species of biota to collect and the
tissue types to sample will depend on the study objectives. For example, a human health–based study should focus on collecting species within a size range targeted by recreational anglers or crabbers (NJDEP 2018),
while an ecological-based study should focus on species representing different trophic levels, as well as
benthic and pelagic habitats, and be of a size range targeted by piscivorous birds and mammals. In addition,
because it has been shown that some PFAS bioaccumulate to a higher degree in the blood and liver compared
to the flesh (see Section 11.1.7.8), collecting and analyzing different tissue types might be an important
consideration in a study design.
General guidance on the use of different sampling techniques for fish and shellfish such as gill nets, seines,
trawls, and electrofishing, can be found in USEPA (2000), and many states have their own guidance, which
should be considered. When sampling biota for PFAS analysis, the additional precautions described in Section
11.1 should also be followed, and some states, such as Michigan, have developed their own PFAS-specific guidance (MI DEQ 2019). For example, collected biota should be wrapped in HDPE or polypropylene bags and/or
aluminum foil, and stainless-steel tables, knives, and weighing scale hooks should be used for sample
processing (in the field or in the lab), as well as untreated wooden cutting boards. Given that PFAS are widely present in the environment and human-made materials, it will be important to collect
equipment blanks during sample collection and processing. Close coordination with the analytical laboratories will
be needed to ensure similar PFAS-specific precautions are followed at all times (see Section 11.2).
Additional considerations include sampling surface water and surface sediment within the same area from
which the biota are collected. While it is recognized that many aquatic biota are migratory or exhibit extended
home ranges, this information will help support identification of PFAS sources as well as potentially the development of site-specific BCFs, BAFs, and biota- sediment concentration factors (BSAFs). BSAFs represent the amount of
PFAS taken up by an organism from the sediment and are measured as the ratio of the concentration in an
organism to the concentration in sediment. BSAFs are typically developed for those organisms in close contact with surface sediment, such as benthic and epibenthic invertebrates, as well as benthic fish (Figure 17-1).
376

16.4.3 Sediment Sampling
Because sediment can be a contaminant sink, a transport mechanism, and a source of contaminants to a
surface water body and to benthic organisms, it may be necessary to sample sediment for PFAS to support an understanding of its contribution to the surface water quality and/or biota tissue concentrations. Conventional
sediment sampling and coring techniques and protocols can generally be used to obtain samples for analysis of
PFAS. Section 11.1 describes sampling protocols for all types of samples, with additional detail for porewater in Section 11.1.7.4 and sediment samples in Section 11.1.7.5
Examples of seven different sampling protocols typically used are detailed below:
• Where the sediment is accessible and can hold its form without collapsing, a corer or “Dormer Piston” sediment sampler could be used.
• When collecting samples from shore or wading, the sample should be collected from the upstream side of the sampler to minimize potentially compromising the sample from stirred-up sediment or from a
waterproof coating on waders.
• Sediment core samples are collected directly from single-use liners and are not reused.
• There can be sites where the sediment is accessible but either the sediment is sloppy and would not
hold its form, or there is a high density of tree roots or boulders and a corer or piston sampler would not be feasible. In these situations, a stainless-steel trowel could be used to collect surface sediment
samples.
• For subtidal sediments, the depth below the sediment surface from which the sample is required determines what equipment is needed. For surface sediment samples, devices such as a modified
van Veen grab, Ekman grab, or Ponar grab sampler can be used, while for deeper subsurface samples, devices such as a vibracorer should be used. This nondedicated equipment (equipment
used for more than one water body or location) should be verified as PFAS free, and the sampling
program should include collection of equipment blanks.
• For sampling subtidal sediments, the depth from which the sample is required dictates what
specialized sampling equipment is needed.
• Samples should be collected in HDPE wide-mouth bottles provided by the laboratory, and fitted with an unlined (no Teflon) polypropylene screw cap. A minimum of 50 g of sample is needed. Field
observations, including sediment type, texture, and color, should be recorded.
16.4.4 Analytical Methods
Analytical methods for the analysis of PFAS in a surface water share many of the same components as those
used for PFAS in other non-drinking water media. A discussion of these analytical methods is found in Section 11.2. Most surface water samples for PFAS are analyzed by Modified EPA 537.1 and use the DOD’s Quality
Systems Manual (QSM) for Environmental Laboratories, Version 5.3, Appendix B, table B-15 (USDOD 2019),
providing the most current and comprehensive set of quality standards for PFAS analysis. In June 2019, USEPA validated EPA SW-846 Method 8327 for the analysis of PFAS in surface water, groundwater, and wastewater
(USEPA 2021). Method 8327 is available for use but has not yet been fully incorporated into SW-846. Method
8327 has not been widely used because it creates laboratory cleanup and accuracy issues and is not accepted by DOD.
377

16.4.5 Site Characterization
Conducting site characterization of PFAS at a site with a surface water body should begin with determining the
beneficial uses as described in Section 16.1.1. Those beneficial uses should be used to select the types of samples to be collected. For example, if evaluating PFAS-containing foam, sample collection will be required near
the surface; if evaluating potential impacts to benthic organisms, samples closer to the sediment/water interface
should be collected, and if evaluating pelagic fish, it may be necessary to collect a surface water sample integrated throughout the water column. Point sources such as stormwater discharge pipes or a publicly owned
treatment works (POTW)discharge should be located and potentially targeted for sampling to evaluate sources
of PFAS to the water body. Establishing the locations of natural and human-made water inflow and outflow points to the water body will also help guide sample points and potential exposure sites.
Groundwater/surface water interaction may also play a role in establishing the conceptual site model and locating
places to sample. Section 10 contains more specifics regarding site characterization and development of a conceptual site model.
378

16.5 Surface Water Foam
PFAS-containing foam (discussed in this section) is differentiated from AFFF (discussed in Section 3) in that it is
the result of dissolved-phase PFAS in surface waters that have been agitated by wind or wave action and
aggregated into a mass at or above the surface of the water, irrespective of the PFAS source type.
16.5.1 Foam Above Water Interface
PFAS-containing foam may occur at and above the air-water interface on surface waters. In this context, surface water is subdivided and defined below. This subdivision describes vertically downward the air-water interface,
surface micro layer (SML), neuston, and underlying water column. See Figure 16-2.
Figure 16-2. PFAS foam on surface water
Although it is typical to find PFAS-containing foam near release source areas, it may also occur some distance
away when surface water bodies are interconnected. Source proximity may impact the concentration of PFAS
analytes in the foam column itself. However, concentrated PFAS-containing foam may occur on surface water bodies containing low to nondetect PFAS concentrations immediately below the foam itself some distance from
the source areas (MPCA 2020; Schwichtenberg et al. 2020). Underlying partitioning considerations are discussed
in Section 5.2.2, Considerations for PFAS Partitioning.
Variable surface water depth, flow conditions, and co-contaminant mixtures may affect the presence,
aggregation, and physical movement of PFAS-containing foam in the SML and above the air-water interface.
These factors may be considered when evaluating fate and transport of PFAS-containing foam, as it may partition back into solution in the water column as it moves with the flowing water. A foam column at and above the
surface may be affected by physical forces, including precipitation, wind, and wave action, causing it to
separate and travel as smaller foam source material “islands” or collapse and dissolve back into the water
column as it travels with the wind and waves.
379

16.5.2 Foam Characteristics
PFAS-containing foam has wide-ranging visual and textural appearances. These characteristics range from
deflated, dry, or aged in appearance, as small aggregations of bubbles accumulating into larger islands of billowed piles, frozen in standard bubble foam appearance or frozen in thin sheetlike membrane appearance,
frozen on top of snow and ice, dark coloration due to detritus or organic content, and bright white, with an
aerated shaving cream or whipped cream texture.
“High turbulence generated foam tends to be fluffy, actively regenerates, and does not appear to contain high
levels of organic material; while older, deflated foam does not actively regenerate and appears to be rich in
organic or non-organic particulates. Foam observed along creeks and streams tend to vary in appearance and
can occur with any combination of the above-listed characteristics. Wind-generated foam has only been
observed on lakes, has generally been white and fluffy, and has actively accumulated along a downwind
shoreline. Both organic-rich foam and unfrozen foam with a wrinkled appearance have been observed to
accumulate along ice dams or ice shelves” (MPCA 2020).
16.5.3 Stratification Within Foam
Surface water foam is known to be laden with bacteria, detritus, and other naturally occurring material.
However, stratification of concentrations of PFAS within the foam column or pile may be due to a number of
physical and chemical conditions. For example, co-contaminants may impact the degree of stratification in the surface water column and the foam itself. Additionally, the foam may be aged and in a dry condition toward the
top of the foam column/pile, creating a concentration gradient toward the base of the column/pile.
Sampling should be conducted so as to maximize consistency and reproducibility during PFAS surface water sampling to understand PFAS stratification in the surface water column and the foam. The Michigan Department
of Environment, Great Lakes, and Energy (EGLE) has published a surface water foam sampling guidance, a surface water foam study report, and has published other PFAS sampling guidance (MI EGLE 2019, MI EGLE
2021, MI EGLE 2021).
As of the date of this publication, the state of Minnesota is working with technical support from the USEPA Office of
Research and Development to evaluate foam sampling techniques aimed at understanding the concentration variability within the foam, at the surface micro layer, and the underlying near-surface water column.
16.5.4 Frozen Foam
PFAS-containing foam has been confirmed in frozen form on surface water in Minnesota, Michigan, and Wisconsin
(MPCA 2019). Appearance of the foam is difficult to distinguish from snow and ice along stream or lake
embankments. PFAS- containing ice has been confirmed in Michigan and can visually take the form of thin film-
type islands or within massive ice (MPCA 2020). The ice appears to stratify vertically in concentration where located in massive ice. Confirmation of the degree of stratification in massive ice is an on-going study at this time.
Early results from Michigan indicate it appears to increase in concentration with elevation in the ice cores,
indicating the ice/air interface may be where the highest concentrations exist, similar to the propensity for PFAS to travel at the air/water interface.
380

16.5.5 Surface Micro Layer
As previously discussed, PFAS in solution tends to accumulate at the air/water interface, also known as the
surface water micro layer or SML. The SML in this context, is generally understood to mean the layer in contact with ambient air and is approximately 50µm thick (MPCA 2020). Variability in sample collection techniques
and the extent to which this interface is included or omitted in the collection of a bulk water sample may result in
biased analytical results. This can further lead to incorrect conclusions about PFAS concentrations in surface waters at source areas and in the downgradient direction. Where the SML is not characterized and only the
deeper water column is sampled, PFAS concentrations may be biased low . The SML may be the location of the
highest PFAS concentration in the water column. Omitting collection of the SML could potentially lead to an
inaccurate assessment of the risk to human and ecological receptors. Therefore, when preparing a sampling plan, it is important to consider the depth of the water column that is most relevant to the human and ecological
receptors that may be exposed to PFAS; different receptors may require unique sampling strategies. At this
time, methods to characterize PFAS concentrations and the nature of exposed biota in the SML are still under
study (https://www.serdp-estcp.org/Program-Areas/Environmental-Restoration/Risk-Assessment/ER19-1205).
Due to the physical and chemical properties of PFAAs, including their hydrophilic heads and hydrophobic tails, a
given molecule may preferentially exist within the SML. Section 4 includes information about PFAS physical and
chemical properties. Sampling the SML in relative isolation from the neuston layer below it or the foam column above it may become an important factor in accurate representation of the concentrations emanating from the
SML into foam above when physical agitation occurs. The Michigan EGLE guidance for sampling PFAS-containing
foam provides a starting point to understanding the considerations of this sampling protocol in varied circumstances (MI EGLE 2019). Michigan EGLE has also published other PFAS sampling guidance that may be relevant for a
project (MI EGLE 2021).
16.5.6 Neuston Layer
The neuston layer may be defined, for the purposes of studying PFAS-containing foam, as the zone directly underlying the SML that is typically enriched with biological life and aligns with the larger definition by Wurl et al.
(2017), which was related to strata thicknesses. Wurl et al. (2017) indicated
“The sea surface microlayer is the boundary interface between the atmosphere and ocean, covering about
70% of the Earth’s surface. The SML has physicochemical and biological properties that are measurably distinct from underlying waters. Because of its unique position at the air-sea interface, the SML is central to a
range of global biogeochemical and climate-related processes. Historically, the SML has been summarized
as being a microhabitat comprised of several layers distinguished by their ecological, chemical and physical properties with an operational total thickness of between 1 and 1000 µm.”
While this 1,000 µm SML definition is large enough to encompass the neuston, the refined definition of 50 µm thick
SML provided above is considered the state-of-the practice for the purposes of understanding and evaluating
PFAS-containing foam and layers of significance immediately underlying it. Liss and Duce (1997) clarify the
neuston below the 50 µm SML as two distinct biological layers, “[The] neuston can be divided into epineuston and hyponeuston. The epineuston includes more than 40 species of water striders, Halobates, inhabiting the open
ocean and coastal areas. The hyponeuston are organisms in the surface centilayer including hydrozoa, mollusks,
copepods, isopods, decapod crustaceans, fishes, and the seaweed Sargassum.”
Section 11.1.7.3 includes generalized surface water sampling guidance references. For PFAS-containing foam
on surface water, it appears that the neuston layer is of particular importance in understanding dissolved-phase PFAS within the water column that may be available to the SML for aggregation and concentration into foam at
the air-water interface. The neuston may also provide insight into the stratification of PFAS in the water column
below the interface.
381

16.5.7 Analytical Methods
Analytical methods for the analysis of PFAS-containing foam are essentially the same as those used for PFAS in
other non- drinking water media. A discussion of these analytical methods is found in Section 11.2. As with all non-drinking water samples, there is no USEPA-certified method for the analysis of PFAS at the time of this
publication. Efforts are being undertaken to develop the various analytical methods for the various non-drinking
water media. Since there may be very high levels of PFAS in PFAS-containing foam, the laboratory should be
warned of this potential so that it can take the necessary precautions during analysis. In the Minnesota case study (MPCA 2020), a commercial laboratory analyzed PFAS- containing foams using their proprietary method of
LC/MS/MS. These foam samples were collected following the Michigan foam sampling guidance noted above,
with caution taken to prevent dilution of the sample by minimizing contact with the water during foam sample collection.
16.5.8 Enrichment Factors
Enrichment factors are defined for the context of this document as “the calculated fold increase (or decrease) of
PFAS concentrations in foam compared to the co-located surface water sample. These values are unitless and
are determined by dividing the foam concentration of a specific PFAS compound by the concentration of the same compound detected in the surface water sample. The foam enrichment factor for a given PFAS
compound indicates whether that compound is preferentially concentrating into the foam from the bulk water
column” (MPCA 2020).
As reported by McMurdo et al. (2008), “Kaiser et al. (2006) observed that surface foam created by bubbling air
through an aqueous solution was enriched in perfluorooctanoate PFO by up to 3.2 times.” However, simple enrichment factors have been documented in PFAS analytical samples from sites in Minnesota with factors ranging
up to >32,000 times (MPCA 2020).
Currently, the extent to which the presence of foam may deplete PFAS concentrations in surface water is
unclear. Enrichment factors of short-chain versus long-chain PFAS differed in one Minnesota case study (MPCA
2020) where 33 PFAS analytes were provided. With few exceptions, “short chain PFAS did not tend to enrich into the foam. Often the four, five, and six-carbon length chains were not detected in the foam samples. If they were
detected, their concentrations were lower compared to concentrations measured in the surface water sample.
Long-chain PFAS were found to have relatively higher foam-to-water enrichment factors than short chain PFAS. In a majority of the samples, 2-(N-ethyl-perfluorooctane sulfonamide) acetic acid (ETFOSAA) and
perfluorooctanesulfonamide (PFOSA) had the largest foam enrichment” (MPCA 2020).
The ability of surfactants to concentrate in surface water foam is well known, but may be particularly of interest near source areas due to the ability of PFOA to partition into air circumstantially. Both terminal PFOA and PFOS
may become entrained in these foams at high concentration, posing particular risk to ecological receptors in the neuston, SML, and those species reliant on the biological life above and below these zones. In support of this
notion, Battelle (2018) indicated, “Foams in the natural environment are metastable and generally dissipate within
seconds to days. Compositionally, foams are very similar to the SML, they are formed from the air entrapment on SML and they destabilize back to form SML. Compared to bulk water, foams are significantly enriched in many
dissolved and particulate components, including particulate and organic matter, clay minerals, lipids,
hydrocarbons, proteins, bacteria, hydrophobic contaminants, and heavy metals. As such, foams can provide a mechanism for fast transport of the contaminants through aquatic systems and a potential exposure pathway
for aquatic animals and humans.”
Updated May 2021.
382

References
2018. Washington Senate Bill 6413 (2018). Engrossed Substitute Senate Bill 6413.
http://lawfilesext.leg.wa.gov/biennium/2017-18/Pdf/Bills/Senate%20Passed%20Legislature/6413-
S.PL.pdf.
3M Company. 1999. Fluorochemical Use, Distribution and Release Overview.
https://www.ag.state.mn.us/Office/Cases/3M/docs/PTX/PTX2754.p
df.
3M Company. 1999. The science of organic fluorochemistry.
http://www.fluoridealert.org/pesticides/pfos.fr.final.docket.0006.pdf.
3M Company. 2000. Phase-out Plan for POSF-Based Products,. https://www.regulations.gov/document?D=EPA-HQ-OPPT-2002-0051-
0006.
3M Company. 2000. Sulfonated Perfluorochemicals in the Environment: Sources, Dispersion, fate and Effects.
St. Paul, MN. http://www.fluoridealert.org/wp-content/pesticides/pfos.fr.final.docket.0005.pdf.
3M Company. 2003. Environmental, Health and Safety Measures Relating to Perfluorooctanoic Acid And Its
Salts (PFOA). 3M Company. 2006. 3M Production History: Perfluorooctanesulfonyl Fluoride (POSF). http://www.pops.int/documents/meetings/poprc/submissions/Comments_2006/3M.doc.
3M Company. 2007. Remedial investigation report. Phase 2. Fluorochemical (FC) data assessment report for
the Cottage Grove. St. Paul, MN.
3M Company. 2017. 3M and Fluorochemicals. http://www.3m.com/3M/en_US/sustainability-us/policies-reports/3m-and-fluorochemicals/.
3M Company. 2017. About 3M AdMD Fluoropolymers.
http://solutions.3m.com/wps/portal/3M/en_EU/Dyneon_EU/Dyneon_Fluoropolymers/ContactHo10812 wtoBuy/AboutDyneon/.
3M Company. 2018. 3MTM Fluorosurfactants.. accessed 2021. https://tinyurl.com/3z497j8. 40 CFR 300.400. 2019. General. accessed 2021.
https://www.govinfo.gov/app/details/CFR-2019-title40-vol30/CFR-2019-title40-vol30-sec300-400.
40 CFR 300.5. 2001. Definitions. accessed 2021.
https://www.govinfo.gov/app/details/CFR-2001-title40-vol24/CFR-2001-title40-vol24-sec300-5.
Abbott, B. D., C. J. Wolf, J. E. Schmid, K. P. Das, R. D. Zehr, L. Helfant, S. Nakayama, A. B. Lindstrom, M. J.
Strynar, and C. Lau. 2007. Perfluorooctanoic acid induced developmental toxicity in the mouse is dependent
on expression of peroxisome proliferator activated receptor-alpha. Toxicol Sci 98 (2):571-81. 10.1093/toxsci/kfm110.
Abbott, B. D., C. J. Wolf, K. P. Das, R. D. Zehr, J. E. Schmid, A. B. Lindstrom, M. J. Strynar, and C. Lau. 2009.
Developmental toxicity of perfluorooctane sulfonate (PFOS) is not dependent on expression of peroxisome
proliferator activated receptor-alpha (PPAR alpha) in the mouse. Reprod Toxicol 27 (3-4):258-265.
https://doi.org/10.1016/j.reprotox.2008.05.061.
Abdul-Kareem Al-Sofi, M. 2001. Seawater desalination — SWCC experience and vision. Desalination 135
(1):121-139. https://doi.org/10.1016/S0011-9164(01)00145-X.
383

Abercrombie, Sarah A., Chloe de Perre, Youn Jeong Choi, Brian J. Tornabene, Maria S. Sepúlveda, Linda S. Lee,
and Jason T. Hoverman. 2019. Larval amphibians rapidly bioaccumulate poly- and perfluoroalkyl substances.
Ecotoxicology and Environmental Safety 178:137-145. https://doi.org/10.1016/j.ecoenv.2019.04.022.
Abercrombie, Sarah A., Chloé de Perre, Michael Iacchetta, R. Wesley Flynn, Maria S. Sepúlveda, Linda S. Lee, and Jason
T. Hoverman. 2021. Sublethal Effects of Dermal Exposure to Poly- and Perfluoroalkyl Substances
on Postmetamorphic Amphibians. Environmental Toxicology and Chemistry 40 (3):717-726. https://doi.org/10.1002/etc.4711.
ACRP. 2017. Use and Potential Impacts of AFFF Containing Per- and Polyfluoroalkyl Substances (PFASs) at
Airports. http://www.trb.org/ACRP/Blurbs/175866.aspx.
ACS. 2016. Teflon and Perfluorooctanoic Acid (PFOA). American Cancer Society. https://www.cancer.org/cancer/cancer-causes/teflon-and-perfluorooctanoic-acid-
pfoa.html.
AECOM. 2019. Unpublished Conceptual Illustration Showing Surface Water Components within a
Freshwater Environment.
AFCEC. 2012. Monitoring and Remediation Optimization System (MAROS) Software, Users Guide and Technical
Manual. Ahmad, Mahtab, Anushka Upamali Rajapaksha, Jung Eun Lim, Ming Zhang, Nanthi Bolan, Dinesh Mohan, Meththika
Vithanage, Sang Soo Lee, and Yong Sik Ok. 2014. Biochar as a sorbent for contaminant management in
soil and water: A review. Chemosphere 99:19-33. https://doi.org/10.1016/j.chemosphere.2013.10.071.
Ahrens, L., and M. Bundschuh. 2014. Fate and effects of poly- and perfluoroalkyl substances in the aquatic
environment: A review. Environmental Toxicology and Chemistry 33 (9). 10.1002/etc.2663.
Ahrens, L., J. Hedlund, W. Durig, R. Troger, and K. Wiberg. 2016. Screening of PFAS in Groundwater and Surface Water.
Swedish Environmental Protection Agency. http://naturvardsverket.diva-portal.org/smash/get/diva2:915446/FULLTEXT01.pdf.
Ahrens, L., J. Rakovic, S. Axelson, and R. Kallenborn. 2016. Source tracking and impact of per-and
polyfluoroalkyl substances at Svalbard.: Swedish University of Agricultural Sciences.
Ahrens, L., M. Shoeib, T. Harner, D. Lane, R. Guo, and E.J. Reiner. 2011. Comparison of Annular Diffusion Denuder and High-Volume Air Samplers for Measuring Per- and Polyfluoroalkyl Substances in the
Atmosphere. Analytical Chemistry 83 (24):9622-9628. https://doi.org/10.1021/ac202414.
Ahrens, L., S. Felizeter, R. Sturm, Z. Xie, and R. Ebinghaus. 2009. Polyfluorinated compounds in waste water
treatment plant effluents and surface waters along the River Elbe, Germany. Marine Pollution Bulletin 58
(9):1326-1333. https://doi.org/10.1016/j.marpolbul.2009.04.028.
Ahrens, Lutz, Dauren Mussabek, Kenneth M. Persson, and Ronny Berndtsson. 2019. Temporal trends and sediment–water partitioning of per- and polyfluoroalkyl substances (PFAS) in lake
sediment. Chemosphere 227:624-629. https://doi.org/10.1016/j.chemosphere.2019.04.074.
Ahrens, Lutz, Leo W. Y. Yeung, Sachi Taniyasu, Paul K. S. Lam, and Nobuyoshi Yamashita. 2011. Partitioning
of perfluorooctanoate (PFOA), perfluorooctane sulfonate (PFOS) and perfluorooctane sulfonamide
(PFOSA) between water and sediment. Chemosphere 85 (5):731-737. https://doi.org/10.1016/j.chemosphere.2011.06.046.
384

Ahrens, Lutz, Mahiba Shoeib, Tom Harner, Douglas A. Lane, Rui Guo, and Eric J. Reiner. 2012. Correction to
Comparison of Annular Diffusion Denuder and High Volume Air Samplers for Measuring Per- and
Polyfluoroalkyl Substances in the Atmosphere. Analytical Chemistry 84 (3):1797-1797. https://doi.org/10.1021/ac300035.
Ahrens, Lutz, Mahiba Shoeib, Tom Harner, Sum Chi Lee, Rui Guo, and Eric J. Reiner. 2011. Wastewater
Treatment Plant and Landfills as Sources of Polyfluoroalkyl Compounds to the Atmosphere. Environmental
Science & Technology 45 (19):8098-8105. https://doi.org/10.1021/es1036173.
Ahrens, Lutz, Tom Harner, Mahiba Shoeib, Douglas A. Lane, and Jennifer G. Murphy. 2012. Improved
Characterization of Gas–Particle Partitioning for Per- and Polyfluoroalkyl Substances in the Atmosphere
Using Annular Diffusion Denuder Samplers. Environmental Science & Technology 46 (13):7199-7206.
https://doi.org/10.1021/es300898.
Ahrens, Lutz, Zhiyong Xie, and Ralf Ebinghaus. 2010. Distribution of perfluoroalkyl compounds in seawater
from Northern Europe, Atlantic Ocean, and Southern Ocean. Chemosphere 78 (8):1011-1016.
https://doi.org/10.1016/j.chemosphere.2009.11.038.
Ahrens, Lutz. 2011. Polyfluoroalkyl compounds in the aquatic environment: a review of their occurrence and
fate. Journal of Environmental Monitoring 13 (1):20-31. 10.1039/C0EM00373E.
AK DEC. 2009. Site Characterization Work Plan and Reporting Guidance for Investigation of Contaminated Sites. AK DEC. 2014. Spill Tactics for Alaska Responders. Seldovia, AK.
https://dec.alaska.gov/spar/ppr/response-resources/star-manual/.
Al-Amoudi, Ahmed S., and A. Mohammed Farooque. 2005. Performance restoration and autopsy of NF
membranes used in seawater pretreatment. Desalination 178 (1):261-271. https://doi.org/10.1016/j.desal.2004.11.048.
Al-Amoudi, Ahmed, and Robert W. Lovitt. 2007. Fouling strategies and the cleaning system of NF membranes
and factors affecting cleaning efficiency. Journal of Membrane Science 303 (1):4-28.
https://doi.org/10.1016/j.memsci.2007.06.002.
Alaska Clean Seas. 2017. Alaska Clean Seas Tactics Manual.
http://www.alaskacleanseas.org/wp-10870 content/uploads/2015/02/Volume-1-Tactics-
Descriptions.pdf.
Aleksandrov, Krasimir, Hans-Joachim Gehrmann, Manuela Hauser, Hartmut Mätzing, Daniel Pigeon, Dieter
Stapf, and Manuela Wexler. 2019. Waste incineration of Polytetrafluoroethylene (PTFE) to evaluate
potential formation of per- and Poly-Fluorinated Alkyl Substances (PFAS) in flue gas. Chemosphere 226:898-906. https://doi.org/10.1016/j.chemosphere.2019.03.191.
Alexander, B. H., and G. W. Olsen. 2007. Bladder cancer in perfluorooctanesulfonyl fluoride manufacturing
workers. Ann Epidemiol 17 (6):471-8. https://doi.org/10.1016/j.annepidem.2007.01.036.
Alexander, B. H., G. W. Olsen, J. M. Burris, J. H. Mandel, and J. S. Mandel. 2003. Mortality of employees of a
perfluorooctanesulphonyl fluoride manufacturing facility. Occup Environ Med 60 (10):722-9.
http://doi.org/10.1136/oem.60.10.722.
Alexandrescu, F., E. Rizzo, L. Pizzol, and A. Critto. 2015. Building a network-based expert-stakeholder framework
for sustainable regeneration. AquaConSoil Conference 2015, Copenhagen, Denmark, June 9-12 Abstract No.
http://www.aquaconsoil.org.
385

Alfa Aesar. Alfa Aesar web page. https://www.alfa.com/en/catalog/category/chemicals/.
Allred, B. McKay, Johnsie R. Lang, Morton A. Barlaz, and Jennifer A. Field. 2015. Physical and Biological Release of Poly- and Perfluoroalkyl Substances (PFASs) from Municipal Solid Waste in Anaerobic Model Landfill
Reactors.
Environmental Science & Technology 49 (13):7648-7656. https://doi.org/10.1021/acs.est.5b01040.
Amec Foster Wheeler. 2017. Site 8 Pilot Test Results Report, Former Pease Air Force Base. Texas Prepared for
Air Force Civil Engineering Center. Joint Base San Antonio – Lakeland.
Amerex Corporation. 2006. Material Safety Data Sheet, AFFF Foam Concentrate. http://www.amerex-
mexico.com/pdf/certificados/MSDS%20AFFF%20AMEREX.pdf.
American Cancer Society. 2016. Teflon and Perfluorooctanoic Acid (PFOA). https://www.cancer.org/cancer/cancer-causes/teflon-and-10831 perfluorooctanoic-acid-
pfoa.html.
Amini, Adib, Youngwoon Kim, Jie Zhang, Treavor Boyer, and Qiong Zhang. 2015. Environmental and economic sustainability of ion exchange drinking water treatment for organics removal. Journal of
Cleaner Production 104:413-421. https://doi.org/10.1016/j.jclepro.2015.05.056.
Amraoui, Imen, Noureddine Khalloufi, and Samir Touaylia. 2018. Effects to perfluorooctane sulfonate (PFOS)
on the mollusk Unio ravoisieri under laboratory exposure. Chemistry and Ecology 34 (4):324-339. 10.1080/02757540.2018.1433168.
An, Youn-Joo, and Elizabeth R. Carraway. 2002. PAH degradation by UV/H2O2 in perfluorinated surfactant
solutions.
Water Research 36 (1):309-314. https://doi.org/10.1016/S0043-1354(01)00206-8.
Anderson, R. Hunter, Dave T. Adamson, and Hans F. Stroo. 2019. Partitioning of poly- and perfluoroalkyl
substances from soil to groundwater within aqueous film-forming foam source zones. Journal of Contaminant Hydrology 220:59-65. https://doi.org/10.1016/j.jconhyd.2018.11.011.
Anderson, R. Hunter, G. Cornell Long, Ronald C. Porter, and Janet K. Anderson. 2016. Occurrence of select
perfluoroalkyl substances at U.S. Air Force aqueous film-forming foam release sites other than fire-training
areas: Field-validation of critical fate and transport properties. Chemosphere 150:678-685. https://doi.org/10.1016/j.chemosphere.2016.01.014.
Andersson, Eva M., Kristin Scott, YiYi Xu, Ying Li, Daniel S. Olsson, Tony Fletcher, and Kristina Jakobsson. 2019.
High exposure to perfluorinated compounds in drinking water and thyroid disease. A cohort study from Ronneby, Sweden. Environmental Research 176:108540. https://doi.org/10.1016/j.envres.2019.108540.
Angus Fire. 2015. Foam Disposal Guide, Managing Firewater Runoff and Accidental
Spills. Angus Fire. 2017. Firefighting Foam Storage Guidance. 6164.
www.angusfire.co.uk.
Ankley, G. T., D. W. Kuehl, M. D. Kahl, K. M. Jensen, B. C. Butterworth, and J. W. Nichols. 2004. Partial life-cycle toxicity and bioconcentration modeling of perfluorooctanesulfonate in the northern leopard frog (Rana
pipiens). Environ Toxicol Chem 23 (11):2745-55.
Ankley, Gerald T., Philippa Cureton, Robert A. Hoke, Magali Houde, Anupama Kumar, Jessy Kurias, Roman
Lanno, Chris McCarthy, John Newsted, Christopher J. Salice, Bradley E. Sample, Maria S. Sepúlveda,
Jeffery Steevens, and Sara Valsecchi. 2020. Assessing the Ecological Risks of Per- and Polyfluoroalkyl
Substances: Current State-of-the Science and a Proposed Path Forward. Environmental Toxicology and Chemistry 40 (3):564-605. https://doi.org/10.1002/etc.4869.
386

ANSES. 2017. Development of oral-administered treatment for TRV by Perfluorohexanoic acid (PFHxA). Maisons-
Alfort, France: Environmental and Occupational Health & Safety French Agency for Food.
Antea Group. 2011. Perfluorocarbon (PFC)-Containing Firefighting foams and their Use in Minnesota: Survey
and Sampling Activities, State Fiscal Year 2011. https://www.pca.state.mn.us/sites/default/files/c-pfc1-20.pdf.
Anumol, Tarun, Sonia Dagnino, Darcy R. Vandervort, and Shane A. Snyder. 2016. Transformation of Polyfluorinated compounds in natural waters by advanced oxidation processes. Chemosphere
144:1780-1787. https://doi.org/10.1016/j.chemosphere.2015.10.070.
APHA. 2016. Reducing Human Exposure to Highly Fluorinated Chemicals to Protect Public Health. Policy Number
20163: American Public Health Association.
https://www.apha.org/policies-and-advocacy/public-health-policy-statements/policy-database/2016/12/21/reducing-h uman-exposure-to-highly-fluorinated-chemicals.
Appleman, T., C.P. Higgins, O. Quinones, B. Vanderford, C. Klstad, J. Ziegler-Holady, and E. Dickenson. 2014.
Treatment of Poly- and Perfluoroalkyl Substances in U.S. Full-Scale Water Treatment Systems. Water Research 51:246-255. https://doi.org/10.1016/j.watres.2013.10.067.
Appleman, Timothy D., Eric R. V. Dickenson, Christopher Bellona, and Christopher P. Higgins. 2013. Nanofiltration
and granular activated carbon treatment of perfluoroalkyl acids. Journal of Hazardous Materials 260:740-746.
https://doi.org/10.1016/j.jhazmat.2013.06.033.
Arabi, S. and A. Lugowski. 2015. Lessons Learned from Successful Applications of Biological Landfill Leachate
Treatment. Environmental Science and Engineering Magazine 28.
Archroma Nuva. 2017. Aerobic Transformation in Soil study conducted under OECD 307. Submitted to U.S. EPA
by Archroma U.S. Inc. RP2116 GA 39/13-1: Noack Laboratory GmbH.
Arias Espana, Victor Andres, Megharaj Mallavarapu, and Ravi Naidu. 2015. Treatment technologies for aqueous perfluorooctanesulfonate (PFOS) and perfluorooctanoate (PFOA): A critical review with an emphasis on field
testing. Environmental Technology & Innovation 4:168-181. https://doi.org/10.1016/j.eti.2015.06.001.
Arias, V. A., R. Naidu, Chadalavada S., and Mallavarapu. M. 2013. A novel technology for treatment of
aqueous fire fighting foams (AFFF) contaminated wastewater. Cleanup 2013, Melbourne, Australia Abstract No. https://www.crccare.com/events/cleanup-13-5th-international-contaminated-site-
remediation-conference.
Armitage, J. M., U. Schenker, M. Scheringer, J. W. Martin, M. Macleod, and I. T. Cousins. 2009. Modeling the
Global Fate and Transport of Perfluorooctane Sulfonate (PFOS) and Precursor Compounds in Relation to Temporal Trends in Wildlife Exposure. Environmental Science & Technology 43. 10.1021/Es901448.
Armitage, James M., Matthew MacLeod, and Ian T. Cousins. 2009. Modeling the Global Fate and Transport of
Perfluorooctanoic Acid (PFOA) and Perfluorooctanoate (PFO) Emitted from Direct Sources Using a
Multispecies Mass Balance Model. Environmental Science & Technology 43 (4):1134-1140.
10.1021/es802900.
Armitage, James, Ian T. Cousins, Robert C. Buck, Konstantinos Prevedouros, Mark H. Russell, Matthew
MacLeod, and Stephen H. Korzeniowski. 2006. Modeling Global-Scale Fate and Transport of
Perfluorooctanoate Emitted from Direct Sources. Environmental Science & Technology 40 (22):6969-6975.
10.1021/es0614870.
Arp, H. P. H., C. Niederer, and K.-U. Goss. 2006. Predicting the Partitioning Behavior of Various Highly Fluorinated
Compounds. Environmental Science & Technology 40 (23):7298-7304. https://doi.org/10.1021/es060744.
387

Arp, Hans Peter H., and Kai-Uwe Goss. 2009. Irreversible sorption of trace concentrations of perfluorocarboxylic
acids to fiber filters used for air sampling. Atmospheric Environment 43:3654-3655. 10.1016/j.atmosenv.2009.03.001.
Arrieta-Cortes, R., P. Farias, C. Hoyo-Vadillo, and M. Kleiche-Dray. 2017. Carcinogenic risk of emerging persistent
organic pollutant perfluorooctane sulfonate (PFOS): A proposal of classification. Regul Toxicol Pharmacol 83:66-80.
10.1016/j.yrtph.2016.11.021.
Arvaniti, O. S., Y. Hwang, H. R. Andersen, T. S. Nikolaos, and S. S. Athanasios. 2014. Removal of Perfluorinated Compounds from Water using Nanoscale Zero-Valent Iron. Singapore International Water Week.
Arvaniti, O.S., and A.S. Stasinakis. 2015. Review on the occurrence, fate and removal of perfluorinated compounds during wastewater treatment. Science of the Total Environment 524-525:81-92.
https://doi.org/10.1016/j.scitotenv.2015.04.023.
Arvaniti, Olga S., Yuhoon Hwang, Henrik R. Andersen, Athanasios S. Stasinakis, Nikolaos S. Thomaidis, and Maria
Aloupi.
2015. Reductive degradation of perfluorinated compounds in water using Mg-aminoclay coated nanoscale zero valent iron. Chemical Engineering Journal 262:133-139.
https://doi.org/10.1016/j.cej.2014.09.079.
Asher, Brian J., Yuan Wang, Amila O. De Silva, Sean Backus, Derek C. G. Muir, Charles S. Wong, and Jonathan W.
Martin.
2012. Enantiospecific Perfluorooctane Sulfonate (PFOS) Analysis Reveals Evidence for the Source Contribution of PFOS-Precursors to the Lake Ontario Foodweb. Environmental Science & Technology 46
(14):7653-7660. https://doi.org/10.1021/es301160.
ASTM. 2007. Standard Guide for Sampling Ground-Water Monitoring Wells. www.astm.org.
ASTM. 2011. Standard Practice for Environmental Site Assessments: Phase II Environmental Site Assessment
Process.
West Conshocken, PA: ASTM International www.astm.org.
ASTM. 2013. Standard Guide for Sampling Ground-Water Monitoring Wells. West Conshocken, PA: ASTM International www.astm.org.
ASTM. 2013. Standard Guide for Selection of Soil and Rock Sampling Devices Used with Drill Rigs for
Environmental Investigations. West Conshocken, PA: ASTM International www.astm.org.
ASTM. 2013. Standard Practice for Environmental Site Assessments: Phase I Environmental Site Assessment
Process. West Conshocken, PA: ASTM International www.astm.org.
ASTM. 2014. Standard Guide for Core Sampling Submerged, Unconsolidated Sediments. West Conshocken, PA:
ASTM International www.astm.org.
ASTM. 2014. Standard Guide for Developing Conceptual Site Models for Contaminated Sites. West Conshocken,
PA: ASTM International www.astm.org.
ASTM. 2015. Standard Guide for Risk Based Corrective Action. E2081-00(2015). West Conshohocken, PA: ASTM International. www.astm.org.
ASTM. 2017. Standard Test Method for Determination of Perfluorinated Compounds in Soil by Liquid Chromatography Tandem Mass Spectrometry (LC/MS/MS). West Conshocken, PA: ASTM International
www.astm.org.
388

ASTM. 2017. Standard Test Method for Determination of Perfluorinated Compounds in Water, Sludge,
Influent, Effluent and Wastewater by Liquid Chromatography Tandem Mass Spectrometry (LC/MS/MS).
West Conshocken, PA: ASTM International www.astm.org.
ASTSWMO. 2015. Perfluorinated Chemicals (PFCs): Perfluorooctanoic Acid (PFOA) and Perfluorooctane
Sulfonate (PFOS) Information Paper. Washington, D. C.: Remediation and Reuse Focus Group. Federal
Facilities Research Center. https://clu-in.org/download/contaminantfocus/pops/POPs-ASTSWMO-PFCs-
2015.pdf.
Atkinson, C., S. Blake, T. Hall, R. Kanda, and P. Rumsby. 2008. Survey of the prevalence of perfluorooctane
sulphonate (PFOS), perfluorooctanoic acid (PFOA) and related compounds in drinking water and their
sources. http://dwi.defra.gov.uk/research/completedresearch/reports/DWI70_2_212PFOS.pdf.
ATSDR. 2008. Health Consultation: PFOS Detections in the City of Brainerd, Minnesota – City of Brainerd, Crow
Wing County, Minnesota.
ATSDR. 2011. Principles of Community Engagement, Second Edition. NIH Publication No. 11-7782: CTSA Community Engagement Key Function Committee Task Force.
ATSDR. 2012. Public Health Assessment for Perfluorochemical Contamination in Southern Washington County, Northern Dakota County, and Southeastern Ramsey County, Minnesota.
ATSDR. 2013. Health Consultation. Exposure Investigation Report. Perfluorochemical serum sampling in the vicinity of Decatur, Alabama. Morgan, Lawrence, and Limestone Counties.
http://www.atsdr.cdc.gov/HAC/pha/Decatur/Perfluorochemical_Serum%20Sampling.pdf
ATSDR. 2016. Per- and Polyfluoroalkyl Substances and Your Health: Health Effects of PFAS. ATSDR.
https://www.atsdr.cdc.gov/pfc/health_effects_pfcs.html.
ATSDR. 2017. An Overview of Perfluoroalkyl and Polyfluoroalkyl Substances and Interim Guidance for Clinicians Responding to Patient Exposure Concerns.
https://www.atsdr.cdc.gov/pfc/docs/pfas_clinician_fact_sheet_508.pdf.
ATSDR. 2018. Human Health Toxicity Values for Hexafluoropropylene Oxide (HFPO) Dimer Acid and Its Ammonium Salt (CASRN 13252-13-6 and CASRN 62037-80-3). Also Known as “GenX Chemicals”. EPA-823-P-
18-001. Washington D.C.: Office of Water U.S Environmental Protection Agency.
https://www.epa.gov/pfas/genx-toxicity-assessments-documents.
ATSDR. 2018. Per- and Polyfluoroalkyl Substances (PFAS) and Your Health. Accessed September 2018. https://www.atsdr.cdc.gov/pfas/index.html.
ATSDR. 2018. Per- and Polyfluoroalkyl Substances (PFAS) and Your Health. Understanding PFAS Exposure. https://www.atsdr.cdc.gov/pfas/understanding-PFAS-exposure.html.
ATSDR. 2018. ToxGuide for Perfluoroalkyls. Atlanta, GA. https://www.atsdr.cdc.gov/toxguides/toxguide-
200.pdf. ATSDR. 2018. Toxic Substances Portal. Minimal Risk Levels (MRLs) for Professionals. accessed
2019. https://www.atsdr.cdc.gov/mrls/index.asp.
ATSDR. 2018. Toxicological profile for Perfluoroalkyls (Draft for Public Comment). U.S. Department of Health and
Human Services. https://www.atsdr.cdc.gov/ToxProfiles/tp200.pdf.
ATSDR. 2019. Health Consultation PFAS HC-508. EPA PWS ID: 1951020. https://www.atsdr.cdc.gov/HAC/pha/pease/Pease-Tradeport-Public-Water-PFAS-HC-508.pdf.
ATSDR. 2019. Per- and Polyfluoroalkyl Substances (PFAS) and Your Health. Last Modified June 24, 2020. accessed 2020. https://www.atsdr.cdc.gov/pfas/pfas-exposure.html.
389

ATSDR. 2019. PFAS Exposure Assessments. Agency for Toxic Substances and Disease Registry, Last Modified
July 12, 2019. accessed 2020. https://www.atsdr.cdc.gov/pfas/PFAS-Exposure-Assessments.html.
ATSDR. 2020. Multi-site Health Study – PFAS Cooperative Agreement. Last Modified July 22, 2020.
accessed 2020. https://www.atsdr.cdc.gov/pfas/activities/studies/multi-site.html.
ATSDR. 2020. PFAS in the U.S. Population. Last Modified June 24, 2020.
accessed 2020. https://www.atsdr.cdc.gov/pfas/health-effects/us-
population.html.
ATSDR. 2020. ToxGuide for Perfluoroalkyls. Atlanta, GA: U.S. Department of Health and Human Services. March. https://www.atsdr.cdc.gov/toxguides/toxguide-200.pdf.
ATSDR. 2021. Toxicological Profile for Perfluoroalkyls. Atlanta, GA: U.S. Department of Health and Human
Services. https://www.atsdr.cdc.gov/ToxProfiles/tp200.pdf.
Australia Government DOD. 2007. Environmental Guidelines for Management of Fire Fighting Aqueous Film
Forming Foam (AFFF) Products. Directorate of Environmental Impact Management.
Australia Government DOD. 2018. Per- and Poly-Fluoroalkyl Substances (PFAS) Framework – Construction and
Maintenance Projects.
ttp://www.defence.gov.au/estatemanagement/Governance/Policy/Environment/PFAS/docs/Defe11001 ncePFASManagementFrameworkforConstructionandMaintenanceProjects.pdf.
Australia Government DOH. 2018. PFAS Expert Health Panel – Report to the Minister. https://www1.health.gov.au/internet/main/publishing.nsf/Content/C9734ED6BE238EC0CA2581BD00052C03/
$File/exp ert-panel-report.pdf.
Avsec, R. 2015. Seven steps to cleaner firefighter PPE..
https://www.firerescue1.com/fire-products/turnoutgear/articles/3218580-7-steps-to-cleaner-firefighter-
PPE/.
Awad, Emily, Xianming Zhang, Satyendra P. Bhavsar, Steve Petro, Patrick W. Crozier, Eric J. Reiner, Rachael
Fletcher, Sheryl A. Tittlemier, and Eric Braekevelt. 2011. Long-Term Environmental Fate of Perfluorinated
Compounds after Accidental Release at Toronto Airport. Environmental Science & Technology 45 (19):8081-8089. 10.1021/es2001985.
AWWA. 2016. Perfluorinated Compounds Treatment and Removal.
Babut, M., P. Labadie, C. Simonnet-Laprade, G. Munoz, M.-C. Roger, B. J. D. Ferrari, H. Budzinski, and E. Sivade.
2017.
Per- and poly-fluoroalkyl compounds in freshwater fish from the Rhône River: Influence of fish size, diet, prey contamination and biotransformation. Science of The Total Environment 605-606:38-47.
Bach, C. C., B. H. Bech, N. Brix, E. A. Nohr, J. P. Bonde, and T. B. Henriksen. 2015. Perfluoroalkyl and
polyfluoroalkyl substances and human fetal growth: a systematic review. Crit Rev Toxicol 45 (1):53-67.
10.3109/10408444.2014.952400.
Backe, Will J., Thomas C. Day, and Jennifer A. Field. 2013. Zwitterionic, Cationic, and Anionic Fluorinated
Chemicals in Aqueous Film Forming Foam Formulations and Groundwater from U.S. Military Bases by Nonaqueous Large-Volume Injection HPLC-MS/MS. Environmental Science & Technology 47 (10):5226-
5234. 10.1021/es3034999.
Badruddoza, A.Z.M., B. Bhattarai, and R.P Suri. 2017. Environmentally Friendly Cyclodextrin-Ionic Liquid
Polyurethane- Modified Magnetic Sorbent for the Removal of PFOA. ACS Sustainable Chemistry & Engineering 5.
390

Baduel, C., C. J. Paxman, and J. F. Mueller. 2015. Perfluoroalkyl substances in a firefighting training ground
(FTG), distribution and potential future release. Journal of Hazardous Materials 296.
Baerlocher, C., L.B. McCusker, and D.H. Olson 2007. Atlas of zeolite framework types..
Bakke, Torgeir, Torsten Källqvist, Anders Ruus, Gijs Breedveld, and Ketil Hylland. 2010. Development of sediment quality criteria in Norway. 10:172-178. https://doi.org/10.1007/s11368-009-0173-y.
Balbi, Teresa, Caterina Ciacci, Elena Grasselli, Arianna Smerilli, Adriana Voci, and Laura Canesi. 2017.
Utilization of Mytilus digestive gland cells for the in vitro screening of potential metabolic disruptors in aquatic invertebrates.
Comparative Biochemistry and Physiology Part C: Toxicology & Pharmacology 191:26-35. https://doi.org/10.1016/j.cbpc.2016.08.009.
Ballesteros, V., O. Costa, C. Iniguez, T. Fletcher, F. Ballester, and M. J. Lopez-Espinosa. 2017. Exposure to
perfluoroalkyl substances and thyroid function in pregnant women and children: A systematic review of epidemiologic studies.
Environ Int 99:15-28. 10.1016/j.envint.2016.10.015.
Bangma, Jacqueline T., John A. Bowden, Arnold M. Brunell, Ian Christie, Brendan Finnell, Matthew P. Guillette, Martin Jones, Russell H. Lowers, Thomas R. Rainwater, Jessica L. Reiner, Philip M. Wilkinson, and Louis J.
Guillette Jr. 2017. Perfluorinated alkyl acids in plasma of American alligators (Alligator mississippiensis) from
Florida and South Carolina. Environmental Toxicology and Chemistry 36 (4):917-925. 10.1002/etc.3600.
Banks, R. E., B. E. Smart, and J.C. Tatlow, eds. 1994. Organofluorine Chemistry: Principles and Commercial Applications, Spring Science + Business Media. New York: Springer. ISBN No. 978-1-4899-1202-2.
Bao, Y., J. Niu, Z. Xu, D. Gao, J. Shi, X. Sun, and Q. Huang. 2014. Removal of perfluorooctane sulfonate (PFOS) and perfluorooctanoate (PFOA) from water by coagulation: mechanisms and 11029 influencing factors.
Journal of Colloid and Interface Science 434. 10.1016/j.jcis.2014.07.041.
Barber, Jonathan L., Urs Berger, Chakra Chaemfa, Sandra Huber, Annika Jahnke, Christian Temme, and Kevin C.
Jones. 2007. Analysis of per- and polyfluorinated alkyl substances in air samples from Northwest Europe. Journal of
Environmental Monitoring 9 (6):530-541. 10.1039/B701417A.
Barclift. 2013. Navy Case Study: Occurrence of Two Emerging Contaminants (PFOA & PFOS) at former NAS
South Weymouth, MA. Federal Remediation Technology Roundtable Fall.
Bardos, R. Paul, Brian D. Bone, Richard Boyle, Frank Evans, Nicola D. Harries, Trevor Howard, and Jonathan W. N. Smith.
2016. The rationale for simple approaches for sustainability assessment and management in
contaminated land practice. Science of The Total Environment 563-564:755-768. https://doi.org/10.1016/j.scitotenv.2015.12.001.
Barmentlo, S. H., J. M. Stel, M. van Doorn, C. Eschauzier, P. de Voogt, and M. H. Kraak. 2015. Acute and
chronic toxicity of short chained perfluoroalkyl substances to Daphnia magna. Environ Pollut 198:47-53.
10.1016/j.envpol.2014.12.025.
Barr. 2017. DRAFT Conceptual Modeling of PFOA Fate and Transport: North Bennington, VT. Minneapolis, MN.
https://anrweb.vt.gov/PubDocs/DEC/PFOA/Consent%20Order%20and%20Technical%20Documents/Core%2
0Technica l%20Documents/Conceptual%20Site%20Model/Saint-
Gobain%20VT%20Draft%20CSM%20June2017%20Main%20Report.pdf.
Bartell, S. M. 2017. Online Serum PFOA Calculator for Adults. Environ Health Perspect 125 (10):104502.
10.1289/ehp2820. 391

Bartell, S. M., A. M. Calafat, C. Lyu, K. Kato, P. B. Ryan, and K. Steenland. 2010. Rate of decline in serum
PFOA concentrations after granular activated carbon filtration at two public water systems in Ohio and West Virginia. Environ Health Perspect 118 (2):222-8. 10.1289/ehp.0901252.
Bartlett, Samuel A., and Katherine L. Davis. 2018. Evaluating PFAS cross contamination issues. Remediation
Journal 28 (2):53-57. 10.1002/rem.21549.
Barton, C. A., L. E. Butler, C. J. Zarzecki, J. Flaherty, and M. Kaiser. 2006. Characterizing perfluorooctanoate in ambient air near the fence line of a manufacturing facility: comparing modeled and monitored values.
Journal of the Air and Waste Management Association 56 (1):48-55. 10.1080/10473289.2006.10464429.
Barton, C. A., M. A. Kaiser, and M. H. Russell. 2007. Partitioning and removal of perfluorooctanoate during rain
events: the importance of physical-chemical properties. Journal of Environmental Monitoring 9 (8):839-46. https://doi.org/10.1039/b703510.
Barton, C. A., M. A. Kaiser, and M. H. Russell. 2010. A site-specific screening comparison of modeled and
monitored air dispersion and deposition for perfluorooctanoate. Journal of the Air and Waste Management
Association 60.
Barton, Catherine A., Miguel A. Botelho, and Mary A. Kaiser. 2008. Solid Vapor Pressure and Enthalpy of Sublimation for Perfluorooctanoic Acid. Journal of Chemical & Engineering Data 53 (4):939-941.
10.1021/je700593.
Barton, Catherine A., Miguel A. Botelho, and Mary A. Kaiser. 2009. Solid Vapor Pressure and Enthalpy of
Sublimation for Ammonium Perfluorooctanoate. Journal of Chemical & Engineering Data 54 (3):752-755.
10.1021/je800418.
Barzen-Hanson, K. A., S. E. Davis, M. Kieber, and J. A. Field. 2017. Sorption of Fluorotelomer Sulfonates,
Fluorotelomer Sulfonamido Betaines, and a Fluorotelomer 11065 Sulfonamido Amine in National Foam Aqueous Film-Forming Foam to Soil. Environmental Science and Technology 51.
Barzen-Hanson, Krista A., Simon C. Roberts, Sarah Choyke, Karl Oetjen, Alan McAlees, Nicole Riddell, Robert
McCrindle,
P. Lee Ferguson, Christopher P. Higgins, and Jennifer A. Field. 2017. Discovery of 40 Classes of Per- and Polyfluoroalkyl Substances in Historical Aqueous Film-Forming Foams (AFFFs) and AFFF-Impacted
Groundwater. Environmental Science & Technology 51 (4):2047-2057. 10.1021/acs.est.6b05843.
Battelle. 2018. Current State of the Science for Quantitative Methods to Collect Foam Samples from Water and
Solids.
Prepared for US EPA Office of Research and Development.
Baudequin, Clément, Estelle Couallier, Mohammed Rakib, Isabelle Deguerry, Romain Severac, and Martial
Pabon. 2011.
Purification of firefighting water containing a fluorinated surfactant by reverse osmosis coupled to electrocoagulation–filtration. Separation and Purification Technology 76 (3):275-282.
https://doi.org/10.1016/j.seppur.2010.10.016.
Beach, S. A., J. L. Newsted, K. Coady, and J. P. Giesy. 2006. Ecotoxicological evaluation of
perfluorooctanesulfonate (PFOS). Rev Environ Contam Toxicol 186:133-74.
Becker, Anna Maria, Silke Gerstmann, and Hartmut Frank. 2008. Perfluorooctane surfactants in waste waters,
the major source of river pollution. Chemosphere 72 (1):115-121.
https://doi.org/10.1016/j.chemosphere.2008.01.009.
392

Becker, Anna Maria, Silke Gerstmann, and Hartmut Frank. 2010. Perfluorooctanoic acid and perfluorooctane
sulfonate in two fish species collected from the Roter Main River, Bayreuth, Germany. Bulletin of Environmental Contamination and Toxicology 84 (1):132.
Becker, Joanna M., Tim Parkin, Cindy H. Nakatsu, Jayson D. Wilbur, and Allan Konopka. 2006. Bacterial
Activity, Community Structure, and Centimeter-Scale Spatial Heterogeneity in Contaminated Soil.
Microbial Ecology 51 (2):220-231. 10.1007/s00248-005-0002-9.
Beesoon, S., G. M. Webster, M. Shoeib, T. Harner, J. P. Benskin, and J. W. Martin. 2011. Isomer profiles of perfluorochemicals in matched maternal, cord, and house dust samples: manufacturing sources and
transplacental transfer. Environ Health Perspect 119 (11):1659-64. 10.1289/ehp.1003265.
Beesoon, S., S.J. Genuis, J.P. Benskin, and J.W. Martin. 2012. Exceptionally High Serum Concentrations of
Perfluorohexanesulfonate in a Canadian Family are Linked to Home Carpet Treatment Applications.
Environmental Science and Technology 46 (23):12960-12967. https://doi.org/10.1021/es3034654.
Begley, T. H., W. Hsu, G. Noonan, and G. Diachenko. 2008. Migration of fluorochemical paper additives from
food-contact paper into foods and food simulants. Food Additives & Contaminants: Part A 25 (3):384-390.
10.1080/02652030701513784.
Benotti, Mark J., Loretta A. Fernandez, Graham F. Peaslee, Gregory S. Douglas, Allen D. Uhler, and Stephen
Emsbo- Mattingly. 2020. A forensic approach for distinguishing PFAS materials. Environmental Forensics 21 (3-4):319-333. 10.1080/15275922.2020.1771631.
Benskin, J. P., D.C. Muir, B.F. Scott, C. Spencer, A. O. DeSilva, H. Kylin, J. W. Martin, A. Morris, R. Lohmann, G.
Tomy, B. Rosenberg, S. Taniyasu, and N. Yamashita. 2012. Perfluoroalkyl acids in the Atlantic and Canadian
Arctic Oceans. Environmental Science and Technology 46.
Benskin, J. P., L. Ahrens, D.C.G. Muir, B. F. Scott, C. Spencer, B. Rosenberg, G. Tomy, H. Kylin, Lohmann R., and
Martin. J.
W. 2011. Manufacturing Origin of Perfluorooctanoate (PFOA) in Atlantic and Canadian Arctic
Seawater. Environmental Science and Technology 46:677.
Benskin, J. P., V. Phillips, V.L. St. Louis and J.W. Martin. 2011. Source elucidation of perfluorinated carboxylic
acids in remote alpine lake sediment cores. Environ. Sci. Technol 45 (17):7188-7194. https://doi.org/10.1021/es2011176.
Benskin, J.P., A. O. DeSilva, and J. W. Martin. 2010. Isomer Profiling of Perfluorinated Substances as a Tool for
Source Tracking: A Review of Early Findings and Future Applications. Reviews of Environmental Contamination and Toxicology 208:111.
Benskin, Jonathan P., Belinda Li, Michael G. Ikonomou, John R. Grace, and Loretta Y. Li. 2012. Per- and
Polyfluoroalkyl Substances in Landfill Leachate: Patterns, Time Trends, and Sources. Environmental
Science & Technology 46 (21):11532-11540. https://doi.org/10.1021/es302471.
Bentel, Michael J., Yaochun Yu, Lihua Xu, Zhong Li, Bryan M. Wong, Yujie Men, and Jinyong Liu. 2019.
Defluorination of Per- and Polyfluoroalkyl Substances (PFASs) with Hydrated Electrons: Structural Dependence and Implications to PFAS Remediation and Management. Environmental Science &
Technology 53 (7):3718-3728.
10.1021/acs.est.8b06648.
Bečanová, Jitka, Lisa Melymuk, Šimon Vojta, Klára Komprdová, and Jana Klánová. 2016. Screening for
perfluoroalkyl acids in consumer products, building materials and wastes. Chemosphere 164:322-
329. https://doi.org/10.1016/j.chemosphere.2016.08.112.
393

Bhattarai, B., M. Manickavachagam, and R.P.S. Suri. 2014. Development of Regenerable Adsorbents for the
Removal of Emerging Contaminants from Water. NSF Water and Environmental Technology Center.
Bickerstaff, Karen. 2004. Risk perception research: socio-cultural perspectives on the public experience of air
pollution.
Environment International 30 (6):827-840. https://doi.org/10.1016/j.envint.2003.12.001.
Biegel, L. B., M. E. Hurtt, S. R. Frame, J. C. OConnor, and J. C. Cook. 2001. Mechanisms of extrahepatic tumor
induction by peroxisome proliferators in male CD rats. Toxicol Sci 60 (1):44-55. 10.1093/toxsci/60.1.44.
Bijland, S., P. C. Rensen, E. J. Pieterman, A. C. Maas, J. W. van der Hoorn, M. J. van Erk, L. M. Havekes, K.
Willems van Dijk, S. C. Chang, D. J. Ehresman, J. L. Butenhoff, and H. M. Princen. 2011. Perfluoroalkyl
sulfonates cause alkyl chain length-dependent hepatic steatosis and hypolipidemia mainly by impairing
lipoprotein production in APOE*3-Leiden CETP mice. Toxicol Sci 123 (1):290-303. 10.1093/toxsci/kfr142.
Birk, G. 2015. RemBind Remediation of PFAS. Tersus Environmental Webinar Series.
Birk, G., and D. Alden. 2017. Ex Situ Treatments of Aqueous Film-Forming Foam Impacted Water. Fourth
International Symposium on Bioremediation and Sustainable Environmental Technologies Abstract No.
Bischel, H. N., L. A. Macmanus-Spencer, C. Zhang, and R. G. Luthy. 2011. Strong associations of short-chain perfluoroalkyl acids with serum albumin and investigation of binding mechanisms.
Environ Toxicol Chem 30 (11):2423-30. https://doi.org/10.1002/etc.647.
Björklund, Justina Awasum, Kaj Thuresson, and Cynthia A. de Wit. 2009. Perfluoroalkyl Compounds (PFCs) in
Indoor Dust: Concentrations, Human Exposure Estimates, and Sources. Environmental Science & Technology 43 (7):2276-2281. 10.1021/es803201.
Blaine, A. C., C. D. Rich, L. S. Hundal, C. Lau, M. A. Mills, K. M. Harris, and C. P. Higgins. 2013. Uptake of
Perfluoroalkyl Acids into Edible Crops via Land Applied Biosolids : Field and Greenhouse Studies.
Environmental Science and Technology 47 (24):14062-14069. https://doi.org/10.1021/es403094.
Blaine, Andrea C., Courtney D. Rich, Erin M. Sedlacko, Katherine C. Hyland, Cecil Stushnoff, Eric R. V.
Dickenson, and Christopher P. Higgins. 2014. Perfluoroalkyl Acid Uptake in Lettuce (Lactuca sativa) and Strawberry (Fragaria ananassa) Irrigated with Reclaimed Water. Environmental Science & Technology 48
(24):14361-14368. https://doi.org/10.1021/es504150.
Blaine, Andrea C., Courtney D. Rich, Erin M. Sedlacko, Lakhwinder S. Hundal, Kuldip Kumar, Christopher Lau,
Marc A. Mills, Kimberly M. Harris, and Christopher P. Higgins. 2014. Perfluoroalkyl Acid Distribution in Various Plant Compartments of Edible Crops Grown in Biosolids-Amended soils. Environmental Science
& Technology 48 (14):7858-7865. https://doi.org/10.1021/es500016.
Blotevogel, J., R. J. Giraud, and T. Borch. 2018. Reductive defluorination of perfluorooctanoic acid by zero-valent iron and zinc : A DFT-based kinetic model. Chemical Engineering Journal 335.
Blum, A., S. A. Balan, M. Scheringer, X. Trier, G. Goldenman, I. T. Cousins, M. Diamond, T. Fletcher, C. Higgins, A. E. Lindeman, G. Peaslee, P. de Voogt, Z. Wang, and R. Weber. 2015. The Madrid statement on poly-
and perfluoroalkyl substances (PFASs). Environmental Health Perspectives 123 (5):A107 – A111.
http://dx.doi.org/10.1289/ehp.1509934.
Bodin, Ö., and C. Prell. 2011. Social networks and natural resource management: Uncovering the social
fabric of environmental governance. Cambridge, United Kingdom: Cambridge University Press. ISBN No. 978-
0521146234.
394

Bodin, Ö., S. Ramirez-Sanchez, H. Ernstson, and C. Prell. 2011. A social relational approach to natural
resource governance. In Social networks and natural resource management: Uncovering the social fabric of environmental governance, edited by Ö. Bodin and C. Prell, 3-28. Cambridge, United Kingdom:
Cambridge University Press. ISBN No. 978-0521146234.
Bogaerts, A., E. Neyts, R. Gijbels, and J. van der Mullen. 2002. Gas discharge plasmas and their applications. Spectrochimica Acta 57 (4):609-658. https://doi.org/10.1016/S0584-8547(01)00406-2.
Boiteux, V., X. Dauchy, C. Bach, A. Colin, J. Hemard, V. Sagres, and J. F. Munoz. 2017. Concentrations and
patterns of perfluoroalkyl and polyfluoroalkyl substances in a river and three drinking water treatment
plants near and far from a major production source. Science of the Total Environment 583:393-400. https://doi.org/10.1016/j.scitotenv.2017.01.079.
Boo, Chanhee, Yunkun Wang, Ines Zucker, Youngwoo Choo, Chinedum O. Osuji, and Menachem Elimelech.
2018. High Performance Nanofiltration Membrane for Effective Removal of Perfluoroalkyl Substances at
High Water Recovery. Environmental Science & Technology 52 (13):7279-7288. 10.1021/acs.est.8b01040.
Boodoo, F. 2018. Single-Use PFAS-Selective Resin + Incineration. Emerging Contaminants Summit Abstract No. Boodoo, F., J. Campos, and S. Kennedy. 2017. Removal of PFOA, PFOS and other PFAS substances
with ion exchange.
International Water Conferences Abstract No.
Bookstaff, R. C., R. W. Moore, G. B. Ingall, and R. E. Peterson. 1990. Androgenic deficiency in male rats
treated with perfluorodecanoic acid. Toxicol Appl Pharmacol 104 (2):322-33.
Bossi R., K. Vorkamp, and H. Skov. 2016. Concentrations of organochlorine pesticides, polybrominated
diphenyl ethers and perfluorinated compounds in the atmosphere of North Greenland. Environmental Pollution 217.
Bots, Jessica, Luc De Bruyn, Tom Snijkers, Bert Van den Branden, and Hans Van Gossum. 2010. Exposure to
perfluorooctane sulfonic acid (PFOS) adversely affects the life-cycle of the damselfly Enallagma cyathigerum. Environmental Pollution 158 (3):901-905. https://doi.org/10.1016/j.envpol.2009.09.016.
Botzen, W. J. W., J. C. J. H. Aerts, and J. C. J. M. Van Den Bergh. 2009. Dependence of flood risk
perceptions on socioeconomic and objective risk factors. Water Resources Research 45:W10440.
10.1029/2009WR007743.
Boudreau, T. M., P. K. Sibley, S. A. Mabury, D. G. C. Muir, and K. R. Solomon. 2003. Laboratory Evaluation of the Toxicity of Perfluorooctane Sulfonate (PFOS) on Selenastrum capricornutum, Chlorella vulgaris, Lemna
gibba, Daphnia magna, and Daphnia pulicaria. Archives of Environmental Contamination and Toxicology 44 (3):0307-0313.
10.1007/s00244-002-2102-6.
Boulanger, B., J. D. Vargo, J. L. Schnoor, and K. C. Hornbuckle. 2005. Evaluation of Perfluorooctane Surfactants in a Wastewater Treatment System and in a Commercial Surface Protection Product.
Environmental Science and Technology 39 (15):5524-5530. https://doi.org/10.1021/es050213.
Brandsma, Sicco H., Marla Smithwick, Keith Solomon, Jeff Small, Jacob de Boer, and Derek C. G. Muir. 2011.
Dietary exposure of rainbow trout to 8:2 and 10:2 fluorotelomer alcohols and perfluorooctanesulfonamide:
Uptake, transformation and elimination. Chemosphere 82 (2):253-258.
https://doi.org/10.1016/j.chemosphere.2010.09.050.
Brede, E., M. Wilhelm, T. Goen, J. Muller, K. Rauchfuss, M. Kraft, and J. Holzer. 2010. Two-year follow-
up biomonitoring pilot study of residents and controls PFC plasma levels after PFOA reduction in public water system in Arnsberg, Germany. Int J Hyg Environ Health 213 (3):217-23.
10.1016/j.ijheh.2010.03.007. 395

Brewer, J. 2017. Granular Activated Carbon : A Proven Solution for PFAS. Cleanup Conference Abstract No.
Briggs, K., and D. Staack,. 2015. Enhancement of bioremediation of soils contaminated with organic hydrocarbon using an electron beam. Third International Symposium on Bioremediation and Sustainable
Environmental Technologies, Miami, Florida., May 18-21.
Brignole, A.J., J.R. Porch, H.O. Krueger, and R.L. Van Hoven. 2003. PFOS: a toxicity test to determine the
effects of the test substance on seedling emergence of seven species of plants. Toxicity to Terrestrial
Plants. EPA Docket AR226-1369. . Easton, MD: Ltd. Wildlife International.
Brooke, D., A. Footitt, and T. A. Nwaogu. 2004. Environmental Risk Evaluation Report: Perfluorooctanesulphonate
(PFOS). Section 2 : General Information on Exposure. Wallingford, UK: Environment
Agency. http://www.environment-agency.gov.uk/.
Brown, Sophia R., R. Wesley Flynn, and Jason T. Hoverman. 2021. Perfluoroalkyl Substances Increase Susceptibility of Northern Leopard Frog Tadpoles to Trematode Infection. Environmental Toxicology and
Chemistry 40 (3):689-694. https://doi.org/10.1002/etc.4678.
Brusseau, Mark L. 2018. Assessing the potential contributions of additional retention processes to PFAS
retardation in the subsurface. Science of The Total Environment 613-614:176-185.
https://doi.org/10.1016/j.scitotenv.2017.09.065.
Brusseau, Mark L. 2019. The influence of molecular structure on the adsorption of PFAS to fluid-fluid interfaces:
Using QSPR to predict interfacial adsorption coefficients. Water Research 152:148-158.
https://doi.org/10.1016/j.watres.2018.12.057.
Brusseau, Mark L. 2020. Simulating PFAS transport influenced by rate-limited multi-process retention. Water
Research 168:115179. https://doi.org/10.1016/j.watres.2019.115179.
Brusseau, Mark L., Naima Khan, Yake Wang, Ni Yan, Sarah Van Glubt, and Kenneth C. Carroll. 2019. Nonideal
Transport and Extended Elution Tailing of PFOS in Soil. Environmental Science & Technology 53
(18):10654-10664. https://doi.org/10.1021/acs.est.9b02343.
Brusseau, Mark L., Ni Yan, Sarah Van Glubt, Yake Wang, Wei Chen, Ying Lyu, Barry Dungan, Kenneth C.
Carroll, and F. Omar Holguin. 2019. Comprehensive retention model for PFAS transport in subsurface
systems. Water Research 148:41-50. https://doi.org/10.1016/j.watres.2018.10.035.
Brusseau, Mark L., R. Hunter Anderson, and Bo Guo. 2020. PFAS concentrations in soils: Background levels
versus contaminated sites. Science of The Total Environment 740:140017. https://doi.org/10.1016/j.scitotenv.2020.140017.
Bruton, Thomas A., and David L. Sedlak. 2017. Treatment of Aqueous Film-Forming Foam by Heat-Activated Persulfate Under Conditions Representative of In Situ Chemical Oxidation. Environmental Science &
Technology 51 (23):13878-13885. 10.1021/acs.est.7b03969.
Bräunig, J., C. Baduel, and J. F. Mueller. 2016. Influence of a commercial adsorbent on the leaching behavior
and bioavailability of selected perfluoroalkyl acids (PFAAs) from soil impacted by AFFF. Brisbane, Australia:
National Research Center for Environmental Toxicology The University of Queensland.
Bräunig, Jennifer, Christine Baduel, Amy Heffernan, Anna Rotander, Eric Donaldson, and Jochen F. Mueller.
2017. Fate and redistribution of perfluoroalkyl acids through AFFF-impacted groundwater. Science of The
Total Environment 596-597:360-368. https://doi.org/10.1016/j.scitotenv.2017.04.095.
396

Buck, R.C. 2015. Toxicology Data for Alternative Short-Chain Fluorinated Substances. In Toxicological Effects of
Perfluoroalkyl and Polyfluoroalkyl Substances, edited by J.C. DeWitt. Humana Press, Cham. ISBN No.
978-3-319-15517-3.
Buck, Robert C., James Franklin, Urs Berger, Jason M. Conder, Ian T. Cousins, Pim de Voogt, Allan Astrup
Jensen, Kurunthachalam Kannan, Scott A. Mabury, and Stefan P. J. van Leeuwen. 2011. Perfluoroalkyl and polyfluoroalkyl substances in the environment: Terminology, classification, and origins. Integrated
Environmental Assessment and Management 7 (4):513-541. https://doi.org/10.1002/ieam.258.
Burdick, J., I. Ross, J. McDonough, J. Miles, and K. Nowack. 2016. Poly- and Perfluouroalkyl Substances (PFAS)
Treatment: State of the Practice and Mythbusting. Impacts from Fire Fighting Foams: Policy, Regulation,
Characterization and Treatment for PFCs Abstract No.
Burger, J., and M. Gochfeld. 1991. Fishing a superfund site: dissonance and risk perception of environmental
hazards by fishermen in Puerto Rico. Risk Analysis 11:269-722. https://doi.org/10.1111/j.1539-
6924.1991.tb00603.x.
Burkhard, Lawrence P., Jon A. Arnot, Michelle R. Embry, Kevin J. Farley, Robert A. Hoke, Masaru Kitano, Heather A. Leslie, Guilherme R. Lotufo, Thomas F. Parkerton, Keith G. Sappington, Gregg T. Tomy, and Kent B. Woodburn.
2012.
Comparing laboratory and field measured bioaccumulation endpoints. Integrated Environmental Assessment and Management 8 (1):17-31. https://doi.org/10.1002/ieam.260.
Burns, Darcy C., David A. Ellis, Hongxia Li, Colin J. McMurdo, and Eva Webster. 2008. Experimental pKa
Determination for Perfluorooctanoic Acid (PFOA) and the Potential Impact of pKa Concentration Dependence on Laboratory-Measured Partitioning Phenomena and Environmental Modeling. Environmental Science &
Technology 42 (24):9283-9288.
10.1021/es802047.
Bursian, Steven J., Jane E. Link, Michael McCarty, and Matt F. Simcik. 2021. The Subacute Toxicity of
Perfluorooctane Sulfonate and/or Perfluorooctanoic Acid and Legacy Aqueous Film-Forming Foams to
Japanese Quail (Coturnix japonica) Chicks. Environmental Toxicology and Chemistry 40:695-710.
https://doi.org/10.1002/etc.4684.
Busch, Jan, Lutz Ahrens, Renate Sturm, and Ralf Ebinghaus. 2010. Polyfluoroalkyl compounds in landfill
leachates.
Environmental Pollution 158 (5):1467-1471. https://doi.org/10.1016/j.envpol.2009.12.031.
Butenhoff, J. L., D. W. Gaylor, J. A. Moore, G. W. Olsen, J. Rodricks, J. H. Mandel, and L. R. Zobel. 2004.
Characterization of risk for general population exposure to perfluorooctanoate. Regul Toxicol Pharmacol 39 (3):363-80. https://doi.org/10.1016/j.yrtph.2004.03.003.
Butenhoff, J. L., G. L. Kennedy, Jr., P. M. Hinderliter, P. H. Lieder, R. Jung, K. J. Hansen, G. S. Gorman, P. E. Noker,
and P. J. Thomford. 2004. Pharmacokinetics of perfluorooctanoate in cynomolgus monkeys. Toxicol Sci 82 (2):394-406. https://doi.org/10.1093/toxsci/kfh302.
Butenhoff, J. L., G. L. Kennedy, Jr., S. C. Chang, and G. W. Olsen. 2012. Chronic dietary toxicity and
carcinogenicity study with ammonium perfluorooctanoate in Sprague-Dawley rats. Toxicology 298 (1-3):1-13.
https://doi.org/10.1016/j.tox.2012.04.001.
Butenhoff, J. L., G. L. Kennedy, Jr., S. R. Frame, J. C. OConnor, and R. G. York. 2004. The reproductive
toxicology of ammonium perfluorooctanoate (APFO) in the rat. Toxicology 196 (1-2):95-116.
https://doi.org/10.1016/j.tox.2003.11.005.
397

Butenhoff, J. L., J. A. Bjork, S. C. Chang, D. J. Ehresman, G. A. Parker, K. Das, C. Lau, P. H. Lieder, F. M. van
Otterdijk, and
K. B. Wallace. 2012. Toxicological evaluation of ammonium perfluorobutyrate in rats: twenty-eight-day and ninety- day oral gavage studies. Reprod Toxicol 33 (4):513-530.
https://doi.org/10.1016/j.reprotox.2011.08.004.
Butenhoff, J. L., S. C. Chang, D. J. Ehresman, and R. G. York. 2009. Evaluation of potential reproductive and developmental toxicity of potassium perfluorohexanesulfonate in Sprague
Dawley rats. Reprod Toxicol 27 (3-4):331-341. https://doi.org/10.1016/j.reprotox.2009.01.004.
Butenhoff, J. L., S. C. Chang, G. W. Olsen, and P. J. Thomford. 2012. Chronic dietary toxicity and
carcinogenicity study with potassium perfluorooctanesulfonate in Sprague Dawley rats. Toxicology 293 (1-
3):1-15. https://doi.org/10.1016/j.tox.2012.01.003.
Butenhoff, J., and S. Chang. 2007. ADME Study of Perfluorooctane Sulfonate in Rats, (cited in EPA, 2016d). ST-
179 Final Report. St. Paul, MN: 3M Center 3M Strategic Toxicology Laboratory.
Butenhoff, J., G. Costa, C. Elcombe, D. Farrar, K. Hansen, H. Iwai, R. Jung, G. Kennedy, Jr., P. Lieder, G. Olsen,
and P. Thomford. 2002. Toxicity of ammonium perfluorooctanoate in male cynomolgus monkeys after oral
dosing for 6 months. Toxicol Sci 69 (1):244-57. https://doi.org/10.1093/toxsci/69.1.244.
Butt, Craig M., Derek C. G. Muir, and Scott A. Mabury. 2014. Biotransformation pathways of fluorotelomer-based
polyfluoroalkyl substances: A review. Environmental Toxicology and Chemistry 33 (2):243-267.
10.1002/etc.2407.
Butt, Craig M., Derek C.G. Muir, and Scott A. Mabury. 2010. Elucidating the Pathways of Poly- and Perfluorinated Acid Formation in Rainbow Trout. Environmental Science & Technology 44 (13):4973-80.
https://doi.org/10.1021/es100702.
Butt, Craig M., Scott A. Mabury, Michael Kwan, Xiaowa Wang, and Derek C. G. Muir. 2008. Spatial trends of
perfluoroalkyl compounds in ringed seals (Phoca hispida) from the Canadian Arctic. Environmental
Toxicology and Chemistry 27 (3):542-553. 10.1897/07-428.1.
Butt, Craig M., Urs Berger, Rossana Bossi, and Gregg T. Tomy. 2010. Levels and trends of poly- and
perfluorinated compounds in the arctic environment. Science of The Total Environment 408 (15):2936-2965. https://doi.org/10.1016/j.scitotenv.2010.03.015.
Buxton, G. V., C.L. Greenstock, W. P. W. P. Helman, and A. B. Ross. 1988. Critical review of rate constants for
reactions of hydrated electrons, hydrogen atoms and hydroxyl radicals in aqueous solution. Journal of
Physical and Chemical Reference Data 17:513.
C8 Science Panel. 2011. Probable Link Evaluation of Pregnancy Induced Hypertension and Preeclampsia.
http://www.c8sciencepanel.org/pdfs/Probable_Link_C8_PIH_5Dec2011.pdf
C8 Science Panel. 2012. Probable Link Evaluation for heart disease (including high blood pressure, high
cholesterol, coronary artery disease). http://www.c8sciencepanel.org/pdfs/Probable_Link_C8_Heart_Disease_29Oct2012.pdf
C8 Science Panel. 2012. Probable Link Evaluation of Autoimmune Disease.
http://www.c8sciencepanel.org/pdfs/Probable_Link_C8_Autoimmune_Disease_30Jul2012.pdf
C8 Science Panel. 2012. Probable Link Evaluation of Cancer.
http://www.c8sciencepanel.org/pdfs/Probable_Link_C8_Cancer_16April2012_v2.pdf.
C8 Science Panel. 2012. Probable Link Evaluation of Thyroid disease.
http://www.c8sciencepanel.org/pdfs/Probable_Link_C8_Thyroid_30Jul2012.pdf
398

C8 Science Panel. 2017. C8 Probable Links Reports. http://www.c8sciencepanel.org/prob_link.html.
C8 Science Panel. 2020. C8 Science Panel website. Last Modified 1/22/2020.
http://www.c8sciencepanel.org/index.html.
CA DTSC. 2019. Product – Chemical Profile for Treatments Containing Perfluoroalkyl or Polyfluoroalkyl
Substances for Use on Converted Textiles or Leathers. Discussion Draft.
https://dtsc.ca.gov/wp-content/uploads/sites/31/2019/11/Product-Chemical-Profile-for-Treatments-with-PFASs.pdf.
CA DTSC. 2019. Work Plan Implementation: Food Packaging with Perfluoroalkyl and Polyfluoroalkyl Substances
(PFASs). https://dtsc.ca.gov/wp-content/uploads/sites/31/2019/10/Food-Packaging_Perfluoroalkyl-and-
Polyfluoroalkyl-Substanc es-PFASs.pdf.
CA OEHHA. 2011. Biomonitoring California. Results for Perfluorochemicals (PFCs).
https://biomonitoring.ca.gov/results/chemical/154%2011.
CA OEHHA. 2012. California Teachers Study (CTS) and Firefighters Occupational 11227 Exposures (FOX) Project. Biomonitoring California.
CA OEHHA. 2013. California Teachers Study (CTS) Results – Perfluorochemicals (PFCs). Biomonitoring
California. CA OEHHA. 2016. Notice of Intent to List Perfluorooctanoic Acid (PFOA) and Perfluorooctane
Sulfonate (PFOS).. CA OEHHA. 2018. Chemicals Listed Effective November 10, 2017 as Known to the
State of California to Cause
Reproductive Toxicity: Perfluorooctanoic Acid (PFOA) and Perfluorooctane Sulfonate (PFOS). .
CA RWQCB. 2016. Water Quality Control Plan for the Sacramento and San Joaquin River Basins. Central Valley
Region.
CA Water Boards. 2019. Water Boards PFAS Phased Investigation Approach.
https://www.waterboards.ca.gov/pfas/docs/7_investigation_plan.pdf.
CA Water Boards. 2020. Per- and Polyfluoroalkyl Substances (PFAS). Last Modified 1/24/20. accessed 2020.
https://www.waterboards.ca.gov/pfas/.
Cai, Minghong, Haizhen Yang, Zhiyong Xie, Zhen Zhao, Feng Wang, Zhibo Lu, Renate Sturm, and Ralf
Ebinghaus. 2012. Per- and polyfluoroalkyl substances in snow, lake, surface runoff water and coastal
seawater in Fildes Peninsula, King George Island, Antarctica. Journal of Hazardous Materials 209-210:335-342. https://doi.org/10.1016/j.jhazmat.2012.01.030.
Cai, Minghong, Zhen Zhao, Zhigao Yin, Lutz Ahrens, Peng Huang, Minggang Cai, Haizhen Yang, Jianfeng He,
Renate Sturm, Ralf Ebinghaus, and Zhiyong Xie. 2012. Occurrence of Perfluoroalkyl Compounds in Surface
Waters from the North Pacific to the Arctic Ocean. Environmental Science & Technology 46 (2):661-668. https://doi.org/10.1021/es2026278.
Cai, Minghong, Zhiyong Xie, Axel Möller, Zhigao Yin, Peng Huang, Minggang Cai, Haizhen Yang, Renate Sturm,
Jianfeng He, and Ralf Ebinghaus. 2012. Polyfluorinated compounds in the atmosphere along a cruise pathway from the Japan Sea to the Arctic Ocean. Chemosphere 87 (9):989-997.
https://doi.org/10.1016/j.chemosphere.2011.11.010.
CalEPA. 2018. Product – Chemical Profile for Perfluoroalkyl and Polyfluroalkyl Substances (PFASs) in Carpets and
Rugs February 2018 Discussion Draft.
Calgon Corporation. 2017. Treatment of Perfluorinated Compounds with Granular Activated Carbon. Eric
Forrester of Calgon to the US Army Corps of Engineers.
399

Campbell, Tammy, and Michael R. Hoffmann. 2015. Sonochemical degradation of perfluorinated surfactants:
Power and multiple frequency effects. Separation and Purification Technology 156:1019-1027.
https://doi.org/10.1016/j.seppur.2015.09.053.
Campos Pereira, Hugo, Malin Ullberg, Dan Berggren Kleja, Jon Petter Gustafsson, and Lutz Ahrens. 2018.
Sorption of perfluoroalkyl substances (PFASs) to an organic soil horizon – Effect of cation composition
and pH. Chemosphere 207:183-191. https://doi.org/10.1016/j.chemosphere.2018.05.012.
Cao, M. H., B. B. Wang, H. S. Yu, L. L. Wang, S. H. Yuan, and J. Chen. 2010. Photochemical decomposition of
perfluorooctanoic acid in aqueous periodate with VUV and UV light irradiation. Journal of Hazardous
Materials 179 (1):1143-1146. https://doi.org/10.1016/j.jhazmat.2010.02.030.
Cappuyns, Valérie, and Bram Kessen. 2013. Combining life cycle analysis, human health and financial risk
assessment for the evaluation of contaminated site remediation. Journal of Environmental Planning and Management 57 (7):1101-1121. https://doi.org/10.1080/09640568.2013.783460.
Carey, G.R., P.J. Van Geel, J.R. Murphy, E.A. McBean, and F.A. Rovers. 1999. Modeling natural
attenuation at the Plattsburgh Air Force Base. In Natural attenuation of chlorinated solvents, petroleum
hydrocarbons, and other organic compounds, edited by B. C. Alleman and A. Leeson, 77-82.
Columbus, OH: Battelle Press. ISBN No. 978-1574770742.
Carey, Grant R., Paul J. Van Geel, Todd H. Wiedemeier, and Edward A. McBean. 2003. A Modified Radial
Diagram Approach for Evaluating Natural Attenuation Trends for Chlorinated Solvents and Inorganic Redox Indicators. Groundwater Monitoring & Remediation 23 (4):75-84. 10.1111/j.1745-
6592.2003.tb00697.x.
Carey, Grant R., Rick McGregor, Anh Le-Tuan Pham, Brent Sleep, and Seyfollah Gilak Hakimabadi. 2019.
Evaluating the longevity of a PFAS in situ colloidal activated carbon remedy. Remediation Journal 29 (2):17-31. https://doi.org/10.1002/rem.21593.
Carmosini, N., and L. S. Lee. 2008. Partitioning of Fluorotelomer Alcohols to Octanol and Different Sources of
Dissolved Organic Carbon. Environmental Science & Technology 42 (17):6559-6565. 10.1021/es800263.
Carter, Kimberly E., and James Farrell. 2008. Oxidative Destruction of Perfluorooctane Sulfonate Using
Boron-Doped Diamond Film Electrodes. Environmental Science & Technology 42 (16):6111-6115. 10.1021/es703273.
Carter, Kimberly E., and James Farrell. 2009. Electrochemical Oxidation of Trichloroethylene Using Boron-Doped Diamond Film Electrodes. Environmental Science & Technology 43 (21):8350-8354.
10.1021/es9017738.
Case, M.T., R.G. York, and M.S. Christian. 2001. Rat and rabbit oral developmental toxicology studies with two perfluorinated compounds. Int J Toxicol 20 (2):101-9.
Cassone, C. G., V. Vongphachan, S. Chiu, K. L. Williams, R. J. Letcher, E. Pelletier, D. Crump, and S. W.
Kennedy. 2012. In ovo effects of perfluorohexane sulfonate and perfluorohexanoate on pipping success,
development, mRNA expression, and thyroid hormone levels in chicken embryos. Toxicol Sci 127 (1):216-
24. 10.1093/toxsci/kfs072.
Caverly Rae, J. M., Lisa Craig, Theodore W. Slone, Steven R. Frame, L. William Buxton, and Gerald L. Kennedy.
2015. Evaluation of chronic toxicity and carcinogenicity of ammonium 2,3,3,3-tetrafluoro-2-(heptafluoropropoxy)-
propanoate in Sprague–Dawley rats. Toxicology Reports 2:939-949.
https://doi.org/10.1016/j.toxrep.2015.06.001.
400

Cañizares, P., C. Sáez, J. Lobato, and M. A. Rodrigo. 2004. Electrochemical Oxidation of Polyhydroxybenzenes on
Boron- Doped Diamond Anodes. Industrial & Engineering Chemistry Research 43 (21):6629-6637. 10.1021/ie049807.
CCME. 2018. Canadian Soil and Groundwater Quality Guidelines for the Protection of Environmental and
Human Health, Perfluorooctane Sulfonate (PFOS) – Draft for Review. Canadian Council of Ministers of hte Environment. https://www.watercanada.net/soil-and-groundwater-quality-guidelines-available-for-public-
comment/.
CDC. 2016. National Health and Nutrition Examination Survey. 2013-2014 Data Documentation, Codebook and
Frequencies. accessed 2020. https://wwwn.cdc.gov/Nchs/Nhanes/2013-2014/SSPFAS_H.htm.
CDC. 2017. Fourth National Report on Human Exposure to Environmental Chemicals, Updated Tables,
Volume 1.. CDC. 2017. National Biomonitoring Program Biomonitoring Summary Perfluorochemicals.
CDC. 2018. Fourth National Report on Human Exposure to Environmental Chemicals, Updated Tables, March 2018, Volume 1. U.S. Department of Health and Human Services. Centers for Disease Control and
Prevention. https://www.cdc.gov/exposurereport/pdf/FourthReport_UpdatedTables_Volume1_Mar2018.pdf.
CDC. 2018. Introduction to Public Health. Last Modified November 15, 2018.
accessed 2020. https://www.cdc.gov/publichealth101/public-health.html.
CDC. 2019. Fourth National Report on Human Exposure to Environmental Chemicals Updated Tables,
January 2019, Volume One U.S. Department of Health and Human Services. Centers for Disease Control and Prevention.
https://www.cdc.gov/exposurereport/pdf/FourthReport_UpdatedTables_Volume1_Jan2019-508.pdf.
CEH. 2018. Fact Sheet, Fluorinated Additives, Disposable Food Containers, and Contaminated Food: State of
the Evidence.
CEPA. 2006. Environmental Performance Agreement (Agreement) Respecting Perfluorinated Carboxylic Acids (PFCAs) and their Precursors in Perfluorochemical Products Sold in Canada Environment and Climate
Change Canada. Environment and Climate Change Canada.
CEPA. 2017. Canadian Environmental Protection Act, 1999. Federal Environmental Quality Guidelines:
Perfluorooctane Sulfonate (PFOS). Environment and Climate Change Canada.
CEPA. 2018. Toxic Substances list: PFOS. Environment and Climate Change Canada.
CH2M. 2017. PFAS Flocculation/Membrane Filtration Testing Results. Technical 11279 Memorandum prepared for
Environment Canada.
Chandramouli, Bharat, Jonathan P. Benskin, M. Coreen Hamilton, and John R. Cosgrove. 2015. Sorption of per-
and polyfluoroalkyl substances (PFASs) on filter media: Implications for phase partitioning studies.
Environmental Toxicology and Chemistry 34 (1):30-36. 10.1002/etc.2751.
Chang, E. T., H. O. Adami, P. Boffetta, H. J. Wedner, and J. S. Mandel. 2016. A critical review of
perfluorooctanoate and perfluorooctanesulfonate exposure and immunological health conditions in humans. Crit Rev Toxicol 46 (4):279-331. 10.3109/10408444.2015.1122573.
Chang, E. T., H. O. Adami, P. Boffetta, P. Cole, T. B. Starr, and J. S. Mandel. 2014. A critical review of
perfluorooctanoate and perfluorooctanesulfonate exposure and cancer risk in humans. Crit Rev Toxicol 44 Suppl 1:1-81. 10.3109/10408444.2014.905767.
Chang, S. C., J. R. Thibodeaux, M. L. Eastvold, D. J. Ehresman, J. A. Bjork, J. W. Froehlich, C. Lau, R. J. Singh, K. B.
Wallace, and J. L. Butenhoff. 2008. Thyroid hormone status and pituitary function in adult rats given oral doses of
perfluorooctanesulfonate (PFOS). Toxicology 243 (3):330-9. 10.1016/j.tox.2007.10.014. 401

Chang, S. C., K. Das, D. J. Ehresman, M. E. Ellefson, G. S. Gorman, J. A. Hart, P. E. Noker, Y. M. Tan, P. H. Lieder, C.
Lau, G.
W. Olsen, and J. L. Butenhoff. 2008. Comparative pharmacokinetics of perfluorobutyrate in rats, mice,
monkeys, and humans and relevance to human exposure via drinking water. Toxicol Sci 104 (1):40-53.
10.1093/toxsci/kfn057.
Chang, S. C., P. E. Noker, G. S. Gorman, S. J. Gibson, J. A. Hart, D. J. Ehresman, and J. L. Butenhoff. 2012. Comparative pharmacokinetics of perfluorooctanesulfonate (PFOS) in rats, mice, and monkeys. Reprod
Toxicol 33 (4):428-440. 10.1016/j.reprotox.2011.07.002.
Chang, S., J. L. Butenhoff, G. A. Parker, P. S. Coder, J. D. Zitzow, R. M. Krisko, J. A. Bjork, K. B. Wallace, and J. G.
Seed.
2018. Reproductive and developmental toxicity of potassium perfluorohexanesulfonate in CD-1 mice. Reprod Toxicol 78:150-168. 10.1016/j.reprotox.2018.04.007.
Chapman, S. W., and B. L. Parker. 2005. Plume persistence due to aquitard back diffusion following dense
nonaqueous phase liquid source removal or isolation. Water Resources Research 41:W12411. https://doi.org/10.1029/2005WR004224.
Chappells, Heather, Louise Parker, Conrad Fernandez, Cathy Conrad, John Drage, Gary OToole, Norma
Campbell, and Trevor J.B. Dummer. 2014. Arsenic in private drinking water wells: An assessment of jurisdictional regulations and guidelines for risk remediation in North America. Journal of Water & Health
12:372-392. 10.2166/wh.2014.054.
Chemours. 2017. History of Teflon.
Chen, H., M. Reinhard, V. T. Nguyen, and K. Y.-H. Gin. 2016. Reversible and irreversible sorption of perfluorinated
compounds (PFCs) by sediments of an urban reservoir. Chemosphere 144:1747-1753. https://doi.org/10.1016/j.chemosphere.2015.10.055.
Chen, Hong, Shuo Chen, Xie Quan, Yazhi Zhao, and Huimin Zhao. 2009. Sorption of perfluorooctane sulfonate
(PFOS) on oil and oil-derived black carbon: Influence of solution pH and [Ca2+]. Chemosphere 77
(10):1406-1411. https://doi.org/10.1016/j.chemosphere.2009.09.008.
Chen, Huiting, Martin Reinhard, Tingru Yin, Tung Viet Nguyen, Ngoc Han Tran, and Karina Yew-Hoong Gin. 2019.
Multi- compartment distribution of perfluoroalkyl and polyfluoroalkyl substances (PFASs) in an urban catchment system. Water Research 154:227-237. https://doi.org/10.1016/j.watres.2019.02.009.
Chen, J., and P. Zhang. 2006. Photodegradation of perfluorooctanoic acid in water under irradiation of 254
nm and 185 nm light by use of persulfate. Water Science & Technology 54 (11-12):317-325.
https://doi.org/10.2166/wst.2006.731.
Chen, J., P. Y. Zhang, and J. Liu. 2006. Photodegradation of perfluorooctanoic acid by 185 nm vacuum ultraviolet
light. Journal of Environmental Sciences (China) 19.
Chen, Jing, Peng-yi Zhang, and Jian Liu. 2007. Photodegradation of perfluorooctanoic acid by 185 nm vacuum
ultraviolet light. Journal of Environmental Sciences 19 (4):387-390. https://doi.org/10.1016/S1001-0742(07)60064-3.
Chen, Li D., Chun-Ze Lai, Laura P. Granda, Melissa A. Fierke, Debaprasad Mandal, Andreas Stein, John A. Gladysz, and Philippe Bühlmann. 2013. Fluorous Membrane Ion-Selective Electrodes for Perfluorinated
Surfactants: Trace-Level Detection and in Situ Monitoring of Adsorption. Analytical Chemistry 85
(15):7471-7477. 10.1021/ac401424.
402

Chen, Shu, Xing-Chun Jiao, Nan Gai, Xiao-Jie Li, Xiao-Chun Wang, Guo-Hui Lu, Hai-Tao Piao, Zhu Rao, and
Yong-Liang Yang. 2016. Perfluorinated compounds in soil, surface water, and groundwater from rural areas in eastern China. Environmental Pollution 211:124-131. https://doi.org/10.1016/j.envpol.2015.12.024.
Chen, Tian, Ling Zhang, Jun-qiu Yue, Zi-quan Lv, Wei Xia, Yan-jian Wan, Yuan-yuan Li, and Shun-qing Xu. 2012.
Prenatal PFOS exposure induces oxidative stress and apoptosis in the lung of rat off-spring. Reproductive
Toxicology 33 (4):538-545. https://doi.org/10.1016/j.reprotox.2011.03.003.
Chen, Xi, Xinghui Xia, Xilong Wang, Jinping Qiao, and Huiting Chen. 2011. A comparative study on
sorption of perfluorooctane sulfonate (PFOS) by chars, ash and carbon nanotubes. Chemosphere
83 (10):1313-1319. https://doi.org/10.1016/j.chemosphere.2011.04.018.
Chen, Ying-Chin, Shang-Lien Lo, and Yu-Chi Lee. 2012. Distribution and fate of perfluorinated compounds
(PFCs) in a pilot constructed wetland. Desalination and Water Treatment 37 (1-3):178-184. https://doi.org/10.1080/19443994.2012.661270.
Cheng, Jian-hua, Xiao-yan Liang, She-wei Yang, and Yong-you Hu. 2014. Photochemical defluorination of
aqueous perfluorooctanoic acid (PFOA) by VUV/Fe3+ system. Chemical Engineering Journal 239:242-249.
https://doi.org/10.1016/j.cej.2013.11.023.
Cheng, Jie, Chad D. Vecitis, Hyunwoong Park, Brian T. Mader, and Michael R. Hoffmann. 2008. Sonochemical
Degradation of Perfluorooctane Sulfonate (PFOS) and Perfluorooctanoate (PFOA) in Landfill Groundwater:
Environmental Matrix Effects. Environmental Science & Technology 42 (21):8057-8063. 10.1021/es8013858.
Cheng, Jie, Chad D. Vecitis, Hyunwoong Park, Brian T. Mader, and Michael R. Hoffmann. 2010. Sonochemical
Degradation of Perfluorooctane Sulfonate (PFOS) and Perfluorooctanoate (PFOA) in Groundwater: Kinetic
Effects of Matrix Inorganics. Environmental Science & Technology 44 (1):445-450. 10.1021/es902651.
Cheng, Weixiao, and Carla A. Ng. 2019. Using Machine Learning to Classify Bioactivity for 3486 Per- and
Polyfluoroalkyl Substances (PFASs) from the OECD List. Environmental Science & Technology 53
(23):13970-13980. https://doi.org/10.1021/acs.est.9b04833.
Cheng, Yu H., Dushyant Barpaga, Jennifer A. Soltis, V. Shutthanandan, Roli Kargupta, Kee Sung Han, B. Peter
McGrail, Radha Kishan Motkuri, Sagnik Basuray, and Sayandev Chatterjee. 2020. Metal–Organic
Framework-Based Microfluidic Impedance Sensor Platform for Ultrasensitive Detection of Perfluorooctanesulfonate. ACS Applied Materials & Interfaces 12 (9):10503-10514.
10.1021/acsami.9b22445.
Chengelis, C. P., J. B. Kirkpatrick, A. Radovsky, and M. Shinohara. 2009. A 90-day repeated dose oral (gavage) toxicity study of perfluorohexanoic acid (PFHxA) in rats (with functional observational battery
and motor activity determinations). Reprod Toxicol 27 (3-4):342-351. 10.1016/j.reprotox.2009.01.006.
Chengelis, C. P., J. B. Kirkpatrick, N. R. Myers, M. Shinohara, P. L. Stetson, and D. W. Sved. 2009. Comparison of
the toxicokinetic behavior of perfluorohexanoic acid (PFHxA) and nonafluorobutane-1-sulfonic acid (PFBS) in cynomolgus monkeys and rats. Reprod Toxicol 27 (3-4):400-406. 10.1016/j.reprotox.2009.01.013.
Chiang, D., R. Stewart, G. Birk, Q. Huang, J. Field, and Bodour A. 2017. Ability of Aluminum-Based Adsorbent to
Remove PFAS from Groundwater. Battelle Conference, Palm Springs, CA Abstract No.
Chiang, D., S. Laing, R. Casson, R. Mora, and Q. Huang. 2018. Applications of Electrochemical Oxidation for PFAS Destruction in Water, Liquid and Solid Wastes. Battelle Conference, Palm Springs, CA.
Choe, Jong Kwon, Allison M. Bergquist, Sangjo Jeong, Jeremy S. Guest, Charles J. Werth, and Timothy J. Strathmann.
2015. Performance and life cycle environmental benefits of recycling spent ion exchange brines by
catalytic treatment of nitrate. Water Research 80:267-280. https://doi.org/10.1016/j.watres.2015.05.007.
403

Choe, Jong Kwon, Michelle H. Mehnert, Jeremy S. Guest, Timothy J. Strathmann, and Charles J. Werth. 2013.
Comparative Assessment of the Environmental Sustainability of Existing and Emerging Perchlorate Treatment Technologies for Drinking Water. Environmental Science & Technology 47 (9):4644-4652.
10.1021/es3042862.
Choi, Dae-Geun, Jun-Ho Jeong, Young-suk Sim, Eung-sug Lee, Woo Soo Kim, and Byeong-Soo Bae. 2005.
Fluorinated Organic−Inorganic Hybrid Mold as a New Stamp for Nanoimprint and Soft Lithography. Langmuir : the ACS journal of surfaces and colloids 21 (21):9390-9392. https://doi.org/10.1021/la0513205.
Chowdhury, Pankaj, and T. Viraraghavan. 2009. Sonochemical degradation of chlorinated organic compounds, phenolic compounds and organic dyes – A review. Science of The Total Environment 407 (8):2474-2492.
https://doi.org/10.1016/j.scitotenv.2008.12.031.
Clara, M., S. Scharf, S. Weiss, O. Gans, and C. Scheffknecht. 2008. Emissions of perfluorinated alkylated
substances (PFAS) from point sources – Identification of relevant branches. Water Science & Technology 58 (1):59-66. https://doi.org/10.2166/wst.2008.641.
Cleland, Marshall R. 2011. Electron Bean Materials Irradiators. In Industrial Accelerators and Their Applications,
edited by
R.W. Hamm and M.E. Hamm, 87-137. World Scientific. ISBN No. 978-981-4307-04-8.
Code of Federal Regulations 14. 2012. Certification of Airports, Section 317 Aircraft rescue and firefighting:
Equipment and agents. https://www.gpo.gov/fdsys/pkg/CFR-10821 2012-title14-vol3/xml/CFR-2012-title14-
vol3-part139.xml
Code of Federal Regulations 40. 2008. Criteria for Municipal Solid Waste Landfills, Section 258.40 Design criteria. https://www.gpo.gov/fdsys/pkg/CFR-2008-title40-10824 vol24/xml/CFR-2008-title40-
vol24-sec258-40.xml.
Codling, Garry, Crispin Halsall, Lutz Ahrens, Sabino Del Vento, Karin Wiberg, Magnus Bergknut, Hjalmar Laudon,
and Ralf Ebinghaus. 2014. The fate of per- and polyfluoroalkyl substances within a melting snowpack of a boreal forest.
Environmental Pollution 191:190-198. https://doi.org/10.1016/j.envpol.2014.04.032.
Codling, Garry, Neil C. Sturchio, Karl Rockne, An Li, H. Peng, Timothy Tse, Paul Jones, and John P. Giesy.
2018. Spatial and temporal trends in poly- and per-fluorinated compounds in the Laurentian Great Lakes Erie, Ontario and St. Clair. Environmental Pollution 237:396-405.
https://doi.org/10.1016/j.envpol.2018.02.013.
Colgan, G., R. Richter, R. Grace, T. Fitzpatrick, R. Darlington, B. DiGuiseppi, L. Cook, and K. Rabe. 2018.
Thermal Treatment of Per- and Polyfluoroalkyl Substances (PFAS) in Soil. Battelle Chlorinated Conference, Palm Springs, California.
CONCAWE. 2016. Environmental Fate and Effects of Poly- and Perfluoroalkyl Substances (PFAS). Auderghem,
Belgium. https://www.concawe.eu/publication/environmental-fate-and-effects-of-poly-and-perfluoroalkyl-
substances-pfas-repo rt-no-816/.
Conder, J., J. Arblaster, E. Larson, J. Brown, and C. Higgins. 2020. Guidance for Assessing the Ecological Risks of
PFAS to Threatened and Endangered Species at Aqueous Film Forming Foam-Impacted Sites. SERDP Project
ER 18-1614. Alexandria, VA: Strategic Environmental Research and Development Program.
https://www.serdp-estcp.org/Program-Areas/Environmental-Restoration/ER18-1614/(language)/eng-US.
Conder, Jason M., Robert A. Hoke, Watze de Wolf, Mark H. Russell, and Robert C. Buck. 2008. Are PFCAs
Bioaccumulative? A Critical Review and Comparison with Regulatory Criteria and Persistent Lipophilic Compounds. Environmental Science & Technology 42 (4):995-1003. 10.1021/es070895.
404

Conley Justin, M., S. Lambright Christy, Nicola Evans, J. Strynar Mark, James McCord, S. McIntyre Barry, S.
Travlos Gregory, C. Cardon Mary, Elizabeth Medlock-Kakaley, C. Hartig Phillip, S. Wilson Vickie, and L. Earl
Gray. 2019. Adverse Maternal, Fetal, and Postnatal Effects of Hexafluoropropylene Oxide Dimer Acid
(GenX) from Oral Gestational Exposure in Sprague-Dawley Rats. Environmental Health Perspectives 127
(3):037008.
10.1289/EHP4372.
Conte, L., L. Falletti, A. Zaggia, and M. Milan. 2015. Polyfluorinated Organic Micropollutants Removal from Water
by Ion Exchange and Adsorption. Chemical Engineering Transactions 43:2257-2262.
https://doi.org/10.3303/CET1543377.
Coperchini, F., O. Awwad, M. Rotondi, F. Santini, M. Imbriani, and L. Chiovato. 2017. Thyroid disruption by
perfluorooctane sulfonate (PFOS) and perfluorooctanoate (PFOA). J Endocrinol Invest 40 (2):105-121.
10.1007/s40618-016-0572-z.
Corton, J. C., S. P. Anderson, and A. Stauber. 2000. Central role of peroxisome proliferator-activated receptors
in the actions of peroxisome proliferators. Annu Rev Pharmacol Toxicol 40:491-518.
10.1146/annurev.pharmtox.40.1.491.
Costanza, Jed, Masoud Arshadi, Linda M. Abriola, and Kurt D. Pennell. 2019. Accumulation of PFOA and PFOS at the Air–Water Interface. Environmental Science & Technology Letters 6 (8):487-491.
https://doi.org/10.1021/acs.estlett.9b00355.
Council of Australian Governments. 2018. Intergovernmental Agreement on a National Framework for Responding to PFAS Contamination, Appendix C: PFAS Information sharing, Communication, and
Engagement Guidelines.
Cousins, Ian T., Jamie C. DeWitt, Juliane Glüge, Gretta Goldenman, Dorte Herzke, Rainer Lohmann, Mark
Miller, Carla A. Ng, Martin Scheringer, Lena Vierke, and Zhanyun Wang. 2020. Strategies for grouping per-
and polyfluoroalkyl substances (PFAS) to protect human and environmental health. Environmental Science: Processes & Impacts 22 (7):1444-1460. https://doi.org/10.1039/D0EM00147C.
Covello, V.T. Message Mapping. Center for Risk Communication.
https://www.orau.gov/cdcynergy/erc/content/activeinformation/resources/Covello_message_mapping.pdf.
Covello, V.T., and F. Allen. 1988. Seven Cardinal Rules of Risk Communication. Washington, D.C.: US
Environmental Protection Agency Office of Policy Analysis.
Covello, V.T., S. K. Minamyer, and K. Clayton. 2007. Effective Risk and Crisis Communication During Water Security Emergencies: Report of EPA Sponsored Message Mapping Workshops. EPA/600/R-07/027. Washington, D.C.:
U.S. Environmental Protection Agency.
Covello, Vincent T., Richard G. Peters, Joseph G. Wojtecki, and Richard C. Hyde. 2001. Risk communication, the
West Nile virus epidemic, and bioterrorism: responding to the commnication challenges posed by the intentional or unintentional release of a pathogen in an urban setting. Journal of Urban Health 78 (2):382-
391. 10.1093/jurban/78.2.382.
CRC CARE. 2016. A human health review of PFOS and PFOA. CRC CARE Technical Report No. 42. Newcastle,
Australia: CRC for Contamination Assessment and Remediation of the Environment.
CRC CARE. 2017. Assessment, Management and Remediation Guidance for Perfluorooctanesulfonate (PFOS)
and Perfluorooctanoic Acid (PFOA) – Part 3: ecological screening levels. CRC CARE Technical Report No. 38. Newcastle, Australia: CRC for Contamination Assessment and Remediation of the Environment.
405

CRC CARE. 2017. Assessment, Management and Remediation Guidance for Perfluorooctanesulfonate (PFOS)
and Perfluorooctanoic Acid (PFOA) – Part 5: Management and Remediation of PFOS and PFOA CRC CARE Technical Report No. 38. Newcastle, Australia: CRC for Contamination Assessment and Remediation of the
Environment. www.crccare.com.
CRC CARE. 2018. Practitioner guide to risk-based assessment, remediation and management of PFAS site contamination.
Newcastle, Australia: CRC for Contamination Assessment and Remediation of the
Environment. https://www.crccare.com/publications/technical-reports.
Crownover, Emily, Daniel Oberle, Mark Kluger, and Gorm Heron. 2019. Perfluoroalkyl and polyfluoroalkyl
substances thermal desorption evaluation. Remediation Journal 29 (4):77-81. 10.1002/rem.21623.
CSWAB. 2018. Community Priorities and Objectives for Test Methods and Remedies at Known and Potential
PFAS Sites. CT DEP. 2010. DEP (Connecticut Dept of Environmental Protection). 2010. Site Characterization
Guidance Document.
Cui, L., Q. F. Zhou, C. Y. Liao, J. J. Fu, and G. B. Jiang. 2009. Studies on the toxicological effects of PFOA and
PFOS on rats using histological observation and chemical analysis. Arch Environ Contam Toxicol 56 (2):338-49.
10.1007/s00244-008-9194-6.
Cummings, L., A. Matarazzo, N. Nelson, F. Sickels, and C.T. Storms. 2015. New Jersey Drinking Water Quality Institute Subcommittee, Recommendation on Perfluorinated Compound Treatment Options for
Drinking Water. New Jersey Department of Environmental Protection.
Cundy, A. B., R. P. Bardos, A. Church, M. Puschenreiter, W. Friesl-Hanl, I. Müller, S. Neu, M. Mench, N. Witters,
and J. Vangronsveld. 2013. Developing principles of sustainability and stakeholder engagement for gentle remediation approaches: The European context. Journal of Environmental Management 129:283-291.
https://doi.org/10.1016/j.jenvman.2013.07.032.
Curran, I., S. L. Hierlihy, V. Liston, P. Pantazopoulos, A. Nunnikhoven, S. Tittlemier, M. Barker, K. Trick, and G. Bondy. 2008. Altered fatty acid homeostasis and related toxicologic sequelae in rats exposed to dietary
potassium perfluorooctanesulfonate (PFOS). J Toxicol Environ Health A 71 (23):1526-41. 10.1080/15287390802361763.
Custer, C. M., B. R. Gray, and T. W. Custer. 2010. Effects of egg order on organic and inorganic element
concentrations and egg characteristics in tree swallows, Tachycineta bicolor. Environ Toxicol Chem 29
(4):909-21. 10.1002/etc.88.
Custer, Christine M., Thomas W. Custer, Heiko L. Schoenfuss, Beth H. Poganski, and Laura Solem. 2012.
Exposure and effects of perfluoroalkyl compounds on tree swallows nesting at Lake Johanna in east
central Minnesota, USA. Reproductive Toxicology 33 (4):556-562. https://doi.org/10.1016/j.reprotox.2011.01.005.
Custer, Christine M., Thomas W. Custer, Paul M. Dummer, Matthew A. Etterson, Wayne E. Thogmartin, Qian
Wu, Kurunthachalam Kannan, Annette Trowbridge, and Patrick C. McKann. 2014. Exposure and Effects of
Perfluoroalkyl Substances in Tree Swallows Nesting in Minnesota and Wisconsin, USA. Archives of
Environmental Contamination and Toxicology 66 (1):120-138. https://doi.org/10.1007/s00244-013-9934-0.
Custer, Christine M., Thomas W. Custer, Robert Delaney, Paul M. Dummer, Sandra Schultz, and Natalie
Karouna-Renier. 2019. Perfluoroalkyl Contaminant Exposure and Effects in Tree Swallows Nesting at Clarks
Marsh, Oscoda, Michigan, USA. Archives of Environmental Contamination and Toxicology 77 (1):1-13.
https://doi.org/10.1007/s00244-019-00620-1.
da Silva-Rackov, C. K., W. A. Lawal, P. A. Nfodzo, M. M. Vianna, C. A. do Nascimento, and H. Choi. 2016.
Degradation of PFOA by hydrogen peroxide and persulfate activated by iron-modified diatomite. Applied
Catalysis B: Environmental 192. 406

DAgostino, Lisa A., and Scott A. Mabury. 2017. Aerobic biodegradation of 2 fluorotelomer sulfonamide–based
aqueous film–forming foam components produces perfluoroalkyl carboxylates. Environmental Toxicology and Chemistry 36 (8):2012-2021. 10.1002/etc.3750.
Dai, Zhineng, Xinghui Xia, Jia Guo, and Xiaoman Jiang. 2013. Bioaccumulation and uptake routes of
perfluoroalkyl acids in Daphnia magna. Chemosphere 90 (5):1589-1596.
https://doi.org/10.1016/j.chemosphere.2012.08.026.
Dalahmeh, Sahar, Sana Tirgani, Allan John Komakech, Charles B. Niwagaba, and Lutz Ahrens. 2018. Per- and polyfluoroalkyl substances (PFASs) in water, soil and plants in wetlands and agricultural areas in
Kampala, Uganda. Science of The Total Environment 631-632:660-667. https://doi.org/10.1016/j.scitotenv.2018.03.024.
Danish EPA. 2015. Alternatives to Perfluoroalkyl and Polyfluoroalkyl Substances (PFAS) in
Textiles. http://www2.mst.dk/Udgiv/publications/2015/05/978-87-93352-16-2.pdf. .
Danish EPA. 2015. Perfluoroalkylated substances: PFOA, PFOS and PFOSA, Evaluation of health hazards and proposal of a health based quality criterion for drinking water, soil and ground water. Environmental project
No. 1665.
Danish EPA. 2015. Short-chain Polyfluoroalkyl Substances (PFAS). A literature review of information on
human health effects and environmental fate and effect aspects of short-chain PFAS.
https://www2.mst.dk/Udgiv/publications/2015/05/978-87-93352-15-5.pdf
Danish Ministry of the Environment. 2015. Short-chain Polyfluoroalkyl Substances (PFAS): A literature review of
information on human health effects and environmental fate and effect aspects of short-chain PFAS. .
edited by The Danish Environmental Protection Agency.
Darrow, L. A., C. R. Stein, and K. Steenland. 2013. Serum perfluorooctanoic acid and perfluorooctane
sulfonate concentrations in relation to birth outcomes in the Mid-Ohio Valley, 2005-2010. Environ
Health Perspect 121 (10):1207-13. 10.1289/ehp.1206372.
Darwin, R. L. Estimated Inventory of PFOS-based Aqueous Film Forming Foam (AFFF). Fire Fighting Foam Coalition, Inc.. Das, K. P., B. E. Grey, M. B. Rosen, C. R. Wood, K. R. Tatum-Gibbs, R. D. Zehr, M. J. Strynar, A. B.
Lindstrom, and C. Lau.
2015. Developmental toxicity of perfluorononanoic acid in mice. Reprod Toxicol 51:133-44. 10.1016/j.reprotox.2014.12.012.
Das, K. P., B. E. Grey, R. D. Zehr, C. R. Wood, J. L. Butenhoff, S. C. Chang, D. J. Ehresman, Y. M. Tan, and C. Lau.
2008. Effects of perfluorobutyrate exposure during pregnancy in the mouse. Toxicol Sci 105 (1):173-81.
10.1093/toxsci/kfn099.
Das, K. P., C. R. Wood, M. T. Lin, A. A. Starkov, C. Lau, K. B. Wallace, J. C. Corton, and B. D. Abbott. 2017.
Perfluoroalkyl acids-induced liver steatosis: Effects on genes controlling lipid homeostasis. Toxicology
378:37-52. 10.1016/j.tox.2016.12.007.
Dassuncao, Clifton, Xindi C. Hu, Xianming Zhang, Rossana Bossi, Maria Dam, Bjarni Mikkelsen, and Elsie M.
Sunderland. 2017. Temporal Shifts in Poly- and Perfluoroalkyl Substances (PFASs) in North Atlantic Pilot
Whales Indicate Large Contribution of Atmospheric Precursors. Environmental Science & Technology 51 (8):4512-4521.
10.1021/acs.est.7b00293.
Dasu, Kavitha, and Linda S. Lee. 2016. Aerobic biodegradation of toluene-2,4-di(8:2 fluorotelomer urethane) and hexamethylene-1,6-di(8:2 fluorotelomer urethane) monomers in soils.
Chemosphere 144:2482-2488. https://doi.org/10.1016/j.chemosphere.2015.11.021.
407

Dasu, Kavitha, Jinxia Liu, and Linda S. Lee. 2012. Aerobic Soil Biodegradation of 8:2 Fluorotelomer Stearate
Monoester. Environmental Science & Technology 46 (7):3831-3836. 10.1021/es203978.
Dasu, Kavitha, Linda S. Lee, Ronald F. Turco, and Loring F. Nies. 2013. Aerobic biodegradation of 8:2
fluorotelomer stearate monoester and 8:2 fluorotelomer citrate triester in forest soil. Chemosphere 91 (3):399-405. https://doi.org/10.1016/j.chemosphere.2012.11.076.
Dauchy, Xavier, Virginie Boiteux, Cristina Bach, Adeline Colin, Jessica Hemard, Christophe Rosin, and Jean-
François Munoz. 2017. Mass flows and fate of per- and polyfluoroalkyl substances (PFASs) in the
wastewater treatment plant of a fluorochemical manufacturing facility. Science of The Total Environment
576:549-558. https://doi.org/10.1016/j.scitotenv.2016.10.130.
Davis, Katherine L., Michael D. Aucoin, Barbara S. Larsen, Mary A. Kaiser, and Andrew S. Hartten. 2007.
Transport of ammonium perfluorooctanoate in environmental media near a fluoropolymer manufacturing
facility. Chemosphere 67 (10):2011-2019. https://doi.org/10.1016/j.chemosphere.2006.11.049.
De Silva, A. O., J. P. Benskin, L. J. Martin, G. Arsenault, R. McCrindle, N. Riddell, J. W. Martin, and S. A. Mabury.
2009.
Disposition of perfluorinated acid isomers in Sprague-Dawley rats; part 2: subchronic dose. Environ Toxicol
Chem 28 (3):555-67. 10.1897/08-254.1.
De Silva, Amila O., Christine Spencer, Brian F. Scott, Sean Backus, and Derek C. G. Muir. 2011. Detection of a
Cyclic Perfluorinated Acid, Perfluoroethylcyclohexane Sulfonate, in the Great Lakes of North America. Environmental Science & Technology 45 (19):8060-8066. https://doi.org/10.1021/es200135.
De Silva, Amila O., Derek C. G. Muir, and Scott A. Mabury. 2009. Distribution of perfluorocarboxylate isomers in
select samples from the north american environment. Environmental Toxicology and Chemistry 28 (9):1801-
1814. 10.1897/08-500.1.
de Vries, Pepijn, Diana M. E. Slijkerman, Christiaan J. A. F. Kwadijk, Michiel J. J. Kotterman, Leo Posthuma, Dick
de Zwart, Albertinka J. Murk, and Edwin M. Foekema. 2017. The toxic exposure of flamingos to per- and
Polyfluoroalkyl substances (PFAS) from firefighting foam applications in Bonaire. Marine Pollution Bulletin 124 (1):102-111. https://doi.org/10.1016/j.marpolbul.2017.07.017.
Deeb, R.A. , A. Haghani, A. Eaton, and J. Chambon. 2016. Development and Testing of an Analytical Method
for Real Time Measurement of Polyfluoroalkyl and Perfluoroalkyl Substances (PFAS). Battelles 2016 Chlorinated Conference.
Delinsky, Amy D., Mark J. Strynar, Patricia J. McCann, Jerry L. Varns, Larry McMillan, Shoji F. Nakayama, and Andrew B. Lindstrom. 2010. Geographical Distribution of Perfluorinated Compounds in Fish from
Minnesota Lakes and Rivers. Environmental Science & Technology 44 (7):2549-2554. 10.1021/es903777.
Delkash, Madjid, Babak Ebrazi Bakhshayesh, and Hossein Kazemian. 2015. Using zeolitic adsorbents to cleanup
special wastewater streams: A review. Microporous and Mesoporous Materials 214:224-241.
https://doi.org/10.1016/j.micromeso.2015.04.039.
Deng, Shubo, Qiang Yu, Jun Huang, and Gang Yu. 2010. Removal of perfluorooctane sulfonate from wastewater
by anion exchange resins: Effects of resin properties and solution chemistry. Water Research 44
(18):5188-5195. https://doi.org/10.1016/j.watres.2010.06.038.
Deng, Shubo, Qin Zhou, Gang Yu, Jun Huang, and Qing Fan. 2011. Removal of perfluorooctanoate from surface
water by polyaluminium chloride coagulation. Water Research 45 (4):1774-1780.
https://doi.org/10.1016/j.watres.2010.11.029.
408

Denly, Elizabeth, Jim Occhialini, Phil Bassignani, Michael Eberle, and Nidal Rabah. 2019. Per- and
polyfluoroalkyl substances in environmental sampling products: Fact or fiction? Remediation Journal 29 (4):65-76.
10.1002/rem.21614.
Dennis, Nicole M., Adcharee Karnjanapiboonwong, Seenivasan Subbiah, Justin N. Rewerts, Jennifer A. Field, Chris McCarthy, Christopher J. Salice, and Todd A. Anderson. 2020. Chronic Reproductive Toxicity of
Perfluorooctane Sulfonic Acid and a Simple Mixture of Perfluorooctane Sulfonic Acid and Perfluorohexane
Sulfonic Acid to Northern Bobwhite Quail (Colinus virginianus). Environmental Toxicology and Chemistry 39
(5):1101-1111. https://doi.org/10.1002/etc.4703.
Dennis, Nicole M., Seenivasan Subbiah, Adcharee Karnjanapiboonwong, Michael L. Dennis, Chris McCarthy,
Christopher J. Salice, and Todd A. Anderson. 2021. Species- and Tissue-Specific Avian Chronic Toxicity Values for Perfluorooctane Sulfonate (PFOS) and a Binary Mixture of PFOS and Perfluorohexane Sulfonate.
Environmental Toxicology and Chemistry 40 (3):899-909. https://doi.org/10.1002/etc.4937.
D’Eon, Jessica C., and Scott A. Mabury. 2011. Is Indirect Exposure a Significant Contributor to the Burden of Perfluorinated Acids Observed in Humans? Environmental Science & Technology 45
(19):7974-7984.
10.1021/es200171.
D’Eon, Jessica C., Michael D. Hurley, Timothy J. Wallington, and Scott A. Mabury. 2006. Atmospheric Chemistry of
N- methyl Perfluorobutane Sulfonamidoethanol, C4F9SO2N(CH3)CH2CH2OH: Kinetics and Mechanism of
Reaction with OH. Environmental Science & Technology 40 (6):1862-1868. 10.1021/es0520767.
D’Eon, Jessica, and Scott A. Mabury. 2007. Production of Perfluorinated Carboxylic Acids (PFCAs) from the
Biotransformation of Polyfluoroalkyl Phosphate Surfactants (PAPS): Exploring Routes of Human
Contamination. Environmental science & technology 41:4799-805. 10.1021/es070126.
D’Eon, Jessica, and Scott A. Mabury. 2011. Exploring Indirect Sources of Human Exposure to Perfluoroalkyl
Carboxylates (PFCAs): Evaluating Uptake, Elimination, and Biotransformation of Polyfluoroalkyl Phosphate
Esters (PAPs) in the Rat. Environ Health Perspectives 119 (3):344-50. 10.1289/ehp.1002409.
DeSilva, Amila O., Derek C.G. Muir, and Scott A. Mabury. 2009. Distribution of Perfluorocarboxylate Isomers in
Select Samples from the North American Environment. Environmental Toxicology and Chemistry 28 (9):1801-
1814.
Desjardins, D., C.A. Sutherland, R. L. Van Hoven, and H. O. Krueger. 2001. PFOS: A 7-d toxicity test with duckweed (Lemna gibba G3). EPA Docket AR226-1030a054: Ltd. Project Number 454-111 Wildlife
International.
Desjardins, D., C.A. Sutherland, R. L. Van Hoven, and H. O. Krueger. 2001. PFOS: A 96-hr toxicity test with the
marine diatom (Skeletonema costatum). EPA Docket AR226-1030a056: Ltd. Wildlife International, Project
Number 454A-113A.
Desjardins, D., C.A. Sutherland, R.L. Van Hoven, and H.O. Krueger. 2001. PFOS: A 96-hr toxicity test with the
freshwater alga (Anabaena flos-aquae). EPA Docket AR226-0186: Ltd. Wildlife International, Project Number
454A-110B.
DeVito, M. 2018. REACT Program for Per- and Polyfluoroalkyl Substances. NIEHS/DNTP.
https://ntp.niehs.nih.gov/ntp/about_ntp/bsc/2018/june/meetingmaterials/devito20180620_508.pdf.
DeVoogt P., U. Berger, W. de Coen, W. de Wolf, E. Heimstad, M. McLachlan, S. van Leeuwen, A. van Roon. 2006.
Perfluorinated Organic Compounds in the European Environment, FP6-NEST-508967.
409

Dewitt, J. C., C. B. Copeland, M. J. Strynar, and R. W. Luebke. 2008. Perfluorooctanoic acid-induced
immunomodulation in adult C57BL/6J or C57BL/6N female mice. Environ Health Perspect 116 (5):644-50. 10.1289/ehp.10896.
DeWitt, Jamie C., ed. 2015. Toxicological Effects of Perfluoroalkyl and Polyfluoroalkyl Substances, Molecular
and Integrative Toxicology: Humana Press, Cham. ISBN No. 978-3-319-15517-3.
DHHS, MI. 2019. Technical Review Evaluating Recreational Exposure to Per- and Polyfluoroalkyl Substances
(PFAS) in Van Etten Lake (Oscoda, MI) Surface water and foam. Lansing, MI: Michigan Department of
Health and Human Services. https://www.michigan.gov/documents/pfasresponse/VEL_Surface_Water_and_Foam_LHC_- 21_May_2019_-
Final_6 55863_7.pdf.
Dhingra, R., C. Lally, L. A. Darrow, M. Klein, A. Winquist, and K. Steenland. 2016. Perfluorooctanoic acid and chronic kidney disease: Longitudinal analysis of a Mid-Ohio Valley community. Environ Res 145:85-92.
10.1016/j.envres.2015.11.018.
Dhingra, R., L. A. Darrow, M. Klein, A. Winquist, and K. Steenland. 2016. Perfluorooctanoic acid exposure and
natural menopause: A longitudinal study in a community cohort. Environ Res 146:323-30.
10.1016/j.envres.2015.12.037.
DHS. 2010. Risk Steering Committee Risk Lexicon 2010 Edition.
Dickenson, E., and C. Higgins. 2016. Treatment Mitigation Strategies for Poly- and Perfluorinated Chemicals.
Project #4322. Denver, Colorado: Water Research Foundation.
DiGuiseppi, W., R. Richter, and M. Riggle. 2019. Low temperature desorption of per- and polyfloroalkyl
substances. The Military Engineer:52-53.
Ding, G. H., T. Fromel, E. J. van den Brandhof, R. Baerselman, and W. J. Peijnenburg. 2012. Acute toxicity of poly- and perfluorinated compounds to two cladocerans, Daphnia magna and Chydorus sphaericus.
Environ Toxicol Chem 31 (3):605-10. 10.1002/etc.1713.
Dinglasan, Mary Joyce A., Yun Ye, Elizabeth A. Edwards, and Scott A. Mabury. 2004. Fluorotelomer Alcohol
Biodegradation Yields Poly- and Perfluorinated Acids. Environmental Science & Technology 38 (10):2857-
2864. 10.1021/es0350177.
Divine, C., M. Frenchmeyer, K. Dally, E. Osborn, P. Anderson, and J. Zodrow. 2020. Approach for Assessing PFAS
Risk to Threatened and Endangered Species. SERDP Project ER18-1654. Alexandria, VA: Strategic
Environmental Research and Development Program. https://www.serdp-estcp.org/Program-Areas/Environmental-Restoration/ER18-1653.
DMEF. 2015. Proposal for Maximum Levels for Total Organic Fluorine in Paper and Cardboard Food Packaging (in
Danish).
. Technical University of Denmark.
Dobraca, D., L. Israel, S. McNeel, R. Voss, M. Wang, R. Gajek, J. S. Park, S. Harwani, F. Barley, J. She, and R. Das.
2015.
Biomonitoring in California firefighters: metals and perfluorinated chemicals. J Occup Environ Med 57 (1):88-
97. 10.1097/jom.0000000000000307.
Domingo, José L., and Martí Nadal. 2017. Per- and Polyfluoroalkyl Substances (PFASs) in Food and Human
Dietary Intake: A Review of the Recent Scientific Literature. Journal of Agricultural and Food Chemistry 65
(3):533-543.
10.1021/acs.jafc.6b04683.
410

Dominguez-Ramos, Antonio, Karan Chavan, Verónica García, Guillermo Jimeno, Jonathan Albo, Kumudini V.
Marathe, Ganapati D. Yadav, and Angel Irabien. 2014. Arsenic Removal from Natural Waters by Adsorption or Ion Exchange: An Environmental Sustainability Assessment. Industrial & Engineering
Chemistry Research 53 (49):18920-18927. 10.1021/ie4044345.
Dong, G. H., M. M. Liu, D. Wang, L. Zheng, Z. F. Liang, and Y. H. Jin. 2011. Sub-chronic effect of
perfluorooctanesulfonate (PFOS) on the balance of type 1 and type 2 cytokine in adult C57BL6 mice. Arch Toxicol 85 (10):1235-44.
10.1007/s00204-011-0661-x.
Dong, G. H., Y. H. Zhang, L. Zheng, W. Liu, Y. H. Jin, and Q. C. He. 2009. Chronic effects of
perfluorooctanesulfonate exposure on immunotoxicity in adult male C57BL/6 mice. Arch Toxicol 83 (9):805-15. 10.1007/s00204-009-0424-0.
Dorrance, Lydia R., Seth Kellogg, and Adam Love. 2017. What You Should Know About Per- and Polyfluoroalkyl
Substances (PFAS) for Environmental Claims. 29:1-15. 10.1080/10406026.2017.1377015.
Dreyer, A., T. Kirchgeorg, I. Weinberg, and V. Matthias. 2015. Particle-size distribution of airborne poly- and
perfluorinated alkyl substances. Chemosphere 129:142-149.
https://doi.org/10.1016/j.chemosphere.2014.06.069.
Dreyer, A., V. Matthias, I. Weinberg, and R. Ebinghaus. 2010. Wet deposition of poly- and perfluorinated compounds in Northern Germany. Environmental Pollution 158 (5):1221-1227.
https://doi.org/10.1016/j.envpol.2010.01.030.
Dreyer, Annekatrin, Ingo Weinberg, Christian Temme, and Ralf Ebinghaus. 2009. Polyfluorinated Compounds in
the Atmosphere of the Atlantic and Southern Oceans: Evidence for a Global Distribution. Environmental Science & Technology 43 (17):6507-6514. 10.1021/es9010465.
Drottar, K.R., and H.O. Krueger. 2000. PFOS: A 96-hr shell deposition test with the eastern oyster (Crassostrea
virginica).
Project No. 454A-106; EPA Docket AR226-0089: Wildlife International Ltd.
Drottar, K.R., and H.O. Krueger. 2000. PFOS: a 96-hr static acute toxicity test with the fathead minnow (Pimephales promelas). Project No. 454-102, EPA Docket AR226-0083: Wildlife International Ltd.
Drottar, K.R., and H.O. Krueger. 2000. PFOS: A 96-hr static acute toxicity test with the freshwater mussel (Unio
complanatus). Project No. 454A-105, EPA Docket AR226-0091: Wildlife International Ltd.
Drottar, K.R., and H.O. Krueger. 2000. PFOS: A 96-hr static acute toxicity test with the saltwater mysid
(Mysidopsis bahia) Project No. 454A-101; EPA Docket AR226-0095: Wildlife International Ltd.
Drottar, K.R., and H.O. Krueger. 2000. PFOS: A 96-hr toxicity test with the freshwater alga (Selenastrum
capricornutum). Project Number 454A-103A. EPA Docket AR226-0085: Ltd. Wildlife International.
Drottar, K.R., and H.O. Krueger. 2001. PFBS: A semi-static life-cycle toxicity test with the cladoceran (Daphnia
magna).
Project Number 454A-130: Wildlife International Ltd.
Drottar, K.R., R.L. Van Hoven, and H.O. Kruger. 2002. Perfluorooctane sulfonate, potassium salt (PFOS): a
flow-through bioconcentration test with the bluegill (Lepomis macrochirus) – amended. Project number
454A-134 USEPA docket AR226-1108. : Wildlife International Ltd.
411

Du, Ziwen, Shubo Deng, Yue Bei, Qian Huang, Bin Wang, Jun Huang, and Gang Yu. 2014. Adsorption
behavior and mechanism of perfluorinated compounds on various adsorbents—A review. Journal of Hazardous Materials 274:443-454. https://doi.org/10.1016/j.jhazmat.2014.04.038.
Duchesne, Alexandra L., Joshua K. Brown, David J. Patch, David Major, Kela P. Weber, and Jason I. Gerhard.
2020.
Remediation of PFAS-Contaminated Soil and Granular Activated Carbon by Smoldering Combustion.
Environmental Science & Technology 54 (19):12631-12640. 10.1021/acs.est.0c03058.
Dudley, L.A., E.C. Arevalo, and D.R. Knappe. 2015. Removal of Perfluoroalkyl Substances by PAC Adsorption
and Anion Exchange. Project #4344: Water Research Foundation.
Dunagan, S., J.G. Brody, R. Morello-Frosch, P. Brown, S. Goho, J. Tovar, S. Patton, and R. Danford. 2013. When
Pollution is Personal: Handbook for Reporting Results to Participants in Biomonitoring and Personal Exposure Studies. Silent Spring Institute.
https://silentspring.org/sites/default/files/publication/2019-02/personal_exposure_report_handbook.pdf.
DuPont. 2008. Cross-species comparison FRD-902 plasma pharmacokinetics in the rat and primate following intravenous dosing..
DuPont. 2010. GenX Filings with USEPA TSCA section 8(e). https://assets.documentcloud.org/documents/2746960/GenX8eFilings.pdf.
DuPont. 2011. H-28548: Absorption, Distribution, Metabolism, and Elimination in the
Mouse. DuPont. 2011. H-28548: Absorption, Distribution, Metabolism, and Elimination in the Rat. Earthjustice. 2020. PFAS Incineration Suit.
https://earthjustice.org/sites/default/files/files/filed_complaint_-_pfas_incineration_suit.pdf
Eberle, Dylan, Raymond Ball, and Thomas B. Boving. 2017. Impact of ISCO Treatment on PFAA Co-Contaminants
at a Former Fire Training Area. Environmental Science & Technology 51 (9):5127-5136.
10.1021/acs.est.6b06591.
ECCC. 2017. Aqueous film-forming foam and the Prohibition of Certain Toxic Substances Reguations.
https://www.canada.ca/en/environment-climate-change/services/management-toxic-substances/list-canadian-enviro nmental-protection-act/perfluorooctane-sulfonate/film-forming-foam-prohibition-toxic-
substances.html.
ECCC. 2018. Federal Environmental Quality Guidelines: Perfluorooctane Sulfonate (PFOS). Last Modified June
2018. accessed 2020.
https://www.canada.ca/en/environment-climate-change/services/evaluating-existing-substances/federal-environment al-quality-guidelines-perfluorooctane-sulfonate.html.
ECHA. 2018. Submitted restrictions under consideration. European Chemicals
Agency. https://echa.europa.eu/restrictions-under-consideration https://echa.europa.eu/substances-of-very-high-concern-identification/-/substance-
rev/20306/term?_viewsubstances_ WAR_echarevsubstanceportlet_SEARCH_CRITERIA_EC_NUMBER=206-196-
6&_viewsubstances_WAR_echarevsubstanc eportlet_DISS=true.
ECOS-DOD. 2007. Identification and Selection of Toxicity Values/Criteria for Comprehensive Environmental
Response, Compensation, and Recovery Act (CERCLA) and Hazardous Waste Site Risk Assessments in the
Absence of IRIS Values. .
EFSA. 2018. Risk to human health related to the presence of perfluorooctane sulfonic acid and perfluorooctanoic
acid in food. European Food Safety Authority (EFSA) Journal 16 (12):5194. 10.2903/j.efsa.2018.5194.
412

Ege, S. N. 1999. Organic Chemistry: Structure and Reactivity: Fourth Edition. Boston, MA: Houghton Mifflin
Company.
ISBN No. 0395902231.
Eggen, Trine, Monika Moeder, and Augustine Arukwe. 2010. Municipal landfill leachates: A significant source for
new and emerging pollutants. Science of The Total Environment 408 (21):5147-5157.
https://doi.org/10.1016/j.scitotenv.2010.07.049.
Ellis, David A., Jonathan W. Martin, Amila O. De Silva, Scott A. Mabury, Michael D. Hurley, Mads P. Sulbaek
Andersen, and Timothy J. Wallington. 2004. Degradation of Fluorotelomer Alcohols: A Likely Atmospheric Source of Perfluorinated Carboxylic Acids. Environmental Science & Technology 38 (12):3316-3321.
10.1021/es049860.
Emmett, E. A., F. S. Shofer, H. Zhang, D. Freeman, C. Desai, and L. M. Shaw. 2006. Community exposure
to perfluorooctanoate: relationships between serum concentrations and exposure sources. J Occup Environ Med 48 (8):759-70. 10.1097/01.jom.0000232486.07658.74.
Emmett, Edward A., and Chintan Desai. 2010. Community First Communication: Reversing Information
Disparities to Achieve Environmental Justice. Environmental Justice 3 (3):79-84. 10.1089/env.2009.0037.
Emmett, Edward Anthony, Hong Zhang, Frances Susan Shofer, Nancy Rodway, Chintan Desai, David
Freeman, and Mary Hufford. 2009. Development and Successful Application of a Community-First
Communication Model for Community- based Environmental Health Research. Journal of Occupational and
Environmental Medicine 51 (2).
Endpoint Consulting. 2016. Bench-Scale VEG Research and Development Study: Implementation
Memorandum for Ex- Situ Thermal Desorption of Perfluoroalkyl Compounds (PFCs) in Soils. http://www.endpoint-inc.com/wp-content/uploads/2016/05/VEG-Bench-Scale-PFCs-Soil.pdf
Ensch, Mary, Cory A. Rusinek, Michael F. Becker, and Thomas Schuelke. 2020. A combined current density technique for the electrochemical oxidation of perfluorooctanoic acid (PFOA) with boron-doped diamond.
Water and Environment Journal n/a (n/a). https://doi.org/10.1111/wej.12616.
Environment Agency. 2004. Environmental Risk Evaluation Report: Perfluorooctanesulfonate (PFOS). United
Kingdom: Research Contractor: Building Research Establishment Ltd. and Risk and Policy Analysts Ltd.
Environment Canada. 2006. Ecological Screening Assessment Report on Perfluorooctane Sulfonate, Its Salts, and Its Precursors that Contain the C8F17SO2 or C8F17SO3 or C8F17SO2N Moiety. .
Environment Canada. 2012. Screening Assessment Report on Perfluorooctanoic Acid, Its Salts, and Its Precursors. https://www.ec.gc.ca/ese-ees/370AB133-3972-454F-A03A-
F18890B58277/PFOA_EN.pdf
Environmental Protection Authority Victoria. 2019. PFAS in Victorian waterfowl. Publication 1734. https://ref.epa.vic.gov.au/~/media/Publications/1734.pdf.
Environmental Working Group and Northeastern University Social Science Environmental Health Research Institute.
2017. Mapping A Contamination Crisis. .
Enviropacific. 2017. Treatment of PFAS in Soils, Sediments and Water. http://www.enviropacific.com.au/wp-content/uploads/2016/09/Enviropacific_Treatment-of-
PFAS.pdf
EPA Science Advisory Board. 2006. Science Advisory Board Review of EPAs Draft Risk Assessment of Potential
Human Health Effects Associated with PFOA and Its Salts, May 30, 2006..
413

Eriksson, Ulrika, Anna Karrman, Anna Rotander, Bjørg Mikkelsen, and Maria Dam. 2013. Perfluoroalkyl
substances (PFASs) in food and water from Faroe Islands. Environmental Science and Pollution Research 20:7940-7948. https://doi.org/10.1007/s11356-013-1700-3.
Eriksson, Ulrika, Peter Haglund, and Anna Karrman. 2017. Contribution of precursor compounds to the
release of per- and polyfluoroalkyl substances (PFASs) from waste water treatment plants (WWTPs).
Journal of Environmental Sciences 61:80-90. https://doi.org/10.1016/j.jes.2017.05.004.
Eschauzier, Christian, Erwin Beerendonk, Petra Scholte-Veenendaal, and Pim De Voogt. 2012. Impact of
Treatment Processes on the Removal of Perfluoroalkyl Acids from the Drinking Water Production Chain.
Environmental Science & Technology 46 (3):1708-1715. 10.1021/es201662.
ESTCP. 2011. Final Report, Assessing Alternative Endpoints for Groundwater Remediation at Contaminated Sites.
ESTCP Project ER-200832.
European Commission. 2020. The Use of PFAS and Fluorine-Free Alternatives in Fire-Fighting Foams.
Brussels: DG Environment / European Chemicals Agency (ECHA).
https://echa.europa.eu/documents/10162/28801697/pfas_flourine-free_alternatives_fire_fighting_en.pdf/d5b24e2a-d 027-0168-cdd8-f723c675fa98.
European Union. 2011. PFOS EQS Dossier 2011. EQSD 2008/105/EC: Sub-Group on Review of the Priority
Substances List.
European Union. 2013. Directive 2013/39/EU amending Directives 2000/60/EC and 2008/105/EC as regards
priority substances in the field of water policy. Official Journal of the European Union.
Executive Order 12898. 1994. Federal Actions to Address Environmental Justice in Minority Populations and Low-Income Populations. Federal Register 59 FR 7629.
FAA. 2006. Aqueous Film Forming Foam (AFFF) meeting MIL-F-24385. FAA CertAlert No.
16-02. FAA. 2016. Update on Mil-Spec Aqueous Film Forming Foam (AFFF). . FAA
CertAlert No. 16-05. FAA. 2018. FAA Reauthorization Act of 2018. https://www.congress.gov/bill/115th-congress/house-
bill/302/text?q=%7B%22search%22%3A%5B%22FAA+Reauthor ization%22%5D%7D&r=2.
FAA. 2019. FAA National Part 139 CertAlert. AFFF Testing at Cetricated Part 139 Airports. CertAlert No. 19-01. Washington, D. C. https://www.faa.gov/airports/airport_safety/certalerts/media/part-139-cert-alert-19-01-
AFFF.pdf.
FAA. 2020. FAA Opens One-of-a-Kind Fire Research Facility in Atlanta City. Last Modified January 14, 2020. accessed 2020. https://www.faa.gov/news/updates/?newsId=94946.
Fabbri, Rita, Michele Montagna, Teresa Balbi, Enrico Raffo, Franca Palumbo, and Laura Canesi. 2014.
Adaptation of the bivalve embryotoxicity assay for the high throughput screening of emerging contaminants in Mytilus galloprovincialis. Marine Environmental Research 99:1-8.
https://doi.org/10.1016/j.marenvres.2014.05.007.
Fair, P. A., T. Romano, A. M. Schaefer, J. S. Reif, G. D. Bossart, M. Houde, D. C. Muir, J. Adams, C. Rice, T. C.
Hulsey, and M. Peden-Adams. 2013. Associations between perfluoroalkyl compounds and immune and clinical
chemistry parameters in highly exposed bottlenose dolphins (Tursiops truncatus). Environmental
Toxicology and Chemistry 32 (4):736-746. https://doi.org/10.1002/etc.2122.
Fakouri Baygi, Sadjad, Bernard S. Crimmins, Philip K. Hopke, and Thomas M. Holsen. 2016. Comprehensive Emerging Chemical Discovery: Novel Polyfluorinated Compounds in Lake Michigan Trout. Environmental
Science & Technology 50 (17):9460-9468. 10.1021/acs.est.6b01349.
414

Falk, Sandy, Klaus Failing, Sebastian Georgii, Hubertus Brunn, and Thorsten Stahl. 2015. Tissue specific
uptake and elimination of perfluoroalkyl acids (PFAAs) in adult rainbow trout (Oncorhynchus mykiss) after dietary exposure. Chemosphere 129:150-156.
https://doi.org/10.1016/j.chemosphere.2014.06.061.
Fang, Shuhong, Xinwei Chen, Shuyan Zhao, Yifeng Zhang, Weiwei Jiang, Liping Yang, and Lingyan Zhu.
2014. Trophic Magnification and Isomer Fractionation of Perfluoroalkyl Substances in the Food Web of
Taihu Lake, China. Environmental Science & Technology 48 (4):2173-2182. 10.1021/es405018.
Fang, Xuemei, Lianjun Zhang, Yixing Feng, Yong Zhao, and Jiayin Dai. 2008. Immunotoxic Effects of
Perfluorononanoic Acid on BALB/c Mice. 105:312-21. 10.1093/toxsci/kfn127.
Fang, Xuemei, Yixing Feng, Jianshe Wang, and Jiayin Dai. 2010. Perfluorononanoic acid-induced apoptosis in rat spleen involves oxidative stress and the activation of caspase-independent death pathway. Toxicology
267 (1):54-59. https://doi.org/10.1016/j.tox.2009.10.020.
Fang, Xuemei, Yixing Feng, Zhimin Shi, and Jiayin Dai. 2009. Alterations of Cytokines and MAPK Signaling
Pathways are Related to the Immunotoxic Effect of Perfluorononanoic Acid. Toxicological Sciences 108
(2):367-376.
10.1093/toxsci/kfp019.
Fasano, W. J., G. L. Kennedy, B. Szostek, D. G. Farrar, R. J. Ward, L. Haroun, and P. M. Hinderliter. 2005.
Penetration of ammonium perfluorooctanoate through rat and human skin in vitro. Drug Chem Toxicol 28 (1):79-90.
10.1081/dct-39707.
Fasano, William J., Lisa M. Sweeney, Michael P. Mawn, Diane L. Nabb, Bogdan Szostek, Robert C. Buck, and Michael L. Gargas. 2009. Kinetics of 8-2 fluorotelomer alcohol and its metabolites, and liver glutathione
status following daily oral dosing for 45 days in male and female rats. Chemico-Biological Interactions 180
(2):281-295. https://doi.org/10.1016/j.cbi.2009.03.015.
Favara, Paul, John Tunks, Jim Hatton, and William DiGuiseppi. 2016. Sustainable Remediation Considerations
for Treatment of 1,4-Dioxane in Groundwater. Remediation Journal 27 (1):133-158. 10.1002/rem.21501.
FDA. 2018. Inventory of Effective Food Contact Substance Notifications.
Feng, X., X. Cao, S. Zhao, X. Wang, X. Hua, L. Chen, and L. Chen. 2017. Exposure of Pregnant Mice to Perfluorobutanesulfonate Causes Hypothyroxinemia and Developmental Abnormalities in Female
Offspring. Toxicol Sci 155 (2):409-419. 10.1093/toxsci/kfw219.
Feng, Y., X. Fang, Z. Shi, M. Xu, and J. Dai. 2010. Effects of PFNA exposure on expression of junction-
associated molecules and secretory function in rat Sertoli cells. Reprod Toxicol 30 (3):429-37.
10.1016/j.reprotox.2010.05.010.
Feng, Yixing, Zhimin Shi, Xuemei Fang, Muqi Xu, and Jiayin Dai. 2009. Perfluorononanoic acid induces apoptosis involving the Fas death receptor signaling pathway in rat testis. Toxicology Letters 190 (2):224-230.
https://doi.org/10.1016/j.toxlet.2009.07.020.
Fenton, Suzanne E., Alan Ducatman, Alan Boobis, Jamie C. DeWitt, Christopher Lau, Carla Ng, James S. Smith, and Stephen M. Roberts. 2020. Per- and Polyfluoroalkyl Substance Toxicity and Human Health
Review: Current State of Knowledge and Strategies for Informing Future Research. Environmental
Toxicology and Chemistry n/a (n/a). https://doi.org/10.1002/etc.4890.
415

Fernández-Sanjuan, María, Melissa Faria, Silvia Lacorte, and Carlos Barata. 2013. Bioaccumulation and effects
of perfluorinated compounds (PFCs) in zebra mussels (Dreissena polymorpha). Environmental Science and
Pollution Research 20 (4):2661-2669. 10.1007/s11356-012-1158-8.
FFFC. 2016. Best Practice Guidance for Use of Class B Firefighting Foams. Arlington, VA: Fire Fighting Foam
Coalition. http://www.fomtec.com/getfile.php/1316325/Bilder/Media/FFFC_bestpracticeguidance.pdf
FFFC. 2018. Best Practice Guidance for Fluorinated Firefighting Foams Q&A.
Field, J., Sedlak, D., Alvarez-Cohen, L., . 2017. Final Report – Characterization of the Fate and Biotransformation of
Fluorochemicals in AFFF-Contaminated Groundwater at Fire/Crash Testing Military Sites. SERDP Project ER-
2128.
Filipovic, Marko, Hjalmar Laudon, Michael S. McLachlan, and Urs Berger. 2015. Mass Balance of Perfluorinated Alkyl Acids in a Pristine Boreal Catchment. Environmental Science & Technology 49 (20):12127-12135.
10.1021/acs.est.5b03403.
Fitzgerald, N.J., A. Wargenau, C. Sorenson, J. Pedersen, N. Tufenkji, P.J. Novak, and M.F. Simcik. 2018.
Partitioning and accumulation of perfluoroalkyl substances in model lipid bilayers and bacteria.
Environmental Science & Technology 52 (18):10433-40.
FL DEP. 2020. Per and Polyfluoroalkyl Substances (PFAS) Dynamic Plan. Florida Department of Environmental
Protection Division of Waste Management. https://floridadep.gov/sites/default/files/Dynamic_Plan_Revised_Feb2021.pdf.
Fliedner, A., H. Rüdel, N. Lohmann, G. Buchmeier, and J. Koschorreck. 2018. Biota monitoring under the Water Framework Directive: On tissue choice and fish species selection. Environmental Pollution 235:129-140.
Flores, C., F. Ventura, J. Martin-Alonso, and J. Caixach. 2013. Occurrence of perfluorooctane sulfonate (PFOS)
and perfluorooctanoate (PFOA) in N.E. Spanish surface waters and their removal in a drinking water treatment plant that combines conventional and advanced treatments in parallel lines. Science of the Total
Environment
461-462:618-626. https://doi.org/10.1016/j.scitotenv.2013.05.026.
FluoroCouncil. 2017. Research Relevant to Short-Chain PFAS.
https://fluorocouncil.com/Resources/Research. FluoroCouncil. 2018. Applications.
https://fluorocouncil.com/applications/ Flynn, R. Wesley, Michael F. Chislock, Megan E. Gannon, Stephanie J. Bauer, Brian J. Tornabene, Jason T.
Hoverman, and Maria S. Sepúlveda. 2019. Acute and chronic effects of perfluoroalkyl substance mixtures
on larval American bullfrogs (Rana catesbeiana). Chemosphere 236:124350.
https://doi.org/10.1016/j.chemosphere.2019.124350.
Flynn, R. Wesley, Michael Iacchetta, Chloe de Perre, Linda Lee, Maria S. Sepúlveda, and Jason T. Hoverman.
2021. Chronic Per-/Polyfluoroalkyl Substance Exposure Under Environmentally Relevant Conditions Delays
Development in Northern Leopard Frog (Rana pipiens) Larvae. Environmental Toxicology and Chemistry
40:711-716. https://doi.org/10.1002/etc.4690.
Forrester, E., and J. Matthis. 2018. Treatment Solutions for PFAS Removal: Evaluating Total Cost.
Fort, Douglas J., Michael B. Mathis, Patrick D. Guiney, and John A. Weeks. 2019. Evaluation of the
developmental toxicity of perfluorooctanesulfonate in the Anuran, Silurana tropicalis. Journal of Applied
Toxicology 39 (2):365-374. https://doi.org/10.1002/jat.3727.
416

Franklin, James. 2016. How reliable are field-derived biomagnification factors and trophic magnification factors
as indicators of bioaccumulation potential? Conclusions from a case study on per- and polyfluoroalkyl substances. Integrated Environmental Assessment and Management 12 (1):6-20. 10.1002/ieam.1642.
Franko, J., B. J. Meade, H. F. Frasch, A. M. Barbero, and S. E. Anderson. 2012. Dermal penetration potential of
perfluorooctanoic acid (PFOA) in human and mouse skin. J Toxicol Environ Health A 75 (1):50-62.
10.1080/15287394.2011.615108.
Fraser, Alicia J., Thomas F. Webster, Deborah J. Watkins, Jessica W. Nelson, Heather M. Stapleton, Antonia
M. Calafat, Kayoko Kato, Mahiba Shoeib, Verónica M. Vieira, and Michael D. McClean. 2012.
Polyfluorinated Compounds in Serum Linked to Indoor Air in Office Environments. Environmental
Science & Technology 46 (2):1209-1215. 10.1021/es2038257.
Frawley, Rachel P., Matthew Smith, Mark F. Cesta, Schantel Hayes-Bouknight, Chad Blystone, Grace E.
Kissling, Shawn Harris, and Dori Germolec. 2018. Immunotoxic and hepatotoxic effects of perfluoro-n-
decanoic acid (PFDA) on female Harlan Sprague–Dawley rats and B6C3F1/N mice when administered by
oral gavage for 28 days. Journal of Immunotoxicology 15 (1):41-52. 10.1080/1547691X.2018.1445145.
Freberg, Baard Ingegerdsson, Line Småstuen Haug, Raymond Olsen, Hanne Line Daae, Merete
Hersson, Cathrine Thomsen, Syvert Thorud, Georg Becher, Paal Molander, and Dag G. Ellingsen. 2010. Occupational Exposure to Airborne Perfluorinated Compounds during Professional Ski Waxing.
Environmental Science & Technology 44 (19):7723-7728. 10.1021/es102033.
Fredriksson, F. 2016. Analysis of Per- and Polyfluoroalkyl Substances (PFASs) in African Darter (Anhinga rufa)
Eggs along Vaal River, South Africa. School of Science and Technology, Örebro University.
Fricke, M., and U. Lahl. 2005. Risk Evaluation of Perfluorinated Surfactants as Contribution to the Current
Debate on the EU Commissions REACH Document. UWSF-Z Umweltchem kotox 17.
Frisbee, S. J., A. P. Brooks, Jr., A. Maher, P. Flensborg, S. Arnold, T. Fletcher, K. Steenland, A. Shankar, S. S.
Knox, C. Pollard, J. A. Halverson, V. M. Vieira, C. Jin, K. M. Leyden, and A. M. Ducatman. 2009. The C8 health
project: design, methods, and participants. Environ Health Perspect 117 (12):1873-82. 10.1289/ehp.0800379.
Fromme, Hermann, Annekatrin Dreyer, Silvio Dietrich, Ludwig Fembacher, Thomas Lahrz, and Wolfgang Völkel.
2015.
Neutral polyfluorinated compounds in indoor air in Germany – The LUPE 4 study. Chemosphere 139:572-578.
https://doi.org/10.1016/j.chemosphere.2015.07.024.
Fromme, Hermann, Christine Mosch, Maria Morovitz, Irene Alba-Alejandre, Sigrun Boehmer, Mandy Kiranoglu,
Fabienne Faber, Iris Hannibal, Orsolya Genzel-Boroviczény, Berthold Koletzko, and Wolfgang Völkel. 2010. Pre- and Postnatal Exposure to Perfluorinated Compounds (PFCs). Environmental Science & Technology
44 (18):7123-7129. 10.1021/es101184.
Fromme, Hermann, Mandy Wöckner, Eike Roscher, and Wolfgang Völkel. 2017. ADONA and perfluoroalkylated substances in plasma samples of German blood donors living in South Germany. International Journal of
Hygiene and Environmental Health 220 (2):455-460. http://dx.doi.org/10.1016/j.ijheh.2016.12.014.
Fromme, Hermann, Sheryl A. Tittlemier, Wolfgang Völkel, Michael Wilhelm, and Dorothee Twardella. 2009.
Perfluorinated compounds – Exposure assessment for the general population in western countries.
International Journal of Hygiene and Environmental Health 212 (3):239-270. https://doi.org/10.1016/j.ijheh.2008.04.007.
Frömel, T., C. Gremmel, I. Dimzon, and P. de Voogt. . 2016. Investigations on the presence and behavior of
precursors to perfluoroalkyl substances in the environment as a preparation of regulatory measures.
417

Fuentes, S., P. Vicens, M. T. Colomina, and J. L. Domingo. 2007. Behavioral effects in adult mice
exposed to perfluorooctane sulfonate (PFOS). Toxicology 242 (1-3):123-9.
10.1016/j.tox.2007.09.012.
Fujii, Yukiko, Kouji H. Harada, and Akio Koizumi. 2013. Occurrence of perfluorinated carboxylic acids (PFCAs) in
personal care products and compounding agents. Chemosphere 93 (3):538-544. https://doi.org/10.1016/j.chemosphere.2013.06.049.
Furl, C., and C. Meredith. 2010. Perfluorinated compounds in Washington rivers and lakes.
Publication Number 10-03-034. Olympia, WA.
https://fortress.wa.gov/ecy/publications/summarypages/1003034.html.
Furman, Olha, S., Amy Teel, L., Mushtaque Ahmad, Marissa Merker, C., and Richard Watts, J. 2011. Effect of Basicity on Persulfate Reactivity. Journal of Environmental Engineering 137 (4):241-247.
10.1061/(ASCE)EE.1943-7870.0000323.
Furst, C., C. Weible, and C. Salice. 2019. Exploring the effects of exposure from common perfluoroalkyl substances (PFASs) on brown anoles (Anolis sagrei). 40th annual North American meeting of the
Society of Environmental Toxicology and Chemistry (SETAC), Toronto, Ontario, Canada, November 3-
7, 2019 Abstract No.
Furuta, M., M. Yamaguchi, T. Tsukamoto, B. Yim, C. E. Stavarache, K. Hasiba, and Y. Maeda. 2004.
Inactivation of Escherichia coli by ultrasonic irradiation. Ultrasonics Sonochemistry 11 (2):57-60. https://doi.org/10.1016/S1350-4177(03)00136-6.
Galatius, Anders, Rossana Bossi, Christian Sonne, Frank Farsø Rigét, Carl Kinze, Christina Lockyer, Jonas
Teilmann, and Rune Dietz. 2013. PFAS profiles in three North Sea top predators: Metabolic differences
among species?
Environmental Science and Pollution Research 20:8013-8020. https://doi.org/10.1007/s11356-013-1633-x.
Gannon, S. A., W. J. Fasano, M. P. Mawn, D. L. Nabb, R. C. Buck, L. W. Buxton, G. W. Jepson, and S. R. Frame. 2016.
Absorption, distribution, metabolism, excretion, and kinetics of 2,3,3,3-tetrafluoro-2-
(heptafluoropropoxy)propanoic acid ammonium salt following a single dose in rat, mouse, and cynomolgus monkey. Toxicology 340:1-9. https://doi.org/10.1016/j.tox.2015.12.006.
Gao, Yan, Jianjie Fu, Huiming Cao, Yawei Wang, Aiqian Zhang, Yong Liang, Thanh Wang, Chunyan Zhao, and
Guibin Jiang. 2015. Differential Accumulation and Elimination Behavior of Perfluoroalkyl Acid Isomers in
Occupational Workers in a Manufactory in China. Environmental Science & Technology 49 (11):6953-6962.
10.1021/acs.est.5b00778.
Gauthier, Suzanne A., and Scott A. Mabury. 2005. Aqueous photolysis of 8:2 fluorotelomer alcohol. Environmental
Toxicology and Chemistry 24 (8):1837-1846. 10.1897/04-591R.1.
Gaylard, S. 2017. Per and polyfluorinated alkyl substances (PFAS) in the marine environment – Preliminary ecological findings. Adelaide, SA: Environment Protection Authority of South Australia.
https://www.epa.sa.gov.au/files/12580_report_pfas_marine.pdf.
Ge, H., E. Yamazaki, N. Yamashita, S. Taniyasu, A. Ogata, and M. Furuuchi. 2017. Particle size specific
distribution of perfluoro alkyl substances in atmospheric particulate matter in Asian cities. Environmental Science: Processes & Impacts 19 (4):549-560. https://doi.org/10.1039/C6EM00564K.
Gebbink, Wouter A., Anders Bignert, and Urs Berger. 2016. Perfluoroalkyl Acids (PFAAs) and Selected Precursors
in the Baltic Sea Environment: Do Precursors Play a Role in Food Web Accumulation of PFAAs? Environmental
Science & Technology 50 (12):6354-6362. 10.1021/acs.est.6b01197.
418

Gebbink, Wouter A., Urs Berger, and Ian T. Cousins. 2015. Estimating human exposure to PFOS isomers
and PFCA homologues: The relative importance of direct and indirect (precursor) exposure. Environment International 74:160-169. https://doi.org/10.1016/j.envint.2014.10.013.
Gellrich, V., T. Stahl, and T. P. Knepper. 2012. Behavior of perfluorinated compounds in soils during
leaching experiments. Chemosphere 87 (9):1052-1056.
https://doi.org/10.1016/j.chemosphere.2012.02.011.
Gellrich, Vanessa, Hubertus Brunn, and Thorsten Stahl. 2013. Perfluoroalkyl and polyfluoroalkyl substances
(PFASs) in mineral water and tap water. Journal of Environmental Science and Health, Part A 48 (2):129-135.
10.1080/10934529.2013.719431.
Gerber, Brian J., and Grant W. Neeley. 2005. Perceived Risk and Citizen Preferences for Governmental
Management of Routine Hazards. Policy Studies Journal 33 (3):395-418. 10.1111/j.1541-0072.2005.00122.x.
German Environment Agency. 2016. HBM I Values for Perfluorooctanoic acid (PFOA) and Perfluorooctanesulfonic acid (PFOS) in blood plasma. Statement of the German Human Biomonitoring
Commission (HBM Commission).
German Federal Environment Agency. 2013. Environmentally Responsible Use of Fluorinated Fire-Fighting
Foams. www.unweltbundesamt.de.
German Human Biomonitoring Commission. 2018. [HBM-I values for Perfluorooctanoic acid (PFOA) and Perfluorooctanesulfonic acid (PFOS) in blood plasma – Statement of the German Human Biomonitoring
Commission (HBM Commission)]. Bundesgesundheitsblatt Gesundheitsforschung Gesundheitsschutz 61 (4):474-487.
10.1007/s00103-018-2709-z.
Gewurtz, Sarah B., Satyendra P. Bhavsar, Patrick W. Crozier, Miriam L. Diamond, Paul A. Helm, Chris H. Marvin,
and Eric J. Reiner. 2009. Perfluoroalkyl Contaminants in Window Film: Indoor/Outdoor, Urban/Rural, and
Winter/Summer Contamination and Assessment of Carpet as a Possible Source. Environmental Science &
Technology 43 (19):7317-7323. 10.1021/es9002718.
Gewurtz, Sarah B., Satyendra P. Bhavsar, Steve Petro, Chris G. Mahon, Xiaoming Zhao, Dave Morse, Eric J.
Reiner, Sheryl
A. Tittlemier, Eric Braekevelt, and Ken Drouillard. 2014. High levels of perfluoroalkyl acids in sport fish
species downstream of a firefighting training facility at Hamilton International Airport, Ontario, Canada. Environment International 67:1-11. https://doi.org/10.1016/j.envint.2014.02.005.
Ghisi, Rossella, Teofilo Vamerali, and Sergio Manzetti. 2019. Accumulation of perfluorinated alkyl substances
(PFAS) in agricultural plants: A review. Environmental Research 169:326-341. https://doi.org/10.1016/j.envres.2018.10.023.
Gibbons, J. Whitfield, David E. Scott, Travis J. Ryan, Kurt A. Buhlmann, Tracey D. Tuberville, Brian S. Metts,
Judith L. Greene, Tony Mills, Yale Leiden, Sean Poppy, and Christopher T. Winne. 2000. The Global Decline of Reptiles, Déjà Vu Amphibians: Reptile species are declining on a global scale. Six significant
threats to reptile populations are habitat loss and degradation, introduced invasive species, environmental
pollution, disease, unsustainable use, and global climate change. BioScience 50 (8):653-666. 10.1641/0006-3568(2000)050[0653:TGDORD]2.0.CO;2.
Gibbs, S., S. Hong, W. Graves, C. Granville, B. Jayaram, C.R. Blystone, V. C. Robinson, and C. Smith. 2012. Toxicokinetics of perfluorodecanoic acid (PFDA) after a single intravenous or gavage administration to
Harlan Sprague Dawley rats. The Toxicologist, Supplement to Toxicological Sciences 126 (1):Abstract
#1875.
419

Giesy, J. P., J. Naile, J. Seong Khim, P. D. Jones, and J. L. Newsted. 2010. Aquatic Toxicology of Perfluorinated
Chemicals. In Reviews of Environmental Contamination and Toxicology, edited by D.M. Whitacre. Vol. 202. Springer
Science+Business Media. ISBN No. 978-1-4419-1157-5.
Giesy, J. P., S.A Mabury, J. W. Martin, K. Kannan, P. D. Jones, J. L. Newsted, and K. Coady. 2006. Perfluorinated Compunds in the Great Lakes. In Persistent Organic Pollutants in the Great Lakes, edited by R.A. Hite, 391-
438. Vol. 5N, The Handbook of Environmental Chemistry. Berlin, Heidelberg: Springer. ISBN No. 978-3-540-32990-9.
Giesy, John P., and Kurunthachalam Kannan. 2001. Global Distribution of Perfluorooctane Sulfonate in Wildlife.
Environmental Science & Technology 35 (7):1339-1342. https://doi.org/10.1021/es001834.
Giesy, John P., and Kurunthachalam Kannan. 2002. Peer Reviewed: Perfluorochemical Surfactants in the
Environment. Environmental Science & Technology 36 (7):146A-152A. 10.1021/es022253.
Gilliland, F. D., and J. S. Mandel. 1993. Mortality among employees of a perfluorooctanoic acid production plant. J
Occup Med 35 (9):950-4.
Gipe, R. L., and H. B. Peterson. 1972. Proportioning Characteristics of Aqueous Film-Forming Foam Concentrates. NRL Report 7437. Washington, D.C.
Giri, Rabindra Raj, Hiroaki Ozaki, Tatsuya Okada, Shogo Taniguchi, and Ryohei Takanami. 2012. Factors influencing UV photodecomposition of perfluorooctanoic acid in water. Chemical Engineering Journal 180:197-
203. https://doi.org/10.1016/j.cej.2011.11.049.
Giri, Rabindra, Hiroaki Ozaki, T. Morigaki, Shogo Taniguchi, and R. Takanami. 2011. UV photolysis of
perfluorooctanoic acid (PFOA) in dilute aqueous solution. Water Science and Technology 63 (2):276-282.
https://doi.org/10.2166/wst.2011.050.
Gleason, J. A., G. B. Post, and J. A. Fagliano. 2015. Associations of perfluorinated chemical serum
concentrations and biomarkers of liver function and uric acid in the US population (NHANES), 2007-2010.
Environ Res 136:8-14. 10.1016/j.envres.2014.10.004.
Global PFAS Science Panel. 2020. Global PFAS Science Panel. accessed 2020.
https://www.pfassciencepanel.org. Globe. 2017. Basic Turnout Gear Care and Cleaning. Globeli, l.us. 2016. Uptake of Per- and Polyfluoroalkyl Substances by Plant. Masters Thesis. Swedish
University of Agricultural Sciences.
Glover, C.M., O. Quiñones, and E.R. Dickenson. 2018. Removal of perfluoroalkyl and polyfluoroalkyl
substances in potable reuse systems. Water Research 144:454-461.
Gobelius, Laura, Jeffrey Lewis, and Lutz Ahrens. 2017. Plant Uptake of Per- and Polyfluoroalkyl
Substances at a Contaminated Fire Training Facility to Evaluate the Phytoremediation Potential of
Various Plant Species. Environmental Science & Technology 51 (21):12602-12610.
https://doi.org/10.1021/acs.est.7b02926.
Goeden, Helen M., Christopher W. Greene, and James A. Jacobus. 2019. A transgenerational toxicokinetic
model and its use in derivation of Minnesota PFOA water guidance. Journal of Exposure Science &
Environmental Epidemiology 29 (2):183-195. 10.1038/s41370-018-0110-5.
Goldenberg, M., and Krishna R. Reddy. 2014. Sustainability Assessment of Excavation and Disposal versus
In Situ Stabilization of Heavy Metal-Contaminated Soil at a Superfund Site in Illinois. Geo-Congress 2014, Atlanta, Georgia Abstract No. https://ascelibrary.org/doi/10.1061/9780784413272.219.
420
Goldenthal, E.I. 1978. Final report. Ninety day subacute rhesus monkey toxicity study. International Research
and Development Corporation. Study No. 137-090. USEPA AR226-0447 (Cited in USEPA, DWQI, 2017a).
Gole, Vitthal L., Reyes Sierra-Alvarez, Hui Peng, John P. Giesy, Pierre Deymier, and Manish Keswani. 2018. Sono-
chemical treatment of per- and poly-fluoroalkyl compounds in aqueous film-forming foams by use of a large-scale multi- transducer dual-frequency based acoustic reactor. Ultrasonics Sonochemistry 45:213-
222. https://doi.org/10.1016/j.ultsonch.2018.02.014.
Gomez-Ruiz, Beatriz, Sonia Gómez-Lavín, Nazely Diban, Virginie Boiteux, Adeline Colin, Xavier Dauchy, and Ane
Urtiaga. 2017. Efficient electrochemical degradation of poly- and perfluoroalkyl substances (PFASs) from the
effluents of an industrial wastewater treatment plant. Chemical Engineering Journal 322:196-204.
https://doi.org/10.1016/j.cej.2017.04.040.
Gomis, M. I., R. Vestergren, D. Borg, and I. T. Cousins. 2018. Comparing the toxic potency in vivo of long-chain
perfluoroalkyl acids and fluorinated alternatives. Environ Int 113:1-9. 10.1016/j.envint.2018.01.011.
Goosey, Emma, and Stuart Harrad. 2012. Perfluoroalkyl substances in UK indoor and outdoor air: Spatial and
seasonal variation, and implications for human exposure. Environment International 45:86-90. https://doi.org/10.1016/j.envint.2012.04.007.
Gordon, Steven C. 2011. Toxicological evaluation of ammonium 4,8-dioxa-3H-perfluorononanoate, a new
emulsifier to replace ammonium perfluorooctanoate in fluoropolymer manufacturing. Regulatory Toxicology
and Pharmacology 59 (1):64-80. https://doi.org/10.1016/j.yrtph.2010.09.008.
Goss, Kai-Uwe, Guido Bronner, Tom Harner, Monika Hertel, and Torsten C. Schmidt. 2006. The Partition
Behavior of Fluorotelomer Alcohols and Olefins. Environmental Science & Technology 40 (11):3572-3577. 10.1021/es060004.
Goss, Kai-Uwe. 2008. The pKa Values of PFOA and Other Highly Fluorinated Carboxylic Acids. Environmental
Science & Technology 42 (2):456-458. 10.1021/es702192.
Gottschall, N., E. Topp, M. Edwards, M. Payne, S. Kleywegt, and D.R. Lapen. 2017. Brominated flame
retardants and perfluoroalkyl acids in groundwater, tile drainage, soil and crop grain following a high application of municipal biosolids to a field. Science of The Total Environment 574:1345-1359.
Government of Canada. 2005. Addressing psychosocial factors through capacity building: A guide for
managers of contaminated sites. Her majesty the Queen in Right of Canada Minister of Health.
http://publications.gc.ca/collections/collection_2013/sc-hc/H46-2-05-430-eng.pdf
Government of Canada. 2018. Consultation Document on Proposed Amendments to the Prohibition of Certain
Toxic Substances Regulations, 2012 for PFOS, PFOA, LC-PFCAs, HBCD, PBDEs, DP and DBDPE.
https://www.canada.ca/en/environment-climate-change/services/canadian-environmental-protection-act-
registry/pro posed-amendments-certain-toxic-substances-2018-consultation.html.
Government of Western Australia. 2016. Interim Guideline on the Assessment and Management of
Perfluoroalkyl and Polyfluoralkyl Substances (PFAS), Contaminated Sites Guidelines. Department of
Environmental Regulation. https://www.der.wa.gov.au/images/documents/your-environment/contaminated-sites/guidelines/Guideline-on-Assess ment-and-Management-of-PFAS-.pdf
Grasty, R. C., D. C. Wolf, B. E. Grey, C. S. Lau, and J. M. Rogers. 2003. Prenatal window of susceptibility to
perfluorooctane sulfonate-induced neonatal mortality in the Sprague-Dawley rat. Birth Defects Res B Dev Reprod Toxicol 68 (6):465-71. 10.1002/bdrb.10046.
Grasty, R. C., J. A. Bjork, K. B. Wallace, D. C. Wolf, C. S. Lau, and J. M. Rogers. 2005. Effects of prenatal
perfluorooctane sulfonate (PFOS) exposure on lung maturation in the perinatal rat. Birth Defects Res B
Dev Reprod Toxicol 74 (5):405-16. 10.1002/bdrb.20059.
421

Greaves, Alana K., and Robert J. Letcher. 2013. Linear and branched perfluorooctane sulfonate (PFOS) isomer
patterns differ among several tissues and blood of polar bears. Chemosphere 93 (3):574-580.
https://doi.org/10.1016/j.chemosphere.2013.07.013.
Gremmel, Christoph, Tobias Frömel, and Thomas P. Knepper. 2016. Systematic determination of perfluoroalkyl
and polyfluoroalkyl substances (PFASs) in outdoor jackets. Chemosphere 160:173-180.
https://doi.org/10.1016/j.chemosphere.2016.06.043.
Grice, Mira M., Bruce H. Alexander, Richard Hoffbeck, and Diane M. Kampa. 2007. Self-Reported Medical
Conditions in Perfluorooctanesulfonyl Fluoride Manufacturing Workers. Journal of Occupational and
Environmental Medicine 49 (7).
Grieco, S., and R. Edwards. 2019. Thermal desorption to treat PFAS-contaminated soil. CRC Care Clean-
up, Adelaide, South Australia, Sept. 8-12 Abstract No.
Groffen, Thimo, Robin Lasters, Ana Lopez-Antia, Els Prinsen, Lieven Bervoets, and Marcel Eens. 2019. Limited
reproductive impairment in a passerine bird species exposed along a perfluoroalkyl acid (PFAA) pollution
gradient. Science of The Total Environment 652:718-728. https://doi.org/10.1016/j.scitotenv.2018.10.273.
Gronnestad, R., G. D. Villanger, A. Polder, K. M. Kovacs, C. Lydersen, B. M. Jenssen, and K. Borga. 2017.
Maternal transfer of perfluoroalkyl substances in hooded seals. Environmental Toxicology and Chemistry 36 (3):763-770. https://doi.org/10.1002/etc.3623.
Gu, Yurong, Wenyi Dong, Cheng Luo, and Tongzhou Liu. 2016. Efficient Reductive Decomposition of
Perfluorooctanesulfonate in a High Photon Flux UV/Sulfite System. Environmental Science &
Technology 50 (19):10554-10561. 10.1021/acs.est.6b03261.
Guelfo, J. 2017. Development of a user-friendly framework for geospatial identification of potential PFAS source zones. Guelfo, J. L., and C. P. Higgins. 2013. Subsurface Transport Potential of Perfluoroalkyl Acids at
Aqueous Film-Forming Foam (AFFF)-Impacted Sites. Environmental Science & Technology 47 (9):4164-
4171. 10.1021/es3048043.
Guelfo, Jennifer L., Assaf Wunsch, John McCray, John F. Stults, and Christopher P. Higgins. 2020. Subsurface
transport potential of perfluoroalkyl acids (PFAAs): Column experiments and modeling. Journal of
Contaminant Hydrology 233:103661. https://doi.org/10.1016/j.jconhyd.2020.103661.
Guelfo, Jennifer, L., Thomas Marlow, M. Klein David, A. Savitz David, Scott Frickel, Michelle Crimi, and M. Suuberg
Eric. 2018. Evaluation and Management Strategies for Per- and Polyfluoroalkyl Substances (PFASs) in
Drinking Water Aquifers: Perspectives from Impacted U.S. Northeast Communities. Environmental Health
Perspectives 126 (6):065001. 10.1289/EHP2727.
Gui, Duan, Mei Zhang, Tao Zhang, Bo Zhang, Wenzhi Lin, Xian Sun, Xinjian Yu, Wen Liu, and Yuping Wu. 2019. Bioaccumulation behavior and spatiotemporal trends of per- and polyfluoroalkyl
substances in Indo-Pacific humpback dolphins from the Pearl River Estuary, China. Science of The
Total Environment 658:1029-1038. https://doi.org/10.1016/j.scitotenv.2018.12.278.
Guo, Bo, Jicai Zeng, and Mark L. Brusseau. 2020. A Mathematical Model for the Release, Transport, and
Retention of Per- and Polyfluoroalkyl Substances (PFAS) in the Vadose Zone. Water Resources Research
56 (2):e2019WR026667. https://doi.org/10.1029/2019WR026667.
Guo, Wei, Shouliang Huo, Jinglan Feng, and Xiaofei Lu. 2017. Adsorption of perfluorooctane sulfonate
(PFOS) on corn straw-derived biochar prepared at different pyrolytic temperatures. Journal of the
Taiwan Institute of Chemical Engineers 78:265-271. https://doi.org/10.1016/j.jtice.2017.06.013.
Guo, Z., X. Liu, K. Krebs, and N. Roache. 2009. Perfluorocarboxylic Acid Content in 116 Articles of Commerce.
422

Gust, K., N. Vinas, M. Wilbanks, E. Mylroie, C. Cox, A. Kimble, K. Jensen, R. Erickson, G. Ankley, J. Conder, and D.
Moore. 2021. Multigenerational PFOS Exposure in Zebrafish (Danio rerio). Presentation at the Tri-Service
Toxicology Consortium (TSTC) Meeting, February Abstract No.
Gyllenhammar, Irina, Urs Berger, Maria Sundström, Philip McCleaf, Karin Eurén, Sara Eriksson, Sven
Ahlgren, Sanna Lignell, Marie Aune, Natalia Kotova, and Anders Glynn. 2015. Influence of
contaminated drinking water on perfluoroalkyl acid levels in human serum – A case study from Uppsala, Sweden. Environmental Research 140:673-683.
https://doi.org/10.1016/j.envres.2015.05.019.
Gülsever, G., and H. Parlak. 2018. Effects of Perfluorooctane Sulfonate Compounds on the Biochemical
Activities in Mussels (Mytilus galloprovincialis). Ege Journal of Fisheries and Aquatic Sciences 35 (4):417-422. https://doi.org/10.12714/egejfas.2018.35.4.07.
Hadley, Paul W., Ravi Arulanantham, and Deepa Gandhi. 2015. Yardsticks to Integrate Risk
Assessment, Risk Management, and Groundwater Remediation. Remediation Journal 25:9-30.
10.1002/rem.21430.
Hale, J. R. 2016. Distribution of PFOS in Groundwater from AFFF Storage, Handling, and Use. NGWA
Groundwater Solutions: Innovating to Address Emerging Issues in Groundwater Resources Symposium.
Hamid, H., and L. Y. Li. 2016. Role of wastewater treatment plant (WWTP) in environmental cycling of poly- and
perfluoroalkyl (PFAS) compounds. Ecocycles 2:43-53. 10.19040/ecocycles.v2i2.62.
Hamid, H., L. Y. Li, and J. R. Grace. 2018. Review of the fate and transformation of per- and polyfluoroalkyl substances (PFASs) in landfills. Environmental Pollution 235:74-84. 10.1016/j.envpol.2017.12.030.
Han, H., T.A. Snow, R.A. Kemper, and G.W. Jepson. 2003. Binding of perfluorooctanoic acid to rat and human plasma proteins. Chemical Research in Toxicology 16 (6):775-781. https://doi.org/10.1021/tx034005.
Hance, B.J., C. Chess, and P.M. Sandman. 1991. Improving Dialogue with Communities: A Risk Communication Manual for Government. New Jersey Department of Environmental Protection Division of Science and
Research.
Hansen, K. J., H. O. Johnson, J. S. Eldridge, J. L. Butenhoff, and L. A. Dick. 2002. Quantitative Characterization
of Trace Levels of PFOS and PFOA in the Tennessee River. Environmental Science & Technology 36
(8):1681-1685.
10.1021/es010780.
Hanson, M.L., P.K. Sibley, R.A. Brain, S.A. Mabury, and K.R. Solomon. 2005. Microcosm Evaluation of the Toxicity
and Risk to Aquatic Macrophytes from Perfluorooctane Sulfonic Acid. Archives of Environmental Contamination
and Toxicology 48 (3).
Hao, Feifei, Weilin Guo, Anqi Wang, Yanqiu Leng, and Helian Li. 2014. Intensification of sonochemical degradation
of ammonium perfluorooctanoate by persulfate oxidant. Ultrasonics Sonochemistry 21 (2):554-558. https://doi.org/10.1016/j.ultsonch.2013.09.016.
Harada, K. H., and A. Koizumi. 2009. Environmental and biological monitoring of persistent fluorinated
compounds in Japan and their toxicities. Environ Health Prev Med 14 (1):7-19. 10.1007/s12199-008-0058-
5.
Harclerode, Melissa A., Pankaj Lal, Neeraj Vedwan, Bernabas Wolde, and Michael E. Miller. 2016. Evaluation of
the role of risk perception in stakeholder engagement to prevent lead exposure in an urban setting.
Journal of Environmental Management 184:132-142. https://doi.org/10.1016/j.jenvman.2016.07.045.
423

Harclerode, Melissa, Reanne Ridsdale, D. Darmendrail, Paul Bardos, Filip Alexandrescu, Paul Nathanail, Lisa
Pizzol, and Erika Rizzo. 2015. Integrating the Social Dimension in Remediation Decision-Making: State of the Practice and Way Forward. Remediation Journal 26:11-42. 10.1002/rem.21447.
Harclerode, Melissa, Tamzen Macbeth, Michael Miller, Christopher J. Gurr, and Teri S. Myers. 2016. Early decision
framework for integrating sustainable risk management for complex remediation sites: Drivers, barriers,
and performance metrics. Journal of Environmental Management 184 (15):57-66. https://doi.org/10.1016/j.jenvman.2016.07.087.
Harding-Marjanovic, Katie C., Erika F. Houtz, Shan Yi, Jennifer A. Field, David L. Sedlak, and Lisa Alvarez-Cohen.
2015. Aerobic Biotransformation of Fluorotelomer Thioether Amido Sulfonate (Lodyne) in AFFF-Amended Microcosms. Environmental Science & Technology 49 (13):7666-7674. 10.1021/acs.est.5b01219.
Harding-Marjanovic, Katie C., Shan Yi, Tess S. Weathers, Jonathan O. Sharp, David L. Sedlak, and Lisa Alvarez-
Cohen.
2016. Effects of Aqueous Film-Forming Foams (AFFFs) on Trichloroethene (TCE) Dechlorination by a
Dehalococcoides mccartyi-Containing Microbial Community. Environmental Science & Technology 50 (7):3352-3361.
10.1021/acs.est.5b04773.
Hardy, J. 1997. Biological effects of chemicals in the sea-surface microlayer. In The Sea Surface and Global
Change, edited by P. Liss and R. Duce, 339-370. Cambridge: Cambridge University Press. ISBN No. 9780511525025.
Harris, M. W., and L. S. Birnbaum. 1989. Developmental toxicity of perfluorodecanoic acid in C57BL/6N mice. Fundam Appl Toxicol 12 (3):442-8.
Harris, M. W., L. C. Uraih, and L. S. Birnbaum. 1989. Acute toxicity of perfluorodecanoic acid in C57BL/6 mice
differs from 2,3,7,8-tetrachlorodibenzo-p-dioxin. Fundam Appl Toxicol 13 (4):723-36.
Hartten, Andrew S. 2014. Water Treatment of PFOA and PFOS. .
http://www.epa.gov/oppt/pfoa/pubs/Water%20Treatment%20Methods%20Hartten%20Oct16-09.pdf.
Hartwig, K., D. Calleson, and M. Williams. 2006. Unit 1: Community-Based Participatory Research: Getting
Grounded. The Examining Community-Institutional Partnerships for Prevention.
Hatton, Jim, Chase Holton, and Bill DiGuiseppi. 2018. Occurrence and behavior of per- and polyfluoroalkyl
substances from aqueous film-forming foam in groundwater systems. Remediation Journal 28 (2):89-99. 10.1002/rem.21552.
Haug, L. S., S. Huber, G. Becher, and C. Thomsen. 2011. Characterisation of human exposure pathways to
perfluorinated compounds–comparing exposure estimates with biomarkers of exposure. Environ Int 37 (4):687-93.
10.1016/j.envint.2011.01.011.
Haukås, Marianne, Urs Berger, Haakon Hop, Bjørn Gulliksen, and Geir W. Gabrielsen. 2007. Bioaccumulation of per- and polyfluorinated alkyl substances (PFAS) in selected species from the Barents Sea food web.
Environmental Pollution 148 (1):360-371. https://doi.org/10.1016/j.envpol.2006.09.021.
Hayashi, Ryuichi, Hayato Obo, Nozomi Takeuchi, and Koichi Yasuoka. 2015. Decomposition of Perfluorinated
Compounds in Water by DC Plasma within Oxygen Bubbles. Electrical Engineering in Japan 190 (3):9-16. 10.1002/eej.22499.
424

Hayman, Nicholas T., Gunther Rosen, Marienne A. Colvin, Jason Conder, and Jennifer A. Arblaster. 2021. Aquatic
toxicity evaluations of PFOS and PFOA for five standard marine endpoints. Chemosphere 273:129699. https://doi.org/10.1016/j.chemosphere.2021.129699.
Hazelton, Peter, W. Cope, Tamara Pandolfo, Shad Mosher, Mark Strynar, Miles Barnhart, and Robert
Bringolf. 2012. Partial life-cycle and acute toxicity of perfluoroalkyl acids to freshwater mussels.
Environmental toxicology and chemistry / SETAC 31:1611-20. 10.1002/etc.1866.
He, H. P., J. G. Guo, X. D. Xie, and J. L. Peng. 2001. Location and migration of cations in Cu2+-adsorbed
montmorillonite. Environment International 26 (5):347-352. https://doi.org/10.1016/S0160-4120(01)00011-3.
He, W., M. Megharaj, and R. Naidu. 2016. Toxicity of perfluorooctanoic acid towards earthworm and enzymatic activities in soil. Environ Monit Assess 188 (7):424. 10.1007/s10661-016-5416-y.
Hekster, Floris, Remi Laane, and Pim De Voogt. 2003. Environmental and Toxicity Effects of Perfluoroalkylated
Substances. In Reviews of Environmental Contamination and Toxicology, edited by G. Ware, 99-121. Vol.
179. New York, NY: Springer-Verlag. ISBN No. 978-0-387-21731-4.
Hellsing, Maja S., Sarah Josefsson, Arwel V. Hughes, and Lutz Ahrens. 2016. Sorption of perfluoroalkyl
substances to two types of minerals. Chemosphere 159:385-391.
https://doi.org/10.1016/j.chemosphere.2016.06.016.
Helmenstine, A.M. 2018. Hydroxyl Group Definition in Chemistry. ThoughtCo, Last Modified Dec. 5, 2018, Accessed 9-28-19. thoughtco.com/definition-of-hydroxyl-group-608739.
Helmenstine, A.M. 2019. Moiety Definition in Chemistry. ThoughtCo, Accessed 10-5-2019. https://www.thoughtco.com/definition-of-moiety-605357.
Hemat, H., M. Wilhelm, W. Volkel, C. Mosch, H. Fromme, and J. Wittsiepe. 2010. Low serum levels of perfluorooctanoic acid (PFOA), perfluorooctane sulfonate (PFOS) and perfluorohexane sulfonate (PFHxS)
in children and adults from Afghanistan. Sci Total Environ 408 (16):3493-5.
10.1016/j.scitotenv.2010.04.040.
Henry, Barbara J., Joseph P. Carlin, Jon A. Hammerschmidt, Robert Buck, L. William Buxton, Heidelore Fiedler,
Jennifer Seed, and Oscar Hernandez. 2018. A Critical Review of the Application of Polymer of Low Concern
and Regulatory Criteria to Fluoropolymers. Integrated Environmental Assessment and Management 14
(3):316-334. https://doi.org/10.1002/ieam.4035.
HEPA. 2018. PFAS National Environmental Management Plan. Heads of EPAs Australia and New Zealand.
HEPA. 2020. PFAS National Environmental Management Plan Version 2.0. Heads of EPA Australia and New
Zealand. Australian Government Department of the Environment and Energy (DoEE).
Herrick, Robert L., Jeanette Buckholz, Frank M. Biro, Antonia M. Calafat, Xiaoyun Ye, Changchun Xie, and
Susan M. Pinney. 2017. Polyfluoroalkyl substance exposure in the Mid-Ohio River Valley, 1991–2012. Environmental Pollution 228:50-60. https://doi.org/10.1016/j.envpol.2017.04.092.
Herzke, Dorte, Elisabeth Olsson, and Stefan Posner. 2012. Perfluoroalkyl and polyfluoroalkyl substances (PFASs)
in consumer products in Norway – A pilot study. Chemosphere 88 (8):980-987.
https://doi.org/10.1016/j.chemosphere.2012.03.035.
Hickman Jr., H. L. 1999. A Brief History of Solid Waste Management in the US During the Last 50 Years.
MSW Management.
Higgins, C. 2017. Accumulation of Perfluoroalkyl Acids in Food Crops.
425

Higgins, C. P., and R. G. Luthy. 2006. Sorption of Perfluorinated Surfactants on Sediments. Environmental
Science & Technology 40 (23):7251-7256. https://doi.org/10.1021/es061000.
Higgins, Christopher P., and Richard G. Luthy. 2007. Modeling Sorption of Anionic Surfactants onto Sediment
Materials: An a priori Approach for Perfluoroalkyl Surfactants and Linear Alkylbenzene Sulfonates.
Environmental Science & Technology 41 (9):3254-3261. 10.1021/es062449.
Higgins, Christopher P., Jennifer A. Field, Craig S. Criddle, and Richard G. Luthy. 2005. Quantitative
Determination of Perfluorochemicals in Sediments and Domestic Sludge. Environmental Science &
Technology 39 (11):3946-3956. 10.1021/es048245.
Higgins, Christopher P., Pamela B. McLeod, Laura A. MacManus-Spencer, and Richard G. Luthy. 2007.
Bioaccumulation of Perfluorochemicals in Sediments by the Aquatic Oligochaete Lumbriculus variegatus. Environmental Science & Technology 41 (13):4600-4606. 10.1021/es062792.
Hinderliter, P. M., M. P. DeLorme, and G. L. Kennedy. 2006. Perfluorooctanoic acid: relationship between
repeated inhalation exposures and plasma PFOA concentration in the rat. Toxicology 222 (1-2):80-5.
10.1016/j.tox.2006.01.029.
Hoff, P., J. Scheirs, K. Van de Vijver, W.Van Dongen, E. Esmans, R. Blust, and W. De Coen. 2004.
“Biochemical effect evaluation of perfluorooctane sulfonic acid-contaminated wood mice (Apodemus
sylvaticus).” Environmental Health Perspectives 112 (6):681-686.
Hoffman, K., T. F. Webster, S. M. Bartell, M. G. Weisskopf, T. Fletcher, and V. M. Vieira. 2011. Private drinking
water wells as a source of exposure to perfluorooctanoic acid (PFOA) in communities surrounding a
fluoropolymer production facility. Environ Health Perspect 119 (1):92-7. 10.1289/ehp.1002503.
Hogue, C. 2019. The hunt is on for GenX chenicals in people. Chemical & Engineering News 97 (14).
Hohenstein, G. 2016. Overview of Remediation Technologies for PFAS. Emerging Contaminants Summit, March
Abstract No.
Holmquist, H., S. Schellenberger, I. van der Veen, G. M. Peters, P. E. G. Leonards, and I. T. Cousins. 2016.
Properties, performance and associated hazards of state-of-the-art durable water repellent (DWR) chemistry for textile finishing. Environment International 91:251-264. https://doi.org/10.1016/j.envint.2016.02.035.
Hong, Seongjin, Jong Seong Khim, Jinsoon Park, Minhee Kim, Woong-Ki Kim, Jinho Jung, Seunghun Hyun, Jeong-
Gyu Kim, Hyojin Lee, Heeseon J. Choi, Garry Codling, and John P. Giesy. 2013. In situ fate and partitioning of
waterborne perfluoroalkyl acids (PFAAs) in the Youngsan and Nakdong River Estuaries of South Korea.
Science of The Total Environment 445-446:136-145. https://doi.org/10.1016/j.scitotenv.2012.12.040.
Hoover, Gary, Supratik Kar, Samuel Guffey, Jerzy Leszczynski, and Maria S. Sepúlveda. 2019. In vitro and in
silico modeling of perfluoroalkyl substances mixture toxicity in an amphibian fibroblast cell line.
Chemosphere 233:25-33. https://doi.org/10.1016/j.chemosphere.2019.05.065.
Hopkins, William A. 2000. Reptile toxicology: Challenges and opportunities on the last frontier in
vertebrate ecotoxicology. Environmental Toxicology and Chemistry 19 (10):2391-2393. https://doi.org/10.1002/etc.5620191001.
Hopkins, Zachary R., Mei Sun, Jamie C. DeWitt, and Detlef R. U. Knappe. 2018. Recently Detected Drinking Water
Contaminants: GenX and Other Per- and Polyfluoroalkyl Ether Acids. Journal – AWWA 110 (7):13-28.
10.1002/awwa.1073.
Hori, Hisao, Ari Yamamoto, Etsuko Hayakawa, Sachi Taniyasu, Nobuyoshi Yamashita, Shuzo Kutsuna, Hiroshi
Kiatagawa, and Ryuichi Arakawa. 2005. Efficient Decomposition of Environmentally Persistent
Perfluorocarboxylic Acids by Use of Persulfate as a Photochemical Oxidant. Environmental Science &
Technology 39 (7):2383-2388. 10.1021/es0484754. 426

Hori, Hisao, Ari Yamamoto, Kazuhide Koike, Shuzo Kutsuna, Issey Osaka, and Ryuichi Arakawa. 2007.
Photochemical decomposition of environmentally persistent short-chain perfluorocarboxylic acids in water mediated by iron(II)/(III) redox reactions. Chemosphere 68 (3):572-578.
https://doi.org/10.1016/j.chemosphere.2006.12.038.
Hori, Hisao, Etsuko Hayakawa, Hisahiro Einaga, Shuzo Kutsuna, Kazuhide Koike, Takashi Ibusuki, Hiroshi
Kiatagawa, and Ryuichi Arakawa. 2004. Decomposition of Environmentally Persistent Perfluorooctanoic Acid
in Water by Photochemical Approaches. Environmental Science & Technology 38 (22):6118-6124. 10.1021/es049719.
Hori, Hisao, Misako Murayama, Naoko Inoue, Kyoko Ishida, and Shuzo Kutsuna. 2010. Efficient mineralization of
hydroperfluorocarboxylic acids with persulfate in hot water. Catalysis Today 151 (1):131-136.
https://doi.org/10.1016/j.cattod.2010.02.023.
Hori, Hisao, Yuko Takano, Kazuhide Koike, Shuzo Kutsuna, Hisahiro Einaga, and Takashi Ibusuki. 2003.
Photochemical decomposition of pentafluoropropionic acid to fluoride ions with a water-soluble heteropolyacid
photocatalyst. Applied Catalysis B: Environmental 46 (2):333-340. https://doi.org/10.1016/S0926-3373(03)00225-X.
Hori, Hisao, Yumiko Nagaoka, Ari Yamamoto, Taizo Sano, Nobuyoshi Yamashita, Sachi Taniyasu, Shuzo
Kutsuna, Issey Osaka, and Ryuichi Arakawa. 2006. Efficient Decomposition of Environmentally Persistent
Perfluorooctanesulfonate and Related Fluorochemicals Using Zerovalent Iron in Subcritical Water. Environmental Science & Technology 40 (3):1049-1054. 10.1021/es0517419.
Hori, Hisao, Yumiko Nagaoka, Misako Murayama, and Shuzo Kutsuna. 2008. Efficient Decomposition of
Perfluorocarboxylic Acids and Alternative Fluorochemical Surfactants in Hot Water. Environmental
Science & Technology 42 (19):7438-7443. 10.1021/es800832.
Hou, Deyi, Qingbao Gu, Fujun Ma, and Shannon OConnell. 2016. Life cycle assessment comparison of thermal
desorption and stabilization/solidification of mercury contaminated soil on agricultural land. Journal of Cleaner Production 139:949-956. https://doi.org/10.1016/j.jclepro.2016.08.108.
Houde, Magali, Amila De Silva, Derek C G Muir, and Robert Letcher. 2011. Monitoring of Perfluorinated
Compounds in Aquatic Biota: An Updated Review PFCs in Aquatic Biota. Environmental Science & Technology
45 (19):7962-7973. https://doi.org/10.1021/es104326.
Houde, Magali, Gertje Czub, Jeff M. Small, Sean Backus, Xiaowa Wang, Mehran Alaee, and Derek C. G.
Muir. 2008. Fractionation and Bioaccumulation of Perfluorooctane Sulfonate (PFOS) Isomers in a
Lake Ontario Food Web. Environmental Science & Technology 42 (24):9397-9403. 10.1021/es800906.
Houde, Magali, Mélanie Douville, Maeva Giraudo, Keven Jean, Mélanie Lépine, Christine Spencer, and Amila O.
De Silva. 2016. Endocrine-disruption potential of perfluoroethylcyclohexane sulfonate (PFECHS) in chronically exposed Daphnia magna. Environmental Pollution 218:950-956.
https://doi.org/10.1016/j.envpol.2016.08.043.
Houde, Magali, Trevor A. D. Bujas, Jeff Small, Randall S. Wells, Patricia A. Fair, Gregory D. Bossart, Keith R.
Solomon, and Derek C. G. Muir. 2006. Biomagnification of Perfluoroalkyl Compounds in the Bottlenose
Dolphin (Tursiops truncatus) Food Web. Environmental Science & Technology 40 (13):4138-4144. 10.1021/es060233.
Houtz, E., M. Wang, and J. Park. 2018. Identification and Fate of Aqueous Film Forming Foam Derived
Per- and Polyfluoroalkyl Substancesin a Wastewater Treatment Plant. Environmental Science and
Technology 52:13212-13221. 10.1021/acs.est.8b04028.
Houtz, Erika F., and David L. Sedlak. 2012. Oxidative Conversion as a Means of Detecting Precursors to
427

Perfluoroalkyl Acids in Urban Runoff. Environmental Science & Technology 46 (17):9342-9349.
10.1021/es302274.
Houtz, Erika F., Christopher P. Higgins, Jennifer A. Field, and David L. Sedlak. 2013. Persistence of Perfluoroalkyl Acid Precursors in AFFF-Impacted Groundwater and Soil. Environmental Science & Technology 47 (15):8187-
8195. 10.1021/es4018877.
Houtz, Erika F., Rebecca Sutton, June-Soo Park, and Margaret Sedlak. 2016. Poly- and perfluoroalkyl substances in wastewater: Significance of unknown precursors, manufacturing shifts, and likely AFFF
impacts. Water Research 95:142-149. https://doi.org/10.1016/j.watres.2016.02.055.
Howard, Philip H., and Derek C. G. Muir. 2010. Identifying New Persistent and Bioaccumulative Organics
Among Chemicals in Commerce. Environmental Science & Technology 44 (7):2277-2285.
https://doi.org/10.1021/es903383. Hu, Xindi C., David Q. Andrews, Andrew B. Lindstrom, Thomas A. Bruton, Laurel A. Schaider, Philippe
Grandjean, Rainer Lohmann, Courtney C. Carignan, Arlene Blum, Simona A. Balan, Christopher P.
Higgins, and Elsie M. Sunderland. 2016. Detection of Poly- and Perfluoroalkyl Substances (PFASs) in U.S. Drinking Water Linked to Industrial Sites, Military Fire Training Areas, and Wastewater Treatment
Plants. Environmental Science & Technology Letters 3 (10):344-350. 10.1021/acs.estlett.6b00260.
Huang, Jiye, Xi Wang, Zhaoqi Pan, Xukai Li, Yu Ling, and Laisheng Li. 2016. Efficient degradation of
perfluorooctanoic acid (PFOA) by photocatalytic ozonation. Chemical Engineering Journal 296:329-334.
https://doi.org/10.1016/j.cej.2016.03.116.
Huang, Shan, and Peter R. Jaffé. 2019. Defluorination of Perfluorooctanoic Acid (PFOA) and
Perfluorooctane Sulfonate (PFOS) by Acidimicrobium sp. Strain A6. Environmental Science & Technology 53 (19):11410-11419. https://doi.org/10.1021/acs.est.9b04047.
Hurley, M. D., M. P. Sulbaek Andersen, T. J. Wallington, D. A. Ellis, J. W. Martin, and S. A. Mabury. 2004.
Atmospheric Chemistry of Perfluorinated Carboxylic Acids: Reaction with OH Radicals and Atmospheric
Lifetimes. The Journal of Physical Chemistry A 108 (4):615-620. 10.1021/jp036343.
Huset, Carin A., Morton A. Barlaz, Douglas F. Barofsky, and Jennifer A. Field. 2011. Quantitative determination of
fluorochemicals in municipal landfill leachates. Chemosphere 82 (10):1380-1386.
https://doi.org/10.1016/j.chemosphere.2010.11.072.
Hölzer, Jürgen, Oliver Midasch, Knut Rauchfuss, Martin Kraft, Rolf Reupert, Jürgen Angerer, Peter Kleeschulte,
Nina Marschall, and Michael Wilhelm. 2008. Biomonitoring of perfluorinated compounds in children and
adults exposed to perfluorooctanoate-contaminated drinking water. Environmental health perspectives 116 (5):651-657. 10.1289/ehp.11064.
IAP2. 2020. Core Values for Public Participation. International Association for Public Participation.
https://www.iap2.org/page/corevalues.
IAPP. 2006. Planning for Effective Public Participation. www.iap2.org.
IARC. 2016. Some Chemicals Used as Solvents and in Polymer Manufacture. IARC Monographs on the Evaluation of Carcinogenic Risk to Humans 110.
IDQTF. 2005. Uniform Federal Policy for Quality Assurance Project Plans. Evaluating, Assessing, and
Documenting Environmental Data Collection and Use Programs. Part 1: UFP-QAPP Manual. Final, Version 1, March 2005. EPA: EPA-505-B-04-900A, DoD: DTIC ADA 427785.
Institue of Medicine. 2013. Environmental Decisions in the Face of Uncertainty. Washington, D.C.: The National
Academies Press.
428

Inyang, Mandu, and Eric R. V. Dickenson. 2017. The use of carbon adsorbents for the removal of
perfluoroalkyl acids from potable reuse systems. Chemosphere 184:168-175. https://doi.org/10.1016/j.chemosphere.2017.05.161.
IPCS/OECD. 2004. IPCS Risk Assessment Terminology. Geneva. https://www.who.int/ipcs/methods/harmonization/areas/terminology/en/.
IPEN. 2018. POPRC-14, White Paper, Fluorine-free firefighting foams (F3) – Viable alternatives to
fluorinated aqueous film-forming foams (AFFF).
ISO. 2009. Technical Committee (TC) 147, Water quality – Determination of perfluorooctansulfonate (PFOS) and
perfluorooctanoate (PFOA) – Method for unfiltered samples using solid phase extraction and liquid ISO 25101:2009.
ITRC. 2003. An Introduction to Characterizing Sites Contaminated with DNAPLs. ITRC, Dense Nonaqueous Phase Liquids Team.
ITRC. 2005. Examination of Risk-Based Screening Values and Approaches of Selected States. RISK-1.
Washington, D.C.: Interstate Technology & Regulatory Council. https://www.itrcweb.org/GuidanceDocuments/RISK-1.pdf.
ITRC. 2008. Enhanced Attenuation: Chlorinated Organics. Washington D.C.: The Interstate Technology & Regulatory Council. www.itrcweb.org/GuidanceDocuments/EACO-1.pdf.
ITRC. 2010. Technical and Regulatory Guidance Document on Use and Measurement of Mass Flux and Mass
Discharge, MASSFLUX-1.
ITRC. 2011. Green and sustainable remediation: A practical framework. GSR-2.
ITRC. 2011. Green and sustainable remediation: State of the science and practice. GSR-1. Green and Sustainable Remediation Team.
ITRC. 2011. Project Risk Management for Site Remediation. RRM-1.
ITRC. 2012. Using Remediation Risk Management to Address Groundwater Cleanup Challenges at Complex Sites. RRM-2. ITRC. 2013. Groundwater Statistics and Monitoring Compliance, Statistical Tools for the
Project Life Cycle. GSMC-1.
ITRC. 2015. Decision Making at Contaminated Sites: Issues and Options in Human Health Risk Assessment. RISK-3. Washington, D.C.: Interstate Technology and Regulatory Council. https://www.itrcweb.org/risk-3/.
ITRC. 2015. Integrated DNAPL Site Characterization and Tools Selection (ISC-1). .
ITRC. 2016. Geospatial Analysis for Optimization at Environmental Sites (GRO-1). Web-Based Guidance.
ITRC. 2018. LNAPL Site Management: LCSM Evolution, Decision Process, and Remedial Technologies. LNAPL-3. https://lnapl-3.itrcweb.org/
ITRC. 2018. PFAS Fact Sheets PFAS-1. Washington, D. C. www.itrcweb.org.
ITRC. 2018. Stormwater Best Management Practices Performance Evaluation. Washington D.C.: The Interstate Technology & Regulatory Council. https://stormwater-1.itrcweb.org.
ITRC. 2018. TPH Risk Evaluation at Petroleum-Contaminated Sites. TPHRisk-1. Washington, D.C. https://tphrisk-1.itrcweb.org.
ITRC. 2019. Implementing Advanced Site Characterization Tools. ASCT-1. Washington, D.C.: Interstate Technology & Regulatory Council. https://asct-1.itrcweb.org.
429

ITRC. 2020. PFAS Technical and Regulatory Guidance Document and Fact Sheets. PFAS-1. Washington, D.C.:
Interstate Technology & Regulatory Council. https://pfas-1.itrcweb.org.
Iwai, H. 2011. Toxicokinetics of ammonium perfluorohexanoate. Drug Chem Toxicol 34 (4):341-6.
10.3109/01480545.2011.585162.
Iwai, H., and A. M. Hoberman. 2014. Oral (Gavage) Combined Developmental and Perinatal/Postnatal
Reproduction Toxicity Study of Ammonium Salt of Perfluorinated Hexanoic Acid in Mice. Int J Toxicol 33
(3):219-237. 10.1177/1091581814529449.
Izadpanah, Amir, and Asghar Javidnia. 2012. The Ability of a Nanofiltration Membrane to Remove Hardness and Ions from Diluted Seawater. Water 4 (2):283-294. https://doi.org/10.3390/w4020283.
Jahnke, Annika, Jonathan L. Barber, Kevin C. Jones, and Christian Temme. 2009. Quantitative trace
analysis of polyfluorinated alkyl substances (PFAS) in ambient air samples from Mace Head (Ireland): A method intercomparison. Atmospheric Environment 43 (4):844-850.
https://doi.org/10.1016/j.atmosenv.2008.10.049.
Jahnke, Annika, Sandra Huber, Christian Temme, Henrik Kylin, and Urs Berger. 2007. Development and
application of a simplified sampling method for volatile polyfluorinated alkyl substances in indoor and environmental air. Journal of Chromatography A 1164 (1-2):1-9.
https://doi.org/10.1016/j.chroma.2007.06.068.
Jahnke, Annika, Urs Berger, Ralf Ebinghaus, and Christian Temme. 2007. Latitudinal Gradient of Airborne
Polyfluorinated Alkyl Substances in the Marine Atmosphere between Germany and South Africa (53° N−33° S). Environmental Science & Technology 41 (9):3055-3061. https://doi.org/10.1021/es062389.
Ji, K., Y. Kim, S. Oh, B. Ahn, H. Jo, and K. Choi. 2008. Toxicity of perfluorooctane sulfonic acid and
perfluorooctanoic acid on freshwater macroinvertebrates (Daphnia magna and Moina macrocopa) and fish
(Oryzias latipes). Environ Toxicol Chem 27 (10):2159-68. 10.1897/07-523.1.
Jiang, Bo, Jingtang Zheng, Shi Qiu, Mingbo Wu, Qinhui Zhang, Zifeng Yan, and Qingzhong Xue. 2014. Review on electrical discharge plasma technology for wastewater remediation. Chemical Engineering Journal 236:348-
368. https://doi.org/10.1016/j.cej.2013.09.090.
Jiménez-Castañeda, M.E., and D.I. Medina. 2017. Use of surfactant-modified zeolites and clays for the
removal of heavy metals from water. Water 9 (4):235.
Jin, Hangbiao, Guoqiang Shan, Lingyan Zhu, Hongwen Sun, and Yi Luo. 2018. Perfluoroalkyl Acids Including Isomers in Tree Barks from a Chinese Fluorochemical Manufacturing Park: Implication for Airborne
Transportation. Environmental Science & Technology 52 (4):2016-2024. https://doi.org/10.1021/acs.est.7b06241.
Jin, Ling, and Pengyi Zhang. 2015. Photochemical decomposition of perfluorooctane sulfonate (PFOS) in an
anoxic alkaline solution by 185nm vacuum ultraviolet. Chemical Engineering Journal 280:241-247.
https://doi.org/10.1016/j.cej.2015.06.022.
Jin, Ling, Chuanjia Jiang, and Pengyi Zhang. 2017. Photochemical decomposition of 1H,1H,2H,2H-
perfluorooctane sulfonate (6:2FTS) induced by ferric ions. Journal of Environmental Sciences 51:120-127.
https://doi.org/10.1016/j.jes.2016.08.010.
Jin, Ling, Pengyi Zhang, Tian Shao, and Shiliang Zhao. 2014. Ferric ion mediated photodecomposition of
aqueous perfluorooctane sulfonate (PFOS) under UV irradiation and its mechanism. Journal of Hazardous
Materials 271:9-15. https://doi.org/10.1016/j.jhazmat.2014.01.061.
430

Jing, Ping, Patrick J. Rodgers, and Shigeru Amemiya. 2009. High Lipophilicity of Perfluoroalkyl Carboxylate and
Sulfonate: Implications for Their Membrane Permeability. Journal of the American Chemical Society 131 (6):2290-2296. 10.1021/ja807961.
Johansson, J. H., M. E. Salter, J. C. Acosta Navarro, C. Leck, E. D. Nilsson, and I. T. Cousins. 2019. Global transport of perfluoroalkyl acids via sea spray aerosol. Environmental Science: Processes & Impacts 21
(4):635-649. 10.1039/C8EM00525G.
Johansson, Jana H., Hong Yan, Urs Berger, and Ian T. Cousins. 2017. Water-to-air transfer of branched and linear PFOA: Influence of pH, concentration and water type. Emerging Contaminants 3 (1):46-53.
https://doi.org/10.1016/j.emcon.2017.03.001.
Johansson, N., A. Fredriksson, and P. Eriksson. 2008. Neonatal exposure to perfluorooctane sulfonate
(PFOS) and perfluorooctanoic acid (PFOA) causes neurobehavioural defects in adult mice. Neurotoxicology 29 (1):160-9. 10.1016/j.neuro.2007.10.008.
Johnson, J.D., and R. E. Ober. 1979. Absorption of FC-95-14C in rats after a single oral dose. 3M. Submitted
to the U.S. Environmental Protection Agencys Administrative Record. AR226-0007. (cited in ATSDR,
2015).
Johnson, M.S., M.J. Quinn, Jr., M.A. Williams, and A.M. Narizzano. 2021. Understanding Risk to Wildlife from
Exposures to Per- and Polyfluorinated Alkyl Substances (PFAS). Oxford, UK: CRC Press, Taylor and Francis.
ISBN No. 9781003162476.
Johnson, Mark S., Robert C. Buck, Ian T. Cousins, Christopher P. Weis, and Suzanne E. Fenton. 2021.
Estimating Environmental Hazard and Risks from Exposure to Per- and Polyfluoroalkyl Substances (PFASs):
Outcome of a SETAC Focused Topic Meeting. Environmental Toxicology and Chemistry 40 (3):543-549.
https://doi.org/10.1002/etc.4784.
Johnson, P. I., P. Sutton, D. S. Atchley, E. Koustas, J. Lam, S. Sen, K. A. Robinson, D. A. Axelrad, and T. J.
Woodruff. 2014.
The Navigation Guide – evidence-based medicine meets environmental health: systematic review of
human evidence for PFOA effects on fetal growth. Environ Health Perspect 122 (10):1028-39.
10.1289/ehp.1307893.
Johnson, R. L., A. J. Anschutz, J. M. Smolen, M. F. Simcik, and R. L. Penn. 2007. The Adsorption of
Perfluorooctane Sulfonate onto Sand, Clay, and Iron Oxide Surfaces. Journal of Chemical & Engineering Data 52 (4):1165-1170. 10.1021/je060285.
Jones, Paul D., Wenyue Hu, Wim De Coen, John L. Newsted, and John P. Giesy. 2003. Binding of perfluorinated
fatty acids to serum proteins. Environmental Toxicology and Chemistry 22 (11):2639-2649. 10.1897/02-553.
Joo, S.H., and B. Tansel. 2015. Novel technologies for reverse osmosis concentrate treatment: a review. Journal of Environmental Management 150:322-335.
Jovicic, Vojislav, Muhammad Khan, Ana Zbogar – Rasic, Nataliia Fedorova, Alexander Poser, Peter Swoboda, and Antonio Delgado. 2018. Degradation of Low Concentrated Perfluorinated Compounds (PFCs) from
Water Samples Using Non- Thermal Atmospheric Plasma (NTAP). Energies 11. 10.3390/en11051290.
Ju, Xiaodong, Yihe Jin, Kazuaki Sasaki, and Norimitsu Saito. 2008. Perfluorinated Surfactants in Surface,
Subsurface Water and Microlayer from Dalian Coastal Waters in China. Environmental Science &
Technology 42 (10):3538-3542. 10.1021/es703006.
Kabadi, Shruti V., Jeffrey Fisher, Jason Aungst, and Penelope Rice. 2018. Internal exposure-based
pharmacokinetic evaluation of potential for biopersistence of 6:2 fluorotelomer alcohol (FTOH) and its
metabolites. Food and Chemical Toxicology 112:375-382. https://doi.org/10.1016/j.fct.2018.01.012.
431

Kaboré, Hermann A., Sung Vo Duy, Gabriel Munoz, Ladji Méité, Mélanie Desrosiers, Jinxia Liu, Traoré Karim Sory,
and Sébastien Sauvé. 2018. Worldwide drinking water occurrence and levels of newly-identified perfluoroalkyl and polyfluoroalkyl substances. Science of The Total Environment 616-617:1089-1100.
https://doi.org/10.1016/j.scitotenv.2017.10.210.
Kaiser, M. A., C. A. Barton, M. Botelho, R.C. Buck, L. W. Buxton, J. Gannon, C. P. C. Kao, B.S. Larsen, M. H. Russell, N. Wang, and R. L. Waterland. 2006. Understanding the transport of anthropogenic fluorinated
compounds in the environment. Organohalogen Compd 68:675-678.
Kaiser, Mary A., Barbara Dawson, Catherine Barton, and Miguel Botelho. 2010. Understanding Potential
Exposure Sources of Perfluorinated Carboxylic Acids in the Workplace. The Annals of Occupational Hygiene 54 (8):915-22. https://doi.org/10.1093/annhyg/meq066.
Kaiser, Mary A., Barbara S. Larsen, Chien-Ping C. Kao, and Robert C. Buck. 2005. Vapor Pressures of Perfluorooctanoic, - nonanoic, -decanoic, -undecanoic, and -dodecanoic Acids. Journal of Chemical &
Engineering Data 50 (6):1841-1843. 10.1021/je050070.
Kaiser, Mary, Barbara Larsen, Barbara Dawson, Kristine Kurtz, Robert Lieckfield, James Miller, and John Flaherty.
2005.
Method for the Determination of Perfluorooctanoic Acid in Air Samples Using Liquid Chromatography with Mass Spectrometry. 2:307-13. 10.1080/15459620590959713.
Kambala, V.S.R., and R. Naidu. 2013. Amine modified clay sorbents and methods for their use. edited by U.S.
Patent and Trademark Office.
Kannan, Kurunthachalam, Emily Perrotta, and Nancy J. Thomas. 2006. Association between Perfluorinated
Compounds and Pathological Conditions in Southern Sea Otters. Environmental Science & Technology 40 (16):4943-4948.
10.1021/es060932.
Kannan, Kurunthachalam, Lin Tao, Ewan Sinclair, Stephanie D. Pastva, Dave J. Jude, and John P. Giesy. 2005. Perfluorinated Compounds in Aquatic Organisms at Various Trophic Levels in a Great Lakes Food Chain.
Archives of Environmental Contamination and Toxicology 48 (4):559-566. 10.1007/s00244-004-0133-x.
Kannan, Kurunthachalam, Simonetta Corsolini, Jerzy Falandysz, Gilberto Fillmann, Kurunthachalam Senthil Kumar, Bommanna G. Loganathan, Mustafa Ali Mohd, Jesus Olivero, Nathalie Van Wouwe, Jae Ho Yang,
and Kenneth M. Aldous. 2004. Perfluorooctanesulfonate and Related Fluorochemicals in Human Blood from
Several Countries. Environmental Science & Technology 38 (17):4489-4495. 10.1021/es0493446.
Karnjanapiboonwong, Adcharee, Sanjit K. Deb, Seenivasan Subbiah, Degeng Wang, and Todd A. Anderson.
2018.
Perfluoroalkylsulfonic and carboxylic acids in earthworms (Eisenia fetida): Accumulation and effects results
from spiked soils at PFAS concentrations bracketing environmental relevance. Chemosphere 199:168-
173. https://doi.org/10.1016/j.chemosphere.2018.02.027.
Karrman, A., K. Elgh-Dalgren, C. Lafossas, and T. Moskeland. 2011. Environmental levels and distribution of
structural isomers of perfluoroalkyl acids after Aqueous Fire-Fighting Foam (AFFF) contamination. Environmental Chemistry 8:372-380. 10.1071/EN10145.
Kasperson, Roger E., and Jeanne X. Kasperson. 1996. The Social Amplification and Attenuation of Risk. The
ANNALS of the American Academy of Political and Social Science 545 (1):95-105.
10.1177/0002716296545001010.
Kato, H., S. Fujii, M. Takahashi, M. Matsumoto, M. Hirata-Koizumi, A. Ono, and A. Hirose. 2015. Repeated dose and reproductive/developmental toxicity of perfluorododecanoic acid in rats. Environ Toxicol 30 (11):1244-63.
10.1002/tox.21996.
432
Kato, K., A.A. Kalathil, A. M. Patel, X. Ye, and A.M. Calafat. 2018. Per- and Polyfluoroalkyl substances and
fluorinated alternatives in urine and serum by on-line solid phase extraction-liquid chromatography-tandem mass spectrometry. Chemosphere 209:338-345.
Kato, K., X. Ye, and A. M. Calafat. 2015. PFASs in the General Population. In Toxicological Effects of
Perfluoroalkyl and Polyfluoroalkyl Substances, edited by J.C. DeWitt, 151-176. Humana Press. ISBN No.
978-3-319-15517-3.
Kawabata, K., H. Matsuzaki, S. Nukui, M. Okazaki, A. Sakai, Y. Kawashima, and N. Kudo. 2017. Perfluorododecanoic Acid Induces Cognitive Deficit in Adult Rats. Toxicol Sci 157 (2):421-428.
10.1093/toxsci/kfx058.
Kawashima, Y., H. Kobayashi, H. Miura, and H. Kozuka. 1995. Characterization of hepatic responses of rat to administration of perfluorooctanoic and perfluorodecanoic acids at low levels. Toxicology
99 (3):169-78.
Keiter, Su, L. Baumann, H. Färber, H. Holbech, D. Skutlarek, M. Engwall, and T. Braunbeck. 2012. Long-term
effects of a binary mixture of perfluorooctane sulfonate (PFOS) and bisphenol A (BPA) in zebrafish (Danio
rerio). Aquatic Toxicology 118-119:116-129. https://doi.org/10.1016/j.aquatox.2012.04.003.
KEMI. 2004. Perfluorooctane Sulfonate (PFOS) Dossier Prepared in Support for a Nomination of PFOS to the UN-
ECE LRTAP Protocol and the Stockholm Convention. Stockholm Convention, Stockholm, Sweden, August.
KEMI. 2005. Proposal for Listing Perfluorooctane Sulfonate (PFOS) in Annex A of the Stockholm Convention on
Persistent Organic Pollutants.
KEMI. 2015. Chemical analysis of selected fire-fighting foams on the Swedish Market 2014. Swedish Chemicals
Agency, Stockholm.
KEMI. 2015. Occurrence and Use of Highly Fluorinated Substances and Alternatives. Swedish Chemicals Agency, Report 7/15.
KEMI. 2017. The 16 New POPs.
Kemper, R. A., and G. W. Jepson. 2003. Pharmacokinetics of perfluorooctanoic acid in male and female rats.
SOT Annual Meeting Abstract No. 716. https://www.toxicology.org/application/ToxicologistDB/index.aspx.
Kempisty, D., Y. Xing, and L. Racz, eds. 2018. Perfluoroalkyl Substances in the Environment: Theory, Practice and innovation, CRC Press: Taylor & Francis Group. New York. ISBN No. 9780429487125.
Kennedy, G. L., Jr., J. L. Butenhoff, G. W. Olsen, J. C. OConnor, A. M. Seacat, R. G. Perkins, L. B. Biegel, S. R. Murphy, and
D. G. Farrar. 2004. The toxicology of perfluorooctanoate. Crit Rev Toxicol 34 (4):351-84.
Kerfoot, W. B. . 2014. Method and Apparatus for Treating Perfluoroalkyl Compounds. edited by U.S. Patent and
Trademark Office.
Kerfoot, W. B. 2016. Treatment of Emerging Contaminants of Concern with ActivateOzone. Florida
Remediation Conference, Orlando, FL, November 30-December 1.
Khalil, K., Lee, M., and Steenland,K. . 2015. Epidemiological Findings. . In: Toxicological Effects of Perfluoroalkyl and Polyfluoroalkyl Substances. J.D. DeWitt, Editor. Humana Press. pp. 305-335.
Khan, M. Yasir, Sui So, and Gabriel da Silva. 2020. Decomposition kinetics of perfluorinated sulfonic acids. Chemosphere 238:124615. https://doi.org/10.1016/j.chemosphere.2019.124615.
433
Kim, Minhee, Loretta Y. Li, John R. Grace, and Chaoyang Yue. 2014. Selecting reliable physicochemical
properties of perfluoroalkyl and polyfluoroalkyl substances (PFASs) based on molecular descriptors. Environmental Pollution 196:462-472. https://doi.org/10.1016/j.envpol.2014.11.008.
Kim, Minhee, Loretta Y. Li, John R. Grace, and Chaoyang Yue. 2015. Selecting reliable physiochemical
properties of perfluoroalkyl and polyfluoroalkyl substances (PFASs) based on molecular descriptors.
Environmental Pollution 196:462-472.
Kim, Seung-Kyu, and Kurunthachalam Kannan. 2007. Perfluorinated Acids in Air, Rain, Snow, Surface Runoff,
and Lakes: Relative Importance of Pathways to Contamination of Urban Lakes. Environmental Science &
Technology 41 (24):8328-8334. https://doi.org/10.1021/es072107.
Kim, Seung-Kyu, Dong-Hao Li, Mahiba Shoeib, and Kyung-Duk Zoh. 2013. Contribution of diffuse inputs to the
aqueous mass load of perfluoroalkyl acids in river and stream catchments in Korea. Science of The Total Environment
470-471 (1):1430-1440. https://doi.org/10.1016/j.scitotenv.2013.06.040.
Kim, Seung-Kyu, Dong-Hao Li, Mahiba Shoeib, and Kyung-Duk Zoh. 2014. Contribution of diffuse inputs to the
aqueous mass load of perfluoroalkyl acids in river and stream catchments in Korea. Science of The Total Environment
470-471:1430-1440. https://doi.org/10.1016/j.scitotenv.2013.06.040.
Kinney, L. A., N. C. Chromey, and G. L. Kennedy, Jr. 1989. Acute inhalation toxicity of ammonium
perfluorononanoate. Food Chem Toxicol 27 (7):465-8.
Kirchgeorg, T., A. Dreyer, P. Gabrielli, J. Gabrieli, L. G. Thompson, C. Barbante, and R. Ebinghaus. 2016.
Seasonal accumulation of persistent organic pollutants on a high altitude glacier in the Eastern Alps. Environmental Pollution 218:804-812. https://doi.org/10.1016/j.envpol.2016.08.004.
Kirchgeorg, Torben, Annekatrin Dreyer, Jacopo Gabrieli, Natalie Kehrwald, Michael Sigl, Margit Schwikowski, Claude Boutron, Andrea Gambaro, Carlo Barbante, and Ralf Ebinghaus. 2013. Temporal variations of perfluoroalkyl
substances and polybrominated diphenyl ethers in alpine snow. Environmental Pollution 178:367-374.
https://doi.org/10.1016/j.envpol.2013.03.043.
Kirk Pflugh, K., and S. Shannon. 1989. Alternatives to Public Hearing.: New Jersey Department of
Environmental Protection.
Kirk Pflugh, K., and S. Shannon. 1992. Improving Public Participation in Environmental Cases: Lessons for
Agency Outreach Efforts 1991-1992. New Jersey Department of Environmental Protection.
Kirk, M., Kayla Smurthwaite, Jennifer Bräunig, Susan Trevenar, Cate DEste, Robyn Lucas, Aparna Lal,
Rosemary Korda, Archie Clements, Jochen Mueller, Bruce Armstrong,. 2018. The PFAS Health Study – Systematic Literature Review. . Australian National University. .
Kissa, E. . 2001. Fluorinated Surfactants and Repellents, Second Edition Revised and Expanded. Hubbard, A. T.,
Ed.
Surfactant Science Series, New York, New York.
Klassen, C.D. 2013. Casarett and Doulls Toxicology: The Basic Science of Poisons. New York, NY: McGraw-Hill
Education.
ISBN No. 9780071769235.
Klaunig, J. E., M. Shinohara, H. Iwai, C. P. Chengelis, J. B. Kirkpatrick, Z. Wang, and R. H. Bruner. 2015.
Evaluation of the chronic toxicity and carcinogenicity of perfluorohexanoic acid (PFHxA) in Sprague-Dawley
rats. Toxicol Pathol 43 (2):209-20. 10.1177/0192623314530532.
434

Knight, Emma R., Leslie J. Janik, Divina A. Navarro, Rai S. Kookana, and Michael J. McLaughlin. 2019. Predicting
partitioning of radiolabelled 14C-PFOA in a range of soils using diffuse reflectance infrared spectroscopy.
Science of The Total Environment 686:505-513. https://doi.org/10.1016/j.scitotenv.2019.05.339.
Kothawala, Dolly N., Stephan J. Köhler, Anna Östlund, Karin Wiberg, and Lutz Ahrens. 2017. Influence of
dissolved organic matter concentration and composition on the removal efficiency of perfluoroalkyl
substances (PFASs) during drinking water treatment. Water Research 121:320-328.
https://doi.org/10.1016/j.watres.2017.05.047.
Kotthoff, Matthias, Josef Müller, Heinrich Juerling, Martin Schlummer, and Dominik Fiedler. 2015.
Perfluoroalkyl and polyfluoroalkyl substances in consumer products. Environmental Science and
Pollution Research 22:14546-14559. https://doi.org/10.1007/s11356-015-4202-7.
Kovarich, S., E. Papa, J. Li, and P. Gramatica. 2012. QSAR classification models for the screening of the
endocrine- disrupting activity of perfluorinated compounds. SAR and QSAR in Environmental Research 23
(3-4):207-220. https://doi.org/10.1080/1062936X.2012.657235.
Krafft, Marie Pierre, and Jean G. Riess. 2015. Selected physicochemical aspects of poly- and
perfluoroalkylated substances relevant to performance, environment and sustainability—Part one.
Chemosphere 129:4-19. https://doi.org/10.1016/j.chemosphere.2014.08.039.
Kramer, H. J., W. A. van den Ham, W. Slob, and M. N. Pieters. 1996. Conversion Factors Estimating Indicative
Chronic No-
Observed-Adverse-Effect Levels from Short-Term Toxicity Data. Regulatory Toxicology and
Pharmacology 23 (3):249-255. https://doi.org/10.1006/rtph.1996.0050.
Krippner, Johanna, Sandy Falk, Hubertus Brunn, Sebastian Georgii, Sven Schubert, and Thorsten Stahl. 2015. Accumulation Potentials of Perfluoroalkyl Carboxylic Acids (PFCAs) and Perfluoroalkyl Sulfonic Acids (PFSAs) in
Maize (Zea mays). Journal of Agricultural and Food Chemistry 63 (14):3646-3653.
https://doi.org/10.1021/acs.jafc.5b00012.
Krusic, Paul J., Alexander A. Marchione, Fredric Davidson, Mary A. Kaiser, Chien-Ping C. Kao, Raymond E.
Richardson, Miguel Botelho, Robert L. Waterland, and Robert C. Buck. 2005. Vapor Pressure and
Intramolecular Hydrogen Bonding in Fluorotelomer Alcohols. The Journal of Physical Chemistry A 109
(28):6232-6241. 10.1021/jp0502961.
Kudo, N. 2015. Metabolism and Pharmacokinetics. In Toxicological Effects of Perfluoroalkyl and
Polyfluoroalkyl Substances, edited by J. C. DeWitt, 151-76. Humana Press. ISBN No. 978-3-319-15517-3.
Kudo, N., and Y. Kawashima. 2003. Induction of triglyceride accumulation in the liver of rats by perfluorinated
fatty acids with different carbon chain lengths: comparison with induction of peroxisomal beta-oxidation. Biol Pharm Bull 26 (1):47-51.
Kudo, N., E. Suzuki-Nakajima, A. Mitsumoto, and Y. Kawashima. 2006. Responses of the liver to perfluorinated
fatty acids with different carbon chain length in male and female mice:in relation to induction of
hepatomegaly, peroxisomal beta-oxidation and microsomal 1-acylglycerophosphocholine acyltransferase.
Biol Pharm Bull 29 (9):1952-7.
Kupryianchyk, Darya, Sarah E. Hale, Gijs D. Breedveld, and Gerard Cornelissen. 2016. Treatment of sites
contaminated with perfluorinated compounds using biochar amendment. Chemosphere 142:35-40.
https://doi.org/10.1016/j.chemosphere.2015.04.085.
435

Kuykendall, D. C., and A. McMullan. 2014. Using an Environmental Footprint Analysis to Evaluate the Sustainability
of Remedial Alternatives. PE International Conference on Health, Safety, and Environment. Abstract No.
Kwadijk, C. J. A. F., I. Velzeboer, and A. A. Koelmans. 2013. Sorption of perfluorooctane sulfonate to carbon
nanotubes in aquatic sediments. Chemosphere 90 (5):1631-1636. https://doi.org/10.1016/j.chemosphere.2012.08.041.
Kwadijk, C. J. A. F., P. Korytár, and A. A. Koelmans. 2010. Distribution of Perfluorinated Compounds in Aquatic
Systems in The Netherlands. Environmental Science & Technology 44 (10):3746-3751. 10.1021/es100485.
Kwadijk, Christiaan, M. J. J. Kotterman, and Albert Koelmans. 2014. Partitioning of perfluorooctanesulfonate and
perfluorohexanesulfonate in the aquatic environment after an accidental release of Aqueous Film Forming Foam at Schiphol Amsterdam Airport. Environmental Toxicology and Chemistry 33 (8):1761-1765.
https://doi.org/10.1002/etc.2602.
Kwan, W. C. 2001. Physical property determination of perfluorinated surfactants PhD diss. National Library of Canada. Kwiatkowski, Carol F., David Q. Andrews, Linda S. Birnbaum, Thomas A. Bruton, Jamie C. DeWitt,
Detlef R. U. Knappe,
Maricel V. Maffini, Mark F. Miller, Katherine E. Pelch, Anna Reade, Anna Soehl, Xenia Trier, Marta Venier, Charlotte
C. Wagner, Zhanyun Wang, and Arlene Blum. 2020. Scientific Basis for Managing PFAS as a Chemical Class. Environmental Science & Technology Letters 7 (8):532-543. 10.1021/acs.estlett.0c00255.
Kwok, Karen Y., Eriko Yamazaki, Nobuyoshi Yamashita, Sachi Taniyasu, Margaret B. Murphy, Yuichi Horii, Gert
Petrick, Roland Kallerborn, Kurunthachalam Kannan, Kentaro Murano, and Paul K. S. Lam. 2013. Transport of
Perfluoroalkyl substances (PFAS) from an arctic glacier to downstream locations: Implications for sources. Science of The Total Environment 447:46-55. https://doi.org/10.1016/j.scitotenv.2012.10.091.
Kwok, Karen Y., Sachi Taniyasu, Leo W. Y. Yeung, Margaret B. Murphy, Paul K. S. Lam, Yuichi Horii,
Kurunthachalam Kannan, Gert Petrick, Ravindra K. Sinha, and Nobuyoshi Yamashita. 2010. Flux of
Perfluorinated Chemicals through Wet Deposition in Japan, the United States, And Several Other Countries. Environmental Science & Technology 44 (18):7043-7049. 10.1021/es101170.
Kärrman, Anna, Bert van Bavel, Ulf Järnberg, Lennart Hardell, and Gunilla Lindström. 2006. Perfluorinated chemicals in relation to other persistent organic pollutants in human blood. Chemosphere 64 (9):1582-
1591. https://doi.org/10.1016/j.chemosphere.2005.11.040.
Lai, Senchao, Junwei Song, Tianli Song, Zhijiong Huang, Yingyi Zhang, Yan Zhao, Guicheng Liu, Junyu Zheng,
Wenying Mi, Jianhui Tang, Shichun Zou, Ralf Ebinghaus, and Zhiyong Xie. 2016. Neutral polyfluoroalkyl
substances in the atmosphere over the northern South China Sea. Environmental Pollution 214:449-455. https://doi.org/10.1016/j.envpol.2016.04.047.
Lam, J., E. Koustas, P. Sutton, P. I. Johnson, D. S. Atchley, S. Sen, K. A. Robinson, D. A. Axelrad, and T. J.
Woodruff. 2014.
The Navigation Guide – evidence-based medicine meets environmental health: integration of animal and
human evidence for PFOA effects on fetal growth. Environ Health Perspect 122 (10):1040-51.
10.1289/ehp.1307923.
Lam, James C. W., Jinling Lyu, Karen Y. Kwok, and Paul K. S. Lam. 2016. Perfluoroalkyl Substances (PFASs) in
Marine Mammals from the South China Sea and Their Temporal Changes 2002–2014: Concern for
Alternatives of PFOS? Environmental Science & Technology 50 (13):6728-6736. 10.1021/acs.est.5b06076.
Lamb, Dane T., Kartik Venkatraman, Nanthi Bolan, Nanjappa Ashwath, Girish Choppala, and Ravi Naidu. 2014.
Phytocapping: An Alternative Technology for the Sustainable Management of Landfill Sites. Critical Reviews in
Environmental Science and Technology 44 (6):561-637. 10.1080/10643389.2012.728823.
436

Landsteiner, A., C. Huset, J. Johnson, and A. Williams. 2014. Biomonitoring for perfluorochemicals in a
Minnesota community with known drinking water contamination. J Environ Health 77 (5):14-9.
Lang, J. R. 2016. Per- and Polyfluoroalkyl Substances in Municipal Solid Waste and Landfill Leachate. Dr.
Morton A. Barlaz.
Lang, Johnsie R., B. McKay Allred, Graham F. Peaslee, Jennifer A. Field, and Morton A. Barlaz. 2016. Release
of Per- and Polyfluoroalkyl Substances (PFASs) from Carpet and Clothing in Model Anaerobic Landfill Reactors. Environmental Science & Technology 50 (10):5024-5032. 10.1021/acs.est.5b06237.
Lang, Johnsie R., B. McKay Allred, Jennifer A. Field, James W. Levis, and Morton A. Barlaz. 2017. National Estimate
of Per- and Polyfluoroalkyl Substance (PFAS) Release to U.S. Municipal Landfill Leachate. Environmental
Science & Technology 51 (4):2197-2205. 10.1021/acs.est.6b05005.
Lange, Cleston C. 2018. Anaerobic biotransformation of N-methyl perfluorobutanesulfonamido ethanol and N-
ethyl perfluorooctanesulfonamido ethanol. Environmental Toxicology and Chemistry 37 (3):768-779. 10.1002/etc.4014.
Langer, Vera, Annekatrin Dreyer, and Ralf Ebinghaus. 2010. Polyfluorinated Compounds in Residential and Nonresidential Indoor Air. Environmental Science & Technology 44 (21):8075-
8081. 10.1021/es102384.
Langley, A. E., and G. D. Pilcher. 1985. Thyroid, bradycardic and hypothermic effects of perfluoro-n-decanoic acid in rats. J Toxicol Environ Health 15 (3-4):485-91. 10.1080/15287398509530675.
Lanza, Heather A., Rebecca S. Cochran, Joseph F. Mudge, Adric D. Olson, Brett R. Blackwell, Jonathan D.
Maul, Christopher J. Salice, and Todd A. Anderson. 2017. Temporal monitoring of perfluorooctane
sulfonate accumulation in aquatic biota downstream of historical aqueous film forming foam use areas. Environmental Toxicology and Chemistry 36 (8):2022-2029. http://doi.org/10.1002/etc.3726.
LaRoe, S., J. Benaman, D.R. Opdyke, and J.P. Connolly. 2017. Emerging concern about PFOS in freshwater fish:
how bioaccumulative is it? Ninth (9th) International Conference on the Remediation and Management of Contaminated Sediments, New Orleans, LA, January 9 – 12, 2017 Abstract No.
Larson, Emily S., Jason M. Conder, and Jennifer A. Arblaster. 2018. Modeling avian exposures to perfluoroalkyl
substances in aquatic habitats impacted by historical aqueous film forming foam releases. Chemosphere
201:335-341. https://doi.org/10.1016/j.chemosphere.2018.03.004.
Lasier, Peter J., John W. Washington, Sayed M. Hassan, and Thomas M. Jenkins. 2011. Perfluorinated chemicals
in surface waters and sediments from northwest Georgia, USA, and their bioaccumulation in Lumbriculus variegatus.
Environmental Toxicology and Chemistry 30 (10):2194-2201. 10.1002/etc.622.
Lassen, C., Allan Jensen, A Potrykus, Frans Christensen, J. Kjølholt, C. Jeppesen, Sonja Mikkelsen, and S. Innanen. 2013.
Survey of PFOS, PFOA and other perfluoroalkyl and polyfluoroalkyl substances. Part of the LOUS-
Review. Environmental Project No. 1475. Copenhagen.
Lassen, C., J. Kjølholt, Sonja Mikkelsen, M. Warming, Allan Jensen, Rossana Bossi, and I Nielsen. 2015.
Polyfluoroalkyl substances (PFASs) in textiles for children: Survey of chemical substances in consumer products. 136. Copenhagen, Denmark.
Lath, Supriya, Divina A. Navarro, Dusan Losic, Anupama Kumar, and Michael J. McLaughlin. 2018. Sorptive
remediation of perfluorooctanoic acid (PFOA) using mixed mineral and graphene/carbon-based materials.
Environmental Chemistry 15 (8):472-480.
Lau, C. 2012. Perfluorinated compounds. Exp Suppl 101:47-86. 10.1007/978-3-7643-8340-4_3. 437

Lau, C. 2015. Perfluorinated Compounds: An Overview. In Toxicological Effects of Perfluoroalkyl and Polyfluoroalkyl
Substances, edited by J.D. DeWitt. Humana Press. ISBN No. 978-3-319-15517-3.
Lau, C., J. R. Thibodeaux, R. G. Hanson, J. M. Rogers, B. E. Grey, M. E. Stanton, J. L. Butenhoff, and L. A.
Stevenson. 2003. Exposure to perfluorooctane sulfonate during pregnancy in rat and mouse. II: postnatal evaluation. Toxicol Sci 74 (2):382-92. 10.1093/toxsci/kfg122.
Lau, C., J. R. Thibodeaux, R. G. Hanson, M. G. Narotsky, J. M. Rogers, A. B. Lindstrom, and M. J. Strynar. 2006.
Effects of perfluorooctanoic acid exposure during pregnancy in the mouse. Toxicol Sci 90 (2):510-8.
10.1093/toxsci/kfj105.
Lau, Christopher, Katherine Anitole, Colette Hodes, David Lai, Andrea Pfahles-Hutchens, and Jennifer Seed. 2007. Perfluoroalkyl Acids: A Review of Monitoring and Toxicological Findings. Toxicological Sciences 99
(2):366-394. https://doi.org/10.1093/toxsci/kfm128.
Le, Thi Xuan Huong, Holly Haflich, Amisha D. Shah, and Brian P. Chaplin. 2019. Energy-Efficient
Electrochemical Oxidation of Perfluoroalkyl Substances Using a Ti4O7 Reactive Electrochemical Membrane Anode. Environmental Science & Technology Letters 6 (8):504-510.
10.1021/acs.estlett.9b00397.
Lechner, Mareike, and Holger Knapp. 2011. Carryover of Perfluorooctanoic Acid (PFOA) and Perfluorooctane
Sulfonate (PFOS) from Soil to Plant and Distribution to the Different Plant Compartments Studied in Cultures
of Carrots (Daucus carota ssp. Sativus), Potatoes (Solanum tuberosum), and Cucumbers (Cucumis Sativus). Journal of Agricultural and Food Chemistry 59 (20):11011-11018.
https://doi.org/10.1021/jf201355.
Lee, C. K., S. G. Kang, J. T. Lee, S. W. Lee, J. H. Kim, D. H. Kim, B. C. Son, K. H. Kim, C. H. Suh, S. Y. Kim, and Y. B.
Park. 2015. Effects of perfluorooctane sulfuric acid on placental PRL-family hormone production and fetal
growth retardation in mice. Mol Cell Endocrinol 401:165-72. 10.1016/j.mce.2014.10.026.
Lee, Holly, Alex G. Tevlin, Scotia A. Mabury, and Scott A. Mabury. 2014. Fate of Polyfluoroalkyl Phosphate
Diesters and Their Metabolites in Biosolids-Applied Soil: Biodegradation and Plant Uptake in Greenhouse
and Field Experiments. Environmental Science & Technology 48 (1):340-349. https://doi.org/10.1021/es403949.
Lee, Holly, and Scott A. Mabury. 2011. A Pilot Survey of Legacy and Current Commercial Fluorinated Chemicals in
Human Sera from United States Donors in 2009. Environmental Science & Technology 45 (19):8067-8074.
10.1021/es200167.
Lee, Holly, and Scott A. Mabury. 2017. Sorption of Perfluoroalkyl Phosphonates and Perfluoroalkyl Phosphinates in Soils.
Environmental Science & Technology 51 (6):3197-3205. 10.1021/acs.est.6b04395.
Lee, Holly, Jessica Deon, and Scott A. Mabury. 2010. Biodegradation of Polyfluoroalkyl Phosphates as a Source of Perfluorinated Acids to the Environment. Environmental Science & Technology 44 (9):3305-3310.
10.1021/es9028183.
Lee, Jin Wuk, Jae-Woo Lee, Yu-Jin Shin, Ji-Eun Kim, Tae-Kwon Ryu, Jisung Ryu, Jaean Lee, Pilje Kim, Kyunghee
Choi, and Kyunghwa Park. 2017. Multi-generational xenoestrogenic effects of Perfluoroalkyl acids (PFAAs)
mixture on Oryzias latipes using a flow-through exposure system. Chemosphere 169:212-223. https://doi.org/10.1016/j.chemosphere.2016.11.035.
Lee, Yu-Chi, Meng-Jia Chen, C. P. Huang, Jeff Kuo, and Shang-Lien Lo. 2016. Efficient Sonochemical Degradation
of Perfluorooctanoic Acid Using Periodate. Ultrasonics Sonochemistry 31:499-505.
https://doi.org/10.1016/j.ultsonch.2016.01.030.
438
Lee, Yu-Chi, Shang-Lien Lo, Jeff Kuo, and Yi-Ling Lin. 2012. Persulfate oxidation of perfluorooctanoic acid
under the temperatures of 20–40°C. Chemical Engineering Journal 198-199:27-32.
https://doi.org/10.1016/j.cej.2012.05.073.
Lee, Yu-Chi, Shang-Lien Lo, Pei-Te Chiueh, and Der-Guang Chang. 2009. Efficient decomposition of
perfluorocarboxylic acids in aqueous solution using microwave-induced persulfate. Water Research 43
(11):2811-2816. https://doi.org/10.1016/j.watres.2009.03.052.
Lee, Yu-Chi, Shang-Lien Lo, Pei-Te Chiueh, Yau-Hsuan Liou, and Man-Li Chen. 2010. Microwave-
hydrothermal decomposition of perfluorooctanoic acid in water by iron-activated persulfate
oxidation. Water Research 44 (3):886-892. https://doi.org/10.1016/j.watres.2009.09.055.
Lee, Yuchi, Shanglien Lo, Jeff Kuo, and Chinghong Hsieh. 2012. Decomposition of perfluorooctanoic acid by
microwaveactivated persulfate: Effects of temperature, pH, and chloride ions. Frontiers of Environmental
Science & Engineering 6 (1):17-25. 10.1007/s11783-011-0371-x.
LeMasters, Grace K., Ash M. Genaidy, Paul Succop, James Deddens, Tarek Sobeih, Heriberto Barriera-Viruet, Kari Dunning, and James Lockey. 2006. Cancer Risk Among Firefighters: A Review and Meta-
analysis of 32 Studies. Journal of Occupational and Environmental Medicine 48 (11).
Leonard, R. C. . 2003. Epidemiology Surveillance Program. Cancer Incidence Report 1959-2001 and All-Case
Mortality Report 1957-2000 at the Washington Works, Parkersburg, WV. DuPont. USEPA. AR226-1307-6..
Lerner, S. 2016. New Teflon Toxin Causes Cancer in Lab Animals. Last Modified March 3.
accessed 2020. https://theintercept.com/2016/03/03/new-teflon-toxin-causes-cancer-in-lab-animals/.
Lescord, Gretchen L., Karen A. Kidd, Amila O. De Silva, Mary Williamson, Christine Spencer, Xiaowa Wang, and
Derek C. G. Muir. 2015. Perfluorinated and Polyfluorinated Compounds in Lake Food Webs from the Canadian High
Arctic. Environmental Science & Technology 49 (5):2694-2702. https://doi.org/10.1021/es5048649.
Letcher, R. J., J. O. Bustnes, R. Dietz, B. M. Jenssen, E. H. Jorgensen, C. Sonne, J. Verreault, M. M. Vijayan,
and G. W. Gabrielsen. 2010. Exposure and effects assessment of persistent organohalogen contaminants
in arctic wildlife and fish. Sci Total Environ 408 (15):2995-3043. 10.1016/j.scitotenv.2009.10.038.
Letcher, Robert J., Shaogang Chu, and Shirley-Anne Smyth. 2020. Side-chain fluorinated polymer surfactants in
biosolids from wastewater treatment plants. Journal of Hazardous Materials 388:122044. https://doi.org/10.1016/j.jhazmat.2020.122044.
Li, Fei, Xinliang Fang, Zhenming Zhou, Xiaobin Liao, Jing Zou, Baoling Yuan, and Wenjie Sun. 2019. Adsorption
of perfluorinated acids onto soils: Kinetics, isotherms, and influences of soil properties. Science of The
Total Environment 649:504-514. https://doi.org/10.1016/j.scitotenv.2018.08.209.
Li, Hongxia, David Ellis, and Don Mackay. 2007. Measurement of Low Air−Water Partition Coefficients of Organic
Acids by Evaporation from a Water Surface. Journal of Chemical & Engineering Data 52 (5):1580-1584. 10.1021/je600556.
Li, M. H. 2009. Toxicity of perfluorooctane sulfonate and perfluorooctanoic acid to plants and aquatic invertebrates. Environ Toxicol 24 (1):95-101. 10.1002/tox.20396.
Li, Mei-Hui. 2010. Chronic Effects of Perfluorooctane Sulfonate and Ammonium Perfluorooctanoate on
Biochemical Parameters, Survival and Reproduction of Daphnia magna. Journal of Health Science 56:104-
111. 10.1248/jhs.56.104.
439

Li, Xiaona, Shuo Chen, Xie Quan, and Yaobin Zhang. 2011. Enhanced Adsorption of PFOA and PFOS on
Multiwalled Carbon Nanotubes under Electrochemical Assistance. Environmental Science & Technology 45 (19):8498-8505. 10.1021/es202026.
Li, Xuchun, Jun Ma, Guifang Liu, Jingyun Fang, Siyang Yue, Yinghong Guan, Liwei Chen, and Xiaowei Liu. 2012.
Efficient Reductive Dechlorination of Monochloroacetic Acid by Sulfite/UV Process. Environmental Science
& Technology 46 (13):7342-7349. 10.1021/es3008535.
Li, Xuemei, Leo Wai Yin Yeung, Muqi Xu, Sachi Taniyasu, Paul K. S. Lam, Nobuyoshi Yamashita, and Jiayin Dai.
2008. Perfluorooctane sulfonate (PFOS) and other fluorochemicals in fish blood collected near the outfall of wastewater treatment plant (WWTP) in Beijing. Environmental Pollution 156 (3):1298-1303.
https://doi.org/10.1016/j.envpol.2008.03.008.
Li, Y., D. H. Ramdhan, H. Naito, N. Yamagishi, Y. Ito, Y. Hayashi, Y. Yanagiba, A. Okamura, H. Tamada, F. J.
Gonzalez, and T. Nakajima. 2011. Ammonium perfluorooctanoate may cause testosterone reduction by
adversely affecting testis in relation to PPARalpha. Toxicol Lett 205 (3):265-72.
10.1016/j.toxlet.2011.06.015.
Li, Y., T. Fletcher, D. Mucs, K. Scott, C. H. Lindh, P. Tallving, and K. Jakobsson. 2018. Half-lives of PFOS, PFHxS and
PFOA after end of exposure to contaminated drinking water. Occup Environ Med 75 (1):46-51.
10.1136/oemed-2017-104651.
Li, Yasong, Danielle P. Oliver, and Rai S. Kookana. 2018. A critical analysis of published data to discern the
role of soil and sediment properties in determining sorption of per and polyfluoroalkyl substances (PFASs).
Science of The Total Environment 628-629:110-120. https://doi.org/10.1016/j.scitotenv.2018.01.167.
Liang, S. 2017. Enzymatic and electrochemical oxidation of emerging contaminants. Doctoral Dissertation. University of Georgia.
Liang, S., R. D. Pierce Jr, H. Lin, S. Y. Chiang, and Q. J. Huang. 2018. Electrochemical oxidation of PFOA and PFOS in concentrated waste streams. Remediation Journal 28 (2):127-134. 10.1002/rem.21554.
Liang, Xiaoyan, Jianhua Cheng, Cao Yang, and Shewei Yang. 2016. Factors influencing aqueous perfluorooctanoic acid (PFOA) photodecomposition by VUV irradiation in the presence of ferric ions.
Chemical Engineering Journal 298:291-299. https://doi.org/10.1016/j.cej.2016.03.150.
Liao, Zhaohui, and James Farrell. 2009. Electrochemical oxidation of perfluorobutane sulfonate using boron-
doped diamond film electrodes. Journal of Applied Electrochemistry 39:1993-1999.
https://doi.org/10.1007/s10800-009-9909-z.
Lieder, P. H., R. G. York, D. C. Hakes, S. C. Chang, and J. L. Butenhoff. 2009. A two-generation oral gavage
reproduction study with potassium perfluorobutanesulfonate (K+PFBS) in Sprague Dawley rats. Toxicology
259 (1-2):33-45.
10.1016/j.tox.2009.01.027.
Lieder, Paul H., Shu-Ching Chang, Raymond G. York, and John L. Butenhoff. 2009. Toxicological evaluation of
potassium perfluorobutanesulfonate in a 90-day oral gavage study with Sprague–Dawley rats. Toxicology 255
(1):45-52. https://doi.org/10.1016/j.tox.2008.10.002.
Lilienthal, H., H. H. Dieter, J. Holzer, and M. Wilhelm. 2017. Recent experimental results of effects of perfluoroalkyl
substances in laboratory animals – Relation to current regulations and guidance values. Int J Hyg Environ
Health 220 (4):766-775. 10.1016/j.ijheh.2017.03.001.
440

Lin, A. Y.-C., S. C. Panchangam, and C.-C. Lo. 2009. The impact of semiconductor, electronics and
optoelectronic industries on downstream perfluorinated chemical contamination in Taiwanese rivers. Environmental Pollution 157 (4):1365-1372. https://doi.org/10.1016/j.envpol.2008.11.033.
Lin, A. Y.-C., S. C. Panchangam, C.-Y. Chang, P. K. A. Hong, and H.-F. Hsueh. 2012. Removal of perfluorooctanoic
acid and perfluorooctane sulfonate via ozonation under alkaline condition. Journal of Hazardous Materials 243:272-
277. https://doi.org/10.1016/j.jhazmat.2012.10.029.
Lin, A. Y.-C., S. C. Panchangam, Y.-T. Tsai, and T.-H. Yu. 2014. Occurrence of perfluorinated compounds in
the aquatic environment as found in science park effluent, river water, rainwater, sediments, and biotissues.
Environmental Monitoring and Assessment 186 (5):3265-3275. 10.1007/s10661-014-3617-9.
Lin, H., J. Niu, S. Ding, and L. Zhang. 2012. Electrochemical degradation of perfluorooctanoic acid (PFOA) by
Ti/SnO2–Sb, Ti/SnO2–Sb/PbO2 and Ti/SnO2–Sb/MnO2 anodes. Water Research 46 (7):2281-2289.
https://doi.org/10.1016/j.watres.2012.01.053.
Lin, H., Y. Wang, J. Niu, Z. Yue, and Q. Huang. 2015. Efficient Sorption and Removal of Perfluoroalkyl Acids
(PFAAs) from Aqueous Solution by Metal Hydroxides Generated in Situ by Electrocoagulation.
Environmental Science and Technology 49 (17):10562-10569. 10.1021/acs.est.5b02092.
Lin, J.-C., C.-Y. Hu, and S.-L. Lo. 2016. Effect of surfactants on the degradation of perfluorooctanoic acid (PFOA)
by ultrasonic (US) treatment. Ultrasonics Sonochemistry 28:130-135. https://doi.org/10.1016/j.ultsonch.2015.07.007.
Lin, J.-C., S.-L. Lo, C.-Y. Hu, Y.-C. Lee, and J. Kuo. 2015. Enhanced sonochemical degradation of perfluorooctanoic acid by sulfate ions. Ultrasonics Sonochemistry 22:542-547. https://doi.org/10.1016/j.ultsonch.2014.06.006.
Lindell, Michael K., and Seong Nam Hwang. 2008. Households Perceived Personal Risk and Responses in a
Multihazard Environment. Risk Analysis 28 (2):539-556. 10.1111/j.1539-6924.2008.01032.x.
Lindstrom, Andrew B., Mark J. Strynar, Amy D. Delinsky, Shoji F. Nakayama, Larry McMillan, E. Laurence Libelo,
Michael Neill, and Lee Thomas. 2011. Application of WWTP Biosolids and Resulting Perfluorinated Compound Contamination of Surface and Well Water in Decatur, Alabama, USA. Environmental Science &
Technology 45 (19):8015-8021.10.1021/es1039425.
Lindstrom, Andrew B., Mark J. Strynar, and E. Laurence Libelo. 2011. Polyfluorinated Compounds: Past, Present, and Future. Environmental Science & Technology 45 (19):7954-7961. 10.1021/es2011622.
Lipp, P., F. Sacher, and G. Baldauf. 2010. Removal of organic micro-pollutants during drinking water treatment by nanofiltration and reverse osmosis. Desalination and Water Treatment 13 (1-3):226-237.
https://doi.org/10.5004/dwt.2010.1063.
Lipson, D. S., B. Raine, and M. Webb. 2013. Transport of Perluoooctance Sulfonate (PFOS) in Fractured Bedrock
at a Well- Characterized Site. SETAC Europe Conference, Glasglow.
Liss, P., and R. Duce. 1997. The Sea Surface and Global Change. Cambridge: Cambridge University Press. ISBN
No. 9780521562737.
Liu, Baolin, Hong Zhang, Dan Yao, Juying Li, Liuwei Xie, Xinxuan Wang, Yanping Wang, Guoqing Liu, and Bo Yang. 2015. Perfluorinated compounds (PFCs) in the atmosphere of Shenzhen, China: Spatial distribution, sources
and health risk assessment. Chemosphere 138:511-518. https://doi.org/10.1016/j.chemosphere.2015.07.012.
Liu, C. S., C. P. Higgins, F. Wang, and K. Shih. 2012. Effect of temperature on oxidative transformation of
perfluorooctanoic acid (PFOA) by persulfate activation in water. Separation and Purification Technology
91:46-51. https://doi.org/10.1016/j.seppur.2011.09.047.
441

Liu, Changhui, and Karina Yew-Hoong Gin. 2018. Immunotoxicity in green mussels under perfluoroalkyl
substance (PFAS) exposure: Reversible response and response model development. Environmental Toxicology and Chemistry 37 (4):1138-1145. https://doi.org/10.1002/etc.4060.
Liu, Changhui, Karina Y. H. Gin, and Victor W. C. Chang. 2014. Multi-biomarker responses in green mussels
exposed to PFCs: effects at molecular, cellular, and physiological levels. Environmental Science and
Pollution Research 21 (4):2785-2794. 10.1007/s11356-013-2216-6.
Liu, Changhui, Victor W. C. Chang, and Karina Y. H. Gin. 2014. Oxidative toxicity of perfluorinated chemicals in
green mussel and bioaccumulation factor dependent quantitative structure–activity relationship. Environmental Toxicology and Chemistry 33 (10):2323-2332. https://doi.org/10.1002/etc.2679.
Liu, Changhui, Victor W. C. Chang, Karina Y. H. Gin, and Viet Tung Nguyen. 2014. Genotoxicity of perfluorinated
chemicals (PFCs) to the green mussel (Perna viridis). Science of The Total Environment 487:117-122.
https://doi.org/10.1016/j.scitotenv.2014.04.017.
Liu, Charlie J., David Werner, and Christopher Bellona. 2019. Removal of per- and polyfluoroalkyl substances
(PFASs) from contaminated groundwater using granular activated carbon: a pilot-scale study with breakthrough modeling. Environmental Science: Water Research & Technology 5 (11):1844-1853.
10.1039/C9EW00349E.
Liu, Chen, and Jinxia Liu. 2016. Aerobic biotransformation of polyfluoroalkyl phosphate esters (PAPs) in soil.
Environmental Pollution 212:230-237. https://doi.org/10.1016/j.envpol.2016.01.069.
Liu, J., and L. S. Lee. 2007. Effect of Fluorotelomer Alcohol Chain Length on Aqueous Solubility and Sorption by
Soils. Environmental Science & Technology 41 (15):5357-5362. 10.1021/es070228.
Liu, J., J. Li, Y. Zhao, Y. Wang, L. Zhang, and Y. Wu. 2010. The occurrence of perfluorinated alkyl compounds in
human milk from different regions of China. Environ Int 36 (5):433-8. 10.1016/j.envint.2010.03.004.
Liu, Jinxia, and Linda S. Lee. 2005. Solubility and Sorption by Soils of 8:2 Fluorotelomer Alcohol in Water and Cosolvent Systems. Environmental Science & Technology 39 (19):7535-7540. 10.1021/es051125.
Liu, Jinxia, and Sandra Mejia Avendaño. 2013. Microbial degradation of polyfluoroalkyl chemicals in the environment: A review. Environment International 61:98-114. https://doi.org/10.1016/j.envint.2013.08.022.
Liu, Jinxia, Guowei Zhong, Wei Li, and Sandra Mejia Avendaño. 2019. Isomer-specific biotransformation of
perfluoroalkyl sulfonamide compounds in aerobic soil. Science of The Total Environment 651:766-774. https://doi.org/10.1016/j.scitotenv.2018.09.214.
Liu, Jinxia, Linda S. Lee, Loring F. Nies, Cindy H. Nakatsu, and Ronald F. Turco. 2007. Biotransformation of 8:2
Fluorotelomer Alcohol in Soil and by Soil Bacteria Isolates. Environmental Science & Technology 41 (23):8024-8030. 10.1021/es0708722.
Liu, Jinxia, Ning Wang, Bogdan Szostek, Robert C. Buck, Patricia K. Panciroli, Patrick W. Folsom, Lisa M. Sulecki,
and Cheryl A. Bellin. 2010. 6-2 Fluorotelomer alcohol aerobic biodegradation in soil and mixed bacterial culture.
Chemosphere 78 (4):437-444. https://doi.org/10.1016/j.chemosphere.2009.10.044.
Liu, Jinxia, Ning Wang, Robert C. Buck, Barry W. Wolstenholme, Patrick W. Folsom, Lisa M. Sulecki, and Cheryl A. Bellin.
2010. Aerobic biodegradation of [14C] 6:2 fluorotelomer alcohol in a flow-through soil incubation
system. Chemosphere 80 (7):716-723. https://doi.org/10.1016/j.chemosphere.2010.05.027.
442

Liu, W., B. Yang, L. Wu, W. Zou, X. Pan, T. Zou, F. Liu, L. Xia, X. Wang, and D. Zhang. 2015. Involvement of NRF2 in
Perfluorooctanoic Acid-Induced Testicular Damage in Male Mice. Biol Reprod 93 (2):41. 10.1095/biolreprod.115.128819.
Liu, W., Y. Jin, X. Quan, K. Sasaki, N. Saito, S. F. Nakayama, I. Sato, and S. Tsuda. 2009. Perfluorosulfonates and
perfluorocarboxylates in snow and rain in Dalian, China. Environ Int 35 (4):737-42.
10.1016/j.envint.2009.01.016.
Liu, Wanyang, Shengying Chen, Kouji H. Harada, and Akio Koizumi. 2011. Analysis of perfluoroalkyl
carboxylates in vacuum cleaner dust samples in Japan. Chemosphere 85 (11):1734-1741. https://doi.org/10.1016/j.chemosphere.2011.09.024.
Liu, Xiaoyu, Zhishi Guo, Edgar E. Folk, and Nancy Roache. 2014. Determination of fluorotelomer alcohols in
selected consumer products and preliminary investigation of their fate in the indoor environment.
Chemosphere 129:81-86. https://doi.org/10.1016/j.chemosphere.2014.06.012.
Liu, Xiaoyu, Zhishi Guo, Kenneth A. Krebs, Robert H. Pope, and Nancy F. Roache. 2014. Concentrations
and trends of perfluorinated chemicals in potential indoor sources from 2007 through 2011 in the US. Chemosphere 98:51-57. https://doi.org/10.1016/j.chemosphere.2013.10.001.
Liu, Zhaoyang, Yonglong Lu, Tieyu Wang, Pei Wang, Qifeng Li, Andrew C. Johnson, Suriyanarayanan
Sarvajayakesavalu, and Andrew J. Sweetman. 2016. Risk assessment and source identification of
perfluoroalkyl acids in surface and ground water: Spatial distribution around a mega-fluorochemical industrial park, China. Environment International 91:69-77. https://doi.org/10.1016/j.envint.2016.02.020.
Liu, Zhaoyang, Yonglong Lu, Xin Song, Kevin Jones, Andrew J. Sweetman, Andrew C. Johnson, Meng Zhang,
Xiaotian Lu, and Chao Su. 2019. Multiple crop bioaccumulation and human exposure of perfluoroalkyl substances around a mega fluorochemical industrial park, China: Implication for planting optimization and
food safety. Environment International 127:671-684. https://doi.org/10.1016/j.envint.2019.04.008.
Llorca, Marta, Gabriella Schirinzi, Mònica Martínez, Damia Barcelo, and Marinella Farré. 2018. Adsorption of perfluoroalkyl substances on microplastics under environmental conditions. Environmental Pollution
235:680-691. https://doi.org/10.1016/j.envpol.2017.12.075.
Locke, Bruce R., Petr Lukes, and Jean-Louis Brisset. 2012. Elementary Chemical and Physical Phenomena
in Electrical Discharge Plasma in Gas–Liquid Environments and in Liquids. Plasma Chemistry and
Catalysis in Gases and Liquids:185-241. https://doi.org/10.1002/9783527649525.ch6.
Loewen, M., F. Wania, F. Wang, and G. Tomy. 2008. Altitudinal transect of atmospheric and aqueous fluorinated
organic compounds in Western Canada. Environ Sci Technol 42 (7):2374-9.
Lohmann, Rainer, Elena Jurado, Henk A. Dijkstra, and Jordi Dachs. 2013. Vertical eddy diffusion as a key
mechanism for removing perfluorooctanoic acid (PFOA) from the global surface oceans. Environmental Pollution 179:88-94. https://doi.org/10.1016/j.envpol.2013.04.006.
Lohmann, Rainer, Ian T. Cousins, Jamie C. DeWitt, Juliane Glüge, Gretta Goldenman, Dorte Herzke, Andrew B.
Lindstrom, Mark F. Miller, Carla A. Ng, Sharyle Patton, Martin Scheringer, Xenia Trier, and Zhanyun Wang.
2020. Are Fluoropolymers Really of Low Concern for Human and Environmental Health and Separate from
Other PFAS? Environmental Science & Technology 54 (20):12820-12828. 10.1021/acs.est.0c03244.
Loi-Brügger, A., Stefan Panglisch, Grit Hoffmann, P. Buchta, R. Gimbel, and C. J. Nacke. 2008. Removal of trace
organic substances from river bank filtrate – Performance study of RO and NF membranes. 8. 10.2166/ws.2008.021.
443

Long, Y., Y. Wang, G. Ji, L. Yan, F. Hu, and A. Gu. 2013. Neurotoxicity of perfluorooctane sulfonate to hippocampal
cells in adult mice. PLoS One 8 (1):e54176. 10.1371/journal.pone.0054176.
Loos, Robert, Giovanni Locoro, Sara Comero, Serafino Contini, David Schwesig, Friedrich Werres, Peter
Balsaa, Oliver Gans, Stefan Weiss, Ludek Blaha, Monica Bolchi, and Bernd Gawlik. 2010. Pan-European Survey on the Occurrence of Selected Polar Organic Persistent Pollutants in Ground Water. Water
Research 44 (14):4115-4126. https://doi.org/10.1016/j.watres.2010.05.032.
Lorber, M., and P. P. Egeghy. 2011. Simple intake and pharmacokinetic modeling to characterize exposure of Americans to perfluoroctanoic acid, PFOA. Environ Sci Technol 45 (19):8006-14. 10.1021/es103718.
Lorber, M., G. E. Eaglesham, P. Hobson, L. M. L. Toms, J. F. Mueller, and J. S. Thompson. 2015. The effect of
ongoing blood loss on human serum concentrations of perfluorinated acids. Chemosphere 118:170-177. https://doi.org/10.1016/j.chemosphere.2014.07.093.
Loveless, S. E., B. Slezak, T. Serex, J. Lewis, P. Mukerji, J. C. OConnor, E. M. Donner, S. R. Frame, S. H.
Korzeniowski, and
R. C. Buck. 2009. Toxicological evaluation of sodium perfluorohexanoate. Toxicology 264 (1-
2):32-44. 10.1016/j.tox.2009.07.011.
Loveless, S. E., C. Finlay, N. E. Everds, S. R. Frame, P. J. Gillies, J. C. OConnor, C. R. Powley, and G. L. Kennedy.
2006.
Comparative responses of rats and mice exposed to linear/branched, linear, or branched ammonium
perfluorooctanoate (APFO). Toxicology 220 (2-3):203-17. 10.1016/j.tox.2006.01.003.
Loveless, S. E., D. Hoban, G. Sykes, S. R. Frame, and N. E. Everds. 2008. Evaluation of the immune system in rats and mice administered linear ammonium perfluorooctanoate. Toxicol Sci 105 (1):86-96.
10.1093/toxsci/kfn113.
Lu, Dingnan, Sha Sha, Jiayue Luo, Zhuangrong Huang, and Xiaoqi Zhang Jackie. 2020. Treatment train
approaches for the remediation of per- and polyfluoroalkyl substances (PFAS): A critical review. Journal of Hazardous Materials 386:121963. https://doi.org/10.1016/j.jhazmat.2019.121963.
Lu, Guang-hua, Jian-chao Liu, Li-sha Sun, and Lu-jin Yuan. 2015. Toxicity of perfluorononanoic acid and
perfluorooctane sulfonate to Daphnia magna. Water Science and Engineering 8 (1):40-48.
https://doi.org/10.1016/j.wse.2015.01.001.
Lu, Hao, Zhen-min Ma, Xiao Zhang, Peng Jiang, Ming Wen, and Wei-wei Yu. 2017. Source Apportionment of
Perfluorinated Compounds (PFCs) in Shallow Groundwater Around A Fluorine Chemistry Industrial Park in North China. DEStech Transactions on Environment, Energy and Earth Sciences:207-212.
https://doi.org/10.12783/dteees/ese2017/14349.
Lu, S., and S.M. Bartell. 2019. Serum PFAS Calculator for Adults. Version 1.1.
https://www.ics.uci.edu/~sbartell/pfascalc.html.
Lu, Y., B. Luo, J. Li, and J. Dai. 2016. Perfluorooctanoic acid disrupts the blood-testis barrier and activates the
TNFalpha/p38 MAPK signaling pathway in vivo and in vitro. Arch Toxicol 90 (4):971-83. 10.1007/s00204-015-1492-y.
Lucas, R.M., and A.J. McMichael. 2005. Association or causation: evaluating links between environment
and diseasehttps://www.who.int/bulletin/volumes/83/10/792.pdf?ua=1. Bulletin of the World Health Organization 83 (10):792-795.
444
Luebker, D. J., M. T. Case, R. G. York, J. A. Moore, K. J. Hansen, and J. L. Butenhoff. 2005. Two-generation
reproduction and cross-foster studies of perfluorooctanesulfonate (PFOS) in rats. Toxicology 215 (1-2):126-
48. 10.1016/j.tox.2005.07.018.
Luebker, D. J., R. G. York, K. J. Hansen, J. A. Moore, and J. L. Butenhoff. 2005. Neonatal mortality from in utero
exposure to perfluorooctanesulfonate (PFOS) in Sprague-Dawley rats: dose-response, and biochemical
and pharamacokinetic parameters. Toxicology 215 (1-2):149-69. 10.1016/j.tox.2005.07.019.
Lukes, P., A.T. Appleton, and B. R. Locke. 2004. Hydrogen peroxide and ozone formation in hybrid gas-liquid
electrical discharge Reactors. IEEE Transactions on Industry Applications 40 (1):60-67. 10.1109/TIA.2003.821799.
Lukes, P., M. Clupek, V. Babicky, and P. Sunka. 2005. Plasma-Surface Interactions Induced by Pulsed Corona
Discharge in Water. IEEE Conference Record – Abstracts. 2005 IEEE International Conference on Plasma
Science, 20-23 June 2005.
Lundgren, R.E., and A.H. McMakin. 2013. Risk Communication: A Handbook for Communicating Environmental, Safety, and Health Risks, Fifth Edition. Hoboken, NJ: John Wiley & Sons, Inc. ISBN No. 978-1118456934.
Lundgren, R.E., and A.H. McMakin. 2018. Risk Communication: A Handbook for Communicating Environmental, Safety, and Health Risks, 6th Edition. Hoboken, NJ: IEEE Press, John Wiley & Sons, Inc. ISBN No. 978-1-119-
45615-5.
Lundin, J. I., B. H. Alexander, G. W. Olsen, and T. R. Church. 2009. Ammonium perfluorooctanoate production and
occupational mortality. Epidemiology 20 (6):921-8. 10.1097/EDE.0b013e3181b5f395.
Luo, Q. 2015. Degradation of Perfluoroalkyl Acids by Enzyme Catalyzed Oxidative Humification Reactions. University of Georgia, Athens Georgia.
Luo, Qi, Junhe Lu, Hao Zhang, Zunyao Wang, Mingbao Feng, Sheau-Yun Dora Chiang, David Woodward, and Qingguo Huang. 2015. Laccase-Catalyzed Degradation of Perfluorooctanoic Acid. Environmental Science &
Technology Letters 2 (7):198-203. 10.1021/acs.estlett.5b00119.
Lupton, Sara J., Janice K. Huwe, David J. Smith, Kerry L. Dearfield, and John J. Johnston. 2014. Distribution and
Excretion of Perfluorooctane Sulfonate (PFOS) in Beef Cattle (Bos taurus). Journal of Agricultural and Food Chemistry 62 (5):1167-1173. 10.1021/jf404355.
Luz, A. L., J. K. Anderson, P. Goodrum, and J. Durda. 2019. Perfluorohexanoic acid toxicity, part I: development
of a chronic human health toxicity value for use in risk assessment. Regulatory Toxicology and
Pharmacology 103:41-55.
Lv, Z., G. Li, Y. Li, C. Ying, J. Chen, T. Chen, J. Wei, Y. Lin, Y. Jiang, Y. Wang, B. Shu, B. Xu, and S. Xu. 2013.
Glucose and lipid homeostasis in adult rat is impaired by early-life exposure to perfluorooctane sulfonate. Environ Toxicol 28 (9):532-42. 10.1002/tox.20747.
Lyu, Xian-Jin, Wen-Wei Li, Paul K. S. Lam, and Han-Qing Yu. 2015. Boiling significantly promotes photodegradation
of perfluorooctane sulfonate. Chemosphere 138:324-327. https://doi.org/10.1016/j.chemosphere.2015.06.027.
Lyu, Xian-Jin, Wen-Wei Li, Paul K. S. Lam, and Han-Qing Yu. 2015. Insights into perfluorooctane sulfonate photodegradation in a catalyst-free aqueous solution. Scientific Reports 5:9353.
https://doi.org/10.1038/srep09353.
Lyu, Ying, and Mark L. Brusseau. 2020. The influence of solution chemistry on air-water interfacial adsorption and transport of PFOA in unsaturated porous media. Science of The Total Environment 713:136744.
https://doi.org/10.1016/j.scitotenv.2020.136744.
445

Löfstedt Gilljam, John, Juliana Leonel, Ian T. Cousins, and Jonathan P. Benskin. 2016. Is Ongoing Sulfluramid
Use in South America a Significant Source of Perfluorooctanesulfonate (PFOS)? Production Inventories, Environmental Fate, and Local Occurrence. Environmental Science & Technology 50 (2):653-659.
10.1021/acs.est.5b04544.
MA DEP. 2018. Commonwealth Begins Program to Remove Legacy Firefighting Foams from Fire Department
Stockpiles. Massachusetts Department of Environmental Protection.
https://www.mass.gov/news/commonwealth-begins-program-to-remove-legacy-firefighting-foams-from-fire-departme nt
MA DEP. 2018. Interim Guidance on Sampling and Analysis for PFAS at Disposal Sites Regulated
under the Massachusetts Contingency Plan.
Ma, Si-Han, Ming-Hong Wu, Liang Tang, Rui Sun, Chao Zang, Jia-Jia Xiang, Xue-Xia Yang, Xu Li, and Gang Xu. 2017. EB degradation of perfluorooctanoic acid and perfluorooctane sulfonate in aqueous solution. Nuclear
Science and Techniques 28 (9):137. 10.1007/s41365-017-0278-8.
MacDonald, M. M., A. L. Warne, N. L. Stock, S. A. Mabury, K. R. Solomon, and P. K. Sibley. 2004. Toxicity
of perfluorooctane sulfonic acid and perfluorooctanoic acid to Chironomus tentans. Environ Toxicol Chem 23 (9):2116-23. 10.1897/03-449.
Macon, M. B., L. R. Villanueva, K. Tatum-Gibbs, R. D. Zehr, M. J. Strynar, J. P. Stanko, S. S. White, L. Helfant, and
S. E. Fenton. 2011. Prenatal perfluorooctanoic acid exposure in CD-1 mice: low-dose developmental effects and
internal dosimetry. Toxicol Sci 122 (1):134-45. 10.1093/toxsci/kfr076.
Mahinroosta, Reza, and Lalantha Senevirathna. 2020. A review of the emerging treatment technologies for
PFAS contaminated soils. Journal of Environmental Management 255:109896.
https://doi.org/10.1016/j.jenvman.2019.109896.
Maine CDC. 2014. Human health risk-based screening levels for perfluoroalkyl compounds. Maine Center for
Disease Control and Prevention. Department of Health and Human Services.
Mamsen, Linn Salto, Bo A. G. Jönsson, Christian H. Lindh, Rasmus H. Olesen, Agnete Larsen, Erik Ernst,
Thomas W. Kelsey, and Claus Yding Andersen. 2017. Concentration of perfluorinated compounds and cotinine in human foetal organs, placenta, and maternal plasma. Science of The Total Environment 596
(Supplement C):97-105. https://doi.org/10.1016/j.scitotenv.2017.04.058.
MAROS. 2012. Users Guide and Technical Manual Software Version 3.0. GSI Environmental, Inc. Houston, Texas. Marquez, N., R. Steward, C. Lawrence, and J. Kirk. 2016. A Novel Adsorption Product for the Treatment of Per-
and Poly- Fluorinated Alkyl Substances (PFAS) in Wastewater from Airport Fire-training Grounds. Battelle
Conference, Palm Springs, CA Abstract No.
Martin, J. W., D. A. Ellis, S. A. Mabury, M. D. Hurley, and T. J. Wallington. 2006. Atmospheric Chemistry of
Perfluoroalkanesulfonamides: Kinetic and Product Studies of the OH Radical and Cl Atom Initiated Oxidation
of N- Ethyl Perfluorobutanesulfonamide. Environmental Science & Technology 40 (3):864-872. 10.1021/es051362.
Martin, J. W., S. A. Mabury, K. R. Solomon, and D. C. Muir. 2003. Bioconcentration and tissue distribution of
perfluorinated acids in rainbow trout (Oncorhynchus mykiss). Environ Toxicol Chem 22 (1):196-204.
Martin, J. W., S. A. Mabury, K. R. Solomon, and D. C. Muir. 2003. Dietary accumulation of perfluorinated acids in juvenile rainbow trout (Oncorhynchus mykiss). Environ Toxicol Chem 22 (1):189-95.
Martin, J. W., S. A. Mabury, K. R. Solomon, and D. C. Muir. 2013. Progress toward understanding the bioaccumulation of perfluorinated alkyl acids. Environ Toxicol Chem 32 (11):2421-3. 10.1002/etc.2376.
446

Martin, Jonathan W., Brian J. Asher, Sanjay Beesoon, Jonathan P. Benskin, and Matthew S. Ross. 2010. PFOS or
PreFOS? Are perfluorooctane sulfonate precursors (PreFOS) important determinants of human and
environmental perfluorooctane sulfonate (PFOS) exposure? Journal of Environmental Monitoring
12 (11):1979-2004. 10.1039/C0EM00295J.
Martin, Jonathan W., D. Michael Whittle, Derek C. G. Muir, and Scott A. Mabury. 2004. Perfluoroalkyl
Contaminants in a Food Web from Lake Ontario. Environmental Science & Technology 38 (20):5379-5385.
10.1021/es049331.
Martin, Jonathan W., Derek C. G. Muir, Cheryl A. Moody, David A. Ellis, Wai Chi Kwan, Keith R. Solomon, and Scott A. Mabury. 2002. Collection of Airborne Fluorinated Organics and Analysis by Gas
Chromatography/Chemical Ionization Mass Spectrometry. Analytical Chemistry 74 (3):584-590. 10.1021/ac015630.
Martin, Jonathan W., Katie Chan, Scott A. Mabury, and Peter J. OBrien. 2009. Bioactivation of fluorotelomer
alcohols in isolated rat hepatocytes. Chemico-Biological Interactions 177 (3):196-203.
https://doi.org/10.1016/j.cbi.2008.11.001.
Martin, Jonathan W., Scott A. Mabury, and Peter J. OBrien. 2005. Metabolic products and pathways of
fluorotelomer alcohols in isolated rat hepatocytes. Chemico-Biological Interactions 155 (3):165-180. https://doi.org/10.1016/j.cbi.2005.06.007.
Martin, M. T., R. J. Brennan, W. Hu, E. Ayanoglu, C. Lau, H. Ren, C. R. Wood, J. C. Corton, R. J. Kavlock, and D. J.
Dix. 2007.
Toxicogenomic study of triazole fungicides and perfluoroalkyl acids in rat livers predicts toxicity and
categorizes chemicals based on mechanisms of toxicity. Toxicol Sci 97 (2):595-613. 10.1093/toxsci/kfm065.
Marziali, Laura, Federica Rosignoli, Sara Valsecchi, Stefano Polesello, and Fabrizio Stefani. 2019. Effects of
Perfluoralkyl Substances on a Multigenerational Scale: A Case Study with Chironomus riparius (Diptera, Chironomidae). Environmental Toxicology and Chemistry 38 (5):988-999. 10.1002/etc.4392.
Matrix Scientific. Matrix Scientific web page. http://www.matrixscientific.com.
Maul, Gabriel A., Youngwoon Kim, Adib Amini, Qiong Zhang, and Treavor H. Boyer. 2014. Efficiency and
life cycle environmental impacts of ion-exchange regeneration using sodium, potassium, chloride, and
bicarbonate salts. Chemical Engineering Journal 254:198-209. https://doi.org/10.1016/j.cej.2014.05.086.
Mayilswami, S., Krishnan, K., Megharaj, M. and Naidu, R. 2014. Effect of perfluorooctane sulfonate (PFOS) on
survival and DNA damage of earthworm in OECD soil compared to natural soils. Centre for Environmental
Risk Assessment and Remediation (CERAR) and Cooperative Research Centre for Contamination
Assessment and Remediation of the Environment (CRC CARE), Australia.
McCarthy, Chris, William Kappleman, and William DiGuiseppi. 2017. Ecological Considerations of Per- and
Polyfluoroalkyl Substances (PFAS). Current Pollution Reports 3 (4):289-301. https://doi.org/10.1007/s40726-
017-0070-8.
McCarthy, Christopher J., Shaun A. Roark, Demitria Wright, Kelly ONeal, Brett Muckey, Mike Stanaway, Justin
Rewerts, Jennifer Field, Todd Anderson, and Christopher J. Salice. 2021. Toxicological Response of
Chironomus dilutus in Single Chemical and Binary Mixture Exposure Experiments with Six Perfluoralkyl Substances. Environmental Toxicology and Chemistry n/a (n/a). https://doi.org/10.1002/etc.5066.
McCarthy, Christopher, Shaun Roark, and Elizabeth T. Middleton. 2021. Considerations for Toxicity Experiments
and Risk Assessments with PFAS Mixtures. Integrated Environmental Assessment and Management n/a (n/a). https://doi.org/10.1002/ieam.4415.
447

McCleaf, Philip, Sophie Englund, Anna Östlund, Klara Lindegren, Karin Wiberg, and Lutz Ahrens. 2017. Removal
efficiency of multiple poly- and perfluoroalkyl substances (PFASs) in drinking water using granular activated
carbon (GAC) and anion exchange (AE) column tests. Water Research 120:77-87. https://doi.org/10.1016/j.watres.2017.04.057.
McCord, James, and Mark Strynar. 2019. Identification of Per- and Polyfluoroalkyl Substances in the Cape Fear
River by High Resolution Mass Spectrometry and Nontargeted Screening. Environmental Science &
Technology. 10.1021/acs.est.8b06017.
McGregor, Rick. 2018. In Situ treatment of PFAS-impacted groundwater using colloidal activated Carbon.
Remediation Journal 28 (3):33-41. 10.1002/rem.21558.
McGuire, M.E. 2013. An In-Depth Site Characterization of Poly- And Perfluoroalkyl Substances at an Abandoned Fire Protection Training Area. Master of Science Environmental Science and Engineering, Colorado School of
Mines.
McGuire, Meghan E., Charles Schaefer, Trenton Richards, Will J. Backe, Jennifer A. Field, Erika Houtz, David L. Sedlak, Jennifer L. Guelfo, Assaf Wunsch, and Christopher P. Higgins. 2014. Evidence of Remediation-
Induced Alteration of Subsurface Poly- and Perfluoroalkyl Substance Distribution at a Former Firefighter
Training Area. Environmental Science & Technology 48 (12):6644-6652. 10.1021/es5006187.
McKenzie, Erica R., Robert L. Siegrist, John E. McCray, and Christopher P. Higgins. 2015. Effects of Chemical
Oxidants on Perfluoroalkyl Acid Transport in One-Dimensional Porous Media Columns. Environmental
Science & Technology 49 (3):1681-1689. https://doi.org/10.1021/es503676.
McKenzie, Erica, Robert L. Siegrist, John McCray, and Christopher Higgins. 2016. The influence of a non-
aqueous phase liquid (NAPL) and chemical oxidant application on perfluoroalkyl acid (PFAA) fate and transport. Water Research 92:199-207. https://doi.org/10.1016/j.watres.2016.01.025.
McLennon, C. 2018. New Science to Treat PFAS. News article February 18. Katherine Times.
McMurdo, Colin J., David A. Ellis, Eva Webster, Jessica Butler, Rebecca D. Christensen, and Liisa K. Reid. 2008.
Aerosol Enrichment of the Surfactant PFO and Mediation of the Water−Air Transport of Gaseous PFOA. Environmental Science & Technology 42 (11):3969-3974. 10.1021/es7032026.
McNamara, J.D., R. Franco, R. Mimna, and L. Zappa. 2018. Comparison of activated carbons for removal of
perfluorinated compounds from drinking water. Journal – American Water Works Association 110 (1):E2-E14.
MDCH. 2014. Health Consultation: Technical Support Document for Assessment of Perfluorinated Chemicals and
Selection of a Perfluorooctane Sulfonate (PFOS) Reference Dose as the basis for Michigan Fish Consumption Screening Values (FCSVs). Michigan Department of Community Health.
http://www.michigan.gov/documents/mdch/MDCH_PFOS_Health_Consultation_2014_468766_7.pdf
MDCH. 2015. USEPA Great Lakes Restoration Initiative (GLRI) Project. Final Report. Michigan Department of Community Health. https://www.michigan.gov/documents/mdch/MDCH_GL-00E01122-
0_Final_Report_493494_7.pdf.
MDH. 2008. Health Consultation – PFOS Detections in the City of Brainerd, Minnesota. Minnesota Department of Health. https://www.health.state.mn.us/communities/environment/hazardous/docs/pfas/pfosdetectbrainerd.pdf.
MDH. 2009. East Metro Perfluorochemical Biomonitoring Pilot Project. Minnesota Department of Health. http://www.health.state.mn.us/divs/eh/tracking/finalpfcrpt.pdf.
MDH. 2014. Evaluation of Point-of-use Water Treatment Devices for Perfluorochemical Removal. http://www.health.state.mn.us/divs/eh/wells/waterquality/poudevicefinalsummary.pdf.
MDH. 2017. MDH Current Activities: Perfluorochemicals (PFCs) in Minnesota, updated October
448

2017 . MDH. 2017. Toxicological Summary for: Perfluorbutane Sulfonate.
MDH. 2017. Toxicological Summary for: Perfluorooctane Sulfonate. Environmental Health Division Health Risk Assessment Unit.
MDH. 2017. Toxicological Summary for: Perfluorooctanoic Acid. Environmental Health Division Health Risk
Assessment Unit.
MDH. 2018. Toxicological Summary for: Perfluorobutanoate. August. https://www.health.state.mn.us/communities/environment/risk/docs/guidance/gw/pfba2summ.pdf
MDH. 2018. Toxicological Summary for: Perfluorooctanoate. August. https://www.health.state.mn.us/communities/environment/risk/docs/guidance/gw/pfoa.pdf
MDH. 2019. Drinking Water Risk Communication Toolkit Tell Your Story – Connect with People. Last Modified 3/20/2019. accessed 2020. https://www.health.state.mn.us/communities/environment/water/toolkit/story.html.
MDH. 2019. Perfluoroalkyl Substances and Health. St. Paul, MN: Minnesota Department
of Health. https://www.health.state.mn.us/communities/environment/hazardous/docs/pfasheal
th.pdf..
MDH. 2019. Toxicological Summary for: Perfluorooctane Sulfonate. April. https://www.health.state.mn.us/communities/environment/risk/docs/guidance/gw/pfos.pdf
MDH. 2019. Toxicological Summary for: Perfluorohexane Sulfonate. April.
https://www.health.state.mn.us/communities/environment/risk/docs/guidance/gw/pfhxs.pdf
MDHHS. 2019. Van Etten Lake Surface Water and Foam Letter Health Consultation. Department of Health and Human Services State of Michigan.
https://www.michigan.gov/documents/pfasresponse/VEL_Surface_Water_and_Foam_LHC_- 21_May_2019_-
Final_6 55863_7.pdf.
ME DEP. 2016. Maine Remedial Action Guidelines (RAGs) for Sites Contaminated with Hazardous Substances.
Augusta, ME: Bureau of Remediation & Waste Management.
ME DEP. 2019. Memorandum: Requirement to analyze for PFAS compounds. State of Maine Department of Environmental Protection.
https://www.maine.gov/dep/spills/topics/pfas/03222019_Sludge_Memorandum.pdf.
Mejia Avendaño, Sandra, and Jinxia Liu. 2015. Production of PFOS from aerobic soil biotransformation
of two perfluoroalkyl sulfonamide derivatives. Chemosphere 119:1084-1090.
https://doi.org/10.1016/j.chemosphere.2014.09.059.
Mejia-Avendaño, Sandra, Gabriel Munoz, Sébastien Sauvé, and Jinxia Liu. 2017. Assessment of the
Influence of Soil Characteristics and Hydrocarbon Fuel Cocontamination on the Solvent Extraction of Perfluoroalkyl and Polyfluoroalkyl Substances. Analytical Chemistry 89 (4):2539-
2546. 10.1021/acs.analchem.6b04746.
Mejia-Avendaño, Sandra, Sung Vo Duy, Sébastien Sauvé, and Jinxia Liu. 2016. Generation of Perfluoroalkyl Acids from Aerobic Biotransformation of Quaternary Ammonium Polyfluoroalkyl Surfactants. Environmental
Science & Technology 50 (18):9923-9932. 10.1021/acs.est.6b00140.
Mejia-Avendaño, Sandra, Yue Zhi, Bei Yan, and Jinxia Liu. 2020. Sorption of Polyfluoroalkyl Surfactants on
Surface Soils: Effect of Molecular Structures, Soil Properties, and Solution Chemistry. Environmental
Science & Technology 54 (3):1513-1521. https://doi.org/10.1021/acs.est.9b04989.
449

Meng, Pingping, Shubo Deng, Ayiguli Maimaiti, Bin Wang, Jun Huang, Yujue Wang, Ian T. Cousins, and Gang
Yu. 2018. Efficient removal of perfluorooctane sulfonate from aqueous film-forming foam solution by
aeration-foam collection. Chemosphere 203:263-270. https://doi.org/10.1016/j.chemosphere.2018.03.183.
Merino, Nancy, Yan Qu, Rula A. Deeb, Elisabeth L. Hawley, Michael R. Hoffmann, and Shaily Mahendra. 2016.
Degradation and Removal Methods for Perfluoroalkyl and Polyfluoroalkyl Substances in Water. Environmental Engineering Science 33 (9):615-649. 10.1089/ees.2016.0233.
Mertens, J. J., D. W. Sved, G. B. Marit, N. R. Myers, P. L. Stetson, S. R. Murphy, B. Schmit, M. Shinohara, and C. H.
Farr.
2010. Subchronic toxicity of S-111-S-WB in Sprague Dawley rats. Int J Toxicol 29 (4):358-71.
10.1177/1091581810370372.
Mhadhbi, Lazhar, Diego Rial, Sara Pérez, and Ricardo Beiras. 2012. Ecological risk assessment of
perfluorooctanoic acid (PFOA) and perfluorooctanesulfonic acid (PFOS) in marine environment using Isochrysis galbana, Paracentrotus lividus, Siriella armata and Psetta maxima. Journal of Environmental
Monitoring 14 (5):1375-1382.
10.1039/C2EM30037K.
MI DEQ. 2018. General PFAS Sampling Guidance.
https://www.michigan.gov/documents/pfasresponse/General_PFAS_Sampling_Guidance_634597_7.pdf.
MI DEQ. 2018. Reconnaissance sampling of perfluorinated compounds in Michigan suface waters and fish 2010-2014.
Lansing, MI: Michigan Department of Environmental Quality.
MI DEQ. 2018. Surface Water PFAS Sampling Guidance. https://www.michigan.gov/documents/pfasresponse/Surface_Water_PFAS_Sampling_Guidance_639408_7.pdf.
MI DEQ. 2018. Wastewater PFAS Sampling Guidance.
https://www.michigan.gov/documents/deq/deq-tou-wrd-WastewaterPFAS-Sampling_624506_7.pdf.
MI DEQ. 2019. Fish Tissue PFAS Sampling Guidance.
https://www.michigan.gov/documents/pfasresponse/Fish_Tissue_PFAS_Sampling_Guidance_644911_7.pdf.
MI DHHS. 2019. Public Health drinking water screening levels for PFAS. Division of Environmental Health Michigan Department of Health and Human Services.
MI EGLE. 2019. Rule 57 Water Quality Values. Michigan Department of Environment, Great Lakes and Energy,. accessed 2019. https://www.michigan.gov/egle/0,9429,7-135-3313_3681_3686_3728-11383–,00.html.
MI EGLE. 2019. Surface Water Foam PFAS Sampling Guidance. https://www.michigan.gov/documents/pfasresponse/Surface_Water_Foam_PFAS_Sampling_Guidance_+_Quick_R
efere nce_Field_Guide_662168_7.pdf.
MI EGLE. 2020. Perfluoroethylcyclohexane Sulfonfonate (PFECHS). Current Knowledge of Physicochemical
Properties, Environmetnal COntamination and Toxicity. White Paper. Michigan PFAS Action Response Team (MPART) Human Health Workgroup (HHWG) and Michigan Department of Health and Human Services
(MDHHS).
https://www.michigan.gov/documents/pfasresponse/Current_Knowledge_of_Physiochemical_Properties_Environment al_Contamination_and_Toxicity_of_PFECHS_Whitepaper_702591_7.pdf.
MI EGLE. 2021. Surface Water Foam Study Report.
https://www.michigan.gov/documents/pfasresponse/Surface_Water_Foam_Study_Report_-
_AECOM_713003_7.pdf.
450

MI EGLE. 2021. PFAS Sampling Guidance. Michigan PFAS Response Team.
accessed 2021. https://www.michigan.gov/pfasresponse/0,9038,7-365-88059_91297—,00.html.
MI SAW. 2019. Health-Based Drinking Water Value Recommendations for PFAS in Michigan. Lansing, MI: Michigan Science Advisory Workgroup.
Miaz, Luc T., Merle M. Plassmann, Irina Gyllenhammar, Anders Bignert, Oskar Sandblom, Sanna Lignell, Anders Glynn, and Jonathan P. Benskin. 2020. Temporal trends of suspect- and target-
per/polyfluoroalkyl substances (PFAS), extractable organic fluorine (EOF) and total fluorine (TF) in
pooled serum from first-time mothers in Uppsala, Sweden, 1996–2017. Environmental Science: Processes & Impacts 22 (4):1071-1083. https://doi.org/10.1039/C9EM00502A.
Michalik, L., J. Auwerx, J. P. Berger, V. K. Chatterjee, C. K. Glass, F. J. Gonzalez, P. A. Grimaldi, T. Kadowaki, M. A. Lazar, S. ORahilly, C. N. Palmer, J. Plutzky, J. K. Reddy, B. M. Spiegelman, B. Staels, and W. Wahli. 2006.
International Union of Pharmacology. LXI. Peroxisome proliferator-activated receptors. Pharmacol Rev 58
(4):726-41. 10.1124/pr.58.4.5.
Milinovic, J., S. Lacorte, M. Vidal, and A. Rigol. 2015. Sorption behaviour of perfluoroalkyl substances in soils.
Science of The Total Environment 511:63-71. https://doi.org/10.1016/j.scitotenv.2014.12.017.
Mimna, R. 2017. Reactivation of Activated Carbon for PFAS Removal. Calgon Memorandum.
Minata, M., K. H. Harada, A. Karrman, T. Hitomi, M. Hirosawa, M. Murata, F. J. Gonzalez, and A. Koizumi. 2010.
Role of peroxisome proliferator-activated receptor-alpha in hepatobiliary injury induced by ammonium perfluorooctanoate in mouse liver. Ind Health 48 (1):96-107. 10.2486/indhealth.48.96.
Miralles-Marco, Ana, and Stuart Harrad. 2015. Perfluorooctane sulfonate: A review of human exposure,
biomonitoring and the environmental forensics utility of its chirality and isomer distribution. Environment
International 77:148-159. https://doi.org/10.1016/j.envint.2015.02.002.
Mitchell, Shannon M., Mushtaque Ahmad, Amy L. Teel, and Richard J. Watts. 2014. Degradation of
Perfluorooctanoic Acid by Reactive Species Generated through Catalyzed H2O2 Propagation Reactions.
Environmental Science & Technology Letters 1 (1):117-121. 10.1021/ez4000862.
Miteni. 2016. Miteni-Company Profile-History.
Miyake, Yuichi, Nobuyoshi Yamashita, Man Ka So, Pawel Rostkowski, Sachi Taniyasu, Paul K. S. Lam, and
Kurunthachalam Kannan. 2007. Trace analysis of total fluorine in human blood using combustion ion chromatography for fluorine: A mass balance approach for the determination of known and unknown
organofluorine compounds. Journal of Chromatography A 1154 (1):214-221.
https://doi.org/10.1016/j.chroma.2007.03.084.
Miyake, Yuichi, Nobuyoshi Yamashita, Pawel Rostkowski, Man Ka So, Sachi Taniyasu, Paul K. S. Lam, and
Kurunthachalam Kannan. 2007. Determination of trace levels of total fluorine in water using combustion
ion chromatography for fluorine: A mass balance approach to determine individual perfluorinated chemicals in water. Journal of Chromatography A 1143 (1):98-104.
https://doi.org/10.1016/j.chroma.2006.12.071.
Moe, Morten K., Sandra Huber, Johan Svenson, An Hagenaars, Martial Pabon, Monika Trümper, Urs Berger, Dries Knapen, and Dorte Herzke. 2012. The structure of the fire fighting foam surfactant Forafac®1157 and its
biological and photolytic transformation products. Chemosphere 89 (7):869-875.
https://doi.org/10.1016/j.chemosphere.2012.05.012.
451

Mogensen, Ulla B., Philippe Grandjean, Flemming Nielsen, Pal Weihe, and Esben Budtz-Jørgensen. 2015.
Breastfeeding as an Exposure Pathway for Perfluorinated Alkylates. Environmental Science & Technology 49 (17):10466-10473. 10.1021/acs.est.5b02237.
Mohammad Feisal, Rahman. 2015. Removal of Perfluorinated Compounds from Ultrapure and Surface Waters
by Adsorption and Ion Exchange. UWSpace http://hdl.handle.net/10012/9161.
Molina, E. D., R. Balander, S. D. Fitzgerald, J. P. Giesy, K. Kannan, R. Mitchell, and S. J. Bursian. 2006. Effects of air
cell injection of perfluorooctane sulfonate before incubation on development of the white leghorn chicken
(Gallus domesticus) embryo. Environ Toxicol Chem 25 (1):227-32.
Mommaerts, V., A. Hagenaars, J. Meyer, W. De Coen, L. Swevers, H. Mosallanejad, and G. Smagghe. 2011.
Impact of a perfluorinated organic compound PFOS on the terrestrial pollinator Bombus terrestris
(Insecta, Hymenoptera). Ecotoxicology 20 (2):447-56. 10.1007/s10646-011-0596-2.
Moody, C. A., G. N. Hebert, S. H. Strauss, and J. A. Field. 2003. Occurrence and persistence of
perfluorooctanesulfonate and other perfluorinated surfactants in groundwater at a fire-training area at
Wurtsmith Air Force Base, Michigan, USA. J Environ Monit 5 (2):341-5.
Moody, Cheryl A., and Jennifer A. Field. 1999. Determination of Perfluorocarboxylates in Groundwater Impacted
by Fire- Fighting Activity. Environmental Science & Technology 33 (16):2800-2806. 10.1021/es981355+.
Moody, Cheryl A., Jonathan W. Martin, Wai Chi Kwan, Derek C. G. Muir, and Scott A. Mabury. 2002. Monitoring
Perfluorinated Surfactants in Biota and Surface Water Samples Following an Accidental Release of Fire-Fighting Foam into Etobicoke Creek. Environmental Science & Technology 36 (4):545-551.
10.1021/es011001+.
Moriwaki, Hiroshi, Youichi Takagi, Masanobu Tanaka, Kenshiro Tsuruho, Kenji Okitsu, and Yasuaki Maeda. 2005.
Sonochemical Decomposition of Perfluorooctane Sulfonate and Perfluorooctanoic Acid. Environmental
Science & Technology 39 (9):3388-3392. 10.1021/es040342.
Moriwaki, Hiroshi, Yumiko Takatah, and Arakawa Ryuichi. 2003. Concentrations of perfluorooctane sulfonate
(PFOS) and perfluorooctanoic acid (PFOA) in vacuum cleaner dust collected in Japanese homes. Journal
of Environmental Monitoring (5):753-757. https://doi.org/10.1039/B307147M.
Moschet, Christoph, Bonny M. Lew, Simone Hasenbein, Tarun Anumol, and Thomas M. Young. 2017. LC- and GC-
QTOF- MS as Complementary Tools for a Comprehensive Micropollutant Analysis in Aquatic Systems.
Environmental Science & Technology 51 (3):1553-1561. https://doi.org/10.1021/acs.est.6b05352.
MPCA, MI EGLE, WI DNR,. 2019. Foamy Friends Meeting Case Study Presentation Materials via Microsoft Teams.
October 2019 – August 2020.
MPCA. 2007. Surface Water Quality Criterion for Perfluorooctane Sulfonic Acid. STS Project 200604796. St. Paul, MN: Minnesota Pollution Control Agency. https://www.pca.state.mn.us/sites/default/files/pfos-report.pdf.
MPCA. 2010. Aquatic Life Criteria and Water Quality Standards. St. Paul, MN: Minnesota Pollution Control Agency. https://www.pca.state.mn.us/sites/default/files/pfos-lakecalhoun.pdf.
MPCA. 2016. MPCA announces resolution of investigation in PFOS in Lake Calhoun. https://www.pca.state.mn.us/news/mpca-announces-resolution-investigation-pfos-lake-
calhoun.
MPCA. 2017. Perfluorochemical (PFC) Waste Sites.
452

MPCA. 2020. DRAFT Project 1007 Six-Month Investigation Progress Report, Appendix C – Preliminary Foam
Assessment. Prepared by AECOM. https://3msettlement.state.mn.us/sites/default/files/Appendix%20C%20-
%20Preliminary%20Foam%20Assessment_F ullReport.pdf.
MPCA. 2020. Interim fish consumption rate for women of childbearing age. wq-s6-60. Saint Paul, MN: Minnesota Pollution Control Agency. https://www.pca.state.mn.us/sites/default/files/wq-s6-60.pdf.
MPCA. 2020. PFAS foam on surface water. https://www.pca.state.mn.us/waste/pfas-foam-surface-water.
MPCA. 2020. Water Quality Standards Technical Support Document: Human Health Protective Water Quality
Criteria for Perfluorooctane Sulfonate (PFOS). St. Paul, MN: Minnesota Pollution Control Agency.
https://www.pca.state.mn.us/sites/default/files/wq-s6-61a.pdf.
Mudumbi, J. B. N., S. K. O. Ntwampe, M. Muganza, and J. O. Okonkwo. 2014. Susceptibility of Riparian Wetland
Plants to Perfluorooctanoic Acid (PFOA) Accumulation. International Journal of Phytoremediation 16 (9):926-936.
10.1080/15226514.2013.810574.
Mundt, D. J., K. A. Mundt, R. S. Luippold, M. D. Schmidt, and C. H. Farr. 2007. Clinical epidemiological study of employees exposed to surfactant blend containing perfluorononanoic acid. Occup Environ Med 64 (9):589-94.
10.1136/oem.2007.032664.
Munoz, G., L. C. Fechner, E. Geneste, P. Pardon, H. Budzinski, and P. Labadie. 2018. Spatio-temporal dynamics
of per and polyfluoroalkyl substances (PFAS) and transfer to periphytic biofilm in an urban river: case-study
on the River Seine. Environmental Science and Pollution Research 25 (24):23574-23582.
Mussabek, Dauren, Lutz Ahrens, Kenneth M. Persson, and Ronny Berndtsson. 2019. Temporal
trends and sediment–water partitioning of per- and polyfluoroalkyl substances (PFAS) in lake sediment. Chemosphere 227:624-629. https://doi.org/10.1016/j.chemosphere.2019.04.074.
Müller, Claudia E., Amila O. De Silva, Jeff Small, Mary Williamson, Xiaowa Wang, Adam Morris, Sharon Katz, Mary
Gamberg, and Derek C. G. Muir. 2011. Biomagnification of Perfluorinated Compounds in a Remote
Terrestrial Food Chain: Lichen–Caribou–Wolf. Environmental Science & Technology 45 (20):8665-8673.
10.1021/es201353.
Nabb, D. L., B. Szostek, M. W. Himmelstein, M. P. Mawn, M. L. Gargas, L. M. Sweeney, J. C. Stadler, R. C. Buck, and W. J. Fasano. 2007. In vitro metabolism of 8-2 fluorotelomer alcohol: interspecies comparisons and
metabolic pathway refinement. Toxicol Sci 100 (2):333-44. 10.1093/toxsci/kfm230.
Naile, Jonathan E., Jong Seong Khim, Seongjin Hong, Jinsoon Park, Bong-Oh Kwon, Jong Seong Ryu, Jin Hwan
Hwang, Paul
D. Jones, and John P. Giesy. 2013. Distributions and bioconcentration characteristics of perfluorinated compounds in environmental samples collected from the west coast of Korea. Chemosphere 90 (2):387-
394. https://doi.org/10.1016/j.chemosphere.2012.07.033.
Nakagawa, T., D. H. Ramdhan, N. Tanaka, H. Naito, H. Tamada, Y. Ito, Y. Li, Y. Hayashi, N. Yamagishi, Y.
Yanagiba, T. Aoyama, F. J. Gonzalez, and T. Nakajima. 2012. Modulation of ammonium
perfluorooctanoate-induced hepatic damage by genetically different PPARalpha in mice. Arch Toxicol 86
(1):63-74. 10.1007/s00204-011-0704-3.
National Foam. 1996. Material Safety Data Sheet.
National Research Council. 2009. Science and Decisions: Advancing Risk Assessment. Washington, DC: The
National Academies Press. ISBN No. 978-0-309-12046-3.
453

Navarro, Irene, Adrián de la Torre, Paloma Sanz, Javier Pro, Gregoria Carbonell, and María de los Ángeles
Martínez. 2016. Bioaccumulation of emerging organic compounds (perfluoroalkyl substances and halogenated flame retardants) by earthworm in biosolid amended soils. Environmental Research
149:32-39. https://doi.org/10.1016/j.envres.2016.05.004.
Navarro, Irene, Adrián de la Torre, Paloma Sanz, Miguel Ángel Porcel, Javier Pro, Gregoria Carbonell, and María de los Ángeles Martínez. 2017. Uptake of perfluoroalkyl substances and halogenated flame
retardants by crop plants grown in biosolids-amended soils. Environmental Research 152:199-206.
https://doi.org/10.1016/j.envres.2016.10.018.
NAVSEA. 2017. Performance Specification – Fire extinguishing agent, aqueous film-forming foam (AFFF)
liquid concentrate for fresh and sea water. MIL-PRF-24385F(SH) with Amendment 2.
NC DEQ. 2018. Chemours Health Studies..
NC DEQ. 2018. GenX Frequently Asked Questions.. https://files.nc.gov/ncdeq/GenX/SAB/FAQ_updated_021518.pdf. NC DEQ. 2019. Air Quality Sampling.
accessed 2020.
https://deq.nc.gov/news/key-issues/genx-investigation/air-quality-sampling.
NC DEQ. 2019. Chemours Weekly Rainwater Summary.
https://files.nc.gov/ncdeq/GenX/Data/air-sampling/2019-04-09-Chemours-Weekly-Rainwater-summary.pdf.
NC DHHS. 2018. Biological sampling for GenX and other Per- and Polyfluoroalkyl Substances (PFAS) – North
Carolina, 2018. North Carolina Dept. of Health and Human Services. https://epi.dph.ncdhhs.gov/oee/pfas/NCDHHS_PFAS%20Biomonitoring%20Report_8Nov2018.pdf.
NCDENR. 2012. Memorandum. NCSAB Recommendation for the Revision of the IMAC for Perfluorooctanoic Acid
(PFOA). Raleigh, NC: Division of Air Quality.
NEFPA. 2014. Standard for Evaluating Aircraft Rescue and Fire-Fighting Foam Equipment. NFPA 412.
Negri, Eva, Francesca Metruccio, Valentina Guercio, Luca Tosti, Emilio Benfenati, Rossella Bonzi, Carlo La
Vecchia, and Angelo Moretto. 2017. Exposure to PFOA and PFOS and fetal growth: a critical merging of toxicological and epidemiological data. Critical Reviews in Toxicology 47 (6):489-515.
10.1080/10408444.2016.1271972.
NEPC. 2013. National Environment Protection (Assessment of Site Contamination) Measure 1999, Volume 9:
Schedule B6 Guideline On The Framework for Risk-Based Assessment of Groundwater Contamination. Federal Register of Legislative Instruments F2013C00288.
NEPI. 2000. Assessing the Bioavailability of Metals in Soil for Use in Human Health Risk Assessments.
National Environmental Policy Institute.
New York State. 2017. Hazardous Substances Identification, Release Prohibition, and Release Reporting. http://www.dec.ny.gov/regulations/105074.html.
Newsted, J. L., K. K. Coady, S. A. Beach, J. L. Butenhoff, S. Gallagher, and J. P. Giesy. 2007. Effects of
perfluorooctane sulfonate on mallard and northern bobwhite quail exposed chronically via the diet. Environ Toxicol Pharmacol 23 (1):1-9. https://doi.org/10.1016/j.etap.2006.04.008.
Newsted, J. L., P. D. Jones, K. K. Coady, and J. P. Giesy. 2005. Avian Toxicity Reference Values for
Perfluorooctane Sulfonate. Environmental Science & Technology 39 (23):9357-9362.
https://doi.org/10.1021/es050989.
454

Newsted, J. L., S. A. Beach, S. P. Gallagher, and J. P. Giesy. 2008. Acute and chronic effects of
perfluorobutane sulfonate (PFBS) on the mallard and northern bobwhite quail. Arch Environ Contam
Toxicol 54 (3):535-545. https://doi.org/10.1007/s00244-007-9039-8.
Newsted, John L., Susan A. Beach, Sean P. Gallagher, and John P. Giesy. 2006. Pharmacokinetics and Acute
Lethality of Perfluorooctanesulfonate (PFOS) to Juvenile Mallard and Northern Bobwhite. Archives of
Environmental Contamination and Toxicology 50 (3):411-420. https://doi.org/10.1007/s00244-005-1137-x.
Newton, S., R. McMahen, J. A. Stoeckel, M. Chislock, A. Lindstrom, and M. Strynar. 2017. Novel
Polyfluorinated Compounds Identified Using High Resolution Mass Spectrometry Downstream of Manufacturing Facilities near Decatur, Alabama. Environ Sci Technol 51 (3):1544-1552.
10.1021/acs.est.6b05330.
Ney, R.E. 1995. Fate and Transport of Organic Chemicals in the Environment: A Practical Guide, Second Edition.
Rockville, MD: Abs Consulting. ISBN No. 0865874700.
NFPA. 2014. Standard on Selection, Care, and Maintenance of Protective Ensembles for Structural Fire Fighting and Proximity Fire Fighting. In NFPA 1851 Quincy, MA: National Fire Protection Association
https://www.nfpa.org.
NFPA. 2016. Standard for Automotive Fire Apparatus. In NFPA 1901. Quincy, MA: National Fire Protection Association https://www.nfpa.org.
NFPA. 2016. Standard for Low-, Medium-, and High-Expansion Foam. In NFPA 11. Quincy, MA: National Fire Protection Association https://www.nfpa.org.
NFPA. 2017. Standard for the Inspection, Testing, and Maintenance of Water-Based Fire Protection Systems. In NFPA 25.
Quincy, MA: National Fire Protection Association https://www.nfpa.org.
NFPA. 2019. Standard for the Installation of Foam-Water Sprinkler and Foam-Water Spray Systems. In NFPA 16. Quincy, MA: National Fire Protection Association https://www.nfpa.org.
NFPA. 2020. Standard for Evaluating Aircraft Rescue and Fire-Fighting Foam Equipment. In NFPA 412. Quincy,
MA: National Fire Protection Association https://www.nfpa.org.
Ng, Carla A., and Konrad Hungerbühler. 2013. Bioconcentration of Perfluorinated Alkyl Acids: How Important Is
Specific Binding? Environmental Science & Technology 47 (13):7214-7223. 10.1021/es400981.
Ng, Carla A., and Konrad Hungerbühler. 2014. Bioaccumulation of Perfluorinated Alkyl Acids: Observations and
Models. Environmental Science & Technology 48 (9):4637-4648. 10.1021/es404008.
NGWA. 2017. Groundwater and PFAS: State of Knowledge and Practice. Westerville, OH: National Groundwater
Association. http://www.ngwa.org/Professional-Resources/Pages/Groundwater-and-PFAS.aspx.
NH DES. 2016. New Hampshire Code of Administrative Rules. Chapter Env-A 1400 Regulated Toxic Air Pollutants. https://www.des.nh.gov/organization/commissioner/legal/rules/documents/env-a1400.pdf.
NH DES. 2016. Status and trends of mercury in fish tissue in New Hampshire waterbodies, 1992–2016.
Concord, NH: New Hampshire Department of Environmental Services. https://www.des.nh.gov/organization/commissioner/pip/publications/documents/r-wd-17-22.pdf.
NH DES. 2017. On-line GIS application, PFAS Sampling Results. New Hampshire Department of Environmental
Services.
http://nhdes.maps.arcgis.com/apps/View/index.html?appid=66770bef141c43a98a445c54a17720e2andextent=-73.5 743,42.5413,-69.6852,45.4489
455

NH DES. 2019. Air Emissions Monitoring for Stationary Sources. accessed 2020.
https://www.des.nh.gov/organization/divisions/air/cb/cmdps/tms/index.htm.
NH DES. 2019. Laboratory Testing Guidelines for Per- and Polyfluoroalkyl Substances (PFAS) at Waste Sites.
NH DES. 2019. Plan to Generate PFAS Surface Water Quality Standards. Concord, NH: New Hampshire Department of Environmental Services.
https://www.des.nh.gov/organization/divisions/water/wmb/wqs/documents/r-wd-19-30.pdf.
NH DES. 2020. NH PFAS Investigation. Public Water System Results. accessed 2020. https://www4.des.state.nh.us/nh-pfas-
investigation/?page_id=826.
NH DHHS. 2015. Perfluorochemical (PFC) Testing Program: Summary of test results for children <12 y.o. New Hampshire Dept. of Health and Human Services. http://www.dhhs.nh.gov/dphs/documents/pediatric-results-
presentation.pdf
NH DHHS. 2016. Pease PFC Blood Testing Program: April 2015 – October 2015.
NH DHHS. 2017. Summary of the New Hamphire Department of Health and Human Services Perfluorochemical
(PFC) Blood Testing Program, 2016-2017. https://www.dhhs.nh.gov/dphs/pfcs/documents/results-summary.pdf.
NH DHHS. 2018. Additional PFAS Resources. https://www.dhhs.nh.gov/dphs/pfcs/pfc-resources.htm.
Nickelsen, M. G., and S.E. Woodard. 2017. A sustainable system and method for removing and concentrating
per-and polyfluoroalkyl substances (PFAS) from water. edited by U.S. Patent and Trademark Office.
NICNAS. 2018. Per- and poly-fluorinated substances (PFAS). . Australian Government Department of Health. .
Nilsson, H., A. Karrman, A. Rotander, B. van Bavel, G. Lindstrom, and H. Westberg. 2013. Professional ski
waxers exposure to PFAS and aerosol concentrations in gas phase and different particle size fractions. Environ Sci Process Impacts 15 (4):814-22. 10.1039/c3em30739.
Nilsson, H., A. Karrman, H. Westberg, A. Rotander, B. van Bavel, and G. Lindstrom. 2010. A time trend study of
significantly elevated perfluorocarboxylate levels in humans after using fluorinated ski wax. Environ Sci
Technol 44 (6):2150-5. 10.1021/es9034733.
Niu, Junfeng, Hui Lin, Chen Gong, and Xiaomin Sun. 2013. Theoretical and Experimental Insights into the
Electrochemical Mineralization Mechanism of Perfluorooctanoic Acid. Environmental Science & Technology 47 (24):14341-14349.
10.1021/es402987.
Niu, Junfeng, Hui Lin, Jiale Xu, Hao Wu, and Yangyang Li. 2012. Electrochemical Mineralization of Perfluorocarboxylic Acids (PFCAs) by Ce-Doped Modified Porous Nanocrystalline PbO2 Film Electrode.
Environmental Science & Technology 46 (18):10191-10198. 10.1021/es302148.
Niu, Junfeng, Yang Li, Enxiang Shang, Zesheng Xu, and Jinzi Liu. 2016. Electrochemical oxidation of
perfluorinated compounds in water. Chemosphere 146:526-538.
https://doi.org/10.1016/j.chemosphere.2015.11.115.
NJDEP. 2014. Establishing Dialogue: Planning for Successful Environmental Management. New Jersey
Department of Environmental Protection.
NJDEP. 2014. Occurrence of Perfluorinated Chemicals in Untreated New Jersey Drinking Water Sources. New
Jersey Department of Environmental Protection.
456

NJDEP. 2018. Investigation of levels of perfluorinated compounds in New Jersey fish, surface water, and
sediment (Updated 4/8/2019). SR15-010: Division of Science New Jersey Department of Environmental Protection, Research, and Environmental Health.
NJDWQI. 2015. Health-Based Maximum Contaminant Level Support Document: Perfluorononanoic Acid (PFNA).
New Jersey Drinking Water Quality Institute.
NJDWQI. 2017. Health-Based Maximum Contaminant Level Support Document: Perfluorooctanoic Acid (PFOA). http://www.nj.gov/dep/watersupply/pdf/pfoa-appendix.pdf.
NJDWQI. 2017. Maximum Contaminant Level Recommendation for Perfluorooctanoic Acid in Drinking Water, Basis and Background.
NJDWQI. 2017. Maximum Contaminant Level Recommendation for Perfluorooctanoic Acid in Drinking Water, Basis and Background. Appendices A, B, C and D.
NJDWQI. 2018. Health-Based Maximum Contaminant Level Support Document: Perfluorooctane Sulfonate
(PFOS). New Jersey Drinking Water Quality Institute.
NJDWQI. 2018. Maximum Contaminant Level Recommendation for Perfluorooctane Sulfonate in Drinking
Water.. Noker, P. E. 2001. A pharmacokinetic study of potassium perfluorohexanoate in the cynomolgus monkey. Southern Research Institute.
Norden, M., U. Berger, and M. Engwall. 2016. Developmental toxicity of PFOS and PFOA in great cormorant
(Phalacrocorax carbo sinensis), herring gull (Larus argentatus) and chicken (Gallus gallus domesticus).
Environ Sci Pollut Res Int 23 (11):10855-10862. 10.1007/s11356-016-6285-1.
Nowack, K. 2017. GAC Treatment for PFC Removal. AWWA Webinar Program: Perfluorinated Compounds:
Research and Treatment Part I.
NPCA. 2006. Økotoksikologiske effekter av PFOS, PFOA og 6:2 FTS på meitemark (Eisenia fetida)
[Ecotoxicological effects of PFOS, PFOA and 6:2 FTS in earthworms]. edited by Statens foru-rensningstilsyn
(SFT). Norway.
NPCA. 2008. Screening of Polyfluorinated Organic Compounds at Four Fire Training Facilites in Norway. TA-
2444/2008: Norwegian Pollution Control Authority.
NSF International. 2018. PFOA/PFOS in Drinking Water.
http://www.nsf.org/consumer-resources/water-quality/drinking-water/perfluorooctanoic-acid-and-
perfluorooctanesulf onic-acid-in-drinking-water.
NTP. 2016. NTP Monograph on Immunotoxicity Associated with Exposure to Perfluorooctanoic Acid (PFOA) or
Perfluorooctane Sulfonate (PFOS). . Office of Health Assessment and Translation, Division of the National
Toxicology Program, National Institute of Environmental Health Sciences.
NTP. 2019. NTP Technical Report on the Toxicity Studies of Perfluoroalkyl Carboxylates (Perfluorohexanoic Acid,
Perfluorooctanoic Acid, Perfluorononanoic Acid and Perfluorodecanoic Acid) Administered by Gavage to
Sprague Dawley (HSD: Sprague Dawley SD) Rats. NTP TOX 97: National Toxicology Program. U. S. Department of Health and Human Services. https://ntp.niehs.nih.gov/ntp/htdocs/st_rpts/tox097_508.pdf.
NTP. 2019. NTP Technical Report on the Toxicity Studies of Perfluoroalkyl Sulfonates (Perfluorobutane Sulfonic
Acid, Perfluorohexane Sulfonate Potassium Salt, and Perfluorooctane Sulfonic Acid) Administered by Gavage
to Sprague Dawley (HSD: Sprague Dawley SD) Rats. NTP TOX 96: National Toxicology Program. U. S. Department of Health and Human Services. https://ntp.niehs.nih.gov/ntp/htdocs/st_rpts/tox096_508.pdf.
457

NTP. 2020. NTP Technical Report on the Toxicology and Carcinogenesis Studies of Perfluorooctanoic Acid (CAS
No. 335-67-1) Administered in Feed to Sprague Dawley (Hsd: Sprague Dawley SD) Rats. Technical Report 598. Research Triangel Park, NC: National Toxicology Program. U. S. Department of Health and Human
Services. https://ntp.niehs.nih.gov/ntp/htdocs/lt_rpts/tr598_508.pdf.
NY DEC. 2016. Stewart Ang Base and Newburgh Watershed Investigation Report.
NY DEC. 2017. Adoption of Final Rule: 6NYCRR Part 597. http://www.dec.ny.gov/regulations/104968.html
NY DEC. 2017. Petersburgh. Information for Communities Impacted by Perfluorinated Compounds (PFCs).
http://www.dec.ny.gov/chemical/108820.html
NY DEC. 2021. Norlite Environmental Sampling Report. Albany, NY: New York State Department of Environmental Conservation. https://www.dec.ny.gov/chemical/121118.html.
NY DEC. 2021. Sampling, Analysis, and Assessment of Per-and Polyfluoroalkyl Substances (PFAS). Under NYSDECs Part 375 Remedial Programs.
NYS DOH. 2016. Information Sheet. PFOA Biomonitoring Group Level Results.
NYS DOH. 2016. Village of Hoosick Falls and Town of Hoosick Private Well Sampling, Perfluorooctanoic Acid
(PFOA) Results Map – Updated August 3, 2016. New York State Department of Health.
Nzeribe, Blossom Nwedo, Michelle Crimi, Selma Mededovic Thagard, and Thomas M. Holsen. 2019. Physico-Chemical Processes for the Treatment of Per- And Polyfluoroalkyl Substances (PFAS): A review. Critical
Reviews in Environmental Science and Technology 49 (10):866-915. 10.1080/10643389.2018.1542916.
Oakes, K.D., P.K. Sibley, J.W. Martin, D.D. MacLean, K.R. Solomon, S.A. Mabury, and G.J. Van Der Kraak. 2005.
Short-term exposures of fish to perfluorooctane sulfonate: Acute effects on fatty acyl-CoA oxidase activity,
oxidative stress, and circulating sex steroids. Environ Contam Toxicol 24 (5):1172-1181. 10.1897/04-419.1.
Obo, Hayato, Nozomi Takeuchi, and Koichi Yasuoka. 2015. Decomposition of Perfluoro Compounds using
Plasmas within Bubbles in Water and Simulation of Decomposition System by Circuit Modeling of Plasma.
IEEJ Transactions on Fundamentals and Materials 135 (5):310-317. https://doi.org/10.1541/ieejfms.135.310.
Ochiai, Tsuyoshi, Yuichi Iizuka, Kazuya Nakata, Taketoshi Murakami, Donald A. Tryk, Akira Fujishima, Yoshihiro
Koide, and Yuko Morito. 2011. Efficient electrochemical decomposition of perfluorocarboxylic acids by the
use of a boron- doped diamond electrode. Diamond and Related Materials 20 (2):64-67. https://doi.org/10.1016/j.diamond.2010.12.008.
Ochoa-Herrera, V., J. A. Field, A. Luna-Velasco, and R. Sierra-Alvarez. 2016. Microbial toxicity and
biodegradability of perfluorooctane sulfonate (PFOS) and shorter chain perfluoroalkyl and polyfluoroalkyl substances (PFASs). Environ Sci Process Impacts 18 (9):1236-1246. 10.1039/c6em00366.
Ochoa-Herrera, Valeria, and Reyes Sierra-Alvarez. 2008. Removal of perfluorinated surfactants by sorption onto
granular activated carbon, zeolite and sludge. Chemosphere 72 (10):1588-1593.
https://doi.org/10.1016/j.chemosphere.2008.04.029.
Ochoa-Herrera, Valeria, Reyes Sierra-Alvarez, Arpad Somogyi, Neil E. Jacobsen, Vicki H. Wysocki, and Jim A. Field. 2008.
Reductive Defluorination of Perfluorooctane Sulfonate. Environmental Science & Technology 42 (9):3260-
3264. 10.1021/es702842.
OECD. 2002. Hazard assessment of perfluorooctane sulfonate (PFOS) and its salts. edited by Pesticides ENV/JM/RD (2002)17/FINAL. Joint Meeting of the Chemicals Committee and the Working Party on Chemicals,
and Biotechnology, Environment Directorate, Organisation for Economic Co-operation and Development. . Paris http://www.oecd.org/dataoecd/23/18/2382880.pdf.
458

OECD. 2006. Results of the 2006 Survey on Production and Use of PFOS, PFAS, PFOA, PFCA, Their Related
Substances and Products/Mixtures Containing These Substances. ENV-JM-MONO(2006)36, Paris: OECD.
OECD. 2007. Environmental Health and Safety Publications. Series on Testing and Assessment No. 80.
Guidance on Grouping of Chemicals. .
http://www.oecd.org/officialdocuments/publicdisplaydocumentpdf/?doclanguage=enandcote=env/jm/mono(20
07)28
OECD. 2007. Report of an OECD Workshop on Perfluorocarboxylic Acids (PFCAs) and Precursors. ENV-JM-
MONO(2007)11, Paris: OECD.
OECD. 2011. PFCS: Outcome of the 2009 Survey – Survey on the Production, Use and Release of PFOS, PFAS,
PFOA, PFCA, Their Related Substances and Products/Mixtures Containing These Substances. ENV-JM-MONO(2011)1, Paris: OECD. .
OECD. 2013. Synthesis paper on per- and polyfluorinated chemicals (PFCs). OECD/UNEP Global
PFC Group. https://www.oecd.org/env/ehs/risk-management/PFC_FINAL-Web.pdf
OECD. 2015. Risk Reduction Approaches for PFASs – a Cross-Country Analysis. http://www.oecd.org/chemicalsafety/risk-
management/Risk_Reduction_Approaches%20for%20PFASS.pdf.
OECD. 2015. Working Towards a Global Emission Inventory of PFASs: Focus on PFCAs – Status
Quo and the Way Forward. No. 30. Paris, France: Health and Safety Publications. Series on
Risk Management OECD Environment. https://tinyurl.com/3shcbydk.
OECD. 2017. Portal on Per and Poly Fluorinated Chemicals.
accessed 2017. http://www.oecd.org/chemicalsafety/portal-
perfluorinated-chemicals/.
OECD. 2018. Toward a New Comprehensive Global Database of Per- And Polyfluoroalkyl Substances (PFASs): Summary Report on Updating the OECD 2007 List of Per- and Polyfluoroalkyl Substances (PFASs)
ENV/JM/MONO(2018)7. Paris, France: Health and Safety Division Environment. https://www.oecd.org/chemicalsafety/portal-perfluorinated-chemicals/.
OEHHA. 2019. California Environmental Protection Agency.
https://oehha.ca.gov/media/downloads/water/chemicals/nl/final-pfoa-
pfosnl082119.pdf.
OFallon, L. R., F. L. Tyson, and A Dearry. 2000. Successful Models of Community-Based Participatory Research:
Final Report. Research Triangle Park, NC: National Institute of Environmental Health Sciences.
OHaire, C., M. McPheeters, E. Nakamoto, L. LaBryant, C. Most, K. Lee, E. Graham, E. Cottrell, and J-M. Guise. 2011.
Engaging Stakeholders To Identify and Prioritize Future Research Needs. Methods Future Research Needs Reports, No. 4. Appendix F, Descriptions of Stakeholder Engagement Methods. Rockville, MD: Agency for
Healthcare Research and Quality. Available from: https://www.ncbi.nlm.nih.gov/books/NBK62556/.
Ohmori, K., N. Kudo, K. Katayama, and Y. Kawashima. 2003. Comparison of the toxicokinetics
between perfluorocarboxylic acids with different carbon chain length. Toxicology 184 (2-3):135-40.
Oliaei, F., D. Kriens, and K. Kessler. 2006. Investigation of Perfluorochemical (PFC) Contamination in Minnesota
Phase One. Report to Senate Environment Committee.
459

Oliaei, F., D. Kriens, and R. Weber. 2010. Discovery and Investigation of PFOS/PFCs Contamination from a
PFC Manufacturing Facility in Minnesota – Environmental Releases and Exposure Risks. Organohalogen Compounds 72:1338-1341.
Oliaei, Fardin, Don Kriens, Roland Weber, and Alan Watson. 2013. PFOS and PFC releases and associated
pollution from a PFC production plant in Minnesota (USA). Environmental Science and Pollution Research 20
(4):1977-1992.
10.1007/s11356-012-1275-4.
Olker, J.H. 2020. Update on Identification and Curation of Ecological Toxicity Data for PFAS with the ECOTOXicology
Knowledgebase Protocols. Presentation. USEPA Center for Computational Toxicology and Exposure.
Olsen, G. W. 2015. PFAS biomonitoring in higher exposed populations. In Toxicological Effects of Perfluoroalkyl and Polyfluoroalkyl Substances, edited by J.D. DeWitt, 77-126. Humana Press. ISBN No. 978-3-319-15517-3.
Olsen, G. W., and L. R. Zobel. 2007. Assessment of lipid, hepatic, and thyroid parameters with serum
perfluorooctanoate (PFOA) concentrations in fluorochemical production workers. Int Arch Occup Environ Health 81 (2):231-46. 10.1007/s00420-007-0213-0.
Olsen, G. W., J. M. Burris, D. J. Ehresman, J. W. Froehlich, A. M. Seacat, J. L. Butenhoff, and L. R. Zobel. 2007. Half-
life of serum elimination of perfluorooctanesulfonate,perfluorohexanesulfonate, and perfluorooctanoate in
retired fluorochemical production workers. Environ Health Perspect 115 (9):1298-305. 10.1289/ehp.10009.
Olsen, G. W., J. M. Burris, M. M. Burlew, and J. H. Mandel. 2003. Epidemiologic assessment of worker
serum perfluorooctanesulfonate (PFOS) and perfluorooctanoate (PFOA) concentrations and medical
surveillance examinations. J Occup Environ Med 45 (3):260-70.
Olsen, G. W., M. M. Burlew, J. C. Marshall, J. M. Burris, and J. H. Mandel. 2004. Analysis of episodes of care in a
perfluorooctanesulfonyl fluoride production facility. J Occup Environ Med 46 (8):837-46.
Olsen, G. W., S. C. Chang, P. E. Noker, G. S. Gorman, D. J. Ehresman, P. H. Lieder, and J. L. Butenhoff. 2009. A comparison of the pharmacokinetics of perfluorobutanesulfonate (PFBS) in rats, monkeys, and humans.
Toxicology 256 (1-2):65-74. 10.1016/j.tox.2008.11.008.
Olsen, Geary W., David C. Mair, Cleston Lange, Laura M. Harrington, Timothy Church, Corinne L. Goldberg, Ross Herron, Hank Hanna, John B. Nobiletti, Jorge A. Rios, William K. Reagen, and Carol A. Ley. 2017. Per- and
polyfluoroalkyl substances (PFAS) in American Red Cross adult blood donors, 2000-2015. Environmental
Research 157:87-95. https://doi.org/10.1016/j.envres.2017.05.013.
Olsen, Geary W., Timothy R. Church, John P. Miller, Jean M. Burris, Kristen J. Hansen, James K. Lundberg, John
B. Armitage, Ross M. Herron, Zahra Medhdizadehkashi, John B. Nobiletti, E. Mary ONeill, Jeffrey H. Mandel,
and Larry R. Zobel. 2003. Perfluorooctanesulfonate and other fluorochemicals in the serum of American Red
Cross adult blood donors. Environmental health perspectives 111 (16):1892-1901. 10.1289/ehp.6316.
Olson, C. T., and M. E. Andersen. 1983. The acute toxicity of perfluorooctanoic and perfluorodecanoic acids in
male rats and effects on tissue fatty acids. Toxicol Appl Pharmacol 70 (3):362-72.
Onishchenko, Natalia, Celia Fischer, Wan Norhamidah Wan Ibrahim, Sara Negri, Stefan Spulber, Danilo Cottica, and Sandra Ceccatelli. 2011. Prenatal Exposure to PFOS or PFOA Alters Motor Function in Mice in a
Sex-Related Manner. Neurotoxicity Research 19 (3):452-461. 10.1007/s12640-010-9200-4.
OSHA. 2013. Fact Sheet: Controlling Hexavalent Chromium Exposures during Electroplating. United States
Department of Labor. .
Pachkowski, B., G. B. Post, and A. H. Stern. 2019. The derivation of a Reference Dose (RfD) for perfluorooctane sulfonate (PFOS) based on immune suppression. Environ Res 171:452-469. 10.1016/j.envres.2018.08.004.
460

Palma-Oliveira, José, and Rui Gaspar. 2004. Environmental education programs construction: some conceptual
and evaluation guidelines. Lisboa: Universidade de Lisboa.
Palmer, S. J., and H. O. Krueger. 2001. PFOS: A frog embryo teratogenesis assay-Xenopus(FETAX).
Palmer, S. J., R. L. Van Hoven, and H. O. Krueger. 2002. Perfluorooctanesulfonate, potassium salt (PFOS): a 96-hr static renewal acute toxicity test with the sheepshead minnow (Cyprinodon variegatus). Report No. 454A-
146A: Wildlife International Ltd.
Palmer, S.J., R.L. Van Hoven, and H.O. Krueger. 2002. Perfluorooctanesulfonate, potassium salt (PFOS): a 96-
hr static acute toxicity test with the rainbow trout (Oncorhynchus mykiss). Report No. 454A-145 EPA Docket
AR226-1030a044: Wildlife International Ltd.
Pan, Chang-Gui, Guang-Guo Ying, Jian-Liang Zhao, You-Sheng Liu, Yu-Xia Jiang, and Qian-Qian Zhang. 2014.
Spatiotemporal distribution and mass loadings of perfluoroalkyl substances in the Yangtze River of China.
Science of The Total Environment 493:580-587. https://doi.org/10.1016/j.scitotenv.2014.06.033.
Pan, Chang-Gui, Guang-Guo Ying, You-Sheng Liu, Qian-Qian Zhang, Zhi-Feng Chen, Feng-Jiao Peng, and Guo-
Yong Huang. 2014. Contamination profiles of perfluoroalkyl substances in five typical rivers of the Pearl River
Delta region, South China. Chemosphere 114:16-25. https://doi.org/10.1016/j.chemosphere.2014.04.005.
Park, H., C. D. Vecitis, J. Cheng, N. F. Dalleska, B. T. Mader, and M. R. Hoffmann. 2011. Reductive degradation
of perfluoroalkyl compounds with aquated electrons generated from iodide photolysis at 254 nm. Photochem Photobiol Sci 10 (12):1945-53. 10.1039/c1pp05270.
Park, Hyunwoong, Chad D. Vecitis, Jie Cheng, Wonyong Choi, Brian T. Mader, and Michael R. Hoffmann. 2009.
Reductive Defluorination of Aqueous Perfluorinated Alkyl Surfactants: Effects of Ionic Headgroup and Chain
Length. The Journal of Physical Chemistry A 113 (4):690-696. 10.1021/jp807116.
Park, S., C. de Perre, and L. S. Lee. 2017. Alternate Reductants with VB12 to Transform C8 and C6
Perfluoroalkyl Sulfonates: Limitations and Insights into Isomer-Specific Transformation Rates, Products and
Pathways. Environ Sci Technol 51 (23):13869-13877. 10.1021/acs.est.7b03744.
Park, Saerom, Linda S. Lee, Victor F. Medina, Aaron Zull, and Scott Waisner. 2016. Heat-activated persulfate
oxidation of PFOA, 6:2 fluorotelomer sulfonate, and PFOS under conditions suitable for in-situ groundwater remediation. Chemosphere 145:376-383.
https://doi.org/10.1016/j.chemosphere.2015.11.097.
Parker, B. L., J. A. Cherry, and S. W. Chapman. 2004. Field study of TCE diffusion profiles below DNAPL to assess
aquitard integrity. J Contam Hydrol 74 (1-4):197-230. 10.1016/j.jconhyd.2004.02.011.
Parsons, J. R., M. Saez, J. Dolfing, and P. de Voogt. 2008. Biodegradation of perfluorinated compounds. Rev
Environ Contam Toxicol 196:53-71.
Patagonia. 2015. Our DWR Problem [Updated]. The Footprint Chronicles.
Patlewicz, Grace, M. Richard Ann, J. Williams Antony, M. Grulke Christopher, Reeder Sams, Jason Lambert,
D. Noyes Pamela, J. DeVito Michael, N. Hines Ronald, Mark Strynar, Annette Guiseppi-Elie, and S. Thomas Russell. A Chemical Category-Based Prioritization Approach for Selecting 75 Per- and Polyfluoroalkyl
Substances (PFAS) for Tiered Toxicity and Toxicokinetic Testing. Environmental Health Perspectives 127
(1):014501. 10.1289/EHP4555.
Paul, Alexander G., Kevin C. Jones, and Andrew J. Sweetman. 2009. A First Global Production, Emission, And
Environmental Inventory For Perfluorooctane Sulfonate. Environmental Science & Technology 43 (2):386-392.
10.1021/es802216.
Payne, F.C., J. A. Quinnan, and S. T. Potter. 2008. Remediation Hydraulics. CRC Press. 461

Pereira, Luís A. M., Luís F. G. Martins, José R. Ascenso, Pedro Morgado, João P. Prates Ramalho, and Eduardo J.
M. Filipe. 2014. Diffusion Coefficients of Fluorinated Surfactants in Water: Experimental Results and
Prediction by Computer Simulation. Journal of Chemical & Engineering Data 59 (10):3151-3159. 10.1021/je500211.
Perkins, R. G., J. L. Butenhoff, G. L. Kennedy, Jr., and M. J. Palazzolo. 2004. 13-week dietary toxicity study of
ammonium perfluorooctanoate (APFO) in male rats. Drug Chem Toxicol 27 (4):361-78. 10.1081/DCT-200039773.
Persson, J., and N. Andersson. 2016. Modeling groundwater flow and PFOS transport. A case study at the old fire drill site of Bromma Stockholm Airport. Stockholm, Sweden.
http://www.diva-portal.org/smash/get/diva2:946450/FULLTEXT02.pdf.
Phillips, S., P. Murphy, G. Brickle, and D. Burns. 2018. Validation of Foam Fractionation as an Effective
Treatment Technology. OPEC Systems.
https://www.opecsystems.com/persistent/catalogue_files/categories/opecsystemspfassolutionsposterforecoforum.pdf
Piekarz, Arkadiusz M., Toby Primbs, Jennifer A. Field, Douglas F. Barofsky, and Staci Simonich. 2007.
Semivolatile Fluorinated Organic Compounds in Asian and Western U.S. Air Masses. Environmental Science & Technology 41 (24):8248-8255. 10.1021/es0713678.
Pillai, Suresh, and Shima Shayanfar. 2016. Electron Beam Technology and Other Irradiation Technology
Applications in the Food Industry. Topics in Current Chemistry 375:6. https://doi.org/10.1007/s41061-016-
0093-4.
Pillai, Suresh. 2016. Introduction to Electron-Beam Food Irradiation. Chemical Engineering Progress 112
(11): 36-44. https://www.aiche.org/resources/publications/cep/2016/november/introduction-electron-
beam-food-irradiation.
Place, Benjamin J., and Jennifer A. Field. 2012. Identification of Novel Fluorochemicals in Aqueous Film-Forming
Foams Used by the US Military. Environmental Science & Technology 46 (13):7120-7127. 10.1021/es301465.
Plain Language.gov. Writing Effective Letters. accessed 2020.
https://www.plainlanguage.gov/resources/content-types/writing-effective-
letters/.
Plastics Industry Association. 2019. Guide to the Safe Handling of Fluoropolymer Resins. Washington DC.
https://access.plasticsindustry.org/ItemDetail?iProductCode=BU201&Category=PUBLICATIO&WebsiteKey=7cf6f8c9- ad49-40af-a01f-0b8c06a4b8f6.
Plumlee, Megan H., Kristopher McNeill, and Martin Reinhard. 2009. Indirect Photolysis of Perfluorochemicals:
Hydroxyl Radical-Initiated Oxidation of N-Ethyl Perfluorooctane Sulfonamido Acetate (N-EtFOSAA) and Other
Perfluoroalkanesulfonamides. Environmental Science & Technology 43 (10):3662-3668. 10.1021/es803411.
Pohland, F.G. and J.T. Graven. 1993. . The Use of Alternative Materials for Daily Cover at Municpal Solid Waste
Landfills. USEPA Research and Development EPA/600/SR-93/172
Posner, Stefan, Sandra Roos, Pia Poulsen, Hrönn Jörundsdóttir, Gunlaugsdottir H, Xenia Trier, Allan Jensen,
Athanasios Katsoyiannis, Dorte Herzke, Eva Cecilie Bonefeld-Jørgensen, Christina Jönsson, Gitte Alsing,
Mandana Ghisari, and Sophie Jensen. 2013. Per- and polyfluorinated substances in the Nordic countries. Use, occurrence and toxicology. Copenhagen: Norden. ISBN No. 978-92-893-2562-2.
462
Post, G. B. 2013. Perfluorinated Chemicals (PFCs) – Emerging Drinking Water Contaminants. Presentation slides
of Gloria
B. Post, Office if Science, New Jersey Department of Environmental Protection, to the Delaware River Basin
Commission, Toxics Advisory Committee, West Trenton, New Jersey.
Post, G. B., J. B. Louis, R. L. Lippincott, and N. A. Procopio. 2013. Occurrence of perfluorinated compounds in raw water from New Jersey public drinking water systems. Environ Sci Technol 47 (23):13266-75.
10.1021/es402884.
Post, Gloria B. 2021. Recent US State and Federal Drinking Water Guidelines for Per- and Polyfluoroalkyl Substances.
Environmental Toxicology and Chemistry 40 (3):550-563. https://doi.org/10.1002/etc.4863.
Post, Gloria B., Jessie A. Gleason, and Keith R. Cooper. 2017. Key scientific issues in developing drinking water
guidelines for perfluoroalkyl acids: Contaminants of emerging concern. PLOS Biology 15 (12):e2002855.
10.1371/journal.pbio.2002855.
Post, Gloria B., Perry D. Cohn, and Keith R. Cooper. 2012. Perfluorooctanoic acid (PFOA), an emerging drinking
water contaminant: A critical review of recent literature. Environmental Research 116:93-117. https://doi.org/10.1016/j.envres.2012.03.007.
Poulsen, P. B., A. A. Jensen, E. Wallstrom, and E. N. P. R. O Aps,. 2005. More Environmentally Friendly
Alternatives to PFOS-Compounds and PFOA. Danish Environmental Protection Agency Environmental Project, 1013.
Praveen, Chandni, Palmy R. Jesudhasan, Robert S. Reimers, and Suresh D. Pillai. 2013. Electron beam
inactivation of selected microbial pathogens and indicator organisms in aerobically and anaerobically digested sewage sludge. Bioresource Technology 144:652-657.
https://doi.org/10.1016/j.biortech.2013.07.034.
Prell, C. 2011. Social Network Analysis: History, theory, methodology. London, United Kingdom: Sage Publications
Ltd. ISBN No. 978-1412947152.
Prell, Christina, Klaus Hubacek, and Mark Reed. 2009. Stakeholder Analysis and Social Network Analysis in
Natural Resource Management. Society & Natural Resources 22 (6):501-518.
10.1080/08941920802199202.
Presidential/Congressional Commission. 1997. Framework for Environmental Health Risk Management. Final
Report. Volume 1. Washington, D.C.: The Presidential/Congressional Commission on Risk Assessment and Risk
Management. http://www.riskworld.com/riskcommission/default.html.
Prevedouros, Konstantinos, Ian T. Cousins, Robert C. Buck, and Stephen H. Korzeniowski. 2006. Sources,
Fate and Transport of Perfluorocarboxylates. Environmental Science & Technology 40 (1):32-44.
10.1021/es0512475.
Princz, Juliska, Muriel Jatar, Heather Lemieux, and Rick Scroggins. 2018. Perfluorooctane sulfonate in surface
soils:
Effects on reproduction in the collembolan, Folsomia candida, and the oribatid mite, Oppia nitens. Chemosphere 208:757-763. https://doi.org/10.1016/j.chemosphere.2018.06.020.
Procopio, N. A., R. Karl, S. M. Goodrow, J. Maggio, J. B. Louis, and T. B. Atherholt. 2017. Occurrence and source identification of perfluoroalkyl acids (PFAAs) in the Metedeconk River Watershed, New Jersey. Environmental
Science and Pollution Research 24:27125-27135. https://doi.org/10.1007/s11356-017-0309-3.
463

ProPublica, Abrahm Lustgarten. 2018. Bombs in our Backyard: How the EPA and the Pentagon Downplayed
a Growing Toxic Threat. Last Modified July 9, 2018. https://www.propublica.org/article/how-the-epa-and-the-pentagon-downplayed-toxic-pfas-chemicals.
Punyapalakul, Patiparn, Kuntida Suksomboon, Panida Prarat, and Sutha Khaodhiar. 2013. Effects of Surface
Functional Groups and Porous Structures on Adsorption and Recovery of Perfluorinated Compounds by
Inorganic Porous Silicas. Separation Science and Technology 48 (5):775-788.
https://doi.org/10.1080/01496395.2012.710888.
Qazi, M. R., M. R. Abedi, B. D. Nelson, J. W. DePierre, and M. Abedi-Valugerdi. 2010. Dietary exposure to
perfluorooctanoate or perfluorooctane sulfonate induces hypertrophy in centrilobular hepatocytes and
alters the hepatic immune status in mice. Int Immunopharmacol 10 (11):1420-7.
10.1016/j.intimp.2010.08.009.
Qi, Ping, Ying Wang, Jingli Mu, and Juying Wang. 2011. Aquatic predicted no-effect-concentration derivation for
perfluorooctane sulfonic acid. Environmental Toxicology and Chemistry 30 (4):836-842. 10.1002/etc.460.
Qi, Yanjie, Shouliang Huo, Beidou Xi, Shibin Hu, Jingtian Zhang, and Zhuoshi He. 2016. Spatial distribution and
source apportionment of PFASs in surface sediments from five lake regions, China. Scientific Reports 6:22674. https://doi.org/10.1038/srep22674.
Qi, Yanjie, Zhuoshi He, Shouliang Huo, Jingtian Zhang, Beidou Xi, and Shibin Hu. 2017. Source apportionment of
perfluoroalkyl substances in surface sediments from lakes in Jiangsu Province, China: Comparison of three
receptor models. Journal of Environmental Sciences 57:321-328. https://doi.org/10.1016/j.jes.2016.12.007.
Qu, Baocheng, Hongxia Zhao, and Jiti Zhou. 2010. Toxic effects of perfluorooctane sulfonate (PFOS) on wheat
(Triticum aestivum L.) plant. Chemosphere 79 (5):555-560. https://doi.org/10.1016/j.chemosphere.2010.02.012.
Qu, Yan, Chao-Jie Zhang, Pei Chen, Qi Zhou, and Wei-Xian Zhang. 2014. Effect of initial solution pH on photo-
induced reductive decomposition of perfluorooctanoic acid. Chemosphere 107:218-223.
https://doi.org/10.1016/j.chemosphere.2013.12.046.
Qu, Yan, Chaojie Zhang, Fei Li, Jing Chen, and Qi Zhou. 2010. Photo-reductive defluorination of perfluorooctanoic
acid in water. Water Research 44 (9):2939-2947. https://doi.org/10.1016/j.watres.2010.02.019.
Queensland Government. 2018. Environmental Management of Fire Fighting Foam –
Operational Policy. https://www.qld.gov.au/environment/pollution/management/investigation-pfas/operational-policy. .
Quist, E. M., A. J. Filgo, C. A. Cummings, G. E. Kissling, M. J. Hoenerhoff, and S. E. Fenton. 2015. Hepatic
Mitochondrial Alteration in CD-1 Mice Associated with Prenatal Exposures to Low Doses of Perfluorooctanoic Acid (PFOA). Toxicol Pathol 43 (4):546-57. 10.1177/0192623314551841.
Radjenovic, Jelena, and David L. Sedlak. 2015. Challenges and Opportunities for Electrochemical
Processes as Next- Generation Technologies for the Treatment of Contaminated Water. Environmental
Science & Technology 49 (19):11292-11302. 10.1021/acs.est.5b02414.
Rahman, Sheikh, Matthew Eckelman, Annalisa Onnis-Hayden, and April Gu. 2014. Environmental
Sustainability Assessment of Technologies for Removal of Contaminants of Emerging Concern.
Proceedings of the Water Environment Federation 2014 (16):6455-6469.
https://doi.org/10.2175/193864714815940785.
464

Raleigh, Katherine K., Bruce H. Alexander, Geary W. Olsen, Gurumurthy Ramachandran, Sandy Z. Morey,
Timothy R. Church, Perry W. Logan, Laura L. F. Scott, and Elizabeth M. Allen. 2014. Mortality and cancer incidence in ammonium perfluorooctanoate production workers. Occupational and Environmental Medicine 71
(7):500. 10.1136/oemed-2014-102109.
Ramhoj, L., U. Hass, J. Boberg, M. Scholze, S. Christiansen, F. Nielsen, and M. Axelstad. 2018. Perfluorohexane Sulfonate (PFHxS) and a Mixture of Endocrine Disrupters Reduce Thyroxine Levels and Cause Antiandrogenic
Effects in Rats. Toxicol Sci 163 (2):579-591. 10.1093/toxsci/kfy055.
Rand, Amy A., and Scott A. Mabury. 2016. Is there a human health risk associated with indirect
exposure to perfluorinated carboxylates (PFCAs)? Toxicology 375:28-36.
https://doi.org/10.1016/j.tox.2016.11.011.
Rand, Amy, John Rooney, Craig Butt, Joel N. Meyer, and Scott A. Mabury. 2013. Cellular Toxicity Associated
with Exposure to Perfluorinated Carboxylates (PFCAs) and Their Metabolic Precursors. Chemical Research in Toxicology 27 (1):42-50. https://doi.org/10.1021/tx400317.
Rankin, Keegan, and Scott A. Mabury. 2015. Matrix Normalized MALDI-TOF Quantification of a Fluorotelomer-
Based Acrylate Polymer. Environmental Science & Technology 49 (10):6093-6101. 10.1021/es505931.
Rankin, Keegan, Holly Lee, Pablo J. Tseng, and Scott A. Mabury. 2014. Investigating the Biodegradability of a Fluorotelomer-Based Acrylate Polymer in a Soil–Plant Microcosm by Indirect and Direct Analysis.
Environmental Science & Technology 48 (21):12783-12790. 10.1021/es502986.
Rankin, Keegan, Scott A. Mabury, Thomas M. Jenkins, and John W. Washington. 2016. A North American
and global survey of perfluoroalkyl substances in surface soils: Distribution patterns and mode of occurrence. Chemosphere 161:333-341. https://doi.org/10.1016/j.chemosphere.2016.06.109.
Rao, N. S., and B. E. Baker. 1994. Textile Finishes and Fluorosurfactants. In Organofluorine Chemistry. Topics in
Applied Chemistry, edited by R.E. Banks, B.E. Smart and J.C. Tatlow, 321-338. Boston, MA: Springer. ISBN
No.978-1-4899-1204-6.
Ra ppazzo, K. M., E. Coffman, and E. P. Hines. 2017. Exposure to Perfluorinated Alkyl Substances and Health
Outcomes in Children: A Systematic Review of the Epidemiologic Literature. Int J Environ Res Public Health 14
(7). 10.3390/ijerph14070691.
Ras, C., and Harro von Blottnitz. 2012. A comparative life cycle assessment of process water treatment
technologies at the Secunda industrial complex, South Africa. Water SA 38 (4):549-554. https://doi.org/10.4314/wsa.v38i4.10.
Rattanaoudom, R., Chettiyappan Visvanathan, and S. K. Boontanon. 2012. Removal of concentrated PFOS and PFOA in synthetic industrial wastewater by powder activated carbon and hydrotalcite. Journal of
Water Sustainability 2:245-258.
Rauert, Cassandra, Mahiba Shoieb, Jasmin K. Schuster, Anita Eng, and Tom Harner. 2018. Atmospheric
concentrations and trends of poly- and perfluoroalkyl substances (PFAS) and volatile methyl siloxanes
(VMS) over 7 years of sampling in the Global Atmospheric Passive Sampling (GAPS) network. Environmental Pollution 238:94-102. https://doi.org/10.1016/j.envpol.2018.03.017.
Rayaroth, Manoj, Usha Aravind, and Charuvila Aravindakumar. 2016. Degradation of pharmaceuticals by
ultrasound- based advanced oxidation process. Environmental Chemistry Letters 14:259-290. https://doi.org/10.1007/s10311-016-0568-0.
Rayne, S., and K. Forest. 2009. Perfluoroalkyl sulfonic and carboxylic acids: a critical review of
physicochemical properties, levels and patterns in waters and wastewaters, and treatment methods. J
Environ Sci Health A Tox Hazard Subst Environ Eng 44 (12):1145-99. 10.1080/10934520903139811.
465

Rayne, S., K. Forest, and K. J. Friesen. 2008. Congener-specific numbering systems for the environmentally
relevant C4 through C8 perfluorinated homologue groups of alkyl sulfonates, carboxylates, telomer alcohols, olefins, and acids, and their derivatives. J Environ Sci Health A Tox Hazard Subst Environ Eng 43
(12):1391-401. 10.1080/10934520802232030.
Rebholz, Sandra L., Thomas Jones, Robert L. Herrick, Changchun Xie, Antonia M. Calafat, Susan M. Pinney, and Laura A. Woollett. 2016. Hypercholesterolemia with consumption of PFOA-laced Western diets is
dependent on strain and sex of mice. Toxicology Reports 3:46-54.
https://doi.org/10.1016/j.toxrep.2015.11.004.
Reed, M. S., A. Graves, N. Dandy, H. Posthumus, K. Hubacek, J. Morris, C. Prell, C. H. Quinn, and L. C. Stringer.
2009. Whos in and why? A typology of stakeholder analysis methods for natural resource management. Journal of Environmental Management 90 (5):1933-49.
Reiner, J. L., and Benjamin J. Place. 2015. Perfluorinated Alkyl Acids in Wildlife. In Toxicological Effects of
Perfluoroalkyl and Polyfluoralkyl Substances., edited by J.C. DeWitt. Humana Press, Cham. ISBN No. 978-3-
319-15517-3.
Reiner, Jessica L., Steven G. OConnell, Amanda J. Moors, John R. Kucklick, Paul R. Becker, and Jennifer M.
Keller. 2011. Spatial and Temporal Trends of Perfluorinated Compounds in Beluga Whales (Delphinapterus leucas) from Alaska. Environmental Science & Technology 45 (19):8129-8136.
10.1021/es103560.
Renner, Rebecca. 2001. Growing Concern Over Perfluorinated Chemicals. Environmental Science &
Technology 35 (7):154A-160A. 10.1021/es012317.
Rhoads, Kurt R., Elisabeth M. L. Janssen, Richard G. Luthy, and Craig S. Criddle. 2008. Aerobic
Biotransformation and Fate of N-Ethyl Perfluorooctane Sulfonamidoethanol (N-EtFOSE) in Activated Sludge. Environmental Science & Technology 42 (8):2873-2878. 10.1021/es702866.
Rhoads, Kurt R., Katherine H. Rostkowski, Peter K. Kitanidis, and Craig S. Criddle. 2013. Use of on-site
bioreactors to estimate the biotransformation rate of N-ethyl perfluorooctane sulfonamidoethanol (N-
EtFOSE) during activated sludge treatment. Chemosphere 92 (6):702-707.
https://doi.org/10.1016/j.chemosphere.2013.04.059.
Rich, Courtney D., Andrea C. Blaine, Lakhwinder Hundal, and Christopher P. Higgins. 2015.
Bioaccumulation of Perfluoroalkyl Acids by Earthworms (Eisenia fetida) Exposed to Contaminated
Soils. Environmental Science & Technology 49 (2):881-888. https://doi.org/10.1021/es504152.
Riddell, Nicole, Gilles Arsenault, Jonathan P. Benskin, Brock Chittim, Jonathan W. Martin, Alan McAlees, and
Robert McCrindle. 2009. Branched Perfluorooctane Sulfonate Isomer Quantification and Characterization in Blood Serum Samples by HPLC/ESI-MS(/MS). Environmental Science & Technology 43 (20):7902-7908.
10.1021/es901261.
Ritter, Evelyn E., Margaret E. Dickinson, John P. Harron, David M. Lunderberg, Paul A. DeYoung, Alix E. Robel,
Jennifer A. Field, and Graham F. Peaslee. 2017. PIGE as a screening tool for Per- and polyfluorinated
substances in papers and textiles. Nuclear Instruments and Methods in Physics Research Section B: Beam Interactions with Materials and Atoms 407:47-54. https://doi.org/10.1016/j.nimb.2017.05.052.
RIVM. 2016. Evaluation of substances used in the GenX technology by Chemours, Dordrecht. RIVM
Letter Report 2016-0174 M. Beekman et al. The Netherlands.
Robel, Alix E., Kristin Marshall, Margaret Dickinson, David Lunderberg, Craig Butt, Graham Peaslee, Heather
M. Stapleton, and Jennifer A. Field. 2017. Closing the Mass Balance on Fluorine on Papers and Textiles. Environmental Science & Technology 51 (16):9022-9032. 10.1021/acs.est.7b02080.
466

Robertson, J. C. 1986. Potential for environmental impact of AFA-6 surfactant. EPA Docket AR266-1030a043.
Missassauga, Ontario, Canada: Beak Consultants Ltd.
Rodowa, Alix E., Emerson Christie, Jane Sedlak, Graham F. Peaslee, Dorin Bogdan, Bill DiGuiseppi, and Jennifer
A. Field. 2020. Field Sampling Materials Unlikely Source of Contamination for Perfluoroalkyl and Polyfluoroalkyl
Substances in Field Samples. Environmental Science & Technology Letters 7 (3):156-163.
10.1021/acs.estlett.0c00036.
Rodriguez-Freire, Lucia, Rajesh Balachandran, Reyes Sierra-Alvarez, and Manish Keswani. 2015. Effect of
sound frequency and initial concentration on the sonochemical degradation of perfluorooctane sulfonate (PFOS). Journal of Hazardous Materials 300:662-669. https://doi.org/10.1016/j.jhazmat.2015.07.077.
Rogers, J. M., R. G. Ellis-Hutchings, B. E. Grey, R. M. Zucker, J. Norwood, Jr., C. E. Grace, C. J. Gordon, and C. Lau.
2014.
Elevated blood pressure in offspring of rats exposed to diverse chemicals during pregnancy.
Toxicol Sci 137 (2):436-46. 10.1093/toxsci/kft248.
Rolland, Jason P., R. Michael Van Dam, Derek A. Schorzman, Stephen R. Quake, and Joseph M. DeSimone.
2004. Solvent- Resistant Photocurable Liquid Teflon for Microfluidic Device Fabrication. Journal of the American Chemical Society 126 (8):2322-2323. 10.1021/ja031657.
Ross, Ian, Jeffrey McDonough, Jonathan Miles, Peter Storch, Parvathy Thelakkat Kochunarayanan, Erica Kalve,
Jake Hurst, Soumitri S. Dasgupta, and Jeff Burdick. 2018. A review of emerging technologies for remediation of PFASs. Remediation Journal 28 (2):101-126. 10.1002/rem.21553.
Rotander, A., L. M. Toms, L. Aylward, M. Kay, and J. F. Mueller. 2015. Elevated levels of PFOS and PFHxS in
firefighters exposed to aqueous film forming foam (AFFF). Environ Int 82:28-34. 10.1016/j.envint.2015.05.005.
Roth, Julia, Ibrahim Abusallout, Tiffany Hill, Chase Holton, Utsav Thapa, and David Hanigan. 2020. Release of Volatile Per- and Polyfluoroalkyl Substances from Aqueous Film-Forming Foam. Environmental Science &
Technology Letters 7 (3):164-170. https://doi.org/10.1021/acs.estlett.0c00052.
Roth, Julia, Ibrahim Abusallout, Tiffany Hill, Chase Holton, Utsav Thapa, and David Hanigan. 2020. Response to
Comment on Release of Volatile Per- and Polyfluoroalkyl Substances from Aqueous Film-Forming Foam.
Environmental Science & Technology Letters 7 (11):869-870. https://doi.org/10.1021/acs.estlett.0c00678.
Roux, I. le, H. M. Krieg, C. A. Yeates, and J. C. Breytenbach. 2005. Use of chitosan as an antifouling agent in a membrane bioreactor. Journal of Membrane Science 248 (1):127-136.
https://doi.org/10.1016/j.memsci.2004.10.005.
Royer, Laurel A., Linda S. Lee, Mark H. Russell, Loring F. Nies, and Ronald F. Turco. 2015. Microbial transformation of 8:2 fluorotelomer acrylate and methacrylate in aerobic soils. Chemosphere 129:54-61.
https://doi.org/10.1016/j.chemosphere.2014.09.077.
RPA. 2004. Perfluorooctane Sulphonate – Risk reduction strategy and analysis of advantages and drawbacks.
Loddon, UK: Food and Rural Affairs and the Environment Agency for England and Wales Department for
Environment. https://assets.publishing.service.gov.uk/government/uploads/system/uploads/attachment_data/file/183154/pf
os-risks trategy.pdf.
Ruan, Ting, Bogdan Szostek, Patrick W. Folsom, Barry W. Wolstenholme, Runzeng Liu, Jiyan Liu, Guibin Jiang, Ning Wang, and Robert C. Buck. 2013. Aerobic Soil Biotransformation of 6:2 Fluorotelomer Iodide. Environmental
Science & Technology 47 (20):11504-11511. https://doi.org/10.1021/es4018128.
467

Ruan, Ting, Yongfeng Lin, Thanh Wang, Guibin Jiang, and Ning Wang. 2015. Methodology for studying
biotransformation of polyfluoroalkyl precursors in the environment. TrAC Trends in Analytical Chemistry 67:167-178. https://doi.org/10.1016/j.trac.2014.11.017.
Rushing, B., Q. Hu, J. Franklin, R. McMahen, S. Dagnio, C. Higgins, M. Strynar, and J. DeWitt. 2017. Evaluation
of the Immunomodulatory Effects of 2,3,3,3-Tetrafluoro-2-(Heptafluoropropoxy)- Propanoate in C57BL/6
Mice. Toxicol Sci 156:179-189. doi.org/10.1093/toxsci/kfw25.
Russell, M. H., H. Nilsson, and R. C. Buck. 2013. Elimination kinetics of perfluorohexanoic acid in humans and
comparison with mouse, rat and monkey. Chemosphere 93 (10):2419-25. 10.1016/j.chemosphere.2013.08.060.
Russell, Mark H., William R. Berti, Bogdan Szostek, and Robert C. Buck. 2008. Investigation of the Biodegradation Potential of a Fluoroacrylate Polymer Product in Aerobic Soils. Environmental Science &
Technology 42 (3):800-807. 10.1021/es0710499.
Russell, Mark H., William R. Berti, Bogdan Szostek, Ning Wang, and Robert C. Buck. 2010. Evaluation of PFO
formation from the biodegradation of a fluorotelomer-based urethane polymer product in aerobic soils.
Polymer Degradation and Stability 95 (1):79-85. https://doi.org/10.1016/j.polymdegradstab.2009.10.004.
RWQCB-CVR. 2016. Water Quality Control Plan (Basin Plan) for the California Regional Water Quality Control
Board, Central Valley Region, Fourth Edition, Sacramento and San Joaquin River Basins.
SA EPA. 2017. Consultation Report: Draft amendment to ban the use of fire-fighting foams containing perfluorinated alkylated substances (PFAS).21.
Sacramento State University. 2019. Empty Bed Contact Time Definition. Office of Water Programs,
Department of Civil Engineering, Accessed 01-25-2020. https://www.owp.csus.edu/glossary/empty-bed-contact-time.php.
Saez, M., P. de Voogt, and J. R. Parsons. 2008. Persistence of perfluoroalkylated substances in closed bottle
tests with municipal sewage sludge. Environ Sci Pollut Res Int 15 (6):472-7. 10.1007/s11356-008-0020-5.
Saito, N., K. Harada, K. Inoue, K. Sasaki, T. Yoshinaga, and A. Koizumi. 2004. Perfluorooctanoate and
perfluorooctane sulfonate concentrations in surface water in Japan. J Occup Health 46 (1):49-59.
10.1539/joh.46.49.
Salice, Christopher J., Todd A. Anderson, Richard H. Anderson, and Adric D. Olson. 2018. Ecological risk assessment of perfluooroctane sulfonate to aquatic fauna from a bayou adjacent to former fire training areas
at a US Air Force installation. Environmental Toxicology and Chemistry 37 (8):2198-2209. https://doi.org/10.1002/etc.4162.
Sandman, P. 2013. Responding to Community Outrage: Strategies for Effective Risk Communication. .
American Industrial Hygiene Association.
Sant, Karilyn E., Olivia L. Venezia, Paul P. Sinno, and Alicia R. Timme-Laragy. 2018. Perfluorobutanesulfonic Acid
Disrupts Pancreatic Organogenesis and Regulation of Lipid Metabolism in the Zebrafish, Danio rerio. Toxicological Sciences 167 (1):258-268. 10.1093/toxsci/kfy237.
Sato, I., K. Kawamoto, Y. Nishikawa, S. Tsuda, M. Yoshida, K. Yaegashi, N. Saito, W. Liu, and Y. Jin. 2009.
Neurotoxicity of perfluorooctane sulfonate (PFOS) in rats and mice after single oral exposure. J Toxicol Sci 34
(5):569-74.
Savitz, D. A., C. R. Stein, S. M. Bartell, B. Elston, J. Gong, H. M. Shin, and G. A. Wellenius. 2012. Perfluorooctanoic
acid exposure and pregnancy outcome in a highly exposed community. Epidemiology 23 (3):386-92. 10.1097/EDE.0b013e31824cb93b.
468

Schaefer, C. E. . 2018. Electrochemical Treatment of AFFF-Impacted Groundwater. Emerging Contaminants
Summit,, Westminster, Colorado, , March 6-7, 2018.
Schaefer, Charles E., Christina Andaya, Ana Urtiaga, Erica R. McKenzie, and Christopher P. Higgins. 2015.
Electrochemical treatment of perfluorooctanoic acid (PFOA) and perfluorooctane sulfonic acid (PFOS) in
groundwater impacted by aqueous film forming foams (AFFFs). Journal of Hazardous Materials 295:170-175. https://doi.org/10.1016/j.jhazmat.2015.04.024.
Schaefer, Charles E., Christina Andaya, Aniela Burant, Charles W. Condee, Ana Urtiaga, Timothy J. Strathmann,
and Christopher P. Higgins. 2017. Electrochemical treatment of perfluorooctanoic acid and perfluorooctane sulfonate: Insights into mechanisms and application to groundwater treatment. Chemical Engineering Journal
317:424-432. https://doi.org/10.1016/j.cej.2017.02.107.
Schaefer, Charles E., Sarah Choyke, P. Lee Ferguson, Christina Andaya, Aniela Burant, Andrew Maizel, Timothy J. Strathmann, and Christopher P. Higgins. 2018. Electrochemical Transformations of
Perfluoroalkyl Acid (PFAA) Precursors and PFAAs in Groundwater Impacted with Aqueous Film
Forming Foams. Environmental Science & Technology 52 (18):10689-10697.
10.1021/acs.est.8b02726.
Schaefer, Charles E., Veronika Culina, Dung Nguyen, and Jennifer Field. 2019. Uptake of Poly- and
Perfluoroalkyl Substances at the Air–Water Interface. Environmental Science & Technology 53
(21):12442-12448. https://doi.org/10.1021/acs.est.9b04008.
Schaefer, Charles, E., Dung Nguyen, Emerson Christie, Stefanie Shea, P. Higgins Christopher, and A. Field
Jennifer. 2021. Desorption of Poly- and Perfluoroalkyl Substances from Soil Historically Impacted with
Aqueous Film-Forming Foam. Journal of Environmental Engineering 147 (2):06020006.
https://doi.org/10.1061/(ASCE)EE.1943-7870.0001846.
Schaider, L. A., J. M. Ackerman, and R. A. Rudel. 2016. Septic systems as sources of organic wastewater
compounds in domestic drinking water wells in a shallow sand and gravel aquifer. Sci Total Environ 547:470-
481. 10.1016/j.scitotenv.2015.12.081.
Schaider, Laurel A., Simona A. Balan, Arlene Blum, David Q. Andrews, Mark J. Strynar, Margaret E. Dickinson,
David M. Lunderberg, Johnsie R. Lang, and Graham F. Peaslee. 2017. Fluorinated Compounds in U.S. Fast Food Packaging. Environmental Science & Technology Letters 4 (3):105-111. 10.1021/acs.estlett.6b00435.
Schenker, Urs, Martin Scheringer, Matthew MacLeod, Jonathan W. Martin, Ian T. Cousins, and Konrad
Hungerbühler. 2008. Contribution of Volatile Precursor Substances to the Flux of Perfluorooctanoate to the
Arctic. Environmental Science & Technology 42 (10):3710-3716. 10.1021/es703165.
Scher, Deanna P., James E. Kelly, Carin A. Huset, Kitrina M. Barry, Richard W. Hoffbeck, Virginia L. Yingling, and
Rita B. Messing. 2018. Occurrence of perfluoroalkyl substances (PFAS) in garden produce at homes with a
history of PFAS- contaminated drinking water. Chemosphere 196:548-555. https://doi.org/10.1016/j.chemosphere.2017.12.179.
Scheringer, Martin, Xenia Trier, Ian T. Cousins, Pim de Voogt, Tony Fletcher, Zhanyun Wang, and Thomas F.
Webster.
2014. Helsingør Statement on poly- and perfluorinated alkyl substances (PFASs). Chemosphere 114:337-
339. https://doi.org/10.1016/j.chemosphere.2014.05.044.
Schuetze, Andrea, Thomas Heberer, Stefan Effkemann, and Susanne Juergensen. 2010. Occurrence and
assessment of perfluorinated chemicals in wild fish from Northern Germany. Chemosphere 78 (6):647-652. https://doi.org/10.1016/j.chemosphere.2009.12.015.
469

Schultz, Melissa M., Christopher P. Higgins, Carin A. Huset, Richard G. Luthy, Douglas F. Barofsky, and Jennifer A.
Field. 2006. Fluorochemical Mass Flows in a Municipal Wastewater Treatment Facility. Environmental
Science & Technology 40 (23):7350-7357. 10.1021/es061025.
Schultz, Melissa M., Douglas F. Barofsky, and Jennifer A. Field. 2004. Quantitative Determination of Fluorotelomer Sulfonates in Groundwater by LC MS/MS. Environmental Science & Technology 38 (6):1828-
1835. 10.1021/es035031.
Schwarzenbach, R. P., P.M. Gschwend, and D.M. Imboden. 2003. Environmental Organic Chemistry, 2nd Edition.
Hoboken, NJ: Wiley-Interscience. ISBN No. 0471357502.
Schwichtenberg, Trever, Dorin Bogdan, Courtney C. Carignan, Patrick Reardon, Justin Rewerts, Thomas
Wanzek, and Jennifer A. Field. 2020. PFAS and Dissolved Organic Carbon Enrichment in Surface Water Foams on a Northern U.S. Freshwater Lake. Environmental Science & Technology 54 (22):14455-14464.
https://doi.org/10.1021/acs.est.0c05697.
Science History Institute. 2017. Historical Biography: Roy J. Plunkett. Last Modified December 14 2017. accessed 2021. https://www.sciencehistory.org/historical-profile/roy-j-plunkett.
Seacat, A. M., P. J. Thomford, K. J. Hansen, G. W. Olsen, M. T. Case, and J. L. Butenhoff. 2002. Subchronic
toxicity studies on perfluorooctanesulfonate potassium salt in cynomolgus monkeys. Toxicol Sci 68 (1):249-64. 10.1093/toxsci/68.1.249.
Sedlak, Margaret D., and Denise J. Greig. 2012. Perfluoroalkyl compounds (PFCs) in wildlife from an urban
estuary.
Journal of Environmental Monitoring 14 (1):146-154. 10.1039/C1EM10609K.
Sedlak, Margaret, Jonathan P. Benskin, Adam Wong, Richard Grace, and Denise Greig. 2017. Per- and
polyfluoroalkyl substances (PFASs) in San Francisco Bay wildlife: Temporal trends, exposure pathways,
and notable presence of precursor compounds. Chemosphere 185:1217-1226.
https://doi.org/10.1016/j.chemosphere.2017.04.096.
Sehmel, G. A. 1984. Deposition and Resuspension. Atmospheric Science and Power Production. Report
DOE/TIC-27601: U.S. Department of Energy.
Sekiguchi, Kazuhiko, Takahisa Kudo, and Kenshi Sankoda. 2017. Combined sonochemical and short-wavelength
UV degradation of hydrophobic perfluorinated compounds. Ultrasonics Sonochemistry 39:87-92. https://doi.org/10.1016/j.ultsonch.2017.04.002.
Seltenrich, Nate. Guiding Communities Affected by PFASs: Tools for Tackling Contaminated Drinking Water.
Environmental Health Perspectives 127 (2):024003. 10.1289/EHP4170.
Sepulvado, Jennifer G., Andrea C. Blaine, Lakhwinder S. Hundal, and Christopher P. Higgins. 2011.
Occurrence and Fate of Perfluorochemicals in Soil Following the Land Application of Municipal Biosolids.
Environmental Science & Technology 45 (19):8106-8112. https://doi.org/10.1021/es103903.
SERDP-ESTCP. 2017. In Situ and Ex Situ Remediation of Per- and Polyfluoroalkyl Substance Contaminated
Groundwater.
FY Statement of Need. Environmental Restoration Program Area.
https://www.serdp-estcp.org/Program-Areas/Environmental-Restoration/Contaminated-Groundwater/Contaminated-G roundwater-SONs/PFAS-Remediation/(language)/eng-US. .
SERDP-ESTCP. 2017. Summary Report: SERDP and ESTCP Workshop on Research and Demonstration Needs for Management of AFFF-Impacted Sites.
470

SERDP-ESTCP. 2019. Per- and Polyfluoroalkyl Substances (PFASs). accessed 2019.
https://www.serdp-estcp.org/Featured-Initiatives/Per-and-Polyfluoroalkyl-Substances-PFASs.
SFB RWQCB. 2020. Transmittal of Interim Final Environmental Screening Levels (ESLs) for Two Per- and Polyfluoroalkyl Substances (PFAS): Perfluorooctane Sulfonate (PFOS) and Perfluorooctanoate (PFOA).
https://www.waterboards.ca.gov/sanfranciscobay/water_issues/programs/ESL/PFAS_ESL_Memo.pdf.
Shan, G., M. Wei, L. Zhu, Z. Liu, and Y. Zhang. 2014. Concentration profiles and spatial distribution of
perfluoroalkyl substances in an industrial center with condensed fluorochemical facilities. Science of
The Total Environment 490:351-9. https://doi.org/10.1016/j.scitotenv.2014.05.005.
Shi, Yali, Robin Vestergren, Lin Xu, Xiaowei Song, Xiameng Niu, Chunhui Zhang, and Yaqi Cai. 2015.
Characterizing direct emissions of perfluoroalkyl substances from ongoing fluoropolymer production sources:
A spatial trend study of Xiaoqing River, China. Environmental Pollution 206:104-112.
https://doi.org/10.1016/j.envpol.2015.06.035.
Shi, Z., H. Zhang, L. Ding, Y. Feng, M. Xu, and J. Dai. 2009. The effect of perfluorododecanonic acid on
endocrine status, sex hormones and expression of steroidogenic genes in pubertal female rats. Reprod Toxicol 27 (3-4):352-359.
10.1016/j.reprotox.2009.02.008.
Shi, Z., L. Ding, H. Zhang, Y. Feng, M. Xu, and J. Dai. 2009. Chronic exposure to perfluorododecanoic acid disrupts testicular steroidogenesis and the expression of related genes in male rats. Toxicol Lett 188
(3):192-200. 10.1016/j.toxlet.2009.04.014.
Shin, Hyeong-Moo, P. B. Ryan, V. M. Vieira, and S. M. Bartell. 2012. Modeling the air-soil transport pathway of
perfluorooctanoic acid in the mid-Ohio Vallley using linked air dispersion and vadose zone models. Atmospheric Environment 51:67-74.
Shin, Hyeong-Moo, Verónica M. Vieira, P. Barry Ryan, Russell Detwiler, Brett Sanders, Kyle Steenland, and Scott
M. Bartell. 2011. Environmental Fate and Transport Modeling for Perfluorooctanoic Acid Emitted from the
Washington Works Facility in West Virginia. Environmental Science & Technology 45 (4):1435-1442. 10.1021/es102769.
Shoeib, Mahiba, Penny Vlahos, Tom Harner, Andrew Peters, Margaret Graustein, and Julie Narayan. 2010.
Survey of polyfluorinated chemicals (PFCs) in the atmosphere over the northeast Atlantic Ocean.
Atmospheric Environment 44 (24):2887-2893. https://doi.org/10.1016/j.atmosenv.2010.04.056.
Shoeib, Mahiba, Tom Harner, Glenys M. Webster, and Sum Chi Lee. 2011. Indoor Sources of Poly- and
Perfluorinated Compounds (PFCS) in Vancouver, Canada: Implications for Human Exposure. Environmental Science & Technology 45 (19):7999-8005. 10.1021/es103562.
Shoeib, Mahiba, Tom Harner, Michael Ikonomou, and Kurunthachalam Kannan. 2004. Indoor and Outdoor Air
Concentrations and Phase Partitioning of Perfluoroalkyl Sulfonamides and Polybrominated Diphenyl Ethers.
Environmental Science & Technology 38 (5):1313-1320. 10.1021/es0305555.
Shoemaker, J. A., and D. Tettenhorst. 2018. Method 537.1: Determination of Selected Per- and Polyfluorinated
Alkyl Substances in Drinking Water by Solid Phase Extraction and Liquid Chromatography/Tandem Mass
Spectrometry (LC/MS/MS). Washington, D. C.: Office of Research and Development U.S. Environmental
Protection Agency, National Center for Environmental Assessment.
Shoemaker, J. A., P.E. Grimmett, and B.K. Boutin. 2009. Determination of Selected Perfluorinated Alkyl Acids in Drinking Water by Solid Phase Extraction and Liquid Chromatography/Tandem Mass Spectrometry (LC/MS/MS).
USEPA Method 537, Rev 1.1, EPA 600-R-08-092: USEPA.
471

Shoemaker, J., and D. Tettenhorst. 2020. Method 537.1 Determination of Selected Per- and Polyflourinated
Alkyl Substances in Drinking Water by Solid Phase Extraction and Liquid Chromatography/Tandem Mass Spectrometry (LC/MS/MS). Revision 2.0. Washington D.C.: U.S. Environmental Protection Agency.
https://cfpub.epa.gov/si/si_public_record_report.cfm?dirEntryId=348508&Lab=CESER&simpleSearch=0&showCr
iteria=2&searchAll=537.1&TIMSType=&dateBeginPublishedPresented=03%2F24%2F2018.
Shultz, M.R., R.S. Cramer, C. Plank, H. Levine, and K. Ehman. 2017. A Practical Guide for Applying
Environmental Sequence Stratigraphy to Improve Conceptual Site Models. EPA/600/R-17/293: USEPA.
SIA. 2008. Use of PFAS/PFOA Compounds by USSIA Members in 2008..
Sibinski, L.J. . 1987. Final report of a two year oral (diet) toxicity and carcinogenicity study of fluorochemical FC-
143 (perfluorooctanoate ammonium carboxylate) in rats. . Vol. 1-4, 3M Company/RIKER. No.0281CR0012; 8EHQ-1087-0394.
Siegrist, R.L., M. Crimi, and T.J. Simpkin. 2011. In situ Chemical Oxidation for Groundwater Remediation. Edited by
R.L. Siegrist, M. Crimi and T.J. Simpkin. Vol. 3, SERDP ESTCP Environmental Remediation Technology. New
York: Springer- Verlag. ISBN No. 78-1-4419-7825-7.
Sigma-Aldrich web page. 2018. Sigma-Aldrich web page. http://www.sigmaaldrich.com/united-states.html
Silva, Jeff A. K., William A. Martin, and John E. McCray. 2021. Air-water interfacial adsorption coefficients for PFAS
when present as a multi-component mixture. Journal of Contaminant Hydrology 236:103731.
https://doi.org/10.1016/j.jconhyd.2020.103731.
Simon, John A., Stew Abrams, Tim Bradburne, Dan Bryant, Matthew Burns, Daniel Cassidy, John Cherry,
Sheau-Yun Chiang, Douglas Cox, Michelle Crimi, Elizabeth Denly, Bill DiGuiseppi, Jim Fenstermacher, Stephanie Fiorenza, Joseph Guarnaccia, Nathan Hagelin, Linda Hall, John Hesemann, Erika Houtz, Stephen
S. Koenigsberg, Francois Lauzon, Jeffrey Longsworth, Tom Maher, Angus McGrath, Ravi Naidu, Charles J.
Newell, Beth L. Parker, Tadbir Singh, Paul Tomiczek, and Rick Wice. 2019. PFAS Experts Symposium:
Statements on regulatory policy, chemistry and analtyics, toxicology, transport/fate, and remediation for per- and polyfluoroalkyl substances (PFAS) contamination issues.
Remediation Journal 29 (4):31-48. 10.1002/rem.21624.
Simpson, Stuart L., Yawen Liu, David A. Spadaro, Xinhong Wang, Rai S. Kookana, and Graeme E. Batley. 2021.
Chronic effects and thresholds for estuarine and marine benthic organism exposure to perfluorooctane
sulfonic acid (PFOS)- contaminated sediments: Influence of organic carbon and exposure routes. Science of
The Total Environment 776:146008. https://doi.org/10.1016/j.scitotenv.2021.146008.
Sinclair, A., and A. Diduck. 2009. Public participation in Canadian environmental assessment: enduring challenges and future directions. In Environmental impact assessment: practice and participation, Second
edition, edited by K. Hanna, 58-82. Ontario: Oxford University Press. ISBN No. 9780195430226.
Sindermann, A. B., J. R. Porch, H. O. Krueger, and R. L. Van Hoven. 2002. PFOS: an acute toxicity study with the
earthworm in an artificial soil substrate. edited by Project No. 454-11. EPA Docket AR226-1106. Easton, MD.:
Wildlife International Ltd.
Singh, Raj Kamal, Nicholas Multari, Chase Nau-Hix, Richard H. Anderson, Stephen D. Richardson, Thomas M.
Holsen, and Selma Mededovic Thagard. 2019. Rapid Removal of Poly- and Perfluorinated Compounds from
Investigation-Derived Waste (IDW) in a Pilot-Scale Plasma Reactor. Environmental Science & Technology
53 (19):11375-11382. 10.1021/acs.est.9b02964.
Singh, Shilpi, and Shio Kumar Singh. 2018. Prepubertal exposure to perfluorononanoic acid interferes with
spermatogenesis and steroidogenesis in male mice. Ecotoxicology and Environmental Safety 170:590-599. 10.1016/j.ecoenv.2018.12.034.
472

Singh, Shilpi, and Shio Kumar Singh. 2019. Chronic exposure to perfluorononanoic acid impairs
spermatogenesis, steroidogenesis and fertility in male mice. Journal of Applied Toxicology 39 (3):420-431. 10.1002/jat.3733.
Skutlarek, D., M. Exner, and H. Farber. 2006. Perfluorinated surfactants in surface and drinking waters. Environ Sci Pollut Res Int 13 (5):299-307.
Slinn, W.G.N. 1984. Precipitation Scavening. In: Atmospheric Science and Power Production. U.S. Department of
Energy. Report DOE/TIC-27601.
Slovic, P. . 1987. Perception of Risk. Science 23:280-285.
Slovic, Paul, Baruch Fischhoff, and Sarah Lichtenstein. 1982. Why Study Risk Perception? Risk Analysis 2 (2):83-93.10.1111/j.1539-6924.1982.tb01369.x.
Slovic, Paul. 1997. Public perception of risk. Journal of environmental health 59 (9):22-25.
Slovic, Paul. 2003. Going Beyond the Red Book: The Sociopolitics of Risk. Human and Ecological Risk
Assessment: An International Journal 9 (5):1181-1190. 10.1080/10807030390244577.
Smith, J. W. N., B. Beuthe, M. Dunk, S. Demeure, J. M. M. Carmona, A. Medve, M. J. Spence, Tessa Pancras, G.
Schrauwen, Thomas Held, K. Baker, Ian Ross, and Hans Slenders. 2016. Environmental fate and effects of poly
and perfluoroalkyl substances (PFAS). 8/16: CONCAWE Reports. https://www.concawe.eu.
Smithwick, Marla, Derek C. G. Muir, Scott A. Mabury, Keith R. Solomon, Jonathan W. Martin, Christian Sonne,
Erik W. Born, Robert J. Letcher, and Rune Dietz. 2005. Perfluoroalkyl contaminants in liver tissue from East Greenland polar bears (Ursus maritimus). Environmental Toxicology and Chemistry 24 (4):981-986.
10.1897/04-258R.1.
Smithwick, Marla, Scott A. Mabury, Keith R. Solomon, Christian Sonne, Jonathan W. Martin, Erik W. Born, Rune
Dietz, Andrew E. Derocher, Robert J. Letcher, Thomas J. Evans, Geir W. Gabrielsen, John Nagy, Ian Stirling, Mitch K. Taylor, and Derek C. G. Muir. 2005. Circumpolar Study of Perfluoroalkyl Contaminants in Polar Bears
(Ursus maritimus). Environmental Science & Technology 39 (15):5517-5523. 10.1021/es048309.
Snyder, S. A., E. C. Wert, H. X. Lei, P. Westerhoff, and Y. Yoon. . 2007. Removal of EDCs and Pharmaceuticals
in Drinking and Reuse Treatment Processes. AWWA Research Foundation, Denver, Colorado.
Sobolewski, M., K. Conrad, J. L. Allen, H. Weston, K. Martin, B. P. Lawrence, and D. A. Cory-Slechta. 2014. Sex-specific enhanced behavioral toxicity induced by maternal exposure to a mixture of low dose
endocrine-disrupting chemicals. Neurotoxicology 45:121-30. 10.1016/j.neuro.2014.09.008.
Son, H. Y., S. H. Kim, H. I. Shin, H. I. Bae, and J. H. Yang. 2008. Perfluorooctanoic acid-induced hepatic toxicity
following 21-day oral exposure in mice. Arch Toxicol 82 (4):239-46. 10.1007/s00204-007-0246-x.
Son, H. Y., S. Lee, E. N. Tak, H. S. Cho, H. I. Shin, S. H. Kim, and J. H. Yang. 2009. Perfluorooctanoic acid alters T lymphocyte phenotypes and cytokine expression in mice. Environ Toxicol 24 (6):580-8. 10.1002/tox.20459.
Song, Shuang, Jiaqi Fan, Zhiqiao He, Liyong Zhan, Zhiwu Liu, Jianmeng Chen, and Xinhua Xu. 2010. Electrochemical degradation of azo dye C.I. Reactive Red 195 by anodic oxidation on Ti/SnO2–Sb/PbO2
electrodes. Electrochimica Acta 55 (11):3606-3613. https://doi.org/10.1016/j.electacta.2010.01.101.
Song, Yinan, Deyi Hou, Junli Zhang, David OConnor, Guanghe Li, Qingbao Gu, Shupeng Li, and Peng Liu. 2018.
Environmental and socio-economic sustainability appraisal of contaminated land remediation strategies:
A case study at a mega-site in China. Science of The Total Environment 610-611:391-401. https://doi.org/10.1016/j.scitotenv.2017.08.016.
473
Song, Zhou, Heqing Tang, Nan Wang, and Lihua Zhu. 2013. Reductive defluorination of perfluorooctanoic acid
by hydrated electrons in a sulfite-mediated UV photochemical system. Journal of Hazardous Materials 262:332-338. https://doi.org/10.1016/j.jhazmat.2013.08.059.
Stahl, Leanne L., Blaine D. Snyder, Anthony R. Olsen, Thomas M. Kincaid, John B. Wathen, and Harry B. McCarty.
2014.
Perfluorinated compounds in fish from U.S. urban rivers and the Great Lakes. Science of The Total Environment 499:185-195. https://doi.org/10.1016/j.scitotenv.2014.07.126.
Stahl, T., J. Heyn, H. Thiele, J. Huther, K. Failing, S. Georgii, and H. Brunn. 2009. Carryover of perfluorooctanoic acid (PFOA) and perfluorooctane sulfonate (PFOS) from soil to plants. Archives of
Environmental Contamination and Toxicology 57 (2):289-98. https://doi.org/10.1007/s00244-008-9272-9.
Stahl, Thorsten, Rika Alessa Riebe, Sandy Falk, Klaus Failing, and Hubertus Brunn. 2013. Long-Term
Lysimeter Experiment To Investigate the Leaching of Perfluoroalkyl Substances (PFASs) and the Carry-over from Soil to Plants: Results of a Pilot Study. Journal of Agricultural and Food Chemistry 61 (8):1784-
1793. 10.1021/jf305003.
State of Virginia. 2019. Section 9.1-207.1 Firefighting foam management. Richmond, VA.
https://trackbill.com/bill/virginia-house-bill-2762-firefighting-foam-management-use-of-foam-that-contains-pfas-chem icals/1640449/.
Steenland, K., and S. Woskie. 2012. Cohort mortality study of workers exposed to perfluorooctanoic acid. Am J Epidemiol 176 (10):909-17. 10.1093/aje/kws171.
Steenland, K., V. Barry, and D. Savitz. 2018. Serum Perfluorooctanoic Acid and Birthweight: An Updated Meta-analysis With Bias Analysis. Epidemiology 29 (6):765-776. 10.1097/ede.0000000000000903.
Steenland, Kyle, Chuangfang Jin, Jessica MacNeil, Cathy Lally, Alan Ducatman, Veronica Vieira, and Tony
Fletcher. 2009. Predictors of PFOA levels in a community surrounding a chemical plant. Environmental health
perspectives 117 (7):1083-1088. 10.1289/ehp.0800294.
Stefani, F., M. Rusconi, S. Valsecchi, and L. Marziali. 2014. Evolutionary ecotoxicology of perfluoralkyl substances
(PFASs) inferred from multigenerational exposure: a case study with Chironomus riparius (Diptera,
Chironomidae). Aquat Toxicol 156:41-51. 10.1016/j.aquatox.2014.07.020.
Stein, C. R., M. S. Wolff, A. M. Calafat, K. Kato, and S. M. Engel. 2012. Comparison of polyfluoroalkyl compound
concentrations in maternal serum and amniotic fluid: a pilot study. Reprod Toxicol 34 (3):312-6. 10.1016/j.reprotox.2012.05.039.
Stein, Cheryl R., David A. Savitz, and Marcelle Dougan. 2009. Serum Levels of Perfluorooctanoic
Acid and Perfluorooctane Sulfonate and Pregnancy Outcome. American Journal of Epidemiology 170 (7):837-846. 10.1093/aje/kwp212.
Steinle-Darling, Eva, and Martin Reinhard. 2008. Nanofiltration for Trace Organic Contaminant Removal:
Structure, Solution, and Membrane Fouling Effects on the Rejection of Perfluorochemicals. Environmental
Science & Technology 42 (14):5292-5297. 10.1021/es703207.
Stevens, J.B. , and A. Coryell. 2007. Surface Water Quality Criterion for Perfluorooctanoic Acid. STS Project
200604 796.
St. Paul, MN: Minnesota Pollution Control Agency.
Stevens, J.B., and A. Coryell. 2007. Surface water quality criterion for perfluorooctane sulfonic acid. STS
Project 200604796. St. Paul, MN: Minnesota Pollution Control Agency.
474

Stevenson, Charlotte N., Laura A. MacManus-Spencer, Till Luckenbach, Richard G. Luthy, and David Epel.
2006. New Perspectives on Perfluorochemical Ecotoxicology: Inhibition and Induction of an Efflux
Transporter in the Marine Mussel, Mytilus californianus. Environmental Science & Technology 40 (17):5580-5585. 10.1021/es0602593.
Stewart, R. 2017. Immobilization and Safe Disposal of Aqueous Film Forming Foam (AFFF) Impacted Soil in
Australia. Battelle International Symposium on Bioremediation and Sustainable Environmental
Technologies, Miami, Florida, May 22-25, 2017 Abstract No.
Stewart, R., and R. McFarland. 2017. Immobilization of Per- and Polyfluorinated Alkyl Substances (PFAS) in 14
Soils from Airport Sites across Australia. Batelle International Symposium on Bioremediation and Sustainable
Environmental Technologies, Miami, Florida, May 22-25, 2017.
Stewart, R., C. Lawrence, and J. Kirk. 2016. An Aluminum Hydroxide Formulation Outperforms Activiated Carbon
in Binding Shorter Chain Per- and Poly-Fluorinated Alkyl Substances (PFAS). Tenth International Conference on Remediation and Recalcitrant Compounds, Palm Springs, California. , May 2016.
Stock, Naomi L., Fiona K. Lau, David A. Ellis, Jonathan W. Martin, Derek C. G. Muir, and Scott A. Mabury. 2004.
Polyfluorinated Telomer Alcohols and Sulfonamides in the North American Troposphere. Environmental
Science & Technology 38 (4):991-996. 10.1021/es034644.
Stock, Naomi L., Vasile I. Furdui, Derek C. G. Muir, and Scott A. Mabury. 2007. Perfluoroalkyl Contaminants in the Canadian Arctic: Evidence of Atmospheric Transport and Local Contamination. Environmental Science &
Technology 41 (10):3529-3536. 10.1021/es062709.
Stockholm Convention. 2001. Stockholm Convention on Persistent Organic Pollutants.
Stoiber, Tasha, Sydney Evans, and Olga V. Naidenko. 2020. Disposal of products and materials containing per-
and polyfluoroalkyl substances (PFAS): A cyclical problem. Chemosphere 260:127659. https://doi.org/10.1016/j.chemosphere.2020.127659.
Strathmann, T. . 2018. UV-sulfite photochemical destruction of PFAS. Emerging Contaminants Summit,
Westminster, Colorado, March 6-7, 2018.
Stratton, G. R., F. Dai, C. L. Bellona, T. M. Holsen, E. R. Dickenson, and S. Mededovic Thagard. 2017. Plasma-
Based Water Treatment: Efficient Transformation of Perfluoroalkyl Substances in Prepared Solutions and
Contaminated Groundwater. Environ Sci Technol 51 (3):1643-1648. 10.1021/acs.est.6b04215.
Strynar, Mark J., and Andrew B. Lindstrom. 2008. Perfluorinated Compounds in House Dust from Ohio and North
Carolina, USA. Environmental Science & Technology 42 (10):3751-3756. 10.1021/es7032058.
Strynar, Mark J., Andrew B. Lindstrom, Shoji F. Nakayama, Peter P. Egeghy, and Laurence J. Helfant. 2012. Pilot scale application of a method for the analysis of perfluorinated compounds in surface soils. Chemosphere
86 (3):252-257. https://doi.org/10.1016/j.chemosphere.2011.09.036.
Stuchal, L., and S. Roberts. 2019. Development of Surface Water Screening Levels for PFOA and PFOS Based
on the Protection of Human Health. Center for Environmental & Human Toxicology University of Florida.
Stump, D. G., J. F. Holson, S. R. Murphy, C. H. Farr, B. Schmit, and M. Shinohara. 2008. An oral two-generation reproductive toxicity study of S-111-S-WB in rats. Reprod Toxicol 25 (1):7-20.
10.1016/j.reprotox.2007.10.002.
Stylianou, Marios, Maria K. Björnsdotter, Per-Erik Olsson, Ingrid Ericson Jogsten, and Jana Jass. 2019. Distinct
transcriptional response of Caenorhabditis elegans to different exposure routes of perfluorooctane sulfonic
acid. Environmental Research 168:406-413. https://doi.org/10.1016/j.envres.2018.10.019.
475
Suh, C. H., N. K. Cho, C. K. Lee, C. H. Lee, D. H. Kim, J. H. Kim, B. C. Son, and J. T. Lee. 2011.
Perfluorooctanoic acid- induced inhibition of placental prolactin-family hormone and fetal growth retardation in mice. Mol Cell Endocrinol 337 (1-2):7-15. 10.1016/j.mce.2011.01.009.
Sun, Mei, Elisa Arevalo, Mark Strynar, Andrew Lindstrom, Michael Richardson, Ben Kearns, Adam Pickett,
Chris Smith, and Detlef R. U. Knappe. 2016. Legacy and Emerging Perfluoroalkyl Substances Are
Important Drinking Water Contaminants in the Cape Fear River Watershed of North Carolina.
Environmental Science & Technology Letters 3 (12):415-419. https://doi.org/10.1021/acs.estlett.6b00398.
Sundstrom, M., S. C. Chang, P. E. Noker, G. S. Gorman, J. A. Hart, D. J. Ehresman, A. Bergman, and J. L.
Butenhoff. 2012. Comparative pharmacokinetics of perfluorohexanesulfonate (PFHxS) in rats, mice, and
monkeys. Reprod Toxicol 33 (4):441-451. 10.1016/j.reprotox.2011.07.004.
Sutherland, C.A., and H. O. Krueger. 2001. A 96-hour toxicity test with the freshwater diatom (Navicula
pelliculosa). Wildlife International Ltd. Project number 454A-112.
Synquest Laboratories. Synquest Laboratories web page. http://synquestlabs.com
Szabo, J., J. Hall, J. Hall, M. Magnuson, S. Panguluri, and G. Meiners. 2017. Treatment of Perfluorinated Alkyl
Substances in Wash Water using Granular Activated Carbon and Mixed Media. EPA/600/R-17/175: USEPA
Office of Research and Development.
Söderqvist, Tore, Petra Brinkhoff, Tommy Norberg, Lars Rosén, Pär-Erik Back, and Jenny Norrman. 2015. Cost-
benefit analysis as a part of sustainability assessment of remediation alternatives for contaminated land.
Journal of Environmental Management 157:267-278. https://doi.org/10.1016/j.jenvman.2015.04.024.
Sörengård, Mattias, Dan B. Kleja, and Lutz Ahrens. 2019. Stabilization and solidification remediation of soil
contaminated with poly- and perfluoroalkyl substances (PFASs). Journal of Hazardous Materials 367:639-646. https://doi.org/10.1016/j.jhazmat.2019.01.005.
Takahashi, M., S. Ishida, M. Hirata-Koizumi, A. Ono, and A. Hirose. 2014. Repeated dose and
reproductive/developmental toxicity of perfluoroundecanoic acid in rats. J Toxicol Sci 39 (1):97-108.
Takeuchi, N., Y. Kitagawa, A. Kosugi, K. Tachibana, H. Obo, and K. Yasuoka. 2013. Plasma-liquid interfacial reaction in decomposition of perfluoro surfactants. Journal of Physics D Applied Physics 47 (4):045203.
https://doi.org/10.1088/0022-3727/47/4/045203.
Tan, X., G. Xie, X. Sun, Q. Li, W. Zhong, P. Qiao, X. Sun, W. Jia, and Z. Zhou. 2013. High fat diet feeding
exaggerates perfluorooctanoic acid-induced liver injury in mice via modulating multiple metabolic pathways. PLoS One 8 (4):e61409. 10.1371/journal.pone.0061409.
Tang, Chuyang Y., Q. Shiang Fu, A. P. Robertson, Craig S. Criddle, and James O. Leckie. 2006. Use of Reverse
Osmosis Membranes to Remove Perfluorooctane Sulfonate (PFOS) from Semiconductor Wastewater.
Environmental Science & Technology 40 (23):7343-7349. 10.1021/es060831.
Tang, Chuyang Y., Q. Shiang Fu, Craig S. Criddle, and James O. Leckie. 2007. Effect of Flux (Transmembrane
Pressure) and Membrane Properties on Fouling and Rejection of Reverse Osmosis and Nanofiltration Membranes Treating Perfluorooctane Sulfonate Containing Wastewater. Environmental Science &
Technology 41 (6):2008-2014.
10.1021/es062052.
Tang, Heqing, Qingqing Xiang, Min Lei, Jingchun Yan, Lihua Zhu, and Jing Zou. 2012. Efficient degradation of
perfluorooctanoic acid by UV–Fenton process. Chemical Engineering Journal 184:156-162.
https://doi.org/10.1016/j.cej.2012.01.020.
476

Taniyasu, Sachi, Nobuyoshi Yamashita, Hyo-Bang Moon, Karen Y Kwok, Paul Lam, Yuichi Horii, Gert Petrick, and
Kurunthachalam Kannan. 2013. Does wet precipitation represent local and regional atmospheric transportation by perfluorinated alkyl substances? Environment international 55:25-32.
https://doi.org/10.1016/j.envint.2013.02.005.
Tao, Lin, Jing Ma, Tatsuya Kunisue, E. Laurence Libelo, Shinsuke Tanabe, and Kurunthachalam Kannan. 2008.
Perfluorinated Compounds in Human Breast Milk from Several Asian Countries, and in Infant Formula and
Dairy Milk from the United States. Environmental Science & Technology 42 (22):8597-8602. 10.1021/es801875.
Tao, Lin, Kurunthachalam Kannan, Chung M. Wong, Kathleen F. Arcaro, and John L. Butenhoff. 2008.
Perfluorinated Compounds in Human Milk from Massachusetts, U.S.A. Environmental Science &
Technology 42 (8):3096-3101. 10.1021/es702789.
Tao, Yousheng, Hirofumi Kanoh, Lloyd Abrams, and Katsumi Kaneko. 2006. Mesopore-Modified Zeolites:
Preparation, Characterization, and Applications. Chemical Reviews 106 (3):896-910. 10.1021/cr040204.
Tartu, Sabrina, Jon Aars, Magnus Andersen, Anuschka Polder, Sophie Bourgeon, Benjamin Merkel, Andrew
D. Lowther, Jenny Bytingsvik, Jeffrey M. Welker, Andrew E. Derocher, Bjørn Munro Jenssen, and Heli
Routti. 2018. Choose Your Poison—Space-Use Strategy Influences Pollutant Exposure in Barents Sea Polar Bears. Environmental Science & Technology. 10.1021/acs.est.7b06137.
Tatum-Gibbs, K., J. F. Wambaugh, K. P. Das, R. D. Zehr, M. J. Strynar, A. B. Lindstrom, A. Delinsky, and C. Lau.
2011.
Comparative pharmacokinetics of perfluorononanoic acid in rat and mouse. Toxicology 281 (1-3):48-55. 10.1016/j.tox.2011.01.003.
Taylor, Matthew D., Jennifer Bräunig, Jochen F. Mueller, Marcus Crompton, R. Hugh Dunstan, and Sandra
Nilsson. 2019.
Metabolomic profiles associated with exposure to per- and polyfluoroalkyl substances (PFASs) in aquatic environments. Environmental Science: Processes & Impacts 21 (11):1980-1990.
10.1039/C9EM00394K.
Taylor, P. H., T. Yamada, R. C. Striebich, J. L. Graham, and R. J. Giraud. 2014. Investigation of waste incineration of fluorotelomer-based polymers as a potential source of PFOA in the environment.
Chemosphere 110:17-22. https://doi.org/10.1016/j.chemosphere.2014.02.037.
TCEQ. 2016. Perfluoro Compounds (PFCs) Various CASRN Numbers, Revisions.. TCEQ. 2017. Texas Risk Reduction Program .
Teel, Amy, Dennis Finn, Jeremy Schmidt, Lynn Cutler, and Richard Watts. 2007. Rates of Trace Mineral-
Catalyzed Decomposition of Hydrogen Peroxide. Journal of Environmental Engineering 133 (8). https://doi.org/10.1061/(ASCE)0733-9372(2007)133:8(853).
Tennessee Riverkeeper, Inc. 2017. 3M Co., No. 5:16-cv-01029-AKK, 2017 WL 784991 (N.D. Ala. Feb.
10, 2017). Tersus Environmental. 2018. Chemical Fixation of Organic & Inorganic Contaminants.
Thackray, Colin, and Noelle Selin. 2017. Uncertainty and variability in atmospheric formation of
PFCAs from fluorotelomer precursors. Atmospheric Chemistry and Physics 17:4585-4597. https://doi.org/10.5194/acp-17-4585-2017.
Thalheimer, A.H., L. B. McConney, I. K. Kalinovich, A. V. Pigott, J. D. Franz, H. T. Holbert, D. Mericas, and Z. J.
Puchacz.
2017. Use and Potential Impacts of AFFF Containing PFASs at Airports (No. Project 02-60). The National
Academies of Sciences, Engineering, and Medicine. .
477

Thibodeaux, J. R., R. G. Hanson, J. M. Rogers, B. E. Grey, B. D. Barbee, J. H. Richards, J. L. Butenhoff, L. A.
Stevenson, and C. Lau. 2003. Exposure to perfluorooctane sulfonate during pregnancy in rat and mouse. I:
maternal and prenatal evaluations. Toxicol Sci 74 (2):369-81. 10.1093/toxsci/kfg121.
Thompson, Jack, Geoff Eaglesham, Julien Reungoat, Yvan Poussade, Michael Bartkow, Michael Lawrence, and
Jochen F. Mueller. 2011. Removal of PFOS, PFOA and other perfluoroalkyl acids at water reclamation plants
in South East Queensland Australia. Chemosphere 82 (1):9-17. https://doi.org/10.1016/j.chemosphere.2010.10.040.
Thomsen, C., L. S. Haug, H. Stigum, M. Froshaug, S. L. Broadwell, and G. Becher. 2010. Changes in
concentrations of perfluorinated compounds, polybrominated diphenyl ethers, and polychlorinated biphenyls
in Norwegian breast-milk during twelve months of lactation. Environ Sci Technol 44 (24):9550-6. 10.1021/es1021922.
Thoreson, K. 2017. PlumeStop Technology with an Overview on In Situ Containment of Perfluorinated Chemicals
(PFAS and PFOA).
Tian, Ying, Yiming Yao, Shuai Chang, Zhen Zhao, Yangyang Zhao, Xiaojia Yuan, Fengchang Wu, and Hongwen Sun. 2018.
Occurrence and Phase Distribution of Neutral and Ionizable Per- and Polyfluoroalkyl Substances (PFASs) in the Atmosphere and Plant Leaves around Landfills: A Case Study in Tianjin, China. Environmental
Science & Technology 52 (3):1301-1310. https://doi.org/10.1021/acs.est.7b05385.
Titaley, Ivan A., Florentino B. De la Cruz, and Jennifer A. Field. 2020. Comment on Release of Volatile
Per- and Polyfluoroalkyl Substances from Aqueous Film-Forming Foam. Environmental Science & Technology Letters 7 (11):866-868. https://doi.org/10.1021/acs.estlett.0c00591.
Tominaga, Nobuaki, Shinya Kohra, Taisen Iguchi, and Koji Arizono. 2004. Effects of Perfluoro Organic Compound
Toxicity on Nematode Caenorhabditis elegans Fecundity. Journal of Health Science 50 (5):545-550. https://doi.org/10.1248/jhs.50.545.
Tomy, Gregg T., Kerri Pleskach, Steve H. Ferguson, Jonathon Hare, Gary Stern, Gordia MacInnis, Chris H. Marvin,
and Lisa Loseto. 2009. Trophodynamics of Some PFCs and BFRs in a Western Canadian Arctic Marine Food
Web. Environmental Science & Technology 43 (11):4076-4081. 10.1021/es900162.
Tomy, Gregg T., Wes Budakowski, Thor Halldorson, Paul A. Helm, Gary A. Stern, Ken Friesen, Karen Pepper,
Sheryl A. Tittlemier, and Aaron T. Fisk. 2004. Fluorinated Organic Compounds in an Eastern Arctic Marine Food
Web. Environmental Science & Technology 38 (24):6475-6481. 10.1021/es049620.
Transport Canada. 2017. Per- and Polyfluoroalkyl Substances (PFAS) Field Sampling Guidance.
Trautmann, A. M., H. Schell, K. R. Schmidt, K-M. Mangold, and A. Tiehm. 2015. Electrochemical
degradation of perfluoroalkyl and polyfluoroalkyl substances (PFASs) in groundwater. Water Science
& Technology 71 (10):1569-1575. https://doi.org/10.2166/wst.2015.143.
Trier, Xenia, Kit Granby, and Jan Christensen. 2011. Polyfluorinated surfactants (PFS) in paper and board
coatings for food packaging. Environmental Science and Pollution Research 18:1108-1120.
https://doi.org/10.1007/s11356-010-0439-3.
Trudel, David, Lea Horowitz, Matthias Wormuth, Martin Scheringer, Ian T. Cousins, and Konrad Hungerbühler.
2008. Estimating Consumer Exposure to PFOS and PFOA. Risk Analysis 28 (2):251-269. 10.1111/j.1539-
6924.2008.01017.x.
478
Trumpey, A.J., D. Daigel, and G. Nowak. 2019. Communicating During an Outbreak of Public Health Investigation.
In The CDC Field Epidemiology Manual, Fourth Edition, edited by S.A. Rasmussen and R.A. Goodman. ISBN No. 978-0190624248.
Tsai, Yu-Ting, Angela Yu-Chen Lin, Yu-Hsiang Weng, and Kung-Cheh Li. 2010. Treatment of Perfluorinated
Chemicals by Electro-Microfiltration. Environmental Science & Technology 44 (20):7914-7920.
https://doi.org/10.1021/es101964.
Tsang, W., D. R. Burgess, and V. Babushok. 1998. On the Incinerability of Highly Fluorinated Organic Compounds.
Combustion Science and Technology 139 (1):385-402. https://doi.org/10.1080/00102209808952095.
Tseng, N. 2012. Feasibility of Biodegradation of Polyfluoroalkyl and Perfluoroalkyl Substances. Civil Engineering,
UCLA.
Tseng, Nancy, Ning Wang, Bogdan Szostek, and Shaily Mahendra. 2014. Biotransformation of 6:2
Fluorotelomer Alcohol (6:2 FTOH) by a Wood-Rotting Fungus. Environmental Science & Technology 48 (7):4012-4020. https://doi.org/10.1021/es4057483.
TTE, Witteveen+Bos and. 2016. Emerging Contaminants, PFOS and PFOA, Production Use-Sources, Production
and Applications. Commissioned by RWS Leefomgeving (the Netherlands) and OVAM (Flanders).
U.S. Air Force. 2017. DoD 2017.B STTR Solicitation AFFF Disposal. https://www.sbir.gov/sbirsearch/detail/1254657.
Ulhaq, Mazhar, Gunnar Carlsson, Stefan Örn, and Leif Norrgren. 2013. Comparison of developmental toxicity of
seven perfluoroalkyl acids to zebrafish embryos. Environmental Toxicology and Pharmacology 36 (2):423-
426. https://doi.org/10.1016/j.etap.2013.05.004.
UNEP. 2008. Report of the Persistent Organic Pollutants Review Committee on the work of its fourth
meeting – Addendum to the risk management evaluation for perfluorooctane sulfonate.
http://chm.pops.int/Portals/0/download.aspx?d=UNEP-POPS-POPRC.4-15-Add.6.English.pdf
UNEP. 2009. SC-4/17: Listing of perfluorooctane sulfonic acid, its salts and perfluorooctane sulfonyl
fluoride. http://chm.pops.int/Portals/0/download.aspx?d=UNEP-POPS-COP.7-SC-7-2.English.pdf
UNEP. 2011. Report of the Persistent Organic Pollutants Review Committee on the work of its sixth meeting, Addendum, Guidance on alternatives to perfluorooctane sulfonic acid and its derivatives. http
://chm.pops.int/Portals/0/download.aspx?d=UNEP-POPS-POPRC.6-13-Add.3-Rev.1.English.pdf
UNEP. 2019. UNEP/POPS/COP.9/30: Report of the Conference of the Parties to the Stockholm Convention on
Persistent Organic Pollutants on the work of its ninth meeting. http://www.pops.int.
UNEP. 2019. UNEP/POPS/POPRC.15/7: Report of the Persistent Organic Pollutants Review Committee on the work of its fifteenth meeting. http://www.pops.int.
University of Florida. 2018. Provisional irrigation water risk-based screening levels for PFOS and PFOA. https://floridadep.gov/sites/default/files/Prov_Irrigation_Water_Risk-
Based_Screen_Lvls_PFOA_PFOS_25Jul18.pdf.
Urtiaga, A., C. Fernandez-Gonzalez, S. Gomez-Lavin, and I. Ortiz. 2015. Kinetics of the electrochemical mineralization of perfluorooctanoic acid on ultrananocrystalline boron doped conductive diamond electrodes.
Chemosphere 129:20-6. https://doi.org/10.1016/j.chemosphere.2014.05.090.
US DOE. 2020. Glossary of Environmental Restoration Terms. The Risk Assessment Information System.
https://rais.ornl.gov/home/glossary.html#E.
US Naval Research Laboratory. 2017. Aqueous Film-Forming Foam.
479

USACE. 2018. Containment and Disposal of Aqueous Film-Forming Foam Solution Guidance. ETL-1110-3-
4810003.
USDOD EDQW. 2017. Bottle Selection and other Sampling Considerations When Sampling for Per- and Poly-
Fluoroalkyl Substances (PFASs) Revision 1.2. http://www.denix.osd.mil/edqw/home/
USDOD EDQW. 2017. Department of Defense (DoD) Quality Systems Manual (QSM) for Environmental
Laboratories, Version 5.1. http ://www.denix.osd.mil/edqw/home/
USDOD. 1997. Containment and Disposal of Aqueous Film Forming Foam Solution.
USDOD. 2009. Emerging Contaminants, June 2009. http
://www.esd.whs.mil/Portals/54/Documents/DD/issuances/dodi/471518p.pdf.
USDOD. 2014. Chemical & Material Emerging Risk Alert; Aqueous Film Forming Foam (AFFF), Risk Alert 03-11.
http://www.denix.osd.mil/cmrmp/ecmr/ecprogrambasics/resources/chemical-material-emerging-risk-alert-for-
afff/
USDOD. 2014. Memorandum for Deputy Chief of Naval Operations (Fleet Readiness and Logistics) (N4) Deputy Commandant Of The Marine Corps (Installations and Logistics). Subject: Perfluorinated Compounds
(PFCs)- An Emerging Environmental Issue.
http://www.secnav.navy.mil/eie/Documents/Perfluorinated-Compounds-(PFCs)-An-Emerging-Environmental-Issue.pdf.
USDOD. 2017. Aqueous Film Forming Foam Report to Congress.
https://www.denix.osd.mil/derp/home/documents/aqueous-film-forming-foam-report-to-congress/
USDOD. 2017. Performance Specification: Fire Extinguishing Agent, Aqueous Film-Forming Foam (AFFF) Liquid
Concentrate, for Fresh and Sea Water. http://quicksearch.dla.mil/Transient/D4B6D2C750CA42EBA876A8BCDCAD51AA.pdf
USDOD. 2018. Department of Defense Alternatives to Aqueous Film Forming Foam – Report to Congress.
https://www.denix.osd.mil/derp/home/documents/alternatives-to-aqueous-film-forming-foam-report-to-
congress/.
USDOD. 2018. General Data Validation Guidelines.
https://www.denix.osd.mil/edqw/documents/documents/general-data-validation-
guidelines-final/.
USDOD. 2018. Qualified Products Database: Performance Specification: Fire Extinguishing Agent, Aqueous Film-
Forming Foam (AFFF) Liquid Concentrate, for Fresh and Sea Water. MIL-PRF-24385F(SH). http://quicksearch.dla.mil/qsDocDetails.aspx?ident_number=94307.
USDOD. 2019. Department of Defense/Department of Energy Consolidated Quality Systems Manual for
Environmental Laboratories Version 5.3. . DoD Environmental Data Quality Workgroup and DOE Consolidated
Audit Program (DOECAP).
USDOD. 2020. Module 3: Data Validation Procedure for Per- and Polyfluoroalkyl Substances Analysis by Quality
Systems Manual for Environmental Laboratories (QSM) Table B-15. Department of Defense/Department of
Energy.
USEPA. 1974. Title XIV of The Public Health Service Act: Safety of Public Water Systems (Safe Drinking Water Act).
USEPA. 1985. Guidelines for deriving numerical national water quality criteria for the protection of aquatic
organisms and their uses. PB-85-227049. Washington, D.C.: US EPA ORD.
https://www.epa.gov/sites/production/files/2016-02/documents/guidelines-water-quality-criteria.pdf. 480

USEPA. 1986. Method 0010 Modified Method 5 Sampling Train.
https://www.epa.gov/sites/production/files/2015-12/documents/0010.pdf.
USEPA. 1987. Compendium of Superfund Field Operations Methods. EPA 540/P-87/001a OSWER
9355.0-14. USEPA. 1988. CERCLA Compliance and Other Laws Manual: Interim Final. EPA/540/G-89/006.
USEPA. 1988. Guidance for Conducting Remedial Investigations and Feasibility Studies under CERCLA. EPA/540/G-89/004, OSWER Directive 9355.3-01.
USEPA. 1989. RCRA Facility Investigation Guidance. EPA 53/SW-89-031.
USEPA. 1989. Risk Assessment Guidance for Superfund Volume I Human Health Evaluation Manual (Part A).
Interim Final. EPA/540/1-89/002. : US Environmental Protection Agency.
https://www.epa.gov/sites/production/files/2015-
09/documents/rags_a.pdf.
USEPA. 1989. Water Quality Criteria to Protect Wildlife Resources. EPA/600/3-89/067 PB 89 220016. Corvallis, OR.
https://nepis.epa.gov/EPA/html/Pubs/pubalpha_W.html.
USEPA. 1991. ARARs Qs and As : General Policy, RCRA, CWA, SDWA, Post-ROD Information, and Contingent Waivers. OSWER Publication 9234.2-01/FS-A. https://semspub.epa.gov/work/HQ/174497.pdf
USEPA. 1991. Risk Assessment Guidance for Superfund: Volume 1- Human Health Evaluation Manual (Part B,
Development of Risk-based Preliminary Remediation Goals) Interim Office of Emergency and Remedial
Response 20460 EP A/540/R-92/003 December 1991. .
USEPA. 1992. Framework for Ecological Risk Assessment. EPA/630/R-92/001. Washington, DC: Risk
Assessment Forum US Environmental Protection Agency.
USEPA. 1993. Use of IRIS Values in Superfund Risk Assessment. OSWER Directive 9285.7-16. Washington, DC: US
EPA. USEPA. 1993. Wildlife Exposure Factors Handbook. USEPA/600/R-93/187: USEPA.
https://cfpub.epa.gov/ncea/risk/recordisplay.cfm?deid=2799.
USEPA. 1995. Final Water Quality Guidance for the Great Lakes System. 60 FR 1536.
USEPA. 1995. Great Lakes Water Quality Initiative Criteria Documents for the Protection of Wildlife: DDT,
Mercury, 2,3,7,8-TCDD, PCBs. EPA/820/B-95/008. Washington, DC: Office of Water US EPA.
https://tinyurl.com/jje955df.
USEPA. 1995. Great Lakes Water Quality Initiative Technical Support Document for Wildlife Criteria. EPA-820-B-95-
009. Washington, DC: Office of Water US EPA. https://tinyurl.com/chptntfc.
USEPA. 1996. Emission Factor Documentation for AP-42. Emission Factor and Inventory Group Office of Air
Planning and Standards, Section 12.20.
USEPA. 1996. Method 3542 Extraction of Semivolatile Analytes collected using Method 0010 (Modified Method 5 Sampling Train). https://www.epa.gov/sites/production/files/2015-12/documents/3542.pdf.
USEPA. 1997. Clarification of the Role of Applicable, or Relevant and Appropriate Requirements in Establishing Preliminary Remedial Goals under CERCLA. OSWER memorandum 9200.4-23.
USEPA. 1997. High Voltage Electron Beam Technology: High Voltage Environmental Applications, Inc. Demonstration Bulletin, Superfund Innovative Technology Evaluation. EPA/540/MR-96/504: US EPA.
481

USEPA. 1998. Hard Chrome Fume Suppressants and Control Technologies. Center for Environmental
Research Information, National Risk Management Research Laboratory, Office of Research and
Development. EPA/625/R-98/002.
USEPA. 1998. Technical Protocol for Evaluating Natural Attenuation of Chlorinated Solvents in Ground Water.
EPA/600/R-98/128.
USEPA. 2000. Data Quality Objectives Process for Hazardous Waste Site Investigations. EPA QA/G-4HW Final.
EPA/600/R-00/007, .
USEPA. 2000. EPA and 3M Announce Phaseout of PFOS.
USEPA. 2000. Guidance for Assessing Chemical Contaminant Data for Use in Fish Advisories. Washington, DC:
U.S. Environmental Protection Agency. https://www.epa.gov/sites/production/files/2015-
06/documents/volume1.pdf.
USEPA. 2000. Methodology for Deriving Ambient Water Quality Criteria for the Protection of Human Health. EPA-
822- B-00-004. Washington, DC: Office of Water U.S. Environmental Protection Agency, Office of Science
and Technology. https://www.epa.gov/sites/production/files/2018-10/documents/methodology-wqc-protection-hh-2000.pdf.
USEPA. 2000. Perfluorooctyl Sulfonates : Proposed Significant New Use Rule. Federal Register, 65, 62,
319-62, 333.
USEPA. 2000. Risk Characterization: Science Policy Handbook. . EPA 100-B-00-002.
USEPA. 2000. Science Policy Council Handbook, Risk Characterization. EPA 100-B-00-002. Washington, D.C.:
Office of Research and Development U.S. Environmental ProtectionAgency. https://www.epa.gov/risk/risk-
management#self.
USEPA. 2001. Class I Underground Injection Control Program: Study of the Risks Associated with Class I Underground Injection Wells. Washington, D.C.
USEPA. 2003. Framework for Cumulative Risk Assessment. EPA/600/P-02/001F. Washington, D.C.: Office of
Research and Development U.S. Environmental Protection Agency, Center for Public Health and
Environmental Assessment (CPHEA), formerly known as the National Center for Environmental Assessment (NCEA). https://www.epa.gov/risk/framework-cumulative-risk-assessment.
USEPA. 2003. Human Health Toxicity Values in Superfund Risk Assessments. OSWER Directive 9285.7-53.
USEPA. 2003. Methodology for Deriving Ambient Water Quality Criteria for the Protection of Human Health (2000).
Technical Support Document Volume 2: Development of National Bioaccumulation Factors. Washington, DC: U.S. Environmental Protection Agency.
https://nepis.epa.gov/Exe/ZyPDF.cgi/P1005EZQ.PDF?Dockey=P1005EZQ.PDF.
USEPA. 2003. Perfluorooctanoic Acid (PFOA), Fluorinated Telomers ; Request for Comment, Solicitation of
Interested Parties for Enforceable Consent Agreement Development, and Notice of Public Meeting. 68
Federal Register 18626. Washington D.C. : EPA.
USEPA. 2004. An Examination of EPA Risk Assessment Principles and Practices. EPA/100/B-04/001.
Washington DC: Office of the Science Advisor.
482

USEPA. 2004. Risk Assessment Guidance for Superfund Volume I: Human Health Evaluation Manual
(Part E, Supplemental Guidance for Dermal Risk Assessment). Washington, DC: U.S. Environmental Protection Agency. https://www.epa.gov/sites/production/files/2015-
09/documents/part_e_final_revision_10-03-07.pdf.
USEPA. 2005. Guidelines for Carcinogen Risk Assessment. EPA/630.P-03/001F. Washington, DC: Risk
Assessment Forum US EPA.
USEPA. 2005. Science Advisory Board Consultation Document. Proposed Revisions to Aquatic Life Guidelines. Tissue- Based Criteria for Bioaccumulative Chemicals. Prepared by the Tissue-based Criteria
Subcommittee.
USEPA. 2005. Superfund Community Involvement Handbook. Washington, D.C. : Office of Emergency and
Remedial Response. EPA 540-K-05-003.
USEPA. 2006. 2010/2015 PFOA Stewardship Program. EPA-HQ-2003-0012-1071.
USEPA. 2006. Guidance on Systematic Planning Using the Data Quality Objectives Process. EPA QA/G-4.
EPA/240/B-06/001, .
USEPA. 2006. Risk Management for Per- and Polyfluoroalkyl Substances (PFAS) under TSCA, PFOA Stewardship Program.
USEPA. 2007. Communicating Radiation Risks. EPA-402-F-07-008. Washington, D.C.: Office of Radiation and
Indoor Air US Environmental Protection Agency. https://go.usa.gov/xnM8X.
USEPA. 2007. Perfluoroalkyl Sulfonates ; Significant New Use Rule. 72 Federal Register 57222. Washington D.C.
USEPA. 2007. Risk Communication in Action: The Risk Communication Workbook. EPA/625/R-05/003: National
Risk Management Research Laboratory Office of Research and Development.
USEPA. 2008. Clean Diesel Technologies and Alternative Fuels. San Francisco, CA: U.S. Environmental Protection Agency Region 9.
USEPA. 2008. Drinking Water Contaminant Candidate List 3—Draft.
Washington, D.C. https://www.govinfo.gov/content/pkg/FR-2008-02-21/pdf/E8-3114.pdf.
USEPA. 2008. Green Remediation: Best Management Practices for Excavation and Surface
Restoration. EPA 542- F-08-012: Office of Superfund and Remediation and Technology Innovation.
USEPA. 2008. White Paper, Aquatic Life Criteria for Contaminants of Emerging Concern, Part I, General
Challenges and Recommendations. Office of Water/Office of Research and Development Emerging
Contaminants Workgroup US EPA.
USEPA. 2009. Drinking Water Contaminant Candidate List 3—Final. Washington, D.C.: U.S. Environmental
Protection Agency. https://www.govinfo.gov/content/pkg/FR-2009-10-08/pdf/E9-24287.pdf.
USEPA. 2009. Long-Chain Perfluorinated Chemicals (PFCs), Action Plan.
USEPA. 2009. Perfluorocarboxylic acid content in 116 Articles of Commerce. EPA/600/R-
09/033.
USEPA. 2009. PFOS Chromium Electroplater Study. US EPA – Region 5, Chicago, IL
September 2009.
USEPA. 2009. Provisional Health Advisories for Perfluorooctanoic Acid (PFOA) and Perfluorooctane Sulfonate (PFOS).
USEPA. 2009. Statistical Analysis of Groundwater Monitoring Data at RCRA Facilities – Unified Guidance. 483

EPA/530/R-09/007.
USEPA. 2009. Washington Works Facility Order on Consent under SDWA Section 1431.
USEPA. 2010. Guidance for Implementing the January 2001 Methylmercury Water Quality Criterion. EPA 823-R-
10-001. Washington, DC: Office of Water US EPA.
USEPA. 2010. Superfund Green Remediation Strategy. Washington, DC: Office of Solid Waste and Emergency
Response and Office of Superfund Remediation and Technology Innovation USEPA.
USEPA. 2011. Exposure Factors Handbook 2011 Edition (Final). EPA/600/R-09/052F. Washington, D.
C.: U.S. Environmental Protection Agency. https://cfpub.epa.gov/ncea/risk/recordisplay.cfm?deid=236252.
USEPA. 2011. Recommended Use of Body Weight 3/4 as the Default Method in Derivation of the Oral Reference Dose.
EPA/100/R11/0001: U. S. Environmental Protection Agency.
USEPA. 2012. A framework for sustainability indicators at EPA. USEPA. 2012. Benchmark Dose Technical Guidance. EPA/100/R-12/001.
USEPA. 2012. Green Remediation Best Management Practices:Implementing In Situ Thermal Technologies.
EPA 542- F-12-029: Office of Superfund and Remediation and Technology Innovation.
USEPA. 2012. Methodology for Understanding and Reducing a Projects Environmental Footprint.
USEPA. 2012. National Emissions Standards for Hazardous Air Pollutant Emissions: Hard and Decorative
Chromium Electroplating and Chromium Anodizing Tanks; and Steel Pickling – HCl Process Facilities
and Hydrochloric Acid Regeneration Plant. Washington D. C.
USEPA. 2013. Climate Change Adaptation Technical Fact Sheet: Groundwater Remediation Systems. EPA 542-F-
13-004: Office of Superfund Remediation and Technology Innovation.
USEPA. 2013. Green Remediation Best Management Practices:Materials and Waste Management. EPA
542-F-13-003: Office of Superfund and Remediation and Technology Innovation.
USEPA. 2013. Pore Water Sampling Operating Procedure. SESDPROC-513-R2.
USEPA. 2013. Science and Ecosystem Support Division (SESD) Operating Procedure: Potable Water Supply
Sampling. SESDPROC-305-R3.
USEPA. 2013. Tier 3 Toxicity Value White Paper. edited by OSWER Directive 9285.7-86.
USEPA. 2013. Toxicological Review of 1,4-Dioxane (with Inhalation Update). Washington, D.C.: U.S.
Environmental Protection Agency.
USEPA. 2014. Climate Change Adaptation Plan. U.S. EPA 100-K14-001. .
USEPA. 2014. Climate Change Adaptation Technical Fact Sheet: Landfills and Containment as an Element of
Site Remediation. EPA-542-F-14-001: Office of Superfund Remediation and Technology Innovation.
USEPA. 2014. Emerging Contaminants Fact Sheet – PFOS and PFOA. EPA 505-F-11-002.
USEPA. 2014. Estimated Fish Consumption Rates for the U.S. Population and Selected Subpopulations (NHANES 2003-2010). Washington, DC: U.S. Environmental Protection Agency.
https://www.epa.gov/sites/production/files/2015-01/documents/fish-consumption-rates-2014.pdf.
484

USEPA. 2014. National Functional Guidelines for Superfund Organic Methods Data Review. USEPA-540-R-014-
002. (OSWER 9335.0-132).
USEPA. 2014. Naval Air Warfare Center Warminster Administrative Order under SDWA
Section 1431.
USEPA. 2014. Provisional Peer-Reviewed Toxicity Values for Perfluorobutane Sulfonate (CASRN 375-73-5) and
Related Compound Potassium Perfluorobutane Sulfonate (CASRN 29420-49-3). . Superfund Health Risk
Technical Support Center National Center for Environmental Assessment Office of Research and
Development U.S. Environmental Protection Agency Cincinnati, OH. .
USEPA. 2015. Administrative Order for Response Action. Docket No. : SDWA-01-2015-0061. USEPA Region 1.
USEPA. 2015. Climate Change Adaptation Technical Fact Sheet : Contaminated Sediment Remedies. EPA
542-F-15-009 Office of Superfund Remediation and Technology Innovation. .
USEPA. 2015. Field Equipment Cleaning and Decontamination at the FEC. SESDPROC-206-R3. Athens, GA: Science and Ecosystem Support Division USEPA Region 4.
https://www.epa.gov/sites/production/files/2016-
01/documents/field_equipment_cleaning_and_decontamination_at_f ec206_af.r3_1.pdf.
USEPA. 2015. Hazardous Waste Cleanup: Chemours Company FC, LLC (Formerly: Dupont Washington Works) in Washington, West Virginia. accessed 2019.
https://www.epa.gov/hwcorrectiveactionsites/hazardous-waste-cleanup-chemours-company-fc-llc-formerly-
dupont-w ashington.
USEPA. 2015. Human Health Ambient Water Quality Criteria: 2015 Update. Washington, DC: U.S.
Environmental Protection Agency.
https://www.epa.gov/sites/production/files/2015-10/documents/human-health-2015-update-factsheet.pdf.
USEPA. 2015. Long-Chain Perfluoroalkyl Carboxylate and Perfluoroalkyl Sulfonate Chemical Substances ;
Significant New Use Rule. 80 Federal Register 2885. Washington D.C. : EPA.
USEPA. 2015. Proposed Rule : Significant New Use Rules : Long-Chain Perfluoroalkyl Carboxylate and Perfluoroalkyl Sulfonate Chemical Substances..
USEPA. 2015. Risk-Screening Environmental Indicators (RSEI) Model Version 2.3.4. Technical Appendix B Physicochemical Properties for TRI Chemicals and Chemical Categories..
USEPA. 2016. AERMOD Implementation Guide. EPA-454/B-16-013. Research Triangle Park, NC.
USEPA. 2016. Aquatic Life Ambient Water Quality Criterion for Selenium – Freshwater 2016. EPA 822-R-16-006.
Washington, DC: Office of Water US EPA.
USEPA. 2016. Definitions. 40 CFR Part 300, Subpart A, Section 300.5.
https://www.gpo.gov/fdsys/pkg/CFR-2016-title40-vol30/xml/CFR-2016-title40-vol30-chapI-
subchapJ.xml#seqnum300. 5.
USEPA. 2016. Drinking Water Health Advisory for Perfluorooctane Sulfonate (PFOS). EPA 822-R-16-004.
Washington, DC: Office of Water US EPA, Health and Ecological Criteria Division.
https://www.epa.gov/sites/production/files/2016-05/documents/pfos_health_advisory_final_508.pdf
USEPA. 2016. Drinking Water Health Advisory for Perfluorooctanoic Acid (PFOA). EPA 822-R-16-005. Washington,
DC: U.S. Environmental Protection Agency.
485

USEPA. 2016. Fact Sheet PFOA and PFOS Drinking Water Health Advisories. EPA800-F-16-003.
https://www.epa.gov/sites/production/files/2016-06/documents/drinkingwaterhealthadvisories_pfoa_pfos_updated_5. 31.16.pdf
USEPA. 2016. Health Effects Support Document for Perfluorooctane Sulfonate (PFOS). EPA 822-R-16-002: Office
of Water US EPA.
USEPA. 2016. Health Effects Support Document for Perfluorooctanoic Acid (PFOA). EPA 822-R-16-003: Office of
Water US EPA. https://www.epa.gov/sites/production/files/2016-05/documents/pfoa_hesd_final_508.pdf
USEPA. 2016. High-Resolution Site Characterization (HRSC). https://clu-in.org/characterization/technologies/hrsc/
USEPA. 2016. Memorandum, Consideration of Greener Cleanup Activities in the Superfund Cleanup Process.
USEPA. 2016. Regional Removal Management Levels (RMLs) Users Guide.
https://www.epa.gov/risk/regional-removal-management-levels-rmls-users-guide
USEPA. 2016. The Fourth Unregulated Contaminant Monitoring Rule (UCMR 4). EPA 815-F-16-007: Office of
Water (MS-140) US EPA. https://www.epa.gov/sites/production/files/2017-03/documents/ucmr4-fact-sheet-general.pdf.
USEPA. 2017. Assessing and Managing Chemicals under TSCA. Last Modified December 18, 2019.
accessed 2020. https://www.epa.gov/assessing-and-managing-chemicals-under-tsca
USEPA. 2017. Basic Information about Per- and Polyfluoroalkyl Substances (PFASs).
https://www.epa.gov/pfas/basic-information-about-and-polyfluoroalkyl-substances-pfass#tab-1.
USEPA. 2017. Best Practices for Environmental Site Management: A Practical Guide for Applying Environmental Sequence Stratigraphy to Improve Conceptual Site Models. EPA/600/R-17/293.
USEPA. 2017. Drinking Water Contaminant Candidate List 4—Final Washington, D.C.: U.S. Environmental
Protection Agency.
USEPA. 2017. EPA Adds Saint-Gobain Performance Plastics Site in Hoosick Falls, N.Y. to the Federal
Superfund List. https://www.epa.gov/newsreleases/epa-adds-saint-gobain-performance-plastics-site-hoosick-falls-ny-federal-superfun d-list
USEPA. 2017. EPA History: Resource Conservation and Recovery Act.
https://www.epa.gov/history/epa-history-resource-conservation-and-recovery-
act. .
USEPA. 2017. EPAs Non-CBI Summary Tables for 2015 Company Progress Reports (Final Progress Reports). https://www.epa.gov/sites/production/files/2017-
02/documents/2016_pfoa_stewardship_summary_table_0.pdf
USEPA. 2017. Method 18 – Measurement of Gaseous Organic Compound Emissions by Gas
Chromatography. https://www.epa.gov/sites/production/files/2017-08/documents/method_18.pdf.
USEPA. 2017. Monitoring Unregulated Drinking Water Contaminants Occurrence Data for the Unregulated
Contaminant Monitoring Rule. https://www.epa.gov/dwucmr/occurrence-data-unregulated-contaminant-
monitoring-rule
486

USEPA. 2017. National Functional Guidelines for Organic Superfund Mehtods Data Review. OLEM 9355.0-136,
EPA-540- R-2017-002. Washington, D.C.: Office of Superfund Remediation and Technology Innovation
(OSRTI). https://www.epa.gov/sites/production/files/2017-01/documents/national_functional_guidelines_for_organic_superfund
_methods_data_review_013072017.pdf.
USEPA. 2017. New Chemicals Program Review of Alternatives for PFOA and Related Chemicals.
https://www.epa.gov/assessing-and-managing-chemicals-under-tsca/new-chemicals-program-review-alternatives-pfo a-and.
USEPA. 2017. Per- and Polyfluoroalkyl Substances (PFASs) Overview PFAS CLU-IN.org page. .
https://clu-in.org/contaminantfocus/default.focus/sec/Per-
_and_Polyfluoroalkyl_Substances_(PFASs)/cat/Overview/.
USEPA. 2017. Per- and Polyfluoroalkyl Substances (PFASs) under TSCA.
https://www.epa.gov/assessing-and-managing-chemicals-under-tsca/and-polyfluoroalkyl-substances-
pfass-under-tsc a
USEPA. 2017. Per- and Polyfluoroalkyl Substances (PFASs): What EPA is
Doing. https://www.epa.gov/pfas/and-polyfluoroalkyl-substances-pfass-what-epa-doing.
USEPA. 2017. Persistent Organic Pollutants: A Global Issue, A Global Response. https://www.epa.gov/international-cooperation/persistent-organic-pollutants-global-issue-global-
response
USEPA. 2017. Regional Screening Level (RSL) Calculator. https://epa-prgs.ornl.gov/cgi-bin/chemicals/csl_search
USEPA. 2017. Regional Screening Levels (RSLs) – Generic Tables
(June 2017). https://www.epa.gov/risk/regional-screening-levels-rsls-generic-tables.
USEPA. 2017. Research on Per- and Polyfluoroalkyl Substances (PFAS).
https://www.epa.gov/chemical-research/research-and-polyfluoroalkyl-substances-pfas
USEPA. 2017. Technical Fact Sheet – Perfluorooctane Sulfonate (PFOS) and Perfluorooctanoic Acid (PFOA). EPA 505- F-17-001.
https://www.epa.gov/sites/production/files/2017-12/documents/ffrrofactsheet_contaminants_pfos_pfoa_11-20-
17_508_0.pdf.
USEPA. 2017. The Third Unregulated Contaminant Monitoring Rule (UCMR 3): Data Summary, January 2017. https://www.epa.gov/sites/production/files/2017-02/documents/ucmr3-data-
summary-january-2017.pdf
USEPA. 2017. Treatment of Perfluorinated Alkyl Substances in Wash Water Using Granular Activated Carbon and Mixed Media.
USEPA. 2017. Water Quality Standards Handbook: Chapter 3: Water Quality Criteria. EPA-823-B-17-001.
Washington, DC: Office of Science and Technology US EPA Office of Water.
https://www.epa.gov/sites/production/files/2014-10/documents/handbook-chapter3.pdf.
USEPA. 2018. Assessing and Managing Chemicals under TSCA – Fact Sheet: 2010/2015 PFOA Stewardship
Program. USEPA. 2018. Contaminated Site Clean-up Information: Green Remediation Focus..
487
USEPA. 2018. Data Review and Validation Guidelines for Perfluoroalkyl Substances (PFASs) Analyzed Using EPA Method 537. EPA 910-R-18-001.
https://nepis.epa.gov/Exe/ZyPDF.cgi/P100VW12.PDF?Dockey=P100VW12.PDF.
USEPA. 2018. DRAFT for Public Comment: Human Health Toxicity Values for Hexafluoropropylene Oxide (HFPO)
Dimer Acid and Its Ammonium Salt (CASRN 13252-13-6 and CASRN 62037- 80-3). Also Known as GenX Chemicals.
USEPA. 2018. DRAFT for Public Comment: Human Health Toxicity Values for Perfluorobutane Sulfonic Acid (CASRN 375-73-5) and Related Compound Potassium Perfluorobutane Sulfonate (CASRN 29420 49 3).
USEPA. 2018. EPA Definition of Anthropogenic Background. USEPA. 2018. EPA Enterprise Vocabulary – Research – Research Resources – Analytical Methods and
Protocols. USEPA. 2018. Final 2016 Effluent Guidelines Program Plan. Washington DC.
https://www.epa.gov/sites/production/files/2018-05/documents/final-2016-eg-plan_april-2018.pdf.
USEPA. 2018. GenX Chemicals Studies. https://www.epa.gov/pfas/genx-chemicals-studies.
USEPA. 2018. Groundwater and Drinking Water, National Primary Drinking Water Regulations. accessed 2019. https://www.epa.gov/ground-water-and-drinking-water/national-primary-drinking-
water-regulations.
USEPA. 2018. Long-Chain Perfluoroalkyl Carboxylate and Perfluoroalkyl Sulfonate Chemical Substances; Significant New Use Rule. Washington, D.C.
https://www.reginfo.gov/public/do/eAgendaViewRule?pubId=201810&RIN=2070-AJ99.
USEPA. 2018. PFAS Laws and Regulations. Last Modified 7-30-2018. accessed 2020. https://www.epa.gov/pfas/pfas-laws-and-regulations#tab-
1.
USEPA. 2018. Science Matters: EPA Toxicologists Focus Innovative Research on PFAS Compounds..
accessed 2020. https://www.epa.gov/sciencematters/epa-toxicologists-focus-innovative-research-pfas-
compounds
USEPA. 2019. A Message from The IRIS Program.
https://www.epa.gov/sites/production/files/2019-04/documents/iris_program_outlook_apr2019.pdf.
USEPA. 2019. Class I Industrial and Municipal Waste Disposal Wells., Accessed June
18, 2019. https://www.epa.gov/uic/class-i-industrial-and-municipal-waste-disposal-wells.
USEPA. 2019. Drinking Water Contaminant Human Health Effects Information. accessed 2019.
https://www.epa.gov/dwstandardsregulations/drinking-water-contaminant-human-health-effects-
information#conten t.
USEPA. 2019. Drinking Water Treatability Database Introduction. Last Modified 9-3-2019.
accessed 2020. https://www.epa.gov/water-research/drinking-water-treatability-database-
tdb.
USEPA. 2019. ECOTOX Knowledgebase. Last Modified December 12, 2019. accessed 2020.
https://cfpub.epa.gov/ecotox/.
USEPA. 2019. EPA and Partners Describe a Chemical Category Prioritization Approach to Select 75 PFAS for
Testing using New Approach Methods. Last Modified February 26, 2019. https://www.epa.gov/sciencematters/epa-and-partners-describe-chemical-category-prioritization-approach-
select-75- pfas.
488

USEPA. 2019. EPA New Approach Methods: Efforts to Reduce Use of Animals in Chemical Testing. Last Modified
August 31, 2020. https://www.epa.gov/research/epa-new-approach-methods-efforts-reduce-use-animals-
chemical-testing.
USEPA. 2019. EPA Region 7 Leading Environmentalism and Forwarding Sustainability (L.E.A.F.S.) Awards. Superfund Redevelopment Initiative, Last Modified 10/8/2019.
https://www.epa.gov/superfund-redevelopment-initiative/epa-region-7-leading-environmentalism-and-forwarding.
USEPA. 2019. Integrated Risk Information System Glossary. accessed 2019.
USEPA. 2019. Method 533: Determination of Per- and Polyfluoroalkyl Substances in Drinking Water by
Isotope Dilution Anion Exchange Solid Phase Extraction and Liquid Chromatography/Tandem Mass Spectrometry. EPA/815-B-19-20. Cincinnati, OH. https://www.epa.gov/sites/production/files/2019-
12/documents/method-533-815b19020.pdf.
USEPA. 2019. Methodology and Spreadsheets for Environmental Footprint Analysis (SEFA)., Accessed
June 20, 2019. https://clu-in.org/greenremediation/methodology/#SEFA.
USEPA. 2019. PFAS Action Plan. EPA 823R18004. Washington D.C. https://www.epa.gov/pfas/epas-pfas-action-
plan.
USEPA. 2019. PFAS Chemical Lists and Tiered Testing Methods Descriptions. Last Modified September 4, 2019.
https://www.epa.gov/chemical-research/pfas-chemical-lists-and-tiered-testing-methods-descriptions.
USEPA. 2019. Regional Screening Levels Users Guide, Introduction.
accessed 2019. https://www.epa.gov/risk/regional-screening-levels-rsls-users-guide#intro.
USEPA. 2019. Requirements for all Class I Wells and Class I Hazardous Waste Wells. Accessed June 18, 2019. https://www.epa.gov/uic/requirements-all-class-i-wells-and-class-i-hazardous-waste-wells.
USEPA. 2019. Research on Per- and Polyfluoroalkyl Substances (PFAS). accessed
2020. https://www.epa.gov/chemical-research/research-and-polyfluoroalkyl-substances-pfas.
USEPA. 2019. Risk Communication. United States Environmental Protection Agency, Last Modified 11/21/2018, Accessed 2/9/2019. https://www.epa.gov/risk/risk-communication.
USEPA. 2019. Superfund Technical Assistance Needs Assessments (TANAs). United States Environmental Protection Agency, Last Modified 4/9/2019. accessed 2020.
https://www.epa.gov/superfund/technical-assistance-needs-assessments-tanas.
USEPA. 2019. Superfund: Applicable or Relevant and Appropriate Requirements (ARARs). Last Modified 4-4-
2019. accessed 2020. https://www.epa.gov/superfund/applicable-or-relevant-and-appropriate-requirements-arars.
USEPA. 2019. System toxicological approaches to define and predict the toxicity of Per and Polyfluoroalkyl
Substances. USEPA Grant R839481. Last Modified January 13, 2020. https://cfpub.epa.gov/ncer_abstracts/index.cfm/fuseaction/display.abstractDetail/abstract/10950/report/0.
USEPA. 2019. Systematic Review Protocol for the PFBA, PFHxA, PFHxS, PFNA, and PFDA IRIS Assessments. Washington, DC: U.S. Environmental Protection Agency.
USEPA. 2019. Technical Brief: Per and Polyfluoroalkyl Substances (PFAS) Incineration to Manage PFAS Waste Streams.
Washington D.C.: U.S. Environmental Protection Agency. www.epa.gov/research.
489

USEPA. 2019. USEPA Web page for Cyanobacteria. accessed 2020.
https://www.epa.gov/cyanohabs/learn-about-cyanobacteria-and-cyanotoxins.
USEPA. 2019. Vocabulary Catalog. Terms & Acronyms. Last Modified December 12, 2019. https://iaspub.epa.gov/sor_internet/registry/termreg/searchandretrieve/termsandacronyms/search.do.
USEPA. 2020. About the Chemical Safety for Sustainability Research Program. Last Modified March
11, 2020. https://www.epa.gov/aboutepa/about-chemical-safety-sustainability-research-program.
USEPA. 2020. CompTox Chemicals Dashboard. U. S. Environmental Protection Agency, Last Modified 1-16-2020. https://www.epa.gov/chemical-research/comptox-chemicals-dashboard.
USEPA. 2020. Drinking Water Treatability Database. accessed 2020.
https://oaspub.epa.gov/tdb/pages/general/home.do.
USEPA. 2020. EPA PFAS Drinking Water Laboratory Methods. Last Modified April 27, 2020. accessed 2021.
https://www.epa.gov/pfas/epa-pfas-drinking-water-laboratory-methods.
USEPA. 2020. Expobox Web Page. accessed 2020. https://www.epa.gov/expobox.
USEPA. 2020. Interim Guidance on Destroying and Disposing of Certain PFAS and PFAS-Containing Materials
that are not Consumer Products. EPA-HQ-OLEM-2020-0527-0003. Washington, DC.
https://www.epa.gov/pfas/interim-guidance-destroying-and-disposing-certain-pfas-and-pfas-containing-materials-are- not.
USEPA. 2020. New Approach Methods Work Plan: Reducing use of animals in chemical testing. EPA 615B2001.
Washington, DC: U.S. Environmental Protection Agency.
USEPA. 2020. PFAS Action Plan: Program Update February 2020. 100K20002. Washington, DC: U.S.
Environmental Protection Agency. https://www.epa.gov/pfas/epas-pfas-action-plan.
USEPA. 2020. PFAS EPA: PFAS structures in DSSTox. Last Modified August, 2020. accessed 2021. https://comptox.epa.gov/dashboard/chemical_lists/PFASSTRUCT.
USEPA. 2020. PFAS Master List of PFAS Substances (Version 2). Last Modified September 16, 2020. accessed
2021. https://comptox.epa.gov/dashboard/chemical_lists/PFASMASTER.
USEPA. 2020. PFAS/EPA: List of 75 Test Samples (Set 1). accessed 2020.
https://comptox.epa.gov/dashboard/chemical_lists/epapfas75s1.
USEPA. 2020. PFAS/EPA: List of 75 Test Samples (Set 2). Accessed 2020.
https://comptox.epa.gov/dashboard/chemical_lists/EPAPFAS75S2.
USEPA. 2020. PFAS/EPA: ToxCast Chemical Inventory. accessed 2020.
https://comptox.epa.gov/dashboard/chemical_lists/epapfasinv.
USEPA. 2020. Technical Brief: Per- and Polyfluoroalkyl Substances (PFAS): Incineration to Manage PFAS Waste Streams. USEPA. https://www.epa.gov/sites/production/files/2019-
09/documents/technical_brief_pfas_incineration_ioaa_approved_final_july_2019.pdf.
USEPA. 2020. Technical Brief: Perfluoroalkyl and Polyfluoroalkyl Substances (PFAS) Methods and guidance for sampling and analyzing water and other environmental media. EPA/600/F-17/022h. Washington, DC.
490

USEPA. 2020. Toxics Release Inventory (TRI) Program. Implementing Statutory Addition of Certain
Per- and Polyfluoroalkyl Substances to the TRI Chemical List. Last Modified June, 22 2020. accessed 2020.
https://www.epa.gov/toxics-release-inventory-tri-program/implementing-statutory-addition-certain-and-polyfluoroalk yl.
USEPA. 2020. Toxics Release Inventory (TRI) Program. What is the Toxics Release Inventory?, Last Modified
January 14, 2021. accessed 2020. https://www.epa.gov/toxics-release-inventory-tri-program/what-toxics-release-inventory
USEPA. 2020. Water Quality Criteria. Last Modified October 7, 2020. accessed 2021. https://www.epa.gov/wqc.
USEPA. 2020. Water Quality Standards Handbook. Last Modified August 31, 2020.
accessed 2021. https://www.epa.gov/wqs-tech/water-quality-standards-handbook.
USEPA. 2021. “CWA Analytical Methods for Per- and Polyfluorinated Alkyl Substances.” USEPA Last Modified March 2, 2021. accessed 2021.
https://www.epa.gov/cwa-methods/cwa-analytical-methods-and-polyfluorinated-alkyl-substances-pfas.
USEPA. 2021. Human Health Toxicity Values for Perfluorobutane Sulfonic Acid and Related Compound Potassium Perfluorobutane Sulfonate. EPA/600/R-20/345F. Washington, DC.
USEPA. 2021. Test Methods for Evaluating Solid Waste: Physical/Chemical Methods, SW-846.
accessed 2021. https://www.epa.gov/hw-sw846/sw-846-compendium.
USFDA. 2016. Inventory of Effective Food Contact Substance (FCS) Notifications. U.S. Food and Drug
Administration. Silver Spring, Maryland.
USFDA. 2019. Per and Polyfluoroalkyl Substances (PFAS). U.S. Food & Drug Administration. accessed 2020. https://www.fda.gov/food/chemicals/and-polyfluoroalkyl-substances-pfas.
USFDA. 2020. FDA Statement: FDA Announces Voluntary Agreement with Manufacturers to Phase Out Certain Short- Chain PFAS Used in Food Packaging. Last Modified 07/31/2020. accessed 2020.
https://www.fda.gov/news-events/press-announcements/fda-announces-voluntary-agreement-
manufacturers-phase- out-certain-short-chain-pfas-used-food.
USGS. 2017. Contaminants of Emerging Concern in the Environment. Last Modified 6-16-17. accessed 2020.
https://toxics.usgs.gov/investigations/cec/index.php.
USNavy. Field Sampling Protocols for PFCs.
Valsecchi, Sara, Daniela Conti, Riccardo Crebelli, Stefano Polesello, Marianna Rusconi, Michela Mazzoni, Elisabetta Preziosi, Mario Carere, Luca Lucentini, Emanuele Ferretti, Stefania Balzamo, Maria Gabriella
Simeone, and Fiorella Aste. 2017. Deriving environmental quality standards for perfluorooctanoic acid
(PFOA) and related short chain perfluorinated alkyl acids. Journal of Hazardous Materials 323:84-98. https://doi.org/10.1016/j.jhazmat.2016.04.055.
van der Putte, I., M. Murin, M. van Velthoven, and F. Affourtit. . 2010. Analysis of the risks arising from the
industrial use of Perfluorooctanoic Acid (PFOA) and Ammonium Perfluorooctanoate (APFO) and from their
use in consumer articles. Evaluation of the risk reduction measures for potential restrictions on the manufacture, placing on the market and use of PFOA and APFO. RPS Advies, Delft, The Netherlands for
European Commission Enterprise and Industry Directorate-General.
van Esterik, J. C., L. Bastos Sales, M. E. Dolle, H. Hakansson, M. Herlin, J. Legler, and L. T. van der Ven. 2016.
Programming of metabolic effects in C57BL/6JxFVB mice by in utero and lactational exposure to
perfluorooctanoic acid. Arch Toxicol 90 (3):701-15. 10.1007/s00204-015-1488-7.
491

Van Gossum, Hans, Jessica Bots, Tom Snijkers, Johan Meyer, Sam Van Wassenbergh, Wim De Coen, and Luc
De Bruyn. 2009. Behaviour of damselfly larvae (Enallagma cyathigerum) (Insecta, Odonata) after long-term exposure to PFOS. Environmental Pollution 157 (4):1332-1336. https://doi.org/10.1016/j.envpol.2008.11.031.
Van Rafelghem, Marc J., David R. Mattie, Richard H. Bruner, and Melvin E. Andersen. 1987. Pathological
and Hepatic Ultrastructural Effects of a Single Dose of Perfluoro-n-decanoic Acid in the Rat, Hamster,
Mouse, and Guinea Pig. Toxicological Sciences 9 (3):522-540. 10.1093/toxsci/9.3.522.
Vandermoere, Frédéric. 2008. Hazard Perception, Risk Perception, and the Need for Decontamination by
Residents
Exposed to Soil Pollution: The Role of Sustainability and the Limits of Expert Knowledge. Risk Analysis 28 (2):387-398. 10.1111/j.1539-6924.2008.01025.x.
Vecitis, Chad D., Hyunwoong Park, Jie Cheng, Brian T. Mader, and Michael R. Hoffmann. 2008. Kinetics and Mechanism of the Sonolytic Conversion of the Aqueous Perfluorinated Surfactants, Perfluorooctanoate
(PFOA), and Perfluorooctane Sulfonate (PFOS) into Inorganic Products. The Journal of Physical Chemistry
A 112 (18):4261-4270.
10.1021/jp801081.
Vecitis, Chad D., Hyunwoong Park, Jie Cheng, Brian T. Mader, and Michael R. Hoffmann. 2009. Treatment
technologies for aqueous perfluorooctanesulfonate (PFOS) and perfluorooctanoate (PFOA). Frontiers of
Environmental Science & Engineering in China 3 (2):129-151. 10.1007/s11783-009-0022-7.
Vecitis, Chad D., Yajuan Wang, Jie Cheng, Hyunwoong Park, Brian T. Mader, and Michael R. Hoffmann. 2010.
Sonochemical Degradation of Perfluorooctanesulfonate in Aqueous Film-Forming Foams. Environmental
Science & Technology 44 (1):432-438. 10.1021/es902444.
Vedagiri, Usha K., Richard H. Anderson, Heather M. Loso, and Catherine M. Schwach. 2018. Ambient levels of
PFOS and PFOA in multiple environmental media. Remediation Journal 28 (2):9-51. 10.1002/rem.21548.
Vellanki, Bhanu Prakash, Bill Batchelor, and Ahmed Abdel-Wahab. 2013. Advanced Reduction Processes: A New
Class of Treatment Processes. Environmental Engineering Science 30 (5):264-271. 10.1089/ees.2012.0273.
Venkatesan, A.K., and R.U. Halsden. 2013. National inventory of perfluoroalkyl substances in archived U.S.
biosolids from the 2001 EPA National Sewage Sludge Survey. Journal of Hazardous Materials 252-253:413-418. https://doi.org/10.1016/j.jhazmat.2013.03.016.
Ventia. 2019. Improving Measurement Reliability of the PFAS TOP Assay.
https://www.ventia.com/ckeditor_assets/attachments/281/ALGA_R_D_Report_Final.pdf.
Vermont DEQ. 2020. State of Vermont Plan. Deriving Ambient Water Quality Standrads for the Emerging Chemicals of Concern: Per- and Polyfluoroalkyl Substances (PFAS). Department of Environmental
Conservation Vermont Agency of Natural Resources. https://dec.vermont.gov/sites/dec/files/wsm/docs/VWQS-
PFAS-Plan-Report-Final-20200204.pdf.
Vermont DOH. 2016. Memorandum: Perfluorooctanoic acid (PFOA) and Perfluorooctane sulfonic acid (PFOS)
Vermont Drinking Water Health Advisory. Burlington, VT: Vermont Department of Health.
Verner, M. A., A. E. Loccisano, N. H. Morken, M. Yoon, H. Wu, R. McDougall, M. Maisonet, M. Marcus, R. Kishi,
C. Miyashita, M. H. Chen, W. S. Hsieh, M. E. Andersen, H. J. Clewell, 3rd, and M. P. Longnecker. 2015. Associations of Perfluoroalkyl Substances (PFAS) with Lower Birth Weight: An Evaluation of Potential
Confounding by Glomerular Filtration Rate Using a Physiologically Based Pharmacokinetic Model (PBPK).
Environ Health Perspect 123 (12):1317-24. 10.1289/ehp.1408837.
492

Verner, Marc-André, Gérard Ngueta, Elizabeth T. Jensen, Hermann Fromme, Wolfgang Völkel, Unni Cecilie
Nygaard, Berit Granum, and Matthew P. Longnecker. 2016. A Simple Pharmacokinetic Model of Prenatal and Postnatal Exposure to Perfluoroalkyl Substances (PFASs). Environmental Science & Technology 50 (2):978-
986. 10.1021/acs.est.5b04399.
Verner, Marc-André, Gérard Ngueta, Elizabeth T. Jensen, Hermann Fromme, Wolfgang Völkel, Unni Cecilie
Nygaard, Berit Granum, and Matthew P. Longnecker. 2016. Correction to A Simple Pharmacokinetic Model of Prenatal and Postnatal Exposure to Perfluoroalkyl Substances (PFASs). Environmental Science &
Technology 50 (10):5420-5421.
10.1021/acs.est.6b01755.
Vestergren, Robin, and Ian T. Cousins. 2009. Tracking the Pathways of Human Exposure to
Perfluorocarboxylates. Environmental Science & Technology 43 (15):5565-5575. 10.1021/es900228.
Viberg, H., I. Lee, and P. Eriksson. 2013. Adult dose-dependent behavioral and cognitive disturbances after a
single neonatal PFHxS dose. Toxicology 304:185-91. 10.1016/j.tox.2012.12.013.
Vidonish, Julia E., Kyriacos Zygourakis, Caroline A. Masiello, Gabriel Sabadell, and Pedro J. J. Alvarez. 2016.
Thermal Treatment of Hydrocarbon-Impacted Soils: A Review of Technology Innovation for Sustainable
Remediation. Engineering 2 (4):426-437. https://doi.org/10.1016/J.ENG.2016.04.005.
Vierke, Lena, Claudia Staude, Annegret Biegel-Engler, Wiebke Drost, and Christoph Schulte. 2012.
Perfluorooctanoic acid (PFOA) — main concerns and regulatory developments in Europe from an environmental point of view. Environmental Sciences Europe 24 (1):16. 10.1186/2190-4715-24-16.
Vierke, Lena, Urs Berger, and Ian T. Cousins. 2013. Estimation of the Acid Dissociation Constant of
Perfluoroalkyl Carboxylic Acids through an Experimental Investigation of their Water-to-Air Transport.
Environmental Science & Technology 47 (19):11032-11039. 10.1021/es402691.
Viswanathan, M., A. Ammerman, E. Eng, G. Gartlehner, K. N. Lohr, D. Griffith, S. Rhodes, C. Samuel-Hodge, S.
Maty, L. Lux, L. Webb, S. F. Sutton, T. Swinson, A. Jackman, and L. Whitener. 2004. Community-Based
Participatory Research: Assessing the Evidence. Evidence Report/Technology Assessment No. 99. AHRQ
Publication 04-E022-2. Rockville, MD: Agency for Healthcare Research and Quality.
Vogan, J., I. Ross, J. Burdick, and J. Quinnan. 2015. Advances in PFC investigation and remediation. Arcadis,
2016 Federal Contaminated Sites National Workshop.
Volkwein, Stephan, Hans-Werner Hurtig, and Walter Klöpffer. 1999. Life Cycle Assessment of
Contaminated Sites Remediation. International Journal of Life Cycle Assessment 4:263-274. https://doi.org/10.1007/BF02979178.
von der Trenck, Karl Theo, Rainer Konietzka, Annegret Biegel-Engler, Jan Brodsky, Andrea Hädicke, Arnold Quadflieg, Rudolf Stockerl, and Thorsten Stahl. 2018. Significance thresholds for the assessment of
contaminated groundwater: perfluorinated and polyfluorinated chemicals. Environmental Sciences
Europe 30 (19). https://doi.org/10.1186/s12302-018-0142-4.
VT DEC. 2016. Emergency Rule Coversheet: Vermont Hazardous Waste Regulations. Last Modified April 16, 2016.
http://dec.vermont.gov/sites/dec/files/documents/2016_04_14%20VHWMR%20Signed%20APA%20forms.pdf
VT DEC. 2016. Vermont Evolving Regualtions and Emerging Contaminants Presentation. Last Modified http://www.vectogether.org/wp-content/uploads/2013/10/Moran-Matt-
VEC.Presentation.pdf
VT DEC. 2018. News Release: State Partners with Local Fire Departments to Safely Get Rid of Toxic Fire-Fighting Foam. http://www.vermont.gov/portal/government/article.php?news=6853.
493

VT DEC. 2018. Perfluoroalkyl Substances (PFAS) Contamination Status Report.
https://dec.vermont.gov/sites/dec/files/documents/PFAS%20Sampling%20Report%207.10.18%20FINAL.pdf.
WA DER. 2017. Interim Guideline on the Assessment and Management of Perfluoroalkyl and Polyfluoroalkyl
Substances (PFAS). (2.1):134.
Wagner, A., B. Raue, H. J. Brauch, E. Worch, and F. T. Lange. 2013. Determination of adsorbable organic
fluorine from aqueous environmental samples by adsorption to polystyrene-divinylbenzene based
activated carbon and combustion ion chromatography. J Chromatogr A 1295:82-9. 10.1016/j.chroma.2013.04.051.
Waite, T. D., C. N. Kurucz, W. J. Cooper, and D. Brown. 1998. Full scale electron beam systems for treatment of
water, wastewater and medical waste (No. IAEA-TECDOC–1023).
Wallington, T. J., M. D. Hurley, J. Xia, D. J. Wuebbles, S. Sillman, A. Ito, J. E. Penner, D. A. Ellis, J. Martin, S. A. Mabury, O. J. Nielsen, and M. P. Sulbaek Andersen. 2006. Formation of C7F15COOH (PFOA) and Other
Perfluorocarboxylic Acids during the Atmospheric Oxidation of 8:2 Fluorotelomer Alcohol. Environmental
Science & Technology 40 (3):924-930. 10.1021/es051858.
Walters, Adam, and David Santillo. 2006. Uses of Perfluorinated Substances. GRL-TN-06-2006. Exeter, UK:
Greenpeace Research Laboratories. https://www.greenpeace.to/greenpeace/.
Walton, B. 2018. Perfluorinated Chemicals Health Study Included in Congress Budget Deal. Circle of Blue.
accessed March 22, 2018.
https://www.circleofblue.org/2018/world/perfluorinated-chemicals-health-study-included-in-congress-budget-deal/.
Wang, Hexing, Hongyi Du, Jiaqi Yang, Hong Jiang, Karmin O, Linji Xu, Shuping Liu, Jianping Yi, Xu Qian, Yue Chen,
Qingwu Jiang, and Gengsheng He. 2019. PFOS, PFOA, estrogen homeostasis, and birth size in Chinese infants. Chemosphere
221:349-355. https://doi.org/10.1016/j.chemosphere.2019.01.061.
Wang, J., S. Yan, W. Zhang, H. Zhang, and J. Dai. 2015. Integrated proteomic and miRNA transcriptional
analysis reveals the hepatotoxicity mechanism of PFNA exposure in mice. J Proteome Res 14 (1):330-41.
10.1021/pr500641.
Wang, Jianshe, Yating Zhang, Fang Zhang, Leo W. Y. Yeung, Sachi Taniyasu, Eriko Yamazaki, Renping Wang, Paul K. S. Lam, Nobuyoshi Yamashita, and Jiayin Dai. 2013. Age- and gender-related accumulation of
perfluoroalkyl substances in captive Chinese alligators (Alligator sinensis). Environmental Pollution 179:61-
67. https://doi.org/10.1016/j.envpol.2013.04.020.
Wang, Jiaxuan, Lei Wang, Changqing Xu, Rui Zhi, Rui Miao, Tong Liang, Xianglei Yue, Yongtao Lv, and Tingting Liu.
2018. Perfluorooctane sulfonate and perfluorobutane sulfonate removal from water by nanofiltration
membrane: The roles of solute concentration, ionic strength, and macromolecular organic foulants. Chemical Engineering Journal
332:787-797. https://doi.org/10.1016/j.cej.2017.09.061.
Wang, L., Y. Wang, Y. Liang, J. Li, Y. Liu, J. Zhang, A. Zhang, J. Fu, and G. Jiang. 2013. Specific accumulation of lipid droplets in hepatocyte nuclei of PFOA-exposed BALB/c mice. Sci Rep 3:2174. 10.1038/srep02174.
Wang, Li, Bill Batchelor, Suresh D. Pillai, and Venkata S. V. Botlaguduru. 2016. Electron beam treatment for potable water reuse: Removal of bromate and perfluorooctanoic acid. Chemical Engineering Journal
302:58-68. https://doi.org/10.1016/j.cej.2016.05.034.
494

Wang, Ling, Yu Wang, Yong Liang, Jia Li, Yuchen Liu, Jie Zhang, Aiqian Zhang, Jianjie Fu, and Guibin Jiang. 2014.
PFOS induced lipid metabolism disturbances in BALB/c mice through inhibition of low density lipoproteins excretion. Scientific Reports 4:4582. 10.1038/srep04582.
Wang, Ning, Bogdan Szostek, Patrick W. Folsom, Lisa M. Sulecki, Vladimir Capka, Robert C. Buck, William R.
Berti, and John T. Gannon. 2005. Aerobic Biotransformation of 14C-Labeled 8-2 Telomer B Alcohol by Activated Sludge from a Domestic Sewage Treatment Plant. Environmental Science & Technology 39
(2):531-538. 10.1021/es049466.
Wang, Ning, Bogdan Szostek, Robert C. Buck, Patrick W. Folsom, Lisa M. Sulecki, and John T. Gannon.
2009. 8-2 Fluorotelomer alcohol aerobic soil biodegradation: Pathways, metabolites, and metabolite
yields. Chemosphere 75 (8):1089-1096. https://doi.org/10.1016/j.chemosphere.2009.01.033.
Wang, Ning, Bogdan Szostek, Robert C. Buck, Patrick W. Folsom, Lisa M. Sulecki, Vladimir Capka, William R.
Berti, and John T. Gannon. 2005. Fluorotelomer Alcohol BiodegradationDirect Evidence that Perfluorinated
Carbon Chains Breakdown. Environmental Science & Technology 39 (19):7516-7528. 10.1021/es0506760.
Wang, Ning, Jinxia Liu, Robert C. Buck, Stephen H. Korzeniowski, Barry W. Wolstenholme, Patrick W. Folsom, and
Lisa M. Sulecki. 2011. 6:2 Fluorotelomer sulfonate aerobic biotransformation in activated sludge of waste water treatment plants. Chemosphere 82 (6):853-858. https://doi.org/10.1016/j.chemosphere.2010.11.003.
Wang, Ning, Robert C. Buck, Bogdan Szostek, Lisa M. Sulecki, and Barry W. Wolstenholme. 2012. 5:3
Polyfluorinated acid aerobic biotransformation in activated sludge via novel one-carbon removal pathways.
Chemosphere 87 (5):527-534. https://doi.org/10.1016/j.chemosphere.2011.12.056.
Wang, Shana, Qi Yang, Fei Chen, Jian Sun, Kun Luo, Fubing Yao, Xiaolin Wang, Dongbo Wang, Xiaoming Li, and Guangming Zeng. 2017. Photocatalytic degradation of perfluorooctanoic acid and
perfluorooctane sulfonate in water: A critical review. Chemical Engineering Journal 328:927-942.
https://doi.org/10.1016/j.cej.2017.07.076.
Wang, Wenfeng, Geoff Rhodes, Jing Ge, Xiangyang Yu, and Hui Li. 2020. Uptake and accumulation of per-
and polyfluoroalkyl substances in plants. Chemosphere 261:127584. https://doi.org/10.1016/j.chemosphere.2020.127584.
Wang, Xiaoping, Crispin Halsall, Garry Codling, Zhiyong Xie, Baiqing Xu, Zhen Zhao, Yonggang Xue, Ralf
Ebinghaus, and Kevin C. Jones. 2014. Accumulation of Perfluoroalkyl Compounds in Tibetan Mountain
Snow: Temporal Patterns from 1980 to 2010. Environmental Science & Technology 48 (1):173-181.
10.1021/es4044775.
Wang, Yuan, Pengyi Zhang, Gang Pan, and Hao Chen. 2008. Ferric ion mediated photochemical decomposition
of perfluorooctanoic acid (PFOA) by 254nm UV light. Journal of Hazardous Materials 160 (1):181-186.
https://doi.org/10.1016/j.jhazmat.2008.02.105.
Wang, Yujuan, Hui Lin, Fangyuan Jin, Junfeng Niu, Jinbo Zhao, Ying Bi, and Ying Li. 2016. Electrocoagulation
mechanism of perfluorooctanoate (PFOA) on a zinc anode: Influence of cathodes and anions. Science of The
Total Environment 557-558:542-550. https://doi.org/10.1016/j.scitotenv.2016.03.114.
Wang, Zhanyun, Ian T. Cousins, Martin Scheringer, and Konrad Hungerbuehler. 2015. Hazard assessment of
fluorinated alternatives to long-chain perfluoroalkyl acids (PFAAs) and their precursors: Status quo, ongoing challenges and possible solutions. Environment International 75:172-179.
https://doi.org/10.1016/j.envint.2014.11.013.
Wang, Zhanyun, Ian T. Cousins, Martin Scheringer, and Konrad Hungerbühler. 2013. Fluorinated alternatives
to long- chain perfluoroalkyl carboxylic acids (PFCAs), perfluoroalkane sulfonic acids (PFSAs) and their
potential precursors. Environment International 60:242-248. https://doi.org/10.1016/j.envint.2013.08.021.
495

Wang, Zhanyun, Jamie C. DeWitt, Christopher P. Higgins, and Ian T. Cousins. 2017. A Never-Ending Story of Per-
and Polyfluoroalkyl Substances (PFASs)? Environmental Science & Technology 51 (5):2508-2518. https://doi.org/10.1021/acs.est.6b04806.
Wang, Zhen, Zhiyong Xie, Wenying Mi, Axel Möller, Hendrik Wolschke, and Ralf Ebinghaus. 2015. Neutral
Poly/Per- Fluoroalkyl Substances in Air from the Atlantic to the Southern Ocean and in Antarctic Snow.
Environmental Science & Technology 49 (13):7770-7775. 10.1021/acs.est.5b00920.
Wania, Frank. 2007. A Global Mass Balance Analysis of the Source of Perfluorocarboxylic Acids in the Arctic
Ocean. Environmental Science & Technology 41 (13):4529-4535. 10.1021/es070124.
Warne, Michael, Graeme Batley, Rick van Dam, John Chapman, David Fox, Christopher Hickey, and Jenny Stauber. 2018. Revised method for deriving Australian and New Zealand water quality guideline values for
toxicants. https://doi.org/10.13140/RG.2.2.36577.35686.
Washington Department of Ecology. 2016. Quality Assurance Project Plan; Statewide Survey of Per- and Poly-
fluoroalkyl Substances in Washington State Rivers and Lakes.
Washington Department of Ecology. 2019. Interim Chemical Action Plan for Per- and Polyfluoroalkyl Substances.
18-04-005, Revised January 2019. Olympia, WA.
https://apps.ecology.wa.gov/publications/documents/1804005.pdf.
Washington State Department of Ecology and Washington State Department of Health. 2019. Interim
Chemical Action Plan for Per- and Polyfluorinated Alkyl Substances. Publication 18-04-005.
https://fortress.wa.gov/ecy/publications/documents/1804005.pdf
Washington State Department of Ecology. 2012. Childrens Safe Products Reporting Rule Rationale for Reporting
List of Chemicals of High Concern to Children.
Washington State Department of Ecology. 2018. PFAS Chemical Action Plan
Focus Sheet. https://fortress.wa.gov/ecy/publications/SummaryPages/1804002.
Washington State Department of Ecology. 2020. Per- and Polyfluoroalkyl Substances. Draft Chemical Action
Plan. 20-04-035. Olympia, WA. https://fortress.wa.gov/ecy/publications/summarypages/2004035.html.
Washington State Legislature. 2006. Persistent Bioaccumulative Toxins. Washington Administrative Code 173-
333. Washington State Legislature. 2008. Identification of high priority chemicals -Report. RCW 70.240.030.
http://apps.leg.wa.gov/RCW/default.aspx?cite=70.240.030
Washington State Legislature. 2018. Chapter 70.75A RCW Firefighting Agendat and Equipment – Toxic
Chemical Use. http://app.leg.wa.gov/RCW/default.aspx?cite=70.75A.
Washington State Legislature. 2018. Chapter 70.95G RCW Packages containing metals and toxic chemicals. http://app.leg.wa.gov/RCW/default.aspx?cite=70.95G.
Washington State Legislature. 2018. Class B firefighting foams.
http://lawfilesext.leg.wa.gov/biennium/2017-18/Pdf/Bills/Senate%20Bills/6413.pdf.
Washington, J. W., K. Rankin, E. L. Libelo, D. G. Lynch, and M. Cyterski. 2018. Determining global background soil PFAS loads and the fluorotelomer-based polymer degradation rates that can account for these loads.
Science of The Total Environment 651:2444-2449.
496

Washington, John W., and Thomas M. Jenkins. 2015. Abiotic Hydrolysis of Fluorotelomer-Based Polymers as a
Source of Perfluorocarboxylates at the Global Scale. Environmental Science & Technology 49 (24):14129-14135. 10.1021/acs.est.5b03686.
Washington, John W., Charlita G. Rosal, James P. McCord, Mark J. Strynar, Andrew B. Lindstrom, Erica L.
Bergman, Sandra M. Goodrow, Haile K. Tadesse, Andrew N. Pilant, Benjamin J. Washington, Mary J. Davis, Brittany G. Stuart,
and Thomas M. Jenkins. 2020. Nontargeted mass-spectral detection of chloroperfluoropolyether
carboxylates in New Jersey soils. Science 368 (6495):1103. https://doi.org/10.1126/science.aba7127.
Washington, John W., Hoon Yoo, J. Jackson Ellington, Thomas M. Jenkins, and E. Laurence Libelo. 2010. Concentrations, Distribution, and Persistence of Perfluoroalkylates in Sludge-Applied Soils near Decatur,
Alabama, USA. Environmental Science & Technology 44 (22):8390-8396. 10.1021/es1003846.
Washington, John W., J. Jackson Ellington, Thomas M. Jenkins, John J. Evans, Hoon Yoo, and Sarah C.
Hafner. 2009. Degradability of an Acrylate-Linked, Fluorotelomer Polymer in Soil. Environmental Science & Technology 43 (17):6617-6623. 10.1021/es9002668.
Washington, John W., Jonathan E. Naile, Thomas M. Jenkins, and David G. Lynch. 2014. Characterizing
Fluorotelomer and Polyfluoroalkyl Substances in New and Aged Fluorotelomer-Based Polymers for
Degradation Studies with GC/MS and LC/MS/MS. Environmental Science & Technology 48 (10):5762-5769.
10.1021/es500373.
Washington, John W., Thomas M. Jenkins, Keegan Rankin, and Jonathan E. Naile. 2015. Decades-Scale
Degradation of Commercial, Side-Chain, Fluorotelomer-Based Polymers in Soils and Water. Environmental
Science & Technology 49 (2):915-923. 10.1021/es504347.
Watanabe, M.X., T. Kunisue, L. Tao, K. Kannan, A. Subramanian, S. Tanabe, and H. Iwata. 2010. Dioxin-like and
perfluorinated compounds in pigs in an Indian open waste dumping site: Toxicokinetics and effects on
hepatic cytochrome P450 and blood plasma hormones. Environmental Toxicology and Chemistry 29
(7):1551-1560. https://doi.org/10.1002/etc.189.
Watanabe, N., M. Takata, S. Takemine, and K. Yamamoto. 2018. Thermal mineralization behavior of PFOA,
PFHxA, and PFOS during reactivation of granular activated carbon (GAC) in nitrogen atmosphere. Environ Sci
Pollut Res Int 25 (8):7200-7205. 10.1007/s11356-015-5353-2.
Watanabe, N., S. Takemine, K. Yamamoto, Y. Haga, and M. Takate. 2016. Residual Organic Fluorinated Compounds
from Thermal Treatment of PFOA, PFHxA, and PFOS Adsorbed onto GAC. J Material Cycles and Waste Management 18:625-630. DOI 10.1007/s10163-016-0532-x.
Watts, Richard, J., Judith Sarasa, Frank Loge, J., and Amy L. Teel. 2005. Oxidative and Reductive Pathways in
Manganese- Catalyzed Fentons Reactions. Journal of Environmental Engineering 131 (1):158-164.
10.1061/(ASCE)0733-9372(2005)131:1(158).
Weber, Andrea K., Larry B. Barber, Denis R. LeBlanc, Elsie M. Sunderland, and Chad D. Vecitis. 2017.
Geochemical and Hydrologic Factors Controlling Subsurface Transport of Poly- and Perfluoroalkyl
Substances, Cape Cod, Massachusetts. Environmental Science & Technology 51 (8):4269-4279. 10.1021/acs.est.6b05573.
Weber, Olaf, Roland W. Scholz, Renate Bühlmann, and Dirk Grasmück. 2001. Risk Perception of Heavy Metal Soil
Contamination and Attitudes toward Decontamination Strategies. Risk Analysis 21 (5):967-967.
10.1111/0272-4332.215165.
497
Weiner, Barbara, Leo Yeung, Erin Marchington, Lisa DAgostino, and Scott Mabury. 2013. Organic fluorine
content in aqueous film forming foams (AFFFs) and biodegradation of the foam component 6 : 2 fluorotelomermercaptoalkylamido sulfonate (6 : 2 FTSAS). Environmental Chemistry 10 (6):486-493.
https://doi.org/10.1071/EN13128.
Weir, Scott M., Jamie G. Suski, and Christopher J. Salice. 2010. Ecological risk of anthropogenic pollutants to reptiles: Evaluating assumptions of sensitivity and exposure. Environmental Pollution 158 (12):3596-3606.
https://doi.org/10.1016/j.envpol.2010.08.011.
Weiß, Odulf, Gerhard A. Wiesmüller, Anne Bunte, Thomas Göen, Carsten K. Schmidt, Michael Wilhelm, and Jürgen
Hölzer.
2012. Perfluorinated compounds in the vicinity of a fire training area – Human biomonitoring among 10 persons drinking water from contaminated private wells in Cologne, Germany. International Journal of
Hygiene and Environmental Health 215 (2):212-215. https://doi.org/10.1016/j.ijheh.2011.08.016.
Wen, B., Y. Wu, H. Zhang, Y. Liu, X. Hu, H. Huang, and S. Zhang. 2016. The roles of protein and lipid in the accumulation and distribution of perfluorooctane sulfonate (PFOS) and perfluorooctanoate (PFOA) in plants
grown in biosolids- amended soils. Environ Pollut 216:682-688. 10.1016/j.envpol.2016.06.032.
Wen, Bei, Longfei Li, Yu Liu, Hongna Zhang, Xiaoyu Hu, Xiao-quan Shan, and Shuzhen Zhang. 2013.
Mechanistic studies of perfluorooctane sulfonate, perfluorooctanoic acid uptake by maize (Zea mays L. cv. TY2).
Plant and Soil 370 (1):345-354. https://doi.org/10.1007/s11104-013-1637-9.
Wepppener, W. 2000. Letter, with attachments, from 3M to Charles Auer, EPA OPPT, regarding the phase
out plan for PFOS-based products. Tech. Rep. AR226-0600.
Westreich, Philippe, Richard Mimna, Jenalle Brewer, and Frederic Forrester. 2018. The removal of short-chain and long- chain perfluoroalkyl acids and sulfonates via granular activated carbons: A comparative column
study. Remediation Journal 29 (1):19-26. 10.1002/rem.21579.
White, Natasha D., Len Balthis, Kurunthachalam Kannan, Amila O. De Silva, Qian Wu, Katherine M. French,
James Daugomah, Christine Spencer, and Patricia A. Fair. 2015. Elevated levels of perfluoroalkyl
substances in estuarine sediments of Charleston, SC. Science of The Total Environment 521-522:79-89. https://doi.org/10.1016/j.scitotenv.2015.03.078.
White, S. S., A. M. Calafat, Z. Kuklenyik, L. Villanueva, R. D. Zehr, L. Helfant, M. J. Strynar, A. B. Lindstrom, J.
R. Thibodeaux, C. Wood, and S. E. Fenton. 2007. Gestational PFOA exposure of mice is associated with
altered mammary gland development in dams and female offspring. Toxicol Sci 96 (1):133-44.
10.1093/toxsci/kfl177.
White, S. S., J. P. Stanko, K. Kato, A. M. Calafat, E. P. Hines, and S. E. Fenton. 2011. Gestational and chronic
low-dose PFOA exposures and mammary gland growth and differentiation in three generations of CD-1 mice.
Environ Health Perspect 119 (8):1070-6. 10.1289/ehp.1002741.
White, S. S., K. Kato, L. T. Jia, B. J. Basden, A. M. Calafat, E. P. Hines, J. P. Stanko, C. J. Wolf, B. D. Abbott, and
S. E. Fenton. 2009. Effects of perfluorooctanoic acid on mouse mammary gland development and
differentiation resulting from cross-foster and restricted gestational exposures. Reprod Toxicol 27 (3-4):289-
298.10.1016/j.reprotox.2008.11.054.
Wilkinson, John L., Julian Swinden, Peter S. Hooda, James Barker, and Stephen Barton. 2016. Markers of
anthropogenic contamination: A validated method for quantification of pharmaceuticals, illicit drug
metabolites, perfluorinated compounds, and plasticisers in sewage treatment effluent and rain runoff.
Chemosphere 159:638-646. https://doi.org/10.1016/j.chemosphere.2016.06.039.
498

Wilkinson, John L., Peter S. Hooda, Julian Swinden, James Barker, and Stephen Barton. 2017. Spatial
distribution of organic contaminants in three rivers of Southern England bound to suspended particulate material and dissolved in water. Science of The Total Environment 593-594:487-497.
https://doi.org/10.1016/j.scitotenv.2017.03.167.
Willach, Sarah, Heinz-Jürgen Brauch, and Frank T. Lange. 2016. Contribution of selected perfluoroalkyl and
polyfluoroalkyl substances to the adsorbable organically bound fluorine in German rivers and in a highly contaminated groundwater. Chemosphere 145:342-350.
https://doi.org/10.1016/j.chemosphere.2015.11.113.
Williams, A., A. McEachran, M. Strynar, C. Grulke, K. Mansouri, G. Patlewicz, R. Sams, E. Schymanski, and A. Richard. 2018. Accessing information for Per- & Polyfluoroalkyl Substances using the US EPA CompTox
Chemistry Dashboard. American Chemical Society Fall Meeting, Boston, MA, August 19 – 23, 2018 Abstract
No. https://doi.org/10.23645/epacomptox.7140953.
Williams, Antony J., Christopher M. Grulke, Jeff Edwards, Andrew D. McEachran, Kamel Mansouri, Nancy C. Baker,
Grace
Patlewicz, Imran Shah, John F. Wambaugh, Richard S. Judson, and Ann M. Richard. 2017. The CompTox
Chemistry Dashboard: a community data resource for environmental chemistry. Journal of Cheminformatics 9 (1):61. https://doi.org/10.1186/s13321-017-0247-6.
Winkens, Kerstin, Robin Vestergren, Urs Berger, and Ian T. Cousins. 2017. Early life exposure to per- and
polyfluoroalkyl substances (PFASs): A critical review. Emerging Contaminants 3 (2):55-68.
https://doi.org/10.1016/j.emcon.2017.05.001.
Winquist, A., and K. Steenland. 2014. Modeled PFOA exposure and coronary artery disease, hypertension, and
high cholesterol in community and worker cohorts. Environ Health Perspect 122 (12):1299-305. 10.1289/ehp.1307943.
Winquist, A., and K. Steenland. 2014. Perfluorooctanoic acid exposure and thyroid disease in community and worker cohorts. Epidemiology 25 (2):255-64. 10.1097/ede.0000000000000040.
Wolf, C. J., R. D. Zehr, J. E. Schmid, C. Lau, and B. D. Abbott. 2010. Developmental effects of perfluorononanoic
Acid in the mouse are dependent on peroxisome proliferator-activated receptor-alpha. PPAR Res 2010. 10.1155/2010/282896.
Wolf, C. J., S. E. Fenton, J. E. Schmid, A. M. Calafat, Z. Kuklenyik, X. A. Bryant, J. Thibodeaux, K. P. Das, S. S.
White, C. S. Lau, and B. D. Abbott. 2007. Developmental toxicity of perfluorooctanoic acid in the CD-1
mouse after cross-foster and restricted gestational exposures. Toxicol Sci 95 (2):462-73. 10.1093/toxsci/kfl159.
Wolf, D. C., T. Moore, B. D. Abbott, M. B. Rosen, K. P. Das, R. D. Zehr, A. B. Lindstrom, M. J. Strynar, and C. Lau.
2008. Comparative hepatic effects of perfluorooctanoic acid and WY 14,643 in PPAR-alpha knockout and wild-
type mice. Toxicol Pathol 36 (4):632-9. 10.1177/0192623308318216.
Woodard, Steve, John Berry, and Brandon Newman. 2017. Ion exchange resin for PFAS removal and pilot test
comparison to GAC. Remediation Journal 27 (3):19-27. 10.1002/rem.21515.
World Bank. 2017. China – Reduction and Phase-Out of PFOS in Priority Sectors Project. World Bank Group.
https://www.worldbank.org/en/news/loans-credits/2017/04/07/china-reduction-and-phase-out-of-pfos-in-priority-secto rs-project
World Bank. 2017. GEF Grant to Assist China’s Efforts to Phase Out POPs. World Bank Group, Last
Modified April 7. https://www.worldbank.org/en/news/press-release/2017/04/07/gef-grant-to-assist-china-
efforts-to-phase-out-pops
499

Woudneh, Million B., Bharat Chandramouli, Coreen Hamilton, and Richard Grace. 2019. Effect of Sample
Storage on the Quantitative Determination of 29 PFAS: Observation of Analyte Interconversions during
Storage. Environmental Science & Technology 53 (21):12576-12585. 10.1021/acs.est.9b03859.
Wu, Boran, Shilai Hao, Younjeong Choi, Christopher P. Higgins, Rula Deeb, and Timothy J. Strathmann.
2019. Rapid Destruction and Defluorination of Perfluorooctanesulfonate by Alkaline Hydrothermal
Reaction. Environmental Science & Technology Letters 6 (10):630-636. 10.1021/acs.estlett.9b00506.
Wu, Yaoxing, and Victor W. C. Chang. 2011. The Effect of Surface Adsorption and Molecular Geometry
on the Determination of Henrys Law Constants for Fluorotelomer Alcohols. Journal of Chemical &
Engineering Data 56 (8):3442-3448. 10.1021/je200466.
Wurl, Oliver, Werner Ekau, William M. Landing, and Christopher J. Zappa. 2017. Sea surface microlayer in a
changing ocean – A perspective. Elementa: Science of the Anthropocene 5. 10.1525/elementa.228.
WV DEP. 2002. Final Ammonium Perfluorooctanoate (C8) Assessment pf Toxicty Team (CATT)
Report. https://dep.wv.gov/WWE/watershed/wqmonitoring/Documents/C-8/C-8_FINAL_CATT_REPORT_8-02.pdf.
WV DEP. 2015. Statement of Basis. DuPont Washington Works. EPA ID No. WVD 04-587-5391: West Virginia Department of Environmetnal Protection.
https://www.dep.wv.gov/dlr/oer/superfund/Documents/DuPont_WW_Statement_Of_Basis_Apr_28_2015.pdf
.
WV University. 2008. The C8 Health Project. Population Results for C8 and C8 Sulfonate Plasma Concentrations.: West Virginia University. http://www.hsc.wvu.edu/media/5354/overall-c8-c8s-results.pdf
WY DEQ. Fact Sheet #10 Soil Confirmation Sampling Guidelines. Voluntary Remediation Program (VRP).
Xia, Xinghui, Andry H. Rabearisoa, Xiaoman Jiang, and Zhineng Dai. 2013. Bioaccumulation of Perfluoroalkyl
Substances by Daphnia magna in Water with Different Types and Concentrations of Protein. Environmental
Science & Technology 47 (19):10955-10963. 10.1021/es401442.
Xia, Xinghui, Andry Harinaina Rabearisoa, Zhineng Dai, Xiaoman Jiang, Pujun Zhao, and Haotian Wang. 2015.
Inhibition effect of Na+ and Ca2+ on the bioaccumulation of perfluoroalkyl substances by Daphnia
magna in the presence of protein. Environmental Toxicology and Chemistry 34 (2):429-436.
https://doi.org/10.1002/etc.2823.
Xia, Xinghui, Zhineng Dai, Andry Harinaina Rabearisoa, Pujun Zhao, and Xiaoman Jiang. 2015. Comparing
humic substance and protein compound effects on the bioaccumulation of perfluoroalkyl substances by
Daphnia magna in water. Chemosphere 119:978-986.
https://doi.org/10.1016/j.chemosphere.2014.09.034.
Xiao, Feng, Bosen Jin, Svetlana A. Golovko, Mikhail Y. Golovko, and Baoshan Xing. 2019. Sorption and
Desorption Mechanisms of Cationic and Zwitterionic Per- and Polyfluoroalkyl Substances in Natural Soils: Thermodynamics and Hysteresis. Environmental Science & Technology 53 (20):11818-11827.
https://doi.org/10.1021/acs.est.9b05379.
Xiao, Feng, Matt F. Simcik, and John S. Gulliver. 2012. Perfluoroalkyl acids in urban stormwater runoff:
Influence of land use. Water Research 46 (20):6601-6608. https://doi.org/10.1016/j.watres.2011.11.029.
Xiao, Feng, Matt F. Simcik, Thomas R. Halbach, and John S. Gulliver. 2015. Perfluorooctane sulfonate (PFOS) and perfluorooctanoate (PFOA) in soils and groundwater of a U.S. metropolitan area: Migration
and implications for human exposure. Water Research 72:64-74.
https://doi.org/10.1016/j.watres.2014.09.052.
500

Xiao, Feng, Thomas R. Halbach, Matt F. Simcik, and John S. Gulliver. 2012. Input characterization of
perfluoroalkyl substances in wastewater treatment plants: Source discrimination by exploratory data analysis. Water Research 46 (9):3101-3109. https://doi.org/10.1016/j.watres.2012.03.027.
Xiao, Feng. 2017. Emerging poly- and perfluoroalkyl substances in the aquatic environment: A review of
current literature. Water Research 124:482-495. https://doi.org/10.1016/j.watres.2017.07.024.
Xiao, Hanshuang, Baoying Lv, Guohua Zhao, Yujing Wang, Mingfang Li, and Dongming Li. 2011. Hydrothermally Enhanced Electrochemical Oxidation of High Concentration Refractory Perfluorooctanoic Acid. The Journal of
Physical Chemistry A 115 (47):13836-13841. 10.1021/jp207519.
Xiao, Leilei, Yuhan Ling, Alaaeddin Alsbaiee, Chenjun Li, Damian E. Helbling, and William R. Dichtel. 2017. β-
Cyclodextrin Polymer Network Sequesters Perfluorooctanoic Acid at Environmentally Relevant Concentrations. Journal of the American Chemical Society 139 (23):7689-7692. 10.1021/jacs.7b02381.
Xiao, Xin, Bridget A. Ulrich, Baoliang Chen, and Christopher P. Higgins. 2017. Sorption of Poly- and
Perfluoroalkyl Substances (PFASs) Relevant to Aqueous Film-Forming Foam (AFFF)-Impacted
Groundwater by Biochars and Activated Carbon. Environmental Science & Technology 51 (11):6342-6351. 10.1021/acs.est.7b00970.
Xie, Shuangwei, Tieyu Wang, Shijie Liu, Kevin C. Jones, Andrew J. Sweetman, and Yonglong Lu. 2013. Industrial
source identification and emission estimation of perfluorooctane sulfonate in China. Environment
International 52:1-8. https://doi.org/10.1016/j.envint.2012.11.004.
Xie, Z., Z. Zhao, A. Moller, H. Wolschke, L. Ahrens, R. Sturm, and R. Ebinghaus. 2013. Neutral poly- and perfluoroalkyl substances in air and seawater of the North Sea. Environ Sci Pollut Res Int 20 (11):7988-8000.
10.1007/s11356-013-1757-z.
Xu, Bentuo, Mohammad Boshir Ahmed, John L. Zhou, Ali Altaee, Minghong Wu, and Gang Xu. 2017.
Photocatalytic removal of perfluoroalkyl substances from water and wastewater: Mechanism, kinetics
and controlling factors. Chemosphere 189:717-729. https://doi.org/10.1016/j.chemosphere.2017.09.110.
Xu, D., C. Li, Y. Wen, and W. Liu. 2013. Antioxidant defense system responses and DNA damage of
earthworms exposed to perfluorooctane sulfonate (PFOS). Environ Pollut 174:121-7. 10.1016/j.envpol.2012.10.030.
Yahia, D., C. Tsukuba, M. Yoshida, I. Sato, and S. Tsuda. 2008. Neonatal death of mice treated with
perfluorooctane sulfonate. J Toxicol Sci 33:219-226.
Yahia, D., M. A. El-Nasser, M. Abedel-Latif, C. Tsukuba, M. Yoshida, I. Sato, and S. Tsuda. 2010. Effects
of perfluorooctanoic acid (PFOA) exposure to pregnant mice on reproduction. J Toxicol Sci 35 (4):527-33.
Yamada, Ami, Nawel Bemrah, Bruno Veyrand, Charles Pollono, Mathilde Merlo, Virginie Desvignes, Véronique Sirot, Marine Oseredczuk, Philippe Marchand, Ronan Cariou, Jean-Phillippe Antignac, Bruno Le Bizec, and
Jean-Charles Leblanc. 2014. Perfluoroalkyl Acid Contamination and Polyunsaturated Fatty Acid
Composition of French Freshwater and Marine Fishes. Journal of Agricultural and Food Chemistry 62 (30):7593-7603. 10.1021/jf501113.
Yamada, Takahiro, Philip H. Taylor, Robert C. Buck, Mary A. Kaiser, and Robert J. Giraud. 2005. Thermal
degradation of fluorotelomer treated articles and related materials. Chemosphere 61 (7):974-984.
https://doi.org/10.1016/j.chemosphere.2005.03.025.
Yamashita, N., K. Kannan, S. Taniyasu, Y. Horii, G. Petrick, and T. Gamo. 2005. A global survey of perfluorinated
acids in oceans. Mar Pollut Bull 51 (8-12):658-68. 10.1016/j.marpolbul.2005.04.026.
501
Yan Z., Wu J., Wang X., Zhang Y,. 2015. Development of Water Quality Criteria for Toxic Organic Pollutants.
SpringerBriefs in Environmental Science.
Yan, Hong, Ian T. Cousins, Chaojie Zhang, and Qi Zhou. 2015. Perfluoroalkyl acids in municipal landfill leachates
from China: Occurrence, fate during leachate treatment and potential impact on groundwater. Science of
The Total Environment 524-525:23-31. https://doi.org/10.1016/j.scitotenv.2015.03.111.
Yan, Zhen-Guang, Jiang-Yue Wu, Xiao-nan Wang, and Ya-hui Zhang. 2015. Development of Water Quality
Criteria for Toxic Organic Pollutants.1-55. 10.1007/978-94-017-9795-5_1.
Yang, Bei, Weiying Zou, Zhenzhen Hu, Fangming Liu, Ling Zhou, Shulong Yang, Haibin Kuang, Lei Wu, Jie Wei,
Jinglei Wang, Ting Zou, and Dalei Zhang. 2014. Involvement of oxidative stress and inflammation in liver injury caused by perfluorooctanoic acid exposure in mice. BioMed research international 2014:409837-
409837. 10.1155/2014/409837.
Yang, Bo, Yanni Han, Yunpan Deng, Yingying Li, Qiongfang Zhuo, and Jinhua Wu. 2016. Highly efficient removal of
perfluorooctanoic acid from aqueous solution by H2O2-enhanced electrocoagulation-electroflotation technique. Emerging Contaminants 2 (1):49-55. https://doi.org/10.1016/j.emcon.2016.04.001.
Yang, C. H., K. P. Glover, and X. Han. 2010. Characterization of cellular uptake of perfluorooctanoate via
organic anion- transporting polypeptide 1A2, organic anion transporter 4, and urate transporter 1 for their
potential roles in mediating human renal reabsorption of perfluorocarboxylates. Toxicol Sci 117 (2):294-
302. 10.1093/toxsci/kfq219.
Yang, Lin, and Jingguang Li. 2015. Perfluorinated compound precursors: Biotransformation and toxicity.
Huanjing Huaxue-Environmental Chemistry 34:649-655. 10.7524/j.issn.0254-
6108.2015.04.2014091803.
Yang, Liping, Shengyan Tian, Lingyan Zhu, Zhengtao Liu, and Yahui Zhang. 2012. Bioaccumulation and distribution of perfloroalkyl acids in seafood products from Bohai Bay, China. Environmental Toxicology
and Chemistry 31 (9):1972-1979. 10.1002/etc.1917.
Yang, Q., Y. Xie, and J. W. Depierre. 2000. Effects of peroxisome proliferators on the thymus and spleen of
mice. Clin Exp Immunol 122 (2):219-26. 10.1046/j.1365-2249.2000.01367.x.
Yang, Q., Y. Xie, S. E. Alexson, B. D. Nelson, and J. W. DePierre. 2002. Involvement of the peroxisome
proliferator- activated receptor alpha in the immunomodulation caused by peroxisome proliferators in
mice. Biochem Pharmacol 63 (10):1893-900.
Yang, Qian, Manuchehr Abedi-Valugerdi, Yi Xie, Xiao-Yan Zhao, Göran Möller, B. Dean Nelson, and Joseph W.
DePierre. 2002. Potent suppression of the adaptive immune response in mice upon dietary exposure to the potent peroxisome proliferator, perfluorooctanoic acid. International Immunopharmacology 2
(2):389-397. https://doi.org/10.1016/S1567-5769(01)00164-3.
Yang, S., J. Cheng, J. Sun, Y. Hu, and X. Liang. 2013. Defluorination of aqueous perfluorooctanesulfonate by
activated persulfate oxidation. PLoS One 8 (10):e74877. 10.1371/journal.pone.0074877.
Yang, Suwen, Fanfan Xu, Fengchang Wu, Shengrui Wang, and Binghui Zheng. 2013. Development of PFOS
and PFOA criteria for the protection of freshwater aquatic life in China. Science of The Total Environment
470-471:677-683. https://doi.org/10.1016/j.scitotenv.2013.09.094.
Yang, Suwen, Fanfan Xu, Fengchang Wu, Shengrui Wang, and Binghui Zheng. 2014. Development of PFOS and PFOA criteria for the protection of freshwater aquatic life in China. Science of The Total Environment
470-471:677-683. https://doi.org/10.1016/j.scitotenv.2013.09.094.
502

Yang, Y., Y. I. Cho, and A. Fridman. 2012. Plasma Discharge in Liquid: Water Treatment and Applications. CRC
Press, Boca Raton.
Yao, Yiming, Hongkai Zhu, Bing Li, Hongwei Hu, Tao Zhang, Eriko Yamazaki, Sachi Taniyasu, Nobuyoshi
Yamashita, and Hongwen Sun. 2014. Distribution and primary source analysis of per- and poly-fluoroalkyl
substances with different chain lengths in surface and groundwater in two cities, North China.
Ecotoxicology and Environmental Safety 108:318-328. https://doi.org/10.1016/j.ecoenv.2014.07.021.
Yarwood, Greg, Susan Kemball-Cook, Michael Keinath, Robert L. Waterland, Stephen H. Korzeniowski, Robert
C. Buck, Mark H. Russell, and Stephen T. Washburn. 2007. High-Resolution Atmospheric Modeling of Fluorotelomer Alcohols and Perfluorocarboxylic Acids in the North American Troposphere. Environmental
Science & Technology 41 (16):5756-5762. 10.1021/es0708971.
Yasuoka, K., K. Sasaki, and R. Hayashi. 2011. An Energy-efficient process for decomposing
perfluorooctanoic and perfluorooctane sulfonic acids using DC plasmas generated within gas bubbles. Plasma Sources Science and Technology 20 (3):034009. https://doi.org/10.1088/0963-
0252/20/3/034009.
Yates, Brian, Ramona Darlington, Radek Zboril, and Virender Sharma. 2014. High-valent iron-based oxidants to
treat perfluorooctanesulfonate and perfluorooctanoic acid in water. Environmental Chemistry Letters 12:413-417.
10.1007/s10311-014-0463-5.
Ye, X., K. Kato, L. Y. Wong, T. Jia, A. Kalathil, J. Latremouille, and A. M. Calafat. 2018. Per- and polyfluoroalkyl
substances in sera from children 3 to 11 years of age participating in the National Health and Nutrition Examination Survey 2013-2014. Int J Hyg Environ Health 221 (1):9-16. 10.1016/j.ijheh.2017.09.011.
Yeung, L. W., A. O. De Silva, E. I. Loi, C. H. Marvin, S. Taniyasu, N. Yamashita, S. A. Mabury, D. C. Muir, and P. K.
Lam.
2013. Perfluoroalkyl substances and extractable organic fluorine in surface sediments and cores from Lake Ontario. Environ Int 59:389-97. 10.1016/j.envint.2013.06.026.
Yeung, L. W., S. J. Robinson, J. Koschorreck, and S. A. Mabury. 2013. Part I. A temporal study of PFCAs and their precursors in human plasma from two German cities 1982-2009. Environ Sci Technol 47 (8):3865-74.
10.1021/es303716.
Yeung, Leo W. Y., Clifton Dassuncao, Scott Mabury, Elsie M. Sunderland, Xianming Zhang, and Rainer Lohmann.
2017. Vertical Profiles, Sources, and Transport of PFASs in the Arctic Ocean. Environmental Science &
Technology 51 (12):6735-6744. 10.1021/acs.est.7b00788.
Yeung, Leo W. Y., Yuichi Miyake, Sachi Taniyasu, Yuan Wang, Hongxia Yu, M. K. So, Guibin Jiang, Yongning Wu,
Jingguang Li, John P. Giesy, Nobuyoshi Yamashita, and Paul K. S. Lam. 2008. Perfluorinated Compounds and Total and Extractable Organic Fluorine in Human Blood Samples from China. Environmental Science &
Technology 42 (21):8140-8145. 10.1021/es800631.
Yi, L. B., L. Y. Chai, Y. Xie, Q. J. Peng, and Q. Z. Peng. 2016. Isolation, identification, and degradation
performance of a PFOA-degrading strain. Genet Mol Res 15 (2). 10.4238/gmr.15028043.
Yin, P., Z. Hu, X. Song, J. Liu, and N. Lin. 2016. Activated Persulfate Oxidation of Perfluorooctanoic Acid (PFOA)
in Groundwater under Acidic Conditions. Int J Environ Res Public Health 13 (6). 10.3390/ijerph13060602.
Yoo, Hoon, John W. Washington, Thomas M. Jenkins, and J. Jackson Ellington. 2011. Quantitative Determination of
Perfluorochemicals and Fluorotelomer Alcohols in Plants from Biosolid-Amended Fields using LC/MS/MS and
GC/MS. Environmental Science & Technology 45 (19):7985-7990. 10.1021/es102972.
503

Young, C. J., and S. A. Mabury. 2010. Atmospheric perfluorinated acid precursors: chemistry, occurrence, and
impacts. Rev Environ Contam Toxicol 208:1-109. 10.1007/978-1-4419-6880-7_1.
Young, Cora J., Vasile I. Furdui, James Franklin, Roy M. Koerner, Derek C. G. Muir, and Scott A. Mabury. 2007.
Perfluorinated Acids in Arctic Snow: New Evidence for Atmospheric Formation. Environmental Science & Technology 41 (10):3455-3461. 10.1021/es0626234.
Yu, Qiang, Ruiqi Zhang, Shubo Deng, Jun Huang, and Gang Yu. 2009. Sorption of perfluorooctane sulfonate and
perfluorooctanoate on activated carbons and resin: Kinetic and isotherm study. Water Research 43
(4):1150-1158. https://doi.org/10.1016/j.watres.2008.12.001.
Yu, W. G., W. Liu, and Y. H. Jin. 2009. Effects of perfluorooctane sulfonate on rat thyroid hormone
biosynthesis and metabolism. Environ Toxicol Chem 28 (5):990-6. 10.1897/08-345.1.
Yuan, Guanxiang, Hui Peng, Chong Huang, and Jianying Hu. 2016. Ubiquitous Occurrence of Fluorotelomer Alcohols in Eco-Friendly Paper-Made Food-Contact Materials and Their Implication for Human Exposure.
Environmental Science & Technology 50 (2):942-950. 10.1021/acs.est.5b03806.
Zabaleta, I., E. Bizkarguenaga, U. Izagirre, N. Negreira, A. Covaci, J. P. Benskin, A. Prieto, and O. Zuloaga. 2017.
Biotransformation of 8:2 polyfluoroalkyl phosphate diester in gilthead bream (Sparus aurata). Sci Total Environ 609:1085-1092. 10.1016/j.scitotenv.2017.07.241.
Zaggia, Alessandro, and Bruno Ameduri. 2012. Recent advances on synthesis of potentially non-
bioaccumulable fluorinated surfactants. Current Opinion in Colloid & Interface Science 17 (4):188-195.
https://doi.org/10.1016/j.cocis.2012.04.001.
Zareitalabad, P., J. Siemens, M. Hamer, and W. Amelung. 2013. Perfluorooctanoic acid (PFOA) and
perfluorooctanesulfonic acid (PFOS) in surface waters, sediments, soils and wastewater – A review on
concentrations and distribution coefficients. Chemosphere 91 (6):725-732.
https://doi.org/10.1016/j.chemosphere.2013.02.024.
Zareitalabad, Parva, Jan Siemens, Florian Wichern, Wulf Amelung, and Rainer Georg Joergensen. 2013. Dose-
dependent reactions of Aporrectodea caliginosa to perfluorooctanoic acid and perfluorooctanesulfonic acid in
soil. Ecotoxicology and Environmental Safety 95:39-43. https://doi.org/10.1016/j.ecoenv.2013.05.012.
Zeilmaker, M. J., S. Fraki, E. M. J. Verbruggen, and B. G. H. NBokkers. 2018. Mixture exposure to PFAS: A
relative Potency Factor approach. RIVM Report 2018-0070. The Netherlands: Welfare and Sport National
Institute for Public Health and the Environment. Ministry of Health.
Zembouai, Idris, Mustapha Kaci, Stéphane Bruzaud, Isabelle Pillin, Jean-Luc Audic, Shima Shayanfar, and Suresh
D. Pillai.
2016. Electron beam radiation effects on properties and ecotoxicity of PHBV/PLA blends in presence of
organo- modified montmorillonite. Polymer Degradation and Stability 132:117-126. https://doi.org/10.1016/j.polymdegradstab.2016.03.019.
Zeng, H. C., L. Zhang, Y. Y. Li, Y. J. Wang, W. Xia, Y. Lin, J. Wei, and S. Q. Xu. 2011. Inflammation-like glial response
in rat brain induced by prenatal PFOS exposure. Neurotoxicology 32 (1):130-9. 10.1016/j.neuro.2010.10.001.
Zhang, Chaojie, Yan Qu, Xiaoyun Zhao, and Qi Zhou. 2015. Photoinduced Reductive Decomposition of
Perflurooctanoic Acid in Water: Effect of Temperature and Ionic Strength. CLEAN – Soil, Air, Water 43
(2):223-228. 10.1002/clen.201300869.
Zhang, Dongqing, Weilan Zhang, and Yanna Liang. 2019. Distribution of eight perfluoroalkyl acids in plant-soil-
water systems and their effect on the soil microbial community. Science of The Total Environment
697:134146. https://doi.org/10.1016/j.scitotenv.2019.134146.
504

Zhang, H., W. Liu, X. He, Y. Wang, and Q. Zhang. 2015. Uptake of perfluoroalkyl acids in the leaves of
coniferous and deciduous broad-leaved trees. Environ Toxicol Chem 34 (7):1499-504. 10.1002/etc.2968.
Zhang, H., Y. Lu, B. Luo, S. Yan, X. Guo, and J. Dai. 2014. Proteomic analysis of mouse testis reveals
perfluorooctanoic acid-induced reproductive dysfunction via direct disturbance of testicular steroidogenic machinery. J Proteome Res 13 (7):3370-85. 10.1021/pr500228.
Zhang, L., L. S. Lee, J. Niu, and J. Liu. 2017. Kinetic analysis of aerobic biotransformation pathways of a
perfluorooctane sulfonate (PFOS) precursor in distinctly different soils. Environ Pollut 229:159-167.
10.1016/j.envpol.2017.05.074.
Zhang, Lu, Hongwen Sun, Qi Wang, Hao Chen, Yiming Yao, Zhen Zhao, and Alfredo C. Alder. 2019. Uptake
mechanisms of perfluoroalkyl acids with different carbon chain lengths (C2-C8) by wheat (Triticum acstivnm
L.). Science of The Total Environment 654:19-27. https://doi.org/10.1016/j.scitotenv.2018.10.443.
Zhang, Shu, Bogdan Szostek, Patricia K. McCausland, Barry W. Wolstenholme, Xiaoxia Lu, Ning Wang, and
Robert C. Buck. 2013. 6:2 and 8:2 Fluorotelomer Alcohol Anaerobic Biotransformation in Digester Sludge
from a WWTP under Methanogenic Conditions. Environmental Science & Technology 47 (9):4227-4235.
https://doi.org/10.1021/es4000824.
Zhang, T., G. Pan, and Q. Zhou. 2016. Temperature effect on photolysis decomposing of perfluorooctanoic acid.
J Environ Sci (China) 42:126-133. 10.1016/j.jes.2015.05.008.
Zhang, T., H. Sun, Y. Lin, X. Qin, Y. Zhang, X. Geng, and K. Kannan. 2013. Distribution of poly- and perfluoroalkyl substances in matched samples from pregnant women and carbon chain length related
maternal transfer. Environ Sci Technol 47 (14):7974-81. 10.1021/es400937.
Zhang, W., Y. Zhang, H. Zhang, J. Wang, R. Cui, and J. Dai. 2012. Sex differences in transcriptional expression of
FABPs in zebrafish liver after chronic perfluorononanoic acid exposure. Environmental Science and Technology
46
(9):5175-5182.10.1021/es300147.
Zhang, Xianming, Rainer Lohmann, Clifton Dassuncao, Xindi C. Hu, Andrea K. Weber, Chad D. Vecitis, and
Elsie M. Sunderland. 2016. Source Attribution of Poly- and Perfluoroalkyl Substances (PFASs) in Surface
Waters from Rhode Island and the New York Metropolitan Area. Environmental Science & Technology Letters 3 (9):316-321.10.1021/acs.estlett.6b00255.
Zhang, Xianming, Trevor N. Brown, Frank Wania, Eldbjørg S. Heimstad, and Kai-Uwe Goss. 2010. Assessment
of chemical screening outcomes based on different partitioning property estimation methods.
Environment International 36 (6):514-520. https://doi.org/10.1016/j.envint.2010.03.010.
Zhang, Y., S. Beesoon, L. Zhu, and J. W. Martin. 2013. Biomonitoring of perfluoroalkyl acids in human urine and
estimates of biological half-life. Environ Sci Technol 47 (18):10619-27. 10.1021/es401905.
Zhao, Baoxiu, Mou Lv, and Li Zhou. 2012. Photocatalytic degradation of perfluorooctanoic acid with β-Ga2O3
in anoxic aqueous solution. Journal of Environmental Sciences 24 (4):774-780. https://doi.org/10.1016/S1001-0742(11)60818-8.
Zhao, H., C. Chen, X. Zhang, J. Chen, and X. Quan. 2011. Phytotoxicity of PFOS and PFOA to Brassica
chinensis in different Chinese soils. Ecotoxicol Environ Saf 74 (5):1343-7.10.1016/j.ecoenv.2011.03.007.
Zhao, Hongying, Junxia Gao, Guohua Zhao, Jiaqi Fan, Yanbin Wang, and Yujing Wang. 2013. Fabrication of novel SnO2- Sb/carbon aerogel electrode for ultrasonic electrochemical oxidation of perfluorooctanoate with
high catalytic efficiency. Applied Catalysis B: Environmental 136-137:278-286.
https://doi.org/10.1016/j.apcatb.2013.02.013.
505

Zhao, Hua-Zhang, Lei Wang, Ying-Yue Chang, and Yi Xu. 2016. High-efficiency removal of perfluorooctanoic
acid from water by covalently bound hybrid coagulants (CBHyC) bearing a hydrophobic quaternary
ammonium group. Separation and Purification Technology 158:9-15. https://doi.org/10.1016/j.seppur.2015.11.044.
Zhao, L., M. Zhou, T. Zhang, and H. Sun. 2013. Polyfluorinated and perfluorinated chemicals in precipitation
and runoff from cities across eastern and central China. Arch Environ Contam Toxicol 64 (2):198-207.
10.1007/s00244-012-9832-x.
Zhao, Lijie, Patricia K. McCausland, Patrick W. Folsom, Barry W. Wolstenholme, Hongwen Sun, Ning Wang, and
Robert C. Buck. 2013. 6:2 Fluorotelomer alcohol aerobic biotransformation in activated sludge from two
domestic wastewater treatment plants. Chemosphere 92 (4):464-470.
https://doi.org/10.1016/j.chemosphere.2013.02.032.
Zhao, Lijie, Patrick W. Folsom, Barry W. Wolstenholme, Hongwen Sun, Ning Wang, and Robert C. Buck.
2013. 6:2 Fluorotelomer alcohol biotransformation in an aerobic river sediment system. Chemosphere 90 (2):203-209. https://doi.org/10.1016/j.chemosphere.2012.06.035.
Zhao, Lixia, Jingna Bian, Yahui Zhang, Lingyan Zhu, and Zhengtao Liu. 2014. Comparison of the sorption
behaviors and mechanisms of perfluorosulfonates and perfluorocarboxylic acids on three kinds of clay
minerals. Chemosphere 114:51-58. https://doi.org/10.1016/j.chemosphere.2014.03.098.
Zhao, S., S. Fang, L. Zhu, L. Liu, Z. Liu, and Y. Zhang. 2014. Mutual impacts of wheat (Triticum aestivum L.)
and earthworms (Eisenia fetida) on the bioavailability of perfluoroalkyl substances (PFASs) in soil. Environ Pollut 184:495-501. 10.1016/j.envpol.2013.09.032.
Zhao, S., X. Ma, S. Fang, and L. Zhu. 2016. Behaviors of N-ethyl perfluorooctane sulfonamide ethanol (N-
EtFOSE) in a soil-earthworm system: Transformation and bioaccumulation. Sci Total Environ 554-
555:186-91.10.1016/j.scitotenv.2016.02.180.
Zhao, Z., Z. Xie, A. Moller, R. Sturm, J. Tang, G. Zhang, and R. Ebinghaus. 2012. Distribution and long-range
transport of polyfluoroalkyl substances in the Arctic, Atlantic Ocean and Antarctic coast. Environ Pollut 170:71-
7.10.1016/j.envpol.2012.06.004.
Zheng, Guomao, Erika Schreder, Jennifer C. Dempsey, Nancy Uding, Valerie Chu, Gabriel Andres, Sheela
Sathyanarayana, and Amina Salamova. 2021. Per- and Polyfluoroalkyl Substances (PFAS) in Breast Milk: Concerning Trends for Current-Use PFAS. Environmental Science & Technology.
https://doi.org/10.1021/acs.est.0c06978.
Zheng, X. M., H. L. Liu, W. Shi, S. Wei, J. P. Giesy, and H. X. Yu. 2011. Effects of perfluorinated compounds on
development of zebrafish embryos. Environ Sci Pollut Res Int 19 (7):2498-505. 10.1007/s11356-012-0977-y.
Zhi, Yue, and Jinxia Liu. 2018. Sorption and desorption of anionic, cationic and zwitterionic polyfluoroalkyl
substances by soil organic matter and pyrogenic carbonaceous materials. Chemical Engineering Journal 346:682-691. https://doi.org/10.1016/j.cej.2018.04.042.
Zhou, Minghua, Meiling Chi, Hongyu Wang, and Tao Jin. 2012. Anode modification by electrochemical
oxidation: A new practical method to improve the performance of microbial fuel cells. Biochemical
Engineering Journal 60:151-155. https://doi.org/10.1016/j.bej.2011.10.014.
Zhou, Qin, Gang Pan, and Jun Zhang. 2013. Effective sorption of perfluorooctane sulfonate
(PFOS) on hexadecyltrimethylammonium bromide immobilized mesoporous SiO2 hollow sphere. Chemosphere 90 (9):2461-2466.
https://doi.org/10.1016/j.chemosphere.2012.11.009.
506

Zhou, Qin, Hong Ping He, Jian Xi Zhu, Wei Shen, Ray L. Frost, and Peng Yuan. 2008. Mechanism of p-
nitrophenol adsorption from aqueous solution by HDTMA+-pillared montmorillonite—Implications for water purification. Journal of Hazardous Materials 154 (1):1025-1032. https://doi.org/10.1016/j.jhazmat.2007.11.009.
Zhou, Qin, Shubo Deng, Qiang Yu, Qiaoying Zhang, Gang Yu, Jun Huang, and Hongping He. 2010. Sorption of
perfluorooctane sulfonate on organo-montmorillonites. Chemosphere 78 (6):688-694.
https://doi.org/10.1016/j.chemosphere.2009.12.005.
Zhu, Lizhong, and Baoliang Chen. 2000. Sorption Behavior of p-Nitrophenol on the Interface between
Anion−Cation Organobentonite and Water. Environmental Science & Technology 34 (14):2997-3002. 10.1021/es991460.
Zhu, Runliang, Qingze Chen, Qing Zhou, Yunfei Xi, Jianxi Zhu, and Hongping He. 2016. Adsorbents based on montmorillonite for contaminant removal from water: A review. Applied Clay Science 123:239-258.
https://doi.org/10.1016/j.clay.2015.12.024.
Zhu, W., H. Roakes, S. G. Zemba, and A.R. Badireddy. 2019. PFAS Background in Vermont Shallow Soils.
https://anrweb.vt.gov/PubDocs/DEC/PFOA/Soil-Background/PFAS-Background-Vermont-Shallow-Soils-03-24-
19.pdf.
Zhuo, Q., X. Li, F. Yan, B. Yang, S. Deng, J. Huang, and G. Yu. 2014. Electrochemical oxidation of
1H,1H,2H,2H- perfluorooctane sulfonic acid (6:2 FTS) on DSA electrode: operating parameters and mechanism. J Environ Sci (China) 26 (8):1733-9. 10.1016/j.jes.2014.06.014.
Zhuo, Qiongfang, Shubo Deng, Bo Yang, Jun Huang, and Gang Yu. 2011. Efficient Electrochemical
Oxidation of Perfluorooctanoate Using a Ti/SnO2-Sb-Bi Anode. Environmental Science & Technology 45 (7):2973-2979. 10.1021/es1024542.
Zhuo, Qiongfang, Shubo Deng, Bo Yang, Jun Huang, Bin Wang, Tingting Zhang, and Gang Yu. 2012. Degradation
of perfluorinated compounds on a boron-doped diamond electrode. Electrochimica Acta 77:17-22.
https://doi.org/10.1016/j.electacta.2012.04.145.
Ziltek. 2018. RemBind enabled the safe disposal of 1,000 tonnes of Aqueous Film Forming Foam (AFFF)
impacted soil.Case Study – PFAS Z088-02.
Zushi, Y., and S. Masunaga. 2009. Identifying the nonpoint source of perfluorinated compounds using a
geographic information system based approach. Environ Toxicol Chem 28 (4):691-700. 10.1897/08-194.1.
Updated May 2021.
507

17 Additional Information
The following sections will be included in the Additional Information menu item for the web-based document.
17.1 Additional Information for Media-Specific Occurrence
This section includes the tables of information that are summarized in Section 6 and included in the figures that section.
Table 17-1A and Figure 6-1A, Observed PFAS concentrations in outdoor air
Table 17-1B and Figure 6-1B, Observed PFAS concentrations in indoor air
Table 17-2 and Figure 6-2, Observed PFAS concentrations in soil and sediment
Table 17-3 and Figure 6-3, Observed PFAS concentrations in groundwater
Table 17-4 and Figure 6-4, Observed PFAS concentrations in surface water
Table 17-5 and Figure 6-5, Observed PFOS concentrations in fish.
Table 17-1A. Observed PFAS concentrations in outdoor air
Location Information Concentrations (pg/m3)
Japan (Kanazawa and Okinawa), Hong Kong, and Chennai, India (Ge et al. 2017)
Included sampling and analysis of ambient particles at four sites for 24 PFAS (9 PFSAs and 15 PFCAs). Ultrafine particles found to be largest contributor to mass fraction of PFCAs, while most PFOS mass was in the coarse-sized fractions. Seasonal differences in PFAS attributed largely to precipitation.
The yearly average PFAS mass concentration, between summer and fall samples, in Chennai was ∑PFAS = 21.5, in Okinawa ∑PFAS = 7, in Kanazawa ∑PFAS = 13. In Hong Kong, the concentration varied from ∑PFAS = 11.5 in the summer to 53 in the winter.
North Greenland (Bossi R. 2016)
Measured a range of neutral PFAS and other persistent organic pollutants (POPs) at a research station in North Greenland from 2008 to 2013.
Reported concentrations of PFAS (sum of particle and gaseous phase) [mean (range)]: • 6:2 FTOH: 2.82 (<0.45–16.5)• 8:2 FTOH: 4.93 (<0.45–22.4)• 10:2 FTOH: 1.59 (<0.20–9.68)• N-MeFOSA: 0.44 (<0.20–3.41)• N-EtFOSA: 0.33 (<0.22–1.93)• N-MeFOSE: 0.61 (<0.15–7.46)• N-EtFOSE: 0.50 (<0.11–5.96)Average ΣPFAS ranged from 1.82 to32.1.
Northern South China Sea (Lai et al. 2016)
Air samples collected and analyzed for neutral PFAS onboard ship during a cruise campaign over the northern South China Sea in 2013.
Reported concentrations of PFAS [mean (range)]: • ΣFTOHs: 53 (17.8–105.8)• ΣFTCAs: mean not reported (0.1–0.4)• ΣFASAs: 1.2 (0.1–3.6)• Overall ΣPFAS: 54.5 (18.0–109.9)
508

Location Information Concentrations (pg/m3)
Shenzhen China (Liu et al. 2015)
Air samples collected at 13 sites, including industrial areas with many industrial manufacturers, port districts, as well as less industrialized forested and tourist areas. Samples were analyzed for a range of PFCAs and PFSAs.
PFAS concentrations reported as mean ± standard deviation (SD) (range): • PFHxS: 0.31 ± 0.39 (ND–1.2)• PFOS: 3.1 ± 1.2 (ND–4.3)• PFBA: 1.9 ± 1.8 (ND–5.0)• PFPeA: 1.9 ± 1.4 (ND–4.0)• PFHxA: 1.5 ± 1.5 (ND–3.6)• PFHpA: 0.042 ± 0.10 (ND–0.30)• PFOA: 5.4 ± 3.8 (1.5–15)• PFNA: 0.49 ± 0.33 (ND–1.0)• PFDA: 0.48 ± 0.38 (ND–1.2)• PFUDA: 0.018 ± 0.064 (ND–0.22)• PFDoA: 0.20 ± 0.19 (ND–0.54)• Overall ΣPFAS: 15 ± 8.8 (3.4–34)Highest PFAS concentrations foundwithin an industrial district downwind ofother industrial cities.
Atlantic Ocean from North Atlantic to Antarctic (Wang, Xie, et al. 2015)
Measured 12 neutral PFAS (4 FTOHs, 3 FOSAs, 3 FOSEs, and 2 FTCAs) in the atmosphere across the Atlantic from the North Atlantic to the Antarctic, as well as snow from the Antarctic Peninsula.
Total ΣPFAS in air in the gas-phase mean (range): 23.5 (2.8 to 68.8). FTOHs were found to be the dominant compound representing 93% of the total ΣPFAS.
Toronto, Canada (Ahrens et al. 2012)
Collected samples from a semi-urban location while investigating an improved technique for measuring the gas-particle partitioning of PFAS using an annular diffusion denuder sampler.
Reported concentration range of gas- phase PFAS: • ΣFTOHs (most abundant PFAS in thegas phase): 39–153• ΣFOSAs: 0.02–1.1• ΣFOSEs: 0.33–0.79• ΣFTCAs: 0.87–5.9• PFBA (dominant PFCA): 4.0–22
Japan Sea to Arctic (Cai, Xie, et al. 2012)
Neutral PFAS were measured on board ship during an expedition from the Japan Sea to the Arctic Ocean in 2010.
Reported concentrations of PFAS in the gas phase(g)/particle-phase (p) [mean (range)]: • ΣFTOHs: 174 (61–358)(g)/3.6 (1–
9.9)(p)• ΣFTCAs: 18 (5.2–47.9)(g)/0.3(0.1–0.5)(p)• ΣFASAs: 1.4 (0.5–2.1)(g)/0.2 (0.1–0.24)(p)• ΣFASEs: 5.8 (1.9–15.0)(g)/1.8 (0.4–4.9)(p)
Birmingham and Harwell, United Kingdom (Goosey and Harrad 2012)
Measured atmospheric concentrations of a range of PFAS in homes, offices, and outdoor locations in Birmingham and Harwell, UK during 2008 and 2009. Outdoor sampling included two urban and one semirural locations. (PFAS reported as MeFOSA, EtFOSA, MeFOSE and EtFOSE).
Reported concentrations of PFAS in outdoor air [mean (range)]: • PFOS: 2.3 (<1.0–6.1)• PFOA: 3.5 (<1.9–20)• PFHxS: 7.0 (<1.1–30)• MeFOSA: 6.3 (<2.4–41)• EtFOSA: 89 (<5–170)• FOSA: 13 (1.8–27)• MeFOSE: 58 (3.4–130)• EtFOSE: 73 (20–120)
509

Location Information Concentrations (pg/m3)
Vancouver, Canada (Shoeib et al. 2011)
Measured a range of ionic and neutral PFAS in indoor air, indoor dust, and clothes dryer lint in 152 homes in Vancouver, Canada in 2007–2008. The study included six outdoor air samples.
Reported concentrations of PFAS in outdoor air were [mean (range)]: • Σ FTOHs: 305 (161–906) • Σ FOSA/Es: 18 (8.1–108) • Σ PFCAs: below detection to 35
Atlantic Ocean: Gulf of Mexico to northeast coast of USA; Bermuda, and Nova Scotia (Shoeib et al. 2010)
Air sampling was performed in 2007 in Bermuda and Nova Scotia, and along a cruise track from the Gulf of Mexico to the northeast coast of the USA to assess air concentrations, particle-gas partitioning, and transport of a range of neutral PFAS.
Reported mean concentrations of dominant PFAS (gas + particle-phase): • ΣFTOHs: 11–165 • MeFOSE: 1.6–73
Atlantic Ocean, Antarctic Ocean, and Baltic Sea; and Hamburg, Germany (Dreyer et al. 2009)
Air samples were taken onboard several research vessels in the Atlantic Ocean, Antarctic Ocean, and the Baltic Sea as well as at one land-based site close to Hamburg, Germany, in 2007 and 2008 and were analyzed for a range of neutral and ionic PFAS.
Total gas-phase concentrations of ship- based samples (ΣPFAS) ranged from 4.5 in the Antarctic to 335 near source regions. Concentrations of 8:2 FTOH (typically the most dominant PFAS) were between 1.8 and 130. Concentrations of individual particle-bound precursors were usually below 1. Reported overall mean PFAS concentrations for all samples: • ΣFTOHs: 47 • ΣFTCAs: 3.6 • ΣFASAs: 7.6 • ΣFASEs: 3.8
Canadian Rocky and Purcell Mountains, Western Canada (Loewen et al. 2008)
Air and lake water samples were collected along an altitudinal transect across Western Canada during the spring and summer of 2004 and analyzed for a range of PFAS.
The reported ranges of vapor phase PFAS concentrations were estimated as: • ΣFTOHs: 0.8–27 • ΣFOSAs: 3.7–19 • ΣFOSEs: <25–88 The concentrations of FTOHs and FOSEs were found to increase with altitude.
Parkersburg, West Virginia. USA (Barton, Kaiser and Russell 2007)
Concurrent rain and air samples collected at nine locations at a manufacturing facility during a single precipitation event and analyzed for PFOA.
PFOA predominantly associated with particulates and detected as high as 1,100.
Atlantic Ocean from Germany to South Africa (Jahnke et al. 2007)
Air samples were collected on board a research vessel during cruise in the Atlantic Ocean from Germany to South Africa in 2005 and analyzed for a range of neutral and ionic PFAS.
Reported concentration ranges of PFAS: • 6:2 FTOH: ND–174 • 8:2 FTOH: 2–190 • 10:2 FTOH: 0.8–48 • N-EtFOSA: ND–2.2 • N-MeFOSA: 0.4–4.2 • N-MeFOSE: ND–22 • N-EtFOSE: ND–11.8
Albany, New York, USA (Kim and Kannan 2007)
Measured PFCAs, PFSAs, and FTSAs in air, rain, snow, surface runoff water, and lake water in an urban area.
Overall range of PFAS concentrations in air: • ΣPFAS (gas phase): 5.10–11.6 • ΣPFAS (particle-phase): 2.05–6.04
510

Location Information Concentrations (pg/m3)
Okinawa, Japan, and Central Oregon, USA (Piekarz et al. 2007)
Air samples were collected and analyzed for a range of neutral PFAS from locations in Okinawa, Japan, and central Oregon, USA, between 2004 and 2006. (PFAS reported as MeFOSE and EtFOSE).
Reported PFAS concentration in the gas phase (g)/particle-phase (p): • ΣFTOHs: <0.4–32 • MeFOSE: <1–25 (g)/<1–21 (p) • EtFOSE: <1–8.7 (g)/<1–6.9 (p) • N-EtFOSA: <0.4–12 (g)/<0.4–12 (p)
Parkersburg, West Virginia USA (Barton et al. 2006)
This study included six sampling events over a 10- week period during 2003–2004. Air samples were collected along the fence line of a fluoropolymer manufacturer and analyzed for PFOA.
The measured concentration of PFOA ranged from 120,000–900,000.
Canada (Shoeib et al. 2004)
Indoor and outdoor air was collected from laboratories and homes in Canada from 2001–2003 and analyzed for several PFAS. The study included two outdoor sample locations.
Reported range of PFAS concentrations in outdoor air (gas + particle-phase): • MeFOSE: 16.0–31.7 • EtFOSE: 8.47–9.79
North American cities (Stock et al. 2004)
Air samples were collected in six North American cities (Reno, NV; Griffin, GA; Cleves, OH; Winnipeg, MB; Long Point, ON; and Toronto, ON) and analyzed for three FTOHs (6:2, 8:2, and 10:2) and three polyfluorinated sulfonamides (NEtFOSA, NEtFOSE, and NMeFOSE).
Reported PFAS concentration range: • ΣFTOHs: 11–165 • Σ(N-EtFOSA, N-EtFOSE, and N-MeFOSE): 22–403
ND = Nondetect
511

Table 17-1B. Observed PFAS concentrations in indoor air
Location Information Concentrations (pg/m3) In schools, reported concentrations of PFAS [mean (range)]: • 6:2 FTOH: 7,853 (1,428–46,867) • 8:2 FTOH: 5,717 (2,480–13,888) • 10:2 FTOH: 2,066 (1,166–4,774) Measured • 8:2 FTCA: 4,554 (128–47,739)
Northern Germany (Fromme et al. 2015)
volatile PFAS in residences and schools in Northern Germany in
• 10:2 FTCA: 1,800 (47–17,360) • N-EtFOSA: 274 (62–692). In residences, reported concentrations of PFAS [mean (range)]: • 6:2 FTOH: 2,058 (289–5,424) • 8:2 FTOH: 9,007 (4,702–21,698)
2014. • 10:2 FTOH: 3,296 (759–10,306) • 8:2 FTCA: 422 (58–1,040) • 10:2 FTCA: 205 (27–560) • N-EtFOSE: 69 (27–155) • N-MeFOSE: 552 (27–3,796) Indoor office
Boston, USA (Fraser et al. 2012)
air was sampled in the winter of 2009 in 31 offices in
Reported mean concentrations of select PFAS: • 8:2 FTOH: 9,920 • N-MeFOSE: 289
Boston, MA.
512

Location Information Concentrations (pg/m3) This study
In homes, reported concentrations of PFAS [mean (range)]: • PFOS: 38 (<1–400) • PFOA: 52 (<1.9–440) • PFHxS: 36 (<1.1–220) • MeFOSA: <2.5 (<2.5–19) • EtFOSA: 120 (14–350) • MeFOSE: 950 (77–3,100) • EtFOSE: 600 (80–1,900). In offices, reported concentration of PFAS [mean (range)]: • PFOS: 56 (12–89) • PFOA: 58 (<1.9–200) • PFHxS: 94 (<1.1–330) • MeFOSA: 6 (<2.5–50) • EtFOSA: 59 (12–150) • MeFOSE: 480 (39–1,200) • EtFOSE: 490 (180–950)
reports atmospheric concentration
s of a range of
Birmingham and Harwell, United Kingdom (Goosey and Harrad 2012)
PFAS in homes, offices, and outdoor locations in Birmingham and Harwell, UK, during 2008 and 2009. (PFAS
reported as MeFOSA, EtFOSA, MeFOSE and EtFOSE).
Measured a Reported concentration range for ΣFTOHs in homes was 890–47,000. The geometric mean concentrations for other PFAS: • MeFOSE: 380 • EtFOSE: 60 • MeFOSA: 30 • EtFOSA: 20 • PFOA: 28 • PFHxA: 9.7 • PFHpA: 5.1
range of ionic and neutral PFAS in indoor Vancouver, air, indoor Canada dust, and (Shoeib et clothes dryer al. 2011) lint in 152
homes in Vancouver, Canada, in 2007–2008.
Air samples
were collected in 16 Hamburg, residential
and
Germany commercial Reported concentrations of PFAS ranged from: (Langer, buildings in • ΣFTOHs: 3,300–307,000 Dreyer, and Hamburg, • ΣFTCAs: 200–15,2000 Ebinghaus Germany, in • Σ(FASAs + FASEs): 4,400–148,000 2010) 2009–2010
and analyzed for a range of neutral PFAS.
513

Location Information Concentrations (pg/m3) Indoor and
outdoor air was collected from
Canada laboratories Reported total air concentrations (gas phase + particle phase) [mean (range)]: (Shoeib et and homes in • MeFOSE: 2590 (11.1–8,315) al. 2004) Canada from • EtFOSE: 770 (4.75–1,917)
2001–2003 and analyzed
for several PFAS.
ND = Nondetect
514

Table 17-2. Observed PFAS concentrations in soil and sediment
Location Information Concentrations (μg/kg)
Global Distribution Worldwide survey
• ΣPFCAs: 0.029–14.3 • ΣPFSAs: ND–3.27 (only one sample was ND) Remote area (Lake Bonney, Antarctica): • PFOA = 0.048 • PFOS = 0.007
of 62 soils samples, PFOA and PFHxA Global detected in all distribution samples, and (Rankin et al. PFOS detected in 2016) all but one
sample; PFOS and
PFOA the most frequently detected. Evaluated 60 soil
samples from six countries and reported global median concentrations.
Global, locations PFOS detected in
not associated 48% and PFOA Global median concentrations: with known PFAS
detected in 28% • PFOA: 0.124
sources (Strynar
of the samples. • PFOS: 0.472
et al. 2012) Note that concentrations < LOQ (~0.5 μg/kg) were assigned a value of LOQ/√2 for the median calculations.
Point Sources
515

Location Information Concentrations (μg/kg) Concentrations of
ammonium perflurooctanoat
e
Location near industrial PFAS source (Davis et al. 2007)
(APFO) in two soil borings located within an impacted well field;
APFO: 110–170
concentrations decreased
rapidly
with depth.
Fire Training/Fire PFOS and PFOA in Median concentrations: Response (Houtz
soils at an unlined
• PFOS: 2,400
et al. 2013) fire training area. • PFOA: 21 In a survey of 40
sites impacted by PFAS, the most frequently
Fire Training/Fire Response (Anderson et al. 2016)
detected compounds were PFOS (99% of surface samples), PFHxS (77%), and
PFOS: • Median: 53 • Max: 9,700
PFOA (79%). PFOS
was detected at the highest concentrations.
Industrial Areas PFOA and PFOS Max: • PFOS: 48 • PFOA: 10
(Zareitalabad, concentrations in Siemens, Hamer,
soil were
et al. 2013) compiled.
Sludge-Biosolids Application
Soil, Soil cores collected from 0–0.3 meters, entire interval homogenized; (values picked from concentrations plots).
PFOA: 0.4–0.8 PFOS: 0.2–0.4
PFNA: 0.1–0.22
PFDA: 0.05–0.33
PFUDA: 0.07–0.12
groundwater, and tile water sampled after a single high-rate application of municipal biosolids (Gottschall et al. 2017)
516

Six municipal Biosolids: biosolids and • PFOS: 80–219 biosolids-
amended • N-MeFOSAA: 63–143
Municipal Biosolids (Sepulvado et al. 2011)
surface soils. Soil concentrations decreased with depth. Values approximated
• N-EtFOSAA: 42–72 • PFOA: 8–68 Biosolid amended soil <10 cm depth: • PFOS: 2,438 • PFOA: ~8–38
from plots in • PFNA: ~2–7 supplemental • PFHpA: ~2–8 information. • PFHxS: ~3–12
Sediment
Location Information Concentrations (μg/kg)
Lake Ontario,
Yangtze &
Mississippi Maximum
Rivers (Qi et al. sediment
2016; Yeung et concentrations of 10s–100s al. 2013; Oliaei PFOA, PFOS, and
et al. 2013; Pan,
other PFAAs.
Ying, Zhao, et al.
2014)
Estuarine
sediments–South Carolina (White
Analysis of 11 PFAS.
Average of 3.79 (∑PFAS)
et al. 2015)
Surface sediments–China (Qi et al. 2016)
Analysis of 17 PFAS. Dominant PFAS: PFOA, PFOS, and PFUDA.
0.086–5.79 dry weight and an average of 1.15 (∑PFAS)
22 PFAS analyzed,
surface sediment
Surface averaged for 3
sediments and different lakes,
cores–Great and dated cores 1.5, 3.1, and 4.6 (surface sediment average for ∑PFAS 3 lakes) Lakes (Codling used to
et al. 2018) approximate depositional trends over time.
ND = Nondetect LOQ = Limit of quantitation
517

Table 17-3. Observed PFAS concentrations in groundwater
Location Information Concentrations (ng/L)
Firefighting Foam Sites
Tested 149 groundwater samples; most commonly
Median (maximum): • PFHxS: 870 (290,000) • PFHxA: 820 (120,000) • PFOS: 4,220 (4,300,000) • PFOA: 405 (250,000) • PFPeA: 530 (66,000) • PFBA: 180 (64,000) • PFHpA: 235 (75,000)
detected PFAAs: PFHxS (95%); PFHxA (94%), PFOA
AFFF Release Sites other (90%), PFPeA (88%), PFBA and PFHpA (85%), PFOS
than Fire Training Areas (84%). The frequency of detections for PFSAs in (Anderson et al. 2016) groundwater was generally higher than those of
PFCAs, which has been attributed to the use of specific AFFF formulations.
Fire Training/Fire Studies at U.S. military installations and other AFFF
Maximum: • PFOA: 6,570,000 • PFOS: 2,300,000
Response (Moody and Field release areas have documented relatively high 1999; Moody et al. 2003; Houtz
detection frequencies of PFAAs in underlying
et al. 2013) groundwater.
Landfill Impacts
518

Location Information Concentrations (ng/L)
Firefighting Foam Sites Raw leachate Range (mean contribution %): 5 municipal landfill sites in China were included in
a • PFOA: 281–217,000 (28.8)
study of 14 PFAAs concentrations in raw and treated
• PFBS: 1,600–41,600 (26.1)
Raw and Treated Landfill Leachates (Yan et al. 2015)
leachate. Total PFAAs ranged from 7.28 to 292 µg/L in raw and 0.1 to 282 µg/L in treated. Dominant compounds included PFOA (28.8% of raw and 36.8%
• PFPeA: 640–10,000 (15.9) • PFOS: 1,200–6,00
of treated) and PFBS (26.1% of raw and 40.8% of
Treated leachate
treated). Range (mean contribution %): • PFOA: 30–206,000 (36.8) • PFBS: 20–55,300 (40.8) Water maximum: • PFHxS: 281 • PFOS: 2,920 • PFHxA: 757 Leachates from two landfills were analyzed for • PFHpA: 277
Landfill Leachates (Eggen, Moeder, and Arukwe 2010)
different emerging pollutants, including PFAS. Landfills had clay liners and tubing system to collect the leachate. Data presented include PFAS
• PFOA: 767 • PFNA: 539
concentrations in water and particle phases. Particle maximum: • PFHxS: 0.15 • PFOS: 339 • PFOA: 4.05 • PFOSA: 0.44
Landfill Leachate and Groundwater (NY DEC 2017)
PFOA was detected in public and private drinking water in Petersburgh, NY. In the site investigation groundwater and leachate from the Petersburgh/Berlin landfill was tested.
PFOA groundwater range: • 1.4–1,600 PFOA
leachate: • 4,200
Range: The City of Newburgh, NY, identified PFAS in their • PFOS: 2.59–50.3 Landfill Groundwater (NY DEC water in 2016. Included in their investigation was • PFOA: 4.0–40.4 2016) the Town of New Windsor landfill, which had its • PFHxS: 3.72–86.6
monitoring wells tested for PFAS compounds. • PFHpA: 2.36–5.93 • PFBS: 8.08–23.9 Landfill Groundwater (VT DEC 2018)
Analysis of groundwater monitoring wells around landfills in Bennington, VT, for PFOS and PFOA. Nine locations were tested in 2016.
Median (maximum): • PFOA: 18 (900) • PFOS: 4.98 (140)
Biosolids/Sludge
Soil, Groundwater, and Tile Shallow groundwater (2-meter depth) sampled at 2, 7, and 10 months after application. Values picked from concentrations plots. Tile water was similar except PFOA range nondetect to 23.
PFOA: 1.5–3 PFOS: nondetect–0.8 PFNA: nondetect–1.1 PFHpA: nondetect–6
Water Sampled after a Single High-Rate Application of Municipal Biosolids (Gottschall et al. 2017)
519

Location Information Concentrations (ng/L)
Firefighting Foam Sites
Contaminated Biosolid Application Effects on Groundwater in Decatur, Alabama (Lindstrom et al. 2011)
Fluorochemical industry contaminated biosolids were applied on local agricultural fields for as much as 12 years in Decatur, Alabama. Sampling of well water near the fields showed elevated PFAS concentrations.
Range: • PFNA: 25.7 • PFOA: 149–6,410 • PFHpA: 77.2–5,220 • PFHxA: 9.7–3,970 • PFPeA: 12.2–2,330 • PFBA: 10.4–1,260 • PFOS: 12–151 • PFHxS: 12.7–087.5 • PFBS: 10.1–76.6
Industrial Sites
Industrial Use Contamination (Procopio et al. 2017)
Study by NJDEP and the NJ Brick Township Municipalities Authority on concentrations of PFAS compounds in various water sources. A plume of contamination was detected and attributed to a small manufacturer using materials containing PFOA.
Maximum: • PFOA: 70,000 • PFBA: 2,000 • PFPA: 560 • PFHxA: 3,800 • PFHpA: 4,300 • PFNA: 63 • PFDA: 560 • PFHxS: 6 • PFOS: 50
Fluorochemical Industrial Facility (Davis et al. 2007)
Environmental media (soil and water) were investigated in a PWS well field near a fluoropolymer manufacturing facility for the presence of PFOA.
Maximum: • PFOA: 78,000
Teflon Fabric Coating Facility (VT DEC 2018)
2016 investigation of PFAS contamination in relation to a former Teflon coating factory in North Bennington, VT. Over 600 drinking water wells tested and more than 300 wells exceeded the state’s PFOA/PFOS standard of 20 ppt.
Maximum: • PFOA: 4,600
Fluorochemical Industrial Facility (3M Company 2007)
Study completed at the 3M Company’s Cottage Grove, Minnesota, plant. 8 groundwater monitoring wells were installed and sampled throughout the site for the presence of FCs.
Maximum: • PFOA: 619,000 • PFBA: 318,000 • PFBuS: 26,100 • PFHxS:40,000 • PFOS: 26,000
Water Supplies–Nonsite-Related
Domestic Drinking Water Wells on Cape Cod, Massachusetts (Schaider, Ackerman, and Rudel 2016)
20 domestic drinking water wells in Cape Cod, MA, were investigated for the presence of organic wastewater compounds, including PFAS. All wells were located in areas served exclusively by onsite wastewater treatment systems.
Maximum: • PFBS: 23 • PFHxA: 2 • PFHpA: 1 • PFHxS: 41 • PFOS: 7
520

Location Information Concentrations (ng/L)
Firefighting Foam Sites
Survey across European Countries (Loos et al. 2010)
164 groundwater samples tested from 23 European countries. Sampling sites were not chosen to be “representative” or “contaminated,” but most were from official monitoring stations also used for drinking water monitoring.
Median (maximum) [freq. %]: • PFOA: 1 (39) [65.9] • PFOS: 0 (135) [48.2] • PFHxS: 0 (19) [34.8] • PFHpA: 0 (21) [29.9] • PFDA: 0 (11) [23.8] • PFBS: 0 (25) [15.2] • PFNA: 0 (1) [15.2]
Public Drinking Water Sources across the U.S. (USEPA 2017)
Results from finished groundwater testing by the EPA under UCMR3.
Range (freq. %): • PFBS: 90–220 (0.05) • PFHpA: 10–410 (0.64) • PFHxS: 30–1,600 (0.56) • PFNA: 22–56 (0.05) • PFOA: 20–350 (1.03) • PFOS: 40–7,000 (0.79)
521

Table 17-4. Observed PFAS concentrations in surface water
Location
Information Concentrations
(ng/L)
Freshwater
Remote Areas (Filipovic et al. 2015; Eriksson et al. 2013; Stock et al. 2007; Lescord et al. 2015)
PFOS and PFOA concentrations in the Faroe Islands and remote areas of Sweden have been measured in the 100s of picograms per liter range, while concentrations in the Canadian Arctic have been measured up to single nanogram per liter range.
Range: PFOS/PFOA ND to <10
Industrial Areas, Japan, and Tennessee River, USA (Saito et al. 2004; Hansen et al. 2002)
Concentrations of PFOS and PFOA as high as 144 ng/L and 67,000 ng/L, respectively, have been measured.
Maximums: PFOS: 144 PFOA: 67,000
Fire Training/Fire Response (Saito et al. 2004; Anderson et al. 2016)
Concentrations of PFOS and PFOA as high as 8,970 ng/L and 3,750 ng/L, respectively, have been measured in AFFF-impacted surface water.
Maximums: PFOS: 8,970 PFOA: 3,750
Municipal Wastewater Treatment Facilities (Becker, Gerstmann, and Frank 2008; Boulanger 2005; Wilkinson et al. 2017; MDH 2008))
Data presented typically for upstream, downstream, and effluent wastewater. Generally low frequency of detection upstream. Some treatment facilities show evidence for precursors with greater PFAS in effluent than influent.
PFOA: ND–220 PFOS: ND–814 PFHxS: ND–26 PFBS: ND–115 PFNA: ND–209
Public Drinking Water Sources across the US (USEPA 2017)
Results from finished water testing with surface water source by the EPA under UCMR3.
Range: PFBS: 90–370 PFHpA: 10–60 PFHxS: 30–190 PFNA: 20–54 PFOA: 20–100 PFOS: 40–400
Marine Water
522
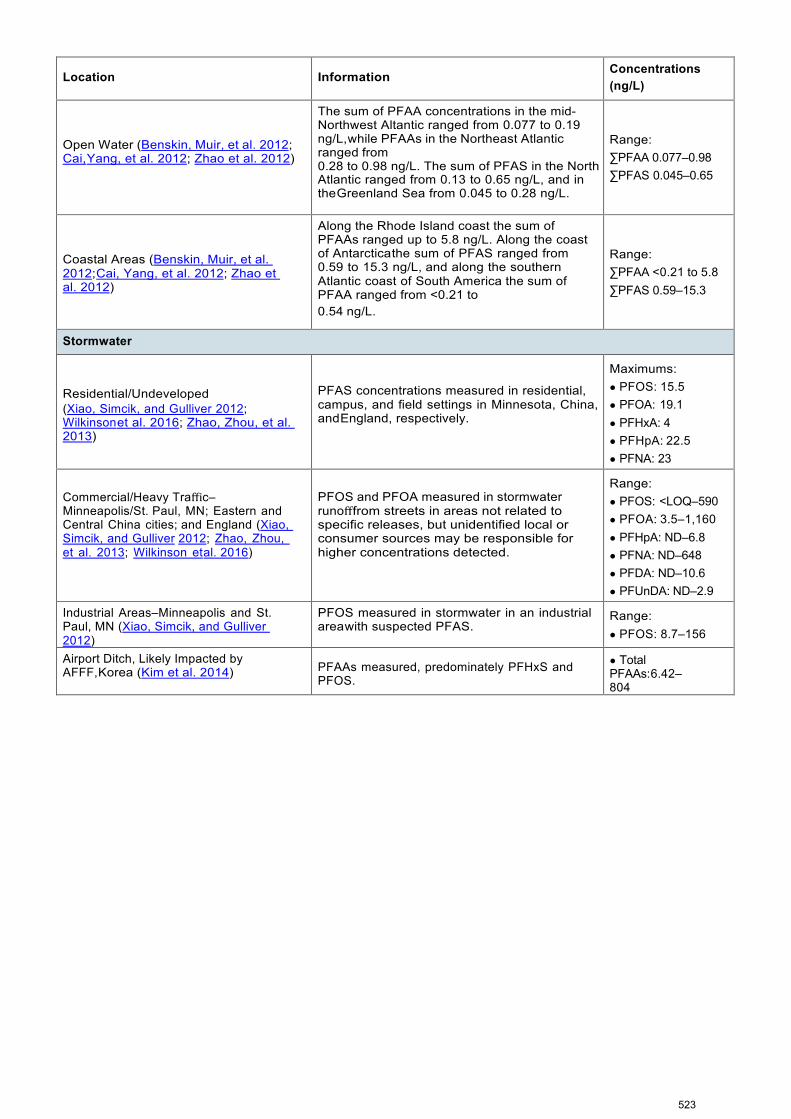
Location
Information Concentrations
(ng/L)
Open Water (Benskin, Muir, et al. 2012; Cai, Yang, et al. 2012; Zhao et al. 2012)
The sum of PFAA concentrations in the mid- Northwest Altantic ranged from 0.077 to 0.19 ng/L, while PFAAs in the Northeast Atlantic ranged from 0.28 to 0.98 ng/L. The sum of PFAS in the North Atlantic ranged from 0.13 to 0.65 ng/L, and in the Greenland Sea from 0.045 to 0.28 ng/L.
Range: ∑PFAA 0.077–0.98 ∑PFAS 0.045–0.65
Coastal Areas (Benskin, Muir, et al. 2012; Cai, Yang, et al. 2012; Zhao et al. 2012)
Along the Rhode Island coast the sum of PFAAs ranged up to 5.8 ng/L. Along the coast of Antarctica the sum of PFAS ranged from 0.59 to 15.3 ng/L, and along the southern Atlantic coast of South America the sum of PFAA ranged from <0.21 to 0.54 ng/L.
Range: ∑PFAA <0.21 to 5.8 ∑PFAS 0.59–15.3
Stormwater
Residential/Undeveloped (Xiao, Simcik, and Gulliver 2012; Wilkinson et al. 2016; Zhao, Zhou, et al. 2013)
PFAS concentrations measured in residential, campus, and field settings in Minnesota, China, and England, respectively.
Maximums: • PFOS: 15.5 • PFOA: 19.1 • PFHxA: 4 • PFHpA: 22.5 • PFNA: 23
Commercial/Heavy Traffic–Minneapolis/St. Paul, MN; Eastern and Central China cities; and England (Xiao, Simcik, and Gulliver 2012; Zhao, Zhou, et al. 2013; Wilkinson et al. 2016)
PFOS and PFOA measured in stormwater runoff from streets in areas not related to specific releases, but unidentified local or consumer sources may be responsible for higher concentrations detected.
Range: • PFOS: <LOQ–590 • PFOA: 3.5–1,160 • PFHpA: ND–6.8 • PFNA: ND–648 • PFDA: ND–10.6 • PFUnDA: ND–2.9
Industrial Areas–Minneapolis and St. Paul, MN (Xiao, Simcik, and Gulliver 2012)
PFOS measured in stormwater in an industrial area with suspected PFAS.
Range: • PFOS: 8.7–156
Airport Ditch, Likely Impacted by AFFF, Korea (Kim et al. 2014)
PFAAs measured, predominately PFHxS and PFOS.
• Total PFAAs: 6.42–804
523

Table 17-5. Observed PFOS concentrations in fish (µg/kg)
Location Information Mean (max) PFOS:
Industrial (Oliaei et al. 2013; Delinsky et al. 2010)
Near PFAS production plants, individual fish tissues such as liver, blood, and muscle have been reported to have elevated PFOS.
• Liver: (6,350) • Blood: (29,600) • Muscle: <3–100
(2,000)
PFOS:
AFFF Release (Moody et al. 2002; Gewurtz et al. 2014; Lanza et al. 2017)
PFOS in fish liver, muscle, and whole fish samples were detected following a release of AFFF during emergency or fire training activities.
• Liver: (100) 72,900 • Muscle: (6,160) • Whole fish:
~200–2,000 (15,000)
Location Information Mean (max)
Wastewater Treatment Plant (Becker, Gerstmann, and Frank 2010; Li et al. 2008; Schuetze et al. 2010)
PFOS concentrations have been detected in fish collected near the outfall of wastewater treatment plants.
PFOS: Liver: (400) Serum: (64) Muscle tissue: 7–250 (400)
Freshwater fish from New Jersey (NJDEP 2018)
PFOS concentrations in 12 species of freshwater fish from New Jersey.
PFOS: 1.4–119 (162.5)
Freshwater fish from U.S. urban rivers and the Great Lakes (Stahl et al. 2014)
PFOS concentrations in freshwater fish from U.S. urban rivers (25 species) and the Great Lakes (18 species).
PFOS: 10.7 (127)
524

17.2 Additional Information for Human Health Effects
This section supplements information provided in Section 7.1 on biomonitoring, exposure, toxicokinetic, toxicology,
and epidemiology data for long-chain and short-chain PFAAs. The PFAS discussed here include perfluorocarboxylic acids (PFCAs) with four to fourteen carbons and perfluorosulfonic acids (PFSAs) with four or more carbons. Also
covered are two fluorinated ether carboxylates (FECAs)—ammonium 2,3,3,3-tetrafluoro-2-
(heptafluoropropoxy)propanoate (also known as perfluoro-2- propoxypropanoic acid (PFPrOPrA); hexafluoropropylene oxide [HFPO] dimer acid), commonly known as GenX (Section 2.2.3.5); and 4,8-dioxa-3H-
perfluorononanoate, commonly known as ADONA. These FECAs are replacements for PFOA as processing aids in
certain fluoropolymer production. They are included because they are of current interest and health effects data
are available. There is little or no publicly available health effects information for most of the many other PFAS
used in commerce (Section 2.3), including precursors that can be converted to PFAAs in the environment and in the human body. For further detail of scientific names and carbon chain length of PFAAs see Section 2.2.
17.2.1 Overview
Based on the number of studies located through searches of the National Library of Medicine’s PubMed, a
database containing relevant peer-reviewed publications, much of the information summarized here is recent.
Additional studies may be available, particularly for those compounds with large health effects data sets, and
additional information on the topics in this section can be found in databases such as PubMed and references listed in Section 7.1.
The publicly available toxicological data set is currently largest for PFOA and PFOS, with considerable data also
available for PFBA, PFBS, PFHxA, PFNA, PFDA, and GenX, a few studies for PFHxS, PFUnA, PFDoA, and ADONA, and little or no data for PFPeA, PFHpA, PFTrA, PFTA, PFPeS, PFHpS, PFNS, or PFDS. Most of the mammalian studies
were conducted in rodents, with a few in nonhuman primates (monkeys). The most notable toxicological effects from
the mammalian studies of these PFAS, with relevant citations, are discussed in Section 17.2.5 and are
summarized in Table 17-8 (provided as a separate Excel file). However, due to the large size of the toxicological
data set, it is beyond the scope of this section to identify no observed adverse effect levels (NOAELs) and lowest
observed adverse effect levels (LOAELs) for these effects. The numerous reviews of potential epidemiological
associations of health endpoints with PFAAs are discussed in Section 17.2.4. Many of the epidemiology studies
evaluate associations of health endpoints with multiple PFAAs detected in the blood serum of the subjects. Finally,
data gaps and research needs are discussed.
17.2.2 Human Biomonitoring and Sources of Exposure
Several long-chain PFAAs (from highest to lowest geometric mean [GM] serum levels, as follows: PFOS, PFOA,
PFHxS, PFNA) are present in the low parts per billion (ng/ml) range in the blood serum of almost all adult residents of the United States, while other PFAS are detected in a smaller percentage of the population (CDC 2018; Olsen et
al. 2017)). In contrast, short- chain PFAAs such as PFBS and PFHxA are more rapidly excreted and were
infrequently detected in the blood serum of the U.S. general population (CDC 2018; Olsen et al. 2017). For example, PFBS was detected in less than 5% of serum samples in all National Health and Nutrition Examination
Survey (NHANES) years except 2005–‘06 (CDC 2018). Both NHANES and the blood donor studies show generally
higher levels of long-chain PFAAs in males than females, with generally decreasing serum levels of long-chain
PFAAs over time. NHANES 2013–‘14 evaluated PFAS in children 3–11 years old (CDC 2018) and found serum levels of PFOS, PFOA, PFHxS, and PFNA generally similar to those in older adolescents and adults in the same
time period. It was noted that most of the children studied were born after PFOS manufacturing was phased out in
525

the United States in 2002 (Ye et al. 2018). Long-chain PFAA human serum levels in other industrialized countries
are generally similar to the United States (Kato 2015) and may be lower in less developed nations (for example, Afghanistan) where they are less likely to be used industrially and consumer products containing them are less
frequently used (Hemat et al. 2010).
Testing in 2017 by the North Carolina Department of Health and Human Services (NC DHHS) did not detect HFPO-DA (“GenX”) in the blood serum or urine of North Carolina residents with previous or current exposure from private
wells, but did detect other PFAS (NC DHHS 2018). A North Carolina State University study of a public water system
and its users included a larger list of PFAS analytes and, although no GenX was detected, they identified four newly identified PFAS in the drinking water and blood serum of most participants (Hogue 2019; Hopkins et al. 2018). A
recent study of a potentially exposed population detected ADONA in only a few subjects (Fromme et al. 2017).
Human exposures can result from consumption of fish from waters contaminated with bioaccumulative PFAAs (for example, MDCH (2014)). PFSAs with more than eight fluorinated carbons (that is, PFOS and longer chain for
PFSAs; PFNA and longer chain for PFCAs) are substantially more bioaccumulative than shorter chain PFAAs, with
PFSAs generally more bioaccumulative than PFCAs with the same number of fluorinated carbons (Conder et al. 2008; Martin et al. 2003). When drinking water is contaminated with even relatively low levels of long-chain PFAAs,
exposure from drinking water may dominate contributions from exposure sources such as food and consumer
products that are prevalent in the general population. For example, USEPA (2011) predicted that ongoing exposure to 20 ng/L PFOA in drinking water will increase serum PFOA levels more than two-fold from the U.S.
median of 2 ng/L. Elevated serum levels of long-chain PFAAs have been observed in communities with
contaminated drinking water in several U.S. states, including Ohio and West Virginia (WV University 2008; Emmett
et al. 2006; Steenland et al. 2009) (Hoffman et al. 2011), New Hampshire (NH DHHS 2015), Alabama (ATSDR
2013), Minnesota (MDH 2009; Landsteiner et al. 2014), New York (NYS DOH 2016), and in other nations, including
Germany (Hölzer et al. 2008) and Sweden (Li et al. 2018) (Table 17-6). ATSDR (2019) plans to conduct exposure
assessments that will include biomonitoring in eight U.S. locations impacted by PFAS in drinking water.
Understanding exposures to PFAS at different developmental phases (for example, fetus, infant) is important to
ensure protection of the most sensitive subpopulations. Evidence for developmental effects from early life
exposures to long-chain PFAAs in humans is discussed in Section 17.2.4 and in animals in Section 17.2.5. PFAAs
(primarily PFHpA and longer chain PFCAs; PFHxS and longer chain PFSAs) have been detected in human amniotic fluid (Stein et al. 2012; Zhang, Sun, et al.2013), umbilical cord blood (Kato 2015; Kudo 2015), and breast milk (Liu, Li,
et al. 2010; White et al. 2011; Post, Cohn, and Cooper 2012; Kato 2015; Kudo 2015). Although the specific
compounds analyzed for and/or detected vary among studies, other PFAAs that have been analyzed for in breast milk rarely exceeded the limit of quantitation (Tao, Kannan, et al. 2008; Tao, Ma, et al. 2008). Serum levels of
several long-chain PFAAs were higher in breast-fed infants than in their mothers and declined slowly following
weaning (Mogensen et al. 2015), and serum levels of infants who drank formula prepared with PFAS-contaminated water were higher than in older individuals using the same water source. Infants and toddlers may also receive
higher exposures because of age-specific behaviors such as hand-to-mouth activity that results in greater
ingestion of house dust, and more time spent on floors with treated carpets relative to older children or adults (Trudel et al. 2008; Shoeib et al. 2011).
Elevated serum levels of PFAAs, in some cases >100,000 ng/ml, have been found in industrially exposed workers
(Olsen 2015). Serum concentrations of PFCAs (PFHpA and longer) were also increased in professional ski waxing
technicians due to exposures to fluorinated ski waxes (Freberg et al. 2010; Nilsson et al. 2010). Higher serum levels of PFDA (Dobraca et al.2015), PFOS, and PFHxS (Rotander et al. 2015) have been reported in firefighters
relative to those in the general population.
526

17.2.3 Toxicokinetics
PFAAs for which data are available (PFOA, PFHpA, PFHxA, PFOS) were well absorbed orally (>90%) in rodents
(Kudo 2015). PFOA and PFNA were absorbed via inhalation as dusts or aerosols (Kinney, Chromey, and Kennedy 1989; Hinderliter, DeLorme, and Kennedy 2006). PFOA was absorbed to a limited extent from dermal exposure in
studies of isolated human and rodent skin (Fasano et al. 2005; Franko et al. 2012).
PFAAs, particularly long-chain PFCAs and PFSAs, have unique toxicokinetic properties as compared to other types of
POPs. Unlike most other bioaccumulative organic compounds (for example, dioxins, PCBs), PFAAs do not have a
high affinity for adipose tissue. In contrast, PFAAs are water soluble, have an affinity for proteins (which varies
among compounds), and generally distribute primarily to the liver, blood serum (where they are bound to albumin
and other proteins), and kidney (Bischel et al. 2011; Lau 2012, 2015; Kato 2015).
PFAAs are highly resistant to chemical reactions. As such, they are not metabolized, and this is also true for HFPO-DA (Gannon et al. 2016) and ADONA (Gordon 2011). However, PFAA precursors can be metabolized to PFAAs
within the body, and reactive intermediates may be formed in these metabolic pathways (Rand and Mabury 2016). Some examples are the metabolism of 6:2 fluorotelomer alcohol (6:2 FTOH) to PFBA, PFPeA, PFHxA, and PFHpA (Buck
2015); 8:2 FTOH to PFOA and PFNA (Kudo 2015; Kabadi et al. 2018); and perfluorooctane sulfonamidoethanols
(FOSEs), perfluorooctane sulfonamides (FOSAs), and perfluorooctane sulfonamidoacetic acids (FOSAAs) to PFOS (Gebbink, Berger, and Cousins 2015). Additionally, larger PFAS molecules such as polyfluoroalkyl phosphoric acid
diesters (diPAPs) have been found in human blood serum and can be metabolized to FTOHs, which are further
metabolized to PFCAs (D’Eon and Mabury 2011; Lee and Mabury 2011).
527

Table 17-6. Long-chain PFAA serum levels in populations exposed through drinking water (ng/ml = µg/L = ppb) (Means, medians, and maximums available from the cited studies are shown. AM–arithmetic mean; GM–geometric mean;
95th–95th percentile; — indicates that data are not available)
Location Study
Population Attributed Source
Year
PFOA PFOS PFHxS
Mean Median Max. Mean Median Max. Mean Median Max.
C8 Study Population: WV/Ohio (WV University 2008) Includes occupationally exposed subject
n = ~69,000 <1 – >90 yrs. M-48%, F-52%
Industrial–PFOA
2005–06
83 (AM)
28
22,412
23 (AM)
20
759
—
—
—
Arnsberg, Germany (Hölzer et al. 2008)
n=90 Children 5–6 yrs.
Industrial waste applied to agricultural land–mainly PFOA
2006
25 (AM)
—
97
5 (AM)
—
21
1 (AM)
—
13
n=164 Mothers 23–49 yrs.
27 (AM)
—
100
6 (AM)
—
17
1 (AM)
—
6
n=101 Men 18–69 yrs.
29 (AM)
—
78
12 (AM)
—
36
3 (AM)
—
9
East Metro, MN (MDH 2009)
n = 196 20–86 yrs. M-45%, F-55%
Industrial–multiple PFAS
2008–09
23 (AM)
16
177
48 (AM)
41
448
15 (AM)
9
316
Decatur, AL (ATSDR 2013)
n=153 “child” – >60 yrs. M-41%, F-59%
Industrial–multiple PFAS
2010
16 (GM)
—
144
40 (GM)
—
472
6 (GM)
—
59
Ronneby, Sweden (Li et al. 2018)
n = 3418 4–83 yrs. M-47%, F-53%
AFFF
2014
14 (AM)
10
92
245 (AM)
176
1,870
228 (AM)
152
1790
Portsmouth, NH (NH DHHS 2015)
n = 108 < 12 yrs.
AFFF
2015
4 (GM)
5
12
9 (GM)
9
31
6 (GM)
7
26
n= 363 >12 yrs.
3 (GM)
—
16
8 (GM)
—
75
8 (GM)
—
75
Hoosick Falls, NY (NYS DOH 2016)
n = 2,081 <17 – >60 yrs. M-45%, F-55%
Industrial–PFOA
Feb.–April 2016
24 (GM)
28
—
—
—
—
—
—
—
Location Study
Population Attributed Source
Year
PFOA PFOS PFHxS
Mean Median Max. Mean Median Max. Mean Median Max.
Merrimack, NH (NH DHHS 2017)
Public water system n = 217
Industrial–PFOA
2016
3.9 (AM)
—
10.1
(95th)
5.5 (AM)
—
15.2
(95th)
1.3 (AM)
—
3.2
(95th)
Private wells N=219
4.4 (AM)
—
26.6
(95th)
5.4 (AM)
—
16.4
(95th)
1.3 (AM)
—
3.4
(95th)
528

Excretion of PFAAs and HFPO-DA is primarily through the urine, with a much smaller percentage, if any, eliminated
in the feces. In women of childbearing age, excretion also occurs through menstruation and lactation (Harada and Koizumi 2009; Thomsen et al. 2010). Serum PFAS levels were lower in adult males undergoing venesection
(ongoing blood withdrawal) for medical reasons (Lorber et al. 2015) and in firefighters who had donated blood, as
compared to other firefighters (Rotander et al. 2015). The excretion rate for long-chain PFAAs varies substantially between animal species, and it is much slower in humans than in laboratory animals. Additionally,
for some PFAS, the excretion rate is very different in males and females of the same rodent species, likely due
to differences in the extent of secretion and reabsorption by organic anion transporter proteins (OATs) and
possibly other transporter proteins in the kidney, reviewed in Lau (2012, 2015); Kudo (2015) and USEPA (2016).
Half-lives in rodents, nonhuman primates, and humans for the PFAS included in this section are shown in Table 17-7.
Table 17-7. Half-lives of PFCAs, PFSAs, and perfluoroethers in rodents, nonhuman primates, and humans
Notes: No information was located for PFPeA, PFDoA, PFTrDA, PFTeDA, PFPeS, PFNS, PFDS, ADONA; — indicates that data are not available; h–hour, d–day, y–year.
Mouse Rat Nonhuman
primate
Human
Male Female Male Female Male Female Male Female
PFCAs
PFBA 13 ha 2.9 ha 9.2 ha 1.8 ha 40 ha 41 ha 72 ha (O; mean) 87 ha (O; mean)
PFHxA
~1 hb
~2 hc
~2 hc
5.3 hc 2.4 hc 32 de (O; GM)
—
14–47 hd
PFHpA
—-
—-
2.4 hf
1.2 hf
—-
—-
— <50 yrs. of age-1.2
yg (G-U)
All M & F >50 yrs. of age-1.5 yg (G-U)
PFOA
19 dh
17 dh
4–6 di
2-4 hi
21 dj
30 dj
3.8 y (O; mean); 2.4 y (O; GM)k 2.3 yl (DW; median)
3.3 ym (DW; GM)
3.4 yn (DW; mean)
15–50 yrs. of age-4.6
yn (DW)
15–50 yrs. of age-3.1 yn (DW)
PFNA
34–68 do,p
26–69 do,p
30 do,p
1–2 do,p
—-
—-
<50 yrs. of age-2.5
yg (G-U)
All M & F >50 yrs. of age-4.3 yg (G-U)
529

Mouse
Rat Nonhuman
primate
Human
Male Female Male Female Male Female Male Female
PFDA
—-
—-
24 dq
29 dq
—-
—-
<50 yrs. of age-4.5
yg (G-U)
All M & F >50 yrs. of age-12 yg (G-U)
PFUnA
—-
—-
—-
—-
—-
—-
<50 yrs. of age-4.5
yg (G-U)
All M & F >50 yrs. of age-12 yg (G-U)
PFSAs
PFBS
—-
—-
3.1–4.5 hr,s
2.4–4.0 hr,s
15–95 hr,s
8.1–83 hr,s
26 d (O;
GM)s
PFPeS —- —- —- —- —- —- —- —-
PFHxS
29 dt
26 dt
29 dt
1.8 hdt
141 dt
87 dt
8.5 y (O; mean); 7.3 y (O, GM)k 5.3 yn (DW)
15–50 yrs. of age-7.4
yn (DW)
15–50 yrs. of age-4.7 yn (DW)
PFOS
40 du
34 du
47–67 du,v
40–48 du,v
132 du
110 du
5.4 y (O; mean); 4.8 y (O; GM)k 3.4 y n (DW; mean)
15–50 yrs. of age-4.6
yn (DW; mean)
15–50 yrs. of age-3.1 yn (DW; mean)
Perfluoroether (Replacement for PFOA in fluoropolymer manufacturing processes)
GenX 21 hw 18 hw 3 hx <3 hx ~2 hy ~2 hy —- —-
530

Mouse
Rat Nonhuman
primate
Human
Male Female Male Female Male Female Male Female
DW–Based on decline in serum levels after exposure to contaminated drinking water ended. GM–Geometric mean. G-U–Mean value; based on urinary excretion in general population, with modeled menstrual excretion for F < 50 yrs. old. More uncertain than estimates based on decline in serum levels. (Not shown for PFAS with half-lives based on serum decline). O–based on decline in serum levels in workers or retired workers after exposure ended. a Chang et al. (2008) b Iwai (2011), reported in Russell, Nilsson, and Buck (2013) c Chengelis et al. (2009) d Noker (2001) reported in Russell, Nilsson, and Buck (2013) e Russell, Nilsson, and Buck (2013) f Ohmori et al. (2003) g Zhang, Beesoon, et al. (2013) h Johnson and Ober (1979) Kemper and Jepson (2003) i Lau et al. (2006) j Butenhoff, Kennedy, Hinderliter, et al. (2004) k Olsen et al. (2007) l Bartell et al. (2010) m Brede et al. (2010) n Li et al. (2018) o Tatum-Gibbs et al. (2011) p Ohmori et al. (2003) q Gibbs et al. (2012) r Chengelis et al. (2009) s Olsen et al. (2009) t Sundstrom et al. (2012) u Chang et al. (2012) v Butenhoff (2007) w DuPont
(2011) x
DuPont (2011) y DuPont
(2008)
As shown in Table 17-7, excretion rates in mammalian species vary among PFAS for which half-life data are
available, with short-chain PFAAs and GenX generally excreted more rapidly than longer chain PFAAs. Half-lives in
rodents and nonhuman primates are generally in the range of several weeks to several months for long-chain PFAAs, and about 1 hour to several days for short-chain PFAAs and GenX. However, PFOA, PFNA, and PFHxS
(reviewed in Kudo (2015)) are excreted much more rapidly (hours to days) in female than male rats; this sex
difference in rats also exists but is not as pronounced for PFBA, PFHxA, PFHpA, and PFBS (Kudo 2015). This
difference in excretion rate is important in interpretation of rat toxicology studies of these compounds, particularly for
developmental effects.
531

Human half-lives for PFAS are longer than in other mammalian species that have been studied, with estimates of several years for long-chain PFAAs (PFOA, PFNA, PFOS, PFHxS); 1 year for PFHpA, and several days to 1 month for
shorter chain PFAAs (PFBA, PFHxA, PFBS; Table 17-7). The estimates of human half-life shown in Table 17-7 are
based on measured declines in serum PFAS levels in the same individuals over time after a source of elevated
exposure, such as occupational exposure or ingestion of contaminated drinking water, ceases. Such estimates are less uncertain than population-based estimates from modeling of PFAS intake and biomonitoring data for
serum PFAS levels from different sets of individuals from the general population at different time points. Half-life
estimates based on urinary excretion are available for several PFAAs, including some with no serum-based half-
life estimates ((Zhang, Beesoon, et al. 2013) shown as G-U in Table 17-7); these urinary estimates are less certain because they include modeled estimates of menstrual excretion in women of childbearing age and do
not consider fecal excretion or blood loss other than menstruation (for example, blood donation). It should be
noted that there are large inter-individual variations in human half-lives, which may arise from physiological
factors (for example, differences in renal transport by OATs; Yang, Glover, and Han (2010)).
Because of the large species and sex differences in excretion rates, the internal dose resulting from a given
administered dose varies widely among species and, in some cases, males and females of the same species.
Therefore, interspecies (for example, animal-to-human) comparisons must account for the large interspecies
half-life differences with approaches such as use of internal dose (serum level) as the dose metric, interspecies
toxicokinetic extrapolation based on the ratio of half- lives in humans and animals, or use of physiologically based pharmacokinetic models.
17.2.3.1 Toxicokinetics Relevant to Developmental Exposures
Toxicokinetics relevant to developmental exposures to PFAAs are important because developmental effects are
sensitive endpoints for toxicity of long-chain PFAAs in rodents, and prenatal exposure to some long-chain PFAA
was associated with decreased fetal growth in some human epidemiology studies. Developmental exposures
have been studied in rodents for several PFAAs, but not in nonhuman primates. PFAAs cross the placenta to reach the developing fetus in both humans and rodents (reviewed in Lau (2012) and Kudo (2015)), and are
transferred to milk, resulting in exposure via lactation (Luebker, Case, et al. 2005; White et al. 2009; Kato 2015).
In humans, long-chain PFAAs have been detected in cord blood (for example, Wang et al. (2019)) and amniotic
fluid (Stein et al. 2012; Zhang, Sun, et al. 2013).
In humans, the greatest exposures to PFAAs in breast milk occur during the first few months of infancy because
both PFAA concentrations in milk and the breast milk ingestion rate on a BW basis (ml/kg/day) are highest then; PFAA levels in milk may be lower in mothers who previously nursed other infants (Tao, Kannan, et al. 2008;
Haug et al. 2011; Thomsen et al. 2010). Serum concentrations of long-chain PFAAs in breast-fed infants increase
several-fold from the levels at birth during the first few months of life, followed by a decline in older infancy and early childhood (Fromme et al. 2010; Mogensen et al. 2015; Verner et al. 2016, Verner et al. 2016; MDH 2018,
2019; reviewed in NJDWQI (2015); (2017), (2018). Because of their higher rate of fluid consumption on a BW
basis, exposures to infants who consume formula prepared with PFAS- contaminated water are also highest during the first few months of life (USEPA 2011). Goeden, Greene, and Jacobus (2019) presented a model that
predicts transplacental transfer and exposure to breast-fed and formula-fed infants for long-chain PFAAs in
drinking water.
532

17.2.3.2 Relationship of Human Exposures to Serum Levels
Clearance factors (CL) that describe the relationship between oral exposures or dose (ng/kg/day) and steady-
state serum levels (ng/L) in humans have been developed for PFOA (Lorber and Egeghy 2011; USEPA 2016) and PFOS (USEPA 2016):
Dose [ng/kg/day] x CL [L/kg/day] = serum concentration [ng/L].
These clearance factors, which indicate bioaccumulative potential, are based on average values for human PFAS
half-lives and volumes of distribution (Vd);
CL [L/kg/day] = Vd [L/kg Body Wt] x [Ln2/half-life in days]. Where Ln2 is the natural log of 2.
When combined with mean daily U.S. water ingestion rates (USEPA 2011), the CLs can be used to predict the
expected average increase in serum levels (above the “baseline” serum level from non-drinking water sources) that results from ongoing exposure to a given drinking water concentration of PFOA or PFOS (Bartell 2017;
NJDWQI 2017; Post, Gleason, and Cooper 2017). For PFOA, this average serum:drinking water ratio is greater
than 100:1 (NJDWQI 2017); this ratio is consistent with data from exposed populations and toxicokinetic modeling
(Emmett et al. 2006; Hoffman et al. 2011; Bartell 2017). The CL for PFOS predicts an average serum:drinking
water ratio of about 200:1 (NJDWQI 2018; Post, Gleason, and Cooper 2017; Lu and Bartell 2019), and available
toxicokinetic data also support an estimated ratio of 200:1 for PFNA (NJDWQI 2015; Lu and Bartell 2019) and
PFHxS (Lu and Bartell 2019). It should be noted that PFAA serum:drinking water ratios vary among individuals
using the same source of contaminated drinking water, due to inter-individual differences in daily water
consumption rates (L/kg/day) and/or physiological differences relevant to toxicokinetics.
17.2.3.3 Isomer-Specific Toxicokinetics
Some PFAAs exist as a mixture of linear and branched isomers; the isomer profile varies depending on the
manufacturing process used (telomerization yields primarily linear PFAS; electrochemical fluorination yields a
mixture of linear and branched PFAS; Section 2.2.5.2. Toxicokinetics may differ among isomers of the same PFAA
in rodents (Loveless et al. 2006; De Silva et al. 2009) and humans (Zhang, Beesoon, et al. 2013; Gao et al. 2015; Beesoon et al. 2011).
17.2.4 Human Epidemiology Studies
Many U.S. general population studies are based on data from NHANES, and other general population studies
come from various worldwide locations. These include studies of specific subpopulations such as pregnant women, infants, children, or the elderly, as well as evaluations of associations of prenatal exposures with
effects later in life. Data on communities exposed through contaminated drinking water come primarily from the
C8 Health Study evaluations of approximately 70,000 Ohio and West Virginia residents exposed to PFOA in
drinking water for at least 1 year at concentrations of 50 ng/L to >3,000 ng/L, including evaluations by the C8 Science Panel (Frisbee et al. 2009; C8 Science Panel 2020). This
panel consisted of three prominent environmental epidemiologists charged with determining whether there are
“probable links” (defined as “given the scientific evidence available, it is more likely than not that a connection exists between C8 exposure and a particular human disease among class members”) between PFOA exposures
in this study group and disease. However, such health effects studies are not available from communities with
drinking water contaminated with either the other PFAS discussed in this section or the complex mixtures of PFAS
present in AFFF. Finally, health effects of several long-chain PFAAs, including PFOA, PFOS, and PFNA, have been
studied in occupationally exposed workers (Khalil 2015). Because these workers were primarily male, relatively few women were included in these studies.
533

Exposure assessment in most but not all of these studies is based on blood serum levels of PFAS as an indicator
of internal dose. The studies often evaluate associations between health endpoints and multiple PFAS detected
in blood. Serum levels of long-chain PFAAs are indicators of long-term exposures (Section 7.1.2) that reflect
individual differences in both exposure (for example, daily water consumption) and rate of excretion. Therefore,
serum levels are less uncertain as indicators of exposure than external parameters such as drinking water
concentration. In contrast to long-chain PFAS, there is little epidemiological information on short-chain PFAS
because they are infrequently detected in blood serum due to their more rapid excretion. Exposure assessment in some of the C8 studies of communities with PFOA exposure from an industrial source is based on serum PFOA
levels estimated from modeling of drinking water and air PFOA concentrations over time, rather than measured
serum levels (Savitz et al. 2012; Winquist and Steenland 2014, Winquist and Steenland 2014; Dhingra, Lally, et al. 2016; Dhingra, Darrow, et al. 2016; Herrick et al. 2017). Finally, exposure is based on job classification, rather
than serum PFAA measurements in some occupational studies of PFOA (Gilliland and Mandel 1993; Leonard 2003;
Lundin et al. 2009; Raleigh et al. 2014), PFNA (Mundt et al. 2007), and PFOS (Alexander et al. 2003; Olsen et al. 2004; Alexander and Olsen 2007; Grice et al. 2007).
As is the case for epidemiologic studies of environmental contaminants in general, the human studies of PFAAs are observational, in contrast to toxicology studies, which are experimental. Additionally, most
epidemiology studies of PFAAs are cross-sectional, although some use other designs (prospective,
retrospective, case-control). In cross-sectional studies, exposure and outcome are evaluated at the same point in time. Such cross-sectional studies cannot reveal whether increased exposure led to the health endpoint or
vice versa, and reverse causality (for example, when a physiological change affects serum PFAS levels, rather
than the serum PFAS levels causing the physiological change) has been hypothesized by some researchers
as partially or totally explaining some of the associations in the epidemiological literature, including reduced birth weight and decreased kidney function. In general, publications of epidemiology studies report results in
terms of associations with the endpoints of interest based on statistical analysis. When there are multiple
studies of associations of an environmental contaminant such as PFAA(s) with a health endpoint, results often
differ among studies. The differing results can arise from difference in the study design (for example, sex, age,
ethnicity of population studied; magnitude and/or duration of exposure; method for assessment of endpoint of
interest), size of population studied (may be too small to detect statistically significant associations), method
used for statistical analysis, consideration of potential confounding factors, or chance. Therefore, conclusions about whether the overall body of evidence supports an association are based on scientific judgment. Such
conclusions may differ among scientists who review the same body of data, and the conclusions are often
phrased carefully to convey the nuances of the opinions being stated. Such observational studies are not
designed to prove causality for health effects, and conclusions about evidence for causality are therefore based
on criteria, such as the Hill criteria (Lucas and McMichael 2005) related to the overall body of relevant scientific information (for example, consistency, dose-response, biological plausibility, potential for reverse causality). As is
the case for associations, when conclusions about causality are presented in the scientific literature, they are
often carefully worded to convey nuances and may differ among scientists reviewing the same body of data.
534

17.2.4.1 Noncancer Health Endpoints
This section summarizes information for various categories of noncancer health endpoints: Changes in systemic
markers, Fetal growth, Immune system effects, Thyroid effects, and Other effects.
Systemic Markers
For PFOA and PFOS (Khalil 2015; USEPA 2016; USEPA 2016; NJDWQI 2017) (NJDWQI 2018; ATSDR 2021), PFNA
(NJDWQI2015; ATSDR 2021), and PFDeA (ATSDR 2021), the cited reviews concluded that associations are generally consistent for increases in total cholesterol and/or low-density lipoproteins. Australia Government DOH (2018)
concluded, based on a review of key reports and published systematic reviews, that an association of both PFOA
and PFOS with small changes in cholesterol is generally observed. Additionally, the C8 Science Panel concluded that there is a “probable link” between PFOA and clinically defined high cholesterol (C8 Science Panel 2012).
Rappazzo, Coffman, and Hines (2017) concluded that the evidence for an association of prenatal or childhood
exposure to PFAS with increased cholesterol is generally consistent; studies reviewed found associations with
PFOA, PFOS, PFNA, and/or total PFAS. Regarding causality, NJDWQI (2017) concluded that the evidence supports multiple criteria for a causal relationship between increased serum cholesterol and PFOA, while Australia
Government DOH (2018) concluded that it cannot be established whether PFOA or PFOS causes increased
cholesterol based on currently available data.
Most reviews have concluded that PFOA (Gleason et al. 2015; Khalil 2015; USEPA 2016; NJDWQI; ATSDR 2021) and
PFNA (NJDWQI 2015) are generally associated with increases in certain liver enzymes, particularly alanine aminotransferase (ALT). NJDWQI (2017) concluded that there is some evidence to support a causal relationship
between PFOA and ALT. In contrast, most evaluations of PFOS have found weaker or no evidence for associations
with increased liver enzymes (Gleason et al.2015; Khalil 2015; NJDWQI 2018; NJDWQI 2018; USEPA 2016). However, ATSDR (2021) p. 26, concluded that “increases in serum enzymes and decreases in serum bilirubin, observed in
studies of PFOA, PFOS, and PFHxS, are suggestive of liver alterations.” Australia Government DOH (2018)
concluded that an association of PFOA and PFOS with elevated levels of the liver enzyme ALT was observed in
many studies.
Various reviews have concluded that there is some evidence or limited evidence for an association of increased
serum uric acid and/or hyperuricemia with exposure to PFOA, PFOS, and/or PFNA (Gleason et al. 2015; Khalil 2015; NJDWQI 2015, 2017, 2018; Australia Government DOH 2018).
535

Fetal Growth
Exposure to PFOA and PFOS were associated with relatively small changes in measures of decreased fetal
growth (for example, birth weight, head circumference) in most studies, while some studies did not find such an
association. A systematic review and meta-analysis by Johnson et al. (2014) found that there is “sufficient” human
evidence that developmental exposure to PFOA reduces fetal growth in humans and provided a quantitative
estimate of the decrease in birth weight per ng/ml serum PFOA. The main analysis included nine studies in which
maternal or umbilical cord serum PFOA levels were measured in pregnant women. These studies met other inclusion criteria defined by the researchers; study subjects were from the general population in various locations.
An additional analysis included a large study from the C8 Health Study population with exposure from
contaminated drinking water in which maternal serum levels were retrospectively modeled. PFOA was associated with decreased birth weight in most of the studies from the general population but not in the study of the more
highly exposed community. Inclusion of the study from the C8 Health Study population, in which serum PFOA
levels during pregnancy were modeled from pre-pregnancy serum PFOA data, reduced the magnitude of decreased birth weight per ng/ml serum PFOA.
Several other reviews also evaluated the associations of PFOA and PFOS with decreased fetal growth. Bach et al.
(2015) concluded that PFOA and PFOS are associated with decreased birth weight in most studies, but that
associations in some studies were not statistically significant, and that the existing information is insufficient to
determine whether or not there is an association. Khalil (2015) concluded that there is inconsistent evidence for association of decreased birth weight and PFAS. A later meta-analysis by Negri et al. (2017), which included more
recent studies not considered by Johnson et al. (2014), also reported a quantitative relationship between
decreased birth weight and serum PFOA and PFOS levels. A recent meta-analysis by Steenland, Barry, and Savitz (2018) considered additional studies not included in the two earlier meta- analyses, including the large
studies from the C8 Health Study in which serum PFOA levels during pregnancy were modeled from pre-
pregnancy serum PFOA data. Although Johnson et al. (2014) concluded that results from studies without measured serum data during pregnancy are too uncertain to include in a metanalysis, Steenland, Barry, and
Savitz (2018) concluded that use of modeled or pre-pregnancy serum data may actually be preferable to serum
levels measured during pregnancy because these exposure estimates would not be affected by potential reverse
causality or confounding related to expansion of maternal plasma volume during pregnancy or renal glomerular filtration rate. Additionally, Steenland, Barry, and Savitz (2018) concluded that the decrease in birth weight in
studies based on late pregnancy serum PFOA levels was larger than in those based on preconception or early
pregnancy serum PFOA levels. They concluded that these findings are consistent with confounding or reverse causality as an explanation for the observed association of PFOA and decreased birth weight. A systematic review
and modeling effort by Verner et al. (2015) found that PFOA is associated with decreased birth weight, and that a
portion (less than half) of the reduction in birth weight results from confounding by associations of PFAS with
decreases in both birth weight and maternal renal glomerular filtration rate (that is, reverse causality). USEPA (2016, 2016) concluded that PFOA and PFOS are associated with decreased fetal growth, and ATSDR (2021)
p.27, concluded that “evidence is suggestive of an association between serum PFOA and PFOS and small
decreases in birth weight; the decrease in birth weight is <20 g (0.7 ounces) per 1 ng/mL increase in blood PFOA or PFOS level.” Australia Government DOH (2018) concluded that PFAS exposure was often associated with
generally small decreases in weight and length at birth in general population studies.
536

Immune System Effects
Of the several potential effects of PFAS on immune function, the discussion below focuses on associations with
antibody response to vaccines, including in children, because this endpoint has been evaluated and reviewed
most extensively. A systematic review by the National Toxicology Program (NTP 2016, p.1) concluded that PFOA
and PFOS are “presumed to be an immune hazard to humans” based on a high level of evidence from animal studies and a moderate level of evidence from human studies for suppression of antibody response. ATSDR
(2021) p. 27, concluded that “evidence is suggestive of an association between serum PFOA, PFOS, PFHxS, and
PFDeA (meaning PFDA) levels and decreased antibody responses to vaccines.” USEPA (2016, 2016) stated that there is an association between PFAS and decreased vaccine response and noted that serum concentrations of
multiple PFAS are often correlated in the relevant studies. Rappazzo, Coffman, and Hines (2017) found that there
is generally consistent evidence for association of PFAS with this effect in children. NJDWQI (2017),(2018)
concluded for PFOA that associations and decreased vaccine response are consistent among studies, and for
PFOA, while decreased vaccine response was consistently observed, evidence is limited because most of the vaccine types were evaluated in only one or two studies. Pachkowski, Post, and Stern (2019) concluded that there
is evidence that PFOS is associated with a decrease in some vaccine antibody responses following vaccination.
Chang et al. (2016) concluded that a consistent association with vaccine response in general has not been demonstrated for PFOA and PFOS, and that some associations for specific vaccines are “striking in magnitude”
but require replication in other studies. Australia Government DOH (2018) , pg.11 concluded, based on review of
key reports and systematic reviews, that “the strongest evidence for a link between PFAS and clinically important
immunological effects is for impaired vaccine response.” They note both that the overall human evidence is weak,
but that animal data suggests that “PFAS may alter immune function at concentrations found in humans with
environmental and occupational exposures.” Finally, Khalil (2015) stated that PFAS exposure has been associated
with immunotoxicity, including decreased vaccine response, but that the data are inconsistent.
Thyroid Effects
Evaluations of PFAAs and thyroid disease have reached varying conclusions. Although stating that the overall
database was mixed, the C8 Science Panel determined a “probable link” for PFOA and thyroid disease (C8 Science Panel 2012). ATSDR (2018),draft p.25 concluded that “epidemiology studies provide suggestive evidence of a
link between serum PFOA and PFOS and an increased risk of thyroid disease.” USEPA (2016) concluded that the
increased risk for thyroid disease in women appears to be associated with PFOA, while there is weaker or no evidence in men. For PFOS, USEPA (2016) concluded that there is limited support for an association of incidence
or prevalence of thyroid disease with PFOS, including large studies of representative samples of the general U.S.
adult population. (NJDWQI 2017) 2018) found limited evidence for association of PFOA and thyroid disease, while associations of PFOS with thyroid disease were not noted, and Khalil (2015) found that the data are inconsistent.
Australia Government DOH (2018) concluded that “there are no consistent associations between any particular
PFAS and thyroid hormones,” and that there is limited evidence of an association between PFOA and thyroid
disease in women but not in men. Rappazzo, Coffman, and Hines (2017) stated that conclusions about PFAS
and thyroid disease in children cannot be reached with certainty due to the small number of studies and
variable results. Coperchini et al. (2017) found that hypothyroidism was the most consistent thyroid effect for
PFOA, and for PFOS to a lesser extent, with women and children most susceptible. Ballesteros et al. (2017)
stated that although there is a small number of studies with comparable data, there is some consistency in evidence for increased thyroid-stimulating hormone (TSH) with PFHxS and PFOS in pregnant women, and with
PFNA TSH in teenage boys; associations with thyroid disease were not noted. More recently, a very large study (n
= ~ 63,000) evaluated thyroid diseases in a Swedish community in which one-third of the population had previous residential exposure to very high levels of PFOS (8,000 ng/L) and PFHxS (17,000 ng/L) in drinking water.
(Andersson et al. 2019). A consistent pattern of increased risk of hypothyroidism or hyperthyroidism was not found
in men or women with residential exposure to the contaminated water.
537

Other Effects
The C8 Science Panel also found probable links for PFOA with ulcerative colitis (C8 Science Panel 2012) and
pregnancy- induced hypertension [PIH] (C8 Science Panel 2012); PIH was also associated with PFOS in the
same two studies that linked it with PFOA (Stein, Savitz, and Dougan 2009; Darrow, Stein, and Steenland 2013). ATSDR (2021) p. 26, concluded that “there is suggestive epidemiological evidence for an association between
serum PFOA and PFOS and [PIH] and/or pre- eclampsia.”
For many other epidemiological endpoints that have been studied, generally consistent associations were not found and/or the available data are too limited to make firm conclusions.
It is notable that associations for several of the effects mentioned above (serum lipids, liver enzymes, vaccine response, birth weight) were observed even within the exposure range prevalent in the general population
(without specific exposures from environmental sources), as well as at higher exposures. For several of these
effects, the dose-response curves (for example, serum lipids, liver enzymes) are steepest at very low
exposures with a much flatter slope approaching a plateau at relatively low serum concentrations (for example, ~40 ng/L for PFOA and cholesterol).
17.2.4.2 Carcinogenicity
Several evaluations of the epidemiological evidence for carcinogenicity are available for PFOA and PFOS, while such evaluations have not been conducted for other PFAAs. The C8 Science Panel (2012) found a “probable link” of
PFOA with testicular and kidney cancer based on an increased incidence of these cancers in the Ohio and West
Virginia communities with drinking water exposure as well as data from other human and animal studies. Although some other occupational studies of PFOA, such as Raleigh et al. (2014), did not find increased
incidence of these tumors, increased kidney cancer was reported in workers exposed to PFOA in the West Virginia
industrial facility (Steenland and Woskie 2012). In consideration of these findings, IARC (2016) classified PFOA as “possibly carcinogenic to humans” (Group 2B) based on limited evidence that PFOA causes testicular and renal
cancer, and limited evidence in experimental animals. Based on reviews of key reports and systematic reviews,
the Australia Government DOH (2018), p.70 concluded that “the evidence on cancer risk is limited;” that it is possible that PFOA is associated with an increased risk of kidney and testicular cancer; and that the evidence
does not support PFAS being a major contributor to cancer burden in workers or exposed community populations.
As discussed in Section 9.1.3.2, PFOA, PFOS, and GenX chemicals were described as having suggestive evidence for human carcinogenicity by USEPA (2016, 2016, 2018) and NJDWQI (2017) – PFOA, NJDWQI (2018) –
PFOS, based primarily on animal data.
In contrast to PFOA, studies of cancer incidence in large populations with exposure to PFOS-contaminated drinking water are not available. Arrieta-Cortes et al. (2017) concluded that while associations with cancer were
not observed in the available occupational and general population studies of PFOS, such associations cannot be ruled out because problems with the studies may have precluded detection of associations if they were present.
They therefore concluded that there is “inadequate evidence of carcinogenicity” based on the human data.
Chang et al. (2014) stated that “many positive associations with PFOA exposure were detected in community
settings” but were not confirmed in studies of workers with much higher exposures, although increases in certain cancers in some occupational studies are noted within the paper. They concluded that a causal association
between PFOA or PFOS and human cancer is not supported by the currently available epidemiological evidence.
538

17.2.5 Animal Toxicology Studies
Many scientific considerations and decision points are involved in developing human health toxicity factors
from animal toxicology data. In the hazard identification component of the toxicity factor development, the
toxicological endpoint selected as the basis for the reference dose should be determined to be well established (that is, supported by multiple studies), related to an adverse health outcome, and relevant to
humans based on mode of action considerations. Peroxisome proliferator-activated receptor-α (PPAR-α) is
a nuclear receptor found in many human and animal tissues that is involved with numerous physiological
processes (Corton (Corton, Anderson, and Stauber 2000; Michalik et al. 2006). The role of PPAR-α in the
effects caused by PFAS and the human relevance of effects in rodents that are mediated by PPAR-α have
been a focus of research on the mode of action for the toxicological effects of PFAAs (Lau 2012; Post,
Gleason, and Cooper 2017). In the dose-response evaluation portion of toxicity factor development, the
selected endpoint must provide the data needed to determine a point of departure (that is, benchmark dose
[BMD], NOAEL, or LOAEL). To appropriately account for the large differences in PFAA half-lives among
species, and among sexes of the same species in some cases, dose-response evaluation for long-chain
PFAAs is most appropriately based on internal dose, as indicated by serum level, rather than external
(administered) dose. Finally, in development of RfDs, uncertainty factors appropriate to the specific study and endpoint are selected and applied to the point of departure to account for factors such as sensitive human
subpopulations, interspecies differences, shorter-than-chronic exposure duration, extrapolation from a NOAEL
to a LOAEL, and potentially more sensitive toxicological effects (Section 8.3 and the ITRC tables posted as an
Excel file of the basis for PFOA and PFOS values).
Toxicological effects that have been reported as statistically significant in mammalian laboratory animal studies for each PFAS, with relevant citations, are presented in Table 17-8 (provided as a separate Excel file). The sections
following the table present general discussions of systemic, reproductive and developmental, and carcinogenic
effects of these PFAS.
17.2.5.1 Systemic Effects
All of the PFAS included in Table 17-8 (provided as a separate Excel file) for which data are available caused
increased liver weight in the rodent and nonhuman primate species studied. For most of these PFAS, increased liver weight was accompanied by hepatocellular hypertrophy. Developmental (in utero or lactational) exposures to
some PFAAs caused increased liver weight in rodent offspring. Many PFCAs, as well as PFOS and GenX, caused
additional hepatic effects that are more severe in nature such as hepatocellular necrosis and/or vacuolation in
rodents and nonhuman primates, or hepatic lipid accumulation in rodents. For PFOA (Butenhoff et al. 2012;
NJDWQI 2017) and PFOS (Butenhoff et al. 2012; NJDWQI 2018), these hepatic effects increased in severity with
longer duration of exposure and may represent a progression to neoplastic changes, including hepatic adenomas.
Additional effects reported for some PFAS include bile duct toxicity in rodents and increased serum levels of liver
enzymes in rodents and/or nonhuman primates.
Some PFAAs and FECAs caused decreased serum cholesterol in rodents and/or nonhuman primates. The
increased cholesterol in humans associated with much lower exposures to some PFAS may be attributable to
interspecies differences, such as differences in activity of relevant receptors involved with cholesterol
metabolism. However, these contrasting observations in rodents and humans may also arise from differences in the fat content of a typical low-fat laboratory diet and the higher fat diet in the humans who were studied (Tan et
al. 2013; Rebholz et al. 2016), or to dose-related differences in this response, because the doses in the
toxicology studies are much higher than human exposure levels.
Some long-chain PFAAs caused immune system toxicity (Table 17-8, provided as a separate Excel file).
Decreased antibody response to antigens has been identified as a sensitive endpoint for PFOS toxicity (Lilienthal et al. 2017; MDH 2019; ATSDR 2021; NJDWQI 2018; Pachkowski, Post, and Stern 2019).
539

The majority of PFAS covered herein have not been tested for neurobehavioral effects. Of those PFAAs that have
been evaluated in rodents, exposure-related effects were not observed for PFBA and PFHxA, while exposure of
adult rodents to PFOS and PFDA caused effects including changes in learning, memory, activity, and habituation
or other effects indicative of cognitive defects. Additionally, developmental exposures to PFOA, PFOS, and PFHxS
caused persistent neurobehavioral effects in mice.
17.2.5.2 Reproductive and Developmental
Reproductive effects in males and females and developmental effects of several PFAS have been evaluated in
rodents (Table 17-8, provided as a separate Excel file), but these effects have not been studied in nonhuman
primates. In addition to the considerations common to developmental toxicity studies in general, the much
faster excretion of several PFAS in female rats than in males must be considered when interpreting results of
the rat reproductive and developmental studies.
Dosing of pregnant females with PFAAs results in gestational exposure to the fetus and also to the offspring during
lactation. Cross-fostering studies of PFOA (White et al. 2009) and PFOS (Luebker, Case, et al. 2005) in which
dosed dams fostered pups from control dams and vice versa showed that effects can result from exposures during
either gestation or lactation.
Although malformations have been reported in a few rodent studies of PFOA and PFOS, effects such as full litter
resorptions, decreased litter or number of live pups at birth, decreased survival of neonates, and decreased
fetal and neonatal weight have been more frequently and consistently found. These developmental effects may
result from toxicity to the placenta, as has been observed for PFOA (Suh et al. 2011) and PFOS (Lee et al. 2015). With PFOS at relatively high doses, neonatal mice and rats appeared normal at birth but died within a few hours;
the genesis of this phenomenon is not understood (multiple studies reviewed in NJDWQI (2018)).
Decreased growth of offspring and/or delays in reaching developmental milestones was observed for several PFAS in rodent studies (Table 17-8, provided as a separate Excel file). For PFBS (Feng et al. 2017) and PFNA (Das et
al. 2015), BW decrements persisted until adulthood. PFOA caused delays in ossification of bones and eruption
of teeth (Lau et al. 2006; Yahia et al. 2010). Developmental markers such as eye opening and/or reaching sexual
maturity were also delayed by some PFAAs, while noting that sexual maturity was conversely accelerated in male
mice by PFOA (Lau et al. 2006). Persistent neurobehavioral effects in mice resulted from developmental
exposures to several long-chain PFAS.
Certain developmental effects of some PFAAs persisted into adulthood. These include decreased size of uterus
and ovaries, accompanied by decreased number of follicles and corpora lutea, and changes in reproductive and
thyroid hormone levels in female mouse offspring exposed to PFBS (Feng et al. 2017). Developmental exposures
of mice to PFOA caused persistent delays in mammary gland development (White et al. 2009) and persistent liver
toxicity (Quist et al. 2015) at doses lower than those that caused other systemic and developmental effects;
these endpoints have not been evaluated for other PFAS.
540

17.2.5.3 Chronic Toxicity and Tumorigenicity
PFAAs have generally not been found to be mutagenic or genotoxic (Lau 2015).
Of the PFAS included in Table 17-8 (provided as a separate Excel file), chronic studies that evaluated
carcinogenicity and other effects of long-term exposure have been conducted in rats only for PFHxA, PFOA (two
studies; one in males only), PFOS, and GenX. PFHxA did not increase the incidence of tumors in either sex of rats.
PFOA increased the incidence of benign tumors, including testicular Leydig cell adenomas in both studies, and
hepatic adenomas and pancreatic acinar cell adenomas in the study that included only males. In the chronic PFOS study, benign tumors were increased, including hepatic adenomas in females, and thyroid follicular cell
adenomas in males only in the high dose “recovery group” (dosed for the first year only and evaluated at the end
of the 2-year study). GenX increased the incidence of both hepatocellular adenomas and carcinomas in females,
and the incidence of combined pancreatic acinar cell adenomas and carcinomas and testicular Leydig cell adenomas in males.
IARC (2016) classified PFOA as “possibly carcinogenic to humans” (Group 2B) based on limited evidence that
PFOA causes testicular and renal cancer, and limited evidence in experimental animals. Based on the USEPA (2005) Guidelines for Carcinogen Risk Assessment, USEPA (2016, 2016, 2018) and NJDWQI (2017) – PFOA, (2018)–
PFOS described PFOA, PFOS, and GenX as having suggestive evidence for human carcinogenicity. For PFOA,
USEPA (2016) and ATSDR (2018), draft concluded that the hepatic tumors are unlikely to be relevant to humans, while human relevance was not discounted for the testicular and pancreatic tumors. For PFOS, USEPA (2016)and
NJDWQI (2018) not discount human relevance of the hepatic tumors. USEPA (2005) and NJDWQI (2017)
developed cancer slope (potency) factors for PFOA based on the incidence of testicular Leydig cell tumors in rats.
USEPA (2016) noted that, while the mode of action for these tumors is not known, a nonlinear mode of action is likely because PFOA is metabolically inert.
17.2.6 Data Gaps and Research Needs
Although many studies relevant to health effects of PFAAs have become available in the last few years, important
data gaps remain for most of the PFAAs and FECAs discussed here, as well as for many additional PFAS used in
commerce or found in AFFF.
Human half-lives and other toxicokinetic data are not available for some PFAS found in drinking water and other
environmental media. This information is critical for adequately assessing the bioaccumulative potential and
relevant routes of exposure (for example, placental and breast milk transfer), and for extrapolation of animal
toxicity information to humans.
Available data suggest that reactive intermediates can form in the metabolic pathways that convert PFAA
precursors to PFAAs within the body. Additional information on the formation and potential toxicity of these
reactive intermediates is needed.
Although the C8 Health Study provides a large body of epidemiological data from communities with exposure to
PFOA in drinking water, such data are not available from communities with drinking water contaminated with PFOS, other PFAAs, or the complex PFAS mixtures found in AFFF. Health studies in communities exposed to PFAS from
AFFF use at nearby military sites were funded in the 2018 federal budget (Walton 2018), and these studies could
provide such information.
541

Additional toxicology data are needed for some PFAAs found in environmental media, including drinking water. For
example, there are very limited toxicology data for PFHpA, and no information was located for PFPeA. Additionally,
although humans are exposed to multiple PFAS, very little toxicological data are available for mixtures of PFAS.
Multigeneration studies are important for assessment of reproductive and developmental effects, and they are
available for only a few PFAS. PFHxS is a PFAA with a long human half-life that has been found in human serum
and in drinking water impacted by both industrial discharges and AFFF. Although developmental effects of
PFHxS are of concern, there are currently no multigenerational developmental studies for PFHxS. Available
information from rodent studies suggests that developmental exposures to some long-chain PFAS (PFOA, PFOS,
PFHxS) cause permanent neurobehavioral effects, but these data are limited. Additional studies are needed on
neurobehavioral effects of PFAS, particularly from early life exposure.
Studies that provide data on chronic effects, including carcinogenicity, are available for only four PFAS (PFHxA, PFOA,
PFOS, GenX), and such studies are needed for PFHxS, PFNA, ADONA, and other PFAS to which humans may be exposed. All of the chronic studies were conducted in rats, and chronic studies in a second species such as mice
would provide valuable information, particularly for those PFAS that are rapidly excreted in female rats.
The mode(s) of action for the toxicological effects of PFAAs are not fully understood and continue to be the focus of
ongoing research. Although not the focus of this section, data on bioavailability of PFAS from environmental media other than drinking water (for example, soil) are limited, and such information can be useful in assessing
exposures at contaminated sites.
Challenges related to the use of toxicity information from surrogates for PFAS for which no toxicity data are available
are discussed in Section 9.1.1.2. There is a need to develop approaches for addressing groups and mixtures of PFAS, such as the relative potency approach described by Zeilmaker et al. (2018).
Finally, OECD (2018) identified 4,730 PFAS-related CAS numbers, including compounds with many different
structures, including some that have not been used commercially. The majority of these PFAS, including those in
commercial use, have very limited or no toxicity data (Wang, Cousins, et al. 2015; Wang, DeWitt, et al. 2017),
indicating a critical data gap in health effects information for PFAS. Approaches currently under development at
EPA and the National Toxicology Program (NTP) may prove useful for screening of a large number of PFAS with
rapid assays that evaluate parameters related to toxicokinetics and toxicity (USEPA 2018). Additional information
is found on the EPA CompTox website (USEPA 2020; Williams et al. 2018) and from the NTP Rapid Evaluation and Assessment of Chemical Toxicity (REACT) Program (DeVito 2018).
If this effort is successful, the results could be used, along with data on human exposure, for prioritization of PFAS
for more detailed toxicological studies (USEPA 2018).
542

17.3 Additional Information for Risk Assessment
17.3.1 Human Health Exposure Assessment
Figure 9-5 illustrates predominant exposure pathways. In the following sections information is presented for exposures by environmental medium. Information about site risk assessment is in Section 9.
17.3.1.1 Soil
Soil exposure scenarios are possible at a site. Some of the PFAAs, such as PFOA and PFOS, are mobile and persistent in soil. As indicated in Section 5, PFAS distribution in soils is complex, reflecting several site-specific
factors and individual PFAS- specific factors.
Sorption and retardation generally increase with increasing perfluoroalkyl tail length, and functional groups
contribute to the degree to which a PFAS has the affinity to leach from soil to groundwater. A detailed discussion of
the fate of PFAS in soil is provided in Section 5. If PFAS are retained in soil, they are available for contact by receptors, resulting in soil exposures.
PFAS are not well absorbed through the skin (ATSDR 2021; USEPA 2016; USEPA 2016). Therefore, dermal contact
is not expected to be an important exposure route for the general public compared to other exposure pathways.
However, dermal contact may pose a risk for people with high-level occupational exposures to PFAS.
17.3.1.2 Potable Water
Potable water can be a major exposure pathway. When drinking water exposures are occurring, the drinking water
pathway typically represents the dominant exposure in comparison to other exposure pathways (for example, via
food), even when PFAS concentrations in drinking water are relatively low (Post, Gleason, and Cooper 2017; Bartell 2017). PFAS levels in young children (up to the age of 6) are higher than in adolescents and adults consuming the
same drinking water source, as discussed and cited in Section 7.1.2. This is most likely due to the higher levels of
water ingestion per unit of body mass at these ages. Even if bottled water is supplied for drinking water purposes, potential exposures may occur to PFAS in potable water if it is used for non-drinking water purposes (for example,
showering, bathing, hand washing dishes). Although the dermal absorption potential from water is low and in most
cases is expected to be insignificant, exposure may occur. In addition, if PFAS is present in potable water used for
food preparation (in commercial or residential settings), PFAS will be transferred to foods, resulting in dietary exposures.
17.3.1.3 Groundwater
The same potential exposure pathways described above for potable water apply to groundwater when used as a
potable source. In addition, construction workers may contact PFAS in shallow groundwater (if within the depth of construction activities), although dermal absorption potential from water is low. If PFAS-impacted groundwater is
used as irrigation water for crops, homegrown produce, or animal watering, PFAS in groundwater may be
transferred to biota (plants or animals), resulting in dietary exposures.
As indicated in Section 6.3, due to the mobility and persistence of PFAA in soil and groundwater, PFAAs are
expected to form larger plumes than other contaminants in the same hydrogeological setting. However, sorption and partitioning might restrict leaching rates from the vadose zone and reduce the advection-driven transport
velocity of PFAS in groundwater, depending on specific properties of the PFAS. These processes might limit
plume development and discharge to surface water and might also provide time for transformation of PFAA precursors. Groundwater geochemistry might dictate the extent of transformation because nearly all microbial
processes identified to date are aerobic (Liu and Mejia Avendaño 2013).
543

17.3.1.4 Surface Water
Surface water exposure scenarios are possible because surface water may become impacted with PFAS by
surface runoff or groundwater discharge. Surface water exposures can occur through drinking water or by consuming aquatic biota from contaminated water bodies. Much of the PFAAs reaching surface water tend to
remain in solution, although there is likely to be partitioning to sediment and uptake to biota. Once in surface
water, PFAAs can contaminate groundwater through groundwater recharge (Liu et al. 2016; ATSDR 2008).
Biofilms on surface water are known to accumulate PFAS (Munoz et al. 2018), as do other organic-/protein-rich particles in aquatic systems (Ahrens and Bundshuh 2014). Therefore, surface water films that contain these matrices are very likely significant repositories (and potential sources of exposure) of long-chain PFAS.
17.3.1.5 Sediment
Sediment exposure scenarios are possible because surface water may become impacted with PFAS by
surface runoff or groundwater discharge, and there is likely to be partitioning to sediment and uptake to biota.
However, when reaching marine waters, the solubility of anionic PFAAs decreases and sorption increases, which
likely results in a salting-out effect that scavenges some PFAAs, especially long-chain PFAAs, to the sediments of
estuarine environments (Hong et al. 2013).
17.3.1.6 Air
Inhalation exposure scenarios are possible for PFAS. Dusts containing PFAS may be generated from a site where
PFAS are present in soil. In addition, some PFAS (for example, FTOHs and some perfluoroalkyl sulfonamides)
have higher volatilities and tend to partition into air from other media (Section 5.2.4). Certain PFAS are found in ambient air, with elevated concentrations observed or expected in urban areas nearest to emission sources,
such as manufacturing facilities, wastewater treatment plants, fire training facilities, and landfills (Barton et al.
2006; Ahrens et al. 2011; Liu et al. 2015).
17.3.1.7 Diet
PFAS exposures may occur from food consumption scenarios (specifically, ingesting aquatic and terrestrial plants and animals). Crops may be impacted by PFAS if irrigated with contaminated groundwater or surface water; if
impacted by soil, runoff, or atmospheric deposition; or where biosolids have been applied to soil. In addition,
because some PFAS biomagnify in food webs, ingestion of contaminated biota, especially fish and animals that
eat fish (for example, bears), may be a major exposure route (ATSDR 2020; ATSDR 2021; USEPA 2016; USEPA 2016). Recreationally caught fish from areas with PFAS contamination may be a specific source of elevated
exposures to PFAS such as PFOS that bioaccumulate in fish. PFAS exposures may also occur from food
packaging materials containing PFAS (see Section 17.3.1.8, Consumer Products).
Breast Milk and Infant Formula
Consumption of breast milk and infant formula are potential exposure scenarios for infants. A mother’s breast milk
may be impacted through exposure to PFAS-contaminated media, and infants may ingest formula prepared with
PFAS-contaminated water (Fromme et al. 2010; Mogensen et al. 2015). Higher exposures to infants are of
concern because infants are sensitive subpopulations for developmental effects of PFAS, including PFOA and
PFOS (USEPA 2016; USEPA 2016), as discussed in Section 7.1. Infant exposure through breast milk or formula
prepared with contaminated water is higher than older adults (for example, the mother) using the same water
source. The USEPA Exposure Factors Handbook (USEPA 2011) provides detailed information on breast milk consumption rates and the higher water consumption rate of infants.
544

17.3.1.8 Consumer Products
Typically, exposure scenarios associated with consumer products are not included in human health risk
assessments (HHRAs) for contaminated sites. However, the HHRA should acknowledge that analytical results for environmental media (including indoor air and dust) may reflect impacts from consumer products (for example,
carpets and upholstered furnishings) containing PFAS that have degraded, released fibers, or volatilized.
17.3.2 Other Considerations When Calculating Exposure Point Concentrations
Other contaminants present at the site can affect the movement of PFAS, which are not easily accounted for in fate and transport models. For example, petroleum hydrocarbon co-contaminants, particularly light nonaqueous
phase liquids (LNAPLs), may affect the fate and transport of AFFF-derived PFAS (Guelfo and Higgins 2013; Lipson,
Raine, and Webb 2013; McKenzie et al. 2016). As discussed in detail in Section 5 and Section 10.4.1, the movement
of PFAS in environmental media depends on both site-specific media properties and properties of the specific PFAS. Leaching potential is a function of both media properties (for example, pH, redox conditions) and PFAS
structural properties (for example, chain length) (Gellrich, Brunn, and Stahl 2013; Gellrich, Stahl, and Knepper
2012).
It is critically important to collect site-specific soil partitioning and soil-to-groundwater pathway data for PFAS sites.
Existing models and standard methods are not able to accurately predict or calculate soil-to-groundwater movement
of PFAS, and therefore site-specific empirical data are necessary.
As discussed in detail in Section 5.4, the composition of PFAS can change in media. Studies have reported both biotic and abiotic transformations of some polyfluorinated substances (precursors), which may form PFAAs (Buck et
al. 2011). Precursors that are ingested can be transformed in the body to PFAAs (USEPA 2016; USEPA 2016).
However, PFAAs likely do not degrade or otherwise transform under ambient environmental conditions. PFAS
composition may change in surface water because of biotic and abiotic degradation of PFAA precursors. These complex transformations are not incorporated in current fate and transport models.
545

17.3.3 Information about Selecting Bioaccumulation and Bioconcentration Factors
As indicated in Section 5.5 (PFAS Uptake into Aquatic Organisms) and Section 6.5.3 (Fish), certain PFAS can
bioaccumulate in the food web. PFAS occur widely in biota through bioaccumulation processes. PFAAs, particularly
PFOS, are typically the dominant PFAS detected in biota (Houde et al. 2011). Figure 17-1 illustrates bioaccumulation from sediment and surface water.
Figure 17-1. Bioaccumulation of PFAS from sediment and surface water. (BAF–bioaccumulation factor; BCF–
bioconcentration factor; BSAF–biota-sediment accumulation factor; RfD–reference dose.
(Source: J. Conder, Geosyntec. Used with permission.)
Section 5.5.2 provides a detailed discussion of factors affecting the bioaccumulation potential of PFAS.
Section 6.5.3 (Fish) provides a detailed discussion of bioaccumulation of PFAS in fish. Accumulation of PFAS in fish
has been documented, particularly for PFOS, longer chain PFCAs (with eight or more fluorinated carbons), and perfluorodecane sulfonate (PFDS) (Houde et al. 2011; Martin et al. 2013; Conder et al. 2008). In fish, PFOS tends
to partition to the tissue of highest protein density, including the liver, blood serum, and kidney (Falk et al. 2015; Ng
and Hungerbühler 2013). PFOS BAFs in field-based studies are presented in Table 5-2 (provided as a separate Excel file).
Trophic level biomagnification in food webs (Figure 17-1) can occur for some PFAS (Franklin (Franklin 2016; Fang et al. 2014) as discussed in further detail in Section 5.5.3.
546

Sections 5.6 and 6.5.1 discuss partitioning of PFAS to plants. Plant uptake and bioaccumulation and partitioning
within the plant appear to depend on PFAS chemical structure and the plant species. Figure 17-2 illustrates
bioaccumulation of PFAS in plants. Most studies report partitioning of PFAAs within plants, with longer chain PFAAs, especially PFSAs, partitioning to the roots and more soluble, shorter chain PFAAs, especially PFCAs, partitioning to
other parts of the plant (Lechner and Knapp 2011; Stahl et al. 2009) Blaine (Blaine et al. 2013; Blaine, Rich,
Sedlacko, Hundal, et al. 2014; Yoo et al. 2011; Scher et al. 2018; Gobelius, Lewis, and Ahrens 2017). Table 5-2
(provided as a separate Excel file) contains BCFs and BAFs for 14 different PFAS for a variety of plant species. In
general, most plant BCFs and BAFs fall between a range of 0.1 and 10.
As indicated in Section 4.2.8 (Octanol/Water Partition Coefficient (Kow)) and Section 5.5.2 (Bioaccumulation), it is
difficult to measure Kow for PFAS due to their complex chemistry, and because many PFAS have both lipophobic and
hydrophobic properties. Therefore, BAFs rely on calculations from empirical data instead of modeling (Haukås et al. 2007).
Figure 17-2. Bioaccumulation of PFAS in plants.
Source: J. Conder, Geosyntec. Used with permission.
Updated May 2021.
547

Acronyms AACO Army Aviation Centre Oakey
AA-QS annual average quality standards
ADONA trade name for 4,8-dioxa-3H-perfluorononanoate
AERMOD American Meteorological Society/EPA Regulatory Model
AFCEC Air Force Civil Engineering Center American AFFF aqueous film-forming foam
ALT alanine aminotransferase
amu atomic mass unit
ANSES French National Agency for Food Safety, Environment and Labor
AERMOD American Meteorological Society/EPA Regulatory Model
AOF adsorbable organic fluorine
APFN ammonium perfluoronanoate
APFO ammonium perfluorooctanoate
ARAR applicable or relevant and appropriate requirement
AM arithmetic mean
ARP advanced reduction processes
ATSDR Agency for Toxic Substances and Disease Registry
BAF bioaccumulation factor
BARC bottom antireflective coatings
BCF bioconcentration factor
BERA baseline ecological risk assessment
BMD benchmark dose
BMF biomagnification factor
BMP best management practices
BSAF biota-sediment accumulation factor
BuFASA N-butyl perfluoroalkane sulfonamide
BuFASE N-butyl perfluoroalkane sulfonamido ethanols
BuFASAA N-butyl perfluoroalkane sulfonamido acetic acid
BV bed volume
BW body weight
C carbon
C8 historical name for PFOA
C&D construction and demolition
CAA Clean Air Act
CAC colloidal activated carbon
CalEPA California Environmental Protection Agency
CAP chemical action plan
CAS Chemical Abstracts Service
CBPR community-based participatory research
CCL Contaminant Candidate List
CCV continuing calibration verification
CDC U.S. Centers for Disease Control and Prevention
548

CERCLA Comprehensive Environmental Response, Compensation, and Liability Act
CFR Code of Federal Regulations
CHP catalyzed hydrogen peroxide
CIC combustion ion chromatography
CL clearance factor
CMC critical micelle concentrations
CNT carbon nanotube
COOH carboxylic acid functional group
CSF cancer slope factor
CSM conceptual site model
CWA Clean Water Act
Da dalton (unit of mass)
DDT dichlorodiphenyltrichloroethane
DNAPL dense nonaqueous phase liquid
DOC dissolved organic carbon
DQO data quality objective
DW drinking water
DWR durable water repellent
EAO emergency administrative order
EBCT empty bed contact time
ECCC Environment and Climate Change Canada
ECF electrochemical fluorination
ECHA European Chemicals Agency
ECOS Environmental Council of the States
ECT Emerging Compound Treatment Technologies, Inc.
EIS extraction internal standards
EPC exposure point concentration
ERA ecological risk assessment
ERB equipment rinse blank
ESS Environmental Sequence Stratigraphy
ESTCP Environmental Security Technology Certification Program
EtFASA N-ethyl perfluoroalkane sulfonamide
EtFASE N-ethyl perfluoroalkane sulfonamido ethanol (var: N-ethyl perfluoroalkane
sulfonamide ethanol)
EtFASAA N-ethyl perfluoroalkane sulfonamido acetic acid (var: N-ethyl perfluoroalkane sulfonamide acetic acid)
ETFE ethylene tetrafluoroethylene
EtFOSA N-ethyl perfluorooctane sulfonamide
EtFOSE N-ethyl perfluorooctane sulfonamido ethanol (var: N-ethyl perfluorooctane sulfonamide ethanol)
EU European Union
F fluorine
F53B chlorinated polyfluorinated ether sulfonate (PFOS substitute for plating)
F3 fluorine-free foams
FAA Federal Aviation Administration
549
FAQ frequently asked questions
FASA perfluoroalkane sulfonamide
FASE perfluoroalkane sulfonamido ethanol (var: perfluoroalkane sulfonamide ethanol)
FASAA perfluoroalkane sulfonamido acetic acid(var: perfluoroalkane sulfonamide acetic acid)
FCM food contact materials
FCS food contact substances
FD field duplicate
FDA U.S. Food and Drug Administration
FECA fluorinated ether carboxylate
FEP perfluorinated ethylene-propylene
FFFC Fire Fighting Foam Coalition
FFFP film-forming fluoroprotein foam
FHxSA perfluorohexane sulfonamide
foc fraction of organic carbon
FOSA, or PFOSA perfluorooctane sulfonamide
FOSE perfluorooctane sulfonamido ethanol (var: perfluorooctane sulfonamide ethanol)
FOSAA perfluorooctane sulfonamido acetic acid (var: perfluorooctane sulfonamide acetic acid)
FP fluoroprotein (used in the contex of firefighting foam formulations that contain a fluorinated surfactant)
FRB field reagent blank
FRM Federal Reference Method
FSANZ Food Standards Australia and New Zealand
FTA fire training area
FTCA fluorotelomer carboxylic acid
FTOH fluorotelomer alcohol
FTSA or FTS fluorotelomer sulfonate, fluorotelomer sulfonic acid
FtTAoS fluorotelomer thioether amido sulfonate
FTUCA fluorotelomer unsaturated carboxylic acid
FWQC federal water quality goal
GAC granular activated carbon
GEF Global Environment Facility
GenX trade name for a polymerization processing aid formulation that contains
ammonium 2,3,3,3-tetrafluoro-2-(heptafluoropropoxy)propanoate
GM geometric mean
HA health advisory
HDPE high-density polyethylene
HFPO-DA hexafluoropropylene oxide dimer acid
HHRA human health risk assessment
HI hazard index
HQ hazard quotient
IARC International Agency for Research on Cancer
ICV initial calibration verification
IDA isotope dilution analysis
550

IDW investigation-derived waste
IRIS Integrated Risk Information System
ITRC Interstate Technology and Regulatory Council
IX ion exchange
Kd bulk partitioning coefficient
Koc organic carbon partitioning coefficent
Kow water/octanol coefficient
LC liquid chromatography
LCS lab control sample
LDPE low-density polyethylene
LEAF Leaching Environmental Assessment Framework
LHA lifetime health advisory
LHWA Little Hocking Water Association
LNAPL light nonaqueous phase liquid
LOAEL lowest observed adverse effect level
LOEC lowest observed effect concentration
LOQ limit of quantitation
MA DEP Massachusetts Department of Environmental Protection
MAC-QS maximum acceptable quality standards
MALDI-TOF matrix-assisted laser desorption/ionization time-of-flight
MCL Maximum Contaminant Level
MDH Minnesota Department of Health
MeFASA N-methyl perfluoroalkane sulfonamide
MeFASE N-methyl perfluoroalkane sulfonamido ethanol (var: N-methyl perfluoroalkane
sulfonamide ethanol)
MeFASAA N-methyl perfluoroalkane sulfonamido acetic acid (var: N-methyl perfluoroalkane sulfonamide acetic acid)
MeFOSA N-methyl perfluorooctane sulfonamide
MEP Multiple Extraction Procedure
MPCA Minnesota Pollution Control Agency
MRL minimum risk level
MRM multiple reaction monitoring
MSD matrix spike duplicate
MSW municipal solid waste
MWCO molecular weight cut-off
NaPFO sodium perfluorooctanoate
NAPL nonaqueous phase liquid
NCOD National Contaminant Occurrence Database
NESHAP National Emissions Standards for Hazardous Air Pollutants
nEtFOSA N-ethyl perfluorooctane sulfonamide
NF nanofiltration
NFPA National Fire Protection Association
NGWA National Groundwater Association
NHANES National Health and Nutrition Examination Survey
NHDES New Hampshire Department of Environmental Services 551

NJ DEP New Jersey Department of Environmental Protection NJDWQI New Jersey Drinking Water Quality Institute
NMeFOSAA N-Methylperfluorooctane sulfonamidoacetic acid
NOAEL no observed adverse effect level
NOEC no observed effect concentration
NOM natural organic matter
NOx nitrogen oxides
NPCA Norwegian Pollution Control Agency
NPDES National Pollutant Discharge Elimination System
NPL National Priorities List
NTP National Toxicology Program
NWQC national water quality criteria
NYDEC New York State Department of Environmental Conservation
O&M operation and maintenance
OAT organic anion transporter protein
OECD Organization for Economic Co-operation and Development
OEHHA Office of Environmental Health Hazard Assessment (California)
OH hydroxide ion, or hydroxyl group (Helmenstine 2018) OSB oriented strand board
PA DEP Pennsylvania Department of Environmental Protection
PAC powdered activated carbon
PAF perfluoroalkanoyl fluorides
PAH polycyclic aromatic hydrocarbon
PASF perfluoroalkane sulfonyl fluoride
PBSF perfluorobutane sulfonyl fluoride
PBT persistent, bioaccumulative, and toxic
PCA principal components analysis
PCBs polychlorinated biphenyls
PFA perfluoroalkoxy polymer
PFAA perfluoroalkyl acid
PFAI perfluoroalkyl iodides
PFAS per- and polyfluoroalkyl substances
PFBA perfluorobutanoate, perfluorobutanoic acid, perfluorobutyrate, perfluorobutyric acid
PFBS perfluorobutane sulfonate, perfluorobutane sulfonic acid
PFC perfluorocarbon (CnF2n+1, for example, perfluorooctane)
Do not use this acronym for any other description including perfluorinated compound or
perfluorochemical.
PFCA perfluoroalkyl carboxylate, perfluoroalkyl carboxylic acid
PFDA perfluorodecanoate, perfluorodecanoic acid
PFDoA, or PFDoDA perfluorododecanoate, perfluorododecanoic acid
PFDoS, or PFDoDS perfluorododecane sulfonate, perfluorododecane sulfonic acid
PFDS perfluorodecane sulfonate, perfluorodecane sulfonic acid PFECA per- or polyfluoroalkyl ether carboxylic acid
PFEI perfluoroethyl iodide (aka fluorotelomer iodide)
PFESA per- or poly- fluoroalkyl ether sulfonic acid
552

PFHpA perfluoroheptanoate, perfluoroheptanoic acid
PFHpS perfluoroheptane sulfonate, perfluoroheptane sulfonic acid
PFHxA perfluorohexanoate, perfluorohexanoic acid
PFHxS perfluorohexane sulfonate, perfluorohexane sulfonic acid
PFMOAA perfluoro-2-methoxyacetic acid
PFNA perfluorononanoate, perfluorononanoic acid
PFNS perfluorononane sulfonate, perfluorononane sulfonic acid
PFOA perfluorooctanoate, perfluorooctanoic acid, perfluorooctane carboxylate
PFOS perfluorooctane sulfonate, perfluorooctane sulfonic acid
PFOSA, or FOSA perfluorooctane sulfonamide
PFPA perfluorophosphonic acid
PFPE perfluoropolyether
PFPeA perfluoropentanoate, perfluoropentanoic acid
PFPeS perfluoropentane sulfonate, perfluoropentane sulfonic acid
PFPiA perfluorophosphinic acid
PFSA perfluoroalkyl sulfonate, perfluoroalkane sulfonic acid
PFSiA perfluoroalkyl sulfinic acid
PFTeDA, or PFTA perfluorotetradecanoic acid
PFTeDS, or PFTS perfluorotetradecane sulfonate, perfluorotetradecane sulfonic acid
PFTrDA, or PFTriA perfluorotridecanoic acid
PFTrDS, or PFTriS perfluorotridecane sulfonate, perfluorotridecane sulfonic acid
PFUnA, or PFUnDA perfluoroundecanoate, perfluoroundecanoic acid
PFUnS, or PFUnDS perfluoroundecane sulfonate, perfluoroundecane sulfonic acid
pg/m3 picogram per cubic meter
pH negative log of hydrogen ion concentration (measure of acidity)
PHxSF perfluorohexane sulfonyl fluoride
PIGE partice-induced gamma-ray emission spectroscopy
PIH pregnancy-induced hypertension
PNEC predicted no-effect concentration
POD porewater observation device
POE point of exposure
POET point of entry treatment
POP persistent organic pollutant
POPRC-14 14th meeting of the POPs Review Committee
POSF perfluorooctane sulfonyl fluoride
POU point of use
PPAR-α peroxisome proliferator-activated receptor-α
ppb parts per billion
PPE personal protective equipment
ppm parts per million
ppt parts per trillion
PPRTV Provisional Peer-Reviewed Toxicity Values
PTFE polytetrafluoroethylene
PUF polyurethane foam
PVDF polyvinylidene fluoride 553

PWS public water system
QAPP quality assurance project plan
QL quantitation limit
QPD qualified products database
QPL Qualified Product Listing
QSAR quantitative structure-activity relationship
QSM Quality Systems Manual
qTOF/MS quadrupole time of flight-mass spectrometry
RCRA Resource Conservation and Recovery Act
REACH European Chemicals Regulation
RfD reference dose
RL reporting limit
RML removal management level
RO reverse osmosis
RSC relative source contribution
RSL regional screening level (Note: In many commercial venues RSL means “restricted substances list.”)
RSSCT rapid small-scale column testing
s.d. or SD standard deviation
SDS Safety Data Sheet
SDWA Safe Drinking Water Act
SERDP Strategic Environmental Research and Development Program
SIP sorbent-impregnated polyurethane foam
SL screening level
SMART specific, measurable, attainable, relevant, and timely (goal)
SMZ surface-modified zeolites
SNUR Significant New Use Rule
SPE solid-phase extraction
SPLP Synthetic Precipitation Leaching Procedure
SSD species sensitivity distribution
STAR Spill Tactics for Alaska Responders
TANA Technical Assistance Needs Assessments
TARC top-layer antireflective coatings
TBC to-be-considered values
TCEQ Texas Commission for Environmental Quality
TCLP Toxicity Characteristic Leaching Procedure
TDS total dissolved solids
TEQ toxic equivalency quotient
TFE tetrafluoroethylene
TMF trophic magnification factor
TO Toxic Organic (method)
TOC total organic carbon
TOP total oxidizable precursor
TRRP Texas Risk Reduction Program
TRV toxicity reference value 554

TSH Thyroid-stimulating hormones
TSCA Toxic Substances and Control Act
UCMR Unregulated Contaminant Monitoring Rule
UF ultrafiltration
mg/kg micrograms per kilogram
UL Underwriters Laboratories
U.S.C. United States Code
USDOD United States Department of Defense
USEPA United States Environmental Protection Agency
USGS United States Geological Survey
VDEC Vermont Department of Environmental Conservation
VDH Vermont Department of Health
VOC volatile organic compound
ww wet weight
WWTP wastewater treatment plant
ZVI zero-valent iron
Updated May 2021.
555

Glossary
A
Adsorption
The mechanism whereby ions or compounds within a liquid or gas adhere to a solid surface upon contact. The
term also refers to a method of treating wastes in which activated carbon is used to remove organic compounds from wastewater.
Anion
A negatively charged ion.
Arithmetic mean
The sum of a collection of numbers divided by the number of numbers in the collection, commonly referred to as the “average”.
B
Biochar
A carbon-rich, porous solid synthesized by heating biomass, such as wood or manure, in a low-oxygen
environment (pyrolysis).
Biomaterials
Materials derived from plants or animals created for use as sorption materials.
C
Cation
A positively charged ion.
Coagulation
The process of destabilizing a colloid or suspension that unbalances the forces that separate the particles,
often by neutralizing the charges on the particles and allowing the particles to clump or settle.
E
Electro precipitation/electrocoagulation
The use of an electrical current to enhance the coagulation and precipitation of ionic compounds. The electrical current may attract the compounds to an anode or cathode, or create coagulating ions from a sacrificial anode, or
both.
Empty bed contact time (EBCT)
A measure of the time during which water to be treated is in contact with the treatment medium in a contact vessel, assuming that all liquid passes through the vessel at the same velocity. EBCT is equal to the volume of
the empty bed divided by the flow rate (Sacramento State University 2019).
556
F
Flocculation
A process in which the suspended particles of a destabilized colloid or suspension form groups or clumps (known as a “floc”). Coagulation and flocculation work together to separate solids and liquids containing colloids and
suspensions.
Fluorotelomer substance
A polyfluoroalkyl substance produced by the telomerization process.
G
Geometric mean
The central tendency or typical value of a set of numbers, derived by multiplying the numbers in a set then
finding the nth root of the product, where “n” is the number of values in the set.
H
Head
The part of a molecule that is a charged functional group attached at one end of the carbon chain tail.
I
Incineration
Thermal destruction process typically characterized by oxidation at temperatures in excess of 1,000°C.
Isomers
Chemicals with the same chemical formula, but different molecular structures.
M
Membrane fouling
Loss of production capacity of a membrane due to accumulation of compounds or biogrowth on the membrane.
Micelles
Particles in which long hydrocarbon tails, repelled by the water molecules and attracted to each other, make up the interior, whereas the negatively charged heads coat the surface and interact with the surrounding water
molecules and positive ions (Ege 1999).
Mineralization/decomposition/destruction
The breakdown of a chemical compound into its constituent elements and carbon dioxide and water.
Moiety
A specific group of atoms within a molecule that is responsible for characteristic chemical reactions of that molecule (Helmenstine 2019).
557

O
Organoclays
A naturally occurring clay mineral that is organically modified to incorporate cations and enhance the sorption
capability.
P
Perfluorinated chemical
Subset of PFAS. Have carbon chain atoms that are totally fluorinated. Examples are perfluorooctanoate (PFOA) and perfluorooctane sulfonate (PFOS) (Buck et al. 2011).
Perfluoroalkyl substance
Fully fluorinated alkane (carbon chain) molecule. They have a chain (tail) of two or more carbons atoms with a
charged functional group (head) attached at one end.
Permeate
The water treated by a membrane filtration technology, which has passed through the membrane, and from
which PFAS have been removed. The contaminants not passing the membrane accumulate in the filtrate, which also does not pass through the membrane.
Polyfluorinated chemical
Subset of PFAS. Have at least one carbon chain atom that is not totally fluorinated (Buck et al. 2011).
Polyfluoroalkyl substance
The molecule has a nonfluorine atom (typically hydrogen or oxygen) attached to at least one, but not all, carbon atoms, while at least two or more of the remaining carbon atoms in the carbon chain tail are fully fluorinated.
Polymer
Large molecules formed by combining many identical smaller molecules.
R
Reactivation
The process of treating regenerated GAC to restore treatment properties.
Redox
Chemical reduction-oxidation processes and conditions that can result in the alteration of a chemical compound.
Regeneration
The act of restoring some of the sorption capacity of a sorptive media (that is, activated carbon or ion exchange)
by removing the adsorbed matter. For carbon, regeneration is a thermal oxidation process.
S
Stabilization
A process to reduce mobility of compounds in the environment through physical or chemical means.
Surfactant
A surface-active agent that lowers the surface tension of a liquid.
558

T
Tail
The part of a molecule that is a chain of two or more carbon atoms.
Thermal desorption
Thermal treatment process intended to remove the contaminants from a solid medium (such as soil, sediment, carbon) and drive them into the vapor phase.
Z
Zwitterion
An ionic compound containing both positively and negatively charged groups with a net charge of zero. Updated April 14, 2020.
559

Acknowledgments The members of the Interstate Technology & Regulatory Council (ITRC) PFAS Team wish to acknowledge and
thank the individuals, organizations, and agencies that contributed to this online document that includes the PFAS
Technical and Regulatory Guidance Document, PFAS Fact Sheets and Explainer Videos, Training Module Videos and external tables of data and information prepared by the ITRC PFAS Team.
The PFAS Team was led by: Bob Mueller, New Jersey Department of Environmental Protection (2017-2021); Ginny
Yingling, Minnesota Department of Health (2017-2020); Kate Emma Schlosser, New Hampshire Department of Environmental Services (2020-present); and Sandra Goodrow, New Jersey Department of Environmental Protection
(2020-present).
The team leaders were assisted by Program Advisors: Lesley Hay Wilson and Jim Rocco of Sage Risk Solutions
LLC. In addition, Josh Criss of GDIT provided video support for the training video modules. Tadbir Singh,
ITRC/ECOS Program Associate and Evan Madden ITRC Project Manager provided support to the team.
During the development of the fact sheets, technical and regulatory guidance document, external tables and
training videos the team received many comments and reviews from experts across U.S. EPA, U.S. DOD and
U.S. DOE, state agencies, academic institutions, industry and consulting. This input was invaluable to the
development of these ITRC products. The team greatly appreciates those who offered advice, suggestions,
reviews and comments.
Specifically, the team wishes to thank and recognize the efforts and important contributions of the team
members.
State and Local Government
John Abernathy SC DHEC
Jonathan Ali New Hampshire Department of Environmental Services
Daniel Arthur Alabama Department of Environmental Management
Heather Barbare Colorado Department of Public Health and Environment
Sara Benovic Arizona Department of Environmental Quality
Jeff Biggs City of Tucson Water Department
Rachel Blomberg CDPHE
Robyne Bridgman Virginia Dept. of Environmental Quality
Christine P. Brown Department of Toxic Substances Control (DTSC)
Robert Burgess Alaska Department of Environmental Conservation
Vivek Mathrani CA DTSC
Lawrence Matson Delaware DNREC
Justin Meredith Tennessee Department of Environment and Conservation- Division of Remediation
Sandra Mort NC DEQ
Steve Nelson City of Austin, Texas
Cherrie Nelson Wyoming Department of Environmental Quality
Mary Helen Niemann TX RR Commission
Marjorie Norman City of San Antonio
Christine Osborne Utah DEQ
560

Sandeep Burman Minnesota Pollution Control Agency
Bonnie Buthker Ohio EPA/ASTSWMO
Sandra Caldwell Department of Ecology
Jill Clark Georgia Environmental Protection Division
Jessika Cohen Oregon Department of Environmental Quality
Hoa Dao Department of Environmental Protection, Pennsylvania
Robert Delaney Michigan Department of Environmental Quality
Amy Doherty NHDES
Mark Elliott MPCA
Chris Evans Maine Department of Environmental Protection
Cheryl Fields Connecticut DPH
Kimberly Gettmann Cal EPA/ DTSC
Helen Goeden Minnesota Department of Health
Sandra Goodrow NJDEP
Stephanie Gordon Delaware DNREC
Kristi Herzer State of Vermont DEC
Rebecca Higgins Minnesota Pollution Control Agency
Samuel Iwenofu Washington State Department of Ecology
Ricardo Jaimes DOEE Government of the District of Columbia
Walsta Jean-Baptiste Florida Department of Environmental Protection
Yujie Jin Department of Toxic Substances Engineering
Sara Pearson Michigan DEQ
Kerry Pflugh NJ DEP
Mallory Pinkowski DNREC
Shannon Pociu CT Dept. of Energy & Environmental Protection
Gloria Post NJDEP
Ron Poustchi NJDEP
Angela Preimesberger Minnesota Pollution Control Agency
Matthew Revel ADEM
Charles Reyes ASTSWMO
Kristy Richardson CO DPHE
Patrik Sartz Alaska Dept of Environmental Conservation
Paul Schleusener Michigan EGLE
Kate Emma Schlosser NH Department of Environmental Services
Chuck Schwer Vermont DEC
Michael Sexton Virginia Department of Environmental Quality
Monica Sheets CDPHE
Kathryn Shepard Morris Montana DEQ
Clifford Shierk Minnesota Pollution Control Agency
Cheryl Sinclair PA Department of Environmental Protection
Tadbir Singh ITRC/ECOS
Leah Smith FDEP
561
Jason Johnson NY DEC
Julie Kadrie Minnesota Dept of Health
Sesha Kallakuri Michigan Department of Health and Human Services
Brandon Kernen New Hampshire Department of Environmental Services
Annalisa Kihara CA State Water Resources Control Board
Anne Knapp WA State Dept. of Ecology
Lisa Kowalczyk Arizona Department of Environmental Quality
Gary Krueger Minnesota Pollution Control Agency
Meghan Lally Connecticut Department of Energy and Environmental Protection
Gladys Liehr Florida Department of Health
Gail Lipfert Maine Department of Environmental Protection
Tim Lockrem Minnesota Pollution Control Agency
Kevin Lund Michigan EGLE
Alexander MacDonald Regional Water Quality Control Board, Central Valley Region
Ron MacGillivray Delaware River Basin Commission
Kerri Malinowski Maine Department of Environmental Protection
Craig Manahan WA State Dept. of Ecology
Matt Smith Orange County Sanitation District
Sandra Snyder SCDHEC
Richard Spiese Vermont Waste Management Division
Brie Sterling PA DEP
Kara Steward WA State Dept. of Ecology
Christina Stringer New England Interstate Water Pollution Control Commission
Brock Tabor Alaska Department of Environmental Conservation
Joy Taylor Morgan Michigan EGLE
Tom Trainor Wisconsin DNR
Lanita Walker City of Tallahassee
Thomas Wallace Mississippi Department of Environmental Quality
Jamie Wallerstedt Minnesota Pollution Control Agency
Li Wang CA DTSC
Jeff Wenzel Missouri Department of Health and Senior Services
Tracie White Colorado Department of Public Health & Environment
Ken Zarker Washington State Department of Ecology Pollution Prevention & Regulatory Assistance Section
562

Federal Government
Hunter Anderson US DOD AFCEC
Timothy Appleman US DOD NAVFAC EXWC
David Asiello US DOD Office of the Assistant Secretary of Defense (Sustainment)
Caroline Baier-Anderson USEPA/OLEM/FFRRO
Paul Beam US DOE HQ EM 4.12, Groundwater and Soil Remediation
Sandip Chattopadhyay USEPA/ORD
Mary Cooke USEPA/FFRRO
Jed Costanza USEPA OSTRI/TIFSD
Anthony Danko US DOD NAVFAC EXWC
Ramona Darlington Iery US DOD NAVFAC EXWC
Emily Fabricatore US DOE Environmental Management
Linda Fiedler USEPA OSRTI
Melissa Forrest US DOD NMCPHC
Elisabeth Freed USEPA
Christopher Griggs US Army Engineer Research and Development Center
Pamela Hamlett US Air Force
Paul Hatzinger SERDP-ESTCP
Hannah Holsinger USEPA
Thomas Imbrigiotta USGS (retired)
Christopher Impellitteri USEPA ORD
David Katz NASA
Cornell Long US Air Force
Michelle Lordemann US Army Corps of Engineers
Yvette Lowney SERDP-ESTCP
Virginia Makale US DOD Naval Facilities Engineering Command, Southwest
Andy Martin US Army Engineer Research and Development Center
Lisa Matthews USEPA Office of Research and Development
Anita Meyer US Army Corps of Engineers
Beth Moore US DOE EM-4.31, Office of Regulatory Compliance
Deborah Morefield US DOD Office of the Deputy Assistant Secretary of Defense (Environment)
Gary Newhart USEPA-ERT
T. Nicole Nieves US Army Corps of Engineers
Bonnie Packer US DOD ARNG
Cara Patton SERDP-ESTCP
Ron Pinkoski US Coast Guard
563

Jessica Reiner NIST David Liu USEPA Atlantic Ecology Division
Ann Richard USEPA
Mark Rothas US Army Corps of Engineers
Andrea Sansom US Army Corps of Engineers USEPA Atlantic Ecology Division
Patsy Kerr US DOD NMCPHC
John Kornuc US DOD NAVFAC EXWC US DOD NAVFAC
Johnsie Lang USEPA ORD-ORISE
Andrea Lehn US DOD SAF/IE
Kendra Leibman US DOD Navy
James Smith US DOD NMCPHC
Sharon Stone US DOD AFCEC/CZO
Hans Stroo SERDP-ESTCP (retired)
James Tarr US DOD NAVFAC
Wendy Thomi USEPA Office of Land and Emergency Management
Hilary Thornton USEPA R4 Superfund
Janice Willey US DOD NAVSEA
564

Emeritus, Public and Tribal Stakeholders
Richard Aho Retired
Doris Cellarius Sierra Club
Edward (Ted) Emmett University of Pennsylvania
David Hofmann Cherokee Nation
Jeffrey Kuhn Retired
Peter Strauss PM Strauss & Associates
Eric Uram Sierra Club
Academia
David Bond Bennington College
Daniela Castañeda University of Colorado at Boulder
Michelle Crimi Clarkson University
Chadi El Mohtar The University of Texas at Austin
Jennifer Field Oregon State University Jennifer Guelfo Texas Tech University
Megan Hart University of Missouri Kansas City
Christopher Higgins Colorado School of Mines
Eric Nuttall University of New Mexico
Matt Reeves Western Michigan Univ.
Timothy Schroeder Bennington College
Mark Widdowson Virginia Tech Paul Yaroschak Water & Environmental Technology Center, Temple University
565

Industry Affiliates
Stewart Abrams Langan Engineering & Environmental Services
David Adamson GSI Environmental Inc.
Jennifer Adler Haley & Aldrich
Hannah Albertus-Benham Wood PLC
Ryan Andersen LANGAN
Janet Anderson GSI Environmental Inc.
Matthew Barvenik GZA GeoEnvironmental, Inc.
Saamih Bashir Wood PLC
Buddy Bealer Shell
Melissa Beauchemin Kennedy/Jenks Consultants
John Berry ECT2
Amanda Bess Chevron
Birgitta Beuthe BP
Dorin Bogdan AECOM
Francis Boodoo Purolite
Andrew Borden AECOM
Jenalle Brewer Calgon Carbon Corporation
Stephen Korzeniowski BEC
Ronald Kotun Tetra Tech
Matt Kraus Tetra Tech
Yasemin Kunukcu TRC
Matthew Lahvis Shell
Heather Lanza GHD
Laurie LaPat-Polasko Ramboll Environ
Sarah LaRoe Anchor QEA, LLC
Steven LaRosa Weston & Sampson
Maureen Leahy Environmental Resources Management
Nigel Lewis HSW Engineering, Inc.
Shangtao Liang AECOM
Jerry Lisiecki Clean Harbors Environmental Services
Anne Lockard Heritage Environmental Services
Linda Logan Terraphase Engineering, Inc.
Kevin Long Terraphase Engineering, Inc.
Heather Lutz Geosyntec Consultants
566

Steven Brown The Dow Chemical Company
Cristin Bruce Shell
Dan Bryant Woodard & Curran
Bob Buck Chemours
Karla Buechler TestAmerica Laboratories, Inc.
Scott Burkey Shell
Stuart Cagen Shell
Barbara Campany GHD
Paul Caprio EA Engineering
Grant Carey Porewater Solutions
David Carlson Enterprise Environmental Advisors
Corey Carpenter EKI Environment & Water, Inc.
Gwendoline Caviness Exponent
Dora Chiang CDM Smith
Sabina Chowdhury BAH
Steve Clough Haley & Aldrich (retired)
John Collins AquaBlok
Jason Conder Geosyntec Consultants
Pete Conwell Shell
Eliot Cooper Cascade
Tamzen Macbeth CDM Smith
Sriram Madabhushi BAH
Andrew Madison Golder Associates, Ltd.
Maria Magilton EA Engineering, Science and Technology
Martha Maier Vista Analytical Laboratory
Stefano Marconetto Golder Associates, Ltd.
Frank Marine Texas Molecular
Matt Matteson Wood PLC
Chris McCarthy Jacobs
Katrina McCullough GHD
Lisa McIntosh Woodard & Curran
Patricia McIsaac TestAmerica Laboratories, Inc.
Jason McNew EA Engineering, Science & Technology
Daniel Medina AECOM
Dogus Meric Geosyntec Consultants
Michael Mobile GZA GeoEnvironmental, Inc.
Joe Montello Republic Services, Inc.
Rebecca Mora AECOM
Teri Myers CDM Smith
Jonathan Naile Shell
567

Jeff Cornell Tehama LLC
Thomas Cortina Cortina Environmental Consulting
Rick Cramer Burns & McDonnell Engineering
Kavitha Dasu Battelle
Rula Deeb Geosyntec Consultants
Todd DeJournett Geosyntec
Elizabeth Denly TRC
Nicholas DeRose Langan Engineering & Environmental Services
Richard Desrosiers GZA GeoEnvironmental, Inc.
Erica DiFilippo S.S. Papadopulos & Associates, Inc.
William DiGuiseppi Jacobs
Thomas Dunder TRC
Scott Dwyer Kleinfelder
Richard Evans GES, Inc
David Favero RACER Properties LLC
Jim Feild Wood PLC
Tony Finding BSTI
Stephanie Fiorenza BP
Eric Forrester Calgon Carbon Corporation
Cheryl Fountain Tetra Tech
Justin Gal Amec Foster Wheeler
Peter Nangeroni Woodard & Curran
Charles Neslund Eurofins
Hilary Nevis Amec Foster Wheeler
John Newsted OBG Company
Eric Nichols Substrata LLC
Mark Nielsen Ramboll
Ashley Nifong GEL Labs
Mitchell Olson Trihydro Corporation
Jeff Orient Tetra Tech
Fernanda Paes Wilson Fishbeck
Ioana Petrisor ToxStrategies
Jenny Phillips TRC
Jeffrey Pintenich Brown and Caldwell
Les Porterfield TEA, Inc.
Fred Price APMI
Bob Pullano GEL Laboratories
Joseph Quinnan Arcadis
Stephen Rembish Parsons Corporation
Cynthia Rhode GHD
William Rish ToxStrategies, Inc.
Christopher Ritchie Ramboll
568

Stephen Geiger ERM
Bob Gensemer GEI Consultants, Inc.
Arianne Godwin Pinyon Environmental, Inc
Jessica Goin Anchor QEA, LLC
Marat Goldenberg Burns & McDonnell
Sean Gormley Wood PLC
Heather Gosack Apex Companies, LLC
Scott Grieco Jacobs
Daniel Griffiths Parsons Corporation
Karen Gruebel EKI Environment & Water
Chris Gurr CDM Smith
Adam Hackenberg Langan Engineering & Environmental Services
Nathan Hagelin Wood PLC
Jeffrey Hale Parsons Corporation
Linda Hall GSI Environmental Inc.
Kris Hallinger ERM
Ruth Hammervold Brown and Caldwell
Melissa Harclerode CDM Smith
Paul Hare OBG
Ivy Harvey EA Engineering, Science, Technology, Inc., PBC
Elisabeth Hawley Geosyntec
Harrison Roakes Sanborn, Head & Associates, Inc.
Nancy Rothman New Environmental Horizons, Inc.
Samantha Saalfield EA Engineering
John Santacroce Parsons Corporation
Nicholas Santella BSTI
Christopher Schaupp Neptune & Company
Dan Schneider Terracon
Ron Schoff Phoenix Pure Holdings LLC
Barrie Selcoe Jacobs
Joe Seracuse Brown and Caldwell
Michael Sieczkowski JRW Bioremediation
David Silbaugh Silbaugh Hydrogeological Svcs
Cannon Silver CDM Smith
Lizanne Simmons Kleinfelder
Brent Smith Civil & Environmental Consultants
Mike Solt Langan Engineering & Environmental Services
Joseph Sposato Pinyon Environmental, Inc
Kendall St. Ange GEI Consultants, Inc.
Brent Stafford Shell
Jamie Suski EA Engineering
Ward Swanson Barr Engineering Co.
569

Ed Hawthorne Shell
Ziqi He HSW Engineering
Jennifer Heath Heath Toxicology
Nanda Hermes ERM
Jeffrey Holden GEI Consultants, Inc.
Rebecca Hollender TRC
Christopher Hook Tetra Tech, Inc.
Chuck Hornaday Vadose Remediation Technologies
Peggy Horst W.L. Gore & Associates, Inc.
Erika Houtz Arcadis
Brian Hoye Burns & McDonnell Engineering Company, Inc
Jane Huber Eurofins
Ryan Hultgren Kennedy/Jenks
Gary Hunt TRC
Craig Hutchings Integral Consulting Inc.
Antone Jain EKI Environment & Water
Thomas M. Johnson Thomas Johnson Associates
Daniel Jones AECOM
Purshotam Juriasingani Tetra Tech, Inc.
Ellen Kaastrup Kaastrup Consulting, LLC
Lisa Kammer Weston Solutions, Inc.
Bob Symons Eurofins Environment Testing, Australia
Sagar Thakali AECOM
Ryan Thomas GHD
Shalene Thomas Wood PLC
Roy Thun GHD
Derek Tomlinson GEI Consultants, Inc.
Adam Tressler ERM
Grant Trigger RACER Properties LLC
Laura Trozzolo TRC
Edward (Ted) Tyler Kleinfelder
Brad Varhol EON Products
Usha Vedagiri Wood PLC
Chris Voci Terraphase Engineering, Inc.
Lisa Voyce HDR
Claudia Walecka-Hutchison Dow, Inc.
Rick Wice Battelle Memorial Institute
Michael Wilken The Dow Chemical Company
Jason Wilkinson Ramboll Environ
Scott Wilson Regenesis
David Woodward AMEC Foster Wheeler
Sandra Yi-Fuller Shell
570

Saroj Kandel Civil & Environmental Consultants, Inc.
William Kerfoot Kerfoot Technologies, Inc.
Trent Key ExxonMobil
Eric Klinker DuPont
Mat Knutson Terracon
Stephen Koenigsberg Civil and Environmental Consultants
Rachel Zajac-Fay Jacobs
Michael Zelenka ExxonMobil
Stephen Zemba Sanborn, Head & Associates, Inc.
Lesa Zimnawoda BEM Systems
Jennifer Zorinsky AECOM
Barry Zvibleman Onion Enterprises PFOS-PFOA Treatment
571

International Team Members
Frank Berger AECOM
Sarah Gewurtz Environment and Climate Change Canada
Andrew Mitchell Department of Defence (Australia)
Niall Ramsden LASTFIRE
Updated May 2021.
572

Team Contacts
Team Leaders Kate Emma Schlosser New Hampshire Department of Environmental Services [email protected]
Sandra Goodrow New Jersey Department of Environmental Protection [email protected]
Program Advisors Lesley Hay Wilson Sage Risk Solutions LLC [email protected]
Jim Rocco Sage Risk Solutions LLC [email protected]
History, Use and Naming Conventions Jeffrey Wenzel Missouri Department of Health and Senior Services [email protected]
Elizabeth Denly TRC [email protected]
Jeffrey Hale Parsons Corporation [email protected]
Firefighting Foams Richard Spiese Vermont Waste Management Division [email protected]
Shalene Thomas Wood PLC [email protected]
Fate and Transport, Site Characterization, Physical and Chemical Properties Robert Burgess Alaska Department of Environmental Conservation [email protected]
Ryan Thomas GHD [email protected]
Human and Ecological Health Effects, Regulations and Site Risk Assessment Brie Sterling Pennsylvania Department of Environmental Protection [email protected]
Linda Hall Consulting Toxicologist [email protected]
Sampling and Analytical Methods Kristi Herzer Vermont Department of Environmental Conservation [email protected]
Janice Willey U.S. DOD, NAVSEA [email protected]
Treatment Technologies Cliff Shierk Minnesota Pollution Control Agency [email protected]
Scott Grieco Jacobs [email protected]
Risk Communication Kerry Kirk Pflugh New Jersey Department of Environmental Protection [email protected]
Melissa Harclerode CDM Smith [email protected]
Surface Water Quality Alex MacDonald California Regional Water Quality Control Board, Central Valley Region [email protected]
Linda Logan Terraphase Engineering [email protected]
573

Stakeholder Perspectives Peter Strauss PM Strauss & Associates [email protected]
Training Kristi Herzer Vermont Department of Environmental Conservation [email protected]
Dora Chiang Wood PLC [email protected]
Updated May 2021.
574