Embed Size (px)
Citation preview
UPTEC W 18 040
Examensarbete 30 hpAugusti 2018
An assessment of thermal desorption as a
remediation technique for per- and polyfluoroalkyl
substances (PFASs) in contaminated soil
Anna-Stina Lind

i
ABSTRACT An assessment of thermal desorption as a remediation techniques for per- and
polyfluoroalkyl substances (PFASs)-contaminated soil
Anna-Stina Lind
Per- and polyfluoroalkyl substances (PFASs) are a diverse group of persistent organic
pollutants. PFASs have a wide area of applications such as stain repellent for paper, textile,
furniture and industrial products such as aqueous film forming foams (AFFFs) used for
firefighting. However, during production, usage and disposal, PFASs can be released into the
environment and can therefore be a threat to humans and the ecosystems. Thus, it is important
to develop soil remediation techniques for PFASs. The aim of this thesis has been to evaluate
if thermal desorption can be used as a remediation method for PFASs-contaminated soil. The
idea of thermal desorption is to vaporize the PFASs by high temperature, extract the PFASs
from the soil by vacuum pumping and then trapping the PFASs into an air filter. The air filter
can then be removed and incinerated at a high temperature to degrade PFASs. The thermal
desorption has been performed in an oven at various temperatures (i.e. 150 °C, 250 °C, 350 °C,
450 °C and 550 °C) during time periods of 15 min, 45 min and 75 min for clay soil, loamy sand
soil and a mixed soil from Arlanda airport. After the thermal desorption the PFASs have been
extracted in methanol and then measured with an Ultra-performance liquid chromatography
tandem mass-spectrometer (UPLC-MS/MS). The results show that the method is a success. 6
of 14 PFASs in the soil from Arlanda airport and all PFASs in the clay soil and the loamy sand
soil reached a removal efficiency above 90 %. The results also show that all PFASs in all soils
have been desorbed below the guide line value for perfluorooctane sulfonate (PFOS) for less
sensitive land use, 3 mg/kg dw, given by Swedish Geological Institute (SGI). All samples have
reached this limit above thermal desorption in 450 °C with treatment time 75 min.
Keywords: Thermal desorption, per- and polyfluoroalkyl substances, PFASs, PFBA, PFPeA,
PFHxA, PFHpA, PFOA, PFNA, PFDA, PFUnDA, PFBS, PFHxS, PFOS, 6:2 FTSA, 8:2 FTSA,
FOSA, PCB, PAH, UPLC MS/MS
Department of Aquatic Sciences and Assessment, Swedish University of Agricultural Sciences
(SLU). Lennart Hjelms väg 9, SE 750-07 Uppsala

ii
REFERAT En utvärdering för termisk rening av jord förorenad med per- och
polyfluoralkylsubstanser (PFASs)
Anna-Stina Lind
Per- och polyfluoralkylsubstanser (PFASs) är en stor grupp av svårnedbrytbara organiska
föroreningar. I polyfluoralkylsubstanser har minst en fluoratom ersatt en väteatom, medan alla
väteatomer har ersatts med fluoratomer i perfluoralkylsubstanser. Den starka klor-
fluorbindningen som uppstår gör dem oerhört resistenta mot nedbrytning. PFASs kan
bioackumulera i organismer och vissa PFASs har visat toxiska effekter på människor.
Brandskum av typen AFFF (Aqueous Film Forming Foam) innehåller PFASs och används på
flygplatser för att släcka bränslebränder, flygplatserna är därmed punktkällor för PFASs. På
grund av att PFASs används i brandskum lakas det ut i marken och kommer följaktligen i
kontakt med grundvattnet. När PFASs kontaminerat grundvattnet är det risk för att dessa
föroreningar hamnar i våra vattenkranar då många akviferer används som dricksvattenkällor.
Det är därmed viktigt att utvärdera marksaneringstekniker för PFAS för att förhindra ytterligare
spridning. Syftet med denna studie är att utvärdera om termisk desorption kan användas som
en saneringsmetod för mark förorenad av PFASs. Saneringsmetoden har visat sig framgångsrik
på andra föroreningar såsom polyklorerade bifenyler (PCB) och polycykliska aromatiska
kolväten (PAH). Den termiska desorptionen går ut på att hetta upp PFASs ända till att ämnena
förångas. Då kan föroreningen extraheras från jorden genom vakuumpumpning och
koncentreras i ett filter. Filtret avlägsnas sedan och förbränns i hög temperatur.
I det här experimentet har jordarna frystorkats och homogeniserats innan den termiska
desorptionen utfördes. Den termiska saneringen har genomförts i ugnar som har kunnat värma
upp till åtminstone 550 °C. Proverna har därefter genomgått en upparbetningsprocess för att
mäta de resterande mängderna av PFASs. Efter det har proven analyserats i en
vätskekromatograf kopplad till en masspektrometer (UPLC MS/MS) för att se hur mycket
PFASs som var kvar i de termiskt behandlade jordproverna. Resultaten visade att för alla PFAS-
ämnen i alla tre jordar, hade den termiska reningen lyckats sanera föroreningarna till en nivå
som ligger under riktvärdena från Sveriges Geotekniska institut (SGI) för mindre känslig
markanvändning för PFOS. I sandjorden (Högåsa) och lerjorden (Vreta kloster) hade alla
PFASs nått en reningsgrad över 90 % över 450 °C efter 75 minuter. För jorden från Arlanda
var saneringen inte lika framgångsrik, 6 av 14 ämnen blev sanerade till över 90 % för 550 °C
efter 75 minuter. Slutsatsen är därför att metoden fungerar.
Nyckelord: Termisk rening, Per- och polyfluoralkylsubstanser, PFASs, PFBA, PFPeA,
PFHxA, PFHpA, PFOA, PFNA, PFDA, PFUnDA, PFBS, PFHxS, PFOS, 6:2 FTSA, 8:2 FTSA,
FOSA, PCB, PAH, UPLC MS/MS.
Institutionen för vatten- och miljö, Sveriges lantbruksuniversitet (SLU). Lennart Hjelms väg 9,
750 07 Uppsala

iii
PREFACE
This Master’s thesis is equivalent to 30 ETCS and is the final part of the Master Programme
in Environmental and Water Engineering at Uppsala University and the Swedish University
of Agricultural Sciences in Uppsala. My supervisor was Ph.D. student Mattias Sörengård and
my subject reviewer was Associated Professor Lutz Ahrens, both at the Department of
Aquatic Sciences and Assessments at the Swedish University of Agricultural Sciences.
Examiner was Associate Professor Fritjof Fagerlund from the department of Geological
Sciences at Uppsala University. The project was carried out as a part of the Science Project
PFAS-pure that is financed by Vinnova.
I would like to thank my supervisor Mattias Sörengård who with a positive attitude,
helpfulness and patients gave great support during the course of this project. I also want to
thank my subject reviewer Lutz Ahrens who provided a lot of knowledge and gave the
opportunity to be part of interesting conferences about PFAS.
I would also like to thank all members of the Department of Aquatic Sciences and
Assessments that were helpful and made the time at the department enjoyable.
Uppsala, Sweden, March 2018
Anna-Stina Lind
Copyright © Anna-Stina Lind and the Department of Aquatic Sciences and Assessments,
Swedish University of Agricultural Sciences (SLU). UPTEC W 18 040, ISSN 1401-5765
Published digitally at the Department of Earth Sciences, Uppsala University, 2018

iv
POPULÄRVETENSKAPLIG SAMMANFATTNING Anna-Stina Lind
Kan jord som är förorenad med per- och polyfluoralkylsubstanser (PFASs)
renas med hjälp av värme?
Per- och polyfluoralkylsubstanser (PFASs) är ämnen som bevaras länge i naturen då de
bryts ned långsamt eller inte alls. De har använts i många typer av produkter till exempel
i ”non-stick”-stekpannor, i färg, på insidan av pappersmuggar och i ett speciellt
brandskum som används på flygplatser. Undersökningar behöver göras för att se om
naturen kan renas från de här ämnena. Därför har det gjorts experiment på om värme
kan rena mark där det finns PFASs.
Per- och polyfluoralkylsubstanser (PFASs) har producerats sedan 1950-talet och är en grupp
ämnen med egenskaper som gör dem användbara men också långlivade. En av de egenskaper
som gör PFASs svårnedbrytbara är att de innehåller en speciell kemisk bindning. Denna består
av en kol-atom och en fluor-atom som dras till varandra och det bildas en stark kraft mellan
dessa vilket gör det svårt att skilja de åt. Alla PFAS-molekyler innehåller minst en sådan kemisk
bindning. Den här gruppen består även av en fettavvisande del och en vattenavvisande del, de
är så kallade surfaktanter. En vanlig surfaktant som de flesta har hemma är diskmedel, alltså ett
medel som attraheras av både vatten och olja. Det är den här egenskapen som gör att PFASs är
bra på att stöta bort både vatten och oljebaserade produkter. På grund av att de är långlivade
och kan stöta bort flertal ämnen gör att PFASs har producerats i stora mängder. De har använts
i brandskum, stekpannor, färg, smink och pappersmuggar för att nämna några produkter.
PFASs har spridits sig ut i naturen som en följd av den storskaliga produktionen. De har läckt
ut från bland annat flygplatser som använder brandskum med PFASs i. Två ämnen, PFOS och
PFOA, är redan förbjudna på grund av att de är giftiga. Dessa kan dock fortfarande spridas till
vårt dricksvatten eftersom att när dessa ämnen användes fastnade en del på markpartiklarna
istället för att transporteras till närmsta vattendrag. Då PFASs stannar längre i marken än i de
närliggande vattendragen och mycket grundvatten används till dricksvatten, är det viktigt att
undersöka metoder som kan avlägsna PFASs ur marken.
Flera forskare har undersökt vilka besvär PFASs kan ge, framförallt har de undersökt de PFASs
som numera har förbjudits. Forskarna kom fram till att om PFASs ansamlas i människokroppen
kan det leda till låg födelsevikt för foster, infertilitet hos kvinnor som en bieffekt till en sjukdom
(endometrios) som kan ha orsakats av höga halter av PFASs, ökad impulsivitet hos barn och
även en ökad risk för cancer i njurar och testiklar.
Det finns flera eventuella metoder som skulle kunna användas för att ta bort PFASs ur marken.
Den metod som undersöks i det här experimentet kallas termisk desorption och innebär att
marken hettas upp. PFASs blir ånga som kan fångas upp och därefter förstöras. Andra metoder
skulle kunna vara att gräva upp den jord där det finns PFASs och skölja rent den. Det finns även
en metod som innebär att föroreningar blir kvar i marken. Metoden går ut på att det tillsätts
ämnen i marken, till exempel betong, som gör att de inte kan spridas vidare.
I det här experimentet har jord hämtats från tre olika platser runt om i Sverige. Lerjord från
Vreta kloster, sandjord från Högåsa och en blandjord från Arlanda Flygplast. Ämnesgruppen
PFASs består av väldigt många ämnen men för att göra experimentet mer hanterbart valdes
bara några stycken. I sandjorden och lerjorden tillsattes det en exakt mängd av 14 stycken
PFASs. I jorden från Arlanda tillsattes dock inget, där ansågs det att det redan fanns tillräckligt
med PFASs. Jordproverna hettades antingen upp till 150 °C, 250 °C, 350 °C, 450 °C eller 550
°C. För varje temperatur var proverna inne i olika lång tid. Tre tidsperioder användes 15

v
minuter, 45 minuter och 75 minuter. Det användes särskilda ugnar till experimenten som kan
värmas upp till höga temperaturer. När jorden hade blivit upphettad och svalnat igen gjordes
analyser av vad som fanns kvar i proverna. Undersökningarna gjordes genom att separera
PFASs från jorden med hjälp av lösningsmedlet metanol. Efter att separeringen var utförd
hamnade den PFASs som förut var i jorden i metanolen. Därefter blev metanolen koncentrerad
till en mindre mängd vätska och sedan kunde PFASs-halterna mätas med en särskild apparat
som heter masspektrometer.
Resultatet blev bra och reningen lyckades för många ämnen. Resultaten visade att de jordar där
PFASs blivit tillsatt var skillnaderna små, det var bara jorden från Arlanda som fick annorlunda
resultat. Av detta har slutsatsen dragits, att jordtypen inte spelar roll för hur bra reningen blir
av mark förorenad med PFASs. De temperaturer där reningen fungerade bäst var mellan 350
°C och 550 °C. Slutsatsen blev då att värme kan användas till att rena mark från PFASs och för
många ämnen blev proverna renade över 90 %.

vi
ABBREVIATIONS AFFFs Aqueous Film Forming Foams
PFASs Per- and polyfluoroalkyl substances
PFBA Perfluorobutanoic acid
PFPeA Perfluoropentanoic acid
PFHxA Perfluorohexanoic acid
PFHpA Perfluoroheptanoic acid
PFOA Perfluorooctanoic acid
PFNA Perfluorononanoic acid
PFDA Perfluorodecanoic acid
PFUnDA Perfluoroundecanoic acid
PFBS Perfluorobutanesulfonic acid
PFHxS Perfluorohexanesulfonic acid
PFOS Perfluorooctanesulfonic acid
6:2 FTSA 6:2 Fluorotelomer sulfonic acid
8:2 FTSA 8:2 Fluorotelomer sulfonic acid
FOSA Perfluorooctane sulphonamide
POP Persistent Organic Pollutant
PCB Polychlorinated biphenyls
PAH Polycyclic aromatic hydrocarbons
SGI Swedish Geological Institute
NaOH Sodium Hydroxide
HCL Hydrochloric acid
PHC Polyhalogenated compound
UPLC MS/MS Ultra-performance liquid chromatography tandem mass-
spectrometer
VOC Volatile organic compound
vii
CONTENT
ABSTRACT ............................................................................................................................................. i
REFERAT ............................................................................................................................................... ii
PREFACE .............................................................................................................................................. iii
POPULÄRVETENSKAPLIG SAMMANFATTNING ......................................................................... iv
ABBREVIATIONS ................................................................................................................................ vi
1. INTRODUCTION ........................................................................................................................... 1
1.1 RESEARCH QUESTIONS ..................................................................................................... 1
1.2 DELIMITATIONS .................................................................................................................. 1
2. BACKGROUND ............................................................................................................................. 2
2.1 MANUFACTURING AND USE ............................................................................................ 2
2.2 PFAS PROPERTIES ............................................................................................................... 2
2.3 ENVIRONMENTAL AND BIOLOGICAL EFFECTS .......................................................... 2
2.4 SOIL REMEDIATING TECHNIQUES ................................................................................. 3
2.5 THERMAL REMEDIATION ................................................................................................. 4
3. METHOD ........................................................................................................................................ 7
3.1 TARGET COMPOUNDS ....................................................................................................... 7
3.2 SOILS ...................................................................................................................................... 7
3.3 EXPERIMENTAL DESIGN ................................................................................................... 8
3.4 EXPERIMENTAL SET-UP .................................................................................................... 8
3.5 PFAS SOIL EXTRACTION, CLEAN-UP AND ANALYSIS ............................................. 10
3.6 DATA EVALUATION ......................................................................................................... 11
4. RESULTS ...................................................................................................................................... 13
4.1 THERMAL DESORPTION .................................................................................................. 13
4.2 REMOVAL EFFICIENCY ................................................................................................... 14
4.3 QUALITY CONTROL ......................................................................................................... 17
4.3.1 Negative control sample ................................................................................................ 17
4.3.2 UPLC-MS/MS measurement accuracy ......................................................................... 18
5 DISCUSSION ............................................................................................................................... 19
5.1 TIME ..................................................................................................................................... 19
5.2 TEMPERATURES TO REMEDIATE DIFFERENT PFASs ............................................... 19
5.3 SOILS .................................................................................................................................... 20
5.4 RECOMMENDATIONS ...................................................................................................... 20
5.5 QUALITY CONTROL ......................................................................................................... 20
5.6 RESEARCH QUESTIONS ................................................................................................... 21
6 CONCLUSIONS ........................................................................................................................... 22

viii
7 REFERENSER .............................................................................................................................. 23
8 APPENDIX ................................................................................................................................... 26

1
1. INTRODUCTION Per- and polyfluoroalkyl substances (PFASs) - are a large group of organic substances
characterized by their strong carbon-fluorine bonds (C-F bonds). PFASs can be partially or
completely fluorinated, vary in size, structure and chemical properties (Buck et al., 2011). They
have bioaccumulation potential (Chu et al., 2015) and they are fluorinated surfactants (Buck et
al., 2011). A surfactant is a substance that can reduce the surface tension of water and other
liquids (Oxford English Dictionary, 2017). Due to these characteristics, PFASs are used in a
wide variety of products (Hale et al., 2017; Xiao, 2017). Concerns have been raised because the
large production volumes of PFASs combined with their problematic features such as
environmental persistency due to the strong C-F bond and their bioaccumulation potential
(Rahman et al., 2014 ). They have also proven to have adverse implications on humans and
biota (Ahrens, 2011). PFASs have been found in humans, wild animals, soil and drinking water,
and are considered ubiquitously distributed in the environment (Buck et al., 2011).
The release of PFASs into the environment is a risk for humans and wildlife (Ahrens, 2011).
There are several studies that mention dangerous complications related to present PFASs
contamination (Rahman et al., 2014; Ashley-Martin et al., 2017; Wang et al., 2017). The
reasons for the PFASs-contaminated soil and groundwater are that there are many products
containing PFASs in large quantities and they are sometimes used in a way so that the PFASs
can easily be spread into the nature (Baduel et al., 2015).
In the soil, the PFASs sorb to the soil particles (Hellsing et al., 2016) and therefore they do not
spread at the same speed in the unsaturated soil compared to when the PFASs have reached the
saturated soil (Gellrich et al., 2012). To be able to reduce the release of PFASs into the
environment, point source PFAS soil remediation sometimes needs to be performed. Although
there are today very few studies that have assessed remediation techniques for PFASs-
contaminated soil. There are however several soil remediation methods that have been
discussed to be effective for PFAS contaminated soil, where thermal desorption was suggested
as theoretically very promising (Berglind et al., 2013).
The aim of this study is to evaluate if thermal desorption can be used as a successful remediation
method for PFAS contaminated soil. Thermal desorption has previously been shown to
successfully remediate other persistent organic pollutants (POP) such as polychlorinated
biphenyls (PCBs) (Zhao et al., 2017), however, it has never been tested for PFASs.
1.1 RESEARCH QUESTIONS
Which temperatures are able to remediate PFASs in the soil to a sufficient level?
How do the PFAS concentrations and composition profile change over time after
thermal treatment?
Does the soil type have any effect on PFAS removal efficiency?
1.2 DELIMITATIONS
These experiments assessed the thermal desorption remediation method for PFASs-
contaminated soil. During the experiments, 14 common PFASs were evaluated, however, this
is only a fraction of the large PFAS group which contains over 3000 substances on the global
market (Falk-Filipsson et al., 2015).

2
The focus has been on evaluating if the thermal desorption works for removing these substances
from soil. No other aspect of the remediation method has been evaluated e.g. no air samples
have been analysed to assess how much of the PFASs vaporized or how much of total organic
fluorine that has been removed from the soil.
2. BACKGROUND
2.1 MANUFACTURING AND USE
PFASs have been used since the 1950's for numerous products and applications (Hale et al.,
2017). Their properties make them an excellent substance to put in a wide variety of products
(Stahl et al., 2013). They been used in firefighting foams, in food-contact paper, as protective
coating on textile, in herbicide, in pesticides and even in cosmetics (Hale et al., 2017). They
have also been used in products like "non-stick" frying pans and paints (Xiao, 2017). Most of
the PFASs are synthetically produced but there are a few that might exist naturally, such as
from volcano activities (Ahrens, 2011)
2.2 PFAS PROPERTIES
The physical and chemical properties of PFASs are diverse since PFASs are a large group of
substances (Xiao, 2017). They have a few properties in common, all have at least one fluor (F)
atom bound together with a carbon atom (Buck et al., 2011). This carbon-fluor bond is a very
strong bond (Kim et al., 2015) and it is this bond that makes the PFASs very persistent to
thermal, chemical and biological degradation (Krafft and Riess, 2015). The polyfluoroalkyl
substances can degrade in the environment, tough but only or most likely to a perfluoroalkyl
substance (Buck et al., 2011).
The difference between perfluoroalkyl substances and polyfluoroalkyl substances are that in
the perfluoroalkyl group all hydrogen atoms are replaced with fluorine atoms and in the
polyfluoroalkyl group at least one, but not all hydrogen atoms, are replaced with a fluorine atom
or atoms (Buck et al., 2011). The two most common perfluoroalkyl substances are the
perfluorinated sulfonic acids (PFSAs) and perfluorinated carboxylic acids (PFCAs) (Rayne and
Forest, 2009). One of each from those groups, PFOA and PFOS, have been phased out because
they are toxic and are bioaccumulating in humans and biota (Borg and Håkansson, 2012).
The PFCAs and PFSAs can be divided into short-chained and long chained PFASs (Buck et al.,
2011). Buck et al. writes that the long chained PFCAs have 7 or more fluorinated carbon atoms
and the PFSAs have 6 or more fluorinated carbon atoms. The difference in definition between
the two perfluoroalkyl acids depends on the fact that the long chained PFCAs and PFSAs can
bioaccumulate easier.
2.3 ENVIRONMENTAL AND BIOLOGICAL EFFECTS
Short-chained PFASs are more mobile in soil than long chained PFASs (Gellrich et al., 2012;
Hellsing et al., 2016). The short chained PFASs also have lower bioaccumulation potential and
viewed upon as less toxic (Gellrich et al., 2012). Short-chained PFASs are however still as
persistent as the long chained PFASs in the environment (Krafft and Riess, 2015). After two of
the long chained PFASs have been banned (PFOA and PFOS) (Gomis et al., 2015), the use of
short-chained PFASs and precursors has increased (Ahrens et al., 2015). There is also still
leaching out a lot of PFOS and PFOA from contaminated soil because they were historically
used in such high abundance (Filipovic et al., 2015). The banned PFASs are therefore still

3
ending up in our drinking water, and they also have precursors that could degrade and increase
the concentrations of them in the soil over time (Gellrich et al., 2012).
A common point source for PFASs is the Aqueous Film Forming Foams (AFFFs) (Anderson
et al., 2016; Barzen-Hanson et al., 2017; Mejia-Avendaño et al., 2017). AFFFs have extensively
been used to quench hydrocarbon fuel fires at different practice facilities such as airport and
military bases (Xiao et al., 2017). Other point sources are landfills, waste disposals, the use of
products containing PFASs and from drains in sewage treatment plants (Borg and Håkansson,
2012).
According to Hellsing et al. (2016) the use of AFFFs have contaminated the soil near
firefighting training sites. When the PFASs have spread to the soil they can bioaccumulate in
soil organisms and plants (Rich et al., 2015; Navarro et al., 2017). After the PFASs has reached
the soil, they can potentially leach down into the groundwater and thereafter contaminate
drinking water reservoirs (Hellsing et al., 2016). In a study from Uppsala, Sweden, it has been
shown that drinking water reservoirs have been contaminated and thereafter PFASs levels in
human blood serum have increased over time because of PFASs contaminated drinking water
(Gyllenhammar et al., 2015).
There are several toxicological effects to be acknowledged because of the spread of PFAS
contaminations. According to Wang et al. (2017), there is a possible relation between infertility
as an effect of endometrioses, where the endometrioses could have been caused by PFASs
contamination. Endometrioses is a gynecologic disease that is characterized by endometrial
glands growing on the outside of the uterus (Wang et al., 2017). A correlation between PFASs
in maternal blood or blood from the umbilical cord and low birth weight has also been found
(Ashley-Martin et al., 2017). A study on PFOA-levels in humans was done on the local
population in mid-Ohio valley (Rahman et al., 2014). In this community PFOA existed in the
drinking water according to Rahman et al. (2014) and it was a chemical plant in the area. The
people in mid-Ohio valley, especially the people who worked in the factory, had a higher rate
of cancer in kidneys and testicles. Other studies, also according to Rahman et al. (2014), have
found a correlation between PFAS levels in humans and early menopause, increased
impulsivity in children, delayed puberty, low semen quality in young men.
2.4 SOIL REMEDIATING TECHNIQUES
There are other potentially good techniques to remediate PFASs-contaminated soil than thermal
desorption, e.g. stabilization and solidification, soil wash and incineration (Berglind et al.,
2013). Soil washing aims to clean PFAS contaminated soil by washing it with water or water
mixed with solvents (Englöv et al., 2007). The solution is circulated in situ within the
contaminated area according to Englöv et al. (2007), to mobilize the contamination and partition
the PFAS to the aqueous phase. When the PFASs are in the aqueous phase, the liquid is taken
out from the soil and then cleaned in order to remove the contamination and any other added
chemical, often by filtration through activated carbon. The in situ soil wash method is primarily
used in the unsaturated zone but can also be applied in the saturated zone.
Incineration is another method that destroys the contaminants by burning the polluted soil. This
method is usually done ex-situ, first, by excavating the affected soil and then combust it in an
incineration unit (Vidonish et al., 2016).
Stabilization and solidification is a remediation method based on adding a sorbent material that
stabilizes the contamination (Spence and Shi, 2004). An example of such a material is activated

4
carbon. A study in Norway tested different sorbents and got the result that the best stabilization
was achieved when activated carbon was added to the soil (Hale et al., 2017). When the
contamination is stabilized, it can be further solidified into a monolith, example by adding a
binder, often Portland cement, to the contaminated soil (Pereira et al., 2001).
2.5 THERMAL REMEDIATION
Multiple methods have been developed for thermal treatments in soil e.g. thermal desorption
and incineration (Kuppusamy et al., 2017). Microwave frequency heating is also used as a
thermal treatment method (Lim et al., 2016). In this study, thermal desorption was evaluated.
There are two ways to operate thermal desorption: ex-situ and in situ. Ex situ means excavation
of the polluted soil and treat the soil in a facility above ground. In situ means that the soil is
remediated while the soil is undisturbed and the treatment equipment is located in the soil
(Vidonish et al., 2016). The theory of in situ thermal desorption is to vaporize the contaminant
by heating the soil to increase the vapour pressure of the contaminant, and then be able to extract
the pollutant from the soil by a vacuum pump (Figure 1). After the desorption process is
finished, the air filter can remove the contaminant from the air which later can be disposed of,
e.g. by incineration (Lim et al., 2016).
Figure 1. A model over how thermal desorption theoretically works.
The advantages of thermal desorption are the high removal efficiency (RE), where RE above
99 % can be achieved (Vidonish et al., 2016). Another study writes that thermal desorption
treats contaminated soil with high efficiency regardless of chemical species (Gitipour et al.,
2015). It can be a fast method, where ex situ thermal desorption has treated contaminated soil
within minutes (Vidonish et al., 2016). The disadvantages are the high costs and low RE when
the moisture content in the soil is high (Lim et al., 2016). In situ thermal desorption is more
costly than the ex-situ thermal desorption (Vidonish et al., 2016). Other negative aspects
according to Vidonish et al. (2016) are the large energy demand, both for the in situ method
and the ex situ method, and the long treatment times for the in situ thermal desorption. The time
can be between a few weeks and a few years. Thermal desorption also decomposes organic

5
matter and therefore disrupts the soil ecosystem on site. Even if in situ thermal desorption takes
longer and is more costly the in situ thermal desorption might be favourable in sensitive areas
because it seems to have less impact on the environment than ex-situ thermal desorption
(Vidonish et al., 2016).
No previous studies have been done on thermal desorption for PFASs contaminated soil.
Although, there has been done thermal desorption on other persistent organic pollutants such
as Polychlorinated biphenyls (PCBs) (Qi et al., 2014). According to Qi et al. (2014) the thermal
desorption RE was evalueted for PCBs for 60 min treatment time between the temperatures 300
°C to 600 °C in six temperature steps (i.e. 300 °C, 350 °C, 400 °C, 450 °C, 500 °C, 550 °C and
600 °C). The RE increased the most between 300 °C to 400 °C, the RE for 400 °C was
approximately 95 %, and at higher temperatures the RE increase was marginal. Another study
also evaluated thermal desorption on PCB-contaminated soil and found similar results with a
maximum RE increase between 300 °C and 400 °C after 60 min of treatment time (Liu et al.,
2015). According to Liu et al. (2015), they spiked their samples with different concentrations
of sodium hydroxide (NaOH) and found that especially for lower temperatures the NaOH had
increased the thermal desorption via base-catalyzed decomposition. Another analytical
variation on thermal desorption evaluation methodology was done on PCB-contaminated soil
where Mascolo et al. (2013) used thermal desorption together with a gas chromatography
coupled to a tandem mass spectrophotometer and found that this method reduced the analyzing
time and the time to handling samples. The disadvantage of this method is the fact that it did
not have low detection limits.
This is an example of the pollutions from a firefighting training site in Canada, where PFAS-
containing AFFFs were used (Yao et al., 2015). The compound groups found according to
Yao et al. (2015) were polyhalogenated compound (PHCs), volatile organic compound
(VOCs), polychlorinated biphenyls (PCBs), polycyclic aromatic hydrocarbons (PAHs), and
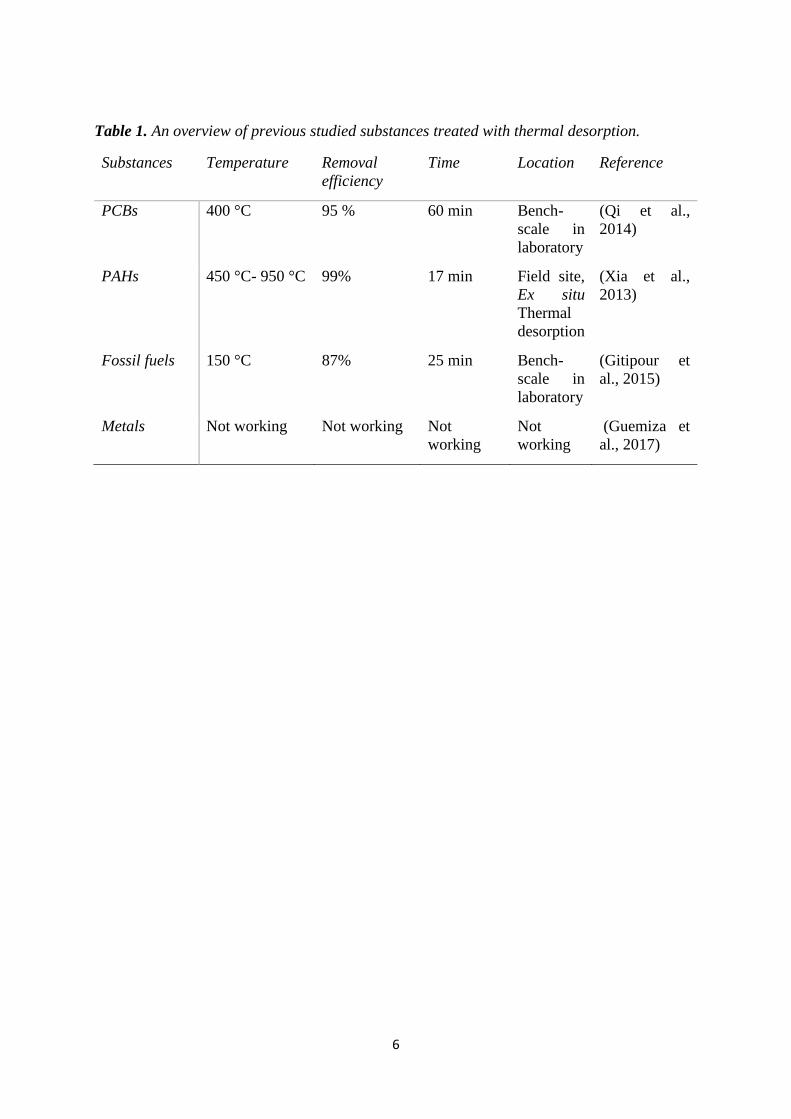
metals. In Table 1 there is an overview over how well and at what temperature thermal
desorption worked for these compounds.
6
Table 1. An overview of previous studied substances treated with thermal desorption.
Substances Temperature Removal
efficiency
Time Location Reference
PCBs 400 °C 95 % 60 min Bench-
scale in
laboratory
(Qi et al.,
2014)
PAHs 450 °C- 950 °C 99% 17 min Field site,
Ex situ
Thermal
desorption
(Xia et al.,
2013)
Fossil fuels 150 °C 87% 25 min Bench-
scale in
laboratory
(Gitipour et
al., 2015)
Metals Not working Not working Not
working
Not
working
(Guemiza et
al., 2017)
7
3. METHOD
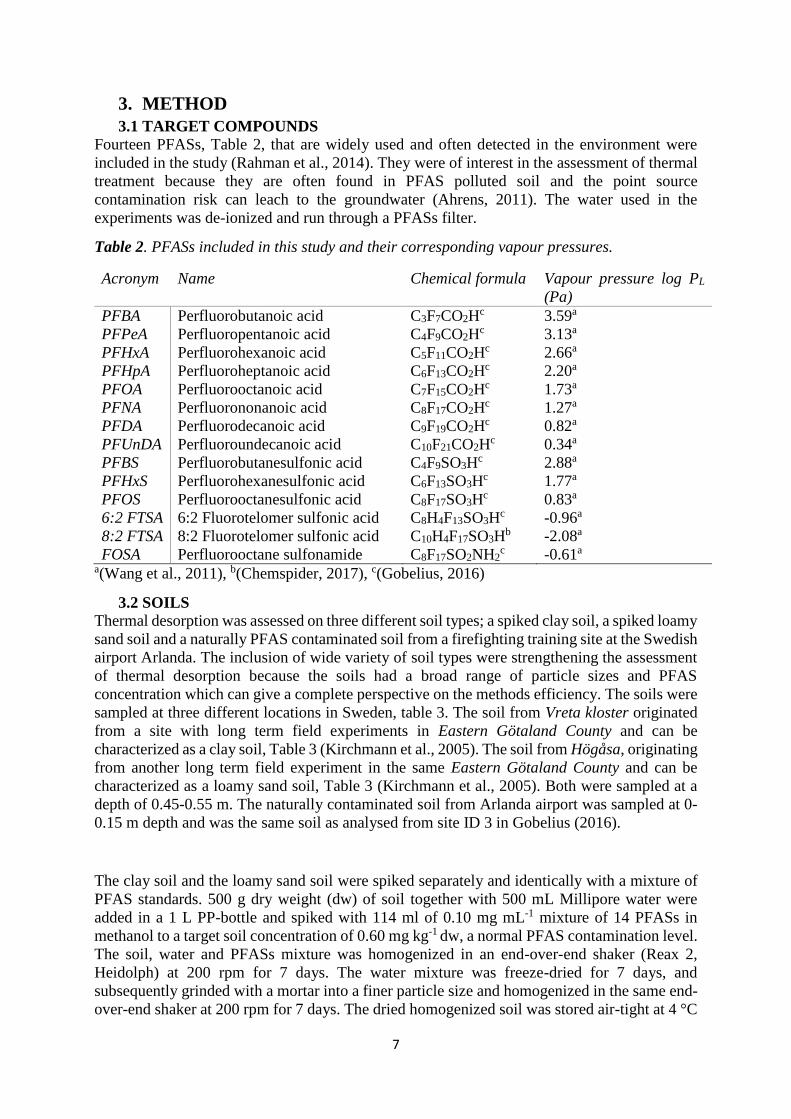
3.1 TARGET COMPOUNDS
Fourteen PFASs, Table 2, that are widely used and often detected in the environment were
included in the study (Rahman et al., 2014). They were of interest in the assessment of thermal
treatment because they are often found in PFAS polluted soil and the point source
contamination risk can leach to the groundwater (Ahrens, 2011). The water used in the
experiments was de-ionized and run through a PFASs filter.
Table 2. PFASs included in this study and their corresponding vapour pressures.
Acronym Name Chemical formula Vapour pressure log PL
(Pa)
PFBA Perfluorobutanoic acid C3F7CO2Hc 3.59a
PFPeA Perfluoropentanoic acid C4F9CO2Hc 3.13a
PFHxA Perfluorohexanoic acid C5F11CO2Hc 2.66a
PFHpA Perfluoroheptanoic acid C6F13CO2Hc 2.20a
PFOA Perfluorooctanoic acid C7F15CO2Hc 1.73a
PFNA Perfluorononanoic acid C8F17CO2Hc 1.27a
PFDA Perfluorodecanoic acid C9F19CO2Hc 0.82a
PFUnDA Perfluoroundecanoic acid C10F21CO2Hc 0.34a
PFBS Perfluorobutanesulfonic acid C4F9SO3Hc 2.88a
PFHxS Perfluorohexanesulfonic acid C6F13SO3Hc 1.77a
PFOS Perfluorooctanesulfonic acid C8F17SO3Hc 0.83a
6:2 FTSA 6:2 Fluorotelomer sulfonic acid C8H4F13SO3Hc -0.96a
8:2 FTSA 8:2 Fluorotelomer sulfonic acid C10H4F17SO3Hb -2.08a
FOSA Perfluorooctane sulfonamide C8F17SO2NH2c -0.61a
a(Wang et al., 2011), b(Chemspider, 2017), c(Gobelius, 2016)
3.2 SOILS
Thermal desorption was assessed on three different soil types; a spiked clay soil, a spiked loamy
sand soil and a naturally PFAS contaminated soil from a firefighting training site at the Swedish
airport Arlanda. The inclusion of wide variety of soil types were strengthening the assessment
of thermal desorption because the soils had a broad range of particle sizes and PFAS
concentration which can give a complete perspective on the methods efficiency. The soils were
sampled at three different locations in Sweden, table 3. The soil from Vreta kloster originated
from a site with long term field experiments in Eastern Götaland County and can be
characterized as a clay soil, Table 3 (Kirchmann et al., 2005). The soil from Högåsa, originating
from another long term field experiment in the same Eastern Götaland County and can be
characterized as a loamy sand soil, Table 3 (Kirchmann et al., 2005). Both were sampled at a
depth of 0.45-0.55 m. The naturally contaminated soil from Arlanda airport was sampled at 0-
0.15 m depth and was the same soil as analysed from site ID 3 in Gobelius (2016).
The clay soil and the loamy sand soil were spiked separately and identically with a mixture of
PFAS standards. 500 g dry weight (dw) of soil together with 500 mL Millipore water were
added in a 1 L PP-bottle and spiked with 114 ml of 0.10 mg mL-1 mixture of 14 PFASs in
methanol to a target soil concentration of 0.60 mg kg-1 dw, a normal PFAS contamination level.
The soil, water and PFASs mixture was homogenized in an end-over-end shaker (Reax 2,
Heidolph) at 200 rpm for 7 days. The water mixture was freeze-dried for 7 days, and
subsequently grinded with a mortar into a finer particle size and homogenized in the same end-
over-end shaker at 200 rpm for 7 days. The dried homogenized soil was stored air-tight at 4 °C

8
for 1 month to age before further experimental execution. The soil from Arlanda airport was
not spiked with PFASs because according to Ahrens et al. (2015) there is a fire training facility
at Arlanda airport. This training facility had used AFFFs and therefore it was thought that this
soil did contain enough PFASs.
Table 3. Soil used in the experiments (partially modified from Kirchmann et al., 2005).
Vreta kloster Högåsa Stockholm Arlanda
Airport
Date of collection July 2016 July 2016 July 2016
Longitude/Latitude 15 ° 30´ E, 58° 29´ N 15 ° 27´ E, 58° 30´ N 17 ° 56´ E, 59° 39´ N
Sand (%) 1.1 % 82.2 % n/d
Silt (%) 23 % 14.8 % n/d
Clay (%) 75.9 % 3 % n/d
pH 7 6 n/d
TOC 0.31 % 0.26 % 3.3 %
3.3 EXPERIMENTAL DESIGN
The general idea has been to perform thermal desorption on different soil types, ensuring that
the method could be applicable on many types of sites. After the thermal desorption the
remaining concentrations of PFASs were extracted and then analysed in a UPLC MS/MS. This
was done to see how well the remediation process exerted on PFASs-contaminated soil. Vapour
pressure will be used to assess the results. Vapour pressure according to Britannica Academic
(2017) is the pressure applied by a vapour when it is in equilibrium with the other phases. It is
a measurement of the ability of a substance to transform into vapour phase and it increases with
rising temperature.
3.4 EXPERIMENTAL SET-UP
The soils were freeze-dried and then the loamy sand soil, the clay soil and the natural soil from
Arlanda were homogenized with a mortar and a pestle. Brown glass bottles (wide mouth, 40
mL) were rinsed three times with methanol and thereafter filled with 4 grams of soil. 160
samples were prepared for the thermal desorption remediation including negative and positive
control samples (Table 4 and Table 5). All the different types of samples were produced in
triplicates to ensure good quality of the measurement. The negative controls were non-spiked
clay soil from Vreta kloster. The negative controls were used to evaluate if a cross
contamination occurs through the air inside the oven. The positive control samples were never
placed in the oven and used to calculate the removal efficiency. They consisted of samples from
the spiked loamy sand soil, spiked clay soil, the mixed soil from Arlanda and the unspiked clay
soil used for the negative controls.
9
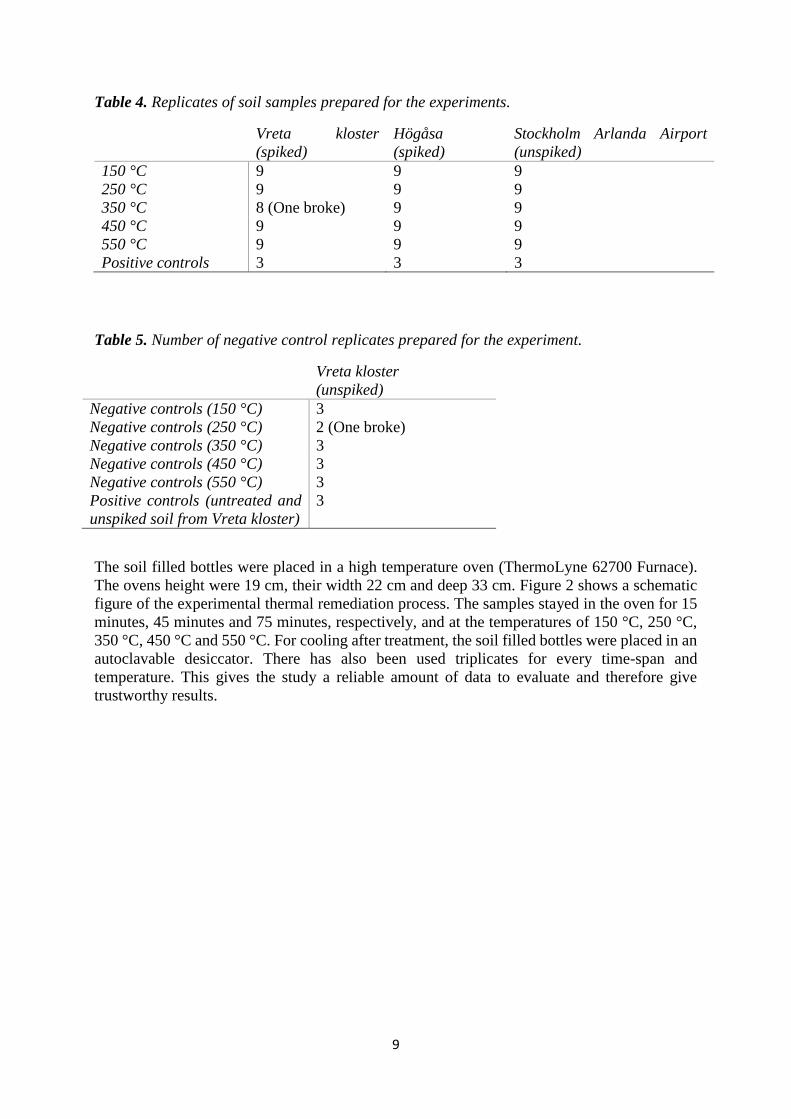
Table 4. Replicates of soil samples prepared for the experiments.
Vreta kloster
(spiked)
Högåsa
(spiked)
Stockholm Arlanda Airport
(unspiked)
150 °C 9 9 9
250 °C 9 9 9
350 °C 8 (One broke) 9 9
450 °C 9 9 9
550 °C 9 9 9
Positive controls 3 3 3
Table 5. Number of negative control replicates prepared for the experiment.
Vreta kloster
(unspiked)
Negative controls (150 °C) 3
Negative controls (250 °C) 2 (One broke)
Negative controls (350 °C) 3
Negative controls (450 °C) 3
Negative controls (550 °C) 3
Positive controls (untreated and
unspiked soil from Vreta kloster)
3
The soil filled bottles were placed in a high temperature oven (ThermoLyne 62700 Furnace).
The ovens height were 19 cm, their width 22 cm and deep 33 cm. Figure 2 shows a schematic
figure of the experimental thermal remediation process. The samples stayed in the oven for 15
minutes, 45 minutes and 75 minutes, respectively, and at the temperatures of 150 °C, 250 °C,
350 °C, 450 °C and 550 °C. For cooling after treatment, the soil filled bottles were placed in an
autoclavable desiccator. There has also been used triplicates for every time-span and
temperature. This gives the study a reliable amount of data to evaluate and therefore give
trustworthy results.

10
Figure 2. Experimental set up of the thermal remediation.
3.5 PFAS SOIL EXTRACTION, CLEAN-UP AND ANALYSIS
The efficiency of the thermal desorption was evaluated by measuring the remaining PFAS
concentration after thermal desorption remediation and then compared to the positive control
samples. The remaining PFAS concentration in the soil samples were extracted using solvent
liquid extraction (Figure 3), along with internal standard (IS) dilution method, accordingly to
Ahrens et al. (2009).
Figure 3. A schematic description of how the PFASs were extracted from thermally treated dry
soil samples and reference samples.

11
Solution A and B were prepared as extraction solutions. Solution A consisted of sodium
hydroxide (NaOH), methanol and Millipore water. 0.5 g of NaOH was diluted with 50 mL
Millipore water and 200 mL methanol. Solution B consisted of a 4 molar (M) (HCl), diluted
with Millipore water from 10 M HCl to 4 M HCl.
3 g (± 0.2 𝑔) of soil was weighed into a 50 mL PP-tube (rinsed with methanol three times). 2
mL of solution A was added and the suspension was soaked and extracted for 30 min.
Thereafter, 20 mL methanol and 100 μL of PFAS-IS-standard mix were added. The PFAS-IS-
standard mix consists of a mix of isotopically labeled PFAS in methanol and the concentration
was 5 ng/mL. The IS accounts for losses in the all losses of PFAS in the following steps of the
extraction, clean-up and analysis.
The PP-tubes containing the samples were shaken at 200 rpm for 60 min in a laboratory shaker
(Gerhardt, United Kingdom) and thereafter centrifuged at 3000 rpm for 15 min in an Eppendorf
5810. After centrifugation, the liquid has separated from the soil and was called supernatant
liquid. The supernatant liquid was transferred from the 50 mL PP-tube to another empty 50 mL
PP-tube (rinsed with methanol three times). The extraction was repeated one more time, step 3-
7 in Figure 3.
1 mL of solution A was left to soak for 30 min, 10 mL of methanol was added (but no PFAS-
IS-standard mix was added) and thereafter shaken for 30 min at 200 rpm. The soil samples were
centrifuged (Eppendorf 5810) at 3000 rpm for 15 min. The supernatant liquid was transferred
a second time to the same 50 mL PP-tube (rinsed with methanol three times) as the first batch
of supernatant liquid. 0.1 mL of solution B was added to the samples. The PP-tubes were shaken
by hand and thereafter put into the centrifuge (Eppendorf 5810) for 5 min at 3000 rpm. After
centrifugation, about a quarter of the supernatant liquid, 8.3 mL, was transferred to a 15 mL
PP-tube (rinsed with methanol three times).
The sample liquids were concentrated, from 8.3 mL to 0.5 mL, by blowing nitrogen gas into
the 15 mL PP-tube. During the concentration, the 15 mL PP-tube walls were rinsed with
methanol twice to ensure that there were no PFASs attached to the walls. After the
concentration, the sample was transferred into 1.7 mL Eppendorf vials which contained 25 mg
Envi-carb powder (Supelco, USA) and 50 µL acetic acid (Merck, Germany). The step was
called clean-up, and aims to reduce interfering substances in the analysis such as dissolved
organic carbon (DOC). Thereafter, the samples were shaken (VWR VX-2500) for 2 min and
centrifuged (Eppendorf 5424 R) for 15 min at 14000 rpm. 1 mL of the supernatant liquid was
filtered through 0.45 µm recycled cellulose (Sartorius) syringe filter into auto-injector vials
(Eppendorf, Germany). The samples were analyzed using ultra-performance liquid
chromatography tandem mass-spectrometer (UPLC MS/MS) (ThermoFisher, Quantiva
UltiMate 3000), and the chromatograms were evaluated in Tracefinder using a nine-point
calibration curve: 0.01ng/mL-100ng/mL.
3.6 DATA EVALUATION
During the data evaluation process, the data was transformed from ng PFAS/mL (E) to mg
PFAS/kg dry weight (dw) (C). The data was normalized with each initial sample weight (W),
Equation (1), which was approximately 3 gram and divided with 1000. The data did not need
to be compensated for because the resulting volumes were comparable. If a compensation has
to be implemented the exported data value (E) was multiplied with the internal standard
correction factor (L). In this assessment the internal standard correction factor was set to 1.
Since all samples were performed in triplicates, the mean value of these were calculated and
those values were used and presented in the graphs in the result section. To calculate the PFASs
desorption removal ratio (𝐶/𝐶0), the sample value (C) was divided with the value from the

12
positive controls (C0), Equation (2). The removal efficiency (RE) was furthermore calculated
in percent, Equation (3).
𝐶 [𝑚𝑔
𝐾𝑔 𝑑𝑤] = (
𝐸 [𝑛𝑔
𝑚𝐿]× 𝐿 [𝑚𝐿]
𝑊 [𝑔]) /1000 (1)
𝐶/𝐶0 = (𝐶 [
𝑚𝑔
𝐾𝑔𝑇𝑆]
𝐶0 [𝑚𝑔
𝐾𝑔𝑇𝑆]
) (2)
𝑅𝐸 [%] = (1 − (𝐶 [
𝑚𝑔
𝐾𝑔𝑇𝑆]
𝐶0 [𝑚𝑔
𝐾𝑔𝑇𝑆]
)) × 100 (3)
The strategy of the Figures and Tables generated were to show in a accurate way if this method
worked for PFASs-contaminated soil. There has been focus on assessing the temperature and
the time aspect of this method and which of those had the greatest impact on thermal desorption
remediation. Therefore Figures containing the changes of PFAS composition regarding time
and temperatures were generated. The changes of removal ratio [C/C0] and the removal
efficiency (RE) regarding temperature were also considered important to include. These were
only created with regard to temperature since time seemed to have less impact than temperature.
There were also Figures and Tables created to control the quality of the data.
13
4. RESULTS
4.1 THERMAL DESORPTION
Thermal desorption was applied on all three soils and the remaining PFASs concentrations were
analysed for these experiments. The evaluation of the data demonstrated that the remediation
had removed a considerable amount of PFASs after 75 minutes, although the difference
between 45 minutes and 75 minutes were small. All further results were therefore based on the
time-period of 75 minutes.
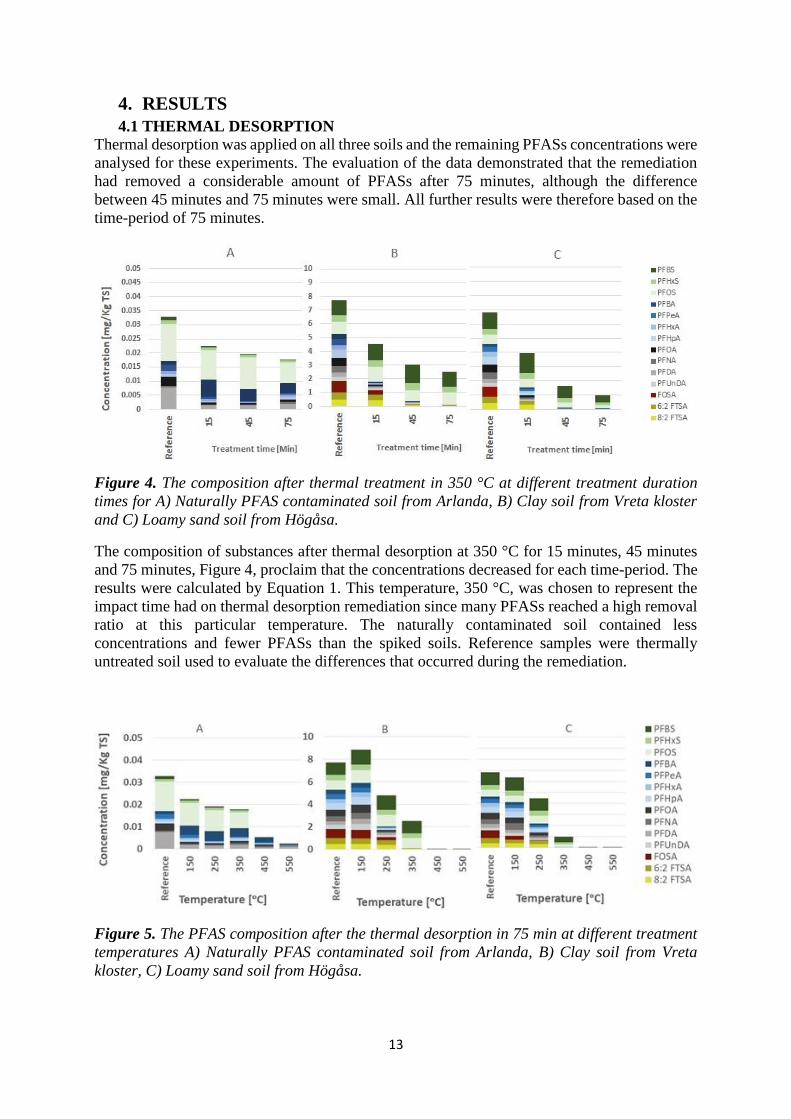
Figure 4. The composition after thermal treatment in 350 °C at different treatment duration
times for A) Naturally PFAS contaminated soil from Arlanda, B) Clay soil from Vreta kloster
and C) Loamy sand soil from Högåsa.
The composition of substances after thermal desorption at 350 °C for 15 minutes, 45 minutes
and 75 minutes, Figure 4, proclaim that the concentrations decreased for each time-period. The
results were calculated by Equation 1. This temperature, 350 °C, was chosen to represent the
impact time had on thermal desorption remediation since many PFASs reached a high removal
ratio at this particular temperature. The naturally contaminated soil contained less
concentrations and fewer PFASs than the spiked soils. Reference samples were thermally
untreated soil used to evaluate the differences that occurred during the remediation.
Figure 5. The PFAS composition after the thermal desorption in 75 min at different treatment
temperatures A) Naturally PFAS contaminated soil from Arlanda, B) Clay soil from Vreta
kloster, C) Loamy sand soil from Högåsa.

14
The composition of substances after thermal desorption at 75 minutes for 150 °C, 250 °C, 350
°C, 450 °C and 550 °C, Figure 5, shows that increased temperatures had an impact on the
concentrations of PFASs in the soils. In the naturally PFAS contaminated soil (Stockholm
Arlanda Airport), the PFCAs and PFSAs were the most prominent substances. PFSAs degraded
first and then the PFCAs, in the naturally contaminated soil (Figure 5, A). In the clay soil
(Figure 5, B) and the loamy sand soil (Figure 5, C), FOSA and FTSAs degraded initially,
thereafter the PFCAs and last the PFSAs.
4.2 REMOVAL EFFICIENCY
Figure 6. Temperatures (T) for >90% thermal desorption of naturally PFAS contaminated soil
from Arlanda, clay soil from Vreta kloster and loamy sand soil from Högåsa. The half
transparent dots within brackets did not reach above 90 % removal ratio. They mark the
temperature where those substances reached their highest removal.
These results, in Figure 6 and appendix in Table 8, that were based on calculations with
Equation 3 illustrated that the clay soil (Vreta kloster) and the sand soil (Högåsa) had generally
a removal efficiency above 90 % at temperatures over 350 °C. PFCAs and PFSAs had unified
results for the clay soil and the loamy sand soil. The PFCAs reached above 90 % removal
efficiency at 350 °C and PFSAs at 450 °C. The other two groups, FOSA and FTSA, had varying
results for all three soils. For the naturally PFAS contaminated soil (Stockholm Arlanda
airport), only a few values reached above 90% removal efficiency.
There were PFASs present in the loamy sand soil (Högåsa) and the clay soil (Vreta kloster) that
were not found in the naturally PFAS contaminated soil (Stockholm Arlanda Airport), and they
were marked with a line in Table 8.
150
200
250
300
350
400
450
500
550
600
PFB
A
PFP
eA
PFH
xA
PFH
pA
PFO
A
PFN
A
PFD
A
PFU
nD
A
PFB
S
PFH
xS
PFO
S
FOSA
6:2
FTS
A
8:2
FTS
A
T fo
r >9
0%
th
erm
al d
eso
rpti
on
[ᵒC]
Arlanda Clay Loamy sand
( ) (88 %)a
(87 %)a
(55 %)a ( ) ( ) ( )
(71 %)a (86 %)a ( )
15
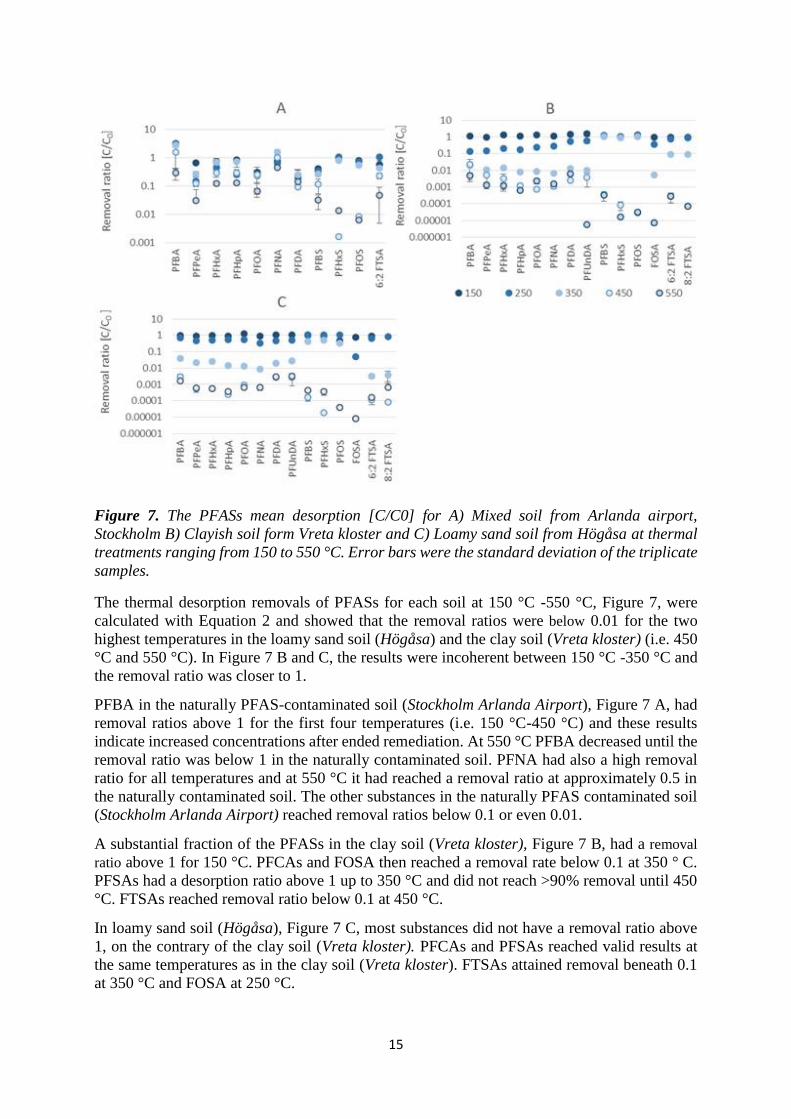
Figure 7. The PFASs mean desorption [C/C0] for A) Mixed soil from Arlanda airport,
Stockholm B) Clayish soil form Vreta kloster and C) Loamy sand soil from Högåsa at thermal
treatments ranging from 150 to 550 °C. Error bars were the standard deviation of the triplicate
samples.
The thermal desorption removals of PFASs for each soil at 150 °C -550 °C, Figure 7, were
calculated with Equation 2 and showed that the removal ratios were below 0.01 for the two
highest temperatures in the loamy sand soil (Högåsa) and the clay soil (Vreta kloster) (i.e. 450
°C and 550 °C). In Figure 7 B and C, the results were incoherent between 150 °C -350 °C and
the removal ratio was closer to 1.
PFBA in the naturally PFAS-contaminated soil (Stockholm Arlanda Airport), Figure 7 A, had
removal ratios above 1 for the first four temperatures (i.e. 150 °C-450 °C) and these results
indicate increased concentrations after ended remediation. At 550 °C PFBA decreased until the
removal ratio was below 1 in the naturally contaminated soil. PFNA had also a high removal
ratio for all temperatures and at 550 °C it had reached a removal ratio at approximately 0.5 in
the naturally contaminated soil. The other substances in the naturally PFAS contaminated soil
(Stockholm Arlanda Airport) reached removal ratios below 0.1 or even 0.01.
A substantial fraction of the PFASs in the clay soil (Vreta kloster), Figure 7 B, had a removal
ratio above 1 for 150 °C. PFCAs and FOSA then reached a removal rate below 0.1 at 350 ° C.
PFSAs had a desorption ratio above 1 up to 350 °C and did not reach >90% removal until 450
°C. FTSAs reached removal ratio below 0.1 at 450 °C.
In loamy sand soil (Högåsa), Figure 7 C, most substances did not have a removal ratio above
1, on the contrary of the clay soil (Vreta kloster). PFCAs and PFSAs reached valid results at
the same temperatures as in the clay soil (Vreta kloster). FTSAs attained removal beneath 0.1
at 350 °C and FOSA at 250 °C.

16
Figure 8. The removal ratio [C/C0] for A) 150 °C, B) 250 °C, C) 350 °C, D) 450 °C and E)550
°C for individual PFASs. Error bars were the standard deviation of the triplicate samples.
A comparison of the soils at 150 °C-550 °C, Figure 8, showed that the loamy sand soil (Högåsa)
had the highest removal, thereafter the clay soil (Vreta kloster) and last the naturally PFAS
contaminated soil (Stockholm Arlanda Airport). The results presented in Figure 8 have been
calculated with Equation 2.
Thermal desorption in 150 °C, Figure 8 B, had a removal ratio at 1 or above for all soils. When
the removal ratio was 1, it showed no change between the concentrations in the positive control
samples and the measured concentration after the thermal desorption. That was a clear
indication that the method had not been successful for this temperature (Figure 8, A). The
results for thermal desorption in 250 °C were improved compared to 150 °C, PFSAs however
still had a removal of 1 or only a little below.
The PFCAs, FTSAs and FOSA, at 350 °C, reached removal ratios below 0.1, Figure 8 C, and
PFSAs had a removal ratio around 1 or slightly below in the clay soil (Vreta kloster) and the
loamy sand soil (Högåsa). In the naturally contaminated soil (Stockholm Arlanda Airport) all
PFASs still had removal ratios at 1 or slightly below.
At 450 °C, Figure 8 D, all substances in the clay soil (Vreta kloster) and the loamy sand soil
(Högåsa) had removal ratios below 0.01. All PFASs in the naturally contaminated soil
17
(Stockholm Arlanda Airport) except PFBA and PFNA, Figure 8 D, had reached a removal ratio
close to 0.1. PFBA and PFNA were still at a removal ratio equal to 1 for this soil. After the
remediation in the highest temperature (550 °C), Figure 8 E, the thermally desorption had
reached a removal ratio below 0.1 for nearly all substances in all soils.
4.3 QUALITY CONTROL
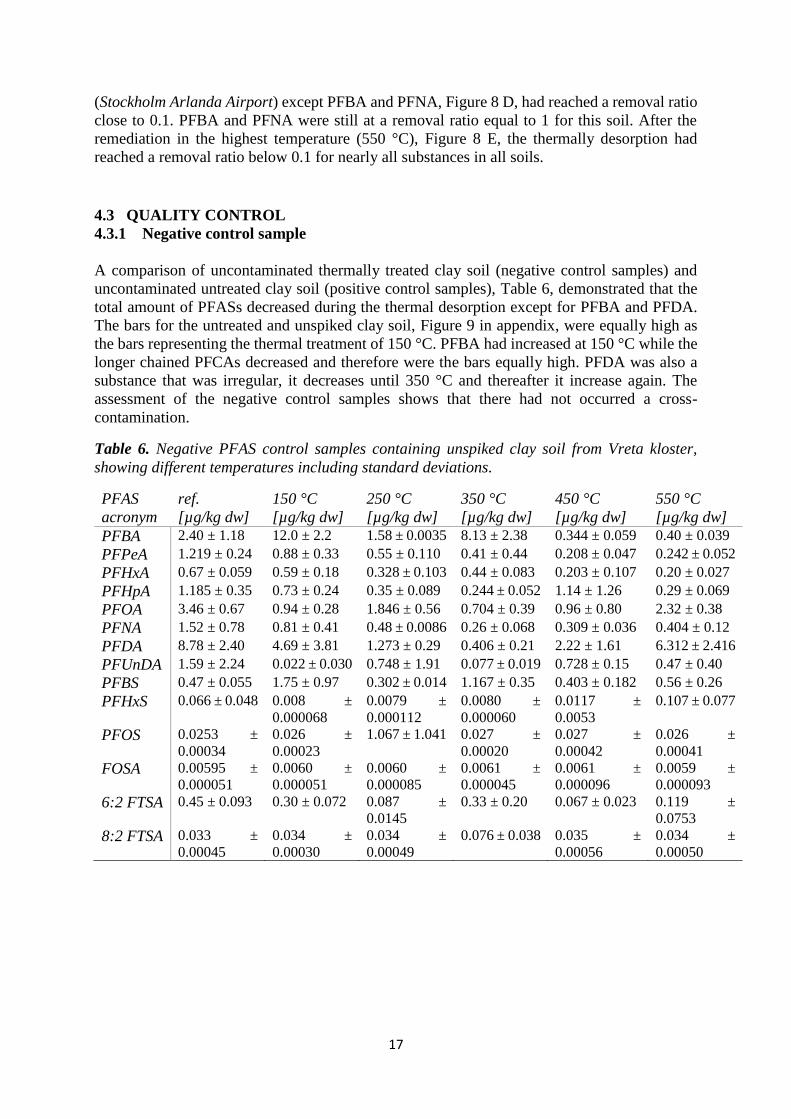
4.3.1 Negative control sample
A comparison of uncontaminated thermally treated clay soil (negative control samples) and
uncontaminated untreated clay soil (positive control samples), Table 6, demonstrated that the
total amount of PFASs decreased during the thermal desorption except for PFBA and PFDA.
The bars for the untreated and unspiked clay soil, Figure 9 in appendix, were equally high as
the bars representing the thermal treatment of 150 °C. PFBA had increased at 150 °C while the
longer chained PFCAs decreased and therefore were the bars equally high. PFDA was also a
substance that was irregular, it decreases until 350 °C and thereafter it increase again. The
assessment of the negative control samples shows that there had not occurred a cross-
contamination.
Table 6. Negative PFAS control samples containing unspiked clay soil from Vreta kloster,
showing different temperatures including standard deviations.
PFAS
acronym
ref.
[µg/kg dw]
150 °C
[µg/kg dw]
250 °C
[µg/kg dw]
350 °C
[µg/kg dw]
450 °C
[µg/kg dw]
550 °C
[µg/kg dw]
PFBA 2.40 ± 1.18 12.0 ± 2.2 1.58 ± 0.0035 8.13 ± 2.38 0.344 ± 0.059 0.40 ± 0.039
PFPeA 1.219 ± 0.24 0.88 ± 0.33 0.55 ± 0.110 0.41 ± 0.44 0.208 ± 0.047 0.242 ± 0.052
PFHxA 0.67 ± 0.059 0.59 ± 0.18 0.328 ± 0.103 0.44 ± 0.083 0.203 ± 0.107 0.20 ± 0.027
PFHpA 1.185 ± 0.35 0.73 ± 0.24 0.35 ± 0.089 0.244 ± 0.052 1.14 ± 1.26 0.29 ± 0.069
PFOA 3.46 ± 0.67 0.94 ± 0.28 1.846 ± 0.56 0.704 ± 0.39 0.96 ± 0.80 2.32 ± 0.38
PFNA 1.52 ± 0.78 0.81 ± 0.41 0.48 ± 0.0086 0.26 ± 0.068 0.309 ± 0.036 0.404 ± 0.12
PFDA 8.78 ± 2.40 4.69 ± 3.81 1.273 ± 0.29 0.406 ± 0.21 2.22 ± 1.61 6.312 ± 2.416
PFUnDA 1.59 ± 2.24 0.022 ± 0.030 0.748 ± 1.91 0.077 ± 0.019 0.728 ± 0.15 0.47 ± 0.40
PFBS 0.47 ± 0.055 1.75 ± 0.97 0.302 ± 0.014 1.167 ± 0.35 0.403 ± 0.182 0.56 ± 0.26
PFHxS 0.066 ± 0.048 0.008 ±
0.000068 0.0079 ±
0.000112 0.0080 ±
0.000060
0.0117 ±
0.0053 0.107 ± 0.077
PFOS 0.0253 ±
0.00034
0.026 ±
0.00023 1.067 ± 1.041 0.027 ±
0.00020 0.027 ±
0.00042 0.026 ±
0.00041
FOSA 0.00595 ±
0.000051
0.0060 ±
0.000051 0.0060 ±
0.000085 0.0061 ±
0.000045 0.0061 ±
0.000096 0.0059 ±
0.000093
6:2 FTSA 0.45 ± 0.093 0.30 ± 0.072 0.087 ±
0.0145 0.33 ± 0.20 0.067 ± 0.023 0.119 ±
0.0753
8:2 FTSA 0.033 ±
0.00045
0.034 ±
0.00030 0.034 ±
0.00049 0.076 ± 0.038 0.035 ±
0.00056 0.034 ±
0.00050

18
4.3.2 UPLC-MS/MS measurement accuracy
The standard deviation for the measurement accuracy, Table 7, were the most important
features in these results. The reason was that these results gave information about whether the
mass spectrometer had given reliable results or not. The standard deviation was within an
acceptable range except PFNA that had a standard deviation that was almost as large as the
mean value. 6:2 FTSA, PFHpA and PFDA had a standard deviation slightly larger than their
mean values. The standard deviations were, however, within an acceptable range.
Table 7. A sample treated in 150 °C for 15 min containing the naturally contaminated soil
(Stockholm Arlanda Airport) was measured 34 times, divided on three analytical runs, ensured
the measurement accuracy for UPLC MS/MS and the integration method in the software.
PFAS
acronym
Measurement accuracy
[µg/kg dw]
PFBA 7.14 ± 1.21
PFPeA 2.18 ± 0.52
PFHxA 1.66 ± 0.72
PFHpA 2.27 ± 1.26
PFOA 3.19 ± 1.38
PFNA 2.38 ± 1.96
PFDA 9.04 ± 5.94
PFBS 1.043 ± 0.38
PFHxS 1.54 ± 0.24
PFOS 15.4 ± 4.70
6:2 FTSA 0.52 ± 0.30
19
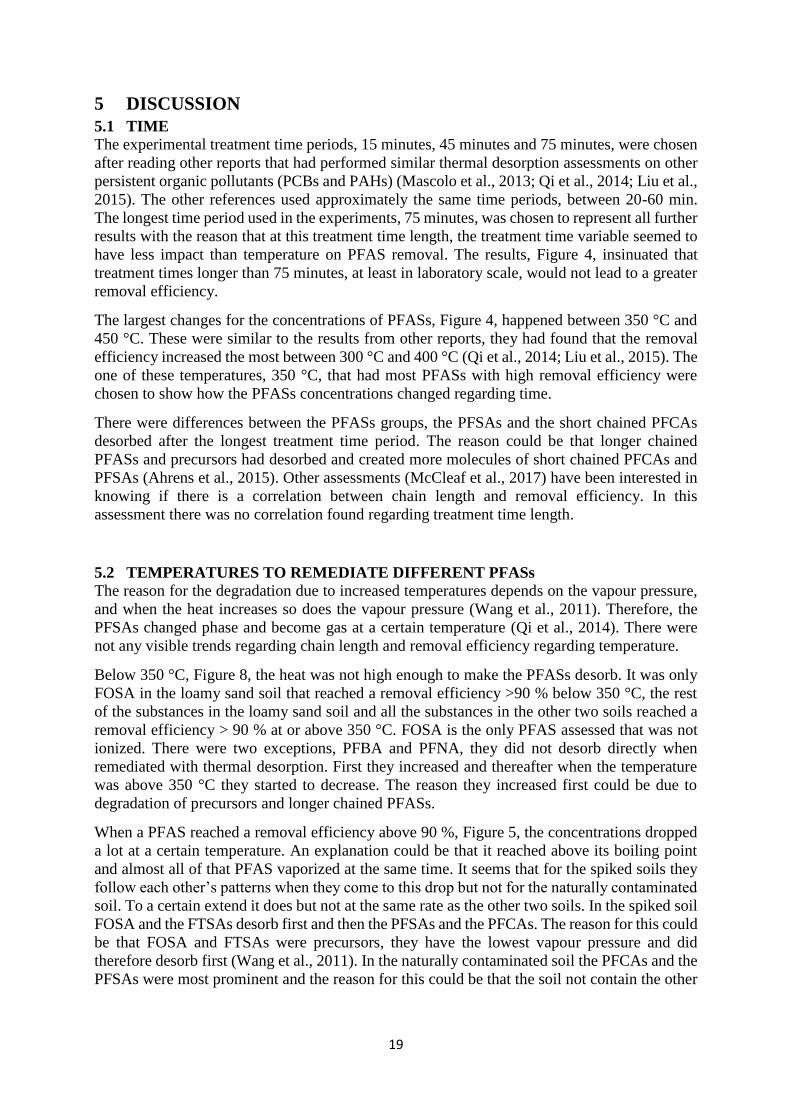
5 DISCUSSION
5.1 TIME The experimental treatment time periods, 15 minutes, 45 minutes and 75 minutes, were chosen
after reading other reports that had performed similar thermal desorption assessments on other
persistent organic pollutants (PCBs and PAHs) (Mascolo et al., 2013; Qi et al., 2014; Liu et al.,
2015). The other references used approximately the same time periods, between 20-60 min.
The longest time period used in the experiments, 75 minutes, was chosen to represent all further
results with the reason that at this treatment time length, the treatment time variable seemed to
have less impact than temperature on PFAS removal. The results, Figure 4, insinuated that
treatment times longer than 75 minutes, at least in laboratory scale, would not lead to a greater
removal efficiency.
The largest changes for the concentrations of PFASs, Figure 4, happened between 350 °C and
450 °C. These were similar to the results from other reports, they had found that the removal
efficiency increased the most between 300 °C and 400 °C (Qi et al., 2014; Liu et al., 2015). The
one of these temperatures, 350 °C, that had most PFASs with high removal efficiency were
chosen to show how the PFASs concentrations changed regarding time.
There were differences between the PFASs groups, the PFSAs and the short chained PFCAs
desorbed after the longest treatment time period. The reason could be that longer chained
PFASs and precursors had desorbed and created more molecules of short chained PFCAs and
PFSAs (Ahrens et al., 2015). Other assessments (McCleaf et al., 2017) have been interested in
knowing if there is a correlation between chain length and removal efficiency. In this
assessment there was no correlation found regarding treatment time length.
5.2 TEMPERATURES TO REMEDIATE DIFFERENT PFASs The reason for the degradation due to increased temperatures depends on the vapour pressure,
and when the heat increases so does the vapour pressure (Wang et al., 2011). Therefore, the
PFSAs changed phase and become gas at a certain temperature (Qi et al., 2014). There were
not any visible trends regarding chain length and removal efficiency regarding temperature.
Below 350 °C, Figure 8, the heat was not high enough to make the PFASs desorb. It was only
FOSA in the loamy sand soil that reached a removal efficiency >90 % below 350 °C, the rest
of the substances in the loamy sand soil and all the substances in the other two soils reached a
removal efficiency > 90 % at or above 350 °C. FOSA is the only PFAS assessed that was not
ionized. There were two exceptions, PFBA and PFNA, they did not desorb directly when
remediated with thermal desorption. First they increased and thereafter when the temperature
was above 350 °C they started to decrease. The reason they increased first could be due to
degradation of precursors and longer chained PFASs.
When a PFAS reached a removal efficiency above 90 %, Figure 5, the concentrations dropped
a lot at a certain temperature. An explanation could be that it reached above its boiling point
and almost all of that PFAS vaporized at the same time. It seems that for the spiked soils they
follow each other’s patterns when they come to this drop but not for the naturally contaminated
soil. To a certain extend it does but not at the same rate as the other two soils. In the spiked soil
FOSA and the FTSAs desorb first and then the PFSAs and the PFCAs. The reason for this could
be that FOSA and FTSAs were precursors, they have the lowest vapour pressure and did
therefore desorb first (Wang et al., 2011). In the naturally contaminated soil the PFCAs and the
PFSAs were most prominent and the reason for this could be that the soil not contain the other

20
PFASs used in the experiments. The naturally contaminated soil could contain other PFASs,
however, that were not analysed in this assessments.
5.3 SOILS
A large difference in removal efficiency, Figure 7, was between the naturally contaminated soil
and the spiked soils (loamy sand soil and clay soil). The spiked soils acted similar during the
thermal desorption remediation. It seemed that the naturally contaminated soil was more
difficult to remediate. There were several possible reasons for this and those were that the
contamination in the naturally contaminated soil was older than the contaminations in the other
two soils. The naturally contaminated soil was also slightly aggregated compared to the spiked
soils and that could therefore be a possibility that this soil contained more water when it entered
the oven compared to the other two soils. The naturally contaminated soil did also contain lower
concentrations of PFASs and that could also be a possible reason why this soil was harder to
remediate than the other two soils.
5.4 RECOMMENDATIONS
The results given in Figure 6 and Table 8 were based on an assumption that >90% removal
efficiency was an adequate level and could be seen as a good removal efficiency indicator. A
few recommendations can be given, for PFCAs the remediating temperature was adequate at ≥
350 °C, for PFSAs ≥ 450 °C, FOSA ≥ 350 °C and for the FTSAs ≥ 350 °C. These
recommendations were based on ideal conditions and therefore they might have to be adjusted
if used in a field experiment. A firefighting training site often contain a large variety of
contaminants, both from the substances that burns and the firefighting foams used to extinguish
the fire. Table 1 contains information about thermal desorption exerted on PAHs, PCBs, fossil
fuels and heavy metals and what temperatures used during those experiments. A
recommendation can therefore be given for this compound mix, the temperature should be at
least ≥ 450 °C.
The guideline values for PFOS given by the Swedish Geological Institute (SGI) were 0.003
mg/kg dw for sensitive land use, and 0.3 mg/kg dw for less sensitive land use (Pettersson et al.,
2015). In Sweden according to Pettersson et al. (2015) there were two different classifications
for land use, sensitive land use and less sensitive land use. Sensitive land use can be areas where
apartments, houses or schools are built. Less sensitive land use is where industries and factories
might be built. PFOS was the only PFASs having a threshold value. SGI is practicing the
precautionary principle and had therefore given the values for PFOS as generic values (Table
8). All substances were, when reached a removal ratio that was considered sufficient, below the
guide line values for less sensitive land use for PFOS.
5.5 QUALITY CONTROL The results shown in Table 6 indicates that there were not any cross contamination through the
air in the oven. There were a few values that were higher than the reference levels but they were
not occurring on a regular basis so they might be viewed upon as outliers rather than a cross
contamination.
The bars for the untreated and unspiked clay soil, Figure 9 in appendix, were equally high as
the bars representing the thermal treatment of 150 °C. PFBA had increased at 150 °C while the
longer chained PFCAs decreased and therefore were the bars equally high. PFDA was also a

21
substance that is irregular, it decreases until 350 °C and thereafter it increase again. An
explanation for this could again be degradation of precursors and PFASs with longer chains
than PFDA.
The measurement accuracy, Table 7, shows reliable results but a source of error could be a
carry over effect due to the UPLC MS/MS. It was most likely an effect from the sample
measured before the control sample. A carry over effect means that the measuring equipment
measures a little bit too high as a result of first measuring a sample with high concentration and
then after measuring a sample with low concentration. The equipment could have a residue of
the last sample in the system which then was visible in the measurement after. It had affected
the result slightly, but since the measures went from high to low in a decreasing scale that
impact have not been significant enough to make the data unreliable.
5.6 RESEARCH QUESTIONS
Which temperatures are able to remediate PFASs in the soil to a sufficient level?
How do the PFAS concentrations and composition profile change over time after
thermal treatment?
Does the soil type has any effect on PFAS removal efficiency?
Answers to research questions
First question was, which temperatures are able to remediate PFASs in the soil to a sufficient
level? The answer depends on the soil and the substance. Approximately most substances are
remediated between 350 °C and 550 °C. How do the PFAS concentrations and composition
change over time after thermal treatment? It desorbs most between 15 min and 45 min and
between 45 and 75 min the changes are small Does the soil type has any effect on PFAS removal
efficiency? The conclusion I would draw was that the soil type do have an effect on PFAS
removal efficiency. This was based on that the removal efficiency for the spiked soils differed
significantly from the removal efficiency for the naturally contaminated soil.
An interesting next step would be to investigate what happens to the ecosystem after the thermal
treatment and how the ecosystems cope with the contaminants in the soil. Do the soils contain
microorganisms when heavily contaminated e.g. on a firefighting training site? If it do, how
much would thermal desorption destroy that ecosystem? It would also be interesting to
investigate why the naturally contaminated soil were harder to remediate than the spiked soils.
22
6 CONCLUSIONS The results showed that for the clay soil (Vreta kloster) and the sandy soil (Högåsa) the
remediation had been successful, all PFASs for these two soils were remediated below guideline
values given by the Swedish Geological Institute (SGI). For the soil from Arlanda the success
rate was lower, 6 out of 14 substances were remediated to > 90% removal. It was a good result
regarding that the concentrations for all substances ended up below the guideline values of 0.3
mg/kg dw.
A few of the positive aspects for this method was high removal efficiency and rapidity if it was
used ex situ. A negative aspect would be that they have great potential to destroy the ecosystem
on the site and make the treated soil sterile (Vidonish et al., 2016). The method worked in the
laboratory, but there was not possible to conclude if it would work on a real site. In a field study
it likely need longer treatment time since the method was tested on dried and homogenised soil.
The conclusion, however, was that the remediation method worked in laboratory scale for all
three soil types at temperatures ≥450 °C after 75 minutes of thermal treatment.
23
7 REFERENSER
Ahrens, L., 2011. Polyfluoroalkyl compounds in the aquatic environment: A review of their
occurrence and fate. J. Environ. Monit. 13, 20–31. https://doi.org/10.1039/c0em00373e
Ahrens, L., Norström, K., Viktor, T., Cousins, A.P., Josefsson, S., 2015. Stockholm Arlanda Airport
as a source of per- and polyfluoroalkyl substances to water, sediment and fish. Chemosphere,
Per- and Polyfluorinated Alkyl substances (PFASs) in materials, humans and the environment
– current knowledge and scientific gaps. 129, 33–38.
https://doi.org/10.1016/j.chemosphere.2014.03.136
Anderson, R.H., Long, G.C., Porter, R.C., Anderson, J.K., 2016. Occurrence of select perfluoroalkyl
substances at U.S. Air Force aqueous film-forming foam release sites other than fire-training
areas: Field-validation of critical fate and transport properties. Chemosphere 150, 678–685.
https://doi.org/10.1016/j.chemosphere.2016.01.014
Ashley-Martin, J., Dodds, L., Arbuckle, T.E., Bouchard, M.F., Fisher, M., Morriset, A.-S., Monnier,
P., Shapiro, G.D., Ettinger, A.S., Dallaire, R., Taback, S., Fraser, W., Platt, R.W., 2017.
Maternal Concentrations of Perfluoroalkyl Substances and Fetal Markers of Metabolic
Function and Birth Weight. Am. J. Epidemiol. 185, 185–193.
https://doi.org/10.1093/aje/kww213
Baduel, C., Paxman, C.J., Mueller, J.F., 2015. Perfluoroalkyl substances in a firefighting training
ground (FTG), distribution and potential future release. J. Hazard. Mater. 296, 46–53.
https://doi.org/10.1016/j.jhazmat.2015.03.007
Barzen-Hanson, K.A., Roberts, S.C., Choyke, S., Oetjen, K., McAlees, A., Riddell, N., McCrindle, R.,
Ferguson, P.L., Higgins, C.P., Field, J.A., 2017. Discovery of 40 Classes of Per- and
Polyfluoroalkyl Substances in Historical Aqueous Film-Forming Foams (AFFFs) and AFFF-
Impacted Groundwater. Environ. Sci. Technol. 51, 2047–2057.
https://doi.org/10.1021/acs.est.6b05843
Berglind, R., Helldén, J., Johansson, N., Liljedahl, B., Sjöström, J., 2013. Perfluorerade ämnen i jord,
grundvatten och ytvatten (No. FOI-R-3705-SE). Försvarsmakten.
Borg, D., Håkansson, H., 2012. Environmental and Health Risk Assessment of Perfluoroalkylated and
Polyfluoroalkylated Substances (PFASs) in Sweden.
Buck, R.C., Franklin, J., Berger, U., Conder, J.M., Cousins, I.T., de Voogt, P., Jensen, A.A., Kannan,
K., Mabury, S.A., van Leeuwen, S.P., 2011. Perfluoroalkyl and polyfluoroalkyl substances in
the environment: Terminology, classification, and origins. Integr. Environ. Assess. Manag. 7,
513–541. https://doi.org/10.1002/ieam.258
Chemspider, 2017. Chemspider [WWW Document]. Chemspider. URL http://www.chemspider.com/
(accessed 8.1.17).
Chu, S., Wang, J., Leong, G., Woodward, L.A., Letcher, R.J., Li, Q.X., 2015. Perfluoroalkyl
sulfonates and carboxylic acids in liver, muscle and adipose tissues of black-footed albatross
(Phoebastria nigripes) from Midway Island, North Pacific Ocean. Chemosphere 138, 60–66.
https://doi.org/10.1016/j.chemosphere.2015.05.043
Englöv, P., Cox, E.E., Durant, N.D., Dall-Jepsen, J., Højbjerg Jørgensen, T., Nilsen, J., Törneman, N.,
2007. Klorerade lösningsmedel -Identifiering och val av efterbehandlingsmetod (No. 5663).
Naturvårdsverket, Stockholm.
Falk-Filipsson, A., Fischer, S., Ivarsson, J., Forsberg, J., Delvin, M., 2015. Förekomst och användning
av högfluorerade ämnen och alternativ (No. 6/15). Kemikalileinspektionen, Stockholm.
Filipovic, M., Woldegiorgis, A., Norström, K., Bibi, M., Lindberg, M., Österås, A.-H., 2015.
Historical usage of aqueous film forming foam: A case study of the widespread distribution of
perfluoroalkyl acids from a military airport to groundwater, lakes, soils and fish. Chemosphere
129, 39–45. https://doi.org/10.1016/j.chemosphere.2014.09.005
Gellrich, V., Stahl, T., Knepper, T.P., 2012. Behavior of perfluorinated compounds in soils during
leaching experiments. Chemosphere 87, 1052–1056.
https://doi.org/10.1016/j.chemosphere.2012.02.011

24
Gitipour, S., Farvash, E.S., Keramati, N., Yaghoobzadeh, P., Rezaee, M., 2015. Remediation of
petroleum contaminated soils in urban areas using thermal desorption. J. Environ. Stud. 41,
643–652.
Gobelius, L., 2016. Uptake of per- and polyfluoroalkyl substances by plants (Masterthesis). Uppsala.
Gomis, M.I., Wang, Z., Scheringer, M., Cousins, I.T., 2015. A modeling assessment of the
physicochemical properties and environmental fate of emerging and novel per- and
polyfluoroalkyl substances. Sci. Total Environ. 505, 981–991.
https://doi.org/10.1016/j.scitotenv.2014.10.062
Gyllenhammar, I., Berger, U., Sundström, M., McCleaf, P., Eurén, K., Eriksson, S., Ahlgren, S.,
Lignell, S., Aune, M., Kotova, N., Glynn, A., 2015. Influence of contaminated drinking water
on perfluoroalkyl acid levels in human serum - A case study from Uppsala, Sweden. Environ.
Res. 140, 673–683. https://doi.org/10.1016/j.envres.2015.05.019
Hale, S.E., Arp, H.P.H., Slinde, G.A., Wade, E.J., Bjørseth, K., Breedveld, G.D., Straith, B.F., Moe,
K.G., Jartun, M., Høisæter, Å., 2017. Sorbent amendment as a remediation strategy to reduce
PFAS mobility and leaching in a contaminated sandy soil from a Norwegian firefighting
training facility. Chemosphere 171, 9–18. https://doi.org/10.1016/j.chemosphere.2016.12.057
Hellsing, M.S., Josefsson, S., Hughes, A.V., Ahrens, L., 2016. Sorption of perfluoroalkyl substances
to two types of minerals. Chemosphere 159, 385–391.
https://doi.org/10.1016/j.chemosphere.2016.06.016
Kim, M., Li, L.Y., Grace, J.R., Yue, C., 2015. Selecting reliable physicochemical properties of
perfluoroalkyl and polyfluoroalkyl substances (PFASs) based on molecular descriptors.
Environ. Pollut. 196, 462–472. https://doi.org/10.1016/j.envpol.2014.11.008
Kirchmann, H., Snäll, S., Eriksson, J., Mattsson, L., 2005. Properties and classification of soils of the
Swedish long-term fertility experiments: V. Sites at Vreta Kloster and Högåsa. Acta Agric.
Scand. Sect. B — Soil Plant Sci. 55, 98–110. https://doi.org/10.1080/09064710510008711
Krafft, M.P., Riess, J.G., 2015. Selected physicochemical aspects of poly- and perfluoroalkylated
substances relevant to performance, environment and sustainability-Part one. Chemosphere
129, 4–19. https://doi.org/10.1016/j.chemosphere.2014.08.039
Kuppusamy, S., Thavamani, P., Venkateswarlu, K., Lee, Y.B., Naidu, R., Megharaj, M., 2017.
Remediation approaches for polycyclic aromatic hydrocarbons (PAHs) contaminated soils:
Technological constraints, emerging trends and future directions. Chemosphere 168, 944–968.
https://doi.org/10.1016/j.chemosphere.2016.10.115
Lim, M.W., Lau, E.V., Poh, P.E., 2016. A comprehensive guide of remediation technologies for oil
contaminated soil — Present works and future directions. Mar. Pollut. Bull. 109, 14–45.
https://doi.org/10.1016/j.marpolbul.2016.04.023
Liu, J., Qi, Z., Zhao, Z., Li, X., Buekens, A., Yan, J., Ni, M., 2015. Thermal desorption of PCB-
contaminated soil with sodium hydroxide. Environ. Sci. Pollut. Res. 22, 19538–19545.
https://doi.org/10.1007/s11356-015-5136-9
Mascolo, G., Bagnuolo, G., De, T., Uricchio, V., 2013. Direct analysis of polychlorinated biphenyls in
heavily contaminated soils by thermal desorption/gas chromatography/mass spectrometry. Int.
J. Environ. Anal. Chem. 93, 1030–1042. https://doi.org/10.1080/03067319.2012.708745
McCleaf, P., Englund, S., Östlund, A., Lindegren, K., Wiberg, K., Ahrens, L., 2017. Removal
efficiency of multiple poly- and perfluoroalkyl substances (PFASs) in drinking water using
granular activated carbon (GAC) and anion exchange (AE) column tests. Water Res. 120, 77–
87. https://doi.org/10.1016/j.watres.2017.04.057
Mejia-Avendaño, S., Munoz, G., Sauvé, S., Liu, J., 2017. Assessment of the Influence of Soil
Characteristics and Hydrocarbon Fuel Cocontamination on the Solvent Extraction of
Perfluoroalkyl and Polyfluoroalkyl Substances. Anal. Chem. 89, 2539–2546.
https://doi.org/10.1021/acs.analchem.6b04746
Navarro, I., de, la T., Sanz, P., Porcel, M.Á., Pro, J., Carbonell, G., Martínez, M.D.L.Á., 2017. Uptake
of perfluoroalkyl substances and halogenated flame retardants by crop plants grown in
biosolids-amended soils. Environ. Res. 152, 199–206.
https://doi.org/10.1016/j.envres.2016.10.018

25
Oxford English Dictionary [WWW Document], 2017. . Oxf. Engl. Dict. URL
http://www.oed.com.ezproxy.its.uu.se/view/Entry/194894?redirectedFrom=Surfactant#eid
(accessed 8.3.17).
Pettersson, M., Ländell, M., Ohlsson, Y., Berggren Kleja, D., Tiberg, C., 2015. Preliminära riktvärden
för högfluorerade ämnen (PFAS) i mark och grundvatten (No. 21). Sveriges Geotekniska
institut (SGI), Linköping.
Qi, Z., Chen, T., Bai, S., Yan, M., Lu, S., Buekens, A., Yan, J., Bulmǎu, C., Li, X., 2014. Effect of
temperature and particle size on the thermal desorption of PCBs from contaminated soil.
Environ. Sci. Pollut. Res. 21, 4697–4704. https://doi.org/10.1007/s11356-013-2392-4
Rahman, M.F., Peldszus, S., Anderson, W.B., 2014. Behaviour and fate of perfluoroalkyl and
polyfluoroalkyl substances (PFASs) in drinking water treatment: A review. Water Res. 50,
318–340. https://doi.org/10.1016/j.watres.2013.10.045
Rayne, S., Forest, K., 2009. Perfluoroalkyl sulfonic and carboxylic acids: A critical review of
physicochemical properties, levels and patterns in waters and wastewaters, and treatment
methods. J. Environ. Sci. Health - Part ToxicHazardous Subst. Environ. Eng. 44, 1145–1199.
https://doi.org/10.1080/10934520903139811
Rich, C.D., Blaine, A.C., Hundal, L., Higgins, C.P., 2015. Bioaccumulation of perfluoroalkyl acids by
earthworms (Eisenia fetida) exposed to contaminated soils. Environ. Sci. Technol. 49, 881–
888. https://doi.org/10.1021/es504152d
Spence, R.D., Shi, C., 2004. Stabilization and Solidification of Hazardous, Radioactive, and Mixed
Wastes. CRC Press.
Stahl, T., Riebe, R.A., Falk, S., Failing, K., Brunn, H., 2013. Long-term lysimeter experiment to
investigate the leaching of perfluoroalkyl substances (PFASs) and the carry-over from soil to
plants: Results of a pilot study. J. Agric. Food Chem. 61, 1784–1793.
https://doi.org/10.1021/jf305003h
vapour pressure -- Britannica Academic [WWW Document], n.d. URL
http://academic.eb.com.ezproxy.its.uu.se/levels/collegiate/article/vapour-pressure/74828
(accessed 1.17.18).
Vidonish, J.E., Zygourakis, K., Masiello, C.A., Sabadell, G., Alvarez, P.J.J., 2016. Thermal Treatment
of Hydrocarbon-Impacted Soils: A Review of Technology Innovation for Sustainable
Remediation. Engineering 2, 426–437. https://doi.org/10.1016/J.ENG.2016.04.005
Wang, B., Zhang, R., Jin, F., Lou, H., Mao, Y., Zhu, W., Zhou, W., Zhang, P., Zhang, J., 2017.
Perfluoroalkyl substances and endometriosis-related infertility in Chinese women. Environ.
Int. 102, 207–212. https://doi.org/10.1016/j.envint.2017.03.003
Wang, Z., MacLeod, M., Cousins, I.T., Scheringer, M., Hungerbühler, K., 2011. Using COSMOtherm
to predict physicochemical properties of poly- and perfluorinated alkyl substances (PFASs).
Environ. Chem. 8, 389–398. https://doi.org/10.1071/EN10143
Xiao, F., 2017. Emerging poly- and perfluoroalkyl substances in the aquatic environment: A review of
current literature. Water Res. 124, 482–495. https://doi.org/10.1016/j.watres.2017.07.024
Xiao, X., Ulrich, B.A., Chen, B., Higgins, C.P., 2017. Sorption of Poly- and Perfluoroalkyl Substances
(PFASs) Relevant to Aqueous Film-Forming Foam (AFFF)-Impacted Groundwater by
Biochars and Activated Carbon. Environ. Sci. Technol. 51, 6342–6351.
https://doi.org/10.1021/acs.est.7b00970
Yao, Y., Volchek, K., Brown, C.E., 2015. Characterization of environmental samples from an aqueous
film forming foam (AFFF)-impacted firefighting training area in Canada. Presented at the
Proceedings of the 38th AMOP Technical Seminar on Environmental Contamination and
Response, pp. 265–282.
Zhao, Z.-H., Li, X.-D., Ni, M.-J., Chen, T., Yan, J.-H., 2017. Remediation of PCB-contaminated soil
using a combination of mechanochemical method and thermal desorption. Environ. Sci.
Pollut. Res. 24, 11800–11806. https://doi.org/10.1007/s11356-017-8734-x

26
8 APPENDIX
Figure 9. The composition and concentrations of the negative control samples.
Figure 10. The measurement accuracy for a sample treated in 150 °C for 15 min containing
the naturally contaminated soil (Stockholm Arlanda Airport), measured 34 times.

27
Table 8. Lowest temperatures with >90% thermal desorption remediation efficiency.
PFAS
acronym
Recommendation:
Naturally PFAS
contaminated soil
Removal
efficiency
Before
remediation
[mg/kg dw]
After
remediation
[mg/kg dw]
PFBA (550) ᵒC (71%)a 0.0013 0.00039a
PFPeA 550 ᵒC 96.9 % 0.0021 6.55 E-05
PFHxA (550) ᵒC (88 %)a 0.0010 0.00013a
PFHpA (550) ᵒC (87 %)a 0.0011 0.00014a
PFOA 550 ᵒC 93.3 % 0.0033 0.00022
PFNA (550) ᵒC (55 %)a 0.00050 0.00023a
PFDA (550) ᵒC (86 %)a 0.0076 0.0011a
PFUnDA - 0b - -
PFBS 550 ᵒC 96.8 % 0.0013 0.00004
PFHxS 450 ᵒC 99.8 % 0.0011 1.81 E-06
PFOS 450 ᵒC 99.2 % 0.013 0.00011
6:2 FTSA 550 ᵒC 95.3 % 0.00017 0.00001
8:2 FTSA - 0b - -
FOSA - 0b - -
Recommendation:
Clay soil
Removal
efficiency
Before
remediation
[mg/kg dw]
After
remediation
[mg/kg dw]
PFBA 350 ᵒC 98 % 0.38 0.0075
PFPeA 350 ᵒC 98.9 % 0.46 0.0051
PFHxA 350 ᵒC 98.6 % 0.33 0.0046
PFHpA 350 ᵒC 99.2 % 0.61 0.0046
PFOA 350 ᵒC 99.2 % 0.57 0.0048
PFNA 350 ᵒC 99.3 % 0.44 0.0029
PFDA 350 ᵒC 98.7 % 0.32 0.0042
PFUnDA 350 ᵒC 99 % 0.35 0.0035
PFBS 450 ᵒC 99.9 % 1.11 0.00040
PFHxS 450 ᵒC 99.9 % 0.48 0.0013
PFOS 450 ᵒC 99.9 % 0.86 2.6 E-05
6:2 FTSA 350 ᵒC 91.0 % 0.51 0.048
8:2 FTSA 350 ᵒC 91.0 % 0.48 0.044
FOSA 350 ᵒC 99.5 % 0.82 0.0044
Recommendation:
Loamy sand soil
Removal
efficiency
Before
remediation
[mg/kg dw]
After
remediation
[mg/kg dw]
PFBA 350 ᵒC 96 % 0.20 0.0081
PFPeA 350 ᵒC 97.8 % 0.38 0.0080
PFHxA 350 ᵒC 97.3 % 0.32 0.0085
PFHpA 350 ᵒC 98.6 % 0.57 0.0081
PFOA 350 ᵒC 98.7 % 0.55 0.0073
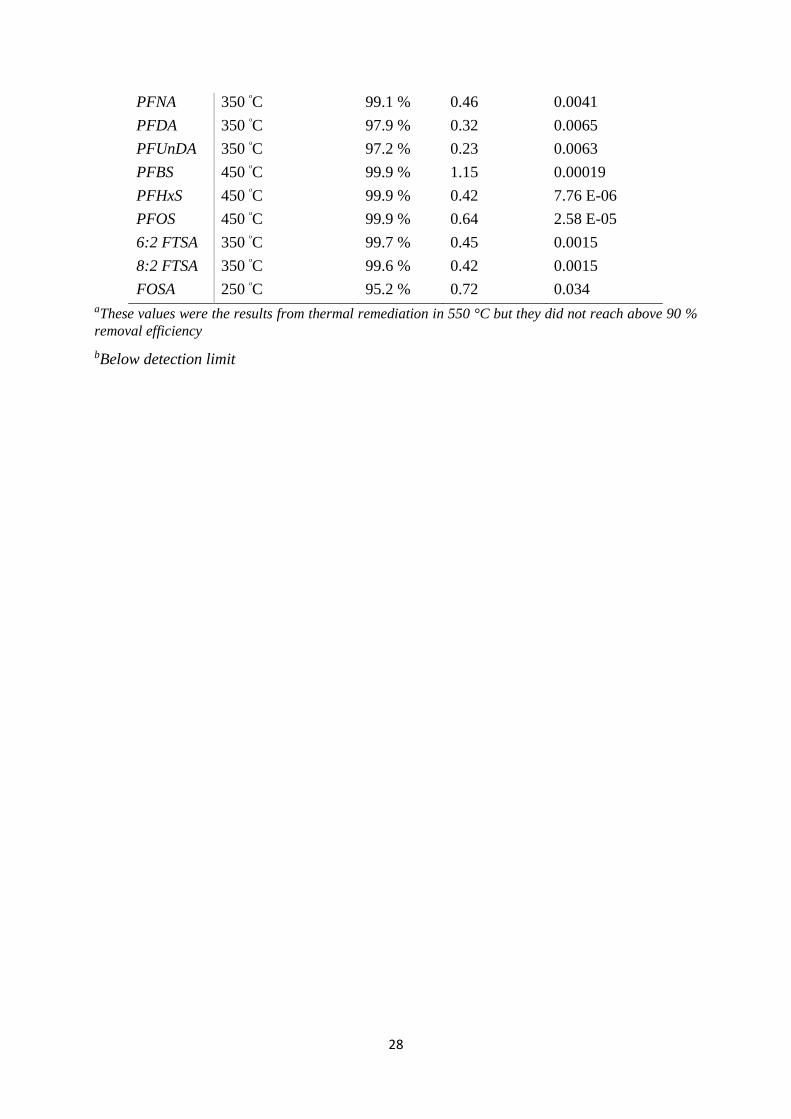
28
PFNA 350 ᵒC 99.1 % 0.46 0.0041
PFDA 350 ᵒC 97.9 % 0.32 0.0065
PFUnDA 350 ᵒC 97.2 % 0.23 0.0063
PFBS 450 ᵒC 99.9 % 1.15 0.00019
PFHxS 450 ᵒC 99.9 % 0.42 7.76 E-06
PFOS 450 ᵒC 99.9 % 0.64 2.58 E-05
6:2 FTSA 350 ᵒC 99.7 % 0.45 0.0015
8:2 FTSA 350 ᵒC 99.6 % 0.42 0.0015
FOSA 250 ᵒC 95.2 % 0.72 0.034 aThese values were the results from thermal remediation in 550 °C but they did not reach above 90 %
removal efficiency
bBelow detection limit