Embed Size (px)
Citation preview
RESEARCH Open Access
Aqueous chemistry of anthropogenicallycontaminated Bengaluru lakesSudhakar Rao1*, Nitish V. Mogili2, Priscilla A1 and Lydia A1
Abstract
Anthropogenic activities impact the major ion composition of fresh water sources. The inorganic species are likelyto be influenced by mineral dissolution, mineral precipitation, redox and ion-exchange reactions in thecontaminated lakes. Owing to paucity of research, this study examines the influence of bio-geochemical reactionson the major ion composition of sewage contaminated Bengaluru lakes. The selected lakes represent water bodiesin the major valley systems of the city that are polluted by partly treated sewage and stormwater runoffs.Hydrogeochemical facies of the lake samples showed that enrichment of Mg2+, Na+, Cl− and SO4
2− ions fromanthropogenic contamination altered the chemical type of the lake-water. Examination of processes influencing themajor ion composition of surface waters indicated that evaporation than rock-weathering tends to influence thechemical composition of the Bengaluru lakes. Precipitation of carbonate minerals in the alkaline pH contributed tothe deficiency of alkaline earth ions, while dissolution of anthropogenic gypsum enhanced the SO4
2− ionconcentration of the lakes. Solute diffusion from lake water into the pore solutions of sediments and ion-exchangereactions between monovalent ions of sediments and divalent cations in lake water are additional pathways thatinfluence the major ion composition of the contaminated lakes. Besides alterations in major ion composition,organic contamination, biochemical reactions associated with photosynthesis activity of algae and release of toxicAl3+ ions from mineral dissolution are consequences of the lake contamination.
Keywords: Anthropogenic, Lakes, Geochemistry, Pollution, Wastewater
IntroductionThe natural factors of lithology, weathering of drainagecatchments, precipitation, climate and distance to mar-ine environment influence the major ion composition offreshwater resources [1–4]. The geochemical processesof dissolution/precipitation, ion-exchange, evaporation/crystallization and redox transformations control the fateof the inorganic species in the fresh water sources [4–8].Anthropogenic contamination also impacts the major
ion composition of freshwater resources. Contaminationby fertilizers, animal waste, municipal and industrialsewage have altered the major ion composition (SO4
2−,NO3
−, Cl−, and K+) of the river waters in Guizhou Prov-ince, China [7]. Use of manure and chemical fertilizers
have contaminated the surface reservoirs of northwestIran with NO3
−, Cl−, HCO3− and Na+ ions [8]. An-
thropogenic activities related to agriculture have led tostrong correlations between TDS (total dissolved solids)and major ion ratios [7, 9]. Agricultural fertilizers causedsignificant increase in Na+, SO4
2−, K+, Cl−, NO3−, and
Mg2+ ion concentrations and altered the chemical ratiosin the Seine river basin, France [2]. Nitrate pollutionfrom agriculture and floating gardens led to a reversecorrelation between nitrate and other major ions in theDal lake samples of Gagribal and Nagin basins, India[10]. Dissolution of anthropogenic gypsum arising fromidols immersed in urban lakes contributed to the Ca2+
ion concentrations of such water bodies [11].Black water is rich in major cations and anions
[12–15]; sewage contamination would thus alter themajor ion composition of the contaminated lakes andrivers. Base flow solute concentrations (SO4
2, Cl−,
© The Author(s). 2020 Open Access This article is licensed under a Creative Commons Attribution 4.0 International License,which permits use, sharing, adaptation, distribution and reproduction in any medium or format, as long as you giveappropriate credit to the original author(s) and the source, provide a link to the Creative Commons licence, and indicate ifchanges were made. The images or other third party material in this article are included in the article's Creative Commonslicence, unless indicated otherwise in a credit line to the material. If material is not included in the article's Creative Commonslicence and your intended use is not permitted by statutory regulation or exceeds the permitted use, you will need to obtainpermission directly from the copyright holder. To view a copy of this licence, visit http://creativecommons.org/licenses/by/4.0/.
* Correspondence: [email protected] of Civil Engineering, Indian Institute of Science, Bengaluru560012, IndiaFull list of author information is available at the end of the article
Sustainable EnvironmentResearch
Rao et al. Sustainable Environment Research (2020) 30:8 https://doi.org/10.1186/s42834-020-00049-5
HCO3−, and Na+) were observed to increase with the
degree of urbanization in the Atlanta MetropolitanRegion, USA, suggesting that septic tank systems andleaky sewer line functioned as pervasive low-levelnon-point sources of contamination affecting thechemistry of shallow groundwater. A strong and un-usual basin-wide correlation between Na–K–Cl withinthe river basin reflected the widespread input of elec-trolytes present in human wastes and wastewater [16].The composition of Bagmati river water inKathmandu, Nepal, suggested that sewage effluent en-tering the river had a major effect on its major ioncomposition. All the chemical parameters showedstrong correlations with population density suggestingthat population density is the most likely driver ofchemical load in drainage waters of the river [17].Also, the microbial degradation of organic C and oxi-dation of NH4
+ ions [12, 18, 19] will contribute toHCO3
− and NO3− concentrations of sewage contami-
nated lakes and rivers. Occurrence of alkaline pHfrom photosynthetic metabolism of algae [20–23] caninduce carbonate mineral precipitation [24, 25] andimpact the alkaline earth (Ca2+, Mg2+) and HCO3
−
ion composition of sewage contaminated waterbodies.Earlier studies have highlighted the influence of an-
thropogenic contamination on the major ion compos-ition of freshwater resources. Subsequent to theirdeposition, the inorganic species will possibly be in-fluenced by dissolution/precipitation, ion-exchange,evaporation/crystallization and redox transformationsin an environment affected by microbial and algal ac-tivities. The influence of bio-geochemical reactions onthe major ion composition of contaminated freshwaterresources has not been studied. The present studyhence examines the influence of bio-geochemical re-actions on the major ion composition of sewage con-taminated Bengaluru lakes. The selected lakesrepresent water bodies in the major valley systems ofBengaluru city that are contaminated by partly treatedsewage and stormwater runoffs.
Study areaBengaluru is located in southeastern part of Karnatakaextending from north latitude 12°39′ 32″ to 13°14′13″and East longitude 77°19′44″ to 77°50′13″ at an altitudeof 920 m above mean sea level. Most of Bengaluru lakesare irrigation tanks built in sixteenth century and arehydrologically connected to form a chain of lakes in agiven valley system. Rapid urbanization of the city from1980s has diminished the number of lakes; further insuf-ficient recharge, inflow of partially treated sewage,stormwater runoffs and effluents have contaminated theexisting lakes [26–28].
The lake beds are composed of residually derivedred sandy soil that are overlaid by silt deposits ofvarying thickness [29, 30]. The silt fraction of redsoils deposited in lakes from rainwater runoffs areexpected to be composed of kaolinite and silica min-erals [29]. The area is mainly drained by part ofArkavathi river catchment to the west and southPennar river to the east. The two main catchmentsare further sub-divided into three major valley wa-tersheds namely the Hebbal Valley, VrushabhavathiValley, and Koramangala and Challaghatta (KC) Val-ley. Each of these valleys are endowed with two lakeseries, and each lake series in turn comprise of manylakes. The flow of water in each lake series is alonga network of drains which facilitates surplus waterfrom the lakes to flow into the downstream lake.Drain is a naturally or man-made channel whichconnects the lentic water bodies for the purpose ofconveying the surplus water on land, particularlyrainfall runoff. In Bengaluru City, most of the non-rejuvenated drains however carry sewage to waterbodies and are chocked by siltation and weeds. Thecatchment areas of Hebbal valley, Vrushabhavathivalley and KC valley correspond to 207, 165, and255 km2 respectively [31].Among the lakes examined in this study, Puttena-
halli lake (PU; KC valley) is the end member of thePuttenahalli lake series that does not drain further.Ulsoor lake (UL; KC Valley) is part of the Varthurlake series and the end-member of this series(Varthur lake) drains into the South Pinakini river.Sankey lake (SK; Vrushabhavathi Valley) is stand-alone lake and is fed by rainwater runoffs and storm-water drains. Nagawara lake (NG; Hebbal Valley) ispart of the Yellamallappa Chetty lake series; the endmember (Kacharakanahalli lake) of this lake seriesdoes not drain further.The areal extent, elevation and coordinates (coor-
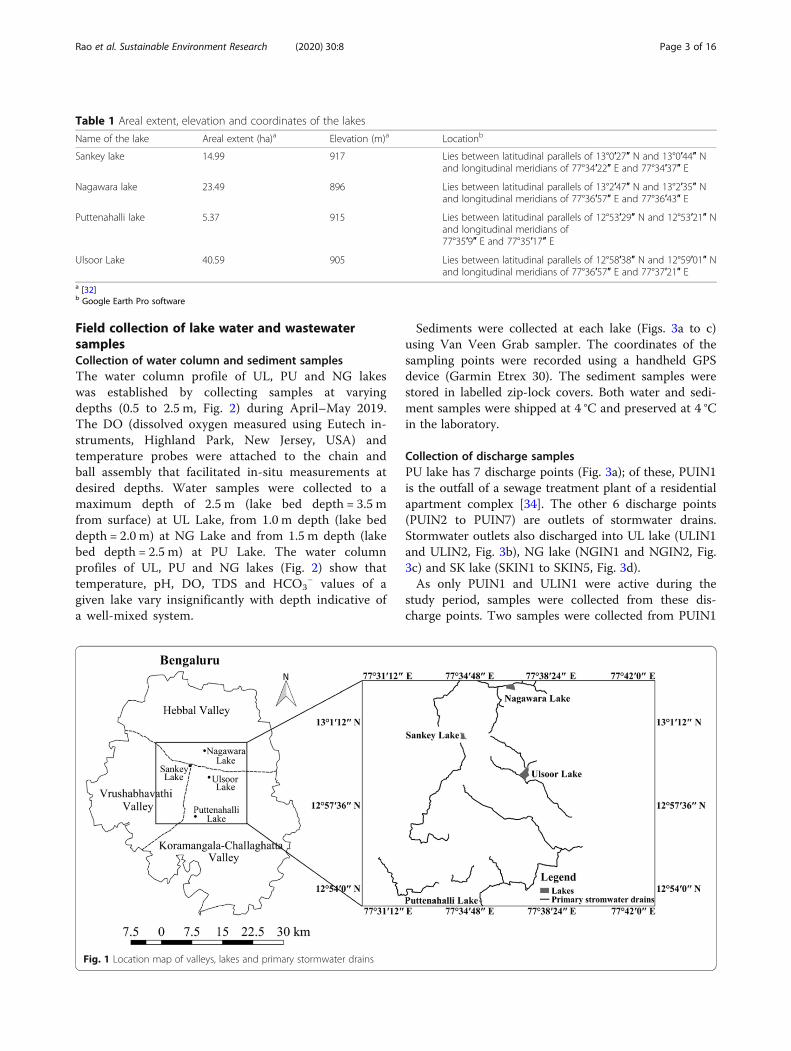
dinates are obtained using Google Earth Pro soft-ware) of the lakes are presented in Table 1. Thelocation of the four lakes and primary storm-waterdrains in the major valley systems of Bengaluru cityare illustrated in Fig. 1. The maximum and averagedepths of PU, UL and NG lakes were measured inApril–May 2019. The depth of each lake was mea-sured at multiple points (4 to 9) with chain andsolid metal ball (4 kg) assembly in consultation withlocal experts having knowledge of the lake topog-raphy. The maximum depths of PU, UL and NGlakes correspond to 2.1, 3.3, and 2.0 m respectively,while, their average depths are 1.43, 2.5 and 1.41 mrespectively. The maximum and average depth of SKlake corresponds to 9.0 m [33] and 2.7 m [32]respectively.
Rao et al. Sustainable Environment Research (2020) 30:8 Page 2 of 16
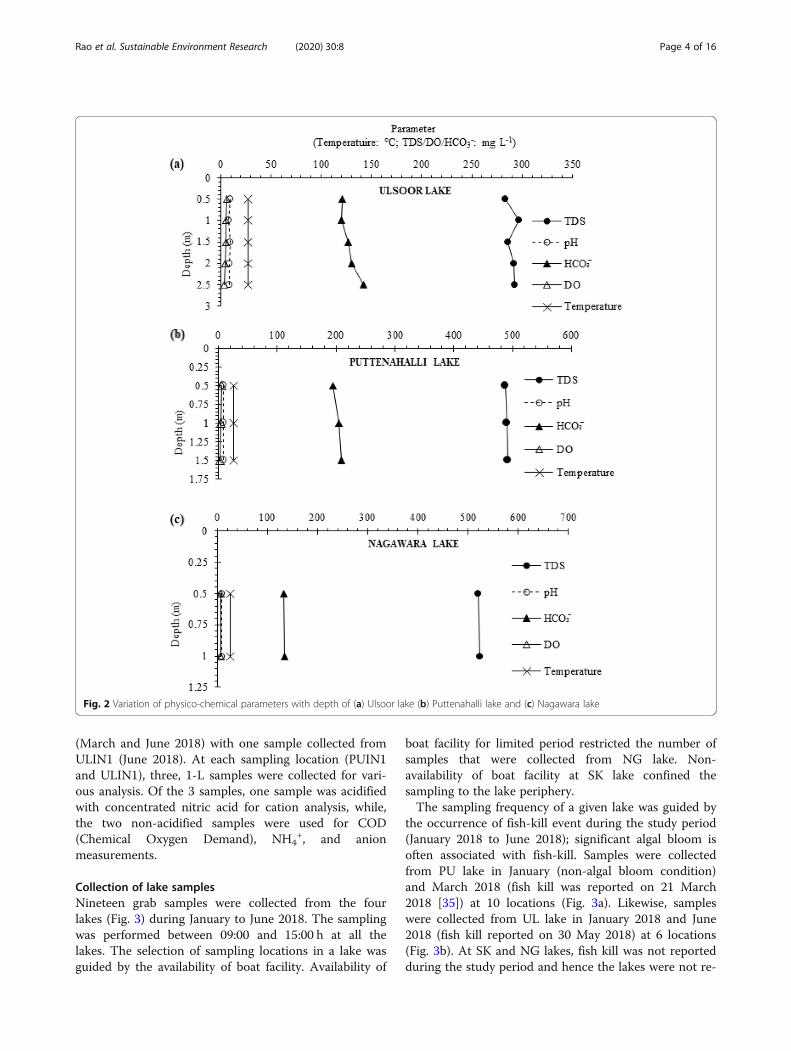
Field collection of lake water and wastewatersamplesCollection of water column and sediment samplesThe water column profile of UL, PU and NG lakeswas established by collecting samples at varyingdepths (0.5 to 2.5 m, Fig. 2) during April–May 2019.The DO (dissolved oxygen measured using Eutech in-struments, Highland Park, New Jersey, USA) andtemperature probes were attached to the chain andball assembly that facilitated in-situ measurements atdesired depths. Water samples were collected to amaximum depth of 2.5 m (lake bed depth = 3.5 mfrom surface) at UL Lake, from 1.0 m depth (lake beddepth = 2.0 m) at NG Lake and from 1.5 m depth (lakebed depth = 2.5 m) at PU Lake. The water columnprofiles of UL, PU and NG lakes (Fig. 2) show thattemperature, pH, DO, TDS and HCO3
− values of agiven lake vary insignificantly with depth indicative ofa well-mixed system.
Sediments were collected at each lake (Figs. 3a to c)using Van Veen Grab sampler. The coordinates of thesampling points were recorded using a handheld GPSdevice (Garmin Etrex 30). The sediment samples werestored in labelled zip-lock covers. Both water and sedi-ment samples were shipped at 4 °C and preserved at 4 °Cin the laboratory.
Collection of discharge samplesPU lake has 7 discharge points (Fig. 3a); of these, PUIN1is the outfall of a sewage treatment plant of a residentialapartment complex [34]. The other 6 discharge points(PUIN2 to PUIN7) are outlets of stormwater drains.Stormwater outlets also discharged into UL lake (ULIN1and ULIN2, Fig. 3b), NG lake (NGIN1 and NGIN2, Fig.3c) and SK lake (SKIN1 to SKIN5, Fig. 3d).As only PUIN1 and ULIN1 were active during the
study period, samples were collected from these dis-charge points. Two samples were collected from PUIN1
Table 1 Areal extent, elevation and coordinates of the lakes
Name of the lake Areal extent (ha)a Elevation (m)a Locationb
Sankey lake 14.99 917 Lies between latitudinal parallels of 13°0′27″ N and 13°0′44″ Nand longitudinal meridians of 77°34′22″ E and 77°34′37″ E
Nagawara lake 23.49 896 Lies between latitudinal parallels of 13°2′47″ N and 13°2′35″ Nand longitudinal meridians of 77°36′57″ E and 77°36′43″ E
Puttenahalli lake 5.37 915 Lies between latitudinal parallels of 12°53′29″ N and 12°53′21″ Nand longitudinal meridians of77°35′9″ E and 77°35′17″ E
Ulsoor Lake 40.59 905 Lies between latitudinal parallels of 12°58′38″ N and 12°59′01″ Nand longitudinal meridians of 77°36′57″ E and 77°37′21″ E
a [32]b Google Earth Pro software
Fig. 1 Location map of valleys, lakes and primary stormwater drains
Rao et al. Sustainable Environment Research (2020) 30:8 Page 3 of 16
(March and June 2018) with one sample collected fromULIN1 (June 2018). At each sampling location (PUIN1and ULIN1), three, 1-L samples were collected for vari-ous analysis. Of the 3 samples, one sample was acidifiedwith concentrated nitric acid for cation analysis, while,the two non-acidified samples were used for COD(Chemical Oxygen Demand), NH4
+, and anionmeasurements.
Collection of lake samplesNineteen grab samples were collected from the fourlakes (Fig. 3) during January to June 2018. The samplingwas performed between 09:00 and 15:00 h at all thelakes. The selection of sampling locations in a lake wasguided by the availability of boat facility. Availability of
boat facility for limited period restricted the number ofsamples that were collected from NG lake. Non-availability of boat facility at SK lake confined thesampling to the lake periphery.The sampling frequency of a given lake was guided by
the occurrence of fish-kill event during the study period(January 2018 to June 2018); significant algal bloom isoften associated with fish-kill. Samples were collectedfrom PU lake in January (non-algal bloom condition)and March 2018 (fish kill was reported on 21 March2018 [35]) at 10 locations (Fig. 3a). Likewise, sampleswere collected from UL lake in January 2018 and June2018 (fish kill reported on 30 May 2018) at 6 locations(Fig. 3b). At SK and NG lakes, fish kill was not reportedduring the study period and hence the lakes were not re-
Fig. 2 Variation of physico-chemical parameters with depth of (a) Ulsoor lake (b) Puttenahalli lake and (c) Nagawara lake
Rao et al. Sustainable Environment Research (2020) 30:8 Page 4 of 16
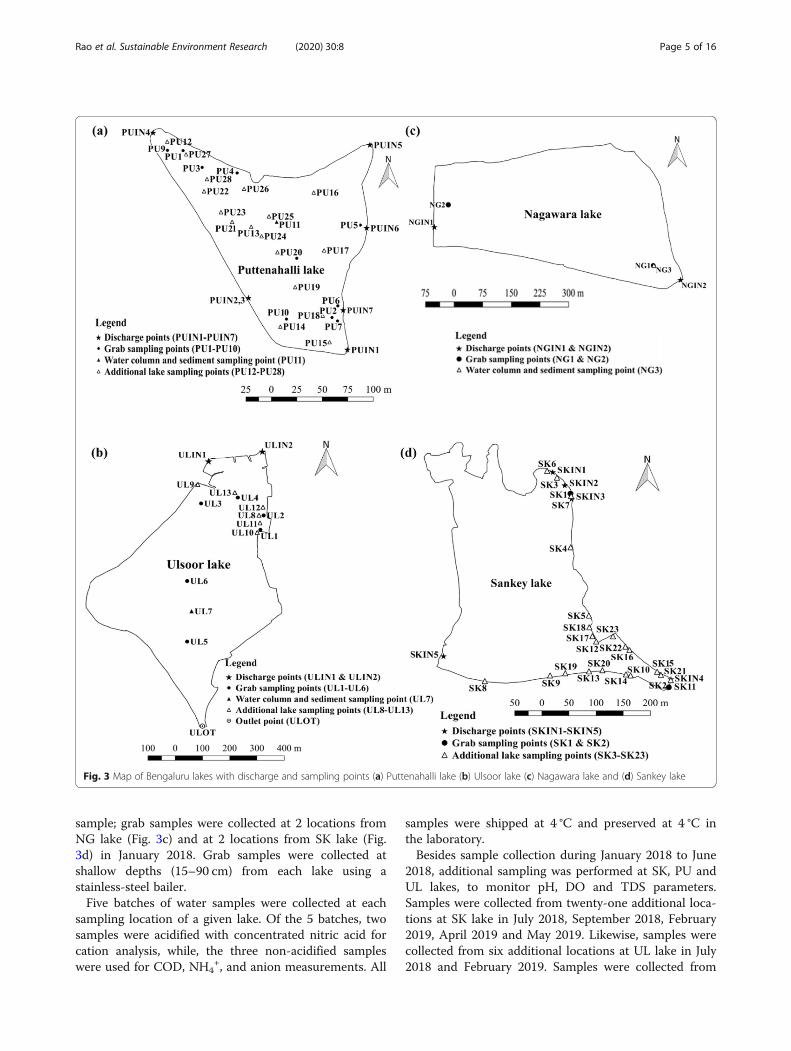
sample; grab samples were collected at 2 locations fromNG lake (Fig. 3c) and at 2 locations from SK lake (Fig.3d) in January 2018. Grab samples were collected atshallow depths (15–90 cm) from each lake using astainless-steel bailer.Five batches of water samples were collected at each
sampling location of a given lake. Of the 5 batches, twosamples were acidified with concentrated nitric acid forcation analysis, while, the three non-acidified sampleswere used for COD, NH4
+, and anion measurements. All
samples were shipped at 4 °C and preserved at 4 °C inthe laboratory.Besides sample collection during January 2018 to June
2018, additional sampling was performed at SK, PU andUL lakes, to monitor pH, DO and TDS parameters.Samples were collected from twenty-one additional loca-tions at SK lake in July 2018, September 2018, February2019, April 2019 and May 2019. Likewise, samples werecollected from six additional locations at UL lake in July2018 and February 2019. Samples were collected from
Fig. 3 Map of Bengaluru lakes with discharge and sampling points (a) Puttenahalli lake (b) Ulsoor lake (c) Nagawara lake and (d) Sankey lake
Rao et al. Sustainable Environment Research (2020) 30:8 Page 5 of 16
seventeen additional locations at PU lake in September2018, April 2019 and May 2019. The additional samplinglocations of PU lake (PU12 to PU28), UL lake (UL8 toUL13) and SK lake (SK3 to SK23) are included in Fig.3a, b and d respectively. Both lake and discharge sampleswere collected on dry days of the sampling period. Thestatistical distribution of measured parameters (Table 2)includes the data from additional sampling and watercolumn profile of the lakes.
Methods of analysisTests with grab and discharge samplesElectrical conductivity (EC), pH and DO contents of lakewater and discharge (PUIN1 and ULIN1) samples weremeasured in the field using portable EC, pH, and DOmeters. All other parameters were measured in the la-boratory. The EC values are represented as TDS usingan appropriate relation. The COD concentrations of thelake water and PUIN1 and ULIN1 samples were deter-mined with unfiltered samples using silver sulfate-sulfuric acid closed reflux method [38]. The otherparameters were measured with filtered (0.45-μm filter,Merck Millipore, USA) samples. The concentrations ofMg2+, Ca2+, Na+ and K+ ions and heavy metal ions (Fe2+,Mn2+, Cu2+, Pb2+, Zn2+, Al3+ and Cd2+) in the acidifiedlake water and PUIN1 and ULIN1 samples were mea-sured using atomic absorption spectrometer (ThermoAAS, ICE 3000, Thermo Fisher Scientific, Waltham,Massachusetts, USA).
The NH4+ and anion concentrations were measured
with non-acidified (filtered) samples. The SO42− ion con-
centration was measured [38] by turbidimetric methodat 420 nm absorbance using UV-Visible spectrophotom-eter (Thermo Evolution 201, Thermo Fisher Scientific,Waltham, Massachusetts, USA). The NO3
− and NH4+
ion concentrations were determined by ion-chromatograph (Dionex ICS 2000, Thermo Fisher Scien-tific, Waltham, Massachusetts, USA). The Cl− andHCO3
−/CO32− ion concentrations were determined
using automatic titrator (Metrohm Titrino Plus 877,Metrohm AG, Herisau, Switzerland). The ionic ratiomethod helps to assess the role of mineral dissolution ininfluencing the ion composition of water samples. Whenweathering and dissolution of calcite, dolomite and gyp-sum significantly contribute to the chemical compositionof water, the data points in (Ca2+ + Mg2+) versus(HCO3
− + SO42−) chart will plot on/close to the 1:1 line
[8]. Piper chart provides visualization of dominant cat-ions and anions present in water samples. The chart re-veals similarity and differences between water samplesbased on the hydrochemical facies. The z is function oflithology, solution kinetics and flow path of water [39].Chlorophyll-a (Chl-a) concentrations in lake water
samples were determined by the spectrophotometermethod [38, 40] using 5 L samples. For Chl-a determin-ation, appropriate aliquot of samples was concentratedby passing through Whatman GF/C filters. Prior to ex-traction, filters were homogenized to enhance extraction
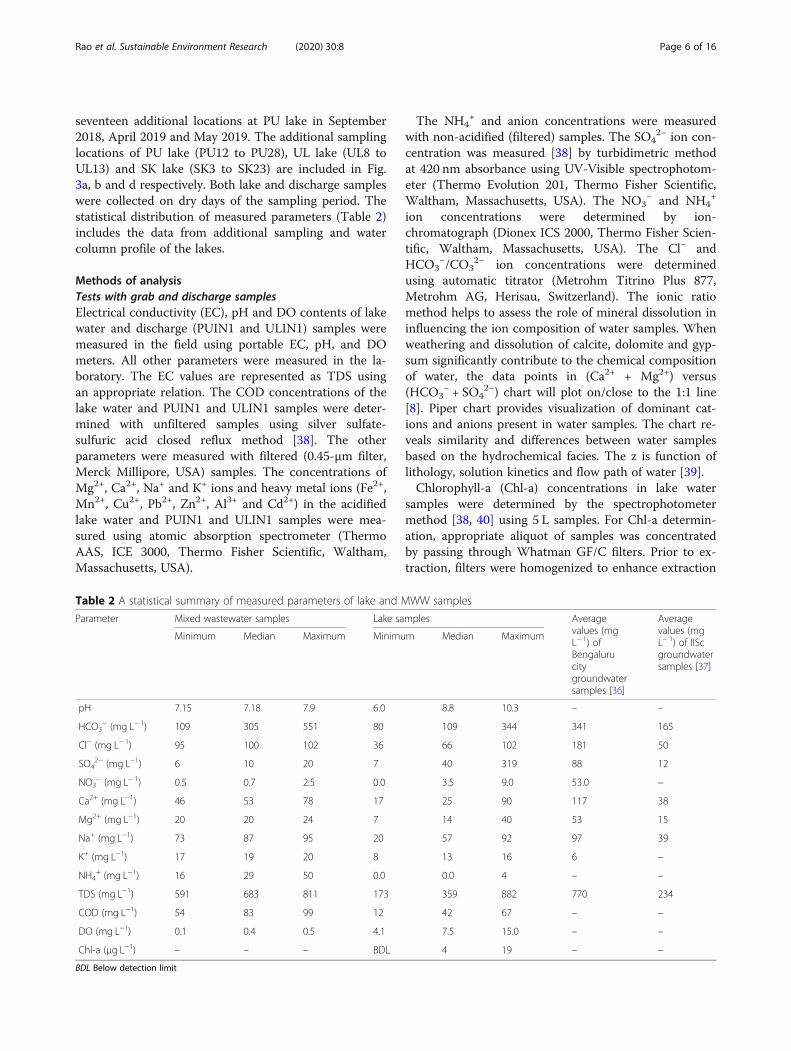
Table 2 A statistical summary of measured parameters of lake and MWW samples
Parameter Mixed wastewater samples Lake samples Averagevalues (mgL− 1) ofBengalurucitygroundwatersamples [36]
Averagevalues (mgL− 1) of IIScgroundwatersamples [37]
Minimum Median Maximum Minimum Median Maximum
pH 7.15 7.18 7.9 6.0 8.8 10.3 – –
HCO3− (mg L− 1) 109 305 551 80 109 344 341 165
Cl− (mg L− 1) 95 100 102 36 66 102 181 50
SO42− (mg L−1) 6 10 20 7 40 319 88 12
NO3− (mg L− 1) 0.5 0.7 2.5 0.0 3.5 9.0 53.0 –
Ca2+ (mg L−1) 46 53 78 17 25 90 117 38
Mg2+ (mg L−1) 20 20 24 7 14 40 53 15
Na+ (mg L−1) 73 87 95 20 57 92 97 39
K+ (mg L−1) 17 19 20 8 13 16 6 –
NH4+ (mg L−1) 16 29 50 0.0 0.0 4 – –
TDS (mg L−1) 591 683 811 173 359 882 770 234
COD (mg L−1) 54 83 99 12 42 67 – –
DO (mg L−1) 0.1 0.4 0.5 4.1 7.5 15.0 – –
Chl-a (μg L−1) – – – BDL 4 19 – –
BDL Below detection limit
Rao et al. Sustainable Environment Research (2020) 30:8 Page 6 of 16
efficiency. Extraction was performed using 90% acetonefollowed by centrifugation to produce a supernatant forspectrophotometric determination. The absorbance wasrecorded at four different wavelengths (630, 645, 665and 750 nm) for measuring Chl-a concentration. The de-tection limit of the method is 0.02 μg L− 1. Trophic stateindex (TSI) based on Chl-a concentration is calculatedto assess lake’s trophic state in the terms of algal prod-uctivity. Trophic state indicates anthropogenic influenceon water quality and the ecological functioning of lakes.The scale of TSI ranges from 0 to 100. Each major div-ision represents a doubling in algal biomass. The indexnumber can be calculated from any of several parame-ters, including Secchi disk transparency, chlorophyll, andtotal phosphorus [41].The COD concentrations of PUIN1 (treated sewage)
and ULIN1 (stormwater runoff) samples (Table 2) rangefrom 54 to 99 mg L− 1 (median = 83 mg L− 1). The DOconcentrations range from 0.10 to 0.48 mg L− 1 (me-dian = 0.42 mg L− 1) and NH4
+ ion concentrations rangefrom 16 to 50mg L− 1 (median = 29mg L− 1). The anoxicnature of the samples hindered the oxidation of NH4
+
ions resulting in low concentrations of NO3− ions. Based
on the COD, DO and NH4+ concentrations, the storm-
water runoffs and treated sewage discharging into theBengaluru lakes are referred as mixed wastewater(MWW) in further discussions.
Tests with sediment samplesThe gravimetric moisture content of the sediments wasdetermined by oven-drying them at 105 °C for 24 h. Theorganic matter of the sediments was determined byWalkley Black method. The EC was determined by agi-tating the sediments with ultra-pure water (sediment:water ratio = 1:2.5) for 60 min. After centrifugation, theEC of supernatant was measured and converted to TDSvalues. Water leaching tests were performed with thelake sediments in accordance with ASTM procedure[42]. The water leachate was examined for Ca2+, Mg2+,Na+, K+, Cl−, HCO3
−and SO4− ions by the previously de-
scribed procedures.The sediment residue from water leaching test was ag-
itated again with ultra-pure water (200 mL) for 2 h to re-move residual salts. The suspension was centrifuged,and the EC of the washings ranged between 25 and 45μS cm− 1. The exchangeable cation content of the moist-washed residue was determined using ammonium acet-ate extraction method [43]. The concentrations of dis-placed Ca2+, Mg2+, Na+, K+ ions in the ammoniumacetate extracts were estimated using atomic absorptionspectrometer. Corrections were applied for residual cat-ion concentrations persisting in the moist-washedsediments.
Results and discussionChemical composition of lake water samplesTable 2 summarizes the statistical distribution of chem-ical parameters of the lake and MWW samples. The lakesamples are characterized with median pH of 8.8. Themedian cation concentrations of the lake samples varyas: Na+ > Ca2+ >Mg2+ ≈ K+ > NH4
+. Likewise, the mediananion concentrations vary as: HCO3
− > Cl− > SO42− >
NO3−. The lake samples showed measurable concentra-
tions of Al3+ and Zn2+ ions, while, the strengths of otherheavy metal ions (Fe2+, Mn2+, Cu2+, Pb2+ and Cd2+) werebelow the detection limit of the instrument (< 0.01 mgL− 1). The Al3+ ion concentrations in the lake samplesranged from 0.14 to 0.39 mg L− 1; further, the Al3+ ionconcentrations of twelve samples were greater than itspermissible limit [44] in drinking water (0.2 mg L− 1).The MWW samples did not show the presence of Al3+
ions. It is hence likely that dissolution of oxide coatingson particle surfaces and/or dissolution of mineral par-ticle edges by humic acid are possibly responsible forpresence of Al3+ ions in the lake samples [45]. The Zn2+
ion concentrations in the lake samples ranged from0.011 to 0.081 mg L− 1 and are below the permissiblelimit in drinking water [15 mg L− 1; 44]. Comparatively,the Zn2+ ion concentrations in the MWW samplesranged between 0.032 to 0.035 mg L− 1.
Multiple correlation analysisThe lake water data was analysed for multiple correla-tions among the measured variables (Table 3). Thestrong positive correlation between DO and pH (R =0.74) is attributed to the production of DO and OH−
ions during intense photosynthesis activity. Likewise, thestrong negative correlation (R = − 0.72) between pH andHCO3
− ions arises from bicarbonate consumption andrelease of OH− ions during intense algal photosyntheticactivity [19, 22]. The strong negative correlation betweenCa2+ and Mg2+ ion concentrations with pH (R = − 0.64to − 0.62) apparently arise as the alkaline pH reduces thedivalent cation concentrations from carbonate precipita-tion reactions (discussed in section 4.3.2). The strongpositive correlation (R = 0.69) between pH and CO3
2−
ions is attributed to HCO3− to CO3
2− transformation inthe alkaline pH environment (pH ≥ 8.35). The strongcorrelation between Ca2+ and HCO3
− ions arises fromtheir tendency to form calcium carbonate in an alkalinepH environment. The strong correlation between Ca2+
and SO42− ions is attributed to dissolution of anthropo-
genic gypsum. The positive correlation between Chl-aand pH (R = 0.74) supports the hypothesis that algalphotosynthesis renders the lake water alkaline. The posi-tive correlation between Chl-a and DO (R = 0.59) is at-tributed to production of DO by photosynthetic algae.The negative correlation between Chl-a and HCO3
− ions
Rao et al. Sustainable Environment Research (2020) 30:8 Page 7 of 16
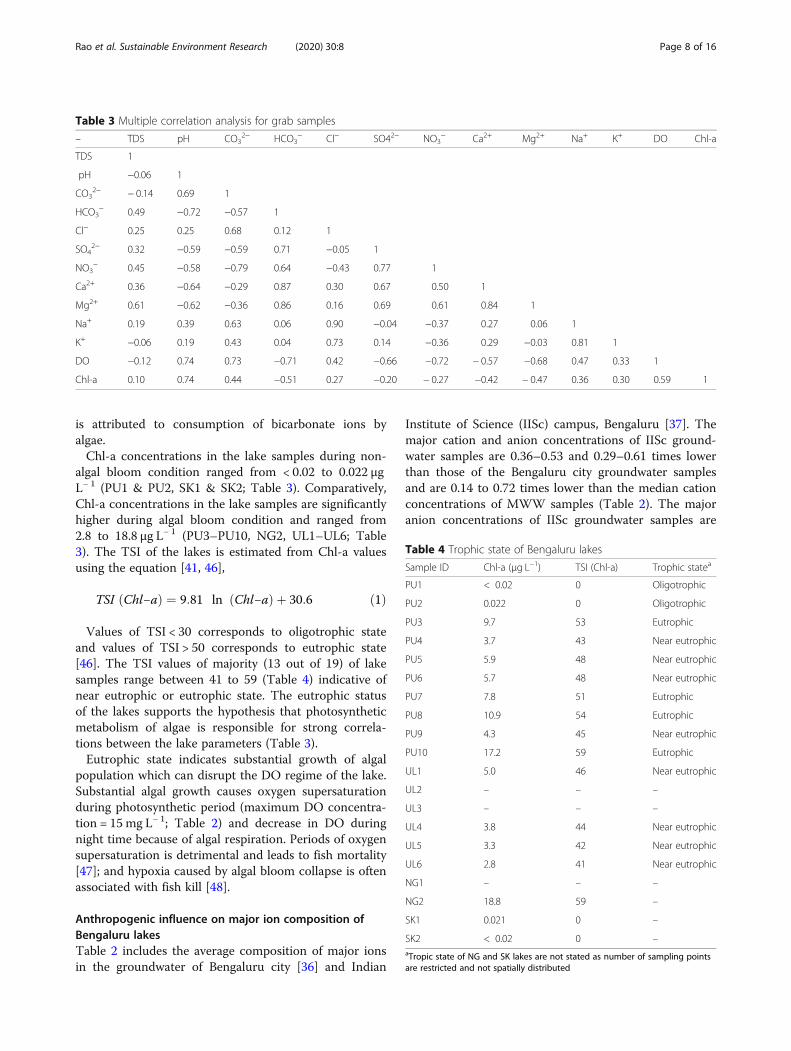
is attributed to consumption of bicarbonate ions byalgae.Chl-a concentrations in the lake samples during non-
algal bloom condition ranged from < 0.02 to 0.022 μgL− 1 (PU1 & PU2, SK1 & SK2; Table 3). Comparatively,Chl-a concentrations in the lake samples are significantlyhigher during algal bloom condition and ranged from2.8 to 18.8 μg L− 1 (PU3–PU10, NG2, UL1–UL6; Table3). The TSI of the lakes is estimated from Chl-a valuesusing the equation [41, 46],
TSI Chl−að Þ ¼ 9:81 ln Chl−að Þ þ 30:6 ð1Þ
Values of TSI < 30 corresponds to oligotrophic stateand values of TSI > 50 corresponds to eutrophic state[46]. The TSI values of majority (13 out of 19) of lakesamples range between 41 to 59 (Table 4) indicative ofnear eutrophic or eutrophic state. The eutrophic statusof the lakes supports the hypothesis that photosyntheticmetabolism of algae is responsible for strong correla-tions between the lake parameters (Table 3).Eutrophic state indicates substantial growth of algal
population which can disrupt the DO regime of the lake.Substantial algal growth causes oxygen supersaturationduring photosynthetic period (maximum DO concentra-tion = 15 mg L− 1; Table 2) and decrease in DO duringnight time because of algal respiration. Periods of oxygensupersaturation is detrimental and leads to fish mortality[47]; and hypoxia caused by algal bloom collapse is oftenassociated with fish kill [48].
Anthropogenic influence on major ion composition ofBengaluru lakesTable 2 includes the average composition of major ionsin the groundwater of Bengaluru city [36] and Indian
Institute of Science (IISc) campus, Bengaluru [37]. Themajor cation and anion concentrations of IISc ground-water samples are 0.36–0.53 and 0.29–0.61 times lowerthan those of the Bengaluru city groundwater samplesand are 0.14 to 0.72 times lower than the median cationconcentrations of MWW samples (Table 2). The majoranion concentrations of IISc groundwater samples are
Table 3 Multiple correlation analysis for grab samples
– TDS pH CO32− HCO3
− Cl− SO42− NO3− Ca2+ Mg2+ Na+ K+ DO Chl-a
TDS 1
pH −0.06 1
CO32− − 0.14 0.69 1
HCO3− 0.49 −0.72 −0.57 1
Cl− 0.25 0.25 0.68 0.12 1
SO42− 0.32 −0.59 −0.59 0.71 −0.05 1
NO3− 0.45 −0.58 −0.79 0.64 −0.43 0.77 1
Ca2+ 0.36 −0.64 −0.29 0.87 0.30 0.67 0.50 1
Mg2+ 0.61 −0.62 −0.36 0.86 0.16 0.69 0.61 0.84 1
Na+ 0.19 0.39 0.63 0.06 0.90 −0.04 −0.37 0.27 0.06 1
K+ −0.06 0.19 0.43 0.04 0.73 0.14 −0.36 0.29 −0.03 0.81 1
DO −0.12 0.74 0.73 −0.71 0.42 −0.66 −0.72 − 0.57 −0.68 0.47 0.33 1
Chl-a 0.10 0.74 0.44 −0.51 0.27 −0.20 − 0.27 −0.42 − 0.47 0.36 0.30 0.59 1
Table 4 Trophic state of Bengaluru lakes
Sample ID Chl-a (μg L−1) TSI (Chl-a) Trophic statea
PU1 < 0.02 0 Oligotrophic
PU2 0.022 0 Oligotrophic
PU3 9.7 53 Eutrophic
PU4 3.7 43 Near eutrophic
PU5 5.9 48 Near eutrophic
PU6 5.7 48 Near eutrophic
PU7 7.8 51 Eutrophic
PU8 10.9 54 Eutrophic
PU9 4.3 45 Near eutrophic
PU10 17.2 59 Eutrophic
UL1 5.0 46 Near eutrophic
UL2 – – –
UL3 – – –
UL4 3.8 44 Near eutrophic
UL5 3.3 42 Near eutrophic
UL6 2.8 41 Near eutrophic
NG1 – – –
NG2 18.8 59 –
SK1 0.021 0 –
SK2 < 0.02 0 –aTropic state of NG and SK lakes are not stated as number of sampling pointsare restricted and not spatially distributed
Rao et al. Sustainable Environment Research (2020) 30:8 Page 8 of 16
0.50 to 0.55 times lower than the median anion concen-trations of MWW samples. The SO4
2− concentrations ofIISc groundwater samples and MWW samples are how-ever comparable (10 and 11.5 mg L− 1).Besides K+ and Na+ ions, the concentrations of Ca2+,
Mg2+, Cl−, SO42− and HCO3
− ions in Bengaluru citygroundwater samples are higher than the median MWWvalues (Table 2). The groundwater in IISc campus is un-polluted as there is no wastewater contamination on thecampus. The major ion composition of IISc groundwatersamples is considered as representative of non-pollutedwater source in Bengaluru city. Lithology, weathering ofdrainage catchment, and rainwater contribute 57 to 98%of Ca2+, Mg2+, Na+, K+, HCO3
−, SO42− and Cl− ion con-
centrations of unpolluted water source; human activitycontributes the remaining 2 to 43% [49]. Geogenic andanthropogenic contributions to the major ion compos-ition of the two sets of groundwater samples are com-pared in Table 5. The anthropogenic component ratio iscalculated as:
Anthropogenic ratio ¼ Anthro component of Bengaluru city groundwater−Anthro component of IISc groundwaterAnthro component of IISc groundwater
� 100%
ð2Þ
The ratios (Table 5) indicate that anthropogeniccomponent of Bengaluru city groundwater samples is540 to 5333% larger than the corresponding compo-nent of IISc groundwater samples. The total annualrainfall of Bengaluru city is 831 mm. The aquiferdepths in Bengaluru city range from 3.12 to 21.35 mduring monsoon (median value = 7.07 m) and rangefrom 4.8 to 22.01 in the post-pre-monsoon season(median value = 9.8 m) [30]. The main rock formationin the study area is the peninsular gneiss complex,represented by mafic gneiss, biotite gneiss, granodio-ritic gneiss with intrusions like dykes, and pegmatite.Physical and chemical weathering of the parent rocksform overburden material of varying thickness be-tween the surface and the aquifer. The drainage
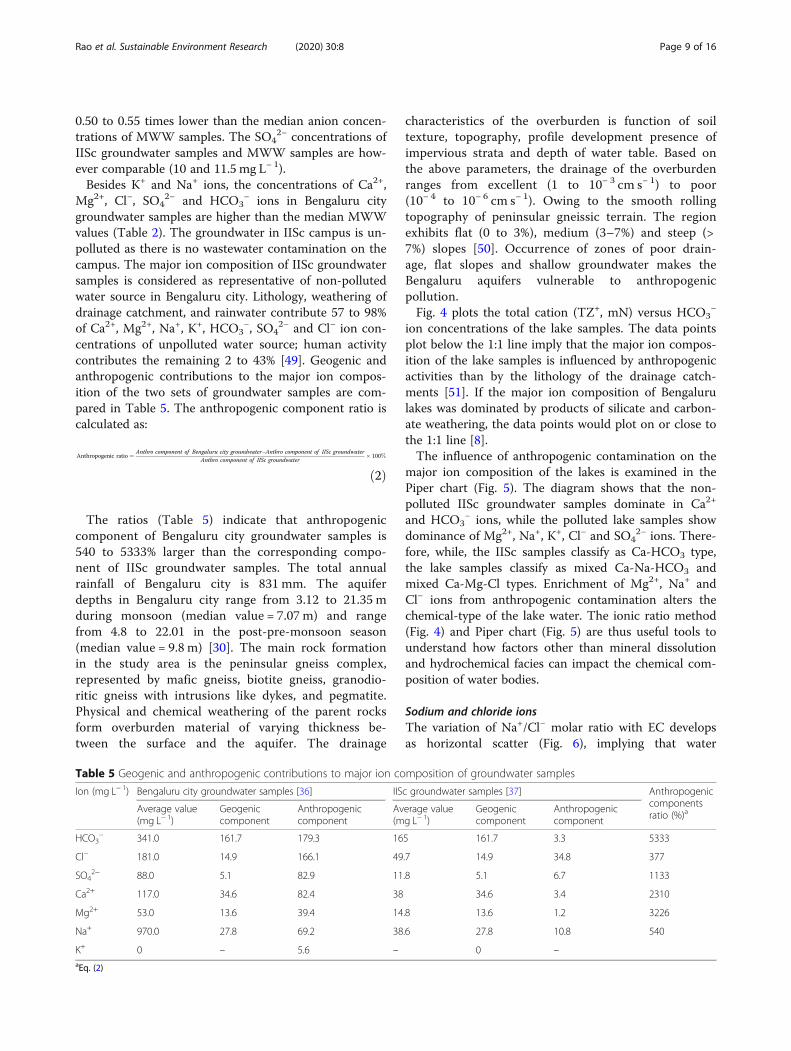
characteristics of the overburden is function of soiltexture, topography, profile development presence ofimpervious strata and depth of water table. Based onthe above parameters, the drainage of the overburdenranges from excellent (1 to 10− 3 cm s− 1) to poor(10− 4 to 10− 6 cm s− 1). Owing to the smooth rollingtopography of peninsular gneissic terrain. The regionexhibits flat (0 to 3%), medium (3–7%) and steep (>7%) slopes [50]. Occurrence of zones of poor drain-age, flat slopes and shallow groundwater makes theBengaluru aquifers vulnerable to anthropogenicpollution.Fig. 4 plots the total cation (TZ+, mN) versus HCO3
−
ion concentrations of the lake samples. The data pointsplot below the 1:1 line imply that the major ion compos-ition of the lake samples is influenced by anthropogenicactivities than by the lithology of the drainage catch-ments [51]. If the major ion composition of Bengalurulakes was dominated by products of silicate and carbon-ate weathering, the data points would plot on or close tothe 1:1 line [8].The influence of anthropogenic contamination on the
major ion composition of the lakes is examined in thePiper chart (Fig. 5). The diagram shows that the non-polluted IISc groundwater samples dominate in Ca2+
and HCO3− ions, while the polluted lake samples show
dominance of Mg2+, Na+, K+, Cl− and SO42− ions. There-
fore, while, the IISc samples classify as Ca-HCO3 type,the lake samples classify as mixed Ca-Na-HCO3 andmixed Ca-Mg-Cl types. Enrichment of Mg2+, Na+ andCl− ions from anthropogenic contamination alters thechemical-type of the lake water. The ionic ratio method(Fig. 4) and Piper chart (Fig. 5) are thus useful tools tounderstand how factors other than mineral dissolutionand hydrochemical facies can impact the chemical com-position of water bodies.
Sodium and chloride ionsThe variation of Na+/Cl− molar ratio with EC developsas horizontal scatter (Fig. 6), implying that water
Table 5 Geogenic and anthropogenic contributions to major ion composition of groundwater samples
Ion (mg L− 1) Bengaluru city groundwater samples [36] IISc groundwater samples [37] Anthropogeniccomponentsratio (%)a
Average value(mg L− 1)
Geogeniccomponent
Anthropogeniccomponent
Average value(mg L− 1)
Geogeniccomponent
Anthropogeniccomponent
HCO3− 341.0 161.7 179.3 165 161.7 3.3 5333
Cl− 181.0 14.9 166.1 49.7 14.9 34.8 377
SO42− 88.0 5.1 82.9 11.8 5.1 6.7 1133
Ca2+ 117.0 34.6 82.4 38 34.6 3.4 2310
Mg2+ 53.0 13.6 39.4 14.8 13.6 1.2 3226
Na+ 970.0 27.8 69.2 38.6 27.8 10.8 540
K+ 0 – 5.6 – 0 –aEq. (2)
Rao et al. Sustainable Environment Research (2020) 30:8 Page 9 of 16
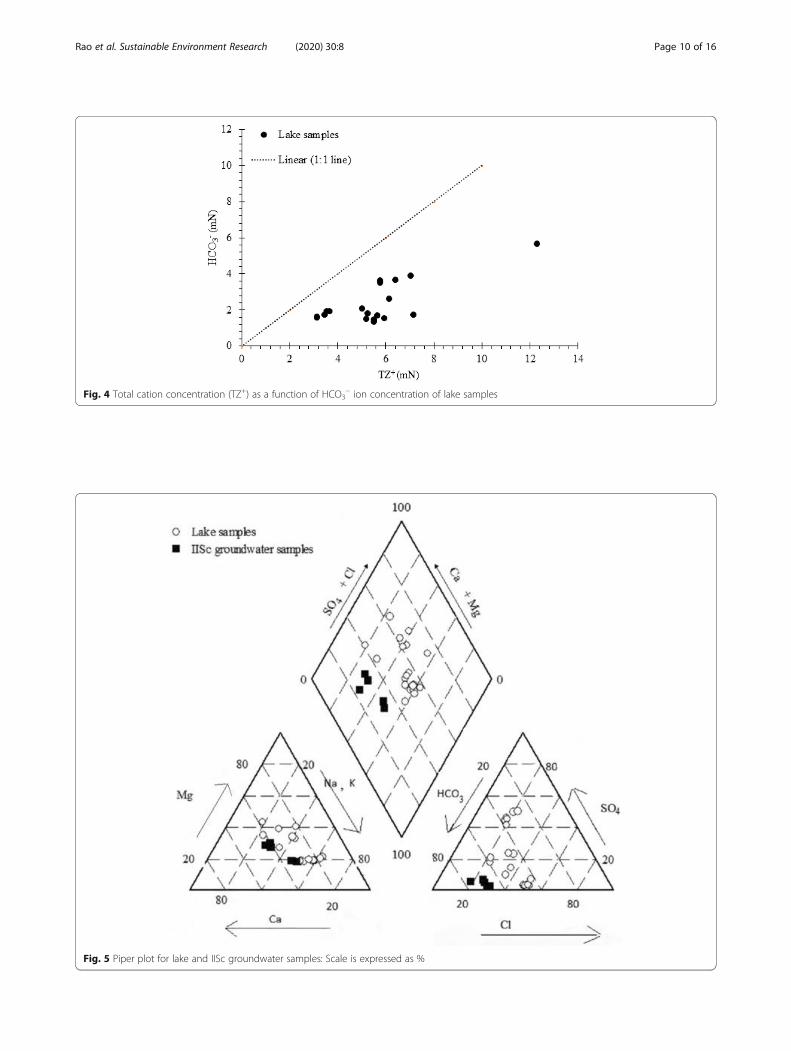
Fig. 4 Total cation concentration (TZ+) as a function of HCO3− ion concentration of lake samples
Fig. 5 Piper plot for lake and IISc groundwater samples: Scale is expressed as %
Rao et al. Sustainable Environment Research (2020) 30:8 Page 10 of 16
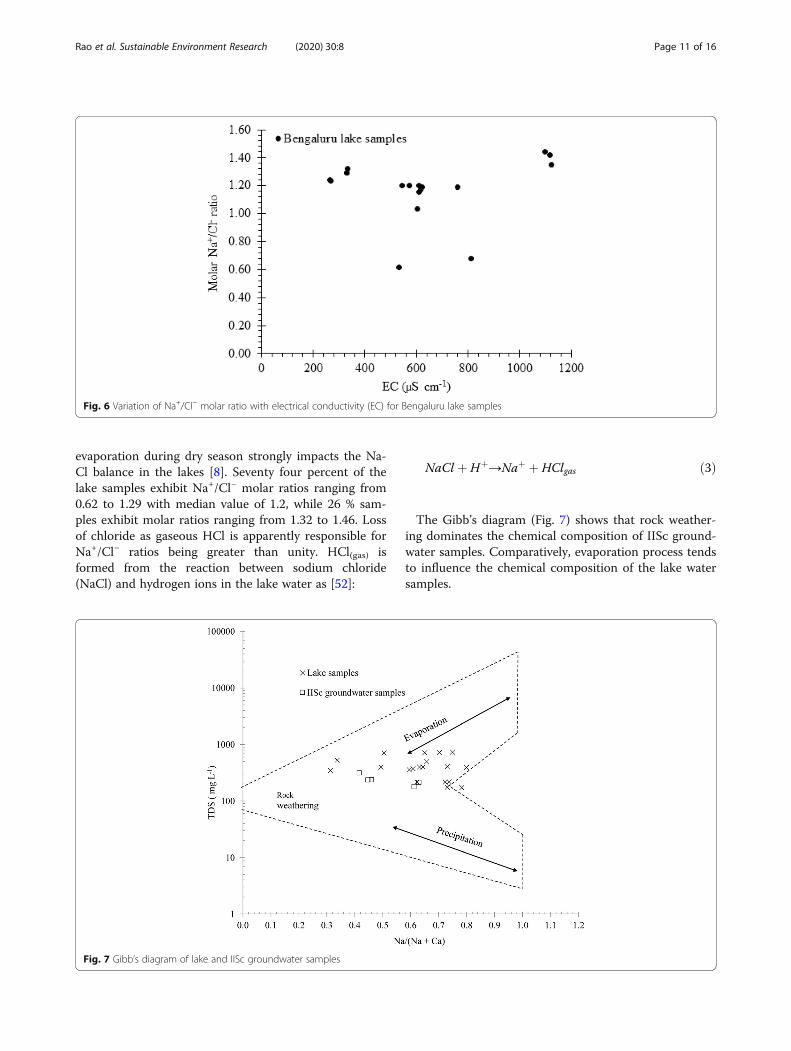
evaporation during dry season strongly impacts the Na-Cl balance in the lakes [8]. Seventy four percent of thelake samples exhibit Na+/Cl− molar ratios ranging from0.62 to 1.29 with median value of 1.2, while 26 % sam-ples exhibit molar ratios ranging from 1.32 to 1.46. Lossof chloride as gaseous HCl is apparently responsible forNa+/Cl− ratios being greater than unity. HCl(gas) isformed from the reaction between sodium chloride(NaCl) and hydrogen ions in the lake water as [52]:
NaCl þ Hþ→Naþ þ HClgas ð3Þ
The Gibb’s diagram (Fig. 7) shows that rock weather-ing dominates the chemical composition of IISc ground-water samples. Comparatively, evaporation process tendsto influence the chemical composition of the lake watersamples.
Fig. 6 Variation of Na+/Cl− molar ratio with electrical conductivity (EC) for Bengaluru lake samples
Fig. 7 Gibb’s diagram of lake and IISc groundwater samples
Rao et al. Sustainable Environment Research (2020) 30:8 Page 11 of 16
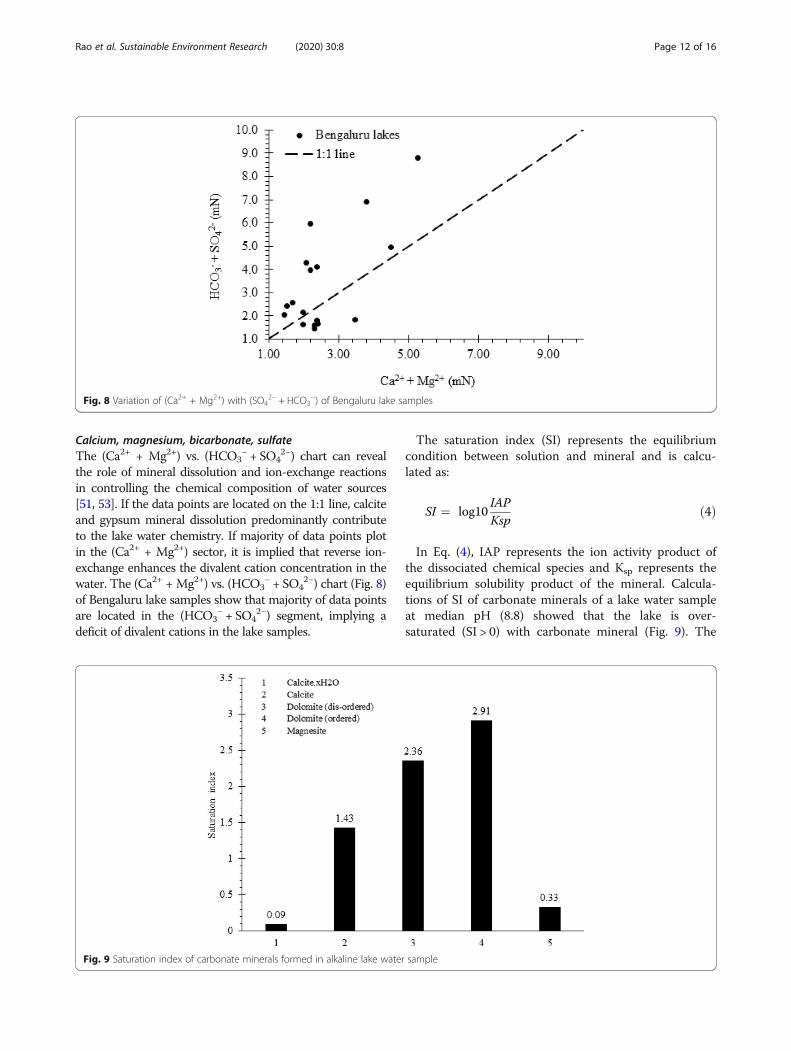
Calcium, magnesium, bicarbonate, sulfateThe (Ca2+ + Mg2+) vs. (HCO3
− + SO42−) chart can reveal
the role of mineral dissolution and ion-exchange reactionsin controlling the chemical composition of water sources[51, 53]. If the data points are located on the 1:1 line, calciteand gypsum mineral dissolution predominantly contributeto the lake water chemistry. If majority of data points plotin the (Ca2+ + Mg2+) sector, it is implied that reverse ion-exchange enhances the divalent cation concentration in thewater. The (Ca2+ + Mg2+) vs. (HCO3
− + SO42−) chart (Fig. 8)
of Bengaluru lake samples show that majority of data pointsare located in the (HCO3
− + SO42−) segment, implying a
deficit of divalent cations in the lake samples.
The saturation index (SI) represents the equilibriumcondition between solution and mineral and is calcu-lated as:
SI ¼ log10IAPKsp
ð4Þ
In Eq. (4), IAP represents the ion activity product ofthe dissociated chemical species and Ksp represents theequilibrium solubility product of the mineral. Calcula-tions of SI of carbonate minerals of a lake water sampleat median pH (8.8) showed that the lake is over-saturated (SI > 0) with carbonate mineral (Fig. 9). The
Fig. 8 Variation of (Ca2+ + Mg2+) with (SO42− + HCO3
−) of Bengaluru lake samples
Fig. 9 Saturation index of carbonate minerals formed in alkaline lake water sample
Rao et al. Sustainable Environment Research (2020) 30:8 Page 12 of 16
deficiency of divalent cations in the lakes is attributed totheir precipitation as carbonate minerals (Fig. 9) andion-exchange reactions between monovalent ions of sed-iments and divalent cations in lake water (discussed insection 4.4). Precipitation and ion-exchange reactions in-creases the relative proportion of Na+ to Ca2+ ions (me-dian value of ratio = 1.61) in the lake samples.The Ca2+/Mg2+ molar ratios of the lake water samples
ranged between 0.52 and 0.88 for 37% of the samples andexceeded unity (1.07 to 1.62) for the remaining samples.Dissolution of anthropogenic gypsum [11] apparently con-tributed to the presence of excess Ca2+ ions causing theCa2+/Mg2+ molar ratio to exceed unity in many lake sam-ples. In addition, release of SO4
2− ions from gypsum dis-solution is possibly responsible for the higher anionconcentration (median value = 40mg L− 1) in the lakesthan in the MWW samples (median value = 20mg L− 1).About 26,192 gypsum idols were immersed in differentlakes of Bengaluru city in 2017 and 2018 [54].Besides anthropogenic gypsum dissolution, SO4
2− ionconcentration in the lakes is contributed by rainwater(3.9 mg L− 1, [55]) and MWW contamination. Assumingthat the (i) SO4
2− ions in lake water are in equilibriumwith ions trapped in the pore solution of the sedimentsand (ii) dilution effects is balanced by enrichment of theanion concentration from evaporation, it follows that:
SO4 concentration from gyspum dissolution
¼ Median SO4 concentration in lakesð Þ
−ðMedian SO4 concentration in MWW
þMean SO4 concentration in rainwaterÞ ¼ 40− 20þ 3:9ð Þ ¼ 16:1 mg L−1
ð5Þ
Mass balance calculations indicate that SO42− ions
produced from gypsum dissolution (16.1 mg L−1) wouldrelease 6.7 mg L−1 of Ca2+ ions to the lakes. The median
Ca2+ ion concentration (24.5 mg L−1) in the lake samples(Table 2) indicates that gypsum dissolution contributedto 27% of available Ca2+ ion concentration in the lakesamples; the reminder (73%) is attributed to contribu-tions from MWW contamination and lithology ofcatchments.
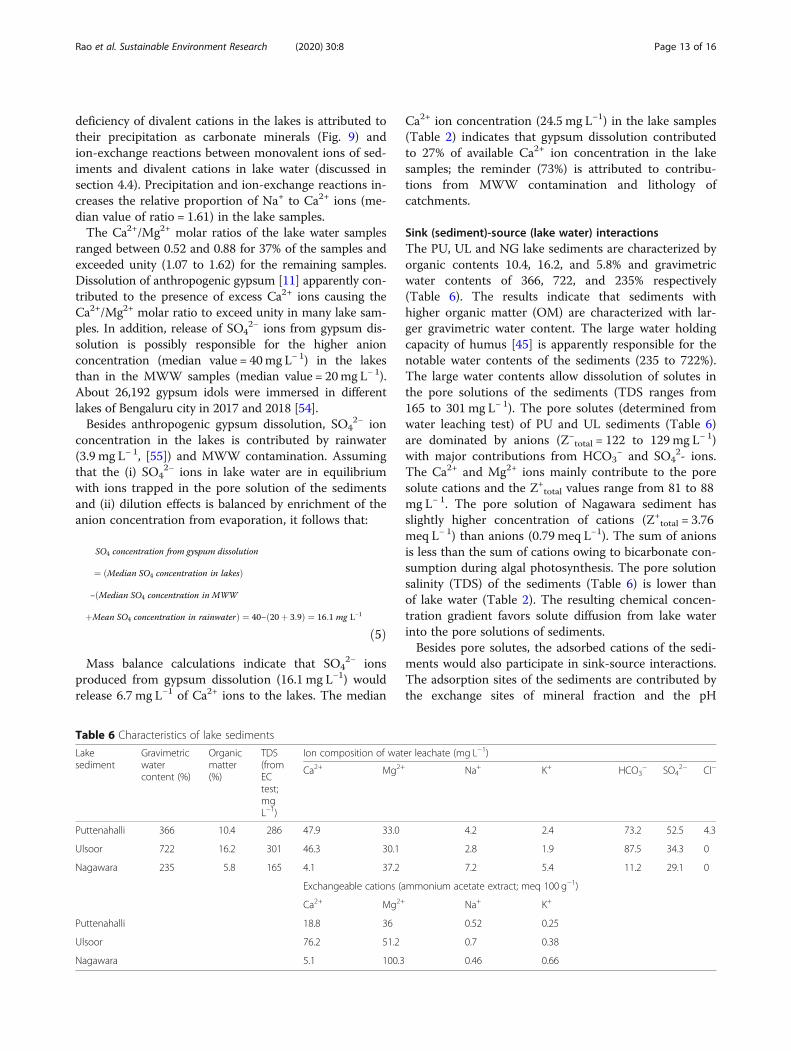
Sink (sediment)-source (lake water) interactionsThe PU, UL and NG lake sediments are characterized byorganic contents 10.4, 16.2, and 5.8% and gravimetricwater contents of 366, 722, and 235% respectively(Table 6). The results indicate that sediments withhigher organic matter (OM) are characterized with lar-ger gravimetric water content. The large water holdingcapacity of humus [45] is apparently responsible for thenotable water contents of the sediments (235 to 722%).The large water contents allow dissolution of solutes inthe pore solutions of the sediments (TDS ranges from165 to 301 mg L− 1). The pore solutes (determined fromwater leaching test) of PU and UL sediments (Table 6)are dominated by anions (Z−
total = 122 to 129 mg L− 1)with major contributions from HCO3
− and SO42- ions.
The Ca2+ and Mg2+ ions mainly contribute to the poresolute cations and the Z+
total values range from 81 to 88mg L− 1. The pore solution of Nagawara sediment hasslightly higher concentration of cations (Z+
total = 3.76meq L− 1) than anions (0.79 meq L−1). The sum of anionsis less than the sum of cations owing to bicarbonate con-sumption during algal photosynthesis. The pore solutionsalinity (TDS) of the sediments (Table 6) is lower thanof lake water (Table 2). The resulting chemical concen-tration gradient favors solute diffusion from lake waterinto the pore solutions of sediments.Besides pore solutes, the adsorbed cations of the sedi-
ments would also participate in sink-source interactions.The adsorption sites of the sediments are contributed bythe exchange sites of mineral fraction and the pH
Table 6 Characteristics of lake sediments
Lakesediment
Gravimetricwatercontent (%)
Organicmatter(%)
TDS(fromECtest;mgL−1)
Ion composition of water leachate (mg L−1)
Ca2+ Mg2+ Na+ K+ HCO3− SO4
2− Cl−
Puttenahalli 366 10.4 286 47.9 33.0 4.2 2.4 73.2 52.5 4.3
Ulsoor 722 16.2 301 46.3 30.1 2.8 1.9 87.5 34.3 0
Nagawara 235 5.8 165 4.1 37.2 7.2 5.4 11.2 29.1 0
Exchangeable cations (ammonium acetate extract; meq 100 g−1)
Ca2+ Mg2+ Na+ K+
Puttenahalli 18.8 36 0.52 0.25
Ulsoor 76.2 51.2 0.7 0.38
Nagawara 5.1 100.3 0.46 0.66
Rao et al. Sustainable Environment Research (2020) 30:8 Page 13 of 16
dependent sites of the humus fraction of organic matter[45, 56]. The ammonium acetate extracts of the sedi-ments (Table 6) dominated in Ca2+ and Mg2+ ions(Z(Ca +Mg) exchangeable = 55 to 127 meq 100 g− 1). The cat-ion exchange capacity (CEC) of Bengaluru soils rangefrom 1.9 to 22meq 100 g− 1 with median value of 12.8meq 100 g− 1 [29]. The sum of exchangeable cations(Z+
exchangeable) of the lake sediments range from 55.6 to128.5 meq 100 g− 1 which is > CEC of Bengaluru soils.The results suggest that in addition to the inorganicmineral fraction, the organic coatings on the lake sedi-ments significantly contribute to their exchangeable cat-ion content. The carboxyl, phenolic-OH, amino andcarbonyl groups of the humic and non-humic substancesin lake sediments develop pH dependent charges andsignificantly contribute to the cation adsorption sites[45, 56]. Ion-exchange reactions between adsorbed Na+
and K+ ions of lake sediments with Ca2+ and Mg2+ ionsof lake water possibly enriched the adsorbed divalentcation content of sediment particles as [57]:
2NaX þ Ca2þ→2Naþ þ CaX2 ð6Þ
The ion-exchange reaction (Eq. 6) would also contrib-ute to depletion of divalent cation concentration in thelakes.
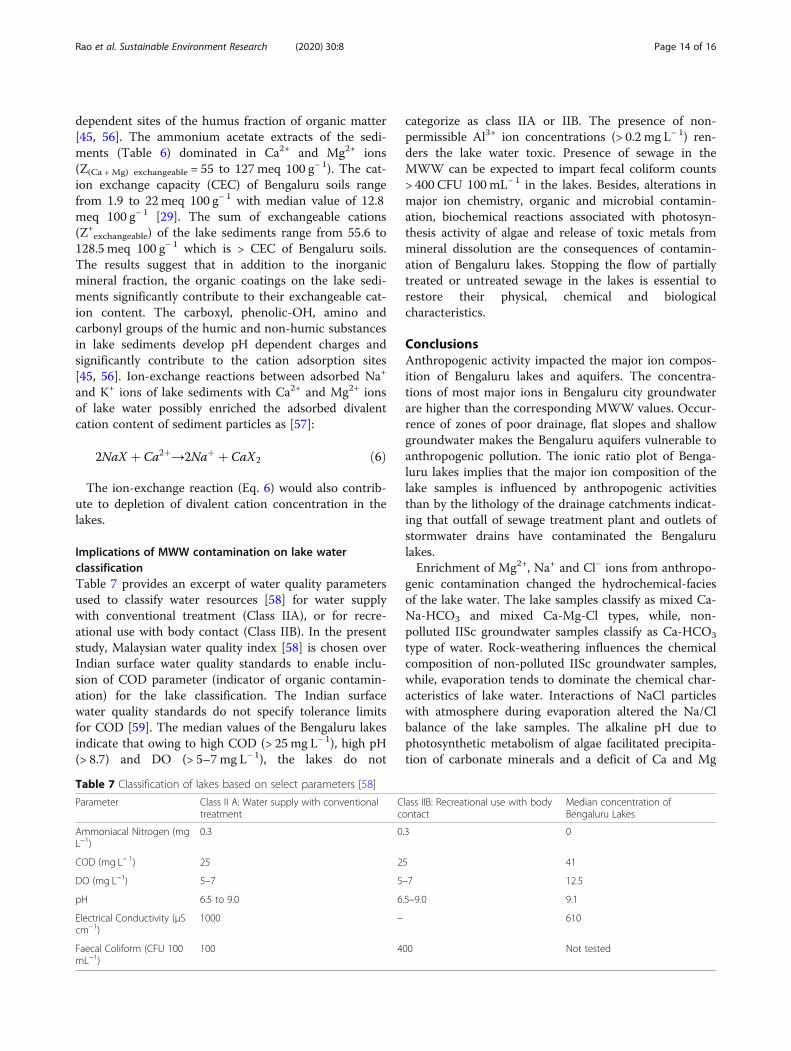
Implications of MWW contamination on lake waterclassificationTable 7 provides an excerpt of water quality parametersused to classify water resources [58] for water supplywith conventional treatment (Class IIA), or for recre-ational use with body contact (Class IIB). In the presentstudy, Malaysian water quality index [58] is chosen overIndian surface water quality standards to enable inclu-sion of COD parameter (indicator of organic contamin-ation) for the lake classification. The Indian surfacewater quality standards do not specify tolerance limitsfor COD [59]. The median values of the Bengaluru lakesindicate that owing to high COD (> 25mg L− 1), high pH(> 8.7) and DO (> 5–7mg L− 1), the lakes do not
categorize as class IIA or IIB. The presence of non-permissible Al3+ ion concentrations (> 0.2 mg L− 1) ren-ders the lake water toxic. Presence of sewage in theMWW can be expected to impart fecal coliform counts> 400 CFU 100mL− 1 in the lakes. Besides, alterations inmajor ion chemistry, organic and microbial contamin-ation, biochemical reactions associated with photosyn-thesis activity of algae and release of toxic metals frommineral dissolution are the consequences of contamin-ation of Bengaluru lakes. Stopping the flow of partiallytreated or untreated sewage in the lakes is essential torestore their physical, chemical and biologicalcharacteristics.
ConclusionsAnthropogenic activity impacted the major ion compos-ition of Bengaluru lakes and aquifers. The concentra-tions of most major ions in Bengaluru city groundwaterare higher than the corresponding MWW values. Occur-rence of zones of poor drainage, flat slopes and shallowgroundwater makes the Bengaluru aquifers vulnerable toanthropogenic pollution. The ionic ratio plot of Benga-luru lakes implies that the major ion composition of thelake samples is influenced by anthropogenic activitiesthan by the lithology of the drainage catchments indicat-ing that outfall of sewage treatment plant and outlets ofstormwater drains have contaminated the Bengalurulakes.Enrichment of Mg2+, Na+ and Cl− ions from anthropo-
genic contamination changed the hydrochemical-faciesof the lake water. The lake samples classify as mixed Ca-Na-HCO3 and mixed Ca-Mg-Cl types, while, non-polluted IISc groundwater samples classify as Ca-HCO3
type of water. Rock-weathering influences the chemicalcomposition of non-polluted IISc groundwater samples,while, evaporation tends to dominate the chemical char-acteristics of lake water. Interactions of NaCl particleswith atmosphere during evaporation altered the Na/Clbalance of the lake samples. The alkaline pH due tophotosynthetic metabolism of algae facilitated precipita-tion of carbonate minerals and a deficit of Ca and Mg
Table 7 Classification of lakes based on select parameters [58]
Parameter Class II A: Water supply with conventionaltreatment
Class IIB: Recreational use with bodycontact
Median concentration ofBengaluru Lakes
Ammoniacal Nitrogen (mgL−1)
0.3 0.3 0
COD (mg L− 1) 25 25 41
DO (mg L−1) 5–7 5–7 12.5
pH 6.5 to 9.0 6.5–9.0 9.1
Electrical Conductivity (μScm−1)
1000 – 610
Faecal Coliform (CFU 100mL−1)
100 400 Not tested
Rao et al. Sustainable Environment Research (2020) 30:8 Page 14 of 16
ions in the lakes. Ion-exchange reactions betweenadsorbed cations of lake sediments and lake water sol-utes also contributed to deficit of divalent cations in thelakes. Dissolution of anthropogenic gypsum contributedto 27% of available Ca2+ ion concentration in the lakesamples and the reminder (73%) is contributed byMWW contamination and lithology of drainage catch-ments. Besides alterations in major ion chemistry, or-ganic contamination, biochemical reactions associatedwith photosynthesis activity of algae and release of toxicAl3+ ions from chemical weathering of lake sedimentsare the consequences of lake contamination.
AcknowledgmentsThe authors thank Karnataka Tank Conservation and Development Authority,Government of Karnataka, Bruhat Bengaluru Mahanagara Palike (BengaluruMunicipal Corporation) for giving us permission to obtain samples from thelakes. The authors thank Puttenahalli Neighbourhood Lake ImprovementTrust for facilitating sampling from Puttenahalli lake.
Authors’ contributionsSudhakar Rao (SR), Priscilla A (PA), Nitish VM (NVM), Lydia A (LA) designedthe field sampling and field/laboratory measurements. PA, NVM and LAperformed the field sampling and experiments. SR, PA, NVM and LA wereinvolved in analysis and interpretation of the results. SR wrote themanuscript in consultation with PA, NVM and LA. The author(s) read andapproved the final manuscript.
FundingThe authors acknowledge Earthwatch Institute India Trust, for funding theproject on “Lakes of Bengaluru as drivers of an enriched blue-greencityscapes.”
Availability of data and materialsAll data used in the study appear in the submitted article.
Competing interestsThe authors declare that they have no competing interests.
Author details1Department of Civil Engineering, Indian Institute of Science, Bengaluru560012, India. 2Centre for Sustainable Technologies, Indian Institute ofScience, Bengaluru 560012, India.
Received: 4 July 2019 Accepted: 14 April 2020
References1. Norton SA, Brakke DF, Kahl JS, Haines TA. Major influences on lake water
chemistry in Maine. Maine Geol Surv. 1989;5:109–24.2. Roy S, Gaillardet J, Allegre CJ. Geochemistry of dissolved and suspended
loads of the seine river, France: anthropogenic impact, carbonate andsilicate weathering. Geochim Cosmochim Ac. 1999;63:1277–92.
3. Kumarasamy P, James RA, Dahms HU, Byeon CW, Ramesh R. Multivariatewater quality assessment from the Tamiraparani river basin, Southern India.Environ Earth Sci. 2014;71:2441–51.
4. Jiang LG, Yao ZJ, Liu ZF, Wang R, Wu SS. Hydrochemistry and its controllingfactors of rivers in the source region of the Yangtze River on the Tibetanplateau. J Geochem Explor. 2015;155:76–83.
5. Hem JD. Study and interpretation of the chemical characteristics of naturalwater. 3rd ed. Alexandria: US Geological Survey; 1985.
6. Meybeck M, Helmer R. The quality of rivers: from pristine stage to globalpollution. Glob Planet Chang. 1989;75:283–309.
7. Han GL, Liu CQ. Water geochemistry controlled by carbonate dissolution: astudy of the river waters draining karst-dominated terrain, GuizhouProvince, China. Chem Geol. 2004;204:1–21.
8. Barzegar R, Moghaddam AA, Tziritis E. Assessing the hydrogeochemistry andwater quality of the Aji-Chay River, northwest of Iran. Environ Earth Sci.2016;75:1486.
9. Jalali M. Geochemistry characterization of groundwater in an agriculturalarea of Razan, Hamadan, Iran. Environ Geol. 2009;56:1479–88.
10. Jeelani G, Shah AQ. Geochemical characteristics of water and sedimentfrom the dal Lake, Kashmir Himalaya: constraints on weathering andanthropogenic activity. Environ Geol. 2006;50:12–23.
11. Reddy MV, Babu KS, Balaram V, Satyanarayanan M. Assessment of the effectsof municipal sewage, immersed idols and boating on the heavy metal andother elemental pollution of surface water of the eutrophic HussainsagarLake (Hyderabad, India). Environ Monit Assess. 2012;184:1991–2000.
12. Metcalf & Eddy Inc. Wastewater engineering: treatment and resourcerecovery. 5th ed. New York: McGraw-Hill; 2014.
13. Schouw NL, Danteravanich S, Mosbaek H, Tjell JC. Composition of humanexcreta – a case study from southern Thailand. Sci Total Environ. 2002;286:155–66.
14. Nishimuta M, Inoue N, Kodama N, Morikuni E, Yoshioka YH, Matsuzaki N,et al. Moisture and mineral content of human feces – high fecal moisture isassociated with increased sodium and decreased potassium content. J NutrSci Vitaminol. 2006;52:121–6.
15. Palmquist H, Hanaeus J. Hazardous substances in separately collected grey-and Blackwater from ordinary Swedish households. Sci Total Environ. 2005;348:151–63.
16. Rose S. The effects of urbanization on the hydrochemistry of base flowwithin the Chattahoochee River basin (Georgia, USA). J Hydrol. 2007;341:42–54.
17. Bhatt MP, McDowell WH. Evolution of chemistry along the Bagmatidrainage network in Kathmandu valley. Water Air Soil Poll. 2007;185:165–76.
18. Rao SM, Arkenadan L, Mogili NV, Atishaya SK, Anthony P. Bioremediation ofpit toilet sewage. J Environ Eng Sci. 2017;12:26–33.
19. Rao SM, Arkenadan L, Mogili NV. Performance of modified twin pit toilet inMulbagal town, Karnataka, India. J Water Sanit Hyg De. 2018;8:578–84.
20. Wurts WA, Durborow RM. Interactions of pH, carbon dioxide, alkalinity andhardness in fish ponds. Stoneville: Southern Regional Aquaculture Center;1992.
21. Lopez-Archilla AI, Moreira D, Lopez-Garcia P, Guerrero C. Phytoplanktondiversity and cyanobacterial dominance in a hypereutrophic shallow lakewith biologically produced alkaline pH. Extremophiles. 2004;8:109–15.
22. Scholz M. Wetland systems to control urban runoff. 1st ed. Amsterdam:Elsevier; 2006.
23. Yu T, Xu QJ, He CD, Cong HB, Dai D, Wu FC, et al. Long-term trends in acidneutralizing capacity under increasing acidic deposition: a special exampleof eutrophic Taihu Lake, China. Environ Sci Technol. 2016;50:12660–8.
24. Hartley AM, House WA, Callow ME, Leadbeater BSC. The role of a green algain the precipitation of calcite and the coprecipitation of phosphate infreshwater. Int Rev Ges Hydrobio. 1995;80:385–401.
25. Deutsch WJ, Siegel R. Groundwater geochemistry: fundamentals andapplications to contamination. Boca Raton: CRC Press; 1997.
26. Jumbe AS, Nandini K, Tandon S, Sunitha N. Bangalore lakes-issues andperspective on pollution, restoration and management. In: 12th World LakeConference. Jaipur; 2007 Oct 28–Nov 2.
27. Shiva Kumar KV. Water quality monitoring of lakes in Bangalore. In: 12thWorld Lake Conference. Jaipur; 2007 Oct 28–Nov 2.
28. Ramachandra TV, Sincy V, Asulabha KS, Sudarshan PB, Rahaman MF.Recurring fish mortality episodes in Bangalore Lakes – sign ofirresponsible and fragmented governance. Bengaluru: Indian Institute ofScience; 2016.
29. Rao SM, Venkatesh KH. Residual soils of India. In: Huat BK, Toll DG, Prasad A,editors. Handbook of tropical residual soil engineering. Boca Raton: CRCPress; 2012. p. 463–90.
30. DMG. Groundwater Hydrology and Groundwater Quality in and aroundBangalore City. Bengaluru: Department of Mines and Geology; 2011.
31. Ramachandra TV, Vinay S, Asulabha KS, Sincy V, Sudarshan B, Durga MM,et al. Rejuvenation blueprint for lakes in Vrishabhavathi Valley. Bengaluru:Indian Institute of Science; 2017.
32. EMPRI. KLCDA-BDA lake list. Bengaluru: Environmental Management andPolicy Research Institute; 2016.
33. Ramachandra TV, Asulabha KS, Sincy V, Vinay S, Sudarshan PB, Bharath HA.Sankey Lake: waiting for an immediate sensible action. Bengaluru: IndianInstitute of Science; 2015.
Rao et al. Sustainable Environment Research (2020) 30:8 Page 15 of 16
34. PNLIT. Information on Puttenahalli Lake. Bengaluru: PuttenahalliNeighbourhood Lake Improvement Trust; 2010.
35. TOI. 150 fish die in Puttenahalli lake; residents suggest aerators. Mumbai:The Times of India; 2018.
36. Gulgundi MS, Shetty A. Groundwater quality assessment of urban Bengaluruusing multivariate statistical techniques. Appl Water Sci. 2018;8:43.
37. Rao SM. Report on water quality Management for Indian institute of science(IISc) campus. Bengaluru: Indian Institute of Science; 2009.
38. APHA. Standard methods for the examination of water and wastewater.20th ed. Washington, DC: American Public Health Association; 1998.
39. Fetter CW. Applied hydrogeology. 2nd ed. New Delhi: CBS Publishers andDistributors; 2007.
40. Parsons TR, Strickland JDH. Discussion of spectrophotometric determinationof marine-plant pigments, with revised equations for ascertainingchlorophylls and carotenoids. J Mar Res. 1963;21:155–63.
41. Carlson RE. A trophic state index for lakes. Limnol Oceanogr. 1977;22:361–9.42. ASTM. Standard practice for shake extraction of solid waste with water
(D3987–12). West Conshohocken: American Society for Testing andMaterials International; 2012.
43. BIS. Methods of Test for Soils–Determination of Cation Exchange Capacity(IS 2720–24). New Delhi: Bureau of Indian Standards; 1976.
44. BIS. Drinking Water – Specification (IS 10500). New Delhi: Bureau of IndianStandards; 2012.
45. Brady NC, Weil RR. The nature and properties of soils. 14th ed. Upper SaddleRiver: Pearson; 2008.
46. Wetzel RG. Limnology: lake and river ecosystems. 3rd ed. San Diego:Academic Press; 2001.
47. Muller R, Stadelmann P. Fish habitat requirements as the basis forrehabilitation of eutrophic lakes by oxygenation. Fisheries Manag Ecol. 2004;11:251–60.
48. Watson SB, Miller C, Arhonditsis G, Boyer GL, Carmichael W, Charlton MN,et al. The re-eutrophication of Lake Erie: harmful algal blooms and hypoxia.Harmful Algae. 2016;56:44–66.
49. Berner EK, Berner RA. The global water cycle: geochemistry andenvironment. Englewood Cliffs: Prentice Hall; 1987.
50. Ramiah BK, Rao SK. Soil distribution and engineering problems in Bangalorearea. Bengaluru: Bangalore University; 1969.
51. Barzegar R, Moghaddam AA, Nazemi AH, Adamowski J. Evidence for theoccurrence of hydrogeochemical processes in the groundwater of Khoyplain, northwestern Iran, using ionic ratios and geochemical modeling.Environ Earth Sci. 2018;77:597.
52. Mæller D. The Na/cl ratio in rainwater and the seasalt chloride cycle. TellusB. 1990;42:254–62.
53. Subramani T, Rajmohan N, Elango L. Groundwater geochemistry andidentification of hydrogeochemical processes in a hard rock region,Southern India. Environ Monit Assess. 2010;162:123–37.
54. TNIE. Despite ban over 12,000 plaster of Paris idols immersed in southBengaluru. Chennai: The New Indian Express; 2018.
55. Pasha GM, Shivashankara GP, Tiwari S. Chemical composition and ionicvariability of wet and bulk precipitation in urban environment of Karnatakastate, India. Inter J Curr Res Acad Rev. 2014;2:66–84.
56. Essington ME. Soil and water chemistry: an integrative approach. 1st ed.Boca Raton: CRC Press; 2003.
57. Appelo CAJ, Postma D. Geochemistry, groundwater and pollution. 2nd ed.Leiden: A.A. Balkema Publishers; 2005.
58. DOE. Malaysian Environmental Quality Report 2006. Putrajaya: Departmentof Environment; 2006.
59. BIS. Tolerance Limits for Inland Surface Waters Subject to Pollution (IS 2296).New Delhi: Bureau of Indian Standards; 1982.
Publisher’s NoteSpringer Nature remains neutral with regard to jurisdictional claims inpublished maps and institutional affiliations.
Rao et al. Sustainable Environment Research (2020) 30:8 Page 16 of 16


