Embed Size (px)
Citation preview
Chemosphere xxx (2014) xxx–xxx
Contents lists available at ScienceDirect
Chemosphere
journal homepage: www.elsevier .com/locate /chemosphere
Perfluorinated alkyl substances (PFAS) in terrestrial environmentsin Greenland and Faroe Islands
http://dx.doi.org/10.1016/j.chemosphere.2014.11.0440045-6535/� 2014 Elsevier Ltd. All rights reserved.
⇑ Corresponding author. Tel.: +45 87158603.E-mail address: [email protected] (R. Bossi).
Please cite this article in press as: Bossi, R., et al. Perfluorinated alkyl substances (PFAS) in terrestrial environments in Greenland and FaroeChemosphere (2014), http://dx.doi.org/10.1016/j.chemosphere.2014.11.044
Rossana Bossi a,⇑, Maria Dam b, Frank F. Rigét c
a Department of Environmental Science, Aarhus University, Arctic Research Centre (ARC), Frederiksborgvej 399, PO Box 358, DK-4000 Roskilde, Denmarkb Environment Agency, PO Box 2048, FO-165 Argir, Faroe Islandsc Department of Bioscience, Aarhus University, Arctic Research Centre (ARC), Frederiksborgvej 399, PO Box 358, DK-4000 Roskilde, Denmark
h i g h l i g h t s
� PFASs measured in terrestrial animals from Greenland and Faeroe Islands.� Eight of the fifteen PFASs analyzed were detected in the samples.� PFNA was the only compound detected in all samples.� Concentrations were higher in fish than ptarmigan and terrestrial mammals.
a r t i c l e i n f o
Article history:Received 31 March 2014Received in revised form 11 November 2014Accepted 17 November 2014Available online xxxx
Handling Editor: I. Cousins
Keywords:PFASsGreenlandFaroe IslandsTerrestrial animals
a b s t r a c t
Perfluorinated alkylated substances (PFASs) have been measured in liver samples from terrestrial organ-isms from Greenland and the Faeroe Islands. Samples from ptarmigan (West Greenland), reindeer (south-west-Greenland), muskox (East Greenland), and land-locked Arctic char from southwest Greenland andthe Faroe Islands were analyzed. In addition, PFASs levels in land-locked brown trout from Faroese lakesare reported. Of the 17 PFASs analyzed in the samples the following compounds were detected: PFOS,PFNA, PFDA, PFUnA, PFDoA, PFTrA, and PFTeA.
PFNA was the compound detected in most samples and in all species. However, the compound detectedat highest concentration was dependent on species, with overall highest concentrations of PFTrA andPFUnA being detected in trout liver from Lake á Myranar (Faroe Islands). In muskox, the PFAS occurringat highest concentrations was PFDA, which was among the PFAS detected at lowest concentrations infreshwater fish, and was only detected in one individual ptarmigan. The concentration of PFOS, PFDoAand PFTrA in Arctic char from Greenland and Faroe Islands were similar, whereas the concentration ofPFNA, PFDA and PFUnA were higher in Arctic char than those from Greenland. The opposite was observedfor PFTeA. The PFASs occurring at highest concentrations in trout were PFTrA and PFUnA. Arctic char fromLake á Myranar had much lower concentrations of PFTrA and PFUnA than in trout from the lakes ana-lyzed, but a higher concentration of PFTeA than trout from the same lake. A clear pattern with odd-carbonnumber homologues concentrations higher than the next lower even homologue was observed in fishsamples, which is consistent with the hypothesis of transport of volatile precursors to remote regions.
� 2014 Elsevier Ltd. All rights reserved.
1. Introduction
Perfluoroalkyl and polyfluoroalkyl substances (PFASs) comprisea family of manmade chemicals, both of which have a completelyor partially fluorinated alkyl backbone. PFASs include the sub-groups perfluoroalkane sulfonic acids (PFSAs) and perfluoroalkanecarboxylic acids (PFCAs). The most well-known PFSA is perfluoro-octane sulfonic acid (PFOS) which was found widespread in the
environment in the late 1990s (Giesy and Kannan, 2001). In 2000the largest producer of perfluorooctane sulfonyl fluoride (PFOSF),the 3M Company, announced the phase-out of its PFOSF-basedchemicals including PFOS (3M, 2000). PFOS was later regulatedwithin the EU with effect from June 2008 (EU Directive 2006/122/ECOF of the European Parliament), and in 2009 PFOSF, PFOSand its precursors were included in the Stockholm Convention onPOPs. However, the restrictions still allow the use of PFOS in manyof the applications for which they were used prior to the regula-tion, e.g. metal plating, aviation hydraulic fluids, semi-conductorsand ceramic filters production, and photo imaging. Other PFASs,
Islands.

Fig. 2. PFNA in liver tissue from terrestrial mammals, ptarmigan and freshwaterfish in Greenland (incl. Qeqertarsuaq and Nuuk) and Faroe Islands (Myranar andSandur).
2 R. Bossi et al. / Chemosphere xxx (2014) xxx–xxx
like PFCAs remain in use, for instance in the production of Teflon™and Gore-Tex™ which are used for non-stick surfaces and forstain-proofing by changing water- and oil surface adhesion andpermeability in paper and textiles.
PFASs have shown to accumulate in food chains, includingremote environments such as the Arctic (Martin et al., 2004; Buttet al., 2010). Unlike ‘‘traditional’’ long-range transported pollutantslike organochlorinated compounds, PFASs do not accumulate in fattissue, but are associated with protein-rich tissue.
The long range transport (LRT) of PFASs to remote areas hasbeen explained by two alternate processes: (i) transport by oceaniccurrents (Ahrens et al., 2009) or (ii) atmospheric oxidative trans-formations and subsequent wet and dry deposition of airborneprecursors, such as fluorotelomer alcohols (FTOHs), fluorinatedsulfonamides (FOSAs), and sulfonamido ethanols (FOSEs) (Elliset al., 2004; D’Eon et al., 2006).
Several studies have reported PFASs concentrations in marinemammals from Arctic and sub-arctic regions (Butt et al., 2010;Dam et al., 2011; Rigét et al., 2013), but very few studies have dealtwith concentrations of PFASs in non-marine feeding animals fromthe Arctic (Martin et al., 2004; Ostertag et al., 2009; Müller et al.,2011; Veillette et al., 2012).
Levels of PFASs in marine mammals from Greenland have beenfound to increase until 2006 (Bossi et al., 2005; Dietz et al., 2008).Recent studies in polar bears and ringed seals from Greenland haveshown that the levels of some PFASs (e.g. PFOS) have starteddecreasing, while the levels of other PFASs (e.g. PFNA and PFUnA)have remained stable or even increased (Rigét et al., 2013). In pilotwhale samples taken from the Faroe Islands the concentration ofPFOS may have peaked around the turn of the millennium (Damet al., 2011; Nielsen et al., 2014) though further analyses areneeded to assess whether this is a true trend. Other PFASs, likePFNA and PFUnA, are showing an increasing trend (Rotanderet al., 2012; Nielsen et al., 2014).
The focus of the present study was to investigate the levels andthe possible sources of PFASs in freshwater and terrestrial biotafrom Greenland and Faroe Islands, a topic which represents aknowledge gap not only in the case of Greenland and the FaroeIslands but in the whole circumpolar region. The study includedfreshwater fish, a terrestrial bird species (ptarmigan), reindeer
Fig. 1. PFOS in liver tissue from terrestrial mammals, ptarmigan and freshwater fishin Greenland (incl. Qeqertarsuaq and Nuuk) and Faroe Islands (Myranar andSandur). AC My (Arctic char, Lake á Myranar), AC sG (Arctic char, south Greenland),MO eG (Musk ox, east Greenland), MOc eG (), PT Nu (Ptarmigan, Nuuk), PT Qe(Ptarmigan, Qeqertarsuaq), RE sG (reindeer, south Greenland), TR My (trout, Lake áMyranar), TR Sa (trout, Sandur).
Fig. 3. PFTrA in liver tissue from terrestrial mammals, ptarmigan and freshwaterfish in Greenland (incl. Qeqertarsuaq and Nuuk) and Faroe Islands (Myranar andSandur).
Please cite this article in press as: Bossi, R., et al. Perfluorinated alkyl substaChemosphere (2014), http://dx.doi.org/10.1016/j.chemosphere.2014.11.044
and muskox. When combined with biological information such astrophic level, age and gender, and climate data, such as the amountof deposition and wind direction, these results will shed light on thelocation of the PFASs sources and the transport pathways.
2. Material and methods
2.1. Sample collection
Landlocked Arctic char (Salvelinus alpinus), a freshwater fish,was sampled in Faroe Islands in Lake á Myranar, and in a smallunnamed lake in southwest Greenland (Fig. 1S). Trout (Salmotrutta) from Faroe Islands were sampled in the same lake as theArctic char and on the Island of Sandur (Fig. 1S). Arctic char wascaught in connection with the Arctic Monitoring and AssessmentProgram (AMAP) of heavy metals and persistent organic pollutantsin the Faroe Islands, in 2011 and 2012 (Tables 2S and 3S) and inGreenland in 2010 (Table 4S). Trout were sampled for the purposeof the present project in 2012 (Table 8S). The fish from Sandurwere taken in three lakes, Lake Norðara Hálsavatn, Lake Stóravatn
nces (PFAS) in terrestrial environments in Greenland and Faroe Islands.
R. Bossi et al. / Chemosphere xxx (2014) xxx–xxx 3
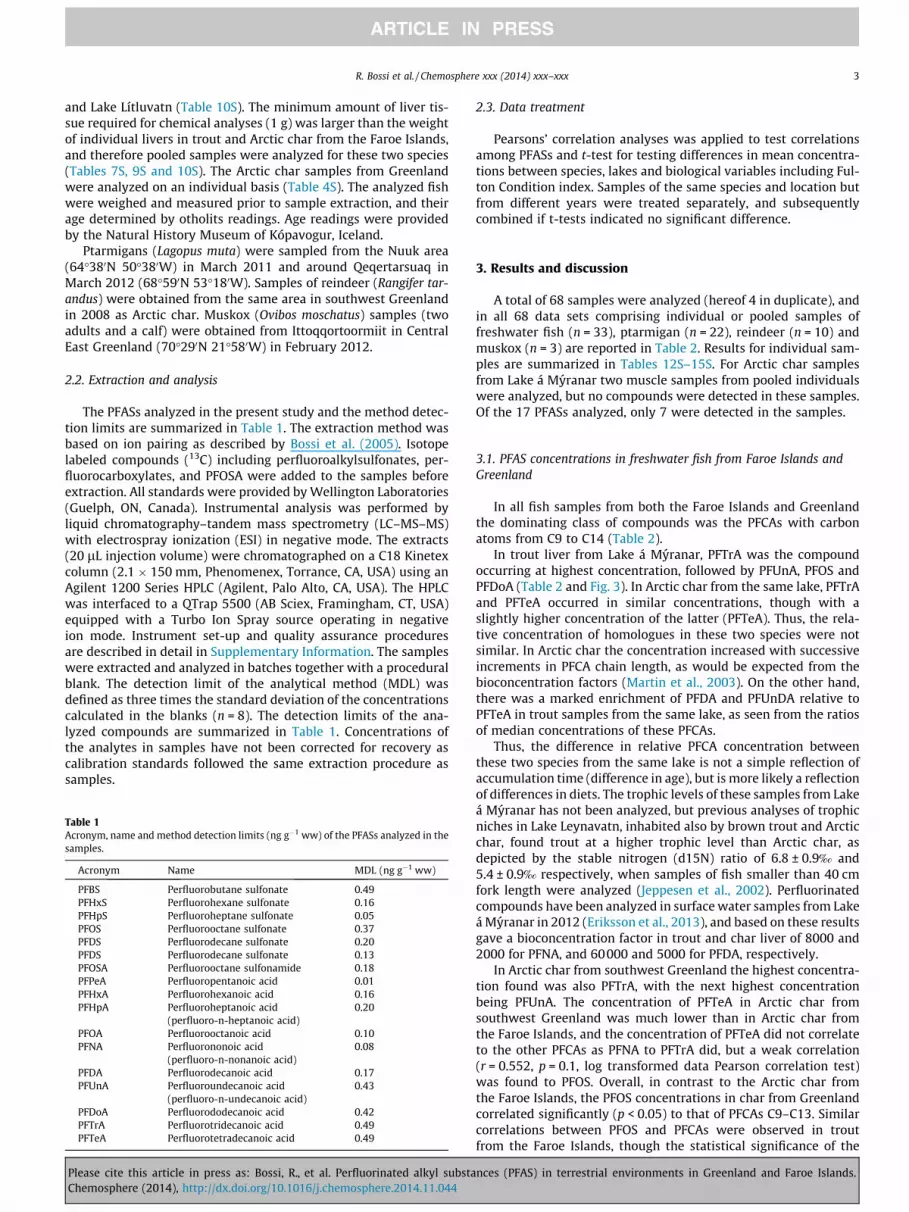
and Lake Lítluvatn (Table 10S). The minimum amount of liver tis-sue required for chemical analyses (1 g) was larger than the weightof individual livers in trout and Arctic char from the Faroe Islands,and therefore pooled samples were analyzed for these two species(Tables 7S, 9S and 10S). The Arctic char samples from Greenlandwere analyzed on an individual basis (Table 4S). The analyzed fishwere weighed and measured prior to sample extraction, and theirage determined by otholits readings. Age readings were providedby the Natural History Museum of Kópavogur, Iceland.
Ptarmigans (Lagopus muta) were sampled from the Nuuk area(64�380N 50�380W) in March 2011 and around Qeqertarsuaq inMarch 2012 (68�590N 53�180W). Samples of reindeer (Rangifer tar-andus) were obtained from the same area in southwest Greenlandin 2008 as Arctic char. Muskox (Ovibos moschatus) samples (twoadults and a calf) were obtained from Ittoqqortoormiit in CentralEast Greenland (70�290N 21�580W) in February 2012.
2.2. Extraction and analysis
The PFASs analyzed in the present study and the method detec-tion limits are summarized in Table 1. The extraction method wasbased on ion pairing as described by Bossi et al. (2005). Isotopelabeled compounds (13C) including perfluoroalkylsulfonates, per-fluorocarboxylates, and PFOSA were added to the samples beforeextraction. All standards were provided by Wellington Laboratories(Guelph, ON, Canada). Instrumental analysis was performed byliquid chromatography–tandem mass spectrometry (LC–MS–MS)with electrospray ionization (ESI) in negative mode. The extracts(20 lL injection volume) were chromatographed on a C18 Kinetexcolumn (2.1 � 150 mm, Phenomenex, Torrance, CA, USA) using anAgilent 1200 Series HPLC (Agilent, Palo Alto, CA, USA). The HPLCwas interfaced to a QTrap 5500 (AB Sciex, Framingham, CT, USA)equipped with a Turbo Ion Spray source operating in negativeion mode. Instrument set-up and quality assurance proceduresare described in detail in Supplementary Information. The sampleswere extracted and analyzed in batches together with a proceduralblank. The detection limit of the analytical method (MDL) wasdefined as three times the standard deviation of the concentrationscalculated in the blanks (n = 8). The detection limits of the ana-lyzed compounds are summarized in Table 1. Concentrations ofthe analytes in samples have not been corrected for recovery ascalibration standards followed the same extraction procedure assamples.
Table 1Acronym, name and method detection limits (ng g�1 ww) of the PFASs analyzed in thesamples.
Acronym Name MDL (ng g�1 ww)
PFBS Perfluorobutane sulfonate 0.49PFHxS Perfluorohexane sulfonate 0.16PFHpS Perfluoroheptane sulfonate 0.05PFOS Perfluorooctane sulfonate 0.37PFDS Perfluorodecane sulfonate 0.20PFDS Perfluorodecane sulfonate 0.13PFOSA Perfluorooctane sulfonamide 0.18PFPeA Perfluoropentanoic acid 0.01PFHxA Perfluorohexanoic acid 0.16PFHpA Perfluoroheptanoic acid
(perfluoro-n-heptanoic acid)0.20
PFOA Perfluorooctanoic acid 0.10PFNA Perfluorononoic acid
(perfluoro-n-nonanoic acid)0.08
PFDA Perfluorodecanoic acid 0.17PFUnA Perfluoroundecanoic acid
(perfluoro-n-undecanoic acid)0.43
PFDoA Perfluorododecanoic acid 0.42PFTrA Perfluorotridecanoic acid 0.49PFTeA Perfluorotetradecanoic acid 0.49
Please cite this article in press as: Bossi, R., et al. Perfluorinated alkyl substaChemosphere (2014), http://dx.doi.org/10.1016/j.chemosphere.2014.11.044
2.3. Data treatment
Pearsons’ correlation analyses was applied to test correlationsamong PFASs and t-test for testing differences in mean concentra-tions between species, lakes and biological variables including Ful-ton Condition index. Samples of the same species and location butfrom different years were treated separately, and subsequentlycombined if t-tests indicated no significant difference.
3. Results and discussion
A total of 68 samples were analyzed (hereof 4 in duplicate), andin all 68 data sets comprising individual or pooled samples offreshwater fish (n = 33), ptarmigan (n = 22), reindeer (n = 10) andmuskox (n = 3) are reported in Table 2. Results for individual sam-ples are summarized in Tables 12S–15S. For Arctic char samplesfrom Lake á Myranar two muscle samples from pooled individualswere analyzed, but no compounds were detected in these samples.Of the 17 PFASs analyzed, only 7 were detected in the samples.
3.1. PFAS concentrations in freshwater fish from Faroe Islands andGreenland
In all fish samples from both the Faroe Islands and Greenlandthe dominating class of compounds was the PFCAs with carbonatoms from C9 to C14 (Table 2).
In trout liver from Lake á Myranar, PFTrA was the compoundoccurring at highest concentration, followed by PFUnA, PFOS andPFDoA (Table 2 and Fig. 3). In Arctic char from the same lake, PFTrAand PFTeA occurred in similar concentrations, though with aslightly higher concentration of the latter (PFTeA). Thus, the rela-tive concentration of homologues in these two species were notsimilar. In Arctic char the concentration increased with successiveincrements in PFCA chain length, as would be expected from thebioconcentration factors (Martin et al., 2003). On the other hand,there was a marked enrichment of PFDA and PFUnDA relative toPFTeA in trout samples from the same lake, as seen from the ratiosof median concentrations of these PFCAs.
Thus, the difference in relative PFCA concentration betweenthese two species from the same lake is not a simple reflection ofaccumulation time (difference in age), but is more likely a reflectionof differences in diets. The trophic levels of these samples from Lakeá Myranar has not been analyzed, but previous analyses of trophicniches in Lake Leynavatn, inhabited also by brown trout and Arcticchar, found trout at a higher trophic level than Arctic char, asdepicted by the stable nitrogen (d15N) ratio of 6.8 ± 0.9‰ and5.4 ± 0.9‰ respectively, when samples of fish smaller than 40 cmfork length were analyzed (Jeppesen et al., 2002). Perfluorinatedcompounds have been analyzed in surface water samples from Lakeá Myranar in 2012 (Eriksson et al., 2013), and based on these resultsgave a bioconcentration factor in trout and char liver of 8000 and2000 for PFNA, and 60000 and 5000 for PFDA, respectively.
In Arctic char from southwest Greenland the highest concentra-tion found was also PFTrA, with the next highest concentrationbeing PFUnA. The concentration of PFTeA in Arctic char fromsouthwest Greenland was much lower than in Arctic char fromthe Faroe Islands, and the concentration of PFTeA did not correlateto the other PFCAs as PFNA to PFTrA did, but a weak correlation(r = 0.552, p = 0.1, log transformed data Pearson correlation test)was found to PFOS. Overall, in contrast to the Arctic char fromthe Faroe Islands, the PFOS concentrations in char from Greenlandcorrelated significantly (p < 0.05) to that of PFCAs C9–C13. Similarcorrelations between PFOS and PFCAs were observed in troutfrom the Faroe Islands, though the statistical significance of the
nces (PFAS) in terrestrial environments in Greenland and Faroe Islands.

Table 2Mean (minimum–maximum) concentrations (ng g�1 wet weight) of detected PFASs in all liver samples analyzed.
Species Site PFOS PFNA PFDA PFUnA PFDoA PFTrA PFTeA
Arctic char Myrarnar 0.75 0.28 0.20 0.63 0.51 1.57 1.73(n = 10) (0.46–1.09) (0.12–0.53) (0.17–0.22) (0.39–0.79) (0.43–0.65) (0.90–2.52) (0.83–2.80)Trout Myrarnar 4.71 1.11 1.84 6.81 3.03 8.35 1.52(n = 5) (4.11–5.51) (0.26–1.86) (0.35–2.92) (1.31–10.9) (0.52–4.45) (1.09–11.9) (1.23–1.9)Trout Sandur 1.75 1.60 0.97 3.44 1.36 3.19 0.67(n = 5) (0.79–2.71) (1.02–3.32) (0.47–1.81) (1.76–6.13) (0.84–2.05) (2.07–4.72) (0.51–0.82)Arctic char South Greenland 0.51 0.42 0.32 1.29 0.61 1.50 0.63(n = 10) (0.38–0.68) (0.20–1.23) (0.18–0.84) (0.73–3.06) (0.49–1.04) (0.96–3.47) (0.44–1.30)Ptarmigan Nuuk nd 1.04 nd nd nd nd nd(n = 12) (0.43–1.82)Ptarmigan Qeqertarsuaq nd 0.27 nd nd nd nd nd(n = 10) (0.10–0.45)Reindeer South Greenland 1.42 0.84 0.28 0.45 nd nd nd(n = 10) (1.02–2.06) (0.50–1.24) (0.17–0.38) (0.44–0.46)Musk ox East Greenland 0.87 2.58 3.22 2.44 0.33 0.62 nd(n = 3) (0.67–1.08) (2.0–3.55) (1.59–5.25) (1.18–4.07) (0.21–0.52) (0.52–0.72)
4 R. Bossi et al. / Chemosphere xxx (2014) xxx–xxx
correlations were weaker and were mainly found for trout samplesfrom Sandur.
There is apparently a species profile in PFASs homologues rela-tive concentration, also across large distances from southwestGreenland to Faroe Islands. However, some common characteris-tics are apparent. The relative concentration of PFOS and PFTrAare similar, with concentrations in trout and Arctic char liverdecreasing in the order Lake á Myranar > Sandur and Lake á Myran-ar > southwest Greenland, respectively.
The highest PFOS concentration was found in trout from Lake áMyranar (5.51 ng g�1 ww), whereas about half the concentration ofthis were found in the same species from Sandur. No significantdifferences in mean age and fork length were found for fish fromthe two lakes (ANOVA, p = 0.55 and p = 0.26, respectively). PFOSand PFCAs C9–C14 concentrations were studied in fish samplesin relation to body length, weight and age, but no significant corre-lation (at p = 0.05) was observed. The material was not well suitedto describe associations between age, sex, length and weight inrelation to PFASs concentration, due to the limited number of indi-viduals analyzed and the pooling of individuals prior to chemicalanalyses. Also, the similarity of the individuals in the samplesmeant that the span of magnitude of these parameters was toolimited to detect such associations on top of the individual andpooled sample variability in PFASs concentration.
The accumulated deposition at the weather station closest toLake á Myranar (Høgareyn station) according to the Office of PublicWorks (www.landsverk) was approximately twice (3230 mm in2011 and 2190 mm in 2012) the average amount of depositionrecorded at the two weather stations at Sandur (Skopun and Brek-kan Stóra stations) (1450 mm and 1060 mm in the same periods).The double concentration of the detected PFASs in trout from LakeMyranar compared to that of trout in Sandur matches quite wellwith the double amount of deposition at the former site in recentyears.
PFASs have been previously analyzed in Arctic char from Lake áMyranar in 2002 (Kallenborn et al., 2004). In that study, the concen-trations of PFOS and PFOSA were found to be in the range4.7–5.3 ng g�1 ww and 3.6–5.7 ng g�1 ww liver, respectively. Theconcentration of PFOS found in the present study was approxi-mately 20% of the level measured in fish sampled in the same lakea decade earlier. Veillette et al. (2012) have reported average totalPFASs concentrations in Arctic char (total body burden) from tworemote lakes in Arctic Canada (Nunavut) ranging from 0.20 to0.48 ng g�1 ww. In the present study we found a total PFASs aver-age liver concentrations of 5.67 (±1.6) ng g�1 ww in Arctic charfrom Lake á Myranar and an average concentration of 5.27(±2.8) ng g�1 ww in Arctic char from Greenland. In the present
Please cite this article in press as: Bossi, R., et al. Perfluorinated alkyl substaChemosphere (2014), http://dx.doi.org/10.1016/j.chemosphere.2014.11.044
study, PFASs were analyzed in a muscle tissue prepared from a sam-ple of the very same population from which the liver samples weretaken. The mean level of PFASs in liver tissue compared to thedetection level at which PFASs in muscle would have been detected,indicates that the concentration fraction of PFASs in liver to muscletissue could well be a factor 10 or more. The mean level of PFTeA in2012 Arctic char liver from Lake á Myranar was 14 times higherthan the detection limit. Shi et al. (2012) analyzed the tissue distri-bution of PFASs in farmed freshwater fish, and found that the ratioof PFOS in liver to that in muscle varied from 4 to 18, and found thatto be consistent with earlier studies where ratios of approx. 10 havebeen reported. Assuming that PFASs concentrations are about 10times higher in liver compared to whole body fish homogenate,the values from Arctic Canada and our study are comparable.
3.2. PFAS concentrations in ptarmigan from Greenland
PFASs concentrations in ptarmigan were mostly under methoddetection limit in the present study with PFNA detected in all theanalyzed samples. The mean concentration of PFNA was signifi-cantly higher in ptarmigan from Nuuk than from Qeqertarsuaq(ANOVA, p < 0.01). The difference in average PFNA concentrationbetween the two locations could stem from factors like bird age,available food items, but possibly also from different atmosphericdeposition input/regimes in the two regions.
Seabirds from Arctic regions have generally much higher PFASsconcentrations than terrestrial birds, indicating that the seabirdsdiet mainly based on fish is the main source of these contaminants(Tomy et al., 2004; Verreault et al., 2005; Butt et al., 2007).
3.3. PFAS concentrations in reindeer and muskox from Greenland
PFOS was detected in all but one liver samples of reindeer fromsouthwest Greenland and PFNA, PFDA, PFUnA and PFDoA weredetected in all samples. The order of decreasing levels wasPFOS > PFNA > PFUnA = PFDA > PFDoA.
In the three liver samples of muskox PFNA, PFDA and PFUnAwere detected at similar concentrations, ranging from 1.18 to5.25 ng g�1 ww. PFOS was detected in two samples, at concentra-tions of 0.67 and 1.08 ng g�1 ww. PFDoA and PFTrA were foundat concentrations from 0.21 to 0.72 ng g�1 ww, whereas PFTeAwas not detected.
PFOS had at highest concentration (1.42 ng g�1 ww) in reindeerfrom southern Greenland followed by PFNA (0.84 ng g�1 ww) andPFUnA (0.45 ng g�1 ww) (Fig. 1). Similar concentrations werefound in caribou from two remote northern areas in Canada(Müller et al., 2011). However, in the later study the concentration
nces (PFAS) in terrestrial environments in Greenland and Faroe Islands.
R. Bossi et al. / Chemosphere xxx (2014) xxx–xxx 5
of PFOS was lower than the concentration of PFNA, PFDA andPFUnA.
PFASs average concentrations measured in muskox from EastGreenland were significantly higher (ANOVA, p < 0.01) than thosemeasured in reindeer. The burden of persistent contaminants isgenerally higher in biota from East Greenland than in biota fromWest Greenland (Rigét et al., 2004). This trend has also beenobserved for PFASs in marine mammals (Bossi et al., 2005). It ishowever difficult to draw the same conclusion for terrestrial ani-mals due to the low number of muskox samples analyzed (n = 3).
3.4. Sources
The PFCAs with C8–C14 detected in all fish samples showed aclear pattern with odd-carbon number homologues concentrationshigher than the next lower even homologue (Table 2). This patternwas not evident in terrestrial mammals, probably because themeasured concentrations were close to the detection limit. Theodd–even pattern may be indicative of the sources and it is consis-tent with the hypothesis of transport of volatile precursors as e.g.long chain fluorotelomer alcohols (FTOH), which have beenreported to yield even- and odd-chain-length PFCAs upon degrada-tion (Ellis et al., 2004). Transport of volatile precursors via theatmosphere with subsequent degradation to PFCAs and PFSAs isthe only LRT process involved for input of PFASs to remote terres-trial ecosystems. Volatile precursors such as FTOHs and perfluori-nated sulfonamides (FSAs) have been detected in the Arcticatmosphere (Shoeib et al., 2006) and their deposition in the fresh-water ecosystem has been measured in Arctic Canada (Stock et al.,2007).
The direct transport of PFASs by oceanic currents is an addi-tional route proposed to explain the presence of PFASs in the Arcticenvironment. The more complex trophic chain of marine ecosys-tems and the contribution from two different transport routes ofPFASs and their precursors may explain the much higher PFASsconcentrations generally encountered in the marine Arctic biotacompared to the levels measured in terrestrial remoteenvironments.
4. Conclusion
PFASs were detected in freshwater and terrestrial biota fromGreenland and Faeroe Islands. PFNA was present at detectable lev-els (DL 0.1 ng g�1 ww) in every liver sample but not in the muscletissue of the Arctic char. The PFAS detected in most samples and inall species was PFNA (Fig. 2). The PFAS found at highest concentra-tion was however dependent on species, with overall highest con-centrations detected in trout liver from Lake á Myranar for PFTrA(Fig. 3) and PFUnA. In muskox, the PFAS occurring at highest con-centrations was PFDA, which was among the PFASs detected atlowest concentrations in freshwater fish, and detected in onlyone individual ptarmigan. The concentration of PFOS, PFDoA andPFTrA in Arctic char from Greenland and Faroe Islands were simi-lar, whereas the concentration of PFNA, PFDA and PFUnA werehigher in Arctic char from Greenland. The opposite was observedfor PFTeA. The PFASs occurring at highest concentrations in troutwere PFTrA and PFUnA. Arctic char from Lake á Myranar had muchlower concentrations of PFTrA and PFUnA than the mean in troutfrom the lakes analyzed, but a higher concentration of PFTeA thantrout from the same lake. Thus ecosystem parameters like trophiclevel and/or fish age must be taken into account in addition to geo-graphical location and wet/dry atmospheric deposition regime. Aclear pattern with odd-carbon number homologues concentrationshigher than the next lower even homologue was observed in fish
Please cite this article in press as: Bossi, R., et al. Perfluorinated alkyl substaChemosphere (2014), http://dx.doi.org/10.1016/j.chemosphere.2014.11.044
samples, which is consistent with the hypothesis of transport ofvolatile precursors to remote regions.
Acknowledgments
The support via DANCEA Grant No. MST J.Nr. 112-00155 forchemical analyses are gratefully acknowledged. Rune Dietz andSigga Joensen are gratefully acknowledged for sample collectionin Greenland and Inga Jensen is gratefully acknowledged for labo-ratory analysis of the samples. Thanks to Jón í Haraldsstovu, Kris-tian Martin Hansen and Andrias Joensen, for sampling in theFaroe Islands and to Rakul Mortensen and Sanna í Túni Nielsenfor sample preparation. Thanks also to Gunnlaugur Sighvatssonat the Office of Public Works for weather data extraction and to Sis-sal Vágsheyg Erenbjerg for climate data processing.
Appendix A. Supplementary material
Supplementary data associated with this article can be found, inthe online version, at http://dx.doi.org/10.1016/j.chemosphere.2014.11.044.
References
3M, 2000. Phase-out plan for POSF-based products. US Environmental ProtectionAgency Docket AR226-0588; USEPA, St. Paul, MN.
Ahrens, L., Barber, J.L., Xie, Z., Ebinghaus, R., 2009. Longitudinal and latitudinaldistribution of perfluoroalkyl compounds in the surface water of the AtlanticOcean. Environ. Sci. Technol. 43, 3122–3127.
Bossi, R., Riget, F.F., Dietz, R., 2005. Temporal and spatial trends of perfluorinatedcompounds in ringed seal (Phoca hispida) from Greenland. Environ. Sci. Technol.39, 7416–7422.
Butt, C.M., Mabury, S.A., Muir, D.C.G., Braune, B.M., 2007. Prevalence of long-chainedperfluorinated carboxylates in seabirds from the Canadian Arctic between 1975and 2004. Environ. Sci. Technol. 41, 3521–3528.
Butt, C.M., Berger, U., Bossi, R., Tomy, G.T., 2010. Levels and trends ofpolyperflurorinated compounds in the arctic environment. Sci. Totta Environ.408, 2936–2965.
Dam, M., van Bavel, B., Rigét, F.F., Rotander, A., Polder, A., Auðunsson, G.A., DoreteBloch, Víkingsson, G.A., Mikkelsen, B., Gabrielsen, G.W., Sagerup, K., 2011. NewPOPs in marine mammals in Nordic Arctic and NE Atlantic areas during threedecades. Tema Nord 2011: 564, ISBN 978-92-893-2282-9. www.norden.org.
D’Eon, J.C., Hurley, M.D., Wallington, T.J., Mabury, S.A., 2006. Atmospheric chemistryof N-methyl perfluorobutane sulfonamidoethanol, C4F9SO2N(CH3)CH2CH 2OH:kinetics and mechanism of reaction with OH. Environ. Sci. Technol. 40, 1862–1868.
Dietz, R., Bossi, R., Rigét, F.F., Sonne, C., Born, E.W., 2008. Increasing perfluoroalkylcontaminants in east Greenland polar bears (Ursus maritimus): a new toxicthreat to the Arctic bears. Environ. Sci. Technol. 42, 2701–2707.
Ellis, D.A., Martin, J.W., De Silva, A.O., Mabury, S.A., Hurley, M.D., Andersen, M.P.S.,Wallington, T.J., 2004. Degradation of fluorotelomer alcohols: a likelyatmospheric source of perfluorinated carboxylic acids. Environ. Sci. Technol.38, 3316–3321.
Eriksson, U., Karrman, A., Rotander, A., Mikkelsen, B., Dam, M., 2013. Perfluoroalkylsubstances (PFASs) in food and water from Faroe Islands. Environ. Sci. Pollut.Res. 20, 7940–7948.
Giesy, J.P., Kannan, K., 2001. Distribution of perfluoroctane sulfonate in wildlife.Environ. Sci. Technol. 35, 1339–1342.
Jeppesen, E., Landkildehus, F., Lauridsen, T.L., Jensen, J.P., Bjerring, R., Søndergaard,M., Amsinck, S.L., 2002. Food web interactions in five Faroese lakes tracked bystable isotopes. Ann. Soc. Scient. Færoensis Suppl. 36, 114–125.
Kallenborn, R., Berger, U., Järnberg, U., 2004. Perfluorinated alkylated substances(PFAS) in the Nordic environment. Tema Nord 2004:552, ISBN 92-893-1051-0.www.norden.org.
Martin, J.W., Mabury, S.A., Solomon, K.R., Muir, D.C.G., 2003. Bioconcentration andtissue distribution of perfluorinated acids in Rainbow trout (Oncorhynchusmykiss). Environ. Toxicol. Chem. 22, 196–204.
Martin, J.W., Smithwicks, M.M., Braune, B.M., Hoekstra, P.F., Muir, D.C.G., Mabury,S.A., 2004. Identification of long-chain perfluorinated acids in biota from theCanadian Arctic. Environ. Sci. Technol. 38, 373–380.
Müller, C., De Silva, A.O., Small, J., Williamson, M., Wang, X., Morris, A., Katz, S.,Gamberg, M., Muir, D.C.G., 2011. Biomagnification of perfluorinated compoundsin a remote terrestrial food chain: lichen–caribou–wolf. Environ. Sci. Technol.45, 8665–8673.
Nielsen, S.T., Mortensen, R., Hoydal, K., Erenbjerg, S.V., Dam, M., 2014. AMAP FaroeIslands heavy metals and POPs core programme 2009–2012. EnvironmentAgency, Faroe Islands. ISBN: 978-99918-819-9-7 www.us.fo.
nces (PFAS) in terrestrial environments in Greenland and Faroe Islands.

6 R. Bossi et al. / Chemosphere xxx (2014) xxx–xxx
Ostertag, S.K., Tague, B.A., Humphries, M.M., Tittlemier, S.A., Chan, H.M., 2009.Estimated dietary exposure to fluorinated compounds from traditional foodsamong Inuit in Nunavut, Canada. Chemosphere 75, 1165–1172.
Rigét, F., Dietz, R., Vorkamp, K., Johansen, P., Muir, D., 2004. Levels and spatial andtemporal trends of contaminants in Greenland biota: an updated review. Sci.Total Environ. 331, 29–52.
Rigét, F., Bossi, R., Sonne, C., Vorkamp, K., Dietz, R., 2013. Trends ofperfluorochemicals in Greenland ringed seals and polar bears: Indications ofshifts to decreasing trends. Chemosphere 93, 1607–1614.
Rotander, A., Kärrman, A., van Bavel, B., Polder, A., Rigét, F., Auðunsson, G.A.,Víkingsson, G., Gabrielsen, G.W., Bloch, D., Dam, M., 2012. Increasing levels oflong-chain perfluorocarboxylic acids (PFCAs) in Arctic and North Atlanticmarine mammals, 1984–2009. Chemosphere 86, 278–285.
Shi, Y., Wang, J., Pan, Y., Cai, Y., 2012. Tissue distribution of perfluorinatedcompounds in farmed freshwater fish and human exposure by consumption.Environ. Toxicol. Chem. 31 (4), 717–723.
Please cite this article in press as: Bossi, R., et al. Perfluorinated alkyl substaChemosphere (2014), http://dx.doi.org/10.1016/j.chemosphere.2014.11.044
Shoeib, M., Harner, T., Vlahos, P., 2006. Perfluorinated chemicals in the Arcticatmosphere. Environ. Sci. Technol. 40, 7577–7583.
Stock, N.L., Furdui, V.I., Muir, D.C.G., Mabury, S.A., 2007. Perfluoroalkylcontaminants in the Canadian Arctic: evidence of atmospheric transport andlocal contamination. Environ. Sci. Technol. 41, 3529–3536.
Tomy, G.T., Budakowski, W., Halldorson, T., Helm, P.A., Stern, G.A., Friesen, K.,Pepper, K., Tittlemier, S.A., Fisk, A.T., 2004. Fluorinated organic compounds in eneastern Arctic marine food web. Environ. Sci. Technol. 38, 6475–6481.
Veillette, J., Muir, D.C.G., Antoniades, A., Small, J.M., Spencer, C., Loewen, T.N.,Babaluk, J.A., Reist, J.D., Vincent, W.F., 2012. Perfluorinated chemicals inmeromitic lakes on the Northern coast of Ellesmere Island, high ArcticCanada. Arctic 65, 245–256.
Verreault, J., Houde, M., Gabrielsen, G.W., Berger, U., Haukås, M., Letcher, R.J., Muir,D.C.G., 2005. Perfluorinated alkyl substances in plasma, liver, brain and eggs ofglaucous gull (Larus hyperboreus) from the Norwegian Arctic. Environ. Sci.Technol. 39, 7439–7445.
nces (PFAS) in terrestrial environments in Greenland and Faroe Islands.