Embed Size (px)
Citation preview
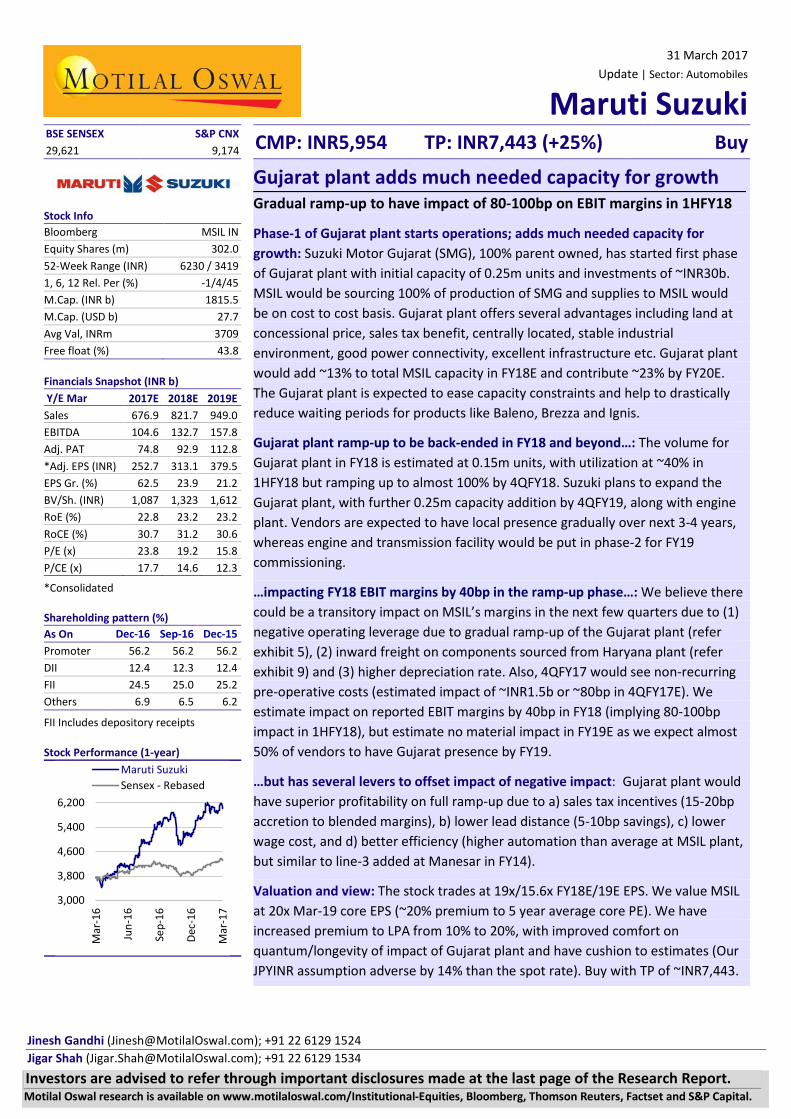
31 March 2017Update | Sector: Automobiles
Maruti SuzukiBSE SENSEX S&P CNX CMP: INR5,954 TP: INR7,443 (+25%) Buy29,621 9,174
Stock Info Bloomberg MSIL IN Equity Shares (m) 302.0 52-Week Range (INR) 6230 / 3419 1, 6, 12 Rel. Per (%) -1/4/45M.Cap. (INR b) 1815.5 M.Cap. (USD b) 27.7 Avg Val, INRm 3709 Free float (%) 43.8
Financials Snapshot (INR b) Y/E Mar 2017E 2018E 2019E Sales 676.9 821.7 949.0 EBITDA 104.6 132.7 157.8 Adj. PAT 74.8 92.9 112.8 *Adj. EPS (INR) 252.7 313.1 379.5EPS Gr. (%) 62.5 23.9 21.2 BV/Sh. (INR) 1,087 1,323 1,612 RoE (%) 22.8 23.2 23.2 RoCE (%) 30.7 31.2 30.6 P/E (x) 23.8 19.2 15.8 P/CE (x) 17.7 14.6 12.3
*Consolidated
Shareholding pattern (%) As On Dec-16 Sep-16 Dec-15 Promoter 56.2 56.2 56.2 DII 12.4 12.3 12.4 FII 24.5 25.0 25.2 Others 6.9 6.5 6.2
FII Includes depository receipts
Stock Performance (1-year)
Gujarat plant adds much needed capacity for growth Gradual ramp-up to have impact of 80-100bp on EBIT margins in 1HFY18
Phase-1 of Gujarat plant starts operations; adds much needed capacity for growth: Suzuki Motor Gujarat (SMG), 100% parent owned, has started first phase of Gujarat plant with initial capacity of 0.25m units and investments of ~INR30b. MSIL would be sourcing 100% of production of SMG and supplies to MSIL would be on cost to cost basis. Gujarat plant offers several advantages including land at concessional price, sales tax benefit, centrally located, stable industrial environment, good power connectivity, excellent infrastructure etc. Gujarat plant would add ~13% to total MSIL capacity in FY18E and contribute ~23% by FY20E. The Gujarat plant is expected to ease capacity constraints and help to drastically reduce waiting periods for products like Baleno, Brezza and Ignis.
Gujarat plant ramp-up to be back-ended in FY18 and beyond…: The volume for Gujarat plant in FY18 is estimated at 0.15m units, with utilization at ~40% in 1HFY18 but ramping up to almost 100% by 4QFY18. Suzuki plans to expand the Gujarat plant, with further 0.25m capacity addition by 4QFY19, along with engine plant. Vendors are expected to have local presence gradually over next 3-4 years, whereas engine and transmission facility would be put in phase-2 for FY19 commissioning.
…impacting FY18 EBIT margins by 40bp in the ramp-up phase…: We believe there could be a transitory impact on MSIL’s margins in the next few quarters due to (1) negative operating leverage due to gradual ramp-up of the Gujarat plant (refer exhibit 5), (2) inward freight on components sourced from Haryana plant (refer exhibit 9) and (3) higher depreciation rate. Also, 4QFY17 would see non-recurring pre-operative costs (estimated impact of ~INR1.5b or ~80bp in 4QFY17E). We estimate impact on reported EBIT margins by 40bp in FY18 (implying 80-100bp impact in 1HFY18), but estimate no material impact in FY19E as we expect almost 50% of vendors to have Gujarat presence by FY19.
…but has several levers to offset impact of negative impact: Gujarat plant would have superior profitability on full ramp-up due to a) sales tax incentives (15-20bp accretion to blended margins), b) lower lead distance (5-10bp savings), c) lower wage cost, and d) better efficiency (higher automation than average at MSIL plant, but similar to line-3 added at Manesar in FY14).
Valuation and view: The stock trades at 19x/15.6x FY18E/19E EPS. We value MSIL at 20x Mar-19 core EPS (~20% premium to 5 year average core PE). We have increased premium to LPA from 10% to 20%, with improved comfort on quantum/longevity of impact of Gujarat plant and have cushion to estimates (Our JPYINR assumption adverse by 14% than the spot rate). Buy with TP of ~INR7,443.
3,000
3,800
4,600
5,400
6,200
Mar
-16
Jun-
16
Sep-
16
Dec-
16
Mar
-17
Maruti SuzukiSensex - Rebased
Jinesh Gandhi ([email protected]); +91 22 6129 1524 Jigar Shah ([email protected]); +91 22 6129 1534 Investors are advised to refer through important disclosures made at the last page of the Research Report. Motilal Oswal research is available on www.motilaloswal.com/Institutional-Equities, Bloomberg, Thomson Reuters, Factset and S&P Capital.
Maruti Suzuki
31 March 2017 2
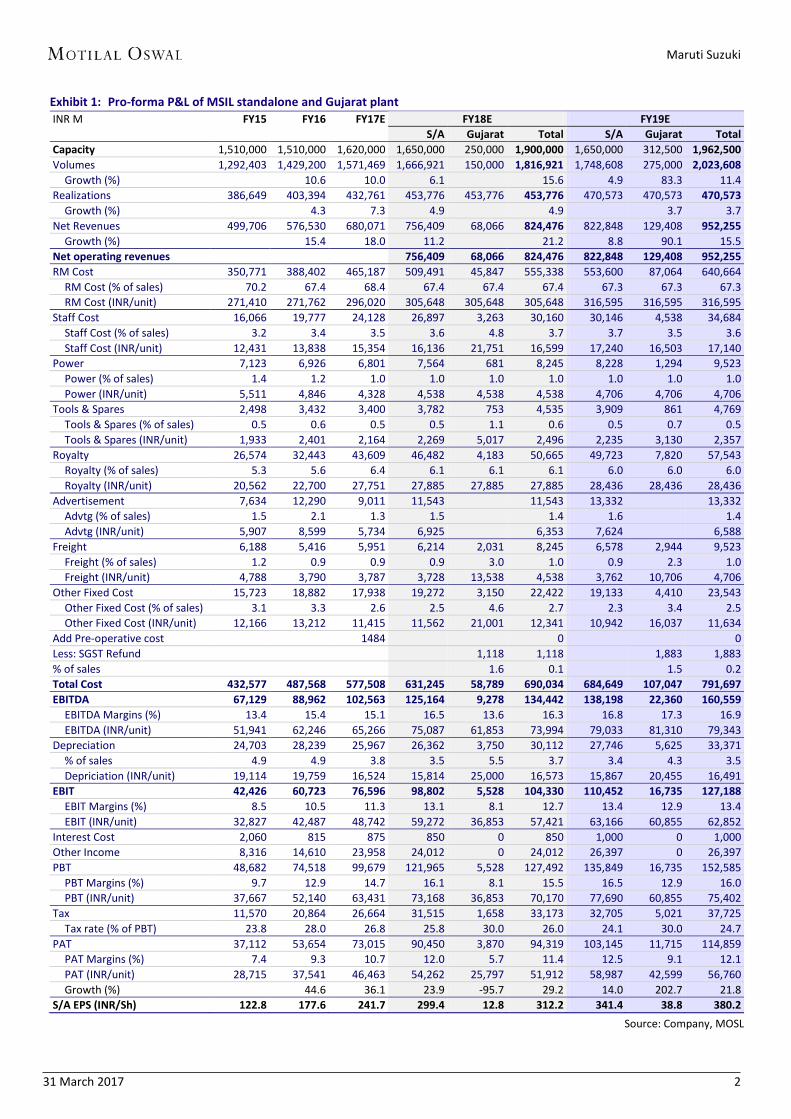
Exhibit 1: Pro-forma P&L of MSIL standalone and Gujarat plant INR M FY15 FY16 FY17E FY18E FY19E
S/A Gujarat Total S/A Gujarat Total Capacity 1,510,000 1,510,000 1,620,000 1,650,000 250,000 1,900,000 1,650,000 312,500 1,962,500 Volumes 1,292,403 1,429,200 1,571,469 1,666,921 150,000 1,816,921 1,748,608 275,000 2,023,608
Growth (%) 10.6 10.0 6.1 15.6 4.9 83.3 11.4 Realizations 386,649 403,394 432,761 453,776 453,776 453,776 470,573 470,573 470,573
Growth (%) 4.3 7.3 4.9 4.9 3.7 3.7 Net Revenues 499,706 576,530 680,071 756,409 68,066 824,476 822,848 129,408 952,255
Growth (%) 15.4 18.0 11.2 21.2 8.8 90.1 15.5 Net operating revenues 756,409 68,066 824,476 822,848 129,408 952,255 RM Cost 350,771 388,402 465,187 509,491 45,847 555,338 553,600 87,064 640,664
RM Cost (% of sales) 70.2 67.4 68.4 67.4 67.4 67.4 67.3 67.3 67.3 RM Cost (INR/unit) 271,410 271,762 296,020 305,648 305,648 305,648 316,595 316,595 316,595
Staff Cost 16,066 19,777 24,128 26,897 3,263 30,160 30,146 4,538 34,684 Staff Cost (% of sales) 3.2 3.4 3.5 3.6 4.8 3.7 3.7 3.5 3.6 Staff Cost (INR/unit) 12,431 13,838 15,354 16,136 21,751 16,599 17,240 16,503 17,140
Power 7,123 6,926 6,801 7,564 681 8,245 8,228 1,294 9,523 Power (% of sales) 1.4 1.2 1.0 1.0 1.0 1.0 1.0 1.0 1.0 Power (INR/unit) 5,511 4,846 4,328 4,538 4,538 4,538 4,706 4,706 4,706
Tools & Spares 2,498 3,432 3,400 3,782 753 4,535 3,909 861 4,769 Tools & Spares (% of sales) 0.5 0.6 0.5 0.5 1.1 0.6 0.5 0.7 0.5 Tools & Spares (INR/unit) 1,933 2,401 2,164 2,269 5,017 2,496 2,235 3,130 2,357
Royalty 26,574 32,443 43,609 46,482 4,183 50,665 49,723 7,820 57,543 Royalty (% of sales) 5.3 5.6 6.4 6.1 6.1 6.1 6.0 6.0 6.0 Royalty (INR/unit) 20,562 22,700 27,751 27,885 27,885 27,885 28,436 28,436 28,436
Advertisement 7,634 12,290 9,011 11,543 11,543 13,332 13,332 Advtg (% of sales) 1.5 2.1 1.3 1.5 1.4 1.6 1.4 Advtg (INR/unit) 5,907 8,599 5,734 6,925 6,353 7,624 6,588
Freight 6,188 5,416 5,951 6,214 2,031 8,245 6,578 2,944 9,523 Freight (% of sales) 1.2 0.9 0.9 0.9 3.0 1.0 0.9 2.3 1.0 Freight (INR/unit) 4,788 3,790 3,787 3,728 13,538 4,538 3,762 10,706 4,706
Other Fixed Cost 15,723 18,882 17,938 19,272 3,150 22,422 19,133 4,410 23,543 Other Fixed Cost (% of sales) 3.1 3.3 2.6 2.5 4.6 2.7 2.3 3.4 2.5 Other Fixed Cost (INR/unit) 12,166 13,212 11,415 11,562 21,001 12,341 10,942 16,037 11,634
Add Pre-operative cost 1484 0 0 Less: SGST Refund 1,118 1,118 1,883 1,883 % of sales 1.6 0.1 1.5 0.2 Total Cost 432,577 487,568 577,508 631,245 58,789 690,034 684,649 107,047 791,697 EBITDA 67,129 88,962 102,563 125,164 9,278 134,442 138,198 22,360 160,559
EBITDA Margins (%) 13.4 15.4 15.1 16.5 13.6 16.3 16.8 17.3 16.9 EBITDA (INR/unit) 51,941 62,246 65,266 75,087 61,853 73,994 79,033 81,310 79,343
Depreciation 24,703 28,239 25,967 26,362 3,750 30,112 27,746 5,625 33,371 % of sales 4.9 4.9 3.8 3.5 5.5 3.7 3.4 4.3 3.5 Depriciation (INR/unit) 19,114 19,759 16,524 15,814 25,000 16,573 15,867 20,455 16,491
EBIT 42,426 60,723 76,596 98,802 5,528 104,330 110,452 16,735 127,188 EBIT Margins (%) 8.5 10.5 11.3 13.1 8.1 12.7 13.4 12.9 13.4 EBIT (INR/unit) 32,827 42,487 48,742 59,272 36,853 57,421 63,166 60,855 62,852
Interest Cost 2,060 815 875 850 0 850 1,000 0 1,000 Other Income 8,316 14,610 23,958 24,012 0 24,012 26,397 0 26,397 PBT 48,682 74,518 99,679 121,965 5,528 127,492 135,849 16,735 152,585
PBT Margins (%) 9.7 12.9 14.7 16.1 8.1 15.5 16.5 12.9 16.0 PBT (INR/unit) 37,667 52,140 63,431 73,168 36,853 70,170 77,690 60,855 75,402
Tax 11,570 20,864 26,664 31,515 1,658 33,173 32,705 5,021 37,725 Tax rate (% of PBT) 23.8 28.0 26.8 25.8 30.0 26.0 24.1 30.0 24.7
PAT 37,112 53,654 73,015 90,450 3,870 94,319 103,145 11,715 114,859 PAT Margins (%) 7.4 9.3 10.7 12.0 5.7 11.4 12.5 9.1 12.1 PAT (INR/unit) 28,715 37,541 46,463 54,262 25,797 51,912 58,987 42,599 56,760 Growth (%) 44.6 36.1 23.9 -95.7 29.2 14.0 202.7 21.8
S/A EPS (INR/Sh) 122.8 177.6 241.7 299.4 12.8 312.2 341.4 38.8 380.2 Source: Company, MOSL
Maruti Suzuki
31 March 2017 3
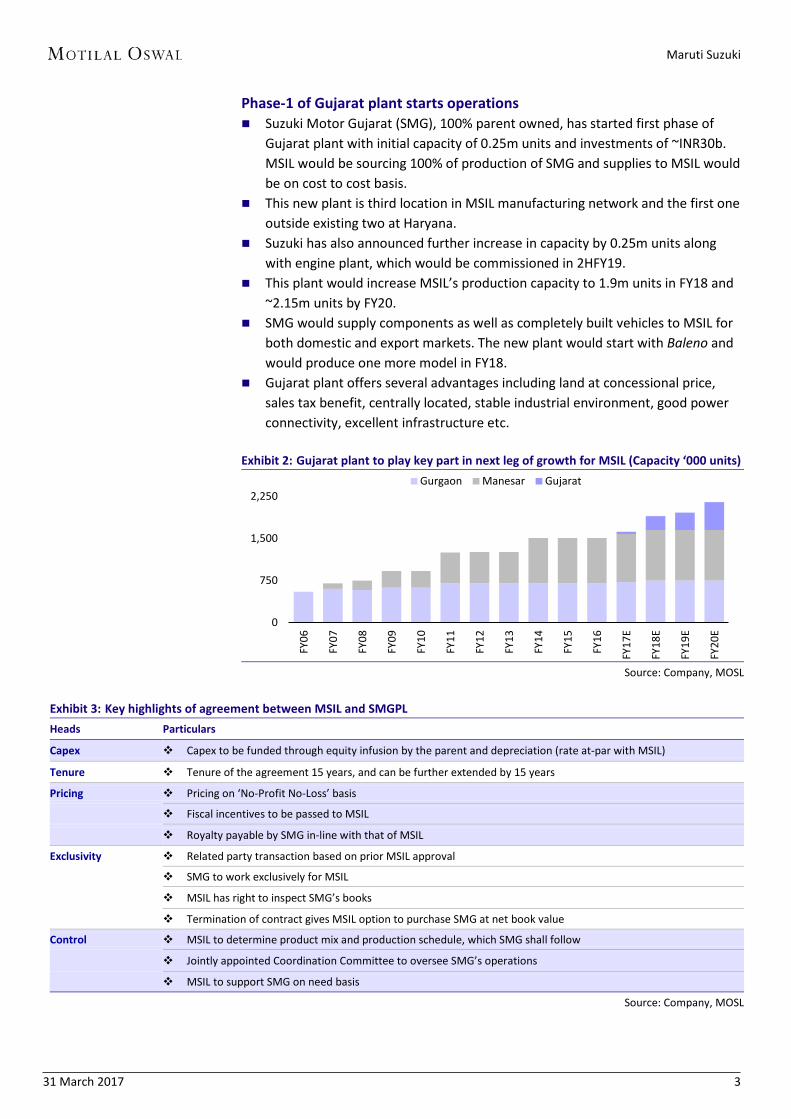
Phase-1 of Gujarat plant starts operations Suzuki Motor Gujarat (SMG), 100% parent owned, has started first phase of
Gujarat plant with initial capacity of 0.25m units and investments of ~INR30b.MSIL would be sourcing 100% of production of SMG and supplies to MSIL wouldbe on cost to cost basis.
This new plant is third location in MSIL manufacturing network and the first oneoutside existing two at Haryana.
Suzuki has also announced further increase in capacity by 0.25m units alongwith engine plant, which would be commissioned in 2HFY19.
This plant would increase MSIL’s production capacity to 1.9m units in FY18 and~2.15m units by FY20.
SMG would supply components as well as completely built vehicles to MSIL forboth domestic and export markets. The new plant would start with Baleno andwould produce one more model in FY18.
Gujarat plant offers several advantages including land at concessional price,sales tax benefit, centrally located, stable industrial environment, good powerconnectivity, excellent infrastructure etc.
Exhibit 2: Gujarat plant to play key part in next leg of growth for MSIL (Capacity ‘000 units)
Source: Company, MOSL
Exhibit 3: Key highlights of agreement between MSIL and SMGPL Heads Particulars
Capex Capex to be funded through equity infusion by the parent and depreciation (rate at-par with MSIL)
Tenure Tenure of the agreement 15 years, and can be further extended by 15 years
Pricing Pricing on ‘No-Profit No-Loss’ basis
Fiscal incentives to be passed to MSIL
Royalty payable by SMG in-line with that of MSIL
Exclusivity Related party transaction based on prior MSIL approval
SMG to work exclusively for MSIL
MSIL has right to inspect SMG’s books
Termination of contract gives MSIL option to purchase SMG at net book value
Control MSIL to determine product mix and production schedule, which SMG shall follow
Jointly appointed Coordination Committee to oversee SMG’s operations
MSIL to support SMG on need basis
Source: Company, MOSL
0
750
1,500
2,250
FY06
FY07
FY08
FY09
FY10
FY11
FY12
FY13
FY14
FY15
FY16
FY17
E
FY18
E
FY19
E
FY20
E
Gurgaon Manesar Gujarat
Maruti Suzuki
31 March 2017 4
Adds much-needed capacity for growth MSIL has a waiting period of up to 8 months for the Baleno, Vitara Brezza and
Ignis. There is an order backlog of ~85,000 for the Baleno, ~50,000 for theBrezza and ~12,500 for the Ignis.
Gujarat plant would add ~13% to total MSIL capacity in FY18E and contribute~23% by FY20E.
The Gujarat plant is expected to ease capacity constraints and allow it to sellmore of the Baleno.
The new plant would also drastically reduce waiting periods for other productsthat have had to be sacrificed to meet the demand for more popular models likethe Baleno and Vitara Brezza.
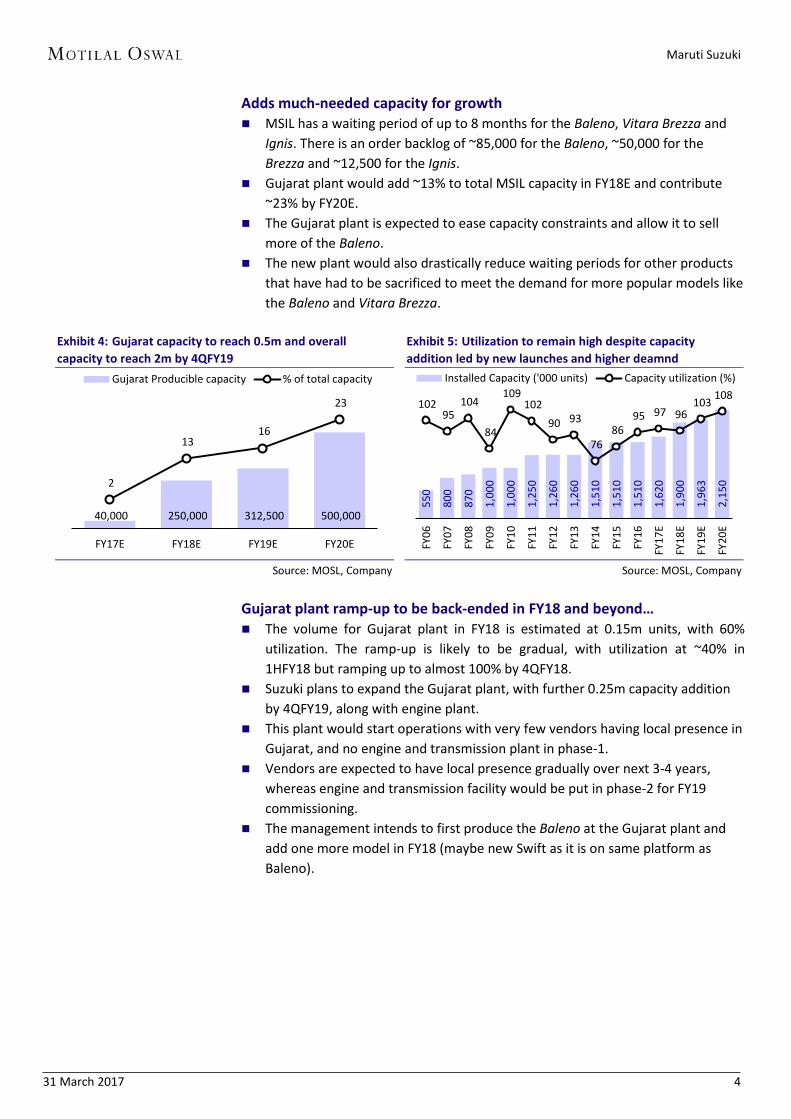
Exhibit 4: Gujarat capacity to reach 0.5m and overall capacity to reach 2m by 4QFY19
Source: MOSL, Company
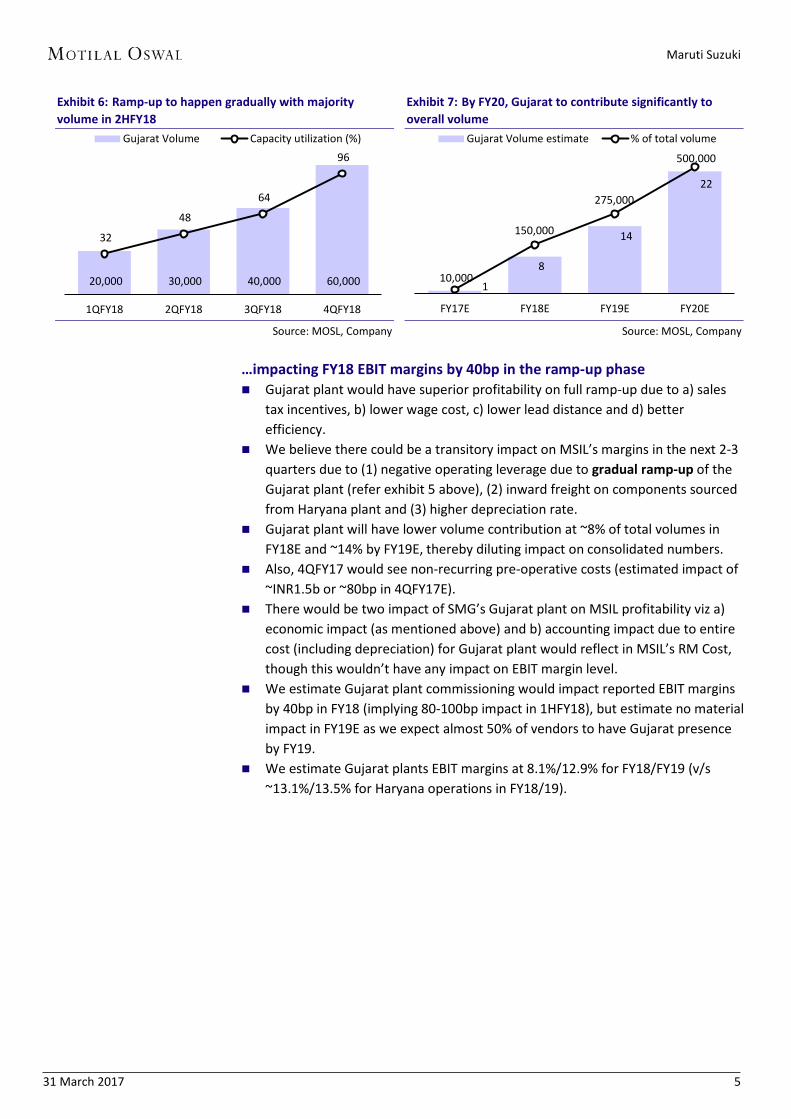
Exhibit 5: Utilization to remain high despite capacity addition led by new launches and higher deamnd
Source: MOSL, Company
Gujarat plant ramp-up to be back-ended in FY18 and beyond… The volume for Gujarat plant in FY18 is estimated at 0.15m units, with 60%
utilization. The ramp-up is likely to be gradual, with utilization at ~40% in1HFY18 but ramping up to almost 100% by 4QFY18.
Suzuki plans to expand the Gujarat plant, with further 0.25m capacity additionby 4QFY19, along with engine plant.
This plant would start operations with very few vendors having local presence inGujarat, and no engine and transmission plant in phase-1.
Vendors are expected to have local presence gradually over next 3-4 years,whereas engine and transmission facility would be put in phase-2 for FY19commissioning.
The management intends to first produce the Baleno at the Gujarat plant andadd one more model in FY18 (maybe new Swift as it is on same platform asBaleno).
40,000 250,000 312,500 500,000
2
13 16
23
FY17E FY18E FY19E FY20E
Gujarat Producible capacity % of total capacity
550
800
870
1,0
00
1,0
00
1,2
50
1,2
60
1,2
60
1,5
10
1,5
10
1,5
10
1,6
20
1,9
00
1,9
63
2,1
50
102 95
104
84
109 102
90 93
76 86
95 97 96 103 108
FY06
FY07
FY08
FY09
FY10
FY11
FY12
FY13
FY14
FY15
FY16
FY17
E
FY18
E
FY19
E
FY20
E
Installed Capacity ('000 units) Capacity utilization (%)
Maruti Suzuki
31 March 2017 5
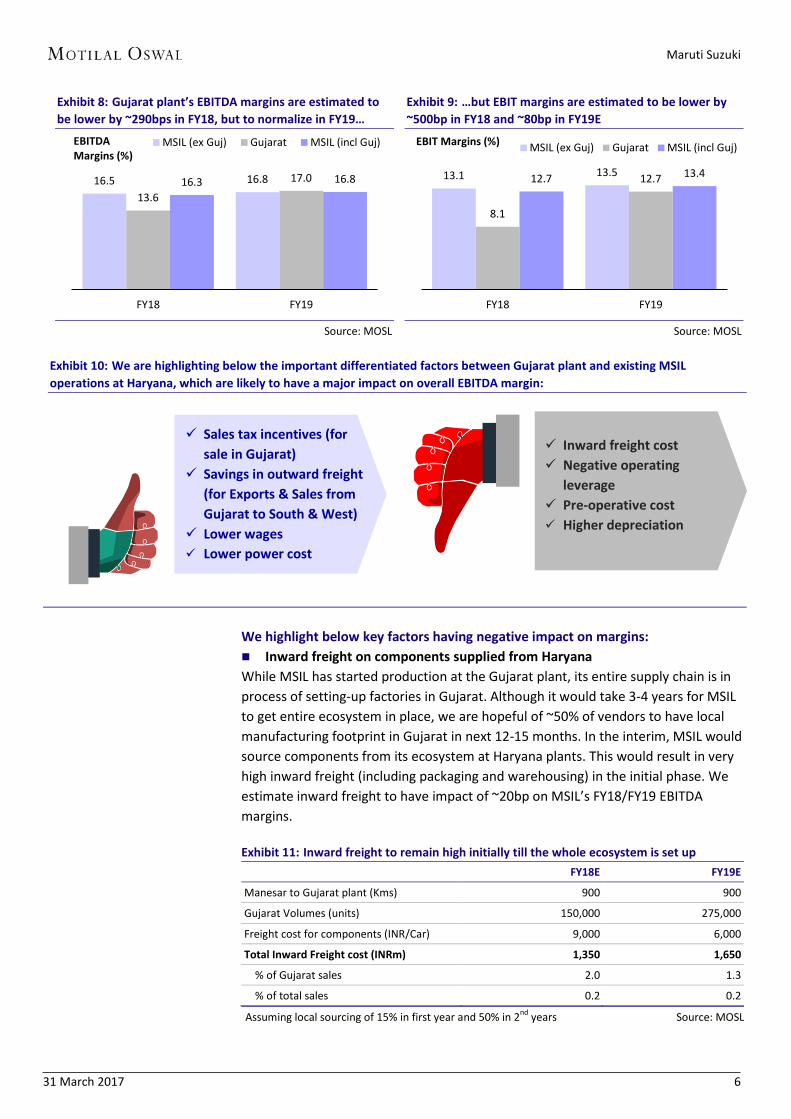
Exhibit 6: Ramp-up to happen gradually with majority volume in 2HFY18
Source: MOSL, Company
Exhibit 7: By FY20, Gujarat to contribute significantly to overall volume
Source: MOSL, Company
…impacting FY18 EBIT margins by 40bp in the ramp-up phase Gujarat plant would have superior profitability on full ramp-up due to a) sales
tax incentives, b) lower wage cost, c) lower lead distance and d) betterefficiency.
We believe there could be a transitory impact on MSIL’s margins in the next 2-3quarters due to (1) negative operating leverage due to gradual ramp-up of theGujarat plant (refer exhibit 5 above), (2) inward freight on components sourcedfrom Haryana plant and (3) higher depreciation rate.
Gujarat plant will have lower volume contribution at ~8% of total volumes inFY18E and ~14% by FY19E, thereby diluting impact on consolidated numbers.
Also, 4QFY17 would see non-recurring pre-operative costs (estimated impact of~INR1.5b or ~80bp in 4QFY17E).
There would be two impact of SMG’s Gujarat plant on MSIL profitability viz a)economic impact (as mentioned above) and b) accounting impact due to entirecost (including depreciation) for Gujarat plant would reflect in MSIL’s RM Cost,though this wouldn’t have any impact on EBIT margin level.
We estimate Gujarat plant commissioning would impact reported EBIT marginsby 40bp in FY18 (implying 80-100bp impact in 1HFY18), but estimate no materialimpact in FY19E as we expect almost 50% of vendors to have Gujarat presenceby FY19.
We estimate Gujarat plants EBIT margins at 8.1%/12.9% for FY18/FY19 (v/s~13.1%/13.5% for Haryana operations in FY18/19).
20,000 30,000 40,000 60,000
32
48
64
96
1QFY18 2QFY18 3QFY18 4QFY18
Gujarat Volume Capacity utilization (%)
10,000
150,000
275,000
500,000
1
8
14
22
FY17E FY18E FY19E FY20E
Gujarat Volume estimate % of total volume
Maruti Suzuki
31 March 2017 6
Exhibit 8: Gujarat plant’s EBITDA margins are estimated to be lower by ~290bps in FY18, but to normalize in FY19…
Source: MOSL
Exhibit 9: …but EBIT margins are estimated to be lower by ~500bp in FY18 and ~80bp in FY19E
Source: MOSL
Exhibit 10: We are highlighting below the important differentiated factors between Gujarat plant and existing MSIL operations at Haryana, which are likely to have a major impact on overall EBITDA margin:
We highlight below key factors having negative impact on margins: Inward freight on components supplied from HaryanaWhile MSIL has started production at the Gujarat plant, its entire supply chain is inprocess of setting-up factories in Gujarat. Although it would take 3-4 years for MSILto get entire ecosystem in place, we are hopeful of ~50% of vendors to have localmanufacturing footprint in Gujarat in next 12-15 months. In the interim, MSIL wouldsource components from its ecosystem at Haryana plants. This would result in veryhigh inward freight (including packaging and warehousing) in the initial phase. Weestimate inward freight to have impact of ~20bp on MSIL’s FY18/FY19 EBITDAmargins.
Exhibit 11: Inward freight to remain high initially till the whole ecosystem is set up FY18E FY19E
Manesar to Gujarat plant (Kms) 900 900
Gujarat Volumes (units) 150,000 275,000
Freight cost for components (INR/Car) 9,000 6,000
Total Inward Freight cost (INRm) 1,350 1,650
% of Gujarat sales 2.0 1.3
% of total sales 0.2 0.2
Assuming local sourcing of 15% in first year and 50% in 2nd years Source: MOSL
16.5 16.8 13.6
17.0 16.3 16.8
FY18 FY19
MSIL (ex Guj) Gujarat MSIL (incl Guj)EBITDA Margins (%)
13.1 13.5
8.1
12.7 12.7 13.4
FY18 FY19
MSIL (ex Guj) Gujarat MSIL (incl Guj)EBIT Margins (%)
Sales tax incentives (forsale in Gujarat)
Savings in outward freight(for Exports & Sales fromGujarat to South & West)
Lower wages Lower power cost
Inward freight cost Negative operating
leverage Pre-operative cost Higher depreciation
Maruti Suzuki
31 March 2017 7
Negative operating leverageConsidering gradual ramp-up to 100% utilization only by 4QFY18, negativeoperating leverage (for staff cost and fixed overheads) would impact Gujaratplant’s margins by ~390bp in FY18 and ~110bp in FY19 (as line-2 and engineplant starts operations by 4QFY19). There would be further negative operatingleverage impact at EBIT margin level due to depreciation (beyond impact ofhigher depreciation rate).
Higher depreciationMSIL’s depreciation policy for Plant and Machinery is based on useful life of 8-11years. Assuming, Gujarat plant would be depreciated in 8 years or at 12.5%, asagainst current blended rate of 8.5% of gross block due to vintage of Haryanaplants. Depreciation (as % of sales) would be higher for the Gujarat plant by~200bp for FY18 and ~100bp for FY19, impacting EBIT margins.
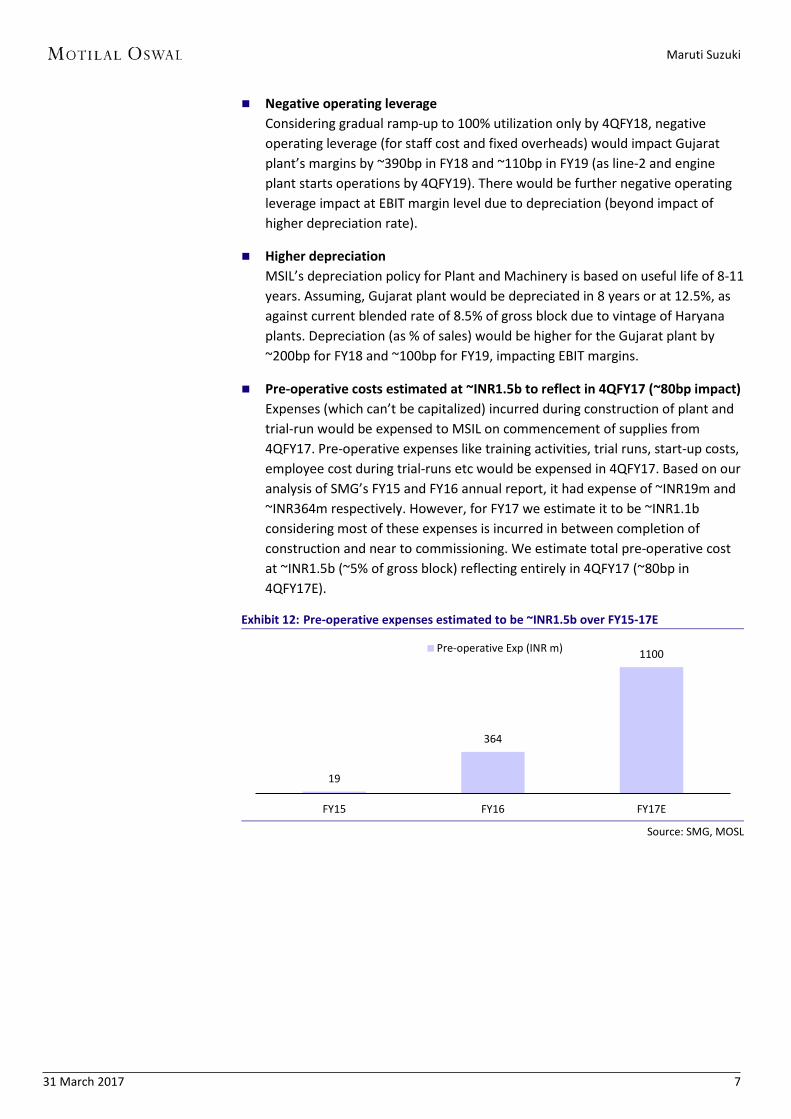
Pre-operative costs estimated at ~INR1.5b to reflect in 4QFY17 (~80bp impact)Expenses (which can’t be capitalized) incurred during construction of plant andtrial-run would be expensed to MSIL on commencement of supplies from4QFY17. Pre-operative expenses like training activities, trial runs, start-up costs,employee cost during trial-runs etc would be expensed in 4QFY17. Based on ouranalysis of SMG’s FY15 and FY16 annual report, it had expense of ~INR19m and~INR364m respectively. However, for FY17 we estimate it to be ~INR1.1bconsidering most of these expenses is incurred in between completion ofconstruction and near to commissioning. We estimate total pre-operative costat ~INR1.5b (~5% of gross block) reflecting entirely in 4QFY17 (~80bp in4QFY17E).
Exhibit 12: Pre-operative expenses estimated to be ~INR1.5b over FY15-17E
Source: SMG, MOSL
19
364
1100
FY15 FY16 FY17E
Pre-operative Exp (INR m)
Maruti Suzuki
31 March 2017 8
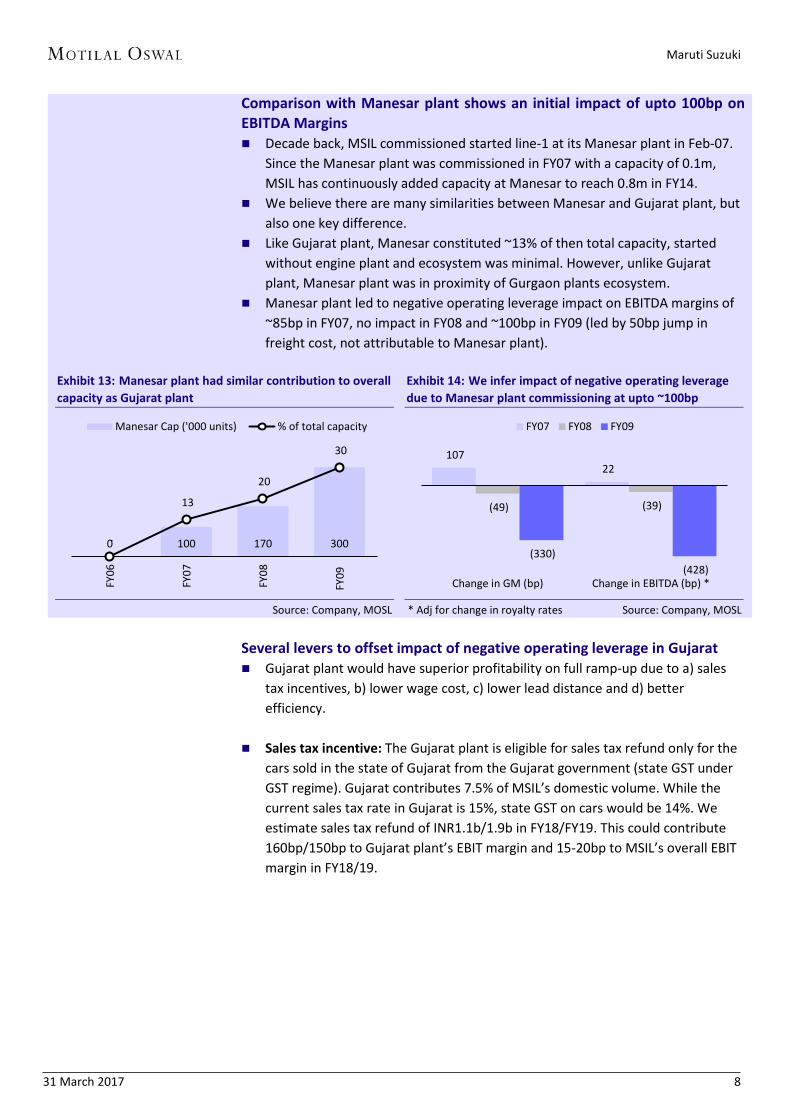
Comparison with Manesar plant shows an initial impact of upto 100bp on EBITDA Margins Decade back, MSIL commissioned started line-1 at its Manesar plant in Feb-07.
Since the Manesar plant was commissioned in FY07 with a capacity of 0.1m,MSIL has continuously added capacity at Manesar to reach 0.8m in FY14.
We believe there are many similarities between Manesar and Gujarat plant, butalso one key difference.
Like Gujarat plant, Manesar constituted ~13% of then total capacity, startedwithout engine plant and ecosystem was minimal. However, unlike Gujaratplant, Manesar plant was in proximity of Gurgaon plants ecosystem.
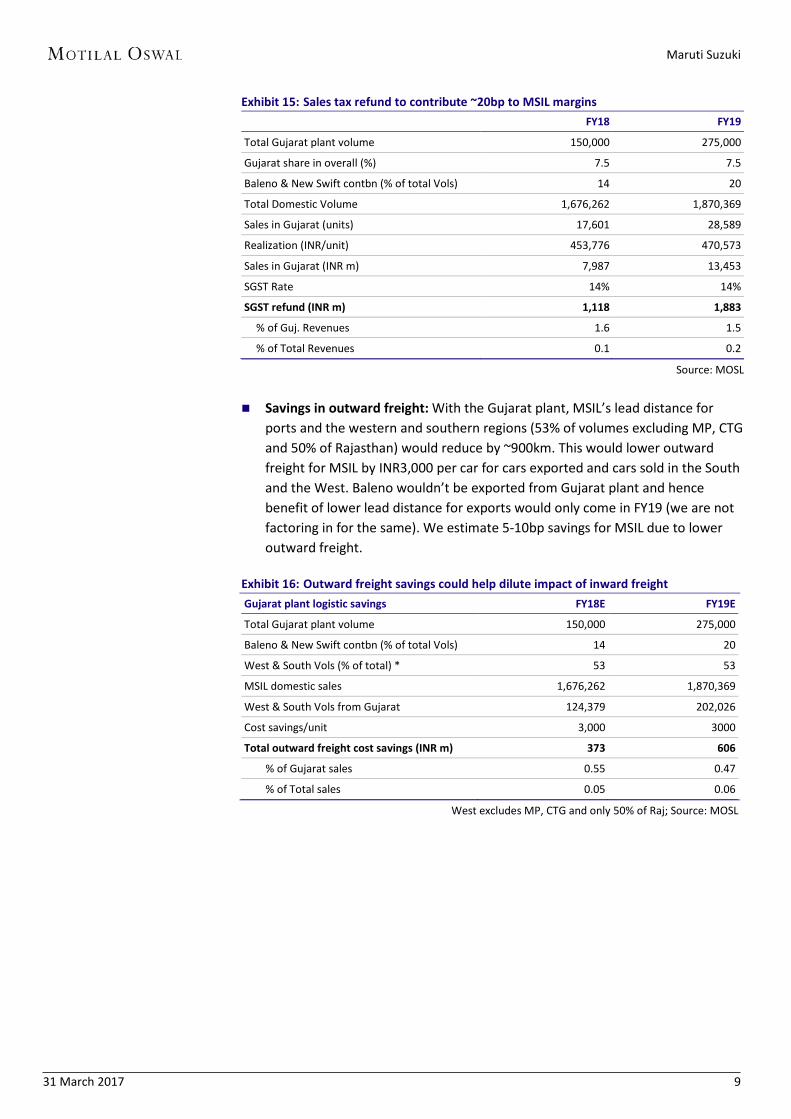
Manesar plant led to negative operating leverage impact on EBITDA margins of~85bp in FY07, no impact in FY08 and ~100bp in FY09 (led by 50bp jump infreight cost, not attributable to Manesar plant).
Exhibit 13: Manesar plant had similar contribution to overall capacity as Gujarat plant
Source: Company, MOSL
Exhibit 14: We infer impact of negative operating leverage due to Manesar plant commissioning at upto ~100bp
* Adj for change in royalty rates Source: Company, MOSL
Several levers to offset impact of negative operating leverage in Gujarat Gujarat plant would have superior profitability on full ramp-up due to a) sales
tax incentives, b) lower wage cost, c) lower lead distance and d) betterefficiency.
Sales tax incentive: The Gujarat plant is eligible for sales tax refund only for thecars sold in the state of Gujarat from the Gujarat government (state GST underGST regime). Gujarat contributes 7.5% of MSIL’s domestic volume. While thecurrent sales tax rate in Gujarat is 15%, state GST on cars would be 14%. Weestimate sales tax refund of INR1.1b/1.9b in FY18/FY19. This could contribute160bp/150bp to Gujarat plant’s EBIT margin and 15-20bp to MSIL’s overall EBITmargin in FY18/19.
0 100 170 300 -
13
20
30
FY06
FY07
FY08
FY09
Manesar Cap ('000 units) % of total capacity
107 22
(49) (39)
(330) (428)
Change in GM (bp) Change in EBITDA (bp) *
FY07 FY08 FY09
Maruti Suzuki
31 March 2017 9
Exhibit 15: Sales tax refund to contribute ~20bp to MSIL margins FY18 FY19
Total Gujarat plant volume 150,000 275,000
Gujarat share in overall (%) 7.5 7.5
Baleno & New Swift contbn (% of total Vols) 14 20
Total Domestic Volume 1,676,262 1,870,369
Sales in Gujarat (units) 17,601 28,589
Realization (INR/unit) 453,776 470,573
Sales in Gujarat (INR m) 7,987 13,453
SGST Rate 14% 14%
SGST refund (INR m) 1,118 1,883
% of Guj. Revenues 1.6 1.5
% of Total Revenues 0.1 0.2
Source: MOSL
Savings in outward freight: With the Gujarat plant, MSIL’s lead distance forports and the western and southern regions (53% of volumes excluding MP, CTGand 50% of Rajasthan) would reduce by ~900km. This would lower outwardfreight for MSIL by INR3,000 per car for cars exported and cars sold in the Southand the West. Baleno wouldn’t be exported from Gujarat plant and hencebenefit of lower lead distance for exports would only come in FY19 (we are notfactoring in for the same). We estimate 5-10bp savings for MSIL due to loweroutward freight.
Exhibit 16: Outward freight savings could help dilute impact of inward freight Gujarat plant logistic savings FY18E FY19E
Total Gujarat plant volume 150,000 275,000
Baleno & New Swift contbn (% of total Vols) 14 20
West & South Vols (% of total) * 53 53
MSIL domestic sales 1,676,262 1,870,369
West & South Vols from Gujarat 124,379 202,026
Cost savings/unit 3,000 3000
Total outward freight cost savings (INR m) 373 606
% of Gujarat sales 0.55 0.47
% of Total sales 0.05 0.06
West excludes MP, CTG and only 50% of Raj; Source: MOSL
Maruti Suzuki
31 March 2017 10
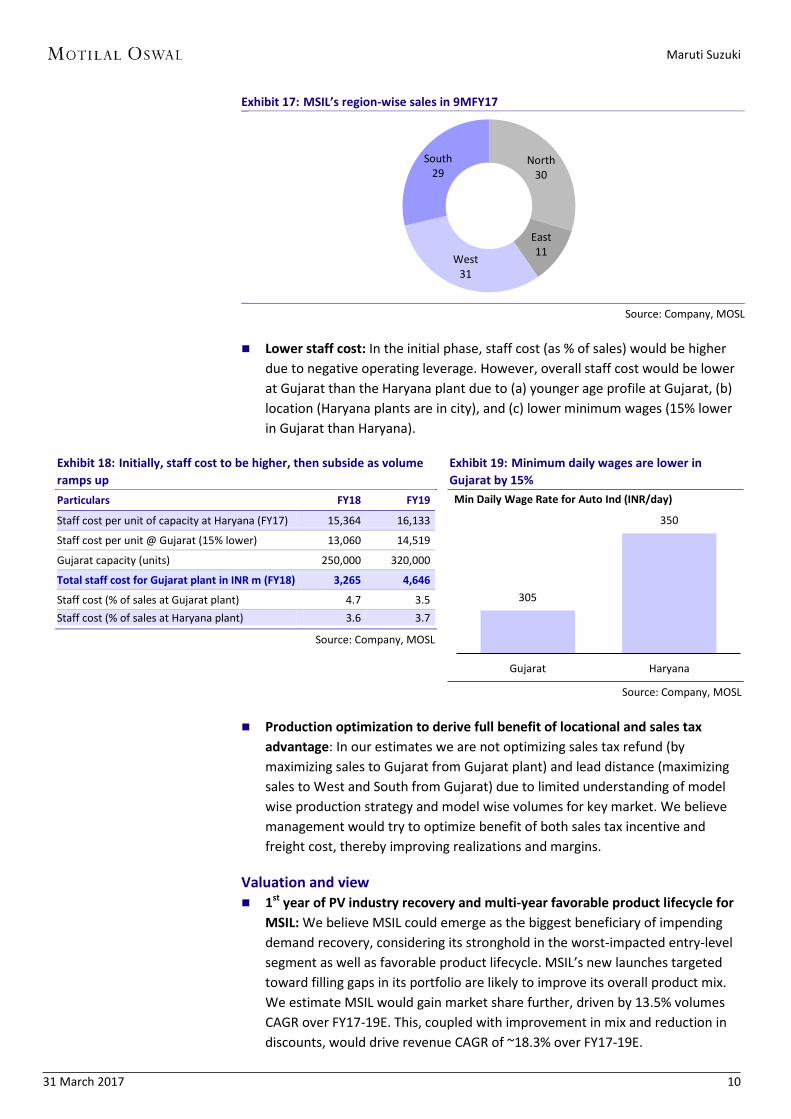
Exhibit 17: MSIL’s region-wise sales in 9MFY17
Source: Company, MOSL
Lower staff cost: In the initial phase, staff cost (as % of sales) would be higherdue to negative operating leverage. However, overall staff cost would be lowerat Gujarat than the Haryana plant due to (a) younger age profile at Gujarat, (b)location (Haryana plants are in city), and (c) lower minimum wages (15% lowerin Gujarat than Haryana).
Exhibit 18: Initially, staff cost to be higher, then subside as volume ramps up Particulars FY18 FY19
Staff cost per unit of capacity at Haryana (FY17) 15,364 16,133
Staff cost per unit @ Gujarat (15% lower) 13,060 14,519
Gujarat capacity (units) 250,000 320,000
Total staff cost for Gujarat plant in INR m (FY18) 3,265 4,646
Staff cost (% of sales at Gujarat plant) 4.7 3.5 Staff cost (% of sales at Haryana plant) 3.6 3.7
Source: Company, MOSL
Exhibit 19: Minimum daily wages are lower in Gujarat by 15%
Source: Company, MOSL
Production optimization to derive full benefit of locational and sales taxadvantage: In our estimates we are not optimizing sales tax refund (bymaximizing sales to Gujarat from Gujarat plant) and lead distance (maximizingsales to West and South from Gujarat) due to limited understanding of modelwise production strategy and model wise volumes for key market. We believemanagement would try to optimize benefit of both sales tax incentive andfreight cost, thereby improving realizations and margins.
Valuation and view 1st year of PV industry recovery and multi-year favorable product lifecycle for
MSIL: We believe MSIL could emerge as the biggest beneficiary of impendingdemand recovery, considering its stronghold in the worst-impacted entry-levelsegment as well as favorable product lifecycle. MSIL’s new launches targetedtoward filling gaps in its portfolio are likely to improve its overall product mix.We estimate MSIL would gain market share further, driven by 13.5% volumesCAGR over FY17-19E. This, coupled with improvement in mix and reduction indiscounts, would drive revenue CAGR of ~18.3% over FY17-19E.
North 30
East 11 West
31
South 29
305
350
Gujarat Haryana
Min Daily Wage Rate for Auto Ind (INR/day)
Maruti Suzuki
31 March 2017 11
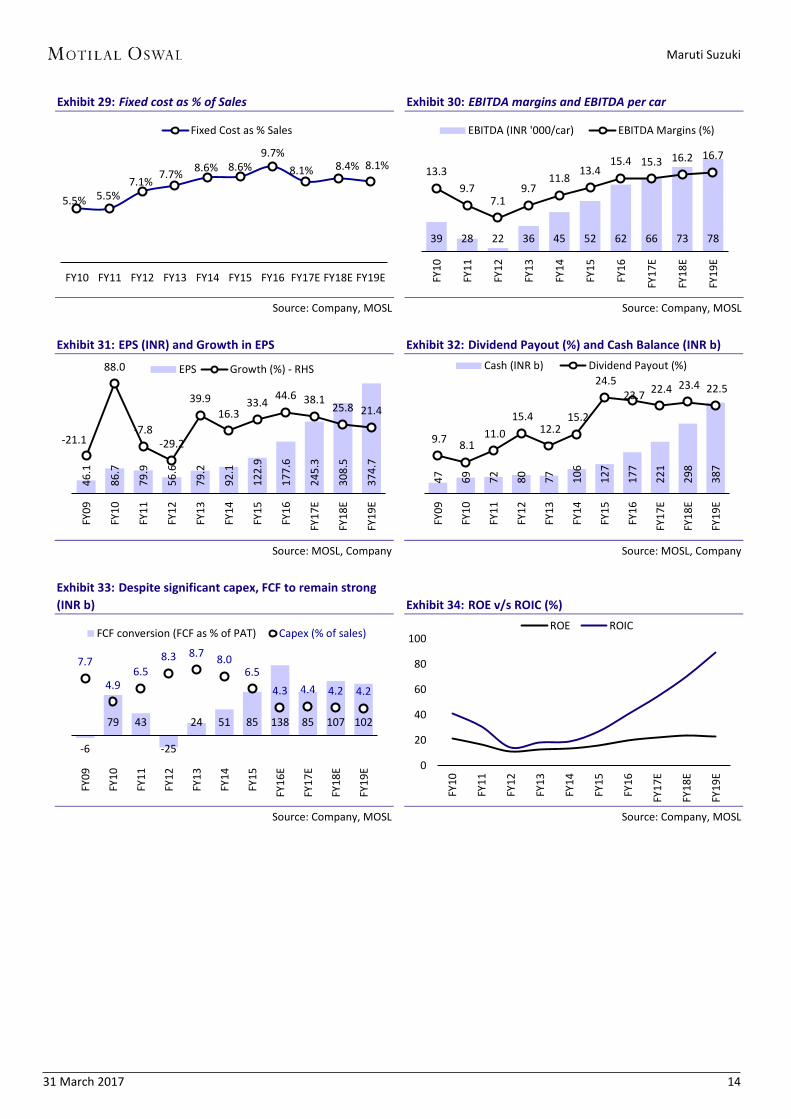
EBITD margins to moderate from recent highs but remain healthy: MSIL’s EBITmargins are estimated to decline from peak of 13.5% in 2QFY17 to ~12.5% inFY18 and 13.2% in FY19 due to impact of Gujarat plant and recovery incommodity prices. We believe EBIT margins will remain healthy at 12-13%,driven by a) discounts reduction with demand revival, b) mix improvement, c)benefits of operating leverage and d) reducing exposure to JPY due to exports toJapan and royalty based on INR for new products.
Strong margins, asset-light model to result in strong FCF generation and RoEimprovement: The Gujarat plant arrangement with its parent Suzuki will makeMSIL’s business asset-light, thereby allowing management to focus more onmarketing. We expect strong cumulative FCF generation of ~INR277.6b overFY17-19E, despite factoring in for capex of ~INR105b. RoE is estimated toimprove 100bp to ~23.3%, while RoIC is likely to improve by 34.9pp to ~89.3%by FY19E.
Structural improvement in business to drive further re-rating: Allbusiness/financial parameters have substantially improved over last few yearsand are expected to strengthen further (refer Exhibit 55). Business parameterssuch as industry consolidation, market share improvement, rising ruralcontribution, reduced JPY exposure and improving share of premium productshave improved MSIL’s positioning considerably. Consequently, we expectfinancial parameters to exhibit improvements over next five years. In summary,the moat for MSIL is expected to strengthen further, which should led to furtherre-rating of the stock.
Buy with TP of ~INR7,443: We remain positive on MSIL, considering a) 1st yearof recovery, b) multi-year favorable product lifecycle, c) improvement in productmix (increasing share of premium products) aiding realizations and consequentlymargins, d) reducing JPY exposure, e) improvement in FCF conversion and f) highFCF generation and sharp improvement in RoIC as capex intensity reduces. OurEPS are 15-20% higher than the consensus numbers, driven by stronger revenuegrowth and higher margins. The stock trades at 19x/15.6x FY18E/19E EPS. As aresult, we value MSIL at 20x Mar-19 core EPS (~20% premium to 5 year averagecore EPS). We have increased premium to LPA from 10% to 20% as we have gotmore comfort on quantum and longevity of impact of Gujarat plant and havecushion to estimates (Our JPYINR assumption adverse by 14% than the spotrate).
Maruti Suzuki
31 March 2017 12
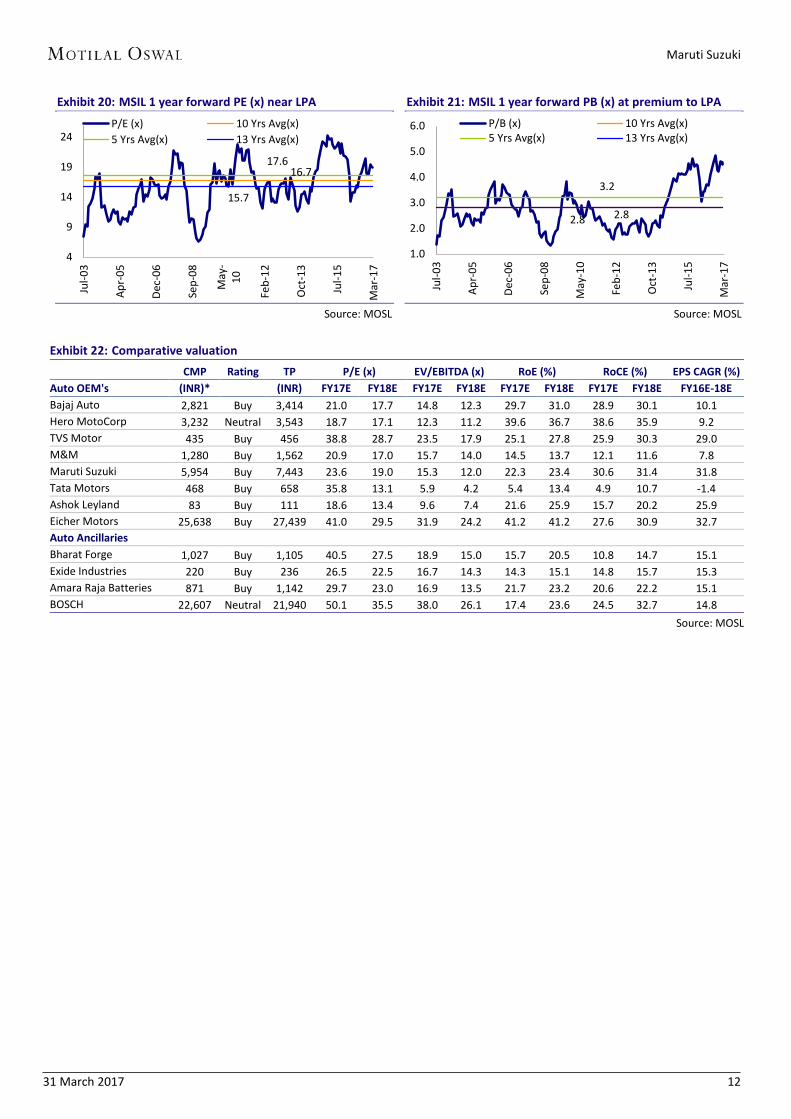
Exhibit 20: MSIL 1 year forward PE (x) near LPA
Source: MOSL
Exhibit 21: MSIL 1 year forward PB (x) at premium to LPA
Source: MOSL
Exhibit 22: Comparative valuation CMP Rating TP P/E (x) EV/EBITDA (x) RoE (%) RoCE (%) EPS CAGR (%)
Auto OEM's (INR)* (INR) FY17E FY18E FY17E FY18E FY17E FY18E FY17E FY18E FY16E-18E Bajaj Auto 2,821 Buy 3,414 21.0 17.7 14.8 12.3 29.7 31.0 28.9 30.1 10.1 Hero MotoCorp 3,232 Neutral 3,543 18.7 17.1 12.3 11.2 39.6 36.7 38.6 35.9 9.2 TVS Motor 435 Buy 456 38.8 28.7 23.5 17.9 25.1 27.8 25.9 30.3 29.0 M&M 1,280 Buy 1,562 20.9 17.0 15.7 14.0 14.5 13.7 12.1 11.6 7.8 Maruti Suzuki 5,954 Buy 7,443 23.6 19.0 15.3 12.0 22.3 23.4 30.6 31.4 31.8 Tata Motors 468 Buy 658 35.8 13.1 5.9 4.2 5.4 13.4 4.9 10.7 -1.4Ashok Leyland 83 Buy 111 18.6 13.4 9.6 7.4 21.6 25.9 15.7 20.2 25.9 Eicher Motors 25,638 Buy 27,439 41.0 29.5 31.9 24.2 41.2 41.2 27.6 30.9 32.7 Auto Ancillaries Bharat Forge 1,027 Buy 1,105 40.5 27.5 18.9 15.0 15.7 20.5 10.8 14.7 15.1 Exide Industries 220 Buy 236 26.5 22.5 16.7 14.3 14.3 15.1 14.8 15.7 15.3 Amara Raja Batteries 871 Buy 1,142 29.7 23.0 16.9 13.5 21.7 23.2 20.6 22.2 15.1 BOSCH 22,607 Neutral 21,940 50.1 35.5 38.0 26.1 17.4 23.6 24.5 32.7 14.8
Source: MOSL
16.7 17.6
15.7
4
9
14
19
24
Jul-0
3
Apr-
05
Dec-
06
Sep-
08
May
-10
Feb-
12
Oct
-13
Jul-1
5
Mar
-17
P/E (x) 10 Yrs Avg(x)5 Yrs Avg(x) 13 Yrs Avg(x)
2.8
3.2
2.8
1.0
2.0
3.0
4.0
5.0
6.0
Jul-0
3
Apr-
05
Dec-
06
Sep-
08
May
-10
Feb-
12
Oct
-13
Jul-1
5
Mar
-17
P/B (x) 10 Yrs Avg(x)5 Yrs Avg(x) 13 Yrs Avg(x)
Maruti Suzuki
31 March 2017 13
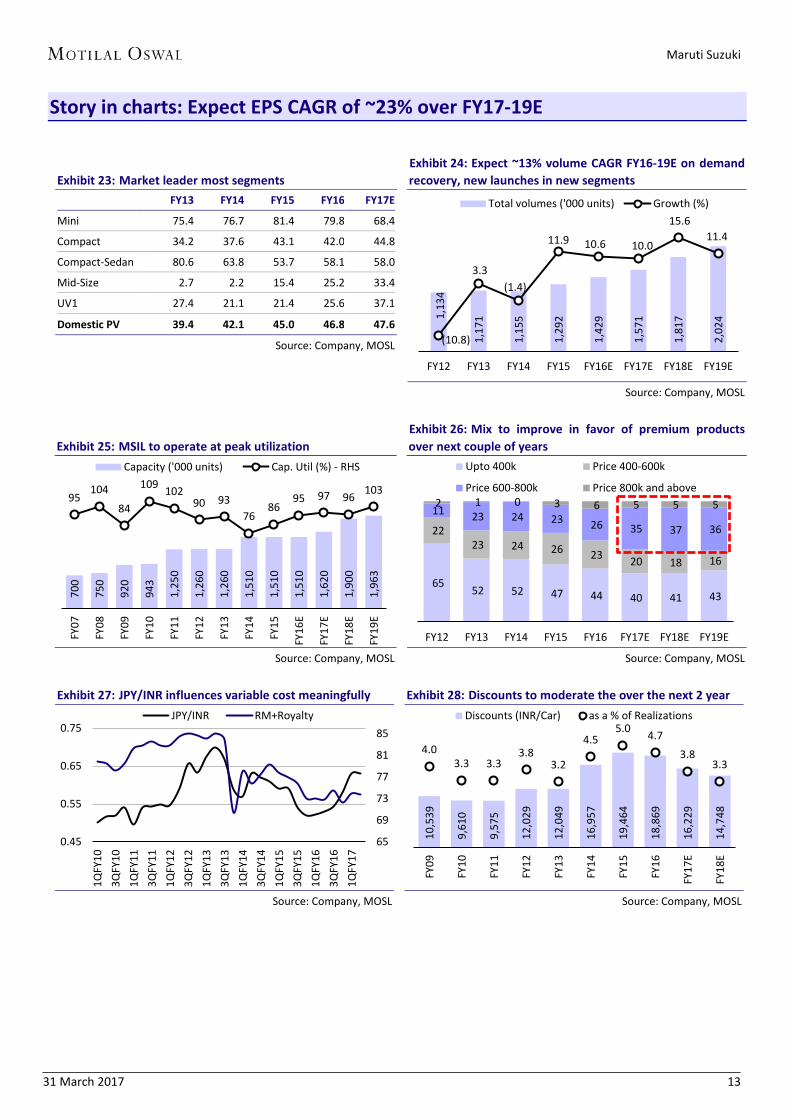
Story in charts: Expect EPS CAGR of ~23% over FY17-19E
Exhibit 23: Market leader most segments FY13 FY14 FY15 FY16 FY17E
Mini 75.4 76.7 81.4 79.8 68.4
Compact 34.2 37.6 43.1 42.0 44.8
Compact-Sedan 80.6 63.8 53.7 58.1 58.0
Mid-Size 2.7 2.2 15.4 25.2 33.4
UV1 27.4 21.1 21.4 25.6 37.1
Domestic PV 39.4 42.1 45.0 46.8 47.6
Source: Company, MOSL
Exhibit 24: Expect ~13% volume CAGR FY16-19E on demand recovery, new launches in new segments
Source: Company, MOSL
Exhibit 25: MSIL to operate at peak utilization
Source: Company, MOSL
Exhibit 26: Mix to improve in favor of premium products over next couple of years
Source: Company, MOSL
Exhibit 27: JPY/INR influences variable cost meaningfully
Source: Company, MOSL
Exhibit 28: Discounts to moderate the over the next 2 year
Source: Company, MOSL
1,13
4
1,17
1
1,15
5
1,29
2
1,42
9
1,57
1
1,81
7
2,02
4
(10.8)
3.3 (1.4)
11.9 10.6 10.0
15.6 11.4
FY12 FY13 FY14 FY15 FY16E FY17E FY18E FY19E
Total volumes ('000 units) Growth (%)
700
750
920
943
1,2
50
1,2
60
1,2
60
1,5
10
1,5
10
1,5
10
1,6
20
1,9
00
1,9
63
95 104
84
109 10290 93
76 86
95 97 96 103
FY07
FY08
FY09
FY10
FY11
FY12
FY13
FY14
FY15
FY16
E
FY17
E
FY18
E
FY19
E
Capacity ('000 units) Cap. Util (%) - RHS
65 52 52 47 44 40 41 43
22 23 24 26 23 20 18 16
11 23 24 23 26 35 37 36
2 1 0 3 6 5 5 5
FY12 FY13 FY14 FY15 FY16 FY17E FY18E FY19E
Upto 400k Price 400-600k
Price 600-800k Price 800k and above
65
69
73
77
81
85
0.45
0.55
0.65
0.75
1QFY
103Q
FY10
1QFY
113Q
FY11
1QFY
123Q
FY12
1QFY
133Q
FY13
1QFY
143Q
FY14
1QFY
153Q
FY15
1QFY
163Q
FY16
1QFY
17
JPY/INR RM+Royalty
10,5
39
9,61
0
9,57
5
12,0
29
12,0
49
16,9
57
19,4
64
18,8
69
16,2
29
14,7
48
4.0 3.3 3.3
3.8 3.2
4.5 5.0 4.7
3.8 3.3
FY09
FY10
FY11
FY12
FY13
FY14
FY15
FY16
FY17
E
FY18
EDiscounts (INR/Car) as a % of Realizations
Maruti Suzuki
31 March 2017 14
Exhibit 29: Fixed cost as % of Sales
Source: Company, MOSL
Exhibit 30: EBITDA margins and EBITDA per car
Source: Company, MOSL
Exhibit 31: EPS (INR) and Growth in EPS
Source: MOSL, Company
Exhibit 32: Dividend Payout (%) and Cash Balance (INR b)
Source: MOSL, Company
Exhibit 33: Despite significant capex, FCF to remain strong (INR b)
Source: Company, MOSL
Exhibit 34: ROE v/s ROIC (%)
Source: Company, MOSL
5.5% 5.5% 7.1% 7.7% 8.6% 8.6%
9.7% 8.1% 8.4% 8.1%
FY10 FY11 FY12 FY13 FY14 FY15 FY16 FY17E FY18E FY19E
Fixed Cost as % Sales
39 28 22 36 45 52 62 66 73 78
13.3 9.7
7.1 9.7
11.8 13.4 15.4 15.3 16.2 16.7
FY10
FY11
FY12
FY13
FY14
FY15
FY16
FY17
E
FY18
E
FY19
E
EBITDA (INR '000/car) EBITDA Margins (%)
46.1
86.7
79.9
56.6
79.2
92.1
122.
9
177.
6
245.
3
308.
5
374.
7
-21.1
88.0
-7.8-29.2
39.9 16.3
33.4 44.6 38.125.8 21.4
FY09
FY10
FY11
FY12
FY13
FY14
FY15
FY16
FY17
E
FY18
E
FY19
EEPS Growth (%) - RHS
47
69
72
80
77
106
127
177
221
298
387
9.7 8.1 11.0
15.4 12.2
15.2
24.5 23.7 22.4 23.4 22.5
FY09
FY10
FY11
FY12
FY13
FY14
FY15
FY16
FY17
E
FY18
E
FY19
E
Cash (INR b) Dividend Payout (%)
-6
79 43
-25
24 51 85 138 85 107 102
7.7
4.9 6.5
8.3 8.7 8.0 6.5
4.3 4.4 4.2 4.2
FY09
FY10
FY11
FY12
FY13
FY14
FY15
FY16
E
FY17
E
FY18
E
FY19
E
FCF conversion (FCF as % of PAT) Capex (% of sales)
0
20
40
60
80
100
FY10
FY11
FY12
FY13
FY14
FY15
FY16
FY17
E
FY18
E
FY19
E
ROE ROIC
Maruti Suzuki
31 March 2017 15
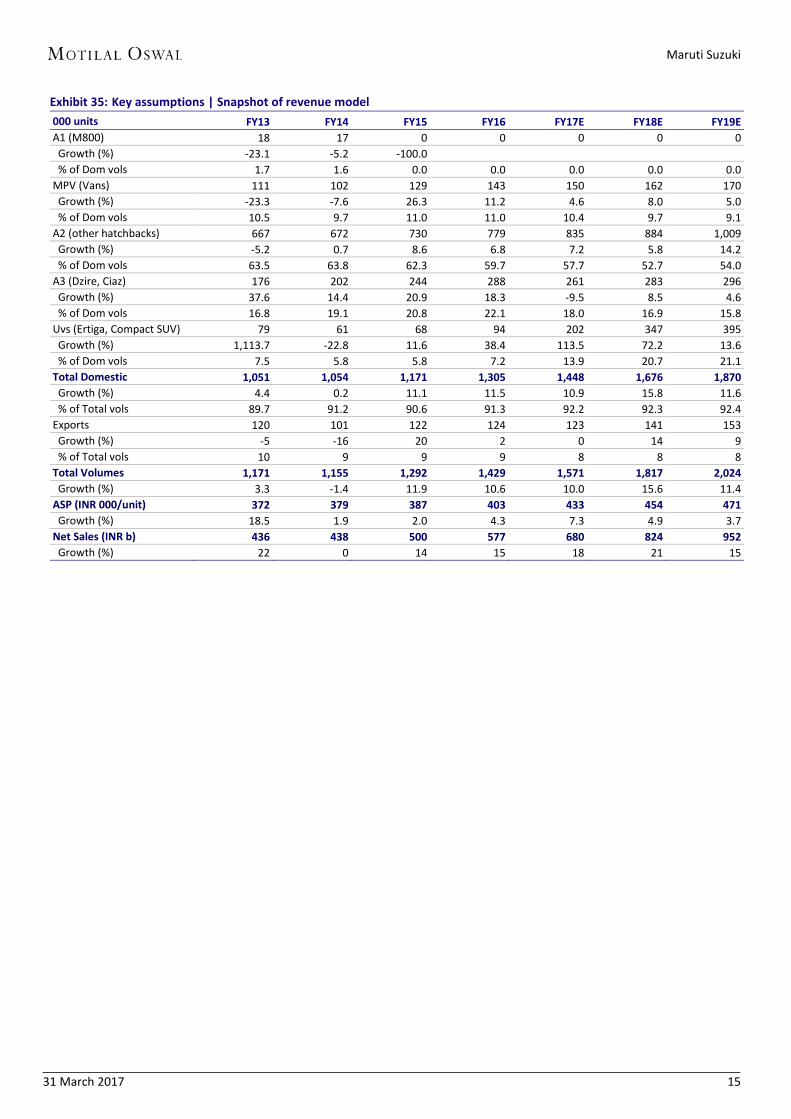
Exhibit 35: Key assumptions | Snapshot of revenue model 000 units FY13 FY14 FY15 FY16 FY17E FY18E FY19E A1 (M800) 18 17 0 0 0 0 0 Growth (%) -23.1 -5.2 -100.0 % of Dom vols 1.7 1.6 0.0 0.0 0.0 0.0 0.0 MPV (Vans) 111 102 129 143 150 162 170 Growth (%) -23.3 -7.6 26.3 11.2 4.6 8.0 5.0 % of Dom vols 10.5 9.7 11.0 11.0 10.4 9.7 9.1 A2 (other hatchbacks) 667 672 730 779 835 884 1,009 Growth (%) -5.2 0.7 8.6 6.8 7.2 5.8 14.2 % of Dom vols 63.5 63.8 62.3 59.7 57.7 52.7 54.0 A3 (Dzire, Ciaz) 176 202 244 288 261 283 296 Growth (%) 37.6 14.4 20.9 18.3 -9.5 8.5 4.6 % of Dom vols 16.8 19.1 20.8 22.1 18.0 16.9 15.8 Uvs (Ertiga, Compact SUV) 79 61 68 94 202 347 395 Growth (%) 1,113.7 -22.8 11.6 38.4 113.5 72.2 13.6 % of Dom vols 7.5 5.8 5.8 7.2 13.9 20.7 21.1 Total Domestic 1,051 1,054 1,171 1,305 1,448 1,676 1,870 Growth (%) 4.4 0.2 11.1 11.5 10.9 15.8 11.6 % of Total vols 89.7 91.2 90.6 91.3 92.2 92.3 92.4 Exports 120 101 122 124 123 141 153 Growth (%) -5 -16 20 2 0 14 9 % of Total vols 10 9 9 9 8 8 8 Total Volumes 1,171 1,155 1,292 1,429 1,571 1,817 2,024 Growth (%) 3.3 -1.4 11.9 10.6 10.0 15.6 11.4 ASP (INR 000/unit) 372 379 387 403 433 454 471 Growth (%) 18.5 1.9 2.0 4.3 7.3 4.9 3.7 Net Sales (INR b) 436 438 500 577 680 824 952 Growth (%) 22 0 14 15 18 21 15
Maruti Suzuki
31 March 2017 16
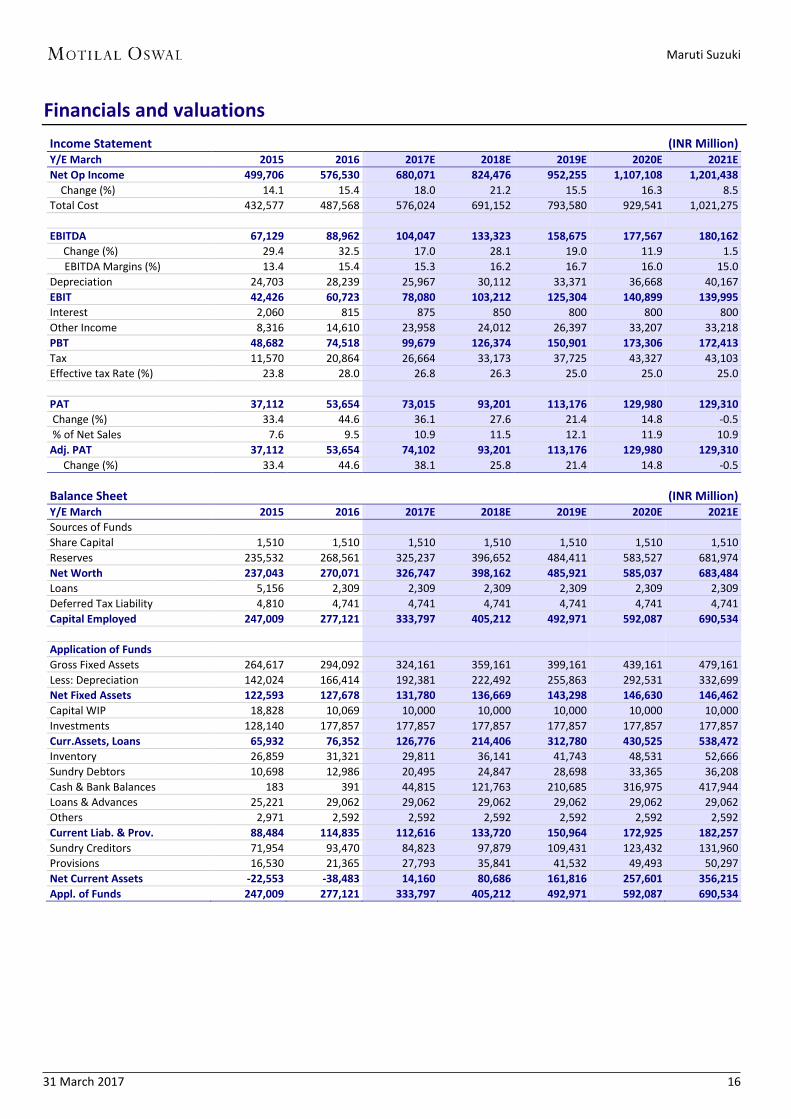
Financials and valuations Income Statement (INR Million) Y/E March 2015 2016 2017E 2018E 2019E 2020E 2021E Net Op Income 499,706 576,530 680,071 824,476 952,255 1,107,108 1,201,438 Change (%) 14.1 15.4 18.0 21.2 15.5 16.3 8.5 Total Cost 432,577 487,568 576,024 691,152 793,580 929,541 1,021,275
EBITDA 67,129 88,962 104,047 133,323 158,675 177,567 180,162 Change (%) 29.4 32.5 17.0 28.1 19.0 11.9 1.5
EBITDA Margins (%) 13.4 15.4 15.3 16.2 16.7 16.0 15.0 Depreciation 24,703 28,239 25,967 30,112 33,371 36,668 40,167 EBIT 42,426 60,723 78,080 103,212 125,304 140,899 139,995 Interest 2,060 815 875 850 800 800 800 Other Income 8,316 14,610 23,958 24,012 26,397 33,207 33,218 PBT 48,682 74,518 99,679 126,374 150,901 173,306 172,413 Tax 11,570 20,864 26,664 33,173 37,725 43,327 43,103 Effective tax Rate (%) 23.8 28.0 26.8 26.3 25.0 25.0 25.0
PAT 37,112 53,654 73,015 93,201 113,176 129,980 129,310 Change (%) 33.4 44.6 36.1 27.6 21.4 14.8 -0.5 % of Net Sales 7.6 9.5 10.9 11.5 12.1 11.9 10.9 Adj. PAT 37,112 53,654 74,102 93,201 113,176 129,980 129,310 Change (%) 33.4 44.6 38.1 25.8 21.4 14.8 -0.5
Balance Sheet (INR Million) Y/E March 2015 2016 2017E 2018E 2019E 2020E 2021E Sources of Funds Share Capital 1,510 1,510 1,510 1,510 1,510 1,510 1,510 Reserves 235,532 268,561 325,237 396,652 484,411 583,527 681,974 Net Worth 237,043 270,071 326,747 398,162 485,921 585,037 683,484 Loans 5,156 2,309 2,309 2,309 2,309 2,309 2,309 Deferred Tax Liability 4,810 4,741 4,741 4,741 4,741 4,741 4,741 Capital Employed 247,009 277,121 333,797 405,212 492,971 592,087 690,534
Application of Funds Gross Fixed Assets 264,617 294,092 324,161 359,161 399,161 439,161 479,161 Less: Depreciation 142,024 166,414 192,381 222,492 255,863 292,531 332,699 Net Fixed Assets 122,593 127,678 131,780 136,669 143,298 146,630 146,462 Capital WIP 18,828 10,069 10,000 10,000 10,000 10,000 10,000 Investments 128,140 177,857 177,857 177,857 177,857 177,857 177,857 Curr.Assets, Loans 65,932 76,352 126,776 214,406 312,780 430,525 538,472 Inventory 26,859 31,321 29,811 36,141 41,743 48,531 52,666 Sundry Debtors 10,698 12,986 20,495 24,847 28,698 33,365 36,208 Cash & Bank Balances 183 391 44,815 121,763 210,685 316,975 417,944 Loans & Advances 25,221 29,062 29,062 29,062 29,062 29,062 29,062 Others 2,971 2,592 2,592 2,592 2,592 2,592 2,592 Current Liab. & Prov. 88,484 114,835 112,616 133,720 150,964 172,925 182,257 Sundry Creditors 71,954 93,470 84,823 97,879 109,431 123,432 131,960 Provisions 16,530 21,365 27,793 35,841 41,532 49,493 50,297 Net Current Assets -22,553 -38,483 14,160 80,686 161,816 257,601 356,215 Appl. of Funds 247,009 277,121 333,797 405,212 492,971 592,087 690,534
Maruti Suzuki
31 March 2017 17
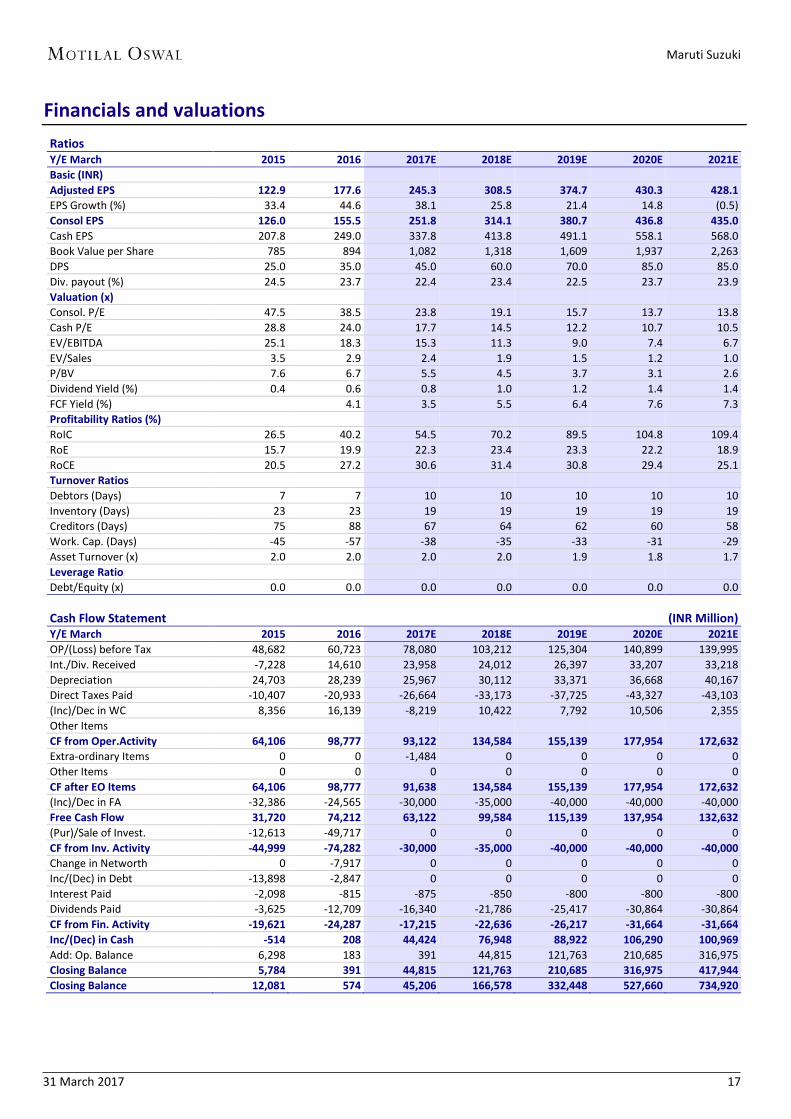
Financials and valuations Ratios Y/E March 2015 2016 2017E 2018E 2019E 2020E 2021E Basic (INR) Adjusted EPS 122.9 177.6 245.3 308.5 374.7 430.3 428.1 EPS Growth (%) 33.4 44.6 38.1 25.8 21.4 14.8 (0.5) Consol EPS 126.0 155.5 251.8 314.1 380.7 436.8 435.0 Cash EPS 207.8 249.0 337.8 413.8 491.1 558.1 568.0 Book Value per Share 785 894 1,082 1,318 1,609 1,937 2,263 DPS 25.0 35.0 45.0 60.0 70.0 85.0 85.0 Div. payout (%) 24.5 23.7 22.4 23.4 22.5 23.7 23.9 Valuation (x) Consol. P/E 47.5 38.5 23.8 19.1 15.7 13.7 13.8 Cash P/E 28.8 24.0 17.7 14.5 12.2 10.7 10.5 EV/EBITDA 25.1 18.3 15.3 11.3 9.0 7.4 6.7 EV/Sales 3.5 2.9 2.4 1.9 1.5 1.2 1.0 P/BV 7.6 6.7 5.5 4.5 3.7 3.1 2.6 Dividend Yield (%) 0.4 0.6 0.8 1.0 1.2 1.4 1.4 FCF Yield (%) 4.1 3.5 5.5 6.4 7.6 7.3 Profitability Ratios (%) RoIC 26.5 40.2 54.5 70.2 89.5 104.8 109.4 RoE 15.7 19.9 22.3 23.4 23.3 22.2 18.9 RoCE 20.5 27.2 30.6 31.4 30.8 29.4 25.1 Turnover Ratios Debtors (Days) 7 7 10 10 10 10 10 Inventory (Days) 23 23 19 19 19 19 19 Creditors (Days) 75 88 67 64 62 60 58 Work. Cap. (Days) -45 -57 -38 -35 -33 -31 -29Asset Turnover (x) 2.0 2.0 2.0 2.0 1.9 1.8 1.7 Leverage Ratio Debt/Equity (x) 0.0 0.0 0.0 0.0 0.0 0.0 0.0
Cash Flow Statement (INR Million) Y/E March 2015 2016 2017E 2018E 2019E 2020E 2021E OP/(Loss) before Tax 48,682 60,723 78,080 103,212 125,304 140,899 139,995 Int./Div. Received -7,228 14,610 23,958 24,012 26,397 33,207 33,218 Depreciation 24,703 28,239 25,967 30,112 33,371 36,668 40,167 Direct Taxes Paid -10,407 -20,933 -26,664 -33,173 -37,725 -43,327 -43,103(Inc)/Dec in WC 8,356 16,139 -8,219 10,422 7,792 10,506 2,355 Other Items CF from Oper.Activity 64,106 98,777 93,122 134,584 155,139 177,954 172,632 Extra-ordinary Items 0 0 -1,484 0 0 0 0 Other Items 0 0 0 0 0 0 0 CF after EO Items 64,106 98,777 91,638 134,584 155,139 177,954 172,632 (Inc)/Dec in FA -32,386 -24,565 -30,000 -35,000 -40,000 -40,000 -40,000Free Cash Flow 31,720 74,212 63,122 99,584 115,139 137,954 132,632 (Pur)/Sale of Invest. -12,613 -49,717 0 0 0 0 0 CF from Inv. Activity -44,999 -74,282 -30,000 -35,000 -40,000 -40,000 -40,000Change in Networth 0 -7,917 0 0 0 0 0 Inc/(Dec) in Debt -13,898 -2,847 0 0 0 0 0 Interest Paid -2,098 -815 -875 -850 -800 -800 -800Dividends Paid -3,625 -12,709 -16,340 -21,786 -25,417 -30,864 -30,864CF from Fin. Activity -19,621 -24,287 -17,215 -22,636 -26,217 -31,664 -31,664Inc/(Dec) in Cash -514 208 44,424 76,948 88,922 106,290 100,969 Add: Op. Balance 6,298 183 391 44,815 121,763 210,685 316,975 Closing Balance 5,784 391 44,815 121,763 210,685 316,975 417,944 Closing Balance 12,081 574 45,206 166,578 332,448 527,660 734,920
Maruti Suzuki
27 March 2017 19
Disclosures
This document has been prepared by Motilal Oswal Securities Limited (hereinafter referred to as Most) to provide information about the company (ies) and/sector(s), if any, covered in the report and may be distributed by it and/or its affiliated company(ies). This report is for personal information of the selected recipient/s and does not construe to be any investment, legal or taxation advice to you. This research report does not constitute an offer, invitation or inducement to invest in securities or other investments and Motilal Oswal Securities Limited (hereinafter referred as MOSt) is not soliciting any action based upon it. This report is not for public distribution and has been furnished to you solely for your general information and should not be reproduced or redistributed to any other person in any form. This report does not constitute a personal recommendation or take into account the particular investment objectives, financial situations, or needs of individual clients. Before acting on any advice or recommendation in this material, investors should consider whether it is suitable for their particular circumstances and, if necessary, seek professional advice. The price and value of the investments referred to in this material and the income from them may go down as well as up, and investors may realize losses on any investments. Past performance is not a guide for future performance, future returns are not guaranteed and a loss of original capital may occur. MOSt and its affiliates are a full-service, integrated investment banking, investment management, brokerage and financing group. We and our affiliates have investment banking and other business relationships with a some companies covered by our Research Department. Our research professionals may provide input into our investment banking and other business selection processes. Investors should assume that MOSt and/or its affiliates are seeking or will seek investment banking or other business from the company or companies that are the subject of this material and that the research professionals who were involved in preparing this material may educate investors on investments in such business . The research professionals responsible for the preparation of this document may interact with trading desk personnel, sales personnel and other parties for the purpose of gathering, applying and interpreting information. Our research professionals are paid on twin parameters of performance & profitability of MOSt. MOSt generally prohibits its analysts, persons reporting to analysts, and members of their households from maintaining a financial interest in the securities or derivatives of any companies that the analysts cover. Additionally, MOSt generally prohibits its analysts and persons reporting to analysts from serving as an officer, director, or advisory board member of any companies that the analysts cover. Our salespeople, traders, and other professionals or affiliates may provide oral or written market commentary or trading strategies to our clients that reflect opinions that are contrary to the opinions expressed herein, and our proprietary trading and investing businesses may make investment decisions that are inconsistent with the recommendations expressed herein. In reviewing these materials, you should be aware that any or all of the foregoing among other things, may give rise to real or potential conflicts of interest. MOSt and its affiliated company(ies), their directors and employees and their relatives may; (a) from time to time, have a long or short position in, act as principal in, and buy or sell the securities or derivatives thereof of companies mentioned herein. (b) be engaged in any other transaction involving such securities and earn brokerage or other compensation or act as a market maker in the financial instruments of the company(ies) discussed herein or act as an advisor or lender/borrower to such company(ies) or may have any other potential conflict of interests with respect to any recommendation and other related information and opinions.; however the same shall have no bearing whatsoever on the specific recommendations made by the analyst(s), as the recommendations made by the analyst(s) are completely independent of the views of the affiliates of MOSt even though there might exist an inherent conflict of interest in some of the stocks mentioned in the research report Reports based on technical and derivative analysis center on studying charts company's price movement, outstanding positions and trading volume, as opposed to focusing on a company's fundamentals and, as such, may not match with a report on a company's fundamental analysis. In addition MOST has different business segments / Divisions with independent research separated by Chinese walls catering to different set of customers having various objectives, risk profiles, investment horizon, etc, and therefore may at times have different contrary views on stocks sectors and markets. Unauthorized disclosure, use, dissemination or copying (either whole or partial) of this information, is prohibited. The person accessing this information specifically agrees to exempt MOSt or any of its affiliates or employees from, any and all responsibility/liability arising from such misuse and agrees not to hold MOSt or any of its affiliates or employees responsible for any such misuse and further agrees to hold MOSt or any of its affiliates or employees free and harmless from all losses, costs, damages, expenses that may be suffered by the person accessing this information due to any errors and delays. The information contained herein is based on publicly available data or other sources believed to be reliable. Any statements contained in this report attributed to a third party represent MOSt’s interpretation of the data, information and/or opinions provided by that third party either publicly or through a subscription service, and such use and interpretation have not been reviewed by the third party. This Report is not intended to be a complete statement or summary of the securities, markets or developments referred to in the document. While we would endeavor to update the information herein on reasonable basis, MOSt and/or its affiliates are under no obligation to update the information. Also there may be regulatory, compliance, or other reasons that may prevent MOSt and/or its affiliates from doing so. MOSt or any of its affiliates or employees shall not be in any way responsible and liable for any loss or damage that may arise to any person from any inadvertent error in the information contained in this report. MOSt or any of its affiliates or employees do not provide, at any time, any express or implied warranty of any kind, regarding any matter pertaining to this report, including without limitation the implied warranties of merchantability, fitness for a particular purpose, and non-infringement. The recipients of this report should rely on their own investigations. This report is intended for distribution to institutional investors. Recipients who are not institutional investors should seek advice of their independent financial advisor prior to taking any investment decision based on this report or for any necessary explanation of its contents. Most and it’s associates may have managed or co-managed public offering of securities, may have received compensation for investment banking or merchant banking or brokerage services, may have received any compensation for products or services other than investment banking or merchant banking or brokerage services from the subject company in the past 12 months. Most and it’s associates have not received any compensation or other benefits from the subject company or third party in connection with the research report. Subject Company may have been a client of Most or its associates during twelve months preceding the date of distribution of the research report MOSt and/or its affiliates and/or employees may have interests/positions, financial or otherwise of over 1 % at the end of the month immediately preceding the date of publication of the research in the securities mentioned in this report. To enhance transparency, MOSt has incorporated a Disclosure of Interest Statement in this document. This should, however, not be treated as endorsement of the views expressed in the report. Motilal Oswal Securities Limited is registered as a Research Analyst under SEBI (Research Analyst) Regulations, 2014. SEBI Reg. No. INH000000412 Pending Regulatory inspections against Motilal Oswal Securities Limited: SEBI pursuant to a complaint from client Shri C.R. Mohanraj alleging unauthorized trading, issued a letter dated 29th April 2014 to MOSL notifying appointment of an Adjudicating Officer as per SEBI regulations to hold inquiry and adjudge violation of SEBI Regulations; MOSL replied to the Show Cause Notice whereby SEBI granted us an opportunity of Inspection of Documents. Since all the documents requested by us were not covered we have requested to SEBI vide our letter dated June 23, 2015 to provide pending list of documents for inspection. List of associate companies of Motilal Oswal Securities Limited -Click here to access detailed report Analyst Certification The views expressed in this research report accurately reflect the personal views of the analyst(s) about the subject securities or issues, and no part of the compensation of the research analyst(s) was, is, or will be directly or indirectly related to the specific recommendations and views expressed by research analyst(s) in this report. The research analysts, strategists, or research associates principally responsible for preparation of MOSt research receive compensation based upon various factors, including quality of research, investor client feedback, stock picking, competitive factors and firm revenues
Disclosure of Interest Statement Maruti Suzuki Analyst ownership of the stock No Served as an officer, director or employee - No
A graph of daily closing prices of securities is available at www.nseindia.com and http://economictimes.indiatimes.com/markets/stocks/stock-quotes
Regional Disclosures (outside India) This report is not directed or intended for distribution to or use by any person or entity resident in a state, country or any jurisdiction, where such distribution, publication, availability or use would be contrary to law, regulation or which would subject MOSt & its group companies to registration or licensing requirements within such jurisdictions.
For Hong Kong: This report is distributed in Hong Kong by Motilal Oswal capital Markets (Hong Kong) Private Limited, a licensed corporation (CE AYY-301) licensed and regulated by the Hong Kong Securities and Futures Commission (SFC) pursuant to the Securities and Futures Ordinance (Chapter 571 of the Laws of Hong Kong) “SFO”. As per SEBI (Research Analyst Regulations) 2014 Motilal Oswal Securities (SEBI Reg No. INH000000412) has an agreement with Motilal Oswal capital Markets (Hong Kong) Private Limited for distribution of research report in Kong Kong. This report is intended for distribution only to “Professional Investors” as defined in Part I of Schedule 1 to SFO. Any investment or investment activity to which this document relates is only available to professional investor and will be engaged only with professional investors.” Nothing here is an offer or solicitation of these securities, products and services in any jurisdiction where their offer or sale is not qualified or exempt from registration. The Indian Analyst(s) who compile this report is/are not located in Hong Kong & are not conducting Research Analysis in Hong Kong.
For U.S. Motilal Oswal Securities Limited (MOSL) is not a registered broker - dealer under the U.S. Securities Exchange Act of 1934, as amended (the"1934 act") and under applicable state laws in the United States. In addition MOSL is not a registered investment adviser under the U.S. Investment Advisers Act of 1940, as amended (the "Advisers Act" and together with the 1934 Act, the "Acts), and under applicable state laws in the United States. Accordingly, in the absence of specific exemption under the Acts, any brokerage and investment services provided by MOSL, including the products and services described herein are not available to or intended for U.S. persons.
This report is intended for distribution only to "Major Institutional Investors" as defined by Rule 15a-6(b)(4) of the Exchange Act and interpretations thereof by SEC (henceforth referred to as "major institutional investors"). This document must not be acted on or relied on by persons who are not major institutional investors. Any investment or investment activity to which this document relates is only available to major institutional investors and will be engaged in only with major institutional investors. In reliance on the exemption from registration provided by Rule 15a-6 of the U.S. Securities Exchange Act of 1934, as amended (the "Exchange Act") and interpretations thereof by the U.S. Securities and Exchange Commission ("SEC") in order to conduct business with Institutional Investors based in the U.S., MOSL has entered into a chaperoning agreement with a U.S. registered broker-dealer, Motilal Oswal Securities International Private Limited. ("MOSIPL"). Any business interaction pursuant to this report will have to be executed within the provisions of this chaperoning agreement.
The Research Analysts contributing to the report may not be registered /qualified as research analyst with FINRA. Such research analyst may not be associated persons of the U.S. registered broker-dealer, MOSIPL, and therefore, may not be subject to NASD rule 2711 and NYSE Rule 472 restrictions on communication with a subject company, public appearances and trading securities held by a research analyst account.
For Singapore Motilal Oswal Capital Markets Singapore Pte Limited is acting as an exempt financial advisor under section 23(1)(f) of the Financial Advisers Act(FAA) read with regulation 17(1)(d) of the Financial Advisors Regulations and is a subsidiary of Motilal Oswal Securities Limited in India. This research is distributed in Singapore by Motilal Oswal Capital Markets Singapore Pte Limited and it is only directed in Singapore to accredited investors, as defined in the Financial Advisers Regulations and the Securities and Futures Act (Chapter 289), as amended from time to time. In respect of any matter arising from or in connection with the research you could contact the following representatives of Motilal Oswal Capital Markets Singapore Pte Limited:
Varun Kumar [email protected] Contact : (+65) 68189232 Office Address:21 (Suite 31),16 Collyer Quay,Singapore 04931
Motilal Oswal Securities Ltd Motilal Oswal Tower, Level 9, Sayani Road, Prabhadevi, Mumbai 400 025
Phone: +91 22 3982 5500 E-mail: [email protected]