Embed Size (px)
Citation preview
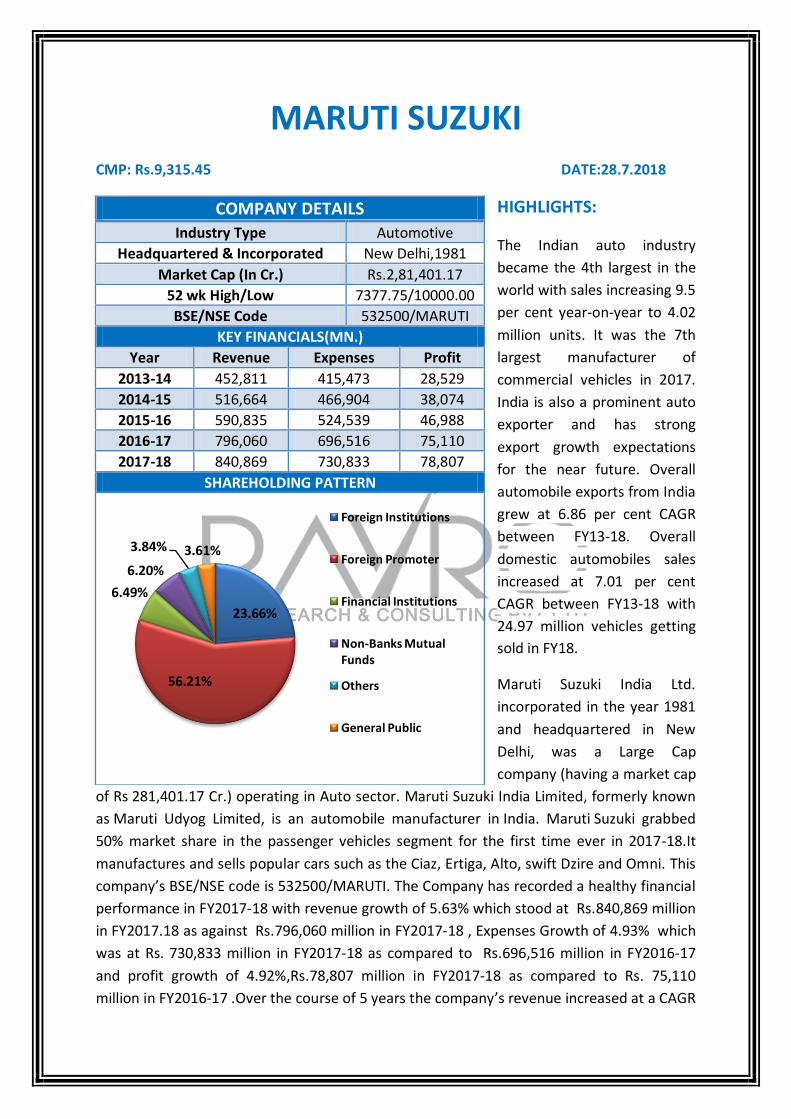
MARUTI SUZUKI CMP: Rs.9,315.45 DATE:28.7.2018
HIGHLIGHTS:
The Indian auto industry
became the 4th largest in the
world with sales increasing 9.5
per cent year-on-year to 4.02
million units. It was the 7th
largest manufacturer of
commercial vehicles in 2017.
India is also a prominent auto
exporter and has strong
export growth expectations
for the near future. Overall
automobile exports from India
grew at 6.86 per cent CAGR
between FY13-18. Overall
domestic automobiles sales
increased at 7.01 per cent
CAGR between FY13-18 with
24.97 million vehicles getting
sold in FY18.
Maruti Suzuki India Ltd.
incorporated in the year 1981
and headquartered in New
Delhi, was a Large Cap
company (having a market cap
of Rs 281,401.17 Cr.) operating in Auto sector. Maruti Suzuki India Limited, formerly known
as Maruti Udyog Limited, is an automobile manufacturer in India. Maruti Suzuki grabbed
50% market share in the passenger vehicles segment for the first time ever in 2017-18.It
manufactures and sells popular cars such as the Ciaz, Ertiga, Alto, swift Dzire and Omni. This
company’s BSE/NSE code is 532500/MARUTI. The Company has recorded a healthy financial
performance in FY2017-18 with revenue growth of 5.63% which stood at Rs.840,869 million
in FY2017.18 as against Rs.796,060 million in FY2017-18 , Expenses Growth of 4.93% which
was at Rs. 730,833 million in FY2017-18 as compared to Rs.696,516 million in FY2016-17
and profit growth of 4.92%,Rs.78,807 million in FY2017-18 as compared to Rs. 75,110
million in FY2016-17 .Over the course of 5 years the company’s revenue increased at a CAGR
COMPANY DETAILS
Industry Type Automotive
Headquartered & Incorporated New Delhi,1981
Market Cap (In Cr.) Rs.2,81,401.17
52 wk High/Low 7377.75/10000.00
BSE/NSE Code 532500/MARUTI
KEY FINANCIALS(MN.)
Year Revenue Expenses Profit
2013-14 452,811 415,473 28,529
2014-15 516,664 466,904 38,074
2015-16 590,835 524,539 46,988
2016-17 796,060 696,516 75,110
2017-18 840,869 730,833 78,807
SHAREHOLDING PATTERN
23.66%
56.21%
6.49%
6.20%
3.84% 3.61%
Foreign Institutions
Foreign Promoter
Financial Institutions
Non-Banks Mutual Funds
Others
General Public
of 11.64% . Foreign Promoter held more shares in shareholding pattern which was 56.21%
of total shares. Afterward Foreign Institutions, Financial Institutions,Non Banks Mutual
Funds ,Others and General public having shares of 23.66%,6.49%,6.20%, 3.84%,3.61%
subsequently.
FINANCIAL PERFORMANCE:
FINANCIAL PERFORMANCE
PARTICULARS 2016-17 2017-18 BALANCE SHEET SIZE (In Mn.) 519,605 602,484
SHAREHOLDER'S FUND (In Mn.) 370,751 425,594
LIABILITIES (In Mn.) 148,700 176,729
ROA (%) 14.46 13.08
ROE (%) 20.26 18.52
ROCE (%) 19.40 17.59
NET PROFIT MARGIN (%) 9.44 9.37
EPS(Rs.) 248.64 260.88
The company has provided a healthy and strong financial performance In FY2017-18.
Balance sheet size of the company has increased to Rs.602,484 millions in FY2017-18 from
Rs.519,605 millions in FY2016-17Shareholder’s fund has increased by 14.79% in FY2017-18
,Rs.425,594 millions in FY2017-18as against Rs.370,751 millions in FY2016-17.Liabilities has
increased to Rs. 176,729 millions in FY2017-18 from Rs. 148,700 millions in FY2016-
17.Returns of the company has shown a decline in FY2017-18.ROA,ROE, ROCE stood at
13.08%, 18.52%, 17.59% respectively in FY2017-18 as comparable to 14.46%, 20.26%,
19.40% respectively in FY2016-17. Net Profit Margin has also decreased in FY2017-18 and
stood at 9.37%.EPS has increased to Rs.260.88 in FY2017-18 from Rs.248.64 in FY2016-17.
FINANCIAL ANALYSIS:
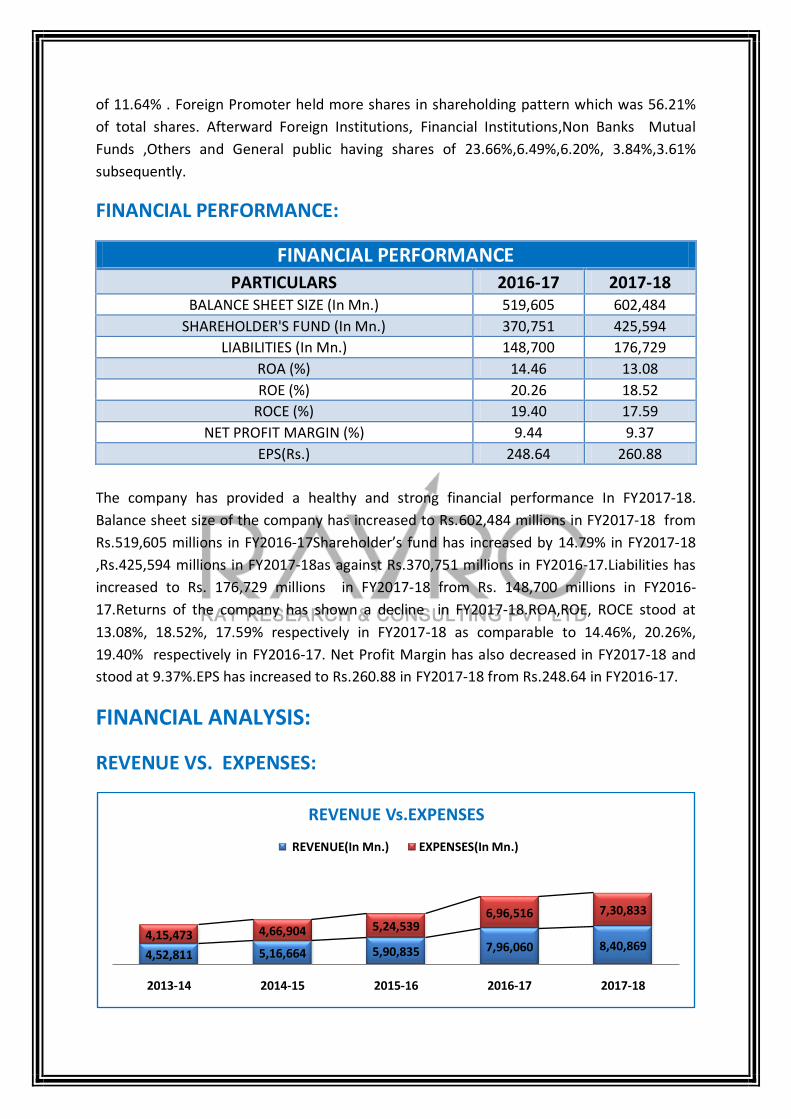
REVENUE VS. EXPENSES:
4,52,811 5,16,664 5,90,835 7,96,060 8,40,8694,15,473 4,66,904 5,24,539
6,96,516 7,30,833
2013-14 2014-15 2015-16 2016-17 2017-18
REVENUE Vs.EXPENSES
REVENUE(In Mn.) EXPENSES(In Mn.)
The above graph Shows the five years Revenue and expenses of Maruti Suzuki which has
increased Y-O-Y.In FY2017-18,Revenue of the company has registered a growth of 5.63%
whereas the expenses has registered a growth of 4.93%.
REVENUE:
Revenue of the company has increased to Rs. 840,869 Millions in FY2017-18 as compared to
Rs.796, 060 millions in FY2016-17, recording a growth of 5.63%.This Growth was mainly on
account of increase in sale of Vehicles of 5.03%, sale of Spare parts of 10.51%, Income from
services of 23.23%, Sale of scrap of 30.14%, Recovery of service charges of 21.03%, Rental
Income of 17.02%.Interest Income of 80.42%, Dividend from equity investments of 55.03%,
Net gain on sale of investments in debt mutual funds of 57.00%.
EXPENSES:
Expenses of the company has Increased by 4.93%, Rs.730,833 Millions in FY2017-18 as
compared to Rs. 696,516 millions in FY2016-17.This increase was due to increase in Cost of
Material Consumed of 5.43%, Employee Benefits Expenses of 21.32%, Finance Costs of
286.80%, Depreciation and Amortisation of 5.99%, Other Expenses of 14.52%.
Employee benefit expenses has increased by 21.32% due to increase in Salaries and
wages of 19.74%, Contribution to provident and other funds of 39.01%, Staff welfare
expenses of 31.23%.
Finance cost has increased to Rs.3,458 millions in FY2017-18 from Rs.894 millions in
FY2016-17.This increase was due to increase in Deposits from dealers, contractors and
others of 45.16%, Interest on enhanced compensation for land of Rs.2,548 Millions.
Depreciation and amortization cost has increased by 5.99% due to increase in
Depreciation of property, plant and equipment of 5.50%, Amortisation of intangible
assets of 18.83%.
Other Expenses of the company has surged by 14.52% because of Increase in
Consumption of stores of 5.39%, Power and fuel of 29.84%, Repair and maintenance of
plant and machinery of 29.86%, Repair and maintenance of building of 26.06%,
Insurance of 8.60%, Advertisement of 4.34%, Sales promotion of 52.12%, Warranty and
product recall of 80.93%, Transportation and distribution expenses of 48.28%, Corporate
social responsibility expenses of 39.73%.
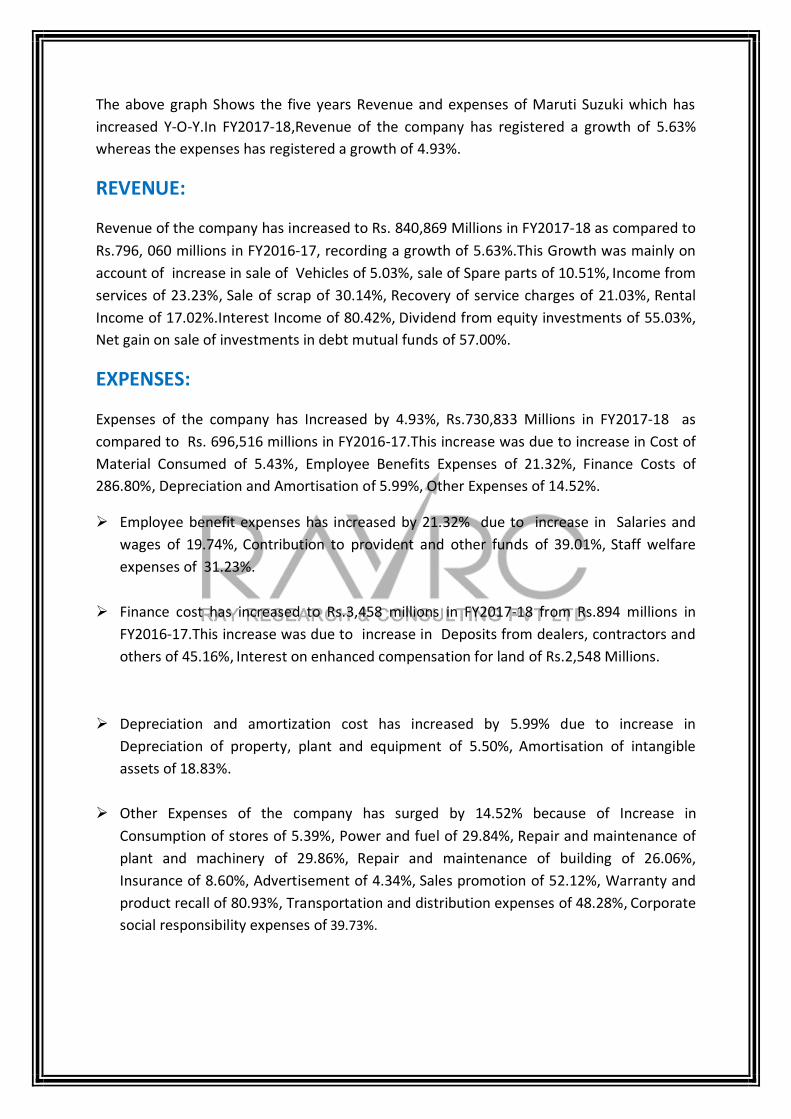
NET PROFIT:
Profit of the company has increased Y-O-Y.During FY2017-18, Profit of the company has
increased to Rs.78, 807Millions from Rs.75,110 Millions in FY2016-17,recording a growth of
4.92% .This Increase was due to increase in Revenue of 5.63%
NET PROFIT MARGIN:
Net Profit Margin of the company has declined to 9.37% in FY 2017-18 as compared to
9.44% in FY2016-17.As operating Expenses has Increased, Profit Margin has declined.
28,529
38,074
46,988
75,11078,807
2013-14 2014-15 2015-16 2016-17 2017-18
NET PROFIT(In Mn.)
6.30
7.377.95
9.44 9.37
2013-14 2014-15 2015-16 2016-17 2017-18
PROFIT MARGIN(%)
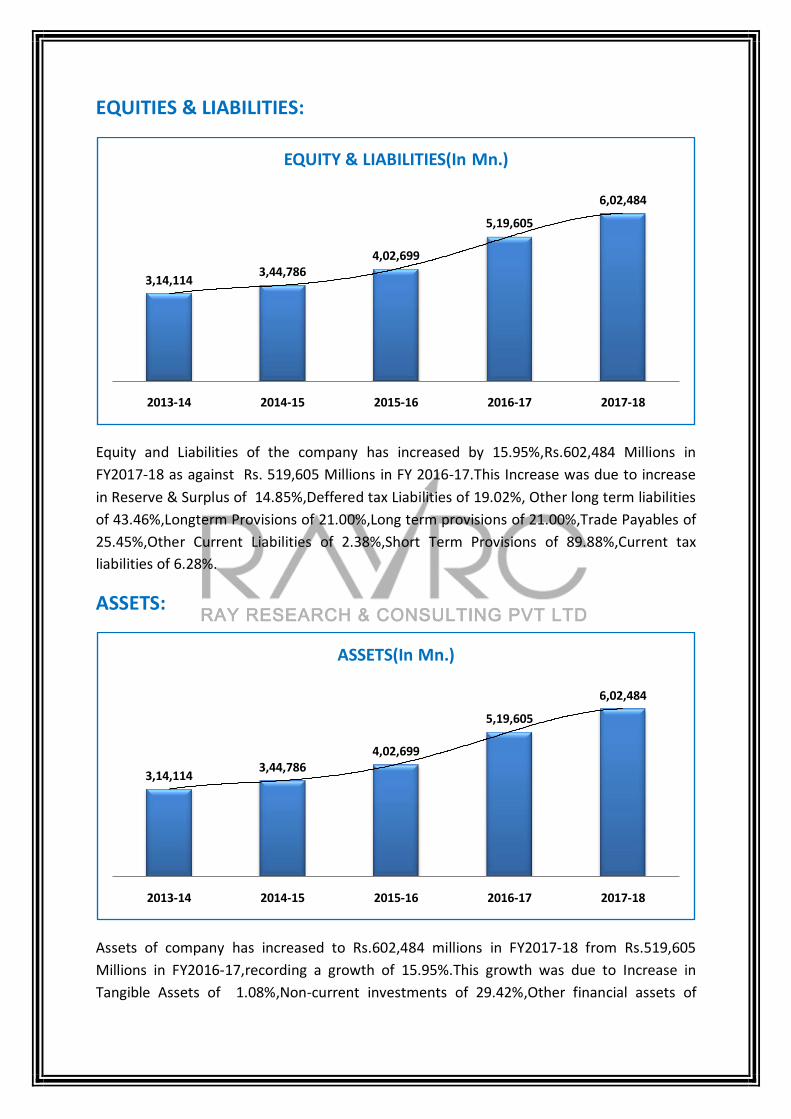
EQUITIES & LIABILITIES:
Equity and Liabilities of the company has increased by 15.95%,Rs.602,484 Millions in
FY2017-18 as against Rs. 519,605 Millions in FY 2016-17.This Increase was due to increase
in Reserve & Surplus of 14.85%,Deffered tax Liabilities of 19.02%, Other long term liabilities
of 43.46%,Longterm Provisions of 21.00%,Long term provisions of 21.00%,Trade Payables of
25.45%,Other Current Liabilities of 2.38%,Short Term Provisions of 89.88%,Current tax
liabilities of 6.28%.
ASSETS:
Assets of company has increased to Rs.602,484 millions in FY2017-18 from Rs.519,605
Millions in FY2016-17,recording a growth of 15.95%.This growth was due to Increase in
Tangible Assets of 1.08%,Non-current investments of 29.42%,Other financial assets of
3,14,1143,44,786
4,02,699
5,19,605
6,02,484
2013-14 2014-15 2015-16 2016-17 2017-18
EQUITY & LIABILITIES(In Mn.)
3,14,1143,44,786
4,02,699
5,19,605
6,02,484
2013-14 2014-15 2015-16 2016-17 2017-18
ASSETS(In Mn.)
36.10%, Other Non-current Assets of 15.93%, Trade Receivables of 21.85%, Short Term
Loans and Advances of 20.00%.
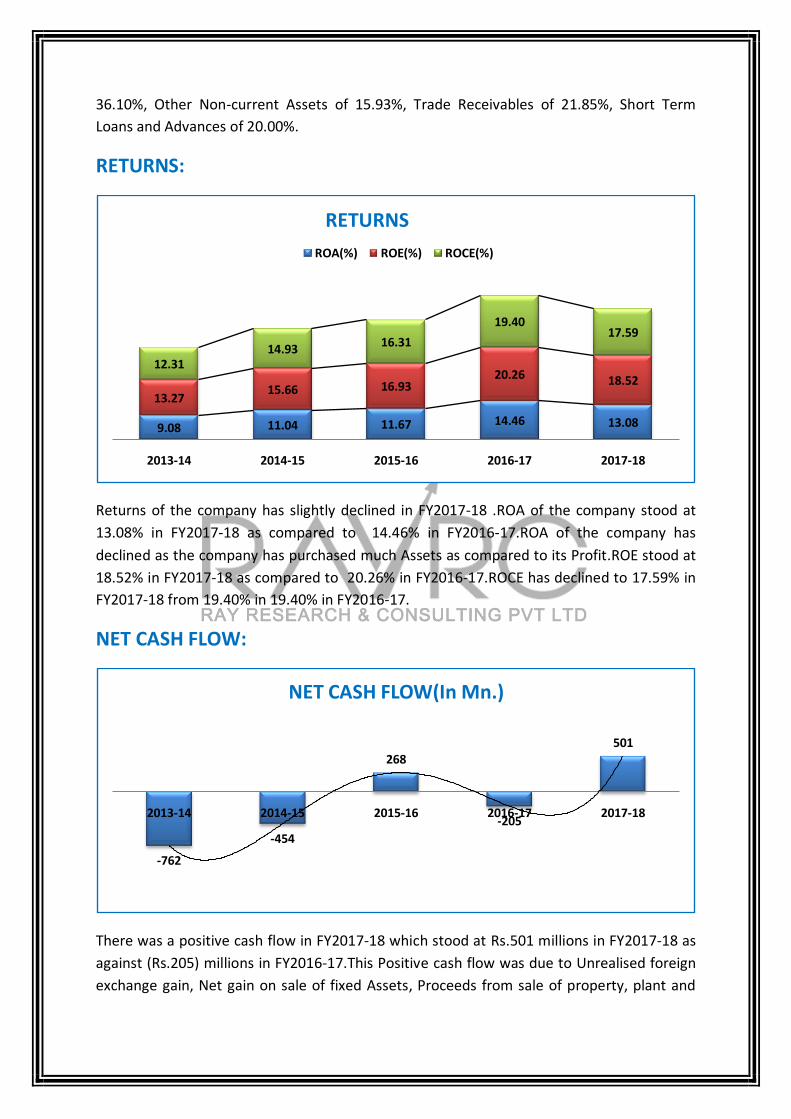
RETURNS:
Returns of the company has slightly declined in FY2017-18 .ROA of the company stood at
13.08% in FY2017-18 as compared to 14.46% in FY2016-17.ROA of the company has
declined as the company has purchased much Assets as compared to its Profit.ROE stood at
18.52% in FY2017-18 as compared to 20.26% in FY2016-17.ROCE has declined to 17.59% in
FY2017-18 from 19.40% in 19.40% in FY2016-17.
NET CASH FLOW:
There was a positive cash flow in FY2017-18 which stood at Rs.501 millions in FY2017-18 as
against (Rs.205) millions in FY2016-17.This Positive cash flow was due to Unrealised foreign
exchange gain, Net gain on sale of fixed Assets, Proceeds from sale of property, plant and
9.08 11.04 11.67 14.46 13.08
13.2715.66 16.93
20.26 18.5212.31
14.9316.31
19.4017.59
2013-14 2014-15 2015-16 2016-17 2017-18
RETURNS
ROA(%) ROE(%) ROCE(%)
-762
-454
268
-205
501
2013-14 2014-15 2015-16 2016-17 2017-18
NET CASH FLOW(In Mn.)
equipment, Proceeds from sale of debt mutual funds, Interest Received, Dividend Received,
Proceeds from Short Term borrowings, Proceeds from Long Term borrowings.
CONCLUSION:
In FY 2017-18,the company has posted a healthy growth in Revenue and profit. Probably the results should be seen in a context that while the market growth was slow in past years, the Company continued to strengthen its foundation for long-term sustainability. It introduced a new sales channel, NEXA, and offered exciting products. The Company also started up gradation of the overall sales experience in the existing channel in line with NEXA. The Company’s entry in the compact SUV segment was well received by customers, helping it become the segment leader.
FINANCIAL STATEMENT:
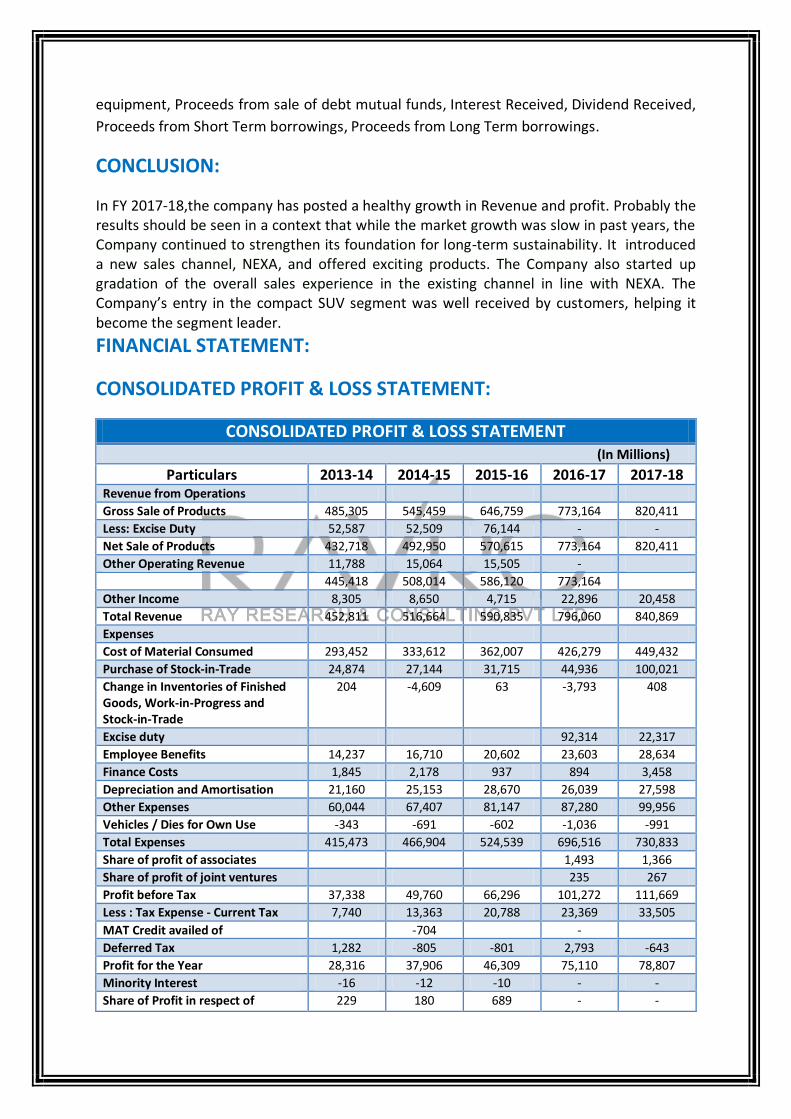
CONSOLIDATED PROFIT & LOSS STATEMENT:
CONSOLIDATED PROFIT & LOSS STATEMENT
(In Millions)
Particulars 2013-14 2014-15 2015-16 2016-17 2017-18 Revenue from Operations
Gross Sale of Products 485,305 545,459 646,759 773,164 820,411
Less: Excise Duty 52,587 52,509 76,144 - -
Net Sale of Products 432,718 492,950 570,615 773,164 820,411
Other Operating Revenue 11,788 15,064 15,505 -
445,418 508,014 586,120 773,164
Other Income 8,305 8,650 4,715 22,896 20,458
Total Revenue 452,811 516,664 590,835 796,060 840,869
Expenses
Cost of Material Consumed 293,452 333,612 362,007 426,279 449,432
Purchase of Stock-in-Trade 24,874 27,144 31,715 44,936 100,021
Change in Inventories of Finished Goods, Work-in-Progress and Stock-in-Trade
204 -4,609 63 -3,793 408
Excise duty 92,314 22,317
Employee Benefits 14,237 16,710 20,602 23,603 28,634
Finance Costs 1,845 2,178 937 894 3,458
Depreciation and Amortisation 21,160 25,153 28,670 26,039 27,598
Other Expenses 60,044 67,407 81,147 87,280 99,956
Vehicles / Dies for Own Use -343 -691 -602 -1,036 -991
Total Expenses 415,473 466,904 524,539 696,516 730,833
Share of profit of associates 1,493 1,366
Share of profit of joint ventures 235 267
Profit before Tax 37,338 49,760 66,296 101,272 111,669
Less : Tax Expense - Current Tax 7,740 13,363 20,788 23,369 33,505
MAT Credit availed of -704 -
Deferred Tax 1,282 -805 -801 2,793 -643
Profit for the Year 28,316 37,906 46,309 75,110 78,807
Minority Interest -16 -12 -10 - -
Share of Profit in respect of 229 180 689 - -
Investment in Associates
Profit for the Year 28,529 38,074 46,988 75,110 78,807
Other Comprehensive Income
A (i) Items that will not be reclassified to profit or loss
(a) gain / (loss) of defined benefit obligation
-159 -197
(b) gain / (loss) on change in fair value of equity instruments
2,361 3,470
2,202 3,273
A (ii) Income tax relating to items that will not be reclassified to profit or loss
61 39
B (i) Items that will be reclassified to profit or loss
-197
(a) effective portion of gain / (loss) on hedging instruments in a cash flow hedge
-72 -2
-72 -2
B (ii) Income tax relating to items that will be reclassified to profit or loss
25 1
Total Other Comprehensive Income (A (i+ii)+B(i+ii))
2,216 3,311
Total Comprehensive Income for the period (IX + X)
77,326 82,118
Profit for the year attributed to:
Owners of the Company 75,099 78,800
Non controlling interest 11 7
75,110 78,807
Other comprehensive income for the year attributable to:
Owners of the Company 2,217 3,311
Non controlling interest -1 -
2,216 3,311
Total comprehensive income for the year attributable to:
Owners of the Company 77,316 82,111
Non controlling interest 10 7
77,326 82,118
Earnings Per Share 94.44 126.04 155.55 248.64 260.88
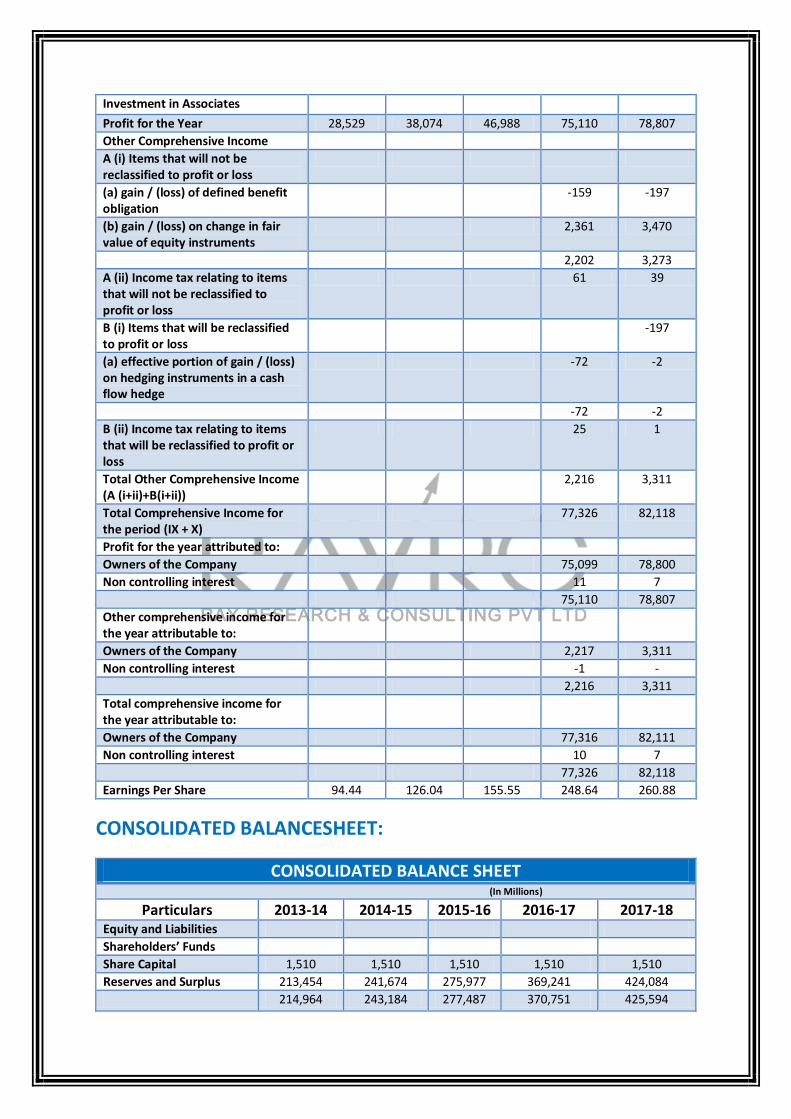
CONSOLIDATED BALANCESHEET:
CONSOLIDATED BALANCE SHEET
(In Millions)
Particulars 2013-14 2014-15 2015-16 2016-17 2017-18 Equity and Liabilities
Shareholders’ Funds
Share Capital 1,510 1,510 1,510 1,510 1,510
Reserves and Surplus 213,454 241,674 275,977 369,241 424,084
214,964 243,184 277,487 370,751 425,594

Minority interest 122 134 144 154 161
Non-current Liabilities
Long Term Borrowings 6,274 2,783 1,471 - 100
Deferred Tax Liabilities 5,962 4,844 4,751 5,058 6,020
Other long term liabilities 2,476 1,059 1,224 11,055 15,859
Long term provisions 2,007 2,958 3,021 219 265
16,719 11,644 10,467 16,332 22,244
Current Liabilities
Short term Borrowings 12,379 525 907 4,836 1,108
Trade Payables 49,998 56,568 71,271 83,692 104,993
Total outstanding dues of micro enterprises and small enterprise
- - 533 832 711
Total outstanding dues of creditors other than micro enterprises and small enterprises
- - 70,738 82,860 104,282
Other Current Liabilities 13,205 19,166 24,078 13,028 13,338
Short Term Provisions 6,727 13,565 18,345 4,498 8,541
Current tax liabilities (Net) 8,036 8,541
Other current liabilities 18,278 20,896
82,309 89,807 114,601 132,368 154,485
Total liabilities 99,028 101,451 125,068 148,700 176,729
Total 314,114 344,769 402,699 519,605 602,484
Assets
Non-Current assets
Fixed Assets
Tangible Assets 108,493 121,947 126,251 129,377 130,771
Intangible Assets 1,844 2,948 3,508 12,523 3,117
Capital Work in progress 26,395 18,901 10,134 3,730 21,321
136,732 143,796 139,893
Non-current investments 15,212 99,918 175,117 269,718 349,058
Long term loans and advances
16,539 13,666 13,555 3 2
Other financial assets 241 328
Other Non-current Assets 95 442 91 16,033 18,587
168,578 257,822 328,656 431,625 523,184
Current Assets
Current Investments 90,059 33,059 8,748 21,788 12,173
Inventories 17,632 26,744 31,998 32,637 31,602
Trade Receivables 14,891 11,443 13,873 12,026 14,654
Cash and Bank Balances 6,486 432 768 235 740
Other financial assets 951 2,846
Short Term Loans and Advances
12,832 12,017 15,957 25 30
Current tax assets (Net) 4,910 4,115
Other Current Assets 3,636 3,269 2,699 15,408 13,140
145,536 86,964 74,043 87,980 79,300
Total 314,114 344,786 402,699 519,605 602,484
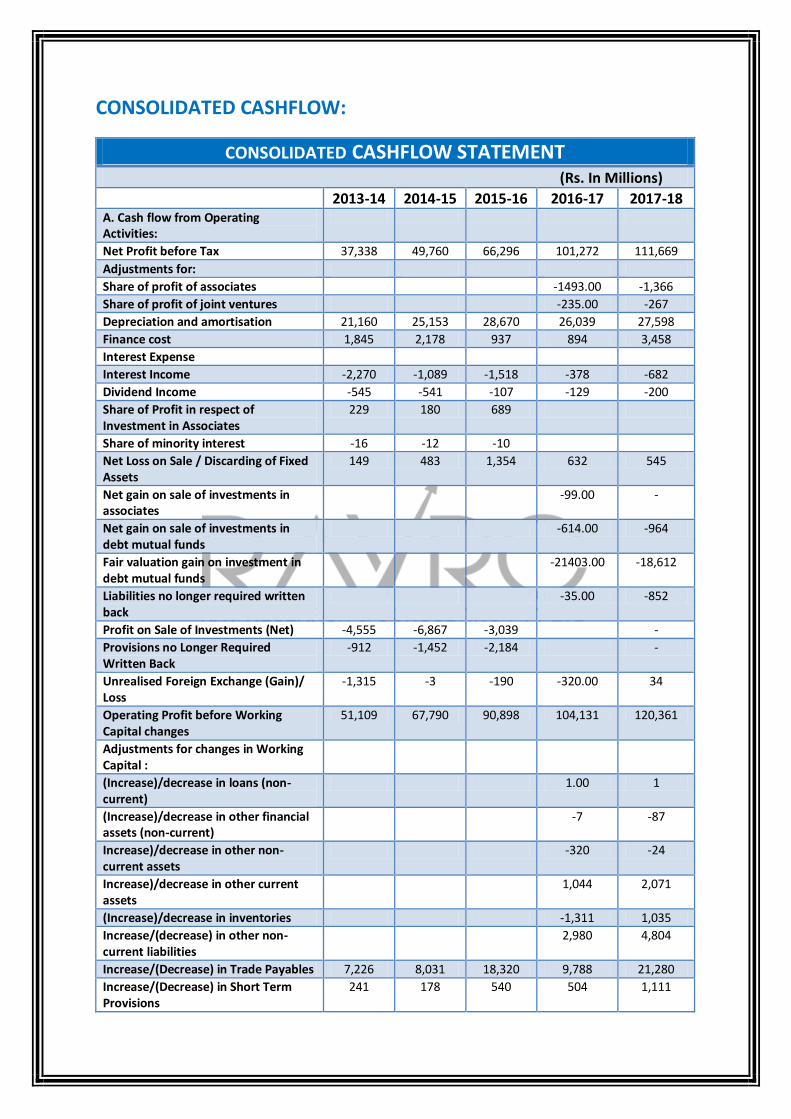
CONSOLIDATED CASHFLOW:
CONSOLIDATED CASHFLOW STATEMENT
(Rs. In Millions)
2013-14 2014-15 2015-16 2016-17 2017-18 A. Cash flow from Operating Activities:
Net Profit before Tax 37,338 49,760 66,296 101,272 111,669
Adjustments for:
Share of profit of associates -1493.00 -1,366
Share of profit of joint ventures -235.00 -267
Depreciation and amortisation 21,160 25,153 28,670 26,039 27,598
Finance cost 1,845 2,178 937 894 3,458
Interest Expense
Interest Income -2,270 -1,089 -1,518 -378 -682
Dividend Income -545 -541 -107 -129 -200
Share of Profit in respect of Investment in Associates
229 180 689
Share of minority interest -16 -12 -10
Net Loss on Sale / Discarding of Fixed Assets
149 483 1,354 632 545
Net gain on sale of investments in associates
-99.00 -
Net gain on sale of investments in debt mutual funds
-614.00 -964
Fair valuation gain on investment in debt mutual funds
-21403.00 -18,612
Liabilities no longer required written back
-35.00 -852
Profit on Sale of Investments (Net) -4,555 -6,867 -3,039 -
Provisions no Longer Required Written Back
-912 -1,452 -2,184 -
Unrealised Foreign Exchange (Gain)/ Loss
-1,315 -3 -190 -320.00 34
Operating Profit before Working Capital changes
51,109 67,790 90,898 104,131 120,361
Adjustments for changes in Working Capital :
(Increase)/decrease in loans (non-current)
1.00 1
(Increase)/decrease in other financial assets (non-current)
-7 -87
Increase)/decrease in other non-current assets
-320 -24
Increase)/decrease in other current assets
1,044 2,071
(Increase)/decrease in inventories -1,311 1,035
Increase/(decrease) in other non-current liabilities
2,980 4,804
Increase/(Decrease) in Trade Payables 7,226 8,031 18,320 9,788 21,280
Increase/(Decrease) in Short Term Provisions
241 178 540 504 1,111
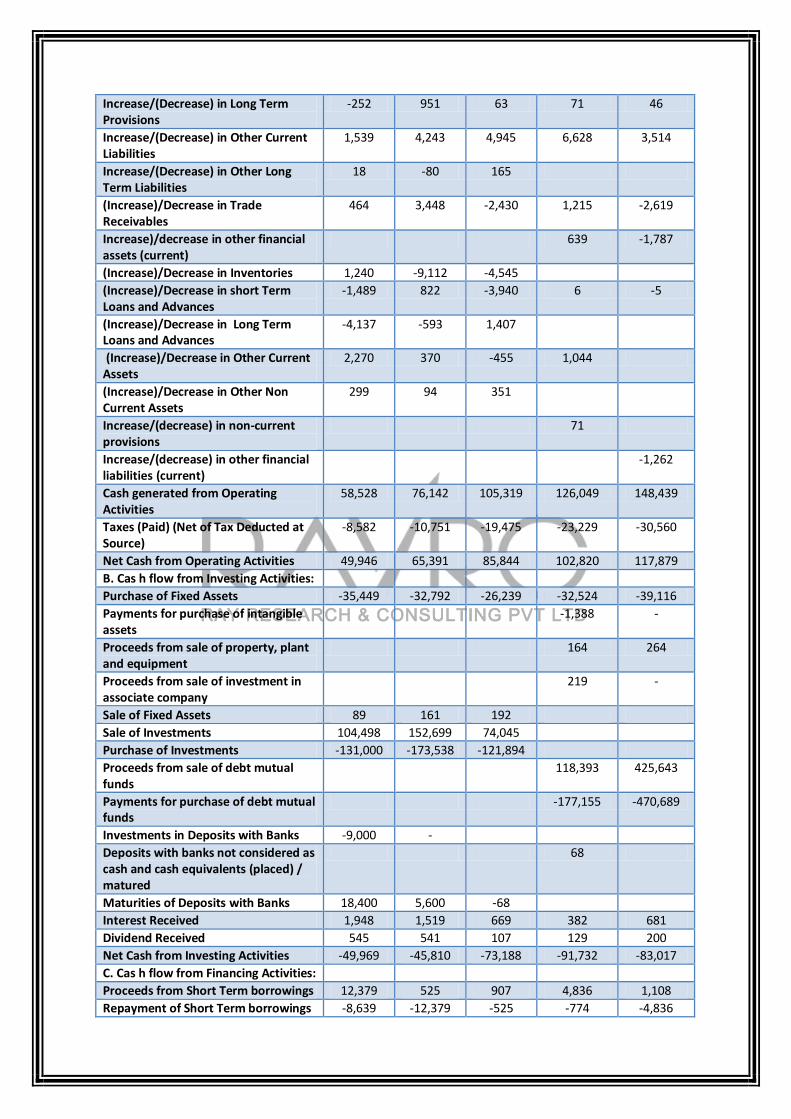
Increase/(Decrease) in Long Term Provisions
-252 951 63 71 46
Increase/(Decrease) in Other Current Liabilities
1,539 4,243 4,945 6,628 3,514
Increase/(Decrease) in Other Long Term Liabilities
18 -80 165
(Increase)/Decrease in Trade Receivables
464 3,448 -2,430 1,215 -2,619
Increase)/decrease in other financial assets (current)
639 -1,787
(Increase)/Decrease in Inventories 1,240 -9,112 -4,545
(Increase)/Decrease in short Term Loans and Advances
-1,489 822 -3,940 6 -5
(Increase)/Decrease in Long Term Loans and Advances
-4,137 -593 1,407
(Increase)/Decrease in Other Current Assets
2,270 370 -455 1,044
(Increase)/Decrease in Other Non Current Assets
299 94 351
Increase/(decrease) in non-current provisions
71
Increase/(decrease) in other financial liabilities (current)
-1,262
Cash generated from Operating Activities
58,528 76,142 105,319 126,049 148,439
Taxes (Paid) (Net of Tax Deducted at Source)
-8,582 -10,751 -19,475 -23,229 -30,560
Net Cash from Operating Activities 49,946 65,391 85,844 102,820 117,879
B. Cas h flow from Investing Activities:
Purchase of Fixed Assets -35,449 -32,792 -26,239 -32,524 -39,116
Payments for purchase of intangible assets
-1,388 -
Proceeds from sale of property, plant and equipment
164 264
Proceeds from sale of investment in associate company
219 -
Sale of Fixed Assets 89 161 192
Sale of Investments 104,498 152,699 74,045
Purchase of Investments -131,000 -173,538 -121,894
Proceeds from sale of debt mutual funds
118,393 425,643
Payments for purchase of debt mutual funds
-177,155 -470,689
Investments in Deposits with Banks -9,000 -
Deposits with banks not considered as cash and cash equivalents (placed) / matured
68
Maturities of Deposits with Banks 18,400 5,600 -68
Interest Received 1,948 1,519 669 382 681
Dividend Received 545 541 107 129 200
Net Cash from Investing Activities -49,969 -45,810 -73,188 -91,732 -83,017
C. Cas h flow from Financing Activities:
Proceeds from Short Term borrowings 12,379 525 907 4,836 1,108
Repayment of Short Term borrowings -8,639 -12,379 -525 -774 -4,836
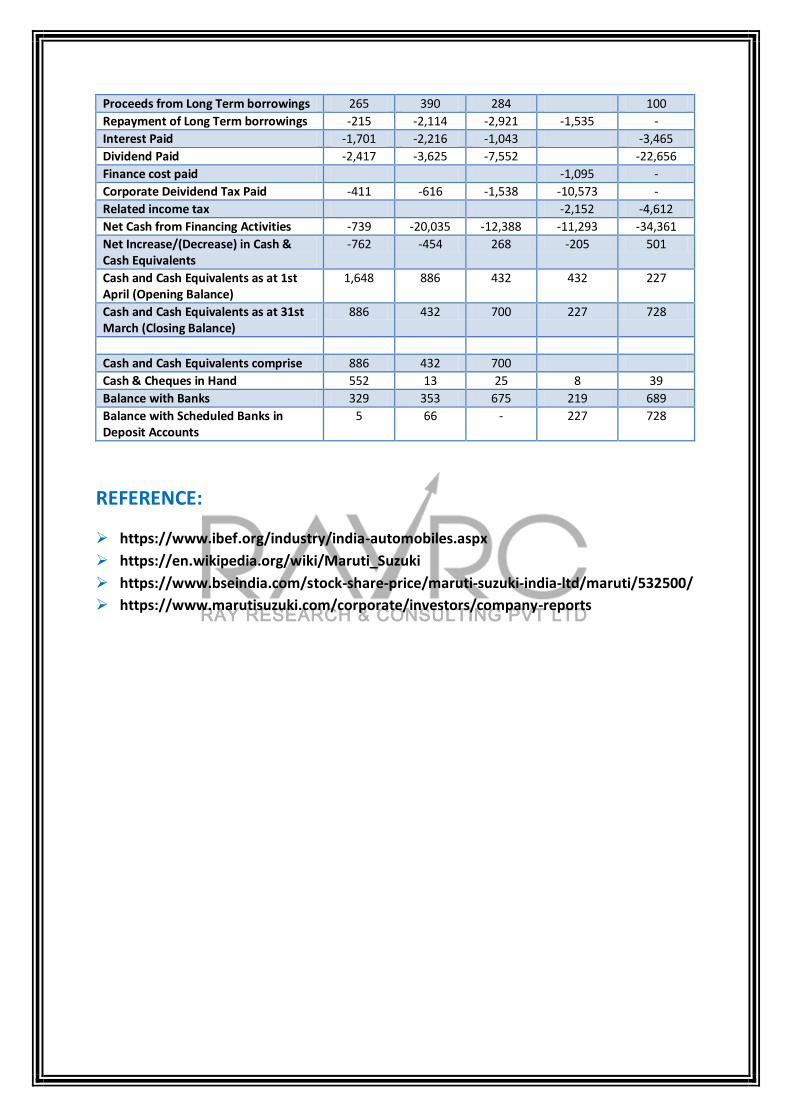
Proceeds from Long Term borrowings 265 390 284 100
Repayment of Long Term borrowings -215 -2,114 -2,921 -1,535 -
Interest Paid -1,701 -2,216 -1,043 -3,465
Dividend Paid -2,417 -3,625 -7,552 -22,656
Finance cost paid -1,095 -
Corporate Deividend Tax Paid -411 -616 -1,538 -10,573 -
Related income tax -2,152 -4,612
Net Cash from Financing Activities -739 -20,035 -12,388 -11,293 -34,361
Net Increase/(Decrease) in Cash & Cash Equivalents
-762 -454 268 -205 501
Cash and Cash Equivalents as at 1st April (Opening Balance)
1,648 886 432 432 227
Cash and Cash Equivalents as at 31st March (Closing Balance)
886 432 700 227 728
Cash and Cash Equivalents comprise 886 432 700
Cash & Cheques in Hand 552 13 25 8 39
Balance with Banks 329 353 675 219 689
Balance with Scheduled Banks in Deposit Accounts
5 66 - 227 728
REFERENCE:
https://www.ibef.org/industry/india-automobiles.aspx
https://en.wikipedia.org/wiki/Maruti_Suzuki
https://www.bseindia.com/stock-share-price/maruti-suzuki-india-ltd/maruti/532500/
https://www.marutisuzuki.com/corporate/investors/company-reports


![Teachers Professional Discourse [Yuta Suzuki]](https://img.dokumen.tips/doc/110x75/634e14dbe2fe175638009796/teachers-professional-discourse-yuta-suzuki.jpg)


