Embed Size (px)
Citation preview
ICIC
I S
ecurit
ies –
Retail E
quit
y R
esearch
Com
pany U
pdate
December 15, 2021
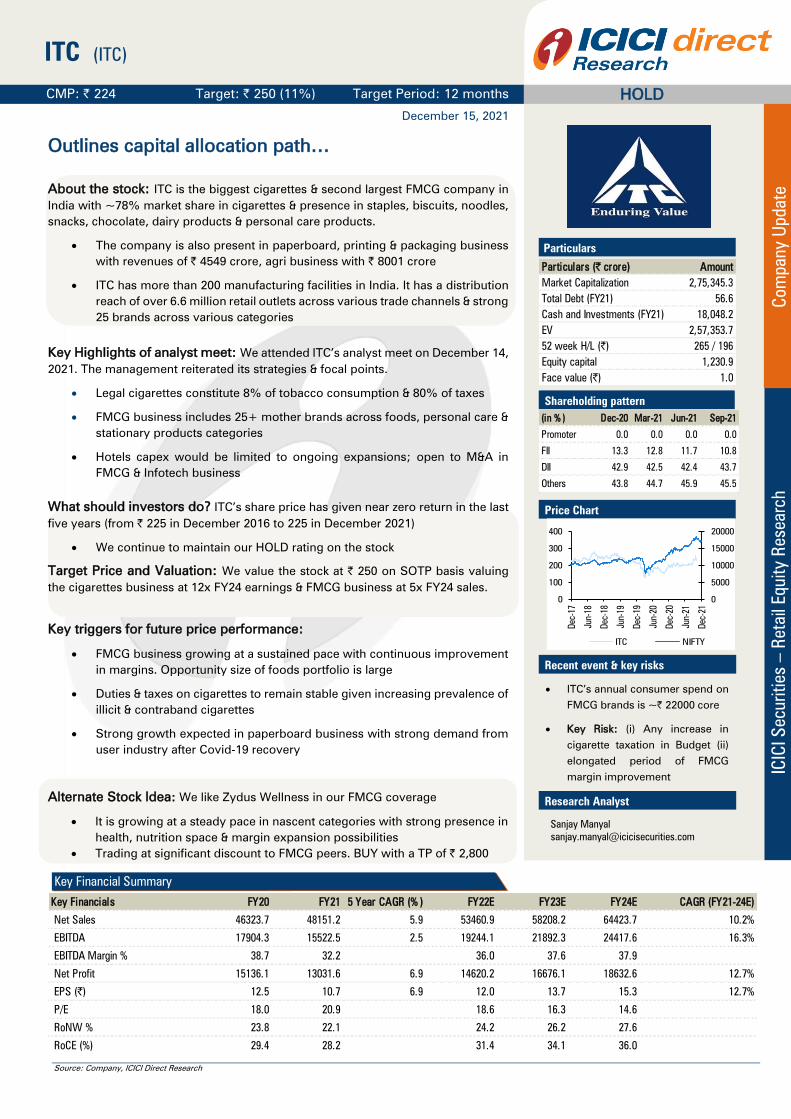
CMP: | 224 Target: | 250 (11%) Target Period: 12 months
ITC (ITC)
HOLD
Outlines capital allocation path…
About the stock: ITC is the biggest cigarettes & second largest FMCG company in
India with ~78% market share in cigarettes & presence in staples, biscuits, noodles,
snacks, chocolate, dairy products & personal care products.
The company is also present in paperboard, printing & packaging business
with revenues of | 4549 crore, agri business with | 8001 crore
ITC has more than 200 manufacturing facilities in India. It has a distribution
reach of over 6.6 million retail outlets across various trade channels & strong
25 brands across various categories
Key Highlights of analyst meet: We attended ITC’s analyst meet on December 14,
2021. The management reiterated its strategies & focal points.
Legal cigarettes constitute 8% of tobacco consumption & 80% of taxes
FMCG business includes 25+ mother brands across foods, personal care &
stationary products categories
Hotels capex would be limited to ongoing expansions; open to M&A in
FMCG & Infotech business
What should investors do? ITC’s share price has given near zero return in the last
five years (from | 225 in December 2016 to 225 in December 2021)
We continue to maintain our HOLD rating on the stock
Target Price and Valuation: We value the stock at | 250 on SOTP basis valuing
the cigarettes business at 12x FY24 earnings & FMCG business at 5x FY24 sales.
Key triggers for future price performance:
FMCG business growing at a sustained pace with continuous improvement
in margins. Opportunity size of foods portfolio is large
Duties & taxes on cigarettes to remain stable given increasing prevalence of
illicit & contraband cigarettes
Strong growth expected in paperboard business with strong demand from
user industry after Covid-19 recovery
Alternate Stock Idea: We like Zydus Wellness in our FMCG coverage
It is growing at a steady pace in nascent categories with strong presence in
health, nutrition space & margin expansion possibilities
Trading at significant discount to FMCG peers. BUY with a TP of | 2,800
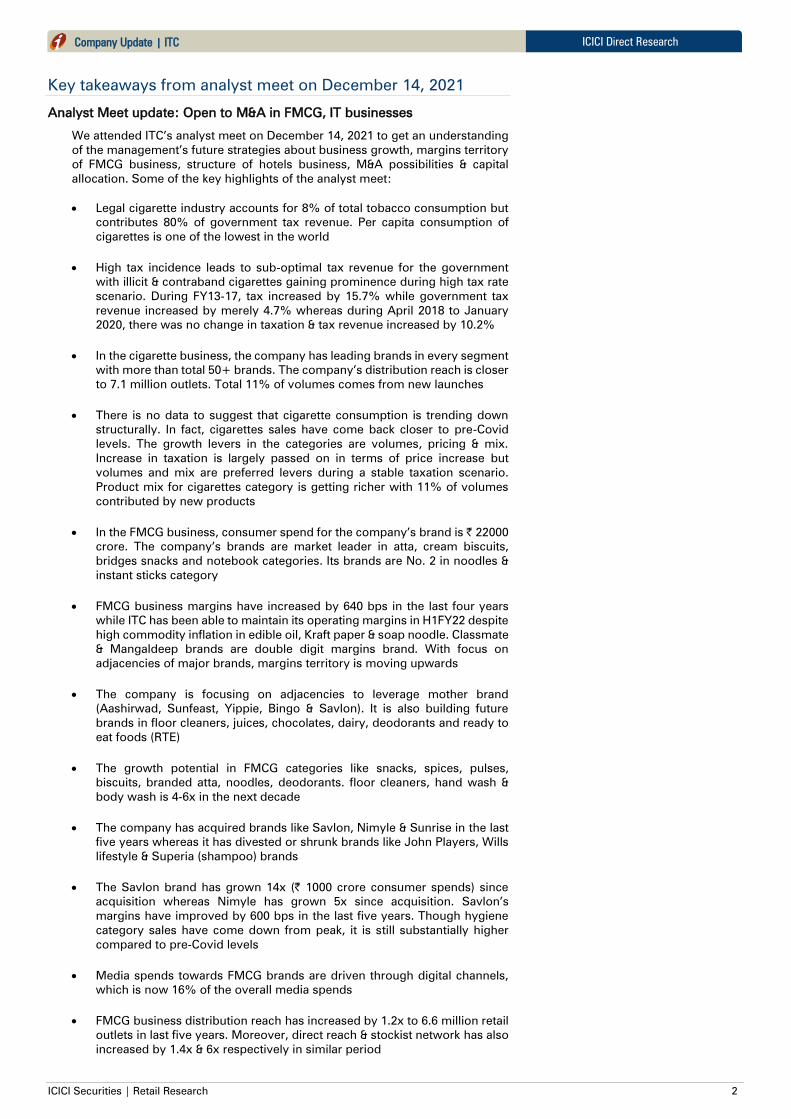
Key Financials FY20 FY21 5 Year CAGR (% ) FY22E FY23E FY24E CAGR (FY21-24E)
Net Sales 46323.7 48151.2 5.9 53460.9 58208.2 64423.7 10.2%
EBITDA 17904.3 15522.5 2.5 19244.1 21892.3 24417.6 16.3%
EBITDA Margin % 38.7 32.2 36.0 37.6 37.9
Net Profit 15136.1 13031.6 6.9 14620.2 16676.1 18632.6 12.7%
EPS (|) 12.5 10.7 6.9 12.0 13.7 15.3 12.7%
P/E 18.0 20.9 18.6 16.3 14.6
RoNW % 23.8 22.1 24.2 26.2 27.6
RoCE (%) 29.4 28.2 31.4 34.1 36.0
Particulars
Particulars (| crore) Amount
Market Capitalization 2,75,345.3
Total Debt (FY21) 56.6
Cash and Investments (FY21) 18,048.2
EV 2,57,353.7
52 week H/L (|) 265 / 196
Equity capital 1,230.9
Face value (|) 1.0
Shareholding pattern
(in % ) Dec-20 Mar-21 Jun-21 Sep-21
Promoter 0.0 0.0 0.0 0.0
FII 13.3 12.8 11.7 10.8
DII 42.9 42.5 42.4 43.7
Others 43.8 44.7 45.9 45.5
Price Chart
0
5000
10000
15000
20000
0
100
200
300
400
Dec-1
7
Jun-1
8
Dec-1
8
Jun-1
9
Dec-1
9
Jun-2
0
Dec-2
0
Jun-2
1
Dec-2
1
ITC NIFTY
Recent event & key risks
ITC’s annual consumer spend on
FMCG brands is ~| 22000 core
Key Risk: (i) Any increase in
cigarette taxation in Budget (ii)
elongated period of FMCG
margin improvement
Research Analyst
Sanjay Manyal
Key Financial Summary
Source: Company, ICICI Direct Research
ICICI Securities | Retail Research 2
ICICI Direct Research
Company Update | ITC
Key takeaways from analyst meet on December 14, 2021
Analyst Meet update: Open to M&A in FMCG, IT businesses
We attended ITC’s analyst meet on December 14, 2021 to get an understanding
of the management’s future strategies about business growth, margins territory
of FMCG business, structure of hotels business, M&A possibilities & capital
allocation. Some of the key highlights of the analyst meet:
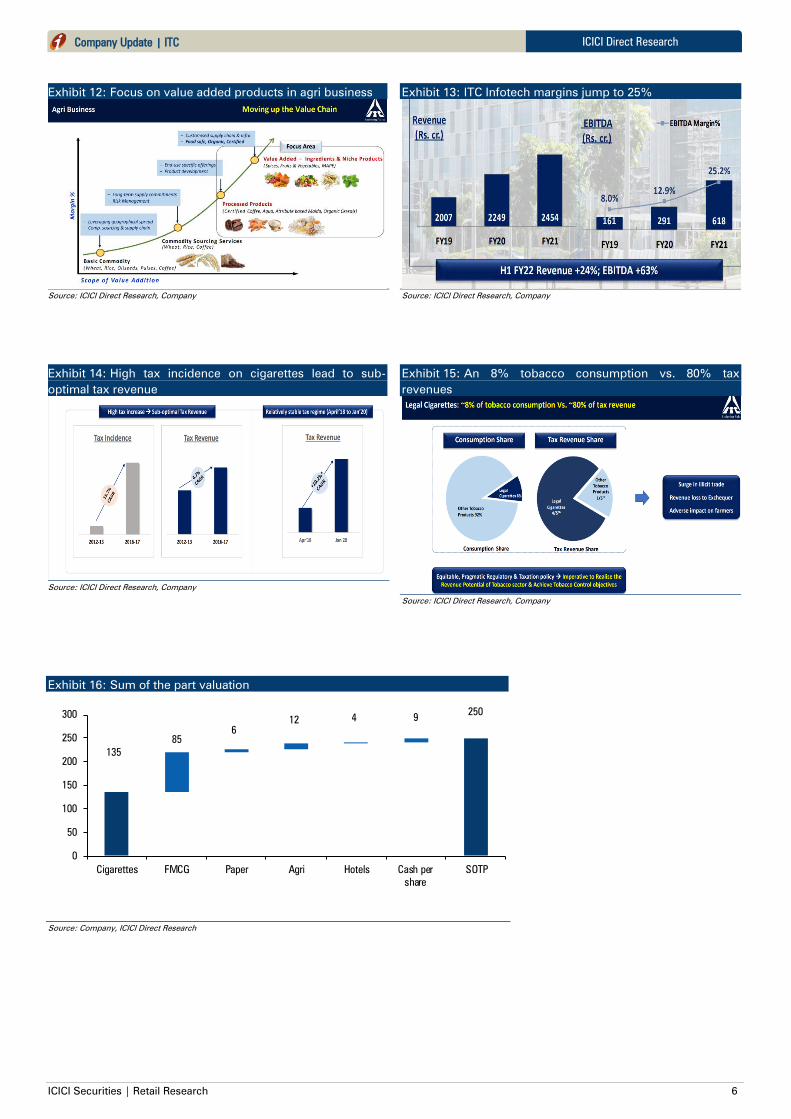
Legal cigarette industry accounts for 8% of total tobacco consumption but
contributes 80% of government tax revenue. Per capita consumption of
cigarettes is one of the lowest in the world
High tax incidence leads to sub-optimal tax revenue for the government
with illicit & contraband cigarettes gaining prominence during high tax rate
scenario. During FY13-17, tax increased by 15.7% while government tax
revenue increased by merely 4.7% whereas during April 2018 to January
2020, there was no change in taxation & tax revenue increased by 10.2%
In the cigarette business, the company has leading brands in every segment
with more than total 50+ brands. The company’s distribution reach is closer
to 7.1 million outlets. Total 11% of volumes comes from new launches
There is no data to suggest that cigarette consumption is trending down
structurally. In fact, cigarettes sales have come back closer to pre-Covid
levels. The growth levers in the categories are volumes, pricing & mix.
Increase in taxation is largely passed on in terms of price increase but
volumes and mix are preferred levers during a stable taxation scenario.
Product mix for cigarettes category is getting richer with 11% of volumes
contributed by new products
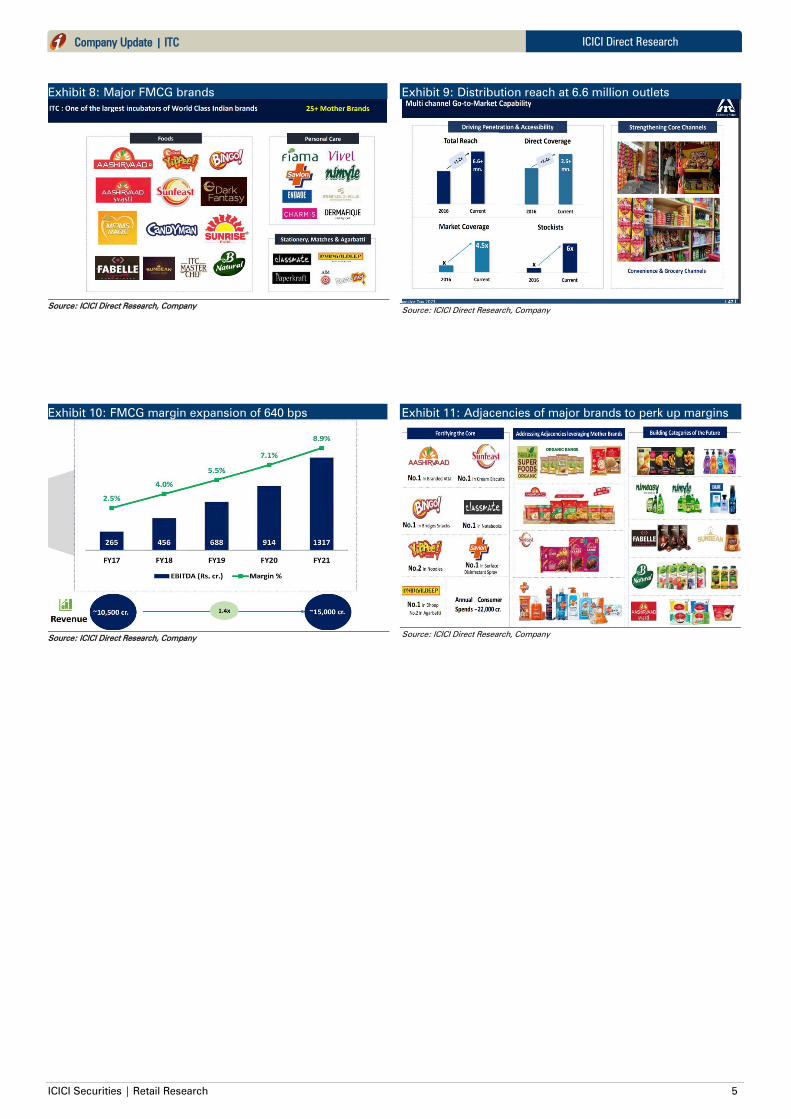
In the FMCG business, consumer spend for the company’s brand is | 22000
crore. The company’s brands are market leader in atta, cream biscuits,
bridges snacks and notebook categories. Its brands are No. 2 in noodles &
instant sticks category
FMCG business margins have increased by 640 bps in the last four years
while ITC has been able to maintain its operating margins in H1FY22 despite
high commodity inflation in edible oil, Kraft paper & soap noodle. Classmate
& Mangaldeep brands are double digit margins brand. With focus on
adjacencies of major brands, margins territory is moving upwards
The company is focusing on adjacencies to leverage mother brand
(Aashirwad, Sunfeast, Yippie, Bingo & Savlon). It is also building future
brands in floor cleaners, juices, chocolates, dairy, deodorants and ready to
eat foods (RTE)
The growth potential in FMCG categories like snacks, spices, pulses,
biscuits, branded atta, noodles, deodorants. floor cleaners, hand wash &
body wash is 4-6x in the next decade
The company has acquired brands like Savlon, Nimyle & Sunrise in the last
five years whereas it has divested or shrunk brands like John Players, Wills
lifestyle & Superia (shampoo) brands
The Savlon brand has grown 14x (| 1000 crore consumer spends) since
acquisition whereas Nimyle has grown 5x since acquisition. Savlon’s
margins have improved by 600 bps in the last five years. Though hygiene
category sales have come down from peak, it is still substantially higher
compared to pre-Covid levels
Media spends towards FMCG brands are driven through digital channels,
which is now 16% of the overall media spends
FMCG business distribution reach has increased by 1.2x to 6.6 million retail
outlets in last five years. Moreover, direct reach & stockist network has also
increased by 1.4x & 6x respectively in similar period
ICICI Securities | Retail Research 3
ICICI Direct Research
Company Update | ITC
In agri business, the company is looking to move up the value chain &
focusing on value added ingredient & niche products like spices, fruits,
vegetable.
In hotels business, occupancy levels have reached pre-Covid levels. Leisure
hotels occupancies are high whereas business travel hotels are still at 40-
50% of the pre-Covid levels
In paperboard business, the company is focussing on speciality papers,
pulp import substitution & scale up of value added product portfolio
The opportunity in infotech business is immense. The company is open to
M&A in the infotech business. It is open to listing possibilities
The company keeps large wheat inventories to sharpen buying & timing of
procurement. No debtors in general trade given it is cash & carry model
Capex for FY21 was | 1600 crore. Average capex per years would be | 3000
crore per annum for the next three years. Of this, 35-40% would be for
FMCG business, 25-30% for paper, paperboard business, 10% for the Hotels
business mainly for ongoing projects. Rest of the capex amount would be
spending on enhancing digital capabilities & infrastructure
The company would continue to maintain 80-85% dividend payout and
would prefer maintaining ordinary dividend instead of giving special
dividend. Total cash on the books of | 25000 crore would not increase,
going forward
De-merger plan of hotels business would be taken at an appropriate time
once the business stabilises from the current disruption. The company is
actively pursuing M&A opportunity in the FMCG & IT space
The company is largest investor in PLI for foods, RTE & marine space. ITC
would be focusing on exports of FMCG products in different countries
largely catering to overseas Indians
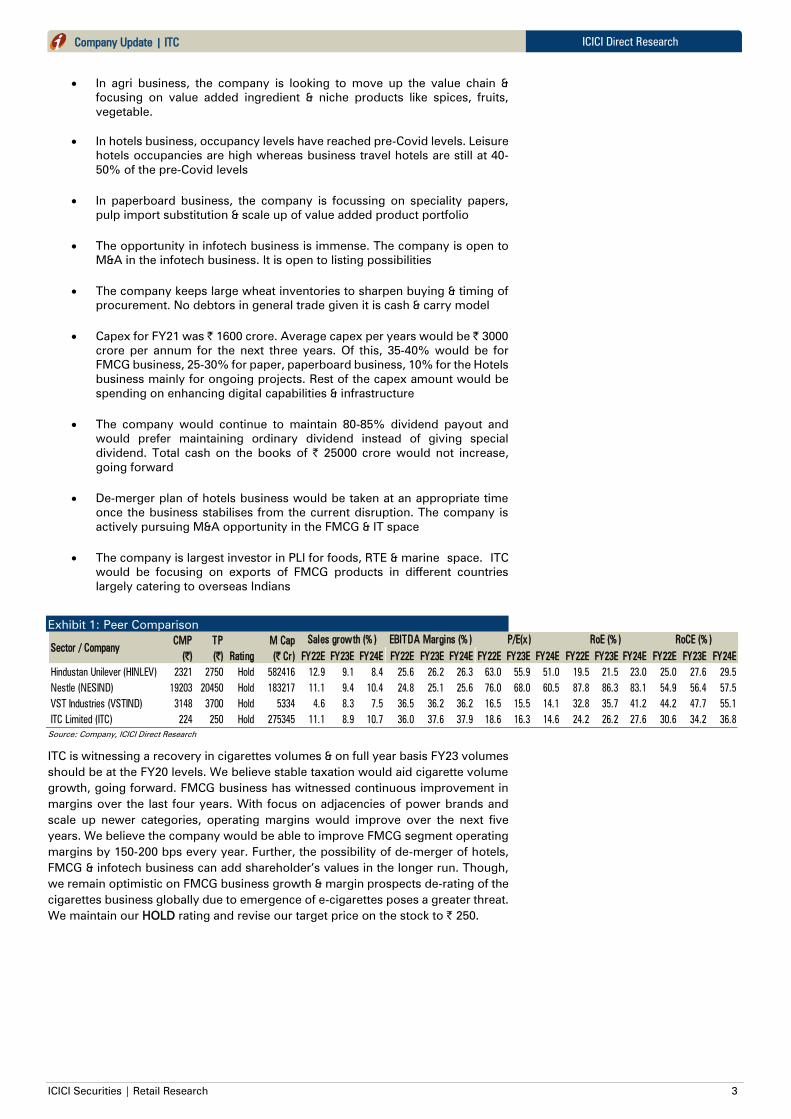
Exhibit 1: Peer Comparison
CMP TP M Cap
(|) (|) Rating (| Cr) FY22E FY23E FY24E FY22E FY23E FY24E FY22E FY23E FY24E FY22E FY23E FY24E FY22E FY23E FY24E
Hindustan Unilever (HINLEV) 2321 2750 Hold 582416 12.9 9.1 8.4 25.6 26.2 26.3 63.0 55.9 51.0 19.5 21.5 23.0 25.0 27.6 29.5
Nestle (NESIND) 19203 20450 Hold 183217 11.1 9.4 10.4 24.8 25.1 25.6 76.0 68.0 60.5 87.8 86.3 83.1 54.9 56.4 57.5
VST Industries (VSTIND) 3148 3700 Hold 5334 4.6 8.3 7.5 36.5 36.2 36.2 16.5 15.5 14.1 32.8 35.7 41.2 44.2 47.7 55.1
ITC Limited (ITC) 224 250 Hold 275345 11.1 8.9 10.7 36.0 37.6 37.9 18.6 16.3 14.6 24.2 26.2 27.6 30.6 34.2 36.8
Sector / Company
Sales growth (% ) EBITDA Margins (% ) P/E(x) RoE (% ) RoCE (% )
Source: Company, ICICI Direct Research
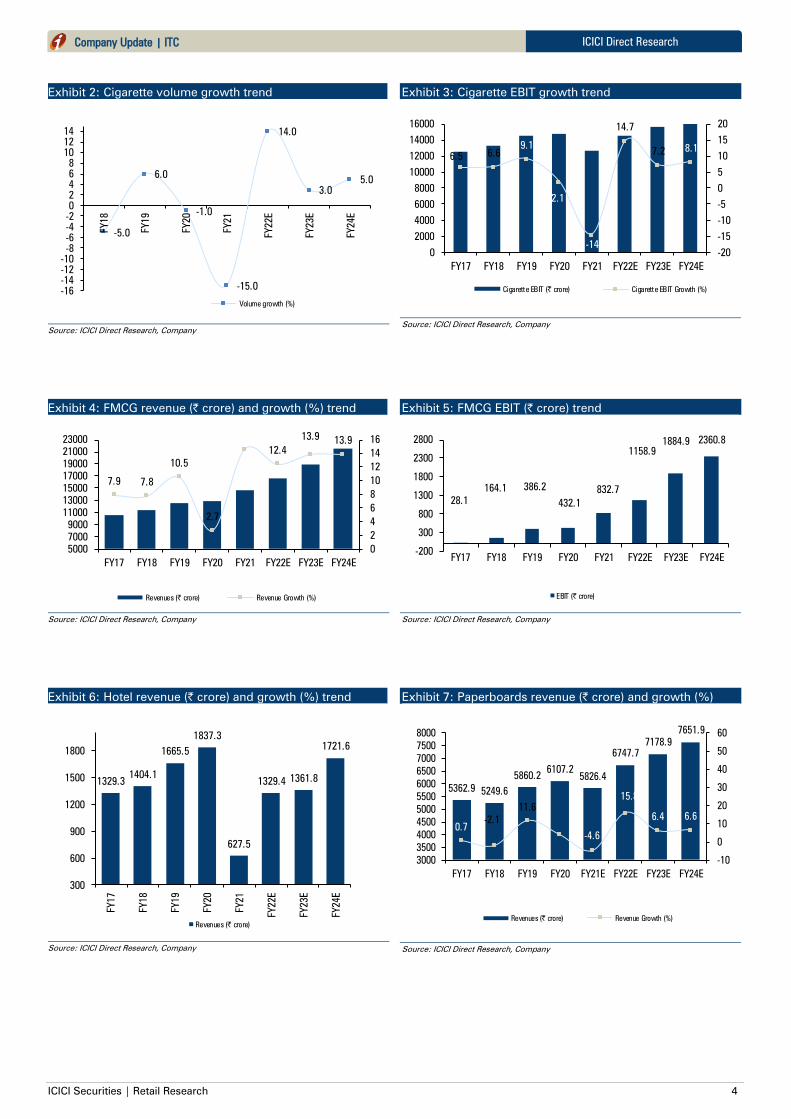
ITC is witnessing a recovery in cigarettes volumes & on full year basis FY23 volumes
should be at the FY20 levels. We believe stable taxation would aid cigarette volume
growth, going forward. FMCG business has witnessed continuous improvement in
margins over the last four years. With focus on adjacencies of power brands and
scale up newer categories, operating margins would improve over the next five
years. We believe the company would be able to improve FMCG segment operating
margins by 150-200 bps every year. Further, the possibility of de-merger of hotels,
FMCG & infotech business can add shareholder’s values in the longer run. Though,
we remain optimistic on FMCG business growth & margin prospects de-rating of the
cigarettes business globally due to emergence of e-cigarettes poses a greater threat.
We maintain our HOLD rating and revise our target price on the stock to | 250.
ICICI Securities | Retail Research 4
ICICI Direct Research
Company Update | ITC
Exhibit 2: Cigarette volume growth trend
-5.0
6.0
-1.0
-15.0
14.0
3.0
5.0
-16
-14
-12
-10
-8
-6
-4
-2
0
2
4
6
8
10
12
14
FY18
FY19
FY20
FY21
FY22E
FY23E
FY24E
Volume growth (%)
Source: ICICI Direct Research, Company
Exhibit 3: Cigarette EBIT growth trend
6.56.6
9.1
2.1
-14.4
14.7
7.28.1
-20
-15
-10
-5
0
5
10
15
20
0
2000
4000
6000
8000
10000
12000
14000
16000
FY17 FY18 FY19 FY20 FY21 FY22E FY23E FY24E
Cigarette EBIT (| crore) Cigarette EBIT Growth (%)
Source: ICICI Direct Research, Company
Exhibit 4: FMCG revenue (| crore) and growth (%) trend
7.9 7.8
10.5
2.7
14.7
12.4
13.913.9
0
2
4
6
8
10
12
14
16
5000
7000
9000
11000
13000
15000
17000
19000
21000
23000
FY17 FY18 FY19 FY20 FY21 FY22E FY23E FY24E
Revenues (| crore) Revenue Growth (%)
Source: ICICI Direct Research, Company
Exhibit 5: FMCG EBIT (| crore) trend
28.1
164.1 386.2
432.1
832.7
1158.9
1884.9 2360.8
-200
300
800
1300
1800
2300
2800
FY17 FY18 FY19 FY20 FY21 FY22E FY23E FY24E
EBIT (| crore)
Source: ICICI Direct Research, Company
Exhibit 6: Hotel revenue (| crore) and growth (%) trend
1329.31404.1
1665.5
1837.3
627.5
1329.41361.8
1721.6
300
600
900
1200
1500
1800
FY17
FY18
FY19
FY20
FY21
FY22E
FY23E
FY24E
Revenues (| crore)
Source: ICICI Direct Research, Company
Exhibit 7: Paperboards revenue (| crore) and growth (%)
5362.95249.6
5860.26107.2
5826.4
6747.7
7178.9
7651.9
0.7
-2.1
11.6
4.2
-4.6
15.8
6.4 6.6
-10
0
10
20
30
40
50
60
3000
3500
4000
4500
5000
5500
6000
6500
7000
7500
8000
FY17 FY18 FY19 FY20 FY21E FY22E FY23E FY24E
Revenues (| crore) Revenue Growth (%)
Source: ICICI Direct Research, Company
ICICI Securities | Retail Research 5
ICICI Direct Research
Company Update | ITC
Exhibit 8: Major FMCG brands
Source: ICICI Direct Research, Company
Exhibit 9: Distribution reach at 6.6 million outlets
Source: ICICI Direct Research, Company
Exhibit 10: FMCG margin expansion of 640 bps
Source: ICICI Direct Research, Company
Exhibit 11: Adjacencies of major brands to perk up margins
Source: ICICI Direct Research, Company
ICICI Securities | Retail Research 6
ICICI Direct Research
Company Update | ITC
Exhibit 12: Focus on value added products in agri business
Source: ICICI Direct Research, Company
Exhibit 13: ITC Infotech margins jump to 25%
Source: ICICI Direct Research, Company
Exhibit 14: High tax incidence on cigarettes lead to sub-
optimal tax revenue
Source: ICICI Direct Research, Company
Exhibit 15: An 8% tobacco consumption vs. 80% tax
revenues
Source: ICICI Direct Research, Company
Exhibit 16: Sum of the part valuation
Source: Company, ICICI Direct Research
135
250
85
6
12 4 9
0
50
100
150
200
250
300
Cigarettes FMCG Paper Agri Hotels Cash per
share
SOTP
ICICI Securities | Retail Research 7
ICICI Direct Research
Company Update | ITC
Financial Summary
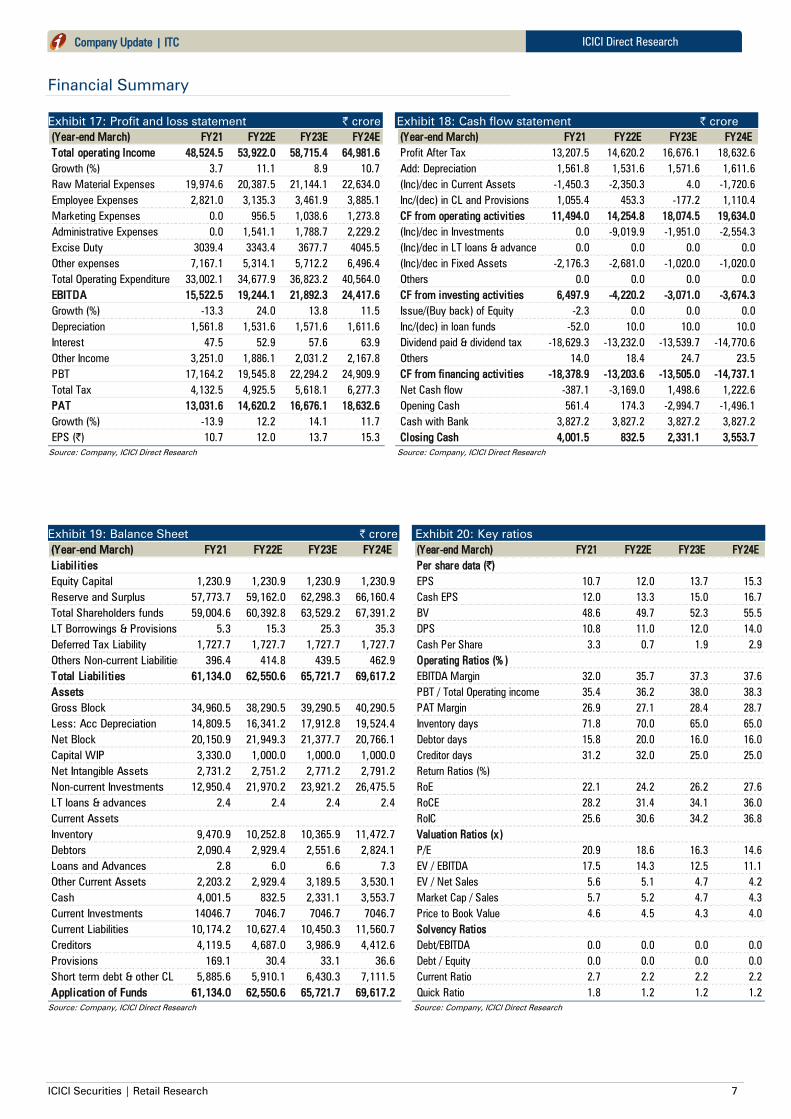
Exhibit 17: Profit and loss statement | crore
(Year-end March) FY21 FY22E FY23E FY24E
Total operating Income 48,524.5 53,922.0 58,715.4 64,981.6
Growth (%) 3.7 11.1 8.9 10.7
Raw Material Expenses 19,974.6 20,387.5 21,144.1 22,634.0
Employee Expenses 2,821.0 3,135.3 3,461.9 3,885.1
Marketing Expenses 0.0 956.5 1,038.6 1,273.8
Administrative Expenses 0.0 1,541.1 1,788.7 2,229.2
Excise Duty 3039.4 3343.4 3677.7 4045.5
Other expenses 7,167.1 5,314.1 5,712.2 6,496.4
Total Operating Expenditure 33,002.1 34,677.9 36,823.2 40,564.0
EBITDA 15,522.5 19,244.1 21,892.3 24,417.6
Growth (%) -13.3 24.0 13.8 11.5
Depreciation 1,561.8 1,531.6 1,571.6 1,611.6
Interest 47.5 52.9 57.6 63.9
Other Income 3,251.0 1,886.1 2,031.2 2,167.8
PBT 17,164.2 19,545.8 22,294.2 24,909.9
Total Tax 4,132.5 4,925.5 5,618.1 6,277.3
PAT 13,031.6 14,620.2 16,676.1 18,632.6
Growth (%) -13.9 12.2 14.1 11.7
EPS (|) 10.7 12.0 13.7 15.3
Source: Company, ICICI Direct Research
Exhibit 18: Cash flow statement | crore
(Year-end March) FY21 FY22E FY23E FY24E
Profit After Tax 13,207.5 14,620.2 16,676.1 18,632.6
Add: Depreciation 1,561.8 1,531.6 1,571.6 1,611.6
(Inc)/dec in Current Assets -1,450.3 -2,350.3 4.0 -1,720.6
Inc/(dec) in CL and Provisions 1,055.4 453.3 -177.2 1,110.4
CF from operating activities 11,494.0 14,254.8 18,074.5 19,634.0
(Inc)/dec in Investments 0.0 -9,019.9 -1,951.0 -2,554.3
(Inc)/dec in LT loans & advances 0.0 0.0 0.0 0.0
(Inc)/dec in Fixed Assets -2,176.3 -2,681.0 -1,020.0 -1,020.0
Others 0.0 0.0 0.0 0.0
CF from investing activities 6,497.9 -4,220.2 -3,071.0 -3,674.3
Issue/(Buy back) of Equity -2.3 0.0 0.0 0.0
Inc/(dec) in loan funds -52.0 10.0 10.0 10.0
Dividend paid & dividend tax -18,629.3 -13,232.0 -13,539.7 -14,770.6
Others 14.0 18.4 24.7 23.5
CF from financing activities -18,378.9 -13,203.6 -13,505.0 -14,737.1
Net Cash flow -387.1 -3,169.0 1,498.6 1,222.6
Opening Cash 561.4 174.3 -2,994.7 -1,496.1
Cash with Bank 3,827.2 3,827.2 3,827.2 3,827.2
Closing Cash 4,001.5 832.5 2,331.1 3,553.7
Source: Company, ICICI Direct Research
Exhibit 19: Balance Sheet | crore
(Year-end March) FY21 FY22E FY23E FY24E
Liabil ities
Equity Capital 1,230.9 1,230.9 1,230.9 1,230.9
Reserve and Surplus 57,773.7 59,162.0 62,298.3 66,160.4
Total Shareholders funds 59,004.6 60,392.8 63,529.2 67,391.2
LT Borrowings & Provisions 5.3 15.3 25.3 35.3
Deferred Tax Liability 1,727.7 1,727.7 1,727.7 1,727.7
Others Non-current Liabilities 396.4 414.8 439.5 462.9
Total Liabil ities 61,134.0 62,550.6 65,721.7 69,617.2
Assets
Gross Block 34,960.5 38,290.5 39,290.5 40,290.5
Less: Acc Depreciation 14,809.5 16,341.2 17,912.8 19,524.4
Net Block 20,150.9 21,949.3 21,377.7 20,766.1
Capital WIP 3,330.0 1,000.0 1,000.0 1,000.0
Net Intangible Assets 2,731.2 2,751.2 2,771.2 2,791.2
Non-current Investments 12,950.4 21,970.2 23,921.2 26,475.5
LT loans & advances 2.4 2.4 2.4 2.4
Current Assets
Inventory 9,470.9 10,252.8 10,365.9 11,472.7
Debtors 2,090.4 2,929.4 2,551.6 2,824.1
Loans and Advances 2.8 6.0 6.6 7.3
Other Current Assets 2,203.2 2,929.4 3,189.5 3,530.1
Cash 4,001.5 832.5 2,331.1 3,553.7
Current Investments 14046.7 7046.7 7046.7 7046.7
Current Liabilities 10,174.2 10,627.4 10,450.3 11,560.7
Creditors 4,119.5 4,687.0 3,986.9 4,412.6
Provisions 169.1 30.4 33.1 36.6
Short term debt & other CL 5,885.6 5,910.1 6,430.3 7,111.5
Application of Funds 61,134.0 62,550.6 65,721.7 69,617.2
Source: Company, ICICI Direct Research
Exhibit 20: Key ratios
(Year-end March) FY21 FY22E FY23E FY24E
Per share data (|)
EPS 10.7 12.0 13.7 15.3
Cash EPS 12.0 13.3 15.0 16.7
BV 48.6 49.7 52.3 55.5
DPS 10.8 11.0 12.0 14.0
Cash Per Share 3.3 0.7 1.9 2.9
Operating Ratios (% )
EBITDA Margin 32.0 35.7 37.3 37.6
PBT / Total Operating income 35.4 36.2 38.0 38.3
PAT Margin 26.9 27.1 28.4 28.7
Inventory days 71.8 70.0 65.0 65.0
Debtor days 15.8 20.0 16.0 16.0
Creditor days 31.2 32.0 25.0 25.0
Return Ratios (%)
RoE 22.1 24.2 26.2 27.6
RoCE 28.2 31.4 34.1 36.0
RoIC 25.6 30.6 34.2 36.8
Valuation Ratios (x)
P/E 20.9 18.6 16.3 14.6
EV / EBITDA 17.5 14.3 12.5 11.1
EV / Net Sales 5.6 5.1 4.7 4.2
Market Cap / Sales 5.7 5.2 4.7 4.3
Price to Book Value 4.6 4.5 4.3 4.0
Solvency Ratios
Debt/EBITDA 0.0 0.0 0.0 0.0
Debt / Equity 0.0 0.0 0.0 0.0
Current Ratio 2.7 2.2 2.2 2.2
Quick Ratio 1.8 1.2 1.2 1.2
Source: Company, ICICI Direct Research
ICICI Securities | Retail Research 8
ICICI Direct Research
Company Update | ITC
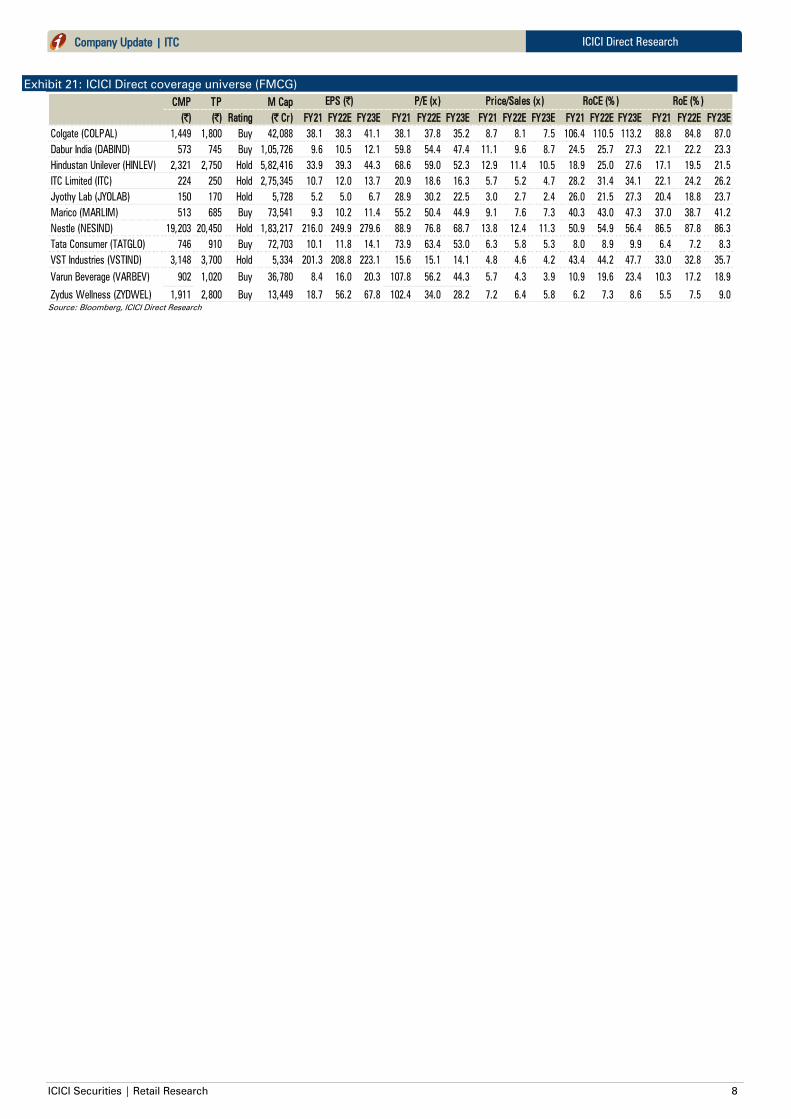
Exhibit 21: ICICI Direct coverage universe (FMCG)
CMP TP M Cap
(|) (|) Rating (| Cr) FY21 FY22E FY23E FY21 FY22E FY23E FY21 FY22E FY23E FY21 FY22E FY23E FY21 FY22E FY23E
Colgate (COLPAL) 1,449 1,800 Buy 42,088 38.1 38.3 41.1 38.1 37.8 35.2 8.7 8.1 7.5 106.4 110.5 113.2 88.8 84.8 87.0
Dabur India (DABIND) 573 745 Buy 1,05,726 9.6 10.5 12.1 59.8 54.4 47.4 11.1 9.6 8.7 24.5 25.7 27.3 22.1 22.2 23.3
Hindustan Unilever (HINLEV) 2,321 2,750 Hold 5,82,416 33.9 39.3 44.3 68.6 59.0 52.3 12.9 11.4 10.5 18.9 25.0 27.6 17.1 19.5 21.5
ITC Limited (ITC) 224 250 Hold 2,75,345 10.7 12.0 13.7 20.9 18.6 16.3 5.7 5.2 4.7 28.2 31.4 34.1 22.1 24.2 26.2
Jyothy Lab (JYOLAB) 150 170 Hold 5,728 5.2 5.0 6.7 28.9 30.2 22.5 3.0 2.7 2.4 26.0 21.5 27.3 20.4 18.8 23.7
Marico (MARLIM) 513 685 Buy 73,541 9.3 10.2 11.4 55.2 50.4 44.9 9.1 7.6 7.3 40.3 43.0 47.3 37.0 38.7 41.2
Nestle (NESIND) 19,203 20,450 Hold 1,83,217 216.0 249.9 279.6 88.9 76.8 68.7 13.8 12.4 11.3 50.9 54.9 56.4 86.5 87.8 86.3
Tata Consumer (TATGLO) 746 910 Buy 72,703 10.1 11.8 14.1 73.9 63.4 53.0 6.3 5.8 5.3 8.0 8.9 9.9 6.4 7.2 8.3
VST Industries (VSTIND) 3,148 3,700 Hold 5,334 201.3 208.8 223.1 15.6 15.1 14.1 4.8 4.6 4.2 43.4 44.2 47.7 33.0 32.8 35.7
Varun Beverage (VARBEV) 902 1,020 Buy 36,780 8.4 16.0 20.3 107.8 56.2 44.3 5.7 4.3 3.9 10.9 19.6 23.4 10.3 17.2 18.9
Zydus Wellness (ZYDWEL) 1,911 2,800 Buy 13,449 18.7 56.2 67.8 102.4 34.0 28.2 7.2 6.4 5.8 6.2 7.3 8.6 5.5 7.5 9.0
EPS (|) P/E (x) Price/Sales (x) RoCE (% ) RoE (% )
Source: Bloomberg, ICICI Direct Research
ICICI Securities | Retail Research 9
ICICI Direct Research
Company Update | ITC
RATING RATIONALE
ICICI Direct endeavours to provide objective opinions and recommendations. ICICI Direct assigns ratings to its
stocks according -to their notional target price vs. current market price and then categorizes them as Buy, Hold,
Reduce and Sell. The performance horizon is two years unless specified and the notional target price is defined
as the analysts' valuation for a stock
Buy: >15%
Hold: -5% to 15%;
Reduce: -15% to -5%;
Sell: <-15%
Pankaj Pandey Head – Research [email protected]
ICICI Direct Research Desk,
ICICI Securities Limited,
1st Floor, Akruti Trade Centre,
Road No 7, MIDC,
Andheri (East)
Mumbai – 400 093
ICICI Securities | Retail Research 10
ICICI Direct Research
Company Update | ITC
ANALYST CERTIFICATION
I/We, Sanjay Manyal (MBA Finance) Research Analysts, authors and the names subscribed to this report, hereby certify that all of the views expressed in this research report accurately reflect
our views about the subject issuer(s) or securities. We also certify that no part of our compensation was, is, or will be directly or indirectly related to the specific recommendation(s) or view(s)
in this report. It is also confirmed that above mentioned Analysts of this report have not received any compensation from the companies mentioned in the report in the preceding twelve
months and do not serve as an officer, director or employee of the companies mentioned in the report.
Terms & conditions and other disclosures:
ICICI Securities Limited (ICICI Securities) is a full-service, integrated investment banking and is, inter alia, engaged in the business of stock brokering and distribution of financial products.
ICICI Securities is Sebi registered stock broker, merchant banker, investment adviser, portfolio manager and Research Analyst. ICICI Securities is registered with Insurance Regulatory
Development Authority of India Limited (IRDAI) as a composite corporate agent and with PFRDA as a Point of Presence. ICICI Securities Limited Research Analyst SEBI Registration Number –
INH000000990. ICICI Securities Limited SEBI Registration is INZ000183631 for stock broker. ICICI Securities is a subsidiary of ICICI Bank which is India’s largest private sector bank and has its
various subsidiaries engaged in businesses of housing finance, asset management, life insurance, general insurance, venture capital fund management, etc. (“associates”), the details in respect
of which are available on www.icicibank.com.
ICICI Securities is one of the leading merchant bankers/ underwriters of securities and participate in virtually all securities trading markets in India. We and our associates might have investment
banking and other business relationship with a significant percentage of companies covered by our Investment Research Department. ICICI Securities and its analysts, persons reporting to
analysts and their relatives are generally prohibited from maintaining a financial interest in the securities or derivatives of any companies that the analysts cover.
Recommendation in reports based on technical and derivative analysis centre on studying charts of a stock's price movement, outstanding positions, trading volume etc as opposed to focusing
on a company's fundamentals and, as such, may not match with the recommendation in fundamental reports. Investors may visit icicidirect.com to view the Fundamental and Technical
Research Reports.
Our proprietary trading and investment businesses may make investment decisions that are inconsistent with the recommendations expressed herein.
ICICI Securities Limited has two independent equity research groups: Institutional Research and Retail Research. This report has been prepared by the Retail Research. The views and opinions
expressed in this document may or may not match or may be contrary with the views, estimates, rating, and target price of the Institutional Research.
The information and opinions in this report have been prepared by ICICI Securities and are subject to change without any notice. The report and information contained herein is strictly
confidential and meant solely for the selected recipient and may not be altered in any way, transmitted to, copied or distributed, in part or in whole, to any other person or to the media or
reproduced in any form, without prior written consent of ICICI Securities. While we would endeavor to update the information herein on a reasonable basis, ICICI Securities is under no
obligation to update or keep the information current. Also, there may be regulatory, compliance or other reasons that may prevent ICICI Securities from doing so. Non-rated securities indicate
that rating on a particular security has been suspended temporarily and such suspension is in compliance with applicable regulations and/or ICICI Securities policies, in circumstances where
ICICI Securities might be acting in an advisory capacity to this company, or in certain other circumstances.
This report is based on information obtained from public sources and sources believed to be reliable, but no independent verification has been made nor is its accuracy or completeness
guaranteed. This report and information herein is solely for informational purpose and shall not be used or considered as an offer document or solicitation of offer to buy or sell or subscribe
for securities or other financial instruments. Though disseminated to all the customers simultaneously, not all customers may receive this report at the same time. ICICI Securities will not treat
recipients as customers by virtue of their receiving this report. Nothing in this report constitutes investment, legal, accounting and tax advice or a representation that any investment or strategy
is suitable or appropriate to your specific circumstances. The securities discussed and opinions expressed in this report may not be suitable for all investors, who must make their own
investment decisions, based on their own investment objectives, financial positions and needs of specific recipient. This may not be taken in substitution for the exercise of independent
judgment by any recipient. The recipient should independently evaluate the investment risks. The value and return on investment may vary because of changes in interest rates, foreign
exchange rates or any other reason. ICICI Securities accepts no liabilities whatsoever for any loss or damage of any kind arising out of the use of this report. Past performance is not necessarily
a guide to future performance. Investors are advised to see Risk Disclosure Document to understand the risks associated before investing in the securities markets. Actual results may differ
materially from those set forth in projections. Forward-looking statements are not predictions and may be subject to change without notice.
ICICI Securities or its associates might have managed or co-managed public offering of securities for the subject company or might have been mandated by the subject company for any other
assignment in the past twelve months.
ICICI Securities or its associates might have received any compensation from the companies mentioned in the report during the period preceding twelve months from the date of this report
for services in respect of managing or co-managing public offerings, corporate finance, investment banking or merchant banking, brokerage services or other advisory service in a merger or
specific transaction.
ICICI Securities encourages independence in research report preparation and strives to minimize conflict in preparation of research report. ICICI Securities or its associates or its analysts did
not receive any compensation or other benefits from the companies mentioned in the report or third party in connection with preparation of the research report. Accordingly, neither ICICI
Securities nor Research Analysts and their relatives have any material conflict of interest at the time of publication of this report.
Compensation of our Research Analysts is not based on any specific merchant banking, investment banking or brokerage service transactions.
ICICI Securities or its subsidiaries collectively or Research Analysts or their relatives do not own 1% or more of the equity securities of the Company mentioned in the report as of the last day
of the month preceding the publication of the research report.
Since associates of ICICI Securities and ICICI Securities as a entity are engaged in various financial service businesses, they might have financial interests or beneficial ownership in various
companies including the subject company/companies mentioned in this report.
ICICI Securities may have issued other reports that are inconsistent with and reach different conclusion from the information presented in this report.
Neither the Research Analysts nor ICICI Securities have been engaged in market making activity for the companies mentioned in the report.
We submit that no material disciplinary action has been taken on ICICI Securities by any Regulatory Authority impacting Equity Research Analysis activities.
This report is not directed or intended for distribution to, or use by, any person or entity who is a citizen or resident of or located in any locality, state, country or other jurisdiction, where such
distribution, publication, availability or use would be contrary to law, regulation or which would subject ICICI Securities and affiliates to any registration or licensing requirement within such
jurisdiction. The securities described herein may or may not be eligible for sale in all jurisdictions or to certain category of investors. Persons in whose possession this document may come are
required to inform themselves of and to observe such restriction.