Embed Size (px)
Citation preview
Investors are advised to refer through important disclosures made at the last page of the Research Report.
Motilal Oswal research is available on www.motilaloswal.com/Institutional-Equities, Bloomberg, Thomson Reuters, Factset and S&P Capital.
Research Analyst: Nitin Aggarwal ([email protected]) | Himanshu Taluja ([email protected]); Alpesh Mehta ([email protected]) | Yash Agarwal ([email protected])
BSE SENSEX S&P CNX CMP: INR502 TP: INR630 (+25%) Buy 45,080 13,259
Stock Info
Bloomberg ICICIBC IN
Equity Shares (m) 6,897
M.Cap.(INRb)/(USDb) 3465 / 45.1
52-Week Range (INR) 552 / 269
1, 6, 12 Rel. Per (%) 4/12/-15
12M Avg Val (INR M) 14058
Free float (%) 100.0
Financials Snapshot (INR b)
Y/E March FY20 FY21E FY22E
NII 332.7 383.0 450.6
OP 281.0 370.3 381.0
NP 79.3 136.7 199.1
NIM (%) 3.7 3.6 3.7
EPS (INR) 12.3 20.5 28.9
EPS Gr (%) 135.0 66.7 41.2
ABV/Sh (INR) 151.3 181.3 206.0
Cons. BV/Sh (INR) 189.9 196.9 219.0
Ratios RoE (%) 7.3 10.8 13.3
RoA (%) 0.8 1.2 1.5
Valuations P/BV (x) (Cons) 2.6 2.6 2.3
P/ABV (x)* 2.5 2.1 1.8
P/E (x)* 30.4 18.2 12.9
*Multiples adjusted for Subs Shareholding pattern (%)
As On Sep-20 Jun-20 Sep-19
Promoter 0.0 0.0 0.0
DII 36.1 37.8 37.4
FII 55.6 53.4 54.0
Others 8.3 8.9 8.6
FII Includes depository receipts
Stock Performance (1-year)
Operating performance resilient; technology remains key growth driver Gaining market share with strong risk control; returns ratios to improve steadily
We attended ICICI Bank (ICICIBC)’s Analyst Day, wherein the bank highlighted the
progress in its different businesses and how the bank is positioned to capitalize on
the exciting opportunities in the space. The topics of discussion constituted (a) how
the management is trying to build a strong bank with best-in-class digital
capabilities, (b) using technology to accelerate growth across business verticals and
maintaining healthy operating metrics, (c) focusing on identifying potential micro
markets for expansion, (d) strong demand recovery in consumption loans, with
disbursements in secured loans surpassing pre-COVID levels, and (e) how asset
quality has remained resilient, with the bank maintaining one of the highest
coverages among private banks.
ICICI Bank has historically been a technology-savvy bank and has several innovations
to its credit. However, systemic asset quality concerns have taken the center-stage
and diverted investor focus away from the strong digital capabilities/innovations
built by the bank. New digital innovations have positioned the bank well to gain
incremental market share across key product lines.
ICICIBC carries an additional provision buffer of 1.3% of loans, besides robust PCR. It
has suggested in the past that corporate restructuring is likely to account for less
than 100bp of loans. The bank expects credit cost to normalize fully in FY22E, which
would accelerate earnings growth. We estimate FY22/FY23 RoA at 1.5%/1.7%,
enabling the bank to deliver FY23E RoE of 15.2%. We reiterate ICICIBC as one of our
top buys in the sector and revise our SOTP-based Target Price to INR630 (2.2x
Sep’22e ABV for the bank).
Retail Banking – focus on building retail franchise with a digital edge ICICIBC has built strong digital capabilities to provide customized cutting-edge
digital solutions – which is helping the bank gain market share across business
segments. It remains focused on identifying potential micro markets for expansion
and strong demand recovery in consumption loans. Disbursements in secured
loans surpassed pre-COVID levels to reach 113% of Feb’20 levels – Auto Loans
(164%), Mortgage Loans (139%), Two-Wheeler (118%), and Commercial Business
(78%). Also, in the unsecured portfolio, disbursement trends improved, but
remained below pre-COVID levels. On the digital front, 88% of personal loans
were sourced digitally, 80% of credit cards issued digitally, and 58% of deposit
accounts opened digitally. Overall, the bank’s focus is on building a retail franchise
with a strong digital edge.
Rural Banking – strong potential growth engine ICICIBC sees strong growth opportunity in Rural Banking as the rural economy is
picking up at a faster rate. Direct Benefit Transfer (DBT) has helped bring the rural
population under the banking channel. ICICIBC has a well-diversified portfolio,
250
370
490
610
No
v-1
9
Feb
-20
May
-20
Au
g-2
0
No
v-2
0
ICICI Bank Sensex - Rebased
5 December 2020
Update | Sector: Financials
ICICI Bank
Company name Company name
ICICI Bank
5 December 2020 2
with 96% of the portfolio secured and diversified across 26 states. The portfolio
has grown at 1.8x over the last three years; the bank remains focused on building
multiple lines of business to capture the entire money flow in Rural Banking.
Business Banking – unique customized solutions to aid growth The Business Banking segment remains significantly underpenetrated, and the bank
has identified focus segments – such as Retailers, Manufacturing, Start-Ups, and
Exporters/Importers – to pursue growth opportunities. ICICIBC has built customized
digital solutions, such as supply chain finance, GST OD, purpose-based loans, and
bank guarantee solutions, to accelerate growth. The bank has developed the
‘InstaBIZ’ portal for the Business Banking segment and received the ‘Best Digital
Innovation’ award in 2020. In 1HFY21, the Business Banking segment grew at 37%
YoY; thus, expect this strong momentum to sustain.
Corporate Banking – less than 1% of loans to avail restructuring Many lead indicators such as the Manufacturing PMI index, GST collections, and
NHAI toll collections suggest economic activity is recovering. On the back of this, the
bank expects the capex cycle to improve, with the govt., PSU entities, and large
corporates likely to drive capacity expansion. ICICIBC is well-placed in the current
environment to gain market share, led by strong digital solutions, low-cost liability
franchises, and increased provision coverage on the existing stress portfolio. The
bank aims to tap business opportunities across the entire ecosystem value with end-
to-end solutions. The bank expects corporate restructuring to be less than 100bp of
loans.
Valuation and view ICICIBC appears firmly positioned to deliver healthy sustainable growth, supported
by continued investments in technology and expansion in its digital offerings.
ICICIBC is seeing strong demand recovery in consumption loans, with disbursements
in secured loans having surpassed pre-COVID levels. Also, Business Banking and
Rural Banking would be other strong growth drivers for the bank. The bank expects
the corporate restructuring book to be ~1% of loans and guided for normalization of
credit cost in FY22. ICICIBC carries an additional provision buffer of 1.3% of loans,
and has one of the highest provision coverages in the Banking sector. ICICIBC
remains one of our top ideas in the BFSI space, and we expect RoA/RoE of
1.7%/15.2% for FY23E. Maintain Buy, with revised SOTP-based Target Price of
INR630 (2.2x Sep’22e ABV for the bank).
ICICI Bank
5 December 2020 3
Key takeaways from our session with the top management
Session #1: Retail Banking: Accelerating Digital Part 1 – Mr Anup Bagchi (Executive
Director), Mr Pranav Mishra (Head Liabilities), Mr Vyom Upadhyay (Head Data
Science & Analytics), Mr Goutam Sanyal (Head Retail, Operational Risk & Credit
Monitoring), Mr Ravi Narayanan (Head Secured Assets, DSMG & Construction
Funding)
The household credit to GDP ratio stands at 12% for India v/s 68% for the US and
61% for China. Macro indicators are performing well and suggest the economy is
working broadly at pre-COVID levels.
The bank’s core principles are a) customer-centricity, b) risk-calibrated core
operating profits, c) ‘Fair to Customer, Fair to Bank’, and d) the 360-degree
customer approach.
The focus would remain on growing ecosystems, providing the full bouquet of
products, such as Equity, SIP, Protection, PPF, NPS, etc.
The focus on retail liabilities is to create a low-cost deposit franchise. Liability
growth is likely to be driven by data analytics with the aim to deepen relationships.
The focus is on providing the right product offering and enabling opportunities for
cross-selling.
The bank has introduced ICICI STACK, a comprehensive strategy, as a core strategic
pillar.
Data analytics helps in assessing the risks, resulting in better underwriting and
improved sourcing quality.
The bank is designing risk acceptance criteria to optimize the use of data-driven
models for underwriting based on various customer traits.
The bank has established an ecosystem for early risk identification and targeted
actions using internal and external sources.
Pre-COVID stats: Data analytics was successfully predicting ~80% of the bounces.
~80% of collections were being done digitally, with ~1.2m payments per month.
Acquiring internal customers is cost-effective and helps strengthen the core
operating profits of the bank.
While outages could occur, more important is the backup and pace of recovery.
Higher emphasis remains on providing seamless services.
Session #2: Retail Banking: Accelerating Digital Part 2 – Mr Anup Bagchi (Executive
Director), Mr Atul Arora (Head Retail Business North), Mr Bijith Bhaskar (Head
Digital Channels & Partnership), Mr Sudipta Roy (Head Unsecured Assets), Mr Ravi
Narayanan (Head Secured Assets, DSMG & Construction Funding), Mr Sriram
Hariharan (Head International Banking Group, Global Remittances & NRI Services)
The bank is leveraging data and the digital platform to strengthen its distribution
strategy.
It follows a micro-market approach to gain market share by dividing a city under
various categories offering personalized solutions.
The branch format has been shortened to 300 sq. ft. v/s 1,500 sq. ft. for earlier
branches. This helps achieve faster breakeven and adds to core operating profits.
The bank has added more virtual branch managers v/s physical branch managers.
ICICI Bank
5 December 2020 4
The digital strategy is aimed at delivering scale and driving core profitability.
Retail Banking: 71% of customers and ~86% of NRI customers are digitally active.
92% of transactions are happening digitally.
Corporate Banking: 70% are digitally active, a ~2x increase is seen in InstaBIZ logins,
and on-the-go trade and forex has been launched.
~3m queries are being handled through chatbots and voice banking; WhatsApp
banking has ~2m customers and 5m active conversations.
Some digital stats: A 17x increase is seen in the no of deposit account openings –
58% of deposit accounts are opened digitally. A 31x increase is seen in general
insurance policies sold, while 54% of MFs is sold digitally. 80% of credit cards are
issued digitally, while the bank is seeing a 7x increase in mortgage sanctions.
The bank has seen a 5x increase in the current account book and 7x growth in
transactions.
The bank has 19% market share in UPI and ranks 2nd in the industry. UPI
contributes ~46% share to total retail payments.
Secured loan disbursements for Oct stand at 113% of Feb’20 – Auto Loans (164%),
Mortgage Loans (139%), Two-Wheeler (118%), and Commercial Business (78%).
88% of personal loans were digitally originated over 1HFY21 v/s 62% in FY20 and
32% in FY19.
88% of credit cards were digitally originated over 1HFY21 v/s 34% in FY20 and 20%
in FY19.
Avg. daily video KYC approvals stand at ~2000 per day. 42% of new Amazon Pay
cards were approved through video KYC (activation rate stands at 65%).
Disbursements: Personal loans stood at 81% of pre-COVID levels for Oct v/s 62% in
2QFY21.
Credit card spends were at 107% of pre-COVID levels for Oct v/s 83% in 2QFY21.
Cards in Force have reached pre-COVID levels.
FASTag spends stand at 121% of pre-COVID levels.
The focus is on acquiring NRI business through digital offerings. It is re-designing
solutions such as NRI tuition fees. The time taken by NRIs to open bank accounts
with the bank has been reduced from two weeks to two days. Inward and outward
remittances stand at ~130% of pre-COVID levels.
There are ~41k digitally approved properties on the ICICI Home website
(home.icicibank.com), while ~200k auto dealers are registered digitally on the ICICI
Auto website (icicibank.com/auto).
Pay Later is an unsecured business, which includes new-to-credit customers who
may not have proper CIBIL scores. Currently, this forms a very small proportion.
Session #3: Business Banking – Mr Anup Bagchi (Executive Director), Mr Ajay
Gupta (Head Transaction Banking & SMEG), Mr Pankaj Gadgil (Head Self-Employed
Segment)
The bank is generating new lines of business in the Business Banking portfolio. This
would enable strong growth opportunity.
It is leveraging technology to expand its Business Banking book and provide
integrated API/ERP to MSMEs for improving their competency and ease of work.
90% of bank guarantees are being issued within three hours; thus, a 50% increase is
seen in bank guarantees.
ICICI Bank
5 December 2020 5
~115k loans have been disbursed digitally. Digitization has resulted in a 25%
increase in RM productivity.
The bank provides ERP integration to provide supply chain solutions, resulting in the
onboarding of new customers and deepening relationships.
Launched BIZCIRCLE is a networking app to connect with multiple MSMEs to cater
to requirements on a wider scale.
InstaBIZ: The bank onboarded ~1.1m customers, financial transactions increased by
2.4x, and non-financial transactions increased by 4.6x. The bank has cross-sold ~78k
products. It also caters to start-ups’ needs.
75% of transactions are on digital channels, with 70% of customers active in digital
banking. It has a ~62% self-funding ratio and 30% CA book attached with CMS. 85%
of the Business Banking book has collateral of 100%. The aim is to have superior
underwriting with a much lower/controlled credit cost.
On competition from fintechs: Business banking customers require a large bouquet
of services, while fintechs are unable to provide all of the solutions. Thus, the bank
plays an important role in providing a full range of services to the business banking
customer.
Session #4: Reimagine Rural Business – Mr Anup Bagchi (Executive Director), Mr
Avijit Saha (Head Rural & Inclusive Banking)
The portfolio has seen growth of 1.8x over the past three years, 96% being the
secured portfolio. The portfolio remains highly diversified.
The bank has 0.5m digital points and a total of 20m customers, of which ~15m are
under-banked.
60% of rural GDP comes from the Manufacturing/Services sector, while 40% comes
from Agriculture/Farmers.
Agriculture: 47% of the business is agriculture-related, with ~49% specialist RMs.
Self-Employed: 2.2m customers contribute 29% to the business, with 19% specialist
RMs.
The dealer business forms 4% of the business, micro-entrepreneurs form 7% of the
business, and corporate forms 6% of the business.
It has created six ecosystems to build diversity in the business. This diversification
aids risk reduction as risk is uncontrollable due to the monsoons.
The ticket size remains small, while the reach is larger; hence, the emphasis remains
on per unit cost, which is important to maintain profitability.
Overall, Improving road infra, telecom infra, DBT and per capita in the rural
economy, presents strong opportunity in this business portfolio. Therefore, the
focus remains largely on building unique solutions in this segment.
Key risk in the portfolio is uncontrollable due to the monsoons; thus, the bank has
to carefully watch out for risk-adjusted returns.
Session #5: Corporate Ecosystem Part 1 – Ms Vishakha Mulye (Executive Director),
Mr Anuj Bhargava (Head Global Clients Group, MNC, PSU & Advisory), Mr Hitesh
Sethia (Head Transaction Banking), Mr Vijay Deshwal (Head Services Sector Group)
The objective remains on maximizing risk-calibrated core operating profits. The
objective is to maintain Portfolio Quality, i.e., Return of capital and Earnings
Quality, i.e., Return on Capital.
Collection efficiency from the moratorium book stands at ~95%.
ICICI Bank
5 December 2020 6
Expect the restructuring book to be less than 1% of total loans. Corporate India is
more bullish currently v/s pre-COVID times.
The bank is seeing renewed optimism in capital expenditure. This is likely to be
driven by the govt. and PSUs; however, demand from corporate is also likely to
increase.
The Cement, Steel, Pharma, and Renewables sectors could see some increase in
capex.
The aim remains on working with customers across their life cycles. ICICIBC is
working toward capturing the entire ecosystem to provide end-to-end solutions.
The bank is not witnessing many disbursements under the ECLG 2.0 toward
corporates.
Trade online platform: 40+ products; 56% digital penetration in FY21YTD; 1.8x
increase in trade digital adoption in FY21 YTD
CP online platform: 2x increase in market share and INR166b flows happening
through this platform
MNC portal platform: One of the identified growth engines for the bank; single
gateway for MNCs to set up in India – within the first four weeks of launch, the bank
received nearly 2k inquiries from eight countries.
The dealer vendor portfolio grew at 50% YoY.
Session #6: Corporate Ecosystem Part 2 – Ms Vishakha Mulye (Executive Director),
Mr Vyom Upadhay (Head Data Science & Analytics), Mr Sumit Sanghai (Head Large
Clients Group, Capital Markets, Custody & Financial Sponsor), Mr Prasanna
Balachander (Group Head Global Markets, Sales, Trading & Research)
The focus remains on Return of Capital with Right Selection, granular acquisitions,
parametrized lending, and process decongestion. Their strong monitoring helps
maintain robust asset quality.
The bank follows pre-sanction, pre-screening, and working with industry winners as
parameters to growth.
The circular on current account has resulted in positive delta for ICICIBC.
Digitization is being used to provide customer-focused treasury services. The aim is
to provide a one-stop solution for diverse needs.
The focus remains on enhancing customer experiences through end-to-end digital
adoption.
Operating profit has grown by 1.6x over the past two years, and assets have
grown by 1.3x. Deposits have grown 2x over the past two years.
90% of incremental disbursements are toward corporates rated A- and above.
Project leap: It is reaching the subsidiaries of large corporates for opportunities. The
risk reward is quite favorable here.
FX and trade have increased, resulting in improving fee income trends.
ICICI Bank
5 December 2020 7
Story in charts
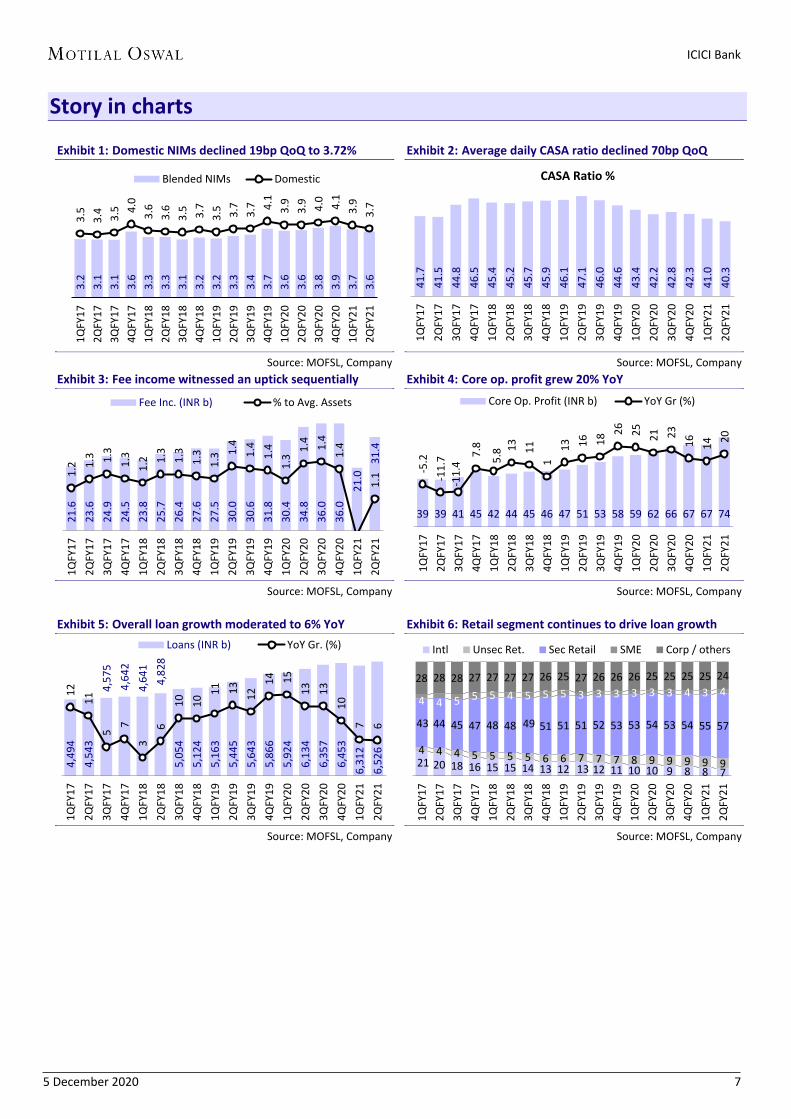
Exhibit 1: Domestic NIMs declined 19bp QoQ to 3.72%
Source: MOFSL, Company
Exhibit 2: Average daily CASA ratio declined 70bp QoQ
Source: MOFSL, Company
Exhibit 3: Fee income witnessed an uptick sequentially
Source: MOFSL, Company
Exhibit 4: Core op. profit grew 20% YoY
Source: MOFSL, Company
Exhibit 5: Overall loan growth moderated to 6% YoY
Source: MOFSL, Company
Exhibit 6: Retail segment continues to drive loan growth
Source: MOFSL, Company
3.2
3.1
3.1
3.6
3.3
3.3
3.1
3.2
3.2
3.3
3.4
3.7
3.6
3.6
3.8
3.9
3.7
3.6
3.5
3.4
3.5
4.0
3.6
3.6
3.5
3.7
3.5
3.7
3.7
4.1
3.9
3.9
4.0
4.1
3.9
3.7
1Q
FY1
7
2Q
FY1
7
3Q
FY1
7
4Q
FY1
7
1Q
FY1
8
2Q
FY1
8
3Q
FY1
8
4Q
FY1
8
1Q
FY1
9
2Q
FY1
9
3Q
FY1
9
4Q
FY1
9
1Q
FY2
0
2Q
FY2
0
3Q
FY2
0
4Q
FY2
0
1Q
FY2
1
2Q
FY2
1
Blended NIMs Domestic
41
.7
41
.5
44
.8
46
.5
45
.4
45
.2
45
.7
45
.9
46
.1
47
.1
46
.0
44
.6
43
.4
42
.2
42
.8
42
.3
41
.0
40
.3
1Q
FY1
7
2Q
FY1
7
3Q
FY1
7
4Q
FY1
7
1Q
FY1
8
2Q
FY1
8
3Q
FY1
8
4Q
FY1
8
1Q
FY1
9
2Q
FY1
9
3Q
FY1
9
4Q
FY1
9
1Q
FY2
0
2Q
FY2
0
3Q
FY2
0
4Q
FY2
0
1Q
FY2
1
2Q
FY2
1
CASA Ratio %
21
.6
23
.6
24
.9
24
.5
23
.8
25
.7
26
.4
27
.6
27
.5
30
.0
30
.6
31
.8
30
.4
34
.8
36
.0
36
.0
21
.0
31
.4
1.2
1.3
1.3
1.3
1.2
1.3
1.3
1.3
1.3
1.4
1.4
1.4
1.3
1.4
1.4
1.4
1.1
1Q
FY1
7
2Q
FY1
7
3Q
FY1
7
4Q
FY1
7
1Q
FY1
8
2Q
FY1
8
3Q
FY1
8
4Q
FY1
8
1Q
FY1
9
2Q
FY1
9
3Q
FY1
9
4Q
FY1
9
1Q
FY2
0
2Q
FY2
0
3Q
FY2
0
4Q
FY2
0
1Q
FY2
1
2Q
FY2
1
Fee Inc. (INR b) % to Avg. Assets
39 39 41 45 42 44 45 46 47 51 53 58 59 62 66 67 67 74
-5.2
-11
.7
-11
.4 7
.8
5.8
13
11
1
13
16
18
26
25
21
23
16
14
20
1Q
FY1
7
2Q
FY1
7
3Q
FY1
7
4Q
FY1
7
1Q
FY1
8
2Q
FY1
8
3Q
FY1
8
4Q
FY1
8
1Q
FY1
9
2Q
FY1
9
3Q
FY1
9
4Q
FY1
9
1Q
FY2
0
2Q
FY2
0
3Q
FY2
0
4Q
FY2
0
1Q
FY2
1
2Q
FY2
1
Core Op. Profit (INR b) YoY Gr (%)
4,4
94
4,5
43
4,5
75
4,6
42
4,6
41
4,8
28
5,0
54
5,1
24
5,1
63
5,4
45
5,6
43
5,8
66
5,9
24
6,1
34
6,3
57
6,4
53
6,3
12
6,5
26
12
11
5 7
3
6
10
10
11
13
12
14
15
13
13
10
7
6
1Q
FY1
7
2Q
FY1
7
3Q
FY1
7
4Q
FY1
7
1Q
FY1
8
2Q
FY1
8
3Q
FY1
8
4Q
FY1
8
1Q
FY1
9
2Q
FY1
9
3Q
FY1
9
4Q
FY1
9
1Q
FY2
0
2Q
FY2
0
3Q
FY2
0
4Q
FY2
0
1Q
FY2
1
2Q
FY2
1
Loans (INR b) YoY Gr. (%)
21 20 18 16 15 15 14 13 12 13 12 11 10 10 9 8 8 7
4 4 4 5 5 5 5 6 6 7 7 7 8 9 9 9 9 9
43 44 45 47 48 48 49 51 51 51 52 53 53 54 53 54 55 57
4 4 5 5 5 4 5 5 5 3 3 3 3 3 3 4 3 4 28 28 28 27 27 27 27 26 25 27 26 26 26 25 25 25 25 24
1Q
FY1
7
2Q
FY1
7
3Q
FY1
7
4Q
FY1
7
1Q
FY1
8
2Q
FY1
8
3Q
FY1
8
4Q
FY1
8
1Q
FY1
9
2Q
FY1
9
3Q
FY1
9
4Q
FY1
9
1Q
FY2
0
2Q
FY2
0
3Q
FY2
0
4Q
FY2
0
1Q
FY2
1
2Q
FY2
1
Intl Unsec Ret. Sec Retail SME Corp / others
ICICI Bank
5 December 2020 8
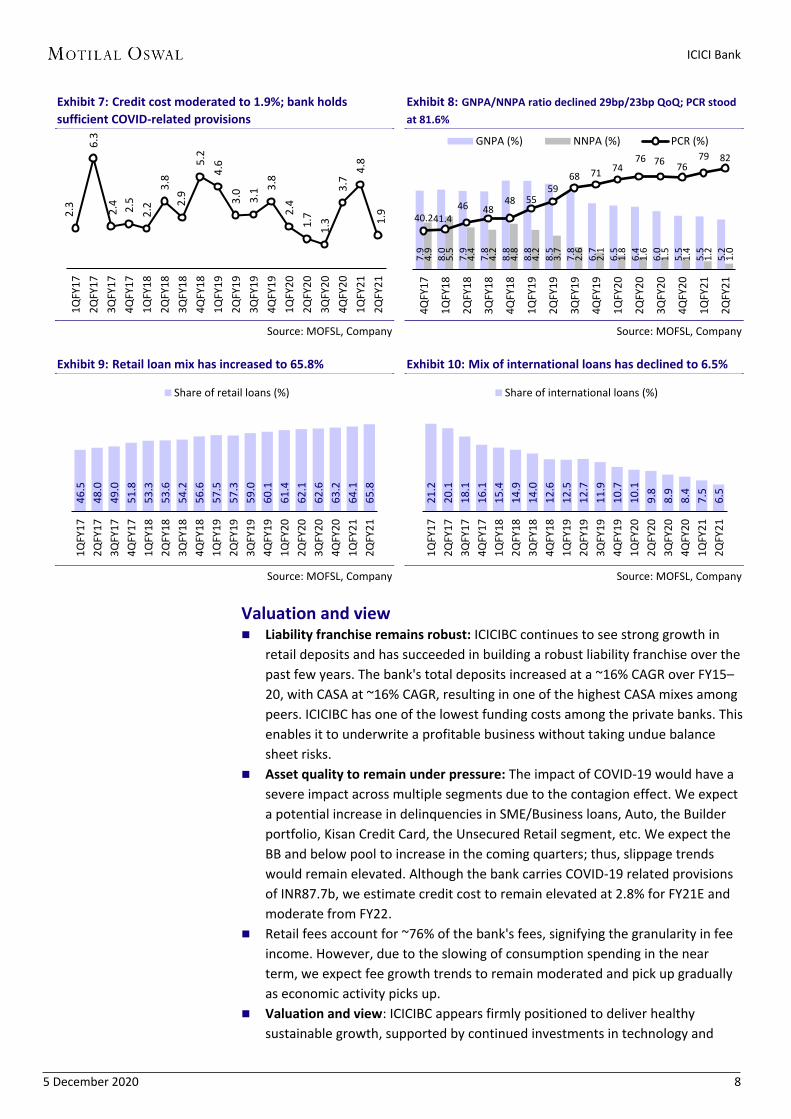
Exhibit 7: Credit cost moderated to 1.9%; bank holds
sufficient COVID-related provisions
Source: MOFSL, Company
Exhibit 8: GNPA/NNPA ratio declined 29bp/23bp QoQ; PCR stood
at 81.6%
Source: MOFSL, Company
Exhibit 9: Retail loan mix has increased to 65.8%
Source: MOFSL, Company
Exhibit 10: Mix of international loans has declined to 6.5%
Source: MOFSL, Company
Valuation and view Liability franchise remains robust: ICICIBC continues to see strong growth in
retail deposits and has succeeded in building a robust liability franchise over the
past few years. The bank's total deposits increased at a ~16% CAGR over FY15–
20, with CASA at ~16% CAGR, resulting in one of the highest CASA mixes among
peers. ICICIBC has one of the lowest funding costs among the private banks. This
enables it to underwrite a profitable business without taking undue balance
sheet risks.
Asset quality to remain under pressure: The impact of COVID-19 would have a
severe impact across multiple segments due to the contagion effect. We expect
a potential increase in delinquencies in SME/Business loans, Auto, the Builder
portfolio, Kisan Credit Card, the Unsecured Retail segment, etc. We expect the
BB and below pool to increase in the coming quarters; thus, slippage trends
would remain elevated. Although the bank carries COVID-19 related provisions
of INR87.7b, we estimate credit cost to remain elevated at 2.8% for FY21E and
moderate from FY22.
Retail fees account for ~76% of the bank's fees, signifying the granularity in fee
income. However, due to the slowing of consumption spending in the near
term, we expect fee growth trends to remain moderated and pick up gradually
as economic activity picks up.
Valuation and view: ICICIBC appears firmly positioned to deliver healthy
sustainable growth, supported by continued investments in technology and
2.3
6.3
2.4
2.5
2.2
3.8
2.9
5.2
4.6
3.0
3.1
3.8
2.4
1.7
1.3
3.7
4.8
1.9
1Q
FY1
7
2Q
FY1
7
3Q
FY1
7
4Q
FY1
7
1Q
FY1
8
2Q
FY1
8
3Q
FY1
8
4Q
FY1
8
1Q
FY1
9
2Q
FY1
9
3Q
FY1
9
4Q
FY1
9
1Q
FY2
0
2Q
FY2
0
3Q
FY2
0
4Q
FY2
0
1Q
FY2
1
2Q
FY2
1
7.9
8.0
7.9
7.8
8.8
8.8
8.5
7.8
6.7
6.5
6.4
6.0
5.5
5.5
5.2
4.9
5.5
4.4
4.2
4.8
4.2
3.7
2.6
2.1
1.8
1.6
1.5
1.4
1.2
1.0
40.2 41.4 46 48
48 55 59
68 71 74 76 76
76 79 82
4Q
FY1
7
1Q
FY1
8
2Q
FY1
8
3Q
FY1
8
4Q
FY1
8
1Q
FY1
9
2Q
FY1
9
3Q
FY1
9
4Q
FY1
9
1Q
FY2
0
2Q
FY2
0
3Q
FY2
0
4Q
FY2
0
1Q
FY2
1
2Q
FY2
1
GNPA (%) NNPA (%) PCR (%)
46
.5
48
.0
49
.0
51
.8
53
.3
53
.6
54
.2
56
.6
57
.5
57
.3
59
.0
60
.1
61
.4
62
.1
62
.6
63
.2
64
.1
65
.8
1Q
FY1
7
2Q
FY1
7
3Q
FY1
7
4Q
FY1
7
1Q
FY1
8
2Q
FY1
8
3Q
FY1
8
4Q
FY1
8
1Q
FY1
9
2Q
FY1
9
3Q
FY1
9
4Q
FY1
9
1Q
FY2
0
2Q
FY2
0
3Q
FY2
0
4Q
FY2
0
1Q
FY2
1
2Q
FY2
1
Share of retail loans (%)
21
.2
20
.1
18
.1
16
.1
15
.4
14
.9
14
.0
12
.6
12
.5
12
.7
11
.9
10
.7
10
.1
9.8
8.9
8.4
7.5
6.5
1Q
FY1
7
2Q
FY1
7
3Q
FY1
7
4Q
FY1
7
1Q
FY1
8
2Q
FY1
8
3Q
FY1
8
4Q
FY1
8
1Q
FY1
9
2Q
FY1
9
3Q
FY1
9
4Q
FY1
9
1Q
FY2
0
2Q
FY2
0
3Q
FY2
0
4Q
FY2
0
1Q
FY2
1
2Q
FY2
1
Share of international loans (%)
ICICI Bank
5 December 2020 9
continuous expansion in digital offerings. ICICIBC is seeing strong demand
recovery in consumption loans, with disbursements in secured loans having
surpassed pre-COVID levels. Also, Business Banking and Rural Banking would
prove strong growth engines for the bank. The bank expects the corporate
restructuring book to be ~1% of loans and has guided for the normalization of
credit cost in FY22. ICICIBC carries an additional provision buffer of 1.3% of loans
and has one of the highest provision coverages in the Banking sector. ICICIBC
remains one of our top ideas in the BFSI space; we expect RoA/RoE of
1.7%/15.2% for FY23E. Maintain Buy, with revised SOTP-based Target Price of
INR630 (2.2x Sep’22e ABV for the bank).
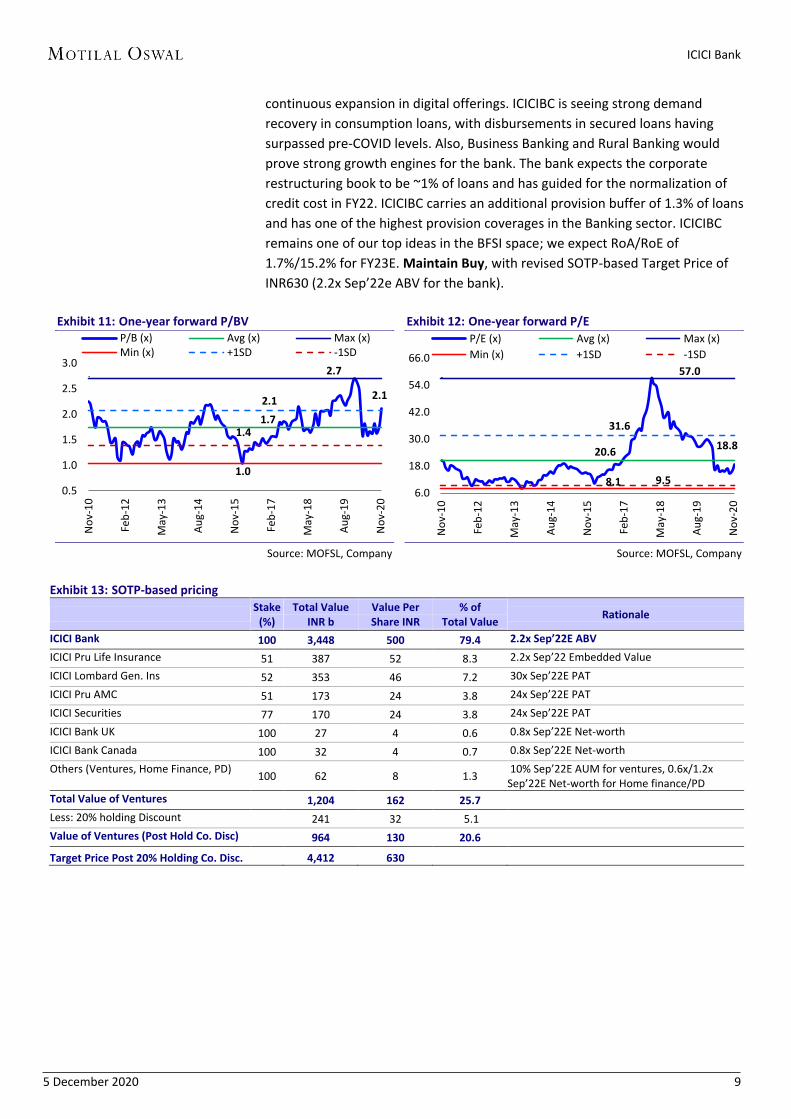
Exhibit 11: One-year forward P/BV
Source: MOFSL, Company
Exhibit 12: One-year forward P/E
Source: MOFSL, Company
Exhibit 13: SOTP-based pricing
Stake
(%) Total Value
INR b Value Per Share INR
% of Total Value
Rationale
ICICI Bank 100 3,448 500 79.4 2.2x Sep’22E ABV
ICICI Pru Life Insurance 51 387 52 8.3 2.2x Sep’22 Embedded Value
ICICI Lombard Gen. Ins 52 353 46 7.2 30x Sep’22E PAT
ICICI Pru AMC 51 173 24 3.8 24x Sep’22E PAT
ICICI Securities 77 170 24 3.8 24x Sep’22E PAT
ICICI Bank UK 100 27 4 0.6 0.8x Sep’22E Net-worth
ICICI Bank Canada 100 32 4 0.7 0.8x Sep’22E Net-worth
Others (Ventures, Home Finance, PD) 100 62 8 1.3
10% Sep’22E AUM for ventures, 0.6x/1.2x Sep’22E Net-worth for Home finance/PD
Total Value of Ventures
1,204 162 25.7
Less: 20% holding Discount
241 32 5.1
Value of Ventures (Post Hold Co. Disc)
964 130 20.6
Target Price Post 20% Holding Co. Disc. 4,412 630
2.1
1.7
2.7
1.0
2.1
1.4
0.5
1.0
1.5
2.0
2.5
3.0
No
v-1
0
Feb
-12
May
-13
Au
g-1
4
No
v-1
5
Feb
-17
May
-18
Au
g-1
9
No
v-2
0
P/B (x) Avg (x) Max (x)Min (x) +1SD -1SD
18.8 20.6
57.0
8.1
31.6
9.5 6.0
18.0
30.0
42.0
54.0
66.0
No
v-1
0
Feb
-12
May
-13
Au
g-1
4
No
v-1
5
Feb
-17
May
-18
Au
g-1
9
No
v-2
0
P/E (x) Avg (x) Max (x)
Min (x) +1SD -1SD
ICICI Bank
5 December 2020 10
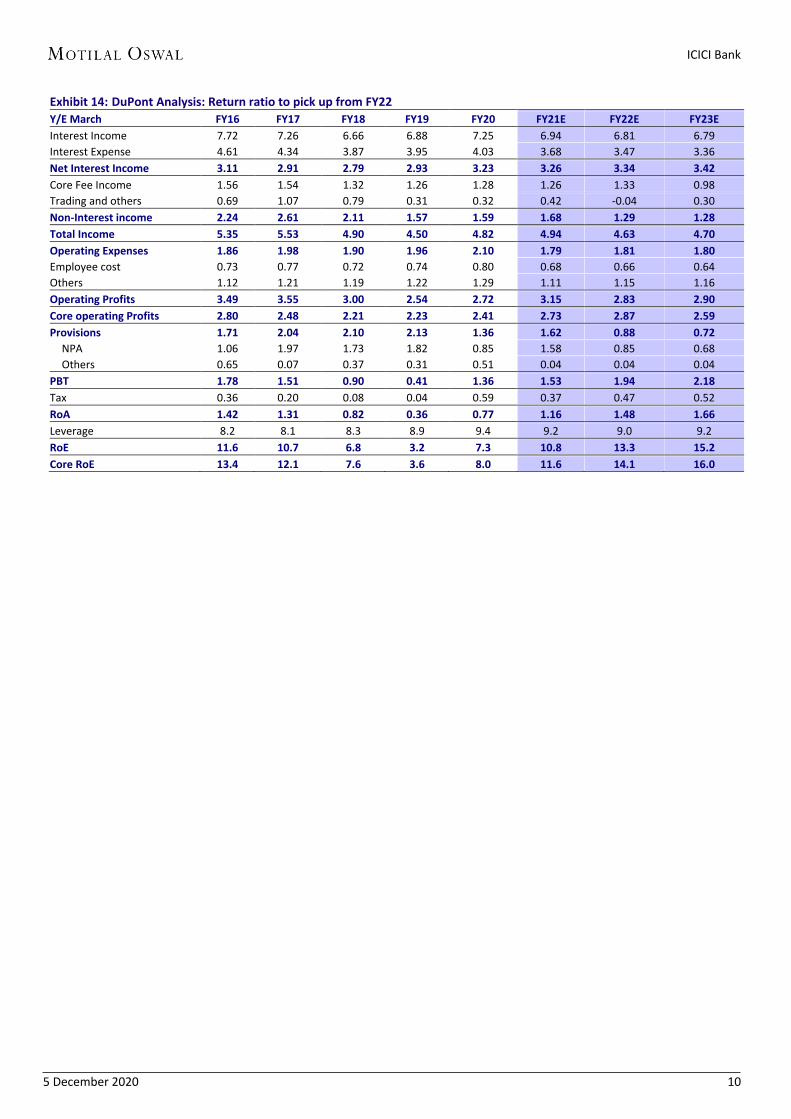
Exhibit 14: DuPont Analysis: Return ratio to pick up from FY22
Y/E March FY16 FY17 FY18 FY19 FY20 FY21E FY22E FY23E
Interest Income 7.72 7.26 6.66 6.88 7.25 6.94 6.81 6.79
Interest Expense 4.61 4.34 3.87 3.95 4.03 3.68 3.47 3.36
Net Interest Income 3.11 2.91 2.79 2.93 3.23 3.26 3.34 3.42
Core Fee Income 1.56 1.54 1.32 1.26 1.28 1.26 1.33 0.98
Trading and others 0.69 1.07 0.79 0.31 0.32 0.42 -0.04 0.30
Non-Interest income 2.24 2.61 2.11 1.57 1.59 1.68 1.29 1.28
Total Income 5.35 5.53 4.90 4.50 4.82 4.94 4.63 4.70
Operating Expenses 1.86 1.98 1.90 1.96 2.10 1.79 1.81 1.80
Employee cost 0.73 0.77 0.72 0.74 0.80 0.68 0.66 0.64
Others 1.12 1.21 1.19 1.22 1.29 1.11 1.15 1.16
Operating Profits 3.49 3.55 3.00 2.54 2.72 3.15 2.83 2.90
Core operating Profits 2.80 2.48 2.21 2.23 2.41 2.73 2.87 2.59
Provisions 1.71 2.04 2.10 2.13 1.36 1.62 0.88 0.72
NPA 1.06 1.97 1.73 1.82 0.85 1.58 0.85 0.68
Others 0.65 0.07 0.37 0.31 0.51 0.04 0.04 0.04
PBT 1.78 1.51 0.90 0.41 1.36 1.53 1.94 2.18
Tax 0.36 0.20 0.08 0.04 0.59 0.37 0.47 0.52
RoA 1.42 1.31 0.82 0.36 0.77 1.16 1.48 1.66
Leverage 8.2 8.1 8.3 8.9 9.4 9.2 9.0 9.2
RoE 11.6 10.7 6.8 3.2 7.3 10.8 13.3 15.2
Core RoE 13.4 12.1 7.6 3.6 8.0 11.6 14.1 16.0
ICICI Bank
5 December 2020 11
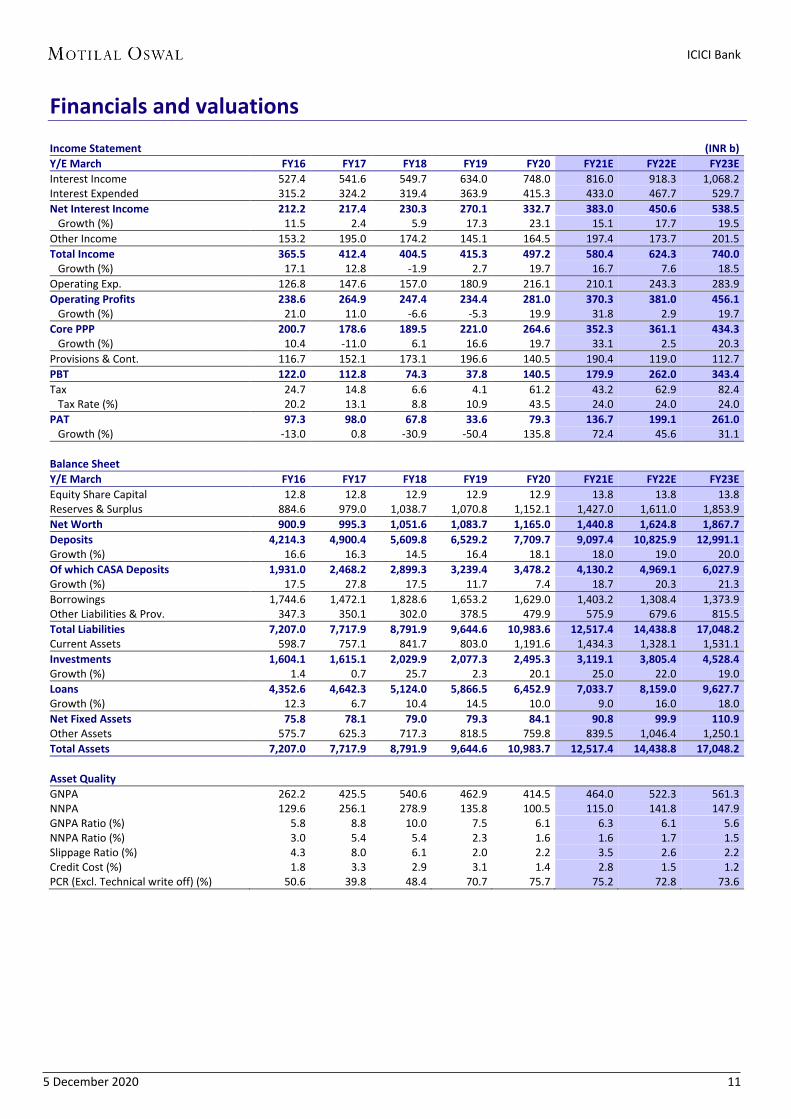
Financials and valuations
Income Statement (INR b)
Y/E March FY16 FY17 FY18 FY19 FY20 FY21E FY22E FY23E
Interest Income 527.4 541.6 549.7 634.0 748.0 816.0 918.3 1,068.2 Interest Expended 315.2 324.2 319.4 363.9 415.3 433.0 467.7 529.7
Net Interest Income 212.2 217.4 230.3 270.1 332.7 383.0 450.6 538.5 Growth (%) 11.5 2.4 5.9 17.3 23.1 15.1 17.7 19.5
Other Income 153.2 195.0 174.2 145.1 164.5 197.4 173.7 201.5
Total Income 365.5 412.4 404.5 415.3 497.2 580.4 624.3 740.0 Growth (%) 17.1 12.8 -1.9 2.7 19.7 16.7 7.6 18.5
Operating Exp. 126.8 147.6 157.0 180.9 216.1 210.1 243.3 283.9
Operating Profits 238.6 264.9 247.4 234.4 281.0 370.3 381.0 456.1 Growth (%) 21.0 11.0 -6.6 -5.3 19.9 31.8 2.9 19.7
Core PPP 200.7 178.6 189.5 221.0 264.6 352.3 361.1 434.3 Growth (%) 10.4 -11.0 6.1 16.6 19.7 33.1 2.5 20.3
Provisions & Cont. 116.7 152.1 173.1 196.6 140.5 190.4 119.0 112.7
PBT 122.0 112.8 74.3 37.8 140.5 179.9 262.0 343.4
Tax 24.7 14.8 6.6 4.1 61.2 43.2 62.9 82.4 Tax Rate (%) 20.2 13.1 8.8 10.9 43.5 24.0 24.0 24.0
PAT 97.3 98.0 67.8 33.6 79.3 136.7 199.1 261.0 Growth (%) -13.0 0.8 -30.9 -50.4 135.8 72.4 45.6 31.1
Balance Sheet
Y/E March FY16 FY17 FY18 FY19 FY20 FY21E FY22E FY23E
Equity Share Capital 12.8 12.8 12.9 12.9 12.9 13.8 13.8 13.8 Reserves & Surplus 884.6 979.0 1,038.7 1,070.8 1,152.1 1,427.0 1,611.0 1,853.9
Net Worth 900.9 995.3 1,051.6 1,083.7 1,165.0 1,440.8 1,624.8 1,867.7
Deposits 4,214.3 4,900.4 5,609.8 6,529.2 7,709.7 9,097.4 10,825.9 12,991.1 Growth (%) 16.6 16.3 14.5 16.4 18.1 18.0 19.0 20.0
Of which CASA Deposits 1,931.0 2,468.2 2,899.3 3,239.4 3,478.2 4,130.2 4,969.1 6,027.9 Growth (%) 17.5 27.8 17.5 11.7 7.4 18.7 20.3 21.3
Borrowings 1,744.6 1,472.1 1,828.6 1,653.2 1,629.0 1,403.2 1,308.4 1,373.9 Other Liabilities & Prov. 347.3 350.1 302.0 378.5 479.9 575.9 679.6 815.5
Total Liabilities 7,207.0 7,717.9 8,791.9 9,644.6 10,983.6 12,517.4 14,438.8 17,048.2 Current Assets 598.7 757.1 841.7 803.0 1,191.6 1,434.3 1,328.1 1,531.1
Investments 1,604.1 1,615.1 2,029.9 2,077.3 2,495.3 3,119.1 3,805.4 4,528.4 Growth (%) 1.4 0.7 25.7 2.3 20.1 25.0 22.0 19.0
Loans 4,352.6 4,642.3 5,124.0 5,866.5 6,452.9 7,033.7 8,159.0 9,627.7 Growth (%) 12.3 6.7 10.4 14.5 10.0 9.0 16.0 18.0
Net Fixed Assets 75.8 78.1 79.0 79.3 84.1 90.8 99.9 110.9 Other Assets 575.7 625.3 717.3 818.5 759.8 839.5 1,046.4 1,250.1
Total Assets 7,207.0 7,717.9 8,791.9 9,644.6 10,983.7 12,517.4 14,438.8 17,048.2
Asset Quality
GNPA 262.2 425.5 540.6 462.9 414.5 464.0 522.3 561.3 NNPA 129.6 256.1 278.9 135.8 100.5 115.0 141.8 147.9 GNPA Ratio (%) 5.8 8.8 10.0 7.5 6.1 6.3 6.1 5.6 NNPA Ratio (%) 3.0 5.4 5.4 2.3 1.6 1.6 1.7 1.5 Slippage Ratio (%) 4.3 8.0 6.1 2.0 2.2 3.5 2.6 2.2 Credit Cost (%) 1.8 3.3 2.9 3.1 1.4 2.8 1.5 1.2 PCR (Excl. Technical write off) (%) 50.6 39.8 48.4 70.7 75.7 75.2 72.8 73.6
ICICI Bank
5 December 2020 12
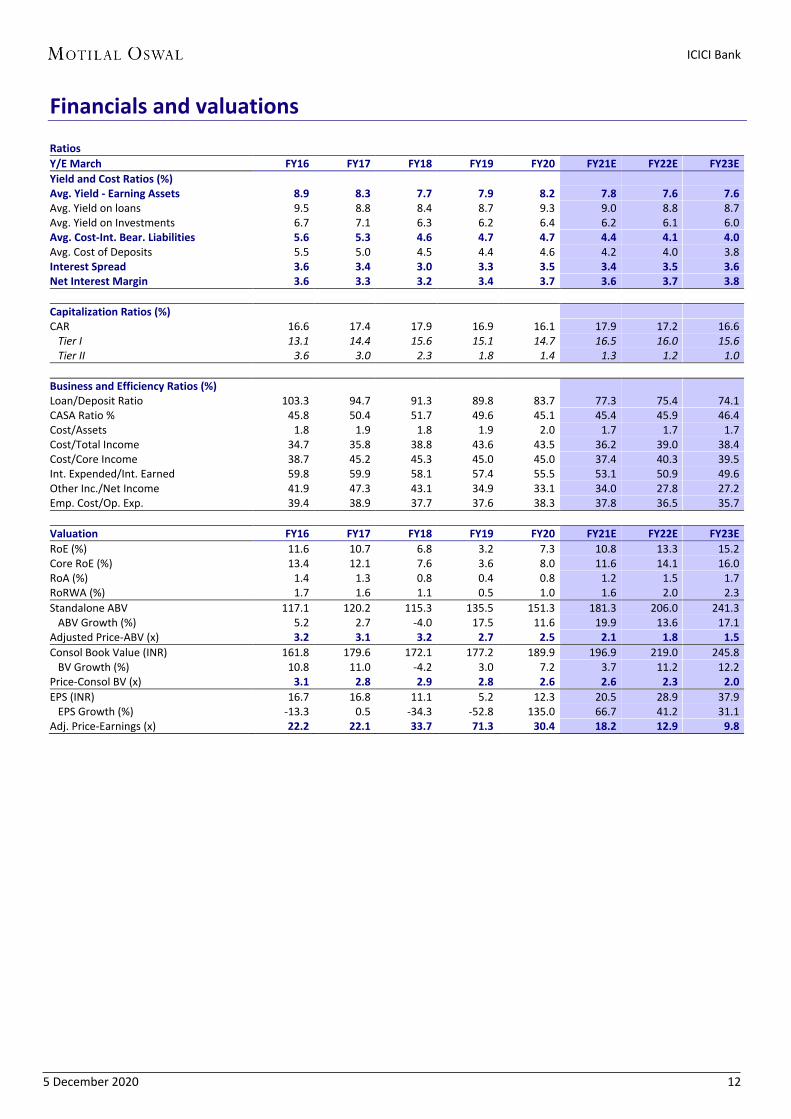
Financials and valuations
Ratios
Y/E March FY16 FY17 FY18 FY19 FY20 FY21E FY22E FY23E
Yield and Cost Ratios (%) Avg. Yield - Earning Assets 8.9 8.3 7.7 7.9 8.2 7.8 7.6 7.6 Avg. Yield on loans 9.5 8.8 8.4 8.7 9.3 9.0 8.8 8.7 Avg. Yield on Investments 6.7 7.1 6.3 6.2 6.4 6.2 6.1 6.0 Avg. Cost-Int. Bear. Liabilities 5.6 5.3 4.6 4.7 4.7 4.4 4.1 4.0 Avg. Cost of Deposits 5.5 5.0 4.5 4.4 4.6 4.2 4.0 3.8 Interest Spread 3.6 3.4 3.0 3.3 3.5 3.4 3.5 3.6 Net Interest Margin 3.6 3.3 3.2 3.4 3.7 3.6 3.7 3.8
Capitalization Ratios (%) CAR 16.6 17.4 17.9 16.9 16.1 17.9 17.2 16.6 Tier I 13.1 14.4 15.6 15.1 14.7 16.5 16.0 15.6 Tier II 3.6 3.0 2.3 1.8 1.4 1.3 1.2 1.0
Business and Efficiency Ratios (%) Loan/Deposit Ratio 103.3 94.7 91.3 89.8 83.7 77.3 75.4 74.1 CASA Ratio % 45.8 50.4 51.7 49.6 45.1 45.4 45.9 46.4 Cost/Assets 1.8 1.9 1.8 1.9 2.0 1.7 1.7 1.7 Cost/Total Income 34.7 35.8 38.8 43.6 43.5 36.2 39.0 38.4 Cost/Core Income 38.7 45.2 45.3 45.0 45.0 37.4 40.3 39.5 Int. Expended/Int. Earned 59.8 59.9 58.1 57.4 55.5 53.1 50.9 49.6 Other Inc./Net Income 41.9 47.3 43.1 34.9 33.1 34.0 27.8 27.2 Emp. Cost/Op. Exp. 39.4 38.9 37.7 37.6 38.3 37.8 36.5 35.7
Valuation FY16 FY17 FY18 FY19 FY20 FY21E FY22E FY23E
RoE (%) 11.6 10.7 6.8 3.2 7.3 10.8 13.3 15.2 Core RoE (%) 13.4 12.1 7.6 3.6 8.0 11.6 14.1 16.0 RoA (%) 1.4 1.3 0.8 0.4 0.8 1.2 1.5 1.7 RoRWA (%) 1.7 1.6 1.1 0.5 1.0 1.6 2.0 2.3
Standalone ABV 117.1 120.2 115.3 135.5 151.3 181.3 206.0 241.3 ABV Growth (%) 5.2 2.7 -4.0 17.5 11.6 19.9 13.6 17.1 Adjusted Price-ABV (x) 3.2 3.1 3.2 2.7 2.5 2.1 1.8 1.5
Consol Book Value (INR) 161.8 179.6 172.1 177.2 189.9 196.9 219.0 245.8 BV Growth (%) 10.8 11.0 -4.2 3.0 7.2 3.7 11.2 12.2 Price-Consol BV (x) 3.1 2.8 2.9 2.8 2.6 2.6 2.3 2.0
EPS (INR) 16.7 16.8 11.1 5.2 12.3 20.5 28.9 37.9 EPS Growth (%) -13.3 0.5 -34.3 -52.8 135.0 66.7 41.2 31.1 Adj. Price-Earnings (x) 22.2 22.1 33.7 71.3 30.4 18.2 12.9 9.8

ICICI Bank
5 December 2020 13
N O T E S
ICICI Bank
5 December 2020 14
Explanation of Investment Rating
Investment Rating Expected return (over 12-month)
BUY >=15%
SELL < - 10%
NEUTRAL > - 10 % to 15%
UNDER REVIEW Rating may undergo a change
NOT RATED We have forward looking estimates for the stock but we refrain from assigning recommendation
*In case the recommendation given by the Research Analyst is inconsistent with the investment rating legend for a continuous period of 30 days,the Research Analyst shall within following 30 days take appropriate measures to make the recommendation consistent with the investment rating legend.
Disclosures: The following Disclosures are being made in compliance with the SEBI Research Analyst Regulations 2014 (herein after referred to as the Regulations).
Motilal Oswal Financial Services Ltd. (MOFSL) is a SEBI Registered Research Analyst having registration no. INH000000412. MOFSL, the Research Entity (RE) as defined in the Regulations, is engaged in the business of providing Stock broking services, Investment Advisory Services, Depository participant services & distribution of various financial products. MOFSL is a subsidiary company of Passionate Investment Management Pvt. Ltd.. (PIMPL). MOFSL is a listed public company, the details in respect of which are available on www.motilaloswal.com. MOFSL (erstwhile Motilal Oswal Securities Limited - MOSL) is registered with the Securities & Exchange Board of India (SEBI) and is a registered Trading Member with National Stock Exchange of India Ltd. (NSE) and Bombay Stock Exchange Limited (BSE), Multi Commodity Exchange of India Limited (MCX) and National Commodity & Derivatives Exchange Limited (NCDEX) for its stock broking activities & is Depository participant with Central Depository Services Limited (CDSL) National Securities Depository Limited (NSDL),NERL, COMRIS and CCRL and is member of Association of Mutual Funds of India (AMFI) for distribution of financial products and Insurance Regulatory & Development Authority of India (IRDA) as Corporate Agent for insurance products. Details of associate entities of Motilal Oswal Financial Services Limited are available on the website at http://onlinereports.motilaloswal.com/Dormant/documents/Associate%20Details.pdf
Details of pending Enquiry Proceedings of Motilal Oswal Financial Services Limited are available on the website at https://galaxy.motilaloswal.com/ResearchAnalyst/PublishViewLitigation.aspx
MOFSL, it’s associates, Research Analyst or their relative may have any financial interest in the subject company. MOFSL and/or its associates and/or Research Analyst may have actual/beneficial ownership of 1% or more securities in the past 12 months. MOFSL and its associate company(ies), their directors and Research Analyst and their relatives may; (a) from time to time, have a long or short position in, act as principal in, and buy or sell the securities or derivatives thereof of companies mentioned herein. (b) be engaged in any other transaction involving such securities and earn brokerage or other compensation or act as a market maker in the financial instruments of the company(ies) discussed herein or act as an advisor or lender/borrower to such company(ies) or may have any other potential conflict of interests with respect to any recommendation and other related information and opinions.; however the same shall have no bearing whatsoever on the specific recommendations made by the analyst(s), as the recommendations made by the analyst(s) are completely independent of the views of the associates of MOFSL even though there might exist an inherent conflict of interest in some of the stocks mentioned in the research report. Research Analyst may have served as director/officer, etc. in the subject company in the past 12 months. MOFSL and/or its associates may have received any compensation from the subject company in the past 12 months.
In the past 12 months, MOFSL or any of its associates may have: a) managed or co-managed public offering of securities from subject company of this research report, b) received compensation for investment banking or merchant banking or brokerage services from subject company of this research report, c) received compensation for products or services other than investment banking or merchant banking or brokerage services from the subject company of this research report. d) Subject Company may have been a client of MOFSL or its associates in the past 12 months.
MOFSL and it’s associates have not received any compensation or other benefits from the subject company or third party in connection with the research report. To enhance transparency, MOFSL has incorporated a Disclosure of Interest Statement in this document. This should, however, not be treated as endorsement of the views expressed in the report. MOFSL and / or its affiliates do and seek to do business including investment banking with companies covered in its research reports. As a result, the recipients of this report should be aware that MOFSL may have a potential conflict of interest that may affect the objectivity of this report. Compensation of Research Analysts is not based on any specific merchant banking, investment banking or brokerage service transactions. Above disclosures include beneficial holdings lying in demat account of MOFSL which are opened for proprietary investments only. While calculating beneficial holdings, It does not consider demat accounts which are opened in name of MOFSL for other purposes (i.e holding client securities, collaterals, error trades etc.). MOFSL also earns DP income from clients which are not considered in above disclosures.
Terms & Conditions: This report has been prepared by MOFSL and is meant for sole use by the recipient and not for circulation. The report and information contained herein is strictly confidential and may not be altered in any way, transmitted to, copied or distributed, in part or in whole, to any other person or to the media or reproduced in any form, without prior written consent of MOFSL. The report is based on the facts, figures and information that are considered true, correct, reliable and accurate. The intent of this report is not recommendatory in nature. The information is obtained from publicly available media or other sources believed to be reliable. Such information has not been independently verified and no guaranty, representation of warranty, express or implied, is made as to its accuracy, completeness or correctness. All such information and opinions are subject to change without notice. The report is prepared solely for informational purpose and does not constitute an offer document or solicitation of offer to buy or sell or subscribe for securities or other financial instruments for the clients. Though disseminated to all the customers simultaneously, not all customers may receive this report at the same time. MOFSL will not treat recipients as customers by virtue of their receiving this report. Analyst Certification The views expressed in this research report accurately reflect the personal views of the analyst(s) about the subject securities or issues, and no part of the compensation of the research analyst(s) was, is, or will be directly or indirectly related to the specific recommendations and views expressed by research analyst(s) in this report.
Disclosure of Interest Statement ICICI Bank Analyst ownership of the stock No A graph of daily closing prices of securities is available at www.nseindia.com, www.bseindia.com. Research Analyst views on Subject Company may vary based on Fundamental research and Technical Research. Proprietary trading desk of MOFSL or its associates maintains arm’s length distance with Research Team as all the activities are segregated from MOFSL research activity and therefore it can have an independent view with regards to subject company for which Research Team have expressed their views.
Regional Disclosures (outside India) This report is not directed or intended for distribution to or use by any person or entity resident in a state, country or any jurisdiction, where such distribution, publication, availability or use would be contrary to law, regulation or which would subject MOFSL & its group companies to registration or licensing requirements within such jurisdictions.
For Hong Kong: This report is distributed in Hong Kong by Motilal Oswal capital Markets (Hong Kong) Private Limited, a licensed corporation (CE AYY-301) licensed and regulated by the Hong Kong Securities and Futures Commission (SFC) pursuant to the Securities and Futures Ordinance (Chapter 571 of the Laws of Hong Kong) “SFO”. As per SEBI (Research Analyst Regulations) 2014 Motilal Oswal Financial Services Limited(SEBI Reg No. INH000000412) has an agreement with Motilal Oswal capital Markets (Hong Kong) Private Limited for distribution of research report in Hong Kong. This report is intended for distribution only to “Professional Investors” as defined in Part I of Schedule 1 to SFO. Any investment or investment activity to which this document relates is only available to professional investor and will be engaged only with professional investors.” Nothing here is an offer or solicitation of these securities, products and services in any jurisdiction where their offer or sale is not qualified or exempt from registration. The Indian Analyst(s) who compile this report is/are not located in Hong Kong & are not conducting Research Analysis in Hong Kong.
For U.S: Motilal Oswal Financial Services Limited (MOFSL) is not a registered broker - dealer under the U.S. Securities Exchange Act of 1934, as amended (the"1934 act") and under applicable state laws in the United States. In addition MOFSL is not a registered investment adviser under the U.S. Investment Advisers Act of 1940, as amended (the "Advisers Act" and together with the 1934 Act, the "Acts), and under applicable state laws in the United States. Accordingly, in the absence of specific exemption under the Acts, any brokerage and investment services provided by MOFSL, including the products and services described herein are not available to or intended for U.S. persons. This report is intended for distribution only to "Major Institutional Investors" as defined by Rule 15a-6(b)(4) of the Exchange Act and interpretations thereof by SEC (henceforth referred to as "major institutional investors"). This document must not be acted on or relied on by persons who are not major institutional investors. Any investment or investment activity to which this document relates is only available to major institutional investors and will be engaged in only with major institutional investors. In reliance on the exemption from registration provided by Rule 15a-6 of the U.S. Securities Exchange Act of 1934, as amended (the "Exchange Act") and interpretations thereof by the U.S. Securities and Exchange Commission ("SEC") in order to conduct business with Institutional Investors based in the U.S., MOFSL has entered into a chaperoning agreement with a U.S. registered broker-dealer, Motilal Oswal Securities International Private Limited. ("MOSIPL"). Any business interaction pursuant to this report will have to be executed within the provisions of this chaperoning agreement.
The Research Analysts contributing to the report may not be registered /qualified as research analyst with FINRA. Such research analyst may not be associated persons of the U.S. registered broker-dealer, MOSIPL, and therefore, may not be subject to NASD rule 2711 and NYSE Rule 472 restrictions on communication with a subject company, public appearances and trading securities held by a research analyst account.
For Singapore In Singapore, this report is being distributed by Motilal Oswal Capital Markets Singapore Pte Ltd (“MOCMSPL”) (Co.Reg. NO. 201129401Z) which is a holder of a capital markets services license and an exempt financial adviser in Singapore, as per the approved agreement under Paragraph 9 of Third Schedule of Securities and Futures Act (CAP 289) and Paragraph 11 of First Schedule of Financial Advisors Act (CAP 110) provided to MOCMSPL by Monetary Authority of Singapore. Persons in Singapore should contact MOCMSPL in respect of any matter arising from, or in connection with this report/publication/communication. This report is distributed solely to persons who qualify as “Institutional Investors”, of which some of whom may consist of "accredited" institutional investors as defined in section 4A(1) of the Securities and Futures Act, Chapter 289 of Singapore (“the SFA”). Accordingly, if a Singapore person is not or ceases to be such an institutional investor, such Singapore Person must immediately discontinue any use of this Report and inform MOCMSPL.
Disclaimer: The report and information contained herein is strictly confidential and meant solely for the selected recipient and may not be altered in any way, transmitted to, copied or distributed, in part or in whole, to any other person or to the media or reproduced in any form, without prior written consent. This report and information herein is solely for informational purpose and may not be used or considered as an offer document or solicitation of offer to buy or sell or subscribe for securities or other financial instruments. Nothing in this report constitutes investment, legal, accounting and tax advice or a representation that any investment or strategy is suitable or appropriate to your specific circumstances. The securities discussed and opinions expressed in this report may not be suitable for all investors, who must make their own investment decisions, based on their own investment objectives, financial positions and needs of specific recipient. This may not be taken in substitution for the exercise of independent judgment by any recipient. Each recipient of this document should make such investigations as it deems necessary to arrive at an independent evaluation of an investment in the securities of companies referred to in this document (including the merits and risks involved), and should consult its own advisors to determine the merits and risks of such an investment. The investment discussed or views expressed may not be suitable for all investors. Certain transactions including those involving futures, options, another derivative products as well as non-investment grade securities - involve substantial risk and are not suitable for all investors. No representation or warranty, express or implied, is made as to the accuracy, completeness or fairness of the information and opinions contained in this document. The Disclosures of Interest Statement incorporated in this document is provided solely to enhance the transparency and should not be treated as endorsement of the views expressed in the report. This information is subject to change without any prior notice. The Company reserves the right to make modifications and alternations to this statement as may be required from time to time without any prior approval. MOFSL, its associates, their directors and the employees may from time to time, effect or have effected an own account transaction in, or deal as principal or agent in or for the securities mentioned in this document. They may perform or seek to perform investment banking or other services for, or solicit investment banking or other business from, any company referred to in this report. Each of these entities functions as a separate, distinct and independent of each other. The recipient should take this into account before interpreting the document. This report has been prepared on the basis of information that is already available in publicly accessible media or developed through analysis of MOFSL. The views expressed are those of the analyst, and the Company may or may not subscribe to all the views expressed therein. This document is being supplied to you solely for your information and may not be reproduced, redistributed or passed on, directly or indirectly, to any other person or published, copied, in whole or in part, for any purpose. This report is not directed or intended for distribution to, or use by, any person or entity who is a citizen or resident of or located in any locality, state, country or other jurisdiction, where such distribution, publication, availability or use would be contrary to law, regulation or which would subject MOFSL to any registration or licensing requirement within such jurisdiction. The securities described herein may or may not be eligible for sale in all jurisdictions or to certain category of investors. Persons in whose possession this document may come are required to inform themselves of and to observe such restriction. Neither the Firm, not its directors, employees, agents or representatives shall be liable for any damages whether direct or indirect, incidental, special or consequential including lost revenue or lost profits that may arise from or in connection with the use of the information. The person accessing this information specifically agrees to exempt MOFSL or any of its affiliates or employees from, any and all responsibility/liability arising from such misuse and agrees not to hold MOFSL or any of its affiliates or employees responsible for any such misuse and further agrees to hold MOFSL or any of its affiliates or employees free and harmless from all losses, costs, damages, expenses that may be suffered by the person accessing this information due to any errors and delays.
Registered Office Address: Motilal Oswal Tower, Rahimtullah Sayani Road, Opposite Parel ST Depot, Prabhadevi, Mumbai-400025; Tel No.: 022 71934200/ 022-71934263; Website www.motilaloswal.com. CIN No.: L67190MH2005PLC153397.Correspondence Office Address: Palm Spring Centre, 2nd Floor, Palm Court Complex, New Link Road, Malad(West), Mumbai- 400 064. Tel No: 022 7188 1000. Registration Nos.: Motilal Oswal Financial Services Limited (MOFSL)*: INZ000158836(BSE/NSE/MCX/NCDEX); CDSL and NSDL: IN-DP-16-2015; Research Analyst: INH000000412. AMFI: ARN - 146822; Investment Adviser: INA000007100; Insurance Corporate Agent: CA0579; PMS:INP000006712. Motilal Oswal Asset Management Company Ltd. (MOAMC): PMS (Registration No.: INP000000670); PMS and Mutual Funds are offered through MOAMC which is group company of MOFSL. Motilal Oswal Wealth Management Ltd. (MOWML): PMS (Registration No.: INP000004409) is offered through MOWML, which is a group company of MOFSL. Motilal Oswal Financial Services Limited is a distributor of Mutual Funds, PMS, Fixed Deposit, Bond, NCDs,Insurance Products and IPOs.Real Estate is offered through Motilal Oswal Real Estate Investment Advisors II Pvt. Ltd. which is a group company of MOFSL. Private Equity is offered through Motilal Oswal Private Equity Investment Advisors Pvt. Ltd which is a group company of MOFSL. Research & Advisory services is backed by proper research. Please read the Risk Disclosure Document prescribed by the Stock Exchanges carefully before investing. There is no assurance or guarantee of the returns. Investment in securities market is subject to market risk, read all the related documents carefully before investing. Details of Compliance Officer: Name: Neeraj Agarwal, Email ID: [email protected], Contact No.:022-71881085.
* MOSL has been amalgamated with Motilal Oswal Financial Services Limited (MOFSL) w.e.f August 21, 2018 pursuant to order dated July 30, 2018 issued by Hon'ble National Company Law Tribunal, Mumbai Bench.