Embed Size (px)
Citation preview
2016-17ANNUAL REPORTMAKING IN INDIA
Forward-looking statementIn this Annual Report, we have disclosed forward-looking information to enable investors to comprehend our prospects and take investment decisions. This report and other statements - written and oral – that we periodically make contain forward-looking statements that set out anticipated results based on the management’s plans and assumptions. We have tried wherever possible to identify such statements by using words such as ‘anticipate’, ‘estimate’, ‘expects’, ‘projects’, ‘intends’, ‘plans’, ‘believes’, and words of similar substance in connection with any discussion of future performance. We cannot guarantee that these forward-looking statements will be realised, although we believe we have been prudent in assumptions. The achievements of results are subject to risks, uncertainties, and even inaccurate assumptions. Should known or unknown risks or uncertainties materialise, or should underlying assumptions prove inaccurate, actual results could vary materially from those anticipated, estimated, or projected. Readers should keep this in mind. We undertake no obligation to publicly update any forward-looking statements, whether as a result of new information, future events or otherwise.
Statutory Reports
Board’s Report 22
Annexures to Board’s Report 31
Management Discussion and Analysis 41
Corporate Governance Report 78
Brief Profile of Directors 96
Business Responsibility Report 101
Financial Statements
Standalone Financials 111
Consolidated Financials 184
Form AOC-1 253
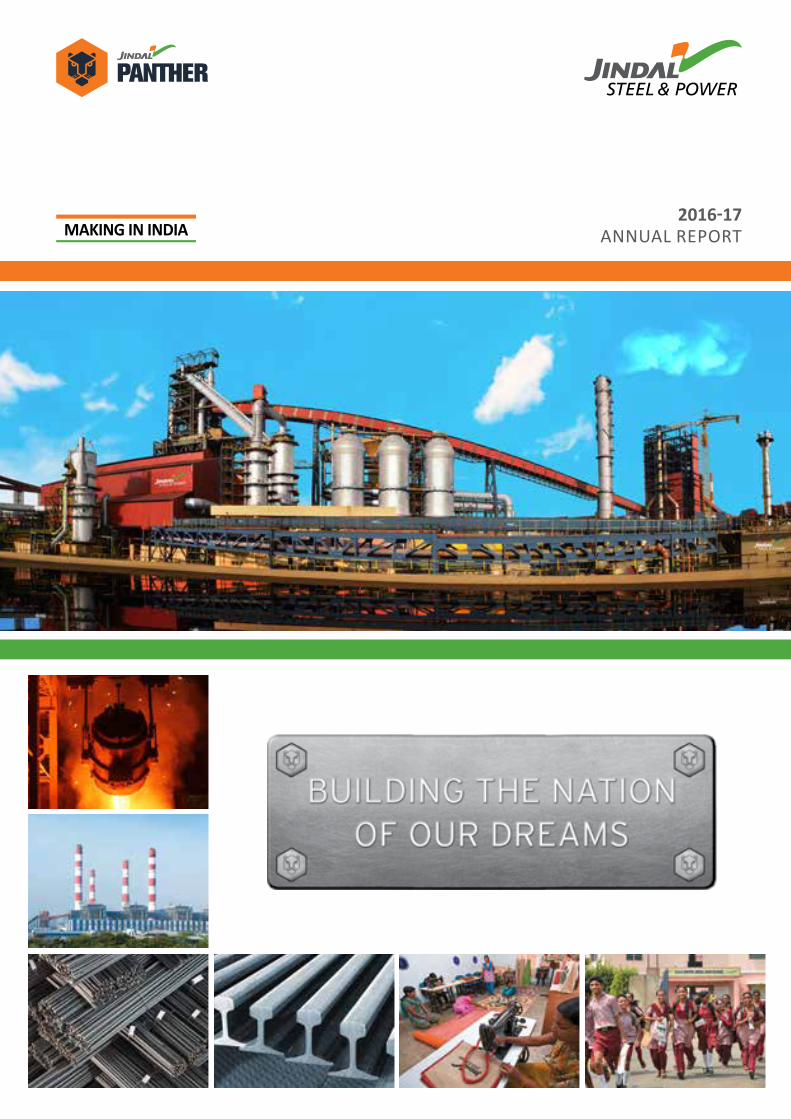
INSIDE THIS REPORT
USD 18 Bn
5,049 MW
USD 3.38 Bn
9 MTPA
8.1 MTPA
` 4,658 Cr.
JSPL is part of the illustrious USD 18 billion OP Jindal Group
Total installed power capacity
JSPL’s turnover as on 31st March, 2017
Pellet-making capacity
Installed steel-making capacity (India and the world)
Operational EBITDA (Consolidated) as on 31st March, 2017
JSPL AT A GLANCE
Corporate Overview
Founder Chairman 02
Chairperson Emeritus 03
Chairman’s Insight 04
Managing Director’s Message 06
Empowering India 08
Major Clients in FY 2016-17 10
JSPL’s Made in India Product Range 11
Business Divisions 12
Growing Sustainably with the Community
18
Board of Directors 19
Key Performance Indicators 20
At Jindal Steel and Power Limited (JSPL), we are partnering the creative and entrepreneurial energy sweeping across the nation, and this shared purpose and values keep us motivated and focused.
FY 2016-17 was a turning point for JSPL, which for the preceding two years has passed through a phase of unprecedented challenges and huge tribulations caused by external factors. We at JSPL have managed to endure all the pressure tests and have demonstrated our resilience to survive the toughest of adversities. In FY 16-17, we implemented multiple initiatives, as a part of our commitment to Making in India, which we believe is a radical step to bolster
India’s manufacturing expertise in line with global standards.
During the year, we not only enhanced our capacities, but also strengthened our operational efficiency, widened our offerings, fortified our raw material security and even ramped up steel volumes. In line with our commitment towards ‘Making in India’, we set a new industry benchmark by dedicating Odisha’s largest and most modern 6 MTPA Integrated Steel Plant at Angul.
Besides, we achieved the highest rail production and crossed the 2 lakh MT rail production in a single financial year for the
India continues to outshine major economies of the world in an uncertain global economic landscape. Over the years, the transformation of India has presented abundant opportunities to its billion-plus population for greater empowerment. The government continues to implement major policy initiatives to boost every sector of the economy.
From persistent focus on infrastructure creation to building manufacturing mettle to strengthening agricultural output to even elevating the services sector, the country is witnessing an upheaval of action on ground. On the other hand, the combination of innovation, technology and skilled entrepreneurship is shaping an exciting digital future for the nation.
first time. We became India’s largest pellet exporter with 3.4 times escalation in pellet sales. The year also saw JSPL’s financial turnaround with remarkable growth in revenue, operating profit and prudent utilisation of resources and assets.
We are meticulously strengthening the foundation of a great value-generating enterprise in our endeavour towards building the nation of our dreams.
Focused on Nation-BuildingJSPL is amongst India’s fastest growing and largest business conglomerates with significant presence in core infrastructure sectors including steel, power, mining and infrastructure. Our business operations span across the states of Chhattisgarh, Odisha and Jharkhand in India, where we operate some of India’s most advanced steel manufacturing and power generation capacities of global scale. Part of the USD 18 billion diversified O. P. Jindal Group, our global footprint spans across Asia, Africa and Australia.
We have created best-in-class capacities to produce up to 9.94 million tonne per annum (MTPA) iron through a judicious mix of Direct Reduced Iron (DRI), Blast Furnace and Hot Briquetted Iron (HBI) routes, catering to our 8.1 MTPA liquid steelmaking capacities across three locations. We have a sprawling installed finished steel capacity of 7.95 MTPA, including 3.8 MTPA Bar Mills, 2.2 MTPA Plate Mills, 0.75 MTPA Rail and Universal Beam Mill, 0.6 MTPA Medium & Light Structural Mill and a 0.6 MTPA Wire Rod Mill.
Led by Shri Naveen Jindal, we produce economical and efficient steel and power through backward and forward integration. From the widest flat products to a whole range of long products, our product portfolio caters to markets across the steel value chain.
We provide direct and indirect employment opportunities to over 50,000 people in India and anchor a socio-economic ecosystem of over 100,000 families.
` 21.58 Cr. ` 110.67 Bn
8.3 Mn
21
1 Lac+ families
Total CSR spending in 2016-17Market capitalisation (BSE) as on 31st March, 2017
Saplings planted till date
Countries export presence
Benefited by our business and community efforts directly and indirectly
2 | Jindal Steel & Power Limited Annual Report 2016-17
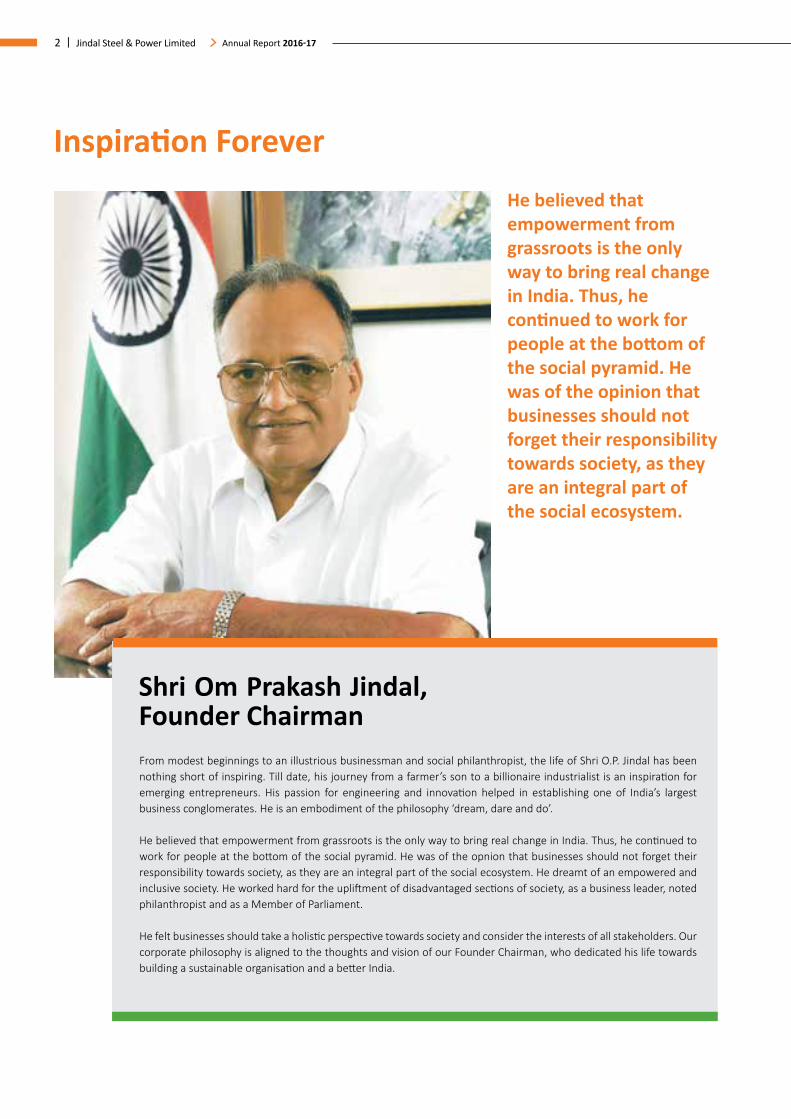
Inspiration ForeverHe believed that empowerment from grassroots is the only way to bring real change in India. Thus, he continued to work for people at the bottom of the social pyramid. He was of the opinion that businesses should not forget their responsibility towards society, as they are an integral part of the social ecosystem.
Shri Om Prakash Jindal, Founder Chairman From modest beginnings to an illustrious businessman and social philanthropist, the life of Shri O.P. Jindal has been nothing short of inspiring. Till date, his journey from a farmer’s son to a billionaire industrialist is an inspiration for emerging entrepreneurs. His passion for engineering and innovation helped in establishing one of India’s largest business conglomerates. He is an embodiment of the philosophy ‘dream, dare and do’.
He believed that empowerment from grassroots is the only way to bring real change in India. Thus, he continued to work for people at the bottom of the social pyramid. He was of the opnion that businesses should not forget their responsibility towards society, as they are an integral part of the social ecosystem. He dreamt of an empowered and inclusive society. He worked hard for the upliftment of disadvantaged sections of society, as a business leader, noted philanthropist and as a Member of Parliament.
He felt businesses should take a holistic perspective towards society and consider the interests of all stakeholders. Our corporate philosophy is aligned to the thoughts and vision of our Founder Chairman, who dedicated his life towards building a sustainable organisation and a better India.
| 3Corporate Overview
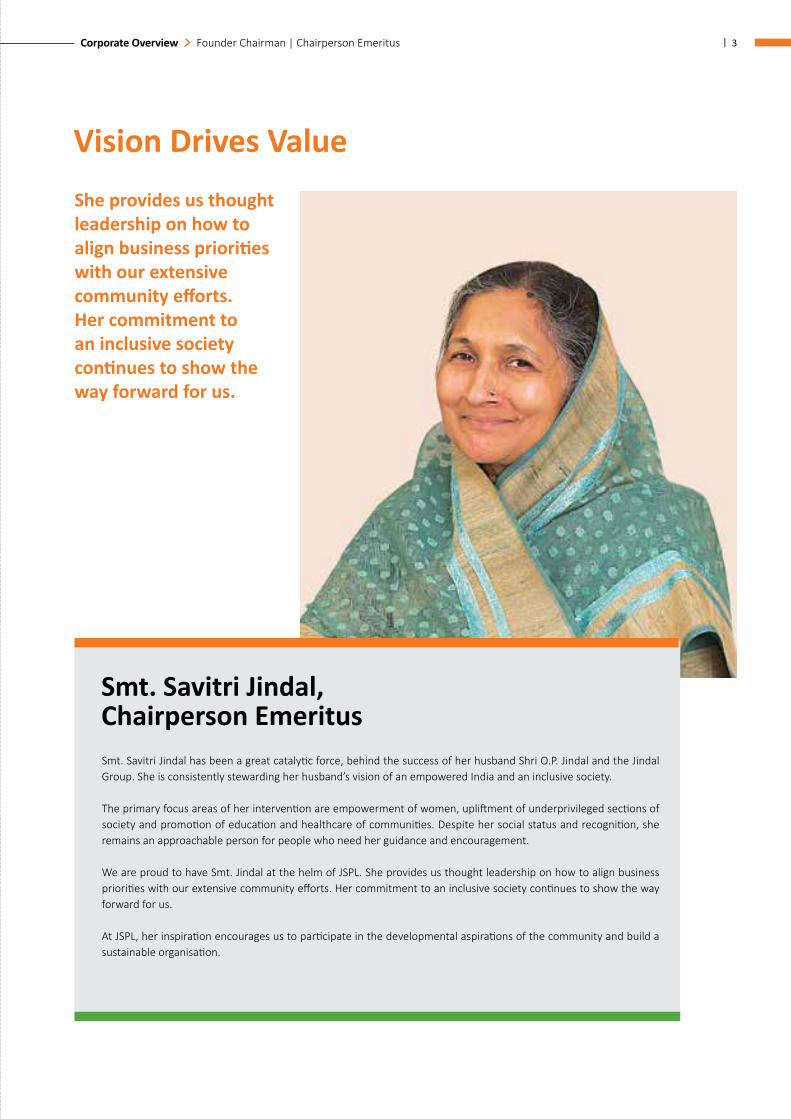
Vision Drives ValueShe provides us thought leadership on how to align business priorities with our extensive community efforts. Her commitment to an inclusive society continues to show the way forward for us.
Smt. Savitri Jindal, Chairperson EmeritusSmt. Savitri Jindal has been a great catalytic force, behind the success of her husband Shri O.P. Jindal and the Jindal Group. She is consistently stewarding her husband’s vision of an empowered India and an inclusive society.
The primary focus areas of her intervention are empowerment of women, upliftment of underprivileged sections of society and promotion of education and healthcare of communities. Despite her social status and recognition, she remains an approachable person for people who need her guidance and encouragement.
We are proud to have Smt. Jindal at the helm of JSPL. She provides us thought leadership on how to align business priorities with our extensive community efforts. Her commitment to an inclusive society continues to show the way forward for us.
At JSPL, her inspiration encourages us to participate in the developmental aspirations of the community and build a sustainable organisation.
Founder Chairman | Chairperson Emeritus
4 | Jindal Steel & Power Limited Annual Report 2016-17
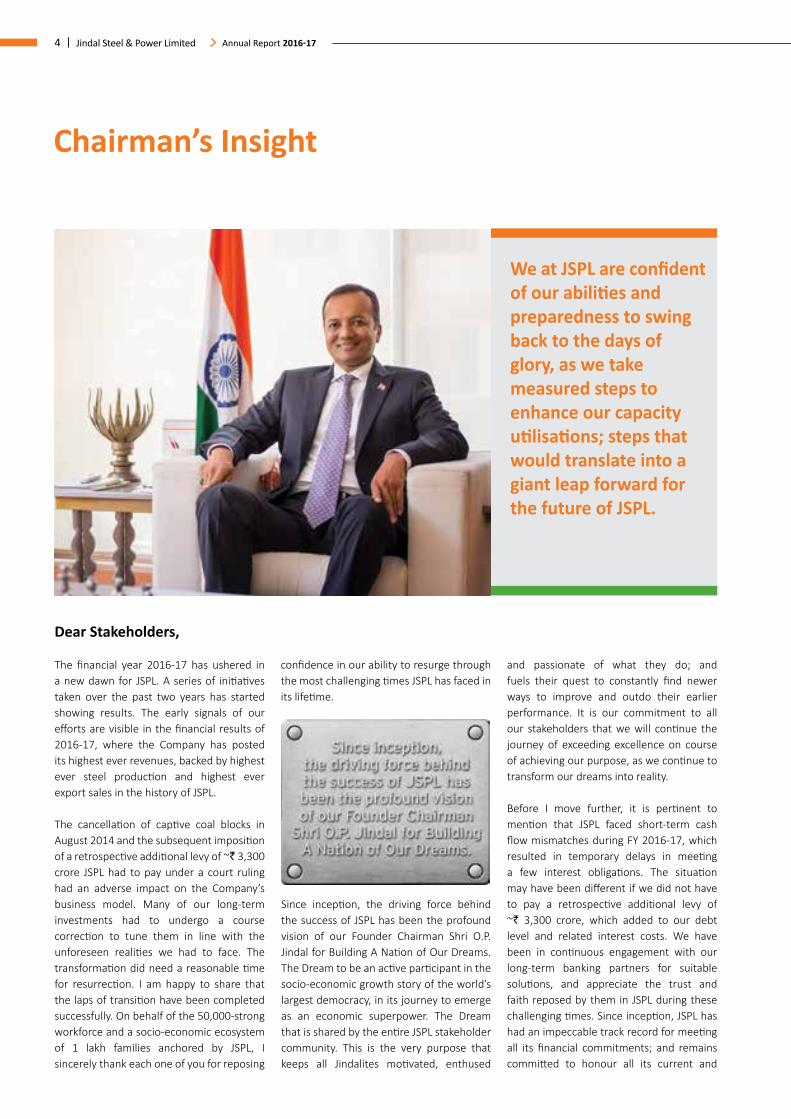
Chairman’s Insight
Dear Stakeholders,
The financial year 2016-17 has ushered in a new dawn for JSPL. A series of initiatives taken over the past two years has started showing results. The early signals of our efforts are visible in the financial results of 2016-17, where the Company has posted its highest ever revenues, backed by highest ever steel production and highest ever export sales in the history of JSPL.
The cancellation of captive coal blocks in August 2014 and the subsequent imposition of a retrospective additional levy of ~` 3,300 crore JSPL had to pay under a court ruling had an adverse impact on the Company’s business model. Many of our long-term investments had to undergo a course correction to tune them in line with the unforeseen realities we had to face. The transformation did need a reasonable time for resurrection. I am happy to share that the laps of transition have been completed successfully. On behalf of the 50,000-strong workforce and a socio-economic ecosystem of 1 lakh families anchored by JSPL, I sincerely thank each one of you for reposing
confidence in our ability to resurge through the most challenging times JSPL has faced in its lifetime.
and passionate of what they do; and fuels their quest to constantly find newer ways to improve and outdo their earlier performance. It is our commitment to all our stakeholders that we will continue the journey of exceeding excellence on course of achieving our purpose, as we continue to transform our dreams into reality.
Before I move further, it is pertinent to mention that JSPL faced short-term cash flow mismatches during FY 2016-17, which resulted in temporary delays in meeting a few interest obligations. The situation may have been different if we did not have to pay a retrospective additional levy of ~` 3,300 crore, which added to our debt level and related interest costs. We have been in continuous engagement with our long-term banking partners for suitable solutions, and appreciate the trust and faith reposed by them in JSPL during these challenging times. Since inception, JSPL has had an impeccable track record for meeting all its financial commitments; and remains committed to honour all its current and
We at JSPL are confident of our abilities and preparedness to swing back to the days of glory, as we take measured steps to enhance our capacity utilisations; steps that would translate into a giant leap forward for the future of JSPL.
Since inception, the driving force behind the success of JSPL has been the profound vision of our Founder Chairman Shri O.P. Jindal for Building A Nation of Our Dreams. The Dream to be an active participant in the socio-economic growth story of the world’s largest democracy, in its journey to emerge as an economic superpower. The Dream that is shared by the entire JSPL stakeholder community. This is the very purpose that keeps all Jindalites motivated, enthused
| 5Corporate Overview Chairman’s Insight
future obligations. We at JSPL, are confident that by the time the current year 2017-18 comes to an end, the Company would be back to the days of prosperity with a steady increase in our EBIDTA levels, and continue to set new records by outdoing its own performance quarter after quarter, and year after year.
During the challenging times, JSPL was often referred to as a debt-heavy company, with a net debt of around ` 46,000 crore. In isolation, the debt levels may appear significantly high. However, when seen in the right perspective, with a diversified and prudently spread out asset base of close to ` 75,000 crore, the same debt level would appear rational and reasonable. The entire debt is prudently spread across high- potential business segments - with around ` 25,000 crore in domestic steelmaking business with a capacity of 6 MTPA; ` 8,600 crore in world-class power generation assets of 3,400 MW; and the balance ` 12,400 crore in a 2 MTPA integrated steel plant in Oman, along with 6.2 MTPA coal-mining operations in Australia, Mozambique and South Africa.
You would have observed that over the past five years, your Company has transformed its assets from 3 MTPA steelmaking and 1,000 MW power generation capacities to a 8.1 MTPA steelmaker and a 5,049 MW power producer. As a conscious element of its expansion strategy, JSPL consolidated its power generation assets at the O.P. Jindal Super Thermal Power Complex at Tamnar, scaling it to 3,400 MW. On the steelmaking front, JSPL spread its operations from Raigarh (Chhattisgarh) by successfully establishing a greenfield integrated steel complex at Angul (Odisha) and Sohar (Oman) – both being among the largest and most modern in their respective regions. Incidentally, adding to our challenges, by the time our capacities went operational, the global steel commodity cycle and the domestic power sector experienced dynamic changes – not only for JSPL but also for every player in these sectors.
Despite facing significant challenges, JSPL successfully completed the 6 MTPA greenfield expansion project at Angul (Odisha) in early FY 2017-18, without taking any additional debt in FY 2016-17. The completion and commissioning of 4 MTPA Blast Furnace - the largest in India – is a significant development for the future growth trajectory of JSPL. I am happy to share with you that JSPL has set new benchmarks in completing the Blast Furnace installation in a record time of 39 months, and at lowest costs, compared to the installation time of 45 months taken for Blast Furnace installations of similar size and scale. With the recent commissioning of the 4 MTPA Blast Furnace at Angul, JSPL will enhance its domestic steelmaking capacities to 9.6 MTPA during FY 2017-18. The Angul operational performance, as it keeps picking momentum, will be the fulcrum to effectuate JSPL’s debt reduction roadmap to become relatively debt free in the next three-four years.
Every challenge offers an opportunity, is the path we have continued walking on for the past two years. The path that made us introspect each and every process minutely - across the length and breadth of JSPL. I am glad to share that the series of measures have not only optimised cost structures, but has enabled us to look at innovative ways of enhancing the overall efficiencies and revenue pipeline – in India and global geographies JSPL operates in.
During FY 2016-17, JSPL’s Raigarh steel plant continued to operate at optimum production levels. The commissioning of India’s first Head Hardened Rail Facility at Raigarh to manufacture Rail Tracks for metros and high-speed trains was a major landmark, taking JSPL to the select league of seven global steelmakers with this capability. The Rail and Universal Beam Mill (RUBM) at
Raigarh successfully completed a major export order of over 1,20,000 tonnes of Rails to Iran to make a mark in the global markets.
Robust demand for Jindal Panther TMT Rebars anchored the acceleration in operational performance at JSPL’s Patratu facility. The Pellet Plant at Barbil posted its highest ever sales and exports during FY 2016-17, enabling JSPL to emerge as the country’s largest pellet exporter. The integrated steelmaking operation at Oman commissioned a 1.4 MTPA Bar Mill and recorded its highest production, effectuating a 50% rise in EBIDTA of Jindal Shadeed. Mining operations spread across South Africa, Mozambique and Australia increased their contribution to the Company’s growth trajectory.
With the indicators of the upward cycle starting to appear, we at JSPL are confident of our abilities and preparedness to swing back to the days of glory, as we take measured steps to enhance our capacity utilisations; steps that would translate into a giant leap forward for the future of JSPL.
The Government of India has recently announced the National Steel Policy (NSP) 2017, with an aim to ramp up domestic crude steel capacity to 300 MTPA by 2030, from the current 125 MTPA levels. This effectively indicates a significant growth in per capita consumption of steel from the current 60 Kg to 160 Kg levels by 2030. The realisation of the targets set forth in NSP 2017 offers significant growth opportunities to domestic steelmakers. JSPL is confident of accelerating its production and sales curve by Making in India, Making for the World - through the course of this journey.
On behalf of my 50,000 colleagues, I take the privilege of appreciating the continued support from all our stakeholder segments during the challenging times. The Purpose of existence of JSPL integrally includes value creation for all our stakeholders. Your confidence in JSPL will continue to be a prime mover for us, motivating us to work harder and smarter this year. We all look forward to come back next year with a performance that would qualify as superlative by all stakeholders, including shareholders, of JSPL.
Yours truly,
Naveen Jindal Chairman
@MPNaveenJindal @NaveenJindalMP
6 | Jindal Steel & Power Limited Annual Report 2016-17
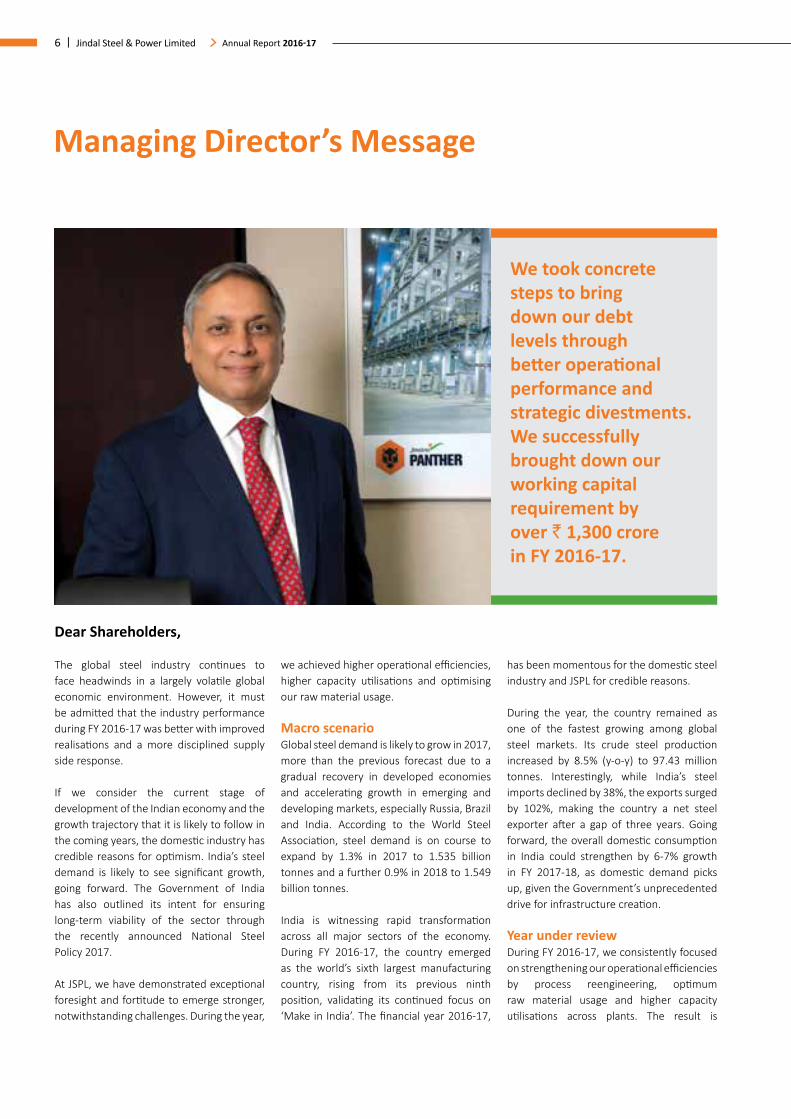
Managing Director’s Message
Dear Shareholders,
The global steel industry continues to face headwinds in a largely volatile global economic environment. However, it must be admitted that the industry performance during FY 2016-17 was better with improved realisations and a more disciplined supply side response.
If we consider the current stage of development of the Indian economy and the growth trajectory that it is likely to follow in the coming years, the domestic industry has credible reasons for optimism. India’s steel demand is likely to see significant growth, going forward. The Government of India has also outlined its intent for ensuring long-term viability of the sector through the recently announced National Steel Policy 2017.
At JSPL, we have demonstrated exceptional foresight and fortitude to emerge stronger, notwithstanding challenges. During the year,
we achieved higher operational efficiencies, higher capacity utilisations and optimising our raw material usage.
Macro scenarioGlobal steel demand is likely to grow in 2017, more than the previous forecast due to a gradual recovery in developed economies and accelerating growth in emerging and developing markets, especially Russia, Brazil and India. According to the World Steel Association, steel demand is on course to expand by 1.3% in 2017 to 1.535 billion tonnes and a further 0.9% in 2018 to 1.549 billion tonnes.
India is witnessing rapid transformation across all major sectors of the economy. During FY 2016-17, the country emerged as the world’s sixth largest manufacturing country, rising from its previous ninth position, validating its continued focus on ‘Make in India’. The financial year 2016-17,
has been momentous for the domestic steel industry and JSPL for credible reasons.
During the year, the country remained as one of the fastest growing among global steel markets. Its crude steel production increased by 8.5% (y-o-y) to 97.43 million tonnes. Interestingly, while India’s steel imports declined by 38%, the exports surged by 102%, making the country a net steel exporter after a gap of three years. Going forward, the overall domestic consumption in India could strengthen by 6-7% growth in FY 2017-18, as domestic demand picks up, given the Government’s unprecedented drive for infrastructure creation.
Year under reviewDuring FY 2016-17, we consistently focused on strengthening our operational efficiencies by process reengineering, optimum raw material usage and higher capacity utilisations across plants. The result is
We took concrete steps to bring down our debt levels through better operational performance and strategic divestments. We successfully brought down our working capital requirement by over ` 1,300 crore in FY 2016-17.
| 7Corporate Overview
encouraging. We have successfully managed to reduce our fuel costs substantially. We reported higher revenue of ` 22,696 crore in 2016-17, compared to ` 20,368 crore 2015-16, an increase of 11% (y-o-y). At the same time, our consolidated EBIDTA increased to ` 4,658 crore in 2016-17, against ` 3,437 crore in 2015-16, an increase of 36% (y-o-y).
We took concrete steps to bring down our debt levels through better operational performance and strategic divestments. We successfully brought down our working capital requirement by over ` 600 crore in FY 2016-17. Our total steel inventory reduced by 55% in 2016-17 (from 0.27 MT on 1st April to 0.13 MT on 31st March) owing to prudent planning.
Steel businessDuring FY 2016-17, we registered the highest ever steel production of 4.8 MT and steel sales of 4.65 MT. We recorded over 340% growth in exports: ` 3,466.98 crore in FY17 vs ` 1,072.38 crore in FY 2016-17, which accounted for 20% of our standalone revenues. We also reported the highest ever iron ore pellet production of 6.5 MT and a dispatch of 6.59 MT in 2016-17. We achieved the highest ever pellet export of 2.3 MT during 2016-17, making us the largest pellet exporter from India. During the year, our rail production crossed 0.2 MT for the first time and over 0.12 MT of rails were exported to Iran.
We strengthened our TMT rebars portfolio with the launch of 550D grade of TMT rebars to provide 10% enhanced strength in steel. This will also entail cost savings for our customers, compared to available 500D grade in the market. We also launched our e-commerce portal as well as mobile based applications, so that the purchase of TMT rebars can be made with speed and convenience. We are equipped to deliver any order received through our portal within 48 hours. In addition, we also received the Research Designs & Standards Organisation (RDSO) certification for our TMT rebars as well as for our bridge manufacturing at Structural Steel Division (SSD), Punjipatra, Chhattisgarh.
Power business In FY 16-17, JPL’s revenues increased by 4%
but EBITDA rose by 65%. The EBITDA margin for FY17 stood at 34%, compared to 21% for FY16. JPL also achieved a net cash profit of ` 656 crore. Our enhanced focus on operational excellence enabled us to post an all-round improvement in our power business. Our proactive initiatives enabled us to reduce coal cost by 14% (y-o-y). We maintained an average Plant Load Factor (PLF) of 65% to 70% during FY 2016-17.
Global businessIn 2016-17, our steel plant in Oman delivered the highest ever steel production of 1.33 MT that helped in augmenting our market share in Oman to over 40%. We became the market leader in Oman in the rebar segment with over 50,000 MT per month sales. To enhance our value-added product portfolio, we commissioned a cut-and-bend plant in Oman with 3,000 tonnes per month capacity.
Our mines in Australia and Mozambique resumed coal mining in FY 2016-17 and are ramping up production steadily. By the end of FY 17, coal production in Mozambique’s coal-rich Moatize region increased steadily to a level of 125KT/month and was at 0.29 million tonnes ROM. Our annual coking coal production in Wongawilli, Australia was 2,55,000 MT in FY 2016-17.
Construction Solutions BusinessWe have been working tirelessly to make inroads into the growing construction and real estate business to become the preferred choice as one-stop shop for all construction and steel structure based building solution. As part of our thrust on providing comprehensive construction solutions, we bagged major bridge orders from Afcons, GMR and IRCON. We completed the supply of 8,500 MT of fabricated structures for high-rise steel building project orders booked in FY 2015-16 on time.
Raw material security During FY 2016-17, we secured two long-term linkage of 1.18 Million Tonne Per Annum (MTPA) and 0.51 MTPA for our state-of-the-art captive power generation plants. The long-term coal linkage for a five-year period will ensure steady and assured fuel security for our captive power plants. These coal linkages would further enhance the
operational efficiencies of our steelmaking facilities at Raigarh and Angul. Since 2016, we have secured coal linkages of close to 2.3 MTPA under various sub-sectors for a 5-year timeframe.
Forward focus We will continue to build on our strengths to contribute meaningfully to India’s socio-economic prosperity for the long term. Going forward, our motto is to strive to improve our net sales realisation (NSR) and thereby strengthen the operating EBIDTA. We plan to stabilise the production for our newly commissioned Angul plant in Odisha. Our aim will be to sweat our assets to achieve 100% capacity utilisation across all our plants. Our focus will be to reduce fixed costs, optimise working capital and decrease our debt portfolio. We plan to increase the production of steel and aspire to achieve the monthly rail production to 50,000 MT per month.
Further, we will increase our market penetration for our Rail and Universal Beam Mill (RUBM) and medium and light structural mill (MLSM), which will set the benchmark of standards. We will continue to sharpen our focus on manufacturing high margin value-added products, which will garner higher returns. Securing approvals from PSUs, governments and semi-government agencies for our products will be a priority to ensure their saleability. In the construction business, we aim to diversify into buildings, rail infrastructure and defence segments, which will add to our product portfolio. There will also be an added thrust to our heavy fabrication business.
Despite challenges, JSPL is strengthening its core and transforming rapidly. Our people, products, technologies and processes are enabling us to help translate the grandiose vision of ‘Make in India’ a vibrant reality.
I remain grateful to all our shareholders for their unrelenting support and encouragement that enthuses us to deliver our best.
Ravi Uppal Managing Director & Group CEO
Managing Director’s Message

8 | Jindal Steel & Power Limited Annual Report 2016-17
Empowering India
An empowered and self-reliant India is what we are working towards. Staying true to our commitment towards ‘Making In India’, we completed our 6 MTPA integrated steel plant at Angul, Odisha. Spread over 3,500 acres, it is one of the most advanced integrated steel plants in the country.
The plant will provide direct employment opportunities to over 30,000 people and indirect employment to over 1 lakh individuals. Built at an investment of ` 29,000 crore, the Integrated Steel Plant at Angul is among the largest private sector investments in Odisha.
World’s largest 1.4 MTPA Rebar Mill at Angul, Odisha World’s Fastest 2.3 Mtpa Billet Caster, Angul, Odisha
6 MTPA Steel Melting Shop, at Angul, Odisha
1.2 MTPA Plate Mill at Angul, Odisha
| 9Corporate Overview
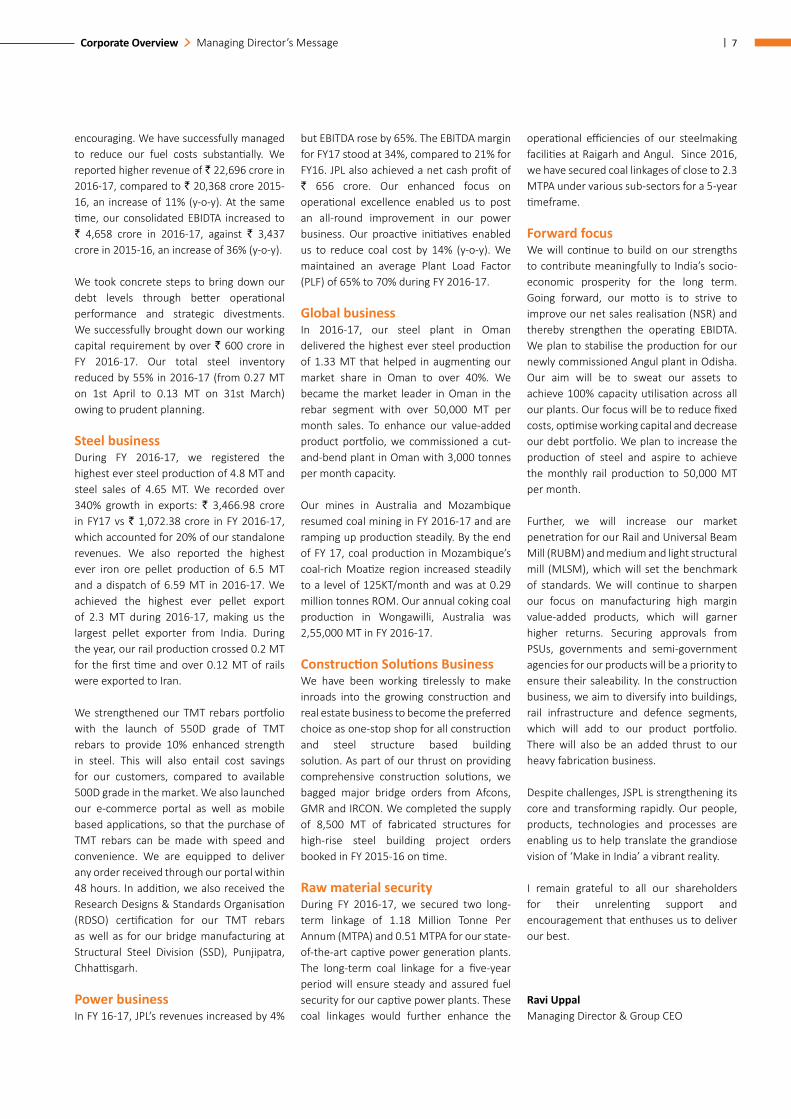
The completion of Odisha’s largest and most modern Integrated Steel Plant enhances JSPL’s installed iron and steelmaking capacities substantially. Angul as a location is strategically best suited for setting up an integrated steel plant of global scale. It is close to the sources of iron ore and coal; and is well connected by roads, rails and ports. We own a captive 3.11 MTPA iron ore mines at Tensa, located at a distance of 200 kilometres from Angul. We also have a 9 MTPA Pellet Plant at Barbil, which is India’s largest single location pelletisation complex. The integrated steel complex was initially envisioned as India’s first and only steel plant, based on purely ‘swadeshi’ raw material, with plenty of sources of ‘swadeshi’ high ash coal in proximity of Angul.
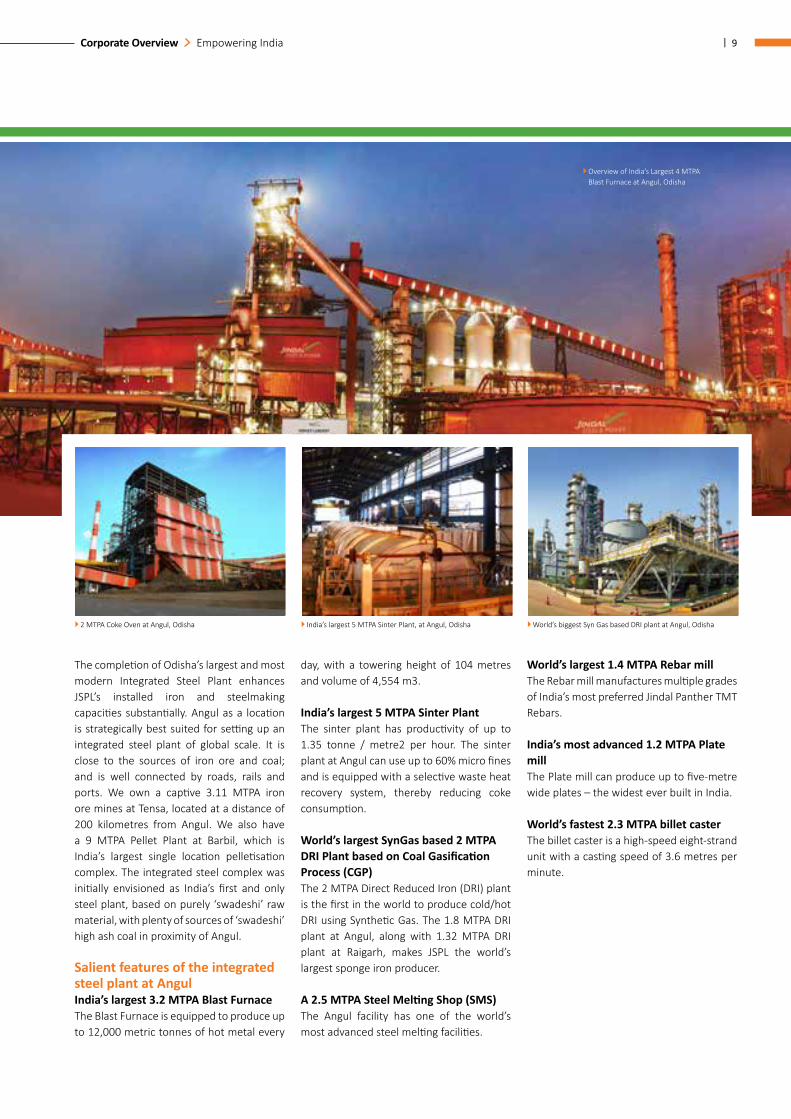
Salient features of the integrated steel plant at AngulIndia’s largest 3.2 MTPA Blast FurnaceThe Blast Furnace is equipped to produce up to 12,000 metric tonnes of hot metal every
day, with a towering height of 104 metres and volume of 4,554 m3.
India’s largest 5 MTPA Sinter PlantThe sinter plant has productivity of up to 1.35 tonne / metre2 per hour. The sinter plant at Angul can use up to 60% micro fines and is equipped with a selective waste heat recovery system, thereby reducing coke consumption.
World’s largest SynGas based 2 MTPA DRI Plant based on Coal Gasification Process (CGP)The 2 MTPA Direct Reduced Iron (DRI) plant is the first in the world to produce cold/hot DRI using Synthetic Gas. The 1.8 MTPA DRI plant at Angul, along with 1.32 MTPA DRI plant at Raigarh, makes JSPL the world’s largest sponge iron producer.
A 2.5 MTPA Steel Melting Shop (SMS)The Angul facility has one of the world’s most advanced steel melting facilities.
World’s largest 1.4 MTPA Rebar millThe Rebar mill manufactures multiple grades of India’s most preferred Jindal Panther TMT Rebars.
India’s most advanced 1.2 MTPA Plate millThe Plate mill can produce up to five-metre wide plates – the widest ever built in India.
World’s fastest 2.3 MTPA billet casterThe billet caster is a high-speed eight-strand unit with a casting speed of 3.6 metres per minute.
2 MTPA Coke Oven at Angul, Odisha India’s largest 5 MTPA Sinter Plant, at Angul, Odisha World’s biggest Syn Gas based DRI plant at Angul, Odisha
Overview of India’s Largest 4 MTPA Blast Furnace at Angul, Odisha
Empowering India
10 | Jindal Steel & Power Limited Annual Report 2016-17
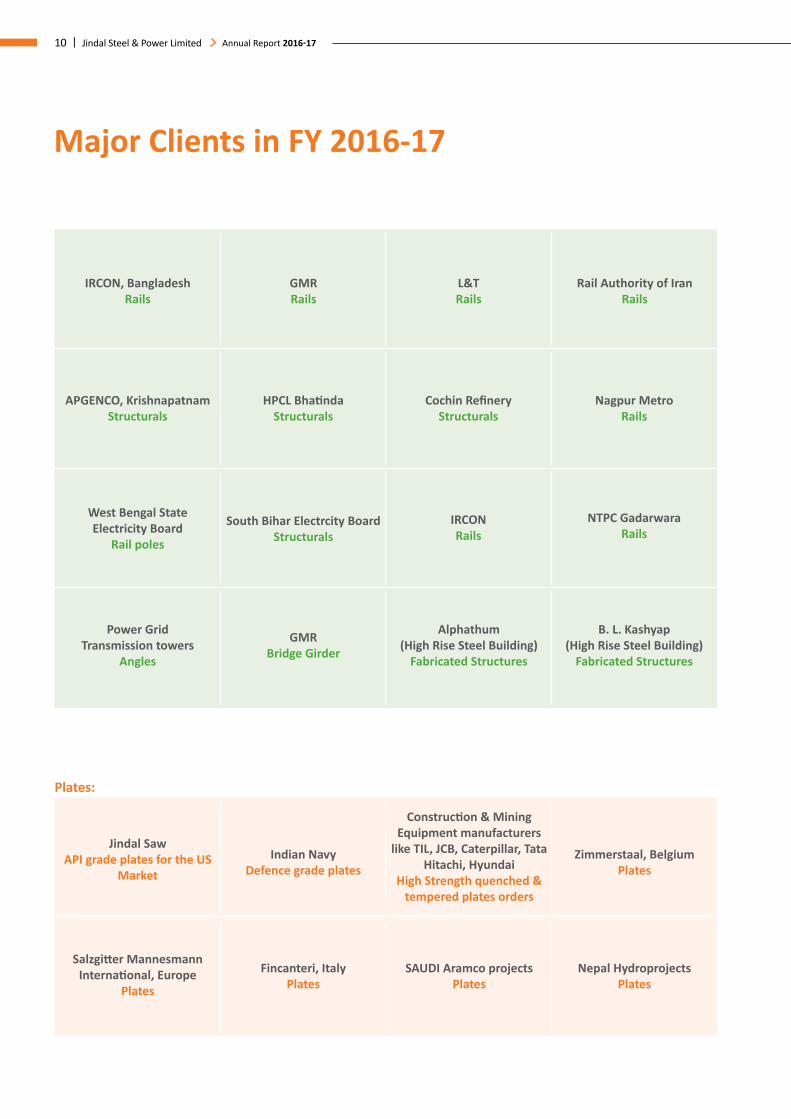
Major Clients in FY 2016-17
IRCON, Bangladesh Rails
Jindal Saw API grade plates for the US
Market
Indian Navy Defence grade plates
Construction & Mining Equipment manufacturers
like TIL, JCB, Caterpillar, Tata Hitachi, Hyundai
High Strength quenched & tempered plates orders
Zimmerstaal, Belgium Plates
Salzgitter Mannesmann International, Europe
Plates
Fincanteri, Italy Plates
SAUDI Aramco projects Plates
Nepal Hydroprojects Plates
APGENCO, Krishnapatnam Structurals
West Bengal State Electricity Board
Rail poles
Power Grid Transmission towers
Angles
GMR Bridge Girder
Alphathum (High Rise Steel Building)
Fabricated Structures
B. L. Kashyap (High Rise Steel Building)
Fabricated Structures
HPCL Bhatinda Structurals
South Bihar Electrcity Board Structurals
Cochin Refinery Structurals
IRCON Rails
Nagpur Metro Rails
NTPC Gadarwara Rails
GMR Rails
L&T Rails
Rail Authority of Iran Rails
Plates:
| 11Corporate Overview
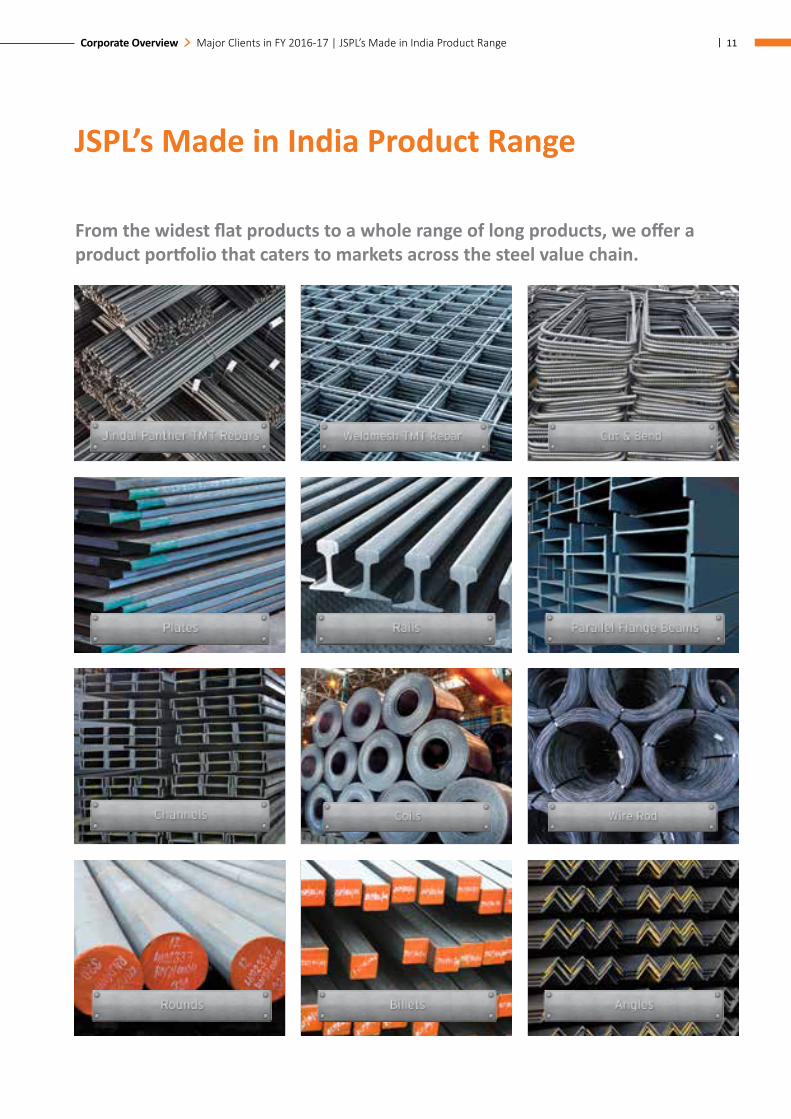
JSPL’s Made in India Product Range
From the widest flat products to a whole range of long products, we offer a product portfolio that caters to markets across the steel value chain.
Major Clients in FY 2016-17 | JSPL’s Made in India Product Range
12 | Jindal Steel & Power Limited Annual Report 2016-17
Making a Difference with Steel
Steel is the fulcrum of a developing economy’s progress and is the catalyst for its socio-economic prosperity. At JSPL, we are geared to help drive India’s transformation into a developed economy with robust and innovative products. Besides, we cater to the requirements of global markets through our wide product portfolio.
India’s crude steel production has consistently been on the rise to meet the country’s growing demand. Consequently, India ranked third amongst the world’s top steel-producing countries after China and Japan in FY 2016-17.
JSPL is emerging as a prominent player in the country’s growing steel industry with its integrated steel plants in Raigarh (Chhattisgarh), Angul (Odisha) and Patratu (Jharkhand). These state-of-the-art facilities offer a wide range of products to cater to the entire value chain of the steel industry. We have the distinction of being India’s first manufacturer of Parallel Flange Beams. Our world-class facility at Raigarh has the potential to emerge as an important hub to supply rails to the forthcoming corridors in India and the world; our head hardening rail facility being the first of its kind in India,
is facilitating head hardened rails for high speed and bullet trains. Our other value-added products include TMT rebars, Cut-and-Bends, Angles, Beams and speedfloor. Our products serve various segments such as housing, infrastructure (airports, stadiums, rail, road, bridges), power plants, industrial and high-rise buildings and heavy machinery to name a few.
During FY 2016-17, we single-mindedly focused on achieving operational efficiencies by effectively utilising our resources. We formulated an action plan to minimise our costs by leveraging our technical knowledge in our manufacturing processes and focused on our value-added products segment.
Our plants are driven by advanced technology and global integration; and we adopted green technologies, which
Steel capacities across life cycle
Finished Steel: 8.15MTPA
WRM 0.6 MTPA | RUBM 0.75 MTPA| MLSM 0.6 MTPA |Plate Mill 2.2 MTPA| BRM 3.8 MTPA
Iron making: 9.94 MTPA
DRI 4.62 MTPA|BF 5.325 MTPA | HBI 1.50 MTPA
Liquid Steel: 8.1 MTPA
Steel Melting Shop (SMS) 8.1 MTPA
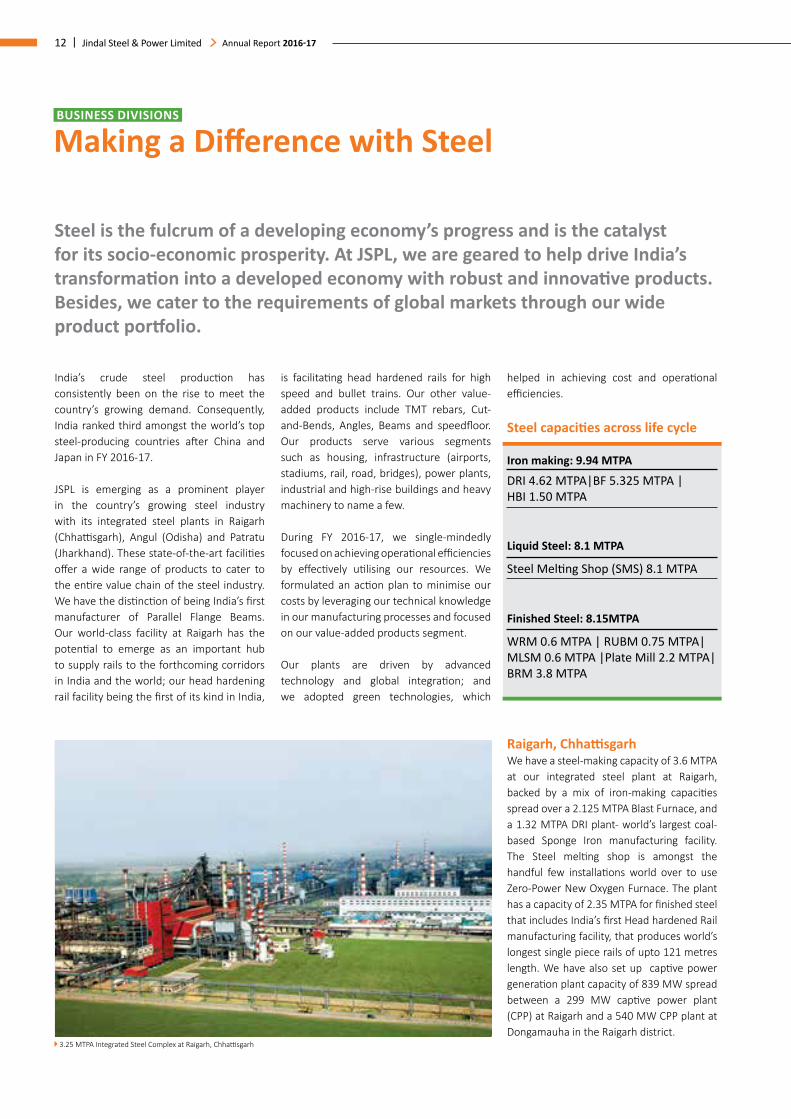
Raigarh, ChhattisgarhWe have a steel-making capacity of 3.6 MTPA at our integrated steel plant at Raigarh, backed by a mix of iron-making capacities spread over a 2.125 MTPA Blast Furnace, and a 1.32 MTPA DRI plant- world’s largest coal-based Sponge Iron manufacturing facility. The Steel melting shop is amongst the handful few installations world over to use Zero-Power New Oxygen Furnace. The plant has a capacity of 2.35 MTPA for finished steel that includes India’s first Head hardened Rail manufacturing facility, that produces world’s longest single piece rails of upto 121 metres length. We have also set up captive power generation plant capacity of 839 MW spread between a 299 MW captive power plant (CPP) at Raigarh and a 540 MW CPP plant at Dongamauha in the Raigarh district.
helped in achieving cost and operational efficiencies.
BUSINESS DIVISIONS
3.25 MTPA Integrated Steel Complex at Raigarh, Chhattisgarh
| 13Corporate Overview
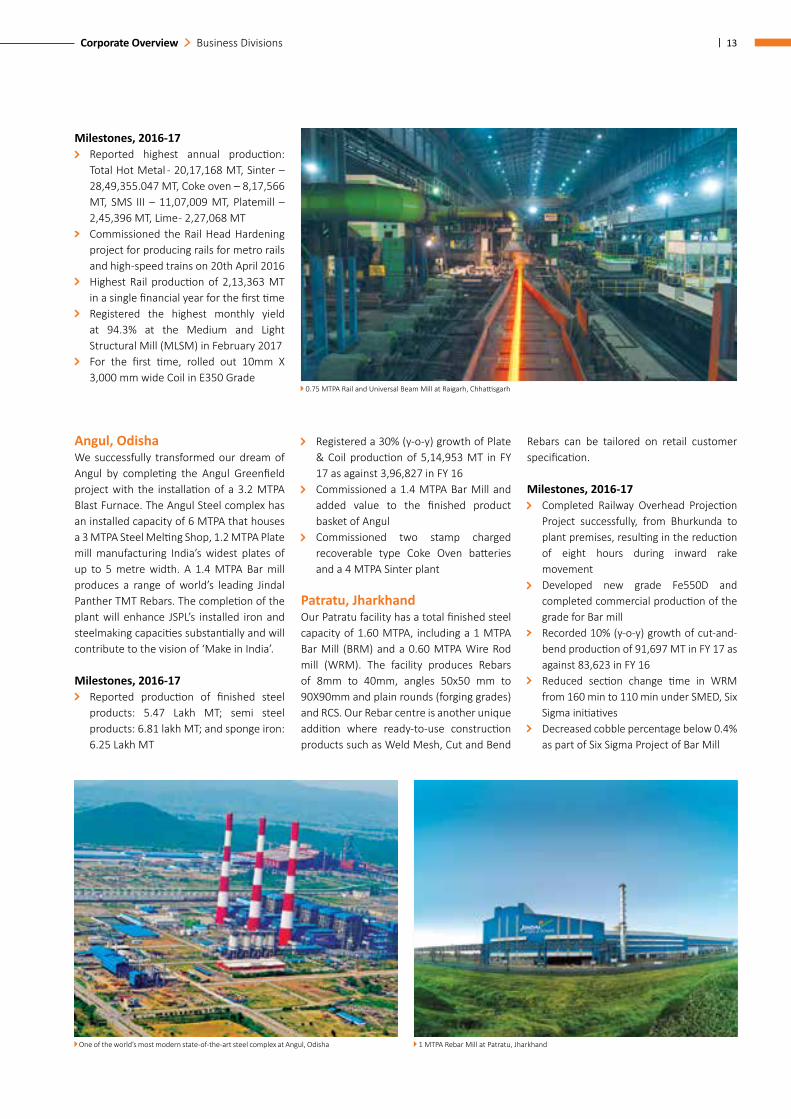
Angul, Odisha We successfully transformed our dream of Angul by completing the Angul Greenfield project with the installation of a 3.2 MTPA Blast Furnace. The Angul Steel complex has an installed capacity of 6 MTPA that houses a 3 MTPA Steel Melting Shop, 1.2 MTPA Plate mill manufacturing India’s widest plates of up to 5 metre width. A 1.4 MTPA Bar mill produces a range of world’s leading Jindal Panther TMT Rebars. The completion of the plant will enhance JSPL’s installed iron and steelmaking capacities substantially and will contribute to the vision of ‘Make in India’.
Milestones, 2016-17 Reported production of finished steel
products: 5.47 Lakh MT; semi steel products: 6.81 lakh MT; and sponge iron: 6.25 Lakh MT
Registered a 30% (y-o-y) growth of Plate & Coil production of 5,14,953 MT in FY 17 as against 3,96,827 in FY 16
Commissioned a 1.4 MTPA Bar Mill and added value to the finished product basket of Angul
Commissioned two stamp charged recoverable type Coke Oven batteries and a 4 MTPA Sinter plant
Patratu, Jharkhand Our Patratu facility has a total finished steel capacity of 1.60 MTPA, including a 1 MTPA Bar Mill (BRM) and a 0.60 MTPA Wire Rod mill (WRM). The facility produces Rebars of 8mm to 40mm, angles 50x50 mm to 90X90mm and plain rounds (forging grades) and RCS. Our Rebar centre is another unique addition where ready-to-use construction products such as Weld Mesh, Cut and Bend
Rebars can be tailored on retail customer specification.
Milestones, 2016-17 Completed Railway Overhead Projection
Project successfully, from Bhurkunda to plant premises, resulting in the reduction of eight hours during inward rake movement
Developed new grade Fe550D and completed commercial production of the grade for Bar mill
Recorded 10% (y-o-y) growth of cut-and-bend production of 91,697 MT in FY 17 as against 83,623 in FY 16
Reduced section change time in WRM from 160 min to 110 min under SMED, Six Sigma initiatives
Decreased cobble percentage below 0.4% as part of Six Sigma Project of Bar Mill
Milestones, 2016-17 Reported highest annual production:
Total Hot Metal - 20,17,168 MT, Sinter – 28,49,355.047 MT, Coke oven – 8,17,566 MT, SMS III – 11,07,009 MT, Platemill – 2,45,396 MT, Lime - 2,27,068 MT
Commissioned the Rail Head Hardening project for producing rails for metro rails and high-speed trains on 20th April 2016
Highest Rail production of 2,13,363 MT in a single financial year for the first time
Registered the highest monthly yield at 94.3% at the Medium and Light Structural Mill (MLSM) in February 2017
For the first time, rolled out 10mm X 3,000 mm wide Coil in E350 Grade
0.75 MTPA Rail and Universal Beam Mill at Raigarh, Chhattisgarh
One of the world’s most modern state-of-the-art steel complex at Angul, Odisha 1 MTPA Rebar Mill at Patratu, Jharkhand
Business Divisions
14 | Jindal Steel & Power Limited Annual Report 2016-17
Raipur Machinery DivisionOur in-house Heavy Machinery division at Raipur is equipped to build heavy machinery for a variety of core sector industries across the world like steel, power, cement, mining and petrochemicals. The division is organised in five business verticals to reach out to core sectors - Steel and Power plant equipment; EOT & Gantry Cranes; Pressure Vessels, Ferrous Castings, Bulk Material Handling Systems.
Milestones, 2016-17 Registered a total production of 11,654
MT of castings Developed a 22-metre-long stabiliser
Column and 33 mm Thick Reactor Vessel for UOP India (a Honeywell company) for its Modular Penex Project
38 mm Thick Rich Amne Flash Drum (Vessel) of 3,000 mm Diameter & weighing 88 MT supplied to BPCL for Mumbai Refinery
Installed a sewage treatment plant of capacity 500 KLD to be utilised for green belt development
Enhanced the capability of quality lab by procuring equipment such as 360-degree laser machine
Mines & Minerals We continue to leverage our own global and domestic mineral sources for raw materials. Through our captive mines and long-term supply arrangements, we ensure to have sufficient supply of raw materials for our processes.
Iron ore mine, Tensa Our 3.11 MTPA Tensa iron ore mine is located at a distance of 200 Kms from Angul that meets part of the iron-ore requirements for our steelmaking operations. The operations of the iron-ore mines are fully mechanised with world-leading mining technologies, that are efficient and environment friendly.
Pellet Plant, Barbil Our Pellet plant at Barbil is India’s largest single location Pelletisation complex with an installed capacity of 9 MTPA producing different grades of pellet. In FY 2016-17,
we reported the highest ever production and export of pellet and emerged as India’s largest Pellet exporter. The plant provides greater flexibility to produce pellets for both blast furnaces and DRI plants. The plant comprises a 4.5 MTPA Dry Grinding and a 4.5 MTPA Wet-Grinding Pelletisation unit.
Jindal Panther TMT Rebars Jindal Panther is one of India’s leading and preferred TMT brand with a nation-wide sales network. In the last one year, Jindal Panther’s manufacturing capacity has taken orbital jump both in India and overseas. During FY 2016-17, we commenced production of the TMT rebars at our integrated steel plants at Oman and Angul. Together, these mills along with Patratu have an installed capacity of over 3.8 million MT. With these mills in operation, today JSPL is one of the top producers of TMT in India as well as in Oman.
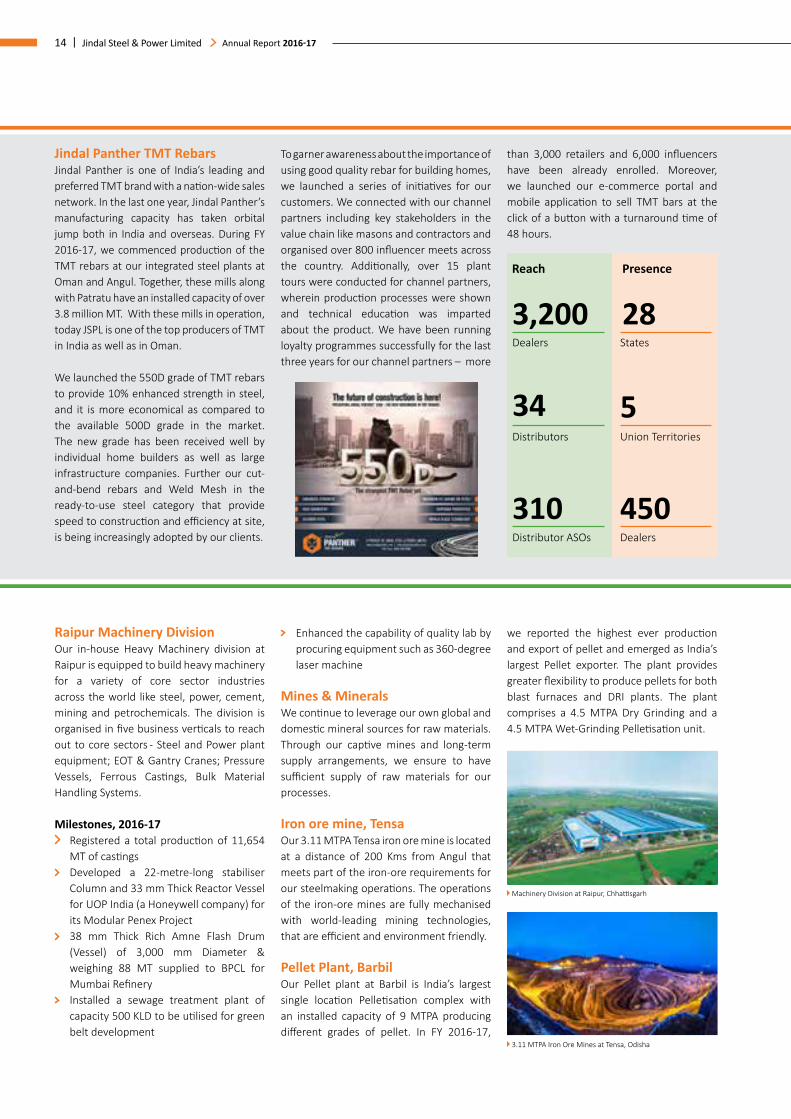
We launched the 550D grade of TMT rebars to provide 10% enhanced strength in steel, and it is more economical as compared to the available 500D grade in the market. The new grade has been received well by individual home builders as well as large infrastructure companies. Further our cut-and-bend rebars and Weld Mesh in the ready-to-use steel category that provide speed to construction and efficiency at site, is being increasingly adopted by our clients.
To garner awareness about the importance of using good quality rebar for building homes, we launched a series of initiatives for our customers. We connected with our channel partners including key stakeholders in the value chain like masons and contractors and organised over 800 influencer meets across the country. Additionally, over 15 plant tours were conducted for channel partners, wherein production processes were shown and technical education was imparted about the product. We have been running loyalty programmes successfully for the last three years for our channel partners – more
than 3,000 retailers and 6,000 influencers have been already enrolled. Moreover, we launched our e-commerce portal and mobile application to sell TMT bars at the click of a button with a turnaround time of 48 hours.
3,200 Dealers
34 Distributors
310 Distributor ASOs
28States
5Union Territories
450 Dealers
PresenceReach
Machinery Division at Raipur, Chhattisgarh
3.11 MTPA Iron Ore Mines at Tensa, Odisha
| 15Corporate Overview
Power Drives National Aspirations
Power fuels the nation’s aspirations to enhance the quality of life of more than a billion people. It is one of the critical components of infrastructure creation that the Government is putting a lot of emphasis on. Our mandate is to assist in realisation of the Government’s ‘Power for All’ initiative and to participate in the nation’s sustainable development programmes.
Jindal Power Limited (JPL) - our wholly owned subsidiary is one of India’s leading power generation companies. We are involved in various stages of power production – operation, implementation, development and planning – in the thermal, hydro and renewable energy sectors. We were the first company in India to establish an Independent Power Plant (IPP) in the power sector with an installed capacity of 1,000 MW thermal power at Tamnar, Chhattisgarh. Enthused by its success, we expanded our power capacity further with a 2,400 MW plant at Tamnar. Today, the 3,400 MW OP Jindal Super Thermal Power Plant is the largest Power Generation Complex of UMPP scale in the state of Chhattisgarh. The plant continues to be an inspiration in terms of project management and operational efficiencies.
To enhance cash flows and strengthen JSPL’s financial position, we decided to divest the 1,000 MW power unit in FY 2016-17. We were successful in receiving the complete support of our shareholders for its transfer and emerged as a sustainable organisation. The divestment will be converted into a special purpose vehicle (SPV) to be transferred to JSW Energy Ltd. to generate value for our equity shareholders.
During FY 2016-17, we sold 30% of our generated power through our power purchase agreements (PPAs). Our generation performance is in line with the PPA commitments and we source coal from a mix of coal linkage and e-auction.
We have the right elements for achieving a higher plant load factor (PLF) with an
optimum mix of raw materials, a robust transmission network and sufficient PPAs.
Milestones, FY 2016-17 Reduced cost of coal by 14%, thus
bringing economies of scale for power generation
Lowered administrative costs by 30% and manpower optimisation by 16%, thereby optimising overall costs
Initiated the flow of power for Tamil Nadu medium-term balance of 140 MW of power
Commenced short-term power purchase agreement (PPA) of 200 MW and long-term PPA of 150 MW with Kerala State Electricity Board at Tamnar II
Decreased operations and maintenance expenses by 5%
Hydroelectric projects under execution Etalin Hydroelectric Power Project (3,097
MW), Dibang Valley District, Arunachal Pradesh
Anonpani Small Hydro Electric Project (22 MW), Dibang Valley District, Arunachal Pradesh
Attunli Hydro Electric Power Project (680 MW), Dibang Valley District, Arunachal Pradesh
Kamala Hydro Electric Power Project (1,800 MW), Lower Subansiri District, Arunachal Pradesh
OutlookOur focus for FY 2017-18 will be to enhance our plant’s performance by adopting various measures. We aim to reduce our coal and fuel oil costs, and achieve operational efficiency by limiting the auxiliary power consumption. There is added impetus on achieving a PLF between 65% and 70%, which will be attained by reducing our maintenance costs.
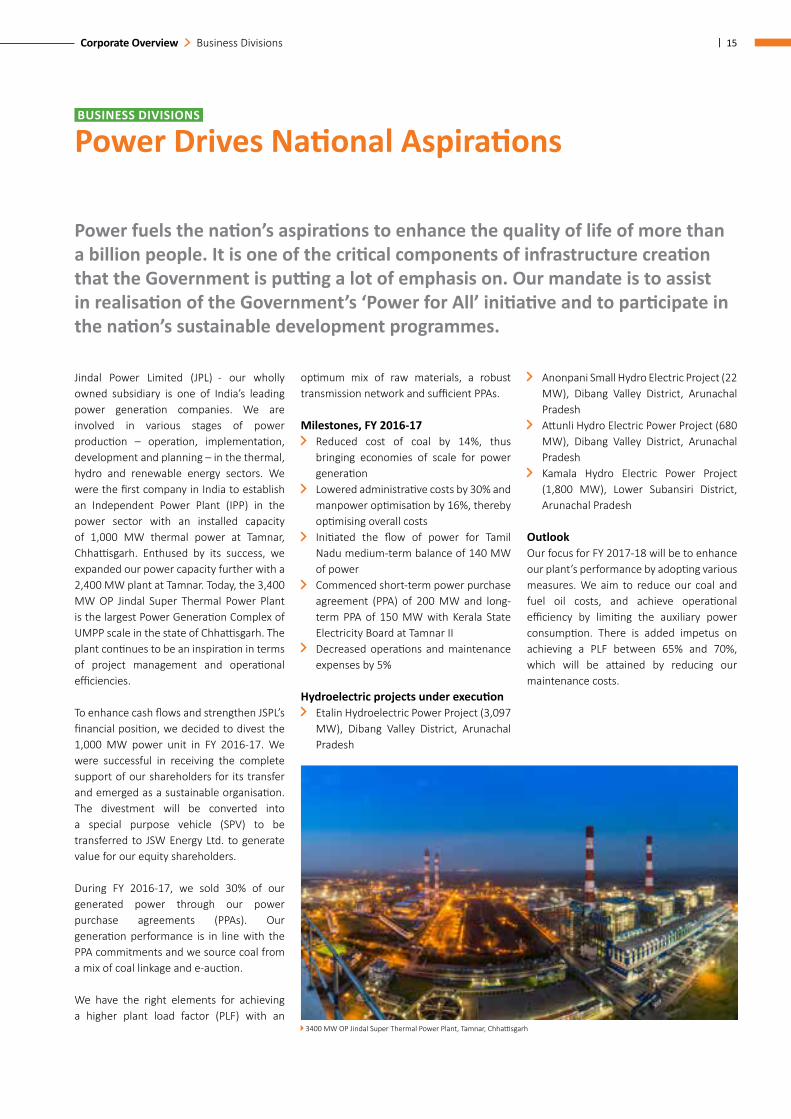
3400 MW OP Jindal Super Thermal Power Plant, Tamnar, Chhattisgarh
BUSINESS DIVISIONS
Business Divisions
16 | Jindal Steel & Power Limited Annual Report 2016-17
Global Ventures
We have put in place relevant strategies to drive seamless in-plant and mining operations across geographies. Our focus continues to be the optimum utilisation of existing assets and top-notch technologies to improve operations and set new industry benchmarks.
OmanJindal Shadeed, a subsidiary of Jindal Steel and Power Ltd., owns and operates a 2 MTPA Steel Melting Shop (SMS), third largest Steel Plant in the Middle East region at Sohar, Oman. Powered by latest technology, Jindal Shadeed is efficient on energy consumption and automation and follows international standards of steel making. The Direct Reduction Iron (DRI) making furnace is powered with a capacity of 1.5 MTPA with 4+ briquetting machines for the production of HBI. This facility has the capability to charge hot direct reduced iron (HDRI) at a temperature of around 6,500 degree Celsius directly into Electric Arc Furnace (EAF).
Our Steel Melt Shop (SMS) establishment in collaboration with Danieli, Italy consists of state-of-the-art steel making facilities with the best features in terms of product range and productivity. The plant achieves remarkable operating outcomes with low headcount and energy consumption, which makes it highly competitive.
Rolling MillJindal Shadeed has a 1.4 MTPA Rolling Mill with advanced technology and equipment
set up in collaboration with Danieli, Italy. The mill produces rebars in line with best international standards and has the largest rolling capacity in Oman. It began the production of its latest brand of rebars called Jindal Panther Rebars as per international standards and grades.
Milestones, FY 2016-17 Increased SMS production to 1.34 million
tonnes and rounds to 1,43,317 tonnes Commissioned a cut-and-bend plant with
3,000 tonnes per month capacity in Feb 2017
Commenced commercial production of 1.4 MTPA Rolling Mill in April 2016
Produced 0.46 million tonnes of rolling mill in its first year of operation
Registered 2,70,228 tonnes sale of rebars making Jindal Shadeed a market leader with a 40% share in Oman
Africa We resumed the production of coal in Mozambique in early October 2016, which increased steadily to a level of 125 KT/month by the end of March 2017; and produced 0.29 million tonnes ‘run of mine’ (ROM). Our target is to achieve 200-250KT/month
of coal production in the near future and to produce 10,000 tonnes of thermal coal per month to neighbouring countries.
We focused on exporting thermal coal to neighbouring countries and optimise our costs for logistics by generating revenues from the idle railway capacity.
Australia Our subsidiary in Australia is Wollongong Coal Limited, which has two coking coal mines named Russell Vale and Wongawilli, with a combined mining reserves of 122.7 million tonnes (MT). The production in Wongawilli was hampered by incessant rains during the latter half of the fourth quarter in FY 2016-17. As a result, the mine produced an aggregate volume of 0.12 million tonnes.
Despite the volatility in coking coal over the past few quarters, we have been steadily increasing production in Mozambique, Australia and South Africa; and would continue in the coming quarters. Despite falling prices during certain quarters, we have been able to consistently increase production and contribute positively towards a consolidated EBITDA.
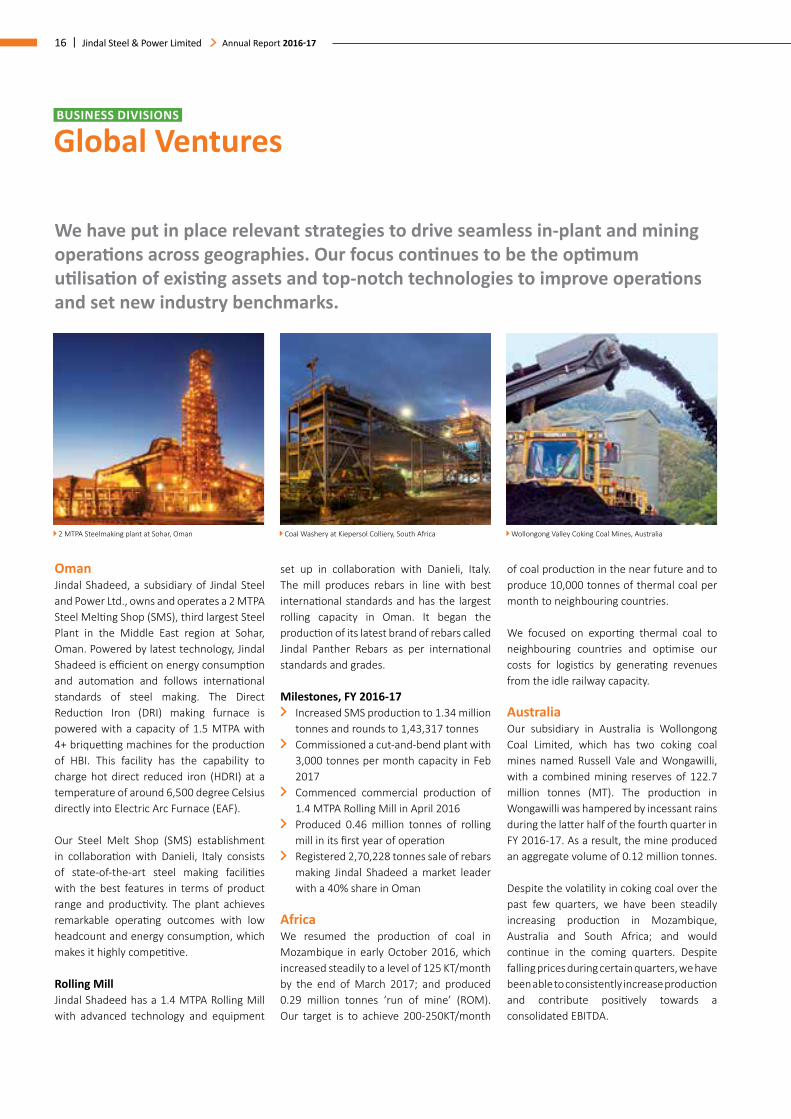
2 MTPA Steelmaking plant at Sohar, Oman Coal Washery at Kiepersol Colliery, South Africa Wollongong Valley Coking Coal Mines, Australia
BUSINESS DIVISIONS
| 17Corporate Overview
Construction Solutions Business
In the preceding few years, there has been a spurt of initiatives in India’s infrastructure sector. Government policies are propelling a consistent demand for steel bridges and other technological structures in the infrastructure business, primarily in railways and road sectors.
Today’s customer prefers a single-window concept, wherein a complete structure can be fabricated and sent to the construction site on a just-in-time basis. Our fabrication plant uses extensive automation to ensure precise and error-free fabrication. This expertise, along with a zero-wastage concept has helped us supply highly-precise material on a just-in-time basis, ensuring optimum working capital requirements. The ability to phase out production of raw material from steel plant based on fabrication requirements is an advantage to the fabrication business.
Milestones, FY 2016-17Steel Building
Completed the supply of 8,500 MT of fabricated structures for high-rise steel building project orders booked in FY 2015-16
Bagged orders of 12,000 MT for supply of fabricated structures of high-grade steel (450, 550 MPA) in high-rise steel building projects of commercial complexes in Bengaluru and Noida – from renowned real estate developers, of which 4,000 MT have already been dispatched
Completed the supply of 1,000 MT of fabricated hot rolled sections for new terminal extension of Vijayawada Airport
Acquired order for supply of fabricated high-grade steel structures of 1,200 MT for a multi-level car park project of a renowned hospital at New Delhi and completed its dispatch
Booked order for design and fabrication of 350 MT steel structures for a school building at Numaligarh, Assam
Received order for the supply of 2,200 MT of Pipe Rack structures (fabricated hot rolled section) for a renowned oil refinery project at Paradip, of which 350 MT have been dispatched
Sold around 920 MT of Speedfloor systems (Joists, Lockbars and so on) to different projects across India
Steel Bridge Girder Received RDSO approval for our work
premises of Jindal Industrial Park, Punjipatra for fabrication and supply of steel bridge girders
Booked and supplied 1,000 MT of bridge girders (riveted plate girders) in few Rail-Over Bridges (ROBs) projects for key railway contractors and major EPC companies
Acquired orders for the supply of 12,500 MT of bridge girders (open web girder as well as riveted plate girders) for various projects – railway bridges of the Dedicated Freight Corridor Corporation (DFCC) projects; road projects as well as of Sangaldan Railway Tunnel project (J&K), railway contractors and renowned EPC contractors – these projects require special steel plates, which will be manufactured either at JSPL’s Angul Plate mill or at Raigarh Plate mill and then will be fabricated at Jindal Industrial Park, Punjipatra.
Outlook Complete dispatch of balance orders in
Steel Buildings and Steel Bridge Girder Acquire high-value bridge girder orders
from projects of national importance, various road projects and steel flyover projects
Enter other markets in India for supplying to high-rise steel buildings of commercial complexes, multi-level car parks, school buildings, multiplexes and malls, stadiums and convention centres, among others
Foray into the supply of pre-fabricated structures for factory sheds and railway platforms sheds using hot rolled sections
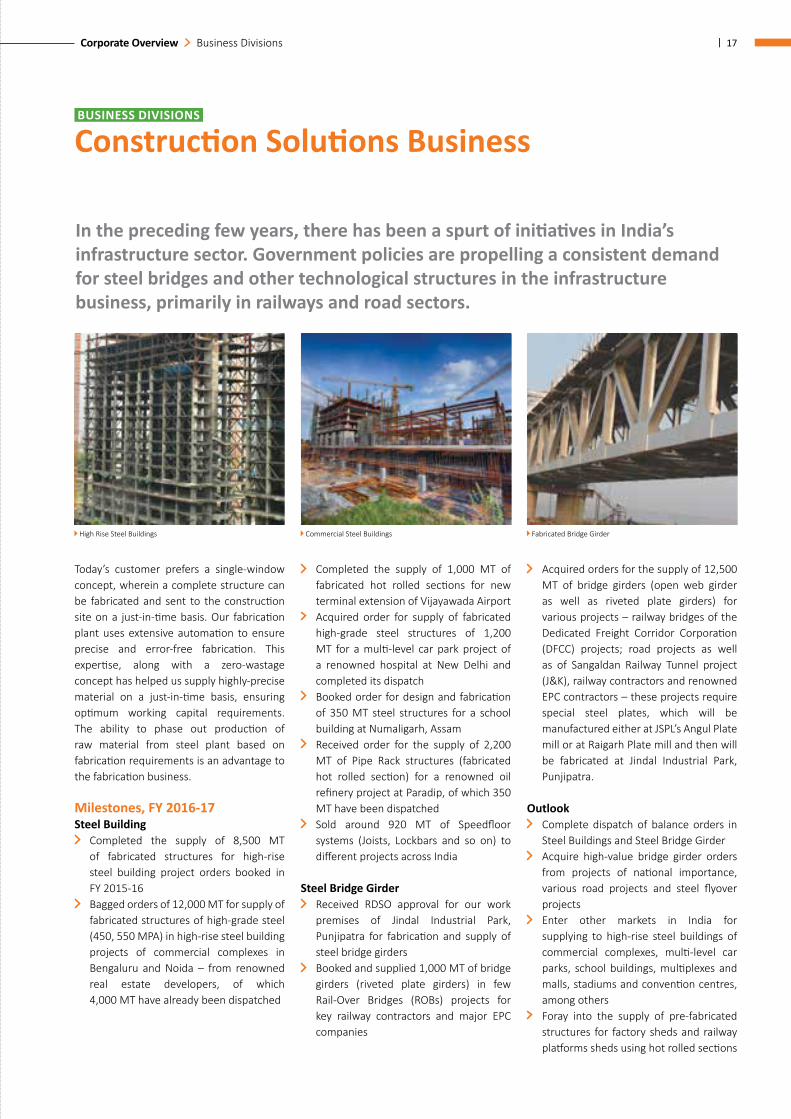
High Rise Steel Buildings Commercial Steel Buildings Fabricated Bridge Girder
BUSINESS DIVISIONS
Business Divisions
18 | Jindal Steel & Power Limited Annual Report 2016-17
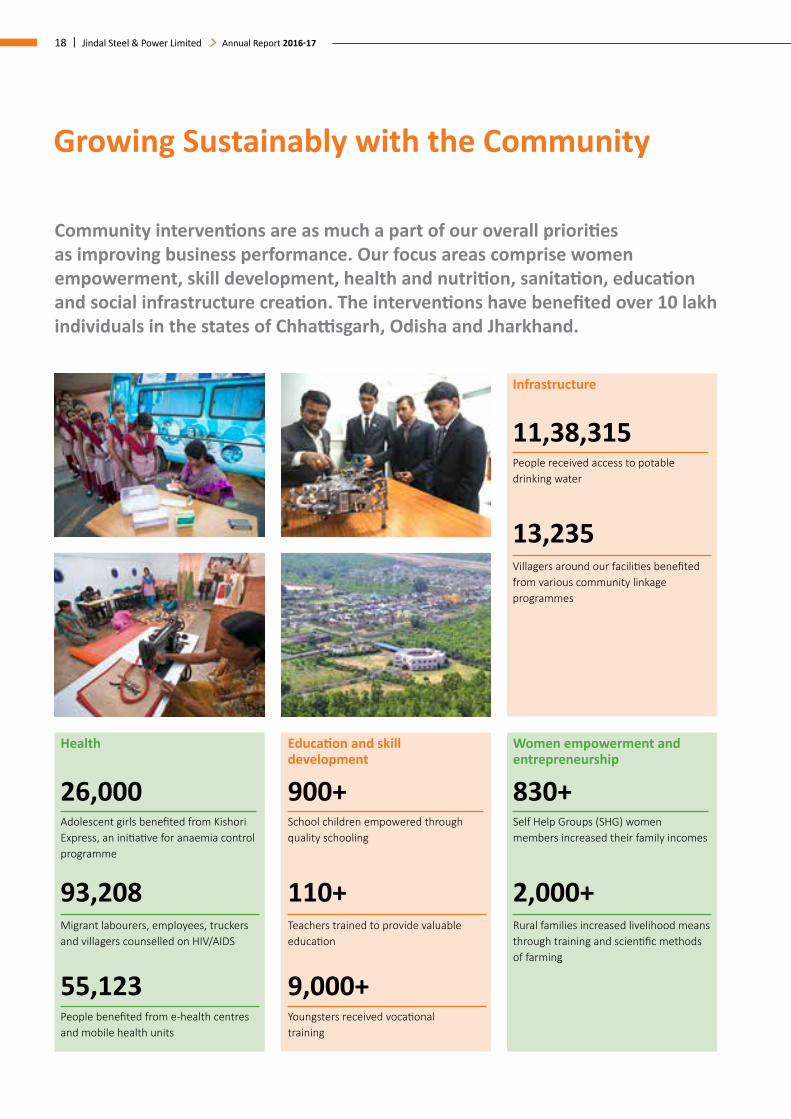
Growing Sustainably with the Community
Community interventions are as much a part of our overall priorities as improving business performance. Our focus areas comprise women empowerment, skill development, health and nutrition, sanitation, education and social infrastructure creation. The interventions have benefited over 10 lakh individuals in the states of Chhattisgarh, Odisha and Jharkhand.
900+School children empowered through quality schooling
110+Teachers trained to provide valuable education
9,000+ Youngsters received vocational training
26,000Adolescent girls benefited from Kishori Express, an initiative for anaemia control programme
93,208Migrant labourers, employees, truckers and villagers counselled on HIV/AIDS
55,123 People benefited from e-health centres and mobile health units
Health
830+Self Help Groups (SHG) women members increased their family incomes
2,000+Rural families increased livelihood means through training and scientific methods of farming
Women empowerment and entrepreneurship
11,38,315People received access to potable drinking water
13,235Villagers around our facilities benefited from various community linkage programmes
Infrastructure
Education and skill development
| 19Corporate Overview
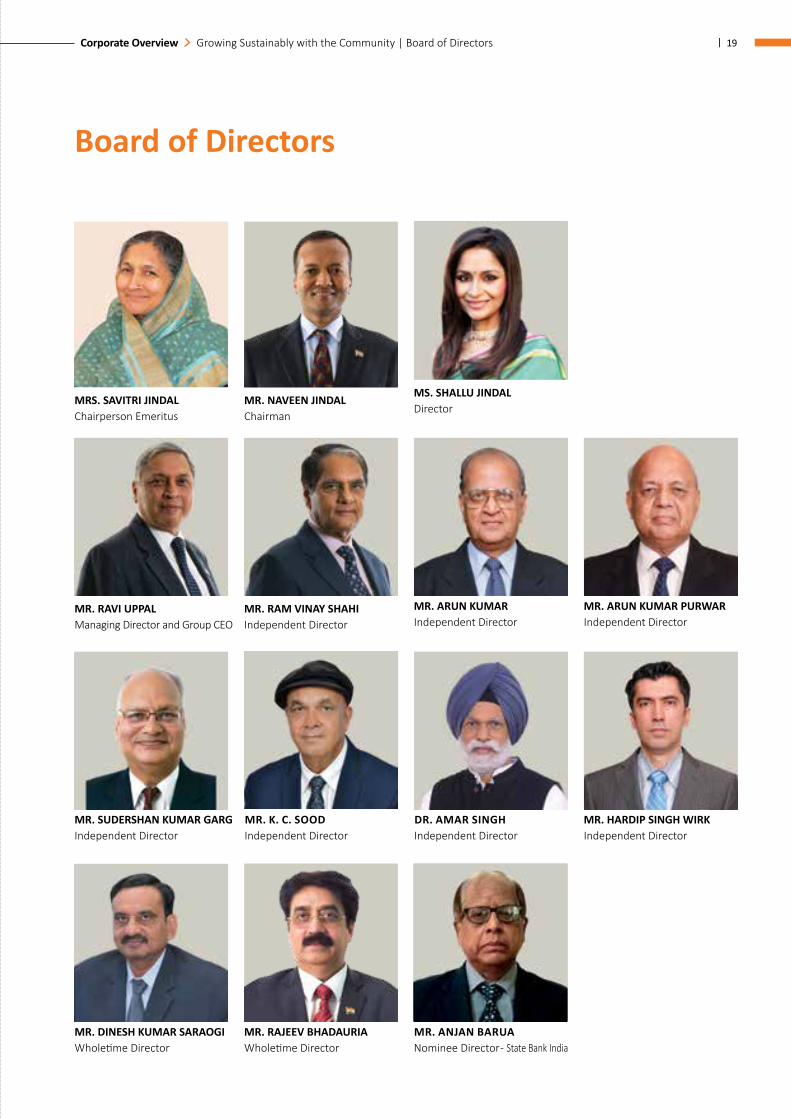
Board of Directors
MRS. SAVITRI JINDALChairperson Emeritus
MR. NAVEEN JINDAL Chairman
MS. SHALLU JINDALDirector
MR. RAVI UPPALManaging Director and Group CEO
MR. RAM VINAY SHAHIIndependent Director
MR. ARUN KUMAR PURWARIndependent Director
MR. ARUN KUMARIndependent Director
MR. SUDERSHAN KUMAR GARGIndependent Director
DR. AMAR SINGHIndependent Director
MR. K. C. SOODIndependent Director
MR. HARDIP SINGH WIRKIndependent Director
MR. DINESH KUMAR SARAOGIWholetime Director
MR. RAJEEV BHADAURIAWholetime Director
MR. ANJAN BARUANominee Director - State Bank India
Growing Sustainably with the Community | Board of Directors
20 | Jindal Steel & Power Limited Annual Report 2016-17
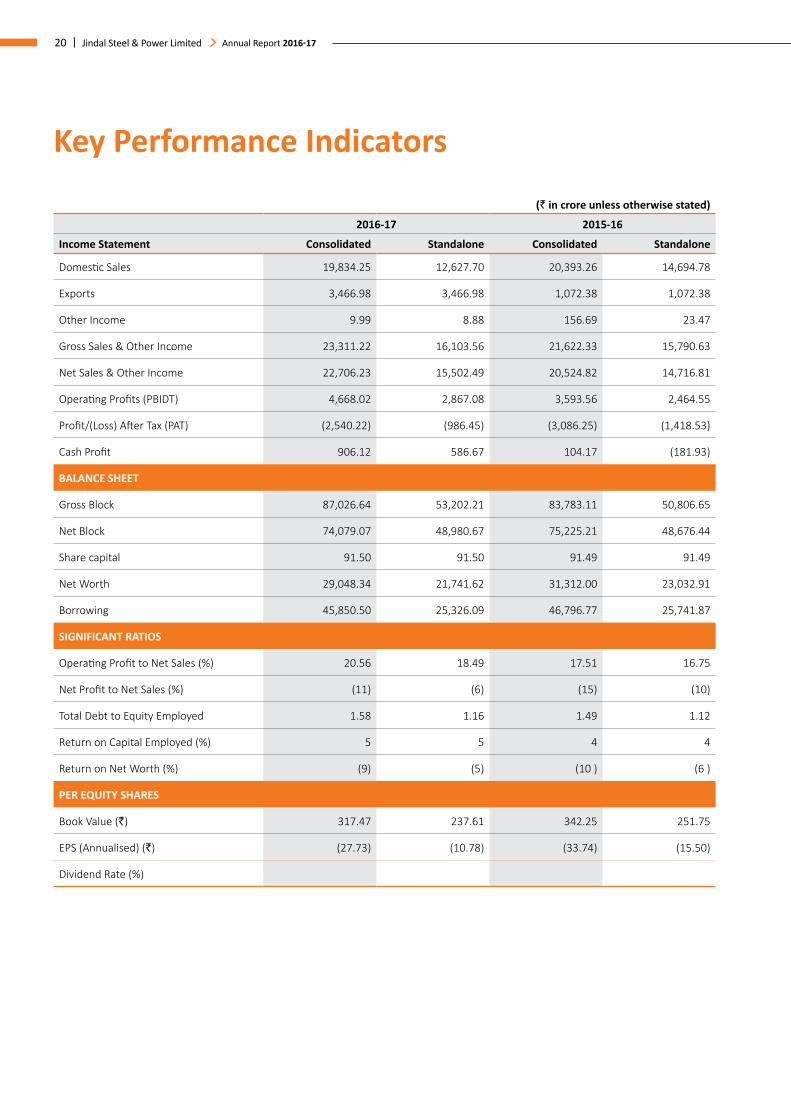
Key Performance Indicators
(` in crore unless otherwise stated)
2016-17 2015-16
Income Statement Consolidated Standalone Consolidated Standalone
Domestic Sales 19,834.25 12,627.70 20,393.26 14,694.78
Exports 3,466.98 3,466.98 1,072.38 1,072.38
Other Income 9.99 8.88 156.69 23.47
Gross Sales & Other Income 23,311.22 16,103.56 21,622.33 15,790.63
Net Sales & Other Income 22,706.23 15,502.49 20,524.82 14,716.81
Operating Profits (PBIDT) 4,668.02 2,867.08 3,593.56 2,464.55
Profit/(Loss) After Tax (PAT) (2,540.22) (986.45) (3,086.25) (1,418.53)
Cash Profit 906.12 586.67 104.17 (181.93)
BALANCE SHEET
Gross Block 87,026.64 53,202.21 83,783.11 50,806.65
Net Block 74,079.07 48,980.67 75,225.21 48,676.44
Share capital 91.50 91.50 91.49 91.49
Net Worth 29,048.34 21,741.62 31,312.00 23,032.91
Borrowing 45,850.50 25,326.09 46,796.77 25,741.87
SIGNIFICANT RATIOS
Operating Profit to Net Sales (%) 20.56 18.49 17.51 16.75
Net Profit to Net Sales (%) (11) (6) (15) (10)
Total Debt to Equity Employed 1.58 1.16 1.49 1.12
Return on Capital Employed (%) 5 5 4 4
Return on Net Worth (%) (9) (5) (10 ) (6 )
PER EQUITY SHARES
Book Value (`) 317.47 237.61 342.25 251.75
EPS (Annualised) (`) (27.73) (10.78) (33.74) (15.50)
Dividend Rate (%)
Statutory Reports
Board’s Report 22
Annexures to Board’s Report 31
Management Discussion and Analysis 41
Corporate Governance Report 78
Brief Profile of Directors 96
Business Responsibility Report 101
Financial Statements
Standalone Financials 111
Consolidated Financials 184
Form AOC-1 253
Statutory and Financial Statements
22 | Jindal Steel & Power Limited Annual Report 2016-17
Board’s Report
Dear Members,
The Board of Directors are pleased to present the Company’s 38th Annual Report along with the Audited Financial Statements, both standalone and consolidated, for the Financial Year ended March 31, 2017.
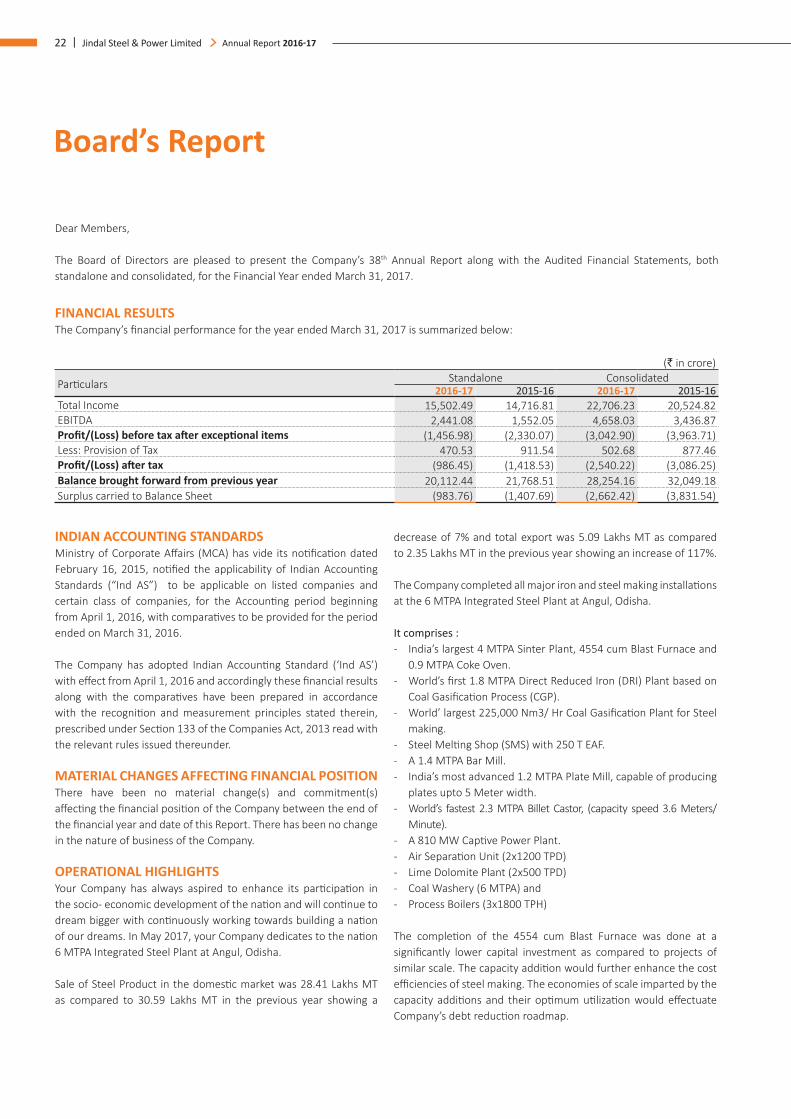
FINANCIAL RESULTSThe Company’s financial performance for the year ended March 31, 2017 is summarized below:
(` in crore)
Particulars Standalone Consolidated2016-17 2015-16 2016-17 2015-16
Total Income 15,502.49 14,716.81 22,706.23 20,524.82EBITDA 2,441.08 1,552.05 4,658.03 3,436.87Profit/(Loss) before tax after exceptional items (1,456.98) (2,330.07) (3,042.90) (3,963.71)Less: Provision of Tax 470.53 911.54 502.68 877.46Profit/(Loss) after tax (986.45) (1,418.53) (2,540.22) (3,086.25)Balance brought forward from previous year 20,112.44 21,768.51 28,254.16 32,049.18Surplus carried to Balance Sheet (983.76) (1,407.69) (2,662.42) (3,831.54)
INDIAN ACCOUNTING STANDARDSMinistry of Corporate Affairs (MCA) has vide its notification dated February 16, 2015, notified the applicability of Indian Accounting Standards (“Ind AS”) to be applicable on listed companies and certain class of companies, for the Accounting period beginning from April 1, 2016, with comparatives to be provided for the period ended on March 31, 2016.
The Company has adopted Indian Accounting Standard (‘Ind AS’) with effect from April 1, 2016 and accordingly these financial results along with the comparatives have been prepared in accordance with the recognition and measurement principles stated therein, prescribed under Section 133 of the Companies Act, 2013 read with the relevant rules issued thereunder.
MATERIAL CHANGES AFFECTING FINANCIAL POSITION There have been no material change(s) and commitment(s) affecting the financial position of the Company between the end of the financial year and date of this Report. There has been no change in the nature of business of the Company.
OPERATIONAL HIGHLIGHTSYour Company has always aspired to enhance its participation in the socio- economic development of the nation and will continue to dream bigger with continuously working towards building a nation of our dreams. In May 2017, your Company dedicates to the nation 6 MTPA Integrated Steel Plant at Angul, Odisha.
Sale of Steel Product in the domestic market was 28.41 Lakhs MT as compared to 30.59 Lakhs MT in the previous year showing a
decrease of 7% and total export was 5.09 Lakhs MT as compared to 2.35 Lakhs MT in the previous year showing an increase of 117%.
The Company completed all major iron and steel making installations at the 6 MTPA Integrated Steel Plant at Angul, Odisha.
It comprises :- India’s largest 4 MTPA Sinter Plant, 4554 cum Blast Furnace and
0.9 MTPA Coke Oven.- World’s first 1.8 MTPA Direct Reduced Iron (DRI) Plant based on
Coal Gasification Process (CGP).- World’ largest 225,000 Nm3/ Hr Coal Gasification Plant for Steel
making.- Steel Melting Shop (SMS) with 250 T EAF.- A 1.4 MTPA Bar Mill.- India’s most advanced 1.2 MTPA Plate Mill, capable of producing
plates upto 5 Meter width.- World’s fastest 2.3 MTPA Billet Castor, (capacity speed 3.6 Meters/
Minute).- A 810 MW Captive Power Plant.- Air Separation Unit (2x1200 TPD) - Lime Dolomite Plant (2x500 TPD) - Coal Washery (6 MTPA) and - Process Boilers (3x1800 TPH)
The completion of the 4554 cum Blast Furnace was done at a significantly lower capital investment as compared to projects of similar scale. The capacity addition would further enhance the cost efficiencies of steel making. The economies of scale imparted by the capacity additions and their optimum utilization would effectuate Company’s debt reduction roadmap.
| 23Statutory Reports Board’s Report
PRODUCTION HIGHLIGHTSSteel: Production of finished Steel products during the year under review was 29.71 Lakh MT, as against 29.48 Lakh MT in the previous year whereas production of semi steel products was 34.75 Lakh MT as against 34.65 Lakh MT in the previous year.
Power: During the year under review, 5465 million Kwh of Power was generated, as against 5882 million Kwh of power in the previous year.
Sponge Iron: Production of Sponge Iron during the year under review was 17.66 Lakh MT, as against previous year’s production of 19.94 Lakh MT.
Pellet: 64.63 Lakh MT of Pellets were produced during the year under review, as against 45.89 Lakh MT in the previous year.
Machinery: Machinery division in Raipur unit produced 998 MT of castings and has done production of 11317 MT, as against 1931 MT and 13966 MT respectively in the previous year.
Mining: The Mining of sized ore and fines at Tensa in Odisha was 5.96 Lakh Ton and 21.27 Lakh Ton respectively as against previous year mining of 6.22 Lakh Ton and 23.01 Lakh Ton respectively.
Detailed discussion on the operations have been given elsewhere in the report.
PROJECTS COMPLETED Steel Plant at Angul, Odisha- Phase- lYour Company has completed following operational facilities under Phase - l of 6 MTPA integrated Steel plant at Angul in the state of Odisha:a) Steel Melting Shop: Your Company has 250 T capacity Electric
Arc Furnace, is one of the largest in India. This art of technology Steel melt shop is equipped with Laddle furnace, RH, VD, Billet Caster and Slab Caster facility which can produce most of the grades available in the world.
b) Direct Reduced Iron Plant (DRI) and Coal Gasification Plant: The 1.8 MTPA DRI Plant is unique one in the world which utilizes Syngas (Gas produced from Non coking coal through Coal Gasification Plant) for reduction process and has facilities for discharging Hot DRI as well as Cold DRI.
c) Plate Mill: Your Company has one of the widest plate mill (5mtrs. wide) plants with 1.2 MTPA capacity. This plate mill has various certification for different grades of Plates for sectors
such as Defense, Wind Mill, Ship Building, Sour Application Pipe Lines, Yellow Goods etc. Plate mill has successfully developed number of different special grade plates. There are very few manufacturers available in the world who can produce similar kind of grade plates.
These plants are supported by 810MW Captive Power Plant (6x135 MW), Air Separation Unit (2x1200 TPD), Lime Dolomite Plant (2x500 TPD), Coal Washery (6 MTPA) and Process Boilers (3x1800 TPH).
Steel Plant at Angul, Odisha -Phase lBYour Company is expanding the steel plant (Phase IB) at Angul at brisk pace from the present 1.5 MTPA to 6 MTPA through the conventional integrated steel plant route i.e Coke Oven and by product plant, sinter plant, blast furnace, steel melting shop - II, bar mill and other allied units.
Following operational facilities under Phase – IB were commissioned during the FY 2016-17:a) Bar Mill: State of the art 1.4 Million Ton per annum Bar Mill
with Integrated Hot Charging Billet arrangement which can produce Rebar’s from 8mm to 40 mm. It was commissioned on July 9, 2016.
b) Coke Oven: 1st Battery of 2 MTPA Coke Oven was commissioned on February 16, 2017 and being set up with latest technology supplied by Sinosteel Equipment & Engineering Co. Ltd., China. The technology is suitable of handling Coal blend VM up-to 29-30% and maximum Sulphur of 1.2%. This will help in reducing the cost of Blend and provide us with wider options for coal sourcing.
Also, India’s biggest Blast Furnace (4554 M3) along with Sinter Plant and 2nd Coke Oven Battery Plant have been commissioned in May, 2017.
Your Company is in advance stage of completion for our BOF Plant and expected to be completed in September, 2018.
Steel Plant at Raigarh, ChhattisgarhTo enhance the plant’s productivity and output, your Company has completed the following new project in Raigarh during the financial year under review:
Rail Head Hardening project for producing rail of high speed application and metro rails and for export market . The technology has been supplied by SMS Meer of Germany.
24 | Jindal Steel & Power Limited Annual Report 2016-17
Machinery Division at Raipur, ChhattisgarhYour Company has implemented following facilities during the financial year under review:
1. Installed shield (steel door) to safeguard the welding process at time of production in Process Equipment Division .
2. Installed new 90 degree attachment for Sanco Machine in Machine Shop to cater to burgeoning requirements of Machinery Equipment Division customers.
3. Sewage Treatment plant (of capacity 500 KLD) has been installed at Machinery Division, Raipur. The treated water is utilized for Green belt development in and around the unit.
4. Enhanced capability of Quality Lab by procuring equipment such as 360 degree Laser Machine.
5. Enhanced capability of Paint Shop by procuring equipment to carry out Salt contamination test and Dolly test.
Shadeed Iron & Steel, OmanRolling Mill: Jindal Shadeed Iron & Steel LLC, Oman, a Subsidiary Company, has started commercial production of the world’s largest and most modern state-of-the-art 1.4 MTPA Rebar Mill from May 1, 2016 to supply finished steels, the first time in its five-year-history with the imminent production of Rebar’s for the construction industry to cater mainly to domestic and middle east countries.
Highlights: Total production of Steel Melting Shop (SMS) increased from
10.54 lakh tons in FY 2015-16 to 13.26 lakh tons in FY 2016-17;
Production of value added grade rounds increased from 0.83 lakh tons in FY 2015-16 to 1.43 lakh in FY 2016-17;
Highest monthly production in SMS was recorded in March 2017 at 143,831 tons whereas highest monthly production till end of FY 2015-16 was 126,311 tons;
Rejection in SMS reduced from 0.93% in FY 2015-16 to 0.54% in FY 2016-17;
Rebar mill started commercial production in April 2016 and total production was 4.54 lakh tons in FY 2016-17;
Rebar mill has received product certification from Cares U.K., Dubai Commercial Laboratories (DCL), SASO and BIS which enables rebar product to qualify for prestigious projects and command premium in the market;
Highest monthly production in Rebar mill was recorded in March, 17 at 71,302 ton. Jindal Shadeed has established itself as Oman's largest rebar producer and seller in Q4 FY 2016-17;
DRI Production decreased slightly from 15.09 lakh tons in FY 2015-16 to 14.39 lakh tons in FY 2016-17. This was due to sharing of allocated natural gas quota with Rebar mill;
Cut & Bend Plant of 3,000 tons per month capacity commissioned in February 2017.
Patratu, Jharkhand Successfully completed “Railway Overhead Electrification
Project” from Bhurkunda to Plant premises resulting in reduction by 8 Hours during inward rake movement;
PGP plant fully completed (automation and balance erection jobs). All the 10 asifiers successfully commissioned and both mill furnaces are successfully fed by Producer Gas.
WRM furnace maintenance carried out in 28 days against a plan of 35 days with in-house fabrication of skids and posts. Modification of burners for feeding producer gas also completed during the same period.
Coil straightening and cutting machine installed in rebar service centre which resulted in increase in production by 200%.
PROJECTS UNDER IMPLEMENTATIONSteel Plant at Raigarh, ChhattisgarhYour Company has the following projects under implementation with a view to increase the efficiency of steel plants at Raigarh:
1. Installation of new reheating furnace in Rail and Universal Beam Mill to increase the output. The furnace shall be using Blast Furnace gas to reduce the fuel cost.
2. Upgradation of Rail Finishing Facility at RUBM for Capacity and dispatch Enhancement.
Machinery Division at Raipur, ChhattisgarhIn order to enhance the capacity and productivity of the division, your Company has planned the following additional equipment/ facilities:
Plate Bending Machine for Higher Thickness bending of plates upto 90 mm (Thk) & 3100 mm (Wid)
DIVIDENDThe Board of Directors of your Company had approved the Dividend Distribution Policy in line with the Securities and Exchange Board of India (Listing Obligations and Disclosure Requirements) Regulations, 2015. The Policy is uploaded on the Company’s website at http://www.jindalsteelpower.com.
The Board of Directors of your Company has not recommended any Dividend during the year in view of losses.
The unclaimed dividend of ` 93,57,733/- (Rupees Ninety Three Lakh Fifty Seven Thousand Seven Hundred and Thirty Three Only)
| 25Statutory Reports Board’s Report
pertaining to the Financial Year 2008-09, has been transferred to the Investor Education and Protection Fund, (IEPF), Government of India. The details including last date for claiming of unclaimed / unpaid dividend amount are given at the end of the Notice of the Annual General Meeting.
CREDIT RATINGYour Company’s domestic credit rating is “D” for the long-term debt/facilities/non-convertible debentures, short term debt/facilities including working capital facilities rated by Credit Analysis & Research Ltd. (CARE), CRISIL and ICRA Limited.
CONSOLIDATED FINANCIAL STATEMENTSThe Consolidated Financial Statements of your Company for the Financial Year 2016-17, is prepared in compliance with the applicable provisions of the Companies Act, 2013, Indian Accounting Standards (Ind AS) and SEBI (LODR) Regulations, 2015.
SHARE CAPITALThe Authorised Share Capital of the Company is ` 200,00,00,000/- (Rupees Two Hundred Crore only) divided into 200,00,00,000 (Two Hundred Crore) equity shares of ` 1/- (Rupee One) each.
As the Company is exploring various possibilities of raising funds including issuance of capital through various means and modes, the Board of Directors of your Company has recommended to increase the Authorised Share Capital from ` 200,00,00,000/- (Rupees Two Hundred Crore only) divided into 200,00,00,000 (Two Hundred Crore) equity shares of ` 1/-(Rupee One) each to ` 300,00,00,000 (Rupees Three Hundred Crore only) comprising 200,00,00,000 (Two Hundred Crore) equity shares of ` 1/-(Rupee One) each and 1,00,00,000 (One Crore) Preference Shares of ` 100/- (Rupees One Hundred) each.
Necessary resolutions in this regard have been included in the notice convening the ensuing Annual General Meeting of the Company.
During the year the paid up share capital of the Company has increased from ` 91,49,03,800/- (Rupees Ninety One Crore Forty Nine Lakh Three Thousand and Eight Hundred only) comprising of 91,49,03,800 (Ninety One Crore Forty Nine Lakh Three Thousand and Eight Hundred) equity shares of ` 1/- (Rupee One) each to ` 91,50,24,234/- (Rupees Ninety One Crore Fifty Lakh Twenty Four Thousand Two Hundred and Thirty Four only) comprising of 91,50,24,234 (Ninety One Crore Fifty Lakh Twenty Four Thousand Two Hundred and Thirty Four) equity shares of ` 1/- (Rupee One) each.
Your Company has an Employee Share purchase Scheme namely JSPL ESPS 2013. Relevant disclosures pursuant to Securities and Exchange Board of India (Share Based Employee Benefits) Regulation, 2014 are given as Annexure – A to this report.
NON-CONVERTIBLE DEBENTURESThe aggregate outstanding amount of Non-Convertible Debentures (NCDs) of the Company as on March 31, 2017 was ` 3612 crore.
During the year under review, NCDs amounting to ` 300 crore have been redeemed and paid on due date. There are delays in servicing the interest on ncds The Company had paid all the dues including interest on the NCDs during the financial year 2016-17. Necessary disclosures in this connection under SEBI (LODR) Regulations, 2015 have been made to the Stock Exchanges where the shares of the Company are listed.
DEPOSITSThe Company has not accepted/received any deposits during the year under report falling within the ambit of Section 73 of the Companies Act, 2013 and the Companies (Acceptance of Deposits) Rules, 2014.
RELATED PARTY TRANSACTIONSIn terms of Section 188 of the Companies Act, 2013 read with rules framed thereunder and Regulation 23 of SEBI (LODR) Regulations, 2015 your Company has a Related Party Policy in dealing with related party transactions. The policy may be accessed under corporate governance section on the website at the following link: http://www.jindalsteelpower.com/img/admin/report/pdf/RPT_Policy.pdf
Particulars of Contracts or arrangements entered into by the Company with the related parties referred to in Section 188(1) of the Companies Act, 2013 read with Regulation 23 of SEBI (LODR) Regulations, 2015, in prescribed Form AOC - 2 is attached herewith as Annexure - B.
All the related party transactions that were entered and executed during the year under review were on arm’s length basis and in the ordinary course of business and within the permissible framework of Section 188 of the Companies Act, 2013, and Rules made thereunder read with Regulation 23 of SEBI (LODR) Regulations, 2015.
PARTICULARS OF LOANS, GUARANTEES OR INVESTMENTS Details of Loans, Guarantees, Securities and Investments covered under the provisions of Section 186 of the Companies Act, 2013 are given in the Notes to the Financial Statements.
SUBSIDIARIES, ASSOCIATES AND JOINT VENTURESYour Company follows its global ambition to build a premium brand name for its quality steel solutions, expertise and with a view of expansion and diversification; it has created multiple subsidiaries, domestic and abroad, associates and joint ventures for facilitating these operations in various countries.
A separate statement containing salient features of Financial Statements of Subsidiaries, Associates and Joint Ventures of your Company forms part of the Consolidated Financial Statements in terms of Section 129 of the Companies Act, 2013.
Name of the Companies which have become or ceased to be its subsidiaries, joint ventures or associate companies have been mentioned in the notes to the accounts.
26 | Jindal Steel & Power Limited Annual Report 2016-17
The Financial Statements of Subsidiary Companies are kept open for inspection by the shareholders at the Registered Office of your Company during business hours on all days except Saturdays, Sundays and public holidays upto the date of the Annual General Meeting (AGM) as required under Section 136 of the Companies Act, 2013. Any member desirous of obtaining a copy of the said financial statements may write to the Company at its Registered Office or Corporate Office. The �inancial �tatements including the consolidated �inancial �tatements and all other documents required to be attached to this report have been uploaded on the website of your Company viz. www.jindalsteelpower.com
Your Company has framed a policy for determining “Material Subsidiary” in terms of Regulation 16(c) of SEBI (Listing Obligations and Disclosure Requirements) Regulations, 2015. The policy on Material Subsidiary has been uploaded on the Company’s website at the following link:
http://www.jindalsteelpower.com/img/admin/report/pdf/Policy_on_determining_material_subsidiary.pdf
The details of business operations / performance of major subsidiaries are as below:
JINDAL POWER LIMITEDJindal Power Limited, a subsidiary company (JPL) is operating 3,400 MW power plant at Tamnar, Chhattisgarh.
During the year under review :- 1000 MW (4x250 MW) power plant generated 4,483 million
units of power representing 51.17% Plant Load Factor (PLF) as against 5,169 million units of power representing 58.85% PLF in the previous year.
- 600 MW of the 2,400 MW (4X600 MW) thermal power plant generated 4694 million units of power in FY 2016-17.
Jindal Power Limited (JPL) 258 km, 400 kV double-circuit transmission line is being used as an interstate transmission line belonging to the Western Region Interstate Transmission System. The Central Electricity Regulatory Commission (CERC) has granted a transmission license to the Company for carrying on business activity and has fixed provisional tariff for its use. During the year under review, JPL has earned transmission income of ` 45.44 crore from this line.
Total revenue of JPL during the year under review was ` 3,516.27 crore and the loss after tax was ` 667.84 crore.
SHADEED IRON & STEEL LLC, OMANShadeed, Iron & Steel LLC, Oman, a subsidiary of Jindal Steel & Power Ltd., is operating 1.5 MTPA Brigutted Iron plant and Steel Melt Shop. It has recorded sales of ` 3,487.50 crore in the Financial Year 2016-17 and earned a profit after tax of ` 191.57 crore.
JINDAL MINING SA (PTY) LIMITED, SOUTH AFRICAThe operating coal mine, recorded sales of ` 202.75 crore in Financial Year 2016-17 and incurred a loss of ` 13.75 crore.
JSPL MOZAMBIQUE MINERALS LDA, MOZAMBIQUEThe operating coal mine, recorded sales of ` 129.84 crore in Financial Year 2016-17 and incurred a loss of ` 2.45 crore.
WOLLONGONG COAL LIMITED (FORMERLY GUJARAT NRE COKING COAL AUSTRALIA LIMITED)The operating coal mine recorded sales of ̀ 181.44 crore in Financial Year 2016-17 and incurred a loss of ` 290.46 crore.
With a view to ensure availability of coal and other raw materials, the Company has, through its other subsidiaries, acquired exploration / mining interests in Botswana, Indonesia, Madagascar, Namibia, Liberia, Mauritania, Zambia and Tanzania.
DIRECTORS AND KEY MANAGERIAL PERSONNELAPPOINTMENT/RE- APPOINTMENTDirectorsThe Board of Directors of your Company co-opted:i. Mr. Deepak Sood (DIN: 02331191) as Nominee Director of
IDBI Bank Limited w.e.f. December 8, 2016.
ii. Mr. Anjan Barua, (DIN: 01191502) as a Nominee Director of State Bank of India w.e.f. February 14, 2017
iii. Dr. Amar Singh (DIN: 07800513) as an Additional Director in the category of Independent Director w.e.f. April 25, 2017
iv. Mr. Kuldip Chander Sood (DIN: 01148992) as an Additional Director in the category of Independent Director w.e.f. April 25, 2017
Wholetime DirectorsOn the recommendation of the Nomination & Remuneration Committee and in terms of Sections 196, 197, 198 and 203 read with Schedule V and all other applicable provisions of the Companies Act, 2013 and the Companies (Appointment and Remuneration of Managerial Personnel) Rules, 2014, the Board of Directors of your Company recommends the re-appointment of :
i. Mr. Naveen Jindal (DIN: 0001523) as Wholetime Director, designated as Chairman of the Company, for a period of 3 (three) years w.e.f. October 1, 2017.
ii. Mr. Rajeev Rupendra Bhadauria (DIN 00376562) as Wholetime Director of the Company for a period of 3 (three) years w.e.f., May 27, 2018.
iii. Mr. Dinesh Kumar Saraogi (DIN 06426609) as Wholetime Director of the Company for a period of 3 (three) years w.e.f., November 9, 2017.
| 27Statutory Reports Board’s Report
Retirement by RotationIn accordance with the provisions of Section 152 of the Companies Act, 2013 and in terms of the Articles of Association of the Company, Mr. Naveen Jindal and Mr. Rajeev Rupendra Bhadauria are retiring by rotation at the ensuing Annual General Meeting and being eligible, seek re-appointment.
Necessary Resolutions in respect of the appointment of Directors mentioned above are included in the Notice convening the ensuing Annual General Meeting. Your Board recommends the appointment/re-appointment of Mr. Naveen Jindal, Mr. Rajeev Rupendra Bhadauria, Mr. Dinesh Kumar Saraogi, Mr. Kuldip Chander Sood, Dr. Amar Singh, Mr. Deepak sood and Mr. Anjan Barua. The particulars in respect of these Directors as required under Regulations 36(3) of SEBI (LODR) Regulations 2015, are mentioned elsewhere in the Notice of Annual General Meeting.
RESIGNATIONS Directorsi. Mr. Chandan Roy and Mr. Haigreve Khaitan resigned from the
position of Independent Directors of the Company w.e.f. June, 7, 2016 and December 7, 2016 respectively.
ii. Mr. Shalil Mukund Awale, Nominee Director of IDBI Bank Ltd., resigned from the Board of the Company w.e.f December 8, 2016 consequent to withdrawal of his nomination from IDBI Bank Limited.
Key Managerial PersonnelDuring the period under review:i. Mr. Murli Manohar Purohit was appointed as Company
Secretary & Compliance Officer of the Company w.e.f. October 10, 2016 to fill the vacancy caused by the resignation of the Company Secretary appointed earlier. He subsequently resigned from the Company w.e.f. May 31, 2017.
ii. Mr. Kannabiran Rajagopal, resigned from the position of Group Chief Financial Officer of the Company w.e.f. November 21, 2016. Mr. Rajesh Bhatia, who was appointed in his place as the Chief Financial Officer of the Company resigned from the Company w.e.f. June 27, 2017.
Your Directors would like to record their deep sense of appreciation for the contributions made by the above Directors and Key Managerial Personnels during their respective tenures.
MEETINGS OF THE BOARD AND COMMITTEES The Board of Directors met 10 (ten) times during the period under review. The details of number of Meetings of the Board and various Committees of your Company are set out in the Corporate Governance Report which forms part of this report. The intervening gap between the meetings was within the period prescribed
under the Companies Act, 2013, the SEBI (Listing Obligations and Disclosure Requirements) Regulations, 2015 and Secretarial Standards on Meeting of the Board of Directors as issued by The Institute of Company Secretaries of India.
REMUNERATION POLICYIn accordance with the provisions of Section 178 of the Companies Act, 2013 and Part D of Schedule II of SEBI (LODR) Regulations, 2015, the policy on Nomination and Remuneration of Directors, KMPs and Senior Management of your Company is uploaded on the website at the following link:
http://www.jindalsteelpower.com/img/admin/report/pdf/Remuneration_Policy.pdf
PARTICULARS OF EMPLOYEES RELATED DISCLOSURESDetails as required under Section 197(2) read with Rule 5(2) of the Companies (Appointment and Remuneration of Managerial Personnel) Rules, 2014 and the statement showing the name of the employees drawing remuneration in excess of the limits set out in Section 197(12) of the Companies Act, 2013 read with Rule 5(2) of the Companies (Appointment and Remuneration of Managerial Personnel) Rules, 2014 is annexed as Annexure-C.
Members and other entitled persons who have not registered their email address with the Company may access the full version of the Annual Report of the Company or by physically inspecting the full version of the Annual Report at the Registered office and at the Corporate office of the Company on all working days of the Company between 10.00 a.m. to 1.00 p.m. or by requesting a physical copy by writing to the Company Secretary.
STATUTORY AUDITORS M/s Lodha & Co., Chartered Accountants (ICAI Firm Registration No. 301051E), New Delhi, were appointed as the Statutory Auditors at previous Annual General Meeting (AGM) for a period of 5 years from the conclusion of 37th Annual General Meeting till 42nd Annual General Meeting of the Company, subject to ratification at each Annual General Meeting by the shareholders of the Company.
In terms of the first proviso to Section 139 of the Companies Act, 2013, appointment of M/s Lodha & Co., Chartered Accountants, as the Statutory Auditors of the Company, is recommended for ratification at the ensuing AGM.
Explanations on qualification, reservation or adverse remark by Statutory Auditors
A) During the financial year 2014-15, the Hon’ ble Supreme Court vide its judgement dated August 25, 2014 read with its order dated September 24, 2014 had cancelled the allocation of certain Coal Blocks, which were allotted from year 1993
28 | Jindal Steel & Power Limited Annual Report 2016-17
onwards through Screening Committee. The Supreme Court also directed the Coal block allottees to pay an additional levy of ` 295 per MT on the coal extracted from the operational mines. The review petition filed by the Company and its subsidiary company JPL before the Hon’ble Supreme Court of India against the order challenging cancellation of coal blocks and imposing additional levy of ̀ 295 per MT on coal extracted with retrospective effect, is still pending.
In the meanwhile, the Company has paid ` 3,267.43 crore (including ` 1,185.20 crore paid by its subsidiary company JPL) under protest on the Run of Mine coal extracted from the operational mines from the commencement of coal mining in the year 1993 to September 30, 2014. Out of the said amount, on the basis of the legal advice obtained by the Company that additional levy of ` 295 per MT is payable only on coal extracted and is not payable on shale, rejects and ungraded middlings, an amount of ̀ 1,911.64 crore (including ̀ 1,103.87 crore related to its subsidiary company JPL) computed on coal extracted excluding shale, rejects and ungraded middling has been shown as an exceptional item in the Statement of Profit and Loss. The balance amount of ` 1,355.79 crore (including ` 81.33 crore related to its subsidiary company JPL) being additional levy of ` 295 per MT on shale, rejects and ungraded middlings has, accordingly, been shown as recoverable. On the same principle, the Company has accrued additional levy of ` 178.18 crore (including ̀ 85.78 crore payable by its subsidiary company JPL) based on coal extracted excluding shale, rejects and ungraded middling from October 1, 2014 to June 30, 2015.
The Board of the Company, based on the legal advice, is sanguine of obtaining appropriate relief in respect of the same.
B) The Board is of the view that as of now there is no requirement for adjustment to the carrying value of investment made in mining assets by the company and difference, if any shall be accounted for when the matter is finally settled.
SECRETARIAL AUDITORSM/s RSMV & Co., Company Secretaries, New Delhi (CP No. 11571) were appointed to conduct the Secretarial Audit of the Company as required under Section 204 of the Companies Act, 2013 and Rules thereunder. The Secretarial �udit Report i.e. MR-3 forms part of the Annual Report as Annexure-D to the Board’s Report.
Observation of Secretarial Auditors on composition of Board is explained elsewhere in the report.
COST AUDITORS M/s Ramanath Iyer & Co., (FRN 00019), Cost Accountants, were appointed as Cost Auditors of the Company for auditing the cost records of the Company for the Financial Year 2017-18.
The Cost Audit Report for the Financial Year ended March 31, 2016 of the Company was filed on September 7, 2016.
In terms of Section 148 of the Companies Act, 2013 read with the Companies (Audit and Auditors) Rules, 2014, appropriate resolution seeking ratification of the remuneration of M/s Ramanath Iyer & Co., (FRN 00019), Cost Accountants, approved by the Board, is included in the Notice convening the 38th AGM of the Company.
RISK MANAGEMENTThe Company has in place a robust risk management framework which identifies and evaluates business risks and opportunities. The Company recognizes that these risks need to be managed and mitigated to protect the interest of the shareholders and stakeholders, to achieve business objectives and enable sustainable growth. The risk management framework is aimed at effectively mitigating the Company’s various business and operational risks, through strategic actions. Risk management is embedded in our critical business activities, functions and processes. The risks are reviewed for the change in the nature and extent of the major risks identified since the last assessment. It also provides control measures for risk and future action plans.
The Company has a Risk Management Committee of the Board, which looks after the identification of risks and their mitigation planning. More details about this Committee and its role and responsibilities are given in the Corporate Governance Report.
INTERNAL FINANCIAL CONTROLSThe Company has in place adequate Internal Financial Controls with reference to financial statements and such internal financial controls are operating effectively. Your Company has adopted policies and procedures for ensuring the orderly and efficient conduct of its business, including adherence to the Company’s policies, the safeguarding of its assets, prevention and detection of frauds and errors, accuracy and completeness of the accounting records, and timely preparation of reliable financial disclosures.
CORPORATE SOCIAL RESPONSIBILITY (CSR) As per the provisions of Section 135 of the Act, the Company has constituted a committee to formulate, implement and monitor the CSR Policy of the Company.
The Annual Report on the Corporate Social Responsibility (CSR) activities for the Financial Year 2016-17 as required under Section
| 29Statutory Reports Board’s Report
134 and 135 of the Companies Act, 2013 read with Rule 8 of the Companies (Corporate Social Responsibility Policy) Rules, 2014 and Rule 9 of the Companies (Accounts) Rules, 2014 is attached to this Report as Annexure-E.
SIGNIFICANT AND MATERIAL ORDERS PASSED BY THE REGULATORS OR COURTS There are no significant material orders passed by the Regulators/Courts which would impact the going concern status of the Company and its future operation during the year under review except the following:
De-Allocation of Coal Blocks:Following the petition in M L Sharma vs The Principal Secretary & Ors and subsequent other Writs, the Hon’ble Supreme Court vide its judgment dated August 25, 2014 read with its order dated September 24, 2014 had cancelled the allocation of Coal Blocks allotted from 1993 onwards through Screening Committee Route.
Subsequently, the Company’s subsidiary, Jindal Power Limited (JPL), despite having made winning bids during the auction of Gare Palma IV/2 and IV/3 Coal Mine in February, 2015, was not declared a successful bidder by the office of Nominated Authority. This was challenged by JPL before Hon’ble Delhi High Court, which decided the matter on March 9, 2017 and the proceedings arising from the same are presently sub-judice before the Hon’ble Supreme Court.
However, since de-allocation of Coal Blocks, the Company is fully geared and catering to its coal requirements through coal linkage, e-auctions etc. Further, the Company also intends to participate in future Coal Block Auctions.
DIRECTORS’ RESPONSIBILITY STATEMENTPursuant to Section 134(3) (c) of the Companies Act, 2013, the Directors state:
(a) that in the preparation of the annual accounts for the year ended March 31, 2017, the applicable accounting standards and Schedule III to the Companies Act, 2013, have been followed and there are no material departures from the same;
(b) that the Directors have selected such accounting policies and applied them consistently and made judgments and estimates that are reasonable and prudent so as to give a true and fair view of the state of affairs of your Company as at March 31, 2017 and of the loss of the Company for the year ended on that date;
(c) that proper and sufficient care has been taken for the maintenance of adequate accounting records in accordance with the provisions of Companies Act, 2013 for safeguarding the assets of your Company and for preventing and detecting fraud and other irregularities;
(d) that the annual accounts have been prepared on a going concern basis;
(e) that proper internal financial controls laid down by the Directors were followed by the Company and that such internal financial controls are adequate and were operating effectively; and
(f) that proper systems to ensure compliance with the provisions of all applicable laws were in place and that such systems were adequate and operating effectively.
OTHER INFORMATIONBusiness Responsibility Report As stipulated under the SEBI (Listing Obligations and Disclosure Requirements) Regulations, 2015, the Business Responsibility Report describing the initiatives taken by the Company from environmental, social and governance perspective is attached as part of the Annual Report.
Management Discussion and Analysis ReportManagement Discussion and Analysis Report for the year under review, as stipulated under SEBI (Listing Obligations and Disclosure Requirements) Regulations, 2015, is annexed herewith as Annexure – F to this Report.
Conservation of Energy, Technology Absorption and Foreign Exchange Earnings and OutgoThe information on conservation of energy, technology absorption and foreign exchange earnings and outgo as stipulated under Section 134(3) (m) read with Rule 8 of the Companies (Accounts) Rules, 2014 is annexed herewith as Annexure - G to this Report.
Certificate on Corporate GovernanceThe Company is committed to maintain the highest standards of Corporate Governance and adhere to the Corporate Governance requirements set out by Securities and Exchange Board of India. The Company has also implemented several best corporate governance practices as prevalent globally. The report on Corporate Governance as stipulated under the SEBI (Listing Obligations and Disclosure Requirements) Regulations, 2015 forms an integral part of this Report. The requisite certificate issued by M/s RSMV & Co., Company Secretaries in Practice confirming compliance with the conditions of Corporate Governance is annexed with Corporate Governance Report as Annexure - I.
Whistle Blower and Vigil MechanismYour Company has formulated a vigil mechanism to deal with instances of unethical behaviour, actual or suspected, fraud or violation of Company’s code of conduct or ethics policy. The details of policy is explained in Corporate Governance Report and also uploaded on Company’s website at the following link: http://www.jindalsteelpower.com/img/admin/report/pdf/whistle.pdf
30 | Jindal Steel & Power Limited Annual Report 2016-17
Prevention of Sexual Harassment at WorkplaceAs per the requirement of the Sexual Harassment of Women at Workplace (Prevention, Prohibition and Redressal) Act, 2013 and the Rules made thereunder, your Company has constituted Internal Complaints Committee having designated independent member(s) to redress complaints regarding sexual harassment. During the year, no complaint regarding Sexual Harassment has been reported.
Extract of the Annual ReturnThe details forming part of the extract of the Annual Return in Form No. MGT – 9 in accordance with the provisions of Section 92 of the Companies Act, 2013 read with the Companies (Management and Administration) Rules, 2014, are set out herewith as Annexure-H to this Report.
Cautionary StatementStatements in the Board’s Report and the Management Discussion & Analysis describing the Company’s objectives, expectations or forecasts may be forward looking within the meaning of applicable Securities Laws and Regulations. Actual results may differ materially from those expressed in the statement. Important factors that could influence the Company’s operations include global and
domestic demand and supply conditions affecting selling prices of finished goods, input availability and prices, changes in Government Regulations, Tax �aws, Economic Developments within the country and other factors such as litigation and industrial relations.
AcknowledgementsThe Directors wish to place on record their appreciation for the sincere services rendered by employees of the Company at all levels. Your Directors also wish to place on record their appreciation for the valuable co-operation and support received from the Government of India, various State Governments, the Banks/ Financial Institutions and other stakeholders such as, shareholders, customers and suppliers, among others. The Directors also commend the continuing commitment and dedication of the employees at all levels, which has been critical for the Company’s success. The Directors look forward to their continued support in future.
For and on behalf of the Board of Directors
Naveen Jindal Place: New Delhi ChairmanDated: August 8, 2017 DIN: 00001523
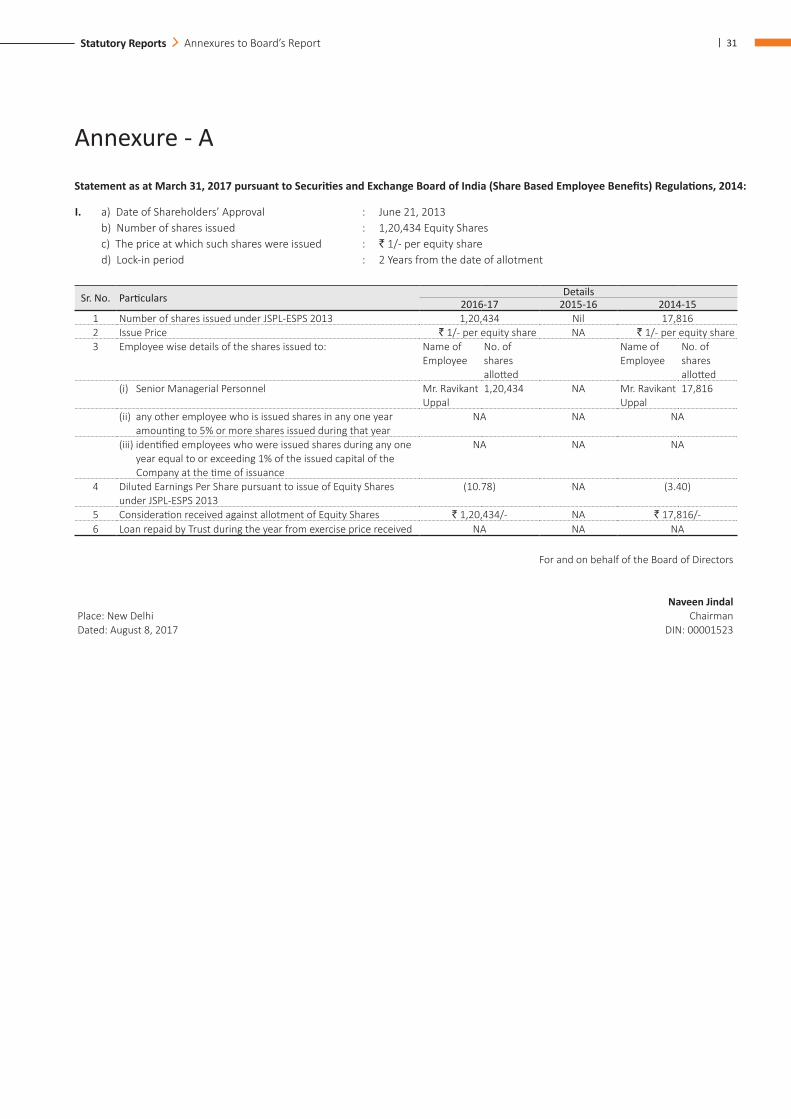
| 31Statutory Reports Annexures to Board’s Report
Annexure - A
Statement as at March 31, 2017 pursuant to Securities and Exchange Board of India (Share Based Employee Benefits) Regulations, 2014:
I. a) Date of Shareholders’ Approval : June 21, 2013 b) Number of shares issued : 1,20,434 Equity Shares c) The price at which such shares were issued : ` 1/- per equity share d) Lock-in period : 2 Years from the date of allotment
Sr. No. Particulars Details2016-17 2015-16 2014-15
1 Number of shares issued under JSPL-ESPS 2013 1,20,434 Nil 17,8162 Issue Price ` 1/- per equity share NA ` 1/- per equity share3 Employee wise details of the shares issued to: Name of
EmployeeNo. of shares allotted
Name of Employee
No. of shares allotted
(i) Senior Managerial Personnel Mr. Ravikant Uppal
1,20,434 NA Mr. Ravikant Uppal
17,816
(ii) any other employee who is issued shares in any one year amounting to 5% or more shares issued during that year
NA NA NA
(iii) identified employees who were issued shares during any one year equal to or exceeding 1% of the issued capital of the Company at the time of issuance
NA NA NA
4 Diluted Earnings Per Share pursuant to issue of Equity Shares under JSPL-ESPS 2013
(10.78) NA (3.40)
5 Consideration received against allotment of Equity Shares ` 1,20,434/- NA ` 17,816/-6 Loan repaid by Trust during the year from exercise price received NA NA NA
For and on behalf of the Board of Directors
Naveen Jindal Place: New Delhi ChairmanDated: August 8, 2017 DIN: 00001523
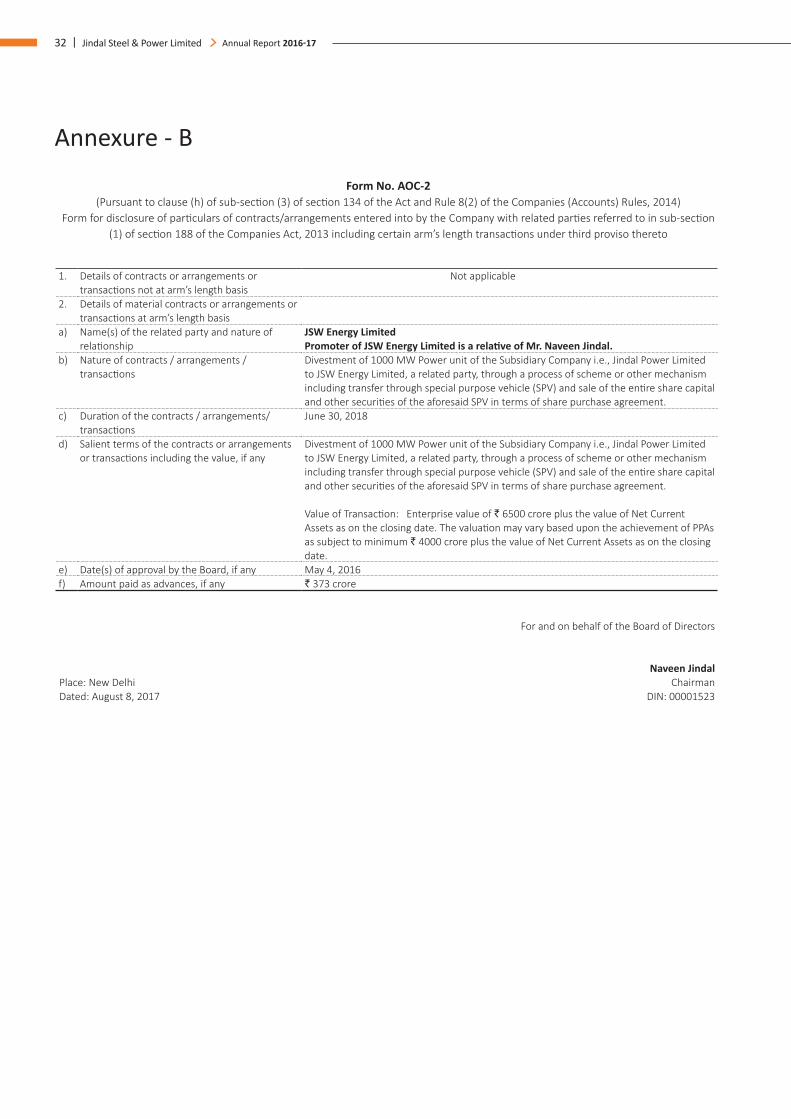
32 | Jindal Steel & Power Limited Annual Report 2016-17
Annexure - B
Form No. AOC-2(Pursuant to clause (h) of sub-section (3) of section 134 of the Act and Rule 8(2) of the Companies (Accounts) Rules, 2014)
Form for disclosure of particulars of contracts/arrangements entered into by the Company with related parties referred to in sub-section (1) of section 188 of the Companies Act, 2013 including certain arm’s length transactions under third proviso thereto
1. Details of contracts or arrangements or
transactions not at arm’s length basis Not applicable
2. Details of material contracts or arrangements or transactions at arm’s length basis
a) Name(s) of the related party and nature of relationship
JSW Energy Limited Promoter of JSW Energy Limited is a relative of Mr. Naveen Jindal.
b) Nature of contracts / arrangements / transactions
Divestment of 1000 MW Power unit of the Subsidiary Company i.e., Jindal Power Limited to JSW Energy Limited, a related party, through a process of scheme or other mechanism including transfer through special purpose vehicle (SPV) and sale of the entire share capital and other securities of the aforesaid SPV in terms of share purchase agreement.
c) Duration of the contracts / arrangements/transactions
June 30, 2018
d) Salient terms of the contracts or arrangements or transactions including the value, if any
Divestment of 1000 MW Power unit of the Subsidiary Company i.e., Jindal Power Limited to JSW Energy Limited, a related party, through a process of scheme or other mechanism including transfer through special purpose vehicle (SPV) and sale of the entire share capital and other securities of the aforesaid SPV in terms of share purchase agreement.
Value of Transaction: Enterprise value of ` 6500 crore plus the value of Net Current Assets as on the closing date. The valuation may vary based upon the achievement of PPAs as subject to minimum ` 4000 crore plus the value of Net Current Assets as on the closing date.
e) Date(s) of approval by the Board, if any May 4, 2016f) Amount paid as advances, if any ` 373 crore
For and on behalf of the Board of Directors
Naveen Jindal Place: New Delhi ChairmanDated: August 8, 2017 DIN: 00001523
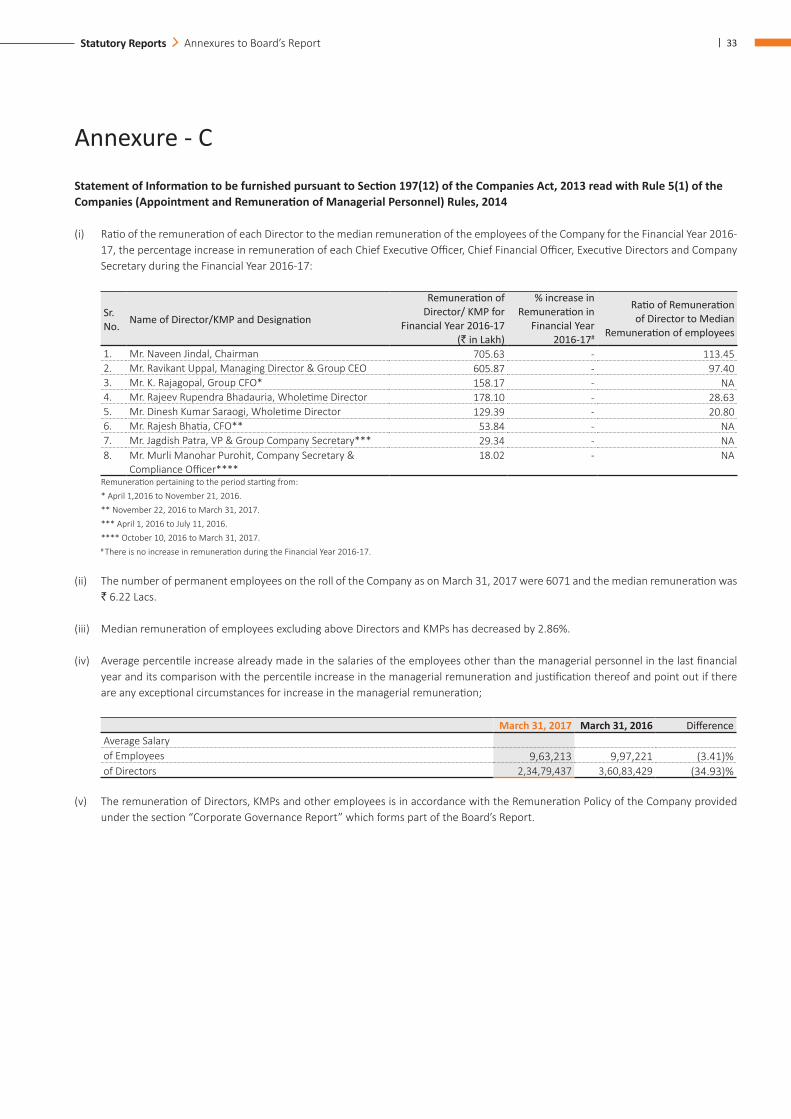
| 33Statutory Reports Annexures to Board’s Report
Annexure - C
Statement of Information to be furnished pursuant to Section 197(12) of the Companies Act, 2013 read with Rule 5(1) of the Companies (Appointment and Remuneration of Managerial Personnel) Rules, 2014
(i) Ratio of the remuneration of each Director to the median remuneration of the employees of the Company for the Financial Year 2016-17, the percentage increase in remuneration of each Chief Executive Officer, Chief Financial Officer, Executive Directors and Company Secretary during the Financial Year 2016-17:
Sr. No. Name of Director/KMP and Designation
Remuneration of Director/ KMP for
Financial Year 2016-17 (` in Lakh)
% increase in Remuneration in
Financial Year 2016-17#
Ratio of Remuneration of Director to Median
Remuneration of employees
1. Mr. Naveen Jindal, Chairman 705.63 - 113.452. Mr. Ravikant Uppal, Managing Director & Group CEO 605.87 - 97.403. Mr. K. Rajagopal, Group CFO* 158.17 - NA4. Mr. Rajeev Rupendra Bhadauria, Wholetime Director 178.10 - 28.635. Mr. Dinesh Kumar Saraogi, Wholetime Director 129.39 - 20.806. Mr. Rajesh Bhatia, CFO** 53.84 - NA7. Mr. Jagdish Patra, VP & Group Company Secretary*** 29.34 - NA8. Mr. Murli Manohar Purohit, Company Secretary &
Compliance Officer**** 18.02 - NA
Remuneration pertaining to the period starting from: * April 1,2016 to November 21, 2016. ** November 22, 2016 to March 31, 2017. *** April 1, 2016 to July 11, 2016. **** October 10, 2016 to March 31, 2017. # There is no increase in remuneration during the Financial Year 2016-17.
(ii) The number of permanent employees on the roll of the Company as on March 31, 2017 were 6071 and the median remuneration was ` 6.22 Lacs.
(iii) Median remuneration of employees excluding above Directors and KMPs has decreased by 2.86%.
(iv) Average percentile increase already made in the salaries of the employees other than the managerial personnel in the last financial year and its comparison with the percentile increase in the managerial remuneration and justification thereof and point out if there are any exceptional circumstances for increase in the managerial remuneration;
March 31, 2017 March 31, 2016 Difference Average Salaryof Employees 9,63,213 9,97,221 (3.41)%of Directors 2,34,79,437 3,60,83,429 (34.93)%
(v) The remuneration of Directors, KMPs and other employees is in accordance with the Remuneration Policy of the Company provided under the section “Corporate Governance Report” which forms part of the Board’s Report.
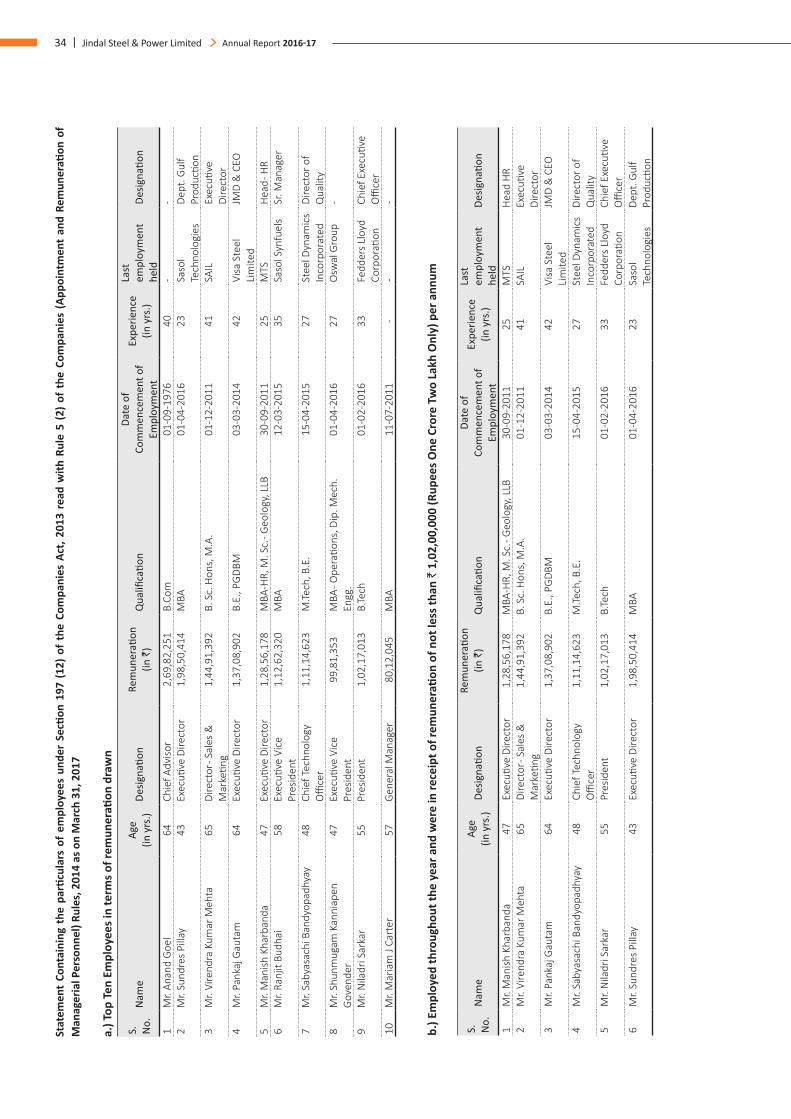
34 | Jindal Steel & Power Limited Annual Report 2016-17St
atem
ent
Cont
aini
ng t
he p
artic
ular
s of
em
ploy
ees
unde
r Se
ction
197
(12
) of
the
Com
pani
es A
ct, 2
013
read
with
Rul
e 5
(2)
of t
he C
ompa
nies
(Ap
poin
tmen
t an
d Re
mun
erati
on o
f M
anag
eria
l Per
sonn
el) R
ules
, 201
4 as
on
Mar
ch 3
1, 2
017
a.) T
op T
en E
mpl
oyee
s in
term
s of r
emun
erati
on d
raw
n
S.
No.
Nam
eAg
e (in
yrs
.)De
signa
tion
Rem
uner
ation
(in
`)
Qua
lifica
tion
Date
of
Com
men
cem
ent o
f Em
ploy
men
t
Expe
rienc
e
(in y
rs.)
Last
em
ploy
men
t he
ldDe
signa
tion
1M
r. An
and
Goe
l64
Chie
f Adv
isor
2,69
,82,
251
B.Co
m01
-09-
1976
40-
-2
Mr.
Sund
res
Pilla
y43
Exec
utive
Dire
ctor
1,98
,50,
414
MBA
01-0
4-20
1623
Saso
l Te
chno
logi
esDe
pt. G
ulf
Prod
uctio
n3
Mr.
Vire
ndra
Kum
ar M
ehta
65Di
rect
or - S
ales
&
Mar
ketin
g1,
44,9
1,39
2B.
Sc.
Hon
s, M
.A.
01-1
2-20
1141
SAIL
Exec
utive
Di
rect
or4
Mr.
Pank
aj G
auta
m64
Exec
utive
Dire
ctor
1,37
,08,
902
B.E.
, PG
DBM
03-0
3-20
1442
Visa
Ste
el
Lim
ited
JMD
& C
EO
5M
r. M
anish
Kha
rban
da47
Exec
utive
Dire
ctor
1,28
,56,
178
MBA
-HR,
M. S
c. - G
eolo
gy, L
LB30
-09-
2011
25M
TSH
ead -
HR
6M
r. Ra
njit
Budh
ai58
Exec
utive
Vic
e Pr
esid
ent
1,12
,62,
320
MBA
12-0
3-20
1535
Saso
l Syn
fuel
sSr
. Man
ager
7M
r. Sa
byas
achi
Ban
dyop
adhy
ay48
Chie
f Tec
hnol
ogy
Offi
cer
1,11
,14,
623
M.Te
ch, B
.E.
15-0
4-20
1527
Stee
l Dyn
amic
s In
corp
orat
edDi
rect
or o
f Q
ualit
y8
Mr.
Shun
mug
am K
anni
apen
G
oven
der
47Ex
ecuti
ve V
ice
Pres
iden
t99
,81,
353
MBA
- Ope
ratio
ns, D
ip. M
ech.
En
gg.
01-0
4-20
1627
Osw
al G
roup
-
9M
r. N
iladr
i Sar
kar
55Pr
esid
ent
1,02
,17,
013
B.Te
ch01
-02-
2016
33Fe
dder
s Ll
oyd
Corp
orati
on
Chie
f Exe
cutiv
e O
ffice
r10
Mr.
Mar
iam
J Ca
rter
57G
ener
al M
anag
er80
,12,
045
MBA
11-0
7-20
11-
- -
b.) E
mpl
oyed
thro
ugho
ut th
e ye
ar a
nd w
ere
in re
ceip
t of r
emun
erati
on o
f not
less
than
` 1
,02,
00,0
00 (R
upee
s One
Cro
re T
wo
Lakh
Onl
y) p
er a
nnum
S.
No.
Nam
eAg
e
(in y
rs.)
Desig
natio
nRe
mun
erati
on
(in `
) Q
ualifi
catio
nDa
te o
f Co
mm
ence
men
t of
Empl
oym
ent
Expe
rienc
e
(in y
rs.)
Last
em
ploy
men
t he
ldDe
signa
tion
1M
r. M
anish
Kha
rban
da47
Exec
utive
Dire
ctor
1,28
,56,
178
MBA
-HR,
M. S
c. - G
eolo
gy, L
LB30
-09-
2011
25M
TSH
ead
HR
2M
r. Vi
rend
ra K
umar
Meh
ta65
Dire
ctor
- Sal
es &
M
arke
ting
1,44
,91,
392
B. S
c. H
ons,
M.A
.01
-12-
2011
41SA
ILEx
ecuti
ve
Dire
ctor
3M
r. Pa
nkaj
Gau
tam
64Ex
ecuti
ve D
irect
or1,
37,0
8,90
2B.
E., P
GDB
M03
-03-
2014
42Vi
sa S
teel
Li
mite
dJM
D &
CEO
4M
r. Sa
byas
achi
Ban
dyop
adhy
ay48
Chie
f Tec
hnol
ogy
Offi
cer
1,11
,14,
623
M.Te
ch, B
.E.
15-0
4-20
1527
Stee
l Dyn
amic
s In
corp
orat
edDi
rect
or o
f Q
ualit
y5
Mr.
Nila
dri S
arka
r55
Pres
iden
t1,
02,1
7,01
3B.
Tech
01-0
2-20
1633
Fedd
ers
Lloy
d Co
rpor
ation
Ch
ief E
xecu
tive
Offi
cer
6M
r. Su
ndre
s Pi
llay
43Ex
ecuti
ve D
irect
or1,
98,5
0,41
4M
BA01
-04-
2016
23Sa
sol
Tech
nolo
gies
Dept
. Gul
f Pr
oduc
tion
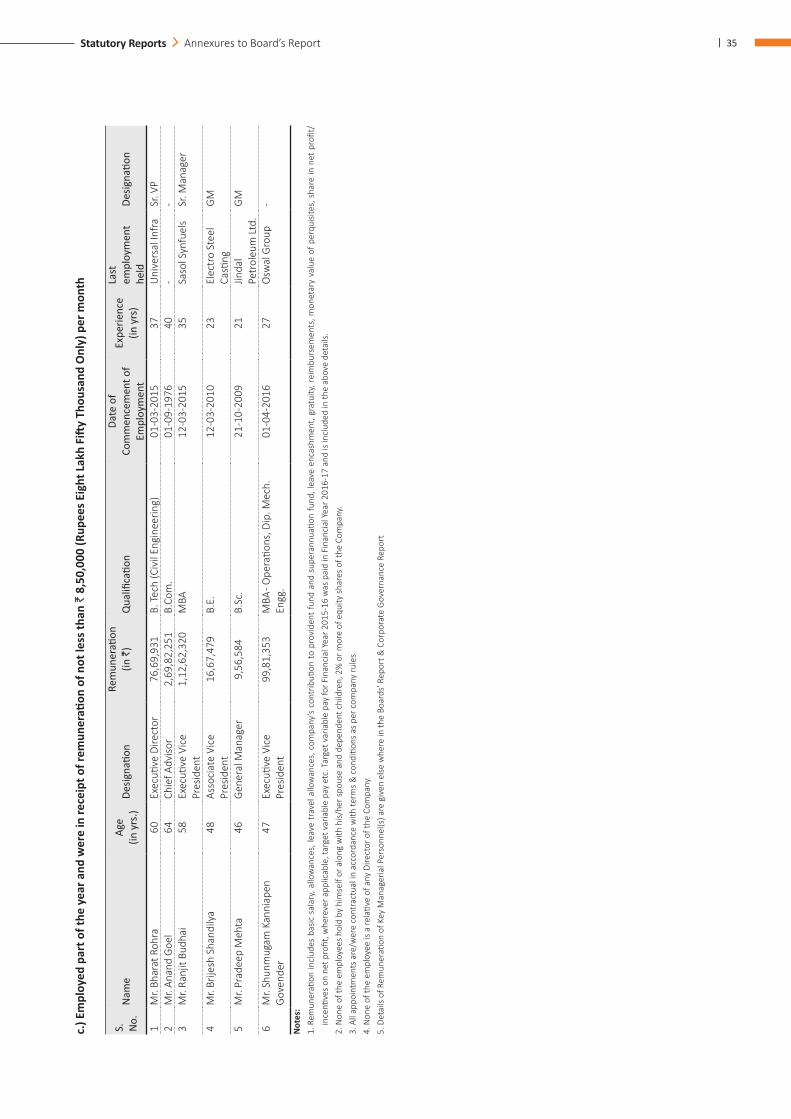
| 35Statutory Reports Annexures to Board’s Report
c.) E
mpl
oyed
par
t of t
he y
ear a
nd w
ere
in re
ceip
t of r
emun
erati
on o
f not
less
than
` 8
,50,
000
(Rup
ees E
ight
Lak
h Fi
fty
Thou
sand
Onl
y) p
er m
onth
S.
No.
Nam
eAg
e (in
yrs
.)De
signa
tion
Rem
uner
ation
(in
`)
Qua
lifica
tion
Date
of
Com
men
cem
ent o
f Em
ploy
men
t
Expe
rienc
e (in
yrs
)
Last
em
ploy
men
t he
ldDe
signa
tion
1M
r. Bh
arat
Roh
ra60
Exec
utive
Dire
ctor
76,6
9,93
1B.
Tec
h (C
ivil
Engi
neer
ing)
01
-03-
2015
37U
nive
rsal
Infr
aSr
. VP
2M
r. An
and
Goe
l64
Chie
f Adv
isor
2,69
,82,
251
B.Co
m.
01-0
9-19
7640
--
3M
r. Ra
njit
Budh
ai58
Exec
utive
Vic
e Pr
esid
ent
1,12
,62,
320
MBA
12-0
3-20
1535
Saso
l Syn
fuel
sSr
. Man
ager
4M
r. Br
ijesh
Sha
ndily
a48
Asso
ciat
e Vi
ce
Pres
iden
t16
,67,
479
B.E.
12-0
3-20
1023
Elec
tro
Stee
l Ca
sting
GM
5M
r. Pr
adee
p M
ehta
46G
ener
al M
anag
er9,
56,5
84B.
Sc.
21-1
0-20
0921
Jinda
l Pe
trol
eum
Ltd
.G
M
6M
r. Sh
unm
ugam
Kan
niap
en
Gov
ende
r47
Exec
utive
Vic
e Pr
esid
ent
99,8
1,35
3M
BA - O
pera
tions
, Dip
. Mec
h.
Engg
.01
-04-
2016
27O
swal
Gro
up-
Not
es:
1. R
emun
erati
on in
clud
es b
asic
sal
ary,
allo
wan
ces,
leav
e tr
avel
allo
wan
ces,
com
pany
’s co
ntrib
ution
to
prov
iden
t fu
nd a
nd s
uper
annu
ation
fund
, lea
ve e
ncas
hmen
t, gr
atui
ty, r
eim
burs
emen
ts, m
onet
ary
valu
e of
per
quisi
tes,
sha
re in
net
pro
fit/
ince
ntive
s on
net
pro
fit, w
here
ver a
pplic
able
, tar
get v
aria
ble
pay
etc.
Tar
get v
aria
ble
pay
for F
inan
cial
Yea
r 201
5-16
was
pai
d in
Fin
anci
al Y
ear 2
016-
17 a
nd is
incl
uded
in th
e ab
ove
deta
ils.
2. N
one
of th
e em
ploy
ees
hold
by
him
self
or a
long
with
his/
her s
pous
e an
d de
pend
ent c
hild
ren,
2%
or m
ore
of e
quity
sha
res
of th
e Co
mpa
ny.
3. A
ll ap
poin
tmen
ts a
re/w
ere
cont
ract
ual i
n ac
cord
ance
with
term
s &
con
ditio
ns a
s pe
r com
pany
rule
s.4.
Non
e of
the
empl
oyee
is a
rela
tive
of a
ny D
irect
or o
f the
Com
pany
.5.
Det
ails
of R
emun
erati
on o
f Key
Man
ager
ial P
erso
nnel
(s) a
re g
iven
else
whe
re in
the
Boar
ds' R
epor
t & C
orpo
rate
Gov
erna
nce
Repo
rt
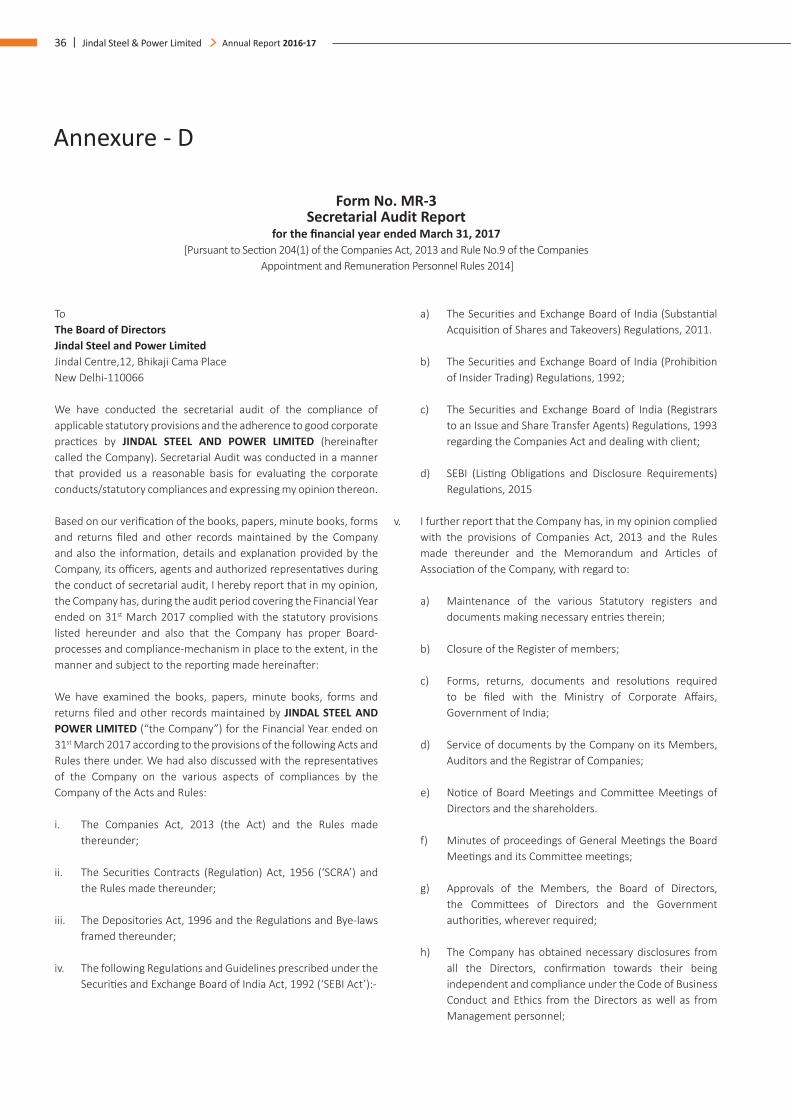
36 | Jindal Steel & Power Limited Annual Report 2016-17
Annexure - D
Form No. MR-3Secretarial Audit Report
for the financial year ended March 31, 2017[Pursuant to Section 204(1) of the Companies Act, 2013 and Rule No.9 of the Companies
Appointment and Remuneration Personnel Rules 2014]
ToThe Board of DirectorsJindal Steel and Power LimitedJindal Centre,12, Bhikaji Cama PlaceNew Delhi-110066
We have conducted the secretarial audit of the compliance of applicable statutory provisions and the adherence to good corporate practices by JINDAL STEEL AND POWER LIMITED (hereinafter called the Company). Secretarial Audit was conducted in a manner that provided us a reasonable basis for evaluating the corporate conducts/statutory compliances and expressing my opinion thereon.
Based on our verification of the books, papers, minute books, forms and returns filed and other records maintained by the Company and also the information, details and explanation provided by the Company, its officers, agents and authorized representatives during the conduct of secretarial audit, I hereby report that in my opinion, the Company has, during the audit period covering the Financial Year ended on 31st March 2017 complied with the statutory provisions listed hereunder and also that the Company has proper Board-processes and compliance-mechanism in place to the extent, in the manner and subject to the reporting made hereinafter:
We have examined the books, papers, minute books, forms and returns filed and other records maintained by JINDAL STEEL AND POWER LIMITED (“the Company”) for the Financial Year ended on 31st March 2017 according to the provisions of the following Acts and Rules there under. We had also discussed with the representatives of the Company on the various aspects of compliances by the Company of the Acts and Rules:
i. The Companies Act, 2013 (the Act) and the Rules made thereunder;
ii. The Securities Contracts (Regulation) Act, 1956 (‘SCRA’) and the Rules made thereunder;
iii. The Depositories Act, 1996 and the Regulations and Bye-laws framed thereunder;
iv. The following Regulations and Guidelines prescribed under the Securities and Exchange Board of India Act, 1992 (‘SEBI Act’):-
a) The Securities and Exchange Board of India (Substantial Acquisition of Shares and Takeovers) Regulations, 2011.
b) The Securities and Exchange Board of India (Prohibition of Insider Trading) Regulations, 1992;
c) The Securities and Exchange Board of India (Registrars to an Issue and Share Transfer Agents) Regulations, 1993 regarding the Companies Act and dealing with client;
d) SEBI (Listing Obligations and Disclosure Requirements) Regulations, 2015
v. I further report that the Company has, in my opinion complied with the provisions of Companies Act, 2013 and the Rules made thereunder and the Memorandum and Articles of Association of the Company, with regard to:
a) Maintenance of the various Statutory registers and documents making necessary entries therein;
b) Closure of the Register of members;
c) Forms, returns, documents and resolutions required to be filed with the Ministry of Corporate Affairs, Government of India;
d) Service of documents by the Company on its Members, Auditors and the Registrar of Companies;
e) Notice of Board Meetings and Committee Meetings of Directors and the shareholders.
f) Minutes of proceedings of General Meetings the Board Meetings and its Committee meetings;
g) Approvals of the Members, the Board of Directors, the Committees of Directors and the Government authorities, wherever required;
h) The Company has obtained necessary disclosures from all the Directors, confirmation towards their being independent and compliance under the Code of Business Conduct and Ethics from the Directors as well as from Management personnel;
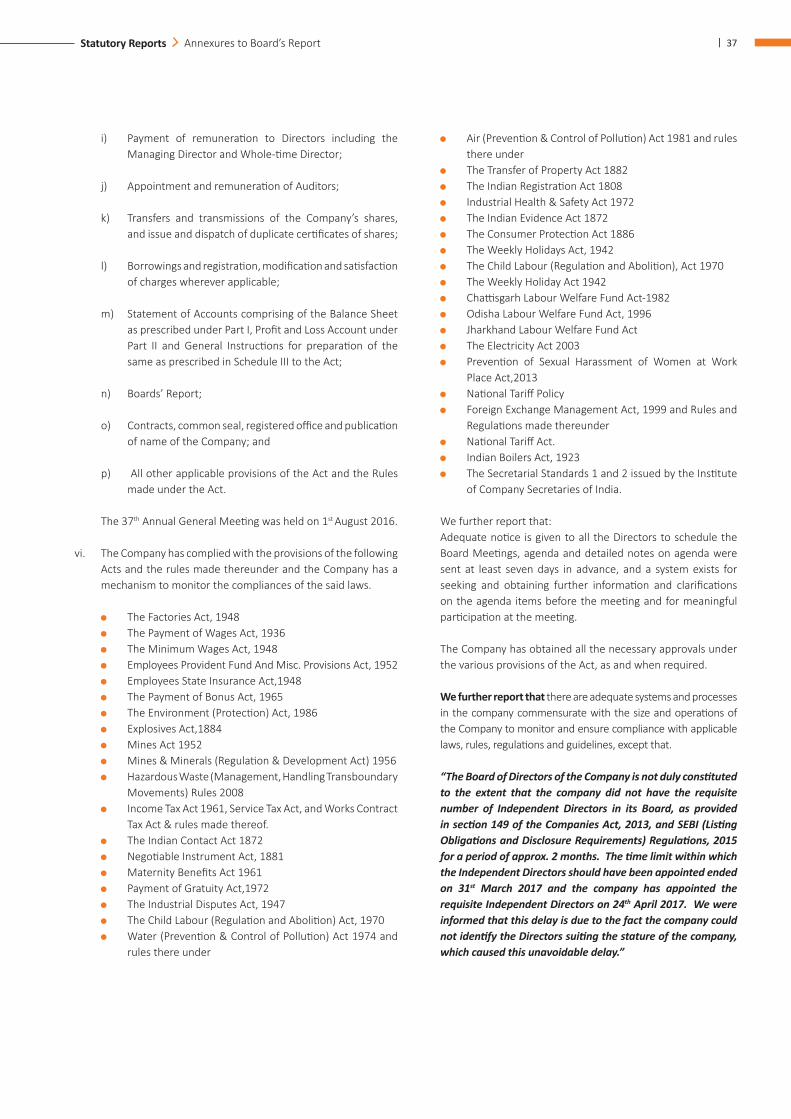
| 37Statutory Reports Annexures to Board’s Report
i) Payment of remuneration to Directors including the Managing Director and Whole-time Director;
j) Appointment and remuneration of Auditors;
k) Transfers and transmissions of the Company’s shares, and issue and dispatch of duplicate certificates of shares;
l) Borrowings and registration, modification and satisfaction of charges wherever applicable;
m) Statement of Accounts comprising of the Balance Sheet as prescribed under Part I, Profit and Loss Account under Part II and General Instructions for preparation of the same as prescribed in Schedule III to the Act;
n) Boards’ Report;
o) Contracts, common seal, registered office and publication of name of the Company; and
p) All other applicable provisions of the Act and the Rules made under the Act.
The 37th Annual General Meeting was held on 1st August 2016.
vi. The Company has complied with the provisions of the following Acts and the rules made thereunder and the Company has a mechanism to monitor the compliances of the said laws.
The Factories Act, 1948 The Payment of Wages Act, 1936 The Minimum Wages Act, 1948 Employees Provident Fund And Misc. Provisions Act, 1952 Employees State Insurance Act,1948 The Payment of Bonus Act, 1965 The Environment (Protection) Act, 1986 Explosives Act,1884 Mines Act 1952 Mines & Minerals (Regulation & Development Act) 1956 Hazardous Waste (Management, Handling Transboundary
Movements) Rules 2008 Income Tax Act 1961, Service Tax Act, and Works Contract
Tax Act & rules made thereof. The Indian Contact Act 1872 Negotiable Instrument Act, 1881 Maternity Benefits Act 1961 Payment of Gratuity Act,1972 The Industrial Disputes Act, 1947 The Child Labour (Regulation and Abolition) Act, 1970 Water (Prevention & Control of Pollution) Act 1974 and
rules there under
Air (Prevention & Control of Pollution) Act 1981 and rules there under
The Transfer of Property Act 1882 The Indian Registration Act 1808 Industrial Health & Safety Act 1972 The Indian Evidence Act 1872 The Consumer Protection Act 1886 The Weekly Holidays Act, 1942 The Child Labour (Regulation and Abolition), Act 1970 The Weekly Holiday Act 1942 Chattisgarh Labour Welfare Fund Act-1982 Odisha Labour Welfare Fund Act, 1996 Jharkhand Labour Welfare Fund Act The Electricity Act 2003 Prevention of Sexual Harassment of Women at Work
Place Act,2013 National Tariff Policy Foreign Exchange Management Act, 1999 and Rules and
Regulations made thereunder National Tariff Act. Indian Boilers Act, 1923 The Secretarial Standards 1 and 2 issued by the Institute
of Company Secretaries of India.
We further report that: Adequate notice is given to all the Directors to schedule the
Board Meetings, agenda and detailed notes on agenda were sent at least seven days in advance, and a system exists for seeking and obtaining further information and clarifications on the agenda items before the meeting and for meaningful participation at the meeting.
The Company has obtained all the necessary approvals under the various provisions of the Act, as and when required.
We further report that there are adequate systems and processes in the company commensurate with the size and operations of the Company to monitor and ensure compliance with applicable laws, rules, regulations and guidelines, except that.
“The Board of Directors of the Company is not duly constituted to the extent that the company did not have the requisite number of Independent Directors in its Board, as provided in section 149 of the Companies Act, 2013, and SEBI (Listing Obligations and Disclosure Requirements) Regulations, 2015 for a period of approx. 2 months. The time limit within which the Independent Directors should have been appointed ended on 31st March 2017 and the company has appointed the requisite Independent Directors on 24th April 2017. We were informed that this delay is due to the fact the company could not identify the Directors suiting the stature of the company, which caused this unavoidable delay.”
38 | Jindal Steel & Power Limited Annual Report 2016-17
During the period under review Company has initiated the process to shift its Registered Office from the state of Haryana to Chhattisgarh. The Company has passed the resolution by way of Postal Ballot under section 12(5) of the Companies Act, 2013.
During the period under review, the Company has passed Resolution by way of Circulation regarding Divestment of 24MW wind mill, situated at Satara, Maharashtra and the same was taken on record in the subsequent Board Meeting.
During the audit period, there were no instances of:
(i) Public/Right/Preferential issue of Shares / Debentures/Sweat Equity, etc.
(ii) Redemption / Buy-Back of securities
(iii) Merger / Amalgamation / Reconstruction, etc.
(iv) Foreign Technical Collaboration(s)
viii. There are 103 cases filed by / against the company, under various statutes, which are at various stages. For the sake of brevity, the title, forum and the status is not given in this report. Details of the same were provided to us for our verification and record.
For and on behalf of RSMV & Co.
Manoj Sharma
(Partner)
Place: DelhiDate: 22/05/2017
FCS: 7516 CP No.: 11571
| 39Statutory Reports Annexures to Board’s Report
Annexure - EANNUAL REPORT ON CORPORATE SOCIAL RESPONSIBILITY (CSR) ACTIVITIES FOR THE FINANCIAL YEAR 2016-17
1. A brief outline of the Company’s CSR policy, including overview of projects or programmes proposed to be undertaken and a reference to the web-link to the CSR policy and projects or programmes.
Brief of the Company’s CSR Policy: The Company strongly believes that sustainable community development is essential for harmony between the community and the
industry. The Company endeavours to make a positive contribution especially to the underprivileged communities by supporting a wide range of socio-economic, educational and health initiatives.
In line with the provisions of the Companies Act, 2013 readwith Schedule VII to the Companies Act, 2013 and on the recommendations of the Health, Safety, CSR & Environment Committee, the Board of Directors has, in its meeting held on April 29, 2014, approved the CSR Policy of the Company. Detailed CSR Policy of the Company has been uploaded on the website of the Company and can be viewed at below mentioned link:
http://www.jindalsteelpower.com/sustainabilities/csr-overview.html
Proposed Programs to be undertaken:Sr. No. Activity Area
1 Mobile Health Services, Tele Medicine Centre, Population Stabilization Program, Medical Referral Services for rural and tribal students, Leprosy Camps, Project to combat Malnutrition, Adolescent girls health care projects and camps, Project to improve the maternal and child health
Health, Water and Sanitation
2 Merit-cum-need based Scholarships, Community Teachers Support to Govt. School, Teachers Training , Building up of School Infrastructure, Literacy for women, Setting up Computer Education Centre, School Infrastructure Building, Support to vernacular medium school
Community Education & Skill Development
3 Need based community infrastructure Community Infrastructure4 Watershed development and Construction of water harvesting structures, Bio Gas Management,
Installation of Hand Pumps, Renovation of Drinking water facilities, Fly Ash Bricks, Stabilising Farm livelihood and NTFP
Entrepreneurship Development
5 Sports training support to youths of community, Non –Farm based Micro Enterprises promotion and capacity building and market linkage.
Sports, Art & Culture
6 Community driven Plantation & Creating Carbon Sinks , Control of Soil Erosion, Ground water recharge on Ridge to valley basis and encouraging Bio degradable Products
Environment & Community driven Natural Resources Management
2. Composition of the CSR Committee:
The Health, Safety, CSR & Environment Committee of the Company comprises majority of Independent Directors as under:-1. Mr. Arun Kumar - Chairman2. Mr. Hardip Singh Wirk - Member3. Mr. Ravikant Uppal – Member4. Mr. Dinesh Kumar Saraogi - Member
3. Average net profit/loss of the Company for last three financial years: ` (1095.19) crore
4. Prescribed CSR Expenditure (two per cent of the amount as in item 3 above): Nil 5. Details of CSR spend for the Financial Year: a. Total amount spent for the Financial Year: ` 15.36 Croreb. Amount unspent, if any: NIL
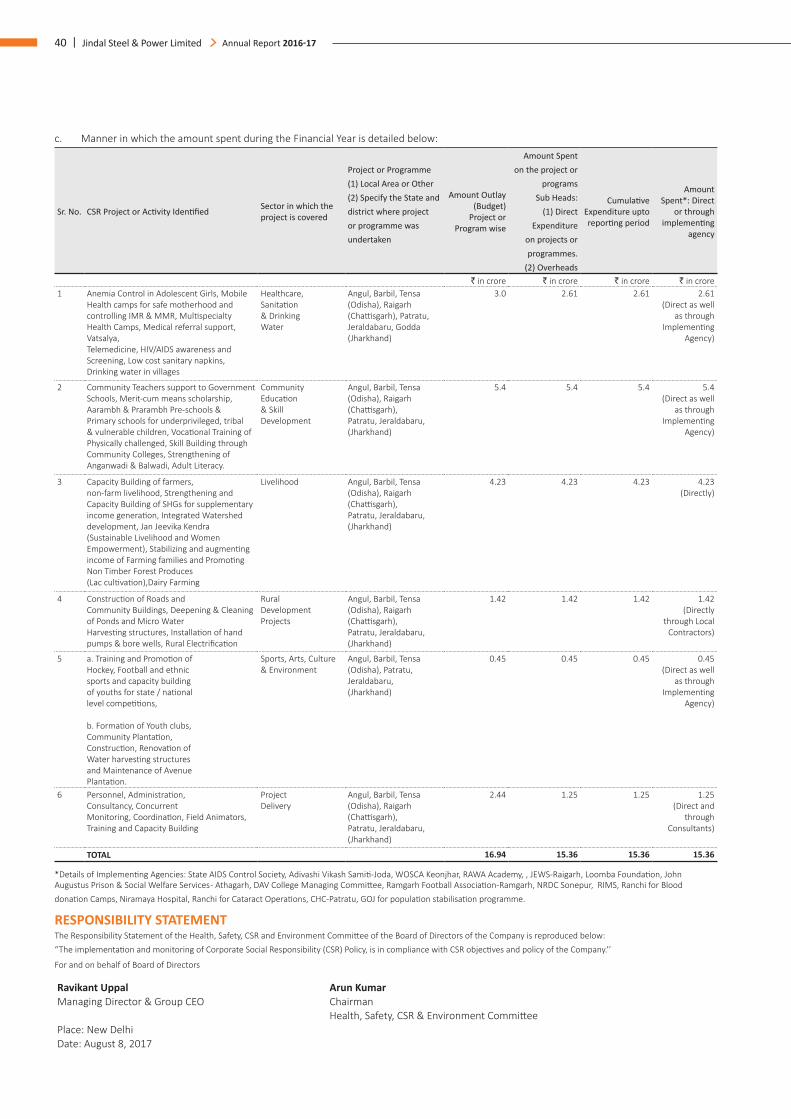
40 | Jindal Steel & Power Limited Annual Report 2016-17
c. Manner in which the amount spent during the Financial Year is detailed below:
Sr. No. CSR Project or Activity Identified Sector in which the project is covered
Project or Programme (1) Local Area or Other (2) Specify the State and district where project or programme was undertaken
Amount Outlay (Budget)
Project or Program wise
Amount Spent on the project or
programs Sub Heads:
(1) Direct Expenditure
on projects or programmes.
(2) Overheads
Cumulative Expenditure upto reporting period
Amount Spent*: Direct
or through implementing
agency
` in crore ` in crore ` in crore ` in crore1 Anemia Control in Adolescent Girls, Mobile
Health camps for safe motherhood and controlling IMR & MMR, Multispecialty Health Camps, Medical referral support, Vatsalya,Telemedicine, HIV/AIDS awareness and Screening, Low cost sanitary napkins, Drinking water in villages
Healthcare,Sanitation& DrinkingWater
Angul, Barbil, Tensa(Odisha), Raigarh(Chattisgarh), Patratu,Jeraldabaru, Godda(Jharkhand)
3.0 2.61 2.61 2.61(Direct as well
as through Implementing
Agency)
2 Community Teachers support to Government Schools, Merit-cum means scholarship, Aarambh & Prarambh Pre-schools & Primary schools for underprivileged, tribal & vulnerable children, Vocational Training of Physically challenged, Skill Building through Community Colleges, Strengthening of Anganwadi & Balwadi, Adult Literacy.
CommunityEducation& SkillDevelopment
Angul, Barbil, Tensa(Odisha), Raigarh(Chattisgarh),Patratu, Jeraldabaru,(Jharkhand)
5.4 5.4 5.4 5.4(Direct as well
as through Implementing
Agency)
3 Capacity Building of farmers,non-farm livelihood, Strengthening and Capacity Building of SHGs for supplementary income generation, Integrated Watershed development, Jan Jeevika Kendra (Sustainable Livelihood and Women Empowerment), Stabilizing and augmenting income of Farming families and Promoting Non Timber Forest Produces (Lac cultivation),Dairy Farming
Livelihood Angul, Barbil, Tensa(Odisha), Raigarh(Chattisgarh),Patratu, Jeraldabaru,(Jharkhand)
4.23 4.23 4.23 4.23(Directly)
4 Construction of Roads andCommunity Buildings, Deepening & Cleaning of Ponds and Micro WaterHarvesting structures, Installation of hand pumps & bore wells, Rural Electrification
RuralDevelopmentProjects
Angul, Barbil, Tensa(Odisha), Raigarh(Chattisgarh),Patratu, Jeraldabaru,(Jharkhand)
1.42 1.42 1.42 1.42(Directly
through Local Contractors)
5 a. Training and Promotion ofHockey, Football and ethnicsports and capacity buildingof youths for state / nationallevel competitions,
b. Formation of Youth clubs,Community Plantation,Construction, Renovation ofWater harvesting structuresand Maintenance of AvenuePlantation.
Sports, Arts, Culture & Environment
Angul, Barbil, Tensa(Odisha), Patratu,Jeraldabaru,(Jharkhand)
0.45 0.45 0.45 0.45(Direct as well
as through Implementing
Agency)
6 Personnel, Administration,Consultancy, ConcurrentMonitoring, Coordination, Field Animators, Training and Capacity Building
ProjectDelivery
Angul, Barbil, Tensa(Odisha), Raigarh(Chattisgarh),Patratu, Jeraldabaru,(Jharkhand)
2.44 1.25 1.25 1.25 (Direct and
through Consultants)
TOTAL 16.94 15.36 15.36 15.36
*Details of Implementing Agencies: State AIDS Control Society, Adivashi Vikash Samiti-Joda, WOSCA Keonjhar, RAWA Academy, , JEWS-Raigarh, Loomba Foundation, John Augustus Prison & Social Welfare Services - Athagarh, DAV College Managing Committee, Ramgarh Football Association-Ramgarh, NRDC Sonepur, RIMS, Ranchi for Blood donation Camps, Niramaya Hospital, Ranchi for Cataract Operations, CHC-Patratu, GOJ for population stabilisation programme.
RESPONSIBILITY STATEMENT The Responsibility Statement of the Health, Safety, CSR and Environment Committee of the Board of Directors of the Company is reproduced below:“The implementation and monitoring of Corporate Social Responsibility (CSR) Policy, is in compliance with CSR objectives and policy of the Company.’’
For and on behalf of Board of Directors
Ravikant Uppal Arun KumarManaging Director & Group CEO Chairman
Health, Safety, CSR & Environment CommitteePlace: New DelhiDate: August 8, 2017
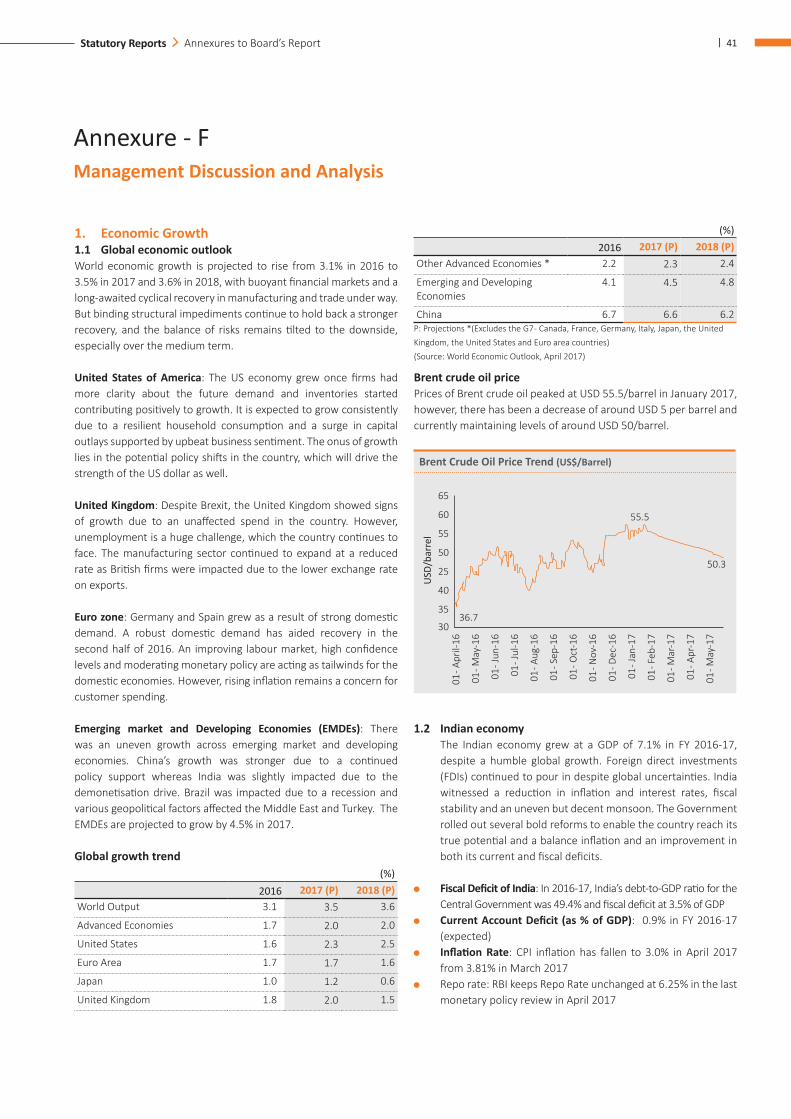
| 41Statutory Reports Annexures to Board’s Report
Management Discussion and Analysis
1. Economic Growth 1.1 Global economic outlookWorld economic growth is projected to rise from 3.1% in 2016 to 3.5% in 2017 and 3.6% in 2018, with buoyant financial markets and a long-awaited cyclical recovery in manufacturing and trade under way. But binding structural impediments continue to hold back a stronger recovery, and the balance of risks remains tilted to the downside, especially over the medium term.
United States of America: The US economy grew once firms had more clarity about the future demand and inventories started contributing positively to growth. It is expected to grow consistently due to a resilient household consumption and a surge in capital outlays supported by upbeat business sentiment. The onus of growth lies in the potential policy shifts in the country, which will drive the strength of the US dollar as well.
United Kingdom: Despite Brexit, the United Kingdom showed signs of growth due to an unaffected spend in the country. However, unemployment is a huge challenge, which the country continues to face. The manufacturing sector continued to expand at a reduced rate as British firms were impacted due to the lower exchange rate on exports.
Euro zone: Germany and Spain grew as a result of strong domestic demand. A robust domestic demand has aided recovery in the second half of 2016. An improving labour market, high confidence levels and moderating monetary policy are acting as tailwinds for the domestic economies. However, rising inflation remains a concern for customer spending.
Emerging market and Developing Economies (EMDEs): There was an uneven growth across emerging market and developing economies. China’s growth was stronger due to a continued policy support whereas India was slightly impacted due to the demonetisation drive. Brazil was impacted due to a recession and various geopolitical factors affected the Middle East and Turkey. The EMDEs are projected to grow by 4.5% in 2017.
Global growth trend (%)
2016 2017 (P) 2018 (P)World Output 3.1 3.5 3.6
Advanced Economies 1.7 2.0 2.0
United States 1.6 2.3 2.5
Euro Area 1.7 1.7 1.6
Japan 1.0 1.2 0.6
United Kingdom 1.8 2.0 1.5
(%) 2016 2017 (P) 2018 (P)Other Advanced Economies * 2.2 2.3 2.4
Emerging and Developing Economies
4.1 4.5 4.8
China 6.7 6.6 6.2P: Projections *(Excludes the G7 - Canada, France, Germany, Italy, Japan, the United Kingdom, the United States and Euro area countries)(Source: World Economic Outlook, April 2017)
Brent crude oil pricePrices of Brent crude oil peaked at USD 55.5/barrel in January 2017, however, there has been a decrease of around USD 5 per barrel and currently maintaining levels of around USD 50/barrel.
Brent Crude Oil Price Trend (US$/Barrel)
65
60
55
50
25
40
35
30
55.5
50.3
36.7
01 - A
pril-
16
USD
/bar
rel
01 - M
ay-1
6
01 - J
un-1
6
01 - J
ul-1
6
01 - A
ug-1
6
01 - S
ep-1
6
01 - O
ct-1
6
01 - N
ov-1
6
01 - D
ec-1
6
01 - J
an-1
7
01 - F
eb-1
7
01 - M
ar-1
7
01 - A
pr-1
7
01 - M
ay-1
7
1.2 Indian economy The Indian economy grew at a GDP of 7.1% in FY 2016-17,
despite a humble global growth. Foreign direct investments (FDIs) continued to pour in despite global uncertainties. India witnessed a reduction in inflation and interest rates, fiscal stability and an uneven but decent monsoon. The Government rolled out several bold reforms to enable the country reach its true potential and a balance inflation and an improvement in both its current and fiscal deficits.
Fiscal Deficit of India: In 2016-17, India’s debt-to-GDP ratio for the Central Government was 49.4% and fiscal deficit at 3.5% of GDP
Current Account Deficit (as % of GDP): 0.9% in FY 2016-17 (expected)
Inflation Rate: CPI inflation has fallen to 3.0% in April 2017 from 3.81% in March 2017
Repo rate: RBI keeps Repo Rate unchanged at 6.25% in the last monetary policy review in April 2017
Annexure - F
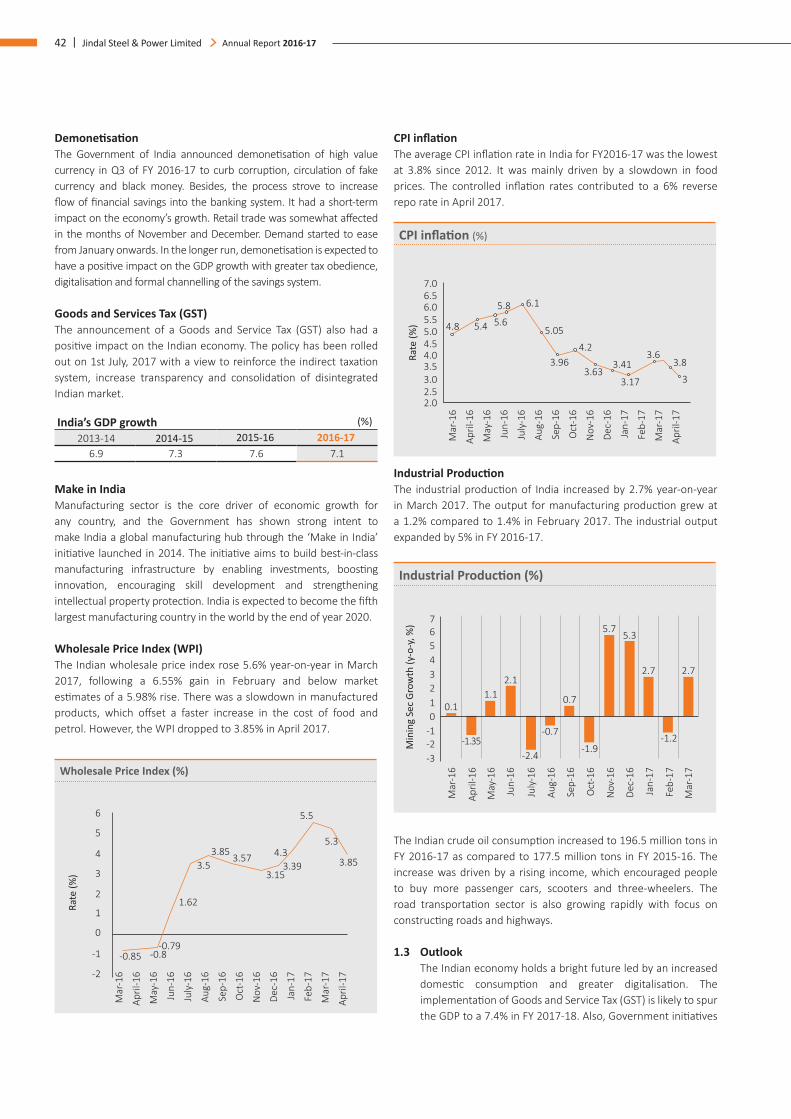
42 | Jindal Steel & Power Limited Annual Report 2016-17
CPI inflation The average CPI inflation rate in India for FY2016-17 was the lowest at 3.8% since 2012. It was mainly driven by a slowdown in food prices. The controlled inflation rates contributed to a 6% reverse repo rate in April 2017.
CPI inflation (%)
4.8 5.4 5.6
5.8 6.1
5.05
4.23.96
3.633.41
3.17
3.63.8
3
7.06.56.05.55.04.54.03.53.02.52.0
Rate
(%)
Apr
il-16
May
-16
Jun-
16
July
-16
Aug-
16
Sep-
16
Oct
-16
Nov
-16
Dec-
16
Jan-
17
Feb-
17
Mar
-17
Apr
il-17
Mar
-16
Industrial Production The industrial production of India increased by 2.7% year-on-year in March 2017. The output for manufacturing production grew at a 1.2% compared to 1.4% in February 2017. The industrial output expanded by 5% in FY 2016-17.
Industrial Production (%)
2.72.7
5.35.7
-1.9-1.2
-0.7
-2.4-1.35
0.7
2.11.1
0.1
76543210
-1-2-3
Min
ing
Sec
Grow
th (y
-o-y
, %)
Apr
il-16
May
-16
Jun-
16
July
-16
Aug-
16
Sep-
16
Oct
-16
Nov
-16
Dec-
16
Jan-
17
Feb-
17
Mar
-17
Mar
-16
The Indian crude oil consumption increased to 196.5 million tons in FY 2016-17 as compared to 177.5 million tons in FY 2015-16. The increase was driven by a rising income, which encouraged people to buy more passenger cars, scooters and three-wheelers. The road transportation sector is also growing rapidly with focus on constructing roads and highways.
1.3 Outlook The Indian economy holds a bright future led by an increased
domestic consumption and greater digitalisation. The implementation of Goods and Service Tax (GST) is likely to spur the GDP to a 7.4% in FY 2017-18. Also, Government initiatives
DemonetisationThe Government of India announced demonetisation of high value currency in Q3 of FY 2016-17 to curb corruption, circulation of fake currency and black money. Besides, the process strove to increase flow of financial savings into the banking system. It had a short-term impact on the economy’s growth. Retail trade was somewhat affected in the months of November and December. Demand started to ease from January onwards. In the longer run, demonetisation is expected to have a positive impact on the GDP growth with greater tax obedience, digitalisation and formal channelling of the savings system.
Goods and Services Tax (GST) The announcement of a Goods and Service Tax (GST) also had a positive impact on the Indian economy. The policy has been rolled out on 1st July, 2017 with a view to reinforce the indirect taxation system, increase transparency and consolidation of disintegrated Indian market.
India’s GDP growth (%) 2013-14 2014-15 2015-16 2016-17
6.9 7.3 7.6 7.1
Make in India Manufacturing sector is the core driver of economic growth for any country, and the Government has shown strong intent to make India a global manufacturing hub through the ‘Make in India’ initiative launched in 2014. The initiative aims to build best-in-class manufacturing infrastructure by enabling investments, boosting innovation, encouraging skill development and strengthening intellectual property protection. India is expected to become the fifth largest manufacturing country in the world by the end of year 2020.
Wholesale Price Index (WPI)The Indian wholesale price index rose 5.6% year-on-year in March 2017, following a 6.55% gain in February and below market estimates of a 5.98% rise. There was a slowdown in manufactured products, which offset a faster increase in the cost of food and petrol. However, the WPI dropped to 3.85% in April 2017.
Wholesale Price Index (%)
3.85
5.3
5.5
3.394.3
3.15
3.573.853.5
1.62
-0.79-0.8-0.85
Apr
il-16
May
-16
Jun-
16
July
-16
Aug-
16
Sep-
16
Oct
-16
Nov
-16
Dec-
16
Jan-
17
Feb-
17
Mar
-17
Apr
il-17
Mar
-16
6
5
4
3
2
1
0
-1
-2
Rate
(%)
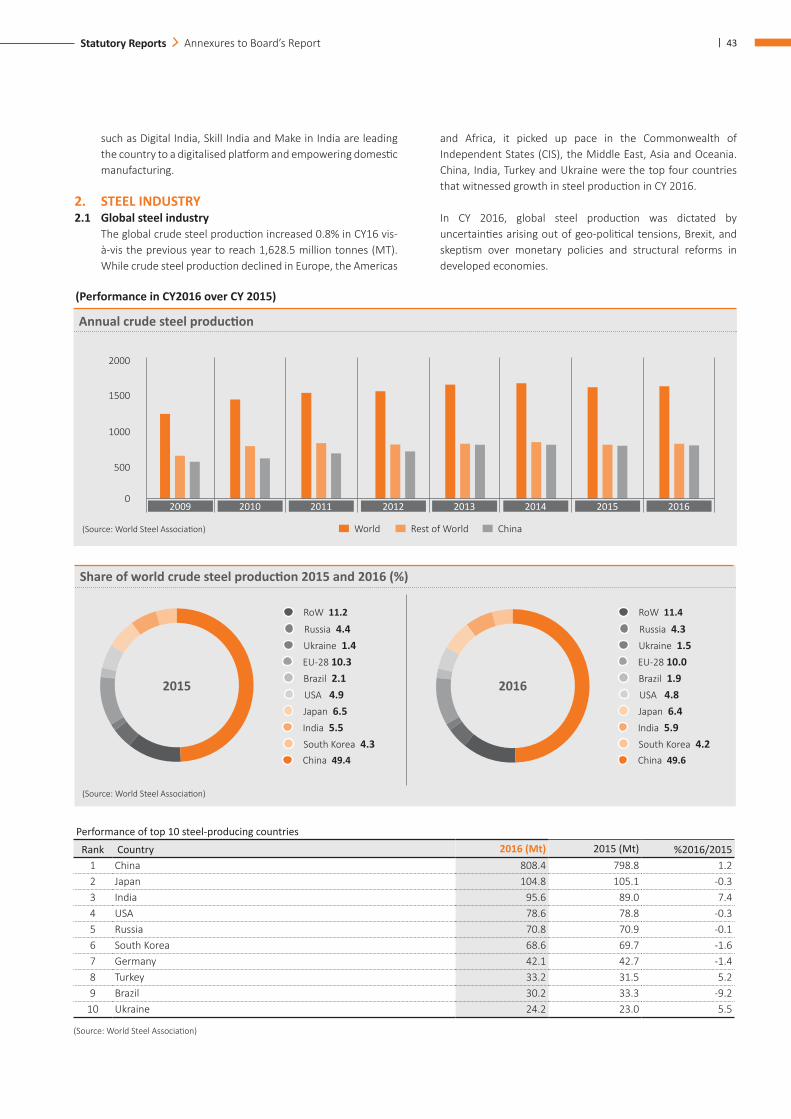
| 43Statutory Reports Annexures to Board’s Report
such as Digital India, Skill India and Make in India are leading the country to a digitalised platform and empowering domestic manufacturing.
2. STEEL INDUSTRY2.1 Global steel industry The global crude steel production increased 0.8% in CY16 vis-
à-vis the previous year to reach 1,628.5 million tonnes (MT). While crude steel production declined in Europe, the Americas
and Africa, it picked up pace in the Commonwealth of Independent States (CIS), the Middle East, Asia and Oceania. China, India, Turkey and Ukraine were the top four countries that witnessed growth in steel production in CY 2016.
In CY 2016, global steel production was dictated by uncertainties arising out of geo-political tensions, Brexit, and skeptism over monetary policies and structural reforms in developed economies.
(Performance in CY2016 over CY 2015)
Annual crude steel production
2009 2010 2011 2012 2013 2014 2015 2016
2000
1500
1000
500
0
World Rest of World China(Source: World Steel Association)
Share of world crude steel production 2015 and 2016 (%)
China 49.6
RoW 11.4
Russia 4.3Ukraine 1.5EU-28 10.0Brazil 1.9USA 4.8Japan 6.4India 5.9South Korea 4.2
China 49.4
RoW 11.2
Russia 4.4Ukraine 1.4EU-28 10.3Brazil 2.1USA 4.9Japan 6.5India 5.5South Korea 4.3
(Source: World Steel Association)
2015 2016
(Source: World Steel Association)
Performance of top 10 steel-producing countries
Rank Country 2016 (Mt) 2015 (Mt) %2016/20151 China 808.4 798.8 1.22 Japan 104.8 105.1 -0.33 India 95.6 89.0 7.44 USA 78.6 78.8 -0.35 Russia 70.8 70.9 -0.16 South Korea 68.6 69.7 -1.67 Germany 42.1 42.7 -1.48 Turkey 33.2 31.5 5.29 Brazil 30.2 33.3 -9.2
10 Ukraine 24.2 23.0 5.5
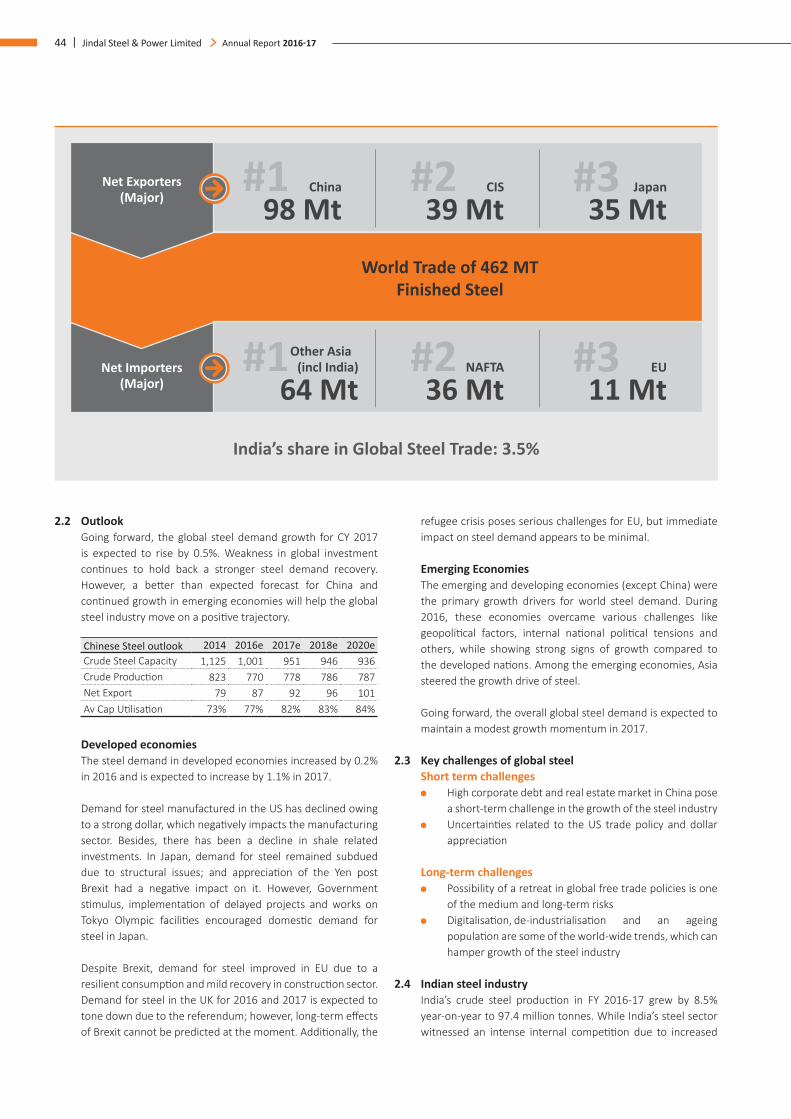
44 | Jindal Steel & Power Limited Annual Report 2016-17
2.2 Outlook Going forward, the global steel demand growth for CY 2017
is expected to rise by 0.5%. Weakness in global investment conti nues to hold back a stronger steel demand recovery. However, a bett er than expected forecast for China and conti nued growth in emerging economies will help the global steel industry move on a positi ve trajectory.
Chinese Steel outlook 2014 2016e 2017e 2018e 2020eCrude Steel Capacity 1,125 1,001 951 946 936Crude Producti on 823 770 778 786 787Net Export 79 87 92 96 101Av Cap Uti lisati on 73% 77% 82% 83% 84%
Developed economies The steel demand in developed economies increased by 0.2%
in 2016 and is expected to increase by 1.1% in 2017.
Demand for steel manufactured in the US has declined owing to a strong dollar, which negati vely impacts the manufacturing sector. Besides, there has been a decline in shale related investments. In Japan, demand for steel remained subdued due to structural issues; and appreciati on of the Yen post Brexit had a negati ve impact on it. However, Government sti mulus, implementati on of delayed projects and works on Tokyo Olympic faciliti es encouraged domesti c demand for steel in Japan.
Despite Brexit, demand for steel improved in EU due to a resilient consumpti on and mild recovery in constructi on sector. Demand for steel in the UK for 2016 and 2017 is expected to tone down due to the referendum; however, long-term eff ects of Brexit cannot be predicted at the moment. Additi onally, the
refugee crisis poses serious challenges for EU, but immediate impact on steel demand appears to be minimal.
Emerging Economies The emerging and developing economies (except China) were
the primary growth drivers for world steel demand. During 2016, these economies overcame various challenges like geopoliti cal factors, internal nati onal politi cal tensions and others, while showing strong signs of growth compared to the developed nati ons. Among the emerging economies, Asia steered the growth drive of steel.
Going forward, the overall global steel demand is expected to maintain a modest growth momentum in 2017.
2.3 Key challenges of global steel Short term challenges High corporate debt and real estate market in China pose
a short-term challenge in the growth of the steel industry Uncertainti es related to the US trade policy and dollar
appreciati on
Long-term challenges Possibility of a retreat in global free trade policies is one
of the medium and long-term risks Digitalisati on, de-industrialisati on and an ageing
populati on are some of the world-wide trends, which can hamper growth of the steel industry
2.4 Indian steel industry India’s crude steel producti on in FY 2016-17 grew by 8.5%
year-on-year to 97.4 million tonnes. While India’s steel sector witnessed an intense internal competi ti on due to increased
Net Exporters(Major)
China
World Trade of 462 MT Finished Steel
Net Importers(Major)
98 MtCIS
39 Mt#1
Other Asia* (incl India)
64 Mt#1 NAFTA
36 Mt#2
#2 Japan
35 Mt#3
EU
11 Mt#3
India’s share in Global Steel Trade: 3.5%
| 45Statutory Reports Annexures to Board’s Report
production, the industry had to withstand cheaper steel imports. The Government undertook various initiatives like imposing the ‘Minimum Import Price’ (MIP) in Feb 2016 on some steel and iron products to curtail unfair steel imports.
Moreover, the Government levied anti-dumping duties on steel products such as hot rolled sheets and plates, among others in FY 2016-17. This was an important step towards safeguarding the industry from excessive steel imports and bolstering the domestic steel production. Despite all trade measures, India imported 8 million tonnes of steel by the end of FY17.
India’s steel consumption increased by 2.6% year-on-year in FY17. It was expected to pick up pace in the second half of FY 2016-17 owing to several Government measures and reforms. A decent monsoon and the Seventh Pay Commission were expected to drive India’s consumer spend on white-goods and realty sector, thereby creating an upswing in the steel industry. However, demonetisation-induced liquidity crunch led to reduced demand in both market segments. Thus, the steel industry did not grow as predicted.
Going forward, India’s steel industry has immense long-term potential for growth, despite the challenges. Both private and public-sector steel manufacturers are taking adequate measures to achieve sustainable long-term growth.
Quick facts of the Indian Steel Industry Key producer of high quality steel of all major grades
and varieties Third-largest producer of crude steel in the world in
CY 2016 Third-largest consumer of finished steel in the world in
CY 2016 Domestic availability of raw materials, such as iron
ore and cost-effective labour Strong economic foundation and reform-centric policy
approach are factors favouring growth of the domestic steel industry
Creates more than six million jobs in the country and contributes 2% to the GDP of the nation
(Source: Joint Plant Committee Report March 2017)
Indian Steel Scenario in FY 2016-17 (MT)Quantity FY 2015-16 FY 2016-17 Y-o-Y change Crude steel production 89.8 97.43 8.5%Import 11.7 7.227 (38%)Export 4.08 8.245 102%Real consumption (Demand)
80.5 83.652 2.6%
India became the highest net exporter of steel during FY 2016-17 with an increase of 102% year-on-year(YoY) after a gap of three years. Besides, there was a 2.6% increase in
the demand for the real consumption and the crude steel production increased by 8.5% vis-à-vis 0.9% in FY 2015-16.
Crude production sector-wise (MT)Particulars FY13 FY14 FY15 FY16 FY17Public sector 16.48 16.77 17.21 17.92 18.48Private sector 61.94 64.92 71.77 71.87 78.91
Steel consumption trend (MT)FY13 FY14 FY15 FY16 FY1773.48 74.10 76.36 81.53 83.93
Government Initiatives The Government of India initiated several steps to protect
the steel industry from the external threats of dumping and uniform trade. Following were the measures taken:
Bureau of Indian Standards (BIS) Norms Compulsory BIS norms were laid down for the steel industry
and production of steel. The norms were also applied to overseas firms, which are licensed steel exporters to India. This reform was thoughtfully imposed to maintain consistency and improve the quality of steel, to compete with international standards.
Annulling Classification The Government removed classification of steelmakers in
their projects to avoid any discrimination arising due to classification. Further, it served to provide equal opportunity for all steel manufacturers.
Anti-dumping Measures India imposed strict anti-dumping duties on China, the United
States and other countries to protect the interests of domestic steel producers. A ‘Minimum Import Price’ (MIP) was imposed on certain steel imports, which was a key factor in reducing low-priced steel imports to India.
The Safeguard duty is another measure by the Government that will eventually replace the MIP.
Railway Freight Reforms The Government of India has withdrawn the differential
railway freight policy for domestic consumption and exports of iron ore and pellets. This reform will help to bolster iron ore exports.
Domestic Finished Steel price trend Domestic prices for both hot rolled coil and plate increased
between 15% and 19% since April 2016. They reached peak price in January 2017. However, there has been a downward trend in the last few months. Additionally, price of long steel reached its apex in March and April 2017, thereafter facing a downward trend. Further, prices of TMT and wire rod have increased upto 9% since April 2016.
46 | Jindal Steel & Power Limited Annual Report 2016-17
2.5 Demand drivers Infrastructure Allocation of ` 3.95 Lakh crore for the infrastructure
sector in the Union Budget for FY 2017-18 Multi-modal transport hubs to ease traffic congestion
and reduce pollution Focus on housing, rural economy, infrastructure spend,
railway and defence capex
Railways Largest-ever rail budget of ` 1.31 trillion More than 500 rail stations to be made friendly for
differently-abled by providing lifts and escalators All coaches to have bio-toilets by 2019 End-to-end transport solutions for selected commodities
through partnerships
Rural India Policies like Food for Work Programme (FWP), Indira
Awaas Yojana, Pradhan Mantri Gram Sadak Yojana and Affordable Housing are expected to raise the demand for steel consumption
Per capita consumption of rural India is expected to 14 kg of finished steel by CY 2020
Automotive Two-wheeler production is projected to rise from 18.5
million in FY15 to 34 million by FY20. Passenger vehicles market in India is expected to cross
the three-million-unit milestone during FY 2016-17, and further increase to 10 million units by FY 2019-20
Renewable energy Plans of generation of 275 gigawatts (GW) of total
renewable energy by CY 2027 Second phase of Solar Park development will be taken up
for an additional 20,000 MW capacity Generation and transmission of power is expected to
raise steel demand from the power sector
Real estate Approval of 100 Smart City Projects will improve the
demand for steel 100% increase for FDI limits for townships, SEZs and
settlements development projects (Source: IBEF)
Government reforms Expected impact of GST on Steel The steel industry is likely to benefit from the Goods and
Service Tax (GST). GST rate for steel has been finalised at 18%, whereas coal and iron ore is in the 5% slab. The low rates if major raw materials will enable steel companies to have lower input costs, which will increase margins of steel manufacturers. Besides, steel makers are likely to witness reduced logistics costs and time with the GST in place.
National Steel Policy, 2017 (NSP) The National Steel Policy (NSP) 2017 was released with a vision
of creating a globally competitive steel industry that promotes inter-sectoral growth.
Objectives of NSP Build a globally competitive industry with a crude steel
capacity of 300 million tonnes by 2030-31 Increase per capita steel consumption to 160 Kgs by
2030-31 Meet the entire steel demand (of high grade automotive
steel, electrical steel, special steels and alloys, among others) domestically for strategic applications by 2030-31
Intensify steel demand by concentrating on new projects in affordable housing, expansion of railway, ship building industry, defence sector and so on
Increase domestic availability of washed coking coal so as to reduce its import dependence to 50% by 2030-31
Develop into a net exporter of steel by 2025-26 Encourage industry to be a world leader on energy
and raw material efficient steel production by 2030-31, ensuring safety and sustainability
Develop and implement quality standards for domestic steel products
Emphasise on BF/BOF technology Focus on pelletisation and installation of slurry pipes and
conveyors Give preference to domestically manufactured iron and
steel products (DMI and SP)
The NSP policy will help augment domestic steel production and consumption to cater to various Government initiatives and reforms for a better India. The policy will support large infrastructure projects in the public private partnership (PPP) mode.
The Real Estate (Regulation and Development) Act, 2016 The RERA Act primarily seeks to protect the interests of home-
buyers. It is also designed to augment investments in the real estate industry. RERA will be responsible for redressal of grievances against any builder. The features of the Act are:
The developer will have to park 70% of the project funds in escrow accounts. This will ensure they do not invest in numerous projects with the proceeds of the booking money of one project
Sale of property is clearly defined based on carpet area, whereas sale on super built area has been made illegal
The developer or promoter cannot make any changes to the plan that had been sold without the written consent of the buyer
Any delay in project completion will make the developer liable to pay the same interest to the consumer, which is of equal value to the EMI paid by the consumer to the bank
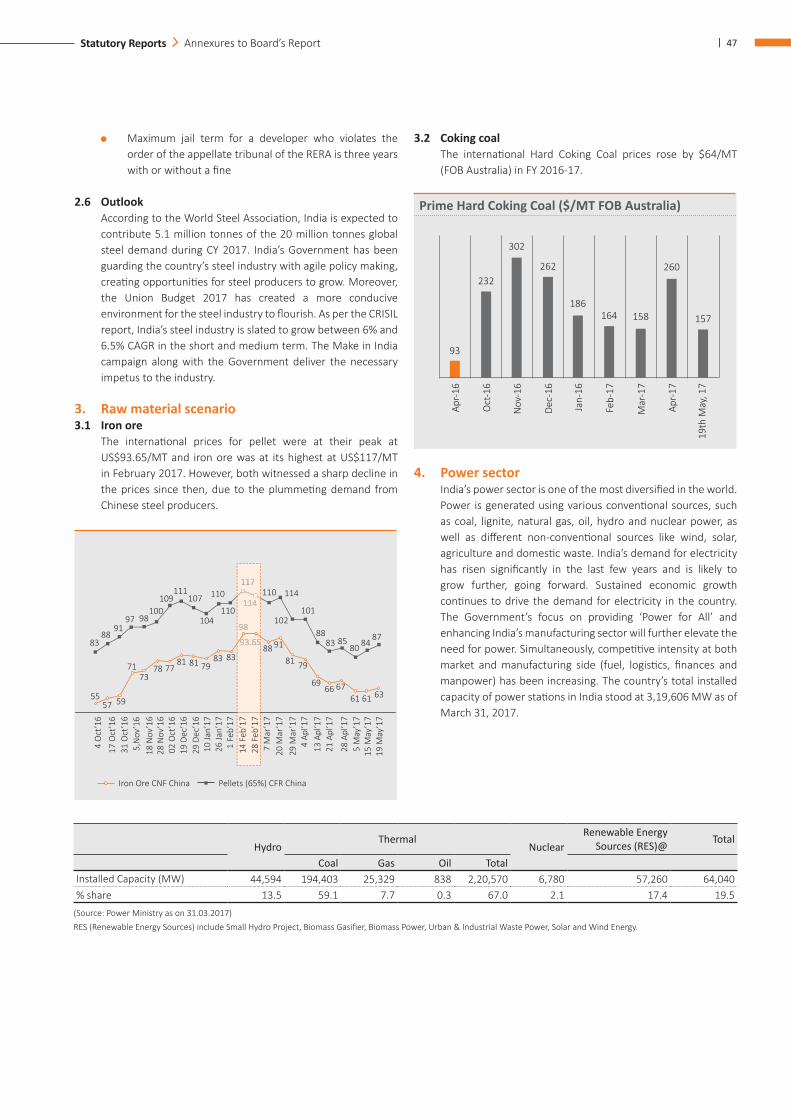
| 47Statutory Reports Annexures to Board’s Report
Maximum jail term for a developer who violates the order of the appellate tribunal of the RERA is three years with or without a fi ne
2.6 Outlook According to the World Steel Associati on, India is expected to
contribute 5.1 million tonnes of the 20 million tonnes global steel demand during CY 2017. India’s Government has been guarding the country’s steel industry with agile policy making, creati ng opportuniti es for steel producers to grow. Moreover, the Union Budget 2017 has created a more conducive environment for the steel industry to fl ourish. As per the CRISIL report, India’s steel industry is slated to grow between 6% and 6.5% CAGR in the short and medium term. The Make in India campaign along with the Government deliver the necessary impetus to the industry.
3. Raw material scenario3.1 Iron ore The internati onal prices for pellet were at their peak at
US$93.65/MT and iron ore was at its highest at US$117/MT in February 2017. However, both witnessed a sharp decline in the prices since then, due to the plummeti ng demand from Chinese steel producers.
8388
9197 98
100109
111107
104
110117
114110 114
102101
8883 85
80 8487
110
6361616766
69
7981
9188
98
8383798181
777873
71
595755
93.65
117117
114114
9898
93.6593.6593.6593.6593.6593.6593.6593.65
4 O
ct’1
6
17 O
ct’1
631
Oct
’16
5,N
ov’1
618
Nov
’16
28 N
ov’1
602
Oct
’16
19 D
ec’1
629
Dec
’16
10 Ja
n’17
26 Ja
n’17
1 Fe
b’17
14 F
eb’1
728
Feb
’17
7 M
ar’1
720
Mar
’17
29 M
ar’1
74
Apl’1
713
Apl
’17
21 A
pl’1
7
28 A
pl’1
75
May
’17
15 M
ay’1
719
May
’17
Pellets (65%) CFR ChinaIron Ore CNF China
3.2 Coking coal The internati onal Hard Coking Coal prices rose by $64/MT
(FOB Australia) in FY 2016-17.
Prime Hard Coking Coal ($/MT FOB Australia)
93
232
302
262
186164 158
260
157
Apr-
16
Oct
-16
Nov
-16
Dec-
16
Jan-
16
Feb-
17
Mar
-17
Apr-
17
19th
May
, 17
4. Power sector India’s power sector is one of the most diversifi ed in the world.
Power is generated using various conventi onal sources, such as coal, lignite, natural gas, oil, hydro and nuclear power, as well as diff erent non-conventi onal sources like wind, solar, agriculture and domesti c waste. India’s demand for electricity has risen signifi cantly in the last few years and is likely to grow further, going forward. Sustained economic growth conti nues to drive the demand for electricity in the country. The Government’s focus on providing ‘Power for All’ and enhancing India’s manufacturing sector will further elevate the need for power. Simultaneously, competi ti ve intensity at both market and manufacturing side (fuel, logisti cs, fi nances and manpower) has been increasing. The country’s total installed capacity of power stati ons in India stood at 3,19,606 MW as of March 31, 2017.
Hydro
ThermalNuclear
Renewable Energy Sources (RES)@ Total
Coal Gas Oil TotalInstalled Capacity (MW) 44,594 194,403 25,329 838 2,20,570 6,780 57,260 64,040% share 13.5 59.1 7.7 0.3 67.0 2.1 17.4 19.5
(Source: Power Ministry as on 31.03.2017) RES (Renewable Energy Sources) include Small Hydro Project, Biomass Gasifi er, Biomass Power, Urban & Industrial Waste Power, Solar and Wind Energy.
48 | Jindal Steel & Power Limited Annual Report 2016-17
Core capacities
Steel Power Mines and Minerals
Construction Material and Solutions
Global Venture
CURRENT CAPACITIES (GLOBAL and DOMESTIC)
8.1 MTPA Steel 3,400 MW** (IPP)1,649 MW (CPP)
3.11 MTPA Cement and road solutionsLight gauge steel
2 MTPA (Steel and mines)
**1000 MW Divestment announced
In FY 2016-17, power deficit for India reduced to 0.7% vis-à-vis 2.1% of FY 2015-16. The major reasons for this reduction were increased availability of coal across most power stations and incremental growth in the installed power capacity. Peak power requirement in FY 2016-17 was 159 GW, of which 157 GW was met. Despite reduced difference in power deficit, India faces uneven power distribution primarily because of an inadequate number of power stations in the country.
The plant load factor (PLF) was at an all-time low of 60.01% owing to financially weak distribution companies, which prefer load shedding rather than supplying power. This is mainly due to their inability to sell power at attractive rates to distribution companies (DISCOMs).
The Government of India launched the Ujwal DISCOM Assurance Yojana (UDAY) with the following objectives:
Financial turnaround Operational improvement Reduction in cost of power generation Development of renewable energy Energy efficiency and conservation
The scheme allows State Governments to take over 75% debt of their respective state distribution companies (DISCOMS) and pay back lenders by selling bonds. The remaining 25% of the debt would be paid by bonds issued by DISCOMS. Through this scheme, the Government hopes to make DISCOMS financially and operationally sound. It targets to improve the plant load factor of generating plants, thereby reducing the stress on assets. The ultimate goal of the scheme is to provide 24*7 power for all at an affordable price. The Government of India is also promoting
renewable energy and implementation of projects in a time bound manner. Besides, the Government has restarted the stalled hydro power projects and increased wind energy production target to 60 GW by 2022 from the current 20 GW.
5. Cement and Construction The Government of India is initiating various infrastructure,
housing and road projects under the Make in India campaign that will enhance the cement demand. Growth is expected in several segments like hospitality, retail, entertainment, education, and IT, among others, which will increase construction of high-rise buildings and industry parks.
The construction methods have undergone an overhaul with the introduction of cutting-edge technologies and machinery. There has also been an innovation in building materials, which has led to the demand of cement and construction material industries.
6. JINDAL STEEL AND POWER LIMITED Jindal Steel and Power Limited (JSPL) is a US$ 2.69 billion
business conglomerate and is an industrial powerhouse predominant in steel, power, mining and infrastructure sectors. JSPL’s business operations span across Asia, Africa, Australia and the Middle East. It has a rich product portfolio that caters to markets across the steel value chain. JSPL operates the world’s largest coal-based sponge iron plant. As a part of the US$ 18 billion OP Jindal Group, the Company has emerged as a young, agile force, which is consistently exploring new opportunities and expanding its capacity to become India’s most preferred steel and power manufacturer.
6.1 Operational review JSPL produces one of the widest variety of flat products and a whole range of long products. The Company produces the world’s
longest single piece Rail of 121 metre length and is a pioneer in manufacturing large-size parallel flange beams in India.
Raigarh (Chhattisgarh)
Angul(Odisha)
Barbil(Odisha)
Patratu(Jharkhand) Oman JPL
(Power) Mining
BF 2.125 MTPA BF 3.2 MTPA Pellet plant 9 MTPA
WRM 0.60 MTPA
HBI 1.5 MTPA Tamnar 3,400 MW
Iron Ore 3.11 MTPA
DRI 1.32 MTPA DRI 1.8 MTPA BRM 1.0 MTPA SMS 2.0 MTPA Coal Overseas 6.20 MTPA
SMS 3.6 MTPA SMS 2.5 MTPA BRM 1.4 MTPA Plate Mill 1.00 MTPA BRM 1.4 MTPA RUBM 0.75 MTPA Plate Mill 1.2 MTPA MLSM 0.60 MTPA CPP 810 MW CPP 839 MW CGP 225,000 Nm3/Hr
| 49Statutory Reports Annexures to Board’s Report
6.3 Strategy of JSPL Capacity utilisation: JSPL has been working towards optimum
capacity utilisation and increasing operational efficiencies of processes in the steel business. While reducing the production costs, impetus on value-added products was enhanced for better yields.
Operational excellence: JSPL continuously strives to attain cost efficiency, enhanced productivity, and product excellence through technological innovation and optimum deployment of resources. Strengthening of internal processes, work flow and optimum manpower utilisation by multiskilling are high on the Company’s agenda.
Financial prudence: JSPL is focusing on reducing its working capital (receivables and inventory) requirement and debt burden through strategic divestments, interest cost reduction and augment asset-sweating strategy.
6.4 Raw Material Security At JSPL, we procure iron-ore from captive mines and through
long-term alliance with miners. We revisited our logistics roadmap to ensure swift movement of coal and iron-ore within our locations.
Coal requirement for our Sponge Iron and Steel plants were met through domestic sources as well as through imports from mines in Australia & South Africa. Our iron-ore mine at Tensa and pelletisation complex at Barbil significantly contributed towards securing our iron ore requirements across our plants.To maintain our power generation levels, we utilised a judicious coal-sourcing mix from our overseas mines, coal linkage and e-auctions to be fully aligned with our PPA commitments and merchant market demand. Our Coal Management Group constituted last year ensured the most appropriate and cost-effective external sources of coal for both our steel and power business.
7. Operational achievements Completion of Angul Phase 1B JSPL has successfully completed and commissioned the 3.2
MTPA Blast Furnace at Angul. A 4 MTPA Sinter Plant alongwith a 2 MTPA Coke Oven plant have also been commissioned. The commissioning of the Blast Furnace, its phased capacity utilization ramp-up, will effectuate significant cost efficiencies through economies of scale at the integrated steel plant in Angul.
Operational efficiency through coal linkage JSPL secured a long-term coal linkage of 1.18 million tonne
per annum (MTPA) for its state-of-the-art captive power generation plants at Dongamahua and Raigarh in Chhattisgarh. The five-year long-term coal linkage was acquired in a coal linkage auction, which will enhance the fuel security for the power plants. The coal linkage will significantly enhance the operational efficiencies of the power plants.
Commission of Tamnar Phase-II. JSPL commissioned its fourth and last unit of 600 MW of
Tamnar Phase-II in December 2016. JSPL has completed commissioning of all units of Phase-II expansion.
8. Key achievements, 2016-17 Steel Increased total steel production by 6% Y-o-Y to 4.8 million
MT in FY17 vis-à-vis 4.52 million MT in FY 2015-16 Expanded total steel sales by 4% Y-o-Y to 4.82 million MT
compared to 4.62 million MT in FY 2015-16 Crossed 2 lakh MT Rail production in a single financial
year for first time Grew Plate and Coils sales volume by over 46% to 1.1
million MT in FY 2016-17 from 750,000 MT in FY 2015-16 Reduced total steel inventory by 55% in current financial
year (from 272,000 MT on 1st April to 121,000 MT on 31st Mar)
Received RDSO certification for Jindal Panther TMT Rebars and for Bridge manufacturing at SSD, Punjipatra
6.2 Product Portfolio JSPL believes in innovation and enhancing operational efficiencies to create a strong pipeline of products to meet the national and
international demand.
JSPL product portfolioSteel product mix Construction Solutions Construction Material TMT Rebar Fabricated Steel Section Light Weight Aggregate (LWA) Rails and Head Hardened Rails Speedfloor Jindal Global Road Stabilisers Parallel Flange Beams and Columns TMT Welded Mesh Jindal Panther Cement Angles and Channels Cut and Blend Fly-Ash Bricks Plates Light Gauge Structures Coils Insulated Dry Wall Panel Wire Rods EPS Panel
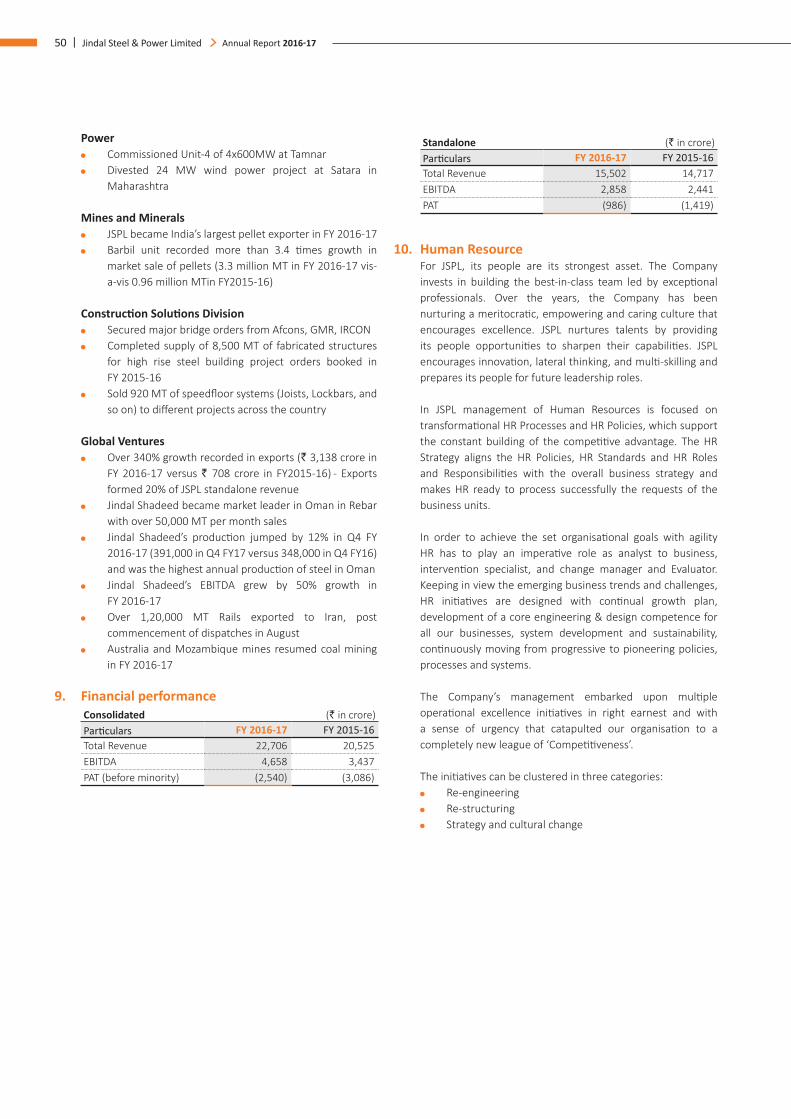
50 | Jindal Steel & Power Limited Annual Report 2016-17
Power Commissioned Unit-4 of 4x600MW at Tamnar Divested 24 MW wind power project at Satara in
Maharashtra
Mines and Minerals JSPL became India’s largest pellet exporter in FY 2016-17 Barbil unit recorded more than 3.4 times growth in
market sale of pellets (3.3 million MT in FY 2016-17 vis-a-vis 0.96 million MTin FY2015-16)
Construction Solutions Division Secured major bridge orders from Afcons, GMR, IRCON Completed supply of 8,500 MT of fabricated structures
for high rise steel building project orders booked in FY 2015-16
Sold 920 MT of speedfloor systems (Joists, Lockbars, and so on) to different projects across the country
Global Ventures Over 340% growth recorded in exports (` 3,138 crore in
FY 2016-17 versus ` 708 crore in FY2015-16) - Exports formed 20% of JSPL standalone revenue
Jindal Shadeed became market leader in Oman in Rebar with over 50,000 MT per month sales
Jindal Shadeed’s production jumped by 12% in Q4 FY 2016-17 (391,000 in Q4 FY17 versus 348,000 in Q4 FY16) and was the highest annual production of steel in Oman
Jindal Shadeed’s EBITDA grew by 50% growth in FY 2016-17
Over 1,20,000 MT Rails exported to Iran, post commencement of dispatches in August
Australia and Mozambique mines resumed coal mining in FY 2016-17
9. Financial performanceConsolidated (` in crore)Particulars FY 2016-17 FY 2015-16Total Revenue 22,706 20,525EBITDA 4,658 3,437PAT (before minority) (2,540) (3,086)
Standalone (` in crore)Particulars FY 2016-17 FY 2015-16Total Revenue 15,502 14,717EBITDA 2,858 2,441PAT (986) (1,419)
10. Human Resource For JSPL, its people are its strongest asset. The Company
invests in building the best-in-class team led by exceptional professionals. Over the years, the Company has been nurturing a meritocratic, empowering and caring culture that encourages excellence. JSPL nurtures talents by providing its people opportunities to sharpen their capabilities. JSPL encourages innovation, lateral thinking, and multi-skilling and prepares its people for future leadership roles.
In JSPL management of Human Resources is focused on transformational HR Processes and HR Policies, which support the constant building of the competitive advantage. The HR Strategy aligns the HR Policies, HR Standards and HR Roles and Responsibilities with the overall business strategy and makes HR ready to process successfully the requests of the business units.
In order to achieve the set organisational goals with agility HR has to play an imperative role as analyst to business, intervention specialist, and change manager and Evaluator. Keeping in view the emerging business trends and challenges, HR initiatives are designed with continual growth plan, development of a core engineering & design competence for all our businesses, system development and sustainability, continuously moving from progressive to pioneering policies, processes and systems.
The Company’s management embarked upon multiple operational excellence initiatives in right earnest and with a sense of urgency that catapulted our organisation to a completely new league of ‘Competitiveness’.
The initiatives can be clustered in three categories: Re-engineering Re-structuring Strategy and cultural change
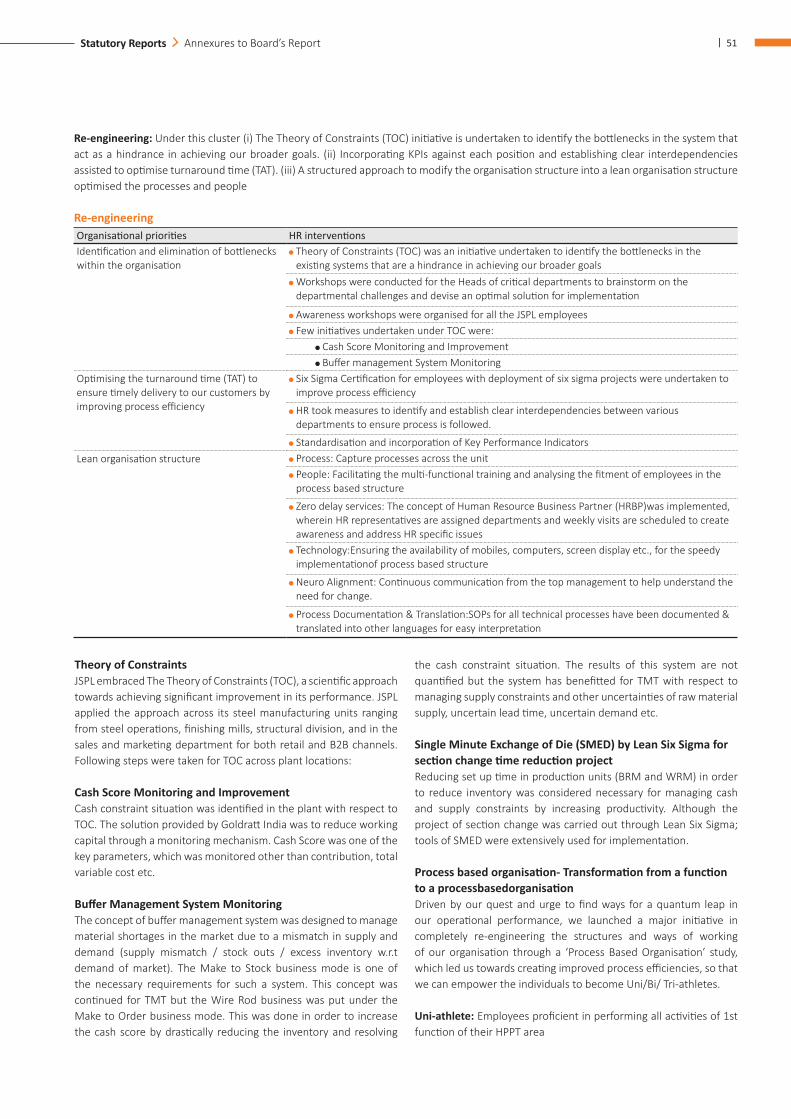
| 51Statutory Reports Annexures to Board’s Report
Re-engineering: Under this cluster (i) The Theory of Constraints (TOC) initiative is undertaken to identify the bottlenecks in the system that act as a hindrance in achieving our broader goals. (ii) Incorporating KPIs against each position and establishing clear interdependencies assisted to optimise turnaround time (TAT). (iii) A structured approach to modify the organisation structure into a lean organisation structure optimised the processes and people
Re-engineeringOrganisational priorities HR interventionsIdentification and elimination of bottlenecks within the organisation
Theory of Constraints (TOC) was an initiative undertaken to identify the bottlenecks in the existing systems that are a hindrance in achieving our broader goals
Workshops were conducted for the Heads of critical departments to brainstorm on the departmental challenges and devise an optimal solution for implementation
Awareness workshops were organised for all the JSPL employees Few initiatives undertaken under TOC were:
Cash Score Monitoring and Improvement Buffer management System Monitoring
Optimising the turnaround time (TAT) to ensure timely delivery to our customers by improving process efficiency
Six Sigma Certification for employees with deployment of six sigma projects were undertaken to improve process efficiency
HR took measures to identify and establish clear interdependencies between various departments to ensure process is followed.
Standardisation and incorporation of Key Performance Indicators Lean organisation structure Process: Capture processes across the unit
People: Facilitating the multi-functional training and analysing the fitment of employees in the process based structure
Zero delay services: The concept of Human Resource Business Partner (HRBP)was implemented, wherein HR representatives are assigned departments and weekly visits are scheduled to create awareness and address HR specific issues
Technology:Ensuring the availability of mobiles, computers, screen display etc., for the speedy implementationof process based structure
Neuro Alignment: Continuous communication from the top management to help understand the need for change.
Process Documentation & Translation:SOPs for all technical processes have been documented & translated into other languages for easy interpretation
Theory of ConstraintsJSPL embraced The Theory of Constraints (TOC), a scientific approach towards achieving significant improvement in its performance. JSPL applied the approach across its steel manufacturing units ranging from steel operations, finishing mills, structural division, and in the sales and marketing department for both retail and B2B channels. Following steps were taken for TOC across plant locations:
Cash Score Monitoring and ImprovementCash constraint situation was identified in the plant with respect to TOC. The solution provided by Goldratt India was to reduce working capital through a monitoring mechanism. Cash Score was one of the key parameters, which was monitored other than contribution, total variable cost etc.
Buffer Management System MonitoringThe concept of buffer management system was designed to manage material shortages in the market due to a mismatch in supply and demand (supply mismatch / stock outs / excess inventory w.r.t demand of market). The Make to Stock business mode is one of the necessary requirements for such a system. This concept was continued for TMT but the Wire Rod business was put under the Make to Order business mode. This was done in order to increase the cash score by drastically reducing the inventory and resolving
the cash constraint situation. The results of this system are not quantified but the system has benefitted for TMT with respect to managing supply constraints and other uncertainties of raw material supply, uncertain lead time, uncertain demand etc.
Single Minute Exchange of Die (SMED) by Lean Six Sigma for section change time reduction projectReducing set up time in production units (BRM and WRM) in order to reduce inventory was considered necessary for managing cash and supply constraints by increasing productivity. Although the project of section change was carried out through Lean Six Sigma; tools of SMED were extensively used for implementation.
Process based organisation- Transformation from a function to a processbasedorganisationDriven by our quest and urge to find ways for a quantum leap in our operational performance, we launched a major initiative in completely re-engineering the structures and ways of working of our organisation through a ‘Process Based Organisation’ study, which led us towards creating improved process efficiencies, so that we can empower the individuals to become Uni/Bi/ Tri-athletes.
Uni-athlete: Employees proficient in performing all activities of 1st function of their HPPT area
52 | Jindal Steel & Power Limited Annual Report 2016-17
Bi-athlete: Employees proficient in performing activities of 2nd functions of their HPPT area
Tri-athlete: Employees proficient in performing activities of 3rd functions of their HPPT area
Leadership Exploration and Development (LEAD): At JSPL, leadership development is a core priority aligned with its organisational values. There was a need to internalise the employees with new values to combat the volatile and uncertain external and internal environment. Also, it was important to create a practice, which would deliver measurable business results aligned to the paradigms of doing business. Therefore, LEAD was built to address the operational challenges and steer the company towards adopting new leadership values. It also focused on ‘future proofing’ the organisation for a sustained growth and competitive advantage.
The scope of the practice is to meet the Company’s objectives that should focus on individual leadership development, build leadership systems and a leadership culture within the context of ‘Delivering business performance’.
The competence of the existing employees was enhanced by providing them opportunities to learn and grow internally as opposed to bringing in lateral talent wherever possible. A 70:30 model was adopted, i.e., 70% of all interventions would remain internal, and 30% of interventions would be outsourced to external support providers. The programme emphasised on diffusing leadership capabilities across the organisation irrespective of the levels at which each individual performs.
The LEAD practice was designed in the best interests of the Company leading to: Creation of significant impact on the business by focusing
participant’s attention to value creation initiatives and unlocking business value through strategic break through projects (BTPs)
Helping to build a leadership culture wherein the employees inculcate the Company’s leadership values, have a culture execution and delivering business excellence
Focusing on building a leadership system by creating a network of internal coaches and act as mentors for their team members by reducing dependence on external resources, leading to significant cost reductions in delivering the programme
Reducing attrition by providing existing employees opportunities to learn and grow and improves both retention as well as acquiring new talent
Re-structuring: A major initiative ‘Project Arjun’ has been undertaken for the transformation of the organisation from a function based structure to process based structure. The employees are given ownership of an entire area covering core functions rather than limiting them to just one function. This is achieved through extensive multi-skilling programs. A flat 3 layered structure has also been adopted to minimise vertical complexities, and enable faster decision making and a flexible work environment.
Strategic and cultural change: In view of the external challenges of market slowdown faced by the industry, following strategic measures have been adopted: Focus on strengthening the sales and marketing teams
across locations by providing them adequate resources from internal pool of high performers and developing their core competencies
A concept of sub stores has been implemented wherein apart from central store, a department store is created to avoid delay in retrieving critical materials
HRBP is an initiative to establish better connect with the employees, provide zero delay services improve facilities and processes, and drive talent management initiatives in collaboration with departments
Establishing Interdependencies: A study was conducted to establish clear interdependencies between the departments, these were incorporated as KPIs in goal sheet of employees to achieve the desired business outcomes by aligning the goals \
Group Governance In order to institutionalise Group Governance, we implemented a three-fold strategy: Portfolio Governance: Positioning business for growth and
setting overall targets Strategic Governance: Driving inclusive and participative
management and setting group strategies Operational Governance: Enhancing efficiency and
effectiveness and executing agreed strategies
11. Environment As a responsible corporate citizen, JSPL has adopted sound
environment management practices for operating its plants. The Company has drawn elaborate environment management plans to minimise the impact from air emissions, noise, water pollution and solid waste generation arising out of its plants.
JSPL implemented the Integrated Management Systems across all its units. The following initiatives were undertaken during FY 2016-17:
Water Conservation and Management measures Installed two sewage treatment plants with 1500 KLD and 60
KLD capacity at Raigarh Steel Plant Utilised recycled water from Effluent Recycling Systems for
cooling purpose to minimise make-up water consumption at Direct Reduced Iron (DRI), Raigarh
Installed two online Effluent Quality Monitoring Systems for monitoring quality of treated sewage water at Raigarh
Installed and commissioned CCTV cameras at zero discharge point (effluent recycling system) at Raigarh
Created an efficient drainage system with additional earthen check dam and settling pit at toe of the OB dump to arrest washed out material in iron ore mines at Tensa
| 53Statutory Reports Annexures to Board’s Report
Air pollution control and monitoring Installed and commissioned online Ambient Air Quality
Monitoring System (AAQMS) for monitoring additional parameters at already existing four AAQMS stations at JSPL Raigarh
Equipped a new online AAQMS station in the Cement plant at Raigarh
Plantation and awareness programmes A total of around 59,500 saplings were planted during the year
2016-17
12. Occupational health and safety JSPL is committed to conduct all its operations free from
accidents and occupational hazards. The Company implements best practices at its operational units to ensure safety of its people including the contractors and temporary labourers. JSPL strives to provide a safe working ecosystem for its people and thus, follows all statutory requirements. The Company is guided by the following principles for developing a world-class safety standard across its operations:
All injuries and work-related illness can and must be prevented Managers are responsible and accountable for safety and
health performance Employee engagement and training is mandatory Working safely is a condition of employment Excellence in safety and health drive excellent business results Safety and health must be integrated in all business processes
The Company conforms to the International Occupational Health and Safety Management Standard - OHSAS 18001, which is certified by the world’s renowned external accredited agencies.
Proactive Measures JSPL initiated various programmes for engaging the management in safety activities. Some of them are: Safety log book: Senior leaders and line managers invested
two hours per week exclusively to identify potential risky situations. They further brainstormed to provide solutions within a time bound schedule with a theme of ‘Find It, Own It & Fix It’
Safety Touch: HODs and line managers interacted with on-the-floor personnel to understand their challenges in carrying out their everyday activities. The feedback was utilised to develop relevant policies for ensuring safety at work.
Cross functional audits: HODs, section heads and line managers collectively carried out safety audits in all plants. These audits were focused on specific topics such as work permit system, firefighting systems and so on. The audit findings were recorded in a specified checklist, while the plants were given a quantified rating. The plant with the highest rating was awarded with a trophy and a certificate.
Apex safety rounds: Periodic safety rounds were organised by senior leaders along with the unit head and their observations were recorded in a time bound schedule.
JSPL undertook several proactive measures on occupational health and safety to minimise work-related injuries and illnesses. Some of them are: Safety Training: Over 3,91,000 man-hours were invested on
safety training and 96,000 toolbox talks were delivered to create safety awareness among shop floor workers
Safety Audits/Inspections: Over 4,100 safety inspections and audits were conducted in FY 2016-17
Emergency Preparedness: About 76 mock drills were conducted to ensure emergency teams were prepared for any potential situation
Documentation and Rectification of Unsafe Acts: Over 67,000 potential incidents were reported and rectified before they could result in a major crisis
Safety Performance Review: JSPL constituted a four-tier safety forum across the Board, site, department and contractor levels for reviewing health and safety performance at periodic intervals
Medical Health Surveillance: Pre-employment and periodic medical examinations were carried out for employees and contractors to ensure they were fit for work. Over 77800 medical examinations were carried out
Performance JSPL outperformed on its occupational health and safety front and achieved high grades on various reactive safety parameters compared to FY 2015-16: Lost time cases were reduced by 37.50% Medical treatment cases reduced by 47.2% First aid cases were reduced by 42.67% Person-days lost on account of accidents were reduced by
17.96% Accident frequency rate was reduced by 26.7% Accident severity rate was reduced by 11% Total Disability Injury Index was reduced by 37% Work-days lost due to accidents were reduced by 20.9%
The cases for the above parameters have reduced consistently over the last five years. And the Company aims to be among the world’s best in terms of occupational health and safety.
13. Awards and Recognitions Mr. Naveen Jindal, Chairman, JSPL received the ‘Industry
Communicator of the Year’ award at World Steel Association’s Steelie Award 2016, for his contribution towards communications related to steel promotion
Jindal Shadeed won Frost and Sullivan’s ‘2017 GCC Ferrous Company of the Year Award’ for Business Excellence best practices
Angul Won the award for outstanding CSR practices in Steel and
Power sector by Odishalive Awarded for Best CSR Practices Award by Odisha CSR forum Won the Kalinga CSR Excellence Award by Institute of Quality &
Environment Management Services Won the Odisha INC CSR award 2016 by Orissadiary for its
innovative CSR activities in Odisha
54 | Jindal Steel & Power Limited Annual Report 2016-17
Raigarh Bagged the Sustainable Energy Development Award 2016
conferred by Chhattisgarh State Renewable Development Agency (CREDA)
Won the ‘Award of Excellence’ in the Captive Power Plant Category and ‘Award of Merit’ in the Steel Plant Category
Dongamauha Captive Power Plant bagged the prestigious 17th Greentech Environment Award Category - Golden Category Award 2017
Won the GreenCo ‘Green Rating of Company’ Gold Award from CII for its Environmental Best Practices in Gold Category
Bagged the ‘National Energy Management award-2015-16’ in the Energy Manager category by ‘Society of Energy Manger & Engineer (SEEM) for its Energy conservation initiatives
Received the ‘National Energy Conservation award (NECA) -2016 and Certificate of Merit in integrated steel plant sectors from Ministry of Power
Won the ‘Performance Excellence’ Award 2016 in the Platinum Category from Indian Institute of Industrial Engineering (IIIE), Mumbai for its Industrial Engineering activities
Patratu Won the most coveted national level Safety Award- Rashtra
Vibhushan Award 2016-17 in the Platinum Category towards excellence in Health & Safety for Workers
Raipur Conferred with ‘Rashtra Vibhushan Award 2017’ in the
Platinum Category for Health & Safety of Workers
JPL Won the prestigious Dale Carnegie Global Leadership Award
2016 for its project ‘Utthaan’ Won the ‘International Safety Award’ from the British Safety
Council, UK Received ‘Par Excellence Award for 5’S implementation’ by
QCFI (Quality Circle Forum of India)
Barbil Bagged the award for Best Management practice in Cost
Optimisation Category at ‘Smart Manufacturing- Reinventing the future & Manufacturing’ conference 2016 for its case study on ‘Enhancing the productivity of Indurating Furnace with Quality Pellets’
Won the ‘International Safety Award’ from the British Safety Council, UK for its commitment to keep its workers and workplaces healthy and safe during 2016
Won the award for Outstanding performance and Best CSR practices by District Journalist Association, Keonjhar
Won the award in ‘Excellent’ category at the National Convention – NCQC (National Convention Quality Circle) 2016
Tensa Won the 1st prize for overall performance and Safe
Handling of Explosive at the 54th Annual Mines Safety Week Celebration-2016 under the aegis of Directorate General of Mines Safety, Chaibasa Region
Won the 1st prize in Reclamation/Rehabilitation at the 19th Mine Environment and Mineral Conservation Week 2016-17 under the aegis of Indian Bureau of Mines, Bhubaneswar
14. Risk Management Policy Risk management at JSPL has enabled the Group to protect
and enhance value, and is designed to deliver upon its short- and long-term objectives. A consistent and comprehensive risk management process has helped prepare organisation better for future eventuality.
Risk management has ensured a sustainable business growth with a pro-active approach in identifying, evaluating, reporting and resolving risks associated with the business. It has resulted in informed business decision making, considering associated business risks and without exposing the Group to undue peril. It has also enabled compliance with appropriate regulations, wherever applicable, through the adoption of best practices.
Risk identification and evaluation at JSPL are performed at strategic functions at the entity level, starting with the Senior Management Committee (SMC) at unit or location level. Core Management Team (CMT), Corporate Functional Heads, Group Executive Committee (GEC) are other risk management entities at JSPL.This exercise is continued until the Top Management and Board Level.
15. Internal controls The Company has in place a proper system of internal controls
to ensure that all assets are safeguarded against loss from unauthorised use or disposition; and that the transactions are authorised, recorded and reported correctly. Additionally, the Internal Financial Control and reporting process ensures robust financial monitoring and ensures compliances. (Refer: Detailed IFCR report in the Statutory Section).
The Company also deploys standard policies and procedures, covering relevant business aspects, which are designed to facilitate effective oversight on business operations. A formal Delegation of Financial Powers (DOFP) document, covering the procurement and purchase of goods/ services and authorisation for expenses, among others is followed pan-organisationally.
The internal control system is periodically reviewed by the management, and supplemented by an extensive programme
| 55Statutory Reports Annexures to Board’s Report
of internal and external audits. The system is designed to ensure that financial and other records are reliable for preparing financial information, maintaining accountability of assets and providing reliable management information.
16. Internal audit The Company has an in-house Group Internal Audit (GIA)
department, headed by the President-GIA. In line with best governance practices, the President-GIA reports functionally to the Chairman of the Audit Committee, and administratively to the Honourable Chairman of the Board of the Company through the Managing Director & Group CEO. GIA’s staff is periodically rotated to ensure independence, and also to refresh skill and expertise.
The in-house GIA audit team is composed of various individuals, who are qualified as chartered accountants, cost accountants, engineers, certified internal auditor (CIA). Over the years, GIA has acquired in-depth knowledge about the Company, including its businesses and operations and systems and processes. Its elements have now been institutionalised into a robust annual Risk Based Audit Plan (RBAP), which
forms the basis of their activities. Some minor part of the audit activities is occasionally outsourced to external audit firms when needed.
GIA’s scope includes the Company’s locations, such as its plants, project sites, corporate office, marketing offices and stockyards. Internal audit observations are presented to the Audit Committee at its quarterly meetings, highlighting the high-risk issues, internal control weaknesses, and action taken by the management to mitigate/resolve it.
Cautionary Statement This report contains projections, estimates, etc., which are just
‘forward-looking statements’. Actual results could differ from those expressed or implied in this report. Important factors that may have an impact on the Company’s operations include economic conditions affecting demand / supply and price conditions in the domestic and overseas markets, changes in the Government regulations / policies, tax laws and other statutes and other incidental factors. The Company assures no responsibility to publicly modify or revise any forward-looking statements on the basis of any future events or new information. Actual results may differ from those mentioned in the report.
56 | Jindal Steel & Power Limited Annual Report 2016-17
Annexure - G
Particulars of Energy Conservation, Technology Absorption and Foreign Exchange Earnings and Outgo required under the Companies (Accounts) Rules, 2014
A. CONSERVATION OF ENERGY (i) Steps taken on conservation of energy: Some of the energy conservation measures adopted across
the Company were:
Raigarh1. Timer Installation with Plate Mill LDB for Energy Saving.
Electrical Power Saving of 175.2 MWh/year achieved.
2. Reduction of furnace specific power consumption in SAF by effective operational control and effective recovery of metal from slag and sand mixtures. Electrical Power Saving of 6372 MWh/year achieved.
3. Energy saving by Billet caster m/c cooling pump impeller modification in SMS-2. Electrical Power Saving of 299.3 MWh/year achieved.
4. Energy saving due to modification of VD condenser pump impeller in SMS-2 . Electrical Power Saving of 1,598.4 MWh/year achieved.
5. Optimisation of Soft Water Pump in sinter plant. Electrical Power Saving of 44.1 MWh/year achieved.
6. Automatic Stoppage of Evaporator Cooler Pumps and Fans by Temperature Control Mode in BF-1. Electrical Power Saving of 452.2 MWh/year achieved.
7. Modification in Hammer Mill tip profile to reduce current of Hammer mill 600 KW motor in DCPP. Electrical Power Saving of 240.1 MWh/year achieved.
8. Reduction of lighting energy consumption at LDP. Electrical Power Saving of 48 MWh/year achieved.
9. Modification in Hammer Mill tip profile to reduce current of Hammer Mill 600 KW motor in coke oven. Electrical Power Saving of 240 MWh/year achieved.
10. The existing 2 No. of CT Fan Blade changed with aerodynamic design high efficiency E-Glass E-Poxy FRP Fan blade installed in SMS-3. Electrical Power Saving of 99.8 MWh/year achieved.
11. Energy saving through increasing efficiency of VD Cooling Pumps in SMS-3. Electrical Power Saving of 360 MWh/year achieved.
12. Automatic Stoppage of Intermediate Mill Hydraulic Pump in Pressure Control Mode in MLSM. Electrical Power Saving of 474.9 MWh/year achieved.
13. Efficient Utilization of ECR-2 Chiller System in MLSM. Electrical Power Saving of 648 MWh/year achieved.
14. Installation of Less Capacity Motor for Settling Tank in water complex area in MLSM. Electrical Power Saving of 259.3 MWh/year achieved.
15. Stoppage of ICW Heat Exchanger Pump in MLSM. Electrical Power Saving of 1140.3 MWh/year achieved.
16. Stoppage of DCW and ICW Cooling Tower Fans in MLSM. Electrical Power Saving of 259 MWh/year achieved.
17. Stoppage of 1 No. Combustion ID Fans after recuperator modification in MLSM. Electrical Power Saving of 3,593 MWh/year achieved.
18. Auxiliary Power reduction by installation of VFD Driven LT Motor in CFBC ID Fan-1 and ID Fan 2 in PP-3. Electrical Power Saving of 1926 MWh/year achieved.
19. VM in blend coking coal has reduced from 23.33% to 21.73% has resulted increase in yield and thus reduction in specific energy consumption in coke oven plant.
20. AV ash in DRI plant has reduced from 32% to 27% due to use of imported coal resulting in overall reduction in specific energy consumption in DRI plant.
Angul21. At Central Utility, a branch line from make-up water supply
header is connected to drinking water filter (DMF) plant supply line, by which utilization of make-up water pump is improved and use of DMF supply pump is eliminated. Power Saving of 179 MWh/year is achieved.
22. Compressed gas supply line control valves are interchanged between Stage-1 & 2 and an Independent operation of process gas compressor Stage – 1 is achieved in partial load conditions of DRI. This was not feasible as per earlier design though flow capacity of Stage – 1 is higher than Stage – 2. By the modification, Power Saving of 720 MWh/year is achieved.
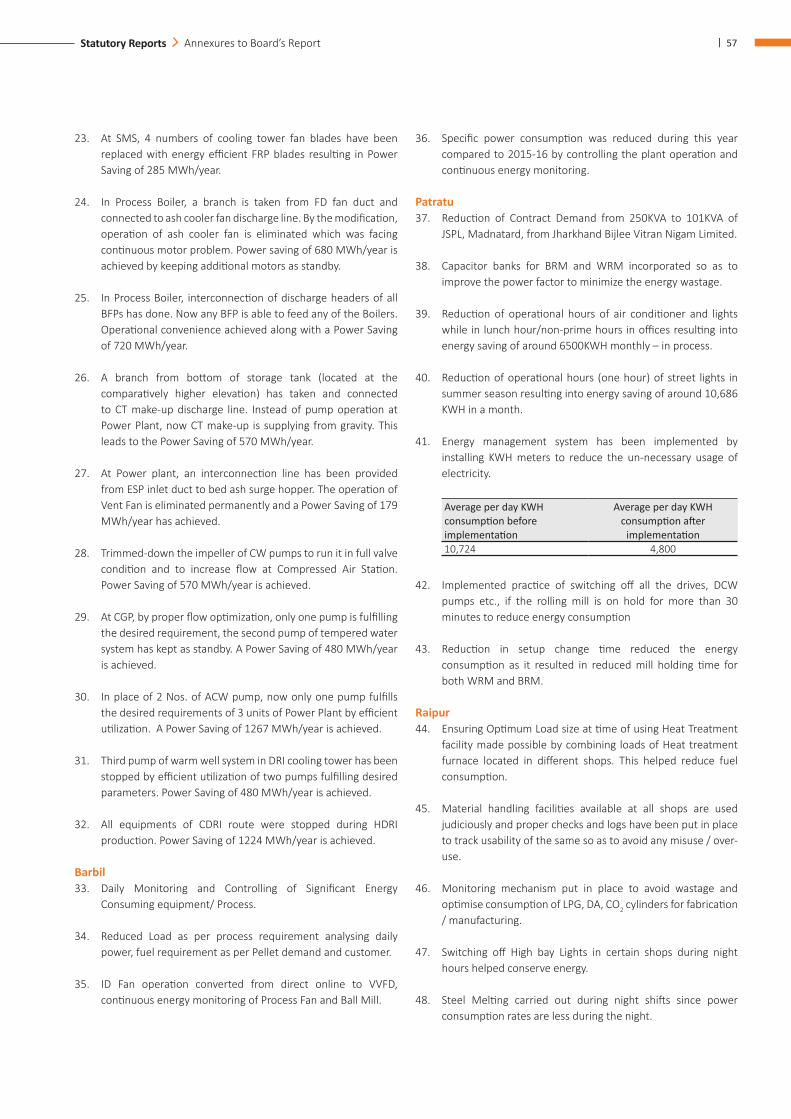
| 57Statutory Reports Annexures to Board’s Report
23. At SMS, 4 numbers of cooling tower fan blades have been replaced with energy efficient FRP blades resulting in Power Saving of 285 MWh/year.
24. In Process Boiler, a branch is taken from FD fan duct and connected to ash cooler fan discharge line. By the modification, operation of ash cooler fan is eliminated which was facing continuous motor problem. Power saving of 680 MWh/year is achieved by keeping additional motors as standby.
25. In Process Boiler, interconnection of discharge headers of all BFPs has done. Now any BFP is able to feed any of the Boilers. Operational convenience achieved along with a Power Saving of 720 MWh/year.
26. A branch from bottom of storage tank (located at the comparatively higher elevation) has taken and connected to CT make-up discharge line. Instead of pump operation at Power Plant, now CT make-up is supplying from gravity. This leads to the Power Saving of 570 MWh/year.
27. At Power plant, an interconnection line has been provided from ESP inlet duct to bed ash surge hopper. The operation of Vent Fan is eliminated permanently and a Power Saving of 179 MWh/year has achieved.
28. Trimmed-down the impeller of CW pumps to run it in full valve condition and to increase flow at Compressed Air Station. Power Saving of 570 MWh/year is achieved.
29. At CGP, by proper flow optimization, only one pump is fulfilling the desired requirement, the second pump of tempered water system has kept as standby. A Power Saving of 480 MWh/year is achieved.
30. In place of 2 Nos. of ACW pump, now only one pump fulfills the desired requirements of 3 units of Power Plant by efficient utilization. A Power Saving of 1267 MWh/year is achieved.
31. Third pump of warm well system in DRI cooling tower has been stopped by efficient utilization of two pumps fulfilling desired parameters. Power Saving of 480 MWh/year is achieved.
32. All equipments of CDRI route were stopped during HDRI production. Power Saving of 1224 MWh/year is achieved.
Barbil33. Daily Monitoring and Controlling of Significant Energy
Consuming equipment/ Process.
34. Reduced Load as per process requirement analysing daily power, fuel requirement as per Pellet demand and customer.
35. ID Fan operation converted from direct online to VVFD, continuous energy monitoring of Process Fan and Ball Mill.
36. Specific power consumption was reduced during this year compared to 2015-16 by controlling the plant operation and continuous energy monitoring.
Patratu37. Reduction of Contract Demand from 250KVA to 101KVA of
JSPL, Madnatard, from Jharkhand Bijlee Vitran Nigam Limited.
38. Capacitor banks for BRM and WRM incorporated so as to improve the power factor to minimize the energy wastage.
39. Reduction of operational hours of air conditioner and lights while in lunch hour/non-prime hours in offices resulting into energy saving of around 6500KWH monthly – in process.
40. Reduction of operational hours (one hour) of street lights in summer season resulting into energy saving of around 10,686 KWH in a month.
41. Energy management system has been implemented by installing KWH meters to reduce the un-necessary usage of electricity.
Average per day KWH consumption before implementation
Average per day KWH consumption after
implementation10,724 4,800
42. Implemented practice of switching off all the drives, DCW pumps etc., if the rolling mill is on hold for more than 30 minutes to reduce energy consumption
43. Reduction in setup change time reduced the energy consumption as it resulted in reduced mill holding time for both WRM and BRM.
Raipur44. Ensuring Optimum Load size at time of using Heat Treatment
facility made possible by combining loads of Heat treatment furnace located in different shops. This helped reduce fuel consumption.
45. Material handling facilities available at all shops are used judiciously and proper checks and logs have been put in place to track usability of the same so as to avoid any misuse / over-use.
46. Monitoring mechanism put in place to avoid wastage and optimise consumption of LPG, DA, CO2 cylinders for fabrication / manufacturing.
47. Switching off High bay Lights in certain shops during night hours helped conserve energy.
48. Steel Melting carried out during night shifts since power consumption rates are less during the night.
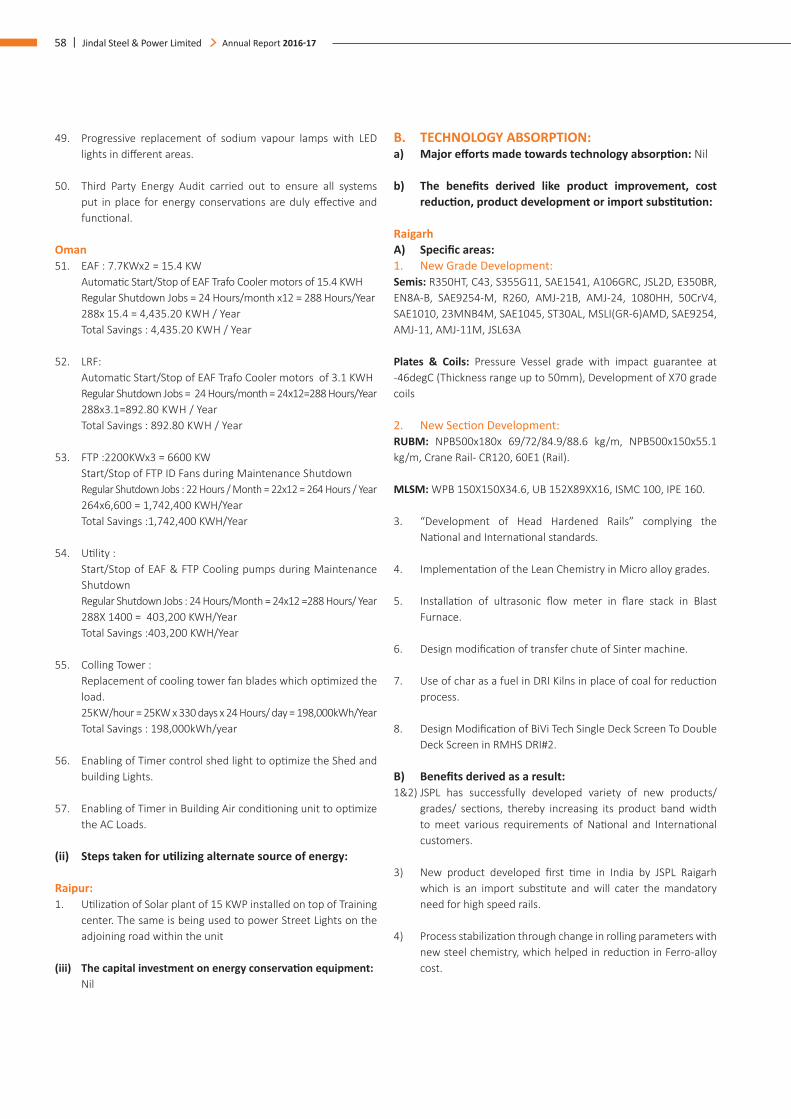
58 | Jindal Steel & Power Limited Annual Report 2016-17
49. Progressive replacement of sodium vapour lamps with LED lights in different areas.
50. Third Party Energy Audit carried out to ensure all systems put in place for energy conservations are duly effective and functional.
Oman 51. EAF : 7.7KWx2 = 15.4 KW Automatic Start/Stop of EAF Trafo Cooler motors of 15.4 KWH Regular Shutdown Jobs = 24 Hours/month x12 = 288 Hours/Year 288x 15.4 = 4,435.20 KWH / Year Total Savings : 4,435.20 KWH / Year
52. LRF: Automatic Start/Stop of EAF Trafo Cooler motors of 3.1 KWH Regular Shutdown Jobs = 24 Hours/month = 24x12=288 Hours/Year 288x3.1=892.80 KWH / Year Total Savings : 892.80 KWH / Year
53. FTP :2200KWx3 = 6600 KW Start/Stop of FTP ID Fans during Maintenance Shutdown
Regular Shutdown Jobs : 22 Hours / Month = 22x12 = 264 Hours / Year 264x6,600 = 1,742,400 KWH/Year Total Savings :1,742,400 KWH/Year
54. Utility : Start/Stop of EAF & FTP Cooling pumps during Maintenance
Shutdown Regular Shutdown Jobs : 24 Hours/Month = 24x12 =288 Hours/ Year 288X 1400 = 403,200 KWH/Year Total Savings :403,200 KWH/Year
55. Colling Tower : Replacement of cooling tower fan blades which optimized the
load. 25KW/hour = 25KW x 330 days x 24 Hours/ day = 198,000kWh/Year Total Savings : 198,000kWh/year
56. Enabling of Timer control shed light to optimize the Shed and building Lights.
57. Enabling of Timer in Building Air conditioning unit to optimize the AC Loads.
(ii) Steps taken for utilizing alternate source of energy:
Raipur:1. Utilization of Solar plant of 15 KWP installed on top of Training
center. The same is being used to power Street Lights on the adjoining road within the unit
(iii) The capital investment on energy conservation equipment: Nil
B. TECHNOLOGY ABSORPTION:a) Major efforts made towards technology absorption: Nil
b) The benefits derived like product improvement, cost reduction, product development or import substitution:
RaigarhA) Specific areas: 1. New Grade Development:Semis: R350HT, C43, S355G11, SAE1541, A106GRC, JSL2D, E350BR, EN8A-B, SAE9254-M, R260, AMJ-21B, AMJ-24, 1080HH, 50CrV4, SAE1010, 23MNB4M, SAE1045, ST30AL, MSLI(GR-6)AMD, SAE9254, AMJ-11, AMJ-11M, JSL63A
Plates & Coils: Pressure Vessel grade with impact guarantee at -46degC (Thickness range up to 50mm), Development of X70 grade coils
2. New Section Development:RUBM: NPB500x180x 69/72/84.9/88.6 kg/m, NPB500x150x55.1 kg/m, Crane Rail- CR120, 60E1 (Rail).
MLSM: WPB 150X150X34.6, UB 152X89XX16, ISMC 100, IPE 160.
3. “Development of Head Hardened Rails” complying the National and International standards.
4. Implementation of the Lean Chemistry in Micro alloy grades.
5. Installation of ultrasonic flow meter in flare stack in Blast Furnace.
6. Design modification of transfer chute of Sinter machine.
7. Use of char as a fuel in DRI Kilns in place of coal for reduction process.
8. Design Modification of BiVi Tech Single Deck Screen To Double Deck Screen in RMHS DRI#2.
B) Benefits derived as a result: 1&2) JSPL has successfully developed variety of new products/
grades/ sections, thereby increasing its product band width to meet various requirements of National and International customers.
3) New product developed first time in India by JSPL Raigarh which is an import substitute and will cater the mandatory need for high speed rails.
4) Process stabilization through change in rolling parameters with new steel chemistry, which helped in reduction in Ferro-alloy cost.

| 59Statutory Reports Annexures to Board’s Report
5) Accurate measurement of BF gas flaring.
6) Reduction of Sinter Fines %, Improvement in yield, Reduction in return sinter fine%.
7) Reduction in Coal Consumption Cost of production reduced.
8) Design modification done successfully in one of the screen (BiVi Tech screen). After modification, its performance is excellent as per DRI process requirement to separate required size material. There is also high cost benefit of this modified Double Deck screen system.
RaipurProduct Improvements: Rail Straightening Press Machines for Rail Universal Beam Mill (RUBM), Improvement in Pellet cars through addition of Ribs and by increasing thickness of Frames.
Cost Reduction:1. Entailed Saving of ̀ 40 Lakh in Machine shop by re-using Shafts
and Bearings in the New Support Rolls for JSPL Raigarh.
2. Helped improve cash flow of the unit by ` 3.07 crore through regular liquidation of Scraps, Off cuts and unusable steel inventory.
Product Development:1. 22 metre long Stabilizer Column & 33 metre Reactor Vessel
for UOP India (a Honeywell Company) for its Modular Penex Project.
2. 38 mm Thick Rich Amine Flash Drum (Vessel) bearing Diameter of 3000 mm & weighing 88 MT supplied to BPCL for Mumbai Refinery.
3. 7 Axle Bogie of Torpedo Ladle car for JSW Dolvi for its Blast Furnace.
Import Substitution1. Generated savings of ` 9.5 crore through import substitution
of Foundry products (CGP items).
2. Generated savings of ` 8.25 crore through import substitution of Rail Straightening press machines supplied to JSPL Raigarh.
Patratu:1. Three new sections of 23mm, 24mm and 25 mm are developed
at WRM with all in house technological developments and five new grades (SAE1022, SAE9254, S45C, SAE52100, 23MnB4M) of Wire Rod are developed and commercial production is also started.
2. New grade Fe550D is developed at BRM which led to complete paradigm shift of production from Fe500D to Fe550D.
C) IN CASE OF IMPORTED TECHNOLOGY (IMPORTED DURING THE LAST THREE YEARS RECKONED FROM THE BEGINNING OF THE FINANCIAL YEAR): Nil
D) Research and Development (R&D)
Raigarh:a) Expenditure on R & D during 2016-17: (` in crore) a. Revenue : 7.84 b. Capital : 0.60 (Cost of Machinery `147.72 crore) c. Total : 8.44
E) FOREIGN EXCHANGE EARNINGS & OUTGO:(` in crore)
S. No. Particulars 2016-17 2015-161 Earnings in Foreign Currency 2,339.68 658.842 Expenditure in Foreign Currency 119.92 198.08
For and on behalf of the Board of Directors
Naveen Jindal Place: New Delhi ChairmanDate: August 8, 2017 DIN: 00001523
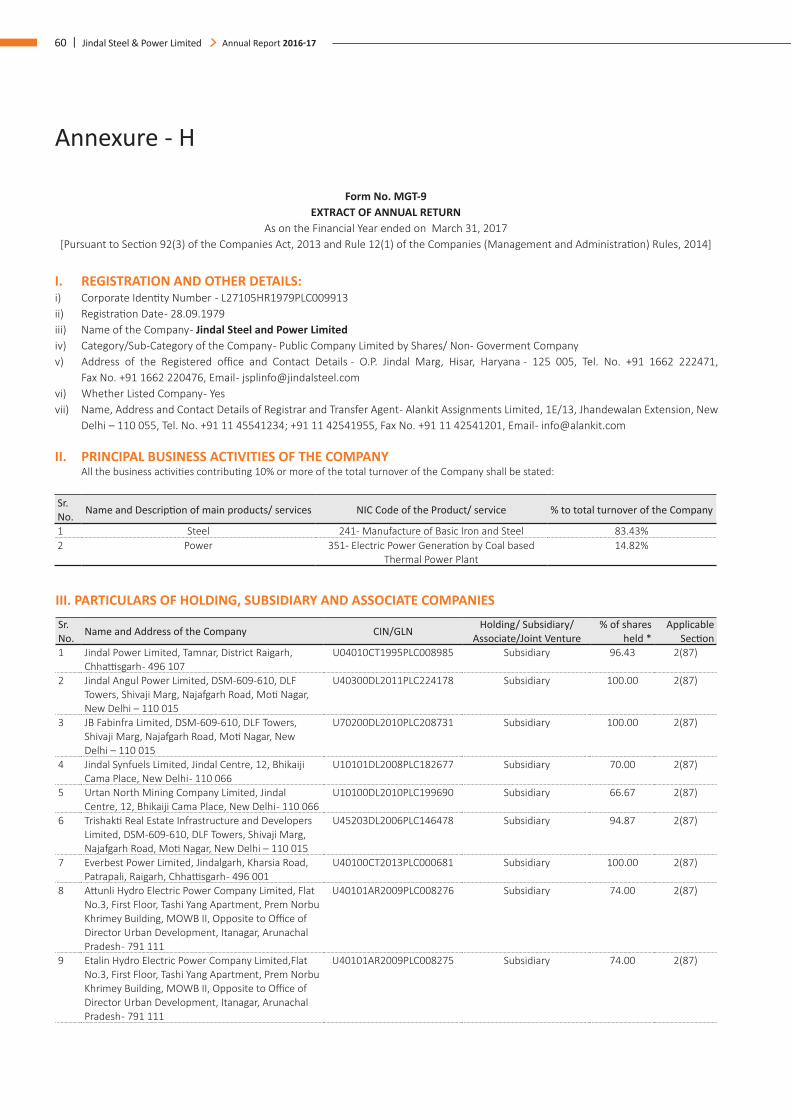
60 | Jindal Steel & Power Limited Annual Report 2016-17
Annexure - H
Form No. MGT-9 EXTRACT OF ANNUAL RETURN
As on the Financial Year ended on March 31, 2017[Pursuant to Section 92(3) of the Companies Act, 2013 and Rule 12(1) of the Companies (Management and Administration) Rules, 2014]
I. REGISTRATION AND OTHER DETAILS: i) Corporate Identity Number - L27105HR1979PLC009913 ii) Registration Date - 28.09.1979 iii) Name of the Company - Jindal Steel and Power Limited iv) Category/Sub-Category of the Company - Public Company Limited by Shares/ Non- Goverment Company v) Address of the Registered office and Contact Details - O.P. Jindal Marg, Hisar, Haryana - 125 005, Tel. No. +91 1662 222471,
Fax No. +91 1662 220476, Email - [email protected]) Whether Listed Company - Yes vii) Name, Address and Contact Details of Registrar and Transfer Agent - Alankit Assignments Limited, 1E/13, Jhandewalan Extension, New
Delhi – 110 055, Tel. No. +91 11 45541234; +91 11 42541955, Fax No. +91 11 42541201, Email - [email protected]
II. PRINCIPAL BUSINESS ACTIVITIES OF THE COMPANY All the business activities contributing 10% or more of the total turnover of the Company shall be stated:
Sr. No. Name and Description of main products/ services NIC Code of the Product/ service % to total turnover of the Company
1 Steel 241- Manufacture of Basic Iron and Steel 83.43%2 Power 351- Electric Power Generation by Coal based
Thermal Power Plant 14.82%
III. PARTICULARS OF HOLDING, SUBSIDIARY AND ASSOCIATE COMPANIES
Sr. No. Name and Address of the Company CIN/GLN Holding/ Subsidiary/
Associate/Joint Venture% of shares
held *Applicable
Section1 Jindal Power Limited, Tamnar, District Raigarh,
Chhattisgarh - 496 107U04010CT1995PLC008985 Subsidiary 96.43 2(87)
2 Jindal Angul Power Limited, DSM-609-610, DLF Towers, Shivaji Marg, Najafgarh Road, Moti Nagar, New Delhi – 110 015
U40300DL2011PLC224178 Subsidiary 100.00 2(87)
3 JB Fabinfra Limited, DSM-609-610, DLF Towers, Shivaji Marg, Najafgarh Road, Moti Nagar, New Delhi – 110 015
U70200DL2010PLC208731 Subsidiary 100.00 2(87)
4 Jindal Synfuels Limited, Jindal Centre, 12, Bhikaiji Cama Place, New Delhi - 110 066
U10101DL2008PLC182677 Subsidiary 70.00 2(87)
5 Urtan North Mining Company Limited, Jindal Centre, 12, Bhikaiji Cama Place, New Delhi - 110 066
U10100DL2010PLC199690 Subsidiary 66.67 2(87)
6 Trishakti Real Estate Infrastructure and Developers Limited, DSM-609-610, DLF Towers, Shivaji Marg, Najafgarh Road, Moti Nagar, New Delhi – 110 015
U45203DL2006PLC146478 Subsidiary 94.87 2(87)
7 Everbest Power Limited, Jindalgarh, Kharsia Road, Patrapali, Raigarh, Chhattisgarh - 496 001
U40100CT2013PLC000681 Subsidiary 100.00 2(87)
8 Attunli Hydro Electric Power Company Limited, Flat No.3, First Floor, Tashi Yang Apartment, Prem Norbu Khrimey Building, MOWB II, Opposite to Office of Director Urban Development, Itanagar, Arunachal Pradesh - 791 111
U40101AR2009PLC008276 Subsidiary 74.00 2(87)
9 Etalin Hydro Electric Power Company Limited,Flat No.3, First Floor, Tashi Yang Apartment, Prem Norbu Khrimey Building, MOWB II, Opposite to Office of Director Urban Development, Itanagar, Arunachal Pradesh - 791 111
U40101AR2009PLC008275 Subsidiary 74.00 2(87)
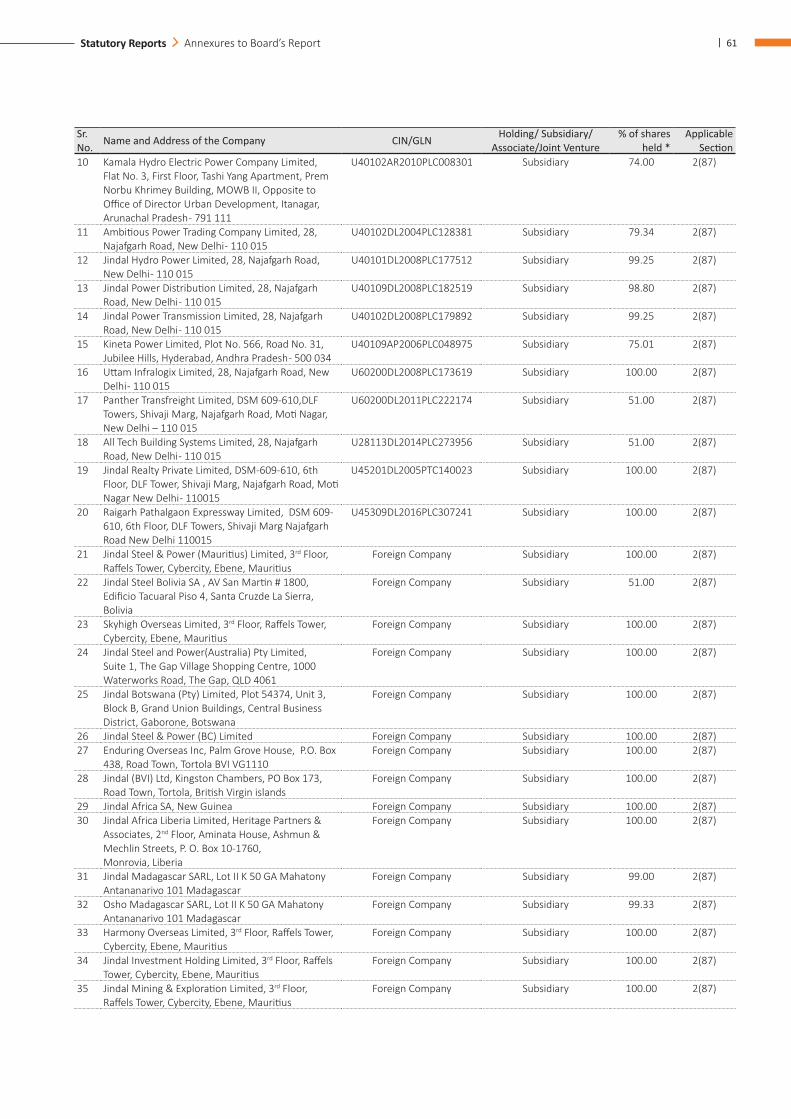
| 61Statutory Reports Annexures to Board’s Report
Sr. No. Name and Address of the Company CIN/GLN Holding/ Subsidiary/
Associate/Joint Venture% of shares
held *Applicable
Section10 Kamala Hydro Electric Power Company Limited,
Flat No. 3, First Floor, Tashi Yang Apartment, Prem Norbu Khrimey Building, MOWB II, Opposite to Office of Director Urban Development, Itanagar, Arunachal Pradesh - 791 111
U40102AR2010PLC008301 Subsidiary 74.00 2(87)
11 Ambitious Power Trading Company Limited, 28, Najafgarh Road, New Delhi - 110 015
U40102DL2004PLC128381 Subsidiary 79.34 2(87)
12 Jindal Hydro Power Limited, 28, Najafgarh Road, New Delhi - 110 015
U40101DL2008PLC177512 Subsidiary 99.25 2(87)
13 Jindal Power Distribution Limited, 28, Najafgarh Road, New Delhi - 110 015
U40109DL2008PLC182519 Subsidiary 98.80 2(87)
14 Jindal Power Transmission Limited, 28, Najafgarh Road, New Delhi - 110 015
U40102DL2008PLC179892 Subsidiary 99.25 2(87)
15 Kineta Power Limited, Plot No. 566, Road No. 31, Jubilee Hills, Hyderabad, Andhra Pradesh - 500 034
U40109AP2006PLC048975 Subsidiary 75.01 2(87)
16 Uttam Infralogix Limited, 28, Najafgarh Road, New Delhi - 110 015
U60200DL2008PLC173619 Subsidiary 100.00 2(87)
17 Panther Transfreight Limited, DSM 609-610,DLF Towers, Shivaji Marg, Najafgarh Road, Moti Nagar, New Delhi – 110 015
U60200DL2011PLC222174 Subsidiary 51.00 2(87)
18 All Tech Building Systems Limited, 28, Najafgarh Road, New Delhi - 110 015
U28113DL2014PLC273956 Subsidiary 51.00 2(87)
19 Jindal Realty Private Limited, DSM-609-610, 6th Floor, DLF Tower, Shivaji Marg, Najafgarh Road, Moti Nagar New Delhi - 110015
U45201DL2005PTC140023 Subsidiary 100.00 2(87)
20 Raigarh Pathalgaon Expressway Limited, DSM 609-610, 6th Floor, DLF Towers, Shivaji Marg Najafgarh Road New Delhi 110015
U45309DL2016PLC307241 Subsidiary 100.00 2(87)
21 Jindal Steel & Power (Mauritius) Limited, 3rd Floor, Raffels Tower, Cybercity, Ebene, Mauritius
Foreign Company Subsidiary 100.00 2(87)
22 Jindal Steel Bolivia SA , AV San Martin # 1800, Edificio Tacuaral Piso 4, Santa Cruzde La Sierra, Bolivia
Foreign Company Subsidiary 51.00 2(87)
23 Skyhigh Overseas Limited, 3rd Floor, Raffels Tower, Cybercity, Ebene, Mauritius
Foreign Company Subsidiary 100.00 2(87)
24 Jindal Steel and Power(Australia) Pty Limited, Suite 1, The Gap Village Shopping Centre, 1000 Waterworks Road, The Gap, QLD 4061
Foreign Company Subsidiary 100.00 2(87)
25 Jindal Botswana (Pty) Limited, Plot 54374, Unit 3, Block B, Grand Union Buildings, Central Business District, Gaborone, Botswana
Foreign Company Subsidiary 100.00 2(87)
26 Jindal Steel & Power (BC) Limited Foreign Company Subsidiary 100.00 2(87)27 Enduring Overseas Inc, Palm Grove House, P.O. Box
438, Road Town, Tortola BVI VG1110Foreign Company Subsidiary 100.00 2(87)
28 Jindal (BVI) Ltd, Kingston Chambers, PO Box 173, Road Town, Tortola, British Virgin islands
Foreign Company Subsidiary 100.00 2(87)
29 Jindal Africa SA, New Guinea Foreign Company Subsidiary 100.00 2(87)30 Jindal Africa Liberia Limited, Heritage Partners &
Associates, 2nd Floor, Aminata House, Ashmun & Mechlin Streets, P. O. Box 10-1760, Monrovia, Liberia
Foreign Company Subsidiary 100.00 2(87)
31 Jindal Madagascar SARL, Lot II K 50 GA Mahatony Antananarivo 101 Madagascar
Foreign Company Subsidiary 99.00 2(87)
32 Osho Madagascar SARL, Lot II K 50 GA Mahatony Antananarivo 101 Madagascar
Foreign Company Subsidiary 99.33 2(87)
33 Harmony Overseas Limited, 3rd Floor, Raffels Tower, Cybercity, Ebene, Mauritius
Foreign Company Subsidiary 100.00 2(87)
34 Jindal Investment Holding Limited, 3rd Floor, Raffels Tower, Cybercity, Ebene, Mauritius
Foreign Company Subsidiary 100.00 2(87)
35 Jindal Mining & Exploration Limited, 3rd Floor, Raffels Tower, Cybercity, Ebene, Mauritius
Foreign Company Subsidiary 100.00 2(87)
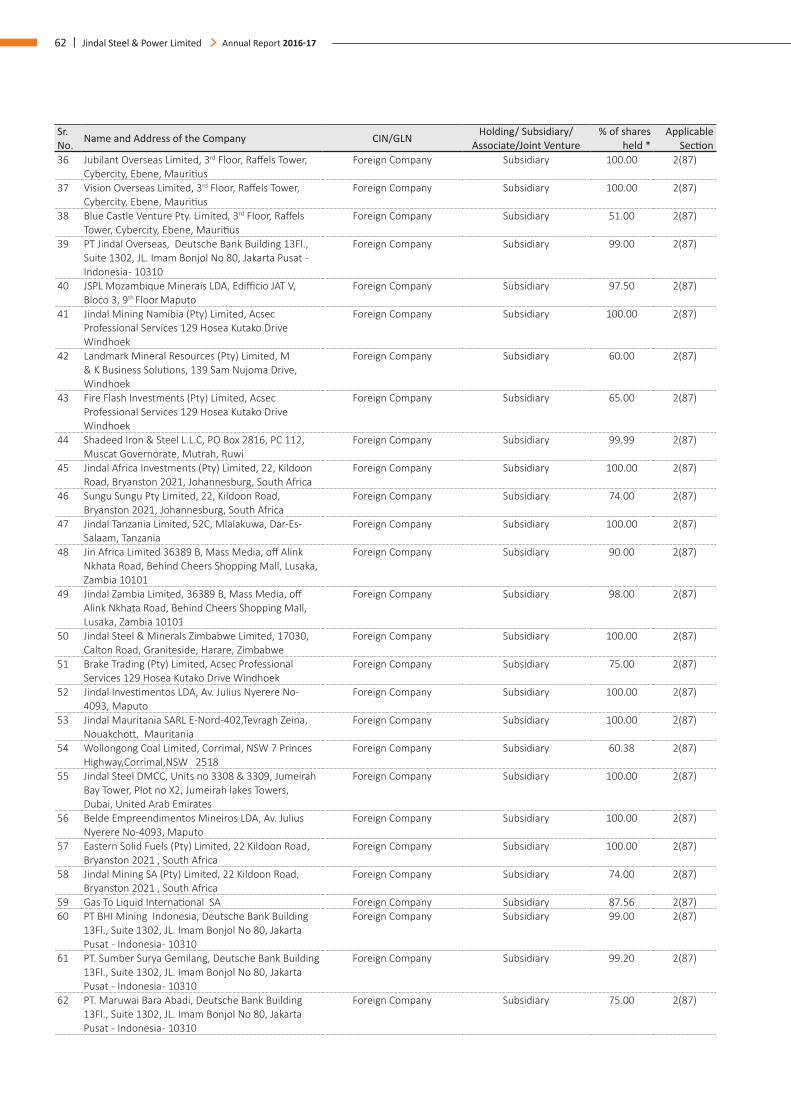
62 | Jindal Steel & Power Limited Annual Report 2016-17
Sr. No. Name and Address of the Company CIN/GLN Holding/ Subsidiary/
Associate/Joint Venture% of shares
held *Applicable
Section36 Jubilant Overseas Limited, 3rd Floor, Raffels Tower,
Cybercity, Ebene, MauritiusForeign Company Subsidiary 100.00 2(87)
37 Vision Overseas Limited, 3rd Floor, Raffels Tower, Cybercity, Ebene, Mauritius
Foreign Company Subsidiary 100.00 2(87)
38 Blue Castle Venture Pty. Limited, 3rd Floor, Raffels Tower, Cybercity, Ebene, Mauritius
Foreign Company Subsidiary 51.00 2(87)
39 PT Jindal Overseas, Deutsche Bank Building 13Fl., Suite 1302, JL. Imam Bonjol No 80, Jakarta Pusat - Indonesia - 10310
Foreign Company Subsidiary 99.00 2(87)
40 JSPL Mozambique Minerais LDA, Edifficio JAT V, Bloco 3, 9th Floor Maputo
Foreign Company Subsidiary 97.50 2(87)
41 Jindal Mining Namibia (Pty) Limited, Acsec Professional Services 129 Hosea Kutako Drive Windhoek
Foreign Company Subsidiary 100.00 2(87)
42 Landmark Mineral Resources (Pty) Limited, M & K Business Solutions, 139 Sam Nujoma Drive, Windhoek
Foreign Company Subsidiary 60.00 2(87)
43 Fire Flash Investments (Pty) Limited, Acsec Professional Services 129 Hosea Kutako Drive Windhoek
Foreign Company Subsidiary 65.00 2(87)
44 Shadeed Iron & Steel L.L.C, PO Box 2816, PC 112, Muscat Governorate, Mutrah, Ruwi
Foreign Company Subsidiary 99.99 2(87)
45 Jindal Africa Investments (Pty) Limited, 22, Kildoon Road, Bryanston 2021, Johannesburg, South Africa
Foreign Company Subsidiary 100.00 2(87)
46 Sungu Sungu Pty Limited, 22, Kildoon Road, Bryanston 2021, Johannesburg, South Africa
Foreign Company Subsidiary 74.00 2(87)
47 Jindal Tanzania Limited, 52C, Mlalakuwa, Dar-Es-Salaam, Tanzania
Foreign Company Subsidiary 100.00 2(87)
48 Jin Africa Limited 36389 B, Mass Media, off Alink Nkhata Road, Behind Cheers Shopping Mall, Lusaka,Zambia 10101
Foreign Company Subsidiary 90.00 2(87)
49 Jindal Zambia Limited, 36389 B, Mass Media, off Alink Nkhata Road, Behind Cheers Shopping Mall, Lusaka, Zambia 10101
Foreign Company Subsidiary 98.00 2(87)
50 Jindal Steel & Minerals Zimbabwe Limited, 17030, Calton Road, Graniteside, Harare, Zimbabwe
Foreign Company Subsidiary 100.00 2(87)
51 Brake Trading (Pty) Limited, Acsec Professional Services 129 Hosea Kutako Drive Windhoek
Foreign Company Subsidiary 75.00 2(87)
52 Jindal Investimentos LDA, Av. Julius Nyerere No-4093, Maputo
Foreign Company Subsidiary 100.00 2(87)
53 Jindal Mauritania SARL E-Nord-402,Tevragh Zeina, Nouakchott, Mauritania
Foreign Company Subsidiary 100.00 2(87)
54 Wollongong Coal Limited, Corrimal, NSW 7 Princes Highway,Corrimal,NSW 2518
Foreign Company Subsidiary 60.38 2(87)
55 Jindal Steel DMCC, Units no 3308 & 3309, Jumeirah Bay Tower, Plot no X2, Jumeirah lakes Towers, Dubai, United Arab Emirates
Foreign Company Subsidiary 100.00 2(87)
56 Belde Empreendimentos Mineiros LDA, Av. Julius Nyerere No-4093, Maputo
Foreign Company Subsidiary 100.00 2(87)
57 Eastern Solid Fuels (Pty) Limited, 22 Kildoon Road, Bryanston 2021 , South Africa
Foreign Company Subsidiary 100.00 2(87)
58 Jindal Mining SA (Pty) Limited, 22 Kildoon Road, Bryanston 2021 , South Africa
Foreign Company Subsidiary 74.00 2(87)
59 Gas To Liquid International SA Foreign Company Subsidiary 87.56 2(87)60 PT BHI Mining Indonesia, Deutsche Bank Building
13Fl., Suite 1302, JL. Imam Bonjol No 80, Jakarta Pusat - Indonesia - 10310
Foreign Company Subsidiary 99.00 2(87)
61 PT. Sumber Surya Gemilang, Deutsche Bank Building 13Fl., Suite 1302, JL. Imam Bonjol No 80, Jakarta Pusat - Indonesia - 10310
Foreign Company Subsidiary 99.20 2(87)
62 PT. Maruwai Bara Abadi, Deutsche Bank Building 13Fl., Suite 1302, JL. Imam Bonjol No 80, Jakarta Pusat - Indonesia - 10310
Foreign Company Subsidiary 75.00 2(87)
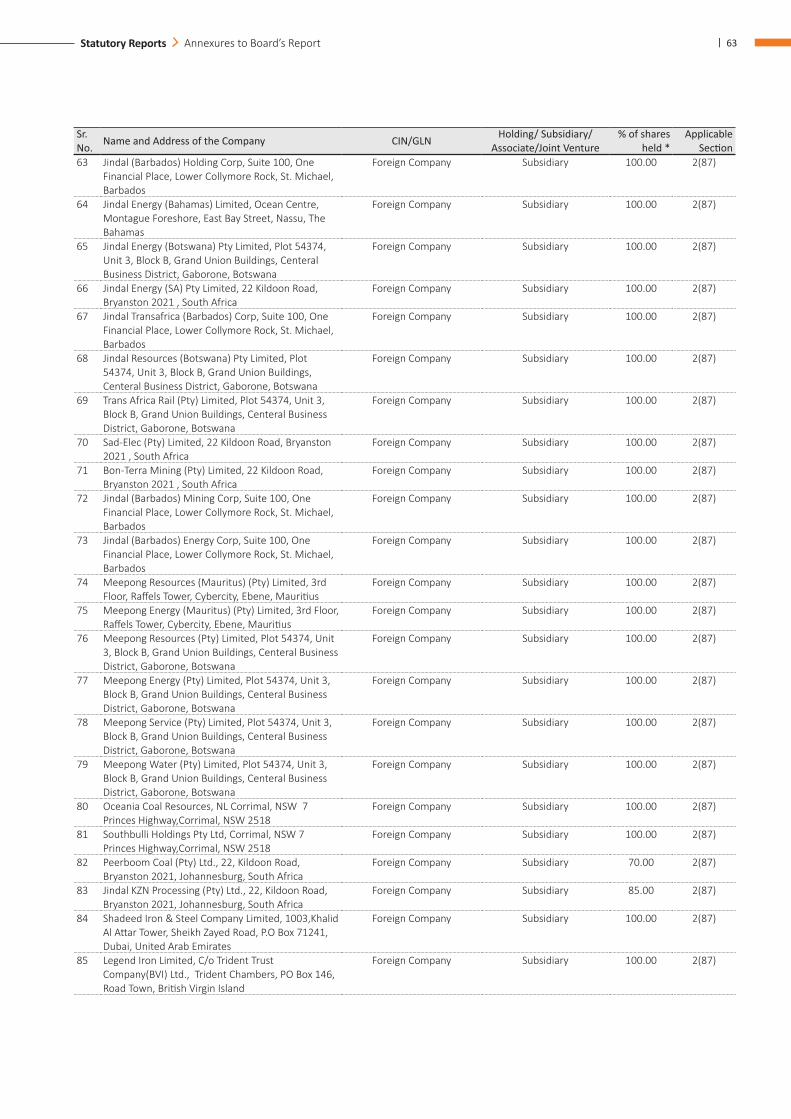
| 63Statutory Reports Annexures to Board’s Report
Sr. No. Name and Address of the Company CIN/GLN Holding/ Subsidiary/
Associate/Joint Venture% of shares
held *Applicable
Section63 Jindal (Barbados) Holding Corp, Suite 100, One
Financial Place, Lower Collymore Rock, St. Michael, Barbados
Foreign Company Subsidiary 100.00 2(87)
64 Jindal Energy (Bahamas) Limited, Ocean Centre, Montague Foreshore, East Bay Street, Nassu, The Bahamas
Foreign Company Subsidiary 100.00 2(87)
65 Jindal Energy (Botswana) Pty Limited, Plot 54374, Unit 3, Block B, Grand Union Buildings, Centeral Business District, Gaborone, Botswana
Foreign Company Subsidiary 100.00 2(87)
66 Jindal Energy (SA) Pty Limited, 22 Kildoon Road, Bryanston 2021 , South Africa
Foreign Company Subsidiary 100.00 2(87)
67 Jindal Transafrica (Barbados) Corp, Suite 100, One Financial Place, Lower Collymore Rock, St. Michael, Barbados
Foreign Company Subsidiary 100.00 2(87)
68 Jindal Resources (Botswana) Pty Limited, Plot 54374, Unit 3, Block B, Grand Union Buildings, Centeral Business District, Gaborone, Botswana
Foreign Company Subsidiary 100.00 2(87)
69 Trans Africa Rail (Pty) Limited, Plot 54374, Unit 3, Block B, Grand Union Buildings, Centeral Business District, Gaborone, Botswana
Foreign Company Subsidiary 100.00 2(87)
70 Sad-Elec (Pty) Limited, 22 Kildoon Road, Bryanston 2021 , South Africa
Foreign Company Subsidiary 100.00 2(87)
71 Bon-Terra Mining (Pty) Limited, 22 Kildoon Road, Bryanston 2021 , South Africa
Foreign Company Subsidiary 100.00 2(87)
72 Jindal (Barbados) Mining Corp, Suite 100, One Financial Place, Lower Collymore Rock, St. Michael, Barbados
Foreign Company Subsidiary 100.00 2(87)
73 Jindal (Barbados) Energy Corp, Suite 100, One Financial Place, Lower Collymore Rock, St. Michael, Barbados
Foreign Company Subsidiary 100.00 2(87)
74 Meepong Resources (Mauritus) (Pty) Limited, 3rd Floor, Raffels Tower, Cybercity, Ebene, Mauritius
Foreign Company Subsidiary 100.00 2(87)
75 Meepong Energy (Mauritus) (Pty) Limited, 3rd Floor, Raffels Tower, Cybercity, Ebene, Mauritius
Foreign Company Subsidiary 100.00 2(87)
76 Meepong Resources (Pty) Limited, Plot 54374, Unit 3, Block B, Grand Union Buildings, Centeral Business District, Gaborone, Botswana
Foreign Company Subsidiary 100.00 2(87)
77 Meepong Energy (Pty) Limited, Plot 54374, Unit 3, Block B, Grand Union Buildings, Centeral Business District, Gaborone, Botswana
Foreign Company Subsidiary 100.00 2(87)
78 Meepong Service (Pty) Limited, Plot 54374, Unit 3, Block B, Grand Union Buildings, Centeral Business District, Gaborone, Botswana
Foreign Company Subsidiary 100.00 2(87)
79 Meepong Water (Pty) Limited, Plot 54374, Unit 3, Block B, Grand Union Buildings, Centeral Business District, Gaborone, Botswana
Foreign Company Subsidiary 100.00 2(87)
80 Oceania Coal Resources, NL Corrimal, NSW 7 Princes Highway,Corrimal, NSW 2518
Foreign Company Subsidiary 100.00 2(87)
81 Southbulli Holdings Pty Ltd, Corrimal, NSW 7 Princes Highway,Corrimal, NSW 2518
Foreign Company Subsidiary 100.00 2(87)
82 Peerboom Coal (Pty) Ltd., 22, Kildoon Road, Bryanston 2021, Johannesburg, South Africa
Foreign Company Subsidiary 70.00 2(87)
83 Jindal KZN Processing (Pty) Ltd., 22, Kildoon Road, Bryanston 2021, Johannesburg, South Africa
Foreign Company Subsidiary 85.00 2(87)
84 Shadeed Iron & Steel Company Limited, 1003,Khalid Al Attar Tower, Sheikh Zayed Road, P.O Box 71241, Dubai, United Arab Emirates
Foreign Company Subsidiary 100.00 2(87)
85 Legend Iron Limited, C/o Trident Trust Company(BVI) Ltd., Trident Chambers, PO Box 146, Road Town, British Virgin Island
Foreign Company Subsidiary 100.00 2(87)
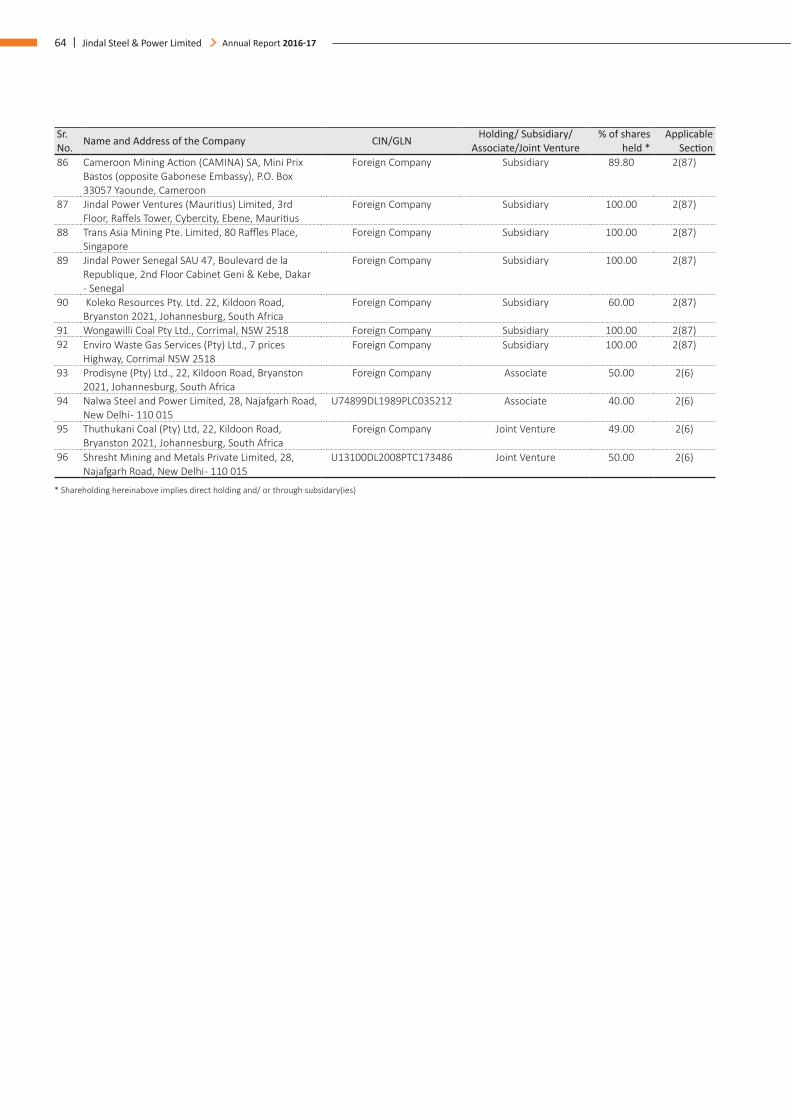
64 | Jindal Steel & Power Limited Annual Report 2016-17
Sr. No. Name and Address of the Company CIN/GLN Holding/ Subsidiary/
Associate/Joint Venture% of shares
held *Applicable
Section86 Cameroon Mining Action (CAMINA) SA, Mini Prix
Bastos (opposite Gabonese Embassy), P.O. Box 33057 Yaounde, Cameroon
Foreign Company Subsidiary 89.80 2(87)
87 Jindal Power Ventures (Mauritius) Limited, 3rd Floor, Raffels Tower, Cybercity, Ebene, Mauritius
Foreign Company Subsidiary 100.00 2(87)
88 Trans Asia Mining Pte. Limited, 80 Raffles Place, Singapore
Foreign Company Subsidiary 100.00 2(87)
89 Jindal Power Senegal SAU 47, Boulevard de la Republique, 2nd Floor Cabinet Geni & Kebe, Dakar - Senegal
Foreign Company Subsidiary 100.00 2(87)
90 Koleko Resources Pty. Ltd. 22, Kildoon Road, Bryanston 2021, Johannesburg, South Africa
Foreign Company Subsidiary 60.00 2(87)
91 Wongawilli Coal Pty Ltd., Corrimal, NSW 2518 Foreign Company Subsidiary 100.00 2(87)92 Enviro Waste Gas Services (Pty) Ltd., 7 prices
Highway, Corrimal NSW 2518Foreign Company Subsidiary 100.00 2(87)
93 Prodisyne (Pty) Ltd., 22, Kildoon Road, Bryanston 2021, Johannesburg, South Africa
Foreign Company Associate 50.00 2(6)
94 Nalwa Steel and Power Limited, 28, Najafgarh Road, New Delhi - 110 015
U74899DL1989PLC035212 Associate 40.00 2(6)
95 Thuthukani Coal (Pty) Ltd, 22, Kildoon Road, Bryanston 2021, Johannesburg, South Africa
Foreign Company Joint Venture 49.00 2(6)
96 Shresht Mining and Metals Private Limited, 28, Najafgarh Road, New Delhi - 110 015
U13100DL2008PTC173486 Joint Venture 50.00 2(6)
* Shareholding hereinabove implies direct holding and/ or through subsidary(ies)
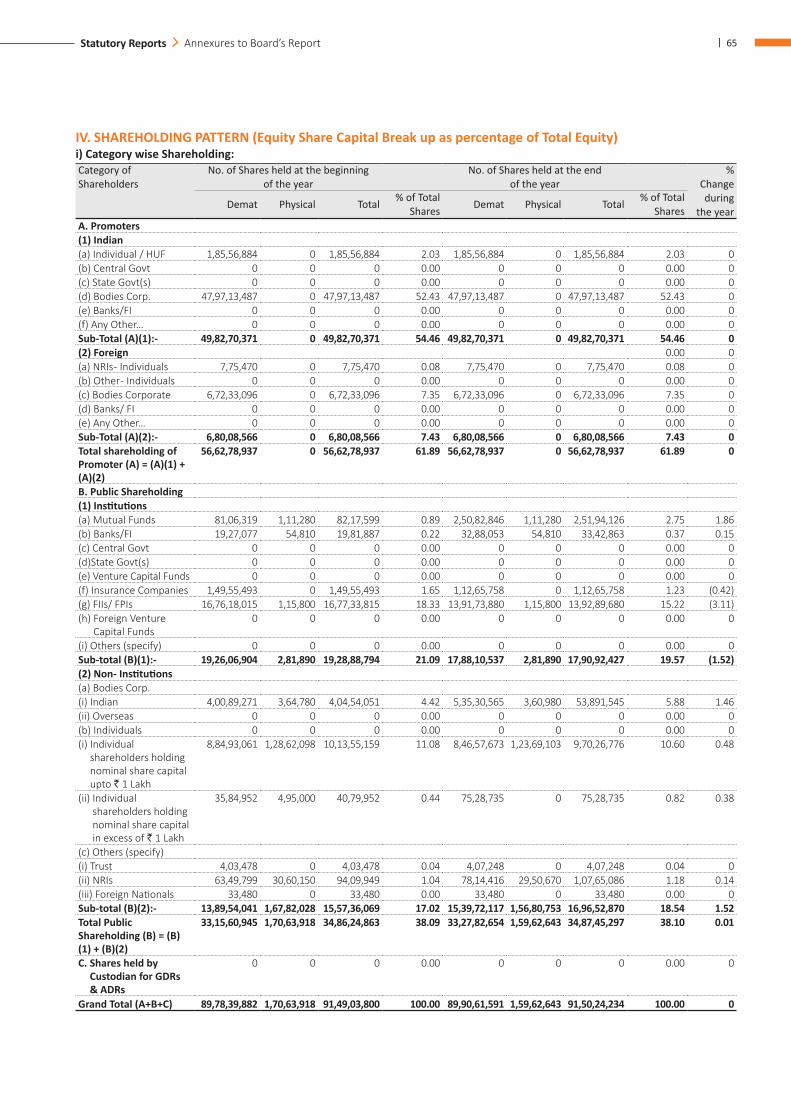
| 65Statutory Reports Annexures to Board’s Report
IV. SHAREHOLDING PATTERN (Equity Share Capital Break up as percentage of Total Equity) i) Category wise Shareholding: Category of Shareholders
No. of Shares held at the beginning of the year
No. of Shares held at the end of the year
% Change during
the year Demat Physical Total % of Total
Shares Demat Physical Total % of Total Shares
A. Promoters(1) Indian(a) Individual / HUF 1,85,56,884 0 1,85,56,884 2.03 1,85,56,884 0 1,85,56,884 2.03 0(b) Central Govt 0 0 0 0.00 0 0 0 0.00 0(c) State Govt(s) 0 0 0 0.00 0 0 0 0.00 0(d) Bodies Corp. 47,97,13,487 0 47,97,13,487 52.43 47,97,13,487 0 47,97,13,487 52.43 0(e) Banks/FI 0 0 0 0.00 0 0 0 0.00 0(f) Any Other… 0 0 0 0.00 0 0 0 0.00 0Sub-Total (A)(1):- 49,82,70,371 0 49,82,70,371 54.46 49,82,70,371 0 49,82,70,371 54.46 0(2) Foreign 0.00 0(a) NRIs - Individuals 7,75,470 0 7,75,470 0.08 7,75,470 0 7,75,470 0.08 0(b) Other - Individuals 0 0 0 0.00 0 0 0 0.00 0(c) Bodies Corporate 6,72,33,096 0 6,72,33,096 7.35 6,72,33,096 0 6,72,33,096 7.35 0(d) Banks/ FI 0 0 0 0.00 0 0 0 0.00 0(e) Any Other… 0 0 0 0.00 0 0 0 0.00 0Sub-Total (A)(2):- 6,80,08,566 0 6,80,08,566 7.43 6,80,08,566 0 6,80,08,566 7.43 0Total shareholding of Promoter (A) = (A)(1) + (A)(2)
56,62,78,937 0 56,62,78,937 61.89 56,62,78,937 0 56,62,78,937 61.89 0
B. Public Shareholding(1) Institutions(a) Mutual Funds 81,06,319 1,11,280 82,17,599 0.89 2,50,82,846 1,11,280 2,51,94,126 2.75 1.86(b) Banks/FI 19,27,077 54,810 19,81,887 0.22 32,88,053 54,810 33,42,863 0.37 0.15(c) Central Govt 0 0 0 0.00 0 0 0 0.00 0(d)State Govt(s) 0 0 0 0.00 0 0 0 0.00 0(e) Venture Capital Funds 0 0 0 0.00 0 0 0 0.00 0(f) Insurance Companies 1,49,55,493 0 1,49,55,493 1.65 1,12,65,758 0 1,12,65,758 1.23 (0.42)(g) FIIs/ FPIs 16,76,18,015 1,15,800 16,77,33,815 18.33 13,91,73,880 1,15,800 13,92,89,680 15.22 (3.11)(h) Foreign Venture
Capital Funds0 0 0 0.00 0 0 0 0.00 0
(i) Others (specify) 0 0 0 0.00 0 0 0 0.00 0Sub-total (B)(1):- 19,26,06,904 2,81,890 19,28,88,794 21.09 17,88,10,537 2,81,890 17,90,92,427 19.57 (1.52)(2) Non- Institutions(a) Bodies Corp.(i) Indian 4,00,89,271 3,64,780 4,04,54,051 4.42 5,35,30,565 3,60,980 53,891,545 5.88 1.46(ii) Overseas 0 0 0 0.00 0 0 0 0.00 0(b) Individuals 0 0 0 0.00 0 0 0 0.00 0(i) Individual
shareholders holding nominal share capital upto ` 1 Lakh
8,84,93,061 1,28,62,098 10,13,55,159 11.08 8,46,57,673 1,23,69,103 9,70,26,776 10.60 0.48
(ii) Individual shareholders holding nominal share capital in excess of ` 1 Lakh
35,84,952 4,95,000 40,79,952 0.44 75,28,735 0 75,28,735 0.82 0.38
(c) Others (specify)(i) Trust 4,03,478 0 4,03,478 0.04 4,07,248 0 4,07,248 0.04 0(ii) NRIs 63,49,799 30,60,150 94,09,949 1.04 78,14,416 29,50,670 1,07,65,086 1.18 0.14(iii) Foreign Nationals 33,480 0 33,480 0.00 33,480 0 33,480 0.00 0Sub-total (B)(2):- 13,89,54,041 1,67,82,028 15,57,36,069 17.02 15,39,72,117 1,56,80,753 16,96,52,870 18.54 1.52Total Public Shareholding (B) = (B)(1) + (B)(2)
33,15,60,945 1,70,63,918 34,86,24,863 38.09 33,27,82,654 1,59,62,643 34,87,45,297 38.10 0.01
C. Shares held by Custodian for GDRs & ADRs
0 0 0 0.00 0 0 0 0.00 0
Grand Total (A+B+C) 89,78,39,882 1,70,63,918 91,49,03,800 100.00 89,90,61,591 1,59,62,643 91,50,24,234 100.00 0
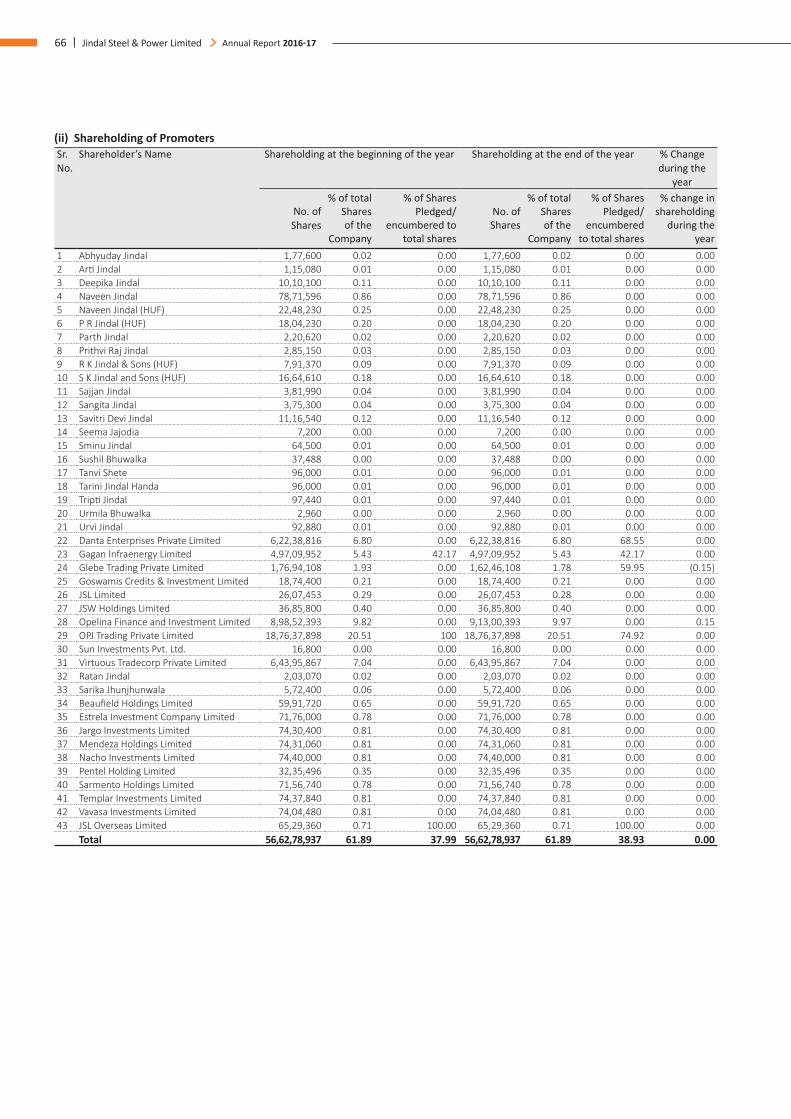
66 | Jindal Steel & Power Limited Annual Report 2016-17
(ii) Shareholding of Promoters Sr. No.
Shareholder’s Name Shareholding at the beginning of the year Shareholding at the end of the year % Change during the
year
No. of Shares
% of total Shares of the
Company
% of Shares Pledged/
encumbered to total shares
No. of Shares
% of total Shares of the
Company
% of Shares Pledged/
encumbered to total shares
% change in shareholding
during the year
1 Abhyuday Jindal 1,77,600 0.02 0.00 1,77,600 0.02 0.00 0.002 Arti Jindal 1,15,080 0.01 0.00 1,15,080 0.01 0.00 0.003 Deepika Jindal 10,10,100 0.11 0.00 10,10,100 0.11 0.00 0.004 Naveen Jindal 78,71,596 0.86 0.00 78,71,596 0.86 0.00 0.005 Naveen Jindal (HUF) 22,48,230 0.25 0.00 22,48,230 0.25 0.00 0.006 P R Jindal (HUF) 18,04,230 0.20 0.00 18,04,230 0.20 0.00 0.007 Parth Jindal 2,20,620 0.02 0.00 2,20,620 0.02 0.00 0.008 Prithvi Raj Jindal 2,85,150 0.03 0.00 2,85,150 0.03 0.00 0.009 R K Jindal & Sons (HUF) 7,91,370 0.09 0.00 7,91,370 0.09 0.00 0.0010 S K Jindal and Sons (HUF) 16,64,610 0.18 0.00 16,64,610 0.18 0.00 0.0011 Sajjan Jindal 3,81,990 0.04 0.00 3,81,990 0.04 0.00 0.0012 Sangita Jindal 3,75,300 0.04 0.00 3,75,300 0.04 0.00 0.0013 Savitri Devi Jindal 11,16,540 0.12 0.00 11,16,540 0.12 0.00 0.0014 Seema Jajodia 7,200 0.00 0.00 7,200 0.00 0.00 0.0015 Sminu Jindal 64,500 0.01 0.00 64,500 0.01 0.00 0.0016 Sushil Bhuwalka 37,488 0.00 0.00 37,488 0.00 0.00 0.0017 Tanvi Shete 96,000 0.01 0.00 96,000 0.01 0.00 0.0018 Tarini Jindal Handa 96,000 0.01 0.00 96,000 0.01 0.00 0.0019 Tripti Jindal 97,440 0.01 0.00 97,440 0.01 0.00 0.0020 Urmila Bhuwalka 2,960 0.00 0.00 2,960 0.00 0.00 0.0021 Urvi Jindal 92,880 0.01 0.00 92,880 0.01 0.00 0.0022 Danta Enterprises Private Limited 6,22,38,816 6.80 0.00 6,22,38,816 6.80 68.55 0.0023 Gagan Infraenergy Limited 4,97,09,952 5.43 42.17 4,97,09,952 5.43 42.17 0.0024 Glebe Trading Private Limited 1,76,94,108 1.93 0.00 1,62,46,108 1.78 59.95 (0.15)25 Goswamis Credits & Investment Limited 18,74,400 0.21 0.00 18,74,400 0.21 0.00 0.0026 JSL Limited 26,07,453 0.29 0.00 26,07,453 0.28 0.00 0.0027 JSW Holdings Limited 36,85,800 0.40 0.00 36,85,800 0.40 0.00 0.0028 Opelina Finance and Investment Limited 8,98,52,393 9.82 0.00 9,13,00,393 9.97 0.00 0.1529 OPJ Trading Private Limited 18,76,37,898 20.51 100 18,76,37,898 20.51 74.92 0.0030 Sun Investments Pvt. Ltd. 16,800 0.00 0.00 16,800 0.00 0.00 0.0031 Virtuous Tradecorp Private Limited 6,43,95,867 7.04 0.00 6,43,95,867 7.04 0.00 0.0032 Ratan Jindal 2,03,070 0.02 0.00 2,03,070 0.02 0.00 0.0033 Sarika Jhunjhunwala 5,72,400 0.06 0.00 5,72,400 0.06 0.00 0.0034 Beaufield Holdings Limited 59,91,720 0.65 0.00 59,91,720 0.65 0.00 0.0035 Estrela Investment Company Limited 71,76,000 0.78 0.00 71,76,000 0.78 0.00 0.0036 Jargo Investments Limited 74,30,400 0.81 0.00 74,30,400 0.81 0.00 0.0037 Mendeza Holdings Limited 74,31,060 0.81 0.00 74,31,060 0.81 0.00 0.0038 Nacho Investments Limited 74,40,000 0.81 0.00 74,40,000 0.81 0.00 0.0039 Pentel Holding Limited 32,35,496 0.35 0.00 32,35,496 0.35 0.00 0.0040 Sarmento Holdings Limited 71,56,740 0.78 0.00 71,56,740 0.78 0.00 0.0041 Templar Investments Limited 74,37,840 0.81 0.00 74,37,840 0.81 0.00 0.0042 Vavasa Investments Limited 74,04,480 0.81 0.00 74,04,480 0.81 0.00 0.0043 JSL Overseas Limited 65,29,360 0.71 100.00 65,29,360 0.71 100.00 0.00
Total 56,62,78,937 61.89 37.99 56,62,78,937 61.89 38.93 0.00
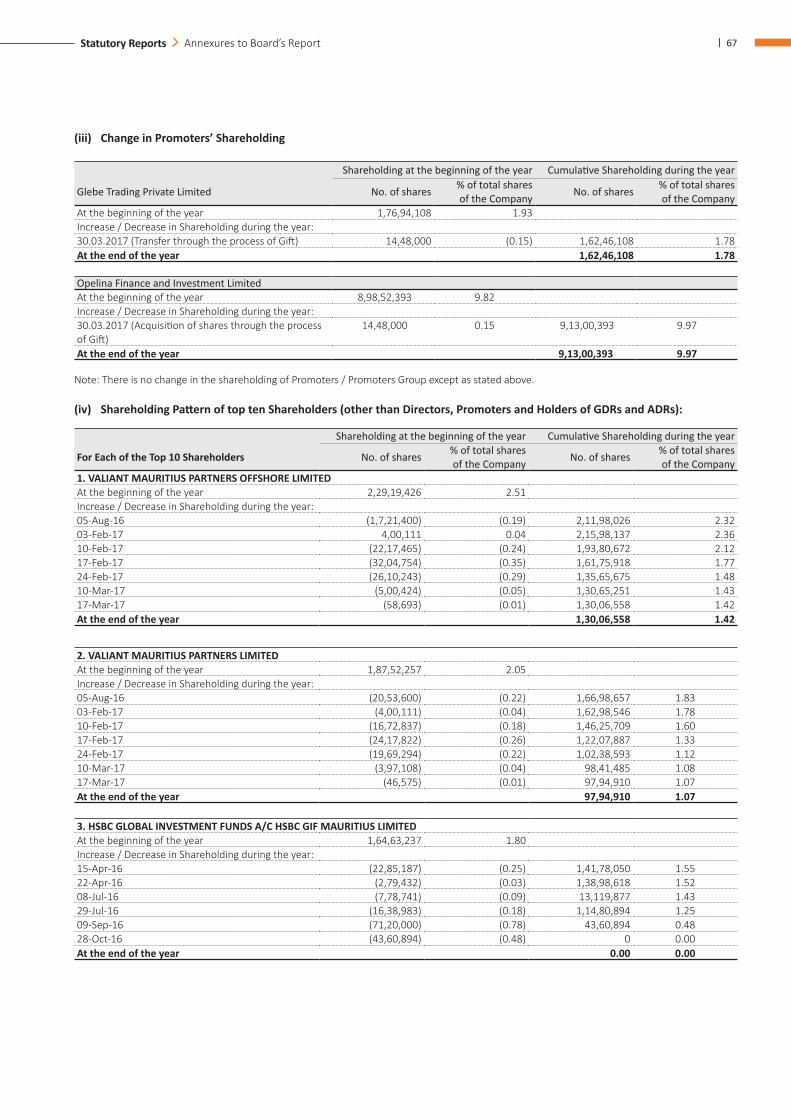
| 67Statutory Reports Annexures to Board’s Report
(iii) Change in Promoters’ Shareholding
Shareholding at the beginning of the year Cumulative Shareholding during the year
Glebe Trading Private Limited No. of shares % of total shares of the Company No. of shares % of total shares
of the CompanyAt the beginning of the year 1,76,94,108 1.93 Increase / Decrease in Shareholding during the year:30.03.2017 (Transfer through the process of Gift) 14,48,000 (0.15) 1,62,46,108 1.78At the end of the year 1,62,46,108 1.78
Opelina Finance and Investment Limited At the beginning of the year 8,98,52,393 9.82Increase / Decrease in Shareholding during the year:30.03.2017 (Acquisition of shares through the process of Gift)
14,48,000 0.15 9,13,00,393 9.97
At the end of the year 9,13,00,393 9.97
Note: There is no change in the shareholding of Promoters / Promoters Group except as stated above.
(iv) Shareholding Pattern of top ten Shareholders (other than Directors, Promoters and Holders of GDRs and ADRs):
Shareholding at the beginning of the year Cumulative Shareholding during the year
For Each of the Top 10 Shareholders No. of shares % of total shares of the Company No. of shares % of total shares
of the Company1. VALIANT MAURITIUS PARTNERS OFFSHORE LIMITEDAt the beginning of the year 2,29,19,426 2.51Increase / Decrease in Shareholding during the year:05-Aug-16 (1,7,21,400) (0.19) 2,11,98,026 2.3203-Feb-17 4,00,111 0.04 2,15,98,137 2.3610-Feb-17 (22,17,465) (0.24) 1,93,80,672 2.1217-Feb-17 (32,04,754) (0.35) 1,61,75,918 1.7724-Feb-17 (26,10,243) (0.29) 1,35,65,675 1.4810-Mar-17 (5,00,424) (0.05) 1,30,65,251 1.4317-Mar-17 (58,693) (0.01) 1,30,06,558 1.42At the end of the year 1,30,06,558 1.42
2. VALIANT MAURITIUS PARTNERS LIMITEDAt the beginning of the year 1,87,52,257 2.05Increase / Decrease in Shareholding during the year:05-Aug-16 (20,53,600) (0.22) 1,66,98,657 1.8303-Feb-17 (4,00,111) (0.04) 1,62,98,546 1.7810-Feb-17 (16,72,837) (0.18) 1,46,25,709 1.6017-Feb-17 (24,17,822) (0.26) 1,22,07,887 1.3324-Feb-17 (19,69,294) (0.22) 1,02,38,593 1.1210-Mar-17 (3,97,108) (0.04) 98,41,485 1.0817-Mar-17 (46,575) (0.01) 97,94,910 1.07At the end of the year 97,94,910 1.07
3. HSBC GLOBAL INVESTMENT FUNDS A/C HSBC GIF MAURITIUS LIMITEDAt the beginning of the year 1,64,63,237 1.80Increase / Decrease in Shareholding during the year:15-Apr-16 (22,85,187) (0.25) 1,41,78,050 1.5522-Apr-16 (2,79,432) (0.03) 1,38,98,618 1.5208-Jul-16 (7,78,741) (0.09) 13,119,877 1.4329-Jul-16 (16,38,983) (0.18) 1,14,80,894 1.2509-Sep-16 (71,20,000) (0.78) 43,60,894 0.4828-Oct-16 (43,60,894) (0.48) 0 0.00At the end of the year 0.00 0.00
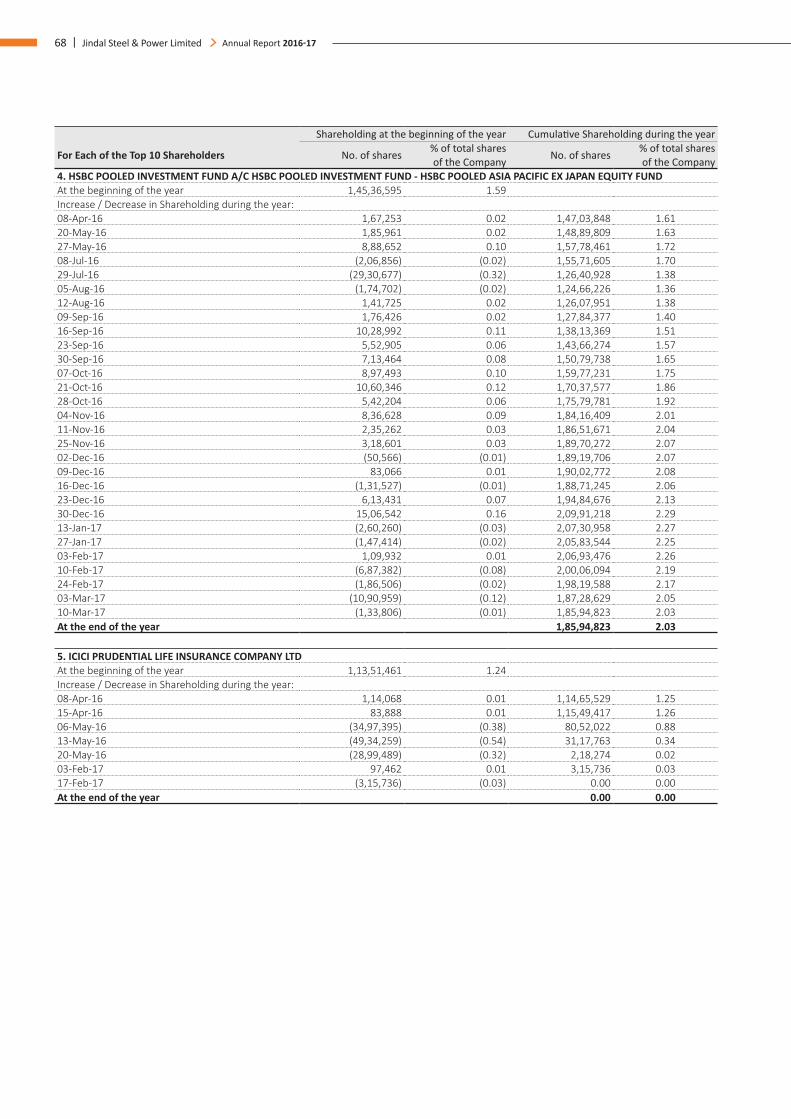
68 | Jindal Steel & Power Limited Annual Report 2016-17
Shareholding at the beginning of the year Cumulative Shareholding during the year
For Each of the Top 10 Shareholders No. of shares % of total shares of the Company No. of shares % of total shares
of the Company4. HSBC POOLED INVESTMENT FUND A/C HSBC POOLED INVESTMENT FUND - HSBC POOLED ASIA PACIFIC EX JAPAN EQUITY FUNDAt the beginning of the year 1,45,36,595 1.59 Increase / Decrease in Shareholding during the year:08-Apr-16 1,67,253 0.02 1,47,03,848 1.6120-May-16 1,85,961 0.02 1,48,89,809 1.6327-May-16 8,88,652 0.10 1,57,78,461 1.7208-Jul-16 (2,06,856) (0.02) 1,55,71,605 1.7029-Jul-16 (29,30,677) (0.32) 1,26,40,928 1.3805-Aug-16 (1,74,702) (0.02) 1,24,66,226 1.3612-Aug-16 1,41,725 0.02 1,26,07,951 1.3809-Sep-16 1,76,426 0.02 1,27,84,377 1.4016-Sep-16 10,28,992 0.11 1,38,13,369 1.5123-Sep-16 5,52,905 0.06 1,43,66,274 1.5730-Sep-16 7,13,464 0.08 1,50,79,738 1.6507-Oct-16 8,97,493 0.10 1,59,77,231 1.7521-Oct-16 10,60,346 0.12 1,70,37,577 1.8628-Oct-16 5,42,204 0.06 1,75,79,781 1.9204-Nov-16 8,36,628 0.09 1,84,16,409 2.0111-Nov-16 2,35,262 0.03 1,86,51,671 2.0425-Nov-16 3,18,601 0.03 1,89,70,272 2.0702-Dec-16 (50,566) (0.01) 1,89,19,706 2.0709-Dec-16 83,066 0.01 1,90,02,772 2.0816-Dec-16 (1,31,527) (0.01) 1,88,71,245 2.0623-Dec-16 6,13,431 0.07 1,94,84,676 2.1330-Dec-16 15,06,542 0.16 2,09,91,218 2.2913-Jan-17 (2,60,260) (0.03) 2,07,30,958 2.2727-Jan-17 (1,47,414) (0.02) 2,05,83,544 2.2503-Feb-17 1,09,932 0.01 2,06,93,476 2.2610-Feb-17 (6,87,382) (0.08) 2,00,06,094 2.1924-Feb-17 (1,86,506) (0.02) 1,98,19,588 2.1703-Mar-17 (10,90,959) (0.12) 1,87,28,629 2.0510-Mar-17 (1,33,806) (0.01) 1,85,94,823 2.03At the end of the year 1,85,94,823 2.03
5. ICICI PRUDENTIAL LIFE INSURANCE COMPANY LTDAt the beginning of the year 1,13,51,461 1.24 Increase / Decrease in Shareholding during the year:08-Apr-16 1,14,068 0.01 1,14,65,529 1.2515-Apr-16 83,888 0.01 1,15,49,417 1.2606-May-16 (34,97,395) (0.38) 80,52,022 0.8813-May-16 (49,34,259) (0.54) 31,17,763 0.3420-May-16 (28,99,489) (0.32) 2,18,274 0.0203-Feb-17 97,462 0.01 3,15,736 0.0317-Feb-17 (3,15,736) (0.03) 0.00 0.00At the end of the year 0.00 0.00
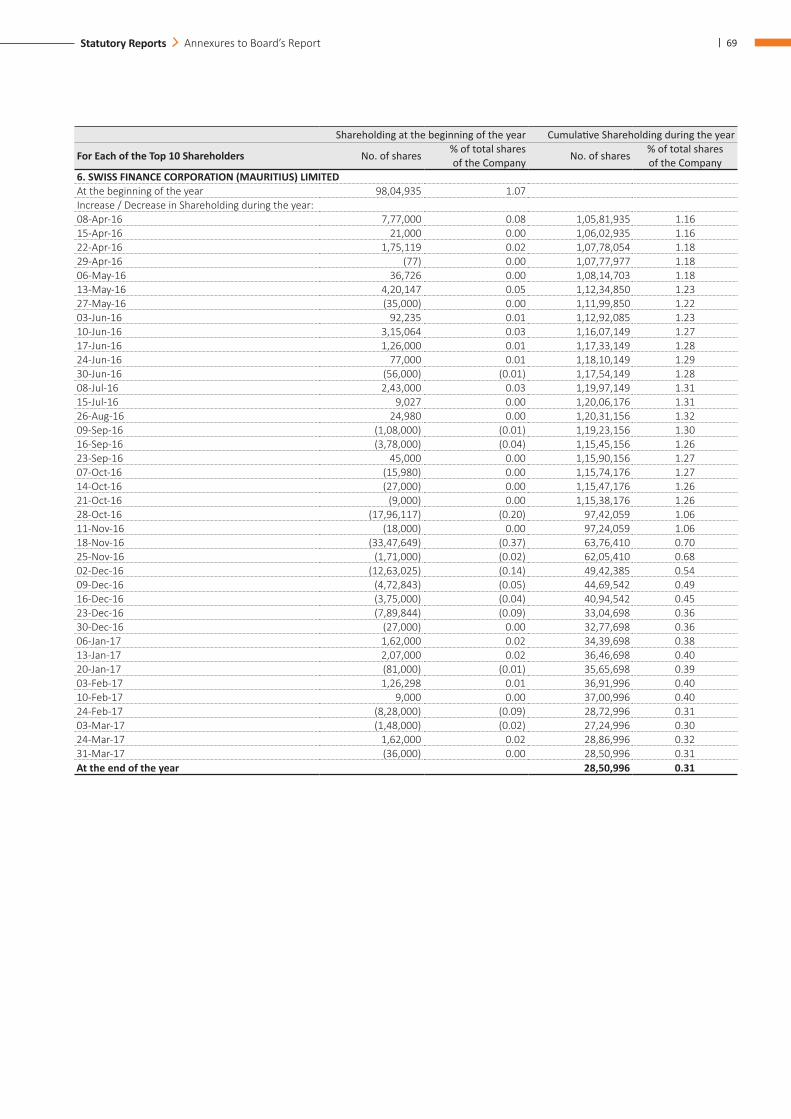
| 69Statutory Reports Annexures to Board’s Report
Shareholding at the beginning of the year Cumulative Shareholding during the year
For Each of the Top 10 Shareholders No. of shares % of total shares of the Company No. of shares % of total shares
of the Company6. SWISS FINANCE CORPORATION (MAURITIUS) LIMITEDAt the beginning of the year 98,04,935 1.07 Increase / Decrease in Shareholding during the year:08-Apr-16 7,77,000 0.08 1,05,81,935 1.1615-Apr-16 21,000 0.00 1,06,02,935 1.1622-Apr-16 1,75,119 0.02 1,07,78,054 1.1829-Apr-16 (77) 0.00 1,07,77,977 1.1806-May-16 36,726 0.00 1,08,14,703 1.1813-May-16 4,20,147 0.05 1,12,34,850 1.2327-May-16 (35,000) 0.00 1,11,99,850 1.2203-Jun-16 92,235 0.01 1,12,92,085 1.2310-Jun-16 3,15,064 0.03 1,16,07,149 1.2717-Jun-16 1,26,000 0.01 1,17,33,149 1.2824-Jun-16 77,000 0.01 1,18,10,149 1.2930-Jun-16 (56,000) (0.01) 1,17,54,149 1.2808-Jul-16 2,43,000 0.03 1,19,97,149 1.3115-Jul-16 9,027 0.00 1,20,06,176 1.3126-Aug-16 24,980 0.00 1,20,31,156 1.3209-Sep-16 (1,08,000) (0.01) 1,19,23,156 1.3016-Sep-16 (3,78,000) (0.04) 1,15,45,156 1.2623-Sep-16 45,000 0.00 1,15,90,156 1.2707-Oct-16 (15,980) 0.00 1,15,74,176 1.2714-Oct-16 (27,000) 0.00 1,15,47,176 1.2621-Oct-16 (9,000) 0.00 1,15,38,176 1.2628-Oct-16 (17,96,117) (0.20) 97,42,059 1.0611-Nov-16 (18,000) 0.00 97,24,059 1.0618-Nov-16 (33,47,649) (0.37) 63,76,410 0.7025-Nov-16 (1,71,000) (0.02) 62,05,410 0.6802-Dec-16 (12,63,025) (0.14) 49,42,385 0.5409-Dec-16 (4,72,843) (0.05) 44,69,542 0.4916-Dec-16 (3,75,000) (0.04) 40,94,542 0.4523-Dec-16 (7,89,844) (0.09) 33,04,698 0.3630-Dec-16 (27,000) 0.00 32,77,698 0.3606-Jan-17 1,62,000 0.02 34,39,698 0.3813-Jan-17 2,07,000 0.02 36,46,698 0.4020-Jan-17 (81,000) (0.01) 35,65,698 0.3903-Feb-17 1,26,298 0.01 36,91,996 0.4010-Feb-17 9,000 0.00 37,00,996 0.4024-Feb-17 (8,28,000) (0.09) 28,72,996 0.3103-Mar-17 (1,48,000) (0.02) 27,24,996 0.3024-Mar-17 1,62,000 0.02 28,86,996 0.3231-Mar-17 (36,000) 0.00 28,50,996 0.31At the end of the year 28,50,996 0.31
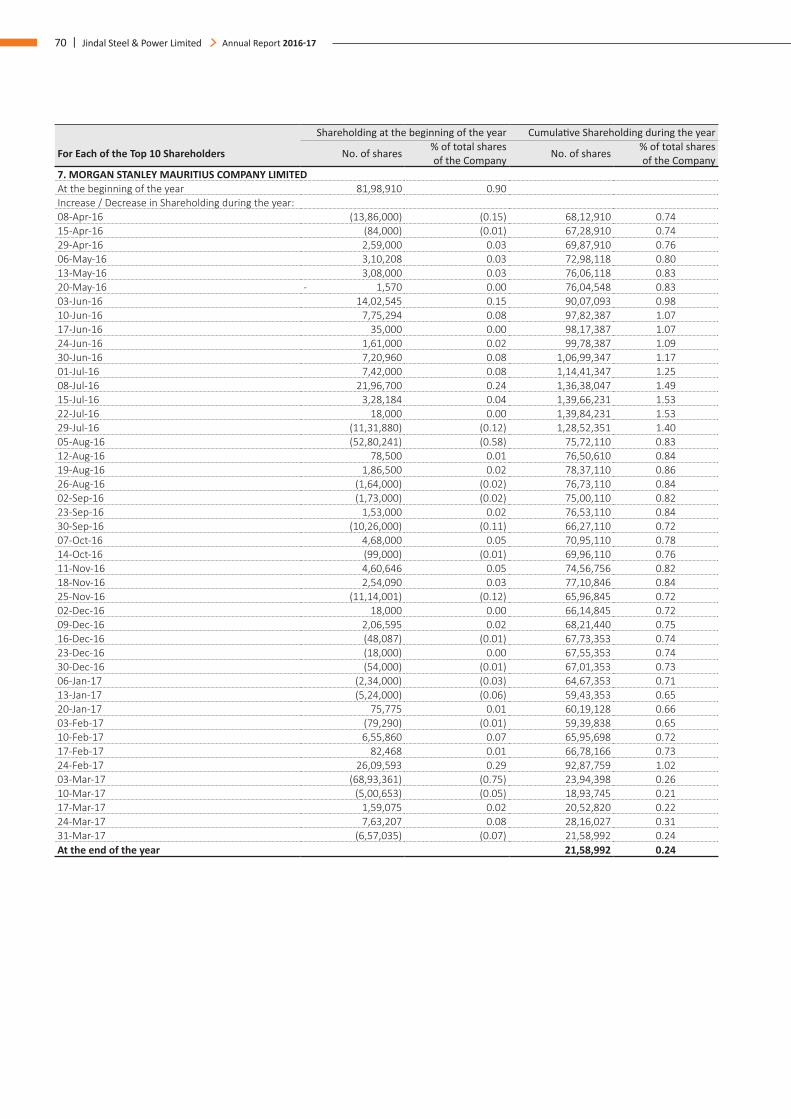
70 | Jindal Steel & Power Limited Annual Report 2016-17
Shareholding at the beginning of the year Cumulative Shareholding during the year
For Each of the Top 10 Shareholders No. of shares % of total shares of the Company No. of shares % of total shares
of the Company7. MORGAN STANLEY MAURITIUS COMPANY LIMITEDAt the beginning of the year 81,98,910 0.90 Increase / Decrease in Shareholding during the year:08-Apr-16 (13,86,000) (0.15) 68,12,910 0.7415-Apr-16 (84,000) (0.01) 67,28,910 0.7429-Apr-16 2,59,000 0.03 69,87,910 0.7606-May-16 3,10,208 0.03 72,98,118 0.8013-May-16 3,08,000 0.03 76,06,118 0.8320-May-16 - 1,570 0.00 76,04,548 0.8303-Jun-16 14,02,545 0.15 90,07,093 0.9810-Jun-16 7,75,294 0.08 97,82,387 1.0717-Jun-16 35,000 0.00 98,17,387 1.0724-Jun-16 1,61,000 0.02 99,78,387 1.0930-Jun-16 7,20,960 0.08 1,06,99,347 1.1701-Jul-16 7,42,000 0.08 1,14,41,347 1.2508-Jul-16 21,96,700 0.24 1,36,38,047 1.4915-Jul-16 3,28,184 0.04 1,39,66,231 1.5322-Jul-16 18,000 0.00 1,39,84,231 1.5329-Jul-16 (11,31,880) (0.12) 1,28,52,351 1.4005-Aug-16 (52,80,241) (0.58) 75,72,110 0.8312-Aug-16 78,500 0.01 76,50,610 0.8419-Aug-16 1,86,500 0.02 78,37,110 0.8626-Aug-16 (1,64,000) (0.02) 76,73,110 0.8402-Sep-16 (1,73,000) (0.02) 75,00,110 0.8223-Sep-16 1,53,000 0.02 76,53,110 0.8430-Sep-16 (10,26,000) (0.11) 66,27,110 0.7207-Oct-16 4,68,000 0.05 70,95,110 0.7814-Oct-16 (99,000) (0.01) 69,96,110 0.7611-Nov-16 4,60,646 0.05 74,56,756 0.8218-Nov-16 2,54,090 0.03 77,10,846 0.8425-Nov-16 (11,14,001) (0.12) 65,96,845 0.7202-Dec-16 18,000 0.00 66,14,845 0.7209-Dec-16 2,06,595 0.02 68,21,440 0.7516-Dec-16 (48,087) (0.01) 67,73,353 0.7423-Dec-16 (18,000) 0.00 67,55,353 0.7430-Dec-16 (54,000) (0.01) 67,01,353 0.7306-Jan-17 (2,34,000) (0.03) 64,67,353 0.7113-Jan-17 (5,24,000) (0.06) 59,43,353 0.6520-Jan-17 75,775 0.01 60,19,128 0.6603-Feb-17 (79,290) (0.01) 59,39,838 0.6510-Feb-17 6,55,860 0.07 65,95,698 0.7217-Feb-17 82,468 0.01 66,78,166 0.7324-Feb-17 26,09,593 0.29 92,87,759 1.0203-Mar-17 (68,93,361) (0.75) 23,94,398 0.2610-Mar-17 (5,00,653) (0.05) 18,93,745 0.2117-Mar-17 1,59,075 0.02 20,52,820 0.2224-Mar-17 7,63,207 0.08 28,16,027 0.3131-Mar-17 (6,57,035) (0.07) 21,58,992 0.24At the end of the year 21,58,992 0.24
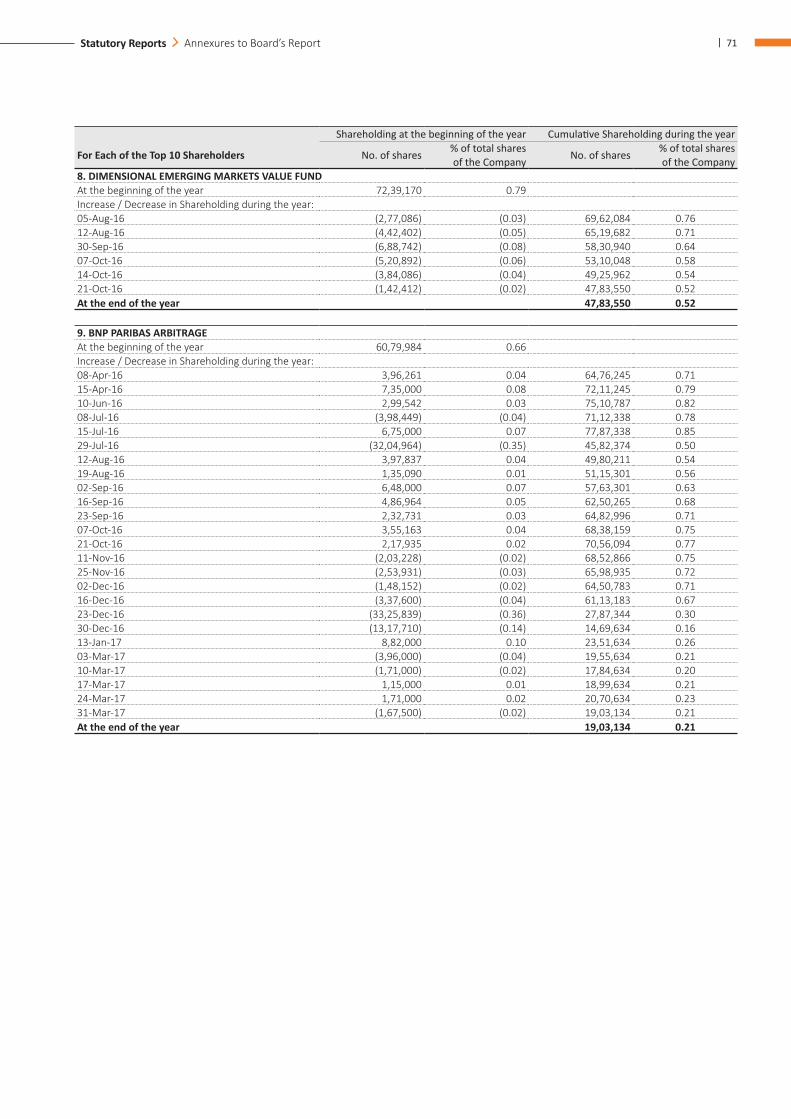
| 71Statutory Reports Annexures to Board’s Report
Shareholding at the beginning of the year Cumulative Shareholding during the year
For Each of the Top 10 Shareholders No. of shares % of total shares of the Company No. of shares % of total shares
of the Company8. DIMENSIONAL EMERGING MARKETS VALUE FUNDAt the beginning of the year 72,39,170 0.79Increase / Decrease in Shareholding during the year:05-Aug-16 (2,77,086) (0.03) 69,62,084 0.7612-Aug-16 (4,42,402) (0.05) 65,19,682 0.7130-Sep-16 (6,88,742) (0.08) 58,30,940 0.6407-Oct-16 (5,20,892) (0.06) 53,10,048 0.5814-Oct-16 (3,84,086) (0.04) 49,25,962 0.5421-Oct-16 (1,42,412) (0.02) 47,83,550 0.52At the end of the year 47,83,550 0.52
9. BNP PARIBAS ARBITRAGEAt the beginning of the year 60,79,984 0.66Increase / Decrease in Shareholding during the year:08-Apr-16 3,96,261 0.04 64,76,245 0.7115-Apr-16 7,35,000 0.08 72,11,245 0.7910-Jun-16 2,99,542 0.03 75,10,787 0.8208-Jul-16 (3,98,449) (0.04) 71,12,338 0.7815-Jul-16 6,75,000 0.07 77,87,338 0.8529-Jul-16 (32,04,964) (0.35) 45,82,374 0.5012-Aug-16 3,97,837 0.04 49,80,211 0.5419-Aug-16 1,35,090 0.01 51,15,301 0.5602-Sep-16 6,48,000 0.07 57,63,301 0.6316-Sep-16 4,86,964 0.05 62,50,265 0.6823-Sep-16 2,32,731 0.03 64,82,996 0.7107-Oct-16 3,55,163 0.04 68,38,159 0.7521-Oct-16 2,17,935 0.02 70,56,094 0.7711-Nov-16 (2,03,228) (0.02) 68,52,866 0.7525-Nov-16 (2,53,931) (0.03) 65,98,935 0.7202-Dec-16 (1,48,152) (0.02) 64,50,783 0.7116-Dec-16 (3,37,600) (0.04) 61,13,183 0.6723-Dec-16 (33,25,839) (0.36) 27,87,344 0.3030-Dec-16 (13,17,710) (0.14) 14,69,634 0.1613-Jan-17 8,82,000 0.10 23,51,634 0.2603-Mar-17 (3,96,000) (0.04) 19,55,634 0.2110-Mar-17 (1,71,000) (0.02) 17,84,634 0.2017-Mar-17 1,15,000 0.01 18,99,634 0.2124-Mar-17 1,71,000 0.02 20,70,634 0.2331-Mar-17 (1,67,500) (0.02) 19,03,134 0.21At the end of the year 19,03,134 0.21
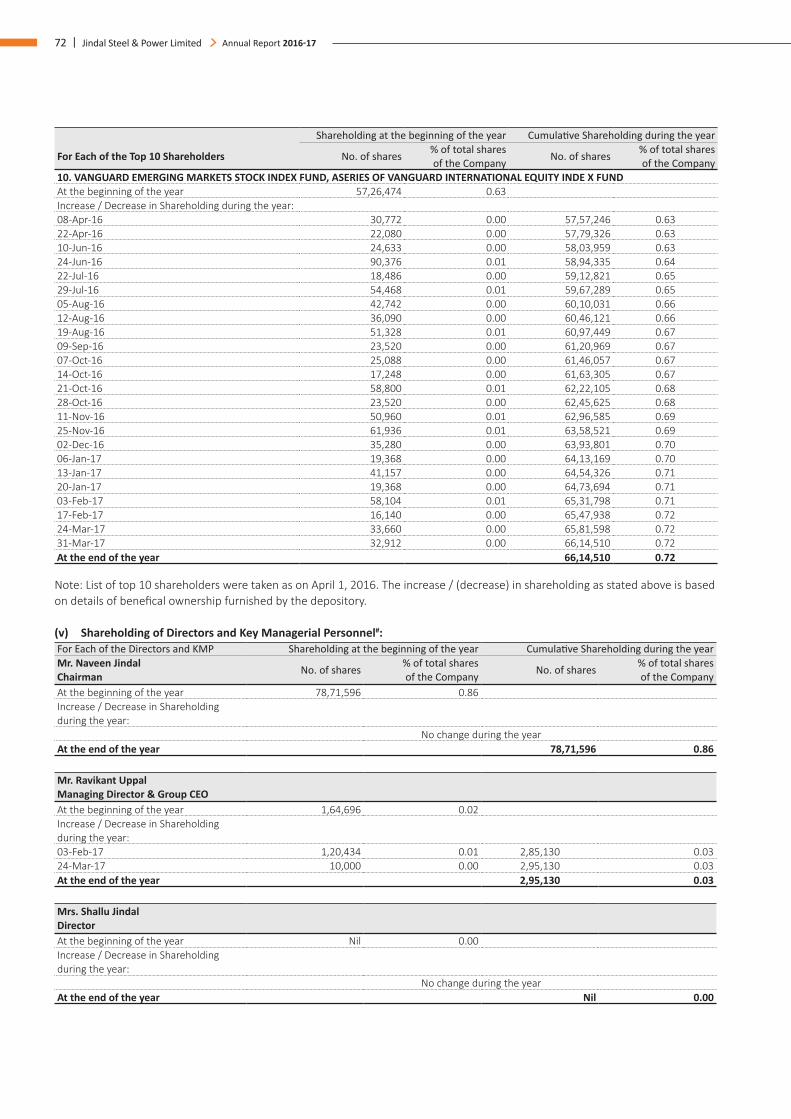
72 | Jindal Steel & Power Limited Annual Report 2016-17
Shareholding at the beginning of the year Cumulative Shareholding during the year
For Each of the Top 10 Shareholders No. of shares % of total shares of the Company No. of shares % of total shares
of the Company10. VANGUARD EMERGING MARKETS STOCK INDEX FUND, ASERIES OF VANGUARD INTERNATIONAL EQUITY INDE X FUNDAt the beginning of the year 57,26,474 0.63Increase / Decrease in Shareholding during the year:08-Apr-16 30,772 0.00 57,57,246 0.6322-Apr-16 22,080 0.00 57,79,326 0.6310-Jun-16 24,633 0.00 58,03,959 0.6324-Jun-16 90,376 0.01 58,94,335 0.6422-Jul-16 18,486 0.00 59,12,821 0.6529-Jul-16 54,468 0.01 59,67,289 0.6505-Aug-16 42,742 0.00 60,10,031 0.6612-Aug-16 36,090 0.00 60,46,121 0.6619-Aug-16 51,328 0.01 60,97,449 0.6709-Sep-16 23,520 0.00 61,20,969 0.6707-Oct-16 25,088 0.00 61,46,057 0.6714-Oct-16 17,248 0.00 61,63,305 0.6721-Oct-16 58,800 0.01 62,22,105 0.6828-Oct-16 23,520 0.00 62,45,625 0.6811-Nov-16 50,960 0.01 62,96,585 0.6925-Nov-16 61,936 0.01 63,58,521 0.6902-Dec-16 35,280 0.00 63,93,801 0.7006-Jan-17 19,368 0.00 64,13,169 0.7013-Jan-17 41,157 0.00 64,54,326 0.7120-Jan-17 19,368 0.00 64,73,694 0.7103-Feb-17 58,104 0.01 65,31,798 0.7117-Feb-17 16,140 0.00 65,47,938 0.7224-Mar-17 33,660 0.00 65,81,598 0.7231-Mar-17 32,912 0.00 66,14,510 0.72At the end of the year 66,14,510 0.72
Note: List of top 10 shareholders were taken as on April 1, 2016. The increase / (decrease) in shareholding as stated above is based on details of benefical ownership furnished by the depository.
(v) Shareholding of Directors and Key Managerial Personnel#:For Each of the Directors and KMP Shareholding at the beginning of the year Cumulative Shareholding during the yearMr. Naveen Jindal Chairman No. of shares % of total shares
of the Company No. of shares % of total shares of the Company
At the beginning of the year 78,71,596 0.86Increase / Decrease in Shareholding during the year:
No change during the yearAt the end of the year 78,71,596 0.86
Mr. Ravikant Uppal Managing Director & Group CEOAt the beginning of the year 1,64,696 0.02Increase / Decrease in Shareholding during the year:03-Feb-17 1,20,434 0.01 2,85,130 0.0324-Mar-17 10,000 0.00 2,95,130 0.03At the end of the year 2,95,130 0.03
Mrs. Shallu Jindal Director At the beginning of the year Nil 0.00Increase / Decrease in Shareholding during the year:
No change during the yearAt the end of the year Nil 0.00
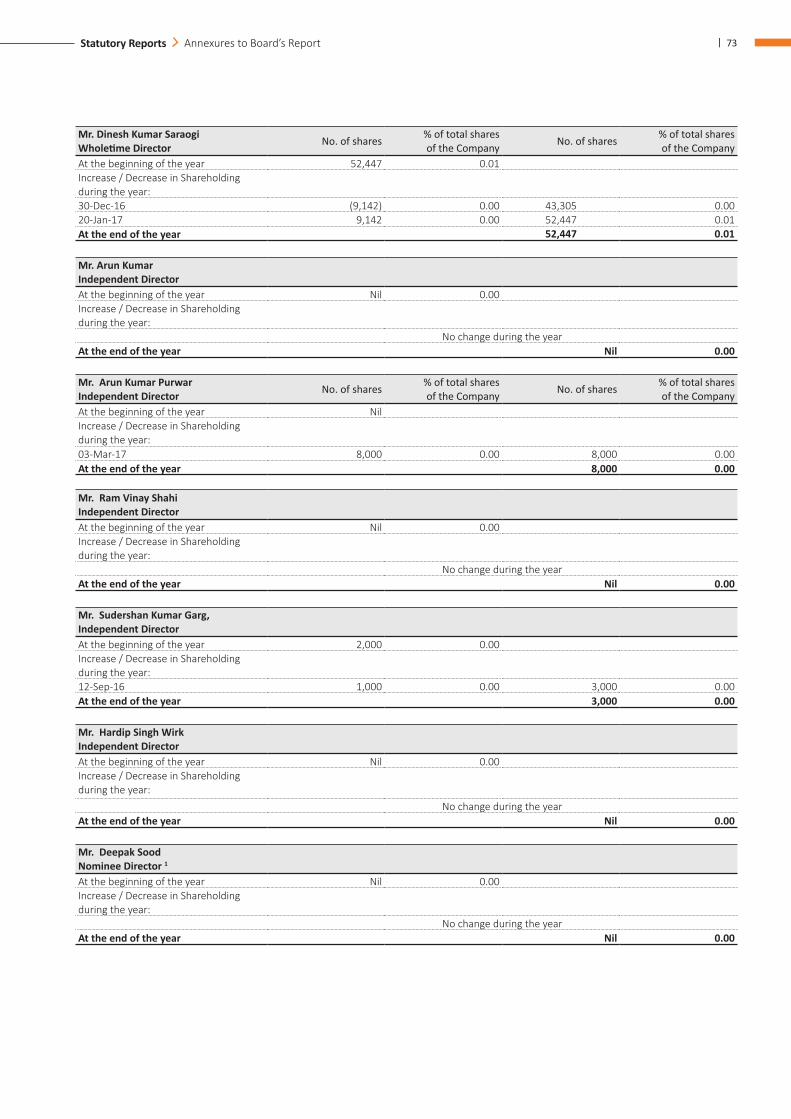
| 73Statutory Reports Annexures to Board’s Report
Mr. Dinesh Kumar Saraogi Wholetime Director No. of shares % of total shares
of the Company No. of shares % of total shares of the Company
At the beginning of the year 52,447 0.01Increase / Decrease in Shareholding during the year:30-Dec-16 (9,142) 0.00 43,305 0.0020-Jan-17 9,142 0.00 52,447 0.01At the end of the year 52,447 0.01
Mr. Arun Kumar Independent DirectorAt the beginning of the year Nil 0.00Increase / Decrease in Shareholding during the year:
No change during the year At the end of the year Nil 0.00
Mr. Arun Kumar Purwar Independent Director No. of shares % of total shares
of the Company No. of shares % of total shares of the Company
At the beginning of the year NilIncrease / Decrease in Shareholding during the year:03-Mar-17 8,000 0.00 8,000 0.00At the end of the year 8,000 0.00
Mr. Ram Vinay Shahi Independent DirectorAt the beginning of the year Nil 0.00Increase / Decrease in Shareholding during the year:
No change during the year At the end of the year Nil 0.00
Mr. Sudershan Kumar Garg, Independent DirectorAt the beginning of the year 2,000 0.00Increase / Decrease in Shareholding during the year:12-Sep-16 1,000 0.00 3,000 0.00At the end of the year 3,000 0.00
Mr. Hardip Singh Wirk Independent DirectorAt the beginning of the year Nil 0.00Increase / Decrease in Shareholding during the year:
No change during the year At the end of the year Nil 0.00
Mr. Deepak Sood Nominee Director 1
At the beginning of the year Nil 0.00Increase / Decrease in Shareholding during the year:
No change during the yearAt the end of the year Nil 0.00
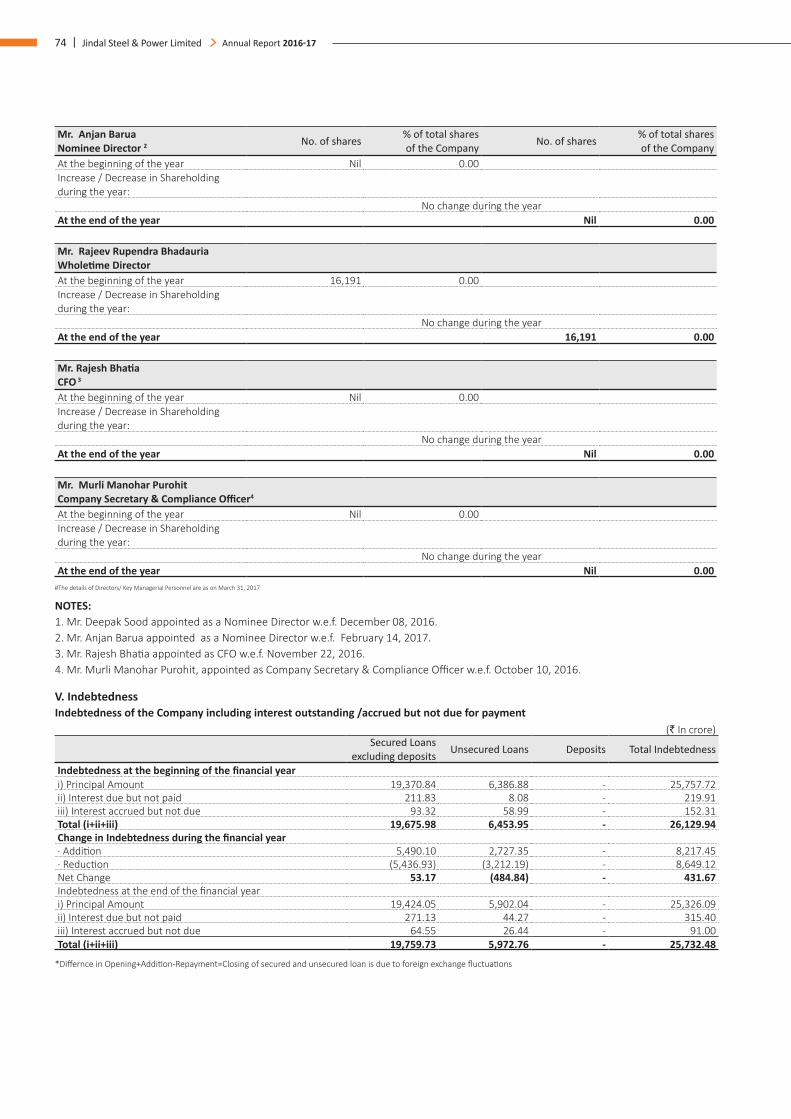
74 | Jindal Steel & Power Limited Annual Report 2016-17
Mr. Anjan Barua Nominee Director 2 No. of shares % of total shares
of the Company No. of shares % of total shares of the Company
At the beginning of the year Nil 0.00Increase / Decrease in Shareholding during the year:
No change during the year At the end of the year Nil 0.00
Mr. Rajeev Rupendra Bhadauria Wholetime DirectorAt the beginning of the year 16,191 0.00Increase / Decrease in Shareholding during the year:
No change during the yearAt the end of the year 16,191 0.00
Mr. Rajesh Bhatia CFO 3
At the beginning of the year Nil 0.00Increase / Decrease in Shareholding during the year:
No change during the yearAt the end of the year Nil 0.00
Mr. Murli Manohar Purohit Company Secretary & Compliance Officer4
At the beginning of the year Nil 0.00Increase / Decrease in Shareholding during the year:
No change during the year At the end of the year Nil 0.00
#The details of Directors/ Key Managerial Personnel are as on March 31, 2017
NOTES: 1. Mr. Deepak Sood appointed as a Nominee Director w.e.f. December 08, 2016. 2. Mr. Anjan Barua appointed as a Nominee Director w.e.f. February 14, 2017. 3. Mr. Rajesh Bhatia appointed as CFO w.e.f. November 22, 2016. 4. Mr. Murli Manohar Purohit, appointed as Company Secretary & Compliance Officer w.e.f. October 10, 2016.
V. Indebtedness Indebtedness of the Company including interest outstanding /accrued but not due for payment
(` In crore)Secured Loans
excluding deposits Unsecured Loans Deposits Total Indebtedness
Indebtedness at the beginning of the financial year i) Principal Amount 19,370.84 6,386.88 - 25,757.72 ii) Interest due but not paid 211.83 8.08 - 219.91 iii) Interest accrued but not due 93.32 58.99 - 152.31Total (i+ii+iii) 19,675.98 6,453.95 - 26,129.94 Change in Indebtedness during the financial year· Addition 5,490.10 2,727.35 - 8,217.45· Reduction (5,436.93) (3,212.19) - 8,649.12 Net Change 53.17 (484.84) - 431.67Indebtedness at the end of the financial year i) Principal Amount 19,424.05 5,902.04 - 25,326.09 ii) Interest due but not paid 271.13 44.27 - 315.40 iii) Interest accrued but not due 64.55 26.44 - 91.00Total (i+ii+iii) 19,759.73 5,972.76 - 25,732.48
*Differnce in Opening+Addition-Repayment=Closing of secured and unsecured loan is due to foreign exchange fluctuations
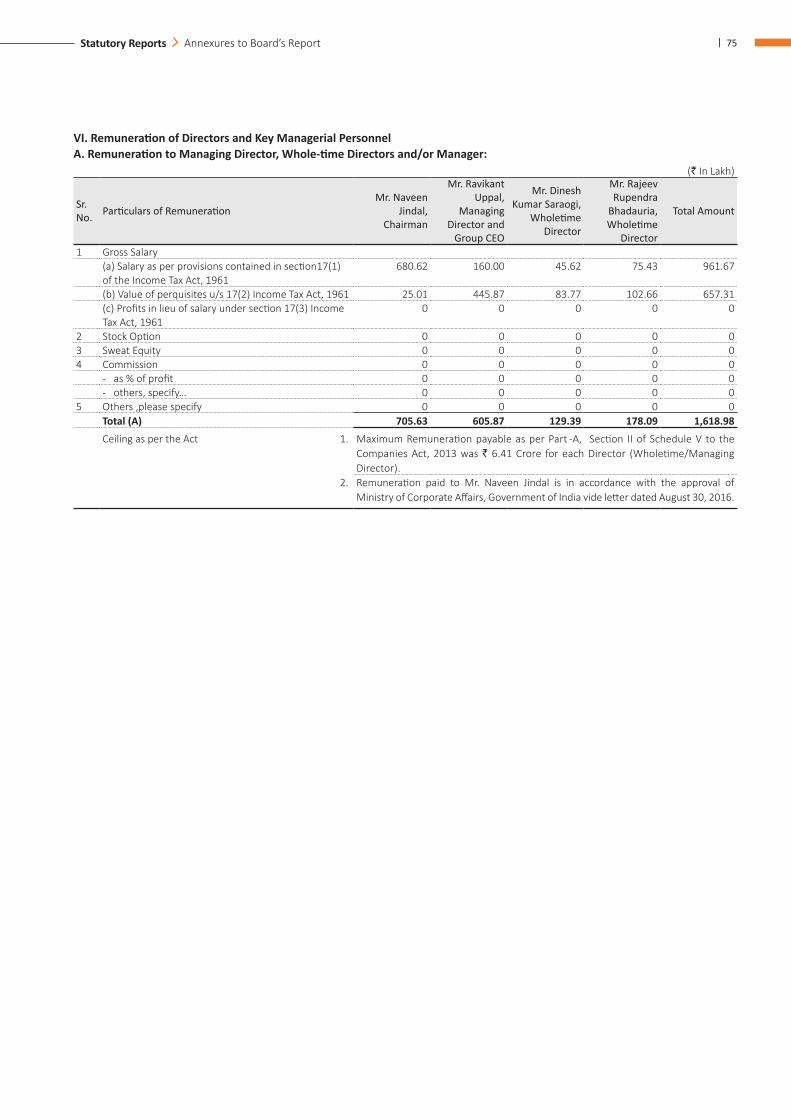
| 75Statutory Reports Annexures to Board’s Report
VI. Remuneration of Directors and Key Managerial Personnel A. Remuneration to Managing Director, Whole-time Directors and/or Manager:
(` In Lakh)
Sr. No. Particulars of Remuneration
Mr. Naveen Jindal,
Chairman
Mr. Ravikant Uppal,
Managing Director and
Group CEO
Mr. Dinesh Kumar Saraogi,
Wholetime Director
Mr. Rajeev Rupendra
Bhadauria, Wholetime
Director
Total Amount
1 Gross Salary(a) Salary as per provisions contained in section17(1) of the Income Tax Act, 1961
680.62 160.00 45.62 75.43 961.67
(b) Value of perquisites u/s 17(2) Income Tax Act, 1961 25.01 445.87 83.77 102.66 657.31(c) Profits in lieu of salary under section 17(3) Income Tax Act, 1961
0 0 0 0 0
2 Stock Option 0 0 0 0 03 Sweat Equity 0 0 0 0 04 Commission 0 0 0 0 0
- as % of profit 0 0 0 0 0- others, specify… 0 0 0 0 0
5 Others ,please specify 0 0 0 0 0Total (A) 705.63 605.87 129.39 178.09 1,618.98Ceiling as per the Act 1.
Maximum Remuneration payable as per Part -A, Section II of Schedule V to the Companies Act, 2013 was ` 6.41 Crore for each Director (Wholetime/Managing Director).
2. Remuneration paid to Mr. Naveen Jindal is in accordance with the approval of Ministry of Corporate Affairs, Government of India vide letter dated August 30, 2016.
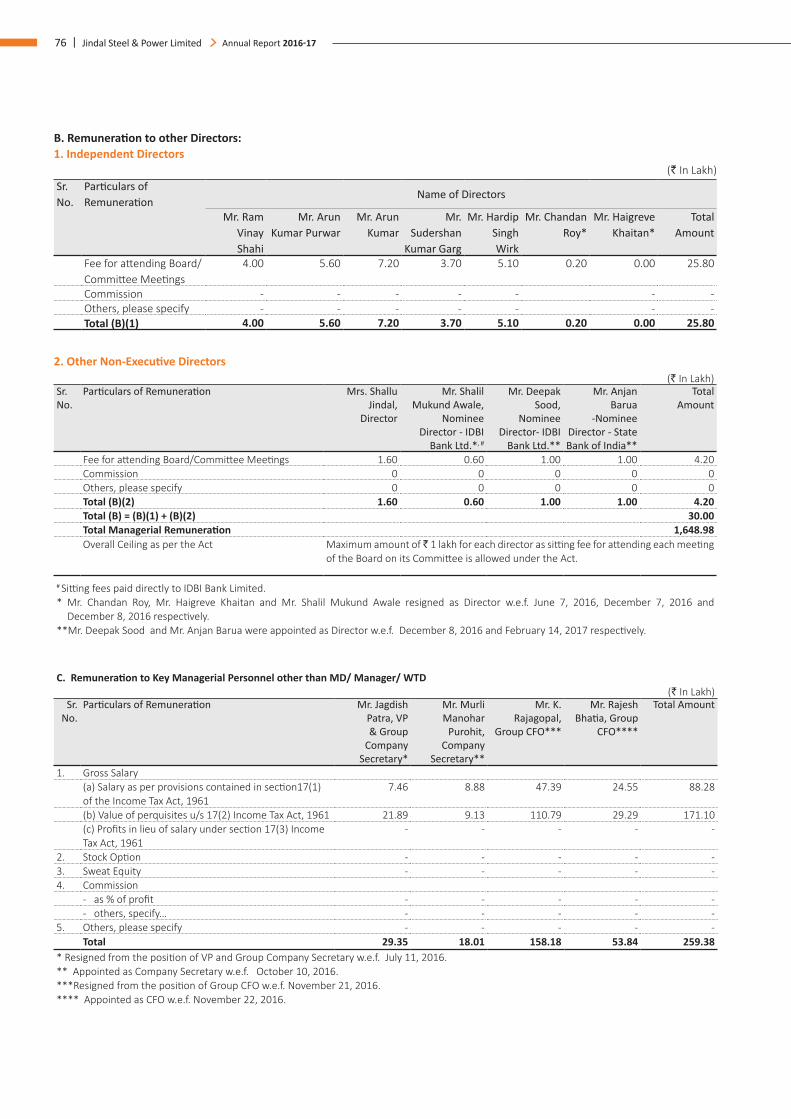
76 | Jindal Steel & Power Limited Annual Report 2016-17
B. Remuneration to other Directors:1. Independent Directors
(` In Lakh)Sr. No.
Particulars of Remuneration
Name of Directors
Mr. Ram Vinay Shahi
Mr. Arun Kumar Purwar
Mr. Arun Kumar
Mr. Sudershan
Kumar Garg
Mr. Hardip Singh Wirk
Mr. Chandan Roy*
Mr. Haigreve Khaitan*
Total Amount
Fee for attending Board/Committee Meetings
4.00 5.60 7.20 3.70 5.10 0.20 0.00 25.80
Commission - - - - - - - Others, please specify - - - - - - - Total (B)(1) 4.00 5.60 7.20 3.70 5.10 0.20 0.00 25.80
2. Other Non-Executive Directors (` In Lakh)
Sr. No.
Particulars of Remuneration Mrs. Shallu Jindal,
Director
Mr. Shalil Mukund Awale,
Nominee Director - IDBI
Bank Ltd.*, #
Mr. Deepak Sood,
Nominee Director- IDBI
Bank Ltd.**
Mr. Anjan Barua
-Nominee Director - State Bank of India**
Total Amount
Fee for attending Board/Committee Meetings 1.60 0.60 1.00 1.00 4.20Commission 0 0 0 0 0Others, please specify 0 0 0 0 0Total (B)(2) 1.60 0.60 1.00 1.00 4.20Total (B) = (B)(1) + (B)(2) 30.00Total Managerial Remuneration 1,648.98 Overall Ceiling as per the Act Maximum amount of ̀ 1 lakh for each director as sitting fee for attending each meeting
of the Board on its Committee is allowed under the Act.
# Sitting fees paid directly to IDBI Bank Limited. * Mr. Chandan Roy, Mr. Haigreve Khaitan and Mr. Shalil Mukund Awale resigned as Director w.e.f. June 7, 2016, December 7, 2016 and
December 8, 2016 respectively.**Mr. Deepak Sood and Mr. Anjan Barua were appointed as Director w.e.f. December 8, 2016 and February 14, 2017 respectively.
C. Remuneration to Key Managerial Personnel other than MD/ Manager/ WTD(` In Lakh)
Sr. No.
Particulars of Remuneration Mr. Jagdish Patra, VP & Group
Company Secretary*
Mr. Murli Manohar
Purohit, Company
Secretary**
Mr. K. Rajagopal,
Group CFO***
Mr. Rajesh Bhatia, Group
CFO****
Total Amount
1. Gross Salary(a) Salary as per provisions contained in section17(1) of the Income Tax Act, 1961
7.46 8.88 47.39 24.55 88.28
(b) Value of perquisites u/s 17(2) Income Tax Act, 1961 21.89 9.13 110.79 29.29 171.10(c) Profits in lieu of salary under section 17(3) Income Tax Act, 1961
- - - - -
2. Stock Option - - - - - 3. Sweat Equity - - - - - 4. Commission
- as % of profit - - - - - - others, specify… - - - - -
5. Others, please specify - - - - - Total 29.35 18.01 158.18 53.84 259.38
* Resigned from the position of VP and Group Company Secretary w.e.f. July 11, 2016.** Appointed as Company Secretary w.e.f. October 10, 2016.***Resigned from the position of Group CFO w.e.f. November 21, 2016.**** Appointed as CFO w.e.f. November 22, 2016.
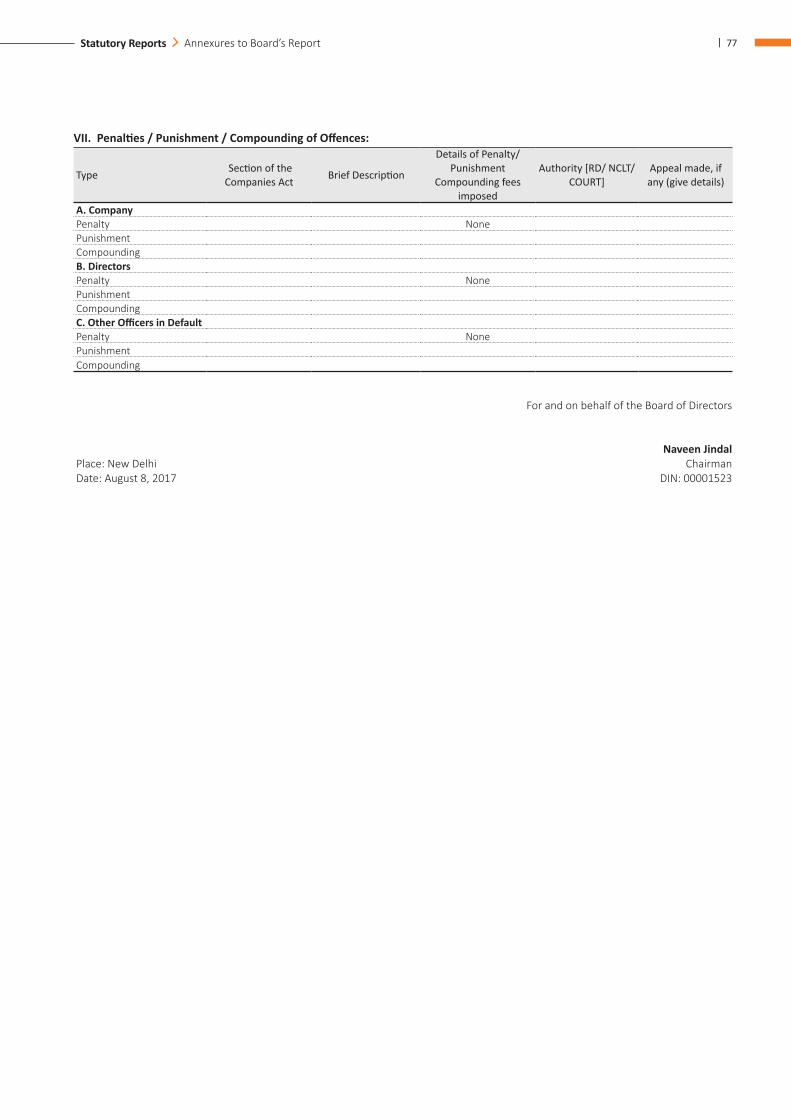
| 77Statutory Reports Annexures to Board’s Report
VII. Penalties / Punishment / Compounding of Offences:
Type Section of the Companies Act Brief Description
Details of Penalty/ Punishment
Compounding fees imposed
Authority [RD/ NCLT/ COURT]
Appeal made, if any (give details)
A. CompanyPenalty NonePunishmentCompoundingB. DirectorsPenalty NonePunishmentCompoundingC. Other Officers in DefaultPenalty NonePunishmentCompounding
For and on behalf of the Board of Directors
Naveen Jindal Place: New Delhi ChairmanDate: August 8, 2017 DIN: 00001523
78 | Jindal Steel & Power Limited Annual Report 2016-17
Corporate Governance Report
In accordance with Regulation 34 and Schedule V of the Securities and Exchange Board of India (Listing Obligations and Disclosure Requirements) Regulations, 2015 SEBI (LODR) Regulations, 2015 the report containing the details of Corporate Governance systems and processes at Jindal Steel & Power Limited (JSPL) is as follows:
Company’s Philosophy on Code of GovernancesCorporate Governance is creation and enhancing long-term sustainable value for the stakeholders through ethically driven business process. At JSPL, it is imperative that our Company affairs are managed in a fair and transparent manner.
Corporate Governance is all about maintaining a valuable relationship and trust with all stakeholders. We consider stakeholders as partners in our success and we remain committed to maximizing stakeholders’ value, be it shareholders, employees, suppliers, customers, investors, communities or policy makers. This approach to value creation emanates from our belief that sound governance system, based on relationship and trust, is integral to creating enduring value for all. We have a defined policy framework for ethical conduct of businesses.
We believe, Corporate Governance is not just a destination, but a journey to constantly improve sustainable value creation. It is an upward-moving target that we collectively strive towards achieving. Our multiple initiatives towards maintaining the highest standards of governance are detailed in the following pages.
The Corporate Governance framework of the Company is based on the following broad practices:
a) Engaging a diverse and highly professional, experienced and competent Board of Directors, with versatile expertise in industry, finance, management and law;
b) Deploying well defined governance structures that establishes checks and balances and delegates decision making to appropriate levels in the organization;
c) Adoption and implementation of fair, transparent and robust systems, processes, policies and procedures;
d) Making high levels of disclosures for dissemination of corporate, financial and operational information to all its stakeholders;
e) Having strong systems and processes to ensure full and timely compliance with all legal and regulatory requirements and zero tolerance for non-compliance.
Best Corporate Governance Practices JSPL maintains the highest standards of Corporate Governance. It is the Company’s constant endeavour to adopt the best Corporate Governance practices keeping in view the international codes of Corporate Governance and practices of well-known global Companies. Some of the best implemented global governance norms include the following:
All securities related filings with Stock Exchanges and SEBI are reviewed periodically by the Company’s Stakeholders’ Relationship Committee of Board of Directors;
The Company has independent Board Committees for matters related to Governance & Business Ethics, Health, Safety, Corporate Social Responsibility & Environment, Risk Management, Investment decisions, Nomination and Remuneration of Directors, Key Managerial Personnel and Senior Management etc;
The Company also undergoes secretarial audit conducted by an independent Company Secretaries Firm. The secretarial audit report is placed before the Board and is included elsewhere in the Annual Report;
Internal Audit is conducted regularly and reports on findings of Internal Auditor are submitted to the Audit Committee on quarterly basis;
Observance and adherence of the Secretarial Standards issued by the Institute of Company Secretaries of India.
Ethics/Governance PoliciesAt JSPL, we strive to conduct our business and strengthen our relationships in a manner that is dignified, distinctive and responsible. We adhere to ethical standards to ensure integrity, transparency, independence and accountability in dealing with all stakeholders. Therefore, we have adopted various codes, policies and processes to carry out our duties in an ethical and well governed manner. Some of these codes and policies are:
Group Code of Conduct Code of internal procedures and conduct for Prevention of
Insider Trading Code of practices and procedures for fair disclosure of
Unpublished Price Sensitive Information Policy on Related Party Transactions Corporate Social Responsibility Policy Policy on Health, Safety and Environment Selection Policy for KMPs & Senior Management
Annexure - I
| 79Statutory Reports Annexures to Board’s Report
Policy on selection criteria for Independent Directors Remuneration Policy for Directors, Key Managerial Personnel
and Senior Management Policy on Familiarization of Independent Directors Code of conduct for Board of Directors and Senior Management Whistle Blower Policy Policy for determining Material Subsidiaries Policy on Board Diversity Policy on Document Retention Policy for determining Material Event Policy on Risk Management Dividend Distribution Policy Policy for prevention of sexual harassment
Role of the Company Secretary in overall governance process The Company Secretary plays a key role in ensuring that the Board (including committees thereof) procedures are followed
and regularly reviewed. The Company Secretary ensures that all relevant information, details and documents are made available to the Directors and senior management for effective decision making at the meetings. The Company Secretary is primarily responsible to assist and advise the Board in the conduct of affairs of the Company, to ensure compliance with applicable statutory requirements and Secretarial Standards, to provide guidance to Directors and to facilitate convening of meetings. He interfaces between the management and regulatory authorities for governance matters.
Board Of DirectorsAt JSPL, it is our belief that an enlightened Board consciously creates a culture of leadership to provide a long-term vision and policy approach to improve the quality of governance. The Board’s actions and decisions are aligned with the Company’s best interests. The Board critically evaluates the Company’s strategic direction, management policies and their effectiveness.
Size and composition of the Board of Directors
Category Name of DirectorsPromoter Directors Mr. Naveen Jindal, Chairman (Executive)
Mrs. Shallu Jindal, Non-Executive Non-Independent DirectorExecutive Directors Mr. Ravikant Uppal, Managing Director & Group CEO
Mr. Dinesh Kumar Saraogi, Wholetime DirectorMr. Rajeev Rupendra Bhadauria, Wholetime Director
Independent Directors Mr. Arun Kumar PurwarMr. Ram Vinay ShahiMr. Hardip Singh WirkMr. Haigreve Khaitan1
Mr. Arun KumarMr. Sudershan Kumar GargMr. Chandan Roy2
Mr. Kuldip Chander Sood3
Dr. Amar Singh4
Nominee Directors Mr. Shalil Mukund Awale5 - IDBI Bank Ltd.Mr. Deepak Sood6 - IDBI Bank Ltd.Mr. Anjan Barua7 - State Bank of India
1 Resigned from the position of Independent Director w.e.f. December 7, 2016. 2 Resigned from the position of Independent Director w.e.f. June 7, 2016.3&4 Appointed as Independent Director, w.e.f. April 25, 20175 Resigned from the position of Nominee Director - IDBI Bank Ltd. w.e.f. December 08, 2016. 6 Appointed as Nominee Director - IDBI Bank Ltd. w.e.f. December 8, 2016.7 Appointed as Nominee Director-State Bank of India w.e.f. February 14, 2017.
Consequent to change in Board of Directors during the year under review, the structure of the Board of Directors of the Company was not as per the structure specified under the SEBI (LODR) Regulations, 2015 for a period of 2 months (approx). Necessary disclosure in this connection was made to the stock exchange(s) in this regard where the shares of the Company are listed.
Inter-se Relationship among DirectorsNo Directors are related with other Directors except Mrs. Shallu Jindal who is the spouse of Mr. Naveen Jindal, Chairman of the Company.
Directors’ Profile A brief resume of Directors, nature of their expertise in specific functional areas and names of companies in which they hold Directorships, Memberships/ Chairmanships of Board Committees and shareholding in the Company are provided in this Report or elsewhere in the Annual Report.
Selection of Independent DirectorsConsidering the requirement of skill sets on the Board, eminent people having an independent standing in their respective field / profession, and who can effectively contribute to the Company’s
80 | Jindal Steel & Power Limited Annual Report 2016-17
business and policy decisions are considered by the Nomination and Remuneration Committee, for appointment, as Independent Directors on the Board. The Committee, inter alia, considers qualification, positive attributes, area of expertise and number of Directorships and Memberships held in various committees of other companies by such persons in accordance with the Company’s Policy for Selection of Directors and determining Directors’ independence. The Board considers the Committee’s recommendation, and takes appropriate decision. Every Independent Director, at the first meeting of the Board in which he participates as a Director and thereafter at the first meeting of the Board in every financial year, gives a declaration that he meets the criteria of independence as provided under law.
A statement, towards fulfillment of criteria of independence and directorship as per the provisions of the Companies Act, 2013 (“the Act”) and the Regulation 25 of SEBI (LODR) Regulations, 2015, received from each of the Independent Directors, is disclosed in the Board’s Report. Your Company has also complied with the relevant provisions under the Companies Act, 2013 and SEBI (LODR) Regulations, 2015 in this connection.
The maximum tenure of the Independent Directors is in compliance with the Act.
Declaration By Independent DirectorsIn terms of Section 149(6) of the Companies Act, 2013, the Company has received necessary declarations from each Independent Directors that they meet the criteria of being Independent Directors as laid down under the Companies Act, 2013 read with Schedule IV and Rules made thereunder, as well as Regulation 16(1)(b) of SEBI(LODR) Regulations, 2015. The Board considered the independence of each of the Independent Directors in terms of above provisions and is of the view that they fulfill/meet the criteria of independence.
Directors’ Induction and FamiliarizationAppropriate induction programmes for new Director(s) and ongoing training for existing Directors, are essential for high Corporate Governance standards of the Company. The Managing Director & Group CEO and the Company Secretary ensure that such induction and training programmes are provided to Directors.
Your Company under “Familiarisation Programme for Independent Directors; familiarise Independet Directors with the Company, their roles, rights, responsibilities in the Company, nature of industry in which the Company operates, business model of the Company etc. Your Company aims to provide its Independent Directors insight into the Company enabling them to contribute effectively.
During the year under review, Independent Directors were apprised on an ongoing basis in the various Board/Committee meetings on micro-economic environment, industry developments, regulatory updates, business overview, operations, financial statements, updates on statutory compliances for Board members etc. In this respect presentations were made to Independent Directors by Managing Director & Group CEO, CFO and other managerial
personnel. Apart from this, a familiarization programme on Board Evaluation was conducted in Financial Year 2016-17.
The details of such familiarization programmes for Independent Directors are posted on the website and can be accessed from below link: www.jindalsteelpower.com/img/admin/report/pdf/Policy_on_Familiarisation_of_IDs.pdf
Performance Evaluation of Board, Committees and Directors The Board of Directors of the Company ensures the formation and monitoring of robust evaluation framework of the Individual Directors including Chairman of the Board, Board as whole and various Committee(s) thereof. The Board of Directors had adopted the Evaluation Policy on the basis of recommendation of the Nomination and Remuneration Committee. The policy provides for evaluation of the Board, the Committee of the Board and Individual Directors, including the Chairman of the Board and shall be carried out on annual basis.
Nomination and Remuneration Committee in terms of SEBI circular no. SEBI/HO/CFD/CMD/CIR/P/2017/004 dated January 5, 2017 was aligned criterion of evaluation as prescribed.
Pursuant to the provisions of the Companies Act, 2013 and Regulation 17 of the SEBI (LODR) Regulations, 2015, the Board has carried out the annual performance evaluation of the Directors individually including Independent Directors, Board as a whole and its various committees.
During the year under review, the Independent Directors in terms of the Companies Act, 2013 and Regulation 25(4) of SEBI (LODR) Regulations, 2015 carried out performance evaluation of non-Independent Directors , Chairman of the Board and Board as a whole based on the criterion evaluation as approved by the Nomination and Remuneration Committee.
Nomination and Remuneration Committee in terms of the Companies Act, 2013, carried out evaluation of every Director’s performance.
The Directors expressed their satisfaction with the evaluation process.
Internal Audits and Compliance managementThe Company has an Internal Audit department that audits and reviews internal control, operating systems and procedures. The Corporate Secretarial Department ensures that the Company conducts its businesses with high standards of compliance in legal, statutory and regulatory. JSPL has instituted an online legal Compliance Management System called “iComply” in conformity with the best international standards which gives the compliance status on real time basis. The Governance and Busines Ethics Committee of the Board reviews the compliance status periodically. Additionally, the Company Secretary also submit the MIS on compliances to the Senior Management on regular basis.
| 81Statutory Reports Annexures to Board’s Report
Separate Meeting of Independent DirectorsIn terms of the provisions of Schedule IV of the Act read with Regulation 25 of SEBI (LODR) Regulations, 2015, the Independent Directors are required to meet at least once in a year without the presence of Non-Independent Directors and Management Representatives.
During the Financial year the Independent Directors met once on March 31, 2017 and inter alia discussed:
The performance of non-Independent Directors and the Board of Directors as a whole;
The performance of the Chairman of the Company, taking into account the views of executive Directors and non-executive Directors;
The quality, quantity and timeliness of flow of information between the Company Management and the Board that is necessary for the Board to effectively and reasonably perform their duties.
In addition to formal meetings, interactions outside the Board Meetings also take place between the Chairman and Independent Directors.
Board Meetings, Board Committee Meetings and Procedures The Board of Directors is the apex body constituted by shareholders for overseeing the Company’s overall functioning. The Board provides and evaluates the Company’s strategic direction, management policies and their effectiveness, and ensures that shareholders’ long-term interests are being served.
The Board has constituted eight Committees, namely Audit Committee, Nomination and Remuneration Committee, Stakeholders’ Relationship Committee, Health, Safety, CSR and Environment Committee, Governance and Business Ethics Committee, Risk Management Committee, Investment Committee and Corporate Management Committee. The Board is authorised to constitute additional functional Committees, from time to time, depending on business needs.
The Company’s internal guidelines for Board/Board Committee meetings facilitate the decision- making process at its meetings in an informed and efficient manner.
Board Meetings The Board meets at regular intervals to discuss and decide on Company’s / business policies and strategy apart from other regular business matters. Minimum five pre-scheduled Board meetings are held annually. Additional Board meetings are convened to address the Company’s specific needs. The Board notes compliance reports of all laws applicable to the Company, every quarter. However in case of a special and urgent business needs, the Board’s approval is taken by passing resolution by circulation, for the matters permitted by law, which is noted and confirmed in the subsequent meeting. Business Unit heads and senior management personnel make
presentations to the Board. The Board is updated on the discussions held at the Committee meetings and the recommendations made by various Committees.
The Chairman of the Board and Company Secretary, in consultation with other concerned members of the senior management, finalise the agenda for Board meetings. The agenda is circulated a week prior to the date of the meetings and includes detailed notes on items to be discussed at the meeting to enable the Directors to take an informed decision. The meetings are held at the Company’s office at Jindal Centre, 12 Bhikaiji Cama Place, New Delhi-110066 and sometimes at plant locations as decided by the Board.
The Company also provides facility to the Directors to attend meetings of the Board and its Committees through Video Conferencing mode except in respect of those meetings wherein transactions are not permitted to be carried out by way of video conferencing, to enable their participation.
Ten (10) Board meetings were held during the Financial Year 2016-17 on April 27, 2016, May 3, 2016, May 4, 2016, June 21, 2016, July 29, 2016, September 8, 2016, November 21, 2016, December 8, 2016, February 14, 2017 and March 30, 2017. The intervening gap between the two Board meetings was within the limit prescribed under the provisions of the Companies Act, 2013 and SEBI LODR.
Board Business The normal business of the Board includes:
Framing and overseeing progress of the Company’s annual plan and operating framework;
Framing strategies for shaping of portfolio and direction of the Company and for corporate resource allocation;
Reviewing financial plans of the Company; Reviewing the financial results including Annual Financial
Statements for adoption by the Members; Reviewing progress of various functions and businesses of the
Company; Reviewing the functioning of the Board and its Committees Reviewing the functioning of subsidiary companies; Considering/approving declaration/recommendation of
dividend; Considering/approving the appointments of Directors/KMPs
and other senior management below one level of Board; Considering/approving/recommending the appointment
of Statutory Auditor(s), Secretarial Auditors(s), payment of remuneration to Cost Auditors(s);
Considering/approving various fund raising activities / financial facilities within the permissible framework/approved limits;
Reviewing and resolving fatal or serious accidents or dangerous occurances, any material significant effluent or pollution problems or significant labour issues, if any;
Reviewing the details of significant development in human resources and industrial relations front;
Reviewing details of foreign exchange exposure and steps taken by the management to limit the risk of adverse exchange rate movement;
82 | Jindal Steel & Power Limited Annual Report 2016-17
Reviewing compliance with all relevant legislations and regulations and litigation status, including materiality, important show cause, demand, prosecution and penalty notices, if any;
Reviewing Board Remuneration Policy and Individual remuneration packages of Directors;
Advising on corporate restructuring such as merger, acquisition, joint venture or disposals, if any;
Reviewing various policies of the Company and monitoring implementation thereof;
Reviewing details of risk evaluation and internal controls; Reviewing reports on progress made on the ongoing projects; Monitoring and reviewing board evaluation framework; Reviewing quarterly results of the Company and its operating
divisions or business segments.
Board Support The Company Secretary is responsible for collation, review and distribution of all papers to be submitted to the Board and Committees thereof for consideration. The Company Secretary is also responsible for preparation of Agenda in consultation with the Chairman and Managing Director & Group CEO of the Company and convening of Board and Committee Meetings. The Company Secretary attends all the meetings of the Board and its Committees, advises and assures the Board on Compliance and Governance principles and ensures appropriate recording of minutes of the meetings.
E-Meeting – a Green InitiativeWith a view to leverage technology and reducing paper consumption, the Company has adopted a web-based secured application for transmitting Board/Board Committee(s) Agenda and pre-reads on real time basis. The Directors of the Company receive the Agenda
and pre-reads in electronic form through this application, which can be accessed through Browsers or iPads. The application meets high standard of security and integrity that is required for storage and transmission of Board/Committee(s) Agenda and pre-reads in electronic form.
Recording minutes of proceedings of Board and Committee meetings The Company Secretary records minutes of proceedings of each Board and Committee meeting. Draft minutes of the proceedings of the meeting are circulated to Board/ Board Committee members for their comments within 15 days of the meetings. The minutes are entered in the Minutes Book within 30 days from the conclusion of the meeting as per the Secretarial Standards issued by the Institute of Company Secretaries of India.
Post meeting follow-up mechanism The guidelines for Board and Board Committee meetings facilitate an effective post meeting follow-up, review and reporting process for decisions taken by the Board and Board Committee(s) thereof. Important decisions taken at Board/Board Committee meetings are communicated promptly to the concerned departments/divisions. Action-taken report on decisions/minutes of the previous meeting(s) is placed at the succeeding meeting of the Board/Board Committee for noting.
Compliance The Company Secretary, while preparing the agenda, notes on agenda and minutes of the proceedings of the meeting(s), ensures adherence to all applicable laws and regulations, including the Companies Act, 2013 read with rules issued thereunder, as applicable and the Secretarial Standards issued by the Institute of Company Secretaries of India and SEBI (LODR) Regulations, 2015.
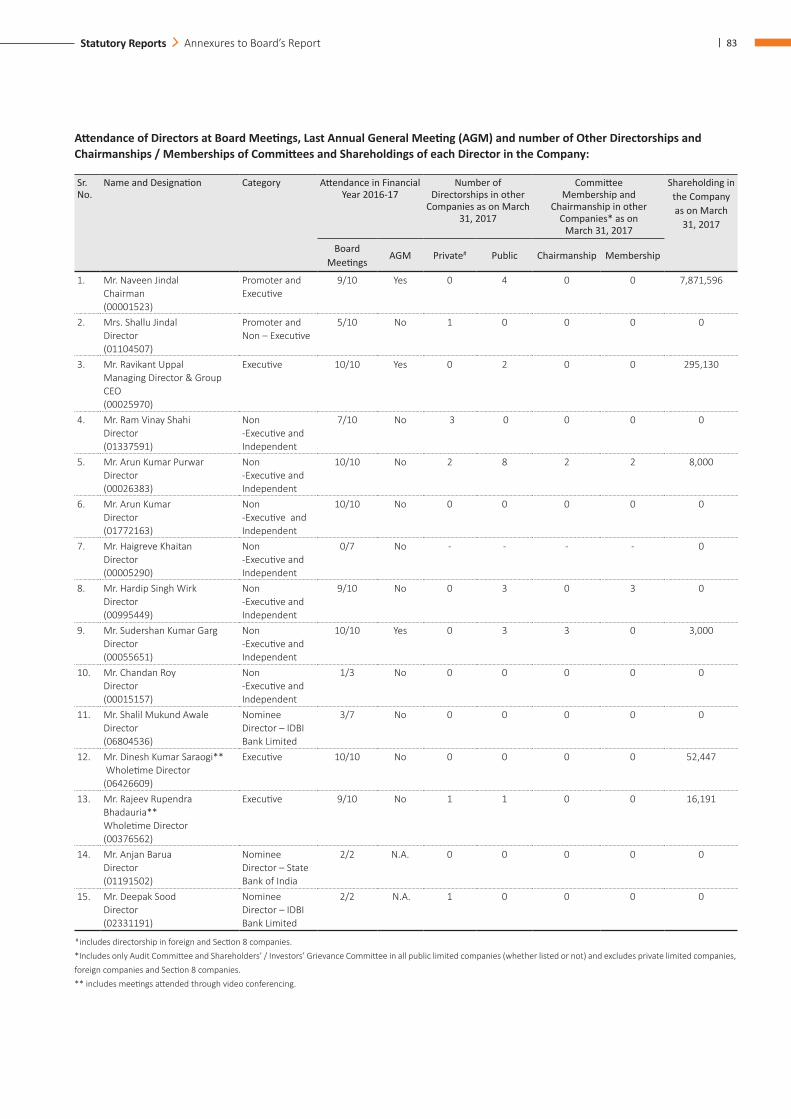
| 83Statutory Reports Annexures to Board’s Report
Attendance of Directors at Board Meetings, Last Annual General Meeting (AGM) and number of Other Directorships and Chairmanships / Memberships of Committees and Shareholdings of each Director in the Company:
Sr. No.
Name and Designation Category Attendance in Financial Year 2016-17
Number of Directorships in other
Companies as on March 31, 2017
CommitteeMembership and
Chairmanship in other Companies* as on
March 31, 2017
Shareholding in the Company as on March
31, 2017
Board Meetings
AGM Private# Public Chairmanship Membership
1. Mr. Naveen JindalChairman (00001523)
Promoter and Executive
9/10 Yes 0 4 0 0 7,871,596
2. Mrs. Shallu JindalDirector(01104507)
Promoter and Non – Executive
5/10 No 1 0 0 0 0
3. Mr. Ravikant UppalManaging Director & Group CEO(00025970)
Executive 10/10 Yes 0 2 0 0 295,130
4. Mr. Ram Vinay ShahiDirector(01337591)
Non -Executive and Independent
7/10 No 3 0 0 0 0
5. Mr. Arun Kumar PurwarDirector(00026383)
Non -Executive and Independent
10/10 No 2 8 2 2 8,000
6. Mr. Arun KumarDirector(01772163)
Non -Executive and Independent
10/10 No 0 0 0 0 0
7. Mr. Haigreve Khaitan Director(00005290)
Non -Executive and Independent
0/7 No - - - - 0
8. Mr. Hardip Singh WirkDirector(00995449)
Non -Executive and Independent
9/10 No 0 3 0 3 0
9. Mr. Sudershan Kumar Garg Director(00055651)
Non -Executive and Independent
10/10 Yes 0 3 3 0 3,000
10. Mr. Chandan Roy Director(00015157)
Non -Executive and Independent
1/3 No 0 0 0 0 0
11. Mr. Shalil Mukund Awale Director(06804536)
Nominee Director – IDBI Bank Limited
3/7 No 0 0 0 0 0
12. Mr. Dinesh Kumar Saraogi** Wholetime Director(06426609)
Executive 10/10 No 0 0 0 0 52,447
13. Mr. Rajeev Rupendra Bhadauria**Wholetime Director(00376562)
Executive 9/10 No 1 1 0 0 16,191
14. Mr. Anjan BaruaDirector(01191502)
Nominee Director – State Bank of India
2/2 N.A. 0 0 0 0 0
15. Mr. Deepak SoodDirector(02331191)
Nominee Director – IDBI Bank Limited
2/2 N.A. 1 0 0 0 0
# includes directorship in foreign and Section 8 companies.*Includes only Audit Committee and Shareholders’ / Investors’ Grievance Committee in all public limited companies (whether listed or not) and excludes private limited companies, foreign companies and Section 8 companies.** includes meetings attended through video conferencing.
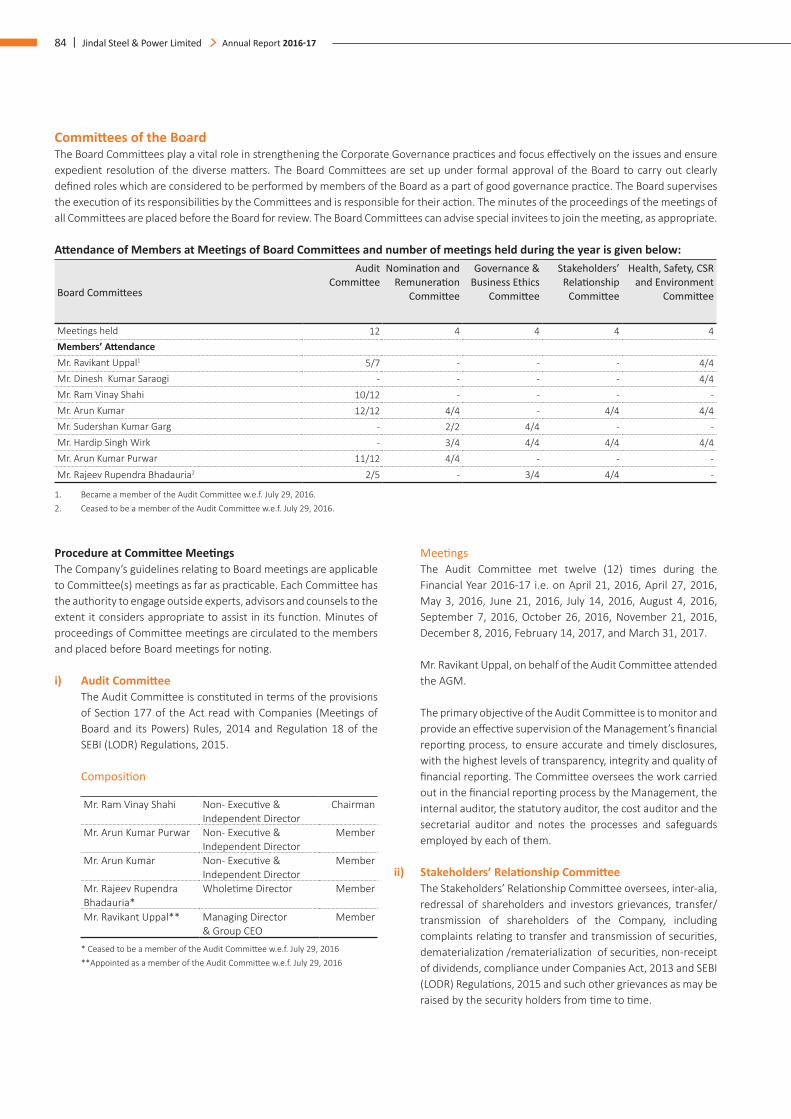
84 | Jindal Steel & Power Limited Annual Report 2016-17
Procedure at Committee MeetingsThe Company’s guidelines relating to Board meetings are applicable to Committee(s) meetings as far as practicable. Each Committee has the authority to engage outside experts, advisors and counsels to the extent it considers appropriate to assist in its function. Minutes of proceedings of Committee meetings are circulated to the members and placed before Board meetings for noting.
i) Audit Committee The Audit Committee is constituted in terms of the provisions
of Section 177 of the Act read with Companies (Meetings of Board and its Powers) Rules, 2014 and Regulation 18 of the SEBI (LODR) Regulations, 2015.
Composition
Mr. Ram Vinay Shahi Non- Executive & Independent Director
Chairman
Mr. Arun Kumar Purwar Non- Executive & Independent Director
Member
Mr. Arun Kumar Non- Executive & Independent Director
Member
Mr. Rajeev Rupendra Bhadauria*
Wholetime Director Member
Mr. Ravikant Uppal** Managing Director & Group CEO
Member
* Ceased to be a member of the Audit Committee w.e.f. July 29, 2016 **Appointed as a member of the Audit Committee w.e.f. July 29, 2016
Meetings The Audit Committee met twelve (12) times during the
Financial Year 2016-17 i.e. on April 21, 2016, April 27, 2016, May 3, 2016, June 21, 2016, July 14, 2016, August 4, 2016, September 7, 2016, October 26, 2016, November 21, 2016, December 8, 2016, February 14, 2017, and March 31, 2017.
Mr. Ravikant Uppal, on behalf of the Audit Committee attended the AGM.
The primary objective of the Audit Committee is to monitor and provide an effective supervision of the Management’s financial reporting process, to ensure accurate and timely disclosures, with the highest levels of transparency, integrity and quality of financial reporting. The Committee oversees the work carried out in the financial reporting process by the Management, the internal auditor, the statutory auditor, the cost auditor and the secretarial auditor and notes the processes and safeguards employed by each of them.
ii) Stakeholders’ Relationship Committee The Stakeholders’ Relationship Committee oversees, inter-alia,
redressal of shareholders and investors grievances, transfer/ transmission of shareholders of the Company, including complaints relating to transfer and transmission of securities, dematerialization /rematerialization of securities, non-receipt of dividends, compliance under Companies Act, 2013 and SEBI (LODR) Regulations, 2015 and such other grievances as may be raised by the security holders from time to time.
Committees of the BoardThe Board Committees play a vital role in strengthening the Corporate Governance practices and focus effectively on the issues and ensure expedient resolution of the diverse matters. The Board Committees are set up under formal approval of the Board to carry out clearly defined roles which are considered to be performed by members of the Board as a part of good governance practice. The Board supervises the execution of its responsibilities by the Committees and is responsible for their action. The minutes of the proceedings of the meetings of all Committees are placed before the Board for review. The Board Committees can advise special invitees to join the meeting, as appropriate.
Attendance of Members at Meetings of Board Committees and number of meetings held during the year is given below:
Board Committees
Audit Committee
Nomination and Remuneration
Committee
Governance & Business Ethics
Committee
Stakeholders’ Relationship
Committee
Health, Safety, CSR and Environment
Committee
Meetings held 12 4 4 4 4Members’ AttendanceMr. Ravikant Uppal1 5/7 - - - 4/4Mr. Dinesh Kumar Saraogi - - - - 4/4Mr. Ram Vinay Shahi 10/12 - - - -Mr. Arun Kumar 12/12 4/4 - 4/4 4/4Mr. Sudershan Kumar Garg - 2/2 4/4 - -Mr. Hardip Singh Wirk - 3/4 4/4 4/4 4/4Mr. Arun Kumar Purwar 11/12 4/4 - - -Mr. Rajeev Rupendra Bhadauria2 2/5 - 3/4 4/4 -
1. Became a member of the Audit Committee w.e.f. July 29, 2016.2. Ceased to be a member of the Audit Committee w.e.f. July 29, 2016.
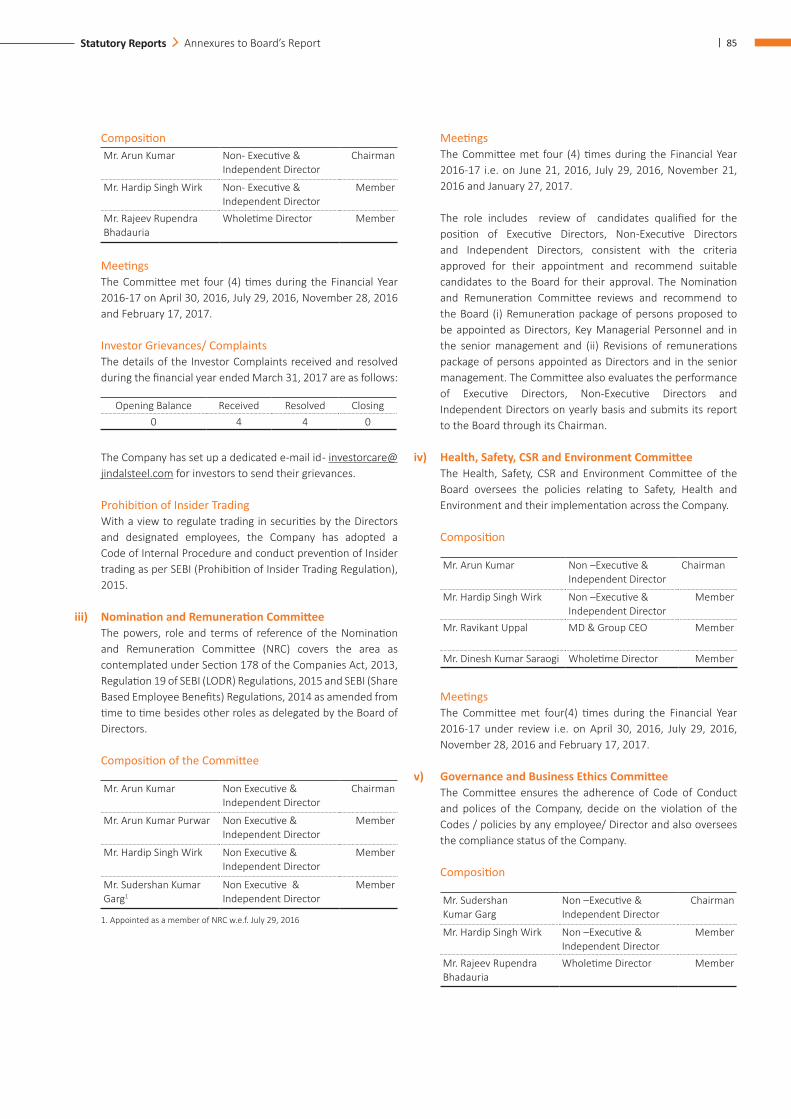
| 85Statutory Reports Annexures to Board’s Report
CompositionMr. Arun Kumar Non- Executive &
Independent DirectorChairman
Mr. Hardip Singh Wirk Non- Executive & Independent Director
Member
Mr. Rajeev Rupendra Bhadauria
Wholetime Director Member
Meetings The Committee met four (4) times during the Financial Year
2016-17 on April 30, 2016, July 29, 2016, November 28, 2016 and February 17, 2017.
Investor Grievances/ Complaints The details of the Investor Complaints received and resolved
during the financial year ended March 31, 2017 are as follows:
Opening Balance Received Resolved Closing0 4 4 0
The Company has set up a dedicated e-mail id - [email protected] for investors to send their grievances.
Prohibition of Insider Trading With a view to regulate trading in securities by the Directors and designated employees, the Company has adopted a Code of Internal Procedure and conduct prevention of Insider trading as per SEBI (Prohibition of Insider Trading Regulation), 2015.
iii) Nomination and Remuneration Committee The powers, role and terms of reference of the Nomination
and Remuneration Committee (NRC) covers the area as contemplated under Section 178 of the Companies Act, 2013, Regulation 19 of SEBI (LODR) Regulations, 2015 and SEBI (Share Based Employee Benefits) Regulations, 2014 as amended from time to time besides other roles as delegated by the Board of Directors.
Composition of the Committee
Mr. Arun Kumar Non Executive & Independent Director
Chairman
Mr. Arun Kumar Purwar Non Executive & Independent Director
Member
Mr. Hardip Singh Wirk Non Executive & Independent Director
Member
Mr. Sudershan Kumar Garg1
Non Executive & Independent Director
Member
1. Appointed as a member of NRC w.e.f. July 29, 2016
Meetings The Committee met four (4) times during the Financial Year
2016-17 i.e. on June 21, 2016, July 29, 2016, November 21, 2016 and January 27, 2017.
The role includes review of candidates qualified for the position of Executive Directors, Non-Executive Directors and Independent Directors, consistent with the criteria approved for their appointment and recommend suitable candidates to the Board for their approval. The Nomination and Remuneration Committee reviews and recommend to the Board (i) Remuneration package of persons proposed to be appointed as Directors, Key Managerial Personnel and in the senior management and (ii) Revisions of remunerations package of persons appointed as Directors and in the senior management. The Committee also evaluates the performance of Executive Directors, Non-Executive Directors and Independent Directors on yearly basis and submits its report to the Board through its Chairman.
iv) Health, Safety, CSR and Environment Committee The Health, Safety, CSR and Environment Committee of the
Board oversees the policies relating to Safety, Health and Environment and their implementation across the Company.
Composition
Mr. Arun Kumar Non –Executive & Independent Director
Chairman
Mr. Hardip Singh Wirk Non –Executive & Independent Director
Member
Mr. Ravikant Uppal MD & Group CEO Member
Mr. Dinesh Kumar Saraogi Wholetime Director Member
MeetingsThe Committee met four(4) times during the Financial Year 2016-17 under review i.e. on April 30, 2016, July 29, 2016, November 28, 2016 and February 17, 2017.
v) Governance and Business Ethics Committee The Committee ensures the adherence of Code of Conduct and polices of the Company, decide on the violation of the Codes / policies by any employee/ Director and also oversees the compliance status of the Company.
Composition
Mr. Sudershan Kumar Garg
Non –Executive & Independent Director
Chairman
Mr. Hardip Singh Wirk Non –Executive & Independent Director
Member
Mr. Rajeev Rupendra Bhadauria
Wholetime Director Member
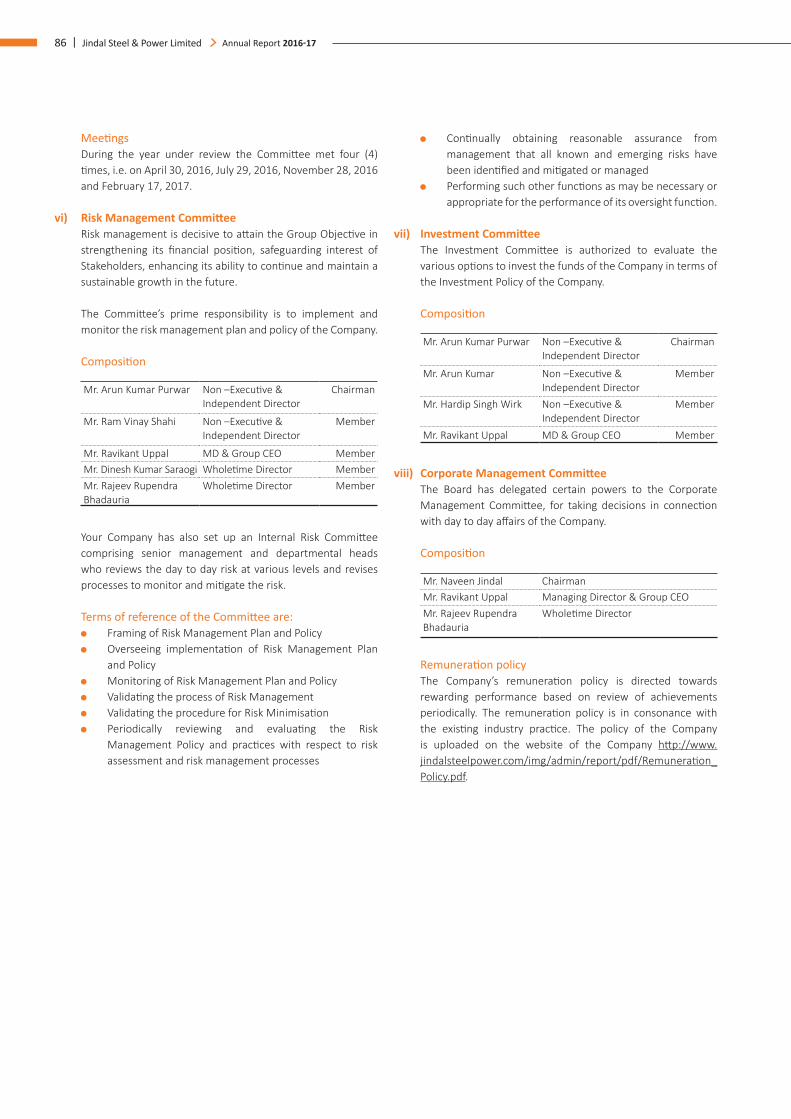
86 | Jindal Steel & Power Limited Annual Report 2016-17
Meetings During the year under review the Committee met four (4)
times, i.e. on April 30, 2016, July 29, 2016, November 28, 2016 and February 17, 2017.
vi) Risk Management Committee Risk management is decisive to attain the Group Objective in
strengthening its financial position, safeguarding interest of Stakeholders, enhancing its ability to continue and maintain a sustainable growth in the future.
The Committee’s prime responsibility is to implement and monitor the risk management plan and policy of the Company.
Composition
Mr. Arun Kumar Purwar Non –Executive & Independent Director
Chairman
Mr. Ram Vinay Shahi Non –Executive & Independent Director
Member
Mr. Ravikant Uppal MD & Group CEO MemberMr. Dinesh Kumar Saraogi Wholetime Director MemberMr. Rajeev Rupendra Bhadauria
Wholetime Director Member
Your Company has also set up an Internal Risk Committee comprising senior management and departmental heads who reviews the day to day risk at various levels and revises processes to monitor and mitigate the risk.
Terms of reference of the Committee are: Framing of Risk Management Plan and Policy Overseeing implementation of Risk Management Plan
and Policy Monitoring of Risk Management Plan and Policy Validating the process of Risk Management Validating the procedure for Risk Minimisation Periodically reviewing and evaluating the Risk
Management Policy and practices with respect to risk assessment and risk management processes
Continually obtaining reasonable assurance from management that all known and emerging risks have been identified and mitigated or managed
Performing such other functions as may be necessary or appropriate for the performance of its oversight function.
vii) Investment Committee The Investment Committee is authorized to evaluate the
various options to invest the funds of the Company in terms of the Investment Policy of the Company.
Composition
Mr. Arun Kumar Purwar Non –Executive & Independent Director
Chairman
Mr. Arun Kumar Non –Executive & Independent Director
Member
Mr. Hardip Singh Wirk Non –Executive & Independent Director
Member
Mr. Ravikant Uppal MD & Group CEO Member
viii) Corporate Management Committee The Board has delegated certain powers to the Corporate
Management Committee, for taking decisions in connection with day to day affairs of the Company.
Composition
Mr. Naveen Jindal ChairmanMr. Ravikant Uppal Managing Director & Group CEOMr. Rajeev Rupendra Bhadauria
Wholetime Director
Remuneration policy The Company’s remuneration policy is directed towards
rewarding performance based on review of achievements periodically. The remuneration policy is in consonance with the existing industry practice. The policy of the Company is uploaded on the website of the Company http://www.jindalsteelpower.com/img/admin/report/pdf/Remuneration_Policy.pdf.
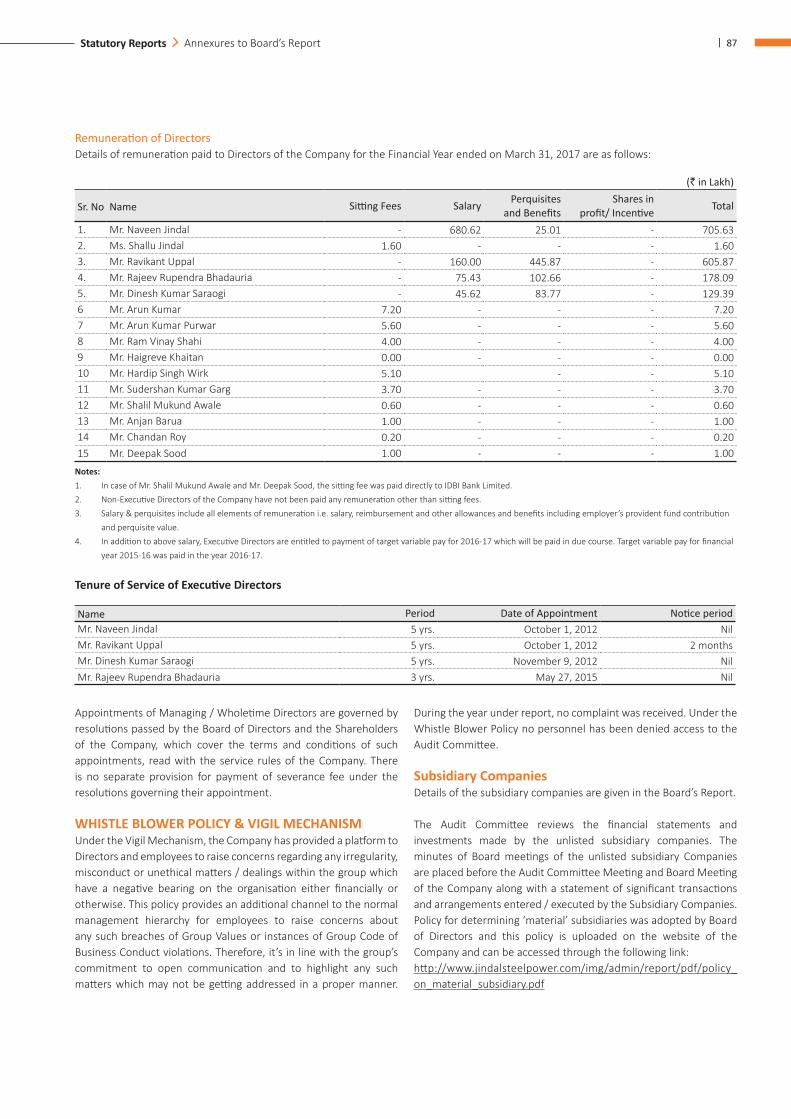
| 87Statutory Reports Annexures to Board’s Report
Appointments of Managing / Wholetime Directors are governed by resolutions passed by the Board of Directors and the Shareholders of the Company, which cover the terms and conditions of such appointments, read with the service rules of the Company. There is no separate provision for payment of severance fee under the resolutions governing their appointment.
WHISTLE BLOWER POLICY & VIGIL MECHANISMUnder the Vigil Mechanism, the Company has provided a platform to Directors and employees to raise concerns regarding any irregularity, misconduct or unethical matters / dealings within the group which have a negative bearing on the organisation either financially or otherwise. This policy provides an additional channel to the normal management hierarchy for employees to raise concerns about any such breaches of Group Values or instances of Group Code of Business Conduct violations. Therefore, it’s in line with the group’s commitment to open communication and to highlight any such matters which may not be getting addressed in a proper manner.
During the year under report, no complaint was received. Under the Whistle Blower Policy no personnel has been denied access to the Audit Committee.
Subsidiary CompaniesDetails of the subsidiary companies are given in the Board’s Report.
The Audit Committee reviews the financial statements and investments made by the unlisted subsidiary companies. The minutes of Board meetings of the unlisted subsidiary Companies are placed before the Audit Committee Meeting and Board Meeting of the Company along with a statement of significant transactions and arrangements entered / executed by the Subsidiary Companies. Policy for determining ‘material’ subsidiaries was adopted by Board of Directors and this policy is uploaded on the website of the Company and can be accessed through the following link: http://www.jindalsteelpower.com/img/admin/report/pdf/policy_on_material_subsidiary.pdf
Remuneration of Directors Details of remuneration paid to Directors of the Company for the Financial Year ended on March 31, 2017 are as follows:
(` in Lakh)
Sr. No Name Sitting Fees Salary Perquisites and Benefits
Shares in profit/ Incentive Total
1. Mr. Naveen Jindal - 680.62 25.01 - 705.632. Ms. Shallu Jindal 1.60 - - - 1.603. Mr. Ravikant Uppal - 160.00 445.87 - 605.874. Mr. Rajeev Rupendra Bhadauria - 75.43 102.66 - 178.095. Mr. Dinesh Kumar Saraogi - 45.62 83.77 - 129.396 Mr. Arun Kumar 7.20 - - - 7.207 Mr. Arun Kumar Purwar 5.60 - - - 5.608 Mr. Ram Vinay Shahi 4.00 - - - 4.009 Mr. Haigreve Khaitan 0.00 - - - 0.0010 Mr. Hardip Singh Wirk 5.10 - - 5.1011 Mr. Sudershan Kumar Garg 3.70 - - - 3.7012 Mr. Shalil Mukund Awale 0.60 - - - 0.6013 Mr. Anjan Barua 1.00 - - - 1.0014 Mr. Chandan Roy 0.20 - - - 0.2015 Mr. Deepak Sood 1.00 - - - 1.00
Notes: 1. In case of Mr. Shalil Mukund Awale and Mr. Deepak Sood, the sitting fee was paid directly to IDBI Bank Limited.2. Non-Executive Directors of the Company have not been paid any remuneration other than sitting fees.3. Salary & perquisites include all elements of remuneration i.e. salary, reimbursement and other allowances and benefits including employer’s provident fund contribution
and perquisite value. 4. In addition to above salary, Executive Directors are entitled to payment of target variable pay for 2016-17 which will be paid in due course. Target variable pay for financial
year 2015-16 was paid in the year 2016-17.
Tenure of Service of Executive Directors
Name Period Date of Appointment Notice periodMr. Naveen Jindal 5 yrs. October 1, 2012 NilMr. Ravikant Uppal 5 yrs. October 1, 2012 2 monthsMr. Dinesh Kumar Saraogi 5 yrs. November 9, 2012 NilMr. Rajeev Rupendra Bhadauria 3 yrs. May 27, 2015 Nil
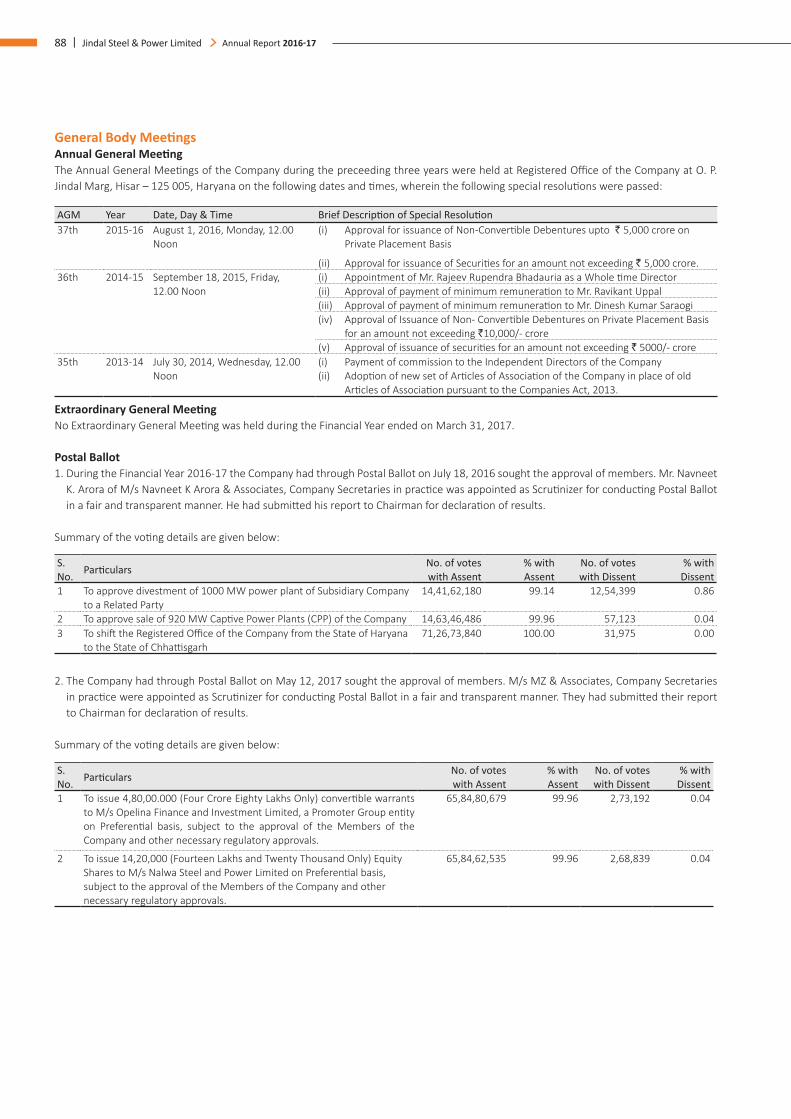
88 | Jindal Steel & Power Limited Annual Report 2016-17
General Body MeetingsAnnual General MeetingThe Annual General Meetings of the Company during the preceeding three years were held at Registered Office of the Company at O. P. Jindal Marg, Hisar – 125 005, Haryana on the following dates and times, wherein the following special resolutions were passed:
AGM Year Date, Day & Time Brief Description of Special Resolution37th 2015-16 August 1, 2016, Monday, 12.00
Noon(i) Approval for issuance of Non-Convertible Debentures upto ` 5,000 crore on
Private Placement Basis
(ii) Approval for issuance of Securities for an amount not exceeding ` 5,000 crore.36th 2014-15 September 18, 2015, Friday,
12.00 Noon(i) Appointment of Mr. Rajeev Rupendra Bhadauria as a Whole time Director (ii) Approval of payment of minimum remuneration to Mr. Ravikant Uppal (iii) Approval of payment of minimum remuneration to Mr. Dinesh Kumar Saraogi(iv) Approval of Issuance of Non- Convertible Debentures on Private Placement Basis
for an amount not exceeding `10,000/- crore(v) Approval of issuance of securities for an amount not exceeding ` 5000/- crore
35th 2013-14 July 30, 2014, Wednesday, 12.00 Noon
(i) Payment of commission to the Independent Directors of the Company (ii) Adoption of new set of Articles of Association of the Company in place of old
Articles of Association pursuant to the Companies Act, 2013.
Extraordinary General MeetingNo Extraordinary General Meeting was held during the Financial Year ended on March 31, 2017.
Postal Ballot1. During the Financial Year 2016-17 the Company had through Postal Ballot on July 18, 2016 sought the approval of members. Mr. Navneet
K. Arora of M/s Navneet K Arora & Associates, Company Secretaries in practice was appointed as Scrutinizer for conducting Postal Ballot in a fair and transparent manner. He had submitted his report to Chairman for declaration of results.
Summary of the voting details are given below:
S. No. Particulars No. of votes
with Assent% with Assent
No. of votes with Dissent
% with Dissent
1 To approve divestment of 1000 MW power plant of Subsidiary Company to a Related Party
14,41,62,180 99.14 12,54,399 0.86
2 To approve sale of 920 MW Captive Power Plants (CPP) of the Company 14,63,46,486 99.96 57,123 0.043 To shift the Registered Office of the Company from the State of Haryana
to the State of Chhattisgarh71,26,73,840 100.00 31,975 0.00
2. The Company had through Postal Ballot on May 12, 2017 sought the approval of members. M/s MZ & Associates, Company Secretaries in practice were appointed as Scrutinizer for conducting Postal Ballot in a fair and transparent manner. They had submitted their report to Chairman for declaration of results.
Summary of the voting details are given below:
S. No. Particulars No. of votes
with Assent% with Assent
No. of votes with Dissent
% with Dissent
1 To issue 4,80,00.000 (Four Crore Eighty Lakhs Only) convertible warrants to M/s Opelina Finance and Investment Limited, a Promoter Group entity on Preferential basis, subject to the approval of the Members of the Company and other necessary regulatory approvals.
65,84,80,679 99.96 2,73,192 0.04
2 To issue 14,20,000 (Fourteen Lakhs and Twenty Thousand Only) Equity Shares to M/s Nalwa Steel and Power Limited on Preferential basis, subject to the approval of the Members of the Company and other necessary regulatory approvals.
65,84,62,535 99.96 2,68,839 0.04
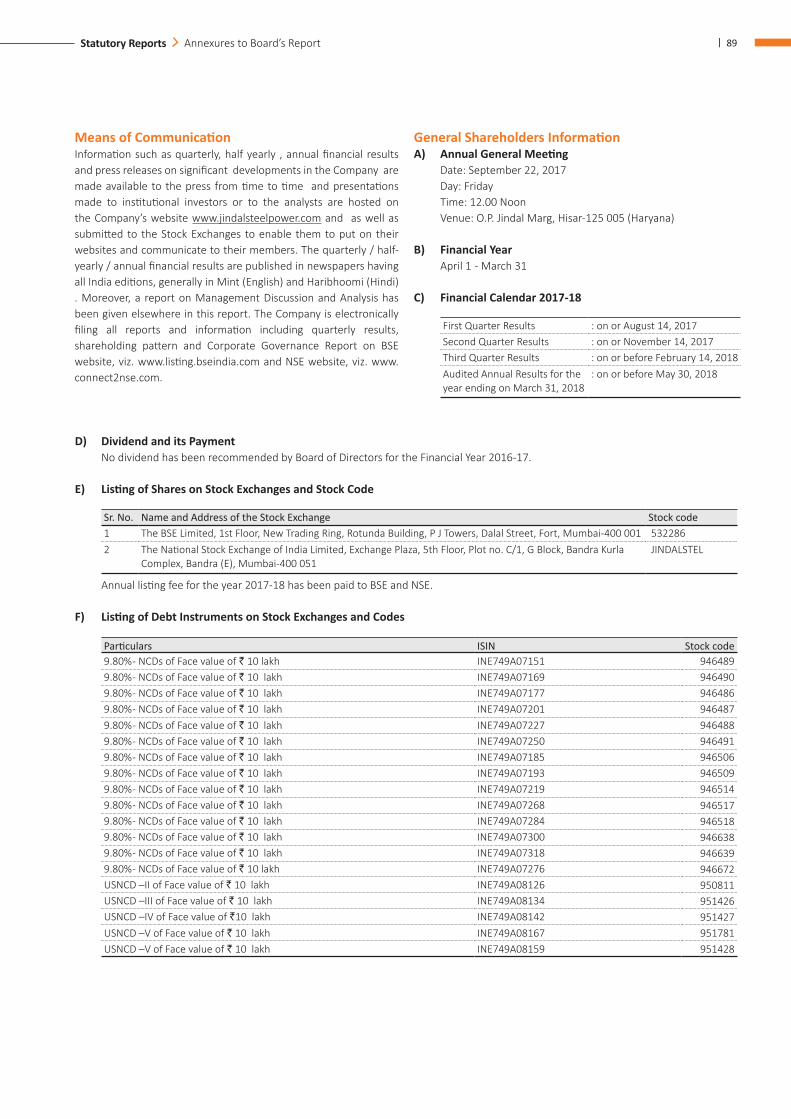
| 89Statutory Reports Annexures to Board’s Report
D) Dividend and its Payment No dividend has been recommended by Board of Directors for the Financial Year 2016-17.
E) Listing of Shares on Stock Exchanges and Stock Code
Sr. No. Name and Address of the Stock Exchange Stock code1 The BSE Limited, 1st Floor, New Trading Ring, Rotunda Building, P J Towers, Dalal Street, Fort, Mumbai-400 001 5322862 The National Stock Exchange of India Limited, Exchange Plaza, 5th Floor, Plot no. C/1, G Block, Bandra Kurla
Complex, Bandra (E), Mumbai-400 051JINDALSTEL
Annual listing fee for the year 2017-18 has been paid to BSE and NSE.
F) Listing of Debt Instruments on Stock Exchanges and Codes
Particulars ISIN Stock code9.80% - NCDs of Face value of ` 10 lakh INE749A07151 9464899.80% - NCDs of Face value of ` 10 lakh INE749A07169 9464909.80% - NCDs of Face value of ` 10 lakh INE749A07177 9464869.80% - NCDs of Face value of ` 10 lakh INE749A07201 9464879.80% - NCDs of Face value of ` 10 lakh INE749A07227 9464889.80% - NCDs of Face value of ` 10 lakh INE749A07250 9464919.80% - NCDs of Face value of ` 10 lakh INE749A07185 9465069.80% - NCDs of Face value of ` 10 lakh INE749A07193 9465099.80% - NCDs of Face value of ` 10 lakh INE749A07219 9465149.80% - NCDs of Face value of ` 10 lakh INE749A07268 9465179.80% - NCDs of Face value of ` 10 lakh INE749A07284 9465189.80% - NCDs of Face value of ` 10 lakh INE749A07300 9466389.80% - NCDs of Face value of ` 10 lakh INE749A07318 9466399.80% - NCDs of Face value of ` 10 lakh INE749A07276 946672USNCD –II of Face value of ` 10 lakh INE749A08126 950811USNCD –III of Face value of ` 10 lakh INE749A08134 951426USNCD –IV of Face value of `10 lakh INE749A08142 951427USNCD –V of Face value of ` 10 lakh INE749A08167 951781USNCD –V of Face value of ` 10 lakh INE749A08159 951428
Means of CommunicationInformation such as quarterly, half yearly , annual financial results and press releases on significant developments in the Company are made available to the press from time to time and presentations made to institutional investors or to the analysts are hosted on the Company’s website www.jindalsteelpower.com and as well as submitted to the Stock Exchanges to enable them to put on their websites and communicate to their members. The quarterly / half-yearly / annual financial results are published in newspapers having all India editions, generally in Mint (English) and Haribhoomi (Hindi) . Moreover, a report on Management Discussion and Analysis has been given elsewhere in this report. The Company is electronically filing all reports and information including quarterly results, shareholding pattern and Corporate Governance Report on BSE website, viz. www.listing.bseindia.com and NSE website, viz. www.connect2nse.com.
General Shareholders InformationA) Annual General Meeting Date: September 22, 2017 Day: Friday Time: 12.00 Noon Venue: O.P. Jindal Marg, Hisar-125 005 (Haryana)
B) Financial Year April 1 - March 31
C) Financial Calendar 2017-18
First Quarter Results : on or August 14, 2017Second Quarter Results : on or November 14, 2017Third Quarter Results : on or before February 14, 2018Audited Annual Results for the year ending on March 31, 2018
: on or before May 30, 2018
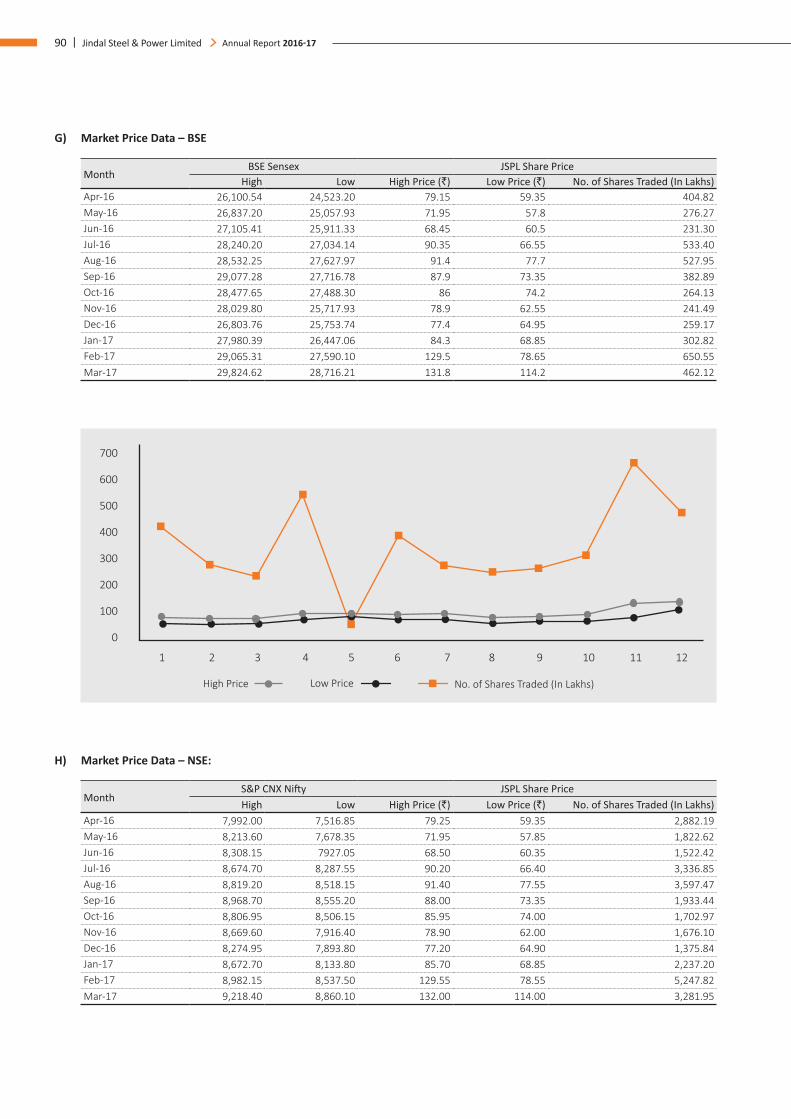
90 | Jindal Steel & Power Limited Annual Report 2016-17
G) Market Price Data – BSE
MonthBSE Sensex JSPL Share Price
High Low High Price (`) Low Price (`) No. of Shares Traded (In Lakhs)Apr-16 26,100.54 24,523.20 79.15 59.35 404.82May-16 26,837.20 25,057.93 71.95 57.8 276.27Jun-16 27,105.41 25,911.33 68.45 60.5 231.30Jul-16 28,240.20 27,034.14 90.35 66.55 533.40Aug-16 28,532.25 27,627.97 91.4 77.7 527.95Sep-16 29,077.28 27,716.78 87.9 73.35 382.89Oct-16 28,477.65 27,488.30 86 74.2 264.13Nov-16 28,029.80 25,717.93 78.9 62.55 241.49Dec-16 26,803.76 25,753.74 77.4 64.95 259.17Jan-17 27,980.39 26,447.06 84.3 68.85 302.82Feb-17 29,065.31 27,590.10 129.5 78.65 650.55Mar-17 29,824.62 28,716.21 131.8 114.2 462.12
H) Market Price Data – NSE:
MonthS&P CNX Nifty JSPL Share PriceHigh Low High Price (`) Low Price (`) No. of Shares Traded (In Lakhs)
Apr-16 7,992.00 7,516.85 79.25 59.35 2,882.19May-16 8,213.60 7,678.35 71.95 57.85 1,822.62Jun-16 8,308.15 7927.05 68.50 60.35 1,522.42Jul-16 8,674.70 8,287.55 90.20 66.40 3,336.85Aug-16 8,819.20 8,518.15 91.40 77.55 3,597.47Sep-16 8,968.70 8,555.20 88.00 73.35 1,933.44Oct-16 8,806.95 8,506.15 85.95 74.00 1,702.97Nov-16 8,669.60 7,916.40 78.90 62.00 1,676.10Dec-16 8,274.95 7,893.80 77.20 64.90 1,375.84Jan-17 8,672.70 8,133.80 85.70 68.85 2,237.20Feb-17 8,982.15 8,537.50 129.55 78.55 5,247.82Mar-17 9,218.40 8,860.10 132.00 114.00 3,281.95
1 2 3 4 6 7 8 9 10 11 12
700
5
600
500
400
300
200
100
0
High Price Low Price No. of Shares Traded (In Lakhs)
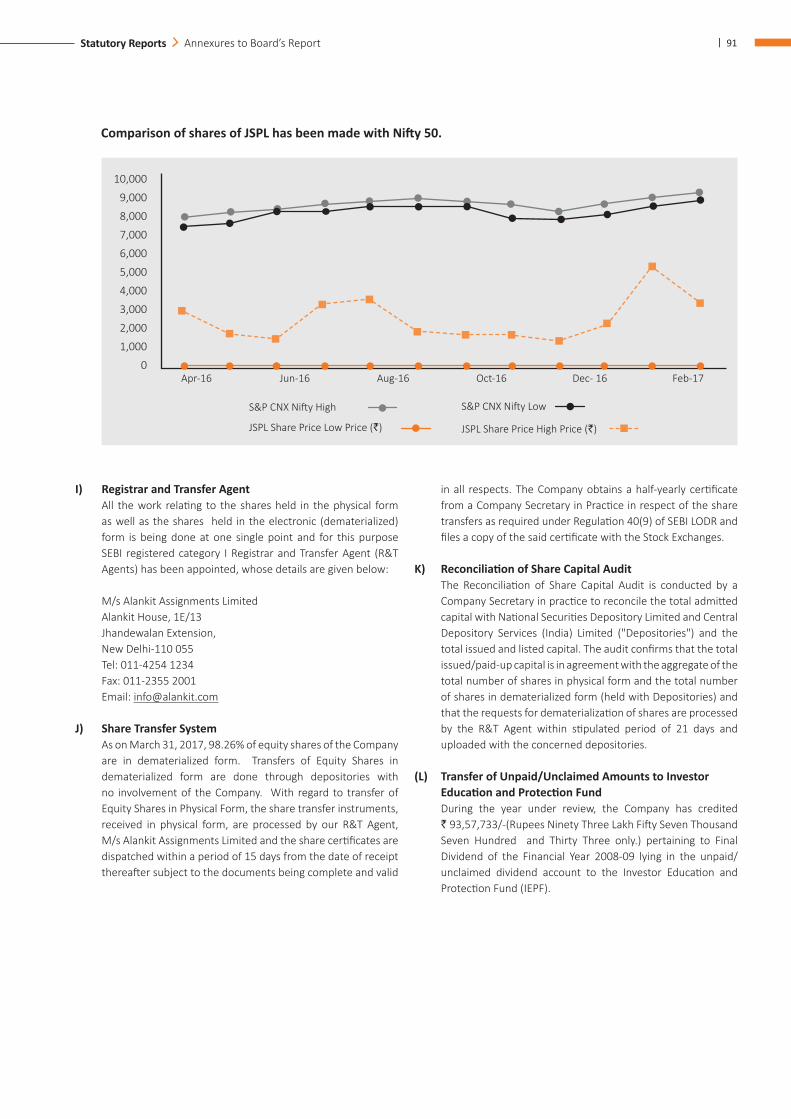
| 91Statutory Reports Annexures to Board’s Report
I) Registrar and Transfer Agent All the work relating to the shares held in the physical form
as well as the shares held in the electronic (dematerialized) form is being done at one single point and for this purpose SEBI registered category I Registrar and Transfer Agent (R&T Agents) has been appointed, whose details are given below:
M/s Alankit Assignments Limited Alankit House, 1E/13 Jhandewalan Extension, New Delhi-110 055 Tel: 011-4254 1234 Fax: 011-2355 2001 Email: [email protected]
J) Share Transfer System As on March 31, 2017, 98.26% of equity shares of the Company
are in dematerialized form. Transfers of Equity Shares in dematerialized form are done through depositories with no involvement of the Company. With regard to transfer of Equity Shares in Physical Form, the share transfer instruments, received in physical form, are processed by our R&T Agent, M/s Alankit Assignments Limited and the share certificates are dispatched within a period of 15 days from the date of receipt thereafter subject to the documents being complete and valid
in all respects. The Company obtains a half-yearly certificate from a Company Secretary in Practice in respect of the share transfers as required under Regulation 40(9) of SEBI LODR and files a copy of the said certificate with the Stock Exchanges.
K) Reconciliation of Share Capital Audit The Reconciliation of Share Capital Audit is conducted by a
Company Secretary in practice to reconcile the total admitted capital with National Securities Depository Limited and Central Depository Services (India) Limited ("Depositories") and the total issued and listed capital. The audit confirms that the total issued/paid-up capital is in agreement with the aggregate of the total number of shares in physical form and the total number of shares in dematerialized form (held with Depositories) and that the requests for dematerialization of shares are processed by the R&T Agent within stipulated period of 21 days and uploaded with the concerned depositories.
(L) Transfer of Unpaid/Unclaimed Amounts to Investor Education and Protection Fund
During the year under review, the Company has credited ` 93,57,733/-(Rupees Ninety Three Lakh Fifty Seven Thousand Seven Hundred and Thirty Three only.) pertaining to Final Dividend of the Financial Year 2008-09 lying in the unpaid/ unclaimed dividend account to the Investor Education and Protection Fund (IEPF).
Comparison of shares of JSPL has been made with Nifty 50.
10,000
9,000
8,000
7,000
6,000
5,000
4,000
3,000
2,000
1,000
0
S&P CNX Nifty High S&P CNX Nifty Low
JSPL Share Price Low Price (`) JSPL Share Price High Price (`)
Apr-16 Feb-17Jun-16 Aug-16 Oct-16 Dec- 16
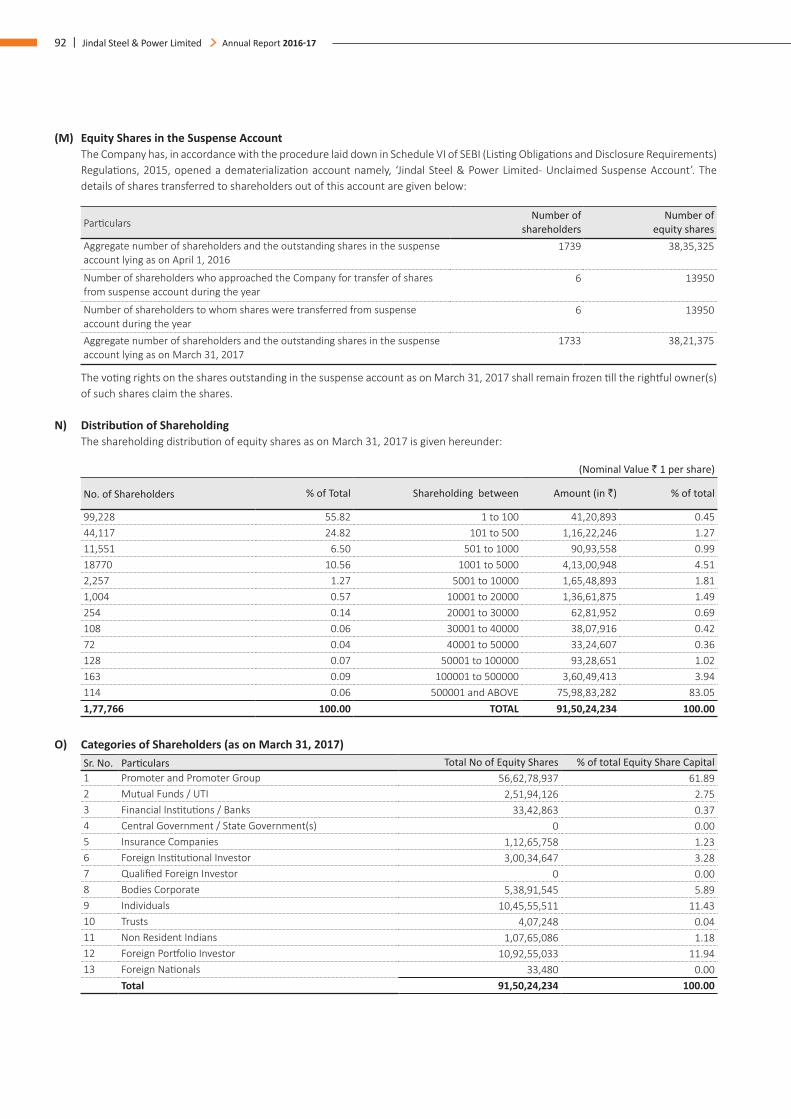
92 | Jindal Steel & Power Limited Annual Report 2016-17
(M) Equity Shares in the Suspense Account The Company has, in accordance with the procedure laid down in Schedule VI of SEBI (Listing Obligations and Disclosure Requirements)
Regulations, 2015, opened a dematerialization account namely, ‘Jindal Steel & Power Limited- Unclaimed Suspense Account’. The details of shares transferred to shareholders out of this account are given below:
ParticularsNumber of
shareholdersNumber of
equity sharesAggregate number of shareholders and the outstanding shares in the suspense account lying as on April 1, 2016
1739 38,35,325
Number of shareholders who approached the Company for transfer of shares from suspense account during the year
6 13950
Number of shareholders to whom shares were transferred from suspense account during the year
6 13950
Aggregate number of shareholders and the outstanding shares in the suspense account lying as on March 31, 2017
1733 38,21,375
The voting rights on the shares outstanding in the suspense account as on March 31, 2017 shall remain frozen till the rightful owner(s) of such shares claim the shares.
N) Distribution of Shareholding The shareholding distribution of equity shares as on March 31, 2017 is given hereunder:
(Nominal Value ` 1 per share)
No. of Shareholders % of Total Shareholding between Amount (in `) % of total
99,228 55.82 1 to 100 41,20,893 0.4544,117 24.82 101 to 500 1,16,22,246 1.2711,551 6.50 501 to 1000 90,93,558 0.9918770 10.56 1001 to 5000 4,13,00,948 4.512,257 1.27 5001 to 10000 1,65,48,893 1.811,004 0.57 10001 to 20000 1,36,61,875 1.49254 0.14 20001 to 30000 62,81,952 0.69108 0.06 30001 to 40000 38,07,916 0.4272 0.04 40001 to 50000 33,24,607 0.36128 0.07 50001 to 100000 93,28,651 1.02163 0.09 100001 to 500000 3,60,49,413 3.94114 0.06 500001 and ABOVE 75,98,83,282 83.051,77,766 100.00 TOTAL 91,50,24,234 100.00
O) Categories of Shareholders (as on March 31, 2017)Sr. No. Particulars Total No of Equity Shares % of total Equity Share Capital1 Promoter and Promoter Group 56,62,78,937 61.892 Mutual Funds / UTI 2,51,94,126 2.753 Financial Institutions / Banks 33,42,863 0.374 Central Government / State Government(s) 0 0.005 Insurance Companies 1,12,65,758 1.236 Foreign Institutional Investor 3,00,34,647 3.287 Qualified Foreign Investor 0 0.008 Bodies Corporate 5,38,91,545 5.899 Individuals 10,45,55,511 11.4310 Trusts 4,07,248 0.0411 Non Resident Indians 1,07,65,086 1.1812 Foreign Portfolio Investor 10,92,55,033 11.9413 Foreign Nationals 33,480 0.00 Total 91,50,24,234 100.00
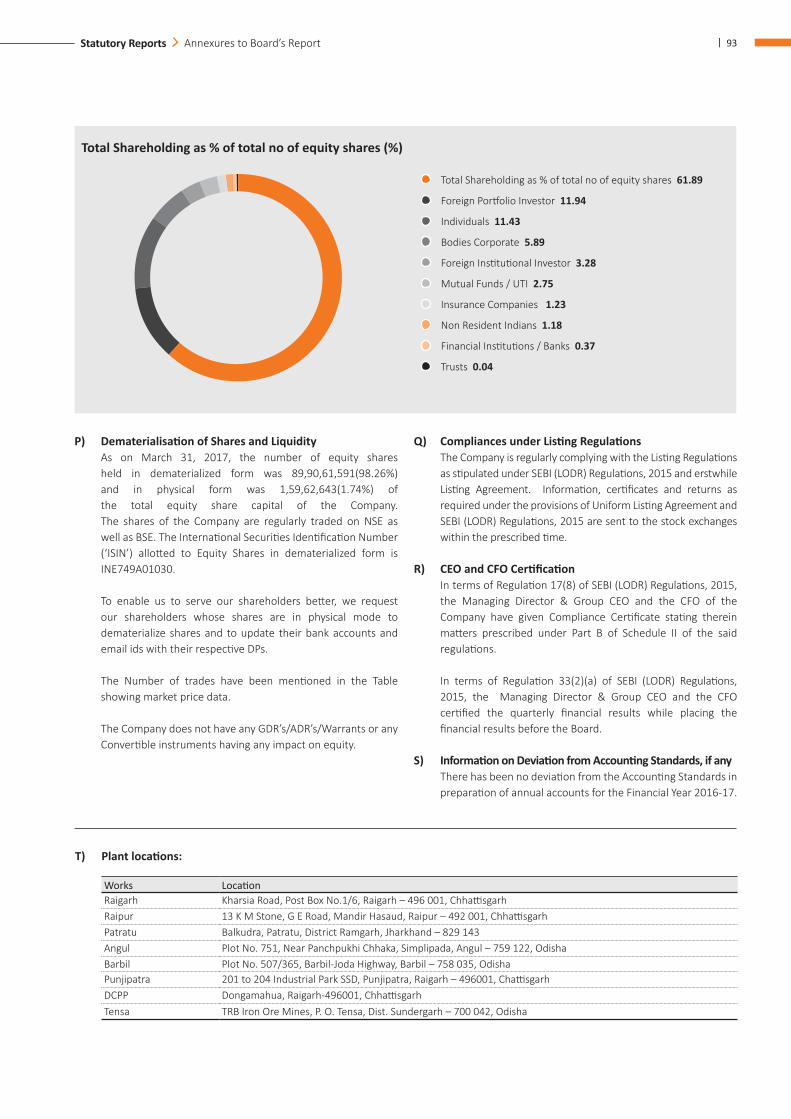
| 93Statutory Reports Annexures to Board’s Report
P) Dematerialisation of Shares and Liquidity As on March 31, 2017, the number of equity shares
held in dematerialized form was 89,90,61,591(98.26%) and in physical form was 1,59,62,643(1.74%) of the total equity share capital of the Company. The shares of the Company are regularly traded on NSE as well as BSE. The International Securities Identification Number (‘ISIN’) allotted to Equity Shares in dematerialized form is INE749A01030.
To enable us to serve our shareholders better, we request our shareholders whose shares are in physical mode to dematerialize shares and to update their bank accounts and email ids with their respective DPs.
The Number of trades have been mentioned in the Table showing market price data.
The Company does not have any GDR’s/ADR’s/Warrants or any Convertible instruments having any impact on equity.
T) Plant locations:
Works LocationRaigarh Kharsia Road, Post Box No.1/6, Raigarh – 496 001, ChhattisgarhRaipur 13 K M Stone, G E Road, Mandir Hasaud, Raipur – 492 001, ChhattisgarhPatratu Balkudra, Patratu, District Ramgarh, Jharkhand – 829 143Angul Plot No. 751, Near Panchpukhi Chhaka, Simplipada, Angul – 759 122, OdishaBarbil Plot No. 507/365, Barbil-Joda Highway, Barbil – 758 035, OdishaPunjipatra 201 to 204 Industrial Park SSD, Punjipatra, Raigarh – 496001, ChattisgarhDCPP Dongamahua, Raigarh-496001, ChhattisgarhTensa TRB Iron Ore Mines, P. O. Tensa, Dist. Sundergarh – 700 042, Odisha
Total Shareholding as % of total no of equity shares (%)
Total Shareholding as % of total no of equity shares 61.89
Foreign Portfolio Investor 11.94
Individuals 11.43
Bodies Corporate 5.89
Foreign Institutional Investor 3.28
Mutual Funds / UTI 2.75
Insurance Companies 1.23
Non Resident Indians 1.18
Financial Institutions / Banks 0.37
Trusts 0.04
Q) Compliances under Listing Regulations The Company is regularly complying with the Listing Regulations
as stipulated under SEBI (LODR) Regulations, 2015 and erstwhile Listing Agreement. Information, certificates and returns as required under the provisions of Uniform Listing Agreement and SEBI (LODR) Regulations, 2015 are sent to the stock exchanges within the prescribed time.
R) CEO and CFO Certification In terms of Regulation 17(8) of SEBI (LODR) Regulations, 2015,
the Managing Director & Group CEO and the CFO of the Company have given Compliance Certificate stating therein matters prescribed under Part B of Schedule II of the said regulations.
In terms of Regulation 33(2)(a) of SEBI (LODR) Regulations, 2015, the Managing Director & Group CEO and the CFO certified the quarterly financial results while placing the financial results before the Board.
S) Information on Deviation from Accounting Standards, if any There has been no deviation from the Accounting Standards in
preparation of annual accounts for the Financial Year 2016-17.
94 | Jindal Steel & Power Limited Annual Report 2016-17
U) Investor Correspondence The Company Secretary Jindal Steel & Power Limited 12, Bhikaiji Cama Palce New Delhi-110 066, Ph: 011-41462000, Fax: 011-45021828 Email: [email protected]
V) Commodity price risk or foreign exchange risk and hedging risk.
The details for the same have been provided under the Management Discussion and Analysis Report.
Disclosures i) The Company has not entered into any materially
significant related party transactions which have potential conflict with the interest of the Company at large. Board of Directors of the Company with the approval of shareholders through requisite majority, had approved a Policy on Related Party Transactions.
The policy can be accessed through http://www.jindalsteelpower.com/img/admin/report/pdf/RPT_Policy.pdf
ii) The Company has complied with the requirements of the Stock Exchanges, SEBI and other statutory authorities on all matters relating to capital markets during the last three years. No penalties or strictures have been imposed on the Company by the Stock Exchanges, SEBI or other statutory authorities relating to the above.
iii) The Company has complied with all the mandatory requirements of Corporate Governance as prescribed under the SEBI (LODR) Regulations, 2015.
iv) Discretionary requirements The Company has discretionally adopted separate posts
of Chairperson along with Managing Director and Chief Executive Officer.
Other information to the shareholders Dividend declared during past 10 years:-
S.No Financial Year Dividend Rate1 2015-16 Nil2 2014-15 Nil3 2013-14 150%4 2012-13 160%5 2011-12 160%6 2010-11 150%7 2009-10 125%8 2008-09 550%9 2007-08 Final 250%
Interim 150%10 2006-07 Final 240%
Interim 120%
Green InitiativePursuant to Section 101 and 136 of the Act read with Companies (Management and Administration) Rules, 2014 and Companies (Accounts) Rules, 2014, the Company can send Notice of Annual General Meeting, financial statements and other communication in electronic forms. Your Company is sending the Annual Report including the Notice of Annual General Meeting, audited financial statements, Directors Report along with their annexures etc. for the financial year 2016-17 in the electronic mode to the shareholders who have registered their email ids with the Company and/or their respective Depository Participants (DPs).
Shareholders who have not registered their e-mail addresses so far are requested to register their e-mail addresses. Those holding shares in demat form can register their e-mail addresses with their concerned DPs. Shareholders who hold shares in physical form are requested to register their e-mail addresses with the Company, by sending a letter, duly signed by the first/sole holder quoting details of Folio No.
Code of Conduct Code of conduct for the Directors and Senior Management of the Company has been laid down with a view to promote good corporate governance and exemplary personal conduct and is applicable to all the Directors and Senior Managerial Personnel of the Company. This Code is also available on the website of the Company www.jindalsteelpower.com
In Compliance of Regulation 26 (3) of SEBI (LODR) Regulations, 2015, all the Directors and Senior Management of the Company have affirmed compliance of code of conduct as on March 31, 2017.
Declaration of compliance of the Code of Conduct in terms of Schedule V of SEBI (LODR) Regulations, 2015 is given hereunder:The Board of Directors of Jindal Steel & Power Limited has pursuant to Regulation 17(5) of SEBI (LODR) Regulations, 2015 laid down Code of Conduct for all Board members and senior managerial personnel of the Company which has also been posted on the website of the Company, viz. www.jindalsteelpower.com.
In terms of Schedule V of the said regulations and as per ‘affirmation of compliance’ letters received from the Directors and the members of senior managerial personnel of the Company, I hereby declare that Directors and the members of senior management of the Company have complied with the Code of Conduct during the Financial Year 2016-17.”
For and on behalf of the Board of Directors
Ravikant Uppal Managing Director & Group CEO
| 95Statutory Reports Annexures to Board’s Report
CERTIFICATE ON CORPORATE GOVERNANCEAs per SEBI (Listing Obligations and Disclosure Requirements) Regulations, 2015
To,The Members,Jindal Steel and Power Limited,
We have examined the compliance of conditions of corporate governance by the Jindal Steel and Power Limited for the year ended 31st March, 2017, as per Regulations 17 to 27, clause (b) to (i) of sub-regulations (2) of Regulations 46 and paragraphs C,D and E of Schedule V of the SEBI (Listing Obligations and Disclosure Requirements) Regulations, 2015.
The compliance of conditions of corporate governance is the responsibility of the management. Our examination was limited to procedures and implementation thereof, adopted by the Company for ensuring the compliance of the conditions of the corporate governance. It is neither an audit nor an expression of opinion on the financial statements of the Company.
In our opinion and to the best of information and according to the explanations given to us, we certify that the Company has complied with the conditions of Corporate Governance as per Regulations 17 to 27, clause (b) to (i) of sub-regulations (2) of Regulations 46 and paragraphs C, D and E of Schedule V of the SEBI (Listing Obligations and Disclosure Requirements) Regulations, 2015, as applicable, except the composition of Board as on 31st March, 2017 of the Corporate Governance Report.
We further state that such compliance is neither an assurance as to the future viability of Company nor the efficiency or effectiveness with which the management has conducted the affairs of the Company.
For and on behalf of RSMV & Co.
Manoj Sharma (Partner)
Place: New Delhi Date: May 23, 2017
FCS: 7516 CP No.: 11571
96 | Jindal Steel & Power Limited Annual Report 2016-17
Brief Profile of Directors
Mr. Naveen Jindal is the Chairman of Jindal Steel and Power Limited (JSPL). He also serves as the President of Flag Foundation of India (FFI) and Chancellor of OP Jindal Global University, and represented Kurukshetra Parliamentary Constituency in the Indian Parliament. Under his able leadership, JSPL has significantly enhanced its liquid and finished steelmaking capacities to over 10 MTPA and 8.4 MTPA respectively; and created power generation capacities of over 5050 MW for the nation. From a manufacturing facility at Raigarh, JSPL now has manufacturing and operational presence in Angul – Odisha, Patratu – Jharkhand in India; and in key global geographies including a 2 MTPA integrated steel plant at Oman; and coal mining operations across Australia, Mozambique and South Africa. JSPL, through its subsidiary Jindal Power Limited, successfully created India’s first private sector power plant of 1000 MW, which after expansion, forms the largest power generation complex of UMPP scale in Chhattisgarh with a generation capacity of 3400 MW.
Mr. Jindal holds a MBA degree from the University of Texas at Dallas, USA. After completing his education, he returned to India and started contributing to the growth of the company.
Mr. Naveen Jindal’s idea of building the nation of his dreams inspired him to commit himself towards ‘Making In India’. The spirit of innovation and the dream of using swadeshi raw materials aided the success story of JSPL under his able leadership.
Manifesting Mr. Naveen Jindal’s vision of Building a Nation of Our Dreams, today JSPL is amongst the select league of 7 global steelmakers with capability to manufacture Head Hardened Rails for laying future railroads including bullet trains and hi-speed metros. JSPL also manufactures world’s longest single-piece rails of upto 121-meter length. Inspired by Mr. Jindal’s vision to continually enhance operational efficiencies, JSPL has deployed significant process efficiency enhancers including New Electric Oxygen Furnace, capable of operating at Zero Power intake.
Led from the front by Mr. Naveen Jindal, JSPL has successfully completed amongst India’s Most Modern 6 MTPA Integrated Steel Plant at Angul – Odisha, comprising of India’s largest 4 MTPA Blast Furnace. The Blast Furnace came up in a record time of 27 months, establishing new benchmarks in global steelmaking. The Integrated Steel Plant, initially envisaged as the country’s first steel plant to be based on purely swadeshi raw material, innovated world’s largest Coal Gasification Plant (CGP) for Steelmaking through the DRI route. Housing the world’s largest 1.5 MTPA Bar Mill and India’s most advanced Plate Mill, JSPL’s steel plant at Angul produces the most diverse range of flat and long products; using a prudent mix of electric and oxygen steelmaking processes adding significant flexibility to its efficient operations.
With a strong belief in prudent forward and backward integrations, JSPL established India’s largest 9 MTPA Pelletization Complex at Barbil, Odisha. In 2016-17, JSPL emerged as India’s largest Pellet exporter to the world.
Curated under guidance of Mr. Naveen Jindal, the global manufacturing foray of JSPL was undertaken at Oman, with setting up a 2 MTPA integrated steel plant at Sohar. The steel plant comprises of a 1.5 MTPA Bar Mill, the largest in the world, catering to the robust demand of TMT Rebars in the Middle East. In line with the fundamental philosophies inculcated by Mr. Jindal, Jindal Shadeed, Oman also came up in a record time and at amongst the lowest costs as compared to manufacturing facilities of similar size and scale. Jindal Shaded, Oman is amongst Top 3 steelmakers in the Gulf region today.
Mr. Jindal also undertook the right to display the National Flag with respect, dignity and honour. His spirit of Nationalism was duly rewarded after a decade, when the Supreme Court of India delivered a historic judgment, which allowed every Indian to hoist the Indian Flag with pride.
Mr. Naveen Jindal represented Kurukshetra in the Indian Parliament for 10 years in the 14th and 15th Lok Sabha and was part of several Parliamentary Committees and initiatives.
As part of his Philanthropic initiative, Mr. Naveen Jindal founded the OP Jindal Global University in 2009 with a deep desire to ensure quality education to build a strong foundation for future of India. The University ranks amongst the country’s most prestigious higher education institutions today. OP Jindal University at Raigarh offers Engineering and Management courses in diverse disciplines, to further Mr. Jindal’s vision of providing quality higher education.
Numerous awards and accolades have conferred upon Mr. Naveen Jindal for his contributions to multiple disciplines of business, philanthropy, education, sports etc., some of them include:
- Industry Communicator of the Year 2016 by World Steel Association
- Young Global Leaders – 2007 by World Economic Forum
- India’s Best CEO by BT – INSEAD – Harvard Business Review; JSPL was rated as the Highest value creator in Indian for the period 1995 – 2011.
- Top Ten India Inc’s Most Powerful CEO’s – 2011 by The Economic Times
| 97Statutory Reports Brief Profile of Directors
- Young Entrepreneur of the Year Award – 2010 by Ernst & Young in field of Energy and Infrastructure
- Justice PN Bhagwati Award for unique contribution to legal education and philanthropy by Dr. A.P.J. Abdul Kalam
Mr. Jindal is an acclaimed shooter and an avid Polo Player. The Jindal Panther Polo team consistently ranks amongst the best Polo teams of India, winning several laurels under his captaincy.
Ms. Shallu Jindal is a Non-Executive Director of the Company. She is a renowned Kuchipudi dancer and has performed with much acclaim and alacrity, both nationally and internationally at various venues across India and abroad. She currently heads National Bal Bhavan as Chairperson with vision to give the children the best, equipping them for the future and nurturing their talents so that they become the leaders of tomorrow. She was honoured with the 2nd Aaadhi Aabadi Women Achievers Award, 2010 and the ‘Indira Gandhi Priyadarshini Award 2007’ for her outstanding achievements in the field of Indian classical dance (Kuchipudi) and contribution in the field of art and culture, education and community development.
She was awarded the 2012 Rex Karmaveer Puraskaar – ‘artist for change’ for her outstanding services and achievements in the field of Indian Classical Dance (Kuchipudi). The award also marks her contributions towards social activities through the field of art and culture, education and community development. She has also been awarded with the International Women’s Day award under the category of ‘Dance’ (IWD award) by ICUNR (Indian Council for UN Relations). She has been honoured with ‘Rajiv Gandhi Excellence Award’, ‘Devdasi National Award’ & ‘Art Karat Award for Excellence’ for Best Classical Danseuse and remarkable contribution in field of Indian Classical Dance.
She co-chairs JSPL Foundation with her husband Mr. Naveen Jindal and spearheading the CSR initiatives of the conglomerate. She focuses on facilitating holistic community developments through various CSR interventions in the operative geographies of JSPL and its subsidiaries. Working towards educating for better minds and helping the underprivileged get access to the best in education is the motto of her life. Women empowerment and working for the deprived sections of the society are issues close to her heart. She is Vice-President of the Flag Foundation of India and has initiated various creative ventures.
She has compiled books like ‘Tiranga- My Life’, ‘My Words and Freedom’. She is also an applauded author and has authored her first book for children titled ‘India: An Alphabet Ride’. She is also Director on the Board of Miracle Foundation India and Jindal Steel & Power (Mauritius) Limited.
Mr. Ravikant Uppal being the Managing Director & Group CEO of JSPL Group, is presently driving the Company’s growth and is responsible for business excellence, both in domestic and global markets. With wide-ranging business experience spanning over 38 years in engineering and infrastructure segments in India and abroad, Mr. Uppal is known for his entrepreneurial experience.
Before joining JSPL, he served as the Whole-time Director and President & CEO (Power) at L&T. Earlier he held various positions in ABB Group including President of Global Market, Member of Group Executive Committee, President of ABB in Asia Pacific Region& Chairman & MD of ABB India. He has also to his credit of being the Founding Managing Director of Volvo in India.
Mr. Uppal has been awarded the Royal Order of the Polar Star by the King of Sweden that named him Knight of this Order in recognition of his invaluable services to the Kingdom of Sweden. He was also conferred with the Marketing Award 2005 by the Institute of Marketing Management, India and named among ‘India’s Best of the Best’ by Smart Manager magazine.
He holds a degree in Mechanical Engineering from the Indian Institute of Technology (IIT) Delhi, which has honoured him as a Distinguished Alumni. He is also an alumnus of the Indian Institute of Management (IIM) Ahmedabad. He has also done an Advanced Management Program from Wharton Business School, USA. Mr. Uppal is actively involved in several industry forums & academic institutions, and holds a keen interest in social and community development initiatives. He is Director on the Board of Jindal Power Limited and Suzlon Energy Limited. He is member of Health, Safety, CSR and Environment Committee, Investment Committee and Risk Management Committee of the Company.
Mr. Rajeev Rupendra Bhadauria is a Wholetime Director of the Company. He is post graduate in Personnel Management and Industrial Relations from the Power Management Institute, NTPC and LLB from Allahabad University. He brings with him a rich, diverse and rare experience in his 32 years of cherished career as an HR professional, both in the Public and Private Sectors.
The choice made by him at the decisive moment of his youth to opt for Public Sector Service rather than Indian Administrative Service, gave him a unique opportunity of working with one of India’s largest Public Sector as well as Private Sector Organisation.
His decade long stint in NTPC saw him rising from an entry level HR executive to the youngest Regional HR Head leading NTPC’s largest region in terms of the generating capacity and workforce. Having successfully managed two wage settlements, the acquisition of UPSEB’s Unchahar power station and the de-merger of PowerGrid from NTPC, he was fully equipped to explore the challenges of the private sector dynamics.
Making a decisive move into the private sector, he joined Reliance Infrastructure (then BSES) in 1995 as the Head of Corporate HR and oversaw the setting up of HR systems at Dahanu Thermal Power Station and the other upcoming Generating Stations of Reliance Infrastructure. The power sector reforms in India saw him leading the BSES acquisition of Orissa and Delhi Distribution companies, and subsequently managing the takeover of BSES by Reliance. His professional acumen catapulted him to the Group level where he played a pivotal role in the de-merger process of the Reliance Group. He was one of the Group’s key resource in guiding the transformation of Reliance - ADA Group demonstrating competencies of leading acquisitions, demergers, incubations and steady state operations.
98 | Jindal Steel & Power Limited Annual Report 2016-17
At present, as a Director – Group HR, he has contributed in transforming and driving the organizational capabilities towards making it modern, progressive, and a future-proof process- a unique blend of promoting principles of diffused leadership with a strong sense of business prudence exemplified / strengthened by a strong sense of commercial and financial proprietary. This competence of his arises from his ability to comprehend and deal with the complexities of managing and striking a pragmatic balance between people aspirations and organizational considerations in a turbulent and tumultuous business environment of the post-Lehman Era.
Having deftly dealt with sectors as core as Steel, Power, Core Infrastructure, Cement, Shipping, Mining, Natural Resources, Oil & Gas and Communication on one hand and service sectors such as healthcare, entertainment, financial services on the other hand, he is arguably one of the most astute HR professionals around. His strong system orientation, deep business understanding and wide exposure to global trends and practices coupled with his voracious reading make him the most sought after HR professional. He is Director on Board of Jindal Synfuels Limited, Indian Iron and Steel Sector Skill Council.
Mr. Dinesh Kumar Saraogi is Executive Director Incharge & Location Head of JSPL, Angul. He is also a Wholetime Director of the Company. His professional experience spans 36 years out of which he has been associated with Jindal Group for more than 28 years.
Mr. Saraogi holds a degree in Mechanical Engineering from Govt. Engg. College, Jabalpur in the year 1981. He joined Jindal Group in November 1988 and since then, Mr. Saraogi rose to positions of increasing responsibility as he moved from Dy. Manager to the level of Executive Director in-charge on April 01, 2012.
He has served the organization at many locations starting from Jindal Hisar, Raigarh [C.G.], Oman (Middle East). Presently, In-charge mega green field 6 million ton Steel & Power project at Angul (Odisha) which habitats the latest technology plant and equipment of International standards. He has worked directly under the legendary and visionary leader Late Babuji Shri O.P. Jindal who is the founder of Jindal Group of companies, and received his training.
Mr. Saraogi has visited several plants in India and abroad, such as USA, Holland, Austria, France, Thailand, Germany, Korea, Africa, China, Oman, Saudi Arabia, UAE and others. He headed Oman Plant from its inception to commercial production and to it’s profitability stage. The Omanis honor & respect his contribution to their country. Mr Saraogi’s basic ‘mantra’ is his ability to face any challenge fearlessly, and this is the secret of his success. His backbone is his devoted wife Mrs Sujata Saraogi, who has parallely contributed to the cause of Angul Plant and environment. She spearheads the Mahila Samiti, and works shoulder to shoulder with her husband for the greater cause. Both are blessed with 2 sons who are Software Engineers, one is working in USA with Amazon, and the other working with Qualcom in Bangalore.
His rich experience, knowledge and business sense has added value to the organization and won several awards to his credit. He is
member of Health, Safety, CSR and Environment Committee & Risk Management Committee of the Company.
Mr Saraogi’s leadership and style of management is multifaceted. His ability to ‘work hands on’ across all levels of manpower structure deserves admiration. He touches each person on a personal level and gets the desired results. His loyalty, dedication and passion for work & performance has won him accolades from the highest echelons.
Mr. Ram Vinay Shahi is an independent Director on the Board of the Company. He holds a bachelor’s degree in Mechanical Engineering from the National Institute of Technology, Jamshedpur, post-graduation in Industrial Engineering from the National Productivity Council, Chennai, post graduate diploma in Business Management (equivalent to MBA) from Xavier Institute, Ranchi and a diploma in Advanced Industrial Management from Delft, Holland. He is a fellow of the World Academy of Productivity Sciences. He is also a fellow of the Institution of Engineers (India), a fellow of International Institute of Electrical Engineers and a fellow of the Indian National Academy of Engineering.
He has technical, administrative and managerial experience of approximately 47 years. He has served as the Secretary, Ministry of Power, Government of India (GoI), from April 2002 to January 2007, prior to which he was Chairman and Managing Director of BSES Limited from 1994 to 2002. He also worked in various capacities with Hindustan Steel Limited (now Steel Authority of India Limited) for over ten years and NTPC Limited for sixteen years and was Director (Operations) on the Board of NTPC.
During his tenure as the Secretary to GoI, the Indian power sector witnessed major restructuring through the formulation and implementation of legislative and policy initiatives aimed at creating a competitive market structure. These included, among others, the Electricity Act (2003), National Electricity Policy (2005), Electricity Tariff Policy (2006), Accelerated Power Development Reform Programme (2002) and Ultra Mega Power Project Policy (2006).
He is Chairman (Executive) of Energy Infratech Private Limited, an Engineering and Project Development Consulting Company; Chairman, Advisory Board of Indian Energy Exchange; Chairman, Adani Power Advisory Board; Member, Central Advisory Committee of Central Electricity Regulatory Commission and Energy Advisor, South Asia, World Bank.
He has presented many papers at various National and International Conferences and edited a book entitled ‘100 Years of Thermal Power in India’ (2000). He has authored the following books viz. i) Indian Power Sector – Challenge and Response (2005), ii) Towards Powering India : Policy Initiatives and Implementation Strategy (2007), iii)Energy Security and Climate Change (2009) and iv) Light at the End of the Tunnel? Way forward For Power Sector (2013).
He has received several awards which include, among others, the Eminent Engineer Award by the Institution of Engineers, Best Power Man of the Millennium Year 2000 Award by the National Foundation
| 99Statutory Reports Brief Profile of Directors
of Indian Engineers and Power-Telecom Convergence Award 2000 by the Independent Power Producers Association of India and National Power Training Institute. He is a Director on the Board of Energy Infratech Private Limited, Renowab Infratech Private Limited and RV Shahi Advisory Private Limited.
Mr. Arun Kumar Purwar is currently the Chairman of ILFS Renewable Energy Limited, one of the largest renewable energy Company of India. He holds a master’s degree in Commerce and a diploma in Business Administration. He also works as an independent director in leading companies across diverse sectors like Power, Telecom, Steel, Textiles, Engineering Consultancy, Pharma and Financial Services. He also acts as an advisor to Mizuho Securities, Japan. Mr. Purwar was the Chairman of State Bank of India, the largest Bank in the country from November 2002 to May 2006. He held several important and critical positions like Managing Director of State Bank of Patiala, Chief Executive Officer of Tokyo covering almost entire range of commercial banking operations in his long and illustrious career at the Bank. He was also associated in setting up of SBI Life.
Mr. Purwar also worked as Chairman of Indian Bank Association during 2005-2006. Post his retirement from SBI, he was associated with a leading industry house in setting up the first healthcare focused private equity fund, and highly successful NBFC focused on funding real estate projects and educational institutions.
He is regularly invited to various conferences and workshops and other forums to share his views on Banking and Monetary Policy. He is passionate about creation of infrastructure viz. healthcare, education and solar power.
He has received several award which include: CEO of the year Award from The Institute of Technology and Management (2004), ’Outstanding Achiever of the year’ award from Indian Banks’ Association (2004) ‘Finance Man of the Year’ Award by the Bombay Management Association in 2006.
He is a Director on Board of, Reliance Communications Limited, Apollo Tyres Limited, IIFL Holdings Limited, ONGC Tripura Power Company Limited, Alkem Laboratories Limited, Saurya Urja Company of Rajasthan Limited, Energy Infratech Private Limited, Balaji Telefilms Limited and Mizuho Securities India Private Limited. He is Chairman Of Audit Committee of ONGC Triple Power Company, Saurya Urga Company of Rajasthan Limited and Member of Audit Committee of Reliance Communication Limited.
He is also a Chairman of Investment Committee and Risk Management Committee and Member of Audit Committee of the Company.
Mr. Hardip Singh Wirk is an Independent Director on the Board of the Company. He holds a bachelor’s degree in law from Delhi University. He started his career in 1998 as a lawyer with Mr. P. V. Kapur, Sr. Advocate and has handled various cases in Delhi High Court, Company Law Board, Consumer Forum and Supreme Court of India. Thereafter, he joined M/s Trilegal, a Corporate Law firm,
where he specialized in foreign investments, real estate and general corporate advice. In 2005, he started his independent practice specializing in foreign investment and real estate.
He is a Director on Board of Jindal Power Limited (JPL) Etalin Hydro Electric Power Company Limited (EHEPCL) and Kamala Hydro Electric Power Company Limited (KHEPCL) He is a Member of Audit Committee, Nomination and Remuneration Comittee (NRC) and CSR Committee of JPL and Audit Committee and Nomination and Remuneration Committee of EHEPCL & KHEPCL.
He is a member of Nomination and Remuneration Committee, Stakeholders Relationship Committee, Governance and Business Ethics Committee and Health Safety, CSR, Environment Committee and Investment Committee.
Mr. Arun Kumar is an Independent Director on the Board of the Company. He holds a master’s degree in Physics from Delhi University and in Mathematics from Banaras Hindu University. He is an I.A.S. Officer (Retired) of 1965 batch. During his tenure of 39 years in the State / Central Government, he has held various important positions. He was the Chief Secretary to the Government of Chhattisgarh from November 2000 to January 2003. After retirement, he was Chairman, Administrative Reforms Commission Chhattisgarh and Vice Chairman, State Planning Board Chhattisgarh. Earlier, he was President, Board of Revenue (Madhya Pradesh); Textile Commissioner, Govt. of India at Mumbai; Principal Secretary to Govt of M.P., Commerce and Industry/ Energy/ Commercial Taxes/ Higher Education Department. He is the Chairman of Health, Safety CSR and Environment Committee, Nomination and Remuneration Committee and Stakeholders Relationship Committee and a member of Audit Committee and Investment Committee.
Mr. Sudershan Kumar Garg is an Independent Director of the Company and also the Chairman of Governance and Business Ethics Committee, Member of Nomination & Remuneration Committee of the Company. He holds a bachelor’s degree in Commerce from Shri Ram College of Commerce and is a Chartered Accountant by profession since 1973. He has 44 years of varied experience in the field of Oil & Power. He has worked with Indian Oil Corporation Limited for 29 years and has acquired rich experience in Finance, Marketing, Pipelines, Excise & Customs, Oil Pricing etc. He was Executive Director (Finance) in Indian Oil Corporation. He joined the Board of NHPC Limited (A Govt. of India enterprise) as Director (Finance) in 2003. In October 2005, he was appointed Chairman and Managing Director of NHPC and NHDC Limited (a subsidiary of NHPC) and served at these posts for more than five years till his superannuation in December 2010. He was also the Chairman of Loktak Downstream Hydroelectric Corporation Limited. Under his able guidance, NHPC was conferred with ‘Mini Ratna Category – I’ status by GOI.
He was instrumental in commissioning five hydro-electric power projects in India with an aggregate installed capacity of 1,820 MW. Under his leadership, NHPC got several new hydro, thermal and wind power projects. Net profit also increased from ` 510
100 | Jindal Steel & Power Limited Annual Report 2016-17
crores in the year 2002-03 when he joined on the Board of NHPC to ` 2,091 crore during the year 2009-10. As Chairman and Managing Director of NHPC he was involved in business process re-engineering and restructuring, expansion of business, IPO of shares etc. He successfully brought maiden IPO of NHPC, which was oversubscribed by 24 times in 2009 and also introduced enterprise resource planning (ERP) in the company. He was also on the Board of International Hydro Association (IHA).
He was conferred with ‘Lifetime Achievement Award’ by the Institute of Economic Studies in 2010, ‘CA Professional Manager’s Award’ in personal capacity by the Institute of Chartered Accountants of India in 2008, the ‘SRCC Alumni award’ by Shri Ram College of Commerce in 2009 and ‘CEPM – PMA Honorary Fellowship Award’ by the Centre for Excellence in Project Management (CEPM) and Project Management Associates apart from getting several other awards.
He is the Chief Advisor to M/s Astrazure Private Limited dealing in training and human resource solutions. Institute of Directors have conferred ‘Golden Peacock National Training Award’ to M/s Astrazure Private Limited at Dubai. He has widely travelled both within India as well as abroad and gained rich experience in oil and power sectors.
He holds the position of senior partner in M/s Apra and Associates, Chartered Accountants Firm. In Jindal Power Limited he is Director in the Board and Chairman of Audit Committee and Corporate Social Responsibility Committee. He also holds directorship in many companies i.e Etalin Hydro Electric Power Company Limited and Kamala Hydro Electric Power Company Limited as well as Chairman of Audit Committee and Nomination & Remuneration Committee of these companies.
Mr. Anjan Barua has been nominated as Nominee Director by State Bank of India. In State Bank of India he had held various assignments the last being Deputy Managing Director in charge of Global Markets. He was a Public Interest Director nominated by SEBI on the Board of National Securities Clearing Corporation Ltd. Prior to this he held Directorship of National Stock Exchange, Central Depository Services Ltd and The Clearing Corporation of India Ltd. He was also a Member of the Committee appointed by SEBI for suggesting reforms in the Corporate Debt Market. He has 40 years experience in Banking in India and abroad.
Mr. Kuldip Chander Sood is an Independent Director on the Board of the Company. He holds a bachelor’s degree in Mechanical Engineering from Birla Institute of Technology, Mesra, Ranchi having passed in the first class with distinction. He also holds a post graduate diploma in Mechanical, Electrical & Metallurgical Engineering aspects of Steel making awarded by Jamshedpur Technical Institute. He has also a post graduate diploma in Business Management from Xaviers Labour Relations Institute (XLRI), Jamshedpur (equivalent to MBA). He has technical, administrative and managerial experience of approximately 45 years. He has served for about 17 years in
various senior positions at TATA STEEL and has been involved in major expansion and modernization projects implemented by TATA Steel at Jamshedpur, Colliery expansion at Jamadoba & West Bokaro, Ipitata (now TATA SPONGE) etc, .He had the privilege of working under the leadership and guidance of Industrial Doyens like Mr. JRD Tata, Mr. Ratan Tata and Mr. Russy Modi.
Apart from his long association with Tata Steel, he has to his credit, the successful handling of many prestigious projects of Bihar Sponge Iron Ltd at Chandil, in collaboration with Lurgi, Germany, as Executive Director in Prakash Industries, he was involved in establishing -2 Nos. 500 TPD DR Plant with co-generation Power, Steel Melt Shop and Rolling Mill. While the 1st DR Plant was executed in collaboration with M/s Lurgi, the second DR Plant was totally engineered with modifications by him. He played a major role in successful development of Waste Heat Recovery Boiler (WHRB) to utilize the sensible heat in the waste gases generated during DRI making process to produce power. This combination of a DRI Kiln along with Waste Heat Recovery Boiler forms the backbone in the viability of a Sponge Iron plant under the present day scenario. He had also been advisor to JSPL between 1997 to 2002.
The synergy derived from these giant steel conglomerates, led him to have a ‘Vision’. That Vision was, to help and guide the entrepreneurs to set up steel and co-generation power plants with cost effective means. Through his leadership & guidance, he has been instrumental in helping numerous entrepreneurs to establish Sponge Iron Plants with Captive Power Plant and Steel Melt Shops including Rolling Mills in various parts of the Country and overseas. He was actively involved in setting up IST Steel and Power (now acquired by JSW),Usha Martin, Tata Sponge, SMC Power Generation, Viraj Steel & Energy, Eastern Steel & Power, Scaw industries,Trimula Industries etc. to name a few between 2003 till date.
For his outstanding performance in the field of Industrial Development in the country, he was honored with UDYOG RATTAN AWARD by Institute of Economic Studies, New Delhi and was also awarded with GEM of INDIA AWARD at all India Achievers’ Conference, New Delhi.
Dr. Amar Singh has degrees in Medicine and Economics. Mr. Singh served in the Indian Administrative Service (IAS) from 1981 to 2013.
He has worked at various levels of Government and has experience spanning multiple sectors.
As Chairman and Managing Director, Food Corporation of India, he headed an all India organisation with over 2 lakh employees and an annual budget of ` 70,000 crore. He played a key role in national level PPP initiatives across different sectors during his stint in the Government of India, besides having worked at senior positions for over 20 years in the Government of Madhya Pradesh.
Since retiring from the IAS in 2013 he has been actively involved in social work in Delhi and Punjab.
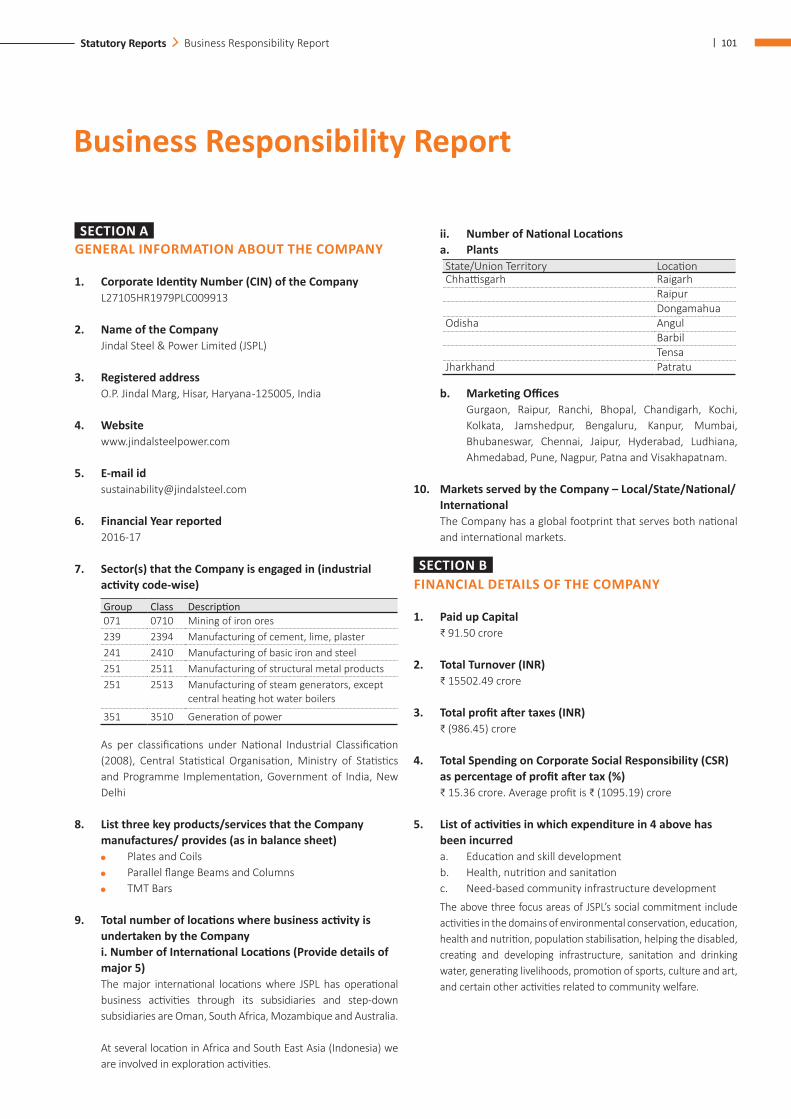
| 101Statutory Reports Business Responsibility Report
Business Responsibility Report
SECTION AGENERAL INFORMATION ABOUT THE COMPANY
1. Corporate Identity Number (CIN) of the Company L27105HR1979PLC009913
2. Name of the Company Jindal Steel & Power Limited (JSPL)
3. Registered address O.P. Jindal Marg, Hisar, Haryana -125005, India
4. Website www.jindalsteelpower.com
5. E-mail id [email protected]
6. Financial Year reported 2016-17
7. Sector(s) that the Company is engaged in (industrial activity code-wise)
Group Class Description071 0710 Mining of iron ores239 2394 Manufacturing of cement, lime, plaster241 2410 Manufacturing of basic iron and steel 251 2511 Manufacturing of structural metal products251 2513 Manufacturing of steam generators, except
central heating hot water boilers
351 3510 Generation of power
As per classifications under National Industrial Classification (2008), Central Statistical Organisation, Ministry of Statistics and Programme Implementation, Government of India, New Delhi
8. List three key products/services that the Company manufactures/ provides (as in balance sheet)
Plates and Coils Parallel flange Beams and Columns TMT Bars
9. Total number of locations where business activity is undertaken by the Company
i. Number of International Locations (Provide details of major 5)
The major international locations where JSPL has operational business activities through its subsidiaries and step-down subsidiaries are Oman, South Africa, Mozambique and Australia.
At several location in Africa and South East Asia (Indonesia) we are involved in exploration activities.
ii. Number of National Locations a. Plants
State/Union Territory LocationChhattisgarh Raigarh
RaipurDongamahua
Odisha AngulBarbilTensa
Jharkhand Patratu
b. Marketing Offices Gurgaon, Raipur, Ranchi, Bhopal, Chandigarh, Kochi,
Kolkata, Jamshedpur, Bengaluru, Kanpur, Mumbai, Bhubaneswar, Chennai, Jaipur, Hyderabad, Ludhiana, Ahmedabad, Pune, Nagpur, Patna and Visakhapatnam.
10. Markets served by the Company – Local/State/National/International
The Company has a global footprint that serves both national and international markets.
SECTION B FINANCIAL DETAILS OF THE COMPANY
1. Paid up Capital ₹ 91.50 crore
2. Total Turnover (INR) ₹ 15502.49 crore
3. Total profit after taxes (INR) ₹ (986.45) crore
4. Total Spending on Corporate Social Responsibility (CSR) as percentage of profit after tax (%)
₹ 15.36 crore. Average profit is ₹ (1095.19) crore
5. List of activities in which expenditure in 4 above has been incurred
a. Education and skill development b. Health, nutrition and sanitation c. Need-based community infrastructure development
The above three focus areas of JSPL’s social commitment include activities in the domains of environmental conservation, education, health and nutrition, population stabilisation, helping the disabled, creating and developing infrastructure, sanitation and drinking water, generating livelihoods, promotion of sports, culture and art, and certain other activities related to community welfare.
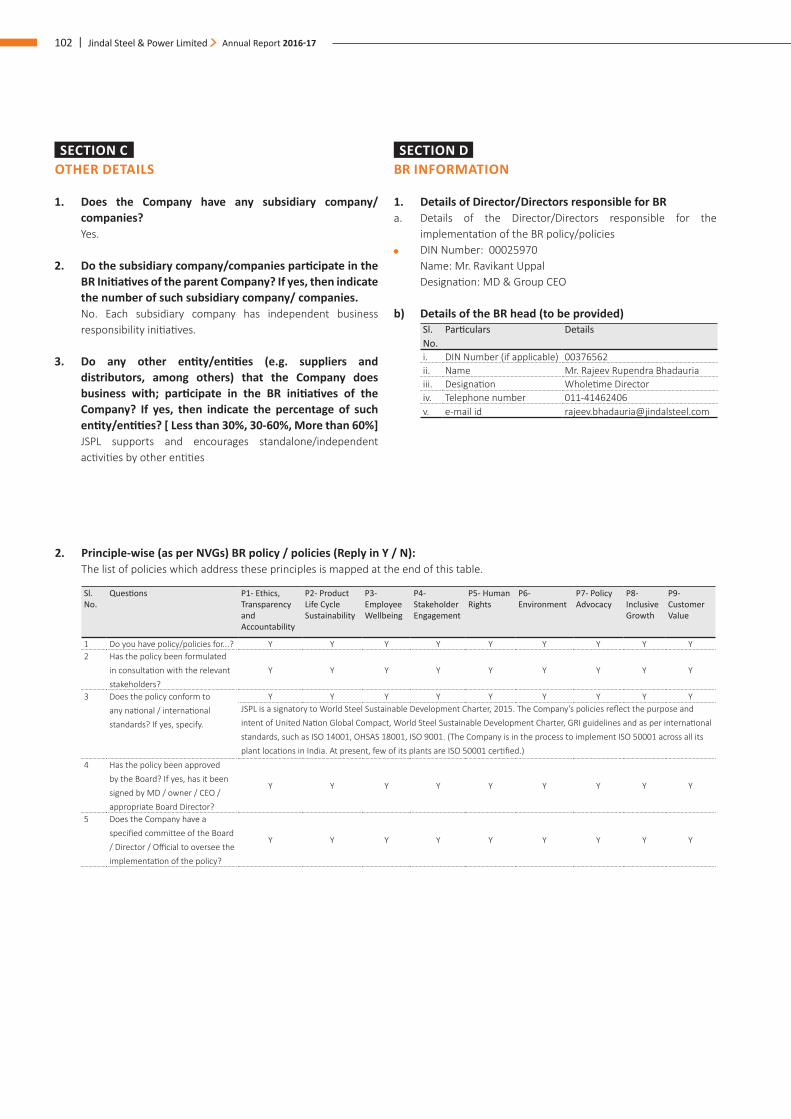
102 | Jindal Steel & Power Limited Annual Report 2016-17
SECTION C OTHER DETAILS
1. Does the Company have any subsidiary company/ companies?
Yes.
2. Do the subsidiary company/companies participate in the BR Initiatives of the parent Company? If yes, then indicate the number of such subsidiary company/ companies.
No. Each subsidiary company has independent business responsibility initiatives.
3. Do any other entity/entities (e.g. suppliers and distributors, among others) that the Company does business with; participate in the BR initiatives of the Company? If yes, then indicate the percentage of such entity/entities? [ Less than 30%, 30-60%, More than 60%]
JSPL supports and encourages standalone/independent activities by other entities
SECTION D BR INFORMATION
1. Details of Director/Directors responsible for BR a. Details of the Director/Directors responsible for the
implementation of the BR policy/policies DIN Number: 00025970
Name: Mr. Ravikant Uppal Designation: MD & Group CEO
b) Details of the BR head (to be provided)Sl. No.
Particulars Details
i. DIN Number (if applicable) 00376562ii. Name Mr. Rajeev Rupendra Bhadauriaiii. Designation Wholetime Directoriv. Telephone number 011-41462406v. e-mail id [email protected]
2. Principle-wise (as per NVGs) BR policy / policies (Reply in Y / N): The list of policies which address these principles is mapped at the end of this table.
Sl. No.
Questions P1- Ethics, Transparency and Accountability
P2- Product Life Cycle Sustainability
P3- Employee Wellbeing
P4- Stakeholder Engagement
P5- Human Rights
P6- Environment
P7- Policy Advocacy
P8- Inclusive Growth
P9- Customer Value
1 Do you have policy/policies for...? Y Y Y Y Y Y Y Y Y2 Has the policy been formulated
in consultation with the relevant stakeholders?
Y Y Y Y Y Y Y Y Y
3 Does the policy conform to any national / international standards? If yes, specify.
Y Y Y Y Y Y Y Y YJSPL is a signatory to World Steel Sustainable Development Charter, 2015. The Company’s policies reflect the purpose and intent of United Nation Global Compact, World Steel Sustainable Development Charter, GRI guidelines and as per international standards, such as ISO 14001, OHSAS 18001, ISO 9001. (The Company is in the process to implement ISO 50001 across all its plant locations in India. At present, few of its plants are ISO 50001 certified.)
4 Has the policy been approved by the Board? If yes, has it been signed by MD / owner / CEO / appropriate Board Director?
Y Y Y Y Y Y Y Y Y
5 Does the Company have a specified committee of the Board / Director / Official to oversee the implementation of the policy?
Y Y Y Y Y Y Y Y Y
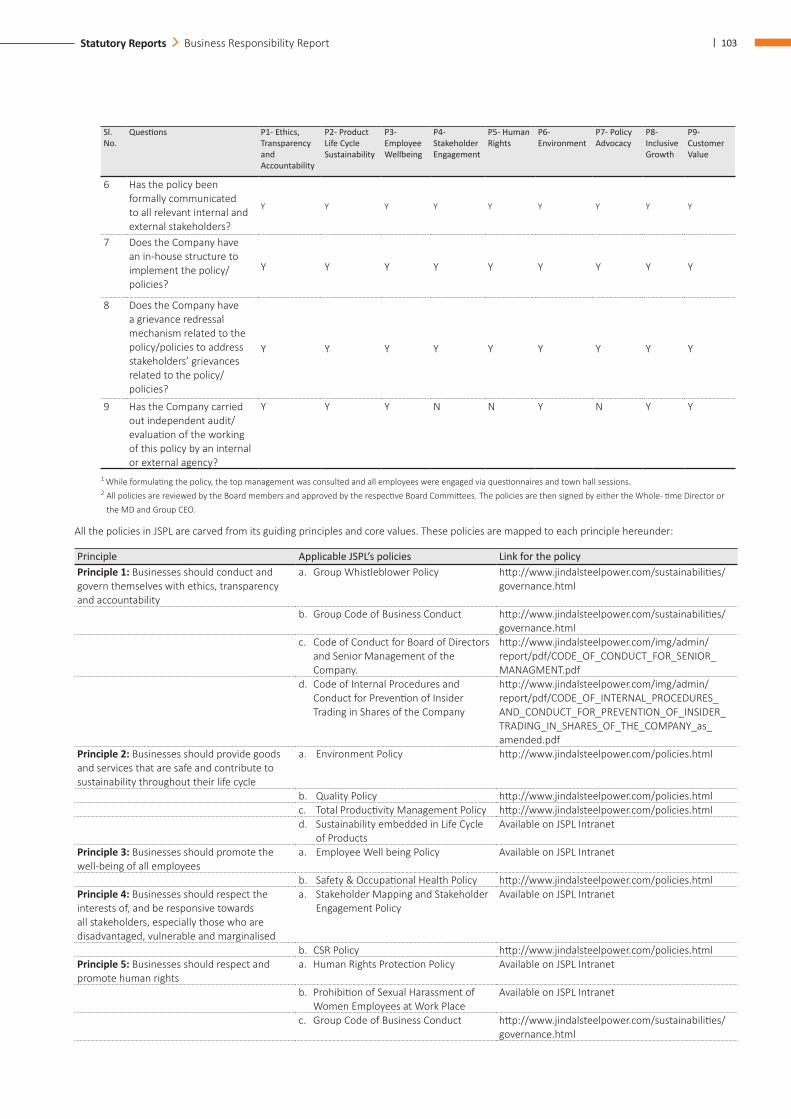
| 103Statutory Reports Business Responsibility Report
Sl. No.
Questions P1- Ethics, Transparency and Accountability
P2- Product Life Cycle Sustainability
P3- Employee Wellbeing
P4- Stakeholder Engagement
P5- Human Rights
P6- Environment
P7- Policy Advocacy
P8- Inclusive Growth
P9- Customer Value
6 Has the policy been formally communicated to all relevant internal and external stakeholders?
Y Y Y Y Y Y Y Y Y
7 Does the Company have an in-house structure to implement the policy/policies?
Y Y Y Y Y Y Y Y Y
8 Does the Company have a grievance redressal mechanism related to the policy/policies to address stakeholders’ grievances related to the policy/policies?
Y Y Y Y Y Y Y Y Y
9 Has the Company carried out independent audit/evaluation of the working of this policy by an internal or external agency?
Y Y Y N N Y N Y Y
1 While formulating the policy, the top management was consulted and all employees were engaged via questionnaires and town hall sessions.2 All policies are reviewed by the Board members and approved by the respective Board Committees. The policies are then signed by either the Whole- time Director or
the MD and Group CEO.
All the policies in JSPL are carved from its guiding principles and core values. These policies are mapped to each principle hereunder:
Principle Applicable JSPL’s policies Link for the policyPrinciple 1: Businesses should conduct and govern themselves with ethics, transparency and accountability
a. Group Whistleblower Policy http://www.jindalsteelpower.com/sustainabilities/governance.html
b. Group Code of Business Conduct http://www.jindalsteelpower.com/sustainabilities/governance.html
c. Code of Conduct for Board of Directors and Senior Management of the Company.
http://www.jindalsteelpower.com/img/admin/report/pdf/CODE_OF_CONDUCT_FOR_SENIOR_MANAGMENT.pdf
d. Code of Internal Procedures and Conduct for Prevention of Insider Trading in Shares of the Company
http://www.jindalsteelpower.com/img/admin/report/pdf/CODE_OF_INTERNAL_PROCEDURES_AND_CONDUCT_FOR_PREVENTION_OF_INSIDER_TRADING_IN_SHARES_OF_THE_COMPANY_as_amended.pdf
Principle 2: Businesses should provide goods and services that are safe and contribute to sustainability throughout their life cycle
a. Environment Policy http://www.jindalsteelpower.com/policies.html
b. Quality Policy http://www.jindalsteelpower.com/policies.htmlc. Total Productivity Management Policy http://www.jindalsteelpower.com/policies.htmld. Sustainability embedded in Life Cycle
of ProductsAvailable on JSPL Intranet
Principle 3: Businesses should promote the well-being of all employees
a. Employee Well being Policy Available on JSPL Intranet
b. Safety & Occupational Health Policy http://www.jindalsteelpower.com/policies.htmlPrinciple 4: Businesses should respect the interests of, and be responsive towards all stakeholders, especially those who are disadvantaged, vulnerable and marginalised
a. Stakeholder Mapping and Stakeholder Engagement Policy
Available on JSPL Intranet
b. CSR Policy http://www.jindalsteelpower.com/policies.htmlPrinciple 5: Businesses should respect and promote human rights
a. Human Rights Protection Policy Available on JSPL Intranet
b. Prohibition of Sexual Harassment of Women Employees at Work Place
Available on JSPL Intranet
c. Group Code of Business Conduct http://www.jindalsteelpower.com/sustainabilities/governance.html
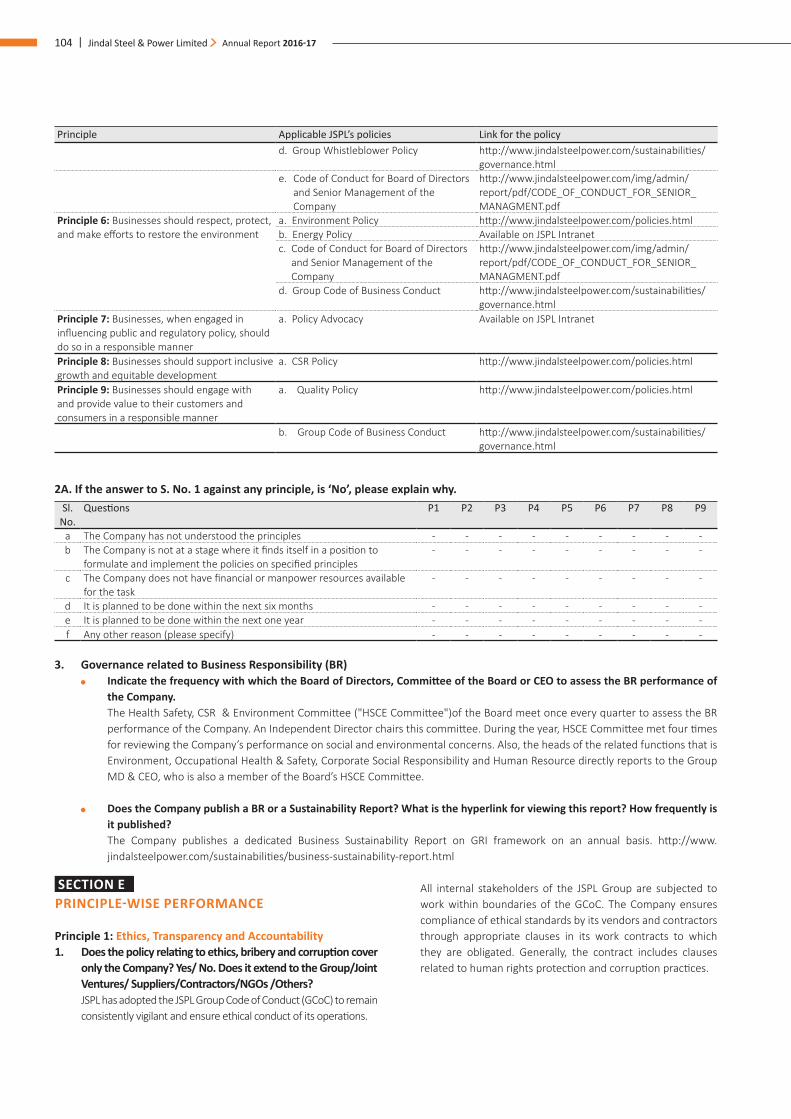
104 | Jindal Steel & Power Limited Annual Report 2016-17
Principle Applicable JSPL’s policies Link for the policyd. Group Whistleblower Policy http://www.jindalsteelpower.com/sustainabilities/
governance.htmle. Code of Conduct for Board of Directors
and Senior Management of the Company
http://www.jindalsteelpower.com/img/admin/report/pdf/CODE_OF_CONDUCT_FOR_SENIOR_MANAGMENT.pdf
Principle 6: Businesses should respect, protect, and make efforts to restore the environment
a. Environment Policy http://www.jindalsteelpower.com/policies.htmlb. Energy Policy Available on JSPL Intranetc. Code of Conduct for Board of Directors
and Senior Management of the Company
http://www.jindalsteelpower.com/img/admin/report/pdf/CODE_OF_CONDUCT_FOR_SENIOR_MANAGMENT.pdf
d. Group Code of Business Conduct http://www.jindalsteelpower.com/sustainabilities/governance.html
Principle 7: Businesses, when engaged in influencing public and regulatory policy, should do so in a responsible manner
a. Policy Advocacy Available on JSPL Intranet
Principle 8: Businesses should support inclusive growth and equitable development
a. CSR Policy http://www.jindalsteelpower.com/policies.html
Principle 9: Businesses should engage with and provide value to their customers and consumers in a responsible manner
a. Quality Policy http://www.jindalsteelpower.com/policies.html
b. Group Code of Business Conduct http://www.jindalsteelpower.com/sustainabilities/governance.html
2A. If the answer to S. No. 1 against any principle, is ‘No’, please explain why.Sl.
No.Questions P1 P2 P3 P4 P5 P6 P7 P8 P9
a The Company has not understood the principles - - - - - - - - -b The Company is not at a stage where it finds itself in a position to
formulate and implement the policies on specified principles- - - - - - - - -
c The Company does not have financial or manpower resources available for the task
- - - - - - - - -
d It is planned to be done within the next six months - - - - - - - - -e It is planned to be done within the next one year - - - - - - - - -f Any other reason (please specify) - - - - - - - - -
3. Governance related to Business Responsibility (BR) Indicate the frequency with which the Board of Directors, Committee of the Board or CEO to assess the BR performance of
the Company. The Health Safety, CSR & Environment Committee ("HSCE Committee")of the Board meet once every quarter to assess the BR
performance of the Company. An Independent Director chairs this committee. During the year, HSCE Committee met four times for reviewing the Company’s performance on social and environmental concerns. Also, the heads of the related functions that is Environment, Occupational Health & Safety, Corporate Social Responsibility and Human Resource directly reports to the Group MD & CEO, who is also a member of the Board’s HSCE Committee.
Does the Company publish a BR or a Sustainability Report? What is the hyperlink for viewing this report? How frequently is it published?
The Company publishes a dedicated Business Sustainability Report on GRI framework on an annual basis. http://www.jindalsteelpower.com/sustainabilities/business-sustainability-report.html
SECTION EPRINCIPLE-WISE PERFORMANCE
Principle 1: Ethics, Transparency and Accountability1. Does the policy relating to ethics, bribery and corruption cover
only the Company? Yes/ No. Does it extend to the Group/Joint Ventures/ Suppliers/Contractors/NGOs /Others?
JSPL has adopted the JSPL Group Code of Conduct (GCoC) to remain consistently vigilant and ensure ethical conduct of its operations.
All internal stakeholders of the JSPL Group are subjected to work within boundaries of the GCoC. The Company ensures compliance of ethical standards by its vendors and contractors through appropriate clauses in its work contracts to which they are obligated. Generally, the contract includes clauses related to human rights protection and corruption practices.
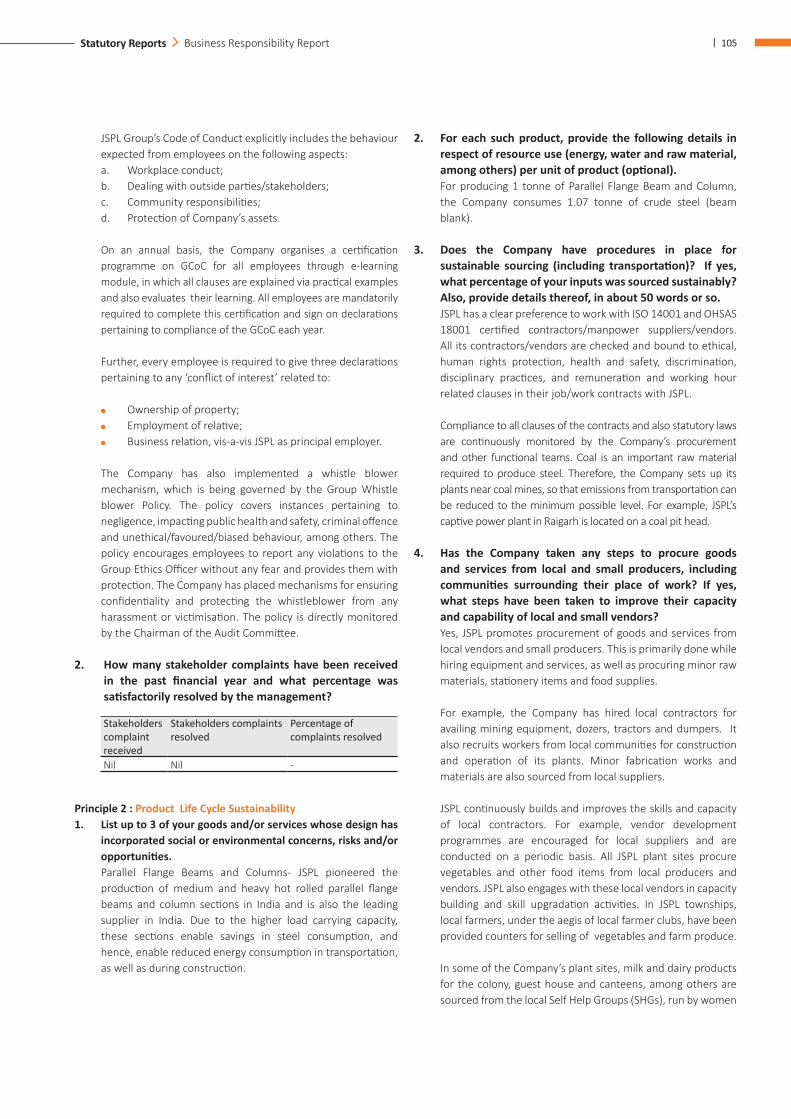
| 105Statutory Reports Business Responsibility Report
JSPL Group’s Code of Conduct explicitly includes the behaviour expected from employees on the following aspects:
a. Workplace conduct; b. Dealing with outside parties/stakeholders; c. Community responsibilities; d. Protection of Company’s assets.
On an annual basis, the Company organises a certification programme on GCoC for all employees through e-learning module, in which all clauses are explained via practical examples and also evaluates their learning. All employees are mandatorily required to complete this certification and sign on declarations pertaining to compliance of the GCoC each year.
Further, every employee is required to give three declarations pertaining to any ‘conflict of interest’ related to:
Ownership of property; Employment of relative; Business relation, vis-a-vis JSPL as principal employer.
The Company has also implemented a whistle blower mechanism, which is being governed by the Group Whistle blower Policy. The policy covers instances pertaining to negligence, impacting public health and safety, criminal offence and unethical/favoured/biased behaviour, among others. The policy encourages employees to report any violations to the Group Ethics Officer without any fear and provides them with protection. The Company has placed mechanisms for ensuring confidentiality and protecting the whistleblower from any harassment or victimisation. The policy is directly monitored by the Chairman of the Audit Committee.
2. How many stakeholder complaints have been received in the past financial year and what percentage was satisfactorily resolved by the management?
Stakeholders complaint received
Stakeholders complaints resolved
Percentage of complaints resolved
Nil Nil -
Principle 2 : Product Life Cycle Sustainability 1. List up to 3 of your goods and/or services whose design has
incorporated social or environmental concerns, risks and/or opportunities.
Parallel Flange Beams and Columns- JSPL pioneered the production of medium and heavy hot rolled parallel flange beams and column sections in India and is also the leading supplier in India. Due to the higher load carrying capacity, these sections enable savings in steel consumption, and hence, enable reduced energy consumption in transportation, as well as during construction.
2. For each such product, provide the following details in respect of resource use (energy, water and raw material, among others) per unit of product (optional).
For producing 1 tonne of Parallel Flange Beam and Column, the Company consumes 1.07 tonne of crude steel (beam blank).
3. Does the Company have procedures in place for sustainable sourcing (including transportation)? If yes, what percentage of your inputs was sourced sustainably? Also, provide details thereof, in about 50 words or so.
JSPL has a clear preference to work with ISO 14001 and OHSAS 18001 certified contractors/manpower suppliers/vendors. All its contractors/vendors are checked and bound to ethical, human rights protection, health and safety, discrimination, disciplinary practices, and remuneration and working hour related clauses in their job/work contracts with JSPL.
Compliance to all clauses of the contracts and also statutory laws are continuously monitored by the Company’s procurement and other functional teams. Coal is an important raw material required to produce steel. Therefore, the Company sets up its plants near coal mines, so that emissions from transportation can be reduced to the minimum possible level. For example, JSPL’s captive power plant in Raigarh is located on a coal pit head.
4. Has the Company taken any steps to procure goods and services from local and small producers, including communities surrounding their place of work? If yes, what steps have been taken to improve their capacity and capability of local and small vendors?
Yes, JSPL promotes procurement of goods and services from local vendors and small producers. This is primarily done while hiring equipment and services, as well as procuring minor raw materials, stationery items and food supplies.
For example, the Company has hired local contractors for availing mining equipment, dozers, tractors and dumpers. It also recruits workers from local communities for construction and operation of its plants. Minor fabrication works and materials are also sourced from local suppliers.
JSPL continuously builds and improves the skills and capacity of local contractors. For example, vendor development programmes are encouraged for local suppliers and are conducted on a periodic basis. All JSPL plant sites procure vegetables and other food items from local producers and vendors. JSPL also engages with these local vendors in capacity building and skill upgradation activities. In JSPL townships, local farmers, under the aegis of local farmer clubs, have been provided counters for selling of vegetables and farm produce.
In some of the Company’s plant sites, milk and dairy products for the colony, guest house and canteens, among others are sourced from the local Self Help Groups (SHGs), run by women
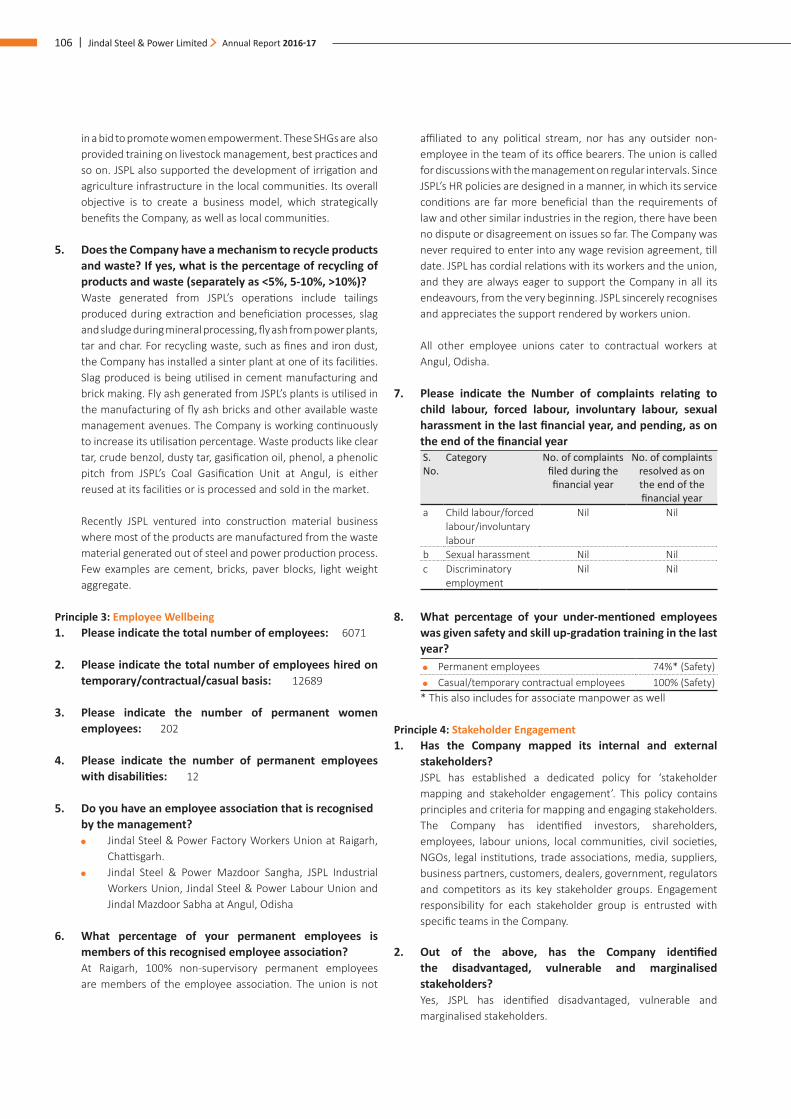
106 | Jindal Steel & Power Limited Annual Report 2016-17
in a bid to promote women empowerment. These SHGs are also provided training on livestock management, best practices and so on. JSPL also supported the development of irrigation and agriculture infrastructure in the local communities. Its overall objective is to create a business model, which strategically benefits the Company, as well as local communities.
5. Does the Company have a mechanism to recycle products and waste? If yes, what is the percentage of recycling of products and waste (separately as <5%, 5-10%, >10%)?
Waste generated from JSPL’s operations include tailings produced during extraction and beneficiation processes, slag and sludge during mineral processing, fly ash from power plants, tar and char. For recycling waste, such as fines and iron dust, the Company has installed a sinter plant at one of its facilities. Slag produced is being utilised in cement manufacturing and brick making. Fly ash generated from JSPL’s plants is utilised in the manufacturing of fly ash bricks and other available waste management avenues. The Company is working continuously to increase its utilisation percentage. Waste products like clear tar, crude benzol, dusty tar, gasification oil, phenol, a phenolic pitch from JSPL’s Coal Gasification Unit at Angul, is either reused at its facilities or is processed and sold in the market.
Recently JSPL ventured into construction material business where most of the products are manufactured from the waste material generated out of steel and power production process. Few examples are cement, bricks, paver blocks, light weight aggregate.
Principle 3: Employee Wellbeing 1. Please indicate the total number of employees: 6071
2. Please indicate the total number of employees hired on temporary/contractual/casual basis: 12689
3. Please indicate the number of permanent women employees: 202
4. Please indicate the number of permanent employees with disabilities: 12
5. Do you have an employee association that is recognised by the management?
Jindal Steel & Power Factory Workers Union at Raigarh, Chattisgarh.
Jindal Steel & Power Mazdoor Sangha, JSPL Industrial Workers Union, Jindal Steel & Power Labour Union and Jindal Mazdoor Sabha at Angul, Odisha
6. What percentage of your permanent employees is members of this recognised employee association?
At Raigarh, 100% non-supervisory permanent employees are members of the employee association. The union is not
affiliated to any political stream, nor has any outsider non-employee in the team of its office bearers. The union is called for discussions with the management on regular intervals. Since JSPL’s HR policies are designed in a manner, in which its service conditions are far more beneficial than the requirements of law and other similar industries in the region, there have been no dispute or disagreement on issues so far. The Company was never required to enter into any wage revision agreement, till date. JSPL has cordial relations with its workers and the union, and they are always eager to support the Company in all its endeavours, from the very beginning. JSPL sincerely recognises and appreciates the support rendered by workers union.
All other employee unions cater to contractual workers at Angul, Odisha.
7. Please indicate the Number of complaints relating to child labour, forced labour, involuntary labour, sexual harassment in the last financial year, and pending, as on the end of the financial yearS. No.
Category No. of complaints filed during the financial year
No. of complaints resolved as on the end of the financial year
a Child labour/forced labour/involuntary labour
Nil Nil
b Sexual harassment Nil Nilc Discriminatory
employment Nil Nil
8. What percentage of your under-mentioned employees was given safety and skill up-gradation training in the last year?
Permanent employees 74%* (Safety) Casual/temporary contractual employees 100% (Safety)
* This also includes for associate manpower as well
Principle 4: Stakeholder Engagement1. Has the Company mapped its internal and external
stakeholders? JSPL has established a dedicated policy for ‘stakeholder
mapping and stakeholder engagement’. This policy contains principles and criteria for mapping and engaging stakeholders. The Company has identified investors, shareholders, employees, labour unions, local communities, civil societies, NGOs, legal institutions, trade associations, media, suppliers, business partners, customers, dealers, government, regulators and competitors as its key stakeholder groups. Engagement responsibility for each stakeholder group is entrusted with specific teams in the Company.
2. Out of the above, has the Company identified the disadvantaged, vulnerable and marginalised stakeholders?
Yes, JSPL has identified disadvantaged, vulnerable and marginalised stakeholders.
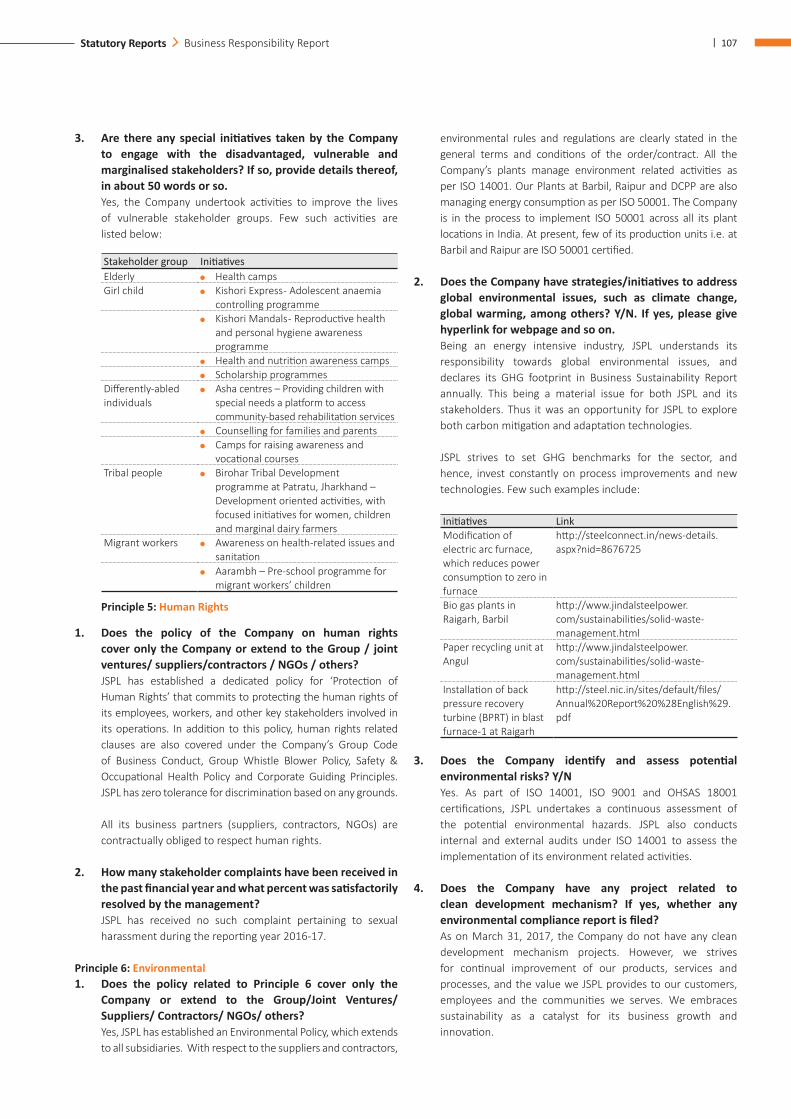
| 107Statutory Reports Business Responsibility Report
3. Are there any special initiatives taken by the Company to engage with the disadvantaged, vulnerable and marginalised stakeholders? If so, provide details thereof, in about 50 words or so.
Yes, the Company undertook activities to improve the lives of vulnerable stakeholder groups. Few such activities are listed below:
Stakeholder group InitiativesElderly Health campsGirl child Kishori Express - Adolescent anaemia
controlling programme Kishori Mandals - Reproductive health
and personal hygiene awareness programme
Health and nutrition awareness camps Scholarship programmes
Differently-abled individuals
Asha centres – Providing children with special needs a platform to access community-based rehabilitation services
Counselling for families and parents Camps for raising awareness and
vocational coursesTribal people Birohar Tribal Development
programme at Patratu, Jharkhand – Development oriented activities, with focused initiatives for women, children and marginal dairy farmers
Migrant workers Awareness on health-related issues and sanitation
Aarambh – Pre-school programme for migrant workers’ children
Principle 5: Human Rights
1. Does the policy of the Company on human rights cover only the Company or extend to the Group / joint ventures/ suppliers/contractors / NGOs / others?
JSPL has established a dedicated policy for ‘Protection of Human Rights’ that commits to protecting the human rights of its employees, workers, and other key stakeholders involved in its operations. In addition to this policy, human rights related clauses are also covered under the Company’s Group Code of Business Conduct, Group Whistle Blower Policy, Safety & Occupational Health Policy and Corporate Guiding Principles. JSPL has zero tolerance for discrimination based on any grounds.
All its business partners (suppliers, contractors, NGOs) are contractually obliged to respect human rights.
2. How many stakeholder complaints have been received in the past financial year and what percent was satisfactorily resolved by the management?
JSPL has received no such complaint pertaining to sexual harassment during the reporting year 2016-17.
Principle 6: Environmental 1. Does the policy related to Principle 6 cover only the
Company or extend to the Group/Joint Ventures/ Suppliers/ Contractors/ NGOs/ others?
Yes, JSPL has established an Environmental Policy, which extends to all subsidiaries. With respect to the suppliers and contractors,
environmental rules and regulations are clearly stated in the general terms and conditions of the order/contract. All the Company’s plants manage environment related activities as per ISO 14001. Our Plants at Barbil, Raipur and DCPP are also managing energy consumption as per ISO 50001. The Company is in the process to implement ISO 50001 across all its plant locations in India. At present, few of its production units i.e. at Barbil and Raipur are ISO 50001 certified.
2. Does the Company have strategies/initiatives to address global environmental issues, such as climate change, global warming, among others? Y/N. If yes, please give hyperlink for webpage and so on.
Being an energy intensive industry, JSPL understands its responsibility towards global environmental issues, and declares its GHG footprint in Business Sustainability Report annually. This being a material issue for both JSPL and its stakeholders. Thus it was an opportunity for JSPL to explore both carbon mitigation and adaptation technologies.
JSPL strives to set GHG benchmarks for the sector, and hence, invest constantly on process improvements and new technologies. Few such examples include:
Initiatives LinkModification of electric arc furnace, which reduces power consumption to zero in furnace
http://steelconnect.in/news-details.aspx?nid=8676725
Bio gas plants in Raigarh, Barbil
http://www.jindalsteelpower.com/sustainabilities/solid-waste-management.html
Paper recycling unit at Angul
http://www.jindalsteelpower.com/sustainabilities/solid-waste-management.html
Installation of back pressure recovery turbine (BPRT) in blast furnace-1 at Raigarh
http://steel.nic.in/sites/default/files/Annual%20Report%20%28English%29.pdf
3. Does the Company identify and assess potential environmental risks? Y/N
Yes. As part of ISO 14001, ISO 9001 and OHSAS 18001 certifications, JSPL undertakes a continuous assessment of the potential environmental hazards. JSPL also conducts internal and external audits under ISO 14001 to assess the implementation of its environment related activities.
4. Does the Company have any project related to clean development mechanism? If yes, whether any environmental compliance report is filed?
As on March 31, 2017, the Company do not have any clean development mechanism projects. However, we strives for continual improvement of our products, services and processes, and the value we JSPL provides to our customers, employees and the communities we serves. We embraces sustainability as a catalyst for its business growth and innovation.
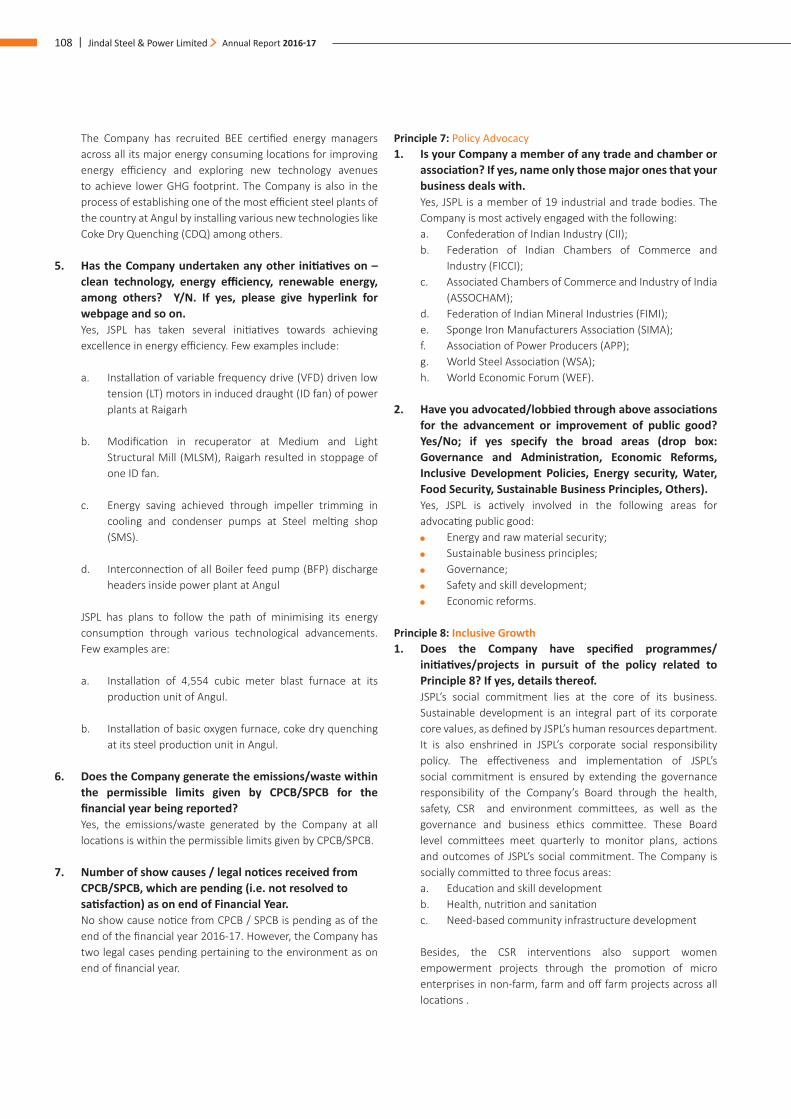
108 | Jindal Steel & Power Limited Annual Report 2016-17
The Company has recruited BEE certified energy managers across all its major energy consuming locations for improving energy efficiency and exploring new technology avenues to achieve lower GHG footprint. The Company is also in the process of establishing one of the most efficient steel plants of the country at Angul by installing various new technologies like Coke Dry Quenching (CDQ) among others.
5. Has the Company undertaken any other initiatives on – clean technology, energy efficiency, renewable energy, among others? Y/N. If yes, please give hyperlink for webpage and so on.
Yes, JSPL has taken several initiatives towards achieving excellence in energy efficiency. Few examples include:
a. Installation of variable frequency drive (VFD) driven low tension (LT) motors in induced draught (ID fan) of power plants at Raigarh
b. Modification in recuperator at Medium and Light Structural Mill (MLSM), Raigarh resulted in stoppage of one ID fan.
c. Energy saving achieved through impeller trimming in cooling and condenser pumps at Steel melting shop (SMS).
d. Interconnection of all Boiler feed pump (BFP) discharge headers inside power plant at Angul
JSPL has plans to follow the path of minimising its energy consumption through various technological advancements. Few examples are:
a. Installation of 4,554 cubic meter blast furnace at its production unit of Angul.
b. Installation of basic oxygen furnace, coke dry quenching at its steel production unit in Angul.
6. Does the Company generate the emissions/waste within the permissible limits given by CPCB/SPCB for the financial year being reported?
Yes, the emissions/waste generated by the Company at all locations is within the permissible limits given by CPCB/SPCB.
7. Number of show causes / legal notices received from CPCB/SPCB, which are pending (i.e. not resolved to satisfaction) as on end of Financial Year.
No show cause notice from CPCB / SPCB is pending as of the end of the financial year 2016-17. However, the Company has two legal cases pending pertaining to the environment as on end of financial year.
Principle 7: Policy Advocacy1. Is your Company a member of any trade and chamber or
association? If yes, name only those major ones that your business deals with.
Yes, JSPL is a member of 19 industrial and trade bodies. The Company is most actively engaged with the following:
a. Confederation of Indian Industry (CII); b. Federation of Indian Chambers of Commerce and
Industry (FICCI); c. Associated Chambers of Commerce and Industry of India
(ASSOCHAM); d. Federation of Indian Mineral Industries (FIMI); e. Sponge Iron Manufacturers Association (SIMA); f. Association of Power Producers (APP); g. World Steel Association (WSA); h. World Economic Forum (WEF).
2. Have you advocated/lobbied through above associations for the advancement or improvement of public good? Yes/No; if yes specify the broad areas (drop box: Governance and Administration, Economic Reforms, Inclusive Development Policies, Energy security, Water, Food Security, Sustainable Business Principles, Others).
Yes, JSPL is actively involved in the following areas for advocating public good:
Energy and raw material security; Sustainable business principles; Governance; Safety and skill development; Economic reforms.
Principle 8: Inclusive Growth 1. Does the Company have specified programmes/
initiatives/projects in pursuit of the policy related to Principle 8? If yes, details thereof.
JSPL’s social commitment lies at the core of its business. Sustainable development is an integral part of its corporate core values, as defined by JSPL’s human resources department. It is also enshrined in JSPL’s corporate social responsibility policy. The effectiveness and implementation of JSPL’s social commitment is ensured by extending the governance responsibility of the Company’s Board through the health, safety, CSR and environment committees, as well as the governance and business ethics committee. These Board level committees meet quarterly to monitor plans, actions and outcomes of JSPL’s social commitment. The Company is socially committed to three focus areas:
a. Education and skill development b. Health, nutrition and sanitation c. Need-based community infrastructure development
Besides, the CSR interventions also support women empowerment projects through the promotion of micro enterprises in non-farm, farm and off farm projects across all locations .
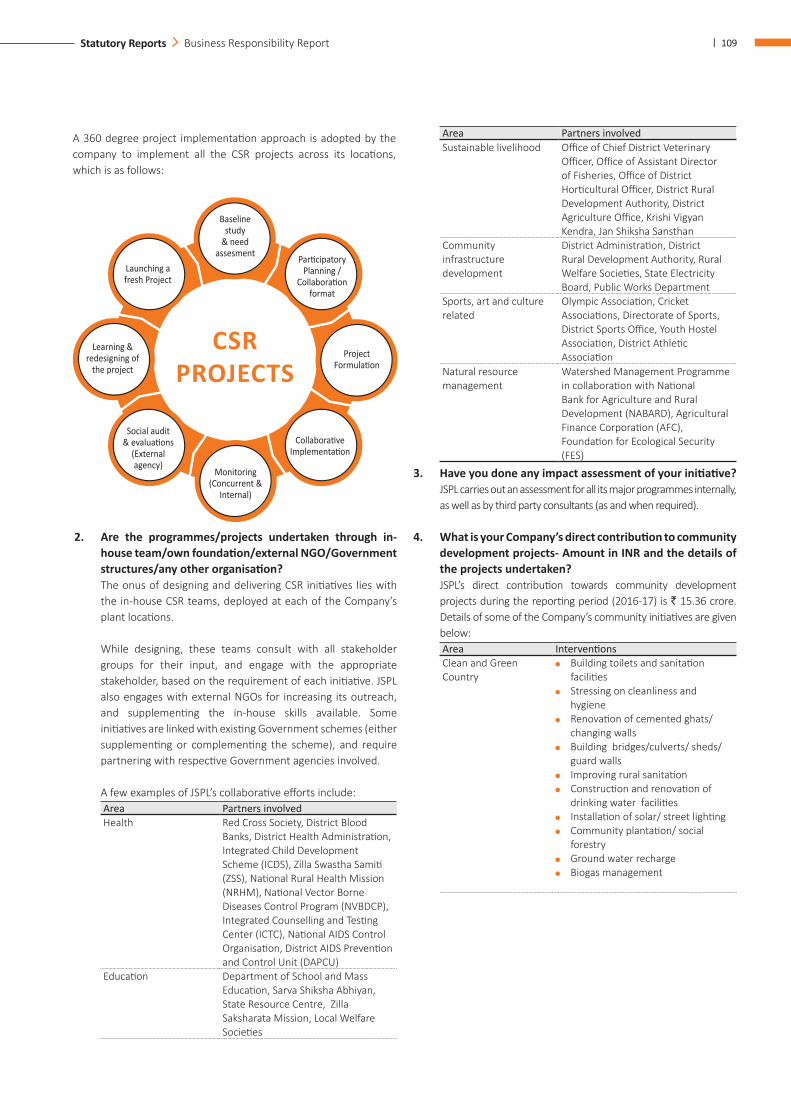
| 109Statutory Reports Business Responsibility Report
A 360 degree project implementation approach is adopted by the company to implement all the CSR projects across its locations, which is as follows:
2. Are the programmes/projects undertaken through in-house team/own foundation/external NGO/Government structures/any other organisation?
The onus of designing and delivering CSR initiatives lies with the in-house CSR teams, deployed at each of the Company’s plant locations.
While designing, these teams consult with all stakeholder groups for their input, and engage with the appropriate stakeholder, based on the requirement of each initiative. JSPL also engages with external NGOs for increasing its outreach, and supplementing the in-house skills available. Some initiatives are linked with existing Government schemes (either supplementing or complementing the scheme), and require partnering with respective Government agencies involved.
A few examples of JSPL’s collaborative efforts include:Area Partners involvedHealth Red Cross Society, District Blood
Banks, District Health Administration, Integrated Child Development Scheme (ICDS), Zilla Swastha Samiti (ZSS), National Rural Health Mission (NRHM), National Vector Borne Diseases Control Program (NVBDCP), Integrated Counselling and Testing Center (ICTC), National AIDS Control Organisation, District AIDS Prevention and Control Unit (DAPCU)
Education Department of School and Mass Education, Sarva Shiksha Abhiyan, State Resource Centre, Zilla Saksharata Mission, Local Welfare Societies
Area Partners involvedSustainable livelihood Office of Chief District Veterinary
Officer, Office of Assistant Director of Fisheries, Office of District Horticultural Officer, District Rural Development Authority, District Agriculture Office, Krishi Vigyan Kendra, Jan Shiksha Sansthan
Community infrastructure development
District Administration, District Rural Development Authority, Rural Welfare Societies, State Electricity Board, Public Works Department
Sports, art and culture related
Olympic Association, Cricket Associations, Directorate of Sports, District Sports Office, Youth Hostel Association, District Athletic Association
Natural resource management
Watershed Management Programme in collaboration with National Bank for Agriculture and Rural Development (NABARD), Agricultural Finance Corporation (AFC), Foundation for Ecological Security (FES)
3. Have you done any impact assessment of your initiative? JSPL carries out an assessment for all its major programmes internally,
as well as by third party consultants (as and when required).
4. What is your Company’s direct contribution to community development projects- Amount in INR and the details of the projects undertaken?
JSPL’s direct contribution towards community development projects during the reporting period (2016-17) is ` 15.36 crore. Details of some of the Company’s community initiatives are given below:Area InterventionsClean and Green Country
Building toilets and sanitation facilities
Stressing on cleanliness and hygiene
Renovation of cemented ghats/ changing walls
Building bridges/culverts/ sheds/ guard walls
Improving rural sanitation Construction and renovation of
drinking water facilities Installation of solar/ street lighting Community plantation/ social
forestry Ground water recharge Biogas management
CSR PROJECTS
Baseline study
& need assesment Participatory
Planning / Collaboration
format
Project Formulation
Collaborative Implementation
Monitoring (Concurrent &
Internal)
Social audit & evaluations
(External agency)
Learning & redesigning of
the project
Launching a fresh Project
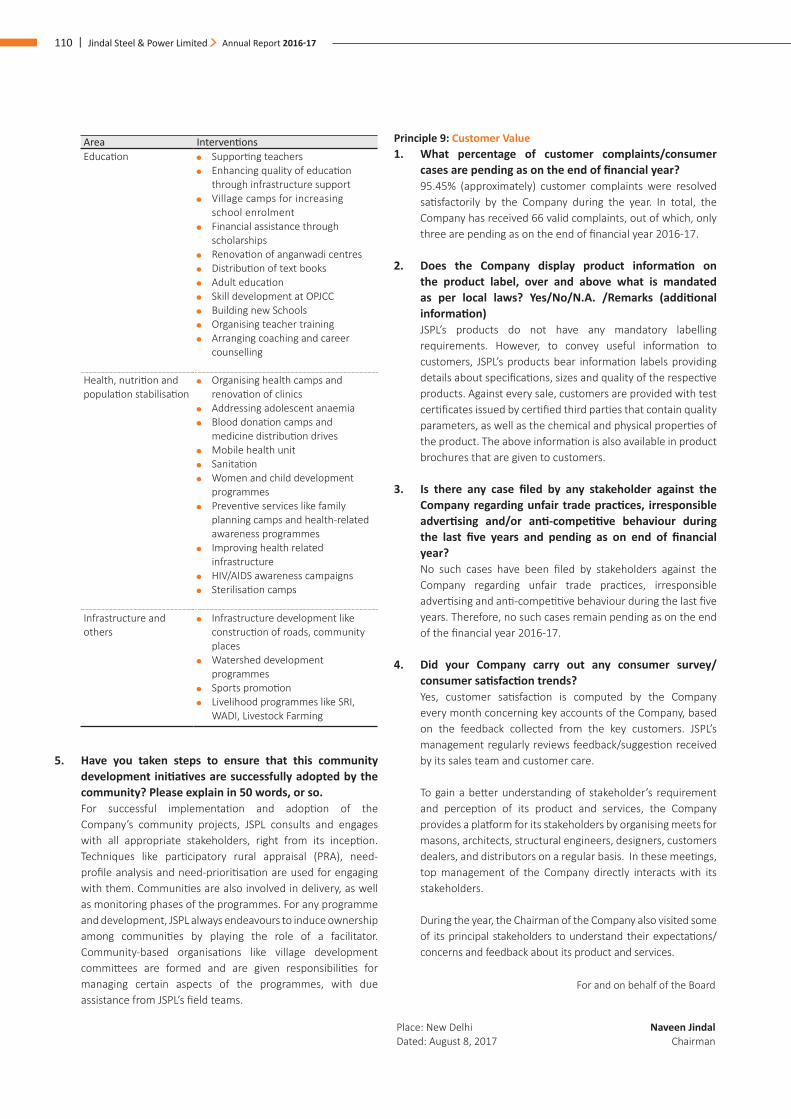
110 | Jindal Steel & Power Limited Annual Report 2016-17
Area InterventionsEducation Supporting teachers
Enhancing quality of education through infrastructure support
Village camps for increasing school enrolment
Financial assistance through scholarships
Renovation of anganwadi centres Distribution of text books Adult education Skill development at OPJCC Building new Schools Organising teacher training Arranging coaching and career
counselling
Health, nutrition and population stabilisation
Organising health camps and renovation of clinics
Addressing adolescent anaemia Blood donation camps and
medicine distribution drives Mobile health unit Sanitation Women and child development
programmes Preventive services like family
planning camps and health-related awareness programmes
Improving health related infrastructure
HIV/AIDS awareness campaigns Sterilisation camps
Infrastructure and others
Infrastructure development like construction of roads, community places
Watershed development programmes
Sports promotion Livelihood programmes like SRI,
WADI, Livestock Farming
5. Have you taken steps to ensure that this community development initiatives are successfully adopted by the community? Please explain in 50 words, or so.
For successful implementation and adoption of the Company’s community projects, JSPL consults and engages with all appropriate stakeholders, right from its inception. Techniques like participatory rural appraisal (PRA), need-profile analysis and need-prioritisation are used for engaging with them. Communities are also involved in delivery, as well as monitoring phases of the programmes. For any programme and development, JSPL always endeavours to induce ownership among communities by playing the role of a facilitator. Community-based organisations like village development committees are formed and are given responsibilities for managing certain aspects of the programmes, with due assistance from JSPL’s field teams.
Principle 9: Customer Value 1. What percentage of customer complaints/consumer
cases are pending as on the end of financial year? 95.45% (approximately) customer complaints were resolved
satisfactorily by the Company during the year. In total, the Company has received 66 valid complaints, out of which, only three are pending as on the end of financial year 2016-17.
2. Does the Company display product information on the product label, over and above what is mandated as per local laws? Yes/No/N.A. /Remarks (additional information)
JSPL’s products do not have any mandatory labelling requirements. However, to convey useful information to customers, JSPL’s products bear information labels providing details about specifications, sizes and quality of the respective products. Against every sale, customers are provided with test certificates issued by certified third parties that contain quality parameters, as well as the chemical and physical properties of the product. The above information is also available in product brochures that are given to customers.
3. Is there any case filed by any stakeholder against the Company regarding unfair trade practices, irresponsible advertising and/or anti-competitive behaviour during the last five years and pending as on end of financial year?
No such cases have been filed by stakeholders against the Company regarding unfair trade practices, irresponsible advertising and anti-competitive behaviour during the last five years. Therefore, no such cases remain pending as on the end of the financial year 2016-17.
4. Did your Company carry out any consumer survey/ consumer satisfaction trends?
Yes, customer satisfaction is computed by the Company every month concerning key accounts of the Company, based on the feedback collected from the key customers. JSPL’s management regularly reviews feedback/suggestion received by its sales team and customer care.
To gain a better understanding of stakeholder’s requirement and perception of its product and services, the Company provides a platform for its stakeholders by organising meets for masons, architects, structural engineers, designers, customers dealers, and distributors on a regular basis. In these meetings, top management of the Company directly interacts with its stakeholders.
During the year, the Chairman of the Company also visited some of its principal stakeholders to understand their expectations/concerns and feedback about its product and services.
For and on behalf of the Board
Place: New Delhi Naveen Jindal Dated: August 8, 2017 Chairman
| 111Financial Statements Standalone Financials
Report on the standalone Ind AS financial StatementsWe have audited the accompanying standalone Ind AS financial statements of JINDAL STEEL & POWER LIMITED (“the Company”), which comprise the Balance Sheet as at 31st March, 2017, the Statement of Profit and Loss (including other comprehensive income), the Cash Flow Statement for the year then ended and the statement of changes in equity for the year then ended and a summary of the significant accounting policies and other explanatory information (herein after referred to as “standalone Ind AS financial statements”).
Management’s Responsibility for the standalone Ind AS Financial StatementsThe Company’s Board of Directors is responsible for the matters stated in Section 134(5) of the Companies Act, 2013 (“the Act”) with respect to the preparation of these standalone Ind AS financial statements that give a true and fair view of the financial position, financial performance including other comprehensive income, cash flows and changes in equity of the Company in accordance with the accounting principles generally accepted in India, including the Indian Accounting Standards (Ind AS) prescribed under Section 133 of the Act read with relevant rules issued thereunder. This responsibility also includes maintenance of adequate accounting records in accordance with the provisions of the Act for safeguarding the assets of the Company and for preventing and detecting frauds and other irregularities; selection and application of appropriate accounting policies; making judgments and estimates that are reasonable and prudent; and design, implementation and maintenance of adequate internal financial controls, that were operating effectively for ensuring the accuracy and completeness of the accounting records, relevant to the preparation and presentation of the standalone Ind AS financial statements that give a true and fair view and are free from material misstatement, whether due to fraud or error.
Auditor’s ResponsibilityOur responsibility is to express an opinion on these standalone Ind AS financial statements based on our audit.
We have taken into account the provisions of the Act, the accounting and auditing standards and matters which are required to be included in the audit report under the provisions of the Act and the Rules made there under.
We conducted our audit in accordance with the Standards on Auditing specified under Section 143(10) of the Act. Those Standards require that we comply with ethical requirements and plan and perform the audit to obtain reasonable assurance about whether the standalone Ind AS financial statements are free from material misstatement.
An audit involves performing procedures to obtain audit evidence about the amounts and the disclosures in the standalone Ind AS financial statements. The procedures selected depend on the auditor’s judgment, including the assessment of the risks of material misstatement of the standalone Ind AS financial statements, whether due to fraud or error. In making those risk assessments, the auditor considers internal financial control relevant to the Company’s preparation of the standalone Ind AS financial statements that give a true and fair view in order to design audit procedures that are appropriate in the circumstances. An audit also includes evaluating the appropriateness of the accounting policies used and the reasonableness of the accounting estimates made by the Company’s Directors, as well as evaluating the overall presentation of the standalone Ind AS financial statements. We believe that the audit evidence we have obtained is sufficient and appropriate to provide a basis for our audit opinion on the standalone Ind AS financial statements.
Basis of Qualified Opinion:We draw attention regarding impact on the net carrying value of fixed assets/investment made in mining assets not been considered for the reason stated in the Note No. 58 to the standalone financial statements of the company for the year ended 31st March 2017 and the management’s view about additional levy paid of amounting to ` 1,274.46 crore (being differential amount between Gross and Net) as stated in the Note No. 57 to the standalone financial statements of the Company for the year ended 31st March 2017, which shown as good and recoverable.
Qualified OpinionIn our opinion and to the best of our information and according to the explanations given to us, except for the effects/ possible effects of our observation stated in “Basis of Qualified Opinion paragraph” above, the aforesaid standalone Ind AS financial statements give the information required by the Act in the manner so required and give a true and fair view in conformity with the accounting principles generally accepted in India including the Ind AS, of the state of affairs (financial position) of the Company as at 31st March, 2017, and its loss (financial performance including other comprehensive income/loss) ), its cash flows and the changes in equity for the year ended on that date.
Report on Other Legal and Regulatory Requirements1. As required by the Companies (Auditor’s Report) Order, 2016
(“the Order”) issued by the Central Government of India in terms of sub-section (11) of section 143 of the Act, and on the basis of such checks of the books and records of the Company as we considered appropriate and according to the information and explanations given to us during the course of audit, we give in the Annexure ‘A’ a statement on the matters specified in the paragraphs 3 and 4 of the Order.
Independent Auditor’s ReportTO THE MEMBERS OF JINDAL STEEL & POWER LIMITED
112 | Jindal Steel & Power Limited Annual Report 2016-17
2. As required by Section 143 (3) of the Act, we report that:
(a) We have sought and obtained all the information and explanations which to the best of our knowledge and belief were necessary for the purposes of our audit.
(b) In our opinion, proper books of account as required by law have been kept by the Company so far as it appears from our examination of those books.
(c) The Balance Sheet, the Statement of Profit and Loss, including other comprehensive income, the Cash Flow Statement and statement of changes in equity dealt with by this Report are in agreement with the books of account.
(d) In our opinion, except for the effect / possible effect of the matters described in ‘Basis of Qualified Opinion’ paragraph above, the aforesaid standalone Ind AS financial statements comply with the Accounting Standards specified under Section 133 of the Act, read with relevant rule issued thereunder.
(e) The Matters described in ‘Basis of Qualified opinion’ paragraph above in our opinion, may not have an adverse effect on the functioning of the Company.
(f) On the basis of the written representations received from the directors as on 31st March, 2017 taken on record by the Board of Directors, none of the directors is disqualified as on 31st March, 2017 from being appointed as a director in terms of Section 164 (2) of the Act.
(g) As required by section 143(3)(i) of the Companies Act, 2013, and based on the checking of the books and records of the Company as we considered appropriate and according to the information and explanations given to us, our separate report with respect to the adequacy of the internal financial controls over financial reporting of the Company and the operating effectiveness of such controls is as per Annexure ‘B’.
(h) With respect to the other matters to be included in the Auditor’s Report in accordance with Rule 11 of the Companies (Audit and Auditors) Rules, 2014, in our opinion and to the best of our information and according to the explanations given to us:
i. The Company has disclosed the impact of pending litigations on its financial position in its standalone Ind AS financial statements – refer Note no. 41 to the standalone Ind AS financial statements.
ii. The Company has made provision, as required under the applicable law or accounting standards, for material foreseeable losses, if any, on long term contracts including derivatives contracts.
iii. There has been no delay in transferring amounts, required to be transferred, to the Investor Education and Protection Fund by the Company.
iv. The company had provided requisite disclosures in its financial statements as to holdings as well as dealings in Specified Bank Notes during the period from 8th November, 2016 to 30th December, 2016 and these are in accordance with the books of accounts maintained by the company. Refer Note No. 15 to the standalone Ind AS financial statements.
For LODHA & CO. Chartered Accountants ICAI-FRN: 301051E
N.K. LODHA Partner Membership No. 085155 Place: New DelhiDated: 23rd May 2017
Independent Auditor’s ReportTO THE MEMBERS OF JINDAL STEEL & POWER LIMITED
| 113Financial Statements Standalone Financials
Annexure “A” referred to in paragraph 1 under the heading “Report on other legal and regulatory requirements” of our report of even date on the Standalone Financial Statements of JINDAL STEEL & POWER LIMITED for the year ended 31st March 2017
1. (a) The Company has maintained proper records showing full particulars including quantitative details and situation of fixed assets.
(b) The Company has a regular programme of Physical Verification of its Fixed assets by which fixed asset have been verified by the management according to the programe of periodical physical verification in a phased manner which in our opinion is reasonable having regard to the size of the Company and the nature of its fixed assets. The discrepancies noticed on such physical verification were not material.
(c) According to the information and explanations given to us and on the basis of our examination of the records of the Company, the title deeds of immovable properties included in fixed assets are held in the name of the Company.
2. The inventories of the Company [except stock lying with the third parties (read with footnote of Note no. 55 (a)) and in transit], part of stores and spares, have been physically verified by the management at reasonable intervals. In our opinion, the procedures of physical verification of inventory followed by the Management are reasonable in relation to the size of the Company and nature of its business. The discrepancies noticed on such physical verification of inventory as compared to book records were not material.
3. The Company has not granted any loans, secured or unsecured to companies, firms or other parties covered in the register maintained under section 189 of the Companies Act, 2013.
4. According to the information, explanations and representations provided by the management and based upon audit procedures performed, we are of the opinion that in respect of loans, investments, guarantees and security, the Company has complied with the provisions of the Section 185 and 186 of the Companies Act, 2013.
5. In our opinion and according to the information and explanations given to us, the Company has not accepted any deposit from the public within the meaning of the directive issued by the Reserve Bank of India and the provisions of Section 73 to76 of the Act or any other relevant provisions of the Act and the rules framed there under (to the extent applicable). We have been informed that no order has been passed by the Company Law Board or National Company Law Tribunal or Reserve Bank of India or any Court or other Tribunal in this regard.
6. We have broadly reviewed the books of account maintained by the Company pursuant to the rules made by the Central Government for the maintenance of cost records under section 148(1) of the Act in respect of the Company’s products to which the said rules are made applicable and are of the opinion that prima facie, the prescribed records have been made and maintained. We have, however, not made a detailed examination of the said records with a view to determine whether they are accurate or complete.
7. (a) According to the records of the Company, the Company is regular in depositing undisputed statutory dues including provident fund, employees’ state insurance, income tax, sales-tax, service tax, duty of customs, duty of excise, value added tax, cess and other material statutory dues with the appropriate authorities to the extent applicable and there are no undisputed statutory dues payable for a period of more than six months from the date they become payable as at 31st March, 2017 except electricity duty / cess 1.65 crore, CST ` 4.66 crore, VAT ` 5.93 crore, Royalty ` 0.86 crore, TDS/TCS ` 1.04crore, Development & Env. Tax ` 0.78 crore, service tax ` 0.21 crore, Excise duty ` 0.12 crore & Professional tax ` 0.01 crore.
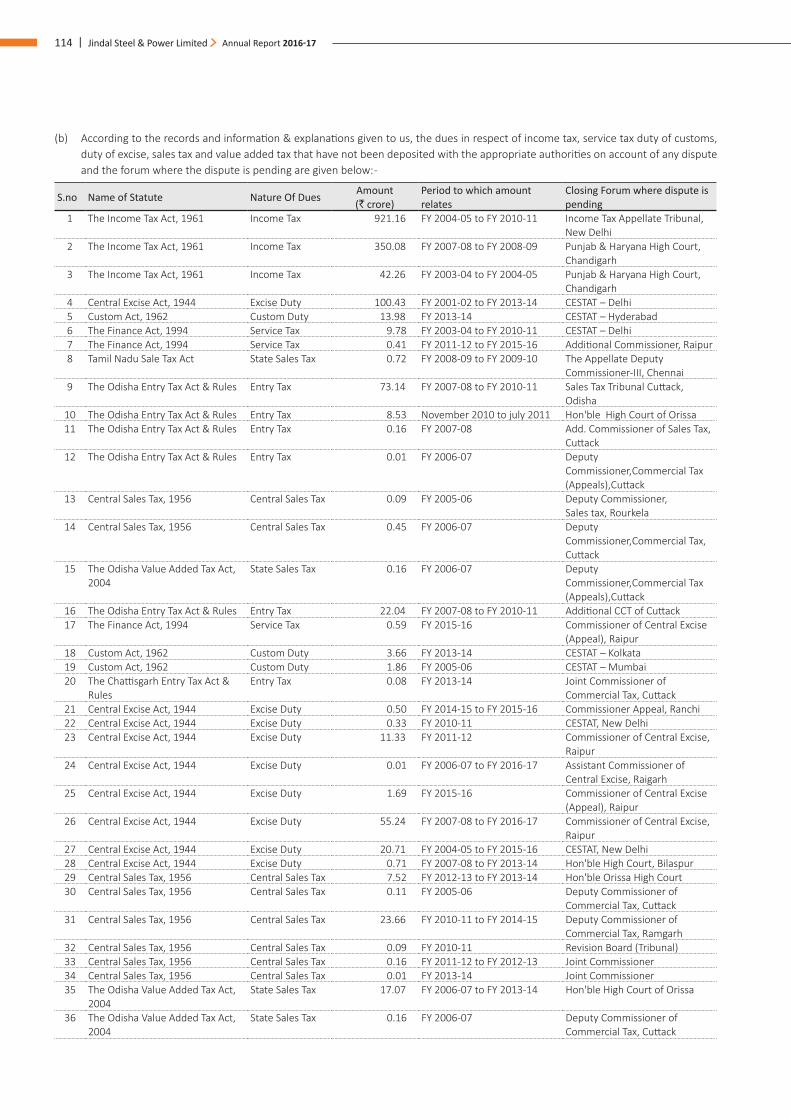
114 | Jindal Steel & Power Limited Annual Report 2016-17
S.no Name of Statute Nature Of Dues Amount (` crore)
Period to which amount relates
Closing Forum where dispute is pending
1 The Income Tax Act, 1961 Income Tax 921.16 FY 2004-05 to FY 2010-11 Income Tax Appellate Tribunal, New Delhi
2 The Income Tax Act, 1961 Income Tax 350.08 FY 2007-08 to FY 2008-09 Punjab & Haryana High Court, Chandigarh
3 The Income Tax Act, 1961 Income Tax 42.26 FY 2003-04 to FY 2004-05 Punjab & Haryana High Court, Chandigarh
4 Central Excise Act, 1944 Excise Duty 100.43 FY 2001-02 to FY 2013-14 CESTAT – Delhi5 Custom Act, 1962 Custom Duty 13.98 FY 2013-14 CESTAT – Hyderabad6 The Finance Act, 1994 Service Tax 9.78 FY 2003-04 to FY 2010-11 CESTAT – Delhi7 The Finance Act, 1994 Service Tax 0.41 FY 2011-12 to FY 2015-16 Additional Commissioner, Raipur8 Tamil Nadu Sale Tax Act State Sales Tax 0.72 FY 2008-09 to FY 2009-10 The Appellate Deputy
Commissioner-III, Chennai9 The Odisha Entry Tax Act & Rules Entry Tax 73.14 FY 2007-08 to FY 2010-11 Sales Tax Tribunal Cuttack,
Odisha10 The Odisha Entry Tax Act & Rules Entry Tax 8.53 November 2010 to july 2011 Hon'ble High Court of Orissa11 The Odisha Entry Tax Act & Rules Entry Tax 0.16 FY 2007-08 Add. Commissioner of Sales Tax,
Cuttack12 The Odisha Entry Tax Act & Rules Entry Tax 0.01 FY 2006-07 Deputy
Commissioner,Commercial Tax (Appeals),Cuttack
13 Central Sales Tax, 1956 Central Sales Tax 0.09 FY 2005-06 Deputy Commissioner, Sales tax, Rourkela
14 Central Sales Tax, 1956 Central Sales Tax 0.45 FY 2006-07 Deputy Commissioner,Commercial Tax, Cuttack
15 The Odisha Value Added Tax Act, 2004
State Sales Tax 0.16 FY 2006-07 Deputy Commissioner,Commercial Tax (Appeals),Cuttack
16 The Odisha Entry Tax Act & Rules Entry Tax 22.04 FY 2007-08 to FY 2010-11 Additional CCT of Cuttack17 The Finance Act, 1994 Service Tax 0.59 FY 2015-16 Commissioner of Central Excise
(Appeal), Raipur18 Custom Act, 1962 Custom Duty 3.66 FY 2013-14 CESTAT – Kolkata19 Custom Act, 1962 Custom Duty 1.86 FY 2005-06 CESTAT – Mumbai20 The Chattisgarh Entry Tax Act &
RulesEntry Tax 0.08 FY 2013-14 Joint Commissioner of
Commercial Tax, Cuttack21 Central Excise Act, 1944 Excise Duty 0.50 FY 2014-15 to FY 2015-16 Commissioner Appeal, Ranchi22 Central Excise Act, 1944 Excise Duty 0.33 FY 2010-11 CESTAT, New Delhi23 Central Excise Act, 1944 Excise Duty 11.33 FY 2011-12 Commissioner of Central Excise,
Raipur24 Central Excise Act, 1944 Excise Duty 0.01 FY 2006-07 to FY 2016-17 Assistant Commissioner of
Central Excise, Raigarh25 Central Excise Act, 1944 Excise Duty 1.69 FY 2015-16 Commissioner of Central Excise
(Appeal), Raipur26 Central Excise Act, 1944 Excise Duty 55.24 FY 2007-08 to FY 2016-17 Commissioner of Central Excise,
Raipur27 Central Excise Act, 1944 Excise Duty 20.71 FY 2004-05 to FY 2015-16 CESTAT, New Delhi28 Central Excise Act, 1944 Excise Duty 0.71 FY 2007-08 to FY 2013-14 Hon'ble High Court, Bilaspur29 Central Sales Tax, 1956 Central Sales Tax 7.52 FY 2012-13 to FY 2013-14 Hon'ble Orissa High Court30 Central Sales Tax, 1956 Central Sales Tax 0.11 FY 2005-06 Deputy Commissioner of
Commercial Tax, Cuttack31 Central Sales Tax, 1956 Central Sales Tax 23.66 FY 2010-11 to FY 2014-15 Deputy Commissioner of
Commercial Tax, Ramgarh32 Central Sales Tax, 1956 Central Sales Tax 0.09 FY 2010-11 Revision Board (Tribunal)33 Central Sales Tax, 1956 Central Sales Tax 0.16 FY 2011-12 to FY 2012-13 Joint Commissioner34 Central Sales Tax, 1956 Central Sales Tax 0.01 FY 2013-14 Joint Commissioner35 The Odisha Value Added Tax Act,
2004State Sales Tax 17.07 FY 2006-07 to FY 2013-14 Hon'ble High Court of Orissa
36 The Odisha Value Added Tax Act, 2004
State Sales Tax 0.16 FY 2006-07 Deputy Commissioner of Commercial Tax, Cuttack
(b) According to the records and information & explanations given to us, the dues in respect of income tax, service tax duty of customs, duty of excise, sales tax and value added tax that have not been deposited with the appropriate authorities on account of any dispute and the forum where the dispute is pending are given below: -
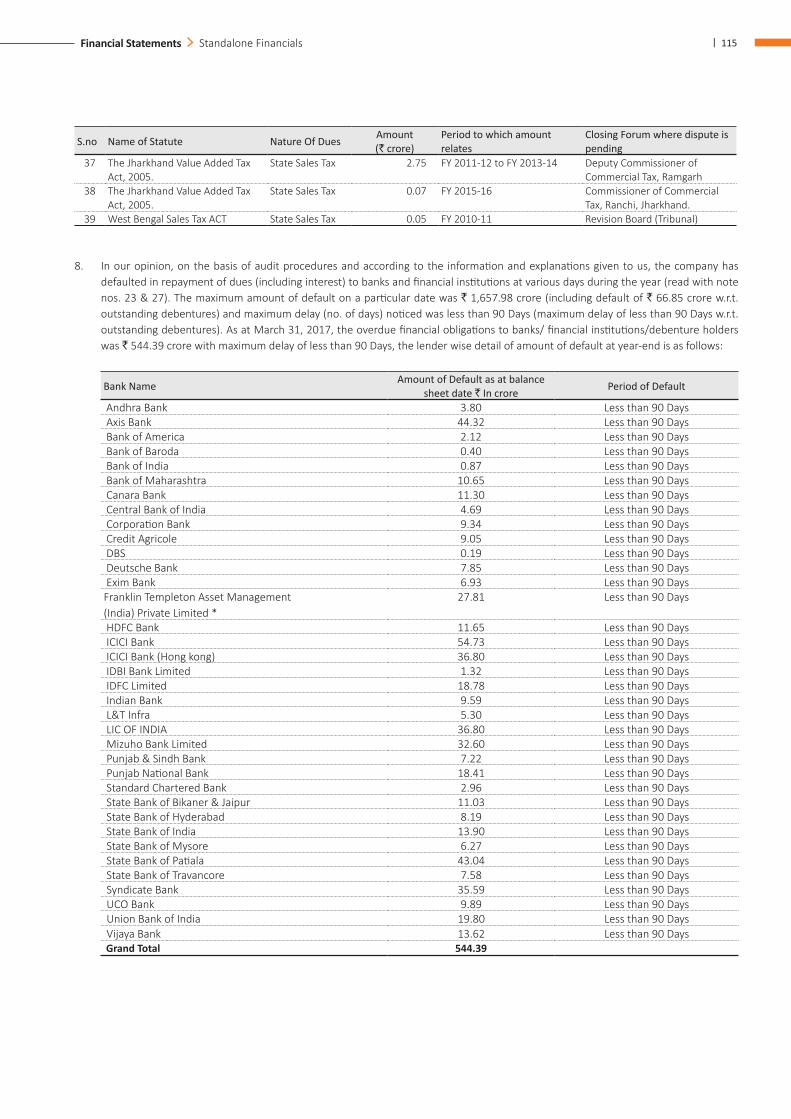
| 115Financial Statements Standalone Financials
S.no Name of Statute Nature Of Dues Amount (` crore)
Period to which amount relates
Closing Forum where dispute is pending
37 The Jharkhand Value Added Tax Act, 2005.
State Sales Tax 2.75 FY 2011-12 to FY 2013-14 Deputy Commissioner of Commercial Tax, Ramgarh
38 The Jharkhand Value Added Tax Act, 2005.
State Sales Tax 0.07 FY 2015-16 Commissioner of Commercial Tax, Ranchi, Jharkhand.
39 West Bengal Sales Tax ACT State Sales Tax 0.05 FY 2010-11 Revision Board (Tribunal)
8. In our opinion, on the basis of audit procedures and according to the information and explanations given to us, the company has defaulted in repayment of dues (including interest) to banks and financial institutions at various days during the year (read with note nos. 23 & 27). The maximum amount of default on a particular date was ` 1,657.98 crore (including default of ` 66.85 crore w.r.t. outstanding debentures) and maximum delay (no. of days) noticed was less than 90 Days (maximum delay of less than 90 Days w.r.t. outstanding debentures). As at March 31, 2017, the overdue financial obligations to banks/ financial institutions/debenture holders was ` 544.39 crore with maximum delay of less than 90 Days, the lender wise detail of amount of default at year-end is as follows:
Bank Name Amount of Default as at balance sheet date ` In crore Period of Default
Andhra Bank 3.80 Less than 90 Days Axis Bank 44.32 Less than 90 Days Bank of America 2.12 Less than 90 Days Bank of Baroda 0.40 Less than 90 Days Bank of India 0.87 Less than 90 Days Bank of Maharashtra 10.65 Less than 90 Days Canara Bank 11.30 Less than 90 Days Central Bank of India 4.69 Less than 90 Days Corporation Bank 9.34 Less than 90 Days Credit Agricole 9.05 Less than 90 Days DBS 0.19 Less than 90 Days Deutsche Bank 7.85 Less than 90 Days Exim Bank 6.93 Less than 90 DaysFranklin Templeton Asset Management (India) Private Limited *
27.81 Less than 90 Days
HDFC Bank 11.65 Less than 90 Days ICICI Bank 54.73 Less than 90 Days ICICI Bank (Hong kong) 36.80 Less than 90 Days IDBI Bank Limited 1.32 Less than 90 Days IDFC Limited 18.78 Less than 90 Days Indian Bank 9.59 Less than 90 Days L&T Infra 5.30 Less than 90 Days LIC OF INDIA 36.80 Less than 90 Days Mizuho Bank Limited 32.60 Less than 90 Days Punjab & Sindh Bank 7.22 Less than 90 Days Punjab National Bank 18.41 Less than 90 Days Standard Chartered Bank 2.96 Less than 90 Days State Bank of Bikaner & Jaipur 11.03 Less than 90 Days State Bank of Hyderabad 8.19 Less than 90 Days State Bank of India 13.90 Less than 90 Days State Bank of Mysore 6.27 Less than 90 Days State Bank of Patiala 43.04 Less than 90 Days State Bank of Travancore 7.58 Less than 90 Days Syndicate Bank 35.59 Less than 90 Days UCO Bank 9.89 Less than 90 Days Union Bank of India 19.80 Less than 90 Days Vijaya Bank 13.62 Less than 90 Days Grand Total 544.39
116 | Jindal Steel & Power Limited Annual Report 2016-17
On the basis of information and explanations given to us, term loan were applied for the purpose for which the loans were obtained. No moneys have been raised during the year by way of initial public offer or further public offer.
10. Based on the audit procedure performed and on the basis of information and explanations provided by the management, no fraud by the Company and no material fraud on the Company by its officers or employees has been noticed or reported during the course of the audit.
11. According to the information and explanations given to us and based on our examination of the records of the Company, managerial remuneration has been paid/ provided in accordance with the requisite approvals mandated by the provisions of section 197 read with Schedule V to the Companies Act, read with note no. 54 B
12. In our opinion and according to the information and explanations given to us, the Company is not a nidhi company. Accordingly, paragraph 3(xii) of the Order is not applicable.
13. According to the information and explanations and records made available by the management of the Company and audit procedure performed, for transactions with the related parties during the year, the Company has complied with the provisions of Section 177 and 188 of the Act, where applicable. As explained and as per records, details of related party transactions have been disclosed in the standalone Ind AS financial statements as per the applicable Accounting Standards [Read with note no. 54 B].
14. According to the information and explanations given to us, the Company has not made any preferential allotment or private placement of shares or fully or partly convertible debentures during the year, read with note no. 21(e); except allotment of equity shares under employees share purchase scheme 2013 of the Company in respect of which requirement of section 42 of the Act have been complied with and the amount raised have been used for the purpose for which the funds were raised.
15. On the basis of records made available to us and according to information and explanations given to us, the Company has not entered into non-cash transactions with the directors or persons connected with him.
16. The Company is not required to be registered under section 45-IA of the Reserve Bank of India Act 1934.
For LODHA & CO. Chartered Accountants FRN: 301051E
N.K. LODHA Partner Membership No. 085155 Place: New DelhiDated: 23rd May 2017
Annexure ‘B’ To The Independent Auditor’s Report of Even Date on The Standalone Ind As Financial Statements of Jindal Steel & Power Limited
Report on the Internal Financial Controls over Financial Reporting under Clause (i) of Sub-section 3 of Section 143 of the Companies Act, 2013 (“the Act”)We have audited the internal financial controls over financial reporting of JINDAL STEEL & POWER LIMITED (“the Company”) as of March 31, 2017 in conjunction with our audit of the standalone Ind AS financial statements of the Company for the year ended on that date.
Management’s Responsibility for Internal Financial ControlsThe Company’s management is responsible for establishing and maintaining internal financial controls based on the internal control over financial reporting criteria established by the Company considering the essential components of internal control stated in the Guidance Note on Audit of Internal Financial Controls over Financial Reporting issued by the Institute of Chartered Accountants of India (ICAI). These responsibilities include the design, implementation and maintenance of adequate internal financial controls that were operating effectively for ensuring the orderly and efficient conduct of its business, including adherence to Company’s policies, the
safeguarding of its assets, the prevention and detection of frauds and errors, the accuracy and completeness of the accounting records, and the timely preparation of reliable financial information, as required under the Companies Act, 2013.
Auditor’s ResponsibilityOur responsibility is to express an opinion on the Company's internal financial controls over financial reporting based on our audit. We conducted our audit in accordance with the Guidance Note on Audit of Internal Financial Controls Over Financial Reporting (the “Guidance Note”) and the Standards on Auditing, issued by ICAI and deemed to be prescribed under section 143(10) of the Companies Act, 2013, to the extent applicable to an audit of internal financial controls, both applicable to an audit of Internal Financial Controls and, both issued by the Institute of Chartered Accountants of India. Those Standards and the Guidance Note require that we comply with ethical requirements and plan and perform the audit to obtain reasonable assurance about whether adequate internal financial controls over financial reporting was established and maintained and if such controls operated effectively in all material respects.
| 117Financial Statements Standalone Financials
Our audit involves performing procedures to obtain audit evidence about the adequacy of the internal financial controls system over financial reporting and their operating effectiveness. Our audit of internal financial controls over financial reporting included obtaining an understanding of internal financial controls over financial reporting, assessing the risk that a material weakness exists, and testing and evaluating the design and operating effectiveness of internal control based on the assessed risk. The procedures selected depend on the auditor’s judgement, including the assessment of the risks of material misstatement of the financial statements, whether due to fraud or error.
We believe that the audit evidence we have obtained is sufficient and appropriate to provide a basis for our audit opinion on the Company’s internal financial controls system over financial reporting.
Meaning of Internal Financial Controls Over Financial ReportingA company's internal financial control over financial reporting is a process designed to provide reasonable assurance regarding the reliability of financial reporting and the preparation of financial statements for external purposes in accordance with generally accepted accounting principles. A company's internal financial control over financial reporting includes those policies and procedures that (1) pertain to the maintenance of records that, in reasonable detail, accurately and fairly reflect the transactions and dispositions of the assets of the company; (2) provide reasonable assurance that transactions are recorded as necessary to permit preparation of financial statements in accordance with generally accepted accounting principles, and that receipts and expenditures of the company are being made only in accordance with authorizations of management and directors of the company; and (3) provide reasonable assurance regarding prevention or timely detection of unauthorized acquisition, use, or disposition of the company's assets that could have a material effect on the financial statements.
Inherent Limitations of Internal Financial Controls Over Financial ReportingBecause of the inherent limitations of internal financial controls over financial reporting, including the possibility of collusion or improper management override of controls, material misstatements due to error or fraud may occur and not be detected. Also, projections of any evaluation of the internal financial controls over financial reporting to future periods are subject to the risk that the internal financial control over financial reporting may become inadequate because of changes in conditions, or that the degree of compliance with the policies or procedures may deteriorate.
Qualified OpinionAccording to the information and explanations given to us and based on our audit, the following material weaknesses has been identified
in the operating effectiveness of the Company’s internal financial controls over financial reporting as at 31st March 2017:
(a) Adjustment/provision to be made in regard to expense relating to additional coal levy could potentially result in the Company recording lower expense. (Note No…)
(b) Provision/Impact of the net carrying value of fixed assets/investment made in mining assets not been considered (presently not determinable); which may result in carrying the assets at higher value. (Note No…)
A ‘material weakness’ is a deficiency, or a combination of deficiencies, in internal financial control over financial reporting, such that there is a reasonable possibility that a material misstatement of the Company’s annual or interim financial statements will not be prevented or detected on a timely basis.
In our opinion, except for the effects / possible effects of the material weaknesses described above in (a) and (b)under Qualified Opinion paragraph on the achievement of the objectives of the control criteria, the Company has, in all material respects, an adequate internal financial controls system over financial reporting and such internal financial controls over financial reporting were operating effectively as of March 31, 2017, based on the internal control over financial reporting criteria established by the Company considering the essential components of internal control stated in the Guidance Note on Audit of Internal Financial Controls Over Financial Reporting issued by the Institute of Chartered Accountants of India.
We have considered material weakness identified and reported above in determining the nature, timing, and extent of audit tests applied in our audit of the March31, 2017 standalone financial statements of the Company and these material weaknesses affect our opinion on standalone financial statements of the Company for the year ended 31st March 2017 [our audit report dated May 23, 2017, which expressed an qualified opinion on those standalone financial statements of the Company].
For LODHA & CO. Chartered Accountants FRN: 301051E
N.K. LODHA Partner Membership No. 085155 Place: New DelhiDated: 23rd May 2017
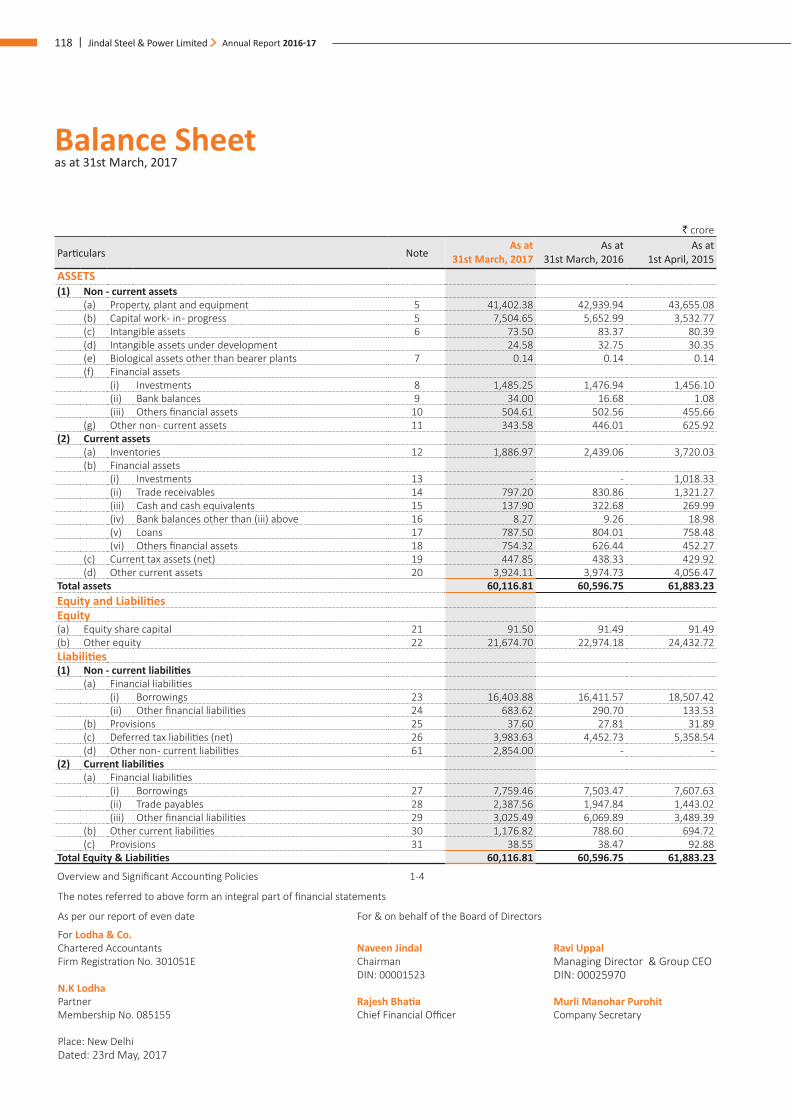
118 | Jindal Steel & Power Limited Annual Report 2016-17
Balance Sheet as at 31st March, 2017
` crore
Particulars Note As at
31st March, 2017 As at
31st March, 2016 As at
1st April, 2015 ASSETS(1) Non - current assets
(a) Property, plant and equipment 5 41,402.38 42,939.94 43,655.08 (b) Capital work - in - progress 5 7,504.65 5,652.99 3,532.77 (c) Intangible assets 6 73.50 83.37 80.39 (d) Intangible assets under development 24.58 32.75 30.35 (e) Biological assets other than bearer plants 7 0.14 0.14 0.14 (f) Financial assets
(i) Investments 8 1,485.25 1,476.94 1,456.10 (ii) Bank balances 9 34.00 16.68 1.08 (iii) Others financial assets 10 504.61 502.56 455.66
(g) Other non - current assets 11 343.58 446.01 625.92 (2) Current assets
(a) Inventories 12 1,886.97 2,439.06 3,720.03 (b) Financial assets
(i) Investments 13 - - 1,018.33 (ii) Trade receivables 14 797.20 830.86 1,321.27 (iii) Cash and cash equivalents 15 137.90 322.68 269.99 (iv) Bank balances other than (iii) above 16 8.27 9.26 18.98 (v) Loans 17 787.50 804.01 758.48 (vi) Others financial assets 18 754.32 626.44 452.27
(c) Current tax assets (net) 19 447.85 438.33 429.92 (d) Other current assets 20 3,924.11 3,974.73 4,056.47
Total assets 60,116.81 60,596.75 61,883.23 Equity and LiabilitiesEquity(a) Equity share capital 21 91.50 91.49 91.49 (b) Other equity 22 21,674.70 22,974.18 24,432.72 Liabilities(1) Non - current liabilities
(a) Financial liabilities(i) Borrowings 23 16,403.88 16,411.57 18,507.42 (ii) Other financial liabilities 24 683.62 290.70 133.53
(b) Provisions 25 37.60 27.81 31.89 (c) Deferred tax liabilities (net) 26 3,983.63 4,452.73 5,358.54 (d) Other non - current liabilities 61 2,854.00 - -
(2) Current liabilities(a) Financial liabilities
(i) Borrowings 27 7,759.46 7,503.47 7,607.63 (ii) Trade payables 28 2,387.56 1,947.84 1,443.02 (iii) Other financial liabilities 29 3,025.49 6,069.89 3,489.39
(b) Other current liabilities 30 1,176.82 788.60 694.72 (c) Provisions 31 38.55 38.47 92.88
Total Equity & Liabilities 60,116.81 60,596.75 61,883.23
Overview and Significant Accounting Policies 1-4
The notes referred to above form an integral part of financial statements
As per our report of even date For & on behalf of the Board of Directors
For Lodha & Co. Chartered Accountants Naveen Jindal Ravi UppalFirm Registration No. 301051E Chairman Managing Director & Group CEO
DIN: 00001523 DIN: 00025970N.K Lodha Partner Rajesh Bhatia Murli Manohar Purohit Membership No. 085155 Chief Financial Officer Company Secretary
Place: New DelhiDated: 23rd May, 2017
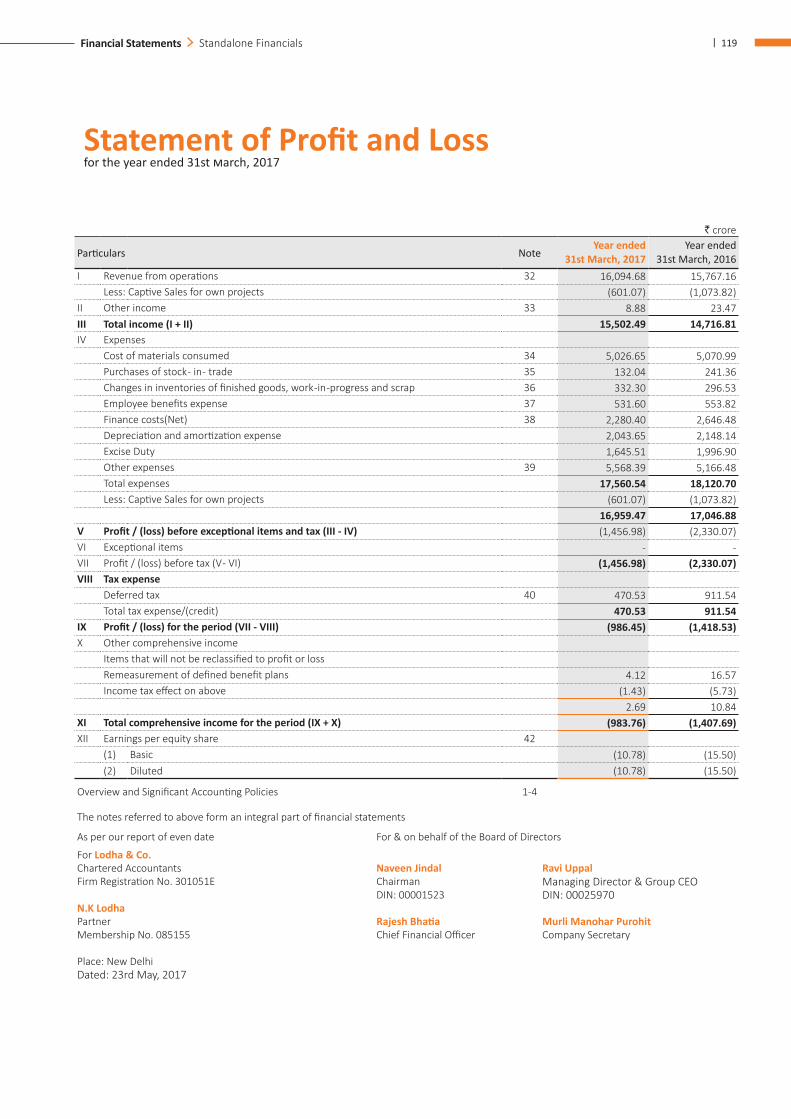
| 119Financial Statements Standalone Financials
` crore
Particulars NoteYear ended
31st March, 2017 Year ended
31st March, 2016 I Revenue from operations 32 16,094.68 15,767.16
Less: Captive Sales for own projects (601.07) (1,073.82)II Other income 33 8.88 23.47 III Total income (I + II) 15,502.49 14,716.81 IV Expenses
Cost of materials consumed 34 5,026.65 5,070.99 Purchases of stock - in - trade 35 132.04 241.36 Changes in inventories of finished goods, work -in -progress and scrap 36 332.30 296.53 Employee benefits expense 37 531.60 553.82 Finance costs(Net) 38 2,280.40 2,646.48 Depreciation and amortization expense 2,043.65 2,148.14 Excise Duty 1,645.51 1,996.90 Other expenses 39 5,568.39 5,166.48 Total expenses 17,560.54 18,120.70 Less: Captive Sales for own projects (601.07) (1,073.82)
16,959.47 17,046.88 V Profit / (loss) before exceptional items and tax (III - IV) (1,456.98) (2,330.07)VI Exceptional items - - VII Profit / (loss) before tax (V - VI) (1,456.98) (2,330.07)VIII Tax expense
Deferred tax 40 470.53 911.54 Total tax expense/(credit) 470.53 911.54
IX Profit / (loss) for the period (VII - VIII) (986.45) (1,418.53)X Other comprehensive income
Items that will not be reclassified to profit or lossRemeasurement of defined benefit plans 4.12 16.57 Income tax effect on above (1.43) (5.73)
2.69 10.84 XI Total comprehensive income for the period (IX + X) (983.76) (1,407.69)XII Earnings per equity share 42
(1) Basic (10.78) (15.50)(2) Diluted (10.78) (15.50)
Overview and Significant Accounting Policies 1-4
The notes referred to above form an integral part of financial statements
As per our report of even date For & on behalf of the Board of Directors
For Lodha & Co. Chartered Accountants Naveen Jindal Ravi UppalFirm Registration No. 301051E Chairman Managing Director & Group CEO
DIN: 00001523 DIN: 00025970N.K Lodha Partner Rajesh Bhatia Murli Manohar Purohit Membership No. 085155 Chief Financial Officer Company Secretary
Place: New DelhiDated: 23rd May, 2017
Statement of Profit and Loss for the year ended 31st �arch, 2017
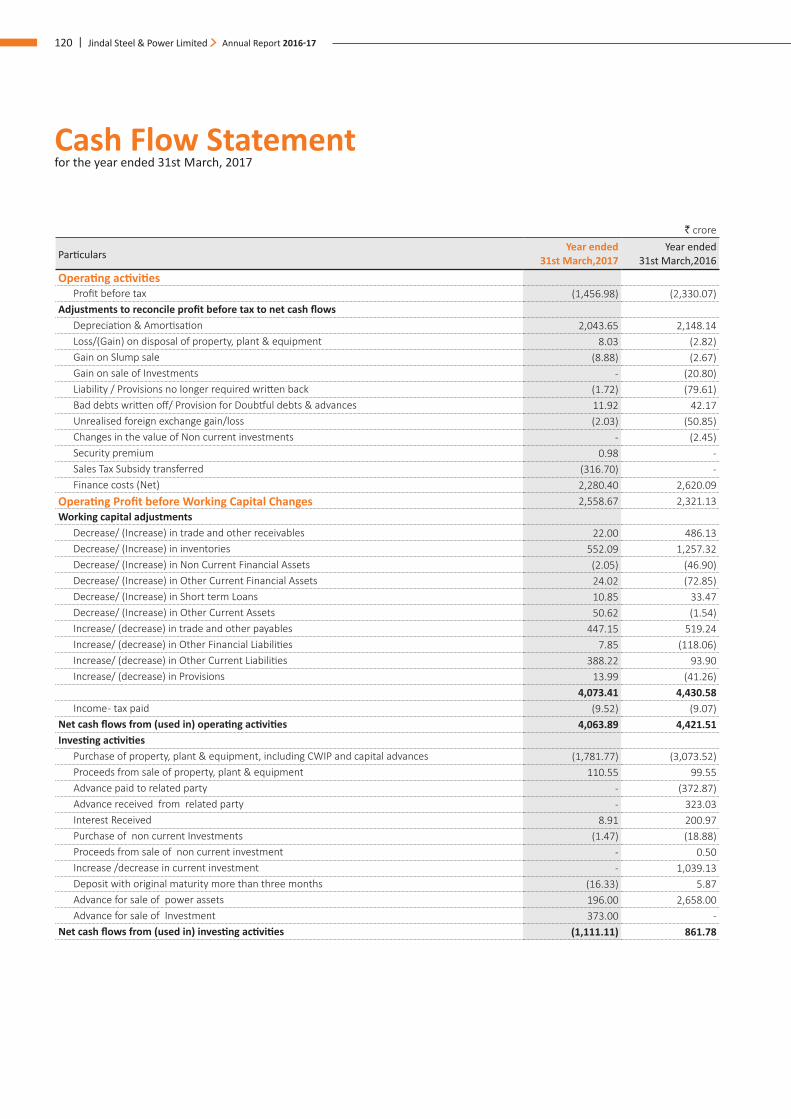
120 | Jindal Steel & Power Limited Annual Report 2016-17
` crore
ParticularsYear ended
31st March,2017 Year ended
31st March,2016 Operating activities
Profit before tax (1,456.98) (2,330.07)Adjustments to reconcile profit before tax to net cash flows
Depreciation & Amortisation 2,043.65 2,148.14 Loss/(Gain) on disposal of property, plant & equipment 8.03 (2.82)Gain on Slump sale (8.88) (2.67)Gain on sale of Investments - (20.80)Liability / Provisions no longer required written back (1.72) (79.61)Bad debts written off/ Provision for Doubtful debts & advances 11.92 42.17 Unrealised foreign exchange gain/loss (2.03) (50.85)Changes in the value of Non current investments - (2.45)Security premium 0.98 - Sales Tax Subsidy transferred (316.70) - Finance costs (Net) 2,280.40 2,620.09
Operating Profit before Working Capital Changes 2,558.67 2,321.13 Working capital adjustments
Decrease/ (Increase) in trade and other receivables 22.00 486.13 Decrease/ (Increase) in inventories 552.09 1,257.32 Decrease/ (Increase) in Non Current Financial Assets (2.05) (46.90)Decrease/ (Increase) in Other Current Financial Assets 24.02 (72.85)Decrease/ (Increase) in Short term Loans 10.85 33.47 Decrease/ (Increase) in Other Current Assets 50.62 (1.54)Increase/ (decrease) in trade and other payables 447.15 519.24 Increase/ (decrease) in Other Financial Liabilities 7.85 (118.06)Increase/ (decrease) in Other Current Liabilities 388.22 93.90 Increase/ (decrease) in Provisions 13.99 (41.26)
4,073.41 4,430.58 Income - tax paid (9.52) (9.07)
Net cash flows from (used in) operating activities 4,063.89 4,421.51 Investing activities
Purchase of property, plant & equipment, including CWIP and capital advances (1,781.77) (3,073.52)Proceeds from sale of property, plant & equipment 110.55 99.55 Advance paid to related party - (372.87)Advance received from related party - 323.03 Interest Received 8.91 200.97 Purchase of non current Investments (1.47) (18.88)Proceeds from sale of non current investment - 0.50 Increase /decrease in current investment - 1,039.13 Deposit with original maturity more than three months (16.33) 5.87 Advance for sale of power assets 196.00 2,658.00 Advance for sale of Investment 373.00 -
Net cash flows from (used in) investing activities (1,111.11) 861.78
Cash Flow Statement for the year ended 31st March, 2017
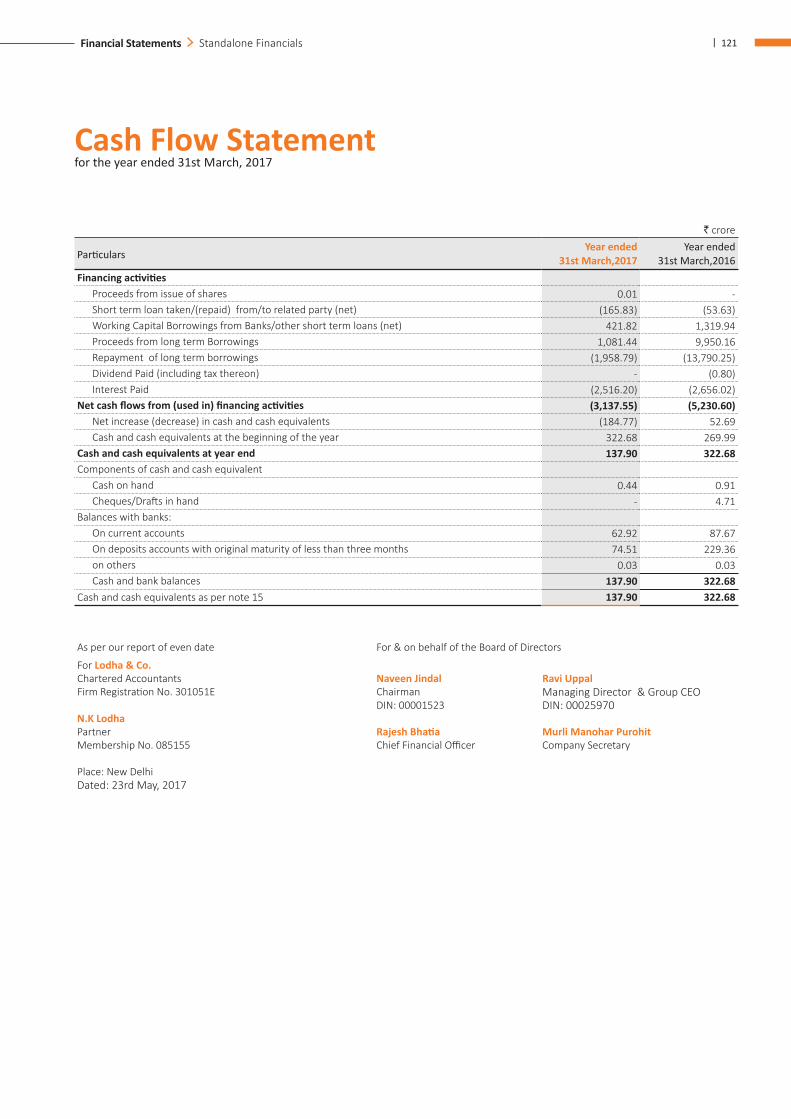
| 121Financial Statements Standalone Financials
Cash Flow Statement for the year ended 31st March, 2017
` crore
ParticularsYear ended
31st March,2017 Year ended
31st March,2016 Financing activities
Proceeds from issue of shares 0.01 - Short term loan taken/(repaid) from/to related party (net) (165.83) (53.63)Working Capital Borrowings from Banks/other short term loans (net) 421.82 1,319.94 Proceeds from long term Borrowings 1,081.44 9,950.16 Repayment of long term borrowings (1,958.79) (13,790.25)Dividend Paid (including tax thereon) - (0.80)Interest Paid (2,516.20) (2,656.02)
Net cash flows from (used in) financing activities (3,137.55) (5,230.60)Net increase (decrease) in cash and cash equivalents (184.77) 52.69 Cash and cash equivalents at the beginning of the year 322.68 269.99
Cash and cash equivalents at year end 137.90 322.68 Components of cash and cash equivalent
Cash on hand 0.44 0.91 Cheques/Drafts in hand - 4.71
Balances with banks:On current accounts 62.92 87.67 On deposits accounts with original maturity of less than three months 74.51 229.36 on others 0.03 0.03 Cash and bank balances 137.90 322.68
Cash and cash equivalents as per note 15 137.90 322.68
As per our report of even date For & on behalf of the Board of Directors
For Lodha & Co. Chartered Accountants Naveen Jindal Ravi UppalFirm Registration No. 301051E Chairman Managing Director & Group CEO
DIN: 00001523 DIN: 00025970N.K Lodha Partner Rajesh Bhatia Murli Manohar Purohit Membership No. 085155 Chief Financial Officer Company Secretary
Place: New DelhiDated: 23rd May, 2017
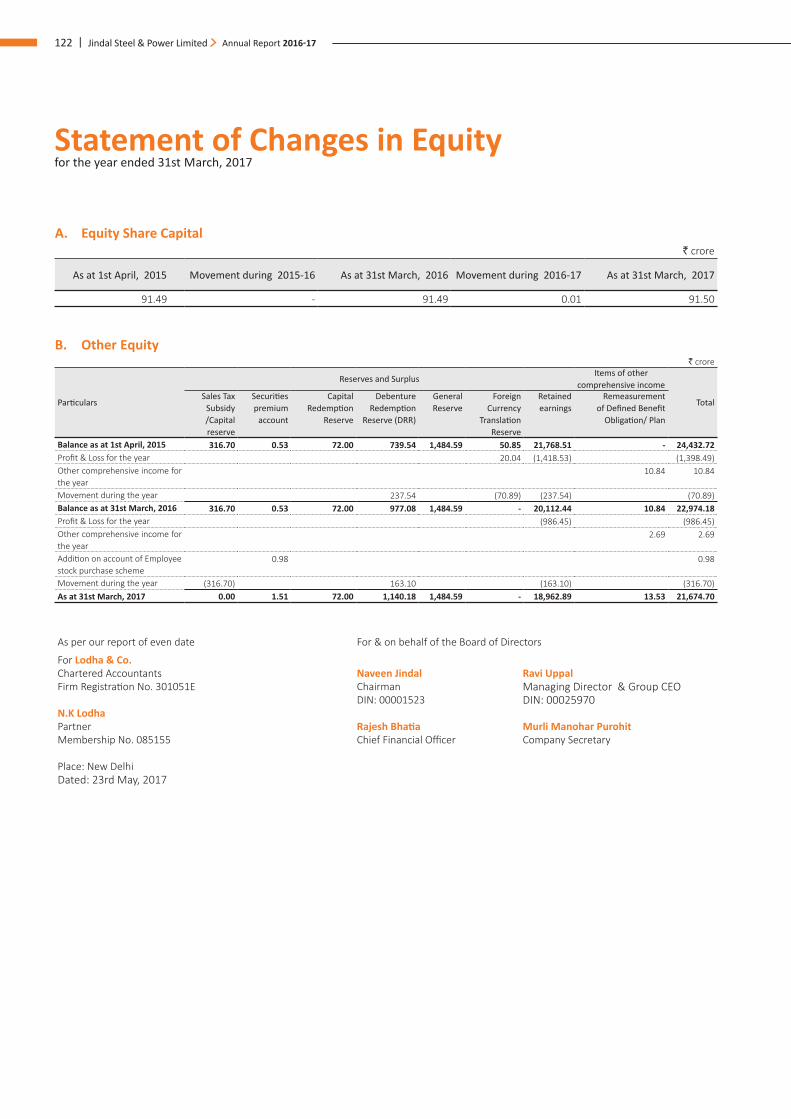
122 | Jindal Steel & Power Limited Annual Report 2016-17
Statement of Changes in Equity for the year ended 31st March, 2017
A. Equity Share Capital` crore
As at 1st April, 2015 Movement during 2015-16 As at 31st March, 2016 Movement during 2016-17 As at 31st March, 2017
91.49 - 91.49 0.01 91.50
B. Other Equity` crore
Particulars
Reserves and SurplusItems of other
comprehensive income
TotalSales Tax
Subsidy /Capital reserve
Securities premium
account
Capital Redemption
Reserve
Debenture Redemption
Reserve (DRR)
General Reserve
Foreign Currency
Translation Reserve
Retained earnings
Remeasurement of Defined Benefit
Obligation/ Plan
Balance as at 1st April, 2015 316.70 0.53 72.00 739.54 1,484.59 50.85 21,768.51 - 24,432.72 Profit & Loss for the year 20.04 (1,418.53) (1,398.49)Other comprehensive income for the year
10.84 10.84
Movement during the year 237.54 (70.89) (237.54) (70.89)Balance as at 31st March, 2016 316.70 0.53 72.00 977.08 1,484.59 - 20,112.44 10.84 22,974.18 Profit & Loss for the year (986.45) (986.45)Other comprehensive income for the year
2.69 2.69
Addition on account of Employee stock purchase scheme
0.98 0.98
Movement during the year (316.70) 163.10 (163.10) (316.70)As at 31st March, 2017 0.00 1.51 72.00 1,140.18 1,484.59 - 18,962.89 13.53 21,674.70
As per our report of even date For & on behalf of the Board of Directors
For Lodha & Co. Chartered Accountants Naveen Jindal Ravi UppalFirm Registration No. 301051E Chairman Managing Director & Group CEO
DIN: 00001523 DIN: 00025970N.K Lodha Partner Rajesh Bhatia Murli Manohar Purohit Membership No. 085155 Chief Financial Officer Company Secretary
Place: New DelhiDated: 23rd May, 2017
Notes to the financial statements as at and for the year ended 31st March, 2017
| 123Financial Statements Standalone Financials
1. OVERVIEW Jindal Steel & Power Limited (“the Company”) is one of the
India’s leading steel producers with significant presence in sectors like mining and power generation. It is listed on the National Stock Exchange of India and Bombay Stock Exchange in India. Its business is spread across India and overseas. The registered office is situated in the state of Haryana, the corporate office is situated in New Delhi and the manufacturing plants in India are in the states of Chhattisgarh, Odisha, Jharkhand etc. The Company has global presence through subsidiaries, mainly in Australia, Botswana, Cameroon, China, Dubai, Indonesia, Liberia, Mauritania, Mauritius, Mozambique, Madagascar, Namibia, South Africa, Sultanate of Oman, Tanzania and Zambia. There are several business initiatives running simultaneously across continents.
2. BASIS OF PREPARATION OF FINANCIAL STATEMENTS
The Company has adopted Indian Accounting Standards (the ‘Ind AS’) prescribed under section 133 of the Companies Act, 2013 (the ‘Act’), read with the Companies (Indian Accounting Standards) Rules, 2015 and the Companies (Indian Accounting Standards) (Amendment) Rules, 2016, with effect from 1st April 2016 with 1st April 2015 as the date of transition. Accordingly the financial statements have been prepared in accordance with the said Ind AS & Rules and other recognized accounting practices & policies to the extent applicable.
For all periods up to and including the year ended 31st March 2016, the Company had prepared its financial statements in accordance with accounting standards as prescribed under Section 133 of the Companies Act, 2013 (the ‘Act’) read with Rule 7 of the Companies (Accounts) Rules, 2014 (referred to as ‘Indian GAAP’). The Company has consistently applied the accounting policies used in the preparation of its opening Ind AS Balance Sheet at April 1, 2015 throughout all periods presented, as if these policies had always been in effect and are covered by Ind AS 101 ‘’First-time adoption of Indian Accounting Standards’’. The transition was carried out from accounting principles generally accepted in India (‘’Indian GAAP’’) which is considered as the previous GAAP, as defined in Ind AS 101. The reconciliation of effects of the transition from Indian GAAP on the equity as at April 1, 2015 and March 31, 2016 and on the net profit and material adjustments to cash flows for the year ended March 31, 2016 is disclosed in Note no 66 to these financial statements.
The standalone financial statements provide comparative information in respect of previous year. In addition, the company presents balance sheet as at the beginning of previous year which is the transition date to Ind AS.
The significant accounting policies used in preparing the financial statements are set out in Note no 3 of the Notes to the Standalone Financial Statements.
The preparation of the financial statements in conformity with Indian Accounting Standards (Ind AS) requires management to make judgments, estimates and assumptions that affect the reported amounts of revenues, expenses, assets and liabilities, and the accompanying disclosures at the date of the financial statements. The judgments, estimates and underlying assumptions are reviewed on an ongoing basis. Revisions to accounting estimates are recognised in the period in which the estimate is revised if the revision effects only that period or in the period of the revision and future periods if the revision affects both current and future years and, if material, their effects are disclosed in the notes to the financial statements.Actual results could vary from these estimates. (refer Note no. 4 on critical accounting estimates, assumptions and judgments).
3. SIGNIFICANT ACCOUNTING POLICIES3.1 Basis of Measurement These financial statements have been prepared under the
historical cost convention on the accrual basis, except for the following assets and liabilities which have been measured fair value:
Property, Plant & Equipment (at fair value as deemed cost as at 1st April 2015),
Derivative financial instruments, Defined benefit plans- plan assets measured at fair value, Financial assets and liabilities except certain investments
and borrowings carried at amortised cost (refer accounting policy regarding financial instruments).
Share based payments
The financial statements are presented in Indian Rupees (`) which is the Company’s functional and presentation currency and all amounts are rounded to the nearest crore(` 00,00,000) and two decimals thereof, exceptas otherwise stated.
3.2 Fair Value Measurement Fair value is the price that would be received to sell an asset
or paid to transfer a liability in an orderly transaction between market participants at the measurement date.
The fair value of an asset or a liability is measured using the assumptions that market participants would use when pricing the asset or liability, assuming that market participants act in their economic best interest.
Notes to the financial statements as at and for the year ended 31st March, 2017
124 | Jindal Steel & Power Limited Annual Report 2016-17
A fair value measurement of a non- financial asset takes in to account a market participant’s ability to generate economic benefits by using the asset in its highest and best use or by selling it to another market participant that would use the asset in its highest and best use.
For the purpose of fair value disclosures, the Company has determined classes of assets and liabilities on the basis of the nature, characteristics and risks of the asset or liability and the level of the fair value hierarchy in which they fall.
3.3 Property, plant and equipment On transition to Ind AS, the Company has adopted optional
exception under Ind AS 101 to measure Property, Plant and Equipment at fair value. Consequently the fair value has been assumed to be deemed cost of Property, Plant and Equipment on the date of transition. Subsequently Property, Plant and Equipment are stated at cost less accumulated depreciation and impairment losses, if any. Costs include costs of acquisitions or constructions including incidental expenses thereto, borrowing costs, and other attributable costs of bringing the asset to its working condition for its intended use and are net of available duty/tax credits.
Subsequent expenditure relating to property, plant and equipment is capitalized only when it is probable that future economic benefits associated with these will flow to the Company and the cost of the item can be measured reliably. All other repair and maintenance costs are recognised in Statement of Profit & Loss as incurred.
Gains or losses arising from discard/sale of Property, Plant and Equipment are measured as the difference between the net disposal proceeds and the carrying amount of the asset and are recognized in the statement of profit and loss when the asset is discarded / sold.
The Company adjusts exchange differences arising on translation/settlement of long-term foreign currency monetary items as referred in Policy for Foreign exchange transactions. (Refer Note no 5)
On transition to Ind AS, the Company has adopted fair value as deemed cost of property, plant and equipment as at 1st April 2015 under Ind AS 101 and revisited and revised useful life of various categories of assets. Subsequent to adoption of fair value as deemed cost of property, plant and equipment as at 1st April 2015 under Ind AS 101, property, plant and equipment are measured in accordance with Ind AS 16’s requirements for cost model.
The residual values, useful lives and methods of depreciation of property, plant and equipment are reviewed at each financial year end and adjusted prospectively.
Capital work-in-progress: Expenditure related to and incurred on implementation of new/expansion-cum-modernisation projects is included under capital work-in-progress until the relevant assets are ready for its intended use. All other expenditure (including trial run / test run expenditures) during construction / erection period (net of income) are shown as part of pre-operative expenditure pending allocation / capitalization and the same is allocated to the respective asset on completion of its construction/erection.
Depreciation: Depreciation on property, plant and equipment is provided on straight-line method (SLM) as per the useful life of assets, as estimated by the management / independent professional, which is generally in line with Schedule II to the Companies Act, 2013 except for certain assets specified below:
1. Plant and equipment: Power generating units: 40-60 years Certain continuous process plants: 25-48 years Certain Other Plant and equipments: 15-35 years
2. Certain non-factory buildings: 18-30 years
Subsequent to fair value as deemed cost of property, plant and equipment as at 1st April 2015 under Ind AS 101, depreciation is charged on fair valued amount less estimated salvage value.
Based on management evaluation, depreciation rates currently used fairly reflect its estimate of the useful lives and residual values of property, plant and equipment.
Certain plant and machinery have been considered as continuous process plant on the basis of technical assessment and depreciation on the same is provided for accordingly.
Leasehold land is amortized on a straight line basis over the period of lease.
3.4 Intangible assets Capital expenditure on purchase and development of
identifiable on monetary assets without physical substance is recognized as Intangible Assets when:
it is probable that the expected future economic benefits that are attributable to the asset will flow to the entity; and
the cost of the asset can be measured reliably.
Notes to the financial statements as at and for the year ended 31st March, 2017
| 125Financial Statements Standalone Financials
Such Intangible assets are stated at cost less accumulated amortization and impairment losses, if any.
Intangible Assets are amortized on straight-line method over the expected duration of benefits. The amortization period and the amortization method for an intangible asset with a finite useful life are reviewed at least at the end of each financial year. Changes in the expected useful life or the expected pattern of consumption of future economic benefits embodied in the assets are considered to modify the amortization period or method, as appropriate, and are treated as changes in accounting estimates and adjusted prospectively.
Estimated useful lives of intangible assets are as follows:
Computer software - 1 to 10 years Design & Drawings- 5 years Licenses - 25 years
3.5 Intangible assets under development Mines development expenditure incurred in respect of new
iron ore/coal and likewise mines are shown under ‘Intangible assets under development’. On mines being ready for intended use, this amount is transferred to appropriate head under intangible assets and amortized over a period of ten years starting from the said year or the future expected extraction period of the reserves based on actual extraction till date, whichever is shorter.
Development expenditure incurred on an individual project is recognized as an intangible asset when the Company can demonstrate all the following:
The technical feasibility of completing the intangible asset so that it will be available for use or sale
Its intention to complete the asset Its ability to use or sell the asset How the asset will generate future economic benefits The availability of adequate resources to complete the
development and to use or sell the asset The ability to measure reliably the expenditure
attributable to the intangible asset during development.
3.6 Biological assets Biological assets are measured at fair value. Feeding and
maintenance costs are expensed as incurred.
3.7 Investment property Investment properties are measured at cost, including
transaction costs less accumulated depreciation and impairment losses, if any.
3.8 Impairment The carrying amount of Property, plant and equipment,
Intangible assets and Investment property are reviewed at each Balance Sheet date to assess impairment, if any based on internal / external factors. An asset is treated as impaired when the carrying cost of asset or exceeds its recoverable value being higher of value in use and net selling price. An impairment loss is recognized as an expense in the Statement of Profit & Loss in the year in which an asset is identified as impaired. The impairment loss recognized in prior accounting period is reversed, if there has been an improvement in recoverable amount.
3.9 Leases The determination of whether an arrangement is, or contains,
a lease is based on the substance of the arrangement at the inception date, whether fulfillment of the arrangement is dependent on the use of a specific asset or assets or the arrangement conveys a right to use the asset, even if that is not explicitly specified in an arrangement.
The rental payments under operating lease are recognized as expense in the statement of profit and loss on a straight-line basis over the lease term.
3.10 Borrowing Costs Borrowing costs include interest and other costs that the
Company incurs in connection with the borrowing of funds.
Borrowing costs related to a qualifying asset that necessarily takes a substantial period of time to get ready for its intended use is worked out on the basis of actual utilization of funds out of project specific loans and/or other borrowings to the extent identifiable with the qualifying asset and is capitalized with the cost of qualifying asset, using the effective interest method. All other borrowing costs are charged to statement of profit and loss.
In case of significant long term loans, other costs incurred in connection with the borrowing of funds are amortized over the period of respective Loan.
3.11 Valuation of Inventories Inventories are valued at lower of cost, computed on weighted
average basis, or net realizable value. Cost of inventories includes in case of raw material, cost of purchase and incidental expenses; in case of work-in-progress, estimated direct cost and appropriate proportion of administrative and other overheads; in case of finished goods, estimated direct cost and appropriate administrative and other overheads and excise duty; and in case of traded goods, cost of purchase and other costs.
Notes to the financial statements as at and for the year ended 31st March, 2017
126 | Jindal Steel & Power Limited Annual Report 2016-17
Scrap is valued at estimated realizable value. However raw materials, components, stores and spares held for use in the production of finished goods are not written down below cost if the finished products are expected to be sold at or above cost.
Net realizable value is the estimated selling price in the ordinary course of business, less estimated costs of completion and estimated costs necessary to make the sale.
Initial cost of inventories includes the transfer of gains and losses on qualifying cash flow hedges, recognised in OCI, in respect of the purchases of raw materials.
3.12 Foreign Currency Transactions Transactions in foreign currencies are initially recorded
by the Company at rates prevailing at the date of the transaction. Subsequently, monetary items are translated at closing exchange rates of balance sheet date and the resulting exchange difference recognised in profit or loss. Differences arising on settlement of monetary items are also recognised in profit or loss. Non-monetary items that are measured in terms of historical cost in a foreign currency are translated using the exchange rates at the dates of the transaction. Non-monetary items (Other than investment in shares of Subsidiaries, Joint Ventures and Associates) carried at fair value that are denominated in foreign currencies are translated at the exchange rates prevailing at the date when the fair value was determined. Exchange component of the gain or loss arising on fair valuation of non-monetary items is recognised in line with the gain or loss of the item that gave rise to such exchange difference.
The Company has availed the exemption available in Ind AS 101, to continue capitalisation of foreign currency fluctuation on long term foreign currency monetary liabilities outstanding on transition date.
3.13 Revenue Recognition Revenue is measured at fair value of the consideration
received or receivable. The Company recognizes revenuefrom sale of products net of discounts, sales incentives, rebates granted, returns, VAT, sales tax and duties when the products are delivered to customer or when delivered to a carrier for export sale, which is when significant risks and rewards of ownership pass to the customer, Sale of product is presented gross of manufacturing taxes like excise duty, wherever applicable.
Income from aviation and other services is accounted for at the time of completion of service and billing thereof.
Revenue from sale of power is recognized when delivered and measured based on bilateral contractual arrangements.
Export benefits available are accounted for in the year of export, to the extent the realisation of the same is not considered uncertain by the Company.
Government grants/ subsidies are recognised at fair value where there is reasonable certainty that the grant /subsidy will be received and all attached conditions will be complied with. The grant/subsidy is recognised in the statement of profit and loss on a systematic basis over the periods in which the Company recognises as expenses the related costs for which the grants are intended to compensate.
3.14 Inter-Division Transfers/Captive sales Inter-division transfer of independent marketable
products, produced by various divisions and used for further production/sales is accounted for at approximate prevailing market price/other appropriate price.
Captive sales are in regard to products produced by various divisions and used for capital projects. These are transferred at cost to manufacture.
The value of inter-divisional transfer and captive sales is netted off from sales and corresponding cost under cost of materials consumed and total expenses respectively. The same is shown as a contra item in the statement of profit and loss.
Any unrealized profit on unsold/unconsumed stocks is eliminated while valuing the inventories.
3.15 Other Income Claims receivable The quantum of accruals in respect of claims receivable
such as from railways, insurance, electricity, customs, excise and the like are accounted for on accrual basis to the extent there is reasonable certainty of realization.
Dividend Income from Investment Dividend income from investments is recognised when
the right to receive payment has been established.
Interest Income Interest income is recognized on a time proportion basis
taking into account the amount outstanding and the applicable interest rate. Interest income is netted off
Notes to the financial statements as at and for the year ended 31st March, 2017
| 127Financial Statements Standalone Financials
from interest cost under the head “Interest Cost (Net)” in the statement of profit and loss.
3.16 Employee Benefits Short term employee benefits are recognized as an
expense in the Statement of Profit and Loss of the year in which the related services are rendered.
Payment to defined contribution plan is recognized as expense when employees have rendered services. Remeasurements of the defined benefit liability/asset comprising actuarial gains and losses are recognized in other comprehensive income.
The liability for gratuity, a defined benefit plan is determined using the projected unit credit method, on the basis of actuarial valuations carried out by third party actuaries at each balance sheet date.Remeasurements comprising actuarial gains and losses arising from experience adjustments and changes in actuarial assumptions are charged / credited to Other Comprehensive Income in period in which they arise. Other costs are accounted for in Statement of Profit and Loss.
Liability in respect of compensated absences due or expected to be availed within one year from the Balance Sheet date is estimated on the basis of valuation carried out by third party actuaries at each Balance Sheet date.Remeasurements comprising actuarial gains and losses arising from experience adjustments and changes in actuarial assumptions are charged / credited to profit and loss in the period in which they arise.
Share based compensation benefits are recognised in the profit and loss in the year in which the same is granted as per Employees Share Purchase Scheme of the Company.
3.17 Research and Development expenditure Revenue expenditure on research is expensed as incurred.
Capital expenditure incurred on research is added to the cost of Property, plant and equipment/ respective intangible asset.
3.18 Taxes on Income Tax expense comprises current and deferred tax. Current
income-tax is measured at the amount expected to be paid to the tax authorities in accordance with the Income-tax Act, 1961 enacted in India and tax laws prevailing in the respective tax jurisdictions where the company operates. The tax rates and tax laws used to compute the amount are those that are enacted or substantively enacted, at the reporting date.
Deferred tax is provided on temporary difference arising between the tax bases of assets & liabilities and their carrying amounts for financial reporting purposes at the reporting date. Deferred tax is measured using the tax rate that are expected to apply in the year when the asset is realized or the liability is settled based on the tax rates and the tax laws enacted or substantively enacted at the reporting date. Deferred tax relating to items recognized directly in equity/OCI is recognized in equity/OCI and not in the statement of profit and loss.
Deferred tax asset is recognized to the extent that it is probable that sufficient future taxable profit will be available against which the deductible temporary differences and the carry forward unused tax credits and unused tax losses can be utilized. The carrying amount of deferred tax assets is reviewed at each reporting date and reduced to the extent that it is no longer probable that sufficient taxable profit will be available to allow all or part of the deferred tax asset to be utilized.
In the situations where the Company is entitled to a tax holiday under the Income-tax Act, 1961 enacted in India or tax laws prevailing in the respective tax jurisdictions where it operates, no deferred tax [asset or liability] is recognized in respect of temporary differences which reverse during the tax holiday period.
Minimum Alternate tax (MAT) credit is recognized as an asset only when and to the extent there is convincing evidence that the Company will pay normal income tax during the specified period.
3.19 Provisions, contingent liabilities, commitments and contingent assets
Provisions are recognized for present obligations of uncertain timing or amount arising as a result of a past event where a reliable estimate can be made and it is probable that an outflow of resources embodying economic benefits will be required to settle the obligation.
Where it is not probable that an outflow of resources embodying economic benefits will be required or the amount cannot be estimated reliably, the obligation is disclosed as a contingent liability and commitments, unless the probability of outflow of resources embodying economic benefits is remote. Contingent assets are not recognized but disclosed in the financial statements when an inflow of economic benefits is probable.
If the effect of the time value of money is material, provisions are discounted using a current pre-tax rate that reflects, when
Notes to the financial statements as at and for the year ended 31st March, 2017
128 | Jindal Steel & Power Limited Annual Report 2016-17
appropriate, the risks specific to the liability. When discounting is used, the increase in the provision due to the passage of time is recognised as a finance cost.
3.20 Earnings per share Basic earnings per share is computed using the net profit/
(loss) for the year (without taking impact of OCI) attributable to the equity shareholders’ and weighted average number of shares outstanding during the year. The weighted average numbers of shares also includes fixed number of equity shares that are issuable on conversion of compulsorily convertible preference shares, debentures or any other instrument, from the date consideration is received (generally the date of their issue)of such instruments. The diluted EPS is calculated on the same basis as basic EPS, after adjusting for the effect of potential dilutive equity shares unless impact is anti-dilutive.
3.21 Segment Reporting Identification of Operating segments The Company’s operating businesses are organized and
managed separately according to the nature of products manufactured and services provided, with each segment representing a strategic business unit that offers different products and as reviewed by the Chief operating decision maker of the Company.
Inter-segment transfers The Company recognises inter-segment sales and
transfers as if they were to third parties at current market prices.
Allocation of common costs Common allocable costs are allocated to each segment
on reasonable basis.
Unallocated items It includes general administrative expenses, corporate
& other office expenses, income that arises at the enterprise level and relate to enterprise as a whole being not allocable to any business segment and also un-allocable assets & liabilities that relate to the company as whole and not allocable to any segment.
Segment Policies The Company prepares its segment information in
conformity with the accounting policies adopted for preparing and presenting the financial statements of the Company as a whole.
3.22 Financial Instruments A financial instrument is any contract that gives rise to a
financial asset of one entity and a financial liability or equity instrument of another entity.
Initial Recognition The Company recognizes financial assets and financial
liabilities when it becomes a party to the contractual provisions of the instrument. All financial assets and liabilitiesare recognized at fair value on initial recognition. Transaction costs that are directly attributable to the acquisition or release of financial assets and financial liabilities respectively, which are not at fair value through profit or loss, are added to the fair value of underlying financial assets and liabilities on initial recognition. Trade receivables and trade payables that do not contain a significant financing component are initially measured at their transaction price.
Subsequent Measurement a. Non- Derivative Financial Instruments Financial assets carried at amortised cost A financial asset is subsequently measured at
amortised cost which is held with objective to hold the asset in order to collect contractual cash flows and the contractual terms of the financial asset give rise on specified dates to cash flows that are solely payments of principal and interest on the principal amount outstanding.
Financial assets at fair value through other comprehensive income
A financial asset is subsequently measured at fair value through other comprehensive income which is held with objective to achieve both collecting contractual cash flows and selling financial assets and the contractual terms of the financial asset give rise on specified dates to cash flows that are solely payments of principal and interest on the principal amount outstanding. The Company has made an election for its investments which are classified as equity instruments (other than investment in shares of Subsidiaries, Joint Ventures and Associates) to present the subsequent changes in fair value through profit and loss account
Financial assets at fair value through profit or loss A financial asset which is not classified in any of
Notes to the financial statements as at and for the year ended 31st March, 2017
| 129Financial Statements Standalone Financials
the above categories are subsequently fair valued through profit or loss. The Company has elected to measure its investments which are classified as equity instruments (other than investment in shares of Subsidiaries, Joint Ventures and Associates) at fair value through profit and loss account.
Impairment of financial assets The Company recognizes loss allowances using the
expected credit loss (ECL) model for the financial assets which are not fair valued through profit or loss. For impairment purposes significant financial assets are tested on an individual basis, other financial assets are assessed collectively in groups that share similar credit risk characteristics.
The Company recognises lifetime expected losses for all trade receivables. For all other financial assets, expected credit losses are measured at an amount equal to the 12 month expected credit losses or at an amount equal to the life time expected credit losses if the credit risk on the financial asset has increased significantly since initial recognition. The amount of expected credit losses (or reversal) that is required to adjust the loss allowance at the reporting date to the amount that is required to be recognised is recognized as an impairment gain or loss in profit or loss.
The Company follows ‘simplified approach’ for the recognition of impairment loss allowance on trade and other receivables.
The application of simplified approach does not require the Company to track changes in credit risk. Rather, it recognises impairment loss allowance based on lifetime ECLs at each reporting date, right from its initial recognition.
The Company uses a provision matrix to determine impairment loss allowance on portfolio of its trade receivables. The provision matrix is based on its historically observed default rates over the expected life of the receivables and is adjusted for forward-looking estimates. At every reporting date, the historical observed default rates are updated and changes in the forward-looking estimates are analysed.
Financial liabilities Financial liabilities are subsequently carried at
amortized cost using the effective interest method. Financial liabilities at fair value through profit and loss includes financial liability held for trading and financial liability designated upon initial recognition as at fair value through profit and loss.
Investment in Subsidiaries, Associates and Joint Ventures
Investment in equity shares of subsidiaries, associates and joint ventures is carried at cost in the standalone financial statements.
Cash and cash equivalents Cash and cash equivalents consist of cash, bank
balances in currents and short-term highly liquid investments that are readily convertible to known amounts of cash and which are subject to an insignificant risk of changes in value.
b. Derivative Financial Instruments Derivative instruments such as forward currency
contracts are used to hedge foreign currency risks, and are initially recognized at their fair values on the date on which a derivative contract is entered into and are subsequently re-measured at fair value on each reporting date. A hedge of foreign currency risk of a firm commitment is accounted for as a fair value hedge. Any gains or losses arising from changes in the fair value of derivatives are taken directly to Statement of Profit and Loss. However, if hedging instrument hedges an equity instrument for which the Company has elected to present changes as at fair value through other comprehensive income, then fair value changes are recognized in Other Comprehensive Income.
Derecognition The Company derecognizes a financial asset when the
contractual rights to the cash flows from the financial asset expire or it transfers the financial asset and the transfer qualifies for derecognitionas per Ind AS 109. A financial liability (or a part of a financial liability) is derecognized from the company’s balance sheet when the obligation specified in the contract is discharged or cancelled or expires.
Notes to the financial statements as at and for the year ended 31st March, 2017
130 | Jindal Steel & Power Limited Annual Report 2016-17
Offsetting of financial instruments Financial assets and financial liabilities are offset and
the net amount is reported in the balance sheet if there is a currently enforceable legal right to offset the recognised amounts and there is an intention to settle on a net basis, to realise the assets and settle the liabilities simultaneously.
Reclassification of financial assets The Company determines classification of financial
assets and liabilities on initial recognition. After initial recognition, no reclassification is made for financial assets which are equity instruments and financial liabilities. For financial assets which are debt instruments, a reclassification is made only if there is a change in the business model for managing those assets. Changes to the business model are expected to be infrequent. The company’s senior management determines change in the business model as a result of external or internal changes which are significant to the Company’s operations. Such changes are evident to external parties. A change in the business model occurs when the company either begins or ceases to perform an activity that is significant to its operations. If the company reclassifies financial assets, it applies the reclassification prospectively from the reclassification date which is the first day of the immediately next reporting period following the change in business model. The company does not restate any previously recognised gains, losses (including impairment gains or losses) or interest.
4. CRITICAL ACCOUNTING ESTIMATES,ASSUMPTIONS AND JUDGEMENTS
4.1 Property, plant and equipment External advisor and/or internal technical team assesses the
remaining useful life and residual value of property, plant and equipment. Management believes that the assigned useful lives and residual values are reasonable.
4.2 Intangibles Internal technical and user team assess the remaining useful
lives of Intangible assets. Management believes that assigned useful lives are reasonable.All Intangibles are carried at net book value on transition.
4.3 Mine restoration obligation In determining the cost of the mine restoration obligation the
Company uses technical estimates to determine the expected cost to restore the mines and the expected timing of these costs.
4.4 Liquidated damages Liquidated damages payable or receivable are estimated and
recorded as per contractual terms/management assertion; estimate may vary from actuals as levy by customer/vendor.
4.5 Other estimates The Company estimates the un-collectability of accounts
receivable by analyzing historical payment patterns, customer concentrations, customer credit-worthiness and current economic trends. If the financial condition of a customer deteriorates, additional allowances may be required. Similarly, the Company provides for inventory obsolescence, excess inventory and inventories with carrying values in excess of net realizable value based on assessment of the future demand, market conditions and specific inventory management initiatives. In all cases inventory is carried at the lower of historical cost and net realizable value.
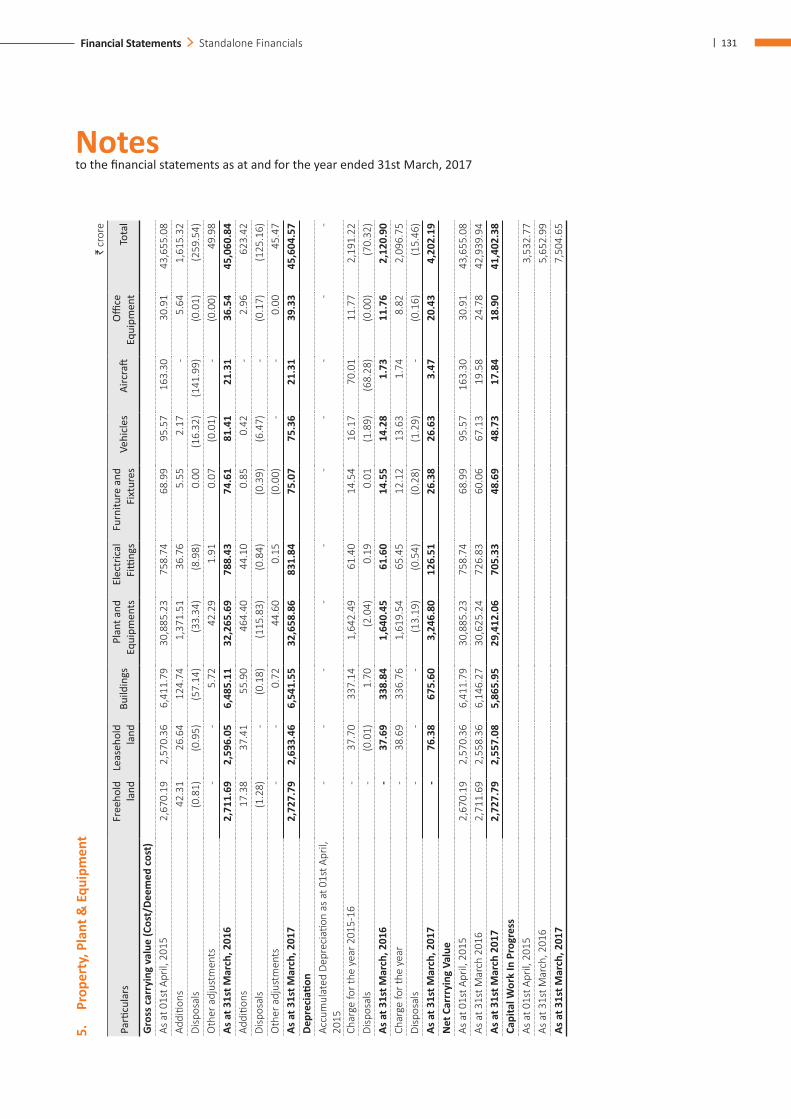
Notes to the financial statements as at and for the year ended 31st March, 2017
| 131Financial Statements Standalone Financials
5.
Prop
erty
, Pla
nt &
Equ
ipm
ent
` cr
ore
Parti
cula
rsFr
eeho
ld
land
Le
aseh
old
land
Build
ings
Pl
ant a
nd
Equi
pmen
tsEl
ectr
ical
Fi
tting
sFu
rnitu
re a
nd
Fixt
ures
Ve
hicl
esAi
rcra
ftO
ffice
Eq
uipm
ent
Tota
l
Gro
ss c
arry
ing
valu
e (C
ost/
Deem
ed c
ost)
As a
t 01s
t Apr
il, 2
015
2,6
70.1
9 2
,570
.36
6,4
11.7
9 3
0,88
5.23
7
58.7
4 6
8.99
9
5.57
1
63.3
0 3
0.91
4
3,65
5.08
Ad
ditio
ns 4
2.31
2
6.64
1
24.7
4 1
,371
.51
36.
76
5.5
5 2
.17
- 5
.64
1,6
15.3
2 Di
spos
als
(0.8
1) (0
.95)
(57.
14)
(33.
34)
(8.9
8) 0
.00
(16.
32)
(141
.99)
(0.0
1) (2
59.5
4)O
ther
adj
ustm
ents
- -
5.7
2 4
2.29
1
.91
0.0
7 (0
.01)
- (0
.00)
49.
98
As a
t 31s
t Mar
ch, 2
016
2,7
11.6
9 2
,596
.05
6,4
85.1
1 3
2,26
5.69
7
88.4
3 7
4.61
8
1.41
2
1.31
3
6.54
4
5,06
0.84
Ad
ditio
ns 1
7.38
3
7.41
5
5.90
4
64.4
0 4
4.10
0
.85
0.4
2 -
2.9
6 6
23.4
2 Di
spos
als
(1.2
8) -
(0.1
8) (1
15.8
3) (0
.84)
(0.3
9) (6
.47)
- (0
.17)
(125
.16)
Oth
er a
djus
tmen
ts -
- 0
.72
44.
60
0.1
5 (0
.00)
- -
0.0
0 4
5.47
As
at 3
1st M
arch
, 201
7 2
,727
.79
2,6
33.4
6 6
,541
.55
32,
658.
86
831
.84
75.
07
75.
36
21.
31
39.
33
45,
604.
57
Depr
ecia
tion
Accu
mul
ated
Dep
reci
ation
as
at 0
1st A
pril,
20
15 -
- -
- -
- -
- -
-
Char
ge fo
r the
yea
r 201
5-16
- 3
7.70
3
37.1
4 1
,642
.49
61.
40
14.
54
16.
17
70.
01
11.
77
2,1
91.2
2 Di
spos
als
- (0
.01)
1.7
0 (2
.04)
0.1
9 0
.01
(1.8
9) (6
8.28
) (0
.00)
(70.
32)
As a
t 31s
t Mar
ch, 2
016
- 3
7.69
3
38.8
4 1
,640
.45
61.
60
14.
55
14.
28
1.7
3 1
1.76
2
,120
.90
Char
ge fo
r the
yea
r -
38.
69
336
.76
1,6
19.5
4 6
5.45
1
2.12
1
3.63
1
.74
8.8
2 2
,096
.75
Disp
osal
s -
- -
(13.
19)
(0.5
4) (0
.28)
(1.2
9) -
(0.1
6) (1
5.46
)As
at 3
1st M
arch
, 201
7 -
76.
38
675
.60
3,2
46.8
0 1
26.5
1 2
6.38
2
6.63
3
.47
20.
43
4,2
02.1
9 N
et C
arrr
ying
Val
ueAs
at 0
1st A
pril,
201
5 2
,670
.19
2,5
70.3
6 6
,411
.79
30,
885.
23
758
.74
68.
99
95.
57
163
.30
30.
91
43,
655.
08
As a
t 31s
t Mar
ch 2
016
2,7
11.6
9 2
,558
.36
6,1
46.2
7 3
0,62
5.24
7
26.8
3 6
0.06
6
7.13
1
9.58
2
4.78
4
2,93
9.94
As
at 3
1st M
arch
201
7 2
,727
.79
2,5
57.0
8 5
,865
.95
29,
412.
06
705
.33
48.
69
48.
73
17.
84
18.
90
41,
402.
38
Capi
tal W
ork
In P
rogr
ess
As a
t 01s
t Apr
il, 2
015
3,5
32.7
7 As
at 3
1st M
arch
, 201
6 5
,652
.99
As a
t 31s
t Mar
ch, 2
017
7,5
04.6
5
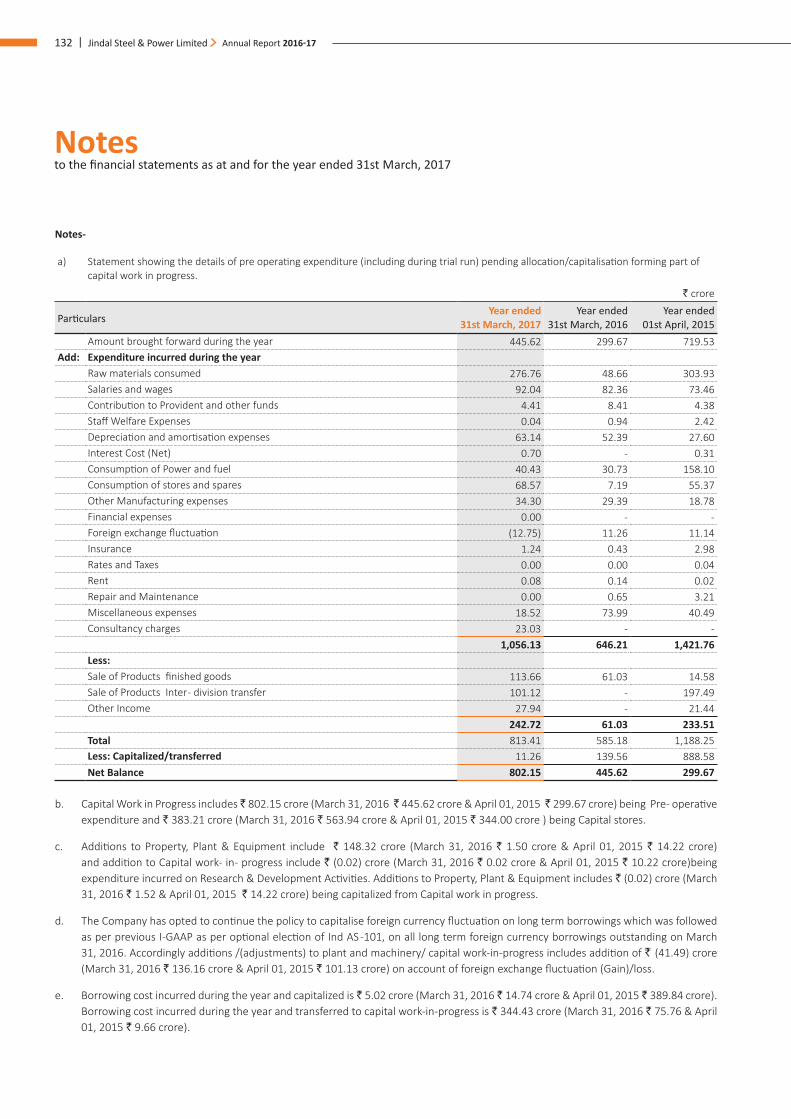
Notes to the financial statements as at and for the year ended 31st March, 2017
132 | Jindal Steel & Power Limited Annual Report 2016-17
Notes-
a) Statement showing the details of pre operating expenditure (including during trial run) pending allocation/capitalisation forming part of capital work in progress.
` crore
ParticularsYear ended
31st March, 2017Year ended
31st March, 2016Year ended
01st April, 2015Amount brought forward during the year 445.62 299.67 719.53
Add: Expenditure incurred during the yearRaw materials consumed 276.76 48.66 303.93 Salaries and wages 92.04 82.36 73.46 Contribution to Provident and other funds 4.41 8.41 4.38 Staff Welfare Expenses 0.04 0.94 2.42 Depreciation and amortisation expenses 63.14 52.39 27.60 Interest Cost (Net) 0.70 - 0.31 Consumption of Power and fuel 40.43 30.73 158.10 Consumption of stores and spares 68.57 7.19 55.37 Other Manufacturing expenses 34.30 29.39 18.78 Financial expenses 0.00 - - Foreign exchange fluctuation (12.75) 11.26 11.14 Insurance 1.24 0.43 2.98 Rates and Taxes 0.00 0.00 0.04 Rent 0.08 0.14 0.02 Repair and Maintenance 0.00 0.65 3.21 Miscellaneous expenses 18.52 73.99 40.49 Consultancy charges 23.03 - -
1,056.13 646.21 1,421.76 Less: Sale of Products finished goods 113.66 61.03 14.58 Sale of Products Inter - division transfer 101.12 - 197.49 Other Income 27.94 - 21.44
242.72 61.03 233.51 Total 813.41 585.18 1,188.25 Less: Capitalized/transferred 11.26 139.56 888.58 Net Balance 802.15 445.62 299.67
b. Capital Work in Progress includes ̀ 802.15 crore (March 31, 2016 ̀ 445.62 crore & April 01, 2015 ̀ 299.67 crore) being Pre- operative expenditure and ` 383.21 crore (March 31, 2016 ` 563.94 crore & April 01, 2015 ` 344.00 crore ) being Capital stores.
c. Additions to Property, Plant & Equipment include ` 148.32 crore (March 31, 2016 ` 1.50 crore & April 01, 2015 ` 14.22 crore) and addition to Capital work- in- progress include ` (0.02) crore (March 31, 2016 ` 0.02 crore & April 01, 2015 ` 10.22 crore)being expenditure incurred on Research & Development Activities. Additions to Property, Plant & Equipment includes ` (0.02) crore (March 31, 2016 ` 1.52 & April 01, 2015 ` 14.22 crore) being capitalized from Capital work in progress.
d. The Company has opted to continue the policy to capitalise foreign currency fluctuation on long term borrowings which was followed as per previous I-GAAP as per optional election of Ind AS -101, on all long term foreign currency borrowings outstanding on March 31, 2016. Accordingly additions /(adjustments) to plant and machinery/ capital work-in-progress includes addition of ` (41.49) crore (March 31, 2016 ` 136.16 crore & April 01, 2015 ` 101.13 crore) on account of foreign exchange fluctuation (Gain)/loss.
e. Borrowing cost incurred during the year and capitalized is ` 5.02 crore (March 31, 2016 ` 14.74 crore & April 01, 2015 ` 389.84 crore). Borrowing cost incurred during the year and transferred to capital work-in-progress is ` 344.43 crore (March 31, 2016 ` 75.76 & April 01, 2015 ` 9.66 crore).
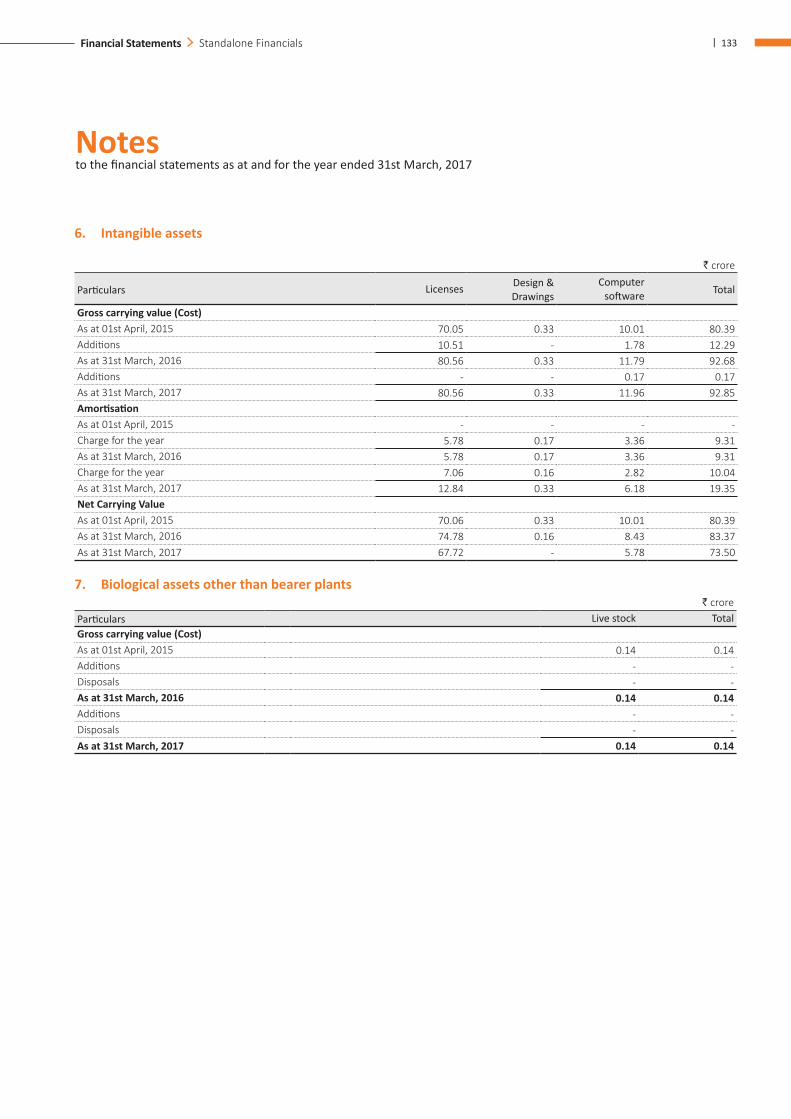
Notes to the financial statements as at and for the year ended 31st March, 2017
| 133Financial Statements Standalone Financials
6. Intangible assets
` crore
Particulars Licenses Design & Drawings
Computer software Total
Gross carrying value (Cost)As at 01st April, 2015 70.05 0.33 10.01 80.39 Additions 10.51 - 1.78 12.29 As at 31st March, 2016 80.56 0.33 11.79 92.68 Additions - - 0.17 0.17 As at 31st March, 2017 80.56 0.33 11.96 92.85 AmortisationAs at 01st April, 2015 - - - - Charge for the year 5.78 0.17 3.36 9.31 As at 31st March, 2016 5.78 0.17 3.36 9.31 Charge for the year 7.06 0.16 2.82 10.04 As at 31st March, 2017 12.84 0.33 6.18 19.35 Net Carrying ValueAs at 01st April, 2015 70.06 0.33 10.01 80.39 As at 31st March, 2016 74.78 0.16 8.43 83.37 As at 31st March, 2017 67.72 - 5.78 73.50
7. Biological assets other than bearer plants ` crore
Particulars Live stock TotalGross carrying value (Cost)As at 01st April, 2015 0.14 0.14 Additions - - Disposals - - As at 31st March, 2016 0.14 0.14 Additions - - Disposals - - As at 31st March, 2017 0.14 0.14
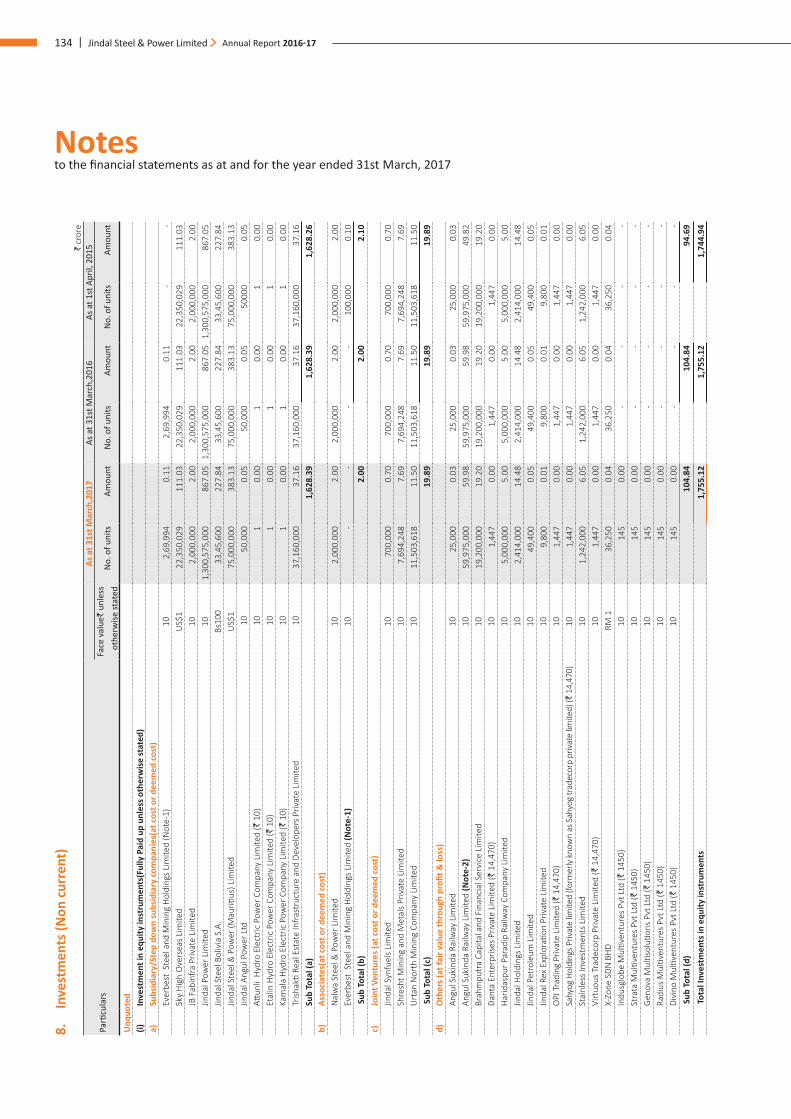
Notes to the financial statements as at and for the year ended 31st March, 2017
134 | Jindal Steel & Power Limited Annual Report 2016-17
8.
Inve
stm
ents
(Non
cur
rent
)`
cror
e
Parti
cula
rsAs
at 3
1st M
arch
,201
7As
at 3
1st M
arch
,201
6As
at 1
st A
pril,
201
5Fa
ce v
alue
` un
less
ot
herw
ise st
ated
No.
of u
nits
Amou
ntN
o. o
f uni
tsAm
ount
No.
of u
nits
Amou
nt
Unq
uote
d(i)
Inve
stm
ent i
n eq
uity
inst
rum
ents
(Ful
ly P
aid
up u
nles
s oth
erw
ise
stat
ed)
a)Su
bsid
iary
/Ste
p do
wn
subs
idia
ry c
ompa
nies
(at c
ost o
r dee
med
cos
t)Ev
erbe
st S
teel
and
Min
ing
Hol
ding
s Li
mite
d (N
ote-
1)10
2,6
9,99
4 0
.11
2,69
,994
0.1
1 -
- Sk
y H
igh
Ove
rsea
s Li
mite
d U
S$1
22,
350,
029
111
.03
22,3
50,0
29 1
11.0
3 22
,350
,029
111
.03
JB F
abin
fra
Priv
ate
Lim
ited
10 2
,000
,000
2
.00
2,00
0,00
0 2
.00
2,00
0,00
0 2
.00
Jinda
l Pow
er L
imite
d10
1,30
0,57
5,00
0 8
67.0
5 1,
300,
575,
000
867
.05
1,30
0,57
5,00
0 8
67.0
5 Jin
dal S
teel
Bol
ivia
S.A
. Bs
100
33,
45,6
00
227
.84
33,4
5,60
0 2
27.8
4 33
,45,
600
227
.84
Jinda
l Ste
el &
Pow
er (M
auriti
us) L
imite
dU
S$1
75,
000,
000
383
.13
75,0
00,0
00 3
83.1
3 75
,000
,000
383
.13
Jinda
l Ang
ul P
ower
Ltd
1
0 5
0,00
0 0
.05
50,0
00 0
.05
5000
0 0
.05
Attun
li H
ydro
Ele
ctric
Pow
er C
ompa
ny L
imite
d (`
10)
10
1
0.0
0 1
0.0
0 1
0.0
0 Et
alin
Hyd
ro E
lect
ric P
ower
Com
pany
Lim
ited
(` 1
0) 1
0 1
0
.00
1 0
.00
1 0
.00
Kam
ala
Hyd
ro E
lect
ric P
ower
Com
pany
Lim
ited
(` 1
0) 1
0 1
0
.00
1 0
.00
1 0
.00
Trish
akti
Real
Est
ate
Infr
astr
uctu
re a
nd D
evel
oper
s Pr
ivat
e Li
mite
d 1
0 3
7,16
0,00
0 3
7.16
3
7,16
0,00
0 3
7.16
3
7,16
0,00
0 3
7.16
Su
b To
tal (
a)
1,6
28.3
9 1
,628
.39
1,6
28.2
6 b)
Asso
ciat
es(a
t cos
t or d
eem
ed c
ost)
Nal
wa
Stee
l & P
ower
Lim
ited
10 2
,000
,000
2
.00
2,0
00,0
00
2.0
0 2
,000
,000
2
.00
Ever
best
Ste
el a
nd M
inin
g H
oldi
ngs
Lim
ited
(Not
e-1)
10 -
- -
- 1
00,0
00
0.1
0 S
ub T
otal
(b)
2.0
0 2
.00
2.1
0 c)
Join
t Ven
ture
s (at
cos
t or d
eem
ed c
ost)
Jinda
l Syn
fuel
s Li
mite
d 10
700
,000
0
.70
700
,000
0
.70
700
,000
0
.70
Shre
sht M
inin
g an
d M
etal
s Pr
ivat
e Li
mite
d10
7,6
94,2
48
7.6
9 7
,694
,248
7
.69
7,6
94,2
48
7.6
9 U
rtan
Nor
th M
inin
g Co
mpa
ny L
imite
d10
11,
503,
618
11.
50
11,
503,
618
11.
50
11,
503,
618
11.
50
Sub
Tot
al (c
) 1
9.89
1
9.89
1
9.89
d)
Oth
ers (
at fa
ir va
lue
thro
ugh
profi
t & lo
ss)
Angu
l Suk
inda
Rai
lway
Lim
ited
10 2
5,00
0 0
.03
25,
000
0.0
3 2
5,00
0 0
.03
Angu
l Suk
inda
Rai
lway
Lim
ited
(Not
e-2)
10 5
9,97
5,00
0 5
9.98
5
9,97
5,00
0 5
9.98
5
9,97
5,00
0 4
9.82
Br
ahm
putr
a Ca
pita
l and
Fin
anci
al S
ervi
ce L
imite
d10
19,
200,
000
19.
20
19,
200,
000
19.
20
19,
200,
000
19.
20
Dant
a En
terp
rises
Priv
ate
Lim
ited
(` 1
4,47
0)10
1,4
47
0.0
0 1
,447
0
.00
1,4
47
0.0
0 H
arid
aspu
r Par
adip
Rai
lway
Com
pany
Lim
ited
10 5
,000
,000
5
.00
5,0
00,0
00
5.0
0 5
,000
,000
5
.00
Jinda
l Hol
ding
s Li
mite
d10
2,4
14,0
00
14.
48
2,4
14,0
00
14.
48
2,4
14,0
00
14.
48
Jinda
l Pet
role
um L
imite
d10
49,
400
0.0
5 4
9,40
0 0
.05
49,
400
0.0
5 Jin
dal R
ex E
xplo
ratio
n Pr
ivat
e Li
mite
d10
9,8
00
0.0
1 9
,800
0
.01
9,8
00
0.0
1 O
PJ T
radi
ng P
rivat
e Li
mite
d (`
14,
470)
10 1
,447
0
.00
1,4
47
0.0
0 1
,447
0
.00
Sahy
og H
oldi
ngs P
rivat
e lim
ited
(form
erly
kno
wn
as S
ahyo
g tr
adec
orp
priva
te lim
ited)
(` 1
4,47
0)10
1,4
47
0.0
0 1
,447
0
.00
1,4
47
0.0
0 St
ainl
ess
Inve
stm
ents
Lim
ited
10 1
,242
,000
6
.05
1,2
42,0
00
6.0
5 1
,242
,000
6
.05
Virt
uous
Tra
deco
rp P
rivat
e Li
mite
d (`
14,
470)
10 1
,447
0
.00
1,4
47
0.0
0 1
,447
0
.00
X-Zo
ne S
DN B
HD
RM
1
36,
250
0.0
4 3
6,25
0 0
.04
36,
250
0.0
4 In
dusg
lobe
Mul
tiven
ture
s Pv
t Ltd
(` 1
450)
10 1
45
0.0
0 -
- -
- St
rata
Mul
tiven
ture
s Pv
t Ltd
(` 1
450)
10 1
45
0.0
0 -
- -
- G
enov
a M
ultis
oluti
ons
Pvt L
td (`
145
0)10
145
0
.00
- -
- -
Radi
us M
ultiv
entu
res
Pvt L
td (`
145
0)10
145
0
.00
- -
- -
Divi
no M
ultiv
entu
res
Pvt L
td (`
145
0)10
145
0
.00
- -
- -
Sub
Tot
al (d
) 1
04.8
4 1
04.8
4 9
4.69
T
otal
Inve
stm
ents
in e
quity
inst
rum
ents
1
,755
.12
1,7
55.1
2 1
,744
.94
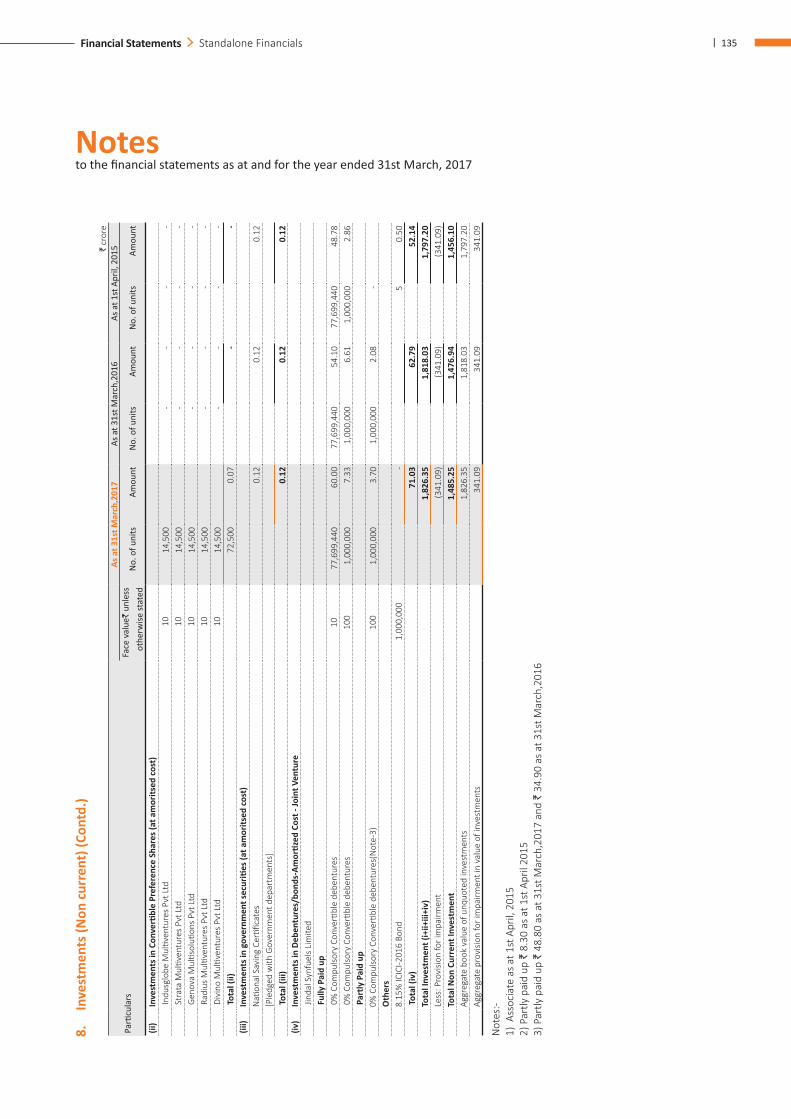
Notes to the financial statements as at and for the year ended 31st March, 2017
| 135Financial Statements Standalone Financials
` cr
ore
Parti
cula
rsAs
at 3
1st M
arch
,201
7As
at 3
1st M
arch
,201
6As
at 1
st A
pril,
201
5Fa
ce v
alue
` un
less
ot
herw
ise st
ated
No.
of u
nits
Amou
ntN
o. o
f uni
tsAm
ount
No.
of u
nits
Amou
nt
(ii)
Inve
stm
ents
in C
onve
rtibl
e Pr
efer
ence
Sha
res (
at a
mor
itsed
cos
t) In
dusg
lobe
Mul
tiven
ture
s Pv
t Ltd
1
0 1
4,50
0 -
- -
- S
trat
a M
ultiv
entu
res
Pvt L
td
10
14,
500
- -
- -
Gen
ova
Mul
tisol
ution
s Pv
t Ltd
1
0 1
4,50
0 -
- -
- R
adiu
s M
ultiv
entu
res
Pvt L
td
10
14,
500
- -
- -
Div
ino
Mul
tiven
ture
s Pv
t Ltd
1
0 1
4,50
0 -
- -
- T
otal
(ii)
72,
500
0.0
7 -
- (ii
i)In
vest
men
ts in
gov
ernm
ent s
ecur
ities
(at a
mor
itsed
cos
t)N
ation
al S
avin
g Ce
rtific
ates
0.1
2 0
.12
0.1
2 [P
ledg
ed w
ith G
over
nmen
t dep
artm
ents
] T
otal
(iii)
0
.12
0.1
2 0
.12
(iv)
Inve
stm
ents
in D
eben
ture
s/bo
nds-
Amor
tized
Cos
t - Jo
int V
entu
re Ji
ndal
Syn
fuel
s Li
mite
d
Ful
ly P
aid
up
0%
Com
pulso
ry C
onve
rtibl
e de
bent
ures
10 7
7,69
9,44
0 6
0.00
7
7,69
9,44
0 5
4.10
7
7,69
9,44
0 4
8.78
0
% C
ompu
lsory
Con
verti
ble
debe
ntur
es10
0 1
,000
,000
7
.33
1,0
00,0
00
6.6
1 1
,000
,000
2
.86
Par
tly P
aid
up
0% C
ompu
lsory
Con
verti
ble
debe
ntur
es(N
ote-
3)10
0 1
,000
,000
3
.70
1,0
00,0
00
2.0
8 -
Oth
ers
8.15
% IC
ICI-2
016
Bond
1,0
00,0
00
- 5
0
.50
Tot
al (i
v)
71.
03
62.
79
52.
14
Tota
l Inv
estm
ent (
i+ii+
iii+i
v) 1
,826
.35
1,8
18.0
3 1
,797
.20
Less
: Pro
visio
n fo
r im
pairm
ent
(341
.09)
(341
.09)
(341
.09)
Tota
l Non
Cur
rent
Inve
stm
ent
1,4
85.2
5 1
,476
.94
1,4
56.1
0 Ag
greg
ate
book
val
ue o
f unq
uote
d in
vest
men
ts 1
,826
.35
1,8
18.0
3 1
,797
.20
Aggr
egat
e pr
ovisi
on fo
r im
pairm
ent i
n va
lue
of in
vest
men
ts 3
41.0
9 3
41.0
9 3
41.0
9
Not
es:-
1)
Ass
ocia
te a
s at
1st
Apr
il, 2
015
2)
Par
tly p
aid
up `
8.3
0 as
at 1
st A
pril
2015
3) P
artly
pai
d up
` 4
8.80
as
at 3
1st M
arch
,201
7 an
d `
34.9
0 as
at 3
1st M
arch
,201
6
8.
Inve
stm
ents
(Non
cur
rent
) (Co
ntd.
)
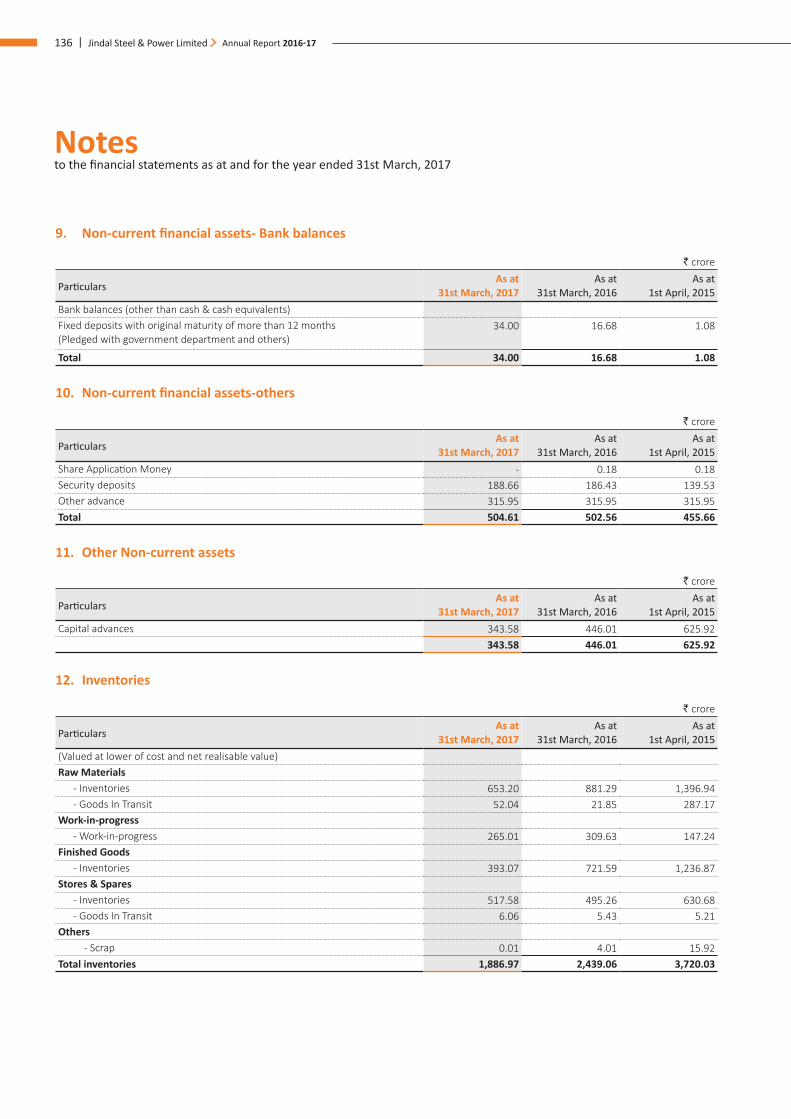
Notes to the financial statements as at and for the year ended 31st March, 2017
136 | Jindal Steel & Power Limited Annual Report 2016-17
9. Non-current financial assets- Bank balances
` crore
ParticularsAs at
31st March, 2017 As at
31st March, 2016 As at
1st April, 2015Bank balances (other than cash & cash equivalents)Fixed deposits with original maturity of more than 12 months (Pledged with government department and others)
34.00 16.68 1.08
Total 34.00 16.68 1.08
10. Non-current financial assets-others
` crore
ParticularsAs at
31st March, 2017 As at
31st March, 2016 As at
1st April, 2015Share Application Money - 0.18 0.18 Security deposits 188.66 186.43 139.53 Other advance 315.95 315.95 315.95 Total 504.61 502.56 455.66
11. Other Non-current assets
` crore
ParticularsAs at
31st March, 2017 As at
31st March, 2016 As at
1st April, 2015Capital advances 343.58 446.01 625.92
343.58 446.01 625.92
12. Inventories
` crore
ParticularsAs at
31st March, 2017 As at
31st March, 2016 As at
1st April, 2015(Valued at lower of cost and net realisable value)Raw Materials
- Inventories 653.20 881.29 1,396.94 - Goods In Transit 52.04 21.85 287.17
Work-in-progress- Work-in-progress 265.01 309.63 147.24
Finished Goods- Inventories 393.07 721.59 1,236.87
Stores & Spares- Inventories 517.58 495.26 630.68 - Goods In Transit 6.06 5.43 5.21
Others - Scrap 0.01 4.01 15.92
Total inventories 1,886.97 2,439.06 3,720.03
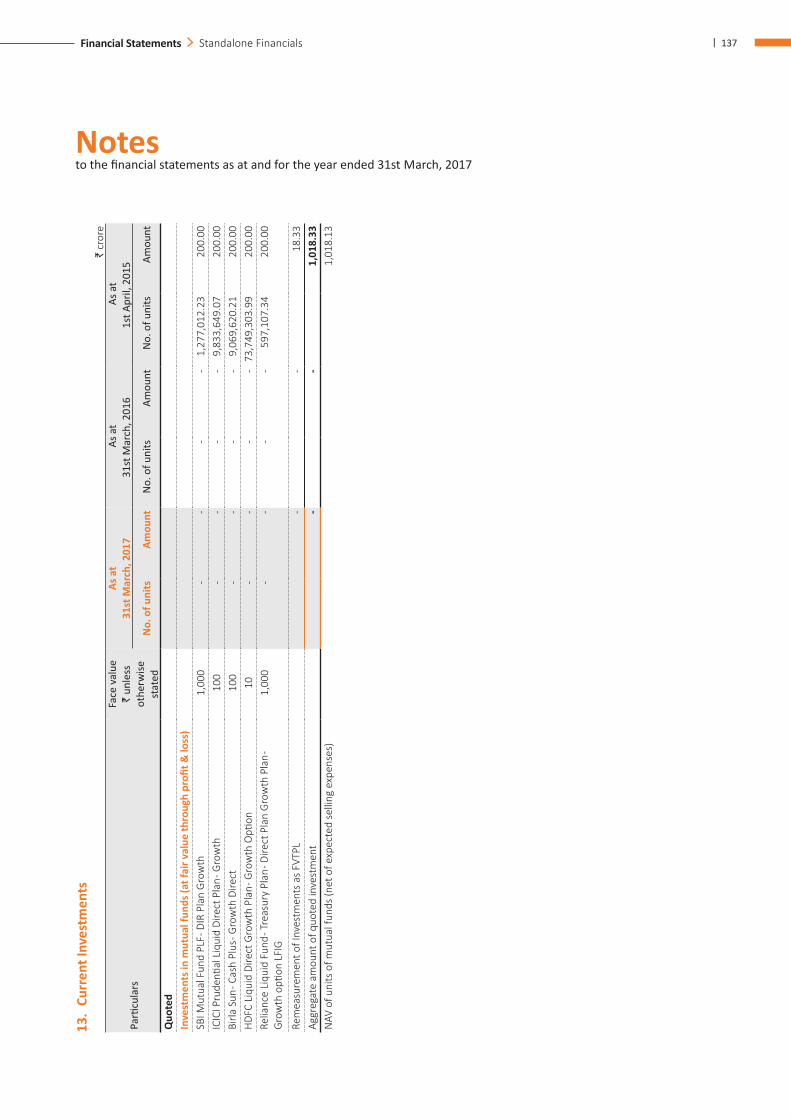
Notes to the financial statements as at and for the year ended 31st March, 2017
| 137Financial Statements Standalone Financials
13.
Curr
ent I
nves
tmen
ts `
cro
re
Parti
cula
rs
Face
val
ue
` un
less
ot
herw
ise
stat
ed
As a
t 31
st M
arch
, 201
7
A
s at
31st
Mar
ch, 2
016
As a
t 1s
t Apr
il, 2
015
No.
of u
nits
Amou
ntN
o. o
f uni
tsAm
ount
No.
of u
nits
Amou
nt
Quo
ted
Inve
stm
ents
in m
utua
l fun
ds (a
t fai
r val
ue th
roug
h pr
ofit &
loss
)SB
I Mut
ual F
und
PLF -
DIR
Pla
n G
row
th
1,0
00
- -
- -
1,2
77,0
12.2
3 2
00.0
0 IC
ICI P
rude
ntial
Liq
uid
Dire
ct P
lan -
Gro
wth
1
00
- -
- -
9,8
33,6
49.0
7 2
00.0
0 Bi
rla S
un - C
ash
Plus
- Gro
wth
Dire
ct
100
-
- -
- 9
,069
,620
.21
200
.00
HDF
C Li
quid
Dire
ct G
row
th P
lan -
Gro
wth
Opti
on
10
- -
- -
73,
749,
303.
99
200
.00
Relia
nce
Liqu
id F
und -
Tre
asur
y Pl
an - D
irect
Pla
n G
row
th P
lan -
G
row
th o
ption
LFI
G
1,0
00
- -
- -
597
,107
.34
200
.00
Rem
easu
rem
ent o
f Inv
estm
ents
as
FVTP
L -
- 1
8.33
Ag
greg
ate
amou
nt o
f quo
ted
inve
stm
ent
- -
1,0
18.3
3 N
AV o
f uni
ts o
f mut
ual f
unds
(net
of e
xpec
ted
selli
ng e
xpen
ses)
1,0
18.1
3
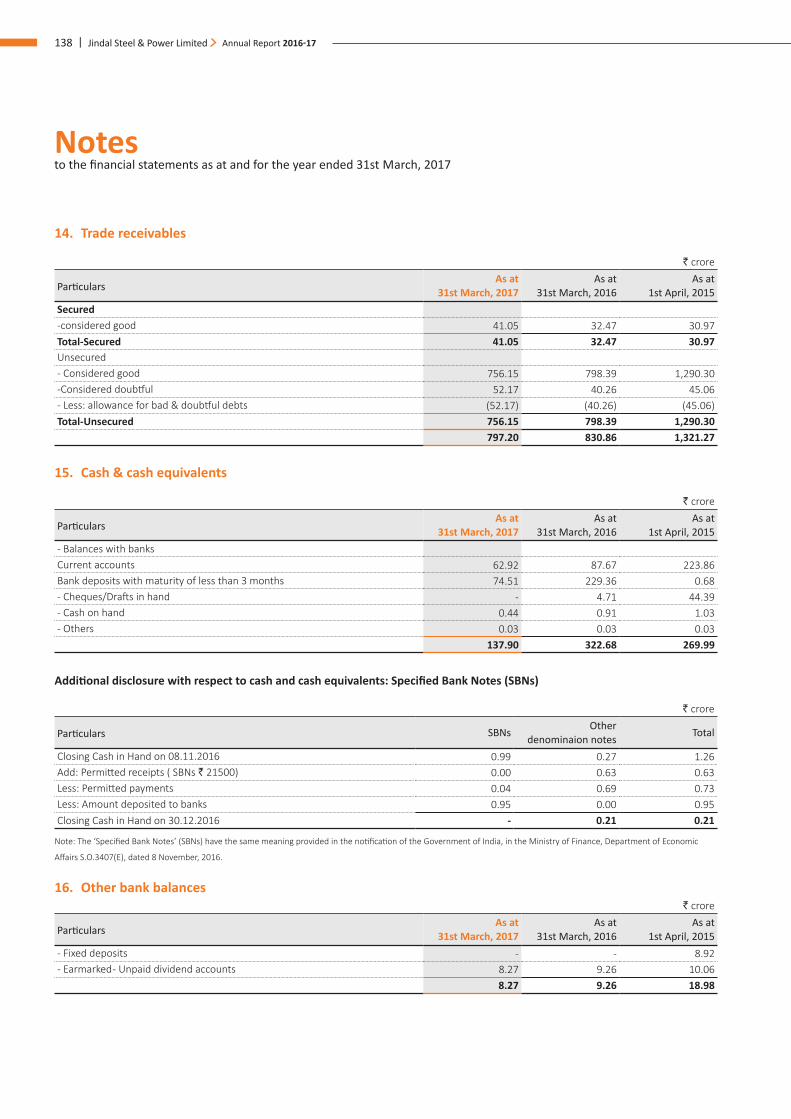
Notes to the financial statements as at and for the year ended 31st March, 2017
138 | Jindal Steel & Power Limited Annual Report 2016-17
14. Trade receivables
` crore
ParticularsAs at
31st March, 2017 As at
31st March, 2016 As at
1st April, 2015Secured-considered good 41.05 32.47 30.97 Total-Secured 41.05 32.47 30.97 Unsecured- Considered good 756.15 798.39 1,290.30 -Considered doubtful 52.17 40.26 45.06 - Less: allowance for bad & doubtful debts (52.17) (40.26) (45.06)Total-Unsecured 756.15 798.39 1,290.30
797.20 830.86 1,321.27
15. Cash & cash equivalents
` crore
ParticularsAs at
31st March, 2017 As at
31st March, 2016 As at
1st April, 2015- Balances with banksCurrent accounts 62.92 87.67 223.86 Bank deposits with maturity of less than 3 months 74.51 229.36 0.68 - Cheques/Drafts in hand - 4.71 44.39 - Cash on hand 0.44 0.91 1.03 - Others 0.03 0.03 0.03
137.90 322.68 269.99
Additional disclosure with respect to cash and cash equivalents: Specified Bank Notes (SBNs)
` crore
Particulars SBNs Other denominaion notes Total
Closing Cash in Hand on 08.11.2016 0.99 0.27 1.26 Add: Permitted receipts ( SBNs ` 21500) 0.00 0.63 0.63 Less: Permitted payments 0.04 0.69 0.73 Less: Amount deposited to banks 0.95 0.00 0.95 Closing Cash in Hand on 30.12.2016 - 0.21 0.21
Note: The ‘Specified Bank Notes’ (SBNs) have the same meaning provided in the notification of the Government of India, in the Ministry of Finance, Department of Economic
Affairs S.O.3407(E), dated 8 November, 2016.
16. Other bank balances` crore
ParticularsAs at
31st March, 2017 As at
31st March, 2016 As at
1st April, 2015- Fixed deposits - - 8.92 - Earmarked - Unpaid dividend accounts 8.27 9.26 10.06
8.27 9.26 18.98
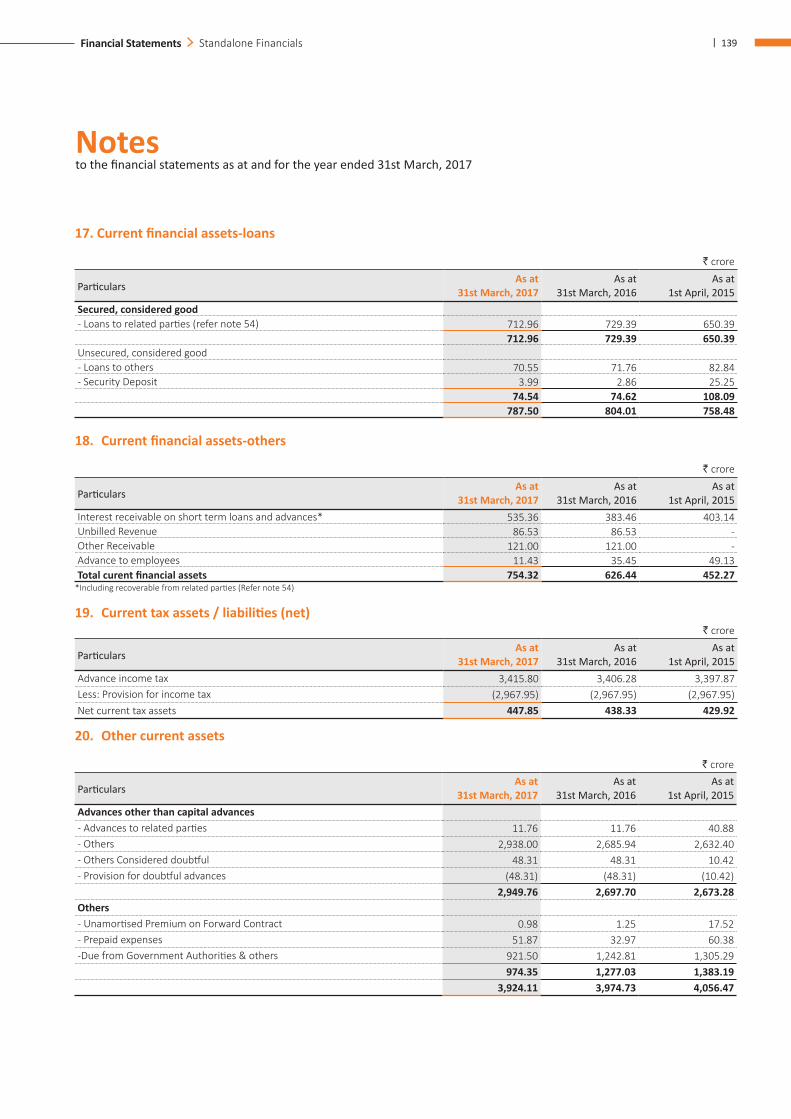
Notes to the financial statements as at and for the year ended 31st March, 2017
| 139Financial Statements Standalone Financials
17. Current financial assets-loans
` crore
ParticularsAs at
31st March, 2017 As at
31st March, 2016 As at
1st April, 2015Secured, considered good- Loans to related parties (refer note 54) 712.96 729.39 650.39
712.96 729.39 650.39 Unsecured, considered good- Loans to others 70.55 71.76 82.84- Security Deposit 3.99 2.86 25.25
74.54 74.62 108.09 787.50 804.01 758.48
18. Current financial assets-others
` crore
ParticularsAs at
31st March, 2017 As at
31st March, 2016 As at
1st April, 2015Interest receivable on short term loans and advances* 535.36 383.46 403.14 Unbilled Revenue 86.53 86.53 - Other Receivable 121.00 121.00 - Advance to employees 11.43 35.45 49.13 Total curent financial assets 754.32 626.44 452.27
*Including recoverable from related parties (Refer note 54)
19. Current tax assets / liabilities (net) ` crore
ParticularsAs at
31st March, 2017 As at
31st March, 2016 As at
1st April, 2015Advance income tax 3,415.80 3,406.28 3,397.87 Less: Provision for income tax (2,967.95) (2,967.95) (2,967.95)Net current tax assets 447.85 438.33 429.92
20. Other current assets
` crore
ParticularsAs at
31st March, 2017 As at
31st March, 2016 As at
1st April, 2015Advances other than capital advances- Advances to related parties 11.76 11.76 40.88 - Others 2,938.00 2,685.94 2,632.40 - Others Considered doubtful 48.31 48.31 10.42 - Provision for doubtful advances (48.31) (48.31) (10.42)
2,949.76 2,697.70 2,673.28 Others- Unamortised Premium on Forward Contract 0.98 1.25 17.52 - Prepaid expenses 51.87 32.97 60.38 -Due from Government Authorities & others 921.50 1,242.81 1,305.29
974.35 1,277.03 1,383.19 3,924.11 3,974.73 4,056.47
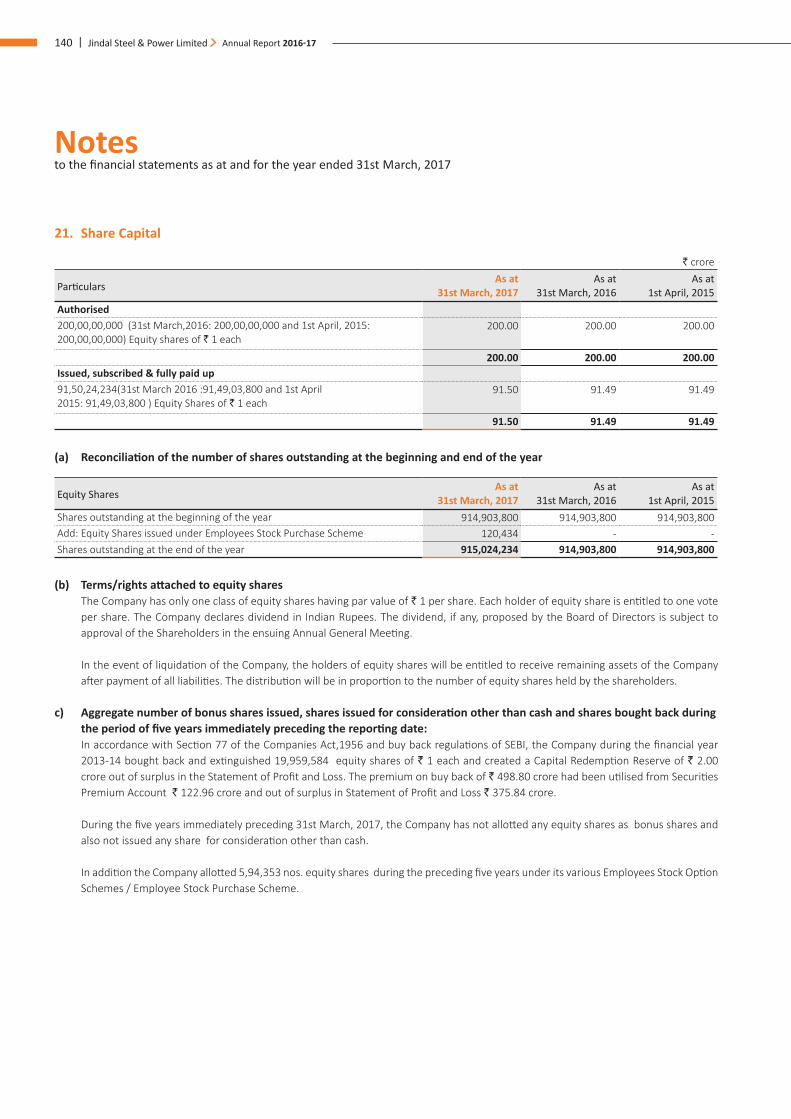
Notes to the financial statements as at and for the year ended 31st March, 2017
140 | Jindal Steel & Power Limited Annual Report 2016-17
21. Share Capital
` crore
ParticularsAs at
31st March, 2017As at
31st March, 2016As at
1st April, 2015Authorised200,00,00,000 (31st March,2016: 200,00,00,000 and 1st April, 2015: 200,00,00,000) Equity shares of ` 1 each
200.00 200.00 200.00
200.00 200.00 200.00 Issued, subscribed & fully paid up91,50,24,234(31st March 2016 :91,49,03,800 and 1st April 2015: 91,49,03,800 ) Equity Shares of ` 1 each
91.50 91.49 91.49
91.50 91.49 91.49
(a) Reconciliation of the number of shares outstanding at the beginning and end of the year
Equity SharesAs at
31st March, 2017As at
31st March, 2016As at
1st April, 2015Shares outstanding at the beginning of the year 914,903,800 914,903,800 914,903,800 Add: Equity Shares issued under Employees Stock Purchase Scheme 120,434 - - Shares outstanding at the end of the year 915,024,234 914,903,800 914,903,800
(b) Terms/rights attached to equity shares The Company has only one class of equity shares having par value of ` 1 per share. Each holder of equity share is entitled to one vote
per share. The Company declares dividend in Indian Rupees. The dividend, if any, proposed by the Board of Directors is subject to approval of the Shareholders in the ensuing Annual General Meeting.
In the event of liquidation of the Company, the holders of equity shares will be entitled to receive remaining assets of the Company after payment of all liabilities. The distribution will be in proportion to the number of equity shares held by the shareholders.
c) Aggregate number of bonus shares issued, shares issued for consideration other than cash and shares bought back during the period of five years immediately preceding the reporting date:
In accordance with Section 77 of the Companies Act,1956 and buy back regulations of SEBI, the Company during the financial year 2013-14 bought back and extinguished 19,959,584 equity shares of ` 1 each and created a Capital Redemption Reserve of ` 2.00 crore out of surplus in the Statement of Profit and Loss. The premium on buy back of ` 498.80 crore had been utilised from Securities Premium Account ` 122.96 crore and out of surplus in Statement of Profit and Loss ` 375.84 crore.
During the five years immediately preceding 31st March, 2017, the Company has not allotted any equity shares as bonus shares and also not issued any share for consideration other than cash.
In addition the Company allotted 5,94,353 nos. equity shares during the preceding five years under its various Employees Stock Option Schemes / Employee Stock Purchase Scheme.
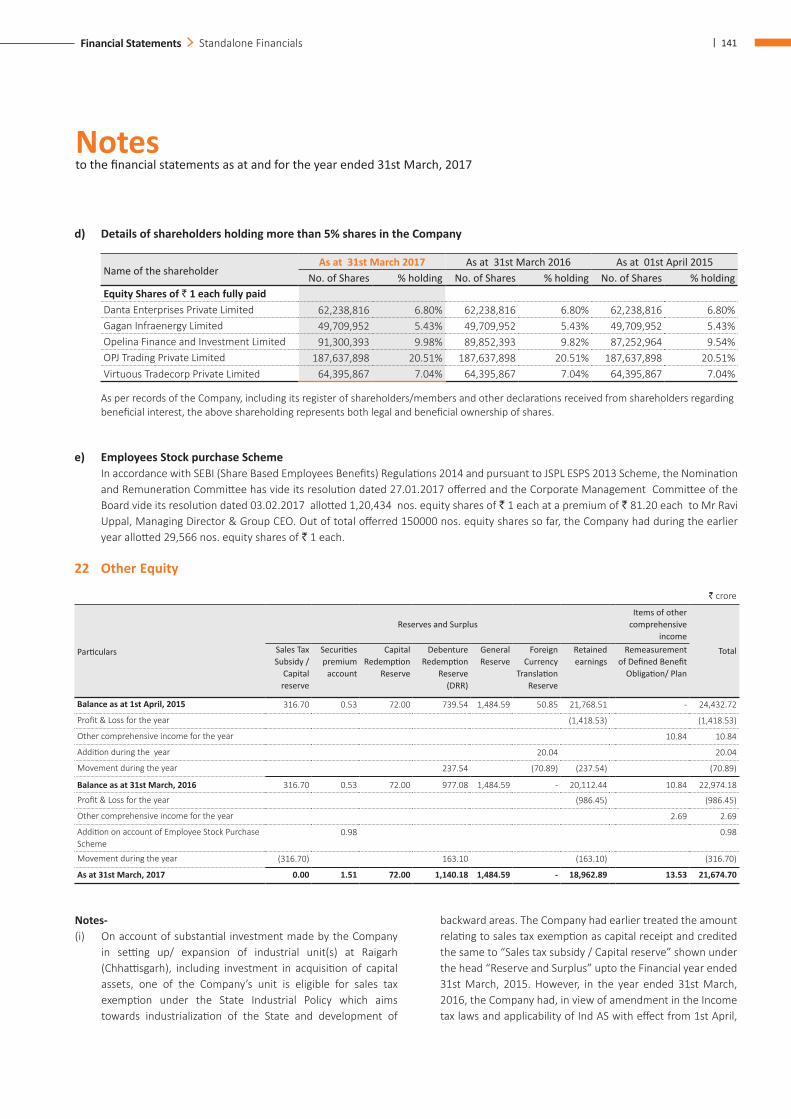
Notes to the financial statements as at and for the year ended 31st March, 2017
| 141Financial Statements Standalone Financials
d) Details of shareholders holding more than 5% shares in the Company
Name of the shareholderAs at 31st March 2017 As at 31st March 2016 As at 01st April 2015
No. of Shares % holding No. of Shares % holding No. of Shares % holding Equity Shares of ` 1 each fully paidDanta Enterprises Private Limited 62,238,816 6.80% 62,238,816 6.80% 62,238,816 6.80%Gagan Infraenergy Limited 49,709,952 5.43% 49,709,952 5.43% 49,709,952 5.43%Opelina Finance and Investment Limited 91,300,393 9.98% 89,852,393 9.82% 87,252,964 9.54%OPJ Trading Private Limited 187,637,898 20.51% 187,637,898 20.51% 187,637,898 20.51%Virtuous Tradecorp Private Limited 64,395,867 7.04% 64,395,867 7.04% 64,395,867 7.04%
As per records of the Company, including its register of shareholders/members and other declarations received from shareholders regarding beneficial interest, the above shareholding represents both legal and beneficial ownership of shares.
e) Employees Stock purchase Scheme In accordance with SEBI (Share Based Employees Benefits) Regulations 2014 and pursuant to JSPL ESPS 2013 Scheme, the Nomination
and Remuneration Committee has vide its resolution dated 27.01.2017 offerred and the Corporate Management Committee of the Board vide its resolution dated 03.02.2017 allotted 1,20,434 nos. equity shares of ` 1 each at a premium of ` 81.20 each to Mr Ravi Uppal, Managing Director & Group CEO. Out of total offerred 150000 nos. equity shares so far, the Company had during the earlier year allotted 29,566 nos. equity shares of ` 1 each.
22 Other Equity
` crore
Particulars
Reserves and SurplusItems of other
comprehensive income
TotalSales Tax Subsidy /
Capital reserve
Securities premium
account
Capital Redemption
Reserve
Debenture Redemption
Reserve (DRR)
General Reserve
Foreign Currency
Translation Reserve
Retained earnings
Remeasurement of Defined Benefit
Obligation/ Plan
Balance as at 1st April, 2015 316.70 0.53 72.00 739.54 1,484.59 50.85 21,768.51 - 24,432.72
Profit & Loss for the year (1,418.53) (1,418.53)
Other comprehensive income for the year 10.84 10.84
Addition during the year 20.04 20.04
Movement during the year 237.54 (70.89) (237.54) (70.89)
Balance as at 31st March, 2016 316.70 0.53 72.00 977.08 1,484.59 - 20,112.44 10.84 22,974.18
Profit & Loss for the year (986.45) (986.45)
Other comprehensive income for the year 2.69 2.69
Addition on account of Employee Stock Purchase Scheme
0.98 0.98
Movement during the year (316.70) 163.10 (163.10) (316.70)
As at 31st March, 2017 0.00 1.51 72.00 1,140.18 1,484.59 - 18,962.89 13.53 21,674.70
Notes- (i) On account of substantial investment made by the Company
in setting up/ expansion of industrial unit(s) at Raigarh (Chhattisgarh), including investment in acquisition of capital assets, one of the Company’s unit is eligible for sales tax exemption under the State Industrial Policy which aims towards industrialization of the State and development of
backward areas. The Company had earlier treated the amount relating to sales tax exemption as capital receipt and credited the same to “Sales tax subsidy / Capital reserve” shown under the head “Reserve and Surplus” upto the Financial year ended 31st March, 2015. However, in the year ended 31st March, 2016, the Company had, in view of amendment in the Income tax laws and applicability of Ind AS with effect from 1st April,
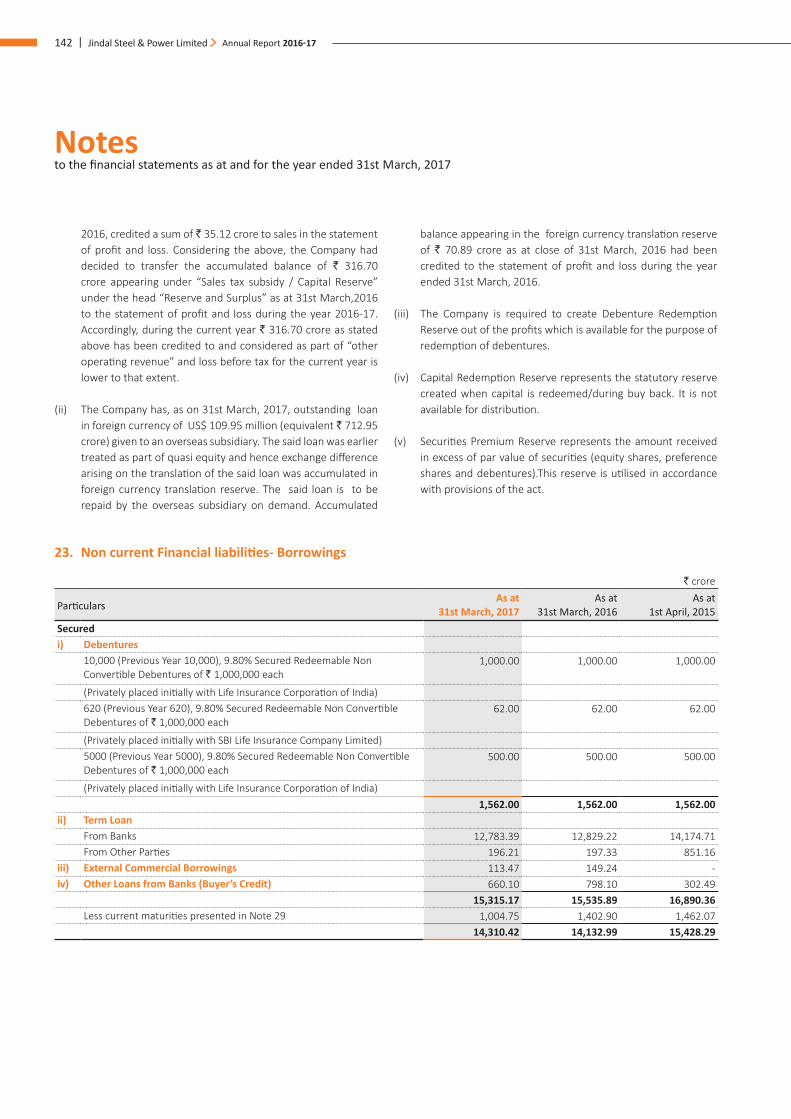
Notes to the financial statements as at and for the year ended 31st March, 2017
142 | Jindal Steel & Power Limited Annual Report 2016-17
2016, credited a sum of ` 35.12 crore to sales in the statement of profit and loss. Considering the above, the Company had decided to transfer the accumulated balance of ` 316.70 crore appearing under “Sales tax subsidy / Capital Reserve” under the head “Reserve and Surplus” as at 31st March,2016 to the statement of profit and loss during the year 2016-17. Accordingly, during the current year ` 316.70 crore as stated above has been credited to and considered as part of “other operating revenue” and loss before tax for the current year is lower to that extent.
(ii) The Company has, as on 31st March, 2017, outstanding loan in foreign currency of US$ 109.95 million (equivalent ` 712.95 crore) given to an overseas subsidiary. The said loan was earlier treated as part of quasi equity and hence exchange difference arising on the translation of the said loan was accumulated in foreign currency translation reserve. The said loan is to be repaid by the overseas subsidiary on demand. Accumulated
balance appearing in the foreign currency translation reserve of ` 70.89 crore as at close of 31st March, 2016 had been credited to the statement of profit and loss during the year ended 31st March, 2016.
(iii) The Company is required to create Debenture Redemption Reserve out of the profits which is available for the purpose of redemption of debentures.
(iv) Capital Redemption Reserve represents the statutory reserve created when capital is redeemed/during buy back. It is not available for distribution.
(v) Securities Premium Reserve represents the amount received in excess of par value of securities (equity shares, preference shares and debentures).This reserve is utilised in accordance with provisions of the act.
23. Non current Financial liabilities- Borrowings
` crore
ParticularsAs at
31st March, 2017 As at
31st March, 2016 As at
1st April, 2015Securedi) Debentures
10,000 (Previous Year 10,000), 9.80% Secured Redeemable Non Convertible Debentures of ` 1,000,000 each
1,000.00 1,000.00 1,000.00
(Privately placed initially with Life Insurance Corporation of India)620 (Previous Year 620), 9.80% Secured Redeemable Non Convertible Debentures of ` 1,000,000 each
62.00 62.00 62.00
(Privately placed initially with SBI Life Insurance Company Limited)5000 (Previous Year 5000), 9.80% Secured Redeemable Non Convertible Debentures of ` 1,000,000 each
500.00 500.00 500.00
(Privately placed initially with Life Insurance Corporation of India) 1,562.00 1,562.00 1,562.00
ii) Term LoanFrom Banks 12,783.39 12,829.22 14,174.71 From Other Parties 196.21 197.33 851.16
iii) External Commercial Borrowings 113.47 149.24 - iv) Other Loans from Banks (Buyer’s Credit) 660.10 798.10 302.49
15,315.17 15,535.89 16,890.36 Less current maturities presented in Note 29 1,004.75 1,402.90 1,462.07
14,310.42 14,132.99 15,428.29
Notes to the financial statements as at and for the year ended 31st March, 2017
| 143Financial Statements Standalone Financials
Debentures Security
i) Debentures of ` 1000 crore (March 31, 2016 ` 1000 crore) placed initially with Life Insurance Corporation of India on private placement basis are redeemable at par in 2 equal annual instalments at the end of 9.5 and 10.5 years from the date of respective allotments i.e. ` 100 crore (12.10.2009), ` 150 crore (22.10.2009), ` 150 crore (24.11.2009), ` 150 crore (24.12.2009), ` 150 crore (25.01.2010), ` 150 crore (19.02.2010) and ` 150 crore (26.03.2010). The debentures are secured by way of first charge on pari-passu charge basis over the movable and immovable fixed assets of 810 MW (6x135MW) Captive Power Plant, both present and future, of the company at Angul, Odisha in favour of the Debenture Trustees
ii) Debentures of ` 62 crore (March 31, 2016 ` 62 crore) placed initially with SBI Life Insurance Company Limited on private placement basis are redeemable at par in 5 equal annual instalments commencing from the end of 8 years from the date of allotment i.e. 29.12.2009. The debentures are secured by way of first charge on pari-passu charge basis over the movable and immovable fixed assets of 810 MW (6x135MW) Captive Power Plant, both present and future, of the company at Angul, Odisha in favour of the Debenture Trustees.
iii) Debentures of ̀ 500 crore (March 31, 2016 ̀ 500 crore) placed initially with Life Insurance Corporation of India on private placement basis are redeemable at par in 2 equal annual instalments at the end of 9.5 and 10.5 years from the date of respective allotments i.e. ` 100 crore (24.08.2009), ` 80 crore (08.09.2009), ̀ 80 crore (08.10.2009), ̀ 80 crore (09.11.2009), ` 80 crore (08.12.2009) and ` 80 crore (08.01.2010) . The debentures are secured on pari-passu charge basis by way of hypothecation of movable fixed assets of the Company (excluding assets charged on exclusive basis) in favour of the Debenture Trustees. In addition a first pari passu mortgage on a part of immovable property of the pertaining to unit located at Kharsia Road, Raigarh and a part of the immovable property pertaining to unit located at 13 KM Stone, G E Road, Mandir Hasaud, Raipur in favour of the Debenture Trustees.
Term Loans from Banks Security i) Loans of ̀ 2829.64 crore (March 31, 2016 ̀ 2775.44 crore) have
been refinanced and are repayable in 79 quarterly instalments starting from June, 2016 are secured by way of first pari passu charge on all movable plant & machinery, spares including all insurance policies, project contracts, movable and immovable
fixed assets, both present and future under the 1.8 MTPA DRI facility at Angul, Odisha.
ii) Loans of ` 40.42 crore (March 31, 2016 ` 53.89 crore) repayable in 38 quarterly instalments starting from October, 2010 (refinancing is in process) are secured by way of first pari passu charge on all movable and immovable fixed assets both present and future under 2X135 MW Power Plant (Phase - 1) at Dongamauha, Raigarh, Chhattisgarh.
iii) Loans of ` 319.80 crore (March 31, 2016 ` 314.00 crore) have been refinanced and are repayable in 79 quarterly instalments starting from June, 2016 are secured by way of first pari passu charge on all movable and immovable fixed assets including machinery spares, both present and future, of DCPP [2X135 MW Power Plant (Phase - 1)] at Dongamauha, Raigarh, Chhattisgarh. Further, IDFC Loan of ` 126.78 crore (March 31, 2016 ` 127.50 crore) included in above is additionally secured by all the assets of DCPP [2X135 MW Power Plant (Phase - 2)] at Dongamauha, Raigarh, Chhattisgarh.
iv) Loans of ` 2328.99 crore (March 31, 2016 ` 2,217.88 crore) have been refinanced and are repayable in 79 quarterly instalments starting from June, 2016 are secured by first pari passu charge on all movable (including project contracts) and immovable fixed assets, both present and future under 1.5 MTPA Integrated Steel Plant and 1.2 MTPA Plate Mill project at Angul, Odisha.
v) Loans of ` 959.59 crore (March 31, 2016 ` 935.22 crore) have been refinanced and are repayable in 79 quarterly instalments starting from June, 2016 are secured by first pari passu charge on all movable plant & machinery, spare parts, furniture & fixtures including all the project contracts (including insurance policies, rights and titles) and immovable fixed assets, both present and future under 6x135 MW Power Plant Project at Angul, Odisha.
vi) Loans of ` NIL (March 31, 2016 ` 62.25 crore) repayable in 16 quarterly instalments starting from March 2013 was secured by subservient charge on fixed assets of the Company.
vii) Loans of ` 1340 crore(March 31, 2016 ` 1,430 crore) initially taken from ICICI bank on bilateral basis are repayable by way of ballooning instalments in two tranches. An amount of ` 500 crore shall be repayable in a period of 5 (five)years in 16 (sixteen) quarterly instalment, whereas an amount of ` 1000 crore shall be repayable in a period of 10 (Ten) years in 36 (thirty six) quarterly instalment starting from January, 2015.
Notes to the financial statements as at and for the year ended 31st March, 2017
144 | Jindal Steel & Power Limited Annual Report 2016-17
Loans of ` 956.24 crore (March 31, 2016 ` 979.67 crore) initially taken from HDFC Bank on bilateral basis are repayable in a period of 8 (eight) years in 28 (twenty eight) quarterly installments starting from June, 2015. Loans of ̀ 1,465.94 crore (March 31, 2016 ̀ 1,500 crore) from State Bank of India are repayable in a period of 8 (eight) years in 32 (Thirty Two) quarterly instalments starting from June, 2016. Above loans are secured by way of a first pari passu charge on all the present movable Fixed Assets of units located at Balkudra, Patratu, District Ramgarh, Jharkand; 13 KM Stone, G E Road, Mandir Hasaud, Raipur; 201 to 204, Industrial Park SSD, Punjipatra, Raigarh, Chhattisgarh; Bhikaji Cama Place, New Delhi; and all movable Fixed Assets (present as well as future) located at Kharsia Road, Raigarh, Chhattisgarh. In addition a first ranking mortgage and pari passu charge on immovable property pertaining to unit located at Kharsia Road, Raigarh and a part of the immovable property pertaining to unit located at 13 KM Stone, G E Road, Mandir Hasaud, Raipur.
viii) a. Loans of ` 1,559.61 crore (March 31, 2016 ` 1574.98 crore) repayable in a period of 7.75 years in 31 (Thirty One) quarterly installments, starting from June, 2017 are secured by way of a first charge on pari passu basis over all the movable and immovable fixed assets (Plate Mill & ISP facility, DRI, Captive power plant and other misc. assets etc.), both present and future, of plant Phase 1A at Angul, Odisha. b. Loans of ` 500.00 crore (March 31, 2016 ` 500.00 crore) repayable to HDFC bank in a period of 7.75 years in 31 (Thirty One) quarterly installments starting from June, 2017 are secured by way of a first charge on pari passu basis over all movable fixed assets (Plate Mill & ISP facility, DRI, CPP and other misc. assets etc.), both present and future, of Plant Phase 1A at Angul, Odisha. Further, charge in favour of HDFC bank in respect of said loan by way of a first charge on immovable fixed assets, both present and future, of Plant Phase 1A at Angul, Odisha is to be created.
ix) Loans of ` 483.16 crore (March 31, 2016 ` 485.90 crore) have been refinanced and are repayable in 79 quarterly installments starting from June, 2016 are secured by way of a first pari passu charge on all movable plant and machinery, spares, vehicles etc. and immovable fixed assets both present and future under 2X135 MW Power Plant (Phase 2) at Dongamahua Raigarh Chattisgarh.
Other Loans Security Other loans of ` 196.21 crore (Previous Year ` 197.33 crore)
have been refinanced and are repayable in 79 quarterly
instalments starting from June, 2016 are secured by first pari passu charge on all movable plant & machinery, spare parts, furniture & fixtures including all the project contracts (including insurance policies, rights and titles) and immovable fixed assets, both present and future under 6x135 MW Power Plant Project at Angul, Odisha.
Note- Project Loan of ` 7215.34 crore outstanding as on 30th Nov
2015 (including loan of ` 57.26 crore from IDBI Bank where documentation under 5/25 scheme of RBI is in progress as on balance sheet date) were elongated under the 5/25 Scheme (outstanding as on 31st March, 2017 ` 7,157.81 crore). The company is in process of execution of Joint Documentation with lenders to effect the sanctioned restructuring scheme. On completion of Joint Documentation, security against the stated loans along with debentures (refer para: “”Debenture”” i & ii, “”Term Loan from Bank”” i, iv, v and “”other Loans””) shall be modified to first charge on pari-passu basis over the movable and immovable fixed assets (ISP, DRI, CPP and other miscellaneous assets etc.) {including all the project contracts (including insurance policies, rights, titles etc.)} both present and future of Plant Phase 1A at Angul, Odisha of the company in favour of the Debenture Trustees/lenders.
External Commerical Borrowings ECB from Mizuho Bank Limited of ̀ 113.47 crore (Previous year
` 149.24 crore) repayable in a period of 2 years, in 9 quarterly instalments starting from March 30, 2016 are secured (Charge to be created) by way of a first pari passu charge on all the present movable and immovable fixed assets of 1.5 MTPA Integrated Steel Plant including 1.2 MTPA Plate Mill project , 1.8 MTPA DRI facility, 810 MW Captive Power Plant at Angul including movable plant & machinery, spares, tools and accessories, furniture, fixtures and the miscellaneous fixed assets of the plant phase 1A at Angul.
Buyer’s credit Loans ̀ 660.10 crore ( Previous Year ̀ 798.10 crore) are secured
by First ranking pari-passu charge by way of hypothecation over all of the company’s current assets, including aggregate rupee value of the company’s cash and bank balances, investments (of which return of principal is guaranteed), advance paid, raw materials, finished and semi-finished goods, consumable stores, spares, stock in progress, bills of lading, airways bills, railways receipt (RR), good receipt (GR), motor transport receipts (MTR) or such other receipts (issued by approved carrier carrying consignment of raw material/consumable spares), irrevocable letter of credit, receivables, book debts and consumable stores (including those stored at company’s
Notes to the financial statements as at and for the year ended 31st March, 2017
| 145Financial Statements Standalone Financials
work at Raigarh and Raipur, Chhattisgarh) and include any money owing to it and payable on demand or within 1 (one) year from the date of computation, in whatsoever currency denominated or as otherwise defined/classified by guidelines of the RBI from time to time in force or any other applicable law and all other current assets which are required to be classified as such as per applicable law, both present and
future and second ranking pari passu charge (charge created/to be created) over the entire fixed assets, both movable & immovable of the company [except the fixed assets related to 1x368 tonnes per day, 2x380 tonnes per day (both at Raigarh) and 2x1200 tonnes per day (at Angul) Oxygen Plants of the Company]. The Company is availing the buyer’s credit for capex as per the guidelines of RBI.
Repayments and Interest rates for the above Secured Debentures,Term Loans ,External Commercial Borrowings and Buyer’s Credit are as follows:
` crore
Year 2017-18 2018-19 2019-20 2020-21 & Above Total
Loan 1,004.75 928.25 1,556.07 11,165.98 14,655.06 Buyers’ Credit 660.10
15,315.16
The interest rate for the above term loans from banks and others (excluding penal interest) varies from 10.50% to 13% p.aThe interest rate for the above External Commercial Borrowings is 3.24%.p.aThe weighted average rate of interest for buyers credit is 1.59%p.a.
23. Non current Financial liabilities- Borrowings (contd.)
` croreAs at
31st March, 2017 As at
31st March, 2016 As at
1st April, 2015UnsecuredDebentures3,000 (Previous Year 3,000), 9.63% Unsecured Redeemable Non Convertible Debentures of `1,000,000 each
- 300.00 300.00
(Privately placed initially with HDFC Bank Limited)3,000 (Previous Year 3,000), 10.48% Unsecured Redeemable Non Convertible Debentures of `1,000,000 each
300.00 300.00 300.00
(Privately placed initially with ICICI Bank Limited)10,000 (Previous Year 10,000), 10.25% Unsecured Redeemable Non Convertible Debentures of `1,000,000 each (Privately placed initially with Kotak Mahindra Bank)
1,000.00 1,000.00 1,000.00
7,500 (Previous Year 7,500), 9.75% Unsecured Redeemable Non Convertible Debentures of ` 1,000,000 each
750.00 750.00 750.00
(Privately placed initially with HDFC Bank Limited) 2,050.00 2,350.00 2,350.00
- Other Loans from Banks (Buyer’s Credit) - 62.94 471.23 - External Commercial Borrowings 201.46 289.57 994.00
2,251.46 2,702.51 3,815.23 Less current maturities presented in Note 29 158.00 423.93 736.10
2,093.46 2,278.58 3,079.13 16,403.88 16,411.57 18,507.42
Notes to the financial statements as at and for the year ended 31st March, 2017
146 | Jindal Steel & Power Limited Annual Report 2016-17
Debentures 1. Debentures of ` NIL (Previous Year ` 300 crore) placed
initially with HDFC Bank Limited on private placement basis are redeemable at par at the end of 3 years from the date of allotment i.e. 05.04.2013.
2. Debentures of ` 300 crore (Previous Year ` 300 crore) placed initially with ICICI Bank Limited on private placement basis are redeemable at par at the end of 5 years from the date of allotment i.e. 11.08.2014.
3. Debentures of ̀ 1000 crore (Previous Year ̀ 1000 crore) placed initially with Kotak Mahindra Bank on private placement basis are redeemable at par in 3 instalments, ` 330 crore at the end of 4 years, ` 330 crore at the end of 5 years and ` 340 crore at the end of 6 years from the date of allotment i.e. 18th December, 2014.
4. Debentures of ` 750 crore (Previous Year ` 750 crore) placed initially with HDFC Bank Limited on private placement basis are redeemable at par at the end of 6 years from the date of allotment i.e. 11.03.2015.
Repayments and Interest rates for the above Unsecured Debentures, External Commercial Borrowings and Buyer’s Credit are as follows:
` crore
Year 2017-18 2018-19 2019-20 2020-21 & Above Total
Loan 158.00 347.38 647.38 1,098.69 2,251.46 Buyers’ Credit -
2251.46
The interest rate for the above External Commercial Borrowings varies from 0.04% to 1.35% p.a.
The Company has made certain delay in repayment of Term Loans and interest thereon. The details of continuing delay as at March 31, 2017 is as follows:
ParticularsAmount
( `in crore) Period of Delay
( in days) Principal repayment 147.45 less than 90 daysInterest payment 300.95 less than 90 days
External Commercial Borrowings 1. ECA from Credit Agricole CIB of ` 1.51 crore (Previous Year
` 4.92 crore) at year end rate repayable in 14 half yearly instalments starting from October 21, 2010.
2. ECA from Credit Agricole CIB of ` 23.28 crore (Previous Year ` 50.50 crore) at year end rate repayable in 16 half yearly instalments starting from May 25, 2010.
3. ECA from Credit Agricole CIB of ` 69.53 crore (Previous Year ` 84.83 crore) at year end rate repayable in 20 half yearly instalments starting from March 9, 2011.
4. ECA from Credit Agricole CIB of ` NIL (Previous Year ` 3.77 crore) at year end rate repayable in 14 half yearly instalments starting from June 21, 2010.
5. ECB from ICICI Bank Limited of ` 107.14 crore (Previous Year ` 145.56 crore) at year end rate repayable in 15 half yearly instalments starting from March 11, 2011.
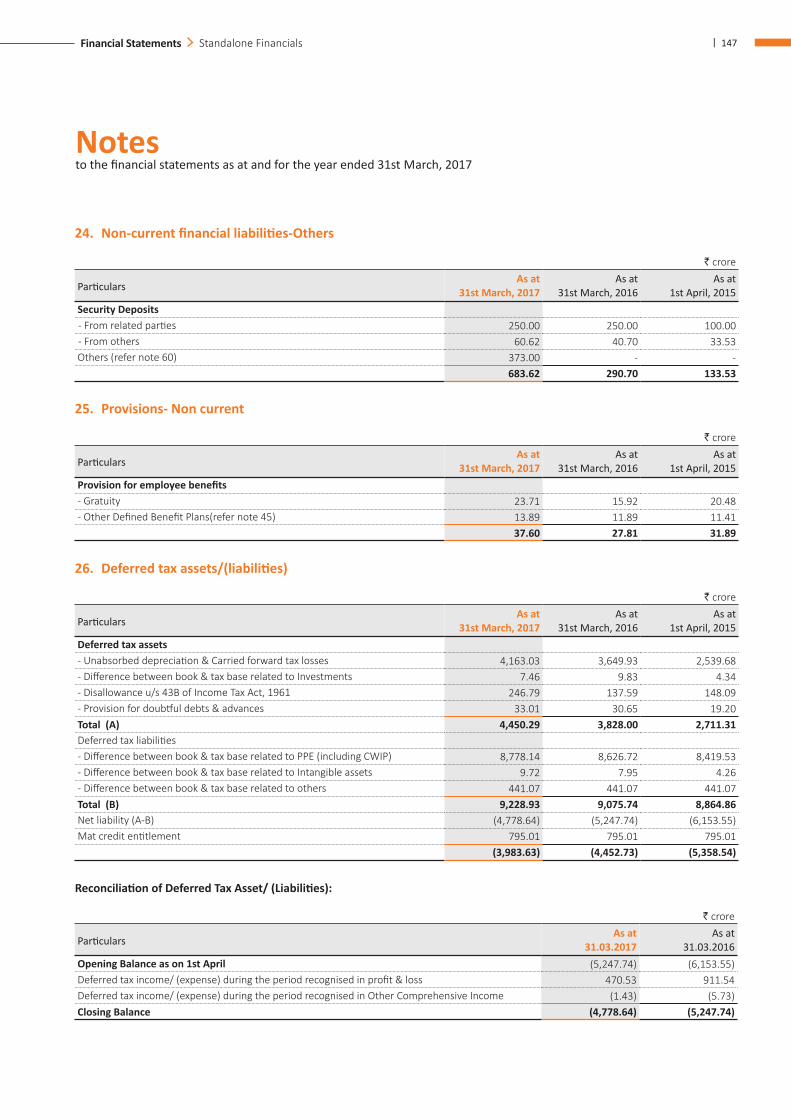
Notes to the financial statements as at and for the year ended 31st March, 2017
| 147Financial Statements Standalone Financials
24. Non-current financial liabilities-Others
` crore
ParticularsAs at
31st March, 2017 As at
31st March, 2016 As at
1st April, 2015Security Deposits - From related parties 250.00 250.00 100.00 - From others 60.62 40.70 33.53 Others (refer note 60) 373.00 - -
683.62 290.70 133.53
25. Provisions- Non current
` crore
ParticularsAs at
31st March, 2017 As at
31st March, 2016 As at
1st April, 2015Provision for employee benefits- Gratuity 23.71 15.92 20.48 - Other Defined Benefit Plans(refer note 45) 13.89 11.89 11.41
37.60 27.81 31.89
26. Deferred tax assets/(liabilities)
` crore
ParticularsAs at
31st March, 2017 As at
31st March, 2016 As at
1st April, 2015Deferred tax assets- Unabsorbed depreciation & Carried forward tax losses 4,163.03 3,649.93 2,539.68 - Difference between book & tax base related to Investments 7.46 9.83 4.34 - Disallowance u/s 43B of Income Tax Act, 1961 246.79 137.59 148.09 - Provision for doubtful debts & advances 33.01 30.65 19.20 Total (A) 4,450.29 3,828.00 2,711.31 Deferred tax liabilities- Difference between book & tax base related to PPE (including CWIP) 8,778.14 8,626.72 8,419.53 - Difference between book & tax base related to Intangible assets 9.72 7.95 4.26 - Difference between book & tax base related to others 441.07 441.07 441.07 Total (B) 9,228.93 9,075.74 8,864.86 Net liability (A-B) (4,778.64) (5,247.74) (6,153.55)Mat credit entitlement 795.01 795.01 795.01
(3,983.63) (4,452.73) (5,358.54)
Reconciliation of Deferred Tax Asset/ (Liabilities):
` crore
ParticularsAs at
31.03.2017 As at
31.03.2016 Opening Balance as on 1st April (5,247.74) (6,153.55)Deferred tax income/ (expense) during the period recognised in profit & loss 470.53 911.54 Deferred tax income/ (expense) during the period recognised in Other Comprehensive Income (1.43) (5.73)Closing Balance (4,778.64) (5,247.74)
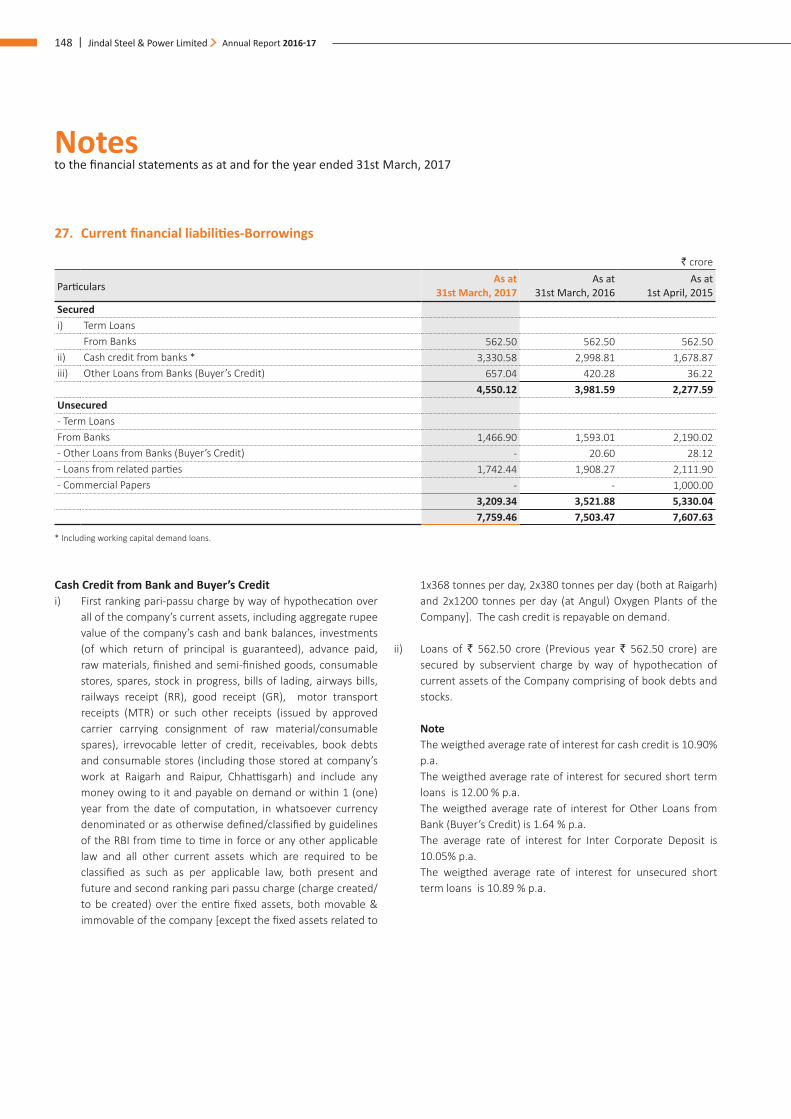
Notes to the financial statements as at and for the year ended 31st March, 2017
148 | Jindal Steel & Power Limited Annual Report 2016-17
27. Current financial liabilities-Borrowings
` crore
ParticularsAs at
31st March, 2017 As at
31st March, 2016 As at
1st April, 2015Securedi) Term Loans
From Banks 562.50 562.50 562.50 ii) Cash credit from banks * 3,330.58 2,998.81 1,678.87 iii) Other Loans from Banks (Buyer’s Credit) 657.04 420.28 36.22
4,550.12 3,981.59 2,277.59 Unsecured- Term LoansFrom Banks 1,466.90 1,593.01 2,190.02 - Other Loans from Banks (Buyer’s Credit) - 20.60 28.12 - Loans from related parties 1,742.44 1,908.27 2,111.90 - Commercial Papers - - 1,000.00
3,209.34 3,521.88 5,330.04 7,759.46 7,503.47 7,607.63
* Including working capital demand loans.
Cash Credit from Bank and Buyer’s Credit i) First ranking pari-passu charge by way of hypothecation over
all of the company’s current assets, including aggregate rupee value of the company’s cash and bank balances, investments (of which return of principal is guaranteed), advance paid, raw materials, finished and semi-finished goods, consumable stores, spares, stock in progress, bills of lading, airways bills, railways receipt (RR), good receipt (GR), motor transport receipts (MTR) or such other receipts (issued by approved carrier carrying consignment of raw material/consumable spares), irrevocable letter of credit, receivables, book debts and consumable stores (including those stored at company’s work at Raigarh and Raipur, Chhattisgarh) and include any money owing to it and payable on demand or within 1 (one) year from the date of computation, in whatsoever currency denominated or as otherwise defined/classified by guidelines of the RBI from time to time in force or any other applicable law and all other current assets which are required to be classified as such as per applicable law, both present and future and second ranking pari passu charge (charge created/to be created) over the entire fixed assets, both movable & immovable of the company [except the fixed assets related to
1x368 tonnes per day, 2x380 tonnes per day (both at Raigarh) and 2x1200 tonnes per day (at Angul) Oxygen Plants of the Company]. The cash credit is repayable on demand.
ii) Loans of ` 562.50 crore (Previous year ` 562.50 crore) are secured by subservient charge by way of hypothecation of current assets of the Company comprising of book debts and stocks.
Note The weigthed average rate of interest for cash credit is 10.90%
p.a. The weigthed average rate of interest for secured short term
loans is 12.00 % p.a. The weigthed average rate of interest for Other Loans from
Bank (Buyer’s Credit) is 1.64 % p.a. The average rate of interest for Inter Corporate Deposit is
10.05% p.a. The weigthed average rate of interest for unsecured short
term loans is 10.89 % p.a.
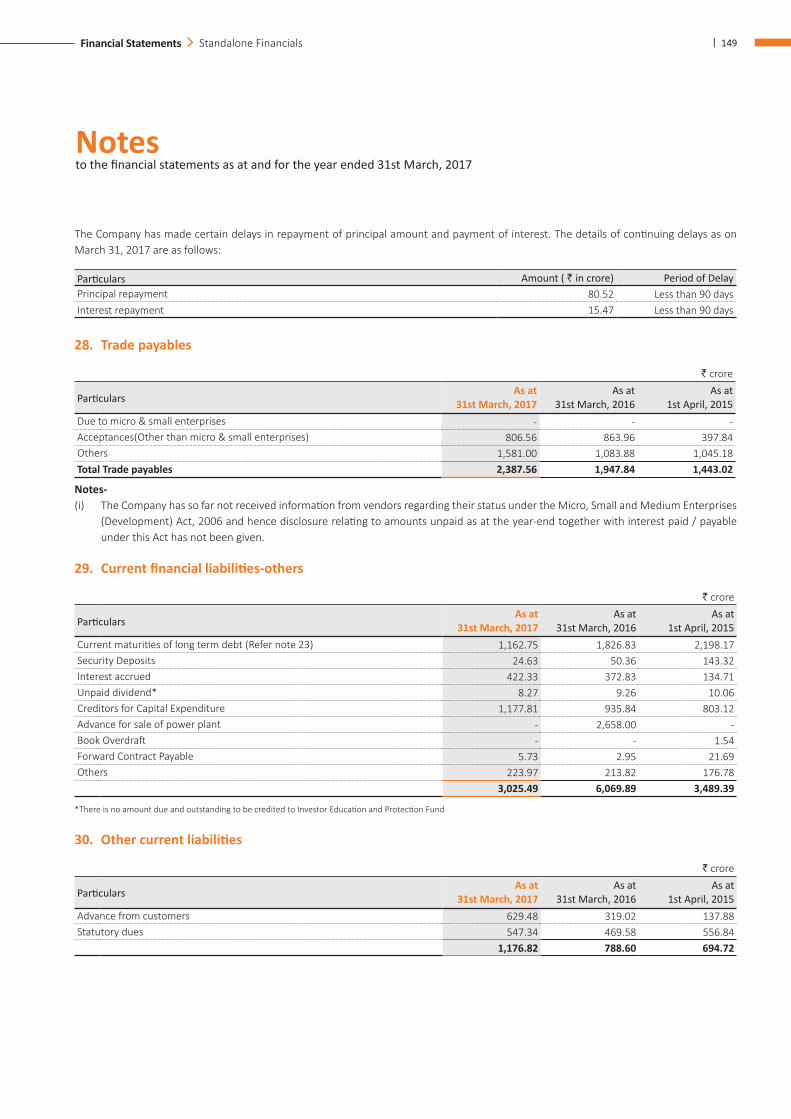
Notes to the financial statements as at and for the year ended 31st March, 2017
| 149Financial Statements Standalone Financials
The Company has made certain delays in repayment of principal amount and payment of interest. The details of continuing delays as on March 31, 2017 are as follows:
Particulars Amount ( ` in crore) Period of Delay Principal repayment 80.52 Less than 90 daysInterest repayment 15.47 Less than 90 days
28. Trade payables
` crore
ParticularsAs at
31st March, 2017 As at
31st March, 2016 As at
1st April, 2015Due to micro & small enterprises - - - Acceptances(Other than micro & small enterprises) 806.56 863.96 397.84 Others 1,581.00 1,083.88 1,045.18 Total Trade payables 2,387.56 1,947.84 1,443.02
Notes- (i) The Company has so far not received information from vendors regarding their status under the Micro, Small and Medium Enterprises
(Development) Act, 2006 and hence disclosure relating to amounts unpaid as at the year-end together with interest paid / payable under this Act has not been given.
29. Current financial liabilities-others
` crore
ParticularsAs at
31st March, 2017 As at
31st March, 2016 As at
1st April, 2015Current maturities of long term debt (Refer note 23) 1,162.75 1,826.83 2,198.17 Security Deposits 24.63 50.36 143.32 Interest accrued 422.33 372.83 134.71 Unpaid dividend* 8.27 9.26 10.06 Creditors for Capital Expenditure 1,177.81 935.84 803.12 Advance for sale of power plant - 2,658.00 - Book Overdraft - - 1.54 Forward Contract Payable 5.73 2.95 21.69 Others 223.97 213.82 176.78
3,025.49 6,069.89 3,489.39
*There is no amount due and outstanding to be credited to Investor Education and Protection Fund
30. Other current liabilities
` crore
ParticularsAs at
31st March, 2017 As at
31st March, 2016 As at
1st April, 2015Advance from customers 629.48 319.02 137.88 Statutory dues 547.34 469.58 556.84
1,176.82 788.60 694.72
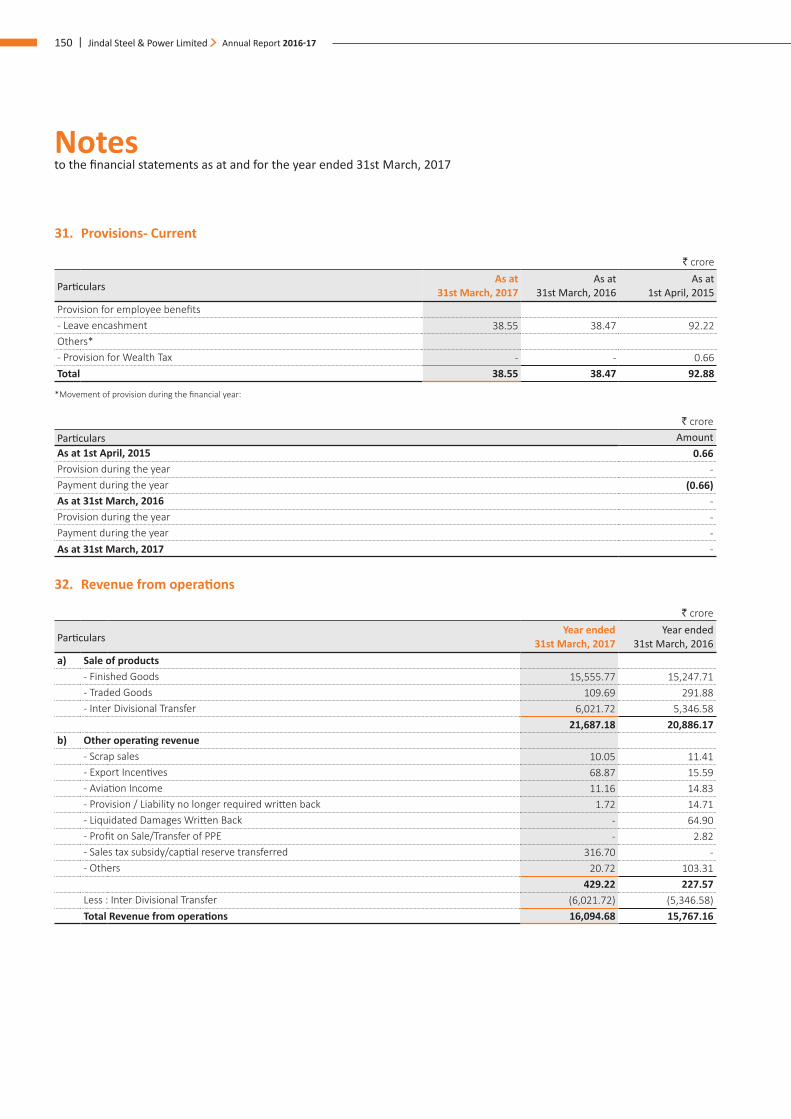
Notes to the financial statements as at and for the year ended 31st March, 2017
150 | Jindal Steel & Power Limited Annual Report 2016-17
31. Provisions- Current
` crore
ParticularsAs at
31st March, 2017 As at
31st March, 2016 As at
1st April, 2015Provision for employee benefits- Leave encashment 38.55 38.47 92.22 Others*- Provision for Wealth Tax - - 0.66 Total 38.55 38.47 92.88
*Movement of provision during the financial year:
` croreParticulars AmountAs at 1st April, 2015 0.66 Provision during the year - Payment during the year (0.66)As at 31st March, 2016 - Provision during the year - Payment during the year - As at 31st March, 2017 -
32. Revenue from operations
` crore
ParticularsYear ended
31st March, 2017 Year ended
31st March, 2016 a) Sale of products
- Finished Goods 15,555.77 15,247.71 - Traded Goods 109.69 291.88 - Inter Divisional Transfer 6,021.72 5,346.58
21,687.18 20,886.17 b) Other operating revenue
- Scrap sales 10.05 11.41 - Export Incentives 68.87 15.59 - Aviation Income 11.16 14.83 - Provision / Liability no longer required written back 1.72 14.71 - Liquidated Damages Written Back - 64.90 - Profit on Sale/Transfer of PPE - 2.82 - Sales tax subsidy/captial reserve transferred 316.70 - - Others 20.72 103.31
429.22 227.57 Less : Inter Divisional Transfer (6,021.72) (5,346.58)Total Revenue from operations 16,094.68 15,767.16
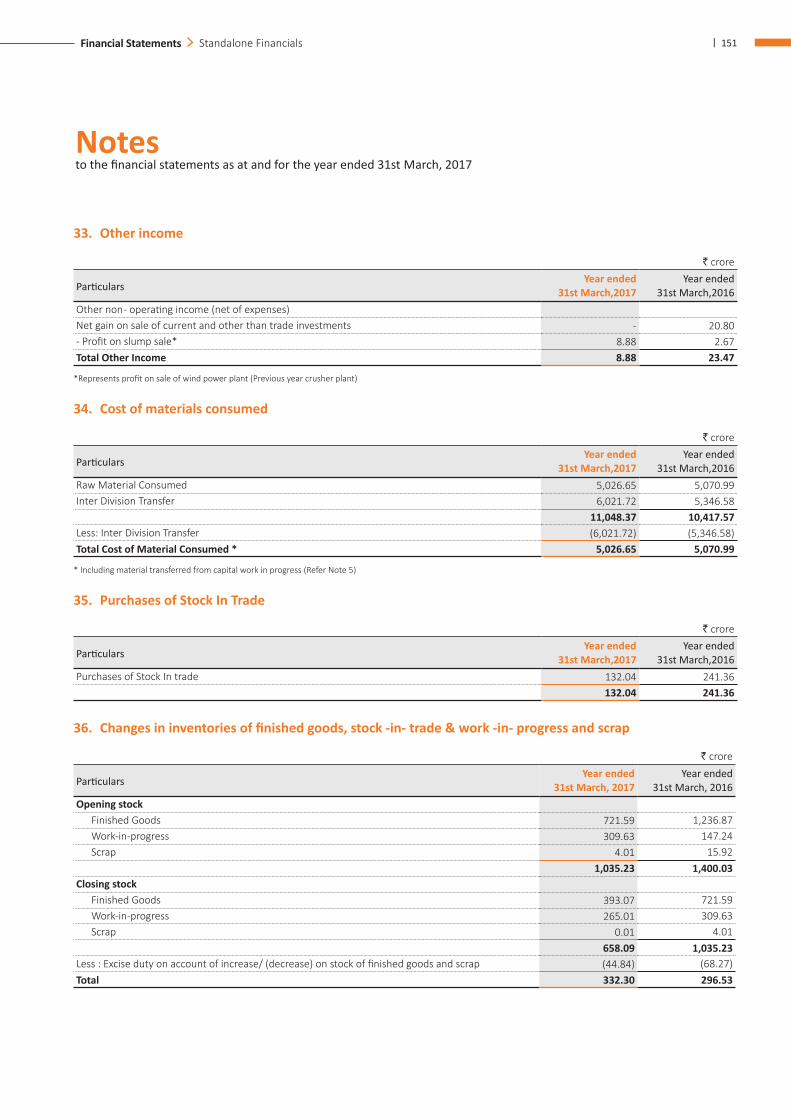
Notes to the financial statements as at and for the year ended 31st March, 2017
| 151Financial Statements Standalone Financials
33. Other income
` crore
ParticularsYear ended
31st March,2017 Year ended
31st March,2016 Other non - operating income (net of expenses)Net gain on sale of current and other than trade investments - 20.80 - Profit on slump sale* 8.88 2.67 Total Other Income 8.88 23.47
*Represents profit on sale of wind power plant (Previous year crusher plant)
34. Cost of materials consumed
` crore
ParticularsYear ended
31st March,2017 Year ended
31st March,2016 Raw Material Consumed 5,026.65 5,070.99 Inter Division Transfer 6,021.72 5,346.58
11,048.37 10,417.57 Less: Inter Division Transfer (6,021.72) (5,346.58)Total Cost of Material Consumed * 5,026.65 5,070.99
* Including material transferred from capital work in progress (Refer Note 5)
35. Purchases of Stock In Trade
` crore
ParticularsYear ended
31st March,2017 Year ended
31st March,2016 Purchases of Stock In trade 132.04 241.36
132.04 241.36
36. Changes in inventories of finished goods, stock -in- trade & work -in- progress and scrap
` crore
ParticularsYear ended
31st March, 2017 Year ended
31st March, 2016 Opening stock
Finished Goods 721.59 1,236.87 Work-in-progress 309.63 147.24 Scrap 4.01 15.92
1,035.23 1,400.03 Closing stock
Finished Goods 393.07 721.59 Work-in-progress 265.01 309.63 Scrap 0.01 4.01
658.09 1,035.23 Less : Excise duty on account of increase/ (decrease) on stock of finished goods and scrap (44.84) (68.27)Total 332.30 296.53
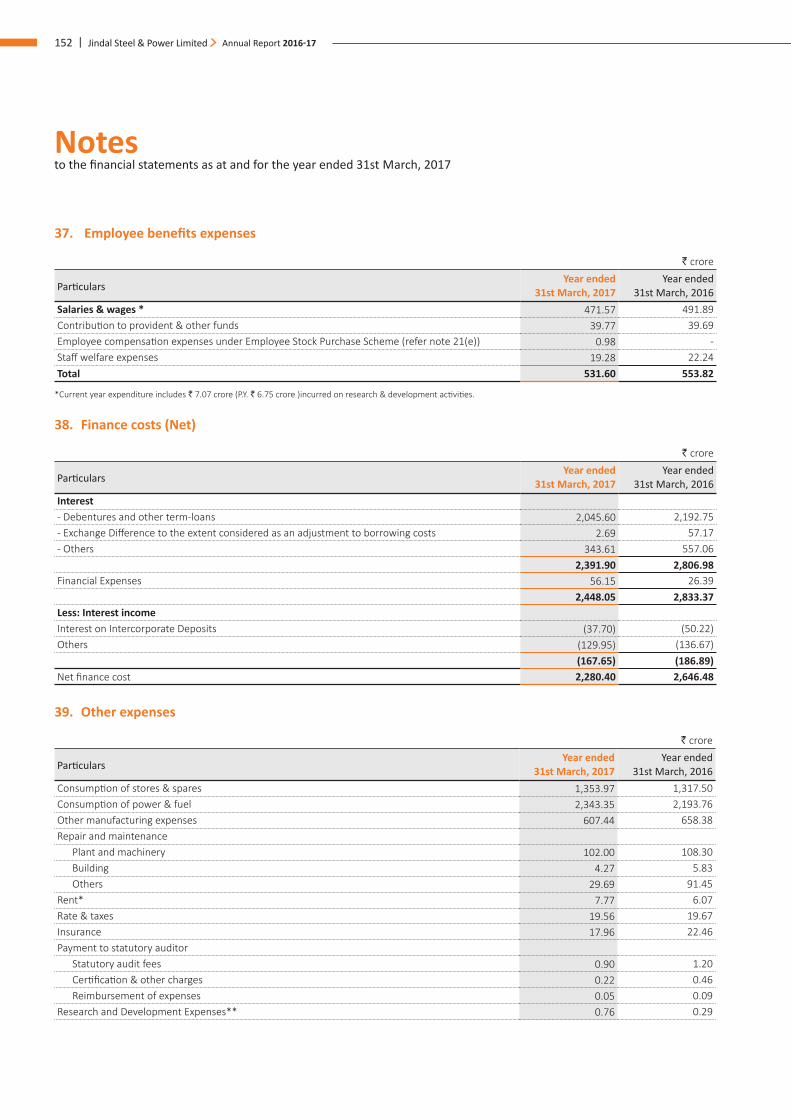
Notes to the financial statements as at and for the year ended 31st March, 2017
152 | Jindal Steel & Power Limited Annual Report 2016-17
37. Employee benefits expenses
` crore
ParticularsYear ended
31st March, 2017 Year ended
31st March, 2016 Salaries & wages * 471.57 491.89 Contribution to provident & other funds 39.77 39.69 Employee compensation expenses under Employee Stock Purchase Scheme (refer note 21(e)) 0.98 - Staff welfare expenses 19.28 22.24 Total 531.60 553.82
*Current year expenditure includes ` 7.07 crore (P.Y. ` 6.75 crore )incurred on research & development activities.
38. Finance costs (Net)
` crore
ParticularsYear ended
31st March, 2017 Year ended
31st March, 2016 Interest- Debentures and other term-loans 2,045.60 2,192.75 - Exchange Difference to the extent considered as an adjustment to borrowing costs 2.69 57.17 - Others 343.61 557.06
2,391.90 2,806.98 Financial Expenses 56.15 26.39
2,448.05 2,833.37 Less: Interest incomeInterest on Intercorporate Deposits (37.70) (50.22)Others (129.95) (136.67)
(167.65) (186.89)Net finance cost 2,280.40 2,646.48
39. Other expenses
` crore
ParticularsYear ended
31st March, 2017 Year ended
31st March, 2016 Consumption of stores & spares 1,353.97 1,317.50 Consumption of power & fuel 2,343.35 2,193.76 Other manufacturing expenses 607.44 658.38 Repair and maintenance
Plant and machinery 102.00 108.30 Building 4.27 5.83 Others 29.69 91.45
Rent* 7.77 6.07 Rate & taxes 19.56 19.67 Insurance 17.96 22.46 Payment to statutory auditor
Statutory audit fees 0.90 1.20 Certification & other charges 0.22 0.46 Reimbursement of expenses 0.05 0.09
Research and Development Expenses** 0.76 0.29
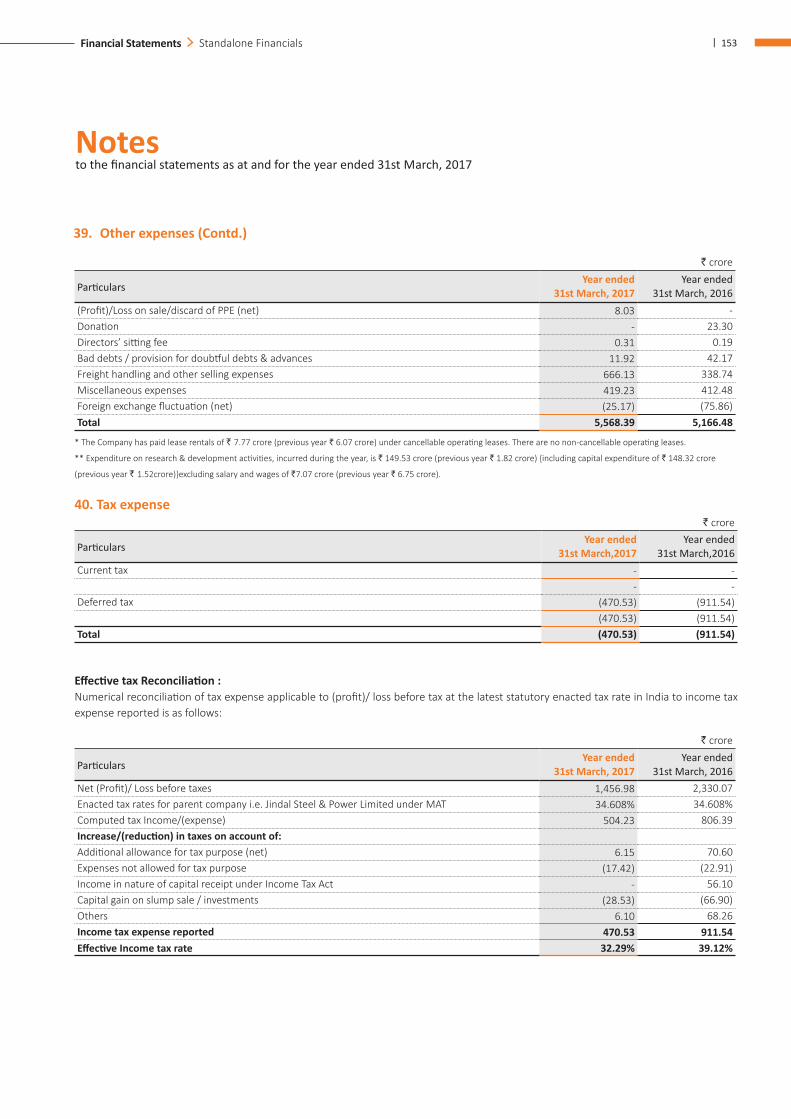
Notes to the financial statements as at and for the year ended 31st March, 2017
| 153Financial Statements Standalone Financials
` crore
ParticularsYear ended
31st March, 2017 Year ended
31st March, 2016 (Profit)/Loss on sale/discard of PPE (net) 8.03 - Donation - 23.30 Directors’ sitting fee 0.31 0.19 Bad debts / provision for doubtful debts & advances 11.92 42.17 Freight handling and other selling expenses 666.13 338.74 Miscellaneous expenses 419.23 412.48 Foreign exchange fluctuation (net) (25.17) (75.86)Total 5,568.39 5,166.48
* The Company has paid lease rentals of ` 7.77 crore (previous year ` 6.07 crore) under cancellable operating leases. There are no non-cancellable operating leases.
** Expenditure on research & development activities, incurred during the year, is ` 149.53 crore (previous year ` 1.82 crore) {including capital expenditure of ` 148.32 crore
(previous year ` 1.52crore)}excluding salary and wages of `7.07 crore (previous year ` 6.75 crore).
40. Tax expense` crore
ParticularsYear ended
31st March,2017 Year ended
31st March,2016 Current tax - -
- - Deferred tax (470.53) (911.54)
(470.53) (911.54)Total (470.53) (911.54)
Effective tax Reconciliation : Numerical reconciliation of tax expense applicable to (profit)/ loss before tax at the latest statutory enacted tax rate in India to income tax expense reported is as follows:
` crore
ParticularsYear ended
31st March, 2017 Year ended
31st March, 2016 Net (Profit)/ Loss before taxes 1,456.98 2,330.07 Enacted tax rates for parent company i.e. Jindal Steel & Power Limited under MAT 34.608% 34.608%Computed tax Income/(expense) 504.23 806.39 Increase/(reduction) in taxes on account of:Additional allowance for tax purpose (net) 6.15 70.60 Expenses not allowed for tax purpose (17.42) (22.91)Income in nature of capital receipt under Income Tax Act - 56.10 Capital gain on slump sale / investments (28.53) (66.90)Others 6.10 68.26 Income tax expense reported 470.53 911.54 Effective Income tax rate 32.29% 39.12%
39. Other expenses (Contd.)
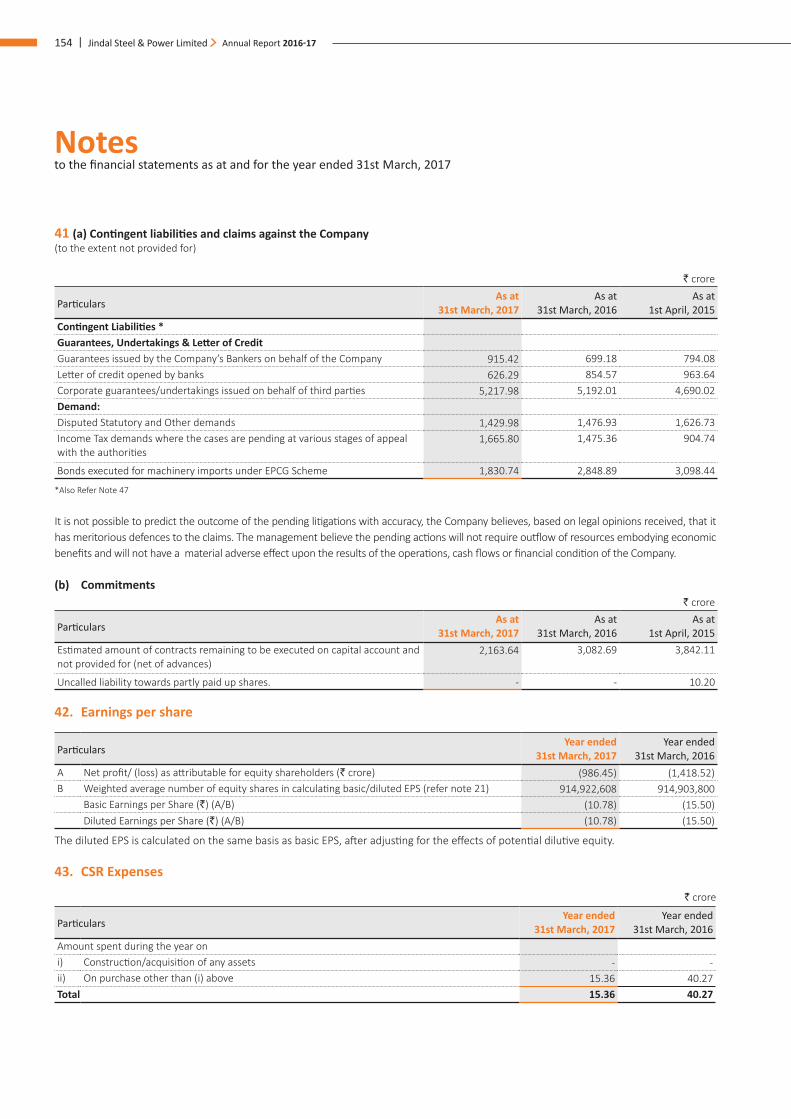
Notes to the financial statements as at and for the year ended 31st March, 2017
154 | Jindal Steel & Power Limited Annual Report 2016-17
41 (a) Contingent liabilities and claims against the Company (to the extent not provided for)
` crore
ParticularsAs at
31st March, 2017 As at
31st March, 2016 As at
1st April, 2015Contingent Liabilities *Guarantees, Undertakings & Letter of CreditGuarantees issued by the Company’s Bankers on behalf of the Company 915.42 699.18 794.08 Letter of credit opened by banks 626.29 854.57 963.64 Corporate guarantees/undertakings issued on behalf of third parties 5,217.98 5,192.01 4,690.02 Demand:Disputed Statutory and Other demands 1,429.98 1,476.93 1,626.73 Income Tax demands where the cases are pending at various stages of appeal with the authorities
1,665.80 1,475.36 904.74
Bonds executed for machinery imports under EPCG Scheme 1,830.74 2,848.89 3,098.44
*Also Refer Note 47
It is not possible to predict the outcome of the pending litigations with accuracy, the Company believes, based on legal opinions received, that it has meritorious defences to the claims. The management believe the pending actions will not require outflow of resources embodying economic benefits and will not have a material adverse effect upon the results of the operations, cash flows or financial condition of the Company.
(b) Commitments` crore
ParticularsAs at
31st March, 2017 As at
31st March, 2016 As at
1st April, 2015Estimated amount of contracts remaining to be executed on capital account and not provided for (net of advances)
2,163.64 3,082.69 3,842.11
Uncalled liability towards partly paid up shares. - - 10.20
42. Earnings per share
ParticularsYear ended
31st March, 2017 Year ended
31st March, 2016 A Net profit/ (loss) as attributable for equity shareholders (` crore) (986.45) (1,418.52)B Weighted average number of equity shares in calculating basic/diluted EPS (refer note 21) 914,922,608 914,903,800
Basic Earnings per Share (`) (A/B) (10.78) (15.50)Diluted Earnings per Share (`) (A/B) (10.78) (15.50)
The diluted EPS is calculated on the same basis as basic EPS, after adjusting for the effects of potential dilutive equity.
43. CSR Expenses
` crore
ParticularsYear ended
31st March, 2017 Year ended
31st March, 2016 Amount spent during the year on i) Construction/acquisition of any assets - - ii) On purchase other than (i) above 15.36 40.27 Total 15.36 40.27
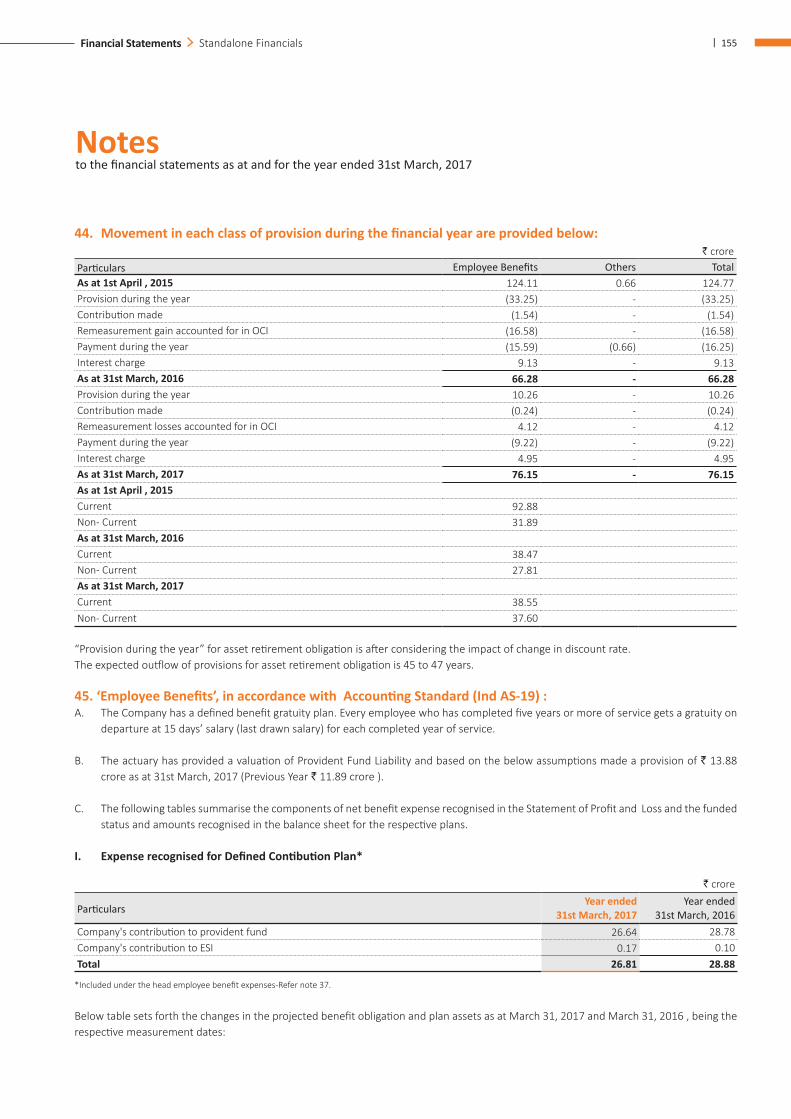
Notes to the financial statements as at and for the year ended 31st March, 2017
| 155Financial Statements Standalone Financials
44. Movement in each class of provision during the financial year are provided below:` crore
Particulars Employee Benefits Others TotalAs at 1st April , 2015 124.11 0.66 124.77 Provision during the year (33.25) - (33.25)Contribution made (1.54) - (1.54)Remeasurement gain accounted for in OCI (16.58) - (16.58)Payment during the year (15.59) (0.66) (16.25)Interest charge 9.13 - 9.13 As at 31st March, 2016 66.28 - 66.28 Provision during the year 10.26 - 10.26 Contribution made (0.24) - (0.24)Remeasurement losses accounted for in OCI 4.12 - 4.12 Payment during the year (9.22) - (9.22)Interest charge 4.95 - 4.95 As at 31st March, 2017 76.15 - 76.15 As at 1st April , 2015Current 92.88 Non- Current 31.89 As at 31st March, 2016Current 38.47 Non- Current 27.81 As at 31st March, 2017Current 38.55 Non- Current 37.60
“Provision during the year” for asset retirement obligation is after considering the impact of change in discount rate.The expected outflow of provisions for asset retirement obligation is 45 to 47 years.
45. ‘Employee Benefits’, in accordance with Accounting Standard (Ind AS-19) :A. The Company has a defined benefit gratuity plan. Every employee who has completed five years or more of service gets a gratuity on
departure at 15 days’ salary (last drawn salary) for each completed year of service.
B. The actuary has provided a valuation of Provident Fund Liability and based on the below assumptions made a provision of ` 13.88 crore as at 31st March, 2017 (Previous Year ` 11.89 crore ).
C. The following tables summarise the components of net benefit expense recognised in the Statement of Profit and Loss and the funded status and amounts recognised in the balance sheet for the respective plans.
I. Expense recognised for Defined Contibution Plan*
` crore
ParticularsYear ended
31st March, 2017 Year ended
31st March, 2016 Company's contribution to provident fund 26.64 28.78 Company's contribution to ESI 0.17 0.10 Total 26.81 28.88
*Included under the head employee benefit expenses-Refer note 37.
Below table sets forth the changes in the projected benefit obligation and plan assets as at March 31, 2017 and March 31, 2016 , being the respective measurement dates:
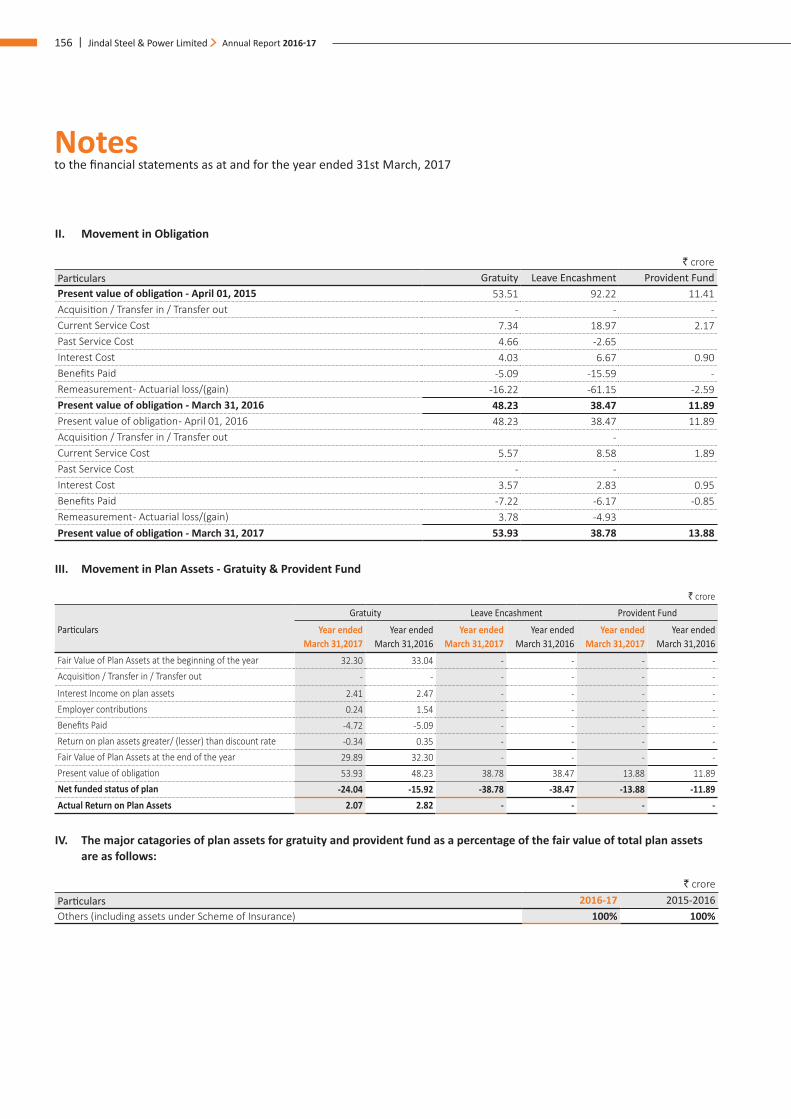
Notes to the financial statements as at and for the year ended 31st March, 2017
156 | Jindal Steel & Power Limited Annual Report 2016-17
II. Movement in Obligation
` crore Particulars Gratuity Leave Encashment Provident FundPresent value of obligation - April 01, 2015 53.51 92.22 11.41 Acquisition / Transfer in / Transfer out - - - Current Service Cost 7.34 18.97 2.17 Past Service Cost 4.66 -2.65 Interest Cost 4.03 6.67 0.90 Benefits Paid -5.09 -15.59 - Remeasurement - Actuarial loss/(gain) -16.22 -61.15 -2.59 Present value of obligation - March 31, 2016 48.23 38.47 11.89 Present value of obligation - April 01, 2016 48.23 38.47 11.89 Acquisition / Transfer in / Transfer out - Current Service Cost 5.57 8.58 1.89 Past Service Cost - - Interest Cost 3.57 2.83 0.95 Benefits Paid -7.22 -6.17 -0.85 Remeasurement - Actuarial loss/(gain) 3.78 -4.93 Present value of obligation - March 31, 2017 53.93 38.78 13.88
III. Movement in Plan Assets - Gratuity & Provident Fund
` crore
Particulars
Gratuity Leave Encashment Provident Fund
Year ended March 31,2017
Year ended March 31,2016
Year ended March 31,2017
Year ended March 31,2016
Year ended March 31,2017
Year ended March 31,2016
Fair Value of Plan Assets at the beginning of the year 32.30 33.04 - - - - Acquisition / Transfer in / Transfer out - - - - - -
Interest Income on plan assets 2.41 2.47 - - - - Employer contributions 0.24 1.54 - - - - Benefits Paid -4.72 -5.09 - - - - Return on plan assets greater/ (lesser) than discount rate -0.34 0.35 - - - - Fair Value of Plan Assets at the end of the year 29.89 32.30 - - - - Present value of obligation 53.93 48.23 38.78 38.47 13.88 11.89 Net funded status of plan -24.04 -15.92 -38.78 -38.47 -13.88 -11.89 Actual Return on Plan Assets 2.07 2.82 - - - -
IV. The major catagories of plan assets for gratuity and provident fund as a percentage of the fair value of total plan assets are as follows:
` croreParticulars 2016-17 2015-2016Others (including assets under Scheme of Insurance) 100% 100%
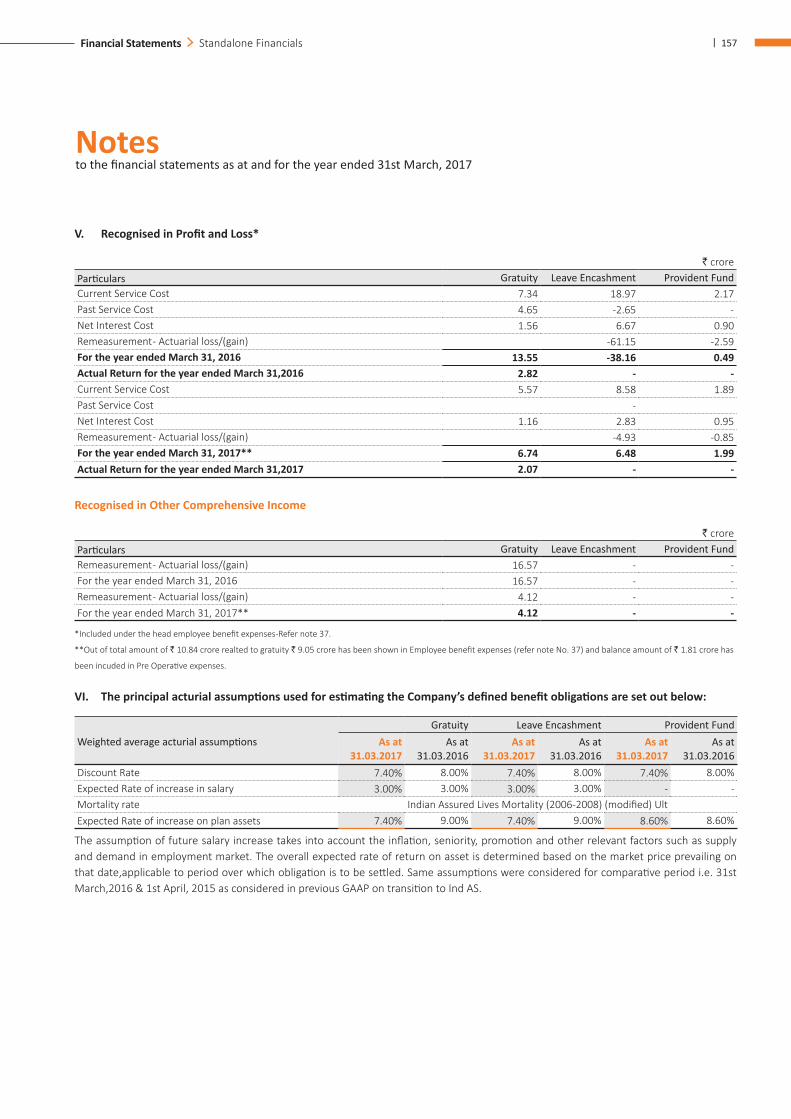
Notes to the financial statements as at and for the year ended 31st March, 2017
| 157Financial Statements Standalone Financials
V. Recognised in Profit and Loss*
` crore Particulars Gratuity Leave Encashment Provident FundCurrent Service Cost 7.34 18.97 2.17 Past Service Cost 4.65 -2.65 - Net Interest Cost 1.56 6.67 0.90 Remeasurement - Actuarial loss/(gain) -61.15 -2.59 For the year ended March 31, 2016 13.55 -38.16 0.49 Actual Return for the year ended March 31,2016 2.82 - - Current Service Cost 5.57 8.58 1.89 Past Service Cost - Net Interest Cost 1.16 2.83 0.95 Remeasurement - Actuarial loss/(gain) -4.93 -0.85 For the year ended March 31, 2017** 6.74 6.48 1.99 Actual Return for the year ended March 31,2017 2.07 - -
Recognised in Other Comprehensive Income
` crore Particulars Gratuity Leave Encashment Provident FundRemeasurement - Actuarial loss/(gain) 16.57 - - For the year ended March 31, 2016 16.57 - - Remeasurement - Actuarial loss/(gain) 4.12 - - For the year ended March 31, 2017** 4.12 - -
*Included under the head employee benefit expenses-Refer note 37.
**Out of total amount of ` 10.84 crore realted to gratuity ` 9.05 crore has been shown in Employee benefit expenses (refer note No. 37) and balance amount of ` 1.81 crore has
been incuded in Pre Operative expenses.
VI. The principal acturial assumptions used for estimating the Company’s defined benefit obligations are set out below:
Weighted average acturial assumptionsGratuity Leave Encashment Provident Fund
As at 31.03.2017
As at 31.03.2016
As at 31.03.2017
As at 31.03.2016
As at 31.03.2017
As at 31.03.2016
Discount Rate 7.40% 8.00% 7.40% 8.00% 7.40% 8.00%Expected Rate of increase in salary 3.00% 3.00% 3.00% 3.00% - - Mortality rate Indian Assured Lives Mortality (2006-2008) (modified) UltExpected Rate of increase on plan assets 7.40% 9.00% 7.40% 9.00% 8.60% 8.60%
The assumption of future salary increase takes into account the inflation, seniority, promotion and other relevant factors such as supply and demand in employment market. The overall expected rate of return on asset is determined based on the market price prevailing on that date,applicable to period over which obligation is to be settled. Same assumptions were considered for comparative period i.e. 31st March,2016 & 1st April, 2015 as considered in previous GAAP on transition to Ind AS.
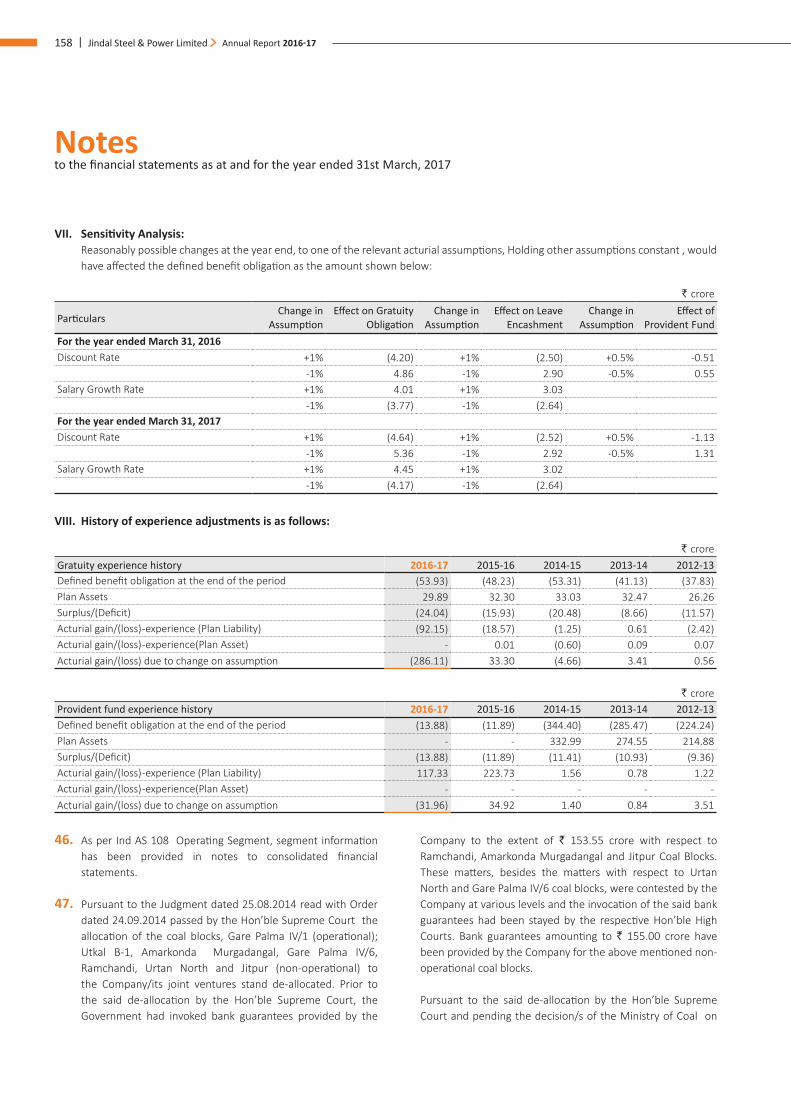
Notes to the financial statements as at and for the year ended 31st March, 2017
158 | Jindal Steel & Power Limited Annual Report 2016-17
VII. Sensitivity Analysis: Reasonably possible changes at the year end, to one of the relevant acturial assumptions, Holding other assumptions constant , would
have affected the defined benefit obligation as the amount shown below:
` crore
ParticularsChange in
AssumptionEffect on Gratuity
ObligationChange in
AssumptionEffect on Leave
EncashmentChange in
AssumptionEffect of
Provident FundFor the year ended March 31, 2016Discount Rate +1% (4.20) +1% (2.50) +0.5% -0.51
-1% 4.86 -1% 2.90 -0.5% 0.55Salary Growth Rate +1% 4.01 +1% 3.03
-1% (3.77) -1% (2.64)For the year ended March 31, 2017Discount Rate +1% (4.64) +1% (2.52) +0.5% -1.13
-1% 5.36 -1% 2.92 -0.5% 1.31Salary Growth Rate +1% 4.45 +1% 3.02
-1% (4.17) -1% (2.64)
VIII. History of experience adjustments is as follows:
` croreGratuity experience history 2016-17 2015-16 2014-15 2013-14 2012-13 Defined benefit obligation at the end of the period (53.93) (48.23) (53.31) (41.13) (37.83)Plan Assets 29.89 32.30 33.03 32.47 26.26 Surplus/(Deficit) (24.04) (15.93) (20.48) (8.66) (11.57)Acturial gain/(loss) -experience (Plan Liability) (92.15) (18.57) (1.25) 0.61 (2.42)Acturial gain/(loss) -experience(Plan Asset) - 0.01 (0.60) 0.09 0.07 Acturial gain/(loss) due to change on assumption (286.11) 33.30 (4.66) 3.41 0.56
` croreProvident fund experience history 2016-17 2015-16 2014-15 2013-14 2012-13 Defined benefit obligation at the end of the period (13.88) (11.89) (344.40) (285.47) (224.24)Plan Assets - - 332.99 274.55 214.88 Surplus/(Deficit) (13.88) (11.89) (11.41) (10.93) (9.36)Acturial gain/(loss) -experience (Plan Liability) 117.33 223.73 1.56 0.78 1.22 Acturial gain/(loss) -experience(Plan Asset) - - - - - Acturial gain/(loss) due to change on assumption (31.96) 34.92 1.40 0.84 3.51
46. As per Ind AS 108 Operating Segment, segment information has been provided in notes to consolidated financial statements.
47. Pursuant to the Judgment dated 25.08.2014 read with Order dated 24.09.2014 passed by the Hon’ble Supreme Court the allocation of the coal blocks, Gare Palma IV/1 (operational); Utkal B-1, Amarkonda Murgadangal, Gare Palma IV/6, Ramchandi, Urtan North and Jitpur (non-operational) to the Company/its joint ventures stand de-allocated. Prior to the said de-allocation by the Hon’ble Supreme Court, the Government had invoked bank guarantees provided by the
Company to the extent of ` 153.55 crore with respect to Ramchandi, Amarkonda Murgadangal and Jitpur Coal Blocks. These matters, besides the matters with respect to Urtan North and Gare Palma IV/6 coal blocks, were contested by the Company at various levels and the invocation of the said bank guarantees had been stayed by the respective Hon’ble High Courts. Bank guarantees amounting to ` 155.00 crore have been provided by the Company for the above mentioned non- operational coal blocks.
Pursuant to the said de-allocation by the Hon’ble Supreme Court and pending the decision/s of the Ministry of Coal on
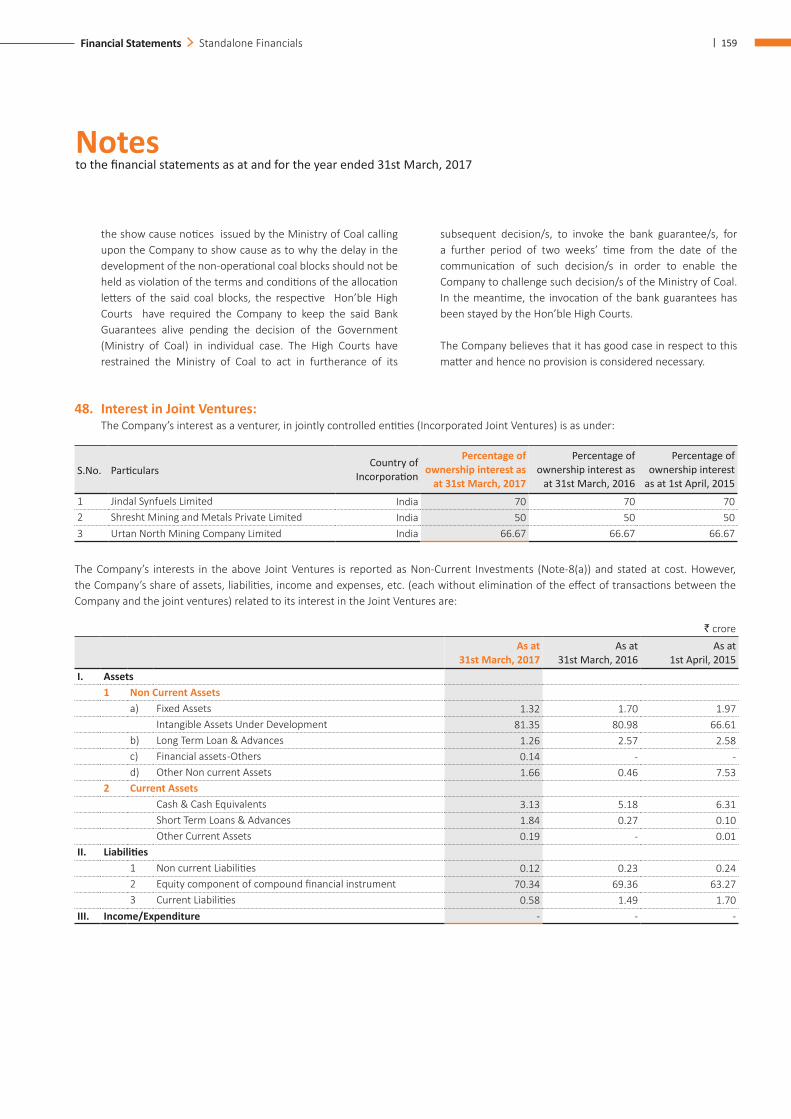
Notes to the financial statements as at and for the year ended 31st March, 2017
| 159Financial Statements Standalone Financials
the show cause notices issued by the Ministry of Coal calling upon the Company to show cause as to why the delay in the development of the non-operational coal blocks should not be held as violation of the terms and conditions of the allocation letters of the said coal blocks, the respective Hon’ble High Courts have required the Company to keep the said Bank Guarantees alive pending the decision of the Government (Ministry of Coal) in individual case. The High Courts have restrained the Ministry of Coal to act in furtherance of its
subsequent decision/s, to invoke the bank guarantee/s, for a further period of two weeks’ time from the date of the communication of such decision/s in order to enable the Company to challenge such decision/s of the Ministry of Coal. In the meantime, the invocation of the bank guarantees has been stayed by the Hon’ble High Courts.
The Company believes that it has good case in respect to this matter and hence no provision is considered necessary.
48. Interest in Joint Ventures: The Company’s interest as a venturer, in jointly controlled entities (Incorporated Joint Ventures) is as under:
S.No. Particulars Country of
Incorporation
Percentage of ownership interest as
at 31st March, 2017
Percentage of ownership interest as
at 31st March, 2016
Percentage of ownership interest
as at 1st April, 20151 Jindal Synfuels Limited India 70 70 702 Shresht Mining and Metals Private Limited India 50 50 503 Urtan North Mining Company Limited India 66.67 66.67 66.67
The Company’s interests in the above Joint Ventures is reported as Non-Current Investments (Note-8(a)) and stated at cost. However, the Company’s share of assets, liabilities, income and expenses, etc. (each without elimination of the effect of transactions between the Company and the joint ventures) related to its interest in the Joint Ventures are:
` croreAs at
31st March, 2017As at
31st March, 2016As at
1st April, 2015I. Assets
1 Non Current Assetsa) Fixed Assets 1.32 1.70 1.97
Intangible Assets Under Development 81.35 80.98 66.61 b) Long Term Loan & Advances 1.26 2.57 2.58 c) Financial assets -Others 0.14 - - d) Other Non current Assets 1.66 0.46 7.53
2 Current AssetsCash & Cash Equivalents 3.13 5.18 6.31 Short Term Loans & Advances 1.84 0.27 0.10 Other Current Assets 0.19 - 0.01
II. Liabilities1 Non current Liabilities 0.12 0.23 0.242 Equity component of compound financial instrument 70.34 69.36 63.273 Current Liabilities 0.58 1.49 1.70
III. Income/Expenditure - - -
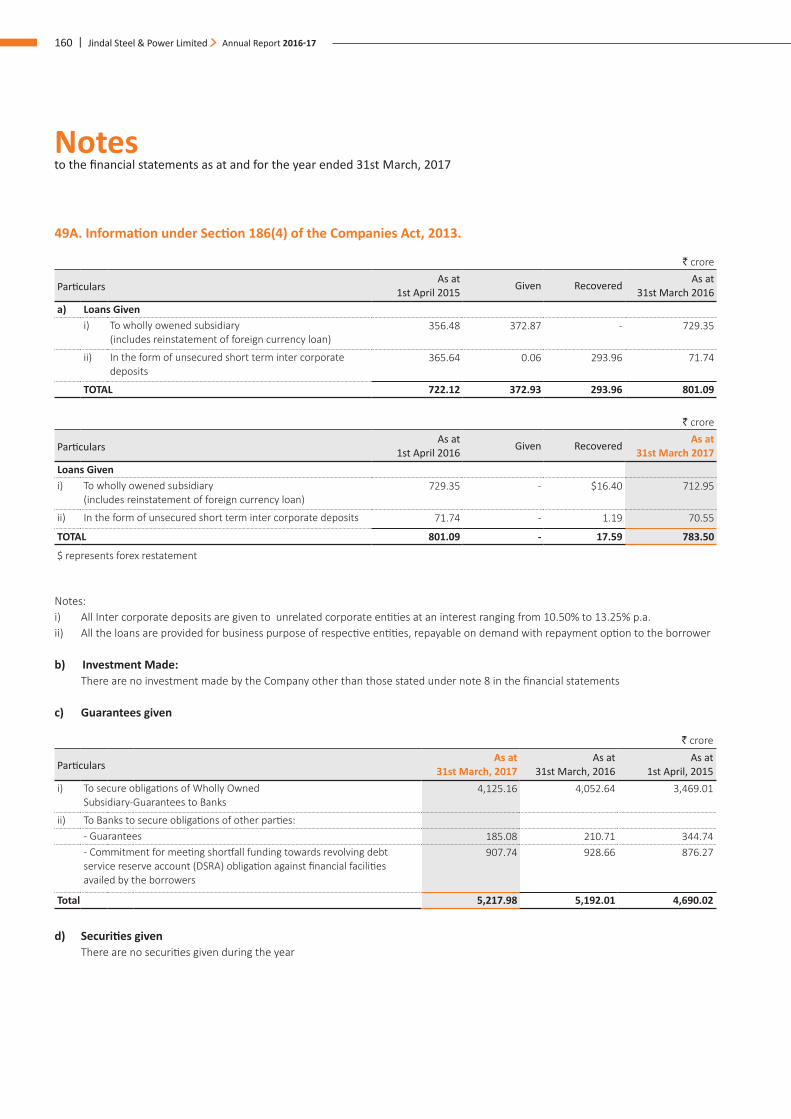
Notes to the financial statements as at and for the year ended 31st March, 2017
160 | Jindal Steel & Power Limited Annual Report 2016-17
49A. Information under Section 186(4) of the Companies Act, 2013.
` crore
ParticularsAs at
1st April 2015 Given Recovered As at 31st March 2016
a) Loans Giveni) To wholly owened subsidiary
(includes reinstatement of foreign currency loan)356.48 372.87 - 729.35
ii) In the form of unsecured short term inter corporate deposits
365.64 0.06 293.96 71.74
TOTAL 722.12 372.93 293.96 801.09
` crore
ParticularsAs at
1st April 2016 Given Recovered As at 31st March 2017
Loans Giveni) To wholly owened subsidiary
(includes reinstatement of foreign currency loan) 729.35 - $16.40 712.95
ii) In the form of unsecured short term inter corporate deposits 71.74 - 1.19 70.55
TOTAL 801.09 - 17.59 783.50
$ represents forex restatement
Notes: i) All Inter corporate deposits are given to unrelated corporate entities at an interest ranging from 10.50% to 13.25% p.a.ii) All the loans are provided for business purpose of respective entities, repayable on demand with repayment option to the borrower
b) Investment Made: There are no investment made by the Company other than those stated under note 8 in the financial statements
c) Guarantees given
` crore
ParticularsAs at
31st March, 2017As at
31st March, 2016As at
1st April, 2015i) To secure obligations of Wholly Owned
Subsidiary-Guarantees to Banks 4,125.16 4,052.64 3,469.01
ii) To Banks to secure obligations of other parties:- Guarantees 185.08 210.71 344.74 - Commitment for meeting shortfall funding towards revolving debt service reserve account (DSRA) obligation against financial facilities availed by the borrowers
907.74 928.66 876.27
Total 5,217.98 5,192.01 4,690.02
d) Securities given There are no securities given during the year
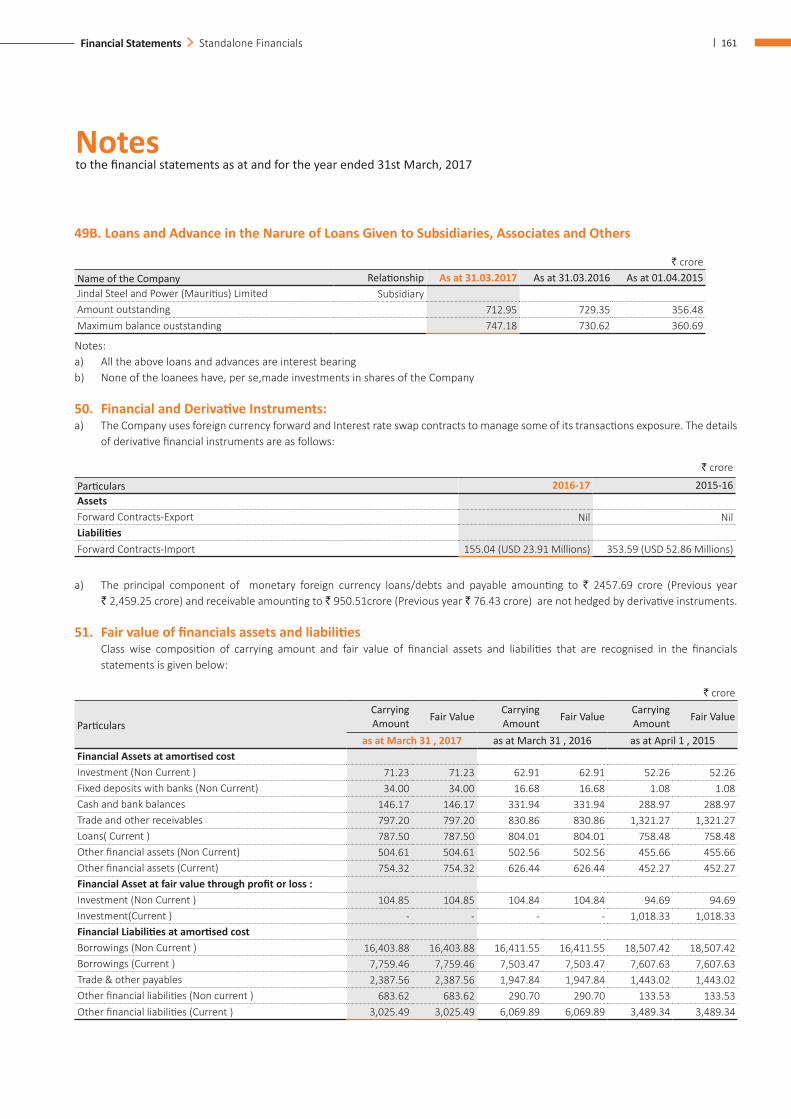
Notes to the financial statements as at and for the year ended 31st March, 2017
| 161Financial Statements Standalone Financials
49B. Loans and Advance in the Narure of Loans Given to Subsidiaries, Associates and Others
` croreName of the Company Relationship As at 31.03.2017 As at 31.03.2016 As at 01.04.2015 Jindal Steel and Power (Mauritius) Limited SubsidiaryAmount outstanding 712.95 729.35 356.48Maximum balance ouststanding 747.18 730.62 360.69
Notes: a) All the above loans and advances are interest bearing b) None of the loanees have, per se,made investments in shares of the Company
50. Financial and Derivative Instruments: a) The Company uses foreign currency forward and Interest rate swap contracts to manage some of its transactions exposure. The details
of derivative financial instruments are as follows:
` crore
Particulars 2016-17 2015-16AssetsForward Contracts-Export Nil NilLiabilitiesForward Contracts-Import 155.04 (USD 23.91 Millions) 353.59 (USD 52.86 Millions)
a) The principal component of monetary foreign currency loans/debts and payable amounting to ` 2457.69 crore (Previous year ` 2,459.25 crore) and receivable amounting to ` 950.51crore (Previous year ` 76.43 crore) are not hedged by derivative instruments.
51. Fair value of financials assets and liabilities Class wise composition of carrying amount and fair value of financial assets and liabilities that are recognised in the financials
statements is given below:
` crore
ParticularsCarrying Amount Fair Value Carrying
Amount Fair Value Carrying Amount Fair Value
as at March 31 , 2017 as at March 31 , 2016 as at April 1 , 2015Financial Assets at amortised costInvestment (Non Current ) 71.23 71.23 62.91 62.91 52.26 52.26 Fixed deposits with banks (Non Current) 34.00 34.00 16.68 16.68 1.08 1.08 Cash and bank balances 146.17 146.17 331.94 331.94 288.97 288.97 Trade and other receivables 797.20 797.20 830.86 830.86 1,321.27 1,321.27 Loans( Current ) 787.50 787.50 804.01 804.01 758.48 758.48 Other financial assets (Non Current) 504.61 504.61 502.56 502.56 455.66 455.66 Other financial assets (Current) 754.32 754.32 626.44 626.44 452.27 452.27 Financial Asset at fair value through profit or loss :Investment (Non Current ) 104.85 104.85 104.84 104.84 94.69 94.69 Investment(Current ) - - - - 1,018.33 1,018.33 Financial Liabilities at amortised costBorrowings (Non Current ) 16,403.88 16,403.88 16,411.55 16,411.55 18,507.42 18,507.42 Borrowings (Current ) 7,759.46 7,759.46 7,503.47 7,503.47 7,607.63 7,607.63 Trade & other payables 2,387.56 2,387.56 1,947.84 1,947.84 1,443.02 1,443.02 Other financial liabilities (Non current ) 683.62 683.62 290.70 290.70 133.53 133.53 Other financial liabilities (Current ) 3,025.49 3,025.49 6,069.89 6,069.89 3,489.34 3,489.34
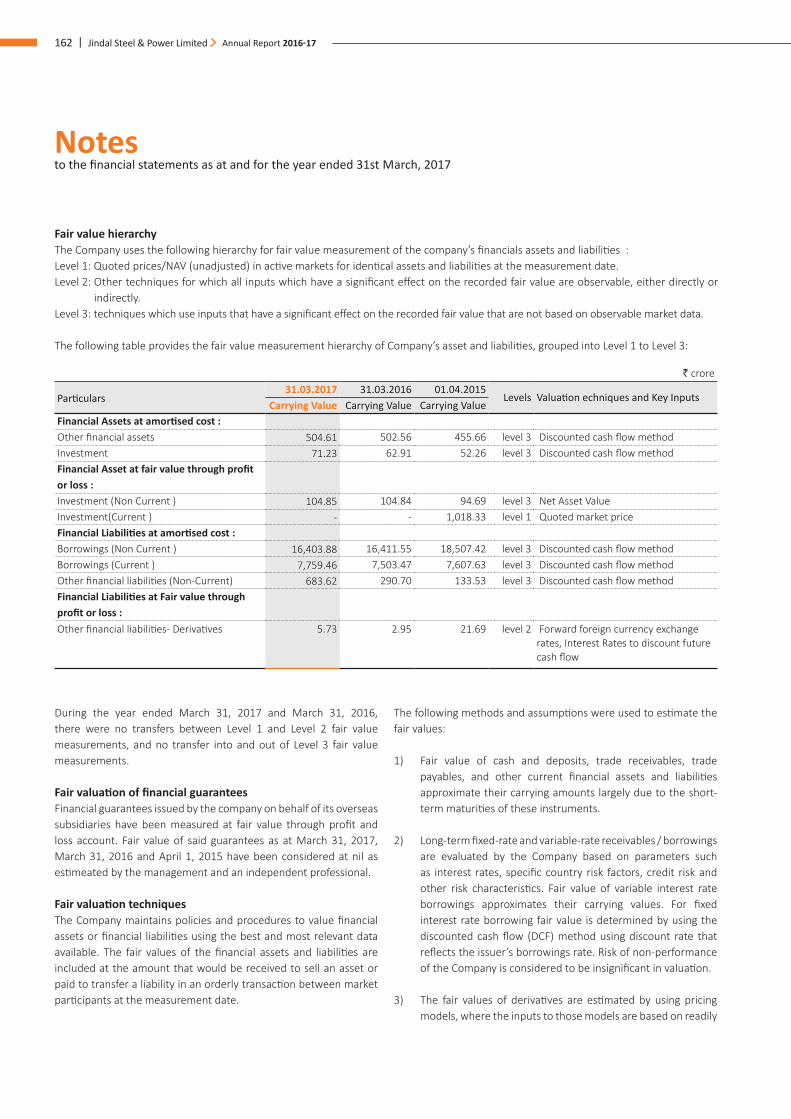
Notes to the financial statements as at and for the year ended 31st March, 2017
162 | Jindal Steel & Power Limited Annual Report 2016-17
Fair value hierarchy The Company uses the following hierarchy for fair value measurement of the company’s financials assets and liabilities : Level 1: Quoted prices/NAV (unadjusted) in active markets for identical assets and liabilities at the measurement date. Level 2: Other techniques for which all inputs which have a significant effect on the recorded fair value are observable, either directly or
indirectly. Level 3: techniques which use inputs that have a significant effect on the recorded fair value that are not based on observable market data.
The following table provides the fair value measurement hierarchy of Company’s asset and liabilities, grouped into Level 1 to Level 3:
` crore
Particulars31.03.2017 31.03.2016 01.04.2015
Levels Valuation echniques and Key InputsCarrying Value Carrying Value Carrying Value
Financial Assets at amortised cost :Other financial assets 504.61 502.56 455.66 level 3 Discounted cash flow method Investment 71.23 62.91 52.26 level 3 Discounted cash flow method Financial Asset at fair value through profit or loss :Investment (Non Current ) 104.85 104.84 94.69 level 3 Net Asset Value Investment(Current ) - - 1,018.33 level 1 Quoted market price Financial Liabilities at amortised cost :Borrowings (Non Current ) 16,403.88 16,411.55 18,507.42 level 3 Discounted cash flow method Borrowings (Current ) 7,759.46 7,503.47 7,607.63 level 3 Discounted cash flow method Other financial liabilities (Non-Current) 683.62 290.70 133.53 level 3 Discounted cash flow method Financial Liabilities at Fair value through profit or loss :Other financial liabilities- Derivatives 5.73 2.95 21.69 level 2 Forward foreign currency exchange
rates, Interest Rates to discount future cash flow
During the year ended March 31, 2017 and March 31, 2016, there were no transfers between Level 1 and Level 2 fair value measurements, and no transfer into and out of Level 3 fair value measurements.
Fair valuation of financial guarantees Financial guarantees issued by the company on behalf of its overseas subsidiaries have been measured at fair value through profit and loss account. Fair value of said guarantees as at March 31, 2017, March 31, 2016 and April 1, 2015 have been considered at nil as estimeated by the management and an independent professional.
Fair valuation techniques The Company maintains policies and procedures to value financial assets or financial liabilities using the best and most relevant data available. The fair values of the financial assets and liabilities are included at the amount that would be received to sell an asset or paid to transfer a liability in an orderly transaction between market participants at the measurement date.
The following methods and assumptions were used to estimate the fair values:
1) Fair value of cash and deposits, trade receivables, trade payables, and other current financial assets and liabilities approximate their carrying amounts largely due to the short-term maturities of these instruments.
2) Long-term fixed-rate and variable-rate receivables / borrowings are evaluated by the Company based on parameters such as interest rates, specific country risk factors, credit risk and other risk characteristics. Fair value of variable interest rate borrowings approximates their carrying values. For fixed interest rate borrowing fair value is determined by using the discounted cash flow (DCF) method using discount rate that reflects the issuer’s borrowings rate. Risk of non-performance of the Company is considered to be insignificant in valuation.
3) The fair values of derivatives are estimated by using pricing models, where the inputs to those models are based on readily
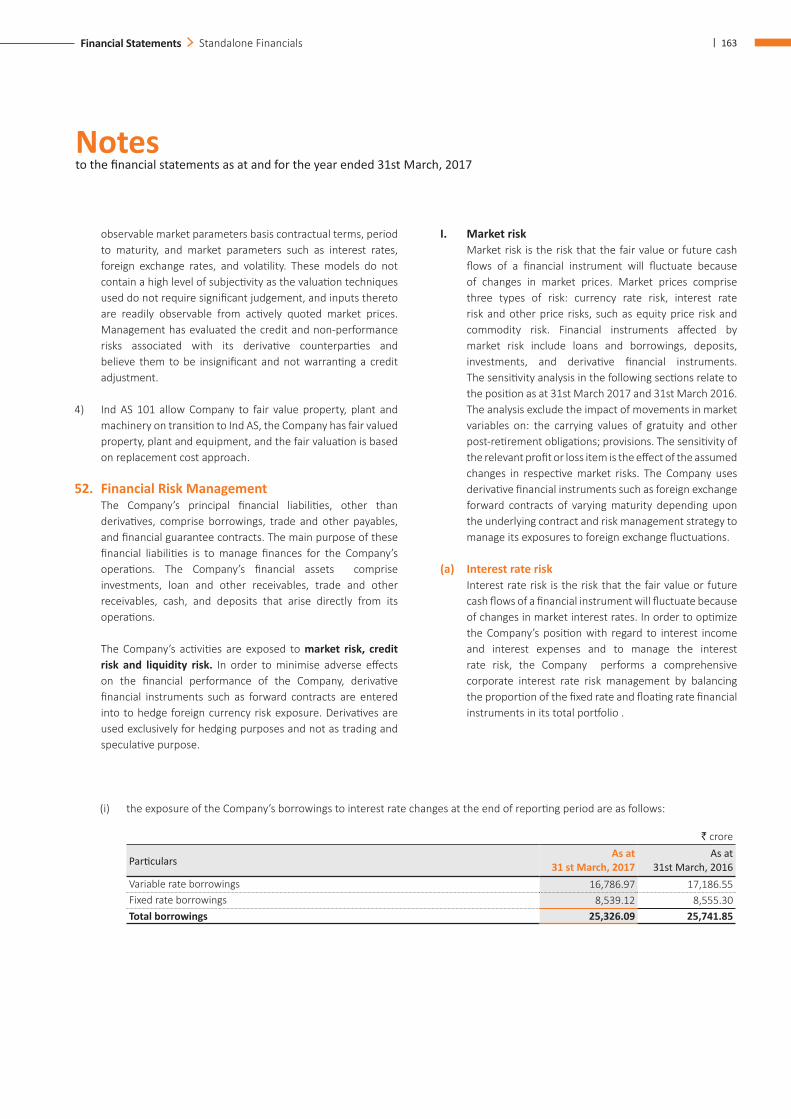
Notes to the financial statements as at and for the year ended 31st March, 2017
| 163Financial Statements Standalone Financials
observable market parameters basis contractual terms, period to maturity, and market parameters such as interest rates, foreign exchange rates, and volatility. These models do not contain a high level of subjectivity as the valuation techniques used do not require significant judgement, and inputs thereto are readily observable from actively quoted market prices. Management has evaluated the credit and non-performance risks associated with its derivative counterparties and believe them to be insignificant and not warranting a credit adjustment.
4) Ind AS 101 allow Company to fair value property, plant and machinery on transition to Ind AS, the Company has fair valued property, plant and equipment, and the fair valuation is based on replacement cost approach.
52. Financial Risk Management The Company’s principal financial liabilities, other than
derivatives, comprise borrowings, trade and other payables, and financial guarantee contracts. The main purpose of these financial liabilities is to manage finances for the Company’s operations. The Company’s financial assets comprise investments, loan and other receivables, trade and other receivables, cash, and deposits that arise directly from its operations.
The Company’s activities are exposed to market risk, credit risk and liquidity risk. In order to minimise adverse effects on the financial performance of the Company, derivative financial instruments such as forward contracts are entered into to hedge foreign currency risk exposure. Derivatives are used exclusively for hedging purposes and not as trading and speculative purpose.
I. Market risk Market risk is the risk that the fair value or future cash
flows of a financial instrument will fluctuate because of changes in market prices. Market prices comprise three types of risk: currency rate risk, interest rate risk and other price risks, such as equity price risk and commodity risk. Financial instruments affected by market risk include loans and borrowings, deposits, investments, and derivative financial instruments. The sensitivity analysis in the following sections relate to the position as at 31st March 2017 and 31st March 2016. The analysis exclude the impact of movements in market variables on: the carrying values of gratuity and other post-retirement obligations; provisions. The sensitivity of the relevant profit or loss item is the effect of the assumed changes in respective market risks. The Company uses derivative financial instruments such as foreign exchange forward contracts of varying maturity depending upon the underlying contract and risk management strategy to manage its exposures to foreign exchange fluctuations.
(a) Interest rate risk Interest rate risk is the risk that the fair value or future
cash flows of a financial instrument will fluctuate because of changes in market interest rates. In order to optimize the Company’s position with regard to interest income and interest expenses and to manage the interest rate risk, the Company performs a comprehensive corporate interest rate risk management by balancing the proportion of the fixed rate and floating rate financial instruments in its total portfolio .
(i) the exposure of the Company’s borrowings to interest rate changes at the end of reporting period are as follows:
` crore
ParticularsAs at
31 st March, 2017As at
31st March, 2016Variable rate borrowings 16,786.97 17,186.55 Fixed rate borrowings 8,539.12 8,555.30 Total borrowings 25,326.09 25,741.85
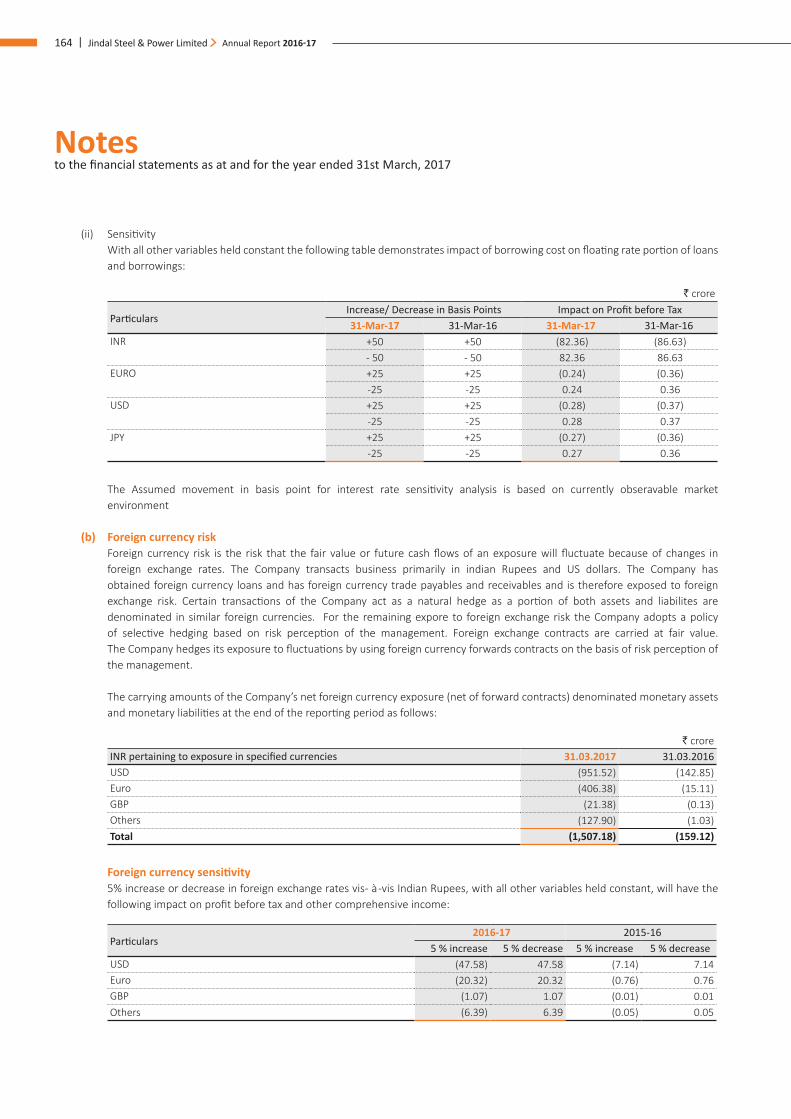
Notes to the financial statements as at and for the year ended 31st March, 2017
164 | Jindal Steel & Power Limited Annual Report 2016-17
(ii) Sensitivity With all other variables held constant the following table demonstrates impact of borrowing cost on floating rate portion of loans
and borrowings:
` crore
ParticularsIncrease/ Decrease in Basis Points Impact on Profit before Tax31-Mar-17 31-Mar-16 31-Mar-17 31-Mar-16
INR +50 +50 (82.36) (86.63)- 50 - 50 82.36 86.63
EURO +25 +25 (0.24) (0.36)-25 -25 0.24 0.36
USD +25 +25 (0.28) (0.37)-25 -25 0.28 0.37
JPY +25 +25 (0.27) (0.36)-25 -25 0.27 0.36
The Assumed movement in basis point for interest rate sensitivity analysis is based on currently obseravable market environment
(b) Foreign currency risk Foreign currency risk is the risk that the fair value or future cash flows of an exposure will fluctuate because of changes in
foreign exchange rates. The Company transacts business primarily in indian Rupees and US dollars. The Company has obtained foreign currency loans and has foreign currency trade payables and receivables and is therefore exposed to foreign exchange risk. Certain transactions of the Company act as a natural hedge as a portion of both assets and liabilites are denominated in similar foreign currencies. For the remaining expore to foreign exchange risk the Company adopts a policy of selective hedging based on risk perception of the management. Foreign exchange contracts are carried at fair value. The Company hedges its exposure to fluctuations by using foreign currency forwards contracts on the basis of risk perception of the management.
The carrying amounts of the Company’s net foreign currency exposure (net of forward contracts) denominated monetary assets and monetary liabilities at the end of the reporting period as follows:
` croreINR pertaining to exposure in specified currencies 31.03.2017 31.03.2016USD (951.52) (142.85)Euro (406.38) (15.11)GBP (21.38) (0.13)Others (127.90) (1.03)Total (1,507.18) (159.12)
Foreign currency sensitivity 5% increase or decrease in foreign exchange rates vis- à -vis Indian Rupees, with all other variables held constant, will have the
following impact on profit before tax and other comprehensive income:
Particulars 2016-17 2015-16
5 % increase 5 % decrease 5 % increase 5 % decrease USD (47.58) 47.58 (7.14) 7.14 Euro (20.32) 20.32 (0.76) 0.76 GBP (1.07) 1.07 (0.01) 0.01 Others (6.39) 6.39 (0.05) 0.05
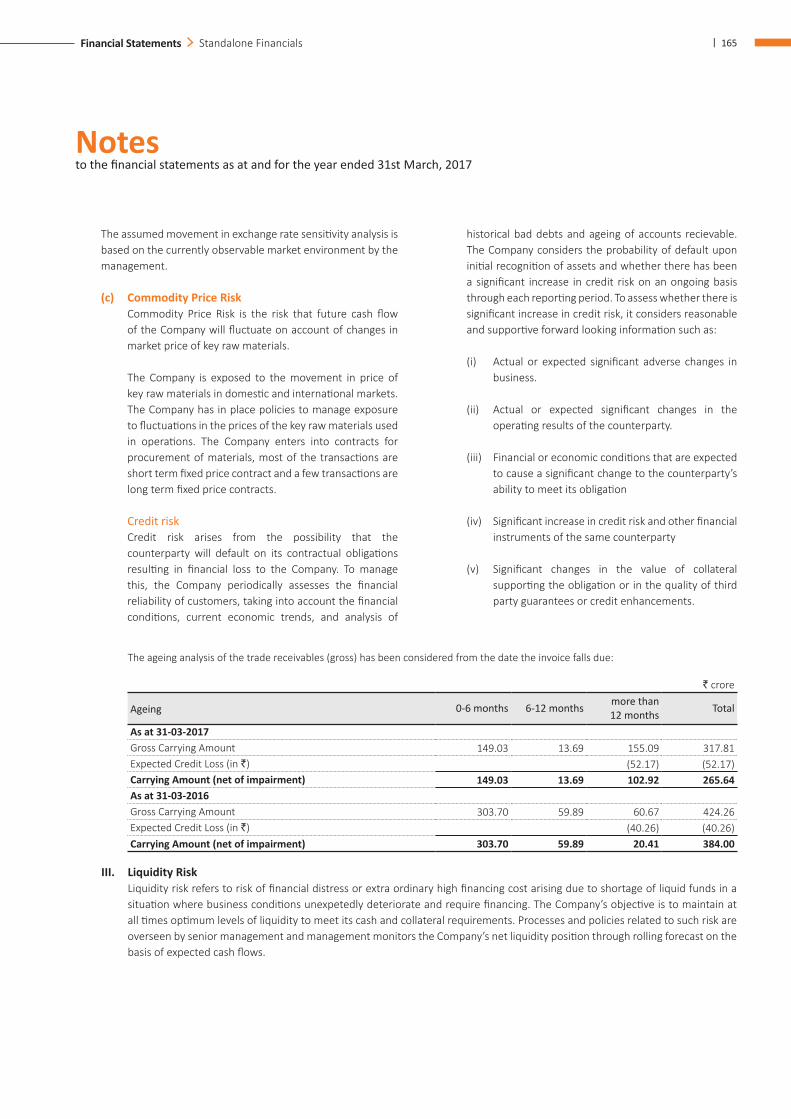
Notes to the financial statements as at and for the year ended 31st March, 2017
| 165Financial Statements Standalone Financials
The assumed movement in exchange rate sensitivity analysis is based on the currently observable market environment by the management.
(c) Commodity Price Risk Commodity Price Risk is the risk that future cash flow
of the Company will fluctuate on account of changes in market price of key raw materials.
The Company is exposed to the movement in price of key raw materials in domestic and international markets. The Company has in place policies to manage exposure to fluctuations in the prices of the key raw materials used in operations. The Company enters into contracts for procurement of materials, most of the transactions are short term fixed price contract and a few transactions are long term fixed price contracts.
Credit risk Credit risk arises from the possibility that the
counterparty will default on its contractual obligations resulting in financial loss to the Company. To manage this, the Company periodically assesses the financial reliability of customers, taking into account the financial conditions, current economic trends, and analysis of
historical bad debts and ageing of accounts recievable. The Company considers the probability of default upon initial recognition of assets and whether there has been a significant increase in credit risk on an ongoing basis through each reporting period. To assess whether there is significant increase in credit risk, it considers reasonable and supportive forward looking information such as:
(i) Actual or expected significant adverse changes in business.
(ii) Actual or expected significant changes in the operating results of the counterparty.
(iii) Financial or economic conditions that are expected to cause a significant change to the counterparty’s ability to meet its obligation
(iv) Significant increase in credit risk and other financial instruments of the same counterparty
(v) Significant changes in the value of collateral supporting the obligation or in the quality of third party guarantees or credit enhancements.
The ageing analysis of the trade receivables (gross) has been considered from the date the invoice falls due:
` crore
Ageing 0-6 months 6-12 months more than 12 months Total
As at 31-03-2017Gross Carrying Amount 149.03 13.69 155.09 317.81 Expected Credit Loss (in `) (52.17) (52.17)Carrying Amount (net of impairment) 149.03 13.69 102.92 265.64 As at 31-03-2016Gross Carrying Amount 303.70 59.89 60.67 424.26 Expected Credit Loss (in `) (40.26) (40.26)Carrying Amount (net of impairment) 303.70 59.89 20.41 384.00
III. Liquidity Risk Liquidity risk refers to risk of financial distress or extra ordinary high financing cost arising due to shortage of liquid funds in a
situation where business conditions unexpetedly deteriorate and require financing. The Company’s objective is to maintain at all times optimum levels of liquidity to meet its cash and collateral requirements. Processes and policies related to such risk are overseen by senior management and management monitors the Company’s net liquidity position through rolling forecast on the basis of expected cash flows.
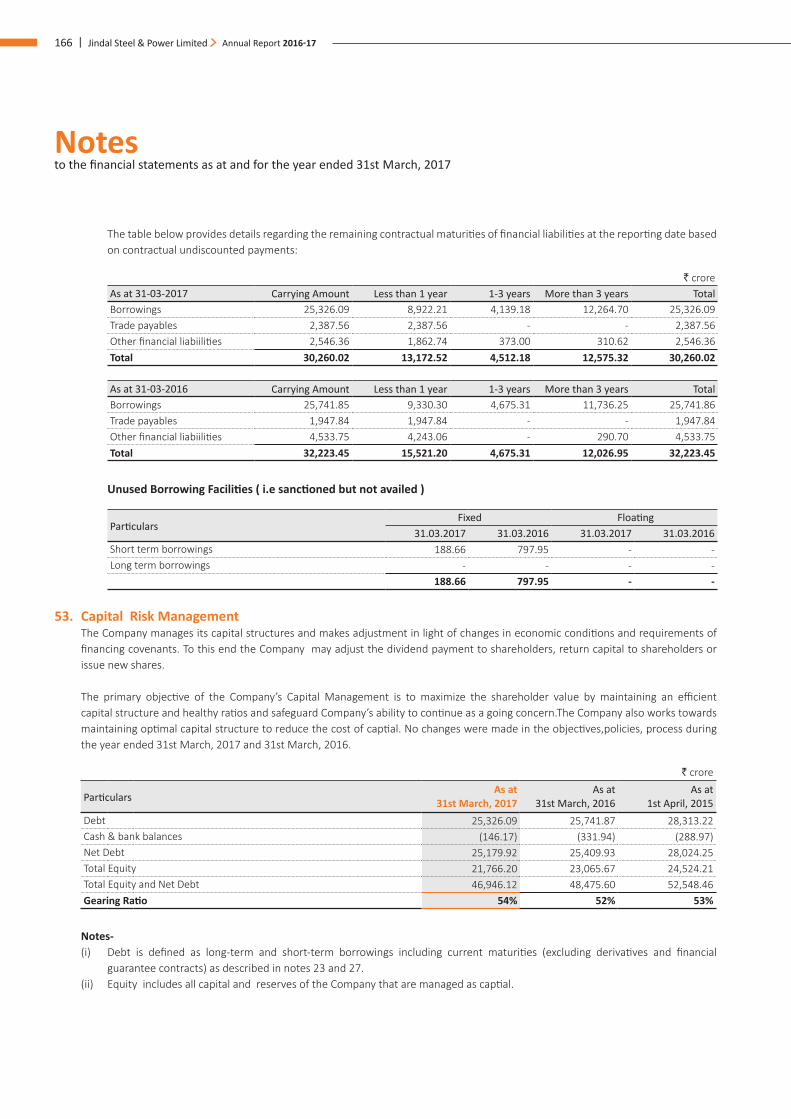
Notes to the financial statements as at and for the year ended 31st March, 2017
166 | Jindal Steel & Power Limited Annual Report 2016-17
The table below provides details regarding the remaining contractual maturities of financial liabilities at the reporting date based on contractual undiscounted payments:
` croreAs at 31-03-2017 Carrying Amount Less than 1 year 1-3 years More than 3 years Total Borrowings 25,326.09 8,922.21 4,139.18 12,264.70 25,326.09 Trade payables 2,387.56 2,387.56 - - 2,387.56 Other financial liabiilities 2,546.36 1,862.74 373.00 310.62 2,546.36 Total 30,260.02 13,172.52 4,512.18 12,575.32 30,260.02
As at 31-03-2016 Carrying Amount Less than 1 year 1-3 years More than 3 years Total Borrowings 25,741.85 9,330.30 4,675.31 11,736.25 25,741.86 Trade payables 1,947.84 1,947.84 - - 1,947.84 Other financial liabiilities 4,533.75 4,243.06 - 290.70 4,533.75 Total 32,223.45 15,521.20 4,675.31 12,026.95 32,223.45
Unused Borrowing Facilities ( i.e sanctioned but not availed )
Particulars Fixed Floating
31.03.2017 31.03.2016 31.03.2017 31.03.2016Short term borrowings 188.66 797.95 - - Long term borrowings - - - -
188.66 797.95 - -
53. Capital Risk Management The Company manages its capital structures and makes adjustment in light of changes in economic conditions and requirements of
financing covenants. To this end the Company may adjust the dividend payment to shareholders, return capital to shareholders or issue new shares.
The primary objective of the Company’s Capital Management is to maximize the shareholder value by maintaining an efficient capital structure and healthy ratios and safeguard Company’s ability to continue as a going concern.The Company also works towards maintaining optimal capital structure to reduce the cost of captial. No changes were made in the objectives,policies, process during the year ended 31st March, 2017 and 31st March, 2016.
` crore
ParticularsAs at
31st March, 2017As at
31st March, 2016As at
1st April, 2015Debt 25,326.09 25,741.87 28,313.22 Cash & bank balances (146.17) (331.94) (288.97)Net Debt 25,179.92 25,409.93 28,024.25 Total Equity 21,766.20 23,065.67 24,524.21 Total Equity and Net Debt 46,946.12 48,475.60 52,548.46 Gearing Ratio 54% 52% 53%
Notes- (i) Debt is defined as long-term and short-term borrowings including current maturities (excluding derivatives and financial
guarantee contracts) as described in notes 23 and 27. (ii) Equity includes all capital and reserves of the Company that are managed as captial.
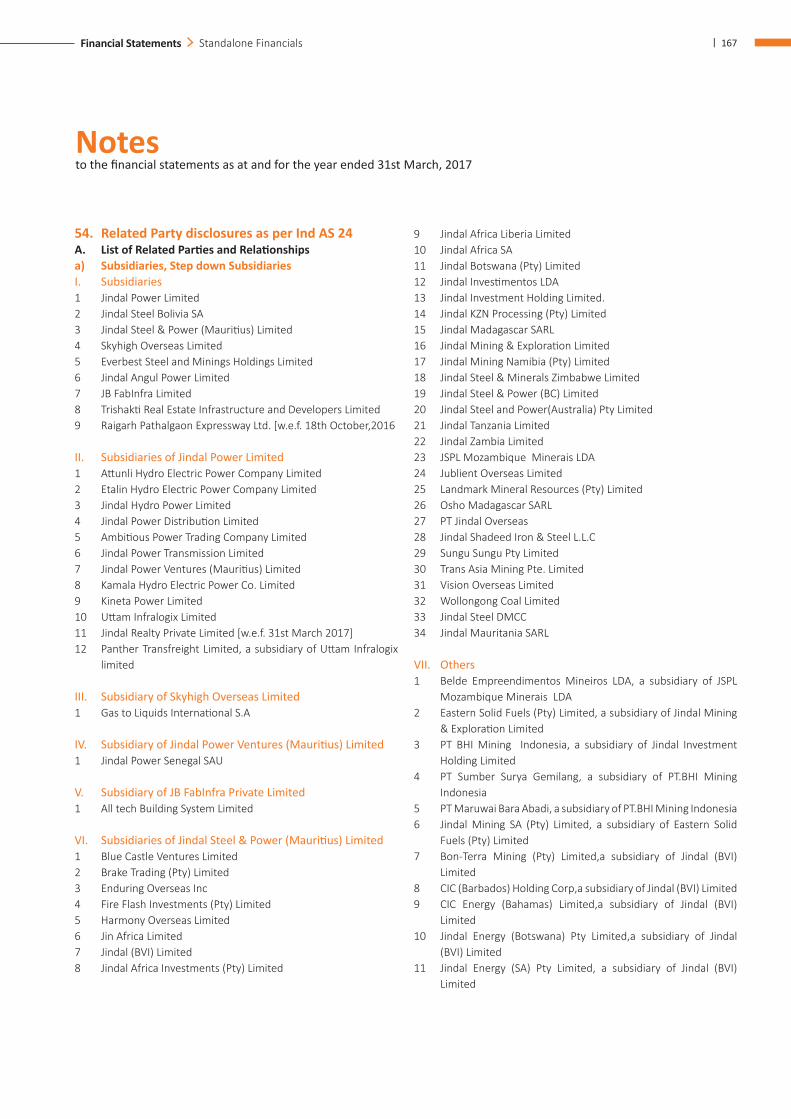
Notes to the financial statements as at and for the year ended 31st March, 2017
| 167Financial Statements Standalone Financials
54. Related Party disclosures as per Ind AS 24 A. List of Related Parties and Relationships a) Subsidiaries, Step down SubsidiariesI. Subsidiaries1 Jindal Power Limited 2 Jindal Steel Bolivia SA3 Jindal Steel & Power (Mauritius) Limited4 Skyhigh Overseas Limited 5 Everbest Steel and Minings Holdings Limited6 Jindal Angul Power Limited 7 JB FabInfra Limited8 Trishakti Real Estate Infrastructure and Developers Limited 9 Raigarh Pathalgaon Expressway Ltd. [w.e.f. 18th October,2016
II. Subsidiaries of Jindal Power Limited1 Attunli Hydro Electric Power Company Limited2 Etalin Hydro Electric Power Company Limited3 Jindal Hydro Power Limited4 Jindal Power Distribution Limited5 Ambitious Power Trading Company Limited 6 Jindal Power Transmission Limited7 Jindal Power Ventures (Mauritius) Limited 8 Kamala Hydro Electric Power Co. Limited9 Kineta Power Limited10 Uttam Infralogix Limited 11 Jindal Realty Private Limited [w.e.f. 31st March 2017]12 Panther Transfreight Limited, a subsidiary of Uttam Infralogix
limited
III. Subsidiary of Skyhigh Overseas Limited1 Gas to Liquids International S.A
IV. Subsidiary of Jindal Power Ventures (Mauritius) Limited1 Jindal Power Senegal SAU V. Subsidiary of JB FabInfra Private Limited1 All tech Building System Limited
VI. Subsidiaries of Jindal Steel & Power (Mauritius) Limited1 Blue Castle Ventures Limited2 Brake Trading (Pty) Limited 3 Enduring Overseas Inc4 Fire Flash Investments (Pty) Limited 5 Harmony Overseas Limited6 Jin Africa Limited7 Jindal (BVI) Limited8 Jindal Africa Investments (Pty) Limited
9 Jindal Africa Liberia Limited10 Jindal Africa SA11 Jindal Botswana (Pty) Limited12 Jindal Investimentos LDA13 Jindal Investment Holding Limited.14 Jindal KZN Processing (Pty) Limited 15 Jindal Madagascar SARL16 Jindal Mining & Exploration Limited17 Jindal Mining Namibia (Pty) Limited18 Jindal Steel & Minerals Zimbabwe Limited19 Jindal Steel & Power (BC) Limited20 Jindal Steel and Power(Australia) Pty Limited 21 Jindal Tanzania Limited22 Jindal Zambia Limited 23 JSPL Mozambique Minerais LDA24 Jublient Overseas Limited25 Landmark Mineral Resources (Pty) Limited 26 Osho Madagascar SARL27 PT Jindal Overseas 28 Jindal Shadeed Iron & Steel L.L.C29 Sungu Sungu Pty Limited 30 Trans Asia Mining Pte. Limited31 Vision Overseas Limited32 Wollongong Coal Limited 33 Jindal Steel DMCC 34 Jindal Mauritania SARL
VII. Others1 Belde Empreendimentos Mineiros LDA, a subsidiary of JSPL
Mozambique Minerais LDA2 Eastern Solid Fuels (Pty) Limited, a subsidiary of Jindal Mining
& Exploration Limited3 PT BHI Mining Indonesia, a subsidiary of Jindal Investment
Holding Limited4 PT Sumber Surya Gemilang, a subsidiary of PT.BHI Mining
Indonesia5 PT Maruwai Bara Abadi, a subsidiary of PT.BHI Mining Indonesia6 Jindal Mining SA (Pty) Limited, a subsidiary of Eastern Solid
Fuels (Pty) Limited7 Bon-Terra Mining (Pty) Limited,a subsidiary of Jindal (BVI)
Limited8 CIC (Barbados) Holding Corp,a subsidiary of Jindal (BVI) Limited9 CIC Energy (Bahamas) Limited,a subsidiary of Jindal (BVI)
Limited10 Jindal Energy (Botswana) Pty Limited,a subsidiary of Jindal
(BVI) Limited11 Jindal Energy (SA) Pty Limited, a subsidiary of Jindal (BVI)
Limited
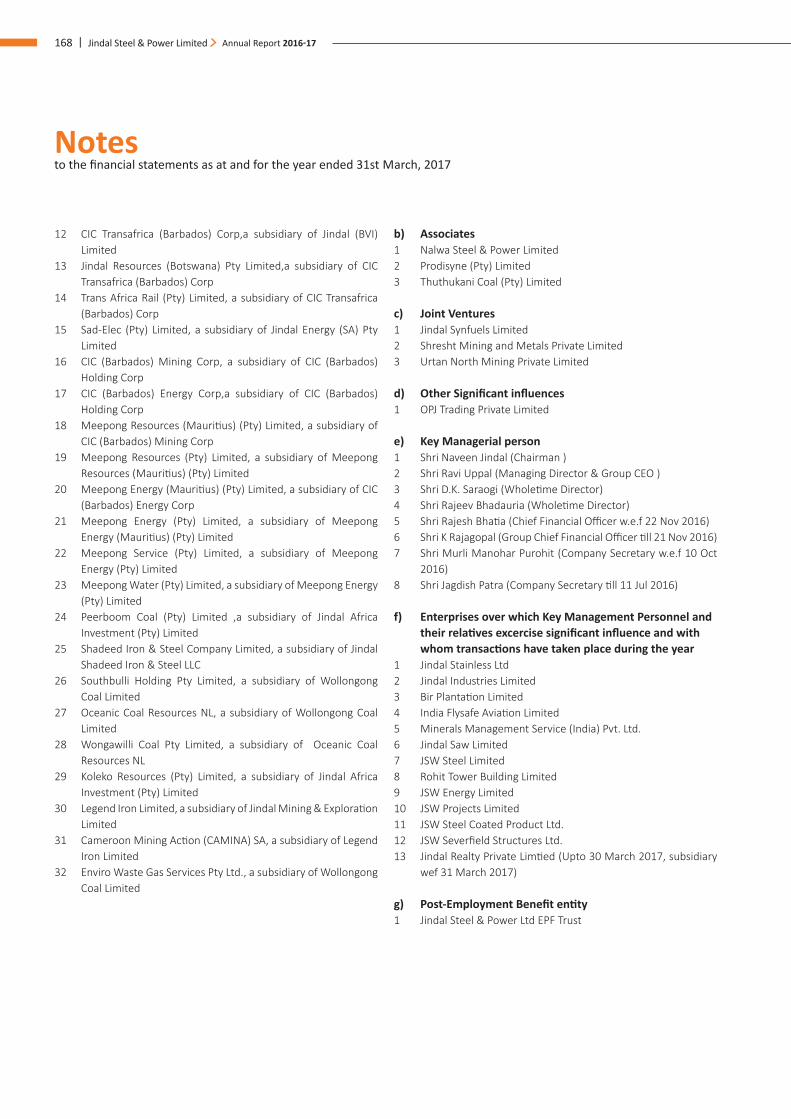
Notes to the financial statements as at and for the year ended 31st March, 2017
168 | Jindal Steel & Power Limited Annual Report 2016-17
12 CIC Transafrica (Barbados) Corp,a subsidiary of Jindal (BVI) Limited
13 Jindal Resources (Botswana) Pty Limited,a subsidiary of CIC Transafrica (Barbados) Corp
14 Trans Africa Rail (Pty) Limited, a subsidiary of CIC Transafrica (Barbados) Corp
15 Sad-Elec (Pty) Limited, a subsidiary of Jindal Energy (SA) Pty Limited
16 CIC (Barbados) Mining Corp, a subsidiary of CIC (Barbados) Holding Corp
17 CIC (Barbados) Energy Corp,a subsidiary of CIC (Barbados) Holding Corp
18 Meepong Resources (Mauritius) (Pty) Limited, a subsidiary of CIC (Barbados) Mining Corp
19 Meepong Resources (Pty) Limited, a subsidiary of Meepong Resources (Mauritius) (Pty) Limited
20 Meepong Energy (Mauritius) (Pty) Limited, a subsidiary of CIC (Barbados) Energy Corp
21 Meepong Energy (Pty) Limited, a subsidiary of Meepong Energy (Mauritius) (Pty) Limited
22 Meepong Service (Pty) Limited, a subsidiary of Meepong Energy (Pty) Limited
23 Meepong Water (Pty) Limited, a subsidiary of Meepong Energy (Pty) Limited
24 Peerboom Coal (Pty) Limited ,a subsidiary of Jindal Africa Investment (Pty) Limited
25 Shadeed Iron & Steel Company Limited, a subsidiary of Jindal Shadeed Iron & Steel LLC
26 Southbulli Holding Pty Limited, a subsidiary of Wollongong Coal Limited
27 Oceanic Coal Resources NL, a subsidiary of Wollongong Coal Limited
28 Wongawilli Coal Pty Limited, a subsidiary of Oceanic Coal Resources NL
29 Koleko Resources (Pty) Limited, a subsidiary of Jindal Africa Investment (Pty) Limited
30 Legend Iron Limited, a subsidiary of Jindal Mining & Exploration Limited
31 Cameroon Mining Action (CAMINA) SA, a subsidiary of Legend Iron Limited
32 Enviro Waste Gas Services Pty Ltd., a subsidiary of Wollongong Coal Limited
b) Associates1 Nalwa Steel & Power Limited2 Prodisyne (Pty) Limited3 Thuthukani Coal (Pty) Limited
c) Joint Ventures1 Jindal Synfuels Limited 2 Shresht Mining and Metals Private Limited3 Urtan North Mining Private Limited d) Other Significant influences1 OPJ Trading Private Limited e) Key Managerial person1 Shri Naveen Jindal (Chairman )2 Shri Ravi Uppal (Managing Director & Group CEO ) 3 Shri D.K. Saraogi (Wholetime Director)4 Shri Rajeev Bhadauria (Wholetime Director)5 Shri Rajesh Bhatia (Chief Financial Officer w.e.f 22 Nov 2016)6 Shri K Rajagopal (Group Chief Financial Officer till 21 Nov 2016)7 Shri Murli Manohar Purohit (Company Secretary w.e.f 10 Oct
2016)8 Shri Jagdish Patra (Company Secretary till 11 Jul 2016)
f) Enterprises over which Key Management Personnel and their relatives excercise significant influence and with whom transactions have taken place during the year
1 Jindal Stainless Ltd2 Jindal Industries Limited3 Bir Plantation Limited4 India Flysafe Aviation Limited5 Minerals Management Service (India) Pvt. Ltd.6 Jindal Saw Limited7 JSW Steel Limited8 Rohit Tower Building Limited9 JSW Energy Limited10 JSW Projects Limited11 JSW Steel Coated Product Ltd.12 JSW Severfield Structures Ltd.13 Jindal Realty Private Limtied (Upto 30 March 2017, subsidiary
wef 31 March 2017)
g) Post-Employment Benefit entity1 Jindal Steel & Power Ltd EPF Trust
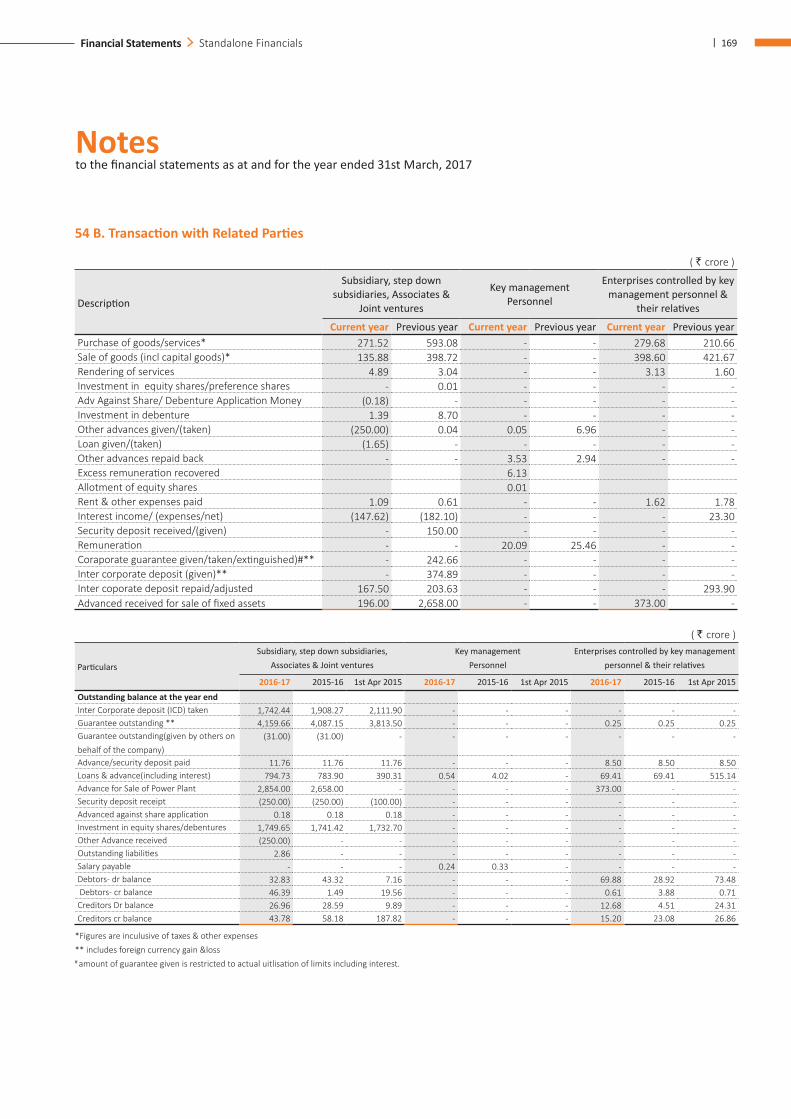
Notes to the financial statements as at and for the year ended 31st March, 2017
| 169Financial Statements Standalone Financials
54 B. Transaction with Related Parties
( ` crore )
Description
Subsidiary, step down subsidiaries, Associates &
Joint ventures
Key management Personnel
Enterprises controlled by key management personnel &
their relatives
Current year Previous year Current year Previous year Current year Previous yearPurchase of goods/services* 271.52 593.08 - - 279.68 210.66 Sale of goods (incl capital goods)* 135.88 398.72 - - 398.60 421.67 Rendering of services 4.89 3.04 - - 3.13 1.60 Investment in equity shares/preference shares - 0.01 - - - - Adv Against Share/ Debenture Application Money (0.18) - - - - - Investment in debenture 1.39 8.70 - - - - Other advances given/(taken) (250.00) 0.04 0.05 6.96 - - Loan given/(taken) (1.65) - - - - - Other advances repaid back - - 3.53 2.94 - - Excess remuneration recovered 6.13 Allotment of equity shares 0.01 Rent & other expenses paid 1.09 0.61 - - 1.62 1.78 Interest income/ (expenses/net) (147.62) (182.10) - - - 23.30 Security deposit received/(given) - 150.00 - - - - Remuneration - - 20.09 25.46 - - Coraporate guarantee given/taken/extinguished)#** - 242.66 - - - - Inter corporate deposit (given)** - 374.89 - - - - Inter coporate deposit repaid/adjusted 167.50 203.63 - - - 293.90 Advanced received for sale of fixed assets 196.00 2,658.00 - - 373.00 -
( ` crore )
Particulars
Subsidiary, step down subsidiaries, Associates & Joint ventures
Key management Personnel
Enterprises controlled by key management personnel & their relatives
2016-17 2015-16 1st Apr 2015 2016-17 2015-16 1st Apr 2015 2016-17 2015-16 1st Apr 2015
Outstanding balance at the year endInter Corporate deposit (ICD) taken 1,742.44 1,908.27 2,111.90 - - - - - - Guarantee outstanding ** 4,159.66 4,087.15 3,813.50 - - - 0.25 0.25 0.25 Guarantee outstanding(given by others on behalf of the company)
(31.00) (31.00) - - - - - - -
Advance/security deposit paid 11.76 11.76 11.76 - - - 8.50 8.50 8.50 Loans & advance(including interest) 794.73 783.90 390.31 0.54 4.02 - 69.41 69.41 515.14 Advance for Sale of Power Plant 2,854.00 2,658.00 - - - - 373.00 - - Security deposit receipt (250.00) (250.00) (100.00) - - - - - - Advanced against share application 0.18 0.18 0.18 - - - - - - Investment in equity shares/debentures 1,749.65 1,741.42 1,732.70 - - - - - - Other Advance received (250.00) - - - - - - - - Outstanding liabilities 2.86 - - - - - - - - Salary payable - - - 0.24 0.33 - - - - Debtors- dr balance 32.83 43.32 7.16 - - - 69.88 28.92 73.48 Debtors- cr balance 46.39 1.49 19.56 - - - 0.61 3.88 0.71 Creditors Dr balance 26.96 28.59 9.89 - - - 12.68 4.51 24.31 Creditors cr balance 43.78 58.18 187.82 - - - 15.20 23.08 26.86
*Figures are inculusive of taxes & other expenses ** includes foreign currency gain &loss # amount of guarantee given is restricted to actual uitlisation of limits including interest.
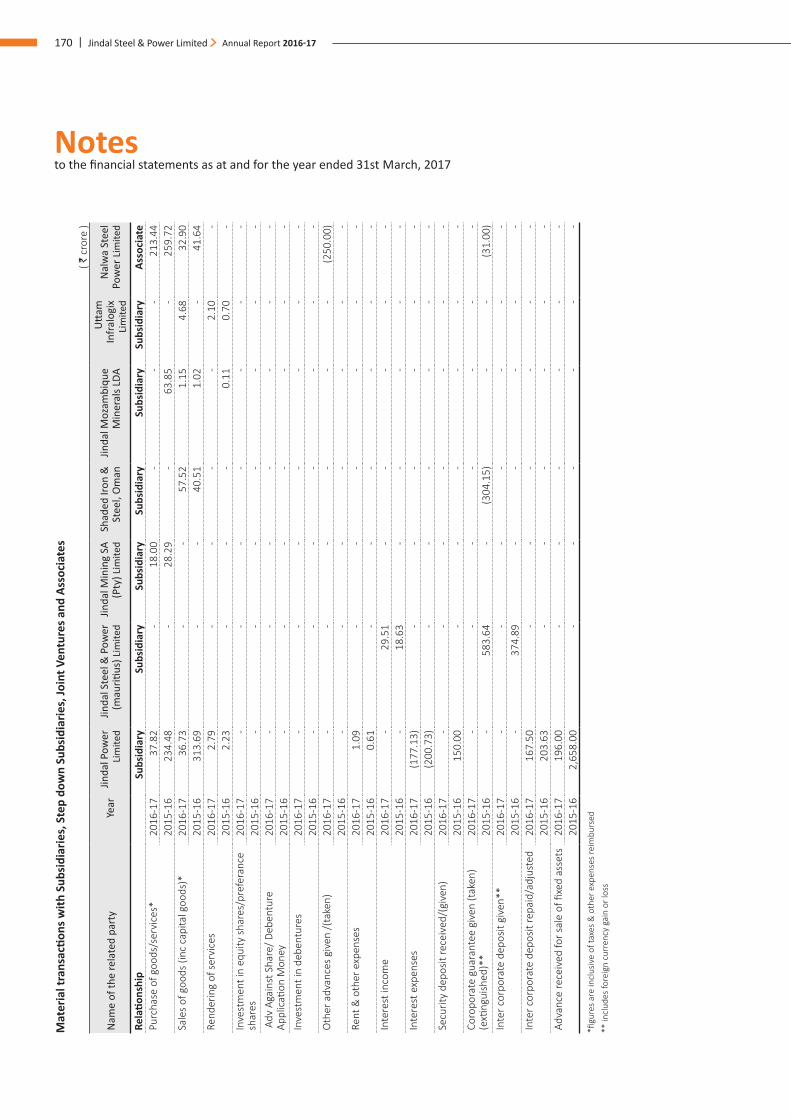
Notes to the financial statements as at and for the year ended 31st March, 2017
170 | Jindal Steel & Power Limited Annual Report 2016-17
Mat
eria
l tra
nsac
tions
with
Sub
sidi
arie
s, S
tep
dow
n Su
bsid
iarie
s, Jo
int V
entu
res a
nd A
ssoc
iate
s
( ` c
rore
)
Nam
e of
the
rela
ted
part
yYe
arJin
dal P
ower
Li
mite
dJin
dal S
teel
& P
ower
(m
auriti
us) L
imite
dJin
dal M
inin
g SA
(P
ty) L
imite
dSh
aded
Iron
&
Stee
l, O
man
Jinda
l Moz
ambi
que
Min
eral
s LDA
Utta
m
Infr
alog
ix
Lim
ited
Nal
wa
Stee
l Po
wer
Lim
ited
Rela
tions
hip
Subs
idia
rySu
bsid
iary
Subs
idia
rySu
bsid
iary
Subs
idia
rySu
bsid
iary
Asso
ciat
ePu
rcha
se o
f goo
ds/s
ervi
ces*
2016
-17
37.
82
- 1
8.00
-
- -
213
.44
2015
-16
234
.48
- 2
8.29
-
63.
85
- 2
59.7
2 Sa
les
of g
oods
(inc
cap
ital g
oods
)*20
16-1
7 3
6.73
-
- 5
7.52
1
.15
4.6
8 3
2.90
20
15-1
6 3
13.6
9 -
- 4
0.51
1
.02
- 4
1.64
Re
nder
ing
of s
ervi
ces
2016
-17
2.7
9 -
- -
- 2
.10
- 20
15-1
6 2
.23
- -
- 0
.11
0.7
0 -
Inve
stm
ent i
n eq
uity
sha
res/
pref
eran
ce
shar
es20
16-1
7 -
- -
- -
- -
2015
-16
- -
- -
- -
- A
dv A
gain
st S
hare
/ Deb
entu
re
Appl
icati
on M
oney
20
16-1
7 -
- -
- -
- -
2015
-16
- -
- -
- -
- In
vest
men
t in
debe
ntur
es20
16-1
7 -
- -
- -
- -
2015
-16
- -
- -
- -
- O
ther
adv
ance
s gi
ven
/(ta
ken)
2016
-17
- -
- -
- -
(250
.00)
2015
-16
- -
- -
- -
- Re
nt &
oth
er e
xpen
ses
2016
-17
1.0
9 -
- -
- -
- 20
15-1
6 0
.61
- -
- -
- -
Inte
rest
inco
me
2016
-17
- 2
9.51
-
- -
- -
2015
-16
- 1
8.63
-
- -
- -
Inte
rest
exp
ense
s20
16-1
7 (1
77.1
3) -
- -
- -
- 20
15-1
6 (2
00.7
3) -
- -
- -
- Se
curit
y de
posit
rece
ived
/(gi
ven)
2016
-17
- -
- -
- -
- 20
15-1
6 1
50.0
0 -
- -
- -
- Co
ropo
rate
gua
rant
ee g
iven
(tak
en)
(exti
ngui
shed
)**
2016
-17
- -
- -
- -
- 20
15-1
6 -
583
.64
- (3
04.1
5) -
- (3
1.00
)In
ter c
orpo
rate
dep
osit
give
n**
2016
-17
- -
- -
- -
- 20
15-1
6 -
374
.89
- -
- -
- In
ter c
orpo
rate
dep
osit
repa
id/a
djus
ted
2016
-17
167
.50
- -
- -
- -
2015
-16
203
.63
- -
- -
- -
Adva
nce
rece
ived
for s
ale
of fi
xed
asse
ts20
16-1
7 1
96.0
0 -
- -
- -
- 20
15-1
6 2
,658
.00
- -
- -
- -
*figu
res
are
incl
usiv
e of
taxe
s &
oth
er e
xpen
ses
reim
burs
ed
**
incl
udes
fore
ign
curr
ency
gai
n or
loss
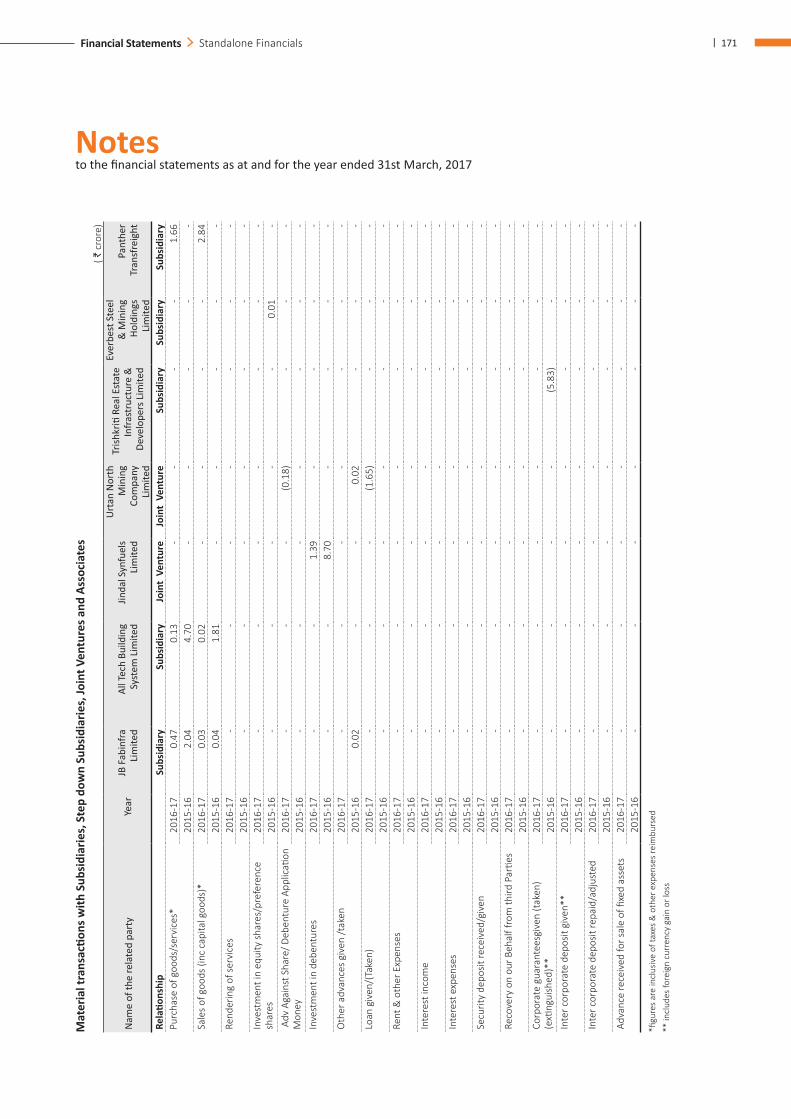
Notes to the financial statements as at and for the year ended 31st March, 2017
| 171Financial Statements Standalone Financials
Mat
eria
l tra
nsac
tions
with
Sub
sidi
arie
s, S
tep
dow
n Su
bsid
iarie
s, Jo
int V
entu
res a
nd A
ssoc
iate
s
( `
cro
re)
Nam
e of
the
rela
ted
part
yYe
arJB
Fab
infr
a Li
mite
dAl
l Tec
h Bu
ildin
g Sy
stem
Lim
ited
Jinda
l Syn
fuel
s Li
mite
d
Urt
an N
orth
M
inin
g Co
mpa
ny
Lim
ited
Trish
kriti
Rea
l Est
ate
Infr
astr
uctu
re &
De
velo
pers
Lim
ited
Ever
best
Ste
el
& M
inin
g Ho
ldin
gs
Lim
ited
Pant
her
Tran
sfre
ight
Rela
tions
hip
Subs
idia
rySu
bsid
iary
Join
t Ve
ntur
eJo
int
Vent
ure
Subs
idia
rySu
bsid
iary
Subs
idia
ryPu
rcha
se o
f goo
ds/s
ervi
ces*
2016
-17
0.4
7 0
.13
- -
- -
1.6
6 20
15-1
6 2
.04
4.7
0 -
- -
- -
Sale
s of
goo
ds (i
nc c
apita
l goo
ds)*
2016
-17
0.0
3 0
.02
- -
- -
2.8
4 20
15-1
6 0
.04
1.8
1 -
- -
- -
Rend
erin
g of
ser
vice
s20
16-1
7 -
- -
- -
- -
2015
-16
- -
- -
- -
- In
vest
men
t in
equi
ty s
hare
s/pr
efer
ence
sh
ares
2016
-17
- -
- -
- -
- 20
15-1
6 -
- -
- -
0.0
1 -
Adv
Aga
inst
Sha
re/ D
eben
ture
App
licati
on
Mon
ey
2016
-17
- -
- (0
.18)
- -
- 20
15-1
6 -
- -
- -
- -
Inve
stm
ent i
n de
bent
ures
2016
-17
- -
1.3
9 -
- -
- 20
15-1
6 -
- 8
.70
- -
- -
Oth
er a
dvan
ces
give
n /t
aken
20
16-1
7 -
- -
- -
- -
2015
-16
0.0
2 -
- 0
.02
- -
- Lo
an g
iven
/(Ta
ken)
2016
-17
- -
- (1
.65)
- -
- 20
15-1
6 -
- -
- -
- -
Rent
& o
ther
Exp
ense
s20
16-1
7 -
- -
- -
- -
2015
-16
- -
- -
- -
- In
tere
st in
com
e20
16-1
7 -
- -
- -
- -
2015
-16
- -
- -
- -
- In
tere
st e
xpen
ses
2016
-17
- -
- -
- -
- 20
15-1
6 -
- -
- -
- -
Secu
rity
depo
sit re
ceiv
ed/g
iven
2016
-17
- -
- -
- -
- 20
15-1
6 -
- -
- -
- -
Reco
very
on
our B
ehal
f fro
m th
ird P
artie
s20
16-1
7 -
- -
- -
- -
2015
-16
- -
- -
- -
- Co
rpor
ate
guar
ante
esgi
ven
(tak
en)
(exti
ngui
shed
)**
2016
-17
- -
- -
- -
- 20
15-1
6 -
- -
- (5
.83)
- -
Inte
r cor
pora
te d
epos
it gi
ven*
*20
16-1
7 -
- -
- -
- -
2015
-16
- -
- -
- -
- In
ter c
orpo
rate
dep
osit
repa
id/a
djus
ted
2016
-17
- -
- -
- -
- 20
15-1
6 -
- -
- -
- -
Adva
nce
rece
ived
for s
ale
of fi
xed
asse
ts20
16-1
7 -
- -
- -
- -
2015
-16
- -
- -
- -
-
*figu
res
are
incl
usiv
e of
taxe
s &
oth
er e
xpen
ses
reim
burs
ed
**
incl
udes
fore
ign
curr
ency
gai
n or
loss
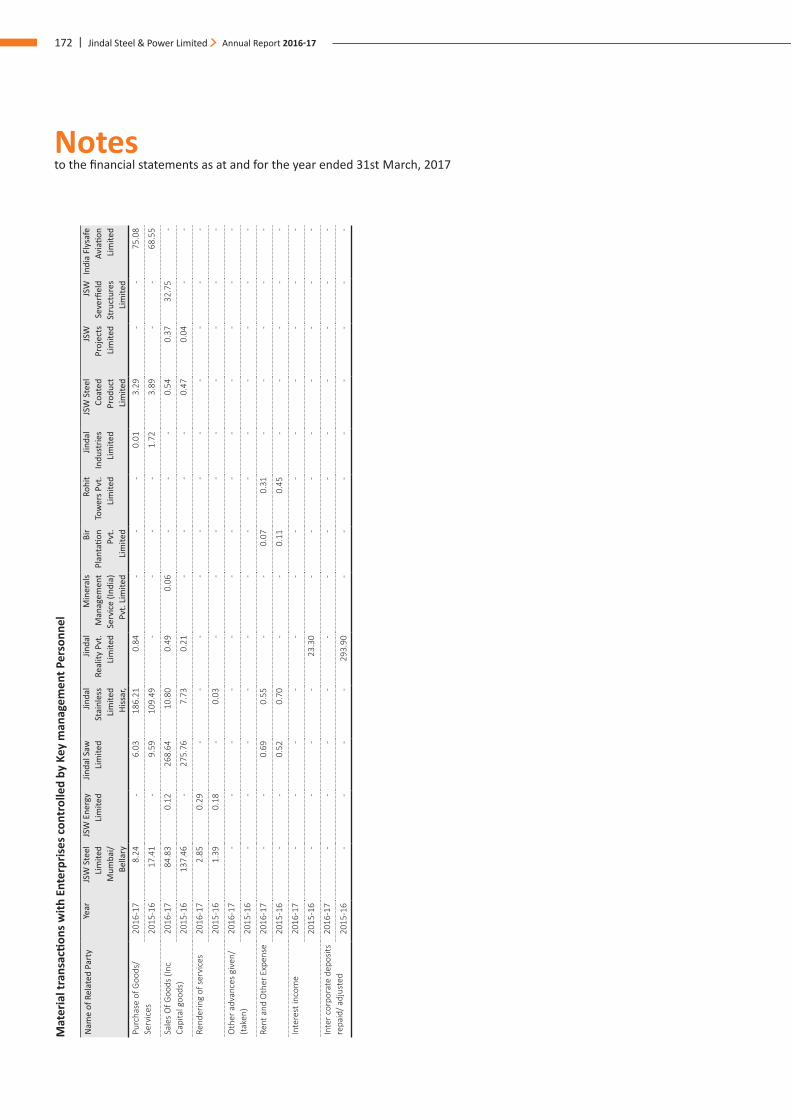
Notes to the financial statements as at and for the year ended 31st March, 2017
172 | Jindal Steel & Power Limited Annual Report 2016-17
Mat
eria
l tra
nsac
tions
with
Ent
erpr
ises
con
trol
led
by K
ey m
anag
emen
t Per
sonn
el
Nam
e of
Rel
ated
Par
tyYe
arJS
W S
teel
Li
mite
d M
umba
i/ Be
llary
JSW
Ene
rgy
Lim
ited
Jinda
l Saw
Li
mite
dJin
dal
Stai
nles
s Li
mite
d Hi
ssar
,
Jinda
l Re
ality
Pvt
. Li
mite
d
Min
eral
s M
anag
emen
t Se
rvic
e (In
dia)
Pv
t. Li
mite
d
Bir
Plan
tatio
n Pv
t. Li
mite
d
Rohi
t To
wer
s Pvt
. Li
mite
d
Jinda
l In
dust
ries
Lim
ited
JSW
Ste
el
Coat
ed
Prod
uct
Lim
ited
JSW
Pr
ojec
ts
Lim
ited
JSW
Se
verfi
eld
Stru
ctur
es
Lim
ited
Indi
a Fl
ysaf
e Av
iatio
n Li
mite
d
Purc
hase
of G
oods
/Se
rvic
es20
16-1
7 8
.24
- 6
.03
186
.21
0.8
4 -
- -
0.0
1 3
.29
- -
75.
08
2015
-16
17.
41
- 9
.59
109
.49
- -
- -
1.7
2 3
.89
- -
68.
55
Sale
s O
f Goo
ds (I
nc
Capi
tal g
oods
)20
16-1
7 8
4.83
0
.12
268
.64
10.
80
0.4
9 0
.06
- -
- 0
.54
0.3
7 3
2.75
-
2015
-16
137
.46
- 2
75.7
6 7
.73
0.2
1 -
- -
- 0
.47
0.0
4 -
-
Rend
erin
g of
ser
vice
s20
16-1
7 2
.85
0.2
9 -
- -
- -
- -
- -
- -
2015
-16
1.3
9 0
.18
- 0
.03
- -
- -
- -
- -
-
Oth
er a
dvan
ces
give
n/(t
aken
)20
16-1
7 -
- -
- -
- -
- -
- -
- -
2015
-16
- -
- -
- -
- -
- -
- -
-
Rent
and
Oth
er E
xpen
se20
16-1
7 -
- 0
.69
0.5
5 -
- 0
.07
0.3
1 -
- -
- -
2015
-16
- -
0.5
2 0
.70
- -
0.1
1 0
.45
- -
- -
-
Inte
rest
inco
me
2016
-17
- -
- -
- -
- -
- -
- -
-
2015
-16
- -
- -
23.
30
- -
- -
- -
- -
Inte
r cor
pora
te d
epos
its
repa
id/ a
djus
ted
2016
-17
- -
- -
- -
- -
- -
- -
-
2015
-16
- -
- -
293
.90
- -
- -
- -
- -
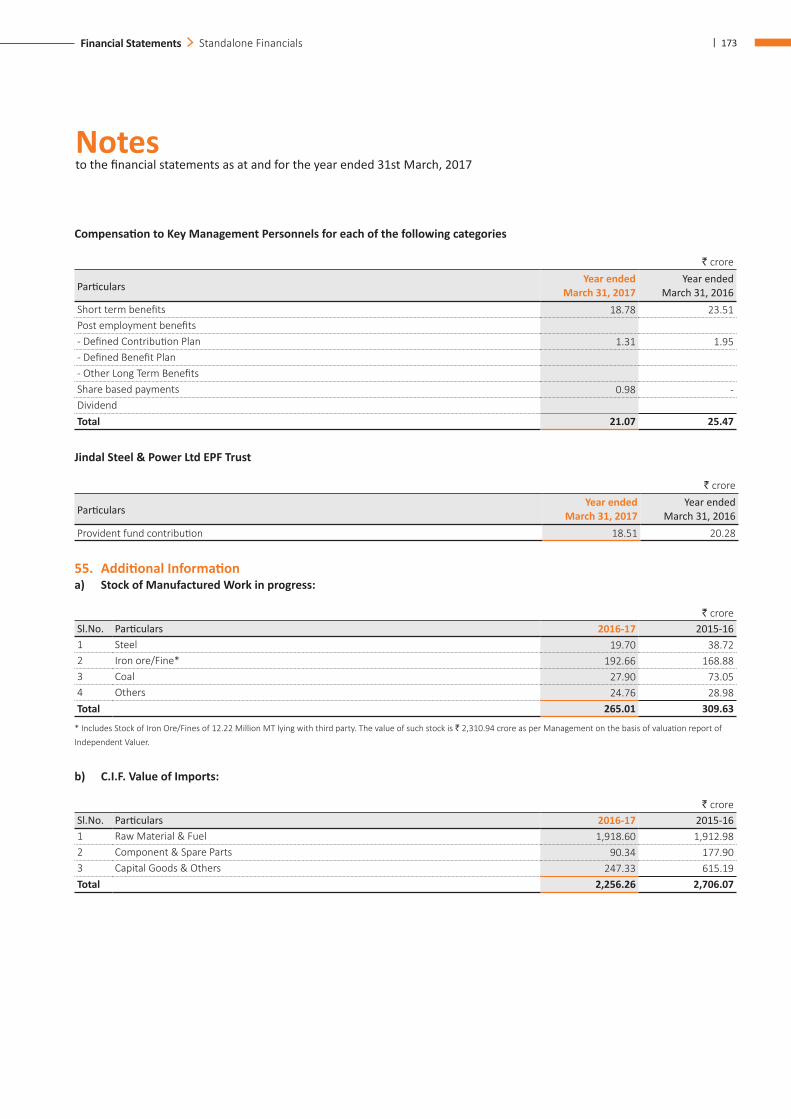
Notes to the financial statements as at and for the year ended 31st March, 2017
| 173Financial Statements Standalone Financials
Compensation to Key Management Personnels for each of the following categories
` crore
ParticularsYear ended
March 31, 2017Year ended
March 31, 2016Short term benefits 18.78 23.51 Post employment benefits- Defined Contribution Plan 1.31 1.95 - Defined Benefit Plan- Other Long Term BenefitsShare based payments 0.98 - DividendTotal 21.07 25.47
Jindal Steel & Power Ltd EPF Trust
` crore
ParticularsYear ended
March 31, 2017Year ended
March 31, 2016Provident fund contribution 18.51 20.28
55. Additional Information a) Stock of Manufactured Work in progress:
` crore Sl.No. Particulars 2016-17 2015-161 Steel 19.70 38.722 Iron ore/Fine* 192.66 168.883 Coal 27.90 73.054 Others 24.76 28.98Total 265.01 309.63
* Includes Stock of Iron Ore/Fines of 12.22 Million MT lying with third party. The value of such stock is ` 2,310.94 crore as per Management on the basis of valuation report of Independent Valuer.
b) C.I.F. Value of Imports:
` crore Sl.No. Particulars 2016-17 2015-161 Raw Material & Fuel 1,918.60 1,912.98 2 Component & Spare Parts 90.34 177.90 3 Capital Goods & Others 247.33 615.19 Total 2,256.26 2,706.07
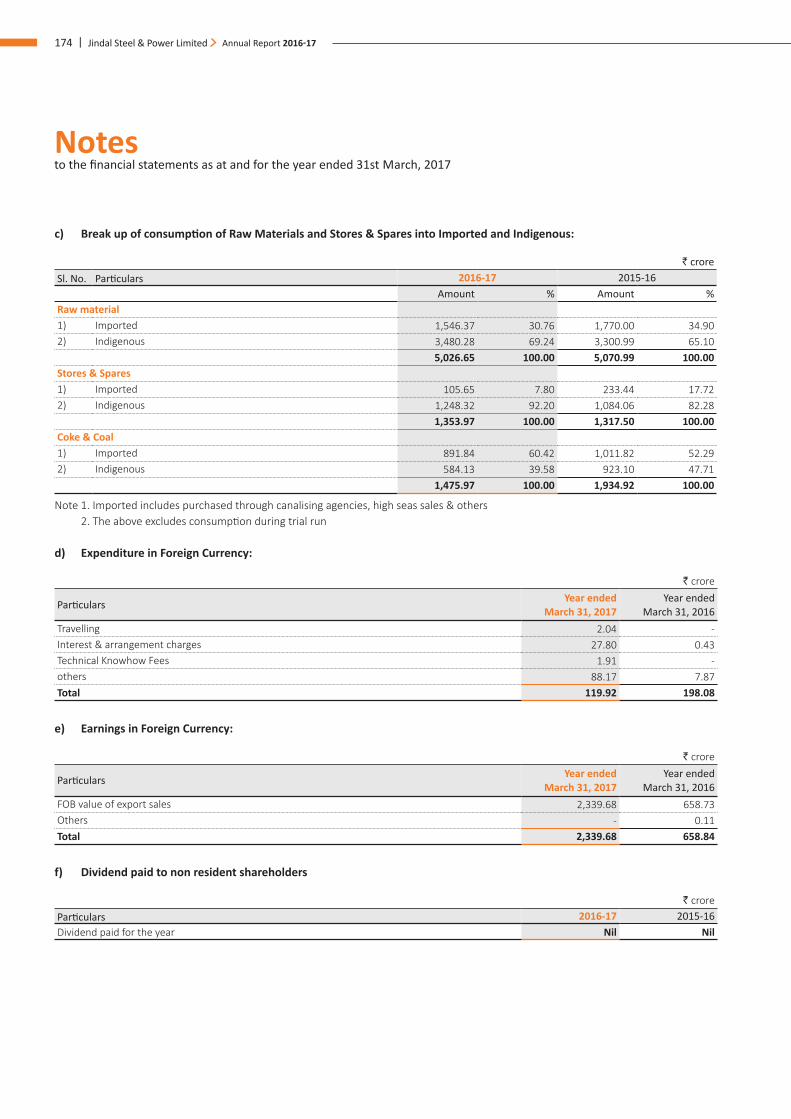
Notes to the financial statements as at and for the year ended 31st March, 2017
174 | Jindal Steel & Power Limited Annual Report 2016-17
c) Break up of consumption of Raw Materials and Stores & Spares into Imported and Indigenous:
` crore Sl. No. Particulars 2016-17 2015-16
Amount % Amount %Raw material1) Imported 1,546.37 30.76 1,770.00 34.90 2) Indigenous 3,480.28 69.24 3,300.99 65.10
5,026.65 100.00 5,070.99 100.00 Stores & Spares1) Imported 105.65 7.80 233.44 17.72 2) Indigenous 1,248.32 92.20 1,084.06 82.28
1,353.97 100.00 1,317.50 100.00 Coke & Coal1) Imported 891.84 60.42 1,011.82 52.29 2) Indigenous 584.13 39.58 923.10 47.71
1,475.97 100.00 1,934.92 100.00
Note 1. Imported includes purchased through canalising agencies, high seas sales & others 2. The above excludes consumption during trial run
d) Expenditure in Foreign Currency:
` crore
Particulars Year ended March 31, 2017
Year ended March 31, 2016
Travelling 2.04 - Interest & arrangement charges 27.80 0.43 Technical Knowhow Fees 1.91 - others 88.17 7.87 Total 119.92 198.08
e) Earnings in Foreign Currency:
` crore
Particulars Year ended March 31, 2017
Year ended March 31, 2016
FOB value of export sales 2,339.68 658.73 Others - 0.11 Total 2,339.68 658.84
f) Dividend paid to non resident shareholders
` crore Particulars 2016-17 2015-16Dividend paid for the year Nil Nil
Notes to the financial statements as at and for the year ended 31st March, 2017
| 175Financial Statements Standalone Financials
56. Impairment Review Assets are tested for impairment whenever there are any
internal or external indicators of impairment.
Impairment test is performed at the level of each Cash Generating Unit (‘CGU’) or groups of CGUs within the Company at which the goodwill or other assets are monitored for internal management purposes, within an operating segment.
The impairment assessment is based on higher of value in use and value from sale calculations.
During the year, the testing did not result in any impairment in the carrying amount of goodwill and other assets.
The measurement of the cash generating units’ value in use is determined based on financial plans that have been used by management for internal purposes. The planning horizon reflects the assumptions for short to- mid term market conditions.
Key assumptions used in value-in-use calculations: - Operating margins (Earnings before interest and taxes) - Discount Rate - Growth Rates - Capital expenditures
Operating margins: Operating margins have been estimated based on past experience after considering incremental revenue arising out of adoption of valued added and data services from the existing and new customers, though these benefits are partially offset by decline in tariffs in a hyper competitive scenario. Margins will be positively impacted from the efficiencies and initiatives driven by the Company; at the same time, factors like higher churn, increased cost of operations may impact the margins negatively.
Discount rate: Discount rate reflects the current market assessment of the risks specific to a CGU or group of CGUs. The discount rate is estimated based on the weighted average cost of capital for respective CGU or group of CGUs.
Growth rates: The growth rates used are in line with the long term average growth rates of the respective industry and country in which the Company operates and are consistent with the forecasts included in the industry reports.
Capital expenditures: The cash flow forecasts of capital expenditure are based on past experience coupled with additional capital expenditure required.
57. The Hon’ble Supreme Court of India by its Order dated 24 September 2014 cancelled number of coal blocks allocated to the Company by Ministry of Coal, Government of India and directed to pay an additional levy of ̀ 295 per MT on gross coal extracted. The Company has paid under protest such levy on coal extracted during the period from 1993 to 31 March 2015 of ` 2,082.23 crore. The management based on legal opinion has charged to the statement of profit and loss ,as exceptional item during the year 2014-15 for ` 807.77 crore computed on net extraction (run of mines less shale, rejects and ungraded middling) of coal by the Company. The balance amount of ` 1,274.46 crore has been shown as recoverable from the Government Authority since the entire amount of additional levy has been paid under protest.
58. The Company has net book value of investment made in mining assets including land, infrastructure and clearance etc. of ` 425 crore and filed claim for the same pursuant to directive vide letter dated 26 December , 2014 given by the Ministry of Coal on such mines . Meanwhile the Ministry of Coal has made interim payment to the Company of ` 22.72 crore towards the same.Pending final settlement of the aforesaid claim, this amount has been accounted for as advance.
59. The Company has filed legal suits /notices or in the process of filing legal case /sending legal notices / making efforts for recovery of debit balances of ` 218.62 crore (P.Y. 2015-16 ` 498.64 crore) plus interest wherever applicable, which are being carried as long term /short term advances, trade receivables and other recoverable. Pending outcome of legal proceedings/Company ‘s efforts for recovery and based on legal advise in certain cases , the Company has considered aforesaid amounts as fully recoverable. Hence, no provision has been made in respect of these balances.
60. Subject to customary regulatory approvals and other conditions precedent(s), the Board of Directors at its meeting held on 3rd May,2016 has approved the agreement for divestment of 1,000 MW Power unit of Jindal Power Limited (a subsidiary of the Company (JPL)), located in Chhattisgarh into a separate purpose vehicle (SPV), for the purpose of transfering the same to JSW Energy Limited through sale of the entire share capital and other securities of the aforesaid entity in terms of the share purchase agreement for an enterprise value of ` 6,500 crore plus the value of Net Current Assets as on the Closing Date. The valuation may vary based upon the achievement of PPA’s before the closing date 30th June, 2018 and as prescribed in the Agreement subject to minimum of ` 4,000 crore plus the value of Net Current Assets as on the
Notes to the financial statements as at and for the year ended 31st March, 2017
176 | Jindal Steel & Power Limited Annual Report 2016-17
Closing Date.The Company has received advance of ` 373.00 crore from JSW Energy against the same.
In order to streamline cash flows of the group and create SPV amenable for, the Board of Directors of the Company and JPL have in principle approved the restructuring involving parent Company and JPL and formed a committee of directors (“Restructuring Committee”), to explore and evaluate various restructuring options available including a scheme of arrangement. The restructuring will entail that 1000 MW Power Plant owned by JPL is hived off into an separate purpose vehicle, being subsidiary of the parent company, creation of other SPV amenable for monetization by way of divestments as well as achieve better synergy across the parent company and its subsidiaries, and to ensure that the businesses of these entities are operated in the most efficient and cost effective manner, including by pooling of technical, distribution and marketing skills, creating optimal utilisation of resources, better administration and cost reduction. Upon completion of evaluation of the possible arrangement options, the Restructuring Committee is to submit its recommendations to the Board of Directors and to such other committee(s) of the Board, including the Audit Committee, shareholders as may be required by applicable laws.
61. During the previous financial year, the Board of Directors of the Company approved sale of certain captive power plants (CPP) to Jindal Power Limited (JPL) a subsidiary company situated at Angul, Odisha (6x135 MW) and at Raigarh, Chattisgarh (2x55 MW) aggregating to 920 MW at a fair market value determined by independent valuer appointed by the Board of Directors amounting to ` 5,275 crore; which is subject to necessary approvals to be arranged by the Company. The Company has received interest free advance against above of ` 2,854 crore.
62. The company has considerd fair value of Property plant and equipment (fair value as assessed by independant valuer) i.e. Land, Building and plant & machinery (PPE) in accordance with stipulation of Ind AS 101 with resulted impact been given and accounted for in reserves, Accordingly on fair value of assets as cost on transition date (1st April 2015) as per option available in Ind AS and being increase in value (net) in PPE of ` 16,520.53 crore and useful life (as assessed and estimated by the management and a technical valuer), depreciation reflected in statement of profit & loss of current year is higher by ` 590.52 crore for the year ended 31st March 2017 and to that extent loss is higher.
63. Hon’ble Supreme Court of India, in its recent judgement has upheld constitutional validity of entry tax levied by the different State Governments and referred the same to divisional/ regular benches for testing and determination of validity of state legislation vis a vis the Article 304 (a) of the constitution and left open levy of entry tax on goods entering the landmass of India from another country to be determined in appropriate proceedings. Full provision has been made in this regard except in case of import of goods from outside India, where part amount (` 55.83 crore) of entry tax has been deposited (shown under loans and advances) based on the Order of High Court in other assessee’s case and as advised by an expert (against amount calculated till 31.03.2017 of ` 113.96 crore). As advised, no material provision is required to be made on this account . Further ` 0.64 crore has been paid subsequent to balance sheet date.
64. Balances of certain advances,creditors and receivables are in process of confirmantion/reconciliation.
65. Information related to Consolidated financial The company is listed on stock exchanges in India. The Company
has prepared consolidated financial statements as required under Ind AS 110, Sections 129 of Companies Act, 2013 and listing requirements. The consolidated financial statements are available on the Company’s website for public use.
66. Transition to Ind AS These Financial Statements, for the year ended 31st March
2017 are the first, the Company has prepared in accordance with Ind AS.
Accordingly, the Company has prepared its financial statement to comply with the Ind AS for the year ending 31st March, 2017, together with the comparative data as at and for the year ended 31st March, 2016, as described in note no. 2. In preparing these financial statements, the Company’s opening balance sheet was prepared as at 1st April, 2015, the date of transition to Ind AS. This note explains the principal adjustments made by the Company in restating its Indian GAAP financial statements, including the balance sheet as at 1st April, 2015 and the financial statements as at and for the year ended 31st March, 2016.
Exemptions Applied Ind AS 101 First time adoption of Indian Accounting Standards
allows first-time adopters certain exemptions from the retrospective application of certain requirements under Ind AS, effective for 1st April 2015 opening balance sheet.The Company has applied the exemptions which have been explained below:
Notes to the financial statements as at and for the year ended 31st March, 2017
| 177Financial Statements Standalone Financials
1 Deemed Cost of Property,Plant & Equipment The Company has elected to measure items of Property,
Plant & Equipment (PPE) at the date of transition to Ind AS at their fair value. The Company has used the fair value of PPE, which is considered as deemed cost on transition. Fair valuations are assessed as on 1st April, 2015.
2 Fair value of financial assets and liabilities The Company has financial receivables and payables that
are non-derivative financial instruments. Under previous GAAP, these were carried at transactions cost less allowances for impairment, if any. Under Ind AS, these financial assets and liabilities are initially recognised at fair value and subsequently measured at amortised cost, less allowance for impairment, if any. For transactions entered into on or after the date of transition to Ind AS, the requirement of initial recognition at fair value is applied prospectively.
3 Long Term Foreign Currency Monetary items The Company has opted to continue the policy adopted
for accounting for exchange differences arising from translation of long term foreign currency monetary items recognised in the financial statements for the period ending immediately before the beginning of the first Ind AS financial reporting period as per the previous GAAP, accordingly the Company has continued the capitalisation of foreign exchange gain/loss on long term loan outstanding on the date of transition i.e April 1st 2015 and such capitalised amount is amortised over the remaining useful life of the asset.
4 Investments in Subsidiaries, joint ventures and associates
The Company has elected to apply previous GAAP carrying amount of its investment in equity shares in subsidiaries, associates and joint ventures as deeemed cost as on the date of transition to Ind AS. However, the debt instruments in subsidiaries, associates and joint ventures are recognised at amortized cost.
5 Leases The Company has applied the transition provision in
Appendix C of Ind AS 17, “Determining whether an
arrangement contains a Lease”, and has assessed all arrangement as at the date of transition.
Estimates The estimates at 1st April, 2015 and at 31st March, 2016
are consistent with those made for the same dates in accordance with Indian GAAP (after adjustments to reflect any differnces if any, in accounting policies) apart from the following items where application of Indian GAAP did not require estimation:
- Impairment of financial assets based on expected credit loss method.
- Investment in debt instruments carried at Amortized Cost.
- Investment in equity instruments carried at Fair value through profit or loss
The estimates used by the Company to present these amounts in accordance with Ind AS reflect conditions as at the transition date and as of 31st March, 2016.
Exceptions to retrospective application of Ind AS 1 Classification and measurement of financial assets The Company has classified the financial assets
in accordance with Ind AS 109 on the basis of facts and circumstances that exists at the date of transition to Ind AS.
2 Derecognistion of financial assets & financial liabilities
The Company has elected to apply the derecognition requirements for financial assets & financial liabilities in accordance with Ind AS 109 prospectively for transactions occuring on or after the date of transition to Ind AS.
Impact of transition to Ind AS The following is a summary of the effects of the
differences between Ind AS and Indian GAAP on the Company’s total equity shareholders’ funds and profit and loss for the financial period for the periods previously reported under Indian GAAP following the date of transition to Ind AS.
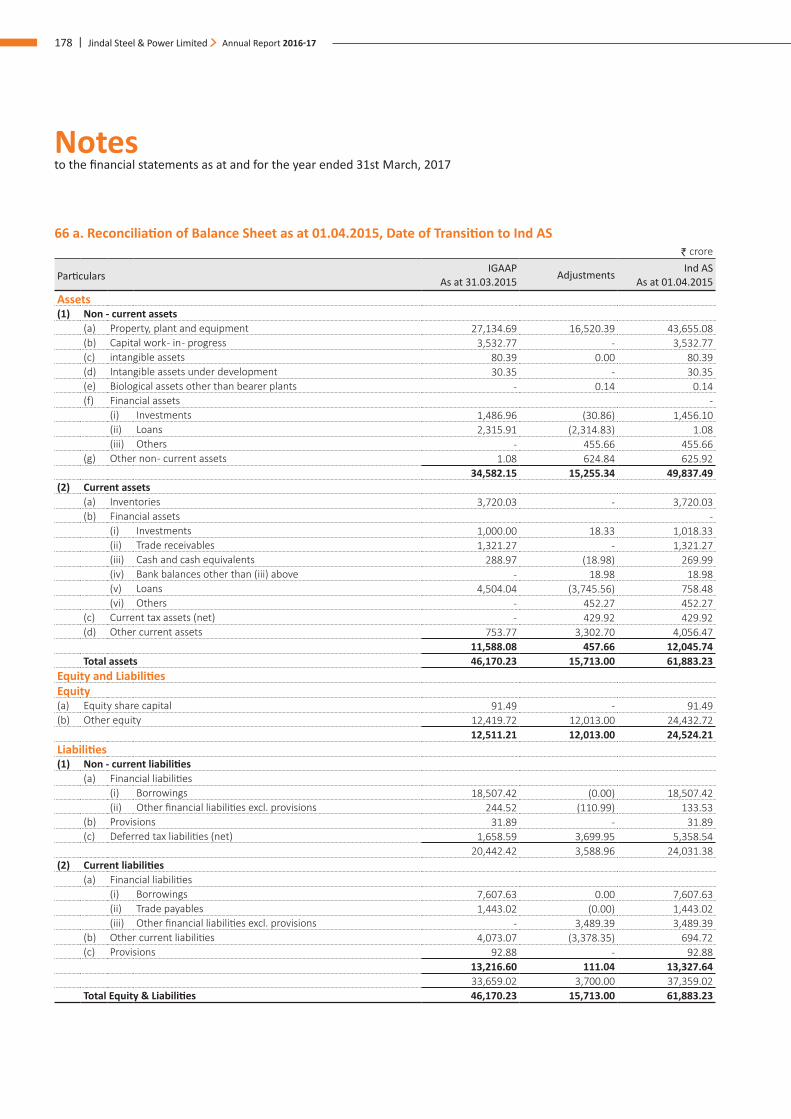
Notes to the financial statements as at and for the year ended 31st March, 2017
178 | Jindal Steel & Power Limited Annual Report 2016-17
66 a. Reconciliation of Balance Sheet as at 01.04.2015, Date of Transition to Ind AS` crore
ParticularsIGAAP
As at 31.03.2015 Adjustments Ind AS As at 01.04.2015
Assets(1) Non - current assets
(a) Property, plant and equipment 27,134.69 16,520.39 43,655.08 (b) Capital work - in - progress 3,532.77 - 3,532.77 (c) intangible assets 80.39 0.00 80.39 (d) Intangible assets under development 30.35 - 30.35 (e) Biological assets other than bearer plants - 0.14 0.14 (f) Financial assets -
(i) Investments 1,486.96 (30.86) 1,456.10 (ii) Loans 2,315.91 (2,314.83) 1.08 (iii) Others - 455.66 455.66
(g) Other non - current assets 1.08 624.84 625.92 34,582.15 15,255.34 49,837.49
(2) Current assets(a) Inventories 3,720.03 - 3,720.03 (b) Financial assets -
(i) Investments 1,000.00 18.33 1,018.33 (ii) Trade receivables 1,321.27 - 1,321.27 (iii) Cash and cash equivalents 288.97 (18.98) 269.99 (iv) Bank balances other than (iii) above - 18.98 18.98 (v) Loans 4,504.04 (3,745.56) 758.48 (vi) Others - 452.27 452.27
(c) Current tax assets (net) - 429.92 429.92 (d) Other current assets 753.77 3,302.70 4,056.47
11,588.08 457.66 12,045.74 Total assets 46,170.23 15,713.00 61,883.23
Equity and LiabilitiesEquity(a) Equity share capital 91.49 - 91.49 (b) Other equity 12,419.72 12,013.00 24,432.72
12,511.21 12,013.00 24,524.21 Liabilities(1) Non - current liabilities
(a) Financial liabilities(i) Borrowings 18,507.42 (0.00) 18,507.42 (ii) Other financial liabilities excl. provisions 244.52 (110.99) 133.53
(b) Provisions 31.89 - 31.89 (c) Deferred tax liabilities (net) 1,658.59 3,699.95 5,358.54
20,442.42 3,588.96 24,031.38 (2) Current liabilities
(a) Financial liabilities(i) Borrowings 7,607.63 0.00 7,607.63 (ii) Trade payables 1,443.02 (0.00) 1,443.02 (iii) Other financial liabilities excl. provisions - 3,489.39 3,489.39
(b) Other current liabilities 4,073.07 (3,378.35) 694.72 (c) Provisions 92.88 - 92.88
13,216.60 111.04 13,327.64 33,659.02 3,700.00 37,359.02
Total Equity & Liabilities 46,170.23 15,713.00 61,883.23
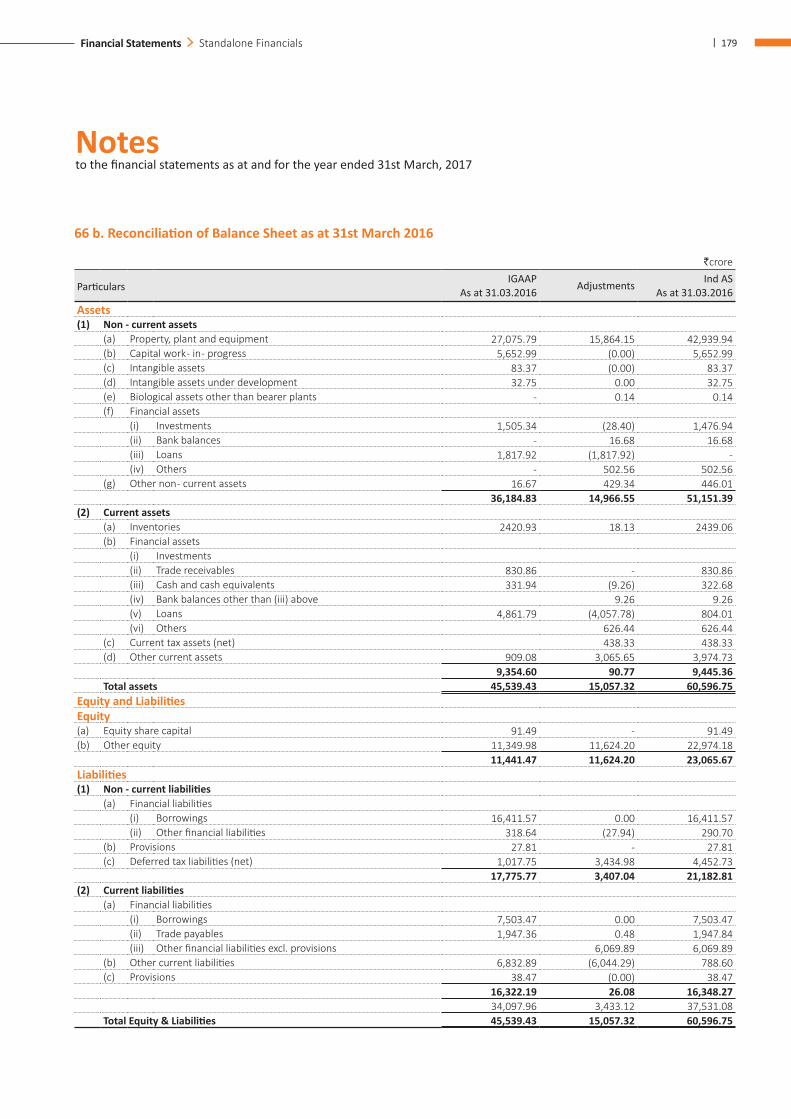
Notes to the financial statements as at and for the year ended 31st March, 2017
| 179Financial Statements Standalone Financials
66 b. Reconciliation of Balance Sheet as at 31st March 2016
`crore
ParticularsIGAAP
As at 31.03.2016 Adjustments Ind AS As at 31.03.2016
Assets(1) Non - current assets
(a) Property, plant and equipment 27,075.79 15,864.15 42,939.94 (b) Capital work - in - progress 5,652.99 (0.00) 5,652.99 (c) Intangible assets 83.37 (0.00) 83.37 (d) Intangible assets under development 32.75 0.00 32.75 (e) Biological assets other than bearer plants - 0.14 0.14 (f) Financial assets
(i) Investments 1,505.34 (28.40) 1,476.94 (ii) Bank balances - 16.68 16.68 (iii) Loans 1,817.92 (1,817.92) - (iv) Others - 502.56 502.56
(g) Other non - current assets 16.67 429.34 446.01 36,184.83 14,966.55 51,151.39
(2) Current assets(a) Inventories 2420.93 18.13 2439.06(b) Financial assets
(i) Investments(ii) Trade receivables 830.86 - 830.86 (iii) Cash and cash equivalents 331.94 (9.26) 322.68 (iv) Bank balances other than (iii) above 9.26 9.26 (v) Loans 4,861.79 (4,057.78) 804.01 (vi) Others 626.44 626.44
(c) Current tax assets (net) 438.33 438.33 (d) Other current assets 909.08 3,065.65 3,974.73
9,354.60 90.77 9,445.36 Total assets 45,539.43 15,057.32 60,596.75
Equity and LiabilitiesEquity(a) Equity share capital 91.49 - 91.49 (b) Other equity 11,349.98 11,624.20 22,974.18
11,441.47 11,624.20 23,065.67 Liabilities(1) Non - current liabilities
(a) Financial liabilities(i) Borrowings 16,411.57 0.00 16,411.57 (ii) Other financial liabilities 318.64 (27.94) 290.70
(b) Provisions 27.81 - 27.81 (c) Deferred tax liabilities (net) 1,017.75 3,434.98 4,452.73
17,775.77 3,407.04 21,182.81 (2) Current liabilities
(a) Financial liabilities(i) Borrowings 7,503.47 0.00 7,503.47 (ii) Trade payables 1,947.36 0.48 1,947.84 (iii) Other financial liabilities excl. provisions 6,069.89 6,069.89
(b) Other current liabilities 6,832.89 (6,044.29) 788.60 (c) Provisions 38.47 (0.00) 38.47
16,322.19 26.08 16,348.27 34,097.96 3,433.12 37,531.08
Total Equity & Liabilities 45,539.43 15,057.32 60,596.75
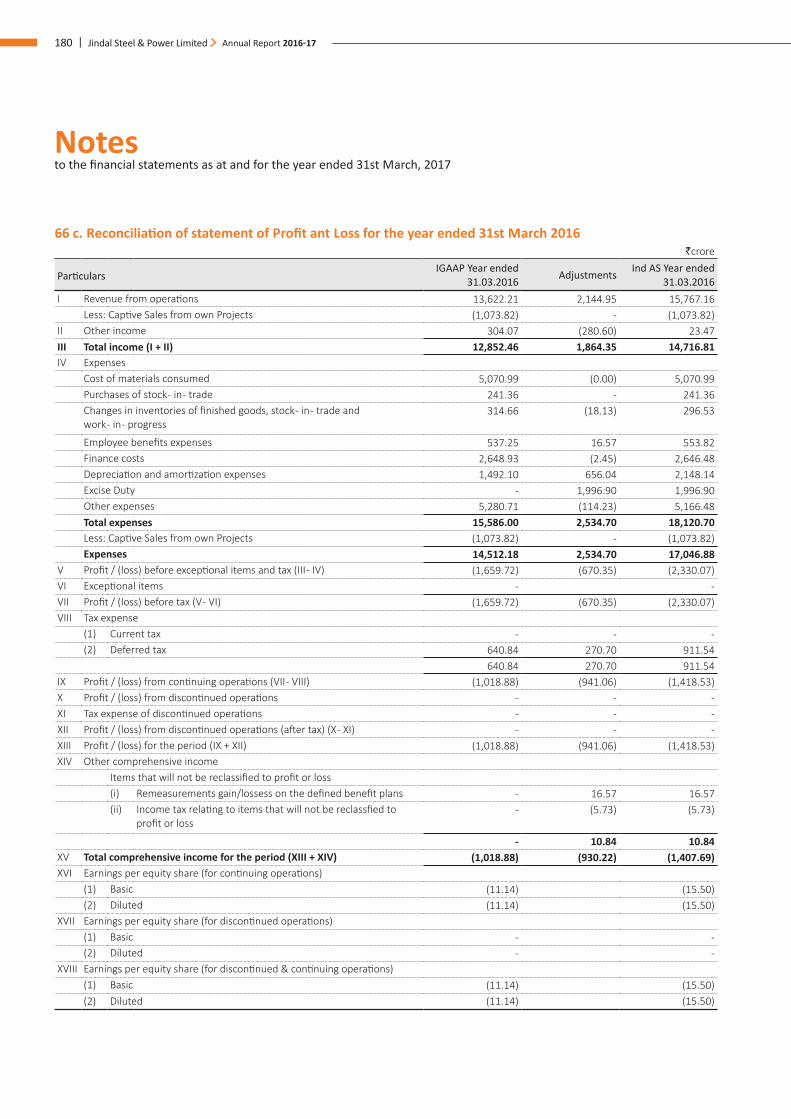
Notes to the financial statements as at and for the year ended 31st March, 2017
180 | Jindal Steel & Power Limited Annual Report 2016-17
66 c. Reconciliation of statement of Profit ant Loss for the year ended 31st March 2016 `crore
ParticularsIGAAP Year ended
31.03.2016 Adjustments Ind AS Year ended 31.03.2016
I Revenue from operations 13,622.21 2,144.95 15,767.16 Less: Captive Sales from own Projects (1,073.82) - (1,073.82)
II Other income 304.07 (280.60) 23.47 III Total income (I + II) 12,852.46 1,864.35 14,716.81 IV Expenses
Cost of materials consumed 5,070.99 (0.00) 5,070.99 Purchases of stock - in - trade 241.36 - 241.36 Changes in inventories of finished goods, stock - in - trade and work - in - progress
314.66 (18.13) 296.53
Employee benefits expenses 537.25 16.57 553.82 Finance costs 2,648.93 (2.45) 2,646.48 Depreciation and amortization expenses 1,492.10 656.04 2,148.14 Excise Duty - 1,996.90 1,996.90 Other expenses 5,280.71 (114.23) 5,166.48 Total expenses 15,586.00 2,534.70 18,120.70 Less: Captive Sales from own Projects (1,073.82) - (1,073.82)Expenses 14,512.18 2,534.70 17,046.88
V Profit / (loss) before exceptional items and tax (III - IV) (1,659.72) (670.35) (2,330.07)VI Exceptional items - - VII Profit / (loss) before tax (V - VI) (1,659.72) (670.35) (2,330.07)VIII Tax expense
(1) Current tax - - - (2) Deferred tax 640.84 270.70 911.54
640.84 270.70 911.54 IX Profit / (loss) from continuing operations (VII - VIII) (1,018.88) (941.06) (1,418.53)X Profit / (loss) from discontinued operations - - - XI Tax expense of discontinued operations - - - XII Profit / (loss) from discontinued operations (after tax) (X - XI) - - - XIII Profit / (loss) for the period (IX + XII) (1,018.88) (941.06) (1,418.53)XIV Other comprehensive income
Items that will not be reclassified to profit or loss(i) Remeasurements gain/lossess on the defined benefit plans - 16.57 16.57 (ii) Income tax relating to items that will not be reclassfied to
profit or loss - (5.73) (5.73)
- 10.84 10.84 XV Total comprehensive income for the period (XIII + XIV) (1,018.88) (930.22) (1,407.69)XVI Earnings per equity share (for continuing operations)
(1) Basic (11.14) (15.50)(2) Diluted (11.14) (15.50)
XVII Earnings per equity share (for discontinued operations)(1) Basic - - (2) Diluted - -
XVIII Earnings per equity share (for discontinued & continuing operations)(1) Basic (11.14) (15.50)(2) Diluted (11.14) (15.50)
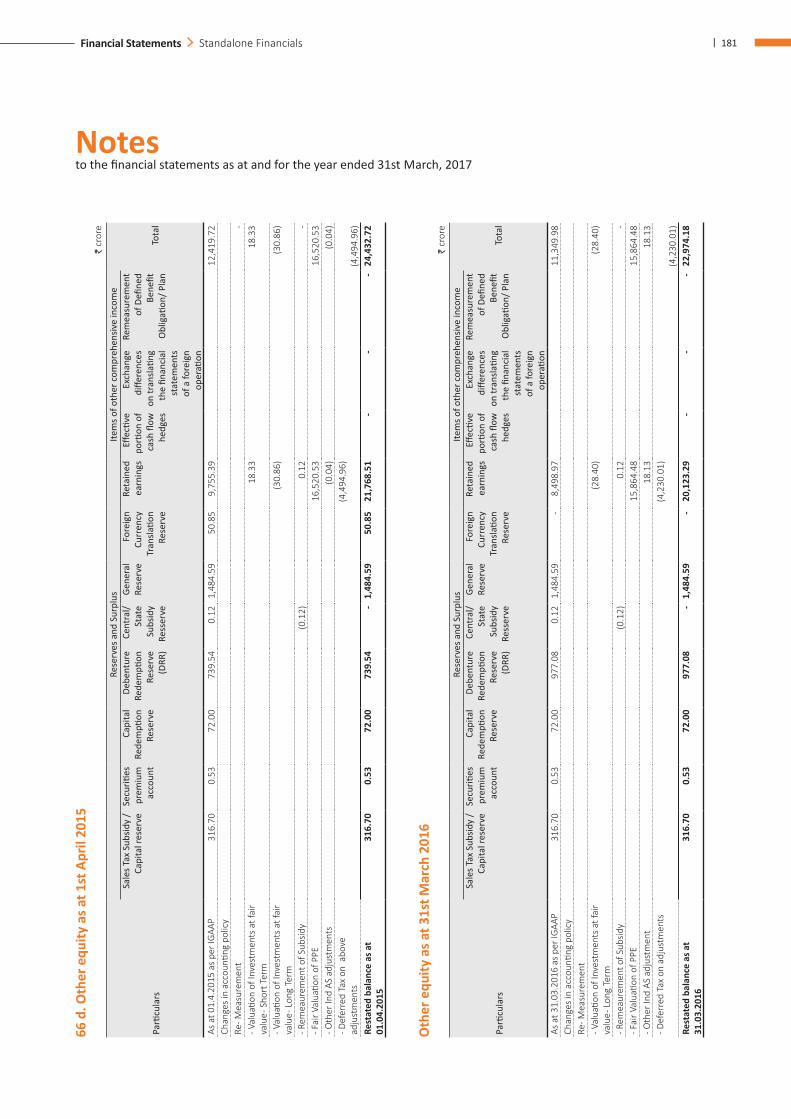
Notes to the financial statements as at and for the year ended 31st March, 2017
| 181Financial Statements Standalone Financials
66 d
. Oth
er e
quity
as a
t 1st
Apr
il 20
15
` cr
ore
Parti
cula
rs
Rese
rves
and
Sur
plus
Item
s of o
ther
com
preh
ensiv
e in
com
e
Tota
l
Sale
s Tax
Sub
sidy
/Ca
pita
l res
erve
Secu
rities
pr
emiu
m
acco
unt
Capi
tal
Rede
mpti
on
Rese
rve
Debe
ntur
e Re
dem
ption
Re
serv
e (D
RR)
Cent
ral/
Stat
e Su
bsid
y Re
sser
ve
Gene
ral
Rese
rve
Fore
ign
Curr
ency
Tr
ansla
tion
Rese
rve
Reta
ined
ea
rnin
gsEff
ectiv
e po
rtion
of
cash
flow
he
dges
Exch
ange
di
ffere
nces
on
tran
slatin
g th
e fin
anci
al
stat
emen
ts
of a
fore
ign
oper
ation
Rem
easu
rem
ent
of D
efine
d Be
nefit
O
blig
ation
/ Pla
n
As a
t 01.
4.20
15 a
s pe
r IG
AAP
316
.70
0.5
3 7
2.00
7
39.5
4 0
.12
1,4
84.5
9 5
0.85
9
,755
.39
12,
419.
72
Chan
ges
in a
ccou
nting
pol
icy
Re- M
easu
rem
ent
- - V
alua
tion
of In
vest
men
ts a
t fai
r va
lue -
Sho
rt T
erm
18.
33
18.
33
- Val
uatio
n of
Inve
stm
ents
at f
air
valu
e - L
ong
Term
(30.
86)
(30.
86)
- Rem
eaur
emen
t of S
ubsid
y (0
.12)
0.1
2 -
- Fai
r Val
uatio
n of
PPE
16,
520.
53
16,
520.
53
- Oth
er In
d AS
adj
ustm
ents
(0.0
4) (0
.04)
- Def
erre
d Ta
x on
abo
ve
adju
stm
ents
(4,4
94.9
6)
(4,4
94.9
6)Re
stat
ed b
alan
ce a
s at
01.0
4.20
15 3
16.7
0 0
.53
72.
00
739
.54
- 1,
484.
59
50.
85
21,
768.
51
- -
- 2
4,43
2.72
Oth
er e
quity
as a
t 31s
t Mar
ch 2
016
` cr
ore
Parti
cula
rs
Rese
rves
and
Sur
plus
Item
s of o
ther
com
preh
ensiv
e in
com
e
Tota
l
Sale
s Tax
Sub
sidy
/Ca
pita
l res
erve
Secu
rities
pr
emiu
m
acco
unt
Capi
tal
Rede
mpti
on
Rese
rve
Debe
ntur
e Re
dem
ption
Re
serv
e (D
RR)
Cent
ral/
Stat
e Su
bsid
y Re
sser
ve
Gene
ral
Rese
rve
Fore
ign
Curr
ency
Tr
ansla
tion
Rese
rve
Reta
ined
ea
rnin
gsEff
ectiv
e po
rtion
of
cash
flow
he
dges
Exch
ange
di
ffere
nces
on
tran
slatin
g th
e fin
anci
al
stat
emen
ts
of a
fore
ign
oper
ation
Rem
easu
rem
ent
of D
efine
d Be
nefit
O
blig
ation
/ Pla
n
As a
t 31.
03.2
016
as p
er IG
AAP
316
.70
0.5
3 7
2.00
9
77.0
8 0
.12
1,4
84.5
9 -
8,4
98.9
7 1
1,34
9.98
Ch
ange
s in
acc
ounti
ng p
olic
yRe
- Mea
sure
men
t- V
alua
tion
of In
vest
men
ts a
t fai
r va
lue -
Lon
g Te
rm (2
8.40
) (2
8.40
)
- Rem
eaur
emen
t of S
ubsid
y (0
.12)
0.1
2 -
- Fai
r Val
uatio
n of
PPE
15,
864.
48
15,
864.
48
- Oth
er In
d AS
adj
ustm
ent
18.
13
18.
13
- Def
erre
d Ta
x on
adj
ustm
ents
(4,2
30.0
1)
(4,2
30.0
1)Re
stat
ed b
alan
ce a
s at
31.0
3.20
16 3
16.7
0 0
.53
72.
00
977
.08
- 1,
484.
59
- 2
0,12
3.29
-
- -
22,
974.
18
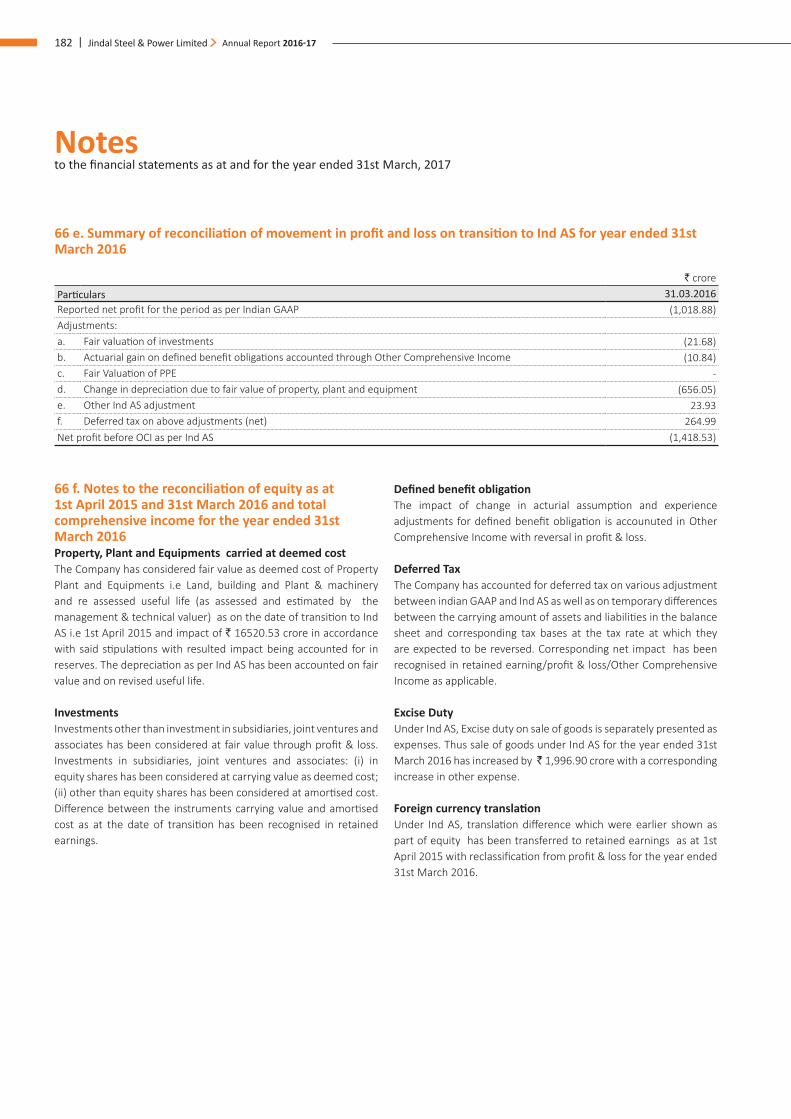
Notes to the financial statements as at and for the year ended 31st March, 2017
182 | Jindal Steel & Power Limited Annual Report 2016-17
66 e. Summary of reconciliation of movement in profit and loss on transition to Ind AS for year ended 31st March 2016
` croreParticulars 31.03.2016Reported net profit for the period as per Indian GAAP (1,018.88) Adjustments:a. Fair valuation of investments (21.68) b. Actuarial gain on defined benefit obligations accounted through Other Comprehensive Income (10.84) c. Fair Valuation of PPE - d. Change in depreciation due to fair value of property, plant and equipment (656.05) e. Other Ind AS adjustment 23.93 f. Deferred tax on above adjustments (net) 264.99 Net profit before OCI as per Ind AS (1,418.53)
66 f. Notes to the reconciliation of equity as at 1st April 2015 and 31st March 2016 and total comprehensive income for the year ended 31st March 2016 Property, Plant and Equipments carried at deemed costThe Company has considered fair value as deemed cost of Property Plant and Equipments i.e Land, building and Plant & machinery and re assessed useful life (as assessed and estimated by the management & technical valuer) as on the date of transition to Ind AS i.e 1st April 2015 and impact of ` 16520.53 crore in accordance with said stipulations with resulted impact being accounted for in reserves. The depreciation as per Ind AS has been accounted on fair value and on revised useful life.
Investments Investments other than investment in subsidiaries, joint ventures and associates has been considered at fair value through profit & loss. Investments in subsidiaries, joint ventures and associates: (i) in equity shares has been considered at carrying value as deemed cost; (ii) other than equity shares has been considered at amortised cost. Difference between the instruments carrying value and amortised cost as at the date of transition has been recognised in retained earnings.
Defined benefit obligation The impact of change in acturial assumption and experience adjustments for defined benefit obligation is accounuted in Other Comprehensive Income with reversal in profit & loss.
Deferred Tax The Company has accounted for deferred tax on various adjustment between indian GAAP and Ind AS as well as on temporary differences between the carrying amount of assets and liabilities in the balance sheet and corresponding tax bases at the tax rate at which they are expected to be reversed. Corresponding net impact has been recognised in retained earning/profit & loss/Other Comprehensive Income as applicable.
Excise Duty Under Ind AS, Excise duty on sale of goods is separately presented as expenses. Thus sale of goods under Ind AS for the year ended 31st March 2016 has increased by ̀ 1,996.90 crore with a corresponding increase in other expense.
Foreign currency translation Under Ind AS, translation difference which were earlier shown as part of equity has been transferred to retained earnings as at 1st April 2015 with reclassification from profit & loss for the year ended 31st March 2016.
Notes to the financial statements as at and for the year ended 31st March, 2017
| 183Financial Statements Standalone Financials
Financial assets and Financial Liabilities Financial assets and financial liabilities have been classified as per Ind AS 109 read with Ind AS 32.
Statement of Cash Flows The transition from Indian GAAP to Ind AS has not had a material impact on the statement of cash flows.
Discounts Under Indian GAAP, discounts were recognised as expenses which has been adjusted against the revenue under Ind AS during the year ended 31st March 2016.
Standards issued but not effective yet In March 2017, the Ministry of Corporate Affairs issued the Companies (Indian Accounting Standards) (Amendments) Rules, 2017, notifying amendments to Ind AS 7, ‘Statement of cash flows’ and Ind AS 102, ‘Share-based payment.’ These amendments are in accordance with the recent amendments made by International Accounting Standards Board (IASB) to IAS 7, ‘Statement of cash flows’ and IFRS 2, ‘Share-based payment,’ respectively. The amendments are applicable to the Company from April 1, 2017.
The amendment to Ind AS 7 requires the entities to provide disclosures that enable users of financial statements to evaluate
As per our report of even date For & on behalf of the Board of Directors
For Lodha & Co. Chartered Accountants Naveen Jindal Ravi UppalFirm Registration No. 301051E Chairman Managing Director & Group CEO
DIN: 00001523 DIN: 00025970N.K Lodha Partner Rajesh Bhatia Murli Manohar Purohit Membership No. 85155 Chief Financial Officer Company Secretary
Place: New DelhiDated: 23rd May, 2017
changes in liabilities arising from financing activities, including both changes arising from cash flows and non-cash changes, suggesting inclusion of a reconciliation between the opening and closing balances in the balance sheet for liabilities arising from financing activities, to meet the disclosure requirement.
The Company is evaluating the requirments of the amendment and the effect on the financial statements is being evaluated.
The amendment to Ind AS 102 provides specific guidance to measurement of cash-settled awards, modification of cash-settled awards and awards that include a net settlement feature in respect of withholding taxes.
The Company has an Employee Share Purchase Scheme namely JSPL ESPS 2013; however the said amendment does not have any possible impact on the financials of the Company..
67. Previous year figures have been regrouped/ rearranged / recast, wherever considered necessary to conform to current year’s classification. Figures less than 50000 have been shown as absolute number.
68. Notes 1 to 68 are annexed to and form an integral part of the financial statements.
184 | Jindal Steel & Power Limited Annual Report 2016-17
Independent Auditors’ Report on Consolidated Ind AS financial StatementsTo the Members of JINDAL STEEL & POWER LIMITED
Report on the Consolidated Ind AS financial StatementsWe have audited the accompanying Consolidated Ind AS financial statements of JINDAL STEEL & POWER LIMITED (herein after referred to as “the Holding Company”) and its subsidiaries (“the Holding Company & its subsidiaries” together referred as “the Group”), its associates and jointly controlled companies, comprising of the Consolidated Balance Sheet as at 31st March 2017, the Consolidated statement of profit and loss (including other comprehensive income), the Consolidated cash flow statement for the year then ended and the consolidated statement of changes in equity for the year then ended and a summary of the significant accounting policies and other explanatory information (hereinafter referred to as “the Consolidated Ind AS financial statements”).
Management’s Responsibility for the Consolidated Ind AS financial StatementsThe Holding Company’s Board of Directors is responsible for the preparation of the Consolidated Ind AS financial statements in terms of the requirements of the Companies Act, 2013 (herein after referred as “the Act”) that give a true and fair view of the Consolidated financial position, Consolidated financial performance and Consolidated cash flows of the Group, its associates and jointly controlled companies in accordance with the accounting principles generally accepted in India, including the Accounting Standards (Ind AS) specified under Section 133 of the Companies Act, 2013 read with relevant rules issued thereunder. The respective Board of Directors of the Companies included in the Group, its associates and jointly controlled companies are responsible for maintenance of adequate accounting records in accordance with the provisions of the Act for safeguarding of the assets of the Group, its associates and jointly controlled companies and for preventing and detecting frauds and other irregularities; the selection and application of appropriate accounting policies; making judgments and estimates that are reasonable and prudent; and the design, implementation and maintenance of adequate internal financial controls, that were operating effectively for ensuring the accuracy and completeness of the accounting records, relevant to the preparation and presentation of the financial statements that give a true and fair view and are free from material misstatement, whether due to fraud or error, which have been used for the purpose of preparation of the Consolidated Ind AS financial statements by the Directors of the Holding Company, as aforesaid.
Auditors’ ResponsibilityOur responsibility is to express an opinion on the Consolidated Ind AS financial statements based on our audit. While conducting the audit, we have taken into account the provisions of the Act, the accounting and auditing standards and matters which are required to be included in the audit report under the provisions of the Act and the Rules made thereunder.
We conducted our audit in accordance with the Standards on Auditing specified under section 143(10) of the Act. Those standards require that we comply with ethical requirements and plan and perform the audit to obtain reasonable assurance about whether the Consolidated Ind AS financial statements are free from material misstatement.
An audit involves performing procedures to obtain audit evidence about the amounts and the disclosures in the Consolidated Ind AS financial statements. The procedures selected depend on the auditor’s judgment, including the assessment of the risks of material misstatement of the Consolidated Ind AS financial statements, whether due to fraud or error. In making those risk assessments, the auditor considers internal financial control relevant to the Holding Company’s preparation of the Consolidated Ind AS financial statements that give a true and fair view in order to design audit procedures that are appropriate in the circumstances. An audit also includes evaluating the appropriateness of the accounting policies used and the reasonableness of the accounting estimates made by the Holding Company’s Board of Directors, as well as evaluating the overall presentation of the Consolidated Ind AS financial statements.
We believe that the audit evidence obtained by us and the audit evidence obtained by the other auditors in terms of their report referred to in the other matter below, is sufficient and appropriate to provide a basis for our audit opinion on the Consolidated Ind AS financial statements.
Basis of Qualified Opinion:We draw attention regarding impact on the net carrying value of fixed assets/investment made in mining assets not been considered for the reason stated in the Note No. 59 to the consolidated financial statements of the company for the year ended 31st March 2017 and the management’s view not to provide for additional levy paid of amounting to ` 1,355.79 crore (being differential between Gross and Net) as stated in the Note No. 58 to the consolidated financial statements of the company for the year ended 31st March 2017, which shown as good and recoverable.
Auditors have also qualified in its report on consolidated financial statements for the year ended 31st March 2016.
Qualified OpinionIn our opinion and to the best of our information and according to the explanations given to us, except for the effects/ possible effects of our observation stated in “Basis of Qualified Opinion paragraph” above, read with ‘Other Matters’ paragraph (b) below, the aforesaid Consolidated Ind AS financial statements give the information required by the Act in the manner so required and give a true and fair view in conformity with the accounting principles generally accepted in India including the Ind AS, of the Consolidated state of affairs (financial position) of the Group, as at 31 March 2017, and their Consolidated loss (financial performance) including other
| 185Financial Statements Consolidated Financials
comprehensive income, their Consolidated cash flows and the consolidated changes in equity for the year ended on that date.
Other Matters(a) We did not audit the financial statements of 25 subsidiaries
(including 2 numbers JVs considered for consolidation as per Ind AS 110) included in the consolidated financial statements of the company for the year ended 31st March 2017, whose financial statements reflect total assets of ` 36,281.95 crore and net assets of ` 13,130.34 crore as at 31st March, 2017, total revenue of ` 7,563.22 crore, for the year ended 31st March 2017 and net cash inflow of ` 159.12 crore for the year ended 31st March 2017, as considered in the consolidated Ind AS financial statements. The consolidated Ind AS financial statements also include the Company’s share of net profit of ` 3.51 crore for the year ended 31st March 2017, as considered in the consolidated Ind AS financial statements, in respect of 1 associate and 1 joint venture. These financial statements have been audited by other auditors whose reports have been furnished to us by the Management and our report on the statement, in so far as it relates to the amounts and disclosures included in respect of these subsidiaries, associate and joint venture is based solely on the reports of the other auditors.
Certain of these subsidiaries are located outside India whose financial statements and other financial information have been prepared in accordance with accounting principles generally accepted in their respective countries and which have been audited by other auditors under generally accepted auditing standards applicable in their respective countries. The Company‘s management has converted the financial statements of such subsidiaries located outside India from accounting principles generally accepted in their respective countries to accounting principles generally accepted in India. We have audited these conversion adjustments made by the Company‘s management. Our opinion in so far as it relates to the balances and affairs of such subsidiaries located outside India is based on the report of other auditors and the conversion adjustments prepared by the management of the Company and audited by us.
(b) We have relied on the management certified financial statements (un-audited) of 61 subsidiaries, whose financial statements reflect total assets of ` 16,343.77 crore and net assets of ` 2,207.15 crore as at 31st March, 2017, total revenue of ̀ 280.02 crore for the year ended 31st March, 2017 and net cash outflow of ` 117.96 crore for the year ended 31st March 2017, as considered in the consolidated Ind AS financial statements. The consolidated Ind AS financial statements also include the Company’s share of net loss of ` 6,156.53 for the year ended 31st March 2017, as considered in the consolidated Ind AS financial statements, in respect of 2 associates. These Financial statements are un-audited and have been furnished to us by the management and our opinion on the statement, in so far as it relates to the amounts included and disclosure included in respect of these subsidiaries / Associates is based solely on such management certified financial statements / financial information.
Our opinion on the Consolidated Ind AS financial statements, and our report on Other Legal and Regulatory Requirements below, is not modified in respect of the above matters with respect to our reliance on the work done and the reports of the other auditors and the financial statements / financial information certified by the Management.
Report on Other Legal and Regulatory RequirementsAs required by sub-section 3 of Section 143 of the Act, we report, to the extent applicable, that:
(a) We have sought and obtained all the information and explanations which to the best of our knowledge and belief were necessary for the purposes of our audit of the aforesaid Consolidated Ind AS financial statements.
(b) In our opinion, proper books of account as required by law relating to preparation of the aforesaid Consolidated Ind AS financial statements have been kept so far as it appears from our examination of those books and the reports of the other auditors.
(c) The Consolidated balance sheet, the Consolidated statement of profit and loss, the Consolidated Cash Flow Statement and Consolidated Statement of Changes in Equity dealt with by this Report are in agreement with the relevant books of account maintained for the purpose of preparation of the Consolidated Ind AS financial statements.
(d) In our opinion, except for the effect / possible effect of the matters described in ‘Basis of Qualified Opinion’ paragraph above, the aforesaid Consolidated Ind AS financial statements comply with the Accounting Standards specified under Section 133 of the Act, read with relevant rules issued thereunder.
(e) The matters described in ‘Basis of Qualified Opinion’ paragraph above, in our opinion, may not have an adverse effect on the functioning of the Group.
(f) On the basis of the written representations received from the directors of the Holding Company as on 31 March 2017 taken on record by the Board of Directors of the Holding Company and the report of the statutory auditors of its subsidiary companies ,associate companies and jointly controlled companies incorporated in India, none of the Directors of the Group, its associates and jointly controlled companies incorporated in India is disqualified as on 31 March 2017 from being appointed as a Director in terms of Section 164(2) of the Act.
(f) With respect to the adequacy of the internal financial controls over financial reporting of the Group (Holding Company, Subsidiary Companies, associates companies and jointly controlled companies incorporated in India) the operating effectiveness of such controls, refer to our separate report in “Annexure- A”; and
186 | Jindal Steel & Power Limited Annual Report 2016-17
(g) With respect to the other matters to be included in the Auditor’s Report in accordance with Rule 11 of the Companies (Audit and Auditors) Rules, 2014, in our opinion and to the best of our information and according to the explanations given to us:
i. The Consolidated Ind AS financial statements disclose the impact of pending litigations on the Consolidated financial position of the Group, its associates and jointly controlled companies - Refer Note No. 44(a) to the Consolidated Ind AS financial statements.
ii. Provision has been made in the Consolidated Ind AS financial statement, as required under the applicable law or accounting standards, for material foreseeable losses, if any, on long term contracts including derivatives contracts.
iii. There has been no delay in transferring amounts, required to be transferred, to the Investor Education and Protection Fund by the holding company and its subsidiaries companies, associate Companies and jointly controlled entities incorporated in India.
iv. The company had provided requisite disclosures in its financial statements as to holdings as well as dealings in Specified Bank Notes during the period from 8th November, 2016 to 30th December, 2016 and these are in accordance with the books of accounts maintained by the company. Refer Note No. 17 to the Consolidated Ind AS financial statements.
For LODHA & CO. Chartered Accountants FRN: 301051E
N.K. LODHA Partner Membership No. 85155 Place: New Delhi Dated: 23rd May 2017
ANNEXURE ‘A’ TO THE INDEPENDENT AUDITOR’S REPORT ON CONSOLIDATED Ind AS FINANCIAL STATEMENTS of JINDAL STEEL & POWER LIMITED
Report on the Internal Financial Controls over Financial Reporting under Clause (i) of Sub-section 3 of Section 143 of the Companies Act, 2013 (“the Act”)In conjunction with our audit of the Consolidated Ind AS financial statements of the Company as of and for the year ended 31st March 2017, we have audited the internal financial controls over financial reporting of JINDAL STEEL & POWER LIMITED (“the Holding Company”) and its subsidiaries (the Holding Company and its subsidiaries (incorporated in India) together referred to as “the Group”), its associates and jointly controlled companies which are companies incorporated in India, as of that date.
Management’s Responsibility for Internal Financial ControlsThe Respective Board of Directors of the Holding Company and its subsidiary companies, which are companies incorporated in India, are responsible for establishing and maintaining internal financial controls based on the internal control over financial reporting criteria established by the Company considering the essential components of internal control stated in the Guidance Note on Audit of Internal Financial Controls over Financial Reporting issued by the Institute of Chartered Accountants of India (“ICAI’). These responsibilities include the design, implementation and maintenance of adequate internal financial controls that were operating effectively for ensuring the orderly and efficient conduct of its business, including adherence to company’s policies, the safeguarding of its assets, the prevention and detection of frauds and errors, the accuracy and completeness of the accounting records, and the timely preparation of reliable financial information, as required under the Companies Act, 2013.
Auditor’s ResponsibilityOur responsibility is to express an opinion on the Group’s internal financial controls over financial reporting based on our audit. We conducted our audit in accordance with the Guidance Note on Audit of Internal Financial Controls over Financial Reporting (the “Guidance Note”) issued by ICAI and the Standards on Auditing, issued by ICAI and deemed to be prescribed under section 143(10) of the Companies Act, 2013, to the extent applicable to an audit of internal financial controls, both issued by the Institute of Chartered Accountants of India. Those Standards and the Guidance Note require that we comply with ethical requirements and plan and perform the audit to obtain reasonable assurance about whether adequate internal financial controls over financial reporting was established and maintained and if such controls operated effectively in all material respects.
Our audit involves performing procedures to obtain audit evidence about the adequacy of the internal financial controls system over financial reporting and their operating effectiveness. Our audit of internal financial controls over financial reporting included obtaining an understanding of internal financial controls over financial reporting, assessing the risk that a material weakness exists, and testing and evaluating the design and operating effectiveness of internal control based on the assessed risk. The procedures selected depend on the auditor’s judgment, including the assessment of the risks of material misstatement of the financial statements, whether due to fraud or error.
| 187Financial Statements Consolidated Financials
We believe that the audit evidence we have obtained and the audit evidence obtained by the other auditors in terms of their reports referred to in the Other Matters paragraph below is sufficient and appropriate to provide a basis for our audit opinion on the Group’s internal financial controls system over financial reporting.
Meaning of Internal Financial Controls Over Financial ReportingA Company’s internal financial control over financial reporting is a process designed to provide reasonable assurance regarding the reliability of financial reporting and the preparation of financial statements for external purposes in accordance with generally accepted accounting principles. A Company’s internal financial control over financial reporting includes those policies and procedures that (1) pertain to the maintenance of records that, in reasonable detail, accurately and fairly reflect the transactions and dispositions of the assets of the Company; (2) provide reasonable assurance that transactions are recorded as necessary to permit preparation of financial statements in accordance with generally accepted accounting principles, and that receipts and expenditures of the companies are being made only in accordance with authorizations of management and directors of the Company; and (3) provide reasonable assurance regarding prevention or timely detection of unauthorized acquisition, use, or disposition of the Company’s assets that could have a material effect on the financial statements.
Inherent Limitations of Internal Financial Controls Over Financial ReportingBecause of the inherent limitations of internal financial controls over financial reporting, including the possibility of collusion or improper management override of controls, material misstatements due to error or fraud may occur and not be detected. Also, projections of any evaluation of the internal financial controls over financial reporting to future periods are subject to the risk that the internal financial control over financial reporting may become inadequate because of changes in conditions, or that the degree of compliance with the policies or procedures may deteriorate.
Qualified OpinionAccording to the information and explanations given to us and based on our audit and based on the reports issued by other auditors on internal financial control over financial reporting system, the following weaknesses has been identified in the operating effectiveness of the Company’s internal financial controls over financial reporting as at 31st March 2017:
(a) Provision/adjustment to be made by Group in regard to expense relating to additional coal levy could potentially result in the Group recording lower expense. (Note no. 58)
(b) Provision/impact of the net carrying value of fixed assets/investment made in mining assets by Group not been considered (presently not determinable); which may result in carrying the assets at higher value. (Note No. 59)
A ‘material weakness’ is a deficiency, or a combination of deficiencies, in internal financial control over financial reporting, such that there is a reasonable possibility that a material misstatement of the Company’s annual or interim financial statements will not be prevented or detected on a timely basis.
In our opinion, except for the effects / possible effects of the material weaknesses described above in (a) and (b) under Qualified Opinion paragraph on the achievement of the objectives of the control criteria, the Holding Company, its subsidiary companies, its associates and jointly controlled companies, which are companies incorporated in India, have, in all material respects, an adequate internal financial controls system over financial reporting and such internal financial controls over financial reporting were operating effectively as of 31st March 2017, based on the internal control over financial reporting criteria established by the Company considering the essential components of internal control stated in the Guidance Note on Audit of Internal Financial Controls Over Financial Reporting issued by the ICAI.
Other Matters:Our report u/s 143(3)(i) of the Act on the adequacy and operating effectiveness of the internal financial controls over financial reporting of the Holding company in so far as it relates to 9 numbers subsidiary companies, 1 associate company and 3 jointly controlled companies, which are incorporated in India, is based solely on the corresponding reports of respective auditors of such subsidiaries, associate company and jointly controlled companies incorporated in India.
We have considered material weakness identified and reported above in determining the nature, timing, and extent of audit tests applied in our audit of the March 31, 2017 consolidated financial statements of the Company and these material weaknesses affect our opinion on consolidated financial statements of the Company for the year ended 31st March 2017 [our audit report dated May 23, 2017, which expressed an qualified opinion on those consolidated financial statements of the Company].
For LODHA & CO. Chartered Accountants ICAI-FRN: 301051E
N.K. LODHA Partner Membership No. 85155 Place: New DelhiDated: 23rd May 2017
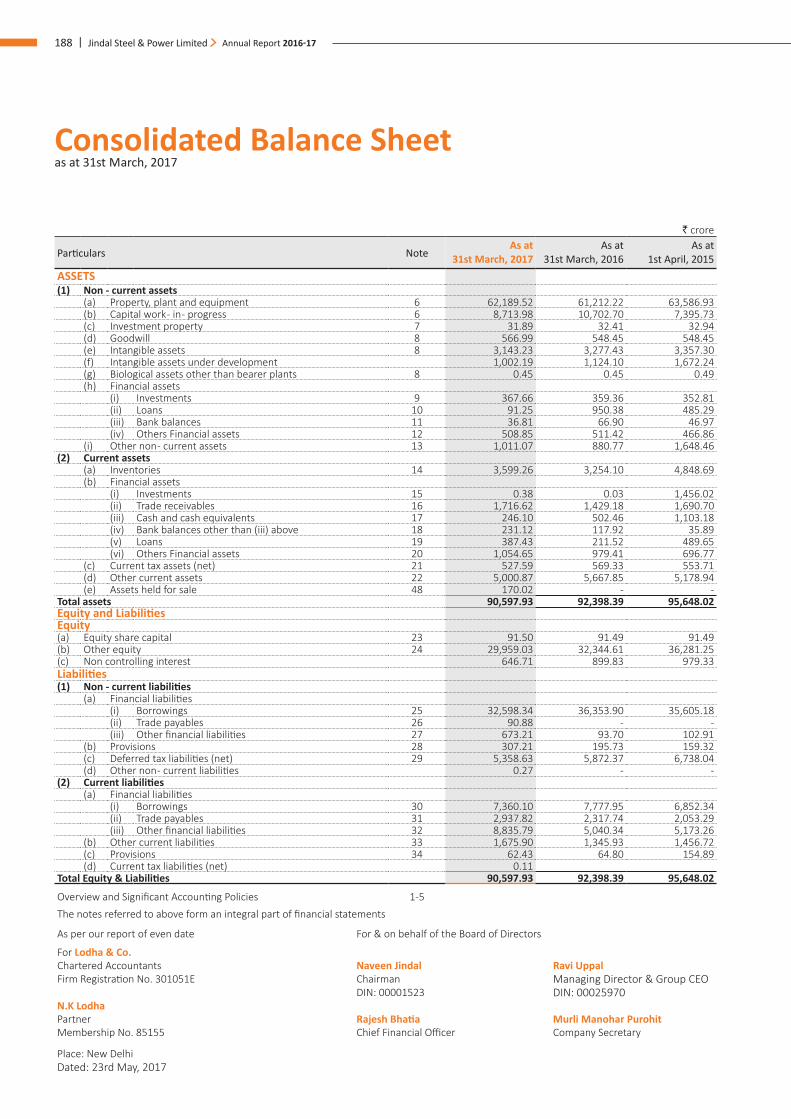
188 | Jindal Steel & Power Limited Annual Report 2016-17
Consolidated Balance Sheet as at 31st March, 2017
` crore
Particulars Note As at
31st March, 2017 As at
31st March, 2016 As at
1st April, 2015 ASSETS(1) Non - current assets
(a) Property, plant and equipment 6 62,189.52 61,212.22 63,586.93 (b) Capital work - in - progress 6 8,713.98 10,702.70 7,395.73 (c) Investment property 7 31.89 32.41 32.94 (d) Goodwill 8 566.99 548.45 548.45 (e) Intangible assets 8 3,143.23 3,277.43 3,357.30 (f) Intangible assets under development 1,002.19 1,124.10 1,672.24 (g) Biological assets other than bearer plants 8 0.45 0.45 0.49 (h) Financial assets
(i) Investments 9 367.66 359.36 352.81 (ii) Loans 10 91.25 950.38 485.29 (iii) Bank balances 11 36.81 66.90 46.97 (iv) Others Financial assets 12 508.85 511.42 466.86
(i) Other non - current assets 13 1,011.07 880.77 1,648.46 (2) Current assets
(a) Inventories 14 3,599.26 3,254.10 4,848.69 (b) Financial assets
(i) Investments 15 0.38 0.03 1,456.02 (ii) Trade receivables 16 1,716.62 1,429.18 1,690.70 (iii) Cash and cash equivalents 17 246.10 502.46 1,103.18 (iv) Bank balances other than (iii) above 18 231.12 117.92 35.89 (v) Loans 19 387.43 211.52 489.65 (vi) Others Financial assets 20 1,054.65 979.41 696.77
(c) Current tax assets (net) 21 527.59 569.33 553.71 (d) Other current assets 22 5,000.87 5,667.85 5,178.94 (e) Assets held for sale 48 170.02 - -
Total assets 90,597.93 92,398.39 95,648.02 Equity and Liabilities Equity(a) Equity share capital 23 91.50 91.49 91.49 (b) Other equity 24 29,959.03 32,344.61 36,281.25 (c) Non controlling interest 646.71 899.83 979.33 Liabilities(1) Non - current liabilities
(a) Financial liabilities(i) Borrowings 25 32,598.34 36,353.90 35,605.18 (ii) Trade payables 26 90.88 - - (iii) Other financial liabilities 27 673.21 93.70 102.91
(b) Provisions 28 307.21 195.73 159.32 (c) Deferred tax liabilities (net) 29 5,358.63 5,872.37 6,738.04 (d) Other non - current liabilities 0.27 - -
(2) Current liabilities(a) Financial liabilities
(i) Borrowings 30 7,360.10 7,777.95 6,852.34 (ii) Trade payables 31 2,937.82 2,317.74 2,053.29 (iii) Other financial liabilities 32 8,835.79 5,040.34 5,173.26
(b) Other current liabilities 33 1,675.90 1,345.93 1,456.72 (c) Provisions 34 62.43 64.80 154.89 (d) Current tax liabilities (net) 0.11
Total Equity & Liabilities 90,597.93 92,398.39 95,648.02
Overview and Significant Accounting Policies 1-5The notes referred to above form an integral part of financial statements
As per our report of even date For & on behalf of the Board of Directors
For Lodha & Co. Chartered Accountants Naveen Jindal Ravi UppalFirm Registration No. 301051E Chairman Managing Director & Group CEO
DIN: 00001523 DIN: 00025970N.K Lodha Partner Rajesh Bhatia Murli Manohar Purohit Membership No. 85155 Chief Financial Officer Company Secretary
Place: New DelhiDated: 23rd May, 2017
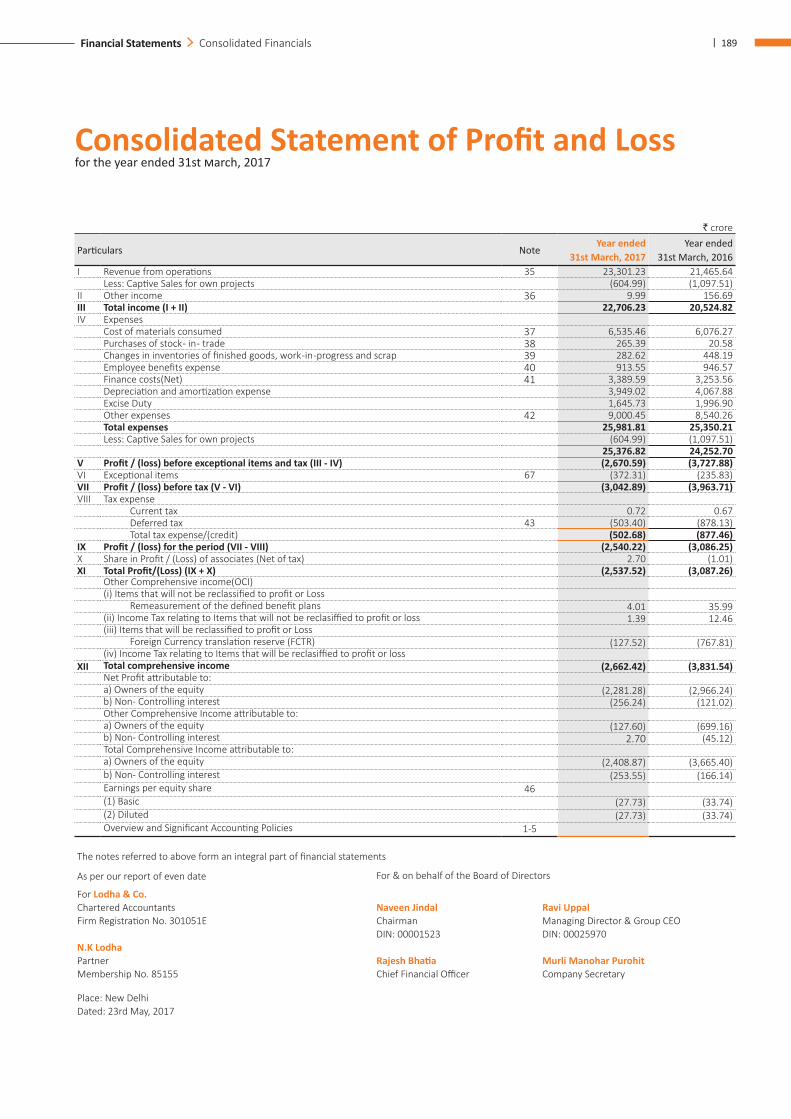
| 189Financial Statements Consolidated Financials
` crore
Particulars NoteYear ended
31st March, 2017 Year ended
31st March, 2016 I Revenue from operations 35 23,301.23 21,465.64
Less: Captive Sales for own projects (604.99) (1,097.51)II Other income 36 9.99 156.69 III Total income (I + II) 22,706.23 20,524.82 IV Expenses
Cost of materials consumed 37 6,535.46 6,076.27 Purchases of stock - in - trade 38 265.39 20.58 Changes in inventories of finished goods, work -in -progress and scrap 39 282.62 448.19 Employee benefits expense 40 913.55 946.57 Finance costs(Net) 41 3,389.59 3,253.56 Depreciation and amortization expense 3,949.02 4,067.88 Excise Duty 1,645.73 1,996.90 Other expenses 42 9,000.45 8,540.26 Total expenses 25,981.81 25,350.21 Less: Captive Sales for own projects (604.99) (1,097.51)
25,376.82 24,252.70 V Profit / (loss) before exceptional items and tax (III - IV) (2,670.59) (3,727.88)VI Exceptional items 67 (372.31) (235.83)VII Profit / (loss) before tax (V - VI) (3,042.89) (3,963.71)VIII Tax expense
Current tax 0.72 0.67 Deferred tax 43 (503.40) (878.13) Total tax expense/(credit) (502.68) (877.46)
IX Profit / (loss) for the period (VII - VIII) (2,540.22) (3,086.25)X Share in Profit / (Loss) of associates (Net of tax) 2.70 (1.01)XI Total Profit/(Loss) (IX + X) (2,537.52) (3,087.26)
Other Comprehensive income(OCI)(i) Items that will not be reclassified to profit or Loss Remeasurement of the defined benefit plans 4.01 35.99 (ii) Income Tax relating to Items that will not be reclasiffied to profit or loss 1.39 12.46 (iii) Items that will be reclassified to profit or Loss Foreign Currency translation reserve (FCTR) (127.52) (767.81)(iv) Income Tax relating to Items that will be reclasiffied to profit or loss
XII Total comprehensive income (2,662.42) (3,831.54)Net Profit attributable to:a) Owners of the equity (2,281.28) (2,966.24)b) Non- Controlling interest (256.24) (121.02)Other Comprehensive Income attributable to:a) Owners of the equity (127.60) (699.16)b) Non- Controlling interest 2.70 (45.12)Total Comprehensive Income attributable to:a) Owners of the equity (2,408.87) (3,665.40)b) Non- Controlling interest (253.55) (166.14)Earnings per equity share 46(1) Basic (27.73) (33.74)(2) Diluted (27.73) (33.74)Overview and Significant Accounting Policies 1-5
The notes referred to above form an integral part of financial statements
As per our report of even date For & on behalf of the Board of Directors
For Lodha & Co. Chartered Accountants Naveen Jindal Ravi UppalFirm Registration No. 301051E Chairman Managing Director & Group CEO
DIN: 00001523 DIN: 00025970N.K Lodha Partner Rajesh Bhatia Murli Manohar Purohit Membership No. 85155 Chief Financial Officer Company Secretary
Place: New DelhiDated: 23rd May, 2017
Consolidated Statement of Profit and Loss for the year ended 31st �arch, 2017
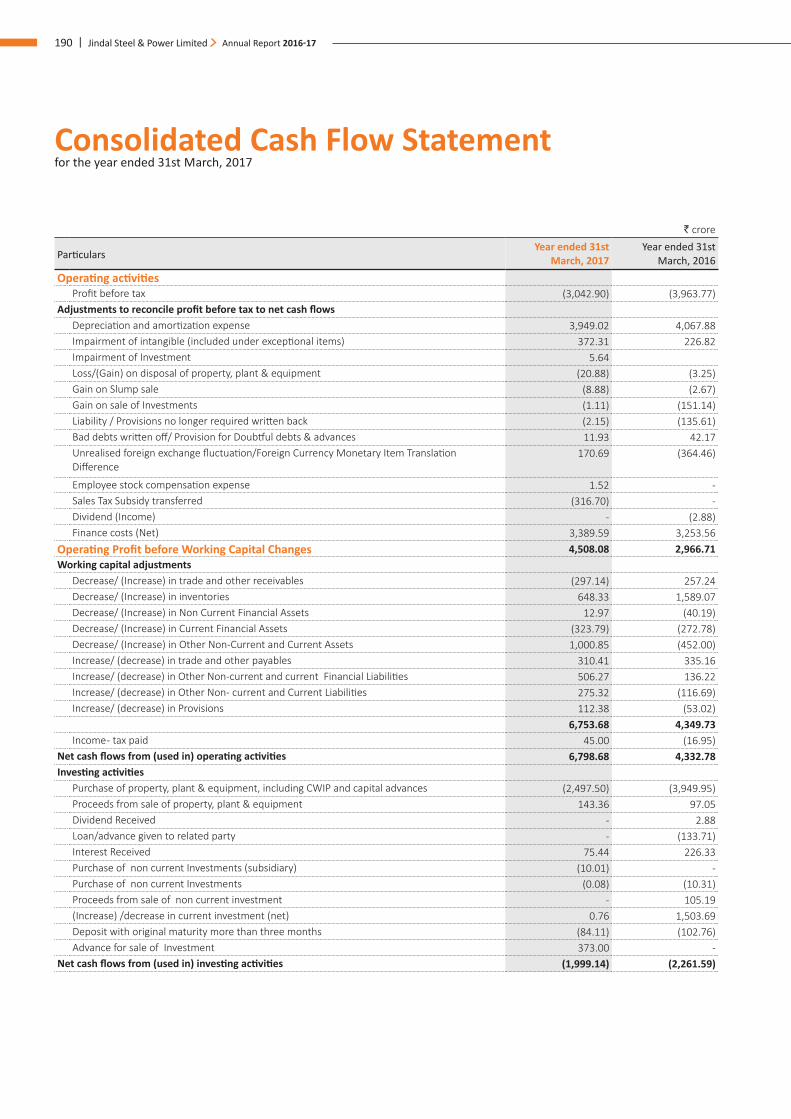
190 | Jindal Steel & Power Limited Annual Report 2016-17
Consolidated Cash Flow Statement for the year ended 31st March, 2017
` crore
ParticularsYear ended 31st
March, 2017 Year ended 31st
March, 2016 Operating activities
Profit before tax (3,042.90) (3,963.77)Adjustments to reconcile profit before tax to net cash flows
Depreciation and amortization expense 3,949.02 4,067.88 Impairment of intangible (included under exceptional items) 372.31 226.82 Impairment of Investment 5.64 Loss/(Gain) on disposal of property, plant & equipment (20.88) (3.25)Gain on Slump sale (8.88) (2.67)Gain on sale of Investments (1.11) (151.14)Liability / Provisions no longer required written back (2.15) (135.61)Bad debts written off/ Provision for Doubtful debts & advances 11.93 42.17 Unrealised foreign exchange fluctuation/Foreign Currency Monetary Item Translation Difference
170.69 (364.46)
Employee stock compensation expense 1.52 - Sales Tax Subsidy transferred (316.70) - Dividend (Income) - (2.88)Finance costs (Net) 3,389.59 3,253.56
Operating Profit before Working Capital Changes 4,508.08 2,966.71 Working capital adjustments
Decrease/ (Increase) in trade and other receivables (297.14) 257.24 Decrease/ (Increase) in inventories 648.33 1,589.07 Decrease/ (Increase) in Non Current Financial Assets 12.97 (40.19)Decrease/ (Increase) in Current Financial Assets (323.79) (272.78)Decrease/ (Increase) in Other Non-Current and Current Assets 1,000.85 (452.00)Increase/ (decrease) in trade and other payables 310.41 335.16 Increase/ (decrease) in Other Non-current and current Financial Liabilities 506.27 136.22 Increase/ (decrease) in Other Non- current and Current Liabilities 275.32 (116.69)Increase/ (decrease) in Provisions 112.38 (53.02)
6,753.68 4,349.73 Income - tax paid 45.00 (16.95)
Net cash flows from (used in) operating activities 6,798.68 4,332.78 Investing activities
Purchase of property, plant & equipment, including CWIP and capital advances (2,497.50) (3,949.95)Proceeds from sale of property, plant & equipment 143.36 97.05 Dividend Received - 2.88 Loan/advance given to related party - (133.71)Interest Received 75.44 226.33 Purchase of non current Investments (subsidiary) (10.01) - Purchase of non current Investments (0.08) (10.31)Proceeds from sale of non current investment - 105.19 (Increase) /decrease in current investment (net) 0.76 1,503.69 Deposit with original maturity more than three months (84.11) (102.76)Advance for sale of Investment 373.00 -
Net cash flows from (used in) investing activities (1,999.14) (2,261.59)
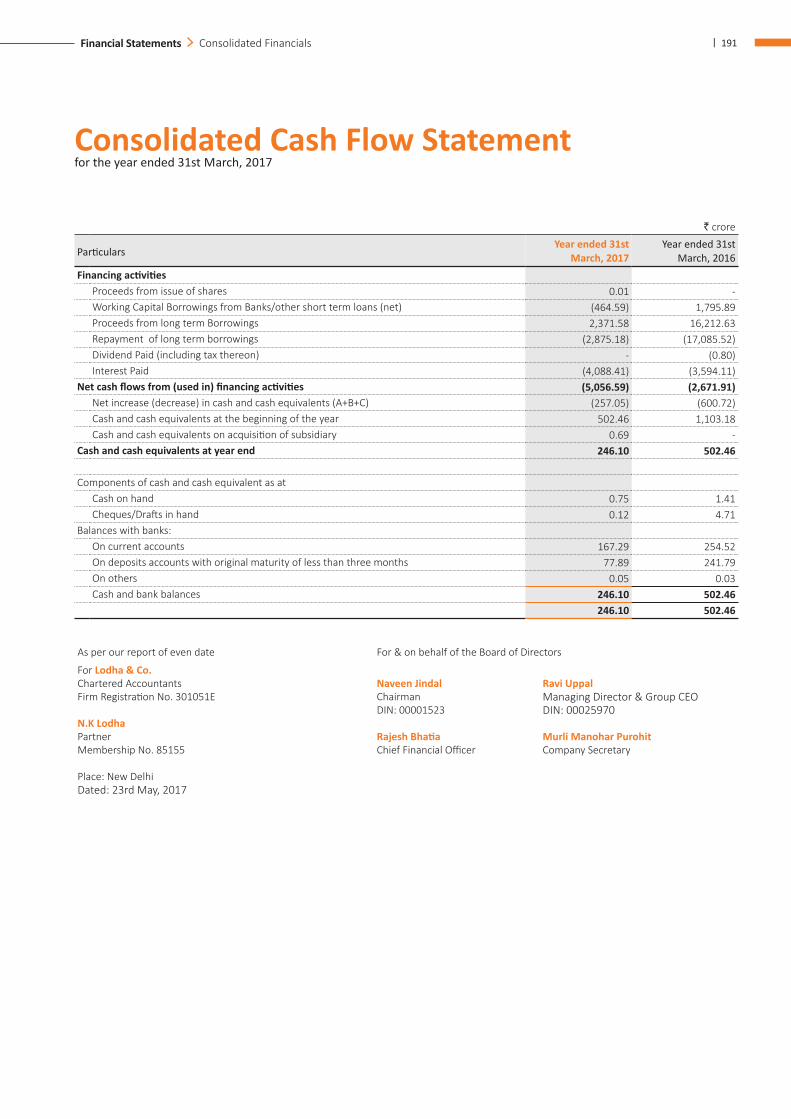
| 191Financial Statements Consolidated Financials
Consolidated Cash Flow Statement for the year ended 31st March, 2017
As per our report of even date For & on behalf of the Board of Directors
For Lodha & Co. Chartered Accountants Naveen Jindal Ravi UppalFirm Registration No. 301051E Chairman Managing Director & Group CEO
DIN: 00001523 DIN: 00025970N.K Lodha Partner Rajesh Bhatia Murli Manohar Purohit Membership No. 85155 Chief Financial Officer Company Secretary
Place: New DelhiDated: 23rd May, 2017
` crore
ParticularsYear ended 31st
March, 2017 Year ended 31st
March, 2016 Financing activities
Proceeds from issue of shares 0.01 - Working Capital Borrowings from Banks/other short term loans (net) (464.59) 1,795.89 Proceeds from long term Borrowings 2,371.58 16,212.63 Repayment of long term borrowings (2,875.18) (17,085.52)Dividend Paid (including tax thereon) - (0.80)Interest Paid (4,088.41) (3,594.11)
Net cash flows from (used in) financing activities (5,056.59) (2,671.91)Net increase (decrease) in cash and cash equivalents (A+B+C) (257.05) (600.72)Cash and cash equivalents at the beginning of the year 502.46 1,103.18 Cash and cash equivalents on acquisition of subsidiary 0.69 -
Cash and cash equivalents at year end 246.10 502.46
Components of cash and cash equivalent as at Cash on hand 0.75 1.41 Cheques/Drafts in hand 0.12 4.71
Balances with banks:On current accounts 167.29 254.52 On deposits accounts with original maturity of less than three months 77.89 241.79 On others 0.05 0.03 Cash and bank balances 246.10 502.46
246.10 502.46
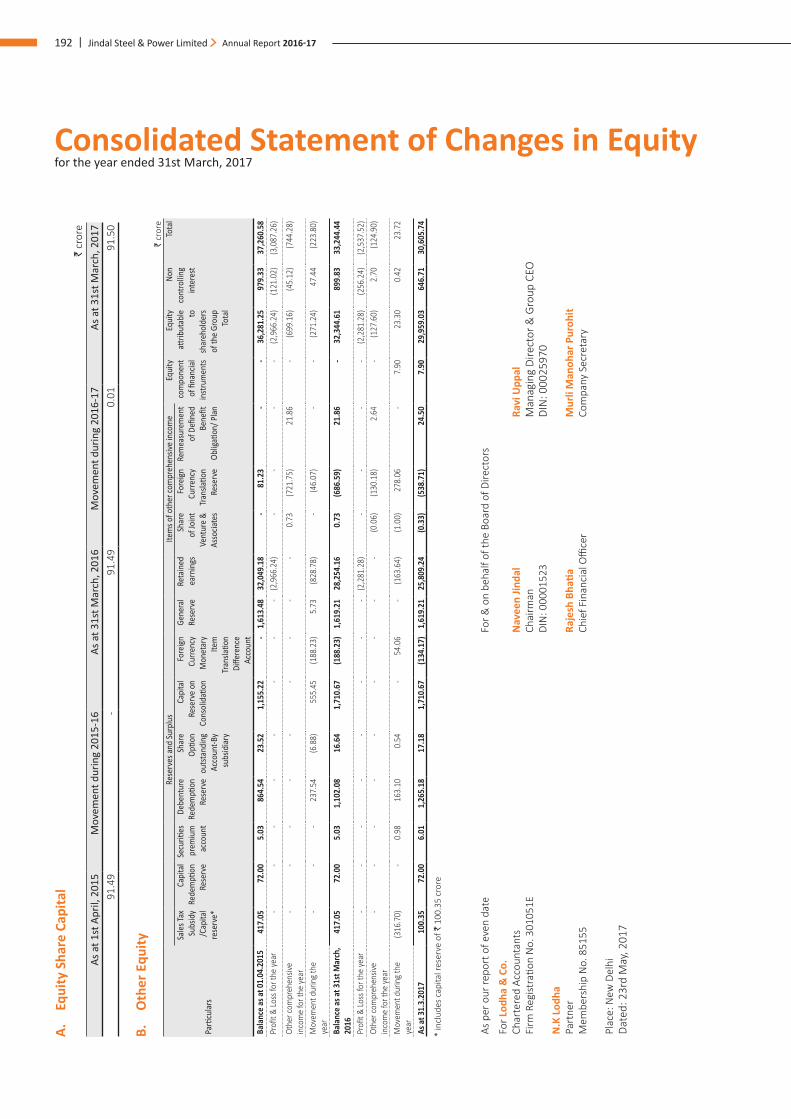
192 | Jindal Steel & Power Limited Annual Report 2016-17
Consolidated Statement of Changes in Equity for the year ended 31st March, 2017
A.
Equi
ty S
hare
Cap
ital
` cr
ore
As a
t 1st
Apr
il, 2
015
Mov
emen
t dur
ing
2015
-16
As a
t 31s
t Mar
ch, 2
016
Mov
emen
t dur
ing
2016
-17
As a
t 31s
t Mar
ch, 2
017
91.
49
- 9
1.49
0
.01
91.
50
B.
Oth
er E
quity
` cr
ore
Parti
cular
s
Rese
rves
and
Surp
lus
Item
s of o
ther
com
preh
ensiv
e in
com
eEq
uity
co
mpo
nent
of
fina
ncial
in
strum
ents
Equi
ty
attrib
utab
le
to
shar
ehol
ders
of
the
Grou
pTo
tal
Non
cont
rollin
g in
tere
st
Tota
lSa
les T
ax
Subs
idy
/Cap
ital
rese
rve*
Capi
tal
Rede
mpti
on
Rese
rve
Secu
rities
pr
emiu
m
acco
unt
Debe
ntur
e Re
dem
ption
Re
serv
e
Shar
e Op
tion
outst
andi
ng
Acco
unt-B
y su
bsid
iary
Capi
tal
Rese
rve
on
Cons
olid
ation
Fore
ign
Curre
ncy
Mon
etar
y Ite
m
Tran
slatio
n Di
ffere
nce
Acco
unt
Gene
ral
Rese
rve
Reta
ined
ea
rnin
gsSh
are
of Jo
int
Vent
ure
& As
socia
tes
Fore
ign
Curre
ncy
Tran
slatio
n Re
serv
e
Rem
easu
rem
ent
of D
efine
d Be
nefit
Ob
ligati
on/ P
lan
Bala
nce
as at
01.
04.2
015
417
.05
72.
00
5.0
3 8
64.5
4 2
3.52
1
,155
.22
- 1
,613
.48
32,
049.
18
- 8
1.23
-
- 3
6,28
1.25
9
79.3
3 3
7,26
0.58
Pr
ofit &
Loss
for t
he ye
ar-
--
--
--
- (2
,966
.24)
--
--
(2,9
66.2
4) (1
21.0
2) (3
,087
.26)
Othe
r com
preh
ensiv
e in
com
e fo
r the
year
--
--
--
--
- 0
.73
(721
.75)
21.
86
- (6
99.1
6) (4
5.12
) (7
44.2
8)
Mov
emen
t dur
ing
the
year
--
- 2
37.5
4 (6
.88)
555
.45
(188
.23)
5.7
3 (8
28.7
8)-
(46.
07)
--
(271
.24)
47.
44
(223
.80)
Bala
nce
as at
31s
t Mar
ch,
2016
417
.05
72.
00
5.0
3 1
,102
.08
16.
64
1,7
10.6
7 (1
88.2
3) 1
,619
.21
28,
254.
16
0.7
3 (6
86.5
9) 2
1.86
-
32,
344.
61
899
.83
33,
244.
44
Profi
t & Lo
ss fo
r the
year
--
--
--
--
(2,2
81.2
8)-
--
- (2
,281
.28)
(256
.24)
(2,5
37.5
2)Ot
her c
ompr
ehen
sive
inco
me
for t
he ye
ar-
--
--
--
--
(0.0
6)(1
30.1
8) 2
.64
- (1
27.6
0) 2
.70
(124
.90)
Mov
emen
t dur
ing
the
year
(316
.70)
- 0
.98
163
.10
0.54
- 5
4.06
-
(163
.64)
(1.0
0)27
8.06
- 7
.90
23.
30
0.4
2 2
3.72
As at
31.
3.20
17 1
00.3
5 7
2.00
6
.01
1,2
65.1
8 17
.18
1,7
10.6
7 (1
34.1
7) 1
,619
.21
25,
809.
24
(0.3
3) (5
38.7
1) 2
4.50
7
.90
29,
959.
03
646
.71
30,
605.
74
* in
clud
es c
apita
l res
erve
of `
100
.35
cror
e
As p
er o
ur re
port
of e
ven
date
For &
on
beha
lf of
the
Boar
d of
Dire
ctor
s
For L
odha
& C
o.
Char
tere
d Ac
coun
tant
s N
avee
n Jin
dal
Ravi
Upp
alFi
rm R
egist
ratio
n N
o. 3
0105
1E
Ch
airm
an
Man
agin
g Di
rect
or &
Gro
up C
EODI
N: 0
0001
523
DIN
: 000
2597
0N
.K L
odha
Pa
rtne
rRa
jesh
Bha
tia
Mur
li M
anoh
ar P
uroh
it M
embe
rshi
p N
o. 8
5155
Chie
f Fin
anci
al O
ffice
r Co
mpa
ny S
ecre
tary
Plac
e: N
ew D
elhi
Date
d: 2
3rd
May
, 201
7
Notes to the Consolidated financial statements as at and for the year ended 31st March, 2017
| 193Financial Statements Consolidated Financials
1. OVERVIEW Jindal Steel & Power Limited (“the Company” or “the Parent
Company”) is one of the India’s leading steel producers with significant presence in sectors like mining and power generation including through its subsidiaries in India and abroad. It is listed on the National Stock Exchange of India and Bombay Stock Exchange in India. The registered office is situated in the state of Haryana, the corporate office is situated in New Delhi and the manufacturing plants are in the states of Chhattisgarh, Odisha, Jharkhand etc. in India and also in Sultanate of Oman. The Group has global presence through subsidiaries, mainly in Australia, Botswana, Cameroon, China, Dubai, Indonesia, Liberia, Mauritania, Mauritius, Mozambique, Madagascar, Namibia, South Africa, Sultanate of Oman, Tanzania and Zambia. There are several business initiatives running simultaneously across continents.
2. Statement of Compliance: The consolidated financial statements related to Jindal Steel
& Power Limited (hereinafter referred to as the Company or Parent Company) and its subsidiaries (hereinafter collectively referred to as “Group”), its joint ventures and associate companies.
The Group has adopted Indian Accounting Standards (the ‘Ind AS’) prescribed under section 133 of the Companies Act, 2013 (the ‘Act’), read with the Companies (Indian Accounting Standards) Rules, 2015 and the Companies (Indian Accounting Standards) (Amendment) Rules, 2016, with effect from 1st April 2016 with 1st April 2015 as the date of transition. Accordingly these consolidated financial statements have been prepared in accordance with the said Ind AS & Rules issued thereunder and other recognized accounting practices & policies to the extent applicable and the relevant provisions of the Companies Act, 2013 and listing requirements.
For all periods up to and including the year ended 31st March 2016, the Group had prepared its consolidated financial statements in accordance with accounting standards as prescribed under Section 133 of the Companies Act, 2013 (the ‘Act’) read with Rule 7 of the Companies (Accounts) Rules, 2014 (referred to as ‘Indian GAAP’). The Group has consistently applied the accounting policies used in the preparation of its opening IND AS Balance Sheet at April 1, 2015 throughout all periods presented, as if these policies had always been in effect and are covered by IND AS 101 ‘’First-time adoption of Indian Accounting Standards’’. The transition was carried out from accounting principles generally accepted in India (‘’Indian GAAP’’) which is considered as the previous GAAP, as defined in IND AS 101. The reconciliation of effects of the transition from
Indian GAAP on the equity as at April 1, 2015 and March 31, 2016 and on the net profit and material adjustments to cash flows, if any, for the year ended March 31, 2016 is disclosed in Note no. 72 to these consolidated financial statements.
The consolidated financial statements provide comparative information in respect of previous year. In addition, the Group presents balance sheet as at the beginning of previous year which is the transition date to Ind AS.
The preparation of the consolidated financial statements in conformity with Indian Accounting Standards (Ind AS) requires management to make judgments, estimates and assumptions that affect the reported amounts of revenues, expenses, assets and liabilities, and the accompanying disclosures at the date of the consolidated financial statements. The judgments, estimates and underlying assumptions are reviewed on an ongoing basis. Revisions to accounting estimates are recognised in the period in which the estimate is revised if the revision effects only that period or in the period of the revision and future periods if the revision affects both current and future years and, if material, their effects are disclosed in the notes to the consolidated financial statements. Actual results could vary from these estimates. (refer Note no. 5 on critical accounting estimates, assumptions and judgments).
These Consolidated financial statements have been approved and adopted by Board of Directors of the Company in their meeting held on 23rd May 2017. These consolidated financial statements are available on the website of the Company for public use.
3. Basis of preparation of Consolidated Financial Statements:
The consolidated financial statements incorporate the financial statements of the Company and entities controlled by the Company i.e. its subsidiaries. It also includes the Group’s share of profits, net assets and retained post acquisition reserves of joint ventures and associates that are consolidated using the equity method of consolidation. Control is achieved when the Company is exposed to, or has rights to the variable returns of the entity and the ability to affect those returns through its power over the entity. Significant influence, is achived when the Company has power to participate in the financial and operating policy decisions of the investee, but is not control or joint control over those policies. The results of subsidiaries, joint ventures and associates acquired or disposed off during the year are included in the consolidated statement of profit and loss from the effective date of acquisition or up to the effective date of disposal, as appropriate. The Accounting
Notes to the Consolidated financial statements as at and for the year ended 31st March, 2017
194 | Jindal Steel & Power Limited Annual Report 2016-17
Policies of the parent company, its subsidiaries, joint ventures and associates are largely similar. However, few accounting policies are different as certain subsidiaries / associates located in different countries have to comply with the local regulatory requirements. Wherever necessary, adjustments are made to the financial statements of subsidiaries, joint ventures and associates to bring their accounting policies in line with those used by other members of the Group. The Financial Statements of parent Company and its subsidiaries have been consolidated on line-by-line basis by adding together book value of like items of assets, liabilities, income and expenses after eliminating Intra-group transactions, balances, income and expenses in accordance with Ind AS 110 “Consolidated Financial Statement”. Non-controlling interests in the net assets (excluding goodwill) of consolidated subsidiaries are identified separately from the Group’s equity. The interest of noncontrolling shareholders may be initially measured either at fair value or at the non-controlling interests’ proportionate share of the fair value of the acquiree’s identifiable net assets.The choice of measurement basis is made on an acquisition by-acquisition basis. Subsequent to acquisition, the carrying value of non-controlling interests is the amount of those interests at initial recognition plus the non-controlling interests’ share of subsequent changes in equity. Total comprehensive income is attributed to non-controlling interests even if it results in the non-controlling interests having a deficit balance. Impact of any insignificant and immaterial Non Controlling Interest is not considered. Foreign Subsidiaries : Items of the assets and liabilities, both monetary and non-monetary, have been translated at the exchange rates prevailing at the end of the year and items of income and expenses have been translated at the average rate prevailing during the year. Resulting exchange differences arising on translation of said items have been transferred to Foreign Currency Translation Reserve Account through Other Comprehensive Income. In case of associates, where Company holds directly or indirectly through subsidiaries 20% or more equity or / and exercises significant influence, investments are accounted for by using equity method in accordance with Ind AS 28 “Investments in Associates and Joint Ventures”. Post acquisition, the Company accounts for its share in the change in net assets of the associates (after eliminating unrealised profits and losses resulting from transactions between the Company and its associates to the extent of its share), through its statement
of profit and loss, other comprehensive income and through its reserves for the balance. The difference between the cost of investment and the share of net assets at the time of acquisition of shares in the subsidiaries, joint ventures and associates is identified in the financial statements as Goodwill or Capital Reserve as the case may be. However, for associates, Goodwill is not separately recognised but included in the value of investments. Figures pertaining to the subsidiary companies have been reclassified wherever necessary to bring them in line with Parent company’s financial statements.
4. Exemptions from retrospective application: Business Combinations: The Company has opted to apply Ind
AS 103 prospectively from the date of transition to Ind AS, i.e. 1st April, 2015 onwards. As such, previous GAAP balances relating to assets and liabilities acquired under business combinations entered into before transition date, have been carried forward without any adjustments.
5. Significant accounting policies: Significant accounting policies of the financial statements of
the Company and its subsidiaries are set out in their respective standalone financial statements. The significant accounting policies to prepare consolidated financial statements are in uniformity with the standalone financial statements of the Company. Following are the additional policies specifically considered for preparation of consolidated financial statements:
a) Business Combinations The acquisitions of businesses are accounted for using the
acquisition method. The cost of the acquisition is measured at the aggregate of the fair values at the date of exchange of assets given, liabilities incurred or assumed and equity instruments issued by the Group in exchange for control of the acquiree. The acquiree’s identifiable assets, liabilities and contingent liabilities that meet the condition for recognition are recognised at their fair values at the acquisition date except certain assets and liabilities required to be measured as per the applicable standard. Goodwill arising on acquisition is recognised as an asset and initially measured at cost, being the excess of the cost of the business combination over the Group’s interest in the net fair value of the identifiable assets acquired, liabilities recognised and contingent liabilities
Notes to the Consolidated financial statements as at and for the year ended 31st March, 2017
| 195Financial Statements Consolidated Financials
assumed. In the case of bargain purchase, resultant gain is recognized in other comprehensive income on the acquisition date and accumulated to capital reserve in other equity.
The interest of non-controlling shareholders in the acquiree is initially measured at the non-controlling shareholders proportionate share of the acquiree’s identifiable net assets.
b) Goodwill Goodwill arising on an acquisition of business is carried at cost
as established at the date of acquisition of the business less accumulated impairment losses, if any.
For the purposes of impairment testing, goodwill is allocated to each of the Group’s cash-generating units (or group of cash-
generating units) that is expected to benefit from the synergies of the combination.
c) Deferred Tax The deferred tax is recognised for temporary differences arising
after elimination of profits and losses resulting from intragroup transactions.Deferred tax assets are recognised for unused tax losses to the extent that it is probable that taxable profit will be available against which the losses can be utilised. Significant management judgement is required to determine the amount of deferred tax assets that can be recognised based upon the likely timing and level of future taxable profits together with future tax planning strategies.
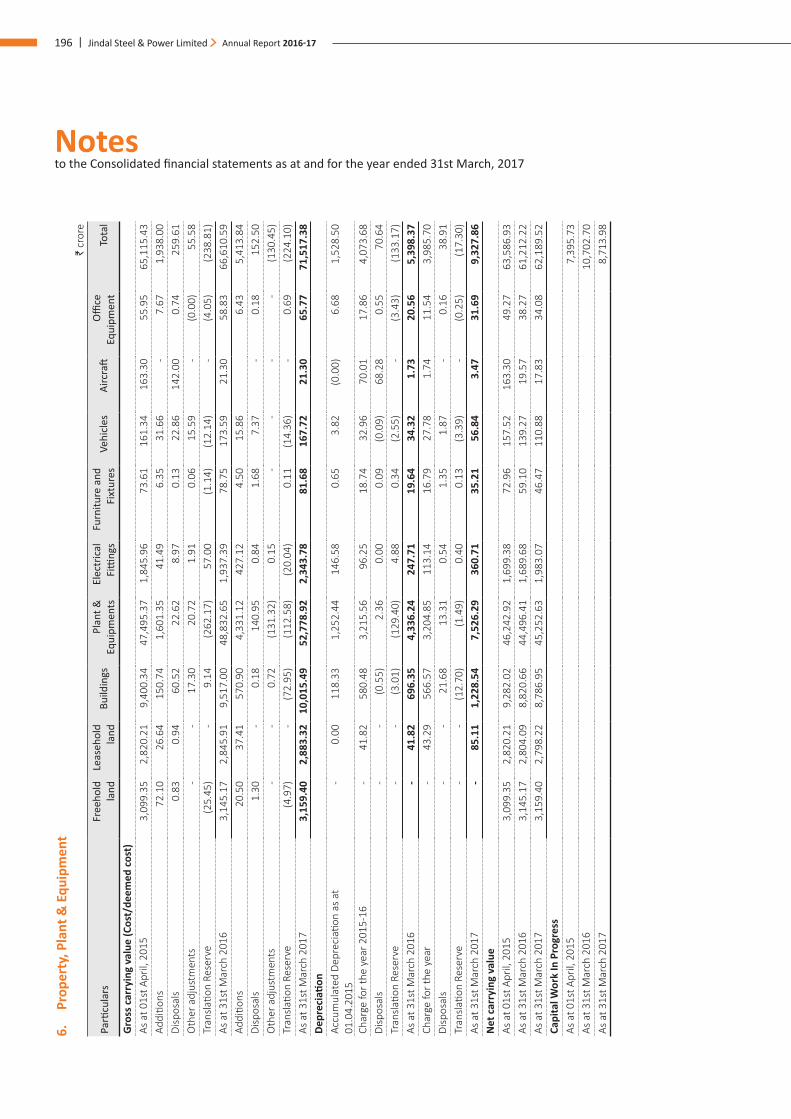
Notes to the Consolidated financial statements as at and for the year ended 31st March, 2017
196 | Jindal Steel & Power Limited Annual Report 2016-17
6.
Prop
erty
, Pla
nt &
Equ
ipm
ent
` cr
ore
Parti
cula
rsFr
eeho
ld
land
Le
aseh
old
land
Build
ings
Pl
ant &
Eq
uipm
ents
Elec
tric
al
Fitti
ngs
Furn
iture
and
Fi
xtur
es
Vehi
cles
Airc
raft
Offi
ce
Equi
pmen
tTo
tal
Gro
ss c
arry
ing
valu
e (C
ost/
deem
ed c
ost)
As a
t 01s
t Apr
il, 2
015
3,0
99.3
5 2
,820
.21
9,4
00.3
4 4
7,49
5.37
1
,845
.96
73.
61
161
.34
163
.30
55.
95
65,
115.
43
Addi
tions
72.
10
26.
64
150
.74
1,6
01.3
5 4
1.49
6
.35
31.
66
- 7
.67
1,9
38.0
0 Di
spos
als
0.8
3 0
.94
60.
52
22.
62
8.9
7 0
.13
22.
86
142
.00
0.7
4 2
59.6
1 O
ther
adj
ustm
ents
- -
17.
30
20.
72
1.9
1 0
.06
15.
59
- (0
.00)
55.
58
Tran
slatio
n Re
serv
e (2
5.45
) -
9.1
4 (2
62.1
7) 5
7.00
(1
.14)
(12.
14)
- (4
.05)
(238
.81)
As a
t 31s
t Mar
ch 2
016
3,1
45.1
7 2
,845
.91
9,5
17.0
0 4
8,83
2.65
1
,937
.39
78.
75
173
.59
21.
30
58.
83
66,
610.
59
Addi
tions
20.
50
37.
41
570
.90
4,3
31.1
2 4
27.1
2 4
.50
15.
86
6.4
3 5
,413
.84
Disp
osal
s 1
.30
- 0
.18
140
.95
0.8
4 1
.68
7.3
7 -
0.1
8 1
52.5
0 O
ther
adj
ustm
ents
- -
0.7
2 (1
31.3
2) 0
.15
- -
- -
(130
.45)
Tran
slatio
n Re
serv
e (4
.97)
- (7
2.95
) (1
12.5
8) (2
0.04
) 0
.11
(14.
36)
- 0
.69
(224
.10)
As a
t 31s
t Mar
ch 2
017
3,1
59.4
0 2
,883
.32
10,
015.
49
52,
778.
92
2,3
43.7
8 8
1.68
1
67.7
2 2
1.30
6
5.77
7
1,51
7.38
De
prec
iatio
nAc
cum
ulat
ed D
epre
ciati
on a
s at
01
.04.
2015
- 0
.00
118
.33
1,2
52.4
4 1
46.5
8 0
.65
3.8
2 (0
.00)
6.6
8 1
,528
.50
Char
ge fo
r the
yea
r 201
5-16
- 4
1.82
5
80.4
8 3
,215
.56
96.
25
18.
74
32.
96
70.
01
17.
86
4,0
73.6
8 Di
spos
als
- -
(0.5
5) 2
.36
0.0
0 0
.09
(0.0
9) 6
8.28
0
.55
70.
64
Tran
slatio
n Re
serv
e -
- (3
.01)
(129
.40)
4.8
8 0
.34
(2.5
5) -
(3.4
3) (1
33.1
7)As
at 3
1st M
arch
201
6 -
41.
82
696
.35
4,3
36.2
4 2
47.7
1 1
9.64
3
4.32
1
.73
20.
56
5,3
98.3
7 Ch
arge
for t
he y
ear
- 4
3.29
5
66.5
7 3
,204
.85
113
.14
16.
79
27.
78
1.7
4 1
1.54
3
,985
.70
Disp
osal
s -
- 2
1.68
1
3.31
0
.54
1.3
5 1
.87
- 0
.16
38.
91
Tran
slatio
n Re
serv
e -
- (1
2.70
) (1
.49)
0.4
0 0
.13
(3.3
9) -
(0.2
5) (1
7.30
)As
at 3
1st M
arch
201
7 -
85.
11
1,2
28.5
4 7
,526
.29
360
.71
35.
21
56.
84
3.4
7 3
1.69
9
,327
.86
Net
car
ryin
g va
lue
As a
t 01s
t Apr
il, 2
015
3,0
99.3
5 2
,820
.21
9,2
82.0
2 4
6,24
2.92
1
,699
.38
72.
96
157
.52
163
.30
49.
27
63,
586.
93
As a
t 31s
t Mar
ch 2
016
3,1
45.1
7 2
,804
.09
8,8
20.6
6 4
4,49
6.41
1
,689
.68
59.
10
139
.27
19.
57
38.
27
61,
212.
22
As a
t 31s
t Mar
ch 2
017
3,1
59.4
0 2
,798
.22
8,7
86.9
5 4
5,25
2.63
1
,983
.07
46.
47
110
.88
17.
83
34.
08
62,
189.
52
Capi
tal W
ork
In P
rogr
ess
As a
t 01s
t Apr
il, 2
015
7,3
95.7
3 As
at 3
1st M
arch
201
6 1
0,70
2.70
As
at 3
1st M
arch
201
7 8
,713
.98
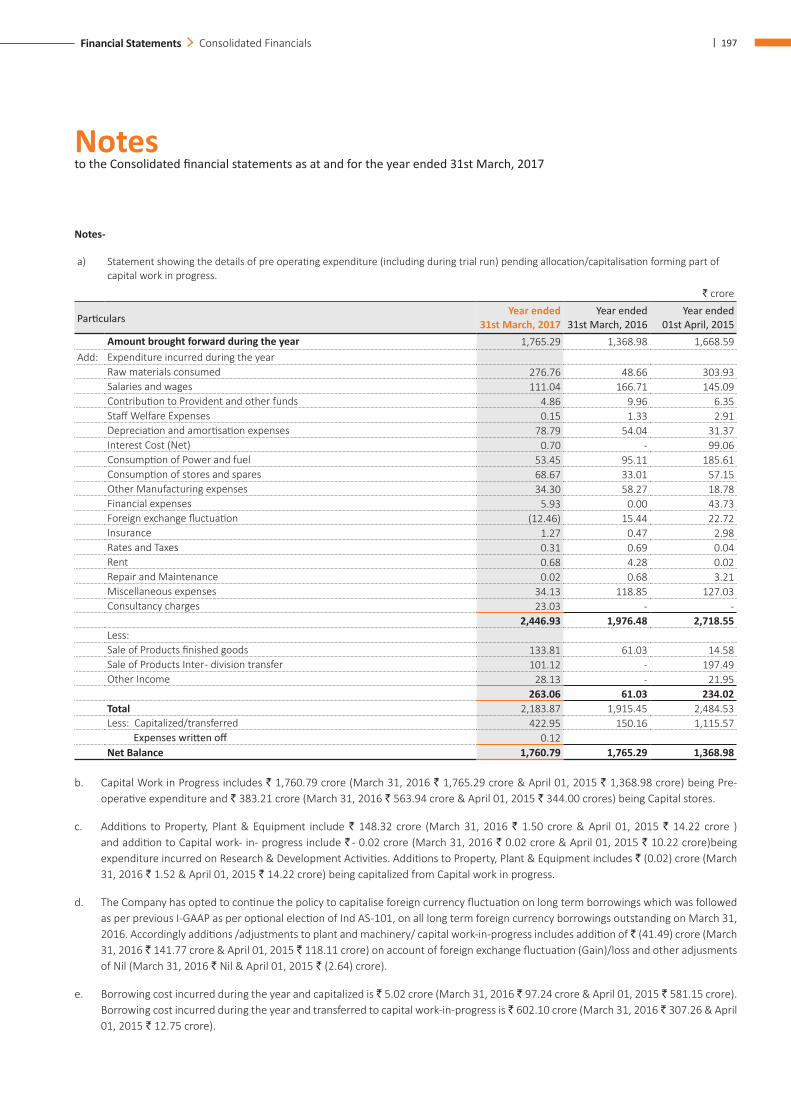
Notes to the Consolidated financial statements as at and for the year ended 31st March, 2017
| 197Financial Statements Consolidated Financials
Notes-
a) Statement showing the details of pre operating expenditure (including during trial run) pending allocation/capitalisation forming part of capital work in progress.
` crore
ParticularsYear ended
31st March, 2017Year ended
31st March, 2016Year ended
01st April, 2015Amount brought forward during the year 1,765.29 1,368.98 1,668.59
Add: Expenditure incurred during the yearRaw materials consumed 276.76 48.66 303.93 Salaries and wages 111.04 166.71 145.09 Contribution to Provident and other funds 4.86 9.96 6.35 Staff Welfare Expenses 0.15 1.33 2.91 Depreciation and amortisation expenses 78.79 54.04 31.37 Interest Cost (Net) 0.70 - 99.06 Consumption of Power and fuel 53.45 95.11 185.61 Consumption of stores and spares 68.67 33.01 57.15 Other Manufacturing expenses 34.30 58.27 18.78 Financial expenses 5.93 0.00 43.73 Foreign exchange fluctuation (12.46) 15.44 22.72 Insurance 1.27 0.47 2.98 Rates and Taxes 0.31 0.69 0.04 Rent 0.68 4.28 0.02 Repair and Maintenance 0.02 0.68 3.21 Miscellaneous expenses 34.13 118.85 127.03 Consultancy charges 23.03 - -
2,446.93 1,976.48 2,718.55 Less: Sale of Products finished goods 133.81 61.03 14.58 Sale of Products Inter - division transfer 101.12 - 197.49 Other Income 28.13 - 21.95
263.06 61.03 234.02 Total 2,183.87 1,915.45 2,484.53 Less: Capitalized/transferred 422.95 150.16 1,115.57 Expenses written off 0.12 Net Balance 1,760.79 1,765.29 1,368.98
b. Capital Work in Progress includes ` 1,760.79 crore (March 31, 2016 ` 1,765.29 crore & April 01, 2015 ` 1,368.98 crore) being Pre- operative expenditure and ` 383.21 crore (March 31, 2016 ` 563.94 crore & April 01, 2015 ` 344.00 crores) being Capital stores.
c. Additions to Property, Plant & Equipment include ` 148.32 crore (March 31, 2016 ` 1.50 crore & April 01, 2015 ` 14.22 crore ) and addition to Capital work- in- progress include ` - 0.02 crore (March 31, 2016 ` 0.02 crore & April 01, 2015 ` 10.22 crore)being expenditure incurred on Research & Development Activities. Additions to Property, Plant & Equipment includes ` (0.02) crore (March 31, 2016 ` 1.52 & April 01, 2015 ` 14.22 crore) being capitalized from Capital work in progress.
d. The Company has opted to continue the policy to capitalise foreign currency fluctuation on long term borrowings which was followed as per previous I-GAAP as per optional election of Ind AS -101, on all long term foreign currency borrowings outstanding on March 31, 2016. Accordingly additions /adjustments to plant and machinery/ capital work-in-progress includes addition of ̀ (41.49) crore (March 31, 2016 ` 141.77 crore & April 01, 2015 ` 118.11 crore) on account of foreign exchange fluctuation (Gain)/loss and other adjusments of Nil (March 31, 2016 ` Nil & April 01, 2015 ` (2.64) crore).
e. Borrowing cost incurred during the year and capitalized is ` 5.02 crore (March 31, 2016 ` 97.24 crore & April 01, 2015 ` 581.15 crore). Borrowing cost incurred during the year and transferred to capital work-in-progress is ` 602.10 crore (March 31, 2016 ` 307.26 & April 01, 2015 ` 12.75 crore).
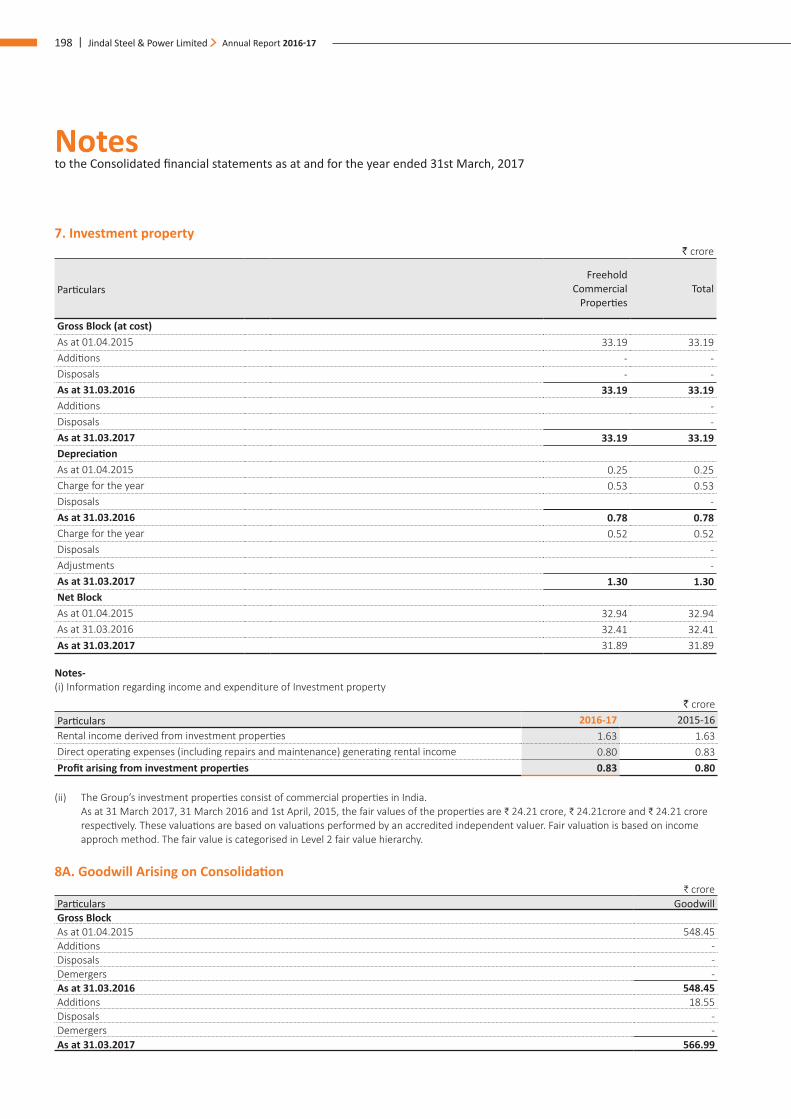
Notes to the Consolidated financial statements as at and for the year ended 31st March, 2017
198 | Jindal Steel & Power Limited Annual Report 2016-17
7. Investment property ` crore
ParticularsFreehold
Commercial Properties
Total
Gross Block (at cost)As at 01.04.2015 33.19 33.19 Additions - - Disposals - - As at 31.03.2016 33.19 33.19 Additions - Disposals - As at 31.03.2017 33.19 33.19 DepreciationAs at 01.04.2015 0.25 0.25 Charge for the year 0.53 0.53 Disposals - As at 31.03.2016 0.78 0.78 Charge for the year 0.52 0.52 Disposals - Adjustments - As at 31.03.2017 1.30 1.30 Net BlockAs at 01.04.2015 32.94 32.94 As at 31.03.2016 32.41 32.41 As at 31.03.2017 31.89 31.89
Notes-(i) Information regarding income and expenditure of Investment property
` croreParticulars 2016-17 2015-16Rental income derived from investment properties 1.63 1.63 Direct operating expenses (including repairs and maintenance) generating rental income 0.80 0.83 Profit arising from investment properties 0.83 0.80
(ii) The Group’s investment properties consist of commercial properties in India. As at 31 March 2017, 31 March 2016 and 1st April, 2015, the fair values of the properties are ₹ 24.21 crore, ₹ 24.21crore and ₹ 24.21 crore
respectively. These valuations are based on valuations performed by an accredited independent valuer. Fair valuation is based on income approch method. The fair value is categorised in Level 2 fair value hierarchy.
8A. Goodwill Arising on Consolidation₹ crore
Particulars Goodwill Gross Block As at 01.04.2015 548.45 Additions - Disposals - Demergers - As at 31.03.2016 548.45 Additions 18.55 Disposals - Demergers - As at 31.03.2017 566.99
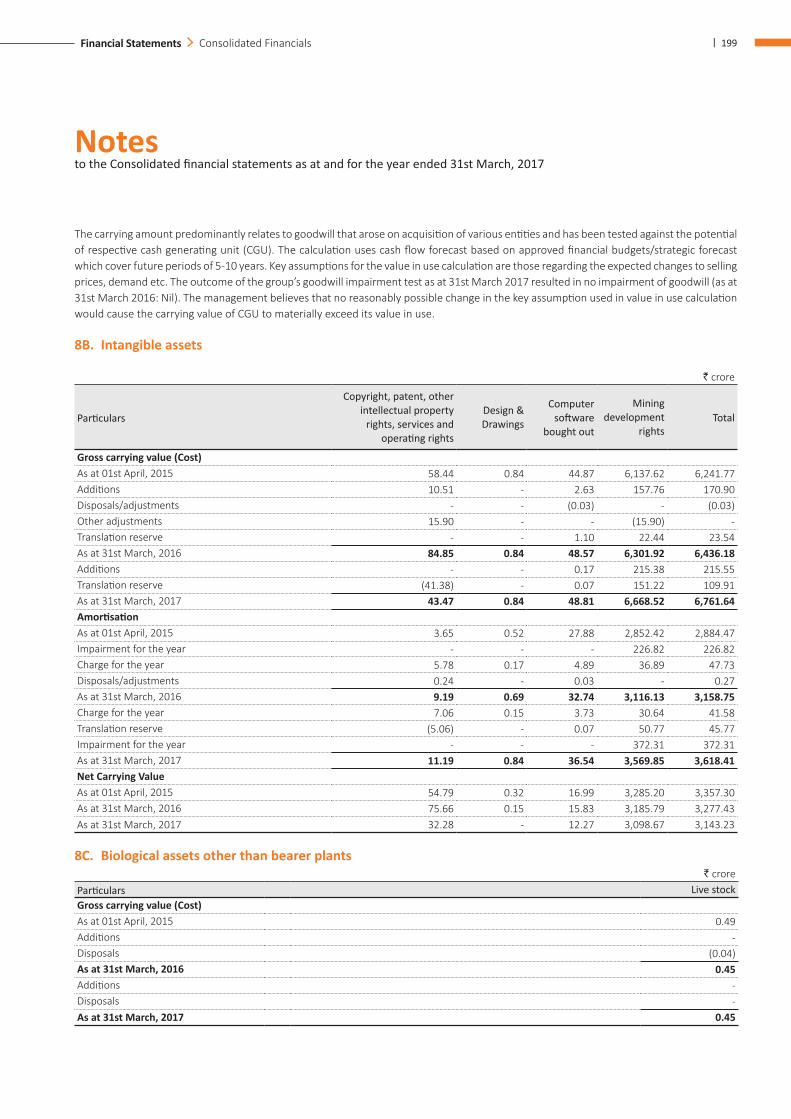
Notes to the Consolidated financial statements as at and for the year ended 31st March, 2017
| 199Financial Statements Consolidated Financials
The carrying amount predominantly relates to goodwill that arose on acquisition of various entities and has been tested against the potential of respective cash generating unit (CGU). The calculation uses cash flow forecast based on approved financial budgets/strategic forecast which cover future periods of 5-10 years. Key assumptions for the value in use calculation are those regarding the expected changes to selling prices, demand etc. The outcome of the group’s goodwill impairment test as at 31st March 2017 resulted in no impairment of goodwill (as at 31st March 2016: Nil). The management believes that no reasonably possible change in the key assumption used in value in use calculation would cause the carrying value of CGU to materially exceed its value in use.
8B. Intangible assets
` crore
Particulars
Copyright, patent, other intellectual property
rights, services and operating rights
Design & Drawings
Computer software
bought out
Mining development
rightsTotal
Gross carrying value (Cost)As at 01st April, 2015 58.44 0.84 44.87 6,137.62 6,241.77 Additions 10.51 - 2.63 157.76 170.90 Disposals/adjustments - - (0.03) - (0.03)Other adjustments 15.90 - - (15.90) - Translation reserve - - 1.10 22.44 23.54 As at 31st March, 2016 84.85 0.84 48.57 6,301.92 6,436.18 Additions - - 0.17 215.38 215.55 Translation reserve (41.38) - 0.07 151.22 109.91 As at 31st March, 2017 43.47 0.84 48.81 6,668.52 6,761.64 AmortisationAs at 01st April, 2015 3.65 0.52 27.88 2,852.42 2,884.47 Impairment for the year - - - 226.82 226.82 Charge for the year 5.78 0.17 4.89 36.89 47.73 Disposals/adjustments 0.24 - 0.03 - 0.27 As at 31st March, 2016 9.19 0.69 32.74 3,116.13 3,158.75 Charge for the year 7.06 0.15 3.73 30.64 41.58 Translation reserve (5.06) - 0.07 50.77 45.77 Impairment for the year - - - 372.31 372.31 As at 31st March, 2017 11.19 0.84 36.54 3,569.85 3,618.41 Net Carrying ValueAs at 01st April, 2015 54.79 0.32 16.99 3,285.20 3,357.30 As at 31st March, 2016 75.66 0.15 15.83 3,185.79 3,277.43 As at 31st March, 2017 32.28 - 12.27 3,098.67 3,143.23
8C. Biological assets other than bearer plants ` crore
Particulars Live stockGross carrying value (Cost)As at 01st April, 2015 0.49 Additions - Disposals (0.04)As at 31st March, 2016 0.45 Additions - Disposals - As at 31st March, 2017 0.45
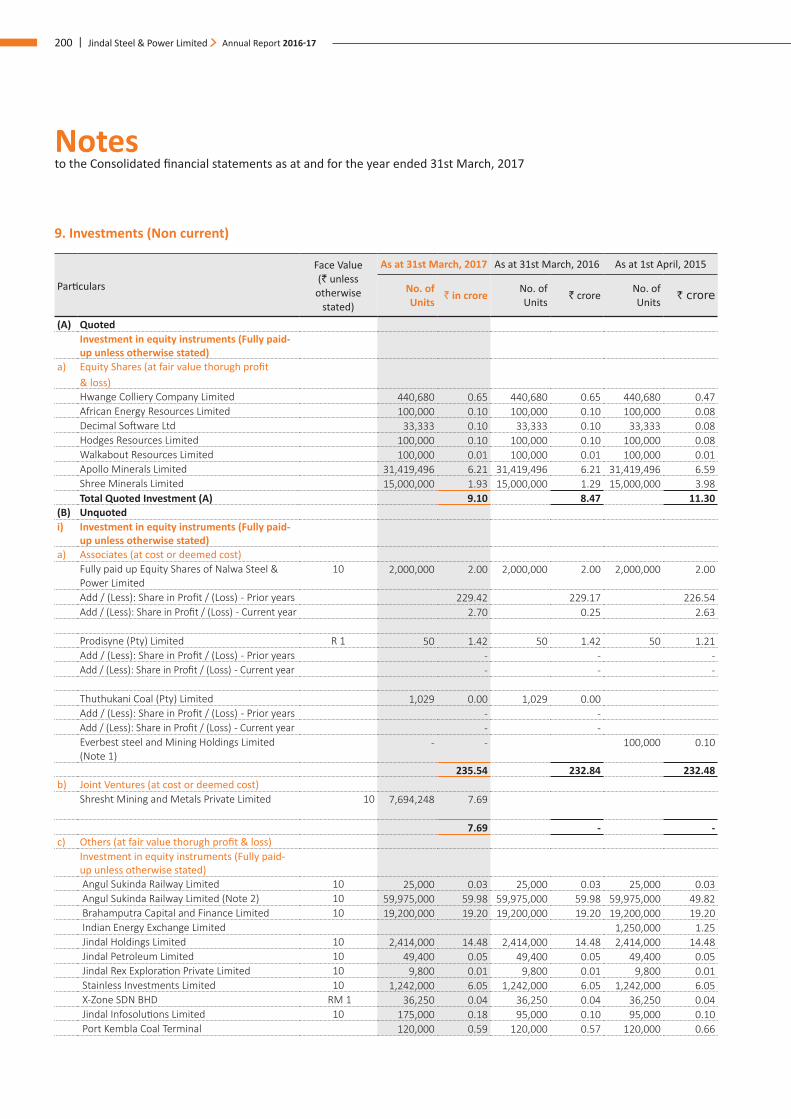
Notes to the Consolidated financial statements as at and for the year ended 31st March, 2017
200 | Jindal Steel & Power Limited Annual Report 2016-17
9. Investments (Non current)
Particulars
Face Value (` unless
otherwise stated)
As at 31st March, 2017 As at 31st March, 2016 As at 1st April, 2015
No. of Units ` in crore No. of
Units ` crore No. of Units ` crore
(A) QuotedInvestment in equity instruments (Fully paid-up unless otherwise stated)
a) Equity Shares (at fair value thorugh profit & loss)Hwange Colliery Company Limited 440,680 0.65 440,680 0.65 440,680 0.47 African Energy Resources Limited 100,000 0.10 100,000 0.10 100,000 0.08 Decimal Software Ltd 33,333 0.10 33,333 0.10 33,333 0.08 Hodges Resources Limited 100,000 0.10 100,000 0.10 100,000 0.08 Walkabout Resources Limited 100,000 0.01 100,000 0.01 100,000 0.01 Apollo Minerals Limited 31,419,496 6.21 31,419,496 6.21 31,419,496 6.59 Shree Minerals Limited 15,000,000 1.93 15,000,000 1.29 15,000,000 3.98 Total Quoted Investment (A) 9.10 8.47 11.30
(B) Unquotedi) Investment in equity instruments (Fully paid-
up unless otherwise stated)a) Associates (at cost or deemed cost)
Fully paid up Equity Shares of Nalwa Steel & Power Limited
10 2,000,000 2.00 2,000,000 2.00 2,000,000 2.00
Add / (Less): Share in Profit / (Loss) - Prior years 229.42 229.17 226.54 Add / (Less): Share in Profit / (Loss) - Current year 2.70 0.25 2.63
Prodisyne (Pty) Limited R 1 50 1.42 50 1.42 50 1.21 Add / (Less): Share in Profit / (Loss) - Prior years - - - Add / (Less): Share in Profit / (Loss) - Current year - - -
Thuthukani Coal (Pty) Limited 1,029 0.00 1,029 0.00 Add / (Less): Share in Profit / (Loss) - Prior years - - Add / (Less): Share in Profit / (Loss) - Current year - - Everbest steel and Mining Holdings Limited (Note 1)
- - 100,000 0.10
235.54 232.84 232.48 b) Joint Ventures (at cost or deemed cost)
Shresht Mining and Metals Private Limited 10 7,694,248 7.69
7.69 - -c) Others (at fair value thorugh profit & loss)
Investment in equity instruments (Fully paid-up unless otherwise stated) Angul Sukinda Railway Limited 10 25,000 0.03 25,000 0.03 25,000 0.03 Angul Sukinda Railway Limited (Note 2) 10 59,975,000 59.98 59,975,000 59.98 59,975,000 49.82 Brahamputra Capital and Finance Limited 10 19,200,000 19.20 19,200,000 19.20 19,200,000 19.20 Indian Energy Exchange Limited 1,250,000 1.25 Jindal Holdings Limited 10 2,414,000 14.48 2,414,000 14.48 2,414,000 14.48 Jindal Petroleum Limited 10 49,400 0.05 49,400 0.05 49,400 0.05 Jindal Rex Exploration Private Limited 10 9,800 0.01 9,800 0.01 9,800 0.01 Stainless Investments Limited 10 1,242,000 6.05 1,242,000 6.05 1,242,000 6.05 X-Zone SDN BHD RM 1 36,250 0.04 36,250 0.04 36,250 0.04 Jindal Infosolutions Limited 10 175,000 0.18 95,000 0.10 95,000 0.10 Port Kembla Coal Terminal 120,000 0.59 120,000 0.57 120,000 0.66
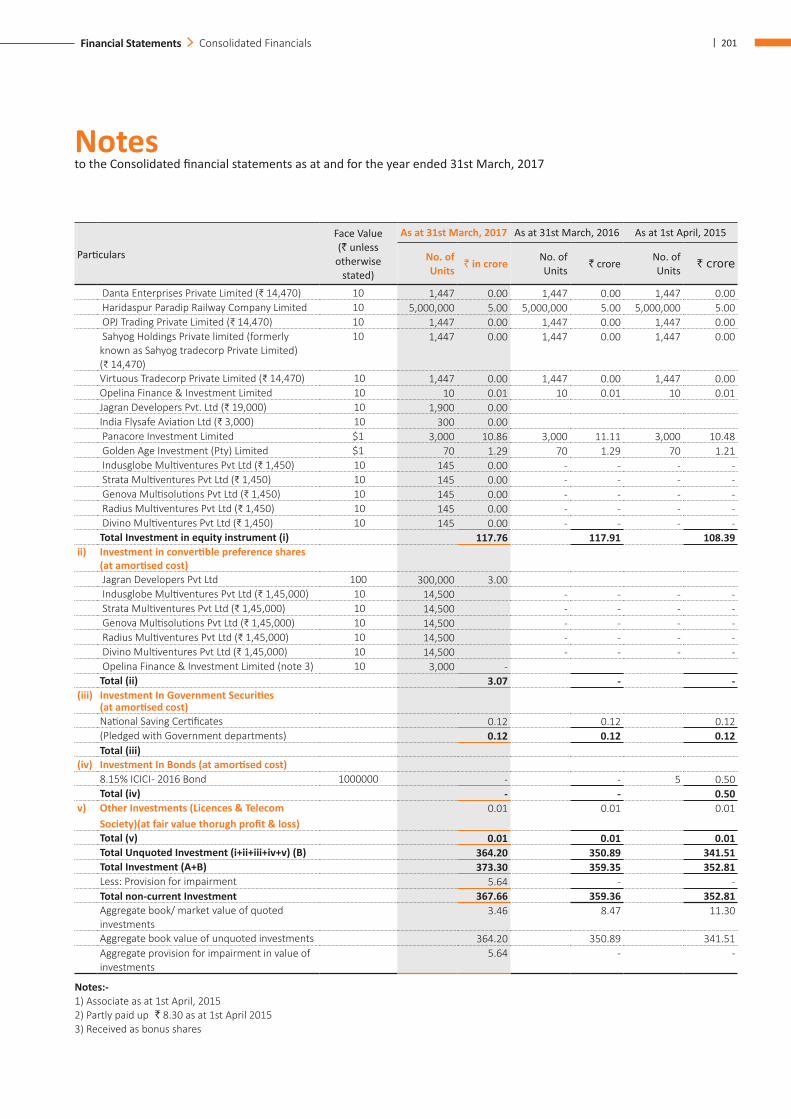
Notes to the Consolidated financial statements as at and for the year ended 31st March, 2017
| 201Financial Statements Consolidated Financials
Particulars
Face Value (` unless
otherwise stated)
As at 31st March, 2017 As at 31st March, 2016 As at 1st April, 2015
No. of Units ` in crore No. of
Units ` crore No. of Units ` crore
Danta Enterprises Private Limited (₹ 14,470) 10 1,447 0.00 1,447 0.00 1,447 0.00 Haridaspur Paradip Railway Company Limited 10 5,000,000 5.00 5,000,000 5.00 5,000,000 5.00 OPJ Trading Private Limited (₹ 14,470) 10 1,447 0.00 1,447 0.00 1,447 0.00 Sahyog Holdings Private limited (formerly known as Sahyog tradecorp Private Limited) (₹ 14,470)
10 1,447 0.00 1,447 0.00 1,447 0.00
Virtuous Tradecorp Private Limited (₹ 14,470) 10 1,447 0.00 1,447 0.00 1,447 0.00 Opelina Finance & Investment Limited 10 10 0.01 10 0.01 10 0.01 Jagran Developers Pvt. Ltd (₹ 19,000) 10 1,900 0.00 India Flysafe Aviation Ltd (₹ 3,000) 10 300 0.00 Panacore Investment Limited $1 3,000 10.86 3,000 11.11 3,000 10.48 Golden Age Investment (Pty) Limited $1 70 1.29 70 1.29 70 1.21 Indusglobe Multiventures Pvt Ltd (₹ 1,450) 10 145 0.00 - - - - Strata Multiventures Pvt Ltd (₹ 1,450) 10 145 0.00 - - - - Genova Multisolutions Pvt Ltd (₹ 1,450) 10 145 0.00 - - - - Radius Multiventures Pvt Ltd (₹ 1,450) 10 145 0.00 - - - - Divino Multiventures Pvt Ltd (₹ 1,450) 10 145 0.00 - - - - Total Investment in equity instrument (i) 117.76 117.91 108.39
ii) Investment in convertible preference shares (at amortised cost) Jagran Developers Pvt Ltd 100 300,000 3.00 Indusglobe Multiventures Pvt Ltd (₹ 1,45,000) 10 14,500 - - - - Strata Multiventures Pvt Ltd (₹ 1,45,000) 10 14,500 - - - - Genova Multisolutions Pvt Ltd (₹ 1,45,000) 10 14,500 - - - - Radius Multiventures Pvt Ltd (₹ 1,45,000) 10 14,500 - - - - Divino Multiventures Pvt Ltd (₹ 1,45,000) 10 14,500 - - - - Opelina Finance & Investment Limited (note 3) 10 3,000 - Total (ii) 3.07 - -
(iii) Investment In Government Securities (at amortised cost) National Saving Certificates 0.12 0.12 0.12 (Pledged with Government departments) 0.12 0.12 0.12 Total (iii)
(iv) Investment In Bonds (at amortised cost) 8.15% ICICI - 2016 Bond 1000000 - - 5 0.50 Total (iv) - - 0.50
v) Other Investments (Licences & Telecom Society)(at fair value thorugh profit & loss)
0.01 0.01 0.01
Total (v) 0.01 0.01 0.01 Total Unquoted Investment (i+ii+iii+iv+v) (B) 364.20 350.89 341.51 Total Investment (A+B) 373.30 359.35 352.81 Less: Provision for impairment 5.64 - - Total non-current Investment 367.66 359.36 352.81 Aggregate book/ market value of quoted investments
3.46 8.47 11.30
Aggregate book value of unquoted investments 364.20 350.89 341.51 Aggregate provision for impairment in value of investments
5.64 - -
Notes:-1) Associate as at 1st April, 20152) Partly paid up ` 8.30 as at 1st April 2015 3) Received as bonus shares
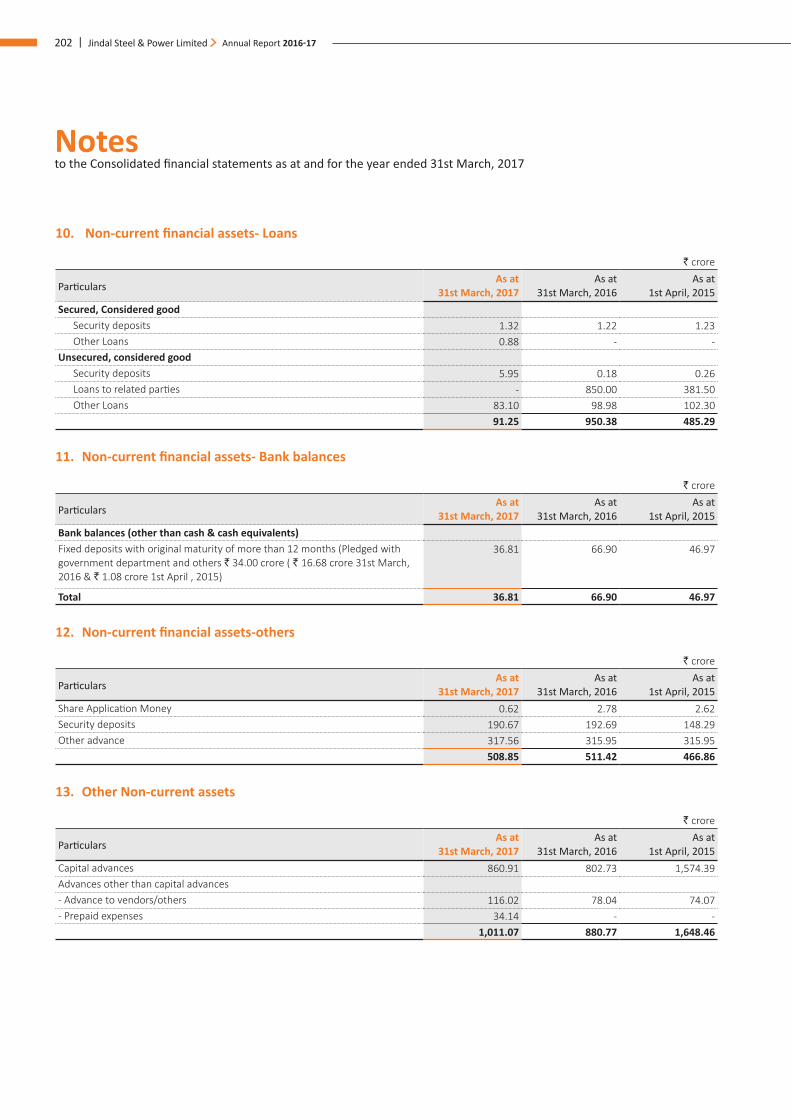
Notes to the Consolidated financial statements as at and for the year ended 31st March, 2017
202 | Jindal Steel & Power Limited Annual Report 2016-17
10. Non-current financial assets- Loans
` crore
ParticularsAs at
31st March, 2017 As at
31st March, 2016 As at
1st April, 2015Secured, Considered good
Security deposits 1.32 1.22 1.23 Other Loans 0.88 - -
Unsecured, considered goodSecurity deposits 5.95 0.18 0.26 Loans to related parties - 850.00 381.50 Other Loans 83.10 98.98 102.30
91.25 950.38 485.29
11. Non-current financial assets- Bank balances
` crore
ParticularsAs at
31st March, 2017 As at
31st March, 2016 As at
1st April, 2015Bank balances (other than cash & cash equivalents)Fixed deposits with original maturity of more than 12 months (Pledged with government department and others ` 34.00 crore ( ` 16.68 crore 31st March, 2016 & ` 1.08 crore 1st April , 2015)
36.81 66.90 46.97
Total 36.81 66.90 46.97
12. Non-current financial assets-others
` crore
ParticularsAs at
31st March, 2017 As at
31st March, 2016 As at
1st April, 2015Share Application Money 0.62 2.78 2.62 Security deposits 190.67 192.69 148.29 Other advance 317.56 315.95 315.95
508.85 511.42 466.86
13. Other Non-current assets
` crore
ParticularsAs at
31st March, 2017 As at
31st March, 2016 As at
1st April, 2015Capital advances 860.91 802.73 1,574.39 Advances other than capital advances- Advance to vendors/others 116.02 78.04 74.07 - Prepaid expenses 34.14 - -
1,011.07 880.77 1,648.46
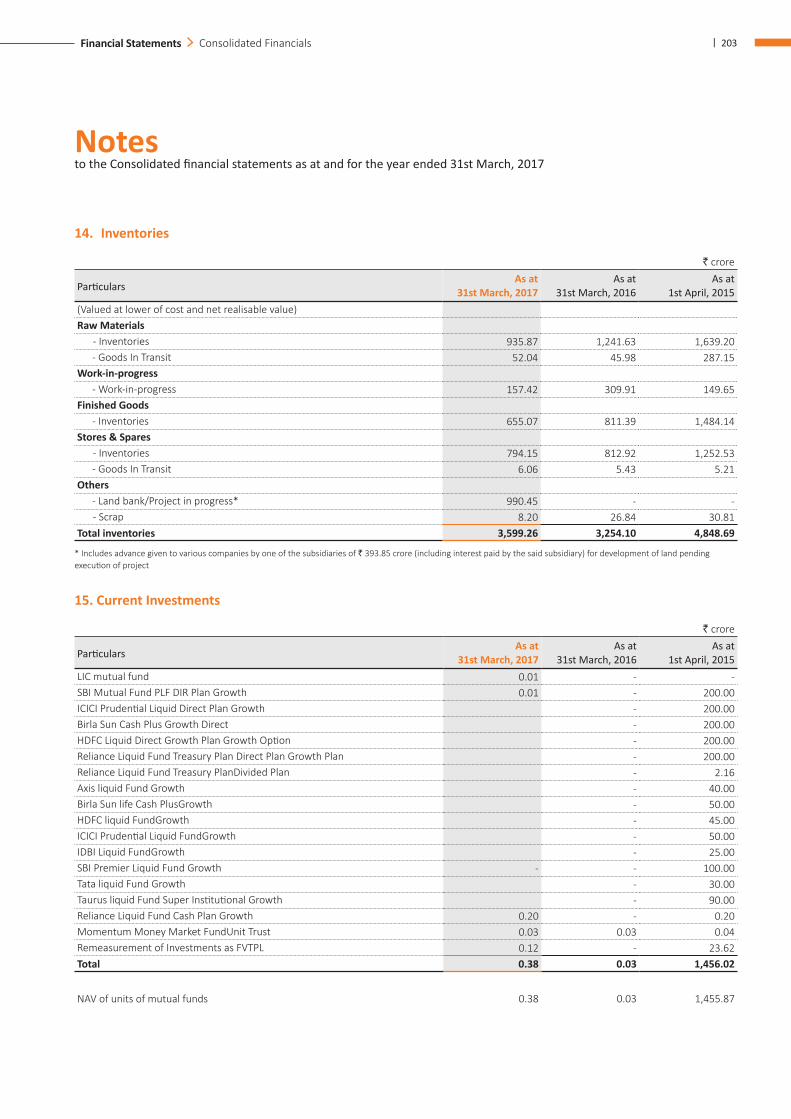
Notes to the Consolidated financial statements as at and for the year ended 31st March, 2017
| 203Financial Statements Consolidated Financials
14. Inventories
` crore
ParticularsAs at
31st March, 2017 As at
31st March, 2016 As at
1st April, 2015(Valued at lower of cost and net realisable value)Raw Materials
- Inventories 935.87 1,241.63 1,639.20 - Goods In Transit 52.04 45.98 287.15
Work-in-progress- Work-in-progress 157.42 309.91 149.65
Finished Goods- Inventories 655.07 811.39 1,484.14
Stores & Spares - Inventories 794.15 812.92 1,252.53 - Goods In Transit 6.06 5.43 5.21
Others- Land bank/Project in progress* 990.45 - - - Scrap 8.20 26.84 30.81
Total inventories 3,599.26 3,254.10 4,848.69
* Includes advance given to various companies by one of the subsidiaries of ` 393.85 crore (including interest paid by the said subsidiary) for development of land pending execution of project
15. Current Investments
` crore
ParticularsAs at
31st March, 2017 As at
31st March, 2016 As at
1st April, 2015LIC mutual fund 0.01 - - SBI Mutual Fund PLF DIR Plan Growth 0.01 - 200.00 ICICI Prudential Liquid Direct Plan Growth - 200.00 Birla Sun Cash Plus Growth Direct - 200.00 HDFC Liquid Direct Growth Plan Growth Option - 200.00 Reliance Liquid Fund Treasury Plan Direct Plan Growth Plan - 200.00 Reliance Liquid Fund Treasury PlanDivided Plan - 2.16 Axis liquid Fund Growth - 40.00 Birla Sun life Cash PlusGrowth - 50.00 HDFC liquid FundGrowth - 45.00 ICICI Prudential Liquid FundGrowth - 50.00 IDBI Liquid FundGrowth - 25.00 SBI Premier Liquid Fund Growth - - 100.00 Tata liquid Fund Growth - 30.00 Taurus liquid Fund Super Institutional Growth - 90.00 Reliance Liquid Fund Cash Plan Growth 0.20 - 0.20 Momentum Money Market FundUnit Trust 0.03 0.03 0.04 Remeasurement of Investments as FVTPL 0.12 - 23.62 Total 0.38 0.03 1,456.02
NAV of units of mutual funds 0.38 0.03 1,455.87
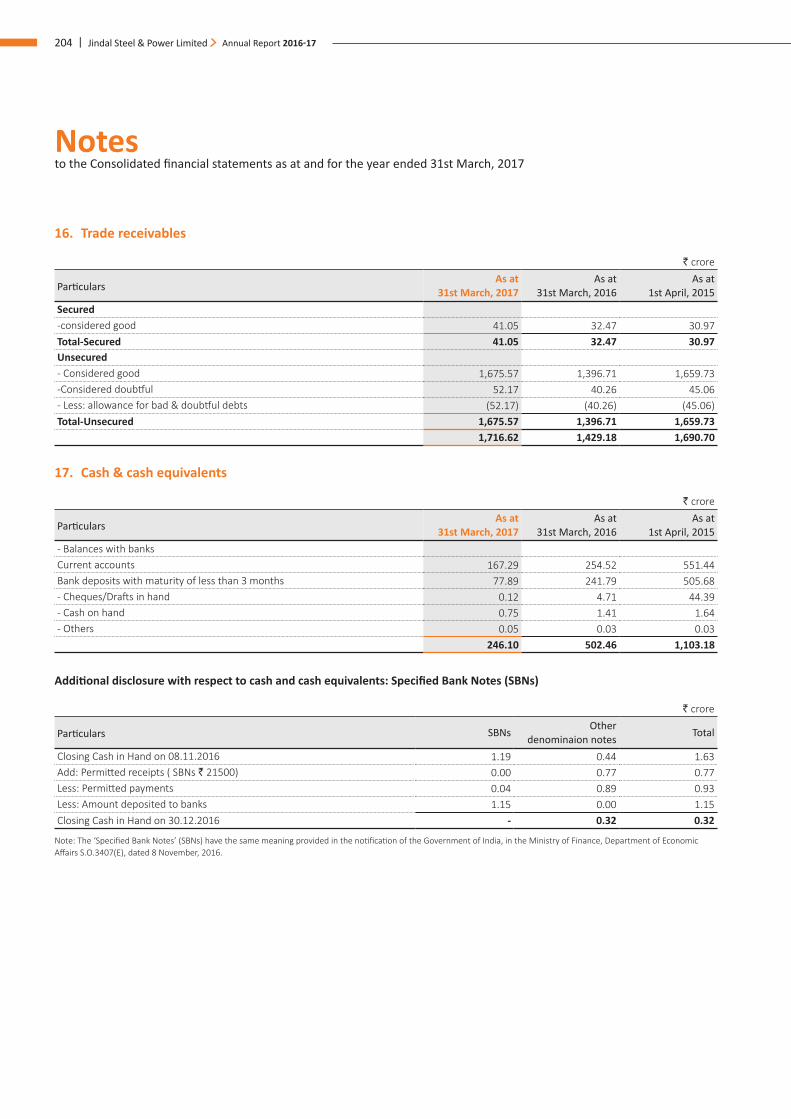
Notes to the Consolidated financial statements as at and for the year ended 31st March, 2017
204 | Jindal Steel & Power Limited Annual Report 2016-17
16. Trade receivables
` crore
ParticularsAs at
31st March, 2017 As at
31st March, 2016 As at
1st April, 2015Secured-considered good 41.05 32.47 30.97 Total-Secured 41.05 32.47 30.97 Unsecured- Considered good 1,675.57 1,396.71 1,659.73 -Considered doubtful 52.17 40.26 45.06 - Less: allowance for bad & doubtful debts (52.17) (40.26) (45.06)Total-Unsecured 1,675.57 1,396.71 1,659.73
1,716.62 1,429.18 1,690.70
17. Cash & cash equivalents
` crore
ParticularsAs at
31st March, 2017 As at
31st March, 2016 As at
1st April, 2015- Balances with banksCurrent accounts 167.29 254.52 551.44 Bank deposits with maturity of less than 3 months 77.89 241.79 505.68 - Cheques/Drafts in hand 0.12 4.71 44.39 - Cash on hand 0.75 1.41 1.64 - Others 0.05 0.03 0.03
246.10 502.46 1,103.18
Additional disclosure with respect to cash and cash equivalents: Specified Bank Notes (SBNs)
` crore
Particulars SBNs Other denominaion notes Total
Closing Cash in Hand on 08.11.2016 1.19 0.44 1.63 Add: Permitted receipts ( SBNs ` 21500) 0.00 0.77 0.77 Less: Permitted payments 0.04 0.89 0.93 Less: Amount deposited to banks 1.15 0.00 1.15 Closing Cash in Hand on 30.12.2016 - 0.32 0.32
Note: The ‘Specified Bank Notes’ (SBNs) have the same meaning provided in the notification of the Government of India, in the Ministry of Finance, Department of Economic Affairs S.O.3407(E), dated 8 November, 2016.
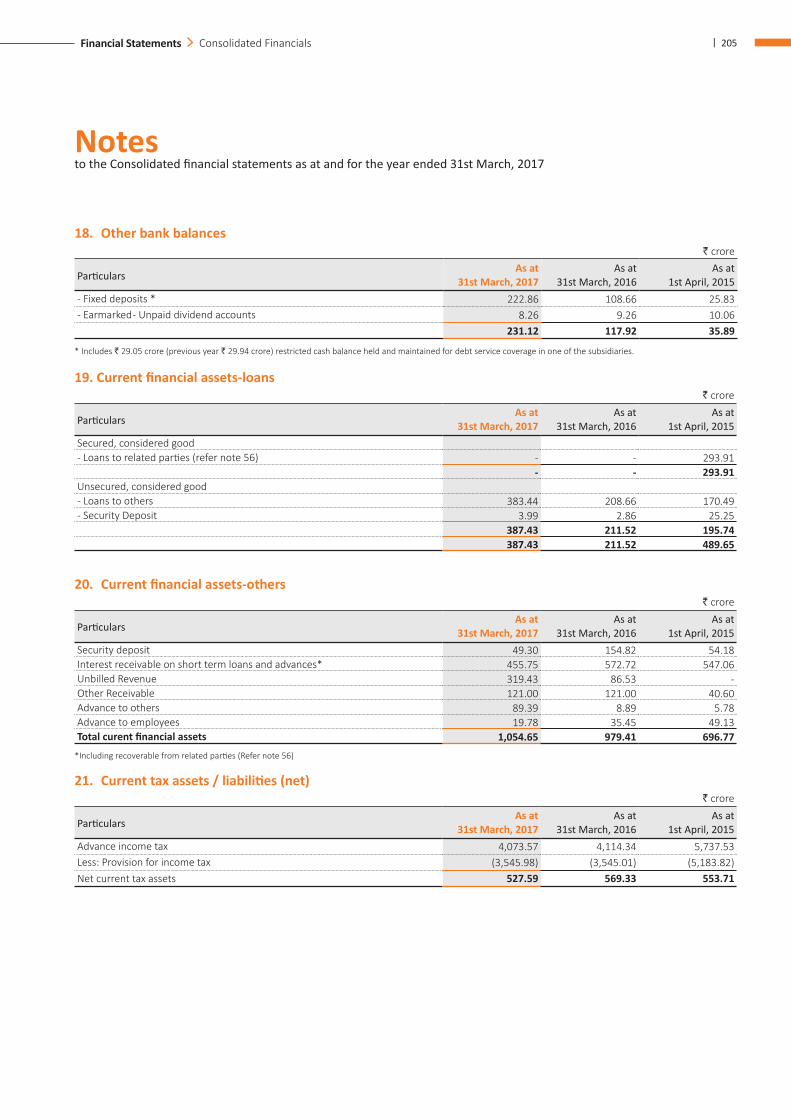
Notes to the Consolidated financial statements as at and for the year ended 31st March, 2017
| 205Financial Statements Consolidated Financials
18. Other bank balances` crore
ParticularsAs at
31st March, 2017 As at
31st March, 2016 As at
1st April, 2015- Fixed deposits * 222.86 108.66 25.83 - Earmarked - Unpaid dividend accounts 8.26 9.26 10.06
231.12 117.92 35.89
* Includes ` 29.05 crore (previous year ` 29.94 crore) restricted cash balance held and maintained for debt service coverage in one of the subsidiaries.
19. Current financial assets-loans ` crore
ParticularsAs at
31st March, 2017 As at
31st March, 2016 As at
1st April, 2015Secured, considered good- Loans to related parties (refer note 56) - - 293.91
- - 293.91 Unsecured, considered good- Loans to others 383.44 208.66 170.49 - Security Deposit 3.99 2.86 25.25
387.43 211.52 195.74 387.43 211.52 489.65
20. Current financial assets-others ` crore
ParticularsAs at
31st March, 2017 As at
31st March, 2016 As at
1st April, 2015Security deposit 49.30 154.82 54.18 Interest receivable on short term loans and advances* 455.75 572.72 547.06 Unbilled Revenue 319.43 86.53 - Other Receivable 121.00 121.00 40.60 Advance to others 89.39 8.89 5.78 Advance to employees 19.78 35.45 49.13 Total curent financial assets 1,054.65 979.41 696.77
*Including recoverable from related parties (Refer note 56)
21. Current tax assets / liabilities (net) ` crore
ParticularsAs at
31st March, 2017 As at
31st March, 2016 As at
1st April, 2015Advance income tax 4,073.57 4,114.34 5,737.53 Less: Provision for income tax (3,545.98) (3,545.01) (5,183.82)Net current tax assets 527.59 569.33 553.71
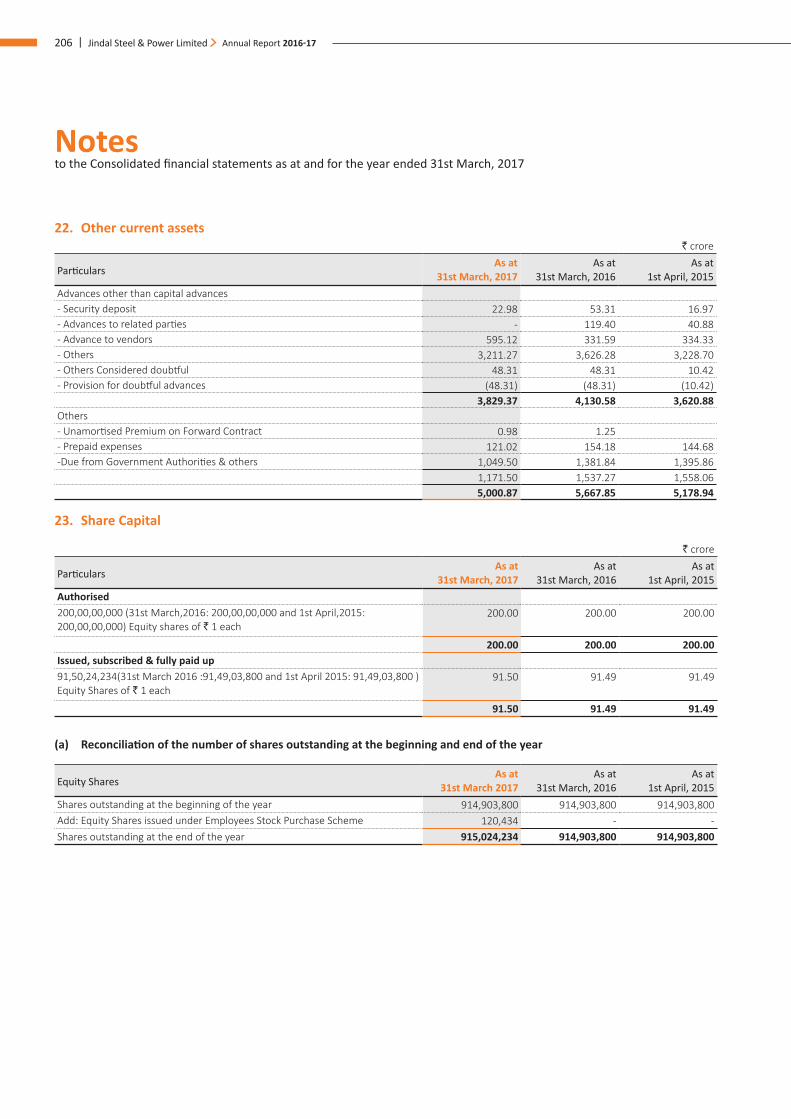
Notes to the Consolidated financial statements as at and for the year ended 31st March, 2017
206 | Jindal Steel & Power Limited Annual Report 2016-17
22. Other current assets ` crore
ParticularsAs at
31st March, 2017 As at
31st March, 2016 As at
1st April, 2015Advances other than capital advances- Security deposit 22.98 53.31 16.97 - Advances to related parties - 119.40 40.88 - Advance to vendors 595.12 331.59 334.33 - Others 3,211.27 3,626.28 3,228.70 - Others Considered doubtful 48.31 48.31 10.42 - Provision for doubtful advances (48.31) (48.31) (10.42)
3,829.37 4,130.58 3,620.88 Others- Unamortised Premium on Forward Contract 0.98 1.25 - Prepaid expenses 121.02 154.18 144.68 -Due from Government Authorities & others 1,049.50 1,381.84 1,395.86
1,171.50 1,537.27 1,558.06 5,000.87 5,667.85 5,178.94
23. Share Capital
` crore
ParticularsAs at
31st March, 2017As at
31st March, 2016As at
1st April, 2015Authorised200,00,00,000 (31st March,2016: 200,00,00,000 and 1st April,2015: 200,00,00,000) Equity shares of ` 1 each
200.00 200.00 200.00
200.00 200.00 200.00 Issued, subscribed & fully paid up91,50,24,234(31st March 2016 :91,49,03,800 and 1st April 2015: 91,49,03,800 ) Equity Shares of ` 1 each
91.50 91.49 91.49
91.50 91.49 91.49
(a) Reconciliation of the number of shares outstanding at the beginning and end of the year
Equity SharesAs at
31st March 2017As at
31st March, 2016As at
1st April, 2015Shares outstanding at the beginning of the year 914,903,800 914,903,800 914,903,800 Add: Equity Shares issued under Employees Stock Purchase Scheme 120,434 - - Shares outstanding at the end of the year 915,024,234 914,903,800 914,903,800
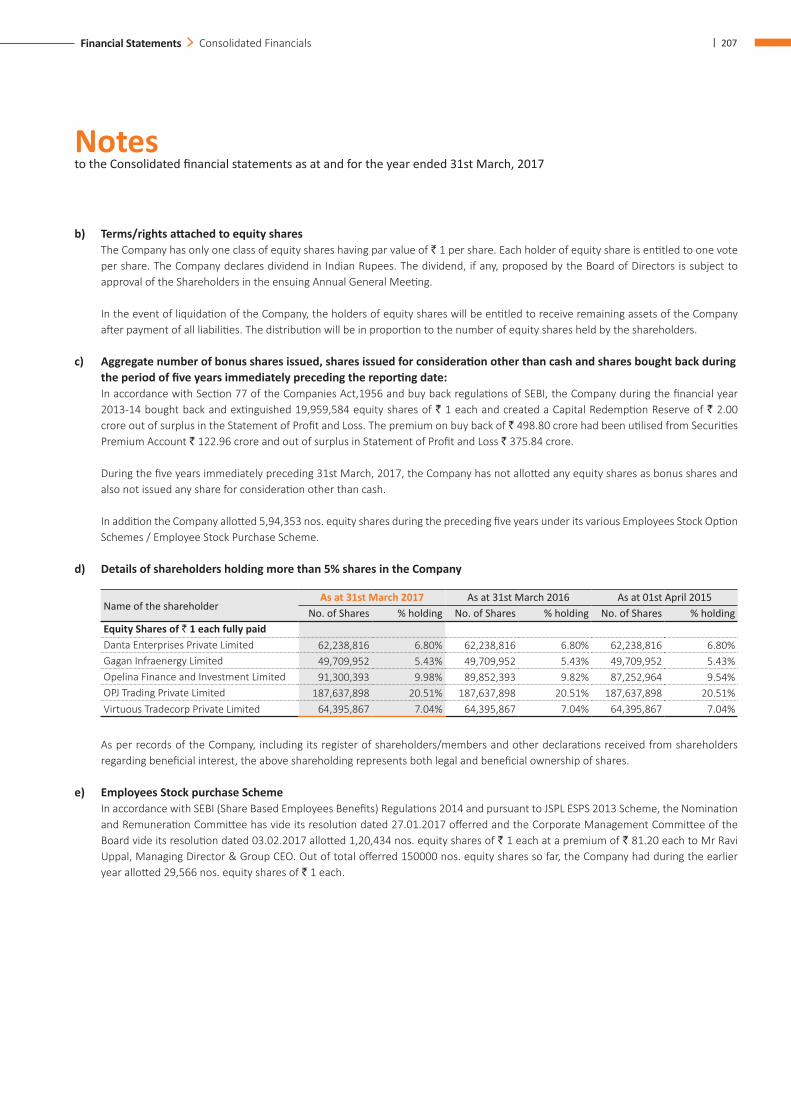
Notes to the Consolidated financial statements as at and for the year ended 31st March, 2017
| 207Financial Statements Consolidated Financials
b) Terms/rights attached to equity shares The Company has only one class of equity shares having par value of ` 1 per share. Each holder of equity share is entitled to one vote
per share. The Company declares dividend in Indian Rupees. The dividend, if any, proposed by the Board of Directors is subject to approval of the Shareholders in the ensuing Annual General Meeting.
In the event of liquidation of the Company, the holders of equity shares will be entitled to receive remaining assets of the Company after payment of all liabilities. The distribution will be in proportion to the number of equity shares held by the shareholders.
c) Aggregate number of bonus shares issued, shares issued for consideration other than cash and shares bought back during the period of five years immediately preceding the reporting date:
In accordance with Section 77 of the Companies Act,1956 and buy back regulations of SEBI, the Company during the financial year 2013-14 bought back and extinguished 19,959,584 equity shares of ` 1 each and created a Capital Redemption Reserve of ` 2.00 crore out of surplus in the Statement of Profit and Loss. The premium on buy back of ` 498.80 crore had been utilised from Securities Premium Account ` 122.96 crore and out of surplus in Statement of Profit and Loss ` 375.84 crore.
During the five years immediately preceding 31st March, 2017, the Company has not allotted any equity shares as bonus shares and also not issued any share for consideration other than cash.
In addition the Company allotted 5,94,353 nos. equity shares during the preceding five years under its various Employees Stock Option Schemes / Employee Stock Purchase Scheme.
d) Details of shareholders holding more than 5% shares in the Company
Name of the shareholderAs at 31st March 2017 As at 31st March 2016 As at 01st April 2015
No. of Shares % holding No. of Shares % holding No. of Shares % holding Equity Shares of ` 1 each fully paidDanta Enterprises Private Limited 62,238,816 6.80% 62,238,816 6.80% 62,238,816 6.80%Gagan Infraenergy Limited 49,709,952 5.43% 49,709,952 5.43% 49,709,952 5.43%Opelina Finance and Investment Limited 91,300,393 9.98% 89,852,393 9.82% 87,252,964 9.54%OPJ Trading Private Limited 187,637,898 20.51% 187,637,898 20.51% 187,637,898 20.51%Virtuous Tradecorp Private Limited 64,395,867 7.04% 64,395,867 7.04% 64,395,867 7.04%
As per records of the Company, including its register of shareholders/members and other declarations received from shareholders regarding beneficial interest, the above shareholding represents both legal and beneficial ownership of shares.
e) Employees Stock purchase Scheme In accordance with SEBI (Share Based Employees Benefits) Regulations 2014 and pursuant to JSPL ESPS 2013 Scheme, the Nomination
and Remuneration Committee has vide its resolution dated 27.01.2017 offerred and the Corporate Management Committee of the Board vide its resolution dated 03.02.2017 allotted 1,20,434 nos. equity shares of ` 1 each at a premium of ` 81.20 each to Mr Ravi Uppal, Managing Director & Group CEO. Out of total offerred 150000 nos. equity shares so far, the Company had during the earlier year allotted 29,566 nos. equity shares of ` 1 each.
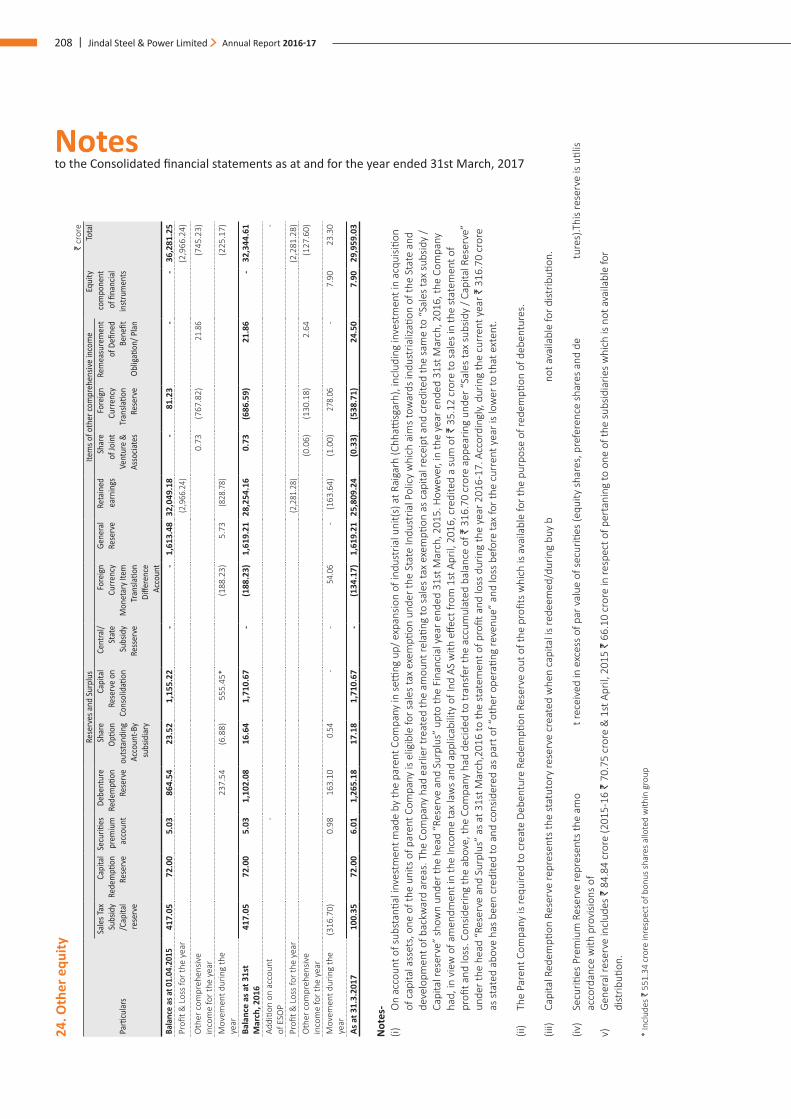
Notes to the Consolidated financial statements as at and for the year ended 31st March, 2017
208 | Jindal Steel & Power Limited Annual Report 2016-17
24. O
ther
equ
ity`
cror
e
Parti
cula
rs
Rese
rves
and
Surp
lus
Item
s of o
ther
com
preh
ensiv
e in
com
eEq
uity
co
mpo
nent
of
fina
ncia
l in
stru
men
ts
Tota
lSa
les T
ax
Subs
idy
/Cap
ital
rese
rve
Capi
tal
Rede
mpti
on
Rese
rve
Secu
rities
pr
emiu
m
acco
unt
Debe
ntur
e Re
dem
ption
Re
serv
e
Shar
e Op
tion
outs
tand
ing
Acco
unt-B
y su
bsid
iary
Capi
tal
Rese
rve
on
Cons
olid
ation
Cent
ral/
Stat
e Su
bsid
y Re
sser
ve
Fore
ign
Curre
ncy
Mon
etar
y Ite
m
Tran
slatio
n Di
ffere
nce
Acco
unt
Gene
ral
Rese
rve
Reta
ined
ea
rnin
gsSh
are
of Jo
int
Vent
ure
& As
socia
tes
Fore
ign
Curre
ncy
Tran
slatio
n Re
serv
e
Rem
easu
rem
ent
of D
efine
d Be
nefit
Ob
ligati
on/ P
lan
Bala
nce
as a
t 01.
04.2
015
417
.05
72.
00
5.0
3 8
64.5
4 2
3.52
1
,155
.22
- -
1,6
13.4
8 32
,049
.18
- 8
1.23
-
- 3
6,28
1.25
Pr
ofit &
Los
s fo
r the
yea
r (2
,966
.24)
(2,9
66.2
4)
Oth
er c
ompr
ehen
sive
inco
me
for t
he y
ear
0.7
3 (7
67.8
2) 2
1.86
(7
45.2
3)
Mov
emen
t dur
ing
the
year
237
.54
(6.8
8) 5
55.4
5*
(188
.23)
5.7
3 (8
28.7
8) (2
25.1
7)
Bala
nce
as a
t 31s
t M
arch
, 201
6 4
17.0
5 7
2.00
5
.03
1,1
02.0
8 1
6.64
1
,710
.67
- (1
88.2
3) 1
,619
.21
28,2
54.1
6 0
.73
(686
.59)
21.
86
- 3
2,34
4.61
Addi
tion
on a
ccou
nt
of E
SOP
- -
Profi
t & L
oss
for t
he y
ear
(2,2
81.2
8) (2
,281
.28)
Oth
er c
ompr
ehen
sive
inco
me
for t
he y
ear
(0.0
6) (1
30.1
8) 2
.64
(127
.60)
Mov
emen
t dur
ing
the
year
(316
.70)
0.9
8 1
63.1
0 0.
54-
- 5
4.06
-
(163
.64)
(1.0
0)27
8.06
- 7
.90
23.
30
As a
t 31.
3.20
17 1
00.3
5 7
2.00
6
.01
1,2
65.1
8 17
.18
1,7
10.6
7 -
(134
.17)
1,6
19.2
1 25
,809
.24
(0.3
3) (5
38.7
1) 2
4.50
7
.90
29,
959.
03
Not
es-
(i)
On
acco
unt o
f sub
stan
tial i
nves
tmen
t mad
e by
the
pare
nt C
ompa
ny in
setti
ng u
p/ e
xpan
sion
of in
dust
rial u
nit(
s) a
t Rai
garh
(Chh
attisg
arh)
, inc
ludi
ng in
vest
men
t in
acqu
isitio
n of
cap
ital a
sset
s, o
ne o
f the
uni
ts o
f par
ent C
ompa
ny is
elig
ible
for s
ales
tax
exem
ption
und
er th
e St
ate
Indu
stria
l Pol
icy
whi
ch a
ims
tow
ards
indu
stria
lizati
on o
f the
Sta
te a
nd
deve
lopm
ent o
f bac
kwar
d ar
eas.
The
Com
pany
had
ear
lier t
reat
ed th
e am
ount
rela
ting
to s
ales
tax
exem
ption
as
capi
tal r
ecei
pt a
nd c
redi
ted
the
sam
e to
“Sa
les
tax
subs
idy
/ Ca
pita
l res
erve
” sh
own
unde
r the
hea
d “R
eser
ve a
nd S
urpl
us”
upto
the
Fina
ncia
l yea
r end
ed 3
1st M
arch
, 201
5. H
owev
er, i
n th
e ye
ar e
nded
31s
t Mar
ch, 2
016,
the
Com
pany
ha
d, in
vie
w o
f am
endm
ent i
n th
e In
com
e ta
x la
ws
and
appl
icab
ility
of I
nd A
S w
ith e
ffect
from
1st
Apr
il, 2
016,
cre
dite
d a
sum
of `
35.
12 c
rore
to s
ales
in th
e st
atem
ent o
f pr
ofit a
nd lo
ss. C
onsid
erin
g th
e ab
ove,
the
Com
pany
had
dec
ided
to tr
ansf
er th
e ac
cum
ulat
ed b
alan
ce o
f ` 3
16.7
0 cr
ore
appe
arin
g un
der “
Sale
s ta
x su
bsid
y / C
apita
l Res
erve
” un
der t
he h
ead
“Res
erve
and
Sur
plus
” as
at 3
1st M
arch
,201
6 to
the
stat
emen
t of p
rofit
and
loss
dur
ing
the
year
201
6-17
. Acc
ordi
ngly,
dur
ing
the
curr
ent y
ear `
316
.70
cror
e as
stat
ed a
bove
has
bee
n cr
edite
d to
and
con
sider
ed a
s pa
rt o
f “ot
her o
pera
ting
reve
nue”
and
loss
bef
ore
tax
for t
he c
urre
nt y
ear i
s lo
wer
to th
at e
xten
t.
(ii)
The
Pare
nt C
ompa
ny is
requ
ired
to c
reat
e De
bent
ure
Rede
mpti
on R
eser
ve o
ut o
f the
pro
fits
whi
ch is
ava
ilabl
e fo
r the
pur
pose
of r
edem
ption
of d
eben
ture
s.
(iii)
Ca
pita
l Red
empti
on R
eser
ve re
pres
ents
the
stat
utor
y re
serv
e cr
eate
d w
hen
capi
tal i
s re
deem
ed/d
urin
g bu
y ba
ck. I
t is
not a
vaila
ble
for d
istrib
ution
.
(iv
) Se
curiti
es P
rem
ium
Res
erve
repr
esen
ts th
e am
ount
rece
ived
in e
xces
s of
par
val
ue o
f sec
uriti
es (e
quity
sha
res,
pre
fere
nce
shar
es a
nd d
eben
ture
s).T
his
rese
rve
is uti
lised
in
acco
rdan
ce w
ith p
rovi
sions
of t
he a
ct.
v)
Gen
eral
rese
rve
incl
udes
` 8
4.84
cro
re (2
015-
16 `
70.
75 c
rore
& 1
st A
pril,
201
5 `
66.1
0 cr
ore
in re
spec
t of p
erta
ning
to o
ne o
f the
sub
sidia
ries
whi
ch is
not
ava
ilabl
e fo
r di
strib
ution
.
* In
clud
es `
551
.34
cror
e in
resp
ect o
f bon
us s
hare
s al
lote
d w
ithin
gro
up
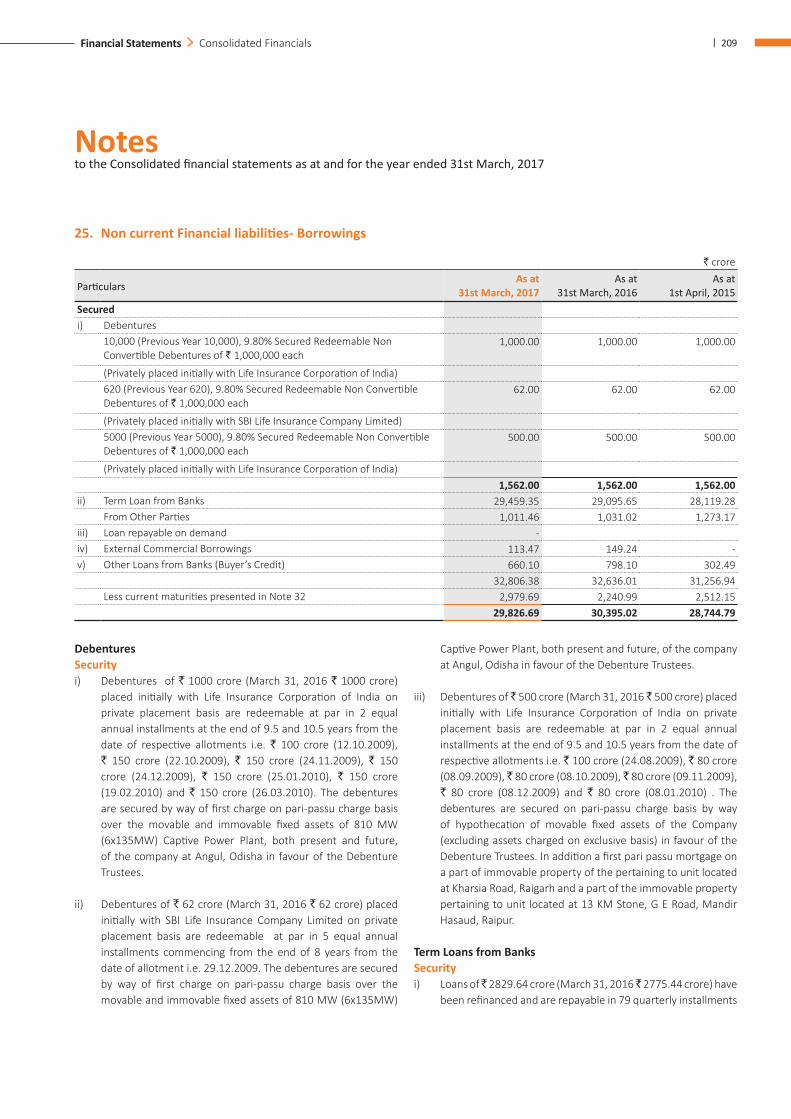
Notes to the Consolidated financial statements as at and for the year ended 31st March, 2017
| 209Financial Statements Consolidated Financials
25. Non current Financial liabilities- Borrowings
` crore
ParticularsAs at
31st March, 2017 As at
31st March, 2016 As at
1st April, 2015Securedi) Debentures
10,000 (Previous Year 10,000), 9.80% Secured Redeemable Non Convertible Debentures of ` 1,000,000 each
1,000.00 1,000.00 1,000.00
(Privately placed initially with Life Insurance Corporation of India)620 (Previous Year 620), 9.80% Secured Redeemable Non Convertible Debentures of ` 1,000,000 each
62.00 62.00 62.00
(Privately placed initially with SBI Life Insurance Company Limited)5000 (Previous Year 5000), 9.80% Secured Redeemable Non Convertible Debentures of ` 1,000,000 each
500.00 500.00 500.00
(Privately placed initially with Life Insurance Corporation of India) 1,562.00 1,562.00 1,562.00
ii) Term Loan from Banks 29,459.35 29,095.65 28,119.28 From Other Parties 1,011.46 1,031.02 1,273.17
iii) Loan repayable on demand - iv) External Commercial Borrowings 113.47 149.24 - v) Other Loans from Banks (Buyer’s Credit) 660.10 798.10 302.49
32,806.38 32,636.01 31,256.94 Less current maturities presented in Note 32 2,979.69 2,240.99 2,512.15
29,826.69 30,395.02 28,744.79
Debentures Security i) Debentures of ` 1000 crore (March 31, 2016 ` 1000 crore)
placed initially with Life Insurance Corporation of India on private placement basis are redeemable at par in 2 equal annual installments at the end of 9.5 and 10.5 years from the date of respective allotments i.e. ` 100 crore (12.10.2009), ` 150 crore (22.10.2009), ` 150 crore (24.11.2009), ` 150 crore (24.12.2009), ` 150 crore (25.01.2010), ` 150 crore (19.02.2010) and ` 150 crore (26.03.2010). The debentures are secured by way of first charge on pari-passu charge basis over the movable and immovable fixed assets of 810 MW (6x135MW) Captive Power Plant, both present and future, of the company at Angul, Odisha in favour of the Debenture Trustees.
ii) Debentures of ` 62 crore (March 31, 2016 ` 62 crore) placed initially with SBI Life Insurance Company Limited on private placement basis are redeemable at par in 5 equal annual installments commencing from the end of 8 years from the date of allotment i.e. 29.12.2009. The debentures are secured by way of first charge on pari-passu charge basis over the movable and immovable fixed assets of 810 MW (6x135MW)
Captive Power Plant, both present and future, of the company at Angul, Odisha in favour of the Debenture Trustees.
iii) Debentures of ̀ 500 crore (March 31, 2016 ̀ 500 crore) placed initially with Life Insurance Corporation of India on private placement basis are redeemable at par in 2 equal annual installments at the end of 9.5 and 10.5 years from the date of respective allotments i.e. ` 100 crore (24.08.2009), ` 80 crore (08.09.2009), ̀ 80 crore (08.10.2009), ̀ 80 crore (09.11.2009), ` 80 crore (08.12.2009) and ` 80 crore (08.01.2010) . The debentures are secured on pari-passu charge basis by way of hypothecation of movable fixed assets of the Company (excluding assets charged on exclusive basis) in favour of the Debenture Trustees. In addition a first pari passu mortgage on a part of immovable property of the pertaining to unit located at Kharsia Road, Raigarh and a part of the immovable property pertaining to unit located at 13 KM Stone, G E Road, Mandir Hasaud, Raipur.
Term Loans from BanksSecurity i) Loans of ̀ 2829.64 crore (March 31, 2016 ̀ 2775.44 crore) have
been refinanced and are repayable in 79 quarterly installments
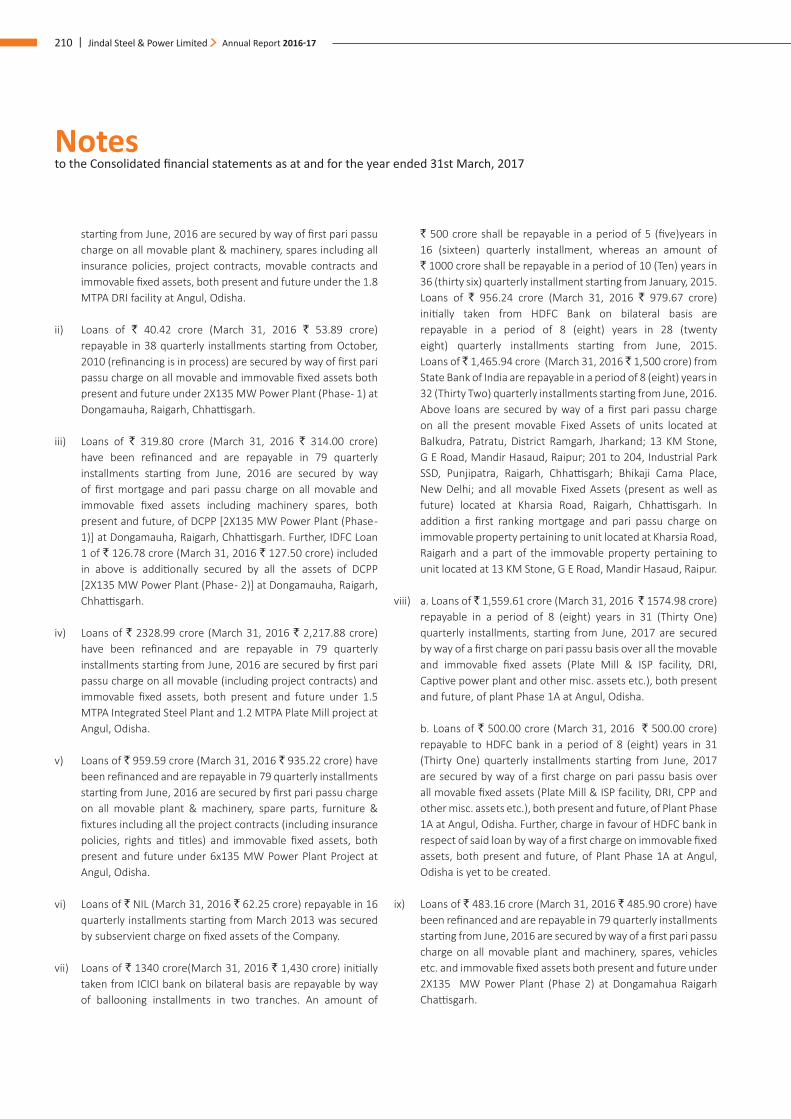
Notes to the Consolidated financial statements as at and for the year ended 31st March, 2017
210 | Jindal Steel & Power Limited Annual Report 2016-17
starting from June, 2016 are secured by way of first pari passu charge on all movable plant & machinery, spares including all insurance policies, project contracts, movable contracts and immovable fixed assets, both present and future under the 1.8 MTPA DRI facility at Angul, Odisha.
ii) Loans of ` 40.42 crore (March 31, 2016 ` 53.89 crore) repayable in 38 quarterly installments starting from October, 2010 (refinancing is in process) are secured by way of first pari passu charge on all movable and immovable fixed assets both present and future under 2X135 MW Power Plant (Phase - 1) at Dongamauha, Raigarh, Chhattisgarh.
iii) Loans of ` 319.80 crore (March 31, 2016 ` 314.00 crore) have been refinanced and are repayable in 79 quarterly installments starting from June, 2016 are secured by way of first mortgage and pari passu charge on all movable and immovable fixed assets including machinery spares, both present and future, of DCPP [2X135 MW Power Plant (Phase - 1)] at Dongamauha, Raigarh, Chhattisgarh. Further, IDFC Loan 1 of ` 126.78 crore (March 31, 2016 ` 127.50 crore) included in above is additionally secured by all the assets of DCPP [2X135 MW Power Plant (Phase - 2)] at Dongamauha, Raigarh, Chhattisgarh.
iv) Loans of ` 2328.99 crore (March 31, 2016 ` 2,217.88 crore) have been refinanced and are repayable in 79 quarterly installments starting from June, 2016 are secured by first pari passu charge on all movable (including project contracts) and immovable fixed assets, both present and future under 1.5 MTPA Integrated Steel Plant and 1.2 MTPA Plate Mill project at Angul, Odisha.
v) Loans of ` 959.59 crore (March 31, 2016 ` 935.22 crore) have been refinanced and are repayable in 79 quarterly installments starting from June, 2016 are secured by first pari passu charge on all movable plant & machinery, spare parts, furniture & fixtures including all the project contracts (including insurance policies, rights and titles) and immovable fixed assets, both present and future under 6x135 MW Power Plant Project at Angul, Odisha.
vi) Loans of ` NIL (March 31, 2016 ` 62.25 crore) repayable in 16 quarterly installments starting from March 2013 was secured by subservient charge on fixed assets of the Company.
vii) Loans of ` 1340 crore(March 31, 2016 ` 1,430 crore) initially taken from ICICI bank on bilateral basis are repayable by way of ballooning installments in two tranches. An amount of
` 500 crore shall be repayable in a period of 5 (five)years in 16 (sixteen) quarterly installment, whereas an amount of ` 1000 crore shall be repayable in a period of 10 (Ten) years in 36 (thirty six) quarterly installment starting from January, 2015. Loans of ` 956.24 crore (March 31, 2016 ` 979.67 crore) initially taken from HDFC Bank on bilateral basis are repayable in a period of 8 (eight) years in 28 (twenty eight) quarterly installments starting from June, 2015. Loans of ̀ 1,465.94 crore (March 31, 2016 ̀ 1,500 crore) from State Bank of India are repayable in a period of 8 (eight) years in 32 (Thirty Two) quarterly installments starting from June, 2016. Above loans are secured by way of a first pari passu charge on all the present movable Fixed Assets of units located at Balkudra, Patratu, District Ramgarh, Jharkand; 13 KM Stone, G E Road, Mandir Hasaud, Raipur; 201 to 204, Industrial Park SSD, Punjipatra, Raigarh, Chhattisgarh; Bhikaji Cama Place, New Delhi; and all movable Fixed Assets (present as well as future) located at Kharsia Road, Raigarh, Chhattisgarh. In addition a first ranking mortgage and pari passu charge on immovable property pertaining to unit located at Kharsia Road, Raigarh and a part of the immovable property pertaining to unit located at 13 KM Stone, G E Road, Mandir Hasaud, Raipur.
viii) a. Loans of ` 1,559.61 crore (March 31, 2016 ` 1574.98 crore) repayable in a period of 8 (eight) years in 31 (Thirty One) quarterly installments, starting from June, 2017 are secured by way of a first charge on pari passu basis over all the movable and immovable fixed assets (Plate Mill & ISP facility, DRI, Captive power plant and other misc. assets etc.), both present and future, of plant Phase 1A at Angul, Odisha.
b. Loans of ` 500.00 crore (March 31, 2016 ` 500.00 crore) repayable to HDFC bank in a period of 8 (eight) years in 31 (Thirty One) quarterly installments starting from June, 2017 are secured by way of a first charge on pari passu basis over all movable fixed assets (Plate Mill & ISP facility, DRI, CPP and other misc. assets etc.), both present and future, of Plant Phase 1A at Angul, Odisha. Further, charge in favour of HDFC bank in respect of said loan by way of a first charge on immovable fixed assets, both present and future, of Plant Phase 1A at Angul, Odisha is yet to be created.
ix) Loans of ` 483.16 crore (March 31, 2016 ` 485.90 crore) have been refinanced and are repayable in 79 quarterly installments starting from June, 2016 are secured by way of a first pari passu charge on all movable plant and machinery, spares, vehicles etc. and immovable fixed assets both present and future under 2X135 MW Power Plant (Phase 2) at Dongamahua Raigarh Chattisgarh.
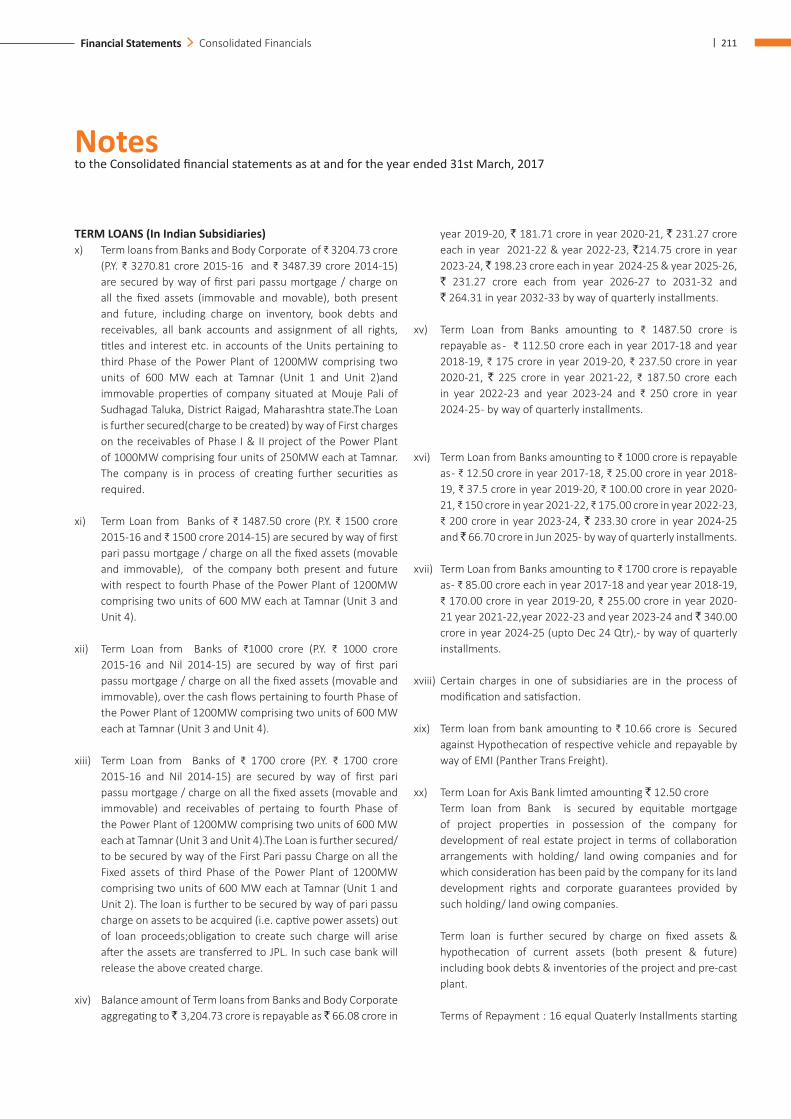
Notes to the Consolidated financial statements as at and for the year ended 31st March, 2017
| 211Financial Statements Consolidated Financials
TERM LOANS (In Indian Subsidiaries)x) Term loans from Banks and Body Corporate of ₹ 3204.73 crore
(P.Y. ₹ 3270.81 crore 2015-16 and ₹ 3487.39 crore 2014-15) are secured by way of first pari passu mortgage / charge on all the fixed assets (immovable and movable), both present and future, including charge on inventory, book debts and receivables, all bank accounts and assignment of all rights, titles and interest etc. in accounts of the Units pertaining to third Phase of the Power Plant of 1200MW comprising two units of 600 MW each at Tamnar (Unit 1 and Unit 2)and immovable properties of company situated at Mouje Pali of Sudhagad Taluka, District Raigad, Maharashtra state.The Loan is further secured(charge to be created) by way of First charges on the receivables of Phase I & II project of the Power Plant of 1000MW comprising four units of 250MW each at Tamnar. The company is in process of creating further securities as required.
xi) Term Loan from Banks of ₹ 1487.50 crore (P.Y. ₹ 1500 crore 2015-16 and ₹ 1500 crore 2014-15) are secured by way of first pari passu mortgage / charge on all the fixed assets (movable and immovable), of the company both present and future with respect to fourth Phase of the Power Plant of 1200MW comprising two units of 600 MW each at Tamnar (Unit 3 and Unit 4).
xii) Term Loan from Banks of ₹1000 crore (P.Y. ₹ 1000 crore 2015-16 and Nil 2014-15) are secured by way of first pari passu mortgage / charge on all the fixed assets (movable and immovable), over the cash flows pertaining to fourth Phase of the Power Plant of 1200MW comprising two units of 600 MW each at Tamnar (Unit 3 and Unit 4).
xiii) Term Loan from Banks of ₹ 1700 crore (P.Y. ₹ 1700 crore 2015-16 and Nil 2014-15) are secured by way of first pari passu mortgage / charge on all the fixed assets (movable and immovable) and receivables of pertaing to fourth Phase of the Power Plant of 1200MW comprising two units of 600 MW each at Tamnar (Unit 3 and Unit 4).The Loan is further secured/ to be secured by way of the First Pari passu Charge on all the Fixed assets of third Phase of the Power Plant of 1200MW comprising two units of 600 MW each at Tamnar (Unit 1 and Unit 2). The loan is further to be secured by way of pari passu charge on assets to be acquired (i.e. captive power assets) out of loan proceeds;obligation to create such charge will arise after the assets are transferred to JPL. In such case bank will release the above created charge.
xiv) Balance amount of Term loans from Banks and Body Corporate aggregating to ̀ 3,204.73 crore is repayable as ̀ 66.08 crore in
year 2019-20, ` 181.71 crore in year 2020-21, ` 231.27 crore each in year 2021-22 & year 2022-23, `214.75 crore in year 2023-24, ̀ 198.23 crore each in year 2024-25 & year 2025-26, ` 231.27 crore each from year 2026-27 to 2031-32 and ` 264.31 in year 2032-33 by way of quarterly installments.
xv) Term Loan from Banks amounting to ₹ 1487.50 crore is repayable as - ₹ 112.50 crore each in year 2017-18 and year 2018-19, ₹ 175 crore in year 2019-20, ₹ 237.50 crore in year 2020-21, ` 225 crore in year 2021-22, ₹ 187.50 crore each in year 2022-23 and year 2023-24 and ₹ 250 crore in year 2024-25 - by way of quarterly installments.
xvi) Term Loan from Banks amounting to ₹ 1000 crore is repayable as - ₹ 12.50 crore in year 2017-18, ₹ 25.00 crore in year 2018-19, ₹ 37.5 crore in year 2019-20, ₹ 100.00 crore in year 2020-21, ₹ 150 crore in year 2021-22, ₹ 175.00 crore in year 2022-23, ₹ 200 crore in year 2023-24, ` 233.30 crore in year 2024-25 and ̀ 66.70 crore in Jun 2025- by way of quarterly installments.
xvii) Term Loan from Banks amounting to ₹ 1700 crore is repayable as - ₹ 85.00 crore each in year 2017-18 and year year 2018-19, ₹ 170.00 crore in year 2019-20, ₹ 255.00 crore in year 2020-21 year 2021-22,year 2022-23 and year 2023-24 and ` 340.00 crore in year 2024-25 (upto Dec 24 Qtr),- by way of quarterly installments.
xviii) Certain charges in one of subsidiaries are in the process of modification and satisfaction.
xix) Term loan from bank amounting to ₹ 10.66 crore is Secured against Hypothecation of respective vehicle and repayable by way of EMI (Panther Trans Freight).
xx) Term Loan for Axis Bank limted amounting ` 12.50 crore Term loan from Bank is secured by equitable mortgage
of project properties in possession of the company for development of real estate project in terms of collaboration arrangements with holding/ land owing companies and for which consideration has been paid by the company for its land development rights and corporate guarantees provided by such holding/ land owing companies.
Term loan is further secured by charge on fixed assets & hypothecation of current assets (both present & future) including book debts & inventories of the project and pre-cast plant.
Terms of Repayment : 16 equal Quaterly Installments starting
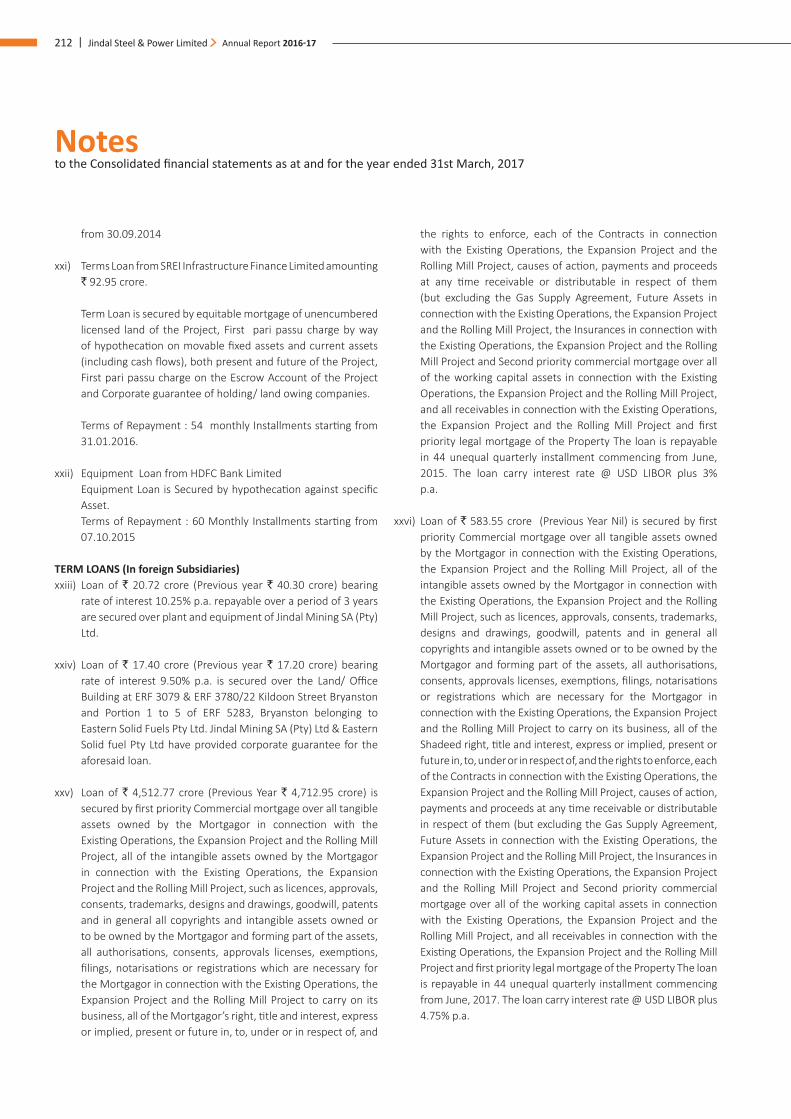
Notes to the Consolidated financial statements as at and for the year ended 31st March, 2017
212 | Jindal Steel & Power Limited Annual Report 2016-17
from 30.09.2014
xxi) Terms Loan from SREI Infrastructure Finance Limited amounting ` 92.95 crore.
Term Loan is secured by equitable mortgage of unencumbered licensed land of the Project, First pari passu charge by way of hypothecation on movable fixed assets and current assets (including cash flows), both present and future of the Project, First pari passu charge on the Escrow Account of the Project and Corporate guarantee of holding/ land owing companies.
Terms of Repayment : 54 monthly Installments starting from 31.01.2016.
xxii) Equipment Loan from HDFC Bank Limited Equipment Loan is Secured by hypothecation against specific
Asset. Terms of Repayment : 60 Monthly Installments starting from
07.10.2015 TERM LOANS (In foreign Subsidiaries) xxiii) Loan of ` 20.72 crore (Previous year ` 40.30 crore) bearing
rate of interest 10.25% p.a. repayable over a period of 3 years are secured over plant and equipment of Jindal Mining SA (Pty) Ltd.
xxiv) Loan of ` 17.40 crore (Previous year ` 17.20 crore) bearing rate of interest 9.50% p.a. is secured over the Land/ Office Building at ERF 3079 & ERF 3780/22 Kildoon Street Bryanston and Portion 1 to 5 of ERF 5283, Bryanston belonging to Eastern Solid Fuels Pty Ltd. Jindal Mining SA (Pty) Ltd & Eastern Solid fuel Pty Ltd have provided corporate guarantee for the aforesaid loan.
xxv) Loan of ` 4,512.77 crore (Previous Year ` 4,712.95 crore) is secured by first priority Commercial mortgage over all tangible assets owned by the Mortgagor in connection with the Existing Operations, the Expansion Project and the Rolling Mill Project, all of the intangible assets owned by the Mortgagor in connection with the Existing Operations, the Expansion Project and the Rolling Mill Project, such as licences, approvals, consents, trademarks, designs and drawings, goodwill, patents and in general all copyrights and intangible assets owned or to be owned by the Mortgagor and forming part of the assets, all authorisations, consents, approvals licenses, exemptions, filings, notarisations or registrations which are necessary for the Mortgagor in connection with the Existing Operations, the Expansion Project and the Rolling Mill Project to carry on its business, all of the Mortgagor’s right, title and interest, express or implied, present or future in, to, under or in respect of, and
the rights to enforce, each of the Contracts in connection with the Existing Operations, the Expansion Project and the Rolling Mill Project, causes of action, payments and proceeds at any time receivable or distributable in respect of them (but excluding the Gas Supply Agreement, Future Assets in connection with the Existing Operations, the Expansion Project and the Rolling Mill Project, the Insurances in connection with the Existing Operations, the Expansion Project and the Rolling Mill Project and Second priority commercial mortgage over all of the working capital assets in connection with the Existing Operations, the Expansion Project and the Rolling Mill Project, and all receivables in connection with the Existing Operations, the Expansion Project and the Rolling Mill Project and first priority legal mortgage of the Property The loan is repayable in 44 unequal quarterly installment commencing from June, 2015. The loan carry interest rate @ USD LIBOR plus 3% p.a.
xxvi) Loan of ` 583.55 crore (Previous Year Nil) is secured by first priority Commercial mortgage over all tangible assets owned by the Mortgagor in connection with the Existing Operations, the Expansion Project and the Rolling Mill Project, all of the intangible assets owned by the Mortgagor in connection with the Existing Operations, the Expansion Project and the Rolling Mill Project, such as licences, approvals, consents, trademarks, designs and drawings, goodwill, patents and in general all copyrights and intangible assets owned or to be owned by the Mortgagor and forming part of the assets, all authorisations, consents, approvals licenses, exemptions, filings, notarisations or registrations which are necessary for the Mortgagor in connection with the Existing Operations, the Expansion Project and the Rolling Mill Project to carry on its business, all of the Shadeed right, title and interest, express or implied, present or future in, to, under or in respect of, and the rights to enforce, each of the Contracts in connection with the Existing Operations, the Expansion Project and the Rolling Mill Project, causes of action, payments and proceeds at any time receivable or distributable in respect of them (but excluding the Gas Supply Agreement, Future Assets in connection with the Existing Operations, the Expansion Project and the Rolling Mill Project, the Insurances in connection with the Existing Operations, the Expansion Project and the Rolling Mill Project and Second priority commercial mortgage over all of the working capital assets in connection with the Existing Operations, the Expansion Project and the Rolling Mill Project, and all receivables in connection with the Existing Operations, the Expansion Project and the Rolling Mill Project and first priority legal mortgage of the Property The loan is repayable in 44 unequal quarterly installment commencing from June, 2017. The loan carry interest rate @ USD LIBOR plus 4.75% p.a.
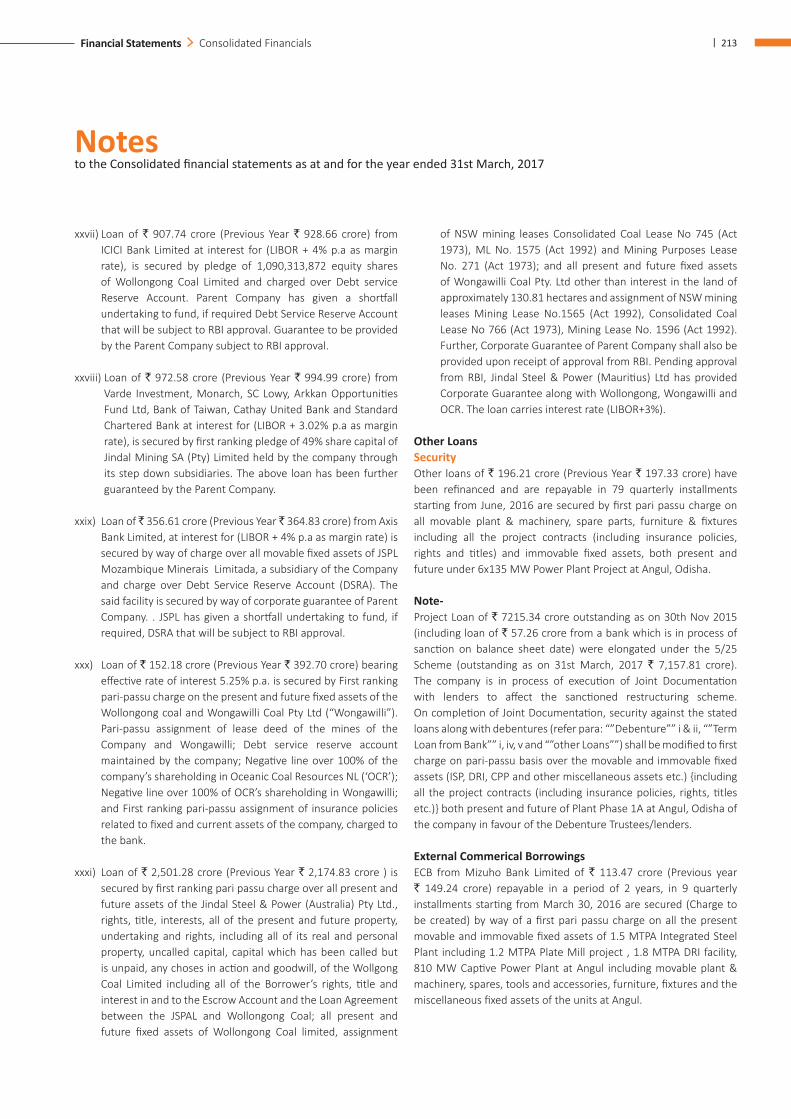
Notes to the Consolidated financial statements as at and for the year ended 31st March, 2017
| 213Financial Statements Consolidated Financials
xxvii) Loan of ` 907.74 crore (Previous Year ` 928.66 crore) from ICICI Bank Limited at interest for (LIBOR + 4% p.a as margin rate), is secured by pledge of 1,090,313,872 equity shares of Wollongong Coal Limited and charged over Debt service Reserve Account. Parent Company has given a shortfall undertaking to fund, if required Debt Service Reserve Account that will be subject to RBI approval. Guarantee to be provided by the Parent Company subject to RBI approval.
xxviii) Loan of ` 972.58 crore (Previous Year ` 994.99 crore) from Varde Investment, Monarch, SC Lowy, Arkkan Opportunities Fund Ltd, Bank of Taiwan, Cathay United Bank and Standard Chartered Bank at interest for (LIBOR + 3.02% p.a as margin rate), is secured by first ranking pledge of 49% share capital of Jindal Mining SA (Pty) Limited held by the company through its step down subsidiaries. The above loan has been further guaranteed by the Parent Company.
xxix) Loan of ̀ 356.61 crore (Previous Year ̀ 364.83 crore) from Axis Bank Limited, at interest for (LIBOR + 4% p.a as margin rate) is secured by way of charge over all movable fixed assets of JSPL Mozambique Minerais Limitada, a subsidiary of the Company and charge over Debt Service Reserve Account (DSRA). The said facility is secured by way of corporate guarantee of Parent Company. . JSPL has given a shortfall undertaking to fund, if required, DSRA that will be subject to RBI approval.
xxx) Loan of ` 152.18 crore (Previous Year ` 392.70 crore) bearing effective rate of interest 5.25% p.a. is secured by First ranking pari-passu charge on the present and future fixed assets of the Wollongong coal and Wongawilli Coal Pty Ltd (“Wongawilli”). Pari-passu assignment of lease deed of the mines of the Company and Wongawilli; Debt service reserve account maintained by the company; Negative line over 100% of the company’s shareholding in Oceanic Coal Resources NL (‘OCR’); Negative line over 100% of OCR’s shareholding in Wongawilli; and First ranking pari-passu assignment of insurance policies related to fixed and current assets of the company, charged to the bank.
xxxi) Loan of ` 2,501.28 crore (Previous Year ` 2,174.83 crore ) is secured by first ranking pari passu charge over all present and future assets of the Jindal Steel & Power (Australia) Pty Ltd., rights, title, interests, all of the present and future property, undertaking and rights, including all of its real and personal property, uncalled capital, capital which has been called but is unpaid, any choses in action and goodwill, of the Wollgong Coal Limited including all of the Borrower’s rights, title and interest in and to the Escrow Account and the Loan Agreement between the JSPAL and Wollongong Coal; all present and future fixed assets of Wollongong Coal limited, assignment
of NSW mining leases Consolidated Coal Lease No 745 (Act 1973), ML No. 1575 (Act 1992) and Mining Purposes Lease No. 271 (Act 1973); and all present and future fixed assets of Wongawilli Coal Pty. Ltd other than interest in the land of approximately 130.81 hectares and assignment of NSW mining leases Mining Lease No.1565 (Act 1992), Consolidated Coal Lease No 766 (Act 1973), Mining Lease No. 1596 (Act 1992). Further, Corporate Guarantee of Parent Company shall also be provided upon receipt of approval from RBI. Pending approval from RBI, Jindal Steel & Power (Mauritius) Ltd has provided Corporate Guarantee along with Wollongong, Wongawilli and OCR. The loan carries interest rate (LIBOR+3%).
Other LoansSecurityOther loans of ` 196.21 crore (Previous Year ` 197.33 crore) have been refinanced and are repayable in 79 quarterly installments starting from June, 2016 are secured by first pari passu charge on all movable plant & machinery, spare parts, furniture & fixtures including all the project contracts (including insurance policies, rights and titles) and immovable fixed assets, both present and future under 6x135 MW Power Plant Project at Angul, Odisha.
Note-Project Loan of ` 7215.34 crore outstanding as on 30th Nov 2015 (including loan of ` 57.26 crore from a bank which is in process of sanction on balance sheet date) were elongated under the 5/25 Scheme (outstanding as on 31st March, 2017 ` 7,157.81 crore). The company is in process of execution of Joint Documentation with lenders to affect the sanctioned restructuring scheme. On completion of Joint Documentation, security against the stated loans along with debentures (refer para: “”Debenture”” i & ii, “”Term Loan from Bank”” i, iv, v and “”other Loans””) shall be modified to first charge on pari-passu basis over the movable and immovable fixed assets (ISP, DRI, CPP and other miscellaneous assets etc.) {including all the project contracts (including insurance policies, rights, titles etc.)} both present and future of Plant Phase 1A at Angul, Odisha of the company in favour of the Debenture Trustees/lenders.
External Commerical Borrowings ECB from Mizuho Bank Limited of ` 113.47 crore (Previous year ` 149.24 crore) repayable in a period of 2 years, in 9 quarterly installments starting from March 30, 2016 are secured (Charge to be created) by way of a first pari passu charge on all the present movable and immovable fixed assets of 1.5 MTPA Integrated Steel Plant including 1.2 MTPA Plate Mill project , 1.8 MTPA DRI facility, 810 MW Captive Power Plant at Angul including movable plant & machinery, spares, tools and accessories, furniture, fixtures and the miscellaneous fixed assets of the units at Angul.
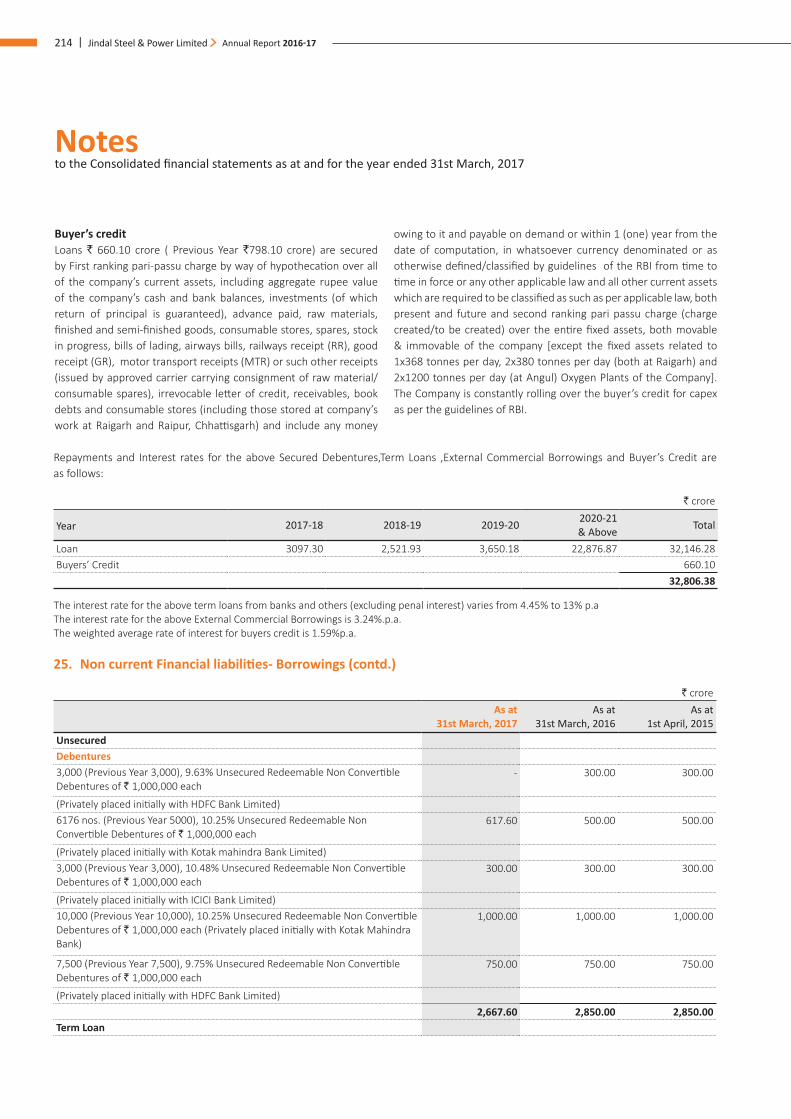
Notes to the Consolidated financial statements as at and for the year ended 31st March, 2017
214 | Jindal Steel & Power Limited Annual Report 2016-17
Repayments and Interest rates for the above Secured Debentures,Term Loans ,External Commercial Borrowings and Buyer’s Credit are as follows:
` crore
Year 2017-18 2018-19 2019-20 2020-21 & Above Total
Loan 3097.30 2,521.93 3,650.18 22,876.87 32,146.28 Buyers’ Credit 660.10
32,806.38
The interest rate for the above term loans from banks and others (excluding penal interest) varies from 4.45% to 13% p.aThe interest rate for the above External Commercial Borrowings is 3.24%.p.a.The weighted average rate of interest for buyers credit is 1.59%p.a.
25. Non current Financial liabilities- Borrowings (contd.)
` croreAs at
31st March, 2017 As at
31st March, 2016 As at
1st April, 2015UnsecuredDebentures3,000 (Previous Year 3,000), 9.63% Unsecured Redeemable Non Convertible Debentures of ` 1,000,000 each
- 300.00 300.00
(Privately placed initially with HDFC Bank Limited)6176 nos. (Previous Year 5000), 10.25% Unsecured Redeemable Non Convertible Debentures of ` 1,000,000 each
617.60 500.00 500.00
(Privately placed initially with Kotak mahindra Bank Limited)3,000 (Previous Year 3,000), 10.48% Unsecured Redeemable Non Convertible Debentures of ` 1,000,000 each
300.00 300.00 300.00
(Privately placed initially with ICICI Bank Limited)10,000 (Previous Year 10,000), 10.25% Unsecured Redeemable Non Convertible Debentures of ` 1,000,000 each (Privately placed initially with Kotak Mahindra Bank)
1,000.00 1,000.00 1,000.00
7,500 (Previous Year 7,500), 9.75% Unsecured Redeemable Non Convertible Debentures of ` 1,000,000 each
750.00 750.00 750.00
(Privately placed initially with HDFC Bank Limited) 2,667.60 2,850.00 2,850.00
Term Loan
Buyer’s credit Loans ` 660.10 crore ( Previous Year `798.10 crore) are secured by First ranking pari-passu charge by way of hypothecation over all of the company’s current assets, including aggregate rupee value of the company’s cash and bank balances, investments (of which return of principal is guaranteed), advance paid, raw materials, finished and semi-finished goods, consumable stores, spares, stock in progress, bills of lading, airways bills, railways receipt (RR), good receipt (GR), motor transport receipts (MTR) or such other receipts (issued by approved carrier carrying consignment of raw material/consumable spares), irrevocable letter of credit, receivables, book debts and consumable stores (including those stored at company’s work at Raigarh and Raipur, Chhattisgarh) and include any money
owing to it and payable on demand or within 1 (one) year from the date of computation, in whatsoever currency denominated or as otherwise defined/classified by guidelines of the RBI from time to time in force or any other applicable law and all other current assets which are required to be classified as such as per applicable law, both present and future and second ranking pari passu charge (charge created/to be created) over the entire fixed assets, both movable & immovable of the company [except the fixed assets related to 1x368 tonnes per day, 2x380 tonnes per day (both at Raigarh) and 2x1200 tonnes per day (at Angul) Oxygen Plants of the Company]. The Company is constantly rolling over the buyer’s credit for capex as per the guidelines of RBI.
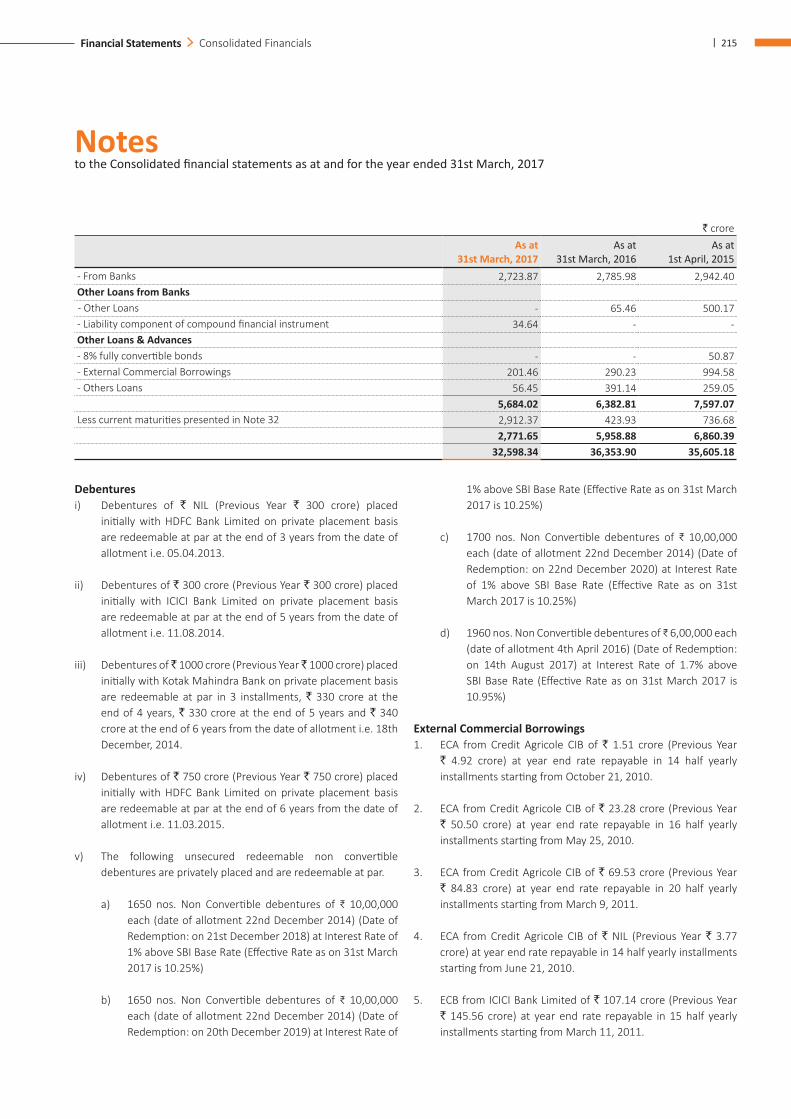
Notes to the Consolidated financial statements as at and for the year ended 31st March, 2017
| 215Financial Statements Consolidated Financials
` croreAs at
31st March, 2017 As at
31st March, 2016 As at
1st April, 2015- From Banks 2,723.87 2,785.98 2,942.40 Other Loans from Banks - Other Loans - 65.46 500.17 - Liability component of compound financial instrument 34.64 - - Other Loans & Advances- 8% fully convertible bonds - - 50.87 - External Commercial Borrowings 201.46 290.23 994.58 - Others Loans 56.45 391.14 259.05
5,684.02 6,382.81 7,597.07 Less current maturities presented in Note 32 2,912.37 423.93 736.68
2,771.65 5,958.88 6,860.39 32,598.34 36,353.90 35,605.18
Debentures i) Debentures of ` NIL (Previous Year ` 300 crore) placed
initially with HDFC Bank Limited on private placement basis are redeemable at par at the end of 3 years from the date of allotment i.e. 05.04.2013.
ii) Debentures of ` 300 crore (Previous Year ` 300 crore) placed initially with ICICI Bank Limited on private placement basis are redeemable at par at the end of 5 years from the date of allotment i.e. 11.08.2014.
iii) Debentures of ̀ 1000 crore (Previous Year ̀ 1000 crore) placed initially with Kotak Mahindra Bank on private placement basis are redeemable at par in 3 installments, ` 330 crore at the end of 4 years, ` 330 crore at the end of 5 years and ` 340 crore at the end of 6 years from the date of allotment i.e. 18th December, 2014.
iv) Debentures of ` 750 crore (Previous Year ` 750 crore) placed initially with HDFC Bank Limited on private placement basis are redeemable at par at the end of 6 years from the date of allotment i.e. 11.03.2015.
v) The following unsecured redeemable non convertible debentures are privately placed and are redeemable at par.
a) 1650 nos. Non Convertible debentures of ₹ 10,00,000 each (date of allotment 22nd December 2014) (Date of Redemption: on 21st December 2018) at Interest Rate of 1% above SBI Base Rate (Effective Rate as on 31st March 2017 is 10.25%)
b) 1650 nos. Non Convertible debentures of ₹ 10,00,000 each (date of allotment 22nd December 2014) (Date of Redemption: on 20th December 2019) at Interest Rate of
1% above SBI Base Rate (Effective Rate as on 31st March 2017 is 10.25%)
c) 1700 nos. Non Convertible debentures of ₹ 10,00,000 each (date of allotment 22nd December 2014) (Date of Redemption: on 22nd December 2020) at Interest Rate of 1% above SBI Base Rate (Effective Rate as on 31st March 2017 is 10.25%)
d) 1960 nos. Non Convertible debentures of ₹ 6,00,000 each (date of allotment 4th April 2016) (Date of Redemption: on 14th August 2017) at Interest Rate of 1.7% above SBI Base Rate (Effective Rate as on 31st March 2017 is 10.95%)
External Commercial Borrowings 1. ECA from Credit Agricole CIB of ` 1.51 crore (Previous Year
` 4.92 crore) at year end rate repayable in 14 half yearly installments starting from October 21, 2010.
2. ECA from Credit Agricole CIB of ` 23.28 crore (Previous Year ` 50.50 crore) at year end rate repayable in 16 half yearly installments starting from May 25, 2010.
3. ECA from Credit Agricole CIB of ` 69.53 crore (Previous Year ` 84.83 crore) at year end rate repayable in 20 half yearly installments starting from March 9, 2011.
4. ECA from Credit Agricole CIB of ` NIL (Previous Year ` 3.77 crore) at year end rate repayable in 14 half yearly installments starting from June 21, 2010.
5. ECB from ICICI Bank Limited of ` 107.14 crore (Previous Year ` 145.56 crore) at year end rate repayable in 15 half yearly installments starting from March 11, 2011.
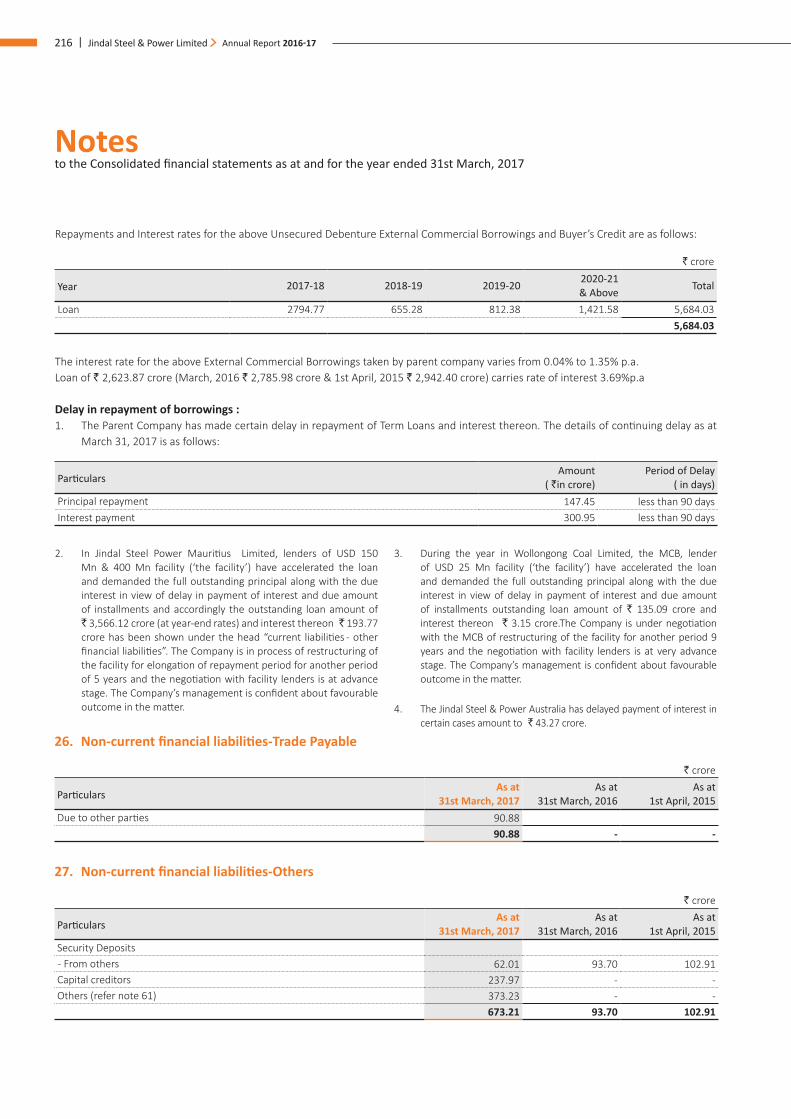
Notes to the Consolidated financial statements as at and for the year ended 31st March, 2017
216 | Jindal Steel & Power Limited Annual Report 2016-17
Repayments and Interest rates for the above Unsecured Debenture External Commercial Borrowings and Buyer’s Credit are as follows:
` crore
Year 2017-18 2018-19 2019-20 2020-21 & Above Total
Loan 2794.77 655.28 812.38 1,421.58 5,684.03 5,684.03
The interest rate for the above External Commercial Borrowings taken by parent company varies from 0.04% to 1.35% p.a.Loan of ` 2,623.87 crore (March, 2016 ` 2,785.98 crore & 1st April, 2015 ` 2,942.40 crore) carries rate of interest 3.69%p.a
Delay in repayment of borrowings :1. The Parent Company has made certain delay in repayment of Term Loans and interest thereon. The details of continuing delay as at
March 31, 2017 is as follows:
ParticularsAmount
( `in crore) Period of Delay
( in days) Principal repayment 147.45 less than 90 daysInterest payment 300.95 less than 90 days
2. In Jindal Steel Power Mauritius Limited, lenders of USD 150 Mn & 400 Mn facility (‘the facility’) have accelerated the loan and demanded the full outstanding principal along with the due interest in view of delay in payment of interest and due amount of installments and accordingly the outstanding loan amount of ` 3,566.12 crore (at year-end rates) and interest thereon ̀ 193.77 crore has been shown under the head “current liabilities - other financial liabilities”. The Company is in process of restructuring of the facility for elongation of repayment period for another period of 5 years and the negotiation with facility lenders is at advance stage. The Company’s management is confident about favourable outcome in the matter.
3. During the year in Wollongong Coal Limited, the MCB, lender of USD 25 Mn facility (‘the facility’) have accelerated the loan and demanded the full outstanding principal along with the due interest in view of delay in payment of interest and due amount of installments outstanding loan amount of ` 135.09 crore and interest thereon ` 3.15 crore.The Company is under negotiation with the MCB of restructuring of the facility for another period 9 years and the negotiation with facility lenders is at very advance stage. The Company’s management is confident about favourable outcome in the matter.
4. The Jindal Steel & Power Australia has delayed payment of interest in certain cases amount to ` 43.27 crore.
26. Non-current financial liabilities-Trade Payable
` crore
ParticularsAs at
31st March, 2017 As at
31st March, 2016 As at
1st April, 2015Due to other parties 90.88
90.88 - -
27. Non-current financial liabilities-Others
` crore
ParticularsAs at
31st March, 2017 As at
31st March, 2016 As at
1st April, 2015Security Deposits - From others 62.01 93.70 102.91 Capital creditors 237.97 - - Others (refer note 61) 373.23 - -
673.21 93.70 102.91
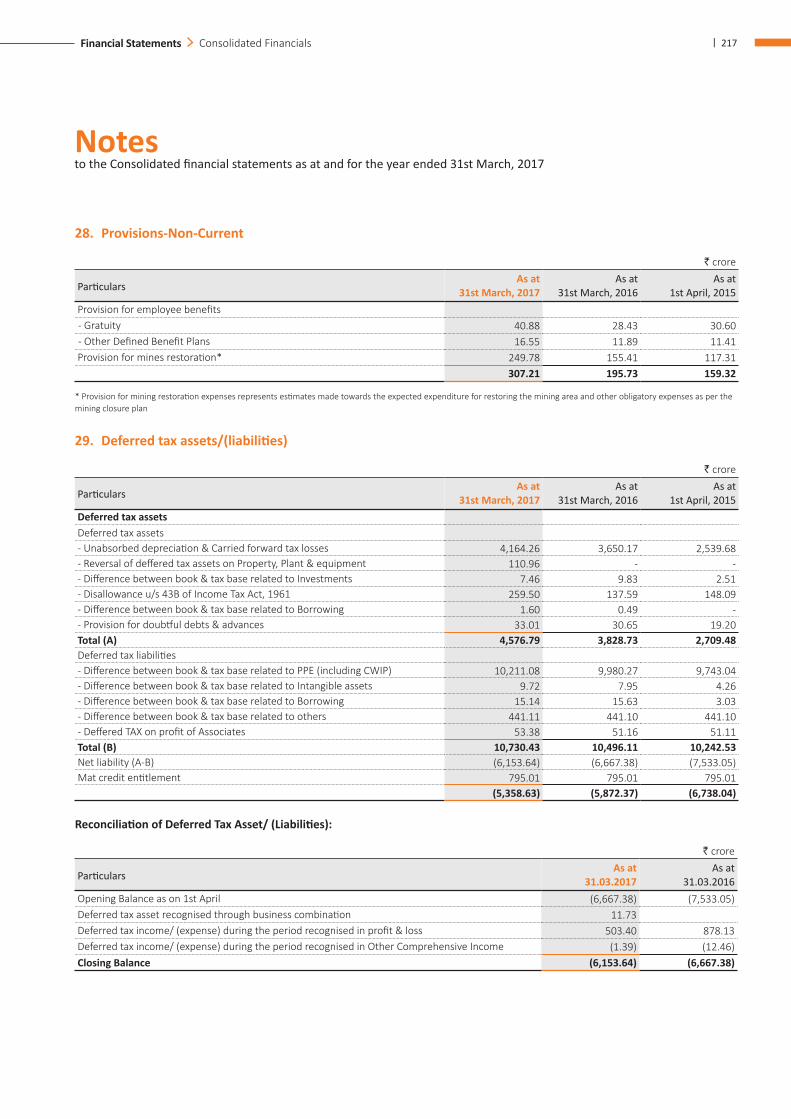
Notes to the Consolidated financial statements as at and for the year ended 31st March, 2017
| 217Financial Statements Consolidated Financials
28. Provisions-Non-Current
` crore
ParticularsAs at
31st March, 2017 As at
31st March, 2016 As at
1st April, 2015Provision for employee benefits - Gratuity 40.88 28.43 30.60 - Other Defined Benefit Plans 16.55 11.89 11.41 Provision for mines restoration* 249.78 155.41 117.31
307.21 195.73 159.32
* Provision for mining restoration expenses represents estimates made towards the expected expenditure for restoring the mining area and other obligatory expenses as per the mining closure plan
29. Deferred tax assets/(liabilities)
` crore
ParticularsAs at
31st March, 2017 As at
31st March, 2016 As at
1st April, 2015Deferred tax assetsDeferred tax assets- Unabsorbed depreciation & Carried forward tax losses 4,164.26 3,650.17 2,539.68 - Reversal of deffered tax assets on Property, Plant & equipment 110.96 - - - Difference between book & tax base related to Investments 7.46 9.83 2.51 - Disallowance u/s 43B of Income Tax Act, 1961 259.50 137.59 148.09 - Difference between book & tax base related to Borrowing 1.60 0.49 - - Provision for doubtful debts & advances 33.01 30.65 19.20 Total (A) 4,576.79 3,828.73 2,709.48 Deferred tax liabilities- Difference between book & tax base related to PPE (including CWIP) 10,211.08 9,980.27 9,743.04 - Difference between book & tax base related to Intangible assets 9.72 7.95 4.26 - Difference between book & tax base related to Borrowing 15.14 15.63 3.03 - Difference between book & tax base related to others 441.11 441.10 441.10 - Deffered TAX on profit of Associates 53.38 51.16 51.11 Total (B) 10,730.43 10,496.11 10,242.53 Net liability (A-B) (6,153.64) (6,667.38) (7,533.05)Mat credit entitlement 795.01 795.01 795.01
(5,358.63) (5,872.37) (6,738.04)
Reconciliation of Deferred Tax Asset/ (Liabilities):
` crore
ParticularsAs at
31.03.2017 As at
31.03.2016 Opening Balance as on 1st April (6,667.38) (7,533.05)Deferred tax asset recognised through business combination 11.73 Deferred tax income/ (expense) during the period recognised in profit & loss 503.40 878.13 Deferred tax income/ (expense) during the period recognised in Other Comprehensive Income (1.39) (12.46)Closing Balance (6,153.64) (6,667.38)
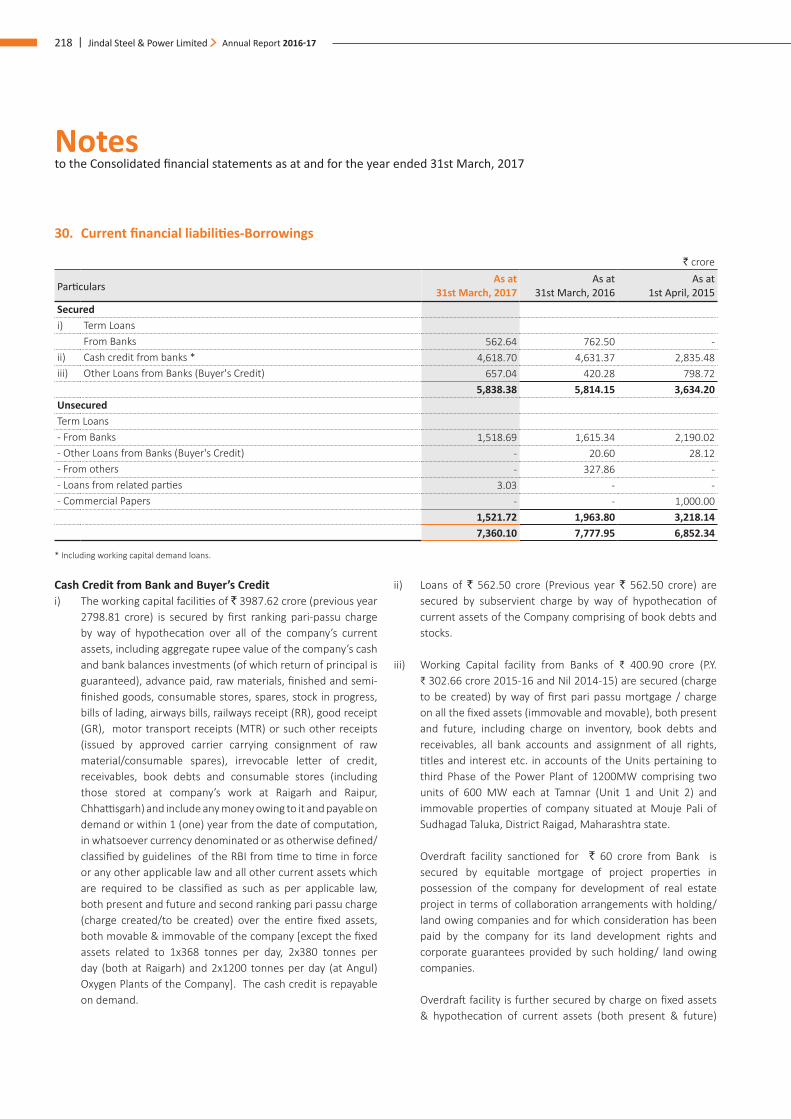
Notes to the Consolidated financial statements as at and for the year ended 31st March, 2017
218 | Jindal Steel & Power Limited Annual Report 2016-17
30. Current financial liabilities-Borrowings
` crore
ParticularsAs at
31st March, 2017 As at
31st March, 2016 As at
1st April, 2015Securedi) Term Loans
From Banks 562.64 762.50 -ii) Cash credit from banks * 4,618.70 4,631.37 2,835.48 iii) Other Loans from Banks (Buyer's Credit) 657.04 420.28 798.72
5,838.38 5,814.15 3,634.20 UnsecuredTerm Loans- From Banks 1,518.69 1,615.34 2,190.02 - Other Loans from Banks (Buyer's Credit) - 20.60 28.12 - From others - 327.86 -- Loans from related parties 3.03 - -- Commercial Papers - - 1,000.00
1,521.72 1,963.80 3,218.14 7,360.10 7,777.95 6,852.34
* Including working capital demand loans.
Cash Credit from Bank and Buyer’s Crediti) The working capital facilities of ` 3987.62 crore (previous year
2798.81 crore) is secured by first ranking pari-passu charge by way of hypothecation over all of the company’s current assets, including aggregate rupee value of the company’s cash and bank balances investments (of which return of principal is guaranteed), advance paid, raw materials, finished and semi-finished goods, consumable stores, spares, stock in progress, bills of lading, airways bills, railways receipt (RR), good receipt (GR), motor transport receipts (MTR) or such other receipts (issued by approved carrier carrying consignment of raw material/consumable spares), irrevocable letter of credit, receivables, book debts and consumable stores (including those stored at company’s work at Raigarh and Raipur, Chhattisgarh) and include any money owing to it and payable on demand or within 1 (one) year from the date of computation, in whatsoever currency denominated or as otherwise defined/classified by guidelines of the RBI from time to time in force or any other applicable law and all other current assets which are required to be classified as such as per applicable law, both present and future and second ranking pari passu charge (charge created/to be created) over the entire fixed assets, both movable & immovable of the company [except the fixed assets related to 1x368 tonnes per day, 2x380 tonnes per day (both at Raigarh) and 2x1200 tonnes per day (at Angul) Oxygen Plants of the Company]. The cash credit is repayable on demand.
ii) Loans of ` 562.50 crore (Previous year ` 562.50 crore) are secured by subservient charge by way of hypothecation of current assets of the Company comprising of book debts and stocks.
iii) Working Capital facility from Banks of ₹ 400.90 crore (P.Y. ₹ 302.66 crore 2015-16 and Nil 2014-15) are secured (charge to be created) by way of first pari passu mortgage / charge on all the fixed assets (immovable and movable), both present and future, including charge on inventory, book debts and receivables, all bank accounts and assignment of all rights, titles and interest etc. in accounts of the Units pertaining to third Phase of the Power Plant of 1200MW comprising two units of 600 MW each at Tamnar (Unit 1 and Unit 2) and immovable properties of company situated at Mouje Pali of Sudhagad Taluka, District Raigad, Maharashtra state.
Overdraft facility sanctioned for ` 60 crore from Bank is secured by equitable mortgage of project properties in possession of the company for development of real estate project in terms of collaboration arrangements with holding/ land owing companies and for which consideration has been paid by the company for its land development rights and corporate guarantees provided by such holding/ land owing companies.
Overdraft facility is further secured by charge on fixed assets & hypothecation of current assets (both present & future)
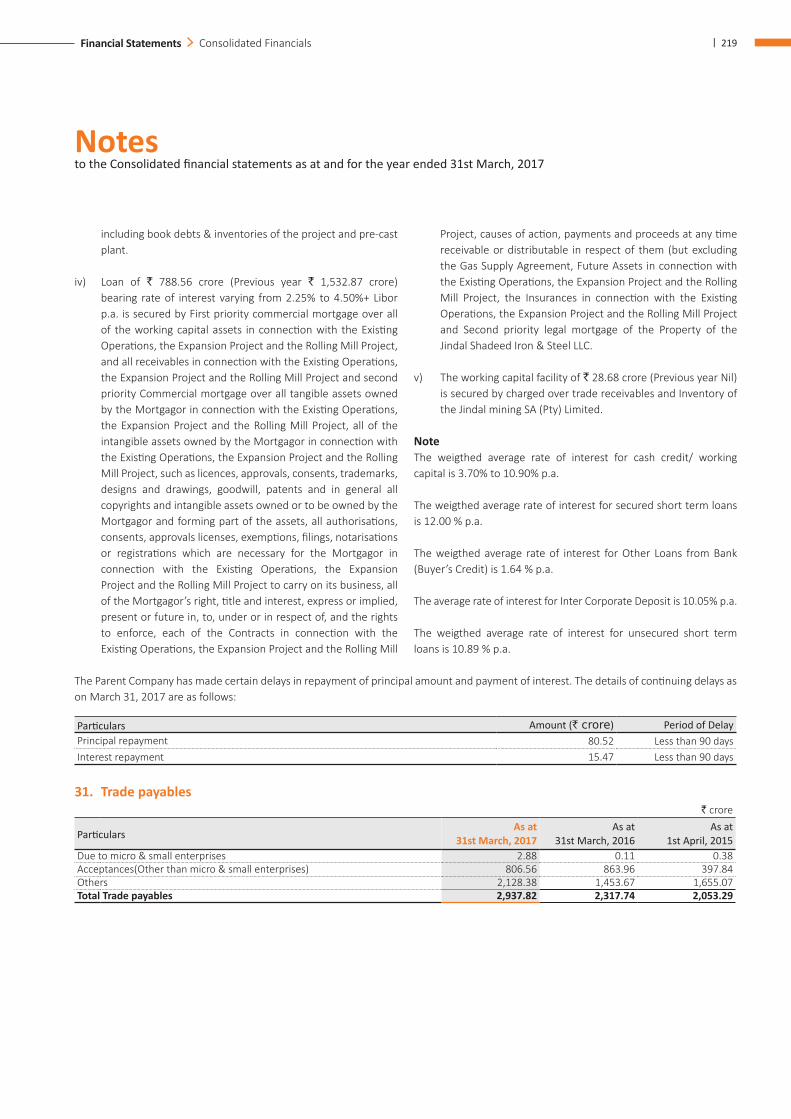
Notes to the Consolidated financial statements as at and for the year ended 31st March, 2017
| 219Financial Statements Consolidated Financials
The Parent Company has made certain delays in repayment of principal amount and payment of interest. The details of continuing delays as on March 31, 2017 are as follows:
Particulars Amount (` crore) Period of Delay Principal repayment 80.52 Less than 90 daysInterest repayment 15.47 Less than 90 days
31. Trade payables ` crore
ParticularsAs at
31st March, 2017 As at
31st March, 2016 As at
1st April, 2015Due to micro & small enterprises 2.88 0.11 0.38 Acceptances(Other than micro & small enterprises) 806.56 863.96 397.84 Others 2,128.38 1,453.67 1,655.07 Total Trade payables 2,937.82 2,317.74 2,053.29
including book debts & inventories of the project and pre-cast plant.
iv) Loan of ` 788.56 crore (Previous year ` 1,532.87 crore) bearing rate of interest varying from 2.25% to 4.50%+ Libor p.a. is secured by First priority commercial mortgage over all of the working capital assets in connection with the Existing Operations, the Expansion Project and the Rolling Mill Project, and all receivables in connection with the Existing Operations, the Expansion Project and the Rolling Mill Project and second priority Commercial mortgage over all tangible assets owned by the Mortgagor in connection with the Existing Operations, the Expansion Project and the Rolling Mill Project, all of the intangible assets owned by the Mortgagor in connection with the Existing Operations, the Expansion Project and the Rolling Mill Project, such as licences, approvals, consents, trademarks, designs and drawings, goodwill, patents and in general all copyrights and intangible assets owned or to be owned by the Mortgagor and forming part of the assets, all authorisations, consents, approvals licenses, exemptions, filings, notarisations or registrations which are necessary for the Mortgagor in connection with the Existing Operations, the Expansion Project and the Rolling Mill Project to carry on its business, all of the Mortgagor’s right, title and interest, express or implied, present or future in, to, under or in respect of, and the rights to enforce, each of the Contracts in connection with the Existing Operations, the Expansion Project and the Rolling Mill
Project, causes of action, payments and proceeds at any time receivable or distributable in respect of them (but excluding the Gas Supply Agreement, Future Assets in connection with the Existing Operations, the Expansion Project and the Rolling Mill Project, the Insurances in connection with the Existing Operations, the Expansion Project and the Rolling Mill Project and Second priority legal mortgage of the Property of the Jindal Shadeed Iron & Steel LLC.
v) The working capital facility of ` 28.68 crore (Previous year Nil) is secured by charged over trade receivables and Inventory of the Jindal mining SA (Pty) Limited.
NoteThe weigthed average rate of interest for cash credit/ working capital is 3.70% to 10.90% p.a.
The weigthed average rate of interest for secured short term loans is 12.00 % p.a.
The weigthed average rate of interest for Other Loans from Bank (Buyer’s Credit) is 1.64 % p.a.
The average rate of interest for Inter Corporate Deposit is 10.05% p.a.
The weigthed average rate of interest for unsecured short term loans is 10.89 % p.a.
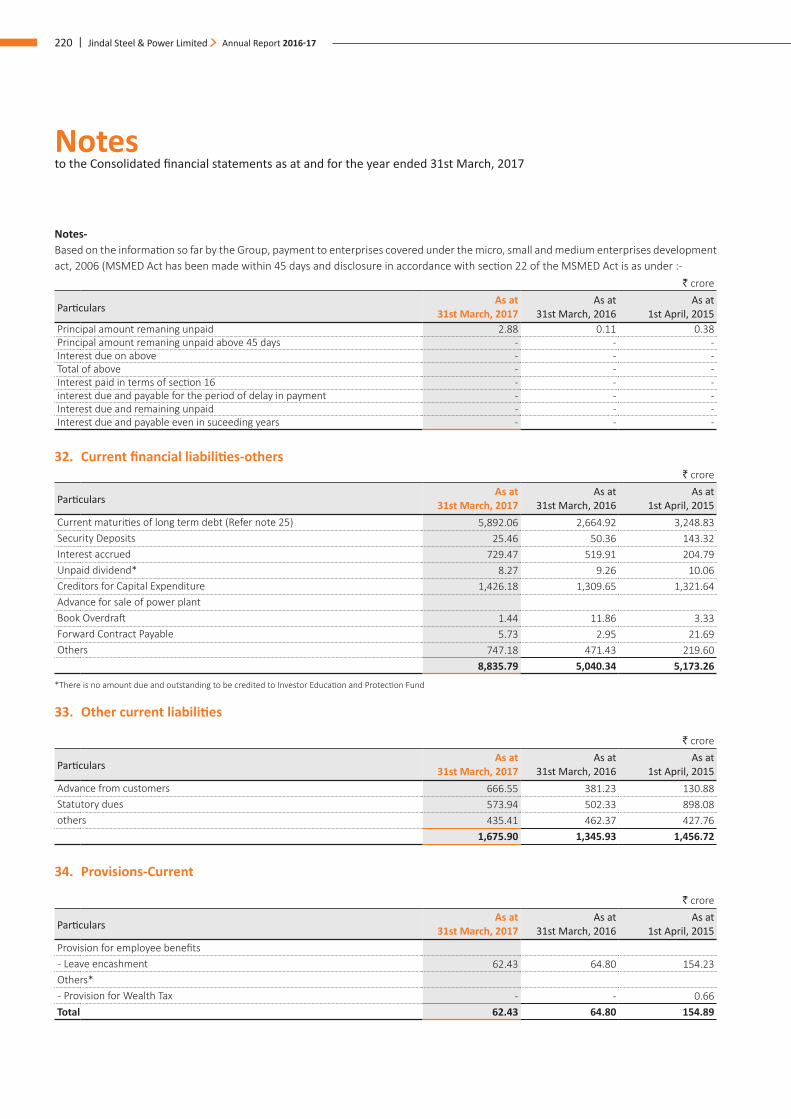
Notes to the Consolidated financial statements as at and for the year ended 31st March, 2017
220 | Jindal Steel & Power Limited Annual Report 2016-17
Notes- Based on the information so far by the Group, payment to enterprises covered under the micro, small and medium enterprises development act, 2006 (MSMED Act has been made within 45 days and disclosure in accordance with section 22 of the MSMED Act is as under :-
` crore
ParticularsAs at
31st March, 2017 As at
31st March, 2016 As at
1st April, 2015Principal amount remaning unpaid 2.88 0.11 0.38 Principal amount remaning unpaid above 45 days - - - Interest due on above - - - Total of above - - - Interest paid in terms of section 16 - - - interest due and payable for the period of delay in payment - - - Interest due and remaining unpaid - - - Interest due and payable even in suceeding years - - -
32. Current financial liabilities-others ` crore
ParticularsAs at
31st March, 2017 As at
31st March, 2016 As at
1st April, 2015Current maturities of long term debt (Refer note 25) 5,892.06 2,664.92 3,248.83 Security Deposits 25.46 50.36 143.32 Interest accrued 729.47 519.91 204.79 Unpaid dividend* 8.27 9.26 10.06 Creditors for Capital Expenditure 1,426.18 1,309.65 1,321.64 Advance for sale of power plantBook Overdraft 1.44 11.86 3.33 Forward Contract Payable 5.73 2.95 21.69 Others 747.18 471.43 219.60
8,835.79 5,040.34 5,173.26
*There is no amount due and outstanding to be credited to Investor Education and Protection Fund
33. Other current liabilities
` crore
ParticularsAs at
31st March, 2017 As at
31st March, 2016 As at
1st April, 2015Advance from customers 666.55 381.23 130.88 Statutory dues 573.94 502.33 898.08 others 435.41 462.37 427.76
1,675.90 1,345.93 1,456.72
34. Provisions-Current
` crore
ParticularsAs at
31st March, 2017 As at
31st March, 2016 As at
1st April, 2015Provision for employee benefits - Leave encashment 62.43 64.80 154.23 Others* - Provision for Wealth Tax - - 0.66 Total 62.43 64.80 154.89
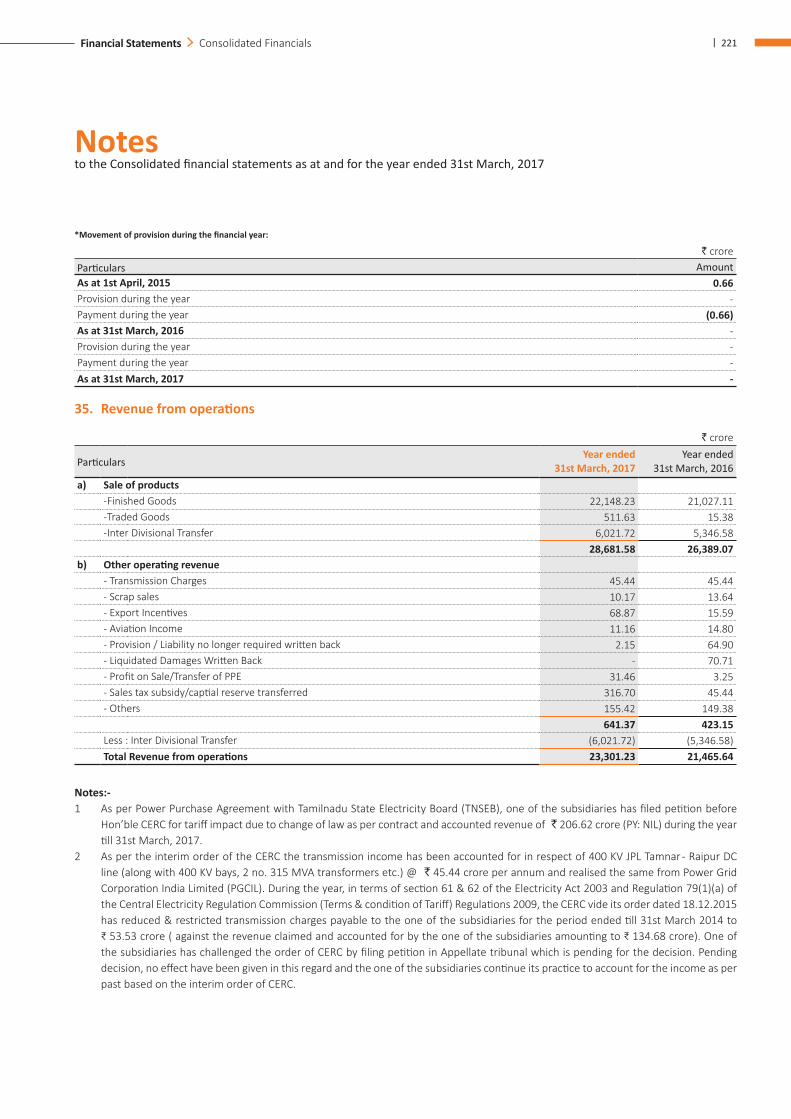
Notes to the Consolidated financial statements as at and for the year ended 31st March, 2017
| 221Financial Statements Consolidated Financials
*Movement of provision during the financial year:
` croreParticulars AmountAs at 1st April, 2015 0.66 Provision during the year - Payment during the year (0.66)As at 31st March, 2016 - Provision during the year - Payment during the year - As at 31st March, 2017 -
35. Revenue from operations
` crore
ParticularsYear ended
31st March, 2017 Year ended
31st March, 2016 a) Sale of products
-Finished Goods 22,148.23 21,027.11 -Traded Goods 511.63 15.38 -Inter Divisional Transfer 6,021.72 5,346.58
28,681.58 26,389.07 b) Other operating revenue
- Transmission Charges 45.44 45.44 - Scrap sales 10.17 13.64 - Export Incentives 68.87 15.59 - Aviation Income 11.16 14.80 - Provision / Liability no longer required written back 2.15 64.90 - Liquidated Damages Written Back - 70.71 - Profit on Sale/Transfer of PPE 31.46 3.25 - Sales tax subsidy/captial reserve transferred 316.70 45.44 - Others 155.42 149.38
641.37 423.15 Less : Inter Divisional Transfer (6,021.72) (5,346.58)Total Revenue from operations 23,301.23 21,465.64
Notes:- 1 As per Power Purchase Agreement with Tamilnadu State Electricity Board (TNSEB), one of the subsidiaries has filed petition before
Hon’ble CERC for tariff impact due to change of law as per contract and accounted revenue of ` 206.62 crore (PY: NIL) during the year till 31st March, 2017.
2 As per the interim order of the CERC the transmission income has been accounted for in respect of 400 KV JPL Tamnar - Raipur DC line (along with 400 KV bays, 2 no. 315 MVA transformers etc.) @ ` 45.44 crore per annum and realised the same from Power Grid Corporation India Limited (PGCIL). During the year, in terms of section 61 & 62 of the Electricity Act 2003 and Regulation 79(1)(a) of the Central Electricity Regulation Commission (Terms & condition of Tariff) Regulations 2009, the CERC vide its order dated 18.12.2015 has reduced & restricted transmission charges payable to the one of the subsidiaries for the period ended till 31st March 2014 to ₹ 53.53 crore ( against the revenue claimed and accounted for by the one of the subsidiaries amounting to ₹ 134.68 crore). One of the subsidiaries has challenged the order of CERC by filing petition in Appellate tribunal which is pending for the decision. Pending decision, no effect have been given in this regard and the one of the subsidiaries continue its practice to account for the income as per past based on the interim order of CERC.
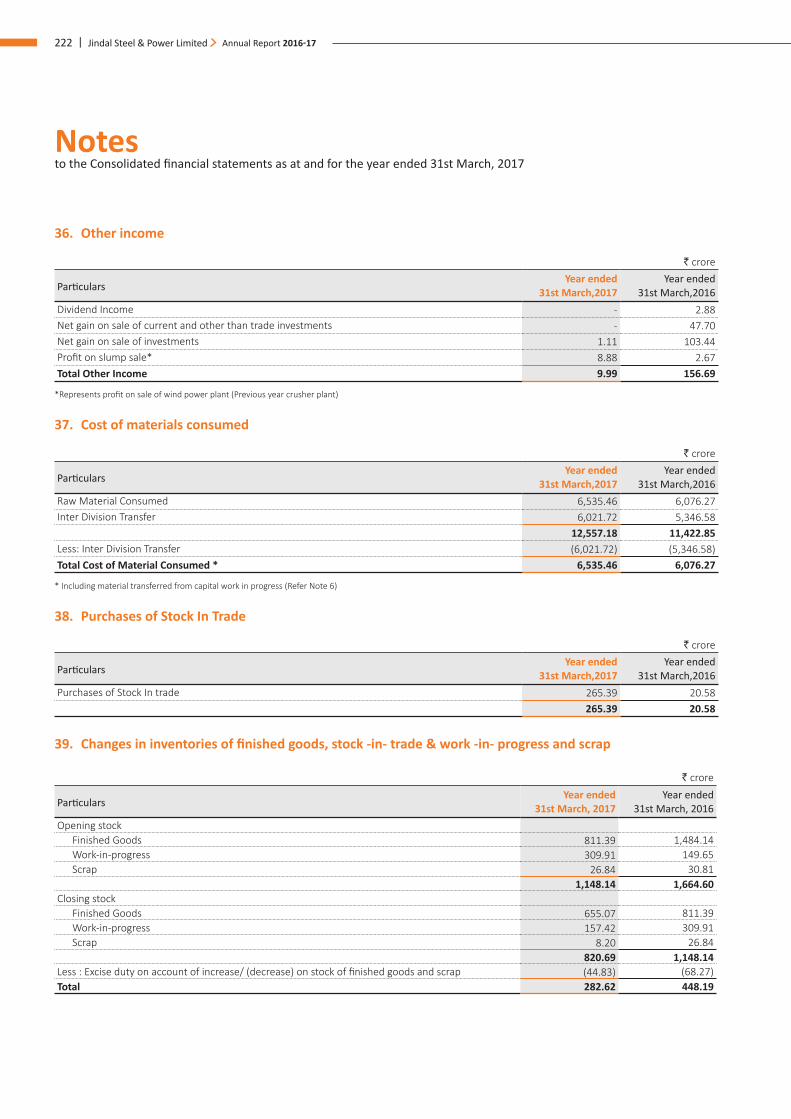
Notes to the Consolidated financial statements as at and for the year ended 31st March, 2017
222 | Jindal Steel & Power Limited Annual Report 2016-17
36. Other income
` crore
ParticularsYear ended
31st March,2017 Year ended
31st March,2016 Dividend Income - 2.88Net gain on sale of current and other than trade investments - 47.70 Net gain on sale of investments 1.11 103.44 Profit on slump sale* 8.88 2.67 Total Other Income 9.99 156.69
*Represents profit on sale of wind power plant (Previous year crusher plant)
37. Cost of materials consumed
` crore
ParticularsYear ended
31st March,2017 Year ended
31st March,2016 Raw Material Consumed 6,535.46 6,076.27 Inter Division Transfer 6,021.72 5,346.58
12,557.18 11,422.85 Less: Inter Division Transfer (6,021.72) (5,346.58)Total Cost of Material Consumed * 6,535.46 6,076.27
* Including material transferred from capital work in progress (Refer Note 6)
38. Purchases of Stock In Trade
` crore
ParticularsYear ended
31st March,2017 Year ended
31st March,2016 Purchases of Stock In trade 265.39 20.58
265.39 20.58
39. Changes in inventories of finished goods, stock -in- trade & work -in- progress and scrap
` crore
ParticularsYear ended
31st March, 2017 Year ended
31st March, 2016 Opening stock
Finished Goods 811.39 1,484.14 Work-in-progress 309.91 149.65 Scrap 26.84 30.81
1,148.14 1,664.60 Closing stock
Finished Goods 655.07 811.39 Work-in-progress 157.42 309.91 Scrap 8.20 26.84
820.69 1,148.14 Less : Excise duty on account of increase/ (decrease) on stock of finished goods and scrap (44.83) (68.27)Total 282.62 448.19
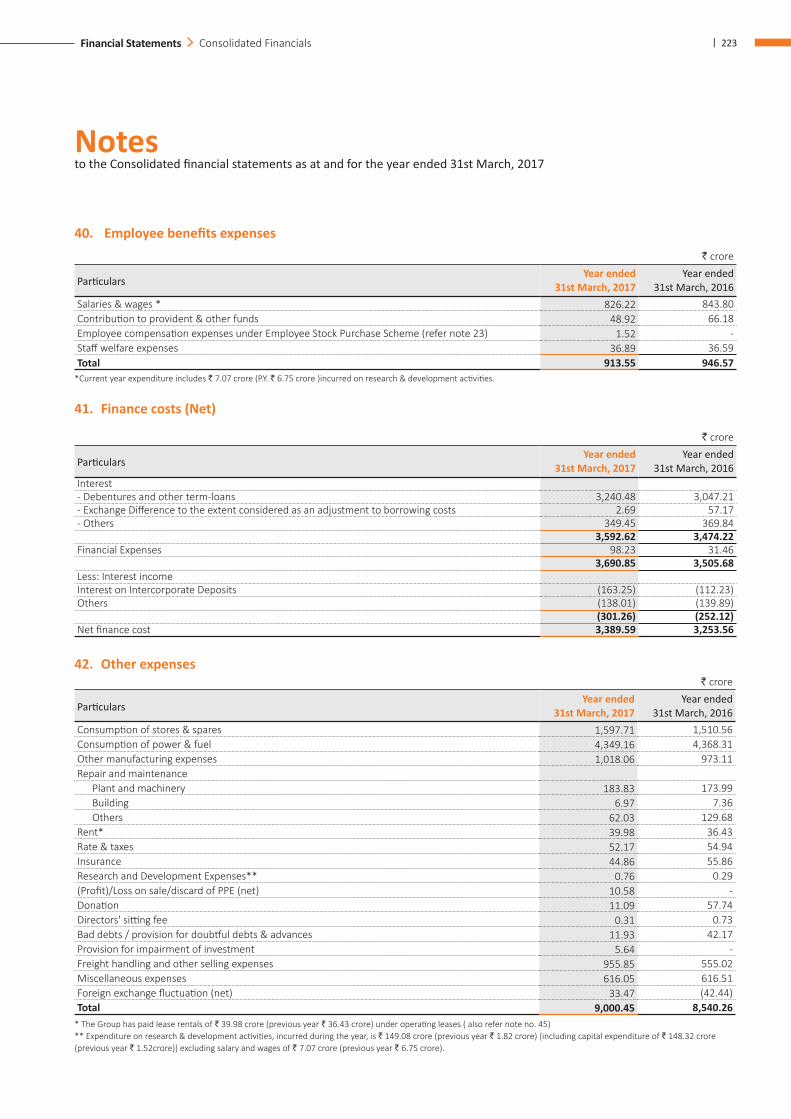
Notes to the Consolidated financial statements as at and for the year ended 31st March, 2017
| 223Financial Statements Consolidated Financials
40. Employee benefits expenses` crore
ParticularsYear ended
31st March, 2017 Year ended
31st March, 2016 Salaries & wages * 826.22 843.80 Contribution to provident & other funds 48.92 66.18 Employee compensation expenses under Employee Stock Purchase Scheme (refer note 23) 1.52 - Staff welfare expenses 36.89 36.59 Total 913.55 946.57
*Current year expenditure includes ` 7.07 crore (P.Y. ` 6.75 crore )incurred on research & development activities.
41. Finance costs (Net)
` crore
ParticularsYear ended
31st March, 2017 Year ended
31st March, 2016 Interest- Debentures and other term-loans 3,240.48 3,047.21 - Exchange Difference to the extent considered as an adjustment to borrowing costs 2.69 57.17 - Others 349.45 369.84
3,592.62 3,474.22 Financial Expenses 98.23 31.46
3,690.85 3,505.68 Less: Interest incomeInterest on Intercorporate Deposits (163.25) (112.23)Others (138.01) (139.89)
(301.26) (252.12)Net finance cost 3,389.59 3,253.56
42. Other expenses` crore
ParticularsYear ended
31st March, 2017 Year ended
31st March, 2016 Consumption of stores & spares 1,597.71 1,510.56 Consumption of power & fuel 4,349.16 4,368.31 Other manufacturing expenses 1,018.06 973.11 Repair and maintenance
Plant and machinery 183.83 173.99 Building 6.97 7.36 Others 62.03 129.68
Rent* 39.98 36.43 Rate & taxes 52.17 54.94 Insurance 44.86 55.86 Research and Development Expenses** 0.76 0.29 (Profit)/Loss on sale/discard of PPE (net) 10.58 - Donation 11.09 57.74 Directors' sitting fee 0.31 0.73 Bad debts / provision for doubtful debts & advances 11.93 42.17 Provision for impairment of investment 5.64 - Freight handling and other selling expenses 955.85 555.02 Miscellaneous expenses 616.05 616.51 Foreign exchange fluctuation (net) 33.47 (42.44)Total 9,000.45 8,540.26
* The Group has paid lease rentals of ` 39.98 crore (previous year ` 36.43 crore) under operating leases ( also refer note no. 45)** Expenditure on research & development activities, incurred during the year, is ` 149.08 crore (previous year ` 1.82 crore) {including capital expenditure of ` 148.32 crore (previous year ` 1.52crore)} excluding salary and wages of ` 7.07 crore (previous year ` 6.75 crore).
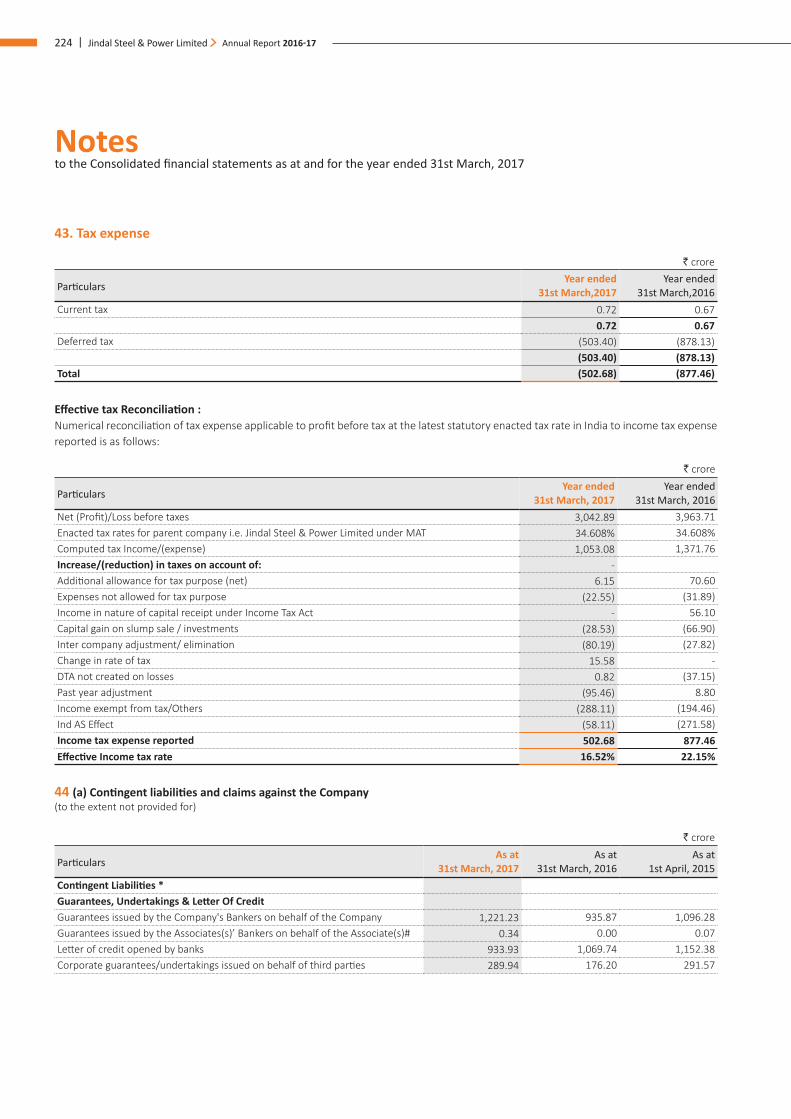
Notes to the Consolidated financial statements as at and for the year ended 31st March, 2017
224 | Jindal Steel & Power Limited Annual Report 2016-17
43. Tax expense
` crore
ParticularsYear ended
31st March,2017 Year ended
31st March,2016 Current tax 0.72 0.67
0.72 0.67 Deferred tax (503.40) (878.13)
(503.40) (878.13)Total (502.68) (877.46)
Effective tax Reconciliation : Numerical reconciliation of tax expense applicable to profit before tax at the latest statutory enacted tax rate in India to income tax expense reported is as follows:
` crore
ParticularsYear ended
31st March, 2017 Year ended
31st March, 2016 Net (Profit)/Loss before taxes 3,042.89 3,963.71 Enacted tax rates for parent company i.e. Jindal Steel & Power Limited under MAT 34.608% 34.608%Computed tax Income/(expense) 1,053.08 1,371.76 Increase/(reduction) in taxes on account of: - Additional allowance for tax purpose (net) 6.15 70.60 Expenses not allowed for tax purpose (22.55) (31.89)Income in nature of capital receipt under Income Tax Act - 56.10 Capital gain on slump sale / investments (28.53) (66.90)Inter company adjustment/ elimination (80.19) (27.82)Change in rate of tax 15.58 - DTA not created on losses 0.82 (37.15)Past year adjustment (95.46) 8.80 Income exempt from tax/Others (288.11) (194.46)Ind AS Effect (58.11) (271.58)Income tax expense reported 502.68 877.46 Effective Income tax rate 16.52% 22.15%
44 (a) Contingent liabilities and claims against the Company (to the extent not provided for)
` crore
ParticularsAs at
31st March, 2017 As at
31st March, 2016 As at
1st April, 2015Contingent Liabilities *Guarantees, Undertakings & Letter Of CreditGuarantees issued by the Company's Bankers on behalf of the Company 1,221.23 935.87 1,096.28 Guarantees issued by the Associates(s)’ Bankers on behalf of the Associate(s)# 0.34 0.00 0.07 Letter of credit opened by banks 933.93 1,069.74 1,152.38 Corporate guarantees/undertakings issued on behalf of third parties 289.94 176.20 291.57
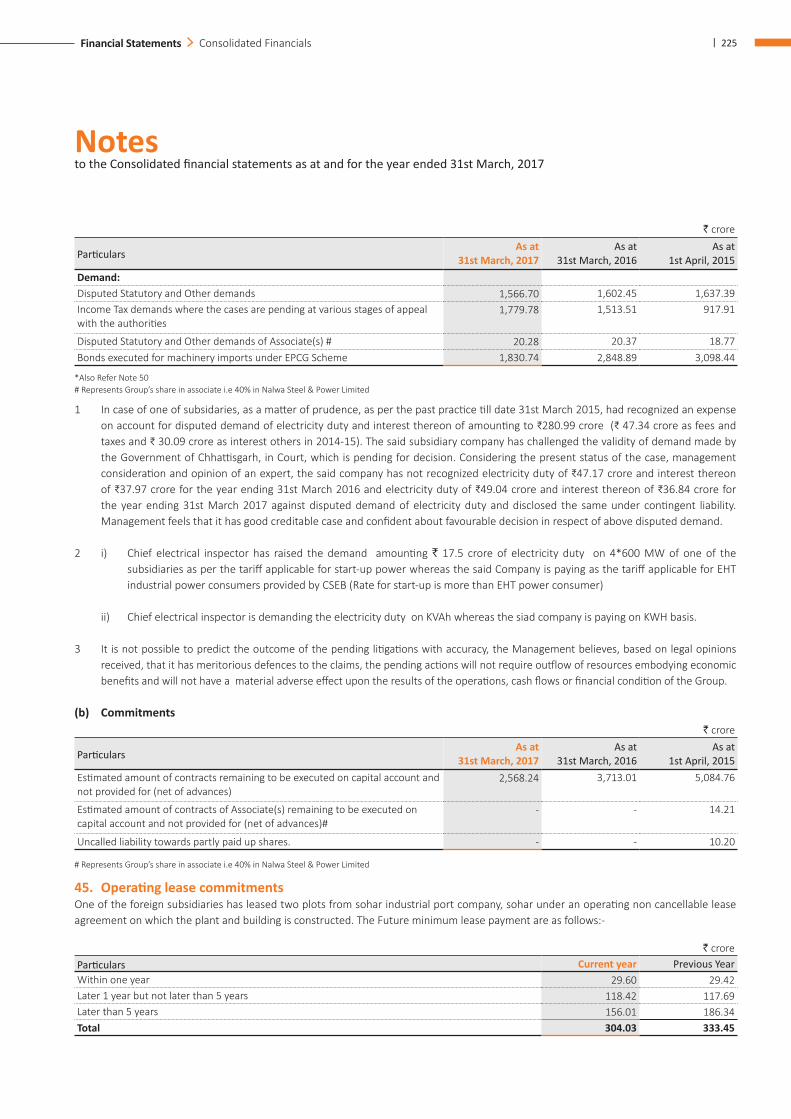
Notes to the Consolidated financial statements as at and for the year ended 31st March, 2017
| 225Financial Statements Consolidated Financials
` crore
ParticularsAs at
31st March, 2017 As at
31st March, 2016 As at
1st April, 2015Demand:Disputed Statutory and Other demands 1,566.70 1,602.45 1,637.39 Income Tax demands where the cases are pending at various stages of appeal with the authorities
1,779.78 1,513.51 917.91
Disputed Statutory and Other demands of Associate(s) # 20.28 20.37 18.77 Bonds executed for machinery imports under EPCG Scheme 1,830.74 2,848.89 3,098.44
*Also Refer Note 50 # Represents Group’s share in associate i.e 40% in Nalwa Steel & Power Limited
1 In case of one of subsidaries, as a matter of prudence, as per the past practice till date 31st March 2015, had recognized an expense on account for disputed demand of electricity duty and interest thereon of amounting to ₹280.99 crore (₹ 47.34 crore as fees and taxes and ₹ 30.09 crore as interest others in 2014-15). The said subsidiary company has challenged the validity of demand made by the Government of Chhattisgarh, in Court, which is pending for decision. Considering the present status of the case, management consideration and opinion of an expert, the said company has not recognized electricity duty of ₹47.17 crore and interest thereon of ₹37.97 crore for the year ending 31st March 2016 and electricity duty of ₹49.04 crore and interest thereon of ₹36.84 crore for the year ending 31st March 2017 against disputed demand of electricity duty and disclosed the same under contingent liability. Management feels that it has good creditable case and confident about favourable decision in respect of above disputed demand.
2 i) Chief electrical inspector has raised the demand amounting ` 17.5 crore of electricity duty on 4*600 MW of one of the subsidiaries as per the tariff applicable for start-up power whereas the said Company is paying as the tariff applicable for EHT industrial power consumers provided by CSEB (Rate for start-up is more than EHT power consumer)
ii) Chief electrical inspector is demanding the electricity duty on KVAh whereas the siad company is paying on KWH basis.
3 It is not possible to predict the outcome of the pending litigations with accuracy, the Management believes, based on legal opinions received, that it has meritorious defences to the claims, the pending actions will not require outflow of resources embodying economic benefits and will not have a material adverse effect upon the results of the operations, cash flows or financial condition of the Group.
(b) Commitments` crore
ParticularsAs at
31st March, 2017 As at
31st March, 2016 As at
1st April, 2015Estimated amount of contracts remaining to be executed on capital account and not provided for (net of advances)
2,568.24 3,713.01 5,084.76
Estimated amount of contracts of Associate(s) remaining to be executed on capital account and not provided for (net of advances)#
- - 14.21
Uncalled liability towards partly paid up shares. - - 10.20
# Represents Group’s share in associate i.e 40% in Nalwa Steel & Power Limited
45. Operating lease commitmentsOne of the foreign subsidiaries has leased two plots from sohar industrial port company, sohar under an operating non cancellable lease agreement on which the plant and building is constructed. The Future minimum lease payment are as follows:-
` croreParticulars Current year Previous Year Within one year 29.60 29.42 Later 1 year but not later than 5 years 118.42 117.69 Later than 5 years 156.01 186.34 Total 304.03 333.45
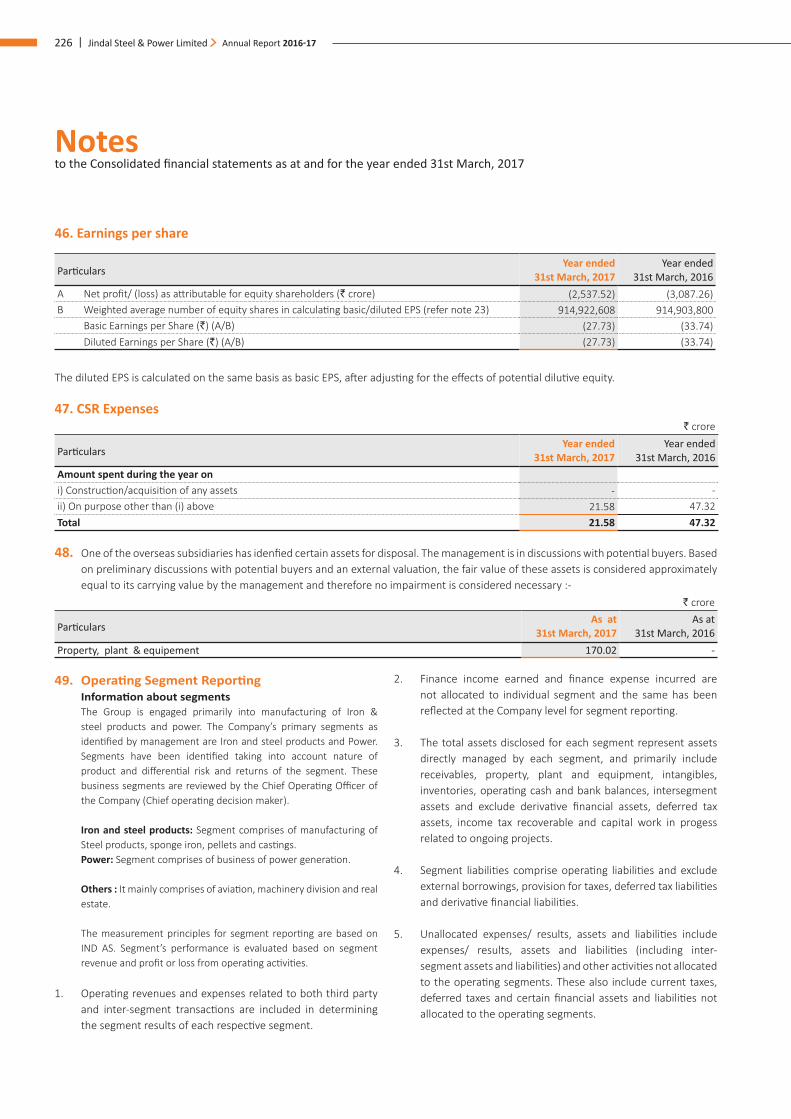
Notes to the Consolidated financial statements as at and for the year ended 31st March, 2017
226 | Jindal Steel & Power Limited Annual Report 2016-17
49. Operating Segment Reporting Information about segments The Group is engaged primarily into manufacturing of Iron &
steel products and power. The Company’s primary segments as identified by management are Iron and steel products and Power. Segments have been identified taking into account nature of product and differential risk and returns of the segment. These business segments are reviewed by the Chief Operating Officer of the Company (Chief operating decision maker).
Iron and steel products: Segment comprises of manufacturing of Steel products, sponge iron, pellets and castings.
Power: Segment comprises of business of power generation.
Others : It mainly comprises of aviation, machinery division and real estate.
The measurement principles for segment reporting are based on IND AS. Segment’s performance is evaluated based on segment revenue and profit or loss from operating activities.
1. Operating revenues and expenses related to both third party and inter-segment transactions are included in determining the segment results of each respective segment.
2. Finance income earned and finance expense incurred are not allocated to individual segment and the same has been reflected at the Company level for segment reporting.
3. The total assets disclosed for each segment represent assets directly managed by each segment, and primarily include receivables, property, plant and equipment, intangibles, inventories, operating cash and bank balances, intersegment assets and exclude derivative financial assets, deferred tax assets, income tax recoverable and capital work in progess related to ongoing projects.
4. Segment liabilities comprise operating liabilities and exclude external borrowings, provision for taxes, deferred tax liabilities and derivative financial liabilities.
5. Unallocated expenses/ results, assets and liabilities include expenses/ results, assets and liabilities (including inter-segment assets and liabilities) and other activities not allocated to the operating segments. These also include current taxes, deferred taxes and certain financial assets and liabilities not allocated to the operating segments.
46. Earnings per share
ParticularsYear ended
31st March, 2017 Year ended
31st March, 2016 A Net profit/ (loss) as attributable for equity shareholders (` crore) (2,537.52) (3,087.26)B Weighted average number of equity shares in calculating basic/diluted EPS (refer note 23) 914,922,608 914,903,800 Basic Earnings per Share (`) (A/B) (27.73) (33.74) Diluted Earnings per Share (`) (A/B) (27.73) (33.74)
The diluted EPS is calculated on the same basis as basic EPS, after adjusting for the effects of potential dilutive equity.
47. CSR Expenses` crore
ParticularsYear ended
31st March, 2017 Year ended
31st March, 2016 Amount spent during the year on i) Construction/acquisition of any assets - - ii) On purpose other than (i) above 21.58 47.32 Total 21.58 47.32
48. One of the overseas subsidiaries has idenfied certain assets for disposal. The management is in discussions with potential buyers. Based on preliminary discussions with potential buyers and an external valuation, the fair value of these assets is considered approximately equal to its carrying value by the management and therefore no impairment is considered necessary :-
` crore
ParticularsAs at
31st March, 2017 As at
31st March, 2016 Property, plant & equipement 170.02 -
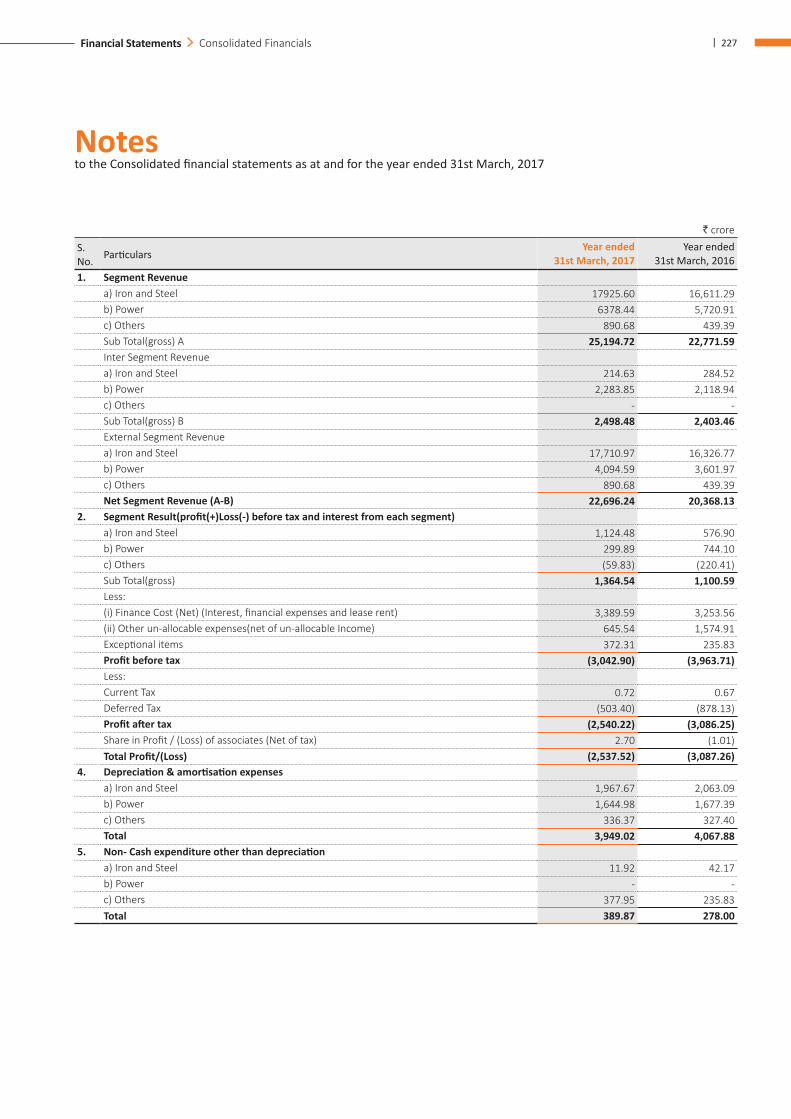
Notes to the Consolidated financial statements as at and for the year ended 31st March, 2017
| 227Financial Statements Consolidated Financials
` crore
S. No. Particulars
Year ended 31st March, 2017
Year ended 31st March, 2016
1. Segment Revenuea) Iron and Steel 17925.60 16,611.29 b) Power 6378.44 5,720.91 c) Others 890.68 439.39 Sub Total(gross) A 25,194.72 22,771.59 Inter Segment Revenuea) Iron and Steel 214.63 284.52 b) Power 2,283.85 2,118.94 c) Others - -Sub Total(gross) B 2,498.48 2,403.46 External Segment Revenuea) Iron and Steel 17,710.97 16,326.77 b) Power 4,094.59 3,601.97 c) Others 890.68 439.39 Net Segment Revenue (A-B) 22,696.24 20,368.13
2. Segment Result(profit(+)Loss(-) before tax and interest from each segment)a) Iron and Steel 1,124.48 576.90 b) Power 299.89 744.10 c) Others (59.83) (220.41) Sub Total(gross) 1,364.54 1,100.59 Less: (i) Finance Cost (Net) (Interest, financial expenses and lease rent) 3,389.59 3,253.56 (ii) Other un-allocable expenses(net of un-allocable Income) 645.54 1,574.91 Exceptional items 372.31 235.83 Profit before tax (3,042.90) (3,963.71) Less: Current Tax 0.72 0.67 Deferred Tax (503.40) (878.13) Profit after tax (2,540.22) (3,086.25) Share in Profit / (Loss) of associates (Net of tax) 2.70 (1.01)Total Profit/(Loss) (2,537.52) (3,087.26)
4. Depreciation & amortisation expensesa) Iron and Steel 1,967.67 2,063.09 b) Power 1,644.98 1,677.39 c) Others 336.37 327.40 Total 3,949.02 4,067.88
5. Non- Cash expenditure other than depreciationa) Iron and Steel 11.92 42.17 b) Power - - c) Others 377.95 235.83 Total 389.87 278.00
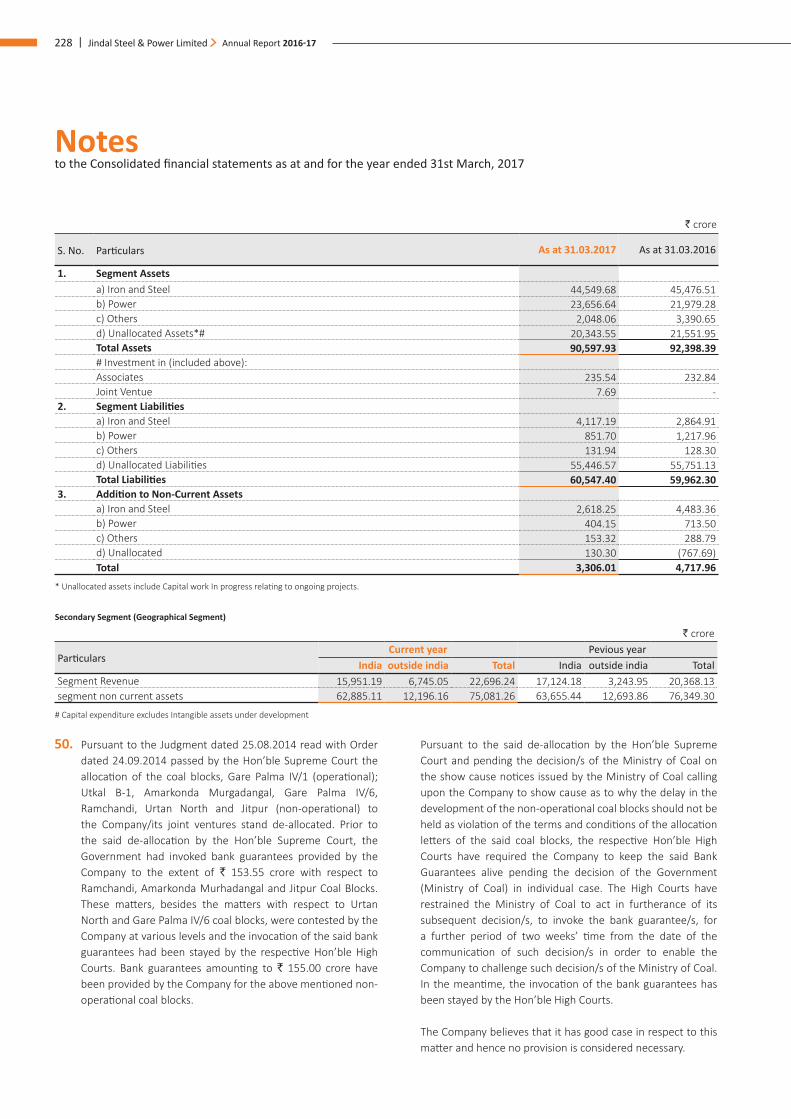
Notes to the Consolidated financial statements as at and for the year ended 31st March, 2017
228 | Jindal Steel & Power Limited Annual Report 2016-17
` crore
S. No. Particulars As at 31.03.2017 As at 31.03.2016
1. Segment Assetsa) Iron and Steel 44,549.68 45,476.51 b) Power 23,656.64 21,979.28 c) Others 2,048.06 3,390.65 d) Unallocated Assets*# 20,343.55 21,551.95 Total Assets 90,597.93 92,398.39 # Investment in (included above):Associates 235.54 232.84 Joint Ventue 7.69 -
2. Segment Liabilitiesa) Iron and Steel 4,117.19 2,864.91 b) Power 851.70 1,217.96 c) Others 131.94 128.30 d) Unallocated Liabilities 55,446.57 55,751.13 Total Liabilities 60,547.40 59,962.30
3. Addition to Non-Current Assetsa) Iron and Steel 2,618.25 4,483.36 b) Power 404.15 713.50 c) Others 153.32 288.79 d) Unallocated 130.30 (767.69)Total 3,306.01 4,717.96
* Unallocated assets include Capital work In progress relating to ongoing projects.
Secondary Segment (Geographical Segment)
` crore
ParticularsCurrent year Pevious year
India outside india Total India outside india TotalSegment Revenue 15,951.19 6,745.05 22,696.24 17,124.18 3,243.95 20,368.13 segment non current assets 62,885.11 12,196.16 75,081.26 63,655.44 12,693.86 76,349.30
# Capital expenditure excludes Intangible assets under development
50. Pursuant to the Judgment dated 25.08.2014 read with Order dated 24.09.2014 passed by the Hon’ble Supreme Court the allocation of the coal blocks, Gare Palma IV/1 (operational); Utkal B-1, Amarkonda Murgadangal, Gare Palma IV/6, Ramchandi, Urtan North and Jitpur (non-operational) to the Company/its joint ventures stand de-allocated. Prior to the said de-allocation by the Hon’ble Supreme Court, the Government had invoked bank guarantees provided by the Company to the extent of ` 153.55 crore with respect to Ramchandi, Amarkonda Murhadangal and Jitpur Coal Blocks. These matters, besides the matters with respect to Urtan North and Gare Palma IV/6 coal blocks, were contested by the Company at various levels and the invocation of the said bank guarantees had been stayed by the respective Hon’ble High Courts. Bank guarantees amounting to ` 155.00 crore have been provided by the Company for the above mentioned non- operational coal blocks.
Pursuant to the said de-allocation by the Hon’ble Supreme Court and pending the decision/s of the Ministry of Coal on the show cause notices issued by the Ministry of Coal calling upon the Company to show cause as to why the delay in the development of the non-operational coal blocks should not be held as violation of the terms and conditions of the allocation letters of the said coal blocks, the respective Hon’ble High Courts have required the Company to keep the said Bank Guarantees alive pending the decision of the Government (Ministry of Coal) in individual case. The High Courts have restrained the Ministry of Coal to act in furtherance of its subsequent decision/s, to invoke the bank guarantee/s, for a further period of two weeks’ time from the date of the communication of such decision/s in order to enable the Company to challenge such decision/s of the Ministry of Coal. In the meantime, the invocation of the bank guarantees has been stayed by the Hon’ble High Courts.
The Company believes that it has good case in respect to this matter and hence no provision is considered necessary.
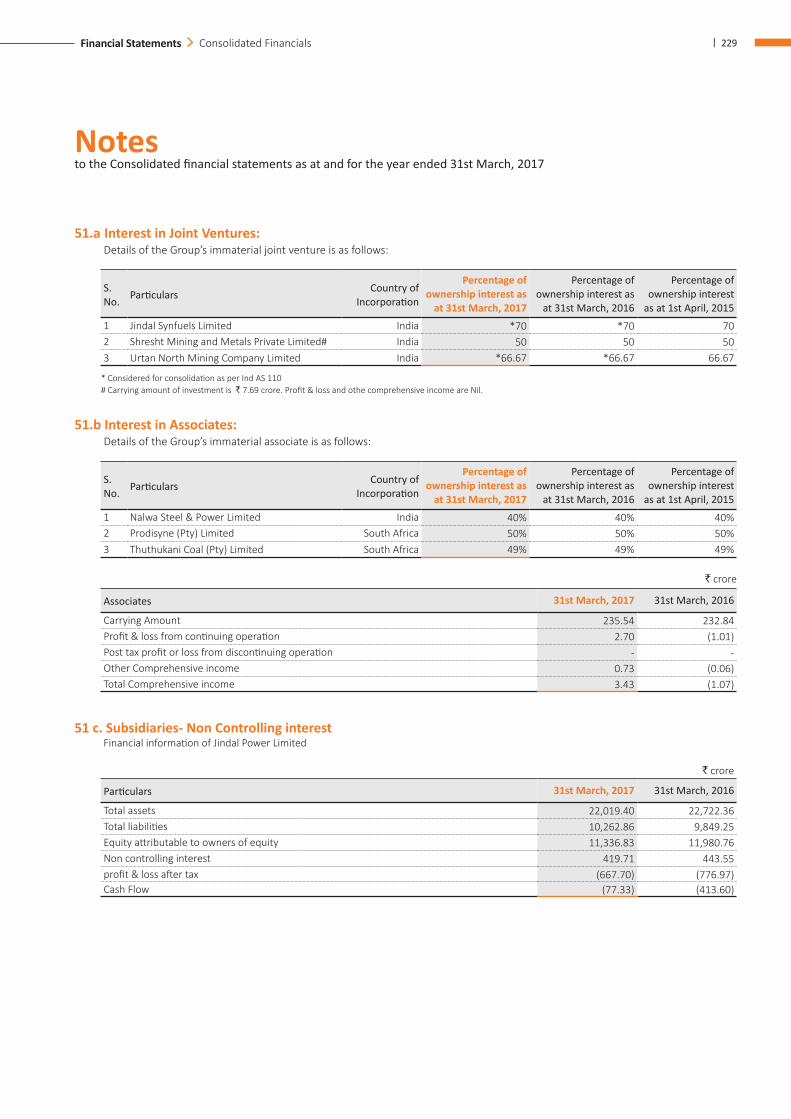
Notes to the Consolidated financial statements as at and for the year ended 31st March, 2017
| 229Financial Statements Consolidated Financials
51.a Interest in Joint Ventures: Details of the Group’s immaterial joint venture is as follows:
S. No. Particulars Country of
Incorporation
Percentage of ownership interest as
at 31st March, 2017
Percentage of ownership interest as
at 31st March, 2016
Percentage of ownership interest
as at 1st April, 20151 Jindal Synfuels Limited India *70 *70 702 Shresht Mining and Metals Private Limited# India 50 50 503 Urtan North Mining Company Limited India *66.67 *66.67 66.67
* Considered for consolidation as per Ind AS 110 # Carrying amount of investment is ` 7.69 crore. Profit & loss and othe comprehensive income are Nil.
51.b Interest in Associates: Details of the Group’s immaterial associate is as follows:
S. No. Particulars Country of
Incorporation
Percentage of ownership interest as
at 31st March, 2017
Percentage of ownership interest as
at 31st March, 2016
Percentage of ownership interest
as at 1st April, 20151 Nalwa Steel & Power Limited India 40% 40% 40%2 Prodisyne (Pty) Limited South Africa 50% 50% 50%3 Thuthukani Coal (Pty) Limited South Africa 49% 49% 49%
` crore
Associates 31st March, 2017 31st March, 2016
Carrying Amount 235.54 232.84 Profit & loss from continuing operation 2.70 (1.01)Post tax profit or loss from discontinuing operation - - Other Comprehensive income 0.73 (0.06)Total Comprehensive income 3.43 (1.07)
51 c. Subsidiaries- Non Controlling interest Financial information of Jindal Power Limited
` crore
Particulars 31st March, 2017 31st March, 2016
Total assets 22,019.40 22,722.36 Total liabilities 10,262.86 9,849.25 Equity attributable to owners of equity 11,336.83 11,980.76 Non controlling interest 419.71 443.55 profit & loss after tax (667.70) (776.97)Cash Flow (77.33) (413.60)
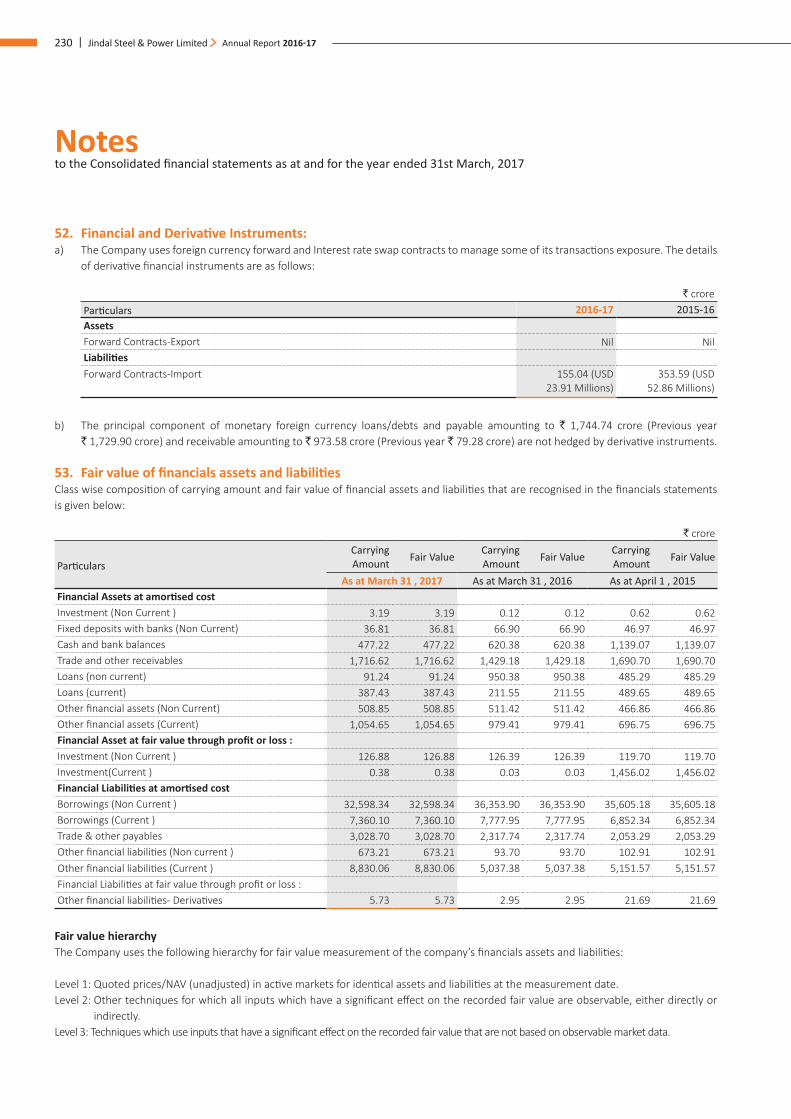
Notes to the Consolidated financial statements as at and for the year ended 31st March, 2017
230 | Jindal Steel & Power Limited Annual Report 2016-17
52. Financial and Derivative Instruments: a) The Company uses foreign currency forward and Interest rate swap contracts to manage some of its transactions exposure. The details
of derivative financial instruments are as follows:
` croreParticulars 2016-17 2015-16AssetsForward Contracts-Export Nil NilLiabilitiesForward Contracts-Import 155.04 (USD
23.91 Millions) 353.59 (USD
52.86 Millions)
b) The principal component of monetary foreign currency loans/debts and payable amounting to ` 1,744.74 crore (Previous year ` 1,729.90 crore) and receivable amounting to ` 973.58 crore (Previous year ` 79.28 crore) are not hedged by derivative instruments.
53. Fair value of financials assets and liabilities Class wise composition of carrying amount and fair value of financial assets and liabilities that are recognised in the financials statements is given below:
` crore
ParticularsCarrying Amount Fair Value Carrying
Amount Fair Value Carrying Amount Fair Value
As at March 31 , 2017 As at March 31 , 2016 As at April 1 , 2015Financial Assets at amortised costInvestment (Non Current ) 3.19 3.19 0.12 0.12 0.62 0.62 Fixed deposits with banks (Non Current) 36.81 36.81 66.90 66.90 46.97 46.97 Cash and bank balances 477.22 477.22 620.38 620.38 1,139.07 1,139.07 Trade and other receivables 1,716.62 1,716.62 1,429.18 1,429.18 1,690.70 1,690.70 Loans (non current) 91.24 91.24 950.38 950.38 485.29 485.29 Loans (current) 387.43 387.43 211.55 211.55 489.65 489.65 Other financial assets (Non Current) 508.85 508.85 511.42 511.42 466.86 466.86 Other financial assets (Current) 1,054.65 1,054.65 979.41 979.41 696.75 696.75 Financial Asset at fair value through profit or loss :Investment (Non Current ) 126.88 126.88 126.39 126.39 119.70 119.70 Investment(Current ) 0.38 0.38 0.03 0.03 1,456.02 1,456.02 Financial Liabilities at amortised costBorrowings (Non Current ) 32,598.34 32,598.34 36,353.90 36,353.90 35,605.18 35,605.18 Borrowings (Current ) 7,360.10 7,360.10 7,777.95 7,777.95 6,852.34 6,852.34 Trade & other payables 3,028.70 3,028.70 2,317.74 2,317.74 2,053.29 2,053.29 Other financial liabilities (Non current ) 673.21 673.21 93.70 93.70 102.91 102.91 Other financial liabilities (Current ) 8,830.06 8,830.06 5,037.38 5,037.38 5,151.57 5,151.57 Financial Liabilities at fair value through profit or loss :Other financial liabilities- Derivatives 5.73 5.73 2.95 2.95 21.69 21.69
Fair value hierarchyThe Company uses the following hierarchy for fair value measurement of the company’s financials assets and liabilities:
Level 1: Quoted prices/NAV (unadjusted) in active markets for identical assets and liabilities at the measurement date.Level 2: Other techniques for which all inputs which have a significant effect on the recorded fair value are observable, either directly or
indirectly. Level 3: Techniques which use inputs that have a significant effect on the recorded fair value that are not based on observable market data.
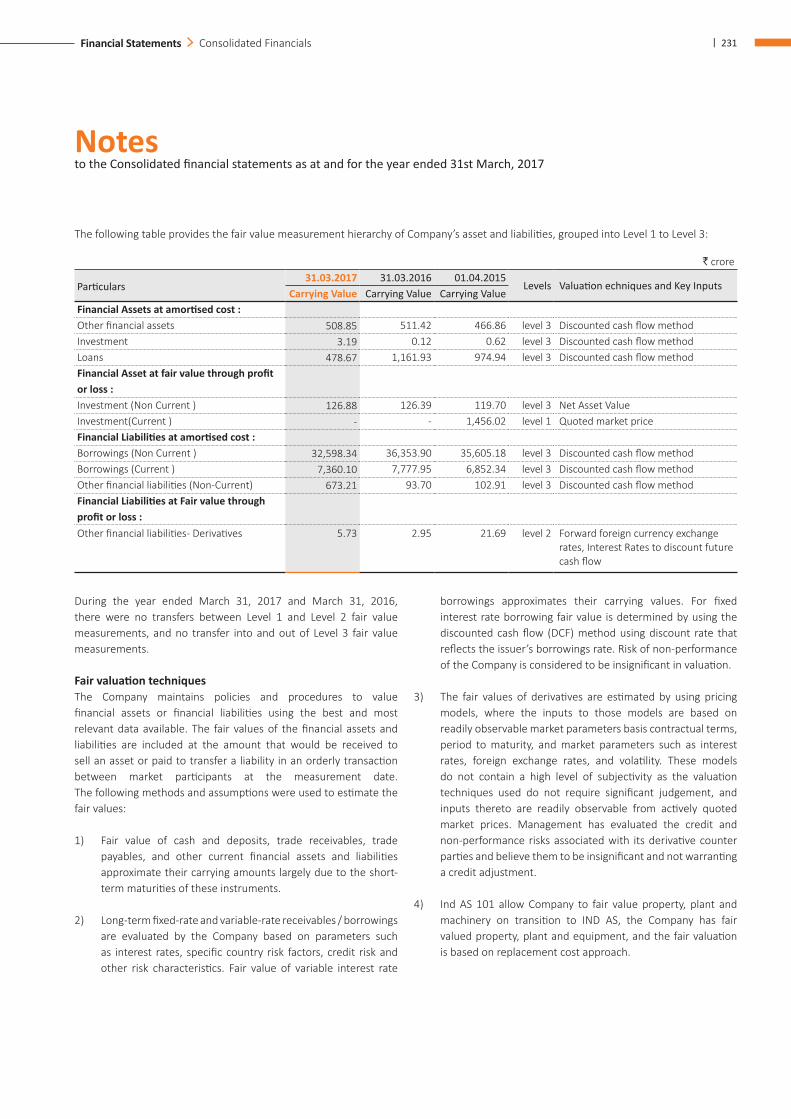
Notes to the Consolidated financial statements as at and for the year ended 31st March, 2017
| 231Financial Statements Consolidated Financials
The following table provides the fair value measurement hierarchy of Company’s asset and liabilities, grouped into Level 1 to Level 3:
` crore
Particulars31.03.2017 31.03.2016 01.04.2015
Levels Valuation echniques and Key InputsCarrying Value Carrying Value Carrying Value
Financial Assets at amortised cost :Other financial assets 508.85 511.42 466.86 level 3 Discounted cash flow method Investment 3.19 0.12 0.62 level 3 Discounted cash flow method Loans 478.67 1,161.93 974.94 level 3 Discounted cash flow method Financial Asset at fair value through profit or loss :Investment (Non Current ) 126.88 126.39 119.70 level 3 Net Asset Value Investment(Current ) - - 1,456.02 level 1 Quoted market price Financial Liabilities at amortised cost :Borrowings (Non Current ) 32,598.34 36,353.90 35,605.18 level 3 Discounted cash flow method Borrowings (Current ) 7,360.10 7,777.95 6,852.34 level 3 Discounted cash flow method Other financial liabilities (Non-Current) 673.21 93.70 102.91 level 3 Discounted cash flow method Financial Liabilities at Fair value through profit or loss :Other financial liabilities- Derivatives 5.73 2.95 21.69 level 2 Forward foreign currency exchange
rates, Interest Rates to discount future cash flow
During the year ended March 31, 2017 and March 31, 2016, there were no transfers between Level 1 and Level 2 fair value measurements, and no transfer into and out of Level 3 fair value measurements.
Fair valuation techniques The Company maintains policies and procedures to value financial assets or financial liabilities using the best and most relevant data available. The fair values of the financial assets and liabilities are included at the amount that would be received to sell an asset or paid to transfer a liability in an orderly transaction between market participants at the measurement date. The following methods and assumptions were used to estimate the fair values:
1) Fair value of cash and deposits, trade receivables, trade payables, and other current financial assets and liabilities approximate their carrying amounts largely due to the short-term maturities of these instruments.
2) Long-term fixed-rate and variable-rate receivables / borrowings are evaluated by the Company based on parameters such as interest rates, specific country risk factors, credit risk and other risk characteristics. Fair value of variable interest rate
borrowings approximates their carrying values. For fixed interest rate borrowing fair value is determined by using the discounted cash flow (DCF) method using discount rate that reflects the issuer’s borrowings rate. Risk of non-performance of the Company is considered to be insignificant in valuation.
3) The fair values of derivatives are estimated by using pricing models, where the inputs to those models are based on readily observable market parameters basis contractual terms, period to maturity, and market parameters such as interest rates, foreign exchange rates, and volatility. These models do not contain a high level of subjectivity as the valuation techniques used do not require significant judgement, and inputs thereto are readily observable from actively quoted market prices. Management has evaluated the credit and non-performance risks associated with its derivative counter parties and believe them to be insignificant and not warranting a credit adjustment.
4) Ind AS 101 allow Company to fair value property, plant and machinery on transition to IND AS, the Company has fair valued property, plant and equipment, and the fair valuation is based on replacement cost approach.
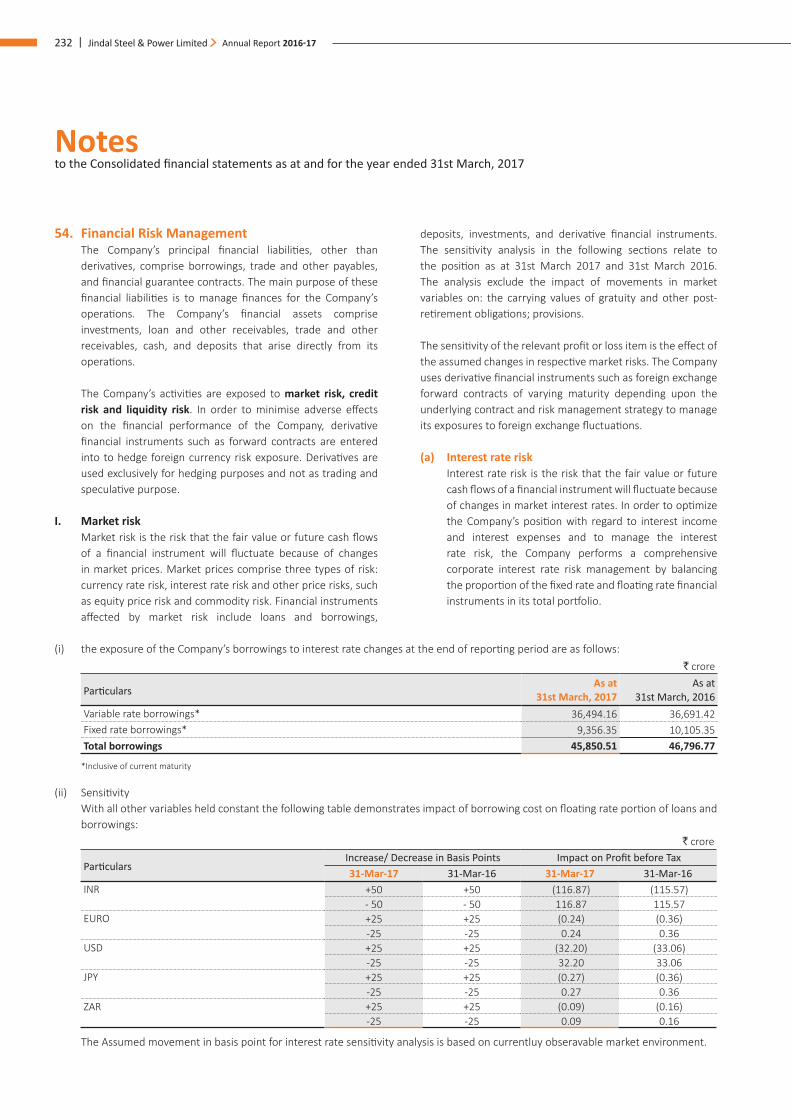
Notes to the Consolidated financial statements as at and for the year ended 31st March, 2017
232 | Jindal Steel & Power Limited Annual Report 2016-17
54. Financial Risk Management The Company’s principal financial liabilities, other than
derivatives, comprise borrowings, trade and other payables, and financial guarantee contracts. The main purpose of these financial liabilities is to manage finances for the Company’s operations. The Company’s financial assets comprise investments, loan and other receivables, trade and other receivables, cash, and deposits that arise directly from its operations.
The Company’s activities are exposed to market risk, credit risk and liquidity risk. In order to minimise adverse effects on the financial performance of the Company, derivative financial instruments such as forward contracts are entered into to hedge foreign currency risk exposure. Derivatives are used exclusively for hedging purposes and not as trading and speculative purpose.
I. Market risk Market risk is the risk that the fair value or future cash flows
of a financial instrument will fluctuate because of changes in market prices. Market prices comprise three types of risk: currency rate risk, interest rate risk and other price risks, such as equity price risk and commodity risk. Financial instruments affected by market risk include loans and borrowings,
deposits, investments, and derivative financial instruments. The sensitivity analysis in the following sections relate to the position as at 31st March 2017 and 31st March 2016. The analysis exclude the impact of movements in market variables on: the carrying values of gratuity and other post-retirement obligations; provisions.
The sensitivity of the relevant profit or loss item is the effect of the assumed changes in respective market risks. The Company uses derivative financial instruments such as foreign exchange forward contracts of varying maturity depending upon the underlying contract and risk management strategy to manage its exposures to foreign exchange fluctuations.
(a) Interest rate risk Interest rate risk is the risk that the fair value or future
cash flows of a financial instrument will fluctuate because of changes in market interest rates. In order to optimize the Company’s position with regard to interest income and interest expenses and to manage the interest rate risk, the Company performs a comprehensive corporate interest rate risk management by balancing the proportion of the fixed rate and floating rate financial instruments in its total portfolio.
(i) the exposure of the Company’s borrowings to interest rate changes at the end of reporting period are as follows: ` crore
ParticularsAs at
31st March, 2017 As at
31st March, 2016 Variable rate borrowings* 36,494.16 36,691.42 Fixed rate borrowings* 9,356.35 10,105.35 Total borrowings 45,850.51 46,796.77
*Inclusive of current maturity
(ii) Sensitivity With all other variables held constant the following table demonstrates impact of borrowing cost on floating rate portion of loans and
borrowings:` crore
ParticularsIncrease/ Decrease in Basis Points Impact on Profit before Tax31-Mar-17 31-Mar-16 31-Mar-17 31-Mar-16
INR +50 +50 (116.87) (115.57)- 50 - 50 116.87 115.57
EURO +25 +25 (0.24) (0.36)-25 -25 0.24 0.36
USD +25 +25 (32.20) (33.06)-25 -25 32.20 33.06
JPY +25 +25 (0.27) (0.36)-25 -25 0.27 0.36
ZAR +25 +25 (0.09) (0.16)-25 -25 0.09 0.16
The Assumed movement in basis point for interest rate sensitivity analysis is based on currentluy obseravable market environment.
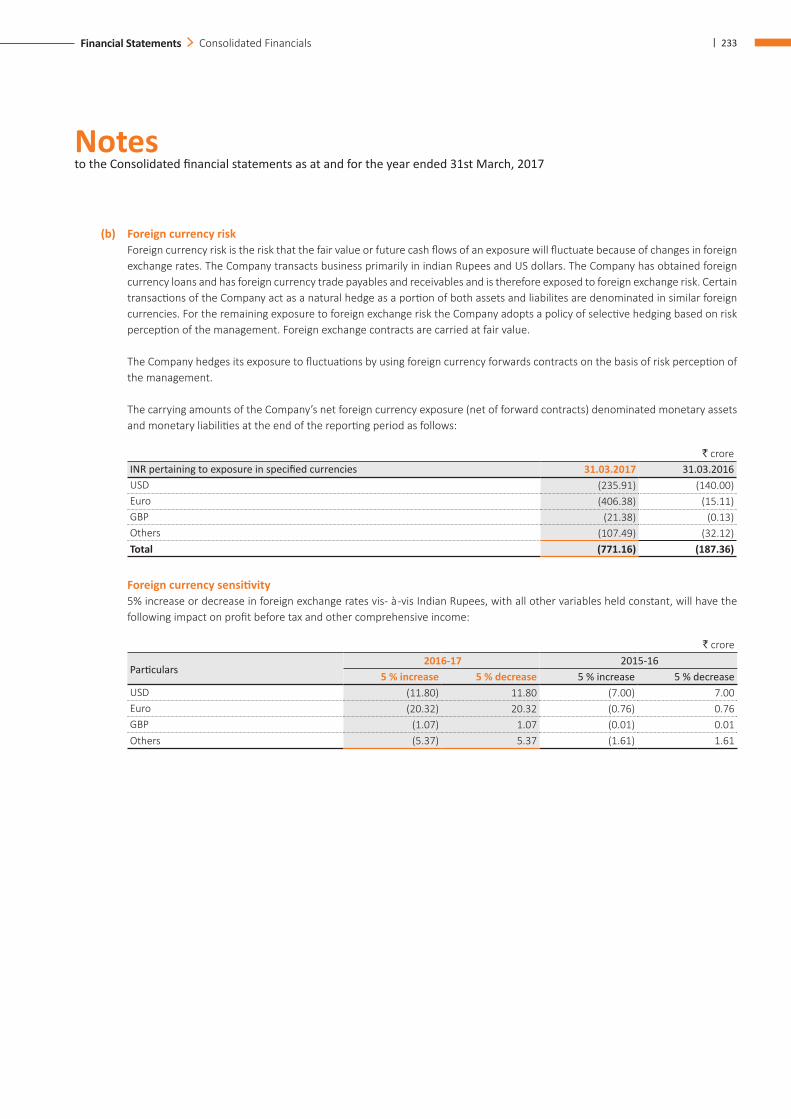
Notes to the Consolidated financial statements as at and for the year ended 31st March, 2017
| 233Financial Statements Consolidated Financials
(b) Foreign currency risk Foreign currency risk is the risk that the fair value or future cash flows of an exposure will fluctuate because of changes in foreign
exchange rates. The Company transacts business primarily in indian Rupees and US dollars. The Company has obtained foreign currency loans and has foreign currency trade payables and receivables and is therefore exposed to foreign exchange risk. Certain transactions of the Company act as a natural hedge as a portion of both assets and liabilites are denominated in similar foreign currencies. For the remaining exposure to foreign exchange risk the Company adopts a policy of selective hedging based on risk perception of the management. Foreign exchange contracts are carried at fair value.
The Company hedges its exposure to fluctuations by using foreign currency forwards contracts on the basis of risk perception of the management.
The carrying amounts of the Company’s net foreign currency exposure (net of forward contracts) denominated monetary assets and monetary liabilities at the end of the reporting period as follows:
` croreINR pertaining to exposure in specified currencies 31.03.2017 31.03.2016USD (235.91) (140.00)Euro (406.38) (15.11)GBP (21.38) (0.13)Others (107.49) (32.12)Total (771.16) (187.36)
Foreign currency sensitivity 5% increase or decrease in foreign exchange rates vis- à -vis Indian Rupees, with all other variables held constant, will have the
following impact on profit before tax and other comprehensive income:
` crore
Particulars 2016-17 2015-16
5 % increase 5 % decrease 5 % increase 5 % decrease USD (11.80) 11.80 (7.00) 7.00 Euro (20.32) 20.32 (0.76) 0.76 GBP (1.07) 1.07 (0.01) 0.01 Others (5.37) 5.37 (1.61) 1.61
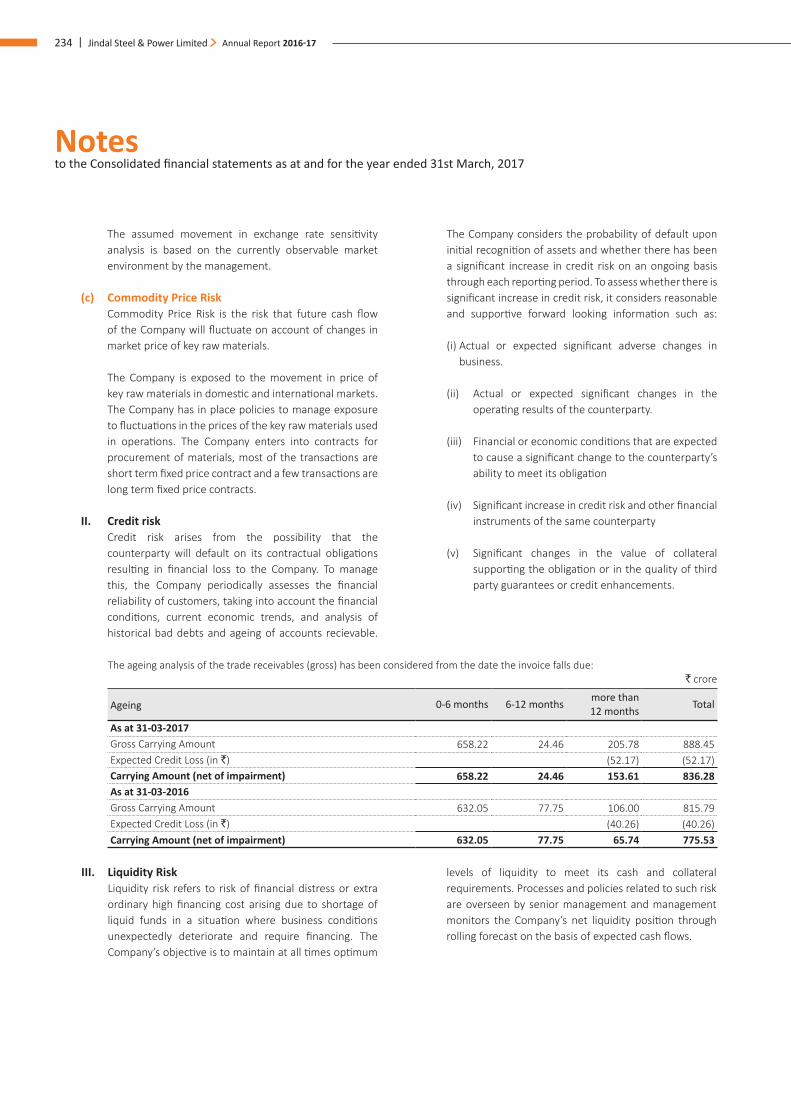
Notes to the Consolidated financial statements as at and for the year ended 31st March, 2017
234 | Jindal Steel & Power Limited Annual Report 2016-17
The assumed movement in exchange rate sensitivity analysis is based on the currently observable market environment by the management.
(c) Commodity Price Risk Commodity Price Risk is the risk that future cash flow
of the Company will fluctuate on account of changes in market price of key raw materials.
The Company is exposed to the movement in price of key raw materials in domestic and international markets. The Company has in place policies to manage exposure to fluctuations in the prices of the key raw materials used in operations. The Company enters into contracts for procurement of materials, most of the transactions are short term fixed price contract and a few transactions are long term fixed price contracts.
II. Credit risk Credit risk arises from the possibility that the
counterparty will default on its contractual obligations resulting in financial loss to the Company. To manage this, the Company periodically assesses the financial reliability of customers, taking into account the financial conditions, current economic trends, and analysis of historical bad debts and ageing of accounts recievable.
The Company considers the probability of default upon initial recognition of assets and whether there has been a significant increase in credit risk on an ongoing basis through each reporting period. To assess whether there is significant increase in credit risk, it considers reasonable and supportive forward looking information such as: (i) Actual or expected significant adverse changes in
business.
(ii) Actual or expected significant changes in the operating results of the counterparty.
(iii) Financial or economic conditions that are expected to cause a significant change to the counterparty’s ability to meet its obligation
(iv) Significant increase in credit risk and other financial instruments of the same counterparty
(v) Significant changes in the value of collateral supporting the obligation or in the quality of third party guarantees or credit enhancements.
The ageing analysis of the trade receivables (gross) has been considered from the date the invoice falls due: ` crore
Ageing 0-6 months 6-12 months more than 12 months Total
As at 31-03-2017Gross Carrying Amount 658.22 24.46 205.78 888.45Expected Credit Loss (in `) (52.17) (52.17)Carrying Amount (net of impairment) 658.22 24.46 153.61 836.28As at 31-03-2016Gross Carrying Amount 632.05 77.75 106.00 815.79 Expected Credit Loss (in `) (40.26) (40.26)Carrying Amount (net of impairment) 632.05 77.75 65.74 775.53
III. Liquidity Risk Liquidity risk refers to risk of financial distress or extra
ordinary high financing cost arising due to shortage of liquid funds in a situation where business conditions unexpectedly deteriorate and require financing. The Company’s objective is to maintain at all times optimum
levels of liquidity to meet its cash and collateral requirements. Processes and policies related to such risk are overseen by senior management and management monitors the Company’s net liquidity position through rolling forecast on the basis of expected cash flows.
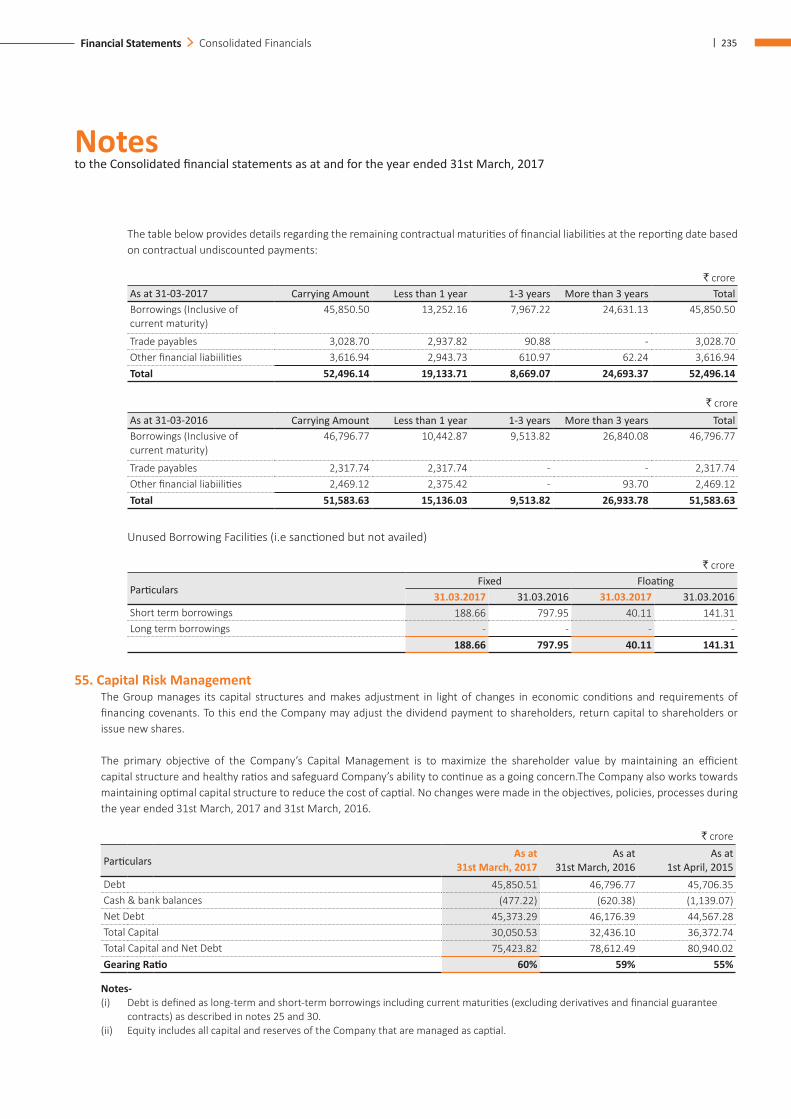
Notes to the Consolidated financial statements as at and for the year ended 31st March, 2017
| 235Financial Statements Consolidated Financials
The table below provides details regarding the remaining contractual maturities of financial liabilities at the reporting date based on contractual undiscounted payments:
` croreAs at 31-03-2017 Carrying Amount Less than 1 year 1-3 years More than 3 years Total Borrowings (Inclusive of current maturity)
45,850.50 13,252.16 7,967.22 24,631.13 45,850.50
Trade payables 3,028.70 2,937.82 90.88 - 3,028.70 Other financial liabiilities 3,616.94 2,943.73 610.97 62.24 3,616.94 Total 52,496.14 19,133.71 8,669.07 24,693.37 52,496.14
` croreAs at 31-03-2016 Carrying Amount Less than 1 year 1-3 years More than 3 years Total Borrowings (Inclusive of current maturity)
46,796.77 10,442.87 9,513.82 26,840.08 46,796.77
Trade payables 2,317.74 2,317.74 - - 2,317.74 Other financial liabiilities 2,469.12 2,375.42 - 93.70 2,469.12 Total 51,583.63 15,136.03 9,513.82 26,933.78 51,583.63
Unused Borrowing Facilities (i.e sanctioned but not availed)
` crore
Particulars Fixed Floating
31.03.2017 31.03.2016 31.03.2017 31.03.2016Short term borrowings 188.66 797.95 40.11 141.31 Long term borrowings - - - -
188.66 797.95 40.11 141.31
55. Capital Risk Management The Group manages its capital structures and makes adjustment in light of changes in economic conditions and requirements of
financing covenants. To this end the Company may adjust the dividend payment to shareholders, return capital to shareholders or issue new shares.
The primary objective of the Company’s Capital Management is to maximize the shareholder value by maintaining an efficient capital structure and healthy ratios and safeguard Company’s ability to continue as a going concern.The Company also works towards maintaining optimal capital structure to reduce the cost of captial. No changes were made in the objectives, policies, processes during the year ended 31st March, 2017 and 31st March, 2016.
` crore
ParticularsAs at
31st March, 2017As at
31st March, 2016As at
1st April, 2015Debt 45,850.51 46,796.77 45,706.35 Cash & bank balances (477.22) (620.38) (1,139.07)Net Debt 45,373.29 46,176.39 44,567.28 Total Capital 30,050.53 32,436.10 36,372.74 Total Capital and Net Debt 75,423.82 78,612.49 80,940.02 Gearing Ratio 60% 59% 55%
Notes- (i) Debt is defined as long-term and short-term borrowings including current maturities (excluding derivatives and financial guarantee
contracts) as described in notes 25 and 30. (ii) Equity includes all capital and reserves of the Company that are managed as captial.
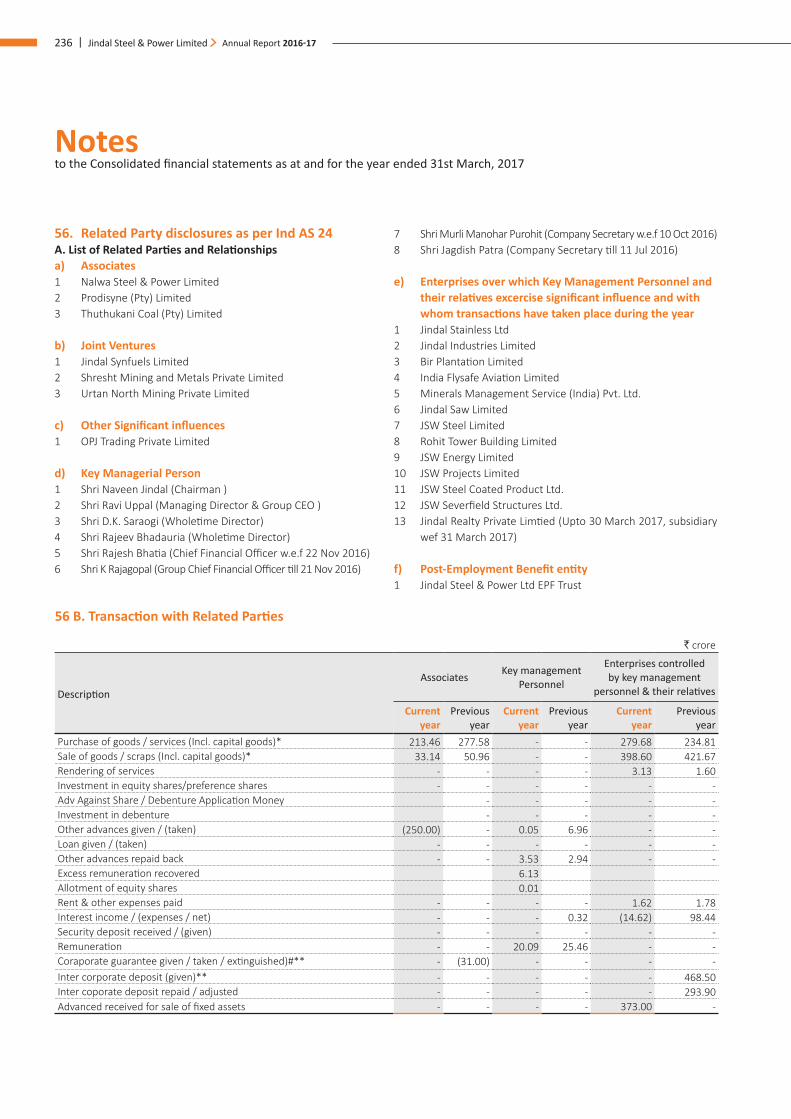
Notes to the Consolidated financial statements as at and for the year ended 31st March, 2017
236 | Jindal Steel & Power Limited Annual Report 2016-17
56. Related Party disclosures as per Ind AS 24 A. List of Related Parties and Relationships a) Associates1 Nalwa Steel & Power Limited2 Prodisyne (Pty) Limited3 Thuthukani Coal (Pty) Limited
b) Joint Ventures1 Jindal Synfuels Limited 2 Shresht Mining and Metals Private Limited3 Urtan North Mining Private Limited
c) Other Significant influences1 OPJ Trading Private Limited
d) Key Managerial Person1 Shri Naveen Jindal (Chairman )2 Shri Ravi Uppal (Managing Director & Group CEO ) 3 Shri D.K. Saraogi (Wholetime Director)4 Shri Rajeev Bhadauria (Wholetime Director)5 Shri Rajesh Bhatia (Chief Financial Officer w.e.f 22 Nov 2016)6 Shri K Rajagopal (Group Chief Financial Officer till 21 Nov 2016)
7 Shri Murli Manohar Purohit (Company Secretary w.e.f 10 Oct 2016)8 Shri Jagdish Patra (Company Secretary till 11 Jul 2016)
e) Enterprises over which Key Management Personnel and their relatives excercise significant influence and with whom transactions have taken place during the year
1 Jindal Stainless Ltd2 Jindal Industries Limited3 Bir Plantation Limited4 India Flysafe Aviation Limited5 Minerals Management Service (India) Pvt. Ltd.6 Jindal Saw Limited7 JSW Steel Limited8 Rohit Tower Building Limited9 JSW Energy Limited10 JSW Projects Limited11 JSW Steel Coated Product Ltd.12 JSW Severfield Structures Ltd.13 Jindal Realty Private Limtied (Upto 30 March 2017, subsidiary
wef 31 March 2017)
f) Post-Employment Benefit entity1 Jindal Steel & Power Ltd EPF Trust
56 B. Transaction with Related Parties
` crore
Description Associates Key management
Personnel
Enterprises controlled by key management
personnel & their relatives
Current year
Previous year
Current year
Previous year
Current year
Previous year
Purchase of goods / services (Incl. capital goods)* 213.46 277.58 - - 279.68 234.81 Sale of goods / scraps (Incl. capital goods)* 33.14 50.96 - - 398.60 421.67 Rendering of services - - - - 3.13 1.60 Investment in equity shares/preference shares - - - - - - Adv Against Share / Debenture Application Money - - - - - Investment in debenture - - - - - Other advances given / (taken) (250.00) - 0.05 6.96 - - Loan given / (taken) - - - - - - Other advances repaid back - - 3.53 2.94 - - Excess remuneration recovered 6.13 Allotment of equity shares 0.01 Rent & other expenses paid - - - - 1.62 1.78 Interest income / (expenses / net) - - - 0.32 (14.62) 98.44 Security deposit received / (given) - - - - - - Remuneration - - 20.09 25.46 - - Coraporate guarantee given / taken / extinguished)#** - (31.00) - - - - Inter corporate deposit (given)** - - - - - 468.50 Inter coporate deposit repaid / adjusted - - - - - 293.90 Advanced received for sale of fixed assets - - - - 373.00 -
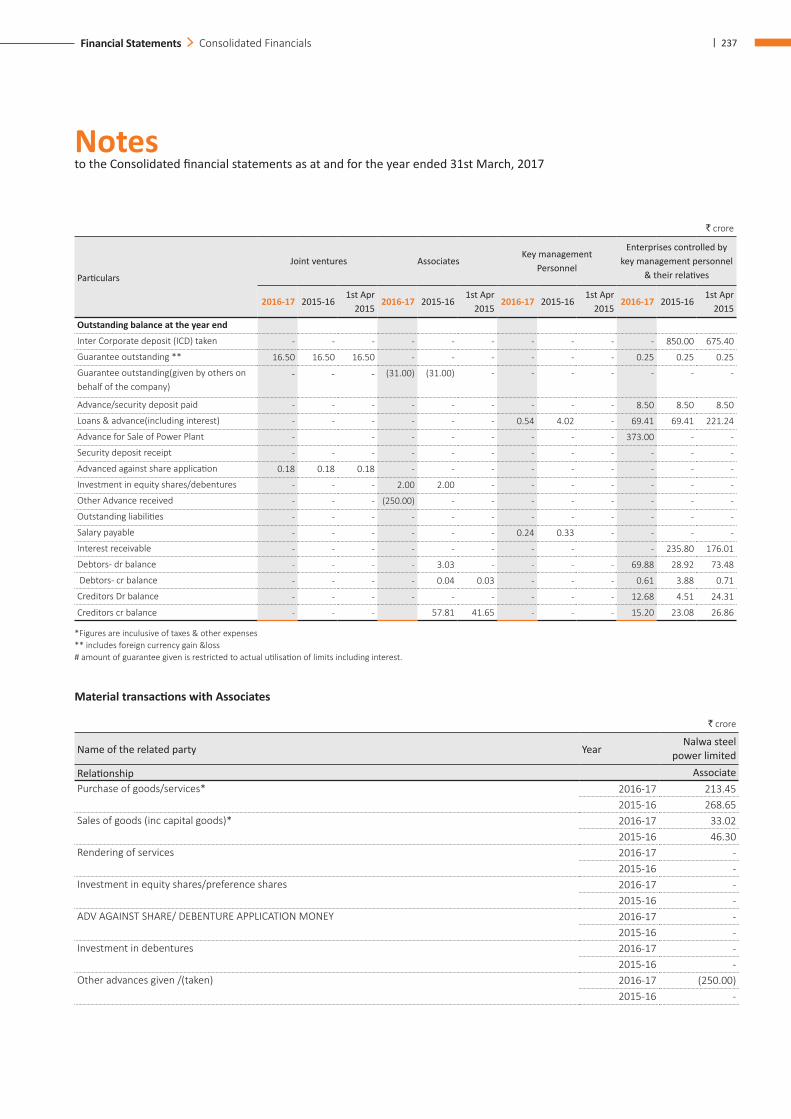
Notes to the Consolidated financial statements as at and for the year ended 31st March, 2017
| 237Financial Statements Consolidated Financials
` crore
Particulars
Joint ventures AssociatesKey management
Personnel
Enterprises controlled by key management personnel
& their relatives
2016-17 2015-16 1st Apr
2015 2016-17 2015-16
1st Apr 2015
2016-17 2015-16 1st Apr
2015 2016-17 2015-16
1st Apr 2015
Outstanding balance at the year end
Inter Corporate deposit (ICD) taken - - - - - - - - - - 850.00 675.40
Guarantee outstanding ** 16.50 16.50 16.50 - - - - - - 0.25 0.25 0.25
Guarantee outstanding(given by others on behalf of the company)
- - - (31.00) (31.00) - - - - - - -
Advance/security deposit paid - - - - - - - - - 8.50 8.50 8.50
Loans & advance(including interest) - - - - - - 0.54 4.02 - 69.41 69.41 221.24
Advance for Sale of Power Plant - - - - - - - - 373.00 - -
Security deposit receipt - - - - - - - - - - - -
Advanced against share application 0.18 0.18 0.18 - - - - - - - - -
Investment in equity shares/debentures - - - 2.00 2.00 - - - - - - -
Other Advance received - - - (250.00) - - - - - - - -
Outstanding liabilities - - - - - - - - - - - -
Salary payable - - - - - - 0.24 0.33 - - - -
Interest receivable - - - - - - - - - 235.80 176.01
Debtors- dr balance - - - - 3.03 - - - - 69.88 28.92 73.48
Debtors- cr balance - - - - 0.04 0.03 - - - 0.61 3.88 0.71
Creditors Dr balance - - - - - - - - - 12.68 4.51 24.31
Creditors cr balance - - - 57.81 41.65 - - - 15.20 23.08 26.86
*Figures are inculusive of taxes & other expenses ** includes foreign currency gain &loss # amount of guarantee given is restricted to actual utilisation of limits including interest.
Material transactions with Associates
` crore
Name of the related party YearNalwa steel
power limitedRelationship AssociatePurchase of goods/services* 2016-17 213.45
2015-16 268.65Sales of goods (inc capital goods)* 2016-17 33.02
2015-16 46.30Rendering of services 2016-17 -
2015-16 - Investment in equity shares/preference shares 2016-17 -
2015-16 - ADV AGAINST SHARE/ DEBENTURE APPLICATION MONEY 2016-17 -
2015-16 - Investment in debentures 2016-17 -
2015-16 - Other advances given /(taken) 2016-17 (250.00)
2015-16 -
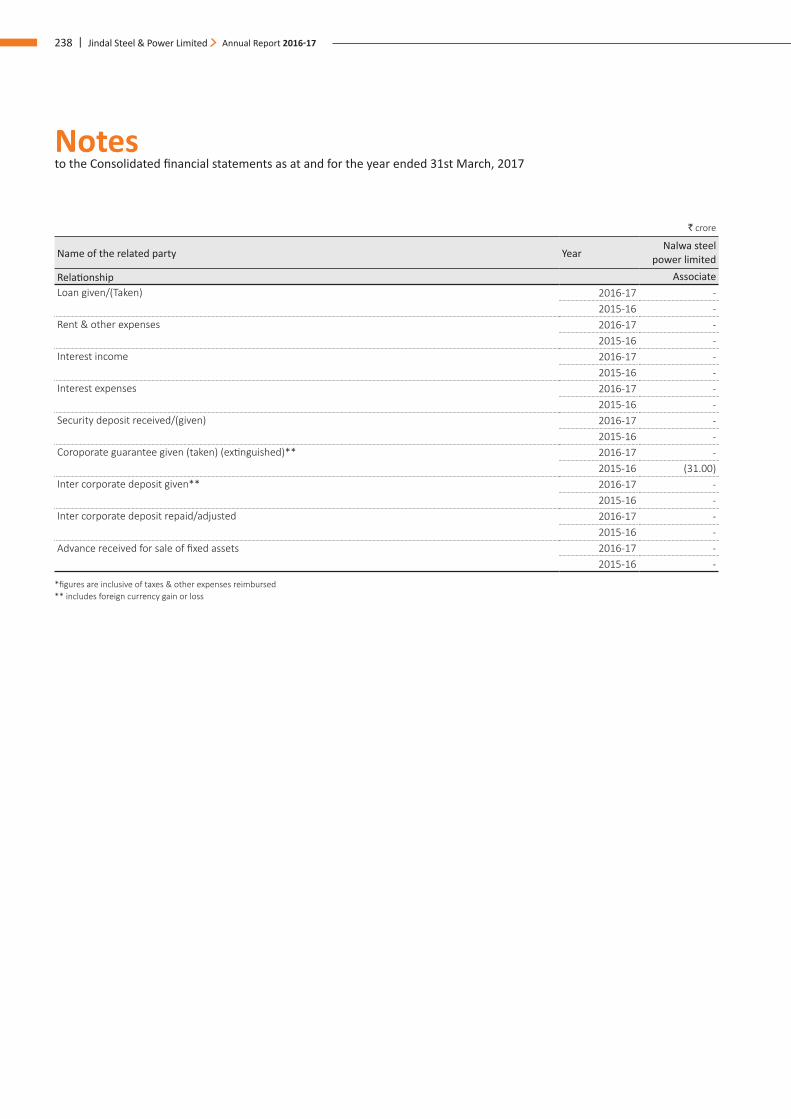
Notes to the Consolidated financial statements as at and for the year ended 31st March, 2017
238 | Jindal Steel & Power Limited Annual Report 2016-17
` crore
Name of the related party YearNalwa steel
power limitedRelationship AssociateLoan given/(Taken) 2016-17 -
2015-16 - Rent & other expenses 2016-17 -
2015-16 - Interest income 2016-17 -
2015-16 - Interest expenses 2016-17 -
2015-16 - Security deposit received/(given) 2016-17 -
2015-16 - Coroporate guarantee given (taken) (extinguished)** 2016-17 -
2015-16 (31.00)Inter corporate deposit given** 2016-17 -
2015-16 - Inter corporate deposit repaid/adjusted 2016-17 -
2015-16 - Advance received for sale of fixed assets 2016-17 -
2015-16 -
*figures are inclusive of taxes & other expenses reimbursed ** includes foreign currency gain or loss
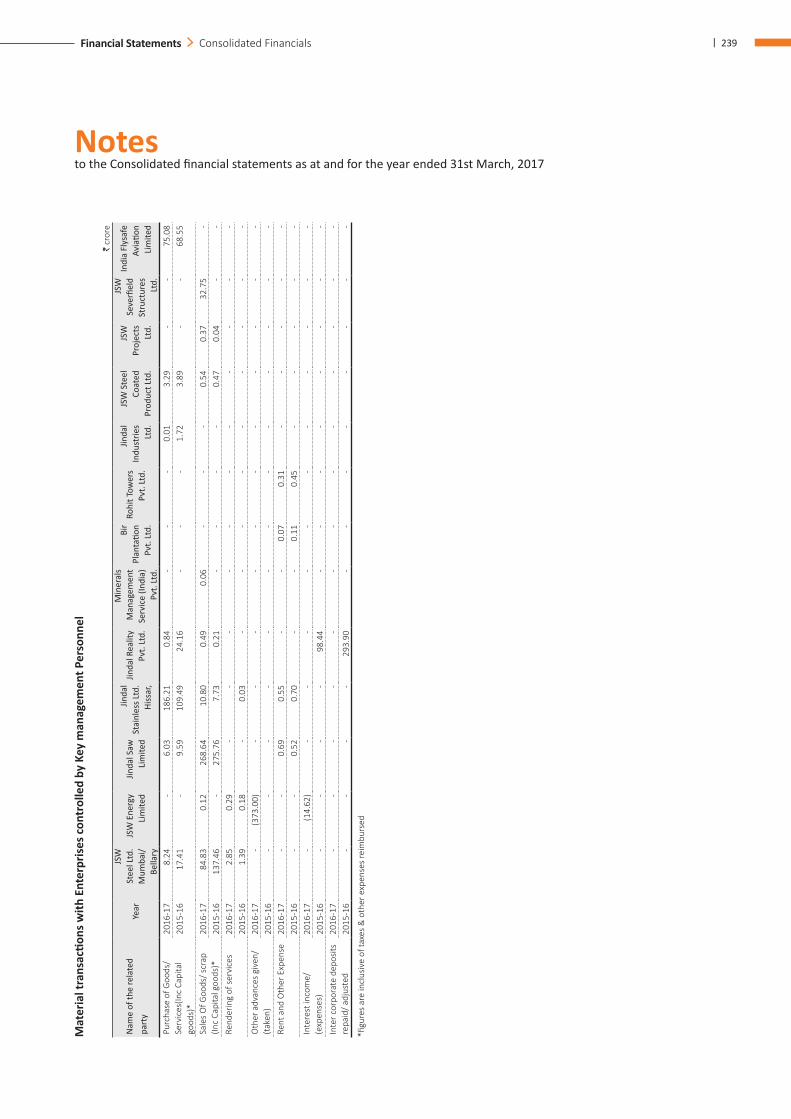
Notes to the Consolidated financial statements as at and for the year ended 31st March, 2017
| 239Financial Statements Consolidated Financials
Mat
eria
l tra
nsac
tions
with
Ent
erpr
ises
con
trol
led
by K
ey m
anag
emen
t Per
sonn
el
` cr
ore
Nam
e of
the
rela
ted
part
yYe
ar
JSW
St
eel L
td.
Mum
bai/
Bella
ry
JSW
Ene
rgy
Lim
ited
Jinda
l Saw
Li
mite
d
Jinda
l St
ainl
ess L
td.
Hiss
ar,
Jinda
l Rea
lity
Pvt.
Ltd.
Min
eral
s M
anag
emen
t Se
rvic
e (In
dia)
Pv
t. Lt
d.
Bir
Plan
tatio
n Pv
t. Lt
d.
Rohi
t Tow
ers
Pvt.
Ltd.
Jinda
l In
dust
ries
Ltd.
JSW
Ste
el
Coat
ed
Prod
uct L
td.
JSW
Pr
ojec
ts
Ltd.
JSW
Se
verfi
eld
Stru
ctur
es
Ltd.
Indi
a Fl
ysaf
e Av
iatio
n Li
mite
d
Purc
hase
of G
oods
/Se
rvic
es(In
c Ca
pita
l go
ods)
*
2016
-17
8.2
4 -
6.0
3 1
86.2
1 0
.84
- -
- 0
.01
3.2
9 -
- 7
5.08
20
15-1
6 1
7.41
-
9.5
9 1
09.4
9 24
.16
- -
- 1
.72
3.8
9 -
- 6
8.55
Sale
s O
f Goo
ds/ s
crap
(In
c Ca
pita
l goo
ds)*
2016
-17
84.
83
0.1
2 2
68.6
4 1
0.80
0
.49
0.0
6 -
- -
0.5
4 0
.37
32.
75
- 20
15-1
6 1
37.4
6 -
275
.76
7.7
3 0
.21
- -
- -
0.4
7 0
.04
- -
Rend
erin
g of
ser
vice
s20
16-1
7 2
.85
0.2
9 -
- -
- -
- -
- -
- -
2015
-16
1.3
9 0
.18
- 0
.03
- -
- -
- -
- -
- O
ther
adv
ance
s gi
ven/
(tak
en)
2016
-17
- (3
73.0
0)
- -
- -
- -
- -
- -
- 20
15-1
6 -
- -
- -
- -
- -
- -
- -
Rent
and
Oth
er E
xpen
se20
16-1
7 -
- 0
.69
0.5
5 -
- 0
.07
0.3
1 -
- -
- -
2015
-16
- -
0.5
2 0
.70
- -
0.1
1 0
.45
- -
- -
- In
tere
st in
com
e/(e
xpen
ses)
2016
-17
- (1
4.62
) -
- -
- -
- -
- -
- -
2015
-16
- -
- -
98.4
4 -
- -
- -
- -
- In
ter c
orpo
rate
dep
osits
re
paid
/ adj
uste
d20
16-1
7 -
- -
- -
- -
- -
- -
- -
2015
-16
- -
- -
293
.90
- -
- -
- -
- -
*figu
res
are
incl
usiv
e of
taxe
s &
oth
er e
xpen
ses
reim
burs
ed
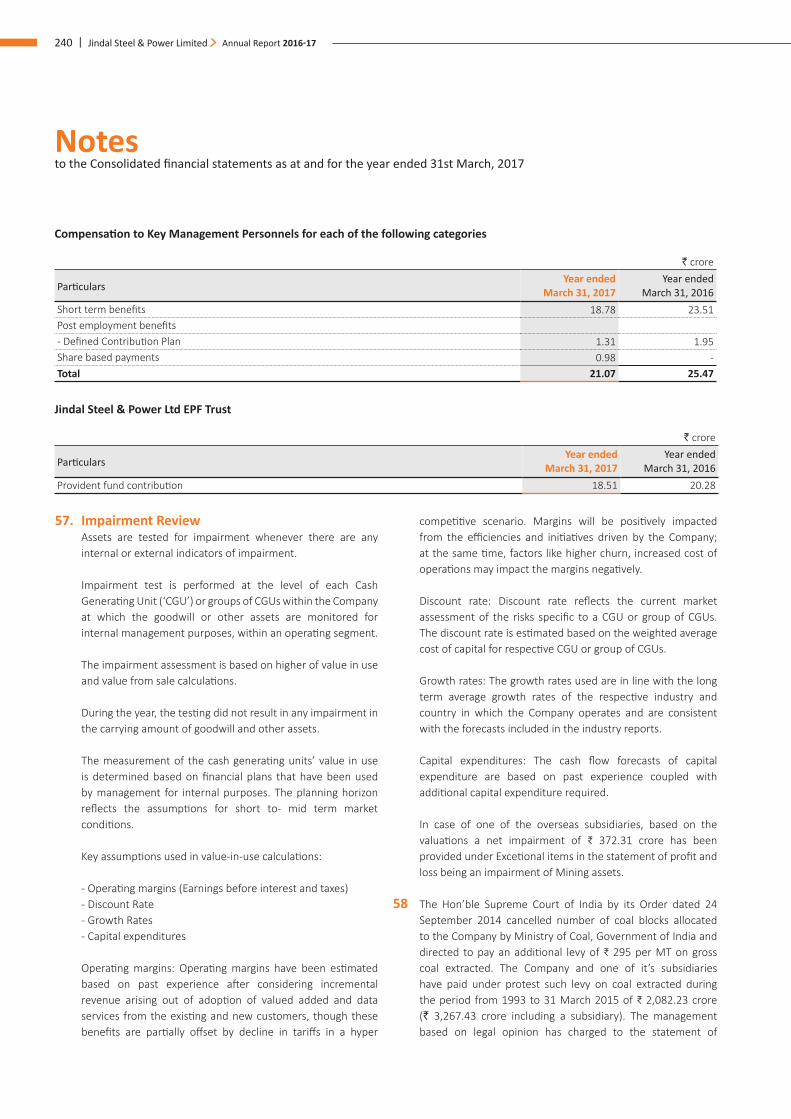
Notes to the Consolidated financial statements as at and for the year ended 31st March, 2017
240 | Jindal Steel & Power Limited Annual Report 2016-17
Compensation to Key Management Personnels for each of the following categories
` crore
ParticularsYear ended
March 31, 2017Year ended
March 31, 2016Short term benefits 18.78 23.51 Post employment benefits- Defined Contribution Plan 1.31 1.95 Share based payments 0.98 - Total 21.07 25.47
Jindal Steel & Power Ltd EPF Trust
` crore
ParticularsYear ended
March 31, 2017Year ended
March 31, 2016Provident fund contribution 18.51 20.28
57. Impairment Review Assets are tested for impairment whenever there are any
internal or external indicators of impairment.
Impairment test is performed at the level of each Cash Generating Unit (‘CGU’) or groups of CGUs within the Company at which the goodwill or other assets are monitored for internal management purposes, within an operating segment.
The impairment assessment is based on higher of value in use and value from sale calculations.
During the year, the testing did not result in any impairment in the carrying amount of goodwill and other assets.
The measurement of the cash generating units’ value in use is determined based on financial plans that have been used by management for internal purposes. The planning horizon reflects the assumptions for short to- mid term market conditions.
Key assumptions used in value-in-use calculations:
- Operating margins (Earnings before interest and taxes) - Discount Rate - Growth Rates - Capital expenditures
Operating margins: Operating margins have been estimated based on past experience after considering incremental revenue arising out of adoption of valued added and data services from the existing and new customers, though these benefits are partially offset by decline in tariffs in a hyper
competitive scenario. Margins will be positively impacted from the efficiencies and initiatives driven by the Company; at the same time, factors like higher churn, increased cost of operations may impact the margins negatively.
Discount rate: Discount rate reflects the current market assessment of the risks specific to a CGU or group of CGUs. The discount rate is estimated based on the weighted average cost of capital for respective CGU or group of CGUs.
Growth rates: The growth rates used are in line with the long term average growth rates of the respective industry and country in which the Company operates and are consistent with the forecasts included in the industry reports.
Capital expenditures: The cash flow forecasts of capital expenditure are based on past experience coupled with additional capital expenditure required.
In case of one of the overseas subsidiaries, based on the valuations a net impairment of ₹ 372.31 crore has been provided under Excetional items in the statement of profit and loss being an impairment of Mining assets.
58 The Hon’ble Supreme Court of India by its Order dated 24 September 2014 cancelled number of coal blocks allocated to the Company by Ministry of Coal, Government of India and directed to pay an additional levy of ₹ 295 per MT on gross coal extracted. The Company and one of it’s subsidiaries have paid under protest such levy on coal extracted during the period from 1993 to 31 March 2015 of ₹ 2,082.23 crore (` 3,267.43 crore including a subsidiary). The management based on legal opinion has charged to the statement of
Notes to the Consolidated financial statements as at and for the year ended 31st March, 2017
| 241Financial Statements Consolidated Financials
profit and loss, as exceptional item during the year 2014-15 for ₹ 807.77 crore (` 1,911.64 crore including a subsidiary) computed on net extraction (run of mines less shale, rejects and ungraded middling) of coal by the Company. The balance amount of ₹ 1,274.46 crore (` 1,355.79 crore including a subsidiary) has been shown as recoverable from the Government Authority since the entire amount of additional levy has been paid under protest.
59. The Company has net book value of investment made in mining assets including land, infrastructure and clearance etc. of ₹ 425 crore (` 608.58 crore including a subsidiary) and filed claim for the same pursuant to directive vide letter dated 26 December , 2014 given by the Ministry of Coal on such mines . Meanwhile the Ministry of Coal has made interim payment to the Company of ` 22.72 crore towards the same.Pending final settlement of the aforesaid claim, this amount has been accounted for as advance.
60. The Company has filed legal suits /notices or in the process of filing legal case /sending legal notices / making efforts for recovery of debit balances of ` 243.56 crore (P.Y. 2015-16 ₹ 630.99 crore) plus interest wherever applicable, which are being carried as long term /short term advances, trade receivables and other recoverable. Pending outcome of legal proceedings/Company ‘s efforts for recovery and based on legal advise in certain cases , the Company has considered aforesaid amounts as fully recoverable. Hence, no provision has been made in respect of these balances.
61. Subject to customary regulatory approvals and other conditions precedent(s), the Board of Directors at its meeting held on 3rd May,2016 has approved the agreement for divestment of 1,000 MW Power unit of Jindal Power Limited (a subsidiary of the Company (JPL)), located in Chhattisgarh into a separate purpose vehicle (SPV), for the purpose of transfering the same to JSW Energy Limited through sale of the entire share capital and other securities of the aforesaid entity in terms of the share purchase agreement for an enterprise value of ₹ 6,500 crore plus the value of Net Current Assets as on the Closing Date. The valuation may vary based upon the achievement of PPA’s before the closing date 30th June, 2018 and as prescribed in the Agreement subject to minimum of ₹ 4,000 crore plus the value of Net Current Assets as on the Closing Date.The Company has received advance of ` 373.00 crore from JSW Energy against the same.
In order to streamline cash flows of the group and create SPV amenable for, the Board of Directors of the Company and JPL have in principle approved the restructuring involving
parent Company and JPL and formed a committee of directors (“Restructuring Committee”), to explore and evaluate various restructuring options available including a scheme of arrangement. The restructuring will entail that 1000 MW Power Plant owned by JPL is hived off into an separate purpose vehicle, being subsidiary of the parent company, creation of other SPV amenable for monetization by way of divestments as well as achieve better synergy across the parent company and its subsidiaries, and to ensure that the businesses of these entities are operated in the most efficient and cost effective manner, including by pooling of technical, distribution and marketing skills, creating optimal utilisation of resources, better administration and cost reduction. Upon completion of evaluation of the possible arrangement options, the Restructuring Committee is to submit its recommendations to the Board of Directors and to such other committee(s) of the Board, including the Audit Committee, shareholders as may be required by applicable laws.
62. Balances of certain advances, creditors and receivables are in process of confirmation/reconciliation.
63. The company and one of it’s subsdiaries have considerd fair value of Property plant and equipment (fair value as assessed by independant valuer) i.e. Land, Building and plant & machinery (PPE) in accordance with stipulation of IND AS 101 with resulted impact been given and accounted for in reserves, Accordingly on fair value of assets as cost on transition date (1st April 2015) as per option available in Ind AS and being increase in value (net) in PPE of ` 20,882.75 crore and useful life (as assessed and estimated by the management and a technical valuer), depreciation reflected in statement of profit & loss of current year is higher by ` 1248.49 crore for the year ended 31st March 2017 and to that extent loss is higher.
64. Hon’ble Supreme Court of India, in its recent judgement has upheld constitutional validity of entry tax levied by the different State Governments and referred the same to divisional/ regular benches for testing and determination of validity of state legislation vis a vis the Article 304 (a) of the constitution and left open levy of entry tax on goods entering the landmass of India from another country to be determined in appropriate proceedings. Full provision has been made in this regard except in case of import of goods from outside India, where part amount (` 55.83 crore) of entry tax has been deposited (shown under loans and advances) based on the Order of High Court in other assessee’s case and as advised by an expert (against amount calculated till 31.03.2017 of ` 113.96 crore). As advised, no material provision is required to be made on this account . Further ` 0.64 crore has been paid subsequent to balance sheet date.
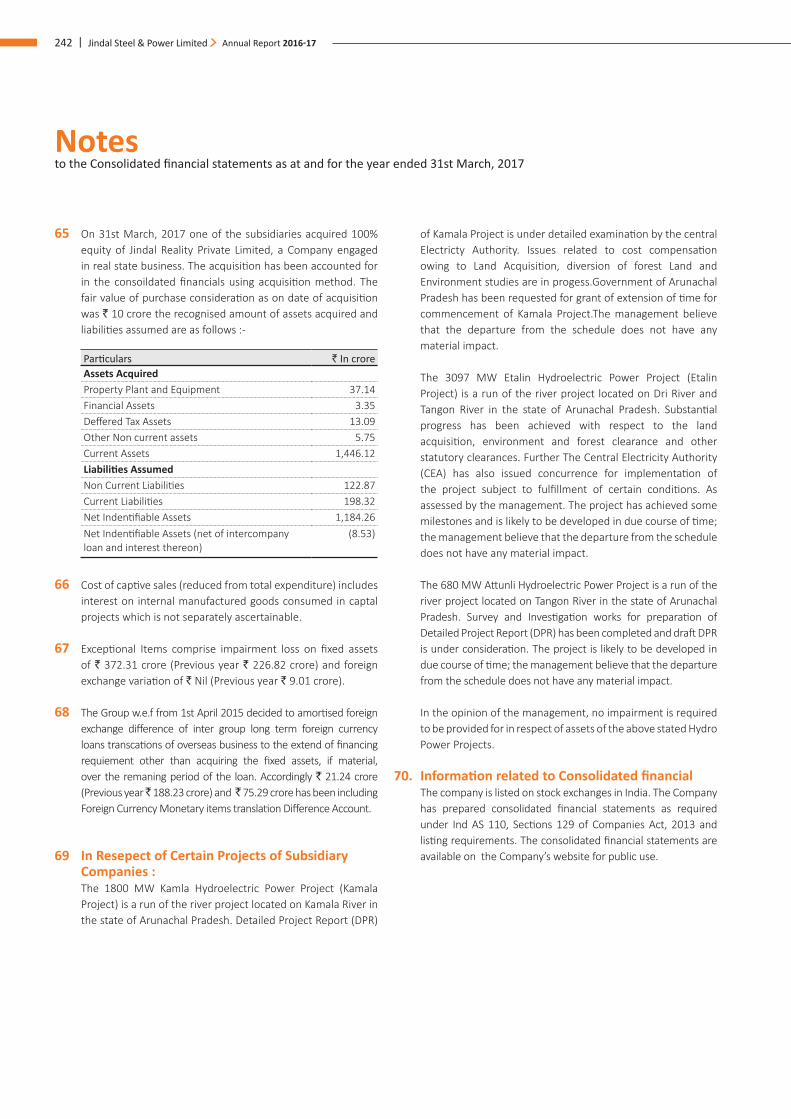
Notes to the Consolidated financial statements as at and for the year ended 31st March, 2017
242 | Jindal Steel & Power Limited Annual Report 2016-17
65 On 31st March, 2017 one of the subsidiaries acquired 100% equity of Jindal Reality Private Limited, a Company engaged in real state business. The acquisition has been accounted for in the consoildated financials using acquisition method. The fair value of purchase consideration as on date of acquisition was ` 10 crore the recognised amount of assets acquired and liabilities assumed are as follows :-
Particulars ` In croreAssets AcquiredProperty Plant and Equipment 37.14 Financial Assets 3.35 Deffered Tax Assets 13.09 Other Non current assets 5.75 Current Assets 1,446.12 Liabilities AssumedNon Current Liabilities 122.87 Current Liabilities 198.32 Net Indentifiable Assets 1,184.26 Net Indentifiable Assets (net of intercompany loan and interest thereon)
(8.53)
66 Cost of captive sales (reduced from total expenditure) includes interest on internal manufactured goods consumed in captal projects which is not separately ascertainable.
67 Exceptional Items comprise impairment loss on fixed assets of ` 372.31 crore (Previous year ` 226.82 crore) and foreign exchange variation of ` Nil (Previous year ` 9.01 crore).
68 The Group w.e.f from 1st April 2015 decided to amortised foreign exchange difference of inter group long term foreign currency loans transcations of overseas business to the extend of financing requiement other than acquiring the fixed assets, if material, over the remaning period of the loan. Accordingly ` 21.24 crore (Previous year ̀ 188.23 crore) and ̀ 75.29 crore has been including Foreign Currency Monetary items translation Difference Account.
69 In Resepect of Certain Projects of Subsidiary Companies :
The 1800 MW Kamla Hydroelectric Power Project (Kamala Project) is a run of the river project located on Kamala River in the state of Arunachal Pradesh. Detailed Project Report (DPR)
of Kamala Project is under detailed examination by the central Electricty Authority. Issues related to cost compensation owing to Land Acquisition, diversion of forest Land and Environment studies are in progess.Government of Arunachal Pradesh has been requested for grant of extension of time for commencement of Kamala Project.The management believe that the departure from the schedule does not have any material impact.
The 3097 MW Etalin Hydroelectric Power Project (Etalin Project) is a run of the river project located on Dri River and Tangon River in the state of Arunachal Pradesh. Substantial progress has been achieved with respect to the land acquisition, environment and forest clearance and other statutory clearances. Further The Central Electricity Authority (CEA) has also issued concurrence for implementation of the project subject to fulfillment of certain conditions. As assessed by the management. The project has achieved some milestones and is likely to be developed in due course of time; the management believe that the departure from the schedule does not have any material impact.
The 680 MW Attunli Hydroelectric Power Project is a run of the river project located on Tangon River in the state of Arunachal Pradesh. Survey and Investigation works for preparation of Detailed Project Report (DPR) has been completed and draft DPR is under consideration. The project is likely to be developed in due course of time; the management believe that the departure from the schedule does not have any material impact.
In the opinion of the management, no impairment is required to be provided for in respect of assets of the above stated Hydro Power Projects.
70. Information related to Consolidated financial The company is listed on stock exchanges in India. The Company
has prepared consolidated financial statements as required under Ind AS 110, Sections 129 of Companies Act, 2013 and listing requirements. The consolidated financial statements are available on the Company’s website for public use.
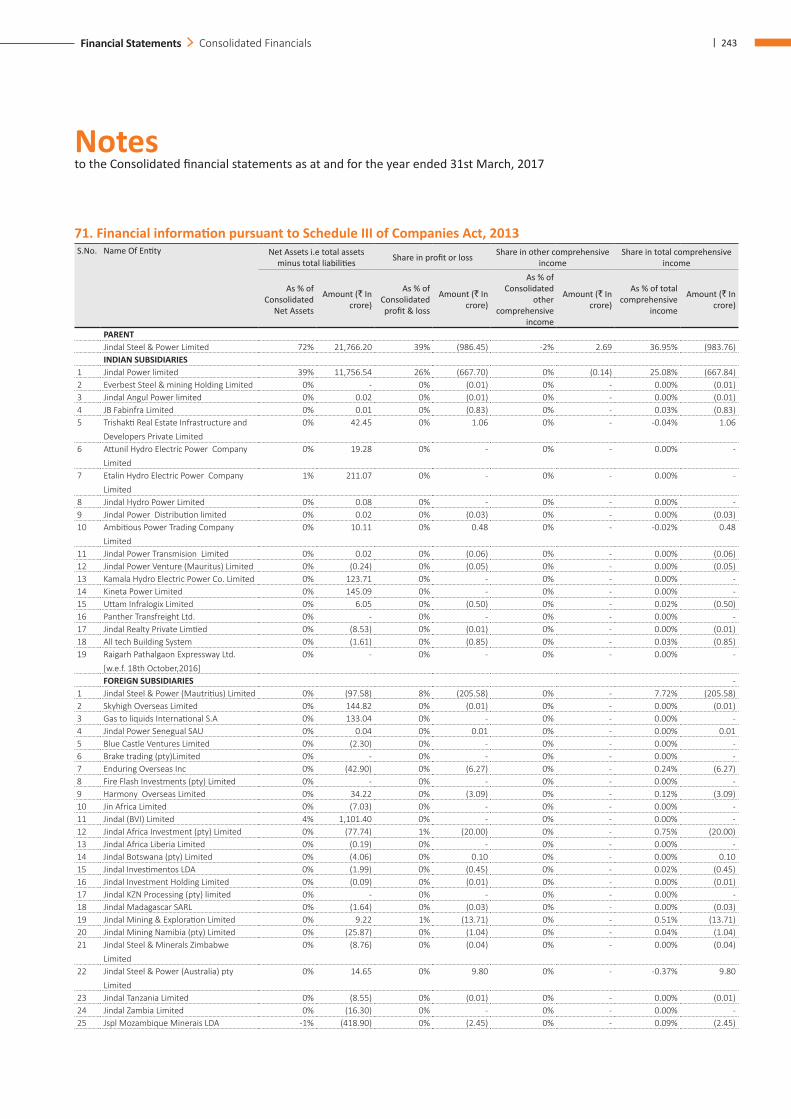
Notes to the Consolidated financial statements as at and for the year ended 31st March, 2017
| 243Financial Statements Consolidated Financials
71. Financial information pursuant to Schedule III of Companies Act, 2013S.No. Name Of Entity Net Assets i.e total assets
minus total liabilities Share in profit or loss Share in other comprehensive income
Share in total comprehensive income
As % of Consolidated
Net Assets
Amount (` In crore)
As % of Consolidated profit & loss
Amount (` In crore)
As % of Consolidated
other comprehensive
income
Amount (` In crore)
As % of total comprehensive
income
Amount (` In crore)
PARENT Jindal Steel & Power Limited 72% 21,766.20 39% (986.45) -2% 2.69 36.95% (983.76)INDIAN SUBSIDIARIES
1 Jindal Power limited 39% 11,756.54 26% (667.70) 0% (0.14) 25.08% (667.84)2 Everbest Steel & mining Holding Limited 0% - 0% (0.01) 0% - 0.00% (0.01)3 Jindal Angul Power limited 0% 0.02 0% (0.01) 0% - 0.00% (0.01)4 JB Fabinfra Limited 0% 0.01 0% (0.83) 0% - 0.03% (0.83)5 Trishakti Real Estate Infrastructure and
Developers Private Limited0% 42.45 0% 1.06 0% - -0.04% 1.06
6 Attunil Hydro Electric Power Company Limited
0% 19.28 0% - 0% - 0.00% -
7 Etalin Hydro Electric Power Company Limited
1% 211.07 0% - 0% - 0.00% -
8 Jindal Hydro Power Limited 0% 0.08 0% - 0% - 0.00% - 9 Jindal Power Distribution limited 0% 0.02 0% (0.03) 0% - 0.00% (0.03)10 Ambitious Power Trading Company
Limited0% 10.11 0% 0.48 0% - -0.02% 0.48
11 Jindal Power Transmision Limited 0% 0.02 0% (0.06) 0% - 0.00% (0.06)12 Jindal Power Venture (Mauritus) Limited 0% (0.24) 0% (0.05) 0% - 0.00% (0.05)13 Kamala Hydro Electric Power Co. Limited 0% 123.71 0% - 0% - 0.00% - 14 Kineta Power Limited 0% 145.09 0% - 0% - 0.00% - 15 Uttam Infralogix Limited 0% 6.05 0% (0.50) 0% - 0.02% (0.50)16 Panther Transfreight Ltd. 0% - 0% - 0% - 0.00% - 17 Jindal Realty Private Limtied 0% (8.53) 0% (0.01) 0% - 0.00% (0.01)18 All tech Building System 0% (1.61) 0% (0.85) 0% - 0.03% (0.85)19 Raigarh Pathalgaon Expressway Ltd.
[w.e.f. 18th October,2016]0% - 0% - 0% - 0.00% -
FOREIGN SUBSIDIARIES - 1 Jindal Steel & Power (Mautritius) Limited 0% (97.58) 8% (205.58) 0% - 7.72% (205.58)2 Skyhigh Overseas Limited 0% 144.82 0% (0.01) 0% - 0.00% (0.01)3 Gas to liquids International S.A 0% 133.04 0% - 0% - 0.00% - 4 Jindal Power Senegual SAU 0% 0.04 0% 0.01 0% - 0.00% 0.01 5 Blue Castle Ventures Limited 0% (2.30) 0% - 0% - 0.00% - 6 Brake trading (pty)Limited 0% - 0% - 0% - 0.00% - 7 Enduring Overseas Inc 0% (42.90) 0% (6.27) 0% - 0.24% (6.27)8 Fire Flash Investments (pty) Limited 0% - 0% - 0% - 0.00% - 9 Harmony Overseas Limited 0% 34.22 0% (3.09) 0% - 0.12% (3.09)10 Jin Africa Limited 0% (7.03) 0% - 0% - 0.00% - 11 Jindal (BVI) Limited 4% 1,101.40 0% - 0% - 0.00% - 12 Jindal Africa Investment (pty) Limited 0% (77.74) 1% (20.00) 0% - 0.75% (20.00)13 Jindal Africa Liberia Limited 0% (0.19) 0% - 0% - 0.00% - 14 Jindal Botswana (pty) Limited 0% (4.06) 0% 0.10 0% - 0.00% 0.10 15 Jindal Investimentos LDA 0% (1.99) 0% (0.45) 0% - 0.02% (0.45)16 Jindal Investment Holding Limited 0% (0.09) 0% (0.01) 0% - 0.00% (0.01)17 Jindal KZN Processing (pty) limited 0% - 0% - 0% - 0.00% - 18 Jindal Madagascar SARL 0% (1.64) 0% (0.03) 0% - 0.00% (0.03)19 Jindal Mining & Exploration Limited 0% 9.22 1% (13.71) 0% - 0.51% (13.71)20 Jindal Mining Namibia (pty) Limited 0% (25.87) 0% (1.04) 0% - 0.04% (1.04)21 Jindal Steel & Minerals Zimbabwe
Limited0% (8.76) 0% (0.04) 0% - 0.00% (0.04)
22 Jindal Steel & Power (Australia) pty Limited
0% 14.65 0% 9.80 0% - -0.37% 9.80
23 Jindal Tanzania Limited 0% (8.55) 0% (0.01) 0% - 0.00% (0.01)24 Jindal Zambia Limited 0% (16.30) 0% - 0% - 0.00% - 25 Jspl Mozambique Minerais LDA -1% (418.90) 0% (2.45) 0% - 0.09% (2.45)
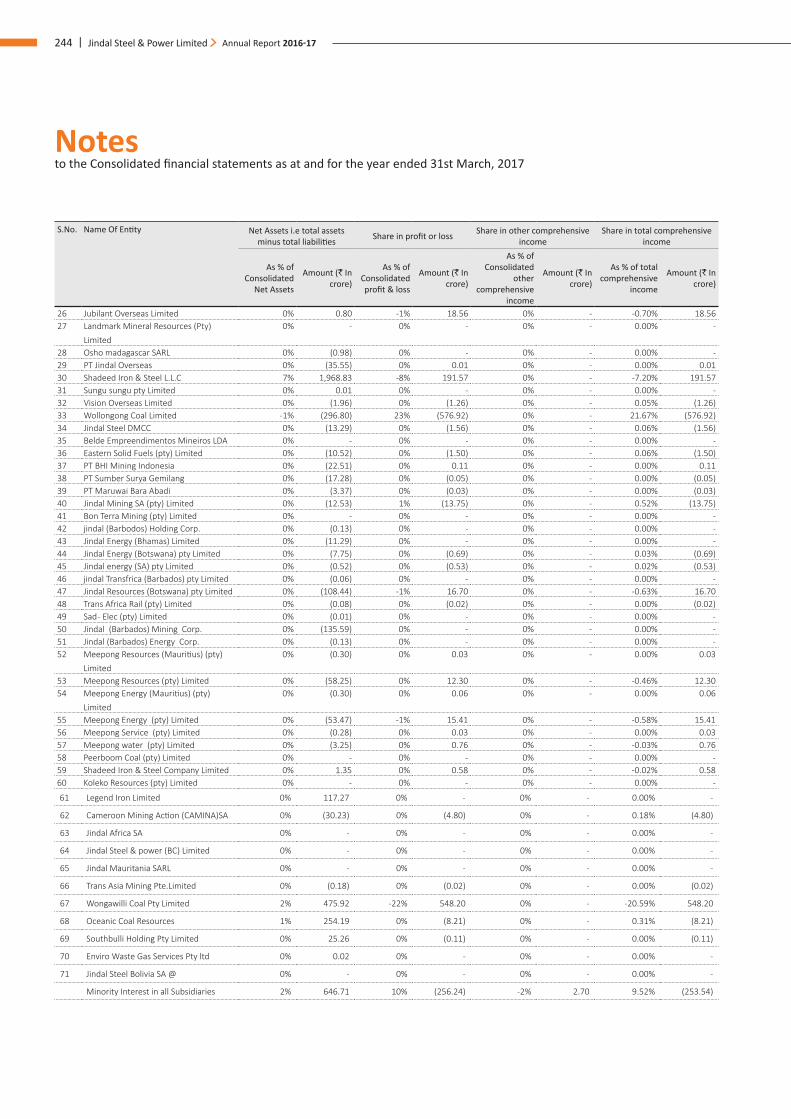
Notes to the Consolidated financial statements as at and for the year ended 31st March, 2017
244 | Jindal Steel & Power Limited Annual Report 2016-17
S.No. Name Of Entity Net Assets i.e total assets minus total liabilities Share in profit or loss Share in other comprehensive
incomeShare in total comprehensive
income
As % of Consolidated
Net Assets
Amount (` In crore)
As % of Consolidated profit & loss
Amount (` In crore)
As % of Consolidated
other comprehensive
income
Amount (` In crore)
As % of total comprehensive
income
Amount (` In crore)
26 Jubilant Overseas Limited 0% 0.80 -1% 18.56 0% - -0.70% 18.56 27 Landmark Mineral Resources (Pty)
Limited0% - 0% - 0% - 0.00% -
28 Osho madagascar SARL 0% (0.98) 0% - 0% - 0.00% - 29 PT Jindal Overseas 0% (35.55) 0% 0.01 0% - 0.00% 0.01 30 Shadeed Iron & Steel L.L.C 7% 1,968.83 -8% 191.57 0% - -7.20% 191.57 31 Sungu sungu pty Limited 0% 0.01 0% - 0% - 0.00% - 32 Vision Overseas Limited 0% (1.96) 0% (1.26) 0% - 0.05% (1.26)33 Wollongong Coal Limited -1% (296.80) 23% (576.92) 0% - 21.67% (576.92)34 Jindal Steel DMCC 0% (13.29) 0% (1.56) 0% - 0.06% (1.56)35 Belde Empreendimentos Mineiros LDA 0% - 0% - 0% - 0.00% - 36 Eastern Solid Fuels (pty) Limited 0% (10.52) 0% (1.50) 0% - 0.06% (1.50)37 PT BHI Mining Indonesia 0% (22.51) 0% 0.11 0% - 0.00% 0.11 38 PT Sumber Surya Gemilang 0% (17.28) 0% (0.05) 0% - 0.00% (0.05)39 PT Maruwai Bara Abadi 0% (3.37) 0% (0.03) 0% - 0.00% (0.03)40 Jindal Mining SA (pty) Limited 0% (12.53) 1% (13.75) 0% - 0.52% (13.75)41 Bon Terra Mining (pty) Limited 0% - 0% - 0% - 0.00% - 42 jindal (Barbodos) Holding Corp. 0% (0.13) 0% - 0% - 0.00% - 43 Jindal Energy (Bhamas) Limited 0% (11.29) 0% - 0% - 0.00% - 44 Jindal Energy (Botswana) pty Limited 0% (7.75) 0% (0.69) 0% - 0.03% (0.69)45 Jindal energy (SA) pty Limited 0% (0.52) 0% (0.53) 0% - 0.02% (0.53)46 jindal Transfrica (Barbados) pty Limited 0% (0.06) 0% - 0% - 0.00% - 47 Jindal Resources (Botswana) pty Limited 0% (108.44) -1% 16.70 0% - -0.63% 16.70 48 Trans Africa Rail (pty) Limited 0% (0.08) 0% (0.02) 0% - 0.00% (0.02)49 Sad - Elec (pty) Limited 0% (0.01) 0% - 0% - 0.00% - 50 Jindal (Barbados) Mining Corp. 0% (135.59) 0% - 0% - 0.00% - 51 Jindal (Barbados) Energy Corp. 0% (0.13) 0% - 0% - 0.00% - 52 Meepong Resources (Mauritius) (pty)
Limited0% (0.30) 0% 0.03 0% - 0.00% 0.03
53 Meepong Resources (pty) Limited 0% (58.25) 0% 12.30 0% - -0.46% 12.30 54 Meepong Energy (Mauritius) (pty)
Limited0% (0.30) 0% 0.06 0% - 0.00% 0.06
55 Meepong Energy (pty) Limited 0% (53.47) -1% 15.41 0% - -0.58% 15.41 56 Meepong Service (pty) Limited 0% (0.28) 0% 0.03 0% - 0.00% 0.03 57 Meepong water (pty) Limited 0% (3.25) 0% 0.76 0% - -0.03% 0.76 58 Peerboom Coal (pty) Limited 0% - 0% - 0% - 0.00% - 59 Shadeed Iron & Steel Company Limited 0% 1.35 0% 0.58 0% - -0.02% 0.58 60 Koleko Resources (pty) Limited 0% - 0% - 0% - 0.00% -
61 Legend Iron Limited 0% 117.27 0% - 0% - 0.00% -
62 Cameroon Mining Action (CAMINA)SA 0% (30.23) 0% (4.80) 0% - 0.18% (4.80)
63 Jindal Africa SA 0% - 0% - 0% - 0.00% -
64 Jindal Steel & power (BC) Limited 0% - 0% - 0% - 0.00% -
65 Jindal Mauritania SARL 0% - 0% - 0% - 0.00% -
66 Trans Asia Mining Pte.Limited 0% (0.18) 0% (0.02) 0% - 0.00% (0.02)
67 Wongawilli Coal Pty Limited 2% 475.92 -22% 548.20 0% - -20.59% 548.20
68 Oceanic Coal Resources 1% 254.19 0% (8.21) 0% - 0.31% (8.21)
69 Southbulli Holding Pty Limited 0% 25.26 0% (0.11) 0% - 0.00% (0.11)
70 Enviro Waste Gas Services Pty ltd 0% 0.02 0% - 0% - 0.00% -
71 Jindal Steel Bolivia SA @ 0% - 0% - 0% - 0.00% -
Minority Interest in all Subsidiaries 2% 646.71 10% (256.24) -2% 2.70 9.52% (253.54)
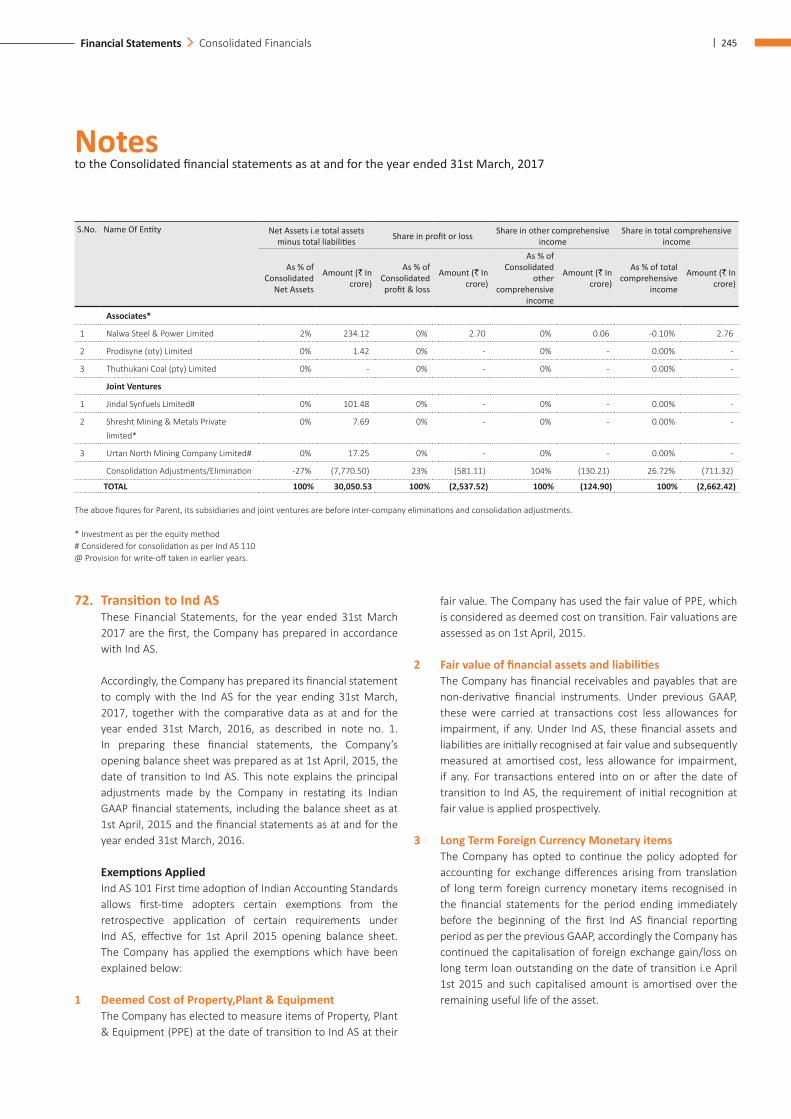
Notes to the Consolidated financial statements as at and for the year ended 31st March, 2017
| 245Financial Statements Consolidated Financials
72. Transition to Ind AS These Financial Statements, for the year ended 31st March
2017 are the first, the Company has prepared in accordance with Ind AS.
Accordingly, the Company has prepared its financial statement to comply with the Ind AS for the year ending 31st March, 2017, together with the comparative data as at and for the year ended 31st March, 2016, as described in note no. 1. In preparing these financial statements, the Company’s opening balance sheet was prepared as at 1st April, 2015, the date of transition to Ind AS. This note explains the principal adjustments made by the Company in restating its Indian GAAP financial statements, including the balance sheet as at 1st April, 2015 and the financial statements as at and for the year ended 31st March, 2016.
Exemptions Applied Ind AS 101 First time adoption of Indian Accounting Standards
allows first-time adopters certain exemptions from the retrospective application of certain requirements under Ind AS, effective for 1st April 2015 opening balance sheet.The Company has applied the exemptions which have been explained below:
1 Deemed Cost of Property,Plant & Equipment The Company has elected to measure items of Property, Plant
& Equipment (PPE) at the date of transition to Ind AS at their
S.No. Name Of Entity Net Assets i.e total assets minus total liabilities Share in profit or loss Share in other comprehensive
incomeShare in total comprehensive
income
As % of Consolidated
Net Assets
Amount (` In crore)
As % of Consolidated profit & loss
Amount (` In crore)
As % of Consolidated
other comprehensive
income
Amount (` In crore)
As % of total comprehensive
income
Amount (` In crore)
Associates*
1 Nalwa Steel & Power Limited 2% 234.12 0% 2.70 0% 0.06 -0.10% 2.76
2 Prodisyne (oty) Limited 0% 1.42 0% - 0% - 0.00% -
3 Thuthukani Coal (pty) Limited 0% - 0% - 0% - 0.00% -
Joint Ventures
1 Jindal Synfuels Limited# 0% 101.48 0% - 0% - 0.00% -
2 Shresht Mining & Metals Private limited*
0% 7.69 0% - 0% - 0.00% -
3 Urtan North Mining Company Limited# 0% 17.25 0% - 0% - 0.00% -
Consolidation Adjustments/Elimination -27% (7,770.50) 23% (581.11) 104% (130.21) 26.72% (711.32)
TOTAL 100% 30,050.53 100% (2,537.52) 100% (124.90) 100% (2,662.42)
The above fiqures for Parent, its subsidiaries and joint ventures are before inter-company eliminations and consolidation adjustments. * Investment as per the equity method # Considered for consolidation as per Ind AS 110 @ Provision for write-off taken in earlier years.
fair value. The Company has used the fair value of PPE, which is considered as deemed cost on transition. Fair valuations are assessed as on 1st April, 2015.
2 Fair value of financial assets and liabilities The Company has financial receivables and payables that are
non-derivative financial instruments. Under previous GAAP, these were carried at transactions cost less allowances for impairment, if any. Under Ind AS, these financial assets and liabilities are initially recognised at fair value and subsequently measured at amortised cost, less allowance for impairment, if any. For transactions entered into on or after the date of transition to Ind AS, the requirement of initial recognition at fair value is applied prospectively.
3 Long Term Foreign Currency Monetary items The Company has opted to continue the policy adopted for
accounting for exchange differences arising from translation of long term foreign currency monetary items recognised in the financial statements for the period ending immediately before the beginning of the first Ind AS financial reporting period as per the previous GAAP, accordingly the Company has continued the capitalisation of foreign exchange gain/loss on long term loan outstanding on the date of transition i.e April 1st 2015 and such capitalised amount is amortised over the remaining useful life of the asset.
Notes to the Consolidated financial statements as at and for the year ended 31st March, 2017
246 | Jindal Steel & Power Limited Annual Report 2016-17
4 Investments in Subsidiaries, joint ventures and associates The Company has elected to apply previous GAAP carrying amount
of its investment in equity shares in subsidiaries, associates and joint ventures as deeemed cost as on the date of transition to Ind AS. However, the debt instruments in subsidiaries, associates and joint ventures are recognised at amortized cost.
5 Leases The Company has applied the transition provision in Appendix
C of Ind AS 17, “Determining whether an arrangement contains a Lease”, and has assessed all arrangement as at the date of transition.
Estimates The estimates at 1st April, 2015 and at 31st March, 2016 are
consistent with those made for the same dates in accordance with Indian GAAP (after adjustments to reflect any differences if any, in accounting policies) apart from the following items where application of Indian GAAP did not require estimation:
- Impairment of financial assets based on expected credit loss method.
- Investment in debt instruments carried at Amortized Cost.
- Investment in equity instruments carried at Fair value through profit or loss
The estimates used by the Company to present these amounts in accordance with Ind AS reflect conditions as at the transition date and as of 31st March, 2016.
Exceptions to retrospective application of Ind AS1 Classification and measurement of financial assets The Company has classified the financial assets in accordance
with Ind AS 109 on the basis of facts and circumstances that exists at the date of transition to Ind AS.
2 Derecognistion of financial assets & financial liabilities The Company has elected to apply the derecognition
requirements for financial assets & financial liabilities in accordance with Ind AS 109 prospectively for transactions occuring on or after the date of transition to Ind AS.
Impact of transition to IND AS The following is a summary of the effects of the differences
between Ind AS and Indian GAAP on the Company’s total equity shareholders’ funds and profit and loss for the financial period for the periods previously reported under Indian GAAP following the date of transition to Ind AS.
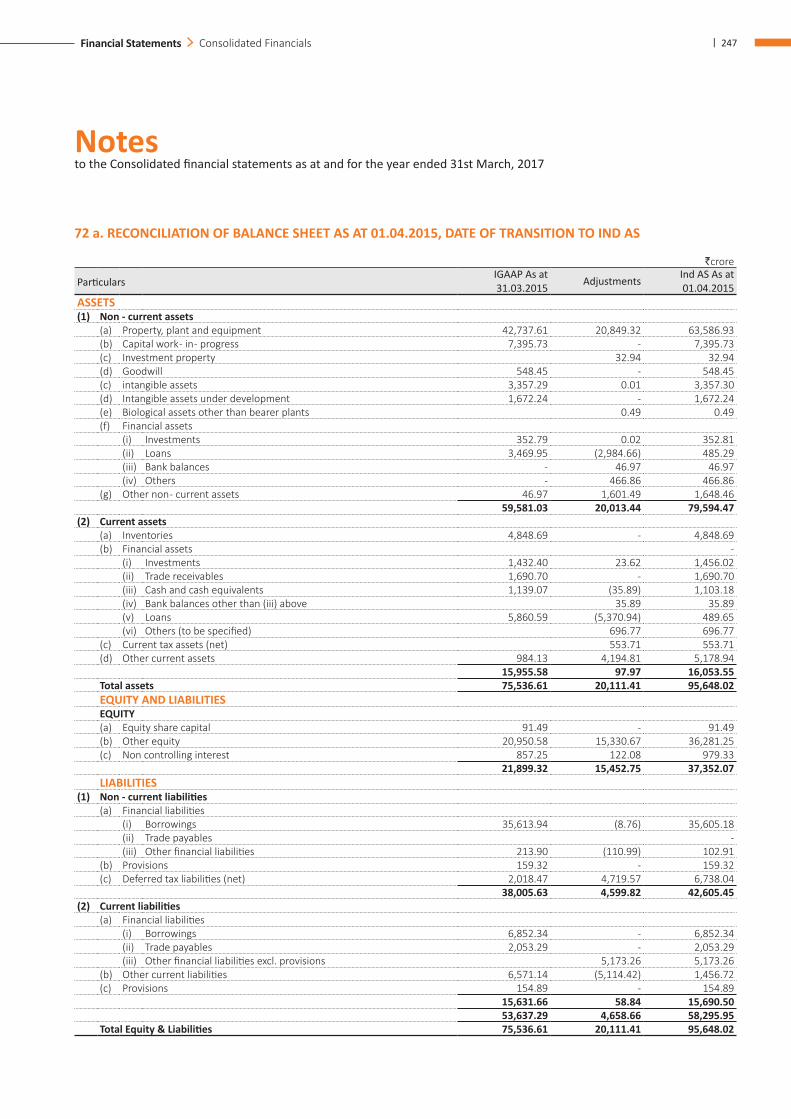
Notes to the Consolidated financial statements as at and for the year ended 31st March, 2017
| 247Financial Statements Consolidated Financials
72 a. RECONCILIATION OF BALANCE SHEET AS AT 01.04.2015, DATE OF TRANSITION TO IND AS
`crore
ParticularsIGAAP As at 31.03.2015 Adjustments Ind AS As at
01.04.2015 ASSETS(1) Non - current assets
(a) Property, plant and equipment 42,737.61 20,849.32 63,586.93 (b) Capital work - in - progress 7,395.73 - 7,395.73 (c) Investment property 32.94 32.94 (d) Goodwill 548.45 - 548.45 (c) intangible assets 3,357.29 0.01 3,357.30 (d) Intangible assets under development 1,672.24 - 1,672.24 (e) Biological assets other than bearer plants 0.49 0.49 (f) Financial assets
(i) Investments 352.79 0.02 352.81 (ii) Loans 3,469.95 (2,984.66) 485.29 (iii) Bank balances - 46.97 46.97 (iv) Others - 466.86 466.86
(g) Other non - current assets 46.97 1,601.49 1,648.46 59,581.03 20,013.44 79,594.47
(2) Current assets(a) Inventories 4,848.69 - 4,848.69 (b) Financial assets -
(i) Investments 1,432.40 23.62 1,456.02 (ii) Trade receivables 1,690.70 - 1,690.70 (iii) Cash and cash equivalents 1,139.07 (35.89) 1,103.18 (iv) Bank balances other than (iii) above 35.89 35.89 (v) Loans 5,860.59 (5,370.94) 489.65 (vi) Others (to be specified) 696.77 696.77
(c) Current tax assets (net) 553.71 553.71 (d) Other current assets 984.13 4,194.81 5,178.94
15,955.58 97.97 16,053.55 Total assets 75,536.61 20,111.41 95,648.02 EQUITY AND LIABILITIESEQUITY(a) Equity share capital 91.49 - 91.49 (b) Other equity 20,950.58 15,330.67 36,281.25 (c) Non controlling interest 857.25 122.08 979.33
21,899.32 15,452.75 37,352.07 LIABILITIES
(1) Non - current liabilities(a) Financial liabilities
(i) Borrowings 35,613.94 (8.76) 35,605.18 (ii) Trade payables - (iii) Other financial liabilities 213.90 (110.99) 102.91
(b) Provisions 159.32 - 159.32 (c) Deferred tax liabilities (net) 2,018.47 4,719.57 6,738.04
38,005.63 4,599.82 42,605.45 (2) Current liabilities
(a) Financial liabilities(i) Borrowings 6,852.34 - 6,852.34 (ii) Trade payables 2,053.29 - 2,053.29 (iii) Other financial liabilities excl. provisions 5,173.26 5,173.26
(b) Other current liabilities 6,571.14 (5,114.42) 1,456.72 (c) Provisions 154.89 - 154.89
15,631.66 58.84 15,690.50 53,637.29 4,658.66 58,295.95
Total Equity & Liabilities 75,536.61 20,111.41 95,648.02
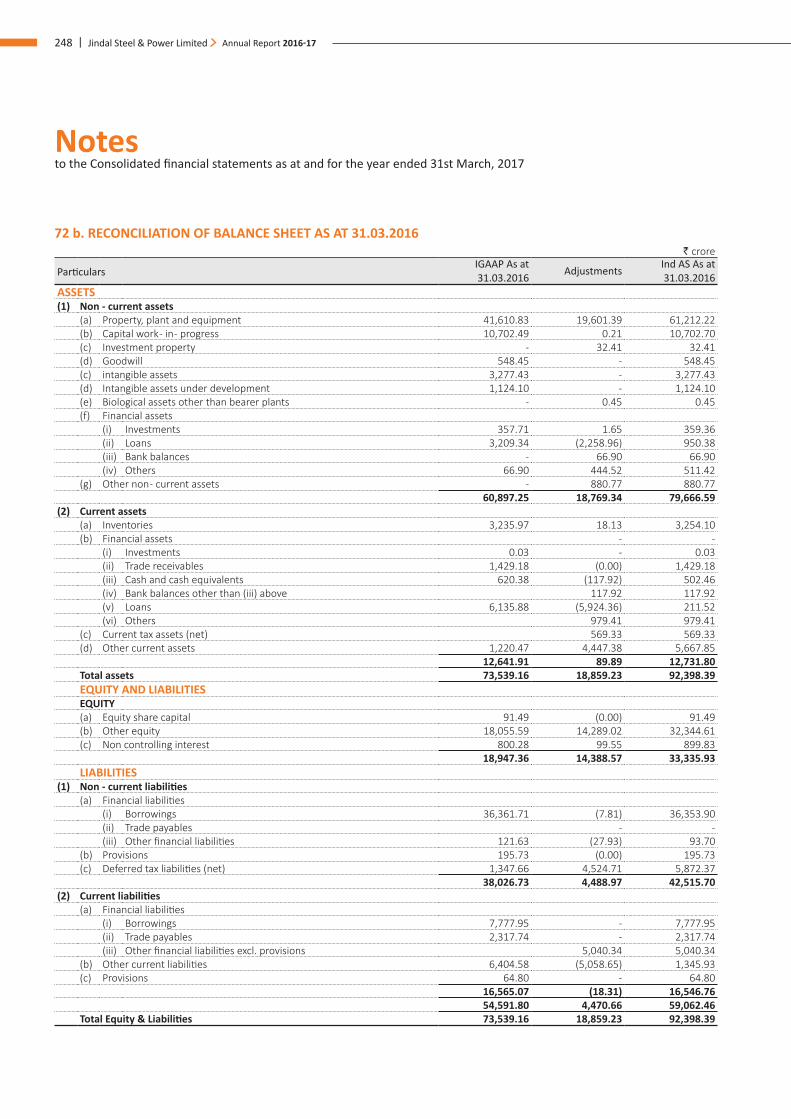
Notes to the Consolidated financial statements as at and for the year ended 31st March, 2017
248 | Jindal Steel & Power Limited Annual Report 2016-17
72 b. RECONCILIATION OF BALANCE SHEET AS AT 31.03.2016 ` crore
ParticularsIGAAP As at 31.03.2016 Adjustments Ind AS As at
31.03.2016ASSETS(1) Non - current assets
(a) Property, plant and equipment 41,610.83 19,601.39 61,212.22 (b) Capital work - in - progress 10,702.49 0.21 10,702.70 (c) Investment property - 32.41 32.41 (d) Goodwill 548.45 - 548.45 (c) intangible assets 3,277.43 - 3,277.43 (d) Intangible assets under development 1,124.10 - 1,124.10 (e) Biological assets other than bearer plants - 0.45 0.45 (f) Financial assets
(i) Investments 357.71 1.65 359.36 (ii) Loans 3,209.34 (2,258.96) 950.38 (iii) Bank balances - 66.90 66.90 (iv) Others 66.90 444.52 511.42
(g) Other non - current assets - 880.77 880.77 60,897.25 18,769.34 79,666.59
(2) Current assets(a) Inventories 3,235.97 18.13 3,254.10 (b) Financial assets - -
(i) Investments 0.03 - 0.03 (ii) Trade receivables 1,429.18 (0.00) 1,429.18 (iii) Cash and cash equivalents 620.38 (117.92) 502.46 (iv) Bank balances other than (iii) above 117.92 117.92 (v) Loans 6,135.88 (5,924.36) 211.52 (vi) Others 979.41 979.41
(c) Current tax assets (net) 569.33 569.33 (d) Other current assets 1,220.47 4,447.38 5,667.85
12,641.91 89.89 12,731.80 Total assets 73,539.16 18,859.23 92,398.39 EQUITY AND LIABILITIESEQUITY(a) Equity share capital 91.49 (0.00) 91.49 (b) Other equity 18,055.59 14,289.02 32,344.61 (c) Non controlling interest 800.28 99.55 899.83
18,947.36 14,388.57 33,335.93 LIABILITIES
(1) Non - current liabilities(a) Financial liabilities
(i) Borrowings 36,361.71 (7.81) 36,353.90 (ii) Trade payables - - (iii) Other financial liabilities 121.63 (27.93) 93.70
(b) Provisions 195.73 (0.00) 195.73 (c) Deferred tax liabilities (net) 1,347.66 4,524.71 5,872.37
38,026.73 4,488.97 42,515.70 (2) Current liabilities
(a) Financial liabilities(i) Borrowings 7,777.95 - 7,777.95 (ii) Trade payables 2,317.74 - 2,317.74 (iii) Other financial liabilities excl. provisions 5,040.34 5,040.34
(b) Other current liabilities 6,404.58 (5,058.65) 1,345.93 (c) Provisions 64.80 - 64.80
16,565.07 (18.31) 16,546.76 54,591.80 4,470.66 59,062.46
Total Equity & Liabilities 73,539.16 18,859.23 92,398.39
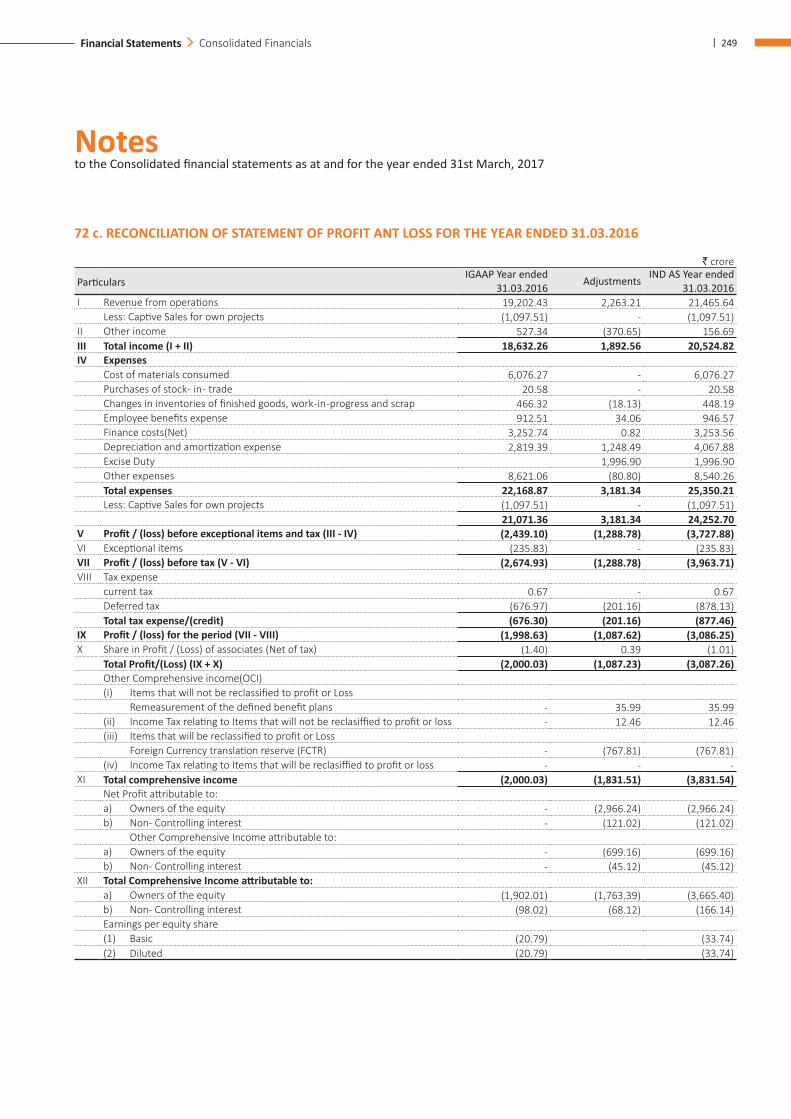
Notes to the Consolidated financial statements as at and for the year ended 31st March, 2017
| 249Financial Statements Consolidated Financials
72 c. RECONCILIATION OF STATEMENT OF PROFIT ANT LOSS FOR THE YEAR ENDED 31.03.2016
` crore
ParticularsIGAAP Year ended
31.03.2016 Adjustments IND AS Year ended 31.03.2016
I Revenue from operations 19,202.43 2,263.21 21,465.64 Less: Captive Sales for own projects (1,097.51) - (1,097.51)
II Other income 527.34 (370.65) 156.69 III Total income (I + II) 18,632.26 1,892.56 20,524.82 IV Expenses
Cost of materials consumed 6,076.27 - 6,076.27 Purchases of stock - in - trade 20.58 - 20.58 Changes in inventories of finished goods, work -in -progress and scrap 466.32 (18.13) 448.19 Employee benefits expense 912.51 34.06 946.57 Finance costs(Net) 3,252.74 0.82 3,253.56 Depreciation and amortization expense 2,819.39 1,248.49 4,067.88 Excise Duty 1,996.90 1,996.90 Other expenses 8,621.06 (80.80) 8,540.26 Total expenses 22,168.87 3,181.34 25,350.21 Less: Captive Sales for own projects (1,097.51) - (1,097.51)
21,071.36 3,181.34 24,252.70 V Profit / (loss) before exceptional items and tax (III - IV) (2,439.10) (1,288.78) (3,727.88)VI Exceptional items (235.83) - (235.83)VII Profit / (loss) before tax (V - VI) (2,674.93) (1,288.78) (3,963.71)VIII Tax expense
current tax 0.67 - 0.67 Deferred tax (676.97) (201.16) (878.13)Total tax expense/(credit) (676.30) (201.16) (877.46)
IX Profit / (loss) for the period (VII - VIII) (1,998.63) (1,087.62) (3,086.25)X Share in Profit / (Loss) of associates (Net of tax) (1.40) 0.39 (1.01)
Total Profit/(Loss) (IX + X) (2,000.03) (1,087.23) (3,087.26)Other Comprehensive income(OCI)(i) Items that will not be reclassified to profit or Loss Remeasurement of the defined benefit plans - 35.99 35.99 (ii) Income Tax relating to Items that will not be reclasiffied to profit or loss - 12.46 12.46 (iii) Items that will be reclassified to profit or Loss Foreign Currency translation reserve (FCTR) - (767.81) (767.81)(iv) Income Tax relating to Items that will be reclasiffied to profit or loss - - -
XI Total comprehensive income (2,000.03) (1,831.51) (3,831.54)Net Profit attributable to:a) Owners of the equity - (2,966.24) (2,966.24)b) Non- Controlling interest - (121.02) (121.02) Other Comprehensive Income attributable to:a) Owners of the equity - (699.16) (699.16)b) Non- Controlling interest - (45.12) (45.12)
XII Total Comprehensive Income attributable to:a) Owners of the equity (1,902.01) (1,763.39) (3,665.40)b) Non- Controlling interest (98.02) (68.12) (166.14)Earnings per equity share(1) Basic (20.79) (33.74)(2) Diluted (20.79) (33.74)
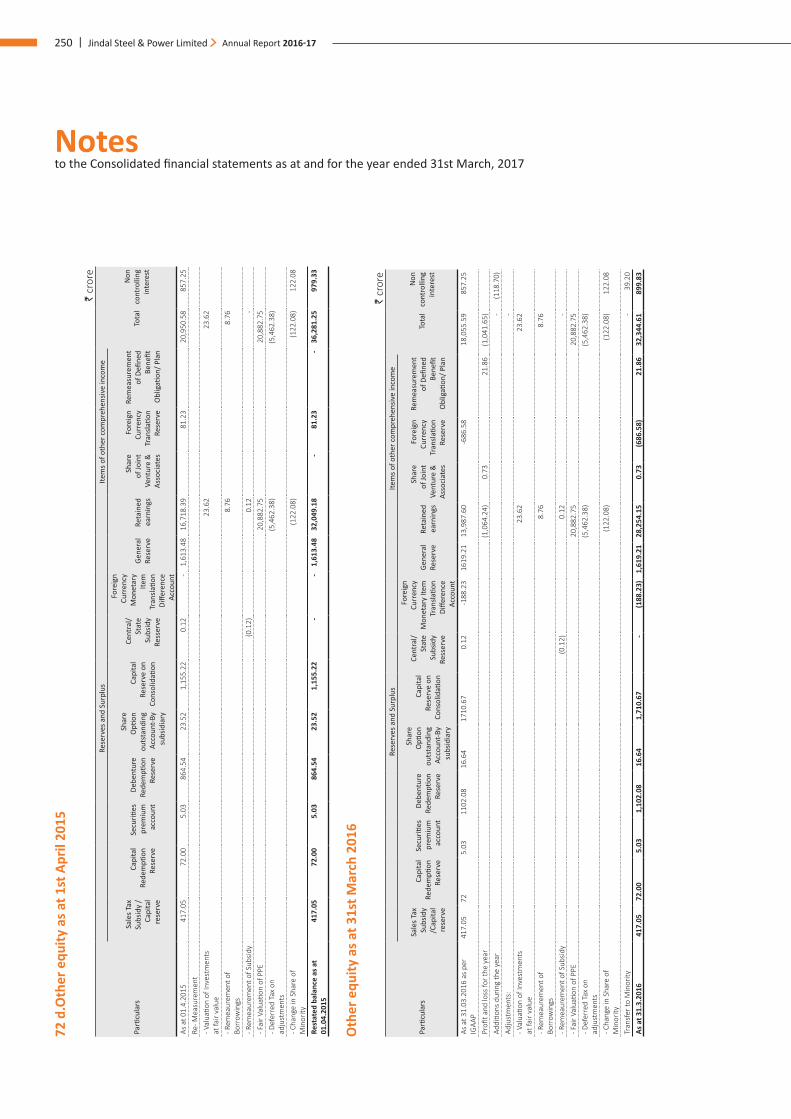
Notes to the Consolidated financial statements as at and for the year ended 31st March, 2017
250 | Jindal Steel & Power Limited Annual Report 2016-17
72 d
.Oth
er e
quity
as a
t 1st
Apr
il 20
15
` cr
ore
Parti
cula
rs
Rese
rves
and
Sur
plus
Item
s of o
ther
com
preh
ensiv
e in
com
e
Tota
lN
on
cont
rolli
ng
inte
rest
Sale
s Tax
Su
bsid
y /
Capi
tal
rese
rve
Capi
tal
Rede
mpti
on
Rese
rve
Secu
rities
pr
emiu
m
acco
unt
Debe
ntur
e Re
dem
ption
Re
serv
e
Shar
e O
ption
ou
tsta
ndin
g Ac
coun
t-By
subs
idia
ry
Capi
tal
Rese
rve
on
Cons
olid
ation
Cent
ral/
Stat
e Su
bsid
y Re
sser
ve
Fore
ign
Curr
ency
M
onet
ary
Item
Tr
ansla
tion
Diffe
renc
e Ac
coun
t
Gene
ral
Rese
rve
Reta
ined
ea
rnin
gs
Shar
e of
Join
t Ve
ntur
e &
As
soci
ates
Fore
ign
Curr
ency
Tr
ansla
tion
Rese
rve
Rem
easu
rem
ent
of D
efine
d Be
nefit
O
blig
ation
/ Pla
n
As a
t 01.
4.20
15 4
17.0
5 7
2.00
5
.03
864
.54
23.
52
1,1
55.2
2 0
.12
- 1
,613
.48
16,
718.
39
81.
23
20,
950.
58
857
.25
Re- M
easu
rem
ent
- Val
uatio
n of
Inve
stm
ents
at
fair
valu
e 2
3.62
2
3.62
- Rem
eaur
emen
t of
Borr
owin
gs 8
.76
8.7
6
- Rem
eaur
emen
t of S
ubsid
y (0
.12)
0.1
2 -
- Fai
r Val
uatio
n of
PPE
20,
882.
75
20,
882.
75
- Def
erre
d Ta
x on
ad
just
men
ts (5
,462
.38)
(5,4
62.3
8)
- Cha
nge
in S
hare
of
Min
ority
(122
.08)
(122
.08)
122
.08
Rest
ated
bal
ance
as a
t 01
.04.
2015
417
.05
72.
00
5.0
3 8
64.5
4 2
3.52
1
,155
.22
- -
1,6
13.4
8 3
2,04
9.18
-
81.
23
- 3
6,28
1.25
9
79.3
3
Oth
er e
quity
as a
t 31s
t Mar
ch 2
016
` cr
ore
Parti
cula
rs
Rese
rves
and
Sur
plus
Item
s of o
ther
com
preh
ensiv
e in
com
e
Tota
lN
on
cont
rolli
ng
inte
rest
Sale
s Tax
Su
bsid
y /C
apita
l re
serv
e
Capi
tal
Rede
mpti
on
Rese
rve
Secu
rities
pr
emiu
m
acco
unt
Debe
ntur
e Re
dem
ption
Re
serv
e
Shar
e O
ption
ou
tsta
ndin
g Ac
coun
t-By
subs
idia
ry
Capi
tal
Rese
rve
on
Cons
olid
ation
Cent
ral/
Stat
e Su
bsid
y Re
sser
ve
Fore
ign
Curr
ency
M
onet
ary
Item
Tr
ansla
tion
Diffe
renc
e Ac
coun
t
Gene
ral
Rese
rve
Reta
ined
ea
rnin
gs
Shar
e of
Join
t Ve
ntur
e &
As
soci
ates
Fore
ign
Curr
ency
Tr
ansla
tion
Rese
rve
Rem
easu
rem
ent
of D
efine
d Be
nefit
O
blig
ation
/ Pla
n
As a
t 31.
03.2
016
as p
er
IGAA
P41
7.05
725.
0311
02.0
816
.64
1710
.67
0.12
-188
.23
1619
.21
13,
987.
60
-686
.58
18,
055.
59
857.
25
Profi
t and
loss
for t
he y
ear
(1,0
64.2
4) 0
.73
21.8
6(1
,041
.65)
Addi
tions
dur
ing
the
year
- (1
18.7
0)Ad
just
men
ts:
- - V
alua
tion
of In
vest
men
ts
at fa
ir va
lue
23.
62
23.
62
- Rem
eaur
emen
t of
Borr
owin
gs 8
.76
8.7
6
- Rem
eaur
emen
t of S
ubsid
y (0
.12)
0.1
2 -
- Fai
r Val
uatio
n of
PPE
20,
882.
75
20,
882.
75
- Def
erre
d Ta
x on
ad
just
men
ts (5
,462
.38)
(5,4
62.3
8)
- Cha
nge
in S
hare
of
Min
ority
(122
.08)
(122
.08)
122
.08
Tran
sfer
to M
inor
ity -
39.
20
As a
t 31.
3.20
16 4
17.0
5 7
2.00
5
.03
1,1
02.0
8 1
6.64
1
,710
.67
- (1
88.2
3) 1
,619
.21
28,
254.
15
0.7
3 (6
86.5
8) 2
1.86
32
,344
.61
899
.83
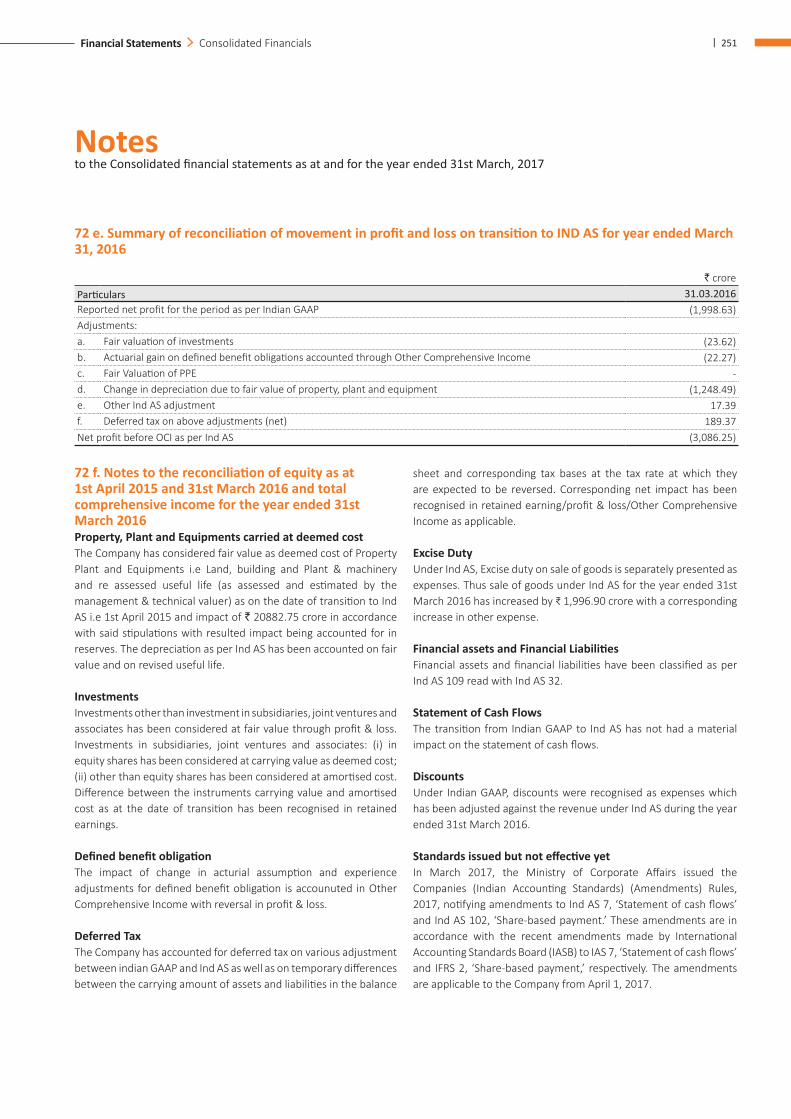
Notes to the Consolidated financial statements as at and for the year ended 31st March, 2017
| 251Financial Statements Consolidated Financials
72 e. Summary of reconciliation of movement in profit and loss on transition to IND AS for year ended March 31, 2016
` croreParticulars 31.03.2016Reported net profit for the period as per Indian GAAP (1,998.63) Adjustments:a. Fair valuation of investments (23.62) b. Actuarial gain on defined benefit obligations accounted through Other Comprehensive Income (22.27) c. Fair Valuation of PPE - d. Change in depreciation due to fair value of property, plant and equipment (1,248.49) e. Other Ind AS adjustment 17.39 f. Deferred tax on above adjustments (net) 189.37 Net profit before OCI as per Ind AS (3,086.25)
72 f. Notes to the reconciliation of equity as at 1st April 2015 and 31st March 2016 and total comprehensive income for the year ended 31st March 2016Property, Plant and Equipments carried at deemed costThe Company has considered fair value as deemed cost of Property Plant and Equipments i.e Land, building and Plant & machinery and re assessed useful life (as assessed and estimated by the management & technical valuer) as on the date of transition to Ind AS i.e 1st April 2015 and impact of ` 20882.75 crore in accordance with said stipulations with resulted impact being accounted for in reserves. The depreciation as per Ind AS has been accounted on fair value and on revised useful life.
InvestmentsInvestments other than investment in subsidiaries, joint ventures and associates has been considered at fair value through profit & loss. Investments in subsidiaries, joint ventures and associates: (i) in equity shares has been considered at carrying value as deemed cost; (ii) other than equity shares has been considered at amortised cost. Difference between the instruments carrying value and amortised cost as at the date of transition has been recognised in retained earnings.
Defined benefit obligationThe impact of change in acturial assumption and experience adjustments for defined benefit obligation is accounuted in Other Comprehensive Income with reversal in profit & loss.
Deferred TaxThe Company has accounted for deferred tax on various adjustment between indian GAAP and Ind AS as well as on temporary differences between the carrying amount of assets and liabilities in the balance
sheet and corresponding tax bases at the tax rate at which they are expected to be reversed. Corresponding net impact has been recognised in retained earning/profit & loss/Other Comprehensive Income as applicable.
Excise DutyUnder Ind AS, Excise duty on sale of goods is separately presented as expenses. Thus sale of goods under Ind AS for the year ended 31st March 2016 has increased by ₹ 1,996.90 crore with a corresponding increase in other expense.
Financial assets and Financial LiabilitiesFinancial assets and financial liabilities have been classified as per Ind AS 109 read with Ind AS 32.
Statement of Cash FlowsThe transition from Indian GAAP to Ind AS has not had a material impact on the statement of cash flows.
Discounts Under Indian GAAP, discounts were recognised as expenses which has been adjusted against the revenue under Ind AS during the year ended 31st March 2016.
Standards issued but not effective yetIn March 2017, the Ministry of Corporate Affairs issued the Companies (Indian Accounting Standards) (Amendments) Rules, 2017, notifying amendments to Ind AS 7, ‘Statement of cash flows’ and Ind AS 102, ‘Share-based payment.’ These amendments are in accordance with the recent amendments made by International Accounting Standards Board (IASB) to IAS 7, ‘Statement of cash flows’ and IFRS 2, ‘Share-based payment,’ respectively. The amendments are applicable to the Company from April 1, 2017.
Notes to the Consolidated financial statements as at and for the year ended 31st March, 2017
252 | Jindal Steel & Power Limited Annual Report 2016-17
The amendment to Ind AS 7 requires the entities to provide disclosures that enable users of financial statements to evaluate changes in liabilities arising from financing activities, including both changes arising from cash flows and non-cash changes, suggesting inclusion of a reconciliation between the opening and closing balances in the balance sheet for liabilities arising from financing activities, to meet the disclosure requirement.
The Company is evaluating the requirments of the amendment and the effect on the financial statements is being evaluated.
The amendment to Ind AS 102 provides specific guidance to measurement of cash-settled awards, modification of cash-settled awards and awards that include a net settlement feature in respect of withholding taxes.
The Company has an Employee Share Purchase Scheme namely JSPL ESPS 2013; accordingly the said amendment does not have any possible impact on the financials of the Company.
73. Previous year figures have been regrouped/ rearranged / recast, wherever considered necessary to conform to current year’s classification. Figures less than 50000 have been shown as absolute number.
74. Notes 1 to 74 are annexed to and form an integral part of financial statements.
As per our report of even date For & on behalf of the Board of Directors
For Lodha & Co. Chartered Accountants Naveen Jindal Ravi UppalFirm Registration No. 301051E Chairman Managing Director & Group CEO
DIN: 00001523 DIN: 00025970N.K Lodha Partner Rajesh Bhatia Murli Manohar Purohit Membership No. 85155 Chief Financial Officer Company Secretary
Place: New DelhiDated: 23rd May, 2017
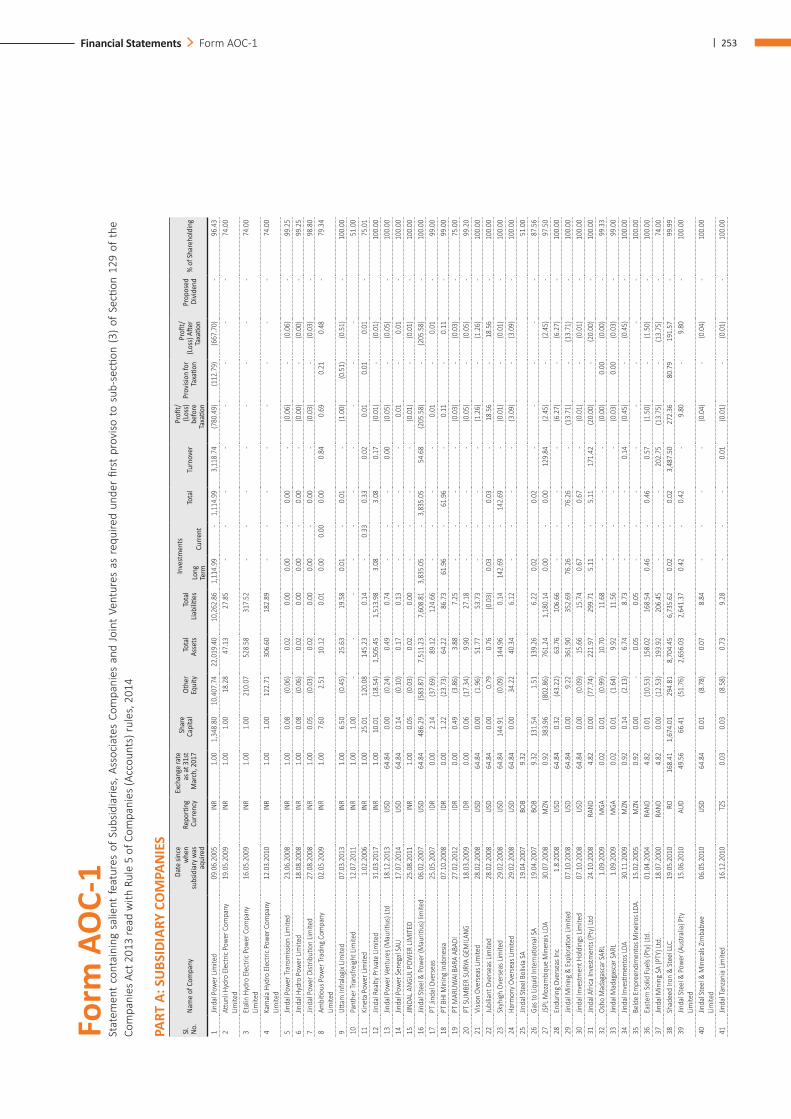
| 253Financial Statements Form AOC-1
Form
AO
C-1
St
atem
ent
cont
aini
ng s
alie
nt fe
atur
es o
f Su
bsid
iarie
s, A
ssoc
iate
s Co
mpa
nies
and
Joi
nt V
entu
res
as r
equi
red
unde
r fir
st p
rovi
so t
o su
b-se
ction
(3)
of
Secti
on 1
29 o
f th
e Co
mpa
nies
Act
201
3 re
ad w
ith R
ule
5 of
Com
pani
es (A
ccou
nts)
rule
s, 2
014
PART
A: S
UBS
IDIA
RY C
OM
PAN
IES
Sl.
No.
Nam
e of
Com
pany
Date
sinc
e w
hen
subs
idia
ry w
as
aqui
red
Repo
rting
Cu
rrenc
y
Exch
ange
rate
as
at 3
1st
Mar
ch, 2
017
Shar
e Ca
pita
lOt
her
Equi
tyTo
tal
Asse
tsTo
tal
Liabi
lities
Inve
stm
ents
Tota
lTu
rnov
erPr
ofit/
(L
oss)
befo
re
Taxa
tion
Prov
ision
for
Taxa
tion
Profi
t/
(Los
s) Aft
er
Taxa
tion
Prop
osed
Di
viden
d%
of S
hare
hold
ing
Long
Te
rmCu
rrent
1Jin
dal P
ower
Lim
ited
09.0
6.20
05IN
R1.
00 1
,348
.80
10,
407.
74
22,
019.
40
10,
262.
86
1,1
14.9
9 -
1,1
14.9
9 3
,118
.74
(780
.49)
(112
.79)
(667
.70)
- 9
6.43
2
Attun
li Hyd
ro E
lect
ric P
ower
Com
pany
Lim
ited
19.0
5.20
09IN
R1.
00 1
.00
18.
28
47.
13
27.
85
- -
- -
- -
- -
74.
00
3Et
alin
Hyd
ro E
lect
ric P
ower
Com
pany
Lim
ited
16.0
5.20
09IN
R1.
00 1
.00
210
.07
528
.58
317
.52
- -
- -
- -
- -
74.
00
4Ka
mal
a Hy
dro
Elec
tric P
ower
Com
pany
Lim
ited
12.0
3.20
10IN
R1.
00 1
.00
122
.71
306
.60
182
.89
- -
- -
- -
- -
74.
00
5Jin
dal P
ower
Tran
smiss
ion
Limite
d23
.06.
2008
INR
1.00
0.0
8 (0
.06)
0.0
2 0
.00
0.0
0 -
0.0
0 -
(0.0
6) -
(0.0
6) -
99.
25
6Jin
dal H
ydro
Pow
er Li
mite
d18
.08.
2008
INR
1.00
0.0
8 (0
.06)
0.0
2 0
.00
0.0
0 -
0.0
0 -
(0.0
0) -
(0.0
0) -
99.
25
7Jin
dal P
ower
Dist
ributi
on Li
mite
d27
.08.
2008
INR
1.00
0.0
5 (0
.03)
0.0
2 0
.00
0.0
0 -
0.0
0 -
(0.0
3) -
(0.0
3) -
98.
80
8Am
bitio
us P
ower
Trad
ing
Com
pany
Lim
ited
02.0
5.20
09IN
R1.
00 7
.60
2.5
1 1
0.12
0
.01
0.0
0 0
.00
0.0
0 0
.84
0.6
9 0
.21
0.4
8 -
79.
34
9Utt
am In
fralo
gix L
imite
d 07
.03.
2013
INR
1.00
6.5
0 (0
.45)
25.6
319
.58
0.0
1 -
0.0
1 -
(1.0
0) (0
.51)
(0.5
1) -
100
.00
10Pa
nthe
r Tra
nsfre
ight
Lim
ited
12.0
7.20
11IN
R1.
00 1
.00
--
--
--
--
--
51.0
011
Kine
ta P
ower
Lim
ited
1.02
.200
6IN
R1.
00 2
5.01
1
20.0
8 1
45.2
3 0
.14
- 0
.33
0.3
3 0
.02
0.0
1 0
.01
0.0
1 -
75.
01
12Jin
dal R
ealty
Priv
ate
Limite
d31
.03.
2017
INR
1.00
10.
01
(18.
54)
1,5
05.4
5 1
,513
.98
3.0
8 3
.08
0.1
7 (0
.01)
- (0
.01)
100
.00
13Jin
dal P
ower
Ven
ture
s (M
auriti
us) L
td
18.1
2.20
13US
D64
.84
0.0
0 (0
.24)
0.4
9 0
.74
- -
- 0
.00
(0.0
5) -
(0.0
5) -
100
.00
14Jin
dal P
ower
Sen
egal
SAU
17.0
7.20
14US
D64
.84
0.1
4 (0
.10)
0.1
7 0
.13
- -
- -
0.0
1 -
0.0
1 -
100
.00
15JIN
DAL A
NGUL
POW
ER LI
MIT
ED
25.0
8.20
11IN
R1.
00 0
.05
(0.0
3) 0
.02
0.0
0 -
- -
- (0
.01)
- (0
.01)
- 1
00.0
0 16
Jinda
l Ste
el &
Pow
er (M
auriti
us) l
imite
d06
.02.
2007
USD
64.8
4 4
86.2
9 (5
83.8
7) 7
,511
.23
7,6
08.8
1 3
,835
.05
- 3
,835
.05
54.
68
(205
.58)
- (2
05.5
8) -
100
.00
17PT
Jind
al O
vers
eas
25.0
5.20
07ID
R0.
00 2
.14
(37.
69)
89.
12
124
.66
- -
- -
0.0
1 -
0.0
1 -
99.
00
18PT
BHI
Min
ing
Indo
nesia
07.1
0.20
08ID
R0.
00 1
.22
(23.
73)
64.
22
86.
73
61.
96
- 6
1.96
-
0.1
1 -
0.1
1 -
99.
00
19PT
MAR
UWAI
BAR
A AB
ADI
27.0
2.20
12ID
R0.
00 0
.49
(3.8
6) 3
.88
7.2
5 -
- -
- (0
.03)
- (0
.03)
- 7
5.00
20
PT S
UMBE
R SU
RYA
GEM
ILANG
18.0
3.20
09ID
R0.
00 0
.06
(17.
34)
9.9
0 2
7.18
-
- -
- (0
.05)
- (0
.05)
- 9
9.20
21
Visio
n Ov
erse
as Li
mite
d28
.02.
2008
USD
64.8
4 0
.00
(1.9
6) 5
1.77
5
3.73
-
- -
- (1
.26)
- (1
.26)
- 1
00.0
0 22
Jubi
liant
Ove
rsea
s Lim
ited
28.0
2.20
08US
D64
.84
0.0
0 0
.79
0.7
6 (0
.03)
0.0
3 -
0.0
3 -
18.
56
- 1
8.56
-
100
.00
23Sk
yhig
h Ov
erse
as Li
mite
d29
.02.
2008
USD
64.8
4 1
44.9
1 (0
.09)
144
.96
0.1
4 1
42.6
9 -
142
.69
- (0
.01)
- (0
.01)
- 1
00.0
0 24
Harm
ony O
vers
eas L
imite
d29
.02.
2008
USD
64.8
4 0
.00
34.
22
40.
34
6.1
2 -
- -
- (3
.09)
- (3
.09)
- 1
00.0
0 25
Jinda
l Ste
el B
olivi
a SA
19.0
4.20
07BO
B9.
32 5
1.00
26
Gas t
o Liq
uid
Inte
rnati
onal
SA19
.04.
2007
BOB
9.32
131
.54
1.5
1 1
39.2
6 6
.22
0.0
2 0
.02
- -
- -
- 8
7.56
27
JSPL
Moz
ambi
que
Min
erai
s LDA
30.0
7.20
08M
ZN0.
92 3
83.9
6 (8
02.8
6) 7
61.2
4 1
,180
.14
0.0
0 -
0.0
0 1
29.8
4 (2
.45)
- (2
.45)
- 9
7.50
28
Endu
ring
Over
seas
Inc
1.8.
2008
USD
64.8
4 0
.32
(43.
22)
63.
76
106
.66
- -
- -
(6.2
7) -
(6.2
7) -
100
.00
29Jin
dal M
inin
g &
Expl
orati
on Li
mite
d07
.10.
2008
USD
64.8
4 0
.00
9.2
2 3
61.9
0 3
52.6
9 7
6.26
-
76.
26
- (1
3.71
) -
(13.
71)
- 1
00.0
0 30
Jinda
l Inv
estm
ent H
oldi
ngs L
imite
d07
.10.
2008
USD
64.8
4 0
.00
(0.0
9) 1
5.66
1
5.74
0
.67
0.6
7 -
(0.0
1) -
(0.0
1) -
100
.00
31Jin
dal A
frica
Inve
stm
ents
(Pty
) Ltd
24.1
0.20
08RA
ND4.
82 0
.00
(77.
74)
221
.97
299
.71
5.1
1 -
5.1
1 1
71.4
2 (2
0.00
) -
(20.
00)
- 1
00.0
0 32
Osho
Mad
agas
car S
ARL
1.09
.200
9M
GA0.
02 0
.01
(0.9
9) 1
0.70
1
1.68
-
- -
- (0
.00)
0.0
0 (0
.00)
- 9
9.33
33
Jinda
l Mad
agas
car S
ARL
1.09
.200
9M
GA0.
02 0
.01
(1.6
4) 9
.92
11.
56
- -
- -
(0.0
3) 0
.00
(0.0
3) -
99.
00
34Jin
dal I
nves
timen
tos L
DA30
.11.
2009
MZN
0.92
0.1
4 (2
.13)
6.7
4 8
.73
- -
- 0
.14
(0.4
5) -
(0.4
5) -
100
.00
35Be
lde
Empr
eend
imen
tos M
inei
ros L
DA.
15.0
2.20
05M
ZN0.
92 0
.00
- 0
.05
0.0
5 -
- -
- -
- -
- 1
00.0
0 36
East
ern
Solid
Fue
ls (P
ty) L
td.
01.0
4.20
04RA
ND4.
82 0
.01
(10.
53)
158
.02
168
.54
0.4
6 -
0.4
6 0
.57
(1.5
0) -
(1.5
0) -
100
.00
37Jin
dal M
inin
g SA
(PTY
) Ltd
.18
.07.
2000
RAND
4.82
0.0
0 (1
2.53
) 1
93.9
2 2
06.4
5 -
- -
202
.75
(13.
75)
- (1
3.75
) -
74.
00
38Sh
adee
d Iro
n &
Stee
l LLC
19.0
5.20
10RO
168.
41 1
,674
.01
294
.81
8,7
04.4
5 6
,735
.62
0.0
2 -
0.0
2 3
,487
.50
272
.36
80.
79
191
.57
- 9
9.99
39
Jinda
l Ste
el &
Pow
er (A
ustra
lia) P
ty
Limite
d15
.06.
2010
AUD
49.5
6 6
6.41
(5
1.76
) 2
,656
.03
2,6
41.3
7 0
.42
- 0
.42
- 9
.80
- 9
.80
- 1
00.0
0
40Jin
dal S
teel
& M
iner
als Z
imba
bwe
Limite
d06
.05.
2010
USD
64.8
4 0
.01
(8.7
8) 0
.07
8.8
4 -
- -
- (0
.04)
- (0
.04)
- 1
00.0
0
41Jin
dal T
anza
nia
Limite
d16
.12.
2010
TZS
0.03
0.0
3 (8
.58)
0.7
3 9
.28
- -
- 0
.01
(0.0
1) -
(0.0
1) -
100
.00
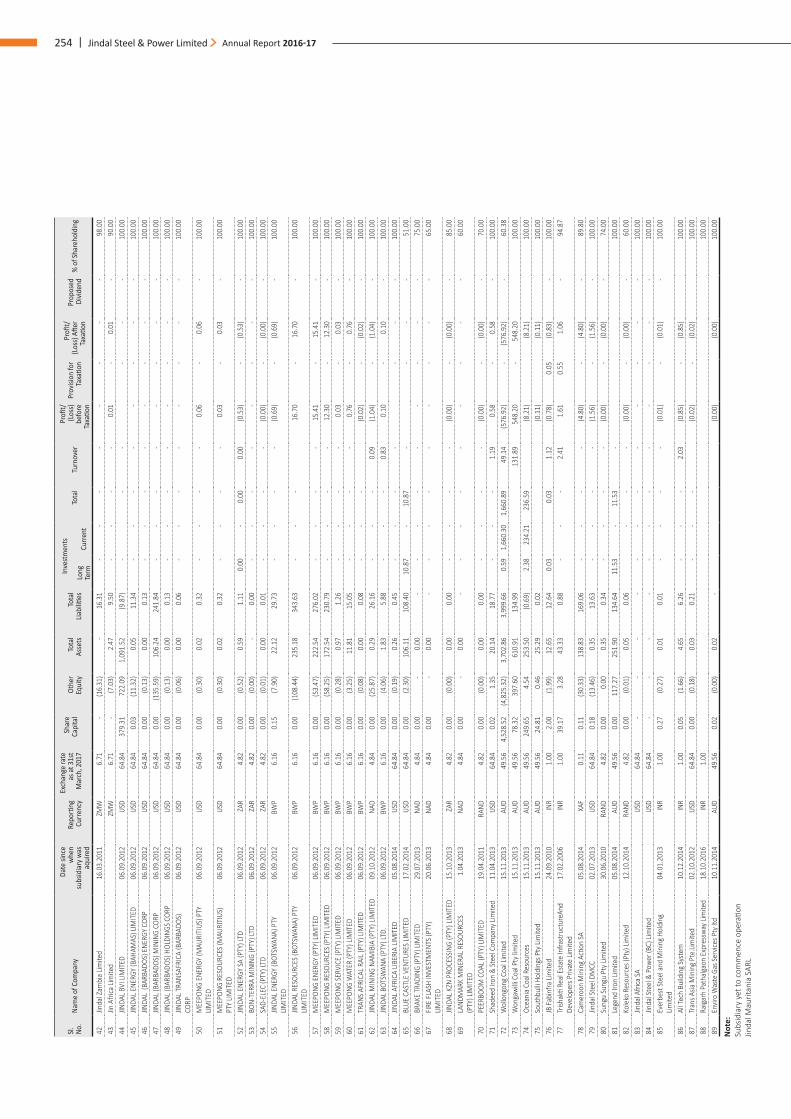
254 | Jindal Steel & Power Limited Annual Report 2016-17
Sl.
No.
Nam
e of
Com
pany
Date
sinc
e w
hen
subs
idia
ry w
as
aqui
red
Repo
rting
Cu
rrenc
y
Exch
ange
rate
as
at 3
1st
Mar
ch, 2
017
Shar
e Ca
pita
lOt
her
Equi
tyTo
tal
Asse
tsTo
tal
Liabi
lities
Inve
stm
ents
Tota
lTu
rnov
erPr
ofit/
(L
oss)
befo
re
Taxa
tion
Prov
ision
for
Taxa
tion
Profi
t/
(Los
s) Aft
er
Taxa
tion
Prop
osed
Di
viden
d%
of S
hare
hold
ing
Long
Te
rmCu
rrent
42Jin
dal Z
ambi
a Lim
ited
16.0
3.20
11ZM
W6.
71 -
(16.
31)
- 1
6.31
-
- -
- -
- -
- 9
8.00
43
Jin A
frica
Lim
ited
ZMW
6.71
- (7
.03)
2.47
9.
50 -
- -
- 0
.01
- 0
.01
- 9
0.00
44
JINDA
L BVI
LIM
ITED
06.0
9.20
12US
D64
.84
379
.31
722
.09
1,0
91.5
2 (9
.87)
- -
- -
- -
100
.00
45JIN
DAL E
NERG
Y (B
AHAM
AS) L
IMIT
ED06
.09.
2012
USD
64.8
4 0
.03
(11.
32)
0.0
5 1
1.34
-
- -
- -
- -
- 1
00.0
0 46
JINDA
L (B
ARBA
DOS)
ENE
RGY
CORP
06.0
9.20
12US
D64
.84
0.0
0 (0
.13)
0.0
0 0
.13
- -
- -
- -
- -
100
.00
47JIN
DAL (
BARB
ADOS
) MIN
ING
CORP
06.0
9.20
12US
D64
.84
0.0
0 (1
35.5
9) 1
06.2
4 2
41.8
4 -
- -
- -
- -
- 1
00.0
0 48
JINDA
L (BA
RBAD
OS) H
OLDI
NGS
CORP
06.0
9.20
12US
D64
.84
0.0
0 (0
.13)
0.0
0 0
.13
- -
- -
- -
- -
100
.00
49JIN
DAL T
RANS
AFRI
CA (B
ARBA
DOS)
CO
RP06
.09.
2012
USD
64.8
4 0
.00
(0.0
6) 0
.00
0.0
6 -
- -
- -
- -
- 1
00.0
0
50M
EEPO
NG E
NERG
Y (M
AURI
TIUS
) PTY
LIM
ITED
06.0
9.20
12US
D64
.84
0.0
0 (0
.30)
0.0
2 0
.32
- -
- -
0.0
6 -
0.0
6 -
100
.00
51M
EEPO
NG R
ESOU
RCES
(MAU
RITI
US)
PTY
LIMIT
ED06
.09.
2012
USD
64.8
4 0
.00
(0.3
0) 0
.02
0.3
2 -
- -
- 0
.03
- 0
.03
- 1
00.0
0
52JIN
DAL E
NERG
Y SA
(PTY
) LTD
06.0
9.20
12ZA
R4.
82 0
.00
(0.5
2) 0
.59
1.1
1 0
.00
- 0
.00
0.0
0 (0
.53)
- (0
.53)
- 1
00.0
0 53
BON-
TERR
A M
ININ
G (P
TY) L
TD06
.09.
2012
ZAR
4.82
0.0
0 (0
.00)
- 0
.00
- -
- -
- -
- -
100
.00
54SA
D-EL
EC (P
TY) L
TD06
.09.
2012
ZAR
4.82
0.0
0 (0
.01)
0.0
0 0
.01
- -
- -
(0.0
0) -
(0.0
0) -
100
.00
55JIN
DAL E
NERG
Y (B
OTSW
ANA)
PTY
LIM
ITED
06.0
9.20
12BW
P6.
16 0
.15
(7.9
0) 2
2.12
2
9.73
-
- -
- (0
.69)
- (0
.69)
- 1
00.0
0
56JIN
DAL R
ESOU
RCES
(BOT
SWAN
A) P
TY
LIMIT
ED06
.09.
2012
BWP
6.16
0.0
0 (1
08.4
4) 2
35.1
8 3
43.6
3 -
- -
16.7
0 -
16.7
0 -
100
.00
57M
EEPO
NG E
NERG
Y (P
TY) L
IMIT
ED06
.09.
2012
BWP
6.16
0.0
0 (5
3.47
) 2
22.5
4 2
76.0
2 -
- -
- 1
5.41
-
15.
41
- 1
00.0
0 58
MEE
PONG
RES
OURC
ES (P
TY) L
IMIT
ED06
.09.
2012
BWP
6.16
0.0
0 (5
8.25
) 1
72.5
4 2
30.7
9 -
- -
- 1
2.30
-
12.
30
- 1
00.0
0 59
MEE
PONG
SER
VICE
(PTY
) LIM
ITED
06.0
9.20
12BW
P6.
16 0
.00
(0.2
8) 0
.97
1.2
6 -
- -
- 0
.03
- 0
.03
- 1
00.0
0 60
MEE
PONG
WAT
ER (P
TY) L
IMIT
ED06
.09.
2012
BWP
6.16
0.0
0 (3
.25)
11.
81
15.
05
- -
- -
0.7
6 -
0.7
6 -
100
.00
61TR
ANS
AFRI
CAL R
AIL (
PTY)
LIM
ITED
06.0
9.20
12BW
P6.
16 0
.00
(0.0
8) 0
.00
0.0
8 -
- -
(0.0
2) -
(0.0
2) -
100
.00
62JIN
DAL M
ININ
G NA
MIB
IA (P
TY) L
IMIT
ED09
.10.
2012
NAD
4.84
0.0
0 (2
5.87
) 0
.29
26.
16
- -
- 0
.09
(1.0
4) -
(1.0
4) -
100
.00
63JIN
DAL B
OTSW
ANA
(PTY
) LTD
.06
.09.
2012
BWP
6.16
0.0
0 (4
.06)
1.8
3 5
.88
- -
- 0
.83
0.1
0 -
0.1
0 -
100
.00
64JIN
DAL A
FRIC
A LIB
ERIA
LIM
ITED
05.0
8.20
14US
D64
.84
0.0
0 (0
.19)
0.2
6 0
.45
- -
- -
- -
- 1
00.0
0 65
BLUE
CAS
TLE
VENT
URES
LIM
ITED
17.0
2.20
14US
D64
.84
0.0
0 (2
.30)
106
.11
108
.40
10.
87
- 1
0.87
-
- -
- 5
1.00
66
BRAK
E TR
ADIN
G (P
TY) L
IMIT
ED29
.07.
2013
NAD
4.84
0.0
0 -
0.0
0 -
- -
- -
- -
- -
75.
00
67FI
RE F
LASH
INVE
STM
ENTS
(PTY
) LIM
ITED
20.0
6.20
13NA
D4.
84 0
.00
- 0
.00
- -
- -
- -
- -
- 6
5.00
68JIN
DAL K
ZN P
ROCE
SSIN
G (P
TY) L
IMIT
ED15
.10.
2013
ZAR
4.82
0.0
0 (0
.00)
0.0
0 0
.00
- -
- -
(0.0
0) -
(0.0
0) -
85.
00
69LA
NDM
ARK
MIN
ERAL
RES
OURC
ES
(PTY
) LIM
ITED
1.04
.201
3NA
D4.
84 0
.00
- 0
.00
- -
- -
- -
- -
- 6
0.00
70PE
ERBO
OM C
OAL (
PTY)
LIM
ITED
19.0
4.20
11RA
ND4.
82 0
.00
(0.0
0) 0
.00
0.0
0 -
- -
- (0
.00)
- (0
.00)
- 7
0.00
71
Shad
eed
Iron
& St
eel C
ompa
ny Li
mite
d11
.04.
2013
USD
64.8
4 0
.02
1.3
5 2
0.14
1
8.77
-
- -
1.1
9 0
.58
- 0
.58
- 1
00.0
0 72
Wol
long
ong
Coal
Lim
ited
15.1
1.20
13AU
D49
.56
4,5
28.5
2 (4
,825
.32)
3,7
02.8
6 3
,999
.66
0.5
9 1,
660.
30
1,6
60.8
9 4
9.14
(5
76.9
2) -
(576
.92)
- 6
0.38
73
Won
gaw
illi C
oal P
ty lim
ited
15.1
1.20
13AU
D49
.56
78.
32
397
.60
610
.91
134
.99
131
.89
548
.20
- 5
48.2
0 1
00.0
0 74
Ocea
nia
Coal
Res
ourc
es15
.11.
2013
AUD
49.5
6 2
49.6
5 4
.54
253
.50
(0.6
9) 2
.38
234
.21
236
.59
(8.2
1) (8
.21)
100
.00
75So
uthb
ulli H
oldi
ngs P
ty Li
mite
d15
.11.
2013
AUD
49.5
6 2
4.81
0
.46
25.
29
0.0
2 (0
.11)
(0.1
1) 1
00.0
0 76
JB Fa
binf
ra Li
mite
d24
.09.
2010
INR
1.00
2.0
0 (1
.99)
12.
65
12.
64
0.0
3 0
.03
1.1
2 (0
.78)
0.05
(0.8
3) -
100
.00
77Tr
ishak
ti Re
al E
stat
e In
frast
ruct
ureA
nd
Deve
lope
rs P
rivat
e Lim
ited
17.0
2.20
06IN
R1.
00 3
9.17
3
.28
43.
33
0.8
8 -
- -
2.4
1 1
.61
0.5
5 1
.06
- 9
4.87
78Ca
mer
oon
Min
ing
Actio
n SA
05.0
8.20
14XA
F0.
11 0
.11
(30.
33)
138
.83
169
.06
- -
- -
(4.8
0) -
(4.8
0) -
89.
80
79Jin
dal S
teel
DM
CC02
.07.
2013
USD
64.8
4 0
.18
(13.
46)
0.3
5 1
3.63
-
- -
- (1
.56)
- (1
.56)
- 1
00.0
0 80
Sung
u Su
ngu
Pty L
imite
d30
.06.
2010
RAND
4.82
0.0
0 0
.00
0.3
5 0
.34
- -
- -
(0.0
0) -
(0.0
0) -
74.
00
81Le
gend
Iron
Lim
ited
05.0
8.20
14AU
D49
.56
0.0
0 1
17.2
7 2
51.9
0 1
34.6
4 1
1.53
-
11.
53
- 1
00.0
0 82
Kole
ko R
esou
rces
(Pty
) Lim
ited
12.1
0.20
14RA
ND4.
82 0
.00
(0.0
1) 0
.05
0.0
6 -
- -
(0.0
0) -
(0.0
0) -
60.
00
83Jin
dal A
frica
SAUS
D64
.84
- -
- -
- -
- -
- -
- -
100
.00
84Jin
dal S
teel
& P
ower
(BC)
Lim
ited
USD
64.8
4 -
- -
- -
- -
- -
- -
- 1
00.0
0 85
Ever
best
Ste
el a
nd M
inin
g Ho
ldin
g Lim
ited
04.0
1.20
13IN
R1.
00 0
.27
(0.2
7) 0
.01
0.0
1 -
- -
- (0
.01)
- (0
.01)
- 1
00.0
0
86Al
l Tec
h Bu
ildin
g Sy
stem
10.1
2.20
14IN
R1.
00 0
.05
(1.6
6) 4
.65
6.2
6 -
- -
2.0
3 (0
.85)
- (0
.85)
100
.00
87Tr
ans A
sia M
inin
g Pt
e.Lim
ited
02.1
0.20
12US
D64
.84
0.0
0 (0
.18)
0.0
3 0
.21
- -
- (0
.02)
- (0
.02)
100
.00
88Ra
igarh
Pat
halga
on E
xpre
ssw
ay Li
mite
d18
.10.
2016
INR
1.00
100
.00
89En
viro
Was
te G
as S
ervic
es P
ty lt
d10
.11.
2014
AUD
49.5
6 0
.02
(0.0
0) 0
.02
- (0
.00)
(0.0
0) 1
00.0
0
Not
e:
Su
bsid
iary
yet
to c
omm
ence
ope
ratio
n
Jinda
l Mau
ritan
ia S
ARL
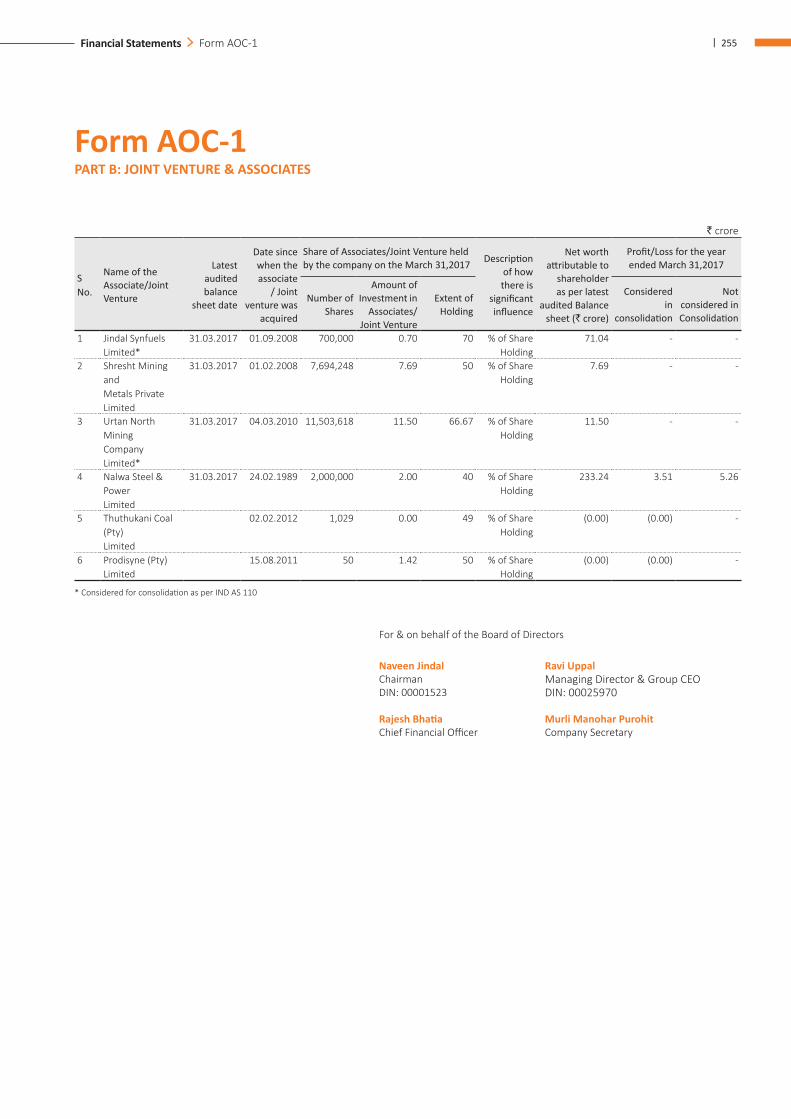
| 255Financial Statements Form AOC-1
Form AOC-1 PART B: JOINT VENTURE & ASSOCIATES
` crore
S No.
Name of the Associate/Joint Venture
Latest audited balance
sheet date
Date since when the associate
/ Joint venture was
acquired
Share of Associates/Joint Venture held by the company on the March 31,2017 Description
of how there is
significant influence
Net worth attributable to
shareholder as per latest
audited Balance sheet (` crore)
Profit/Loss for the year ended March 31,2017
Number of Shares
Amount of Investment in
Associates/Joint Venture
Extent of Holding
Considered in
consolidation
Not considered in Consolidation
1 Jindal Synfuels Limited*
31.03.2017 01.09.2008 700,000 0.70 70 % of Share Holding
71.04 - -
2 Shresht Mining and Metals Private Limited
31.03.2017 01.02.2008 7,694,248 7.69 50 % of Share Holding
7.69 - -
3 Urtan North Mining Company Limited*
31.03.2017 04.03.2010 11,503,618 11.50 66.67 % of Share Holding
11.50 - -
4 Nalwa Steel & Power Limited
31.03.2017 24.02.1989 2,000,000 2.00 40 % of Share Holding
233.24 3.51 5.26
5 Thuthukani Coal (Pty) Limited
02.02.2012 1,029 0.00 49 % of Share Holding
(0.00) (0.00) -
6 Prodisyne (Pty) Limited
15.08.2011 50 1.42 50 % of Share Holding
(0.00) (0.00) -
* Considered for consolidation as per IND AS 110
For & on behalf of the Board of Directors
Naveen Jindal Ravi UppalChairman Managing Director & Group CEODIN: 00001523 DIN: 00025970
Rajesh Bhatia Murli Manohar Purohit Chief Financial Officer Company Secretary

NOTES

NOTES

NOTES
Jindal Steel & Power LimitedRegistered Office: O. P. Jindal Marg, Hisar –125005 (Haryana)
Corporate Office: Jindal Centre, 12, Bhikaiji Cama Place, New Delhi – 110066CIN: L27105HR1979PLC009913 | Website: www.jindalsteelpower.com | Email: [email protected]
Tel.: +91 11 41462000 Fax: +91 11 26161271
To, Alankit Assignments LimitedUnit: Jindal Steel & Power Limited1E/13, Jhandewalan Extension, New Delhi-110 055
GREEN INITIATIVE IN CORPORATE GOVERNANCE
I/ We hereby exercise my/our option to receive all communications from the Company such as Notice of General Meeting, Explanatory Statement, Audited Financial Statements, Board’s Report, Auditor’s Report etc. in electronic mode pursuant to the “Green Initiative in Corporate Governance” taken by the Ministry of Corporate Affairs. Please register my E-mail ID as given below, in your records, for seeking the communications:
Folio No./ DP ID & Client ID No.: _____________________________________________________________________________________
Name of 1st Registered Holder: _____________________________________________________________________________________
Name of Joint Holder(s), if any : ____________________________________________________________________________________
Registered Address of the Sole1st Registered Holder: _____________________________________________________________________________________
____________________________________________________________________________________
No. of Shares held: _____________________________________________________________________________________
E-mail id (to be registered) : _____________________________________________________________________________________
Date:_____________________ Signature:_________________________
Notes:1) On registration, all communications will be sent to the E- mail ID registered.2) The form is also available on the website of the Company www.jindalsteelpower.com under the section ‘Investors’.3) Shareholders are requested to keep the Company’s Registrar- Alankit Assignments Limited informed as and when there is any change
in the e- mail address.

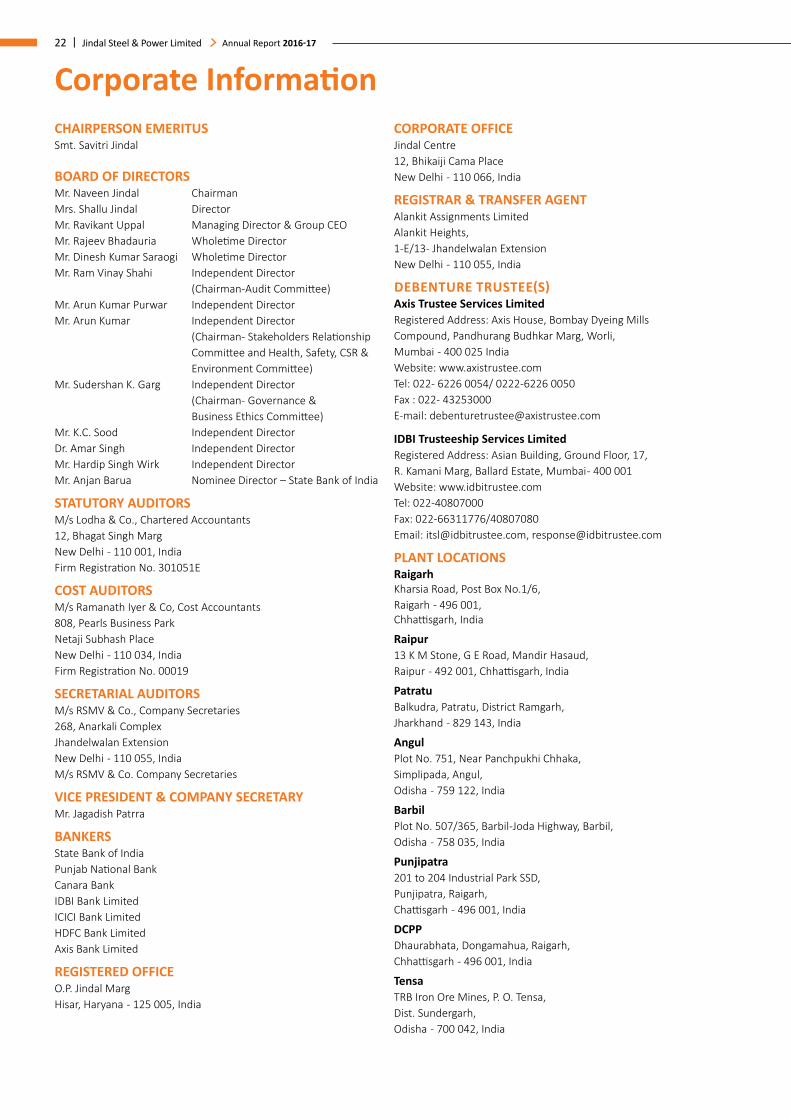
22 | Jindal Steel & Power Limited Annual Report 2016-17
Corporate Information CHAIRPERSON EMERITUSSmt. Savitri Jindal
BOARD OF DIRECTORSMr. Naveen Jindal ChairmanMrs. Shallu Jindal DirectorMr. Ravikant Uppal Managing Director & Group CEOMr. Rajeev Bhadauria Wholetime DirectorMr. Dinesh Kumar Saraogi Wholetime DirectorMr. Ram Vinay Shahi Independent Director
(Chairman-Audit Committee)Mr. Arun Kumar Purwar Independent DirectorMr. Arun Kumar Independent Director
(Chairman- Stakeholders Relationship Committee and Health, Safety, CSR & Environment Committee)
Mr. Sudershan K. Garg Independent Director (Chairman- Governance & Business Ethics Committee)
Mr. K.C. Sood Independent DirectorDr. Amar Singh Independent DirectorMr. Hardip Singh Wirk Independent DirectorMr. Anjan Barua Nominee Director – State Bank of India
STATUTORY AUDITORSM/s Lodha & Co., Chartered Accountants12, Bhagat Singh MargNew Delhi - 110 001, IndiaFirm Registration No. 301051E
COST AUDITORSM/s Ramanath Iyer & Co, Cost Accountants808, Pearls Business ParkNetaji Subhash PlaceNew Delhi - 110 034, India Firm Registration No. 00019
SECRETARIAL AUDITORSM/s RSMV & Co., Company Secretaries268, Anarkali ComplexJhandelwalan Extension New Delhi - 110 055, India M/s RSMV & Co. Company Secretaries
VICE PRESIDENT & COMPANY SECRETARYMr. Jagadish Patrra
BANKERSState Bank of IndiaPunjab National BankCanara Bank IDBI Bank LimitedICICI Bank LimitedHDFC Bank Limited Axis Bank Limited
REGISTERED OFFICEO.P. Jindal MargHisar, Haryana - 125 005, India
CORPORATE OFFICEJindal Centre12, Bhikaiji Cama PlaceNew Delhi - 110 066, India
REGISTRAR & TRANSFER AGENTAlankit Assignments LimitedAlankit Heights,1-E/13- Jhandelwalan ExtensionNew Delhi - 110 055, India
DEBENTURE TRUSTEE(S)Axis Trustee Services LimitedRegistered Address: Axis House, Bombay Dyeing Mills Compound, Pandhurang Budhkar Marg, Worli, Mumbai - 400 025 IndiaWebsite: www.axistrustee.com Tel: 022- 6226 0054/ 0222-6226 0050Fax : 022- 43253000E-mail: [email protected]
IDBI Trusteeship Services LimitedRegistered Address: Asian Building, Ground Floor, 17, R. Kamani Marg, Ballard Estate, Mumbai - 400 001Website: www.idbitrustee.comTel: 022-40807000Fax: 022-66311776/40807080 Email: [email protected], [email protected]
PLANT LOCATIONSRaigarh Kharsia Road, Post Box No.1/6, Raigarh - 496 001, Chhattisgarh, India
Raipur 13 K M Stone, G E Road, Mandir Hasaud, Raipur - 492 001, Chhattisgarh, India
PatratuBalkudra, Patratu, District Ramgarh, Jharkhand - 829 143, India
Angul Plot No. 751, Near Panchpukhi Chhaka, Simplipada, Angul, Odisha - 759 122, India
Barbil Plot No. 507/365, Barbil-Joda Highway, Barbil, Odisha - 758 035, India
Punjipatra201 to 204 Industrial Park SSD, Punjipatra, Raigarh, Chattisgarh - 496 001, India
DCPP Dhaurabhata, Dongamahua, Raigarh, Chhattisgarh - 496 001, India
Tensa TRB Iron Ore Mines, P. O. Tensa, Dist. Sundergarh, Odisha - 700 042, India

CORPORATE OFFICEJindal Centre,12, Bhikaiji Cama Place,New Delhi - 110066, India
REGISTERED OFFICE O.P. Jindal Marg, Hisar - 125005, Haryana, IndiaTel: +91 1662 222471-84, Fax: +91 1662 220476 Email: [email protected]
JINDAL STEEL & POWER LIMITEDCIN: L27105HR1979PLC009913www.jindalsteelpower.com