Embed Size (px)
Citation preview
Company name
10 December 2010 1
hfy
31 December 2021
Initiating Coverage | Sector: Consumer
Indigo Paints
Colorful prospects!
Investors are advised to refer through important disclosures made at the last page of the Research Report. Motilal Oswal research is available on www.motilaloswal.com/Institutional-Equities, Bloomberg, Thomson Reuters, Factset and S&P Capital.
Dhairya Dhruv – Research analyst ([email protected]) Research analyst: Krishnan Sambamoorthy ([email protected]) / Kaiwan Jal Olia ([email protected])
Differentiated products
Distribution expansion
Tinting machines
penetration
High brand investments
Page #3 Summary
Page #6
Page #07
About INDIGOPN: Making a mark in an industry of giants
Page #08
Surmounting industry moats
Page #14
Improving product mix
Page #18
Financial analysis: Slated to deliver strong growth
Page #16
Ground checks: rural positive, but urban a monitorable
Page #20
INDIGOPN growing faster than the industry
01 02
03 04
05 06
07 08
Indigo Paints: Colorful prospects!
Story in charts
Page #26
Annexure
Page #31
Financials and valuations
09 10
Indigo Paints
31 December 2021 3
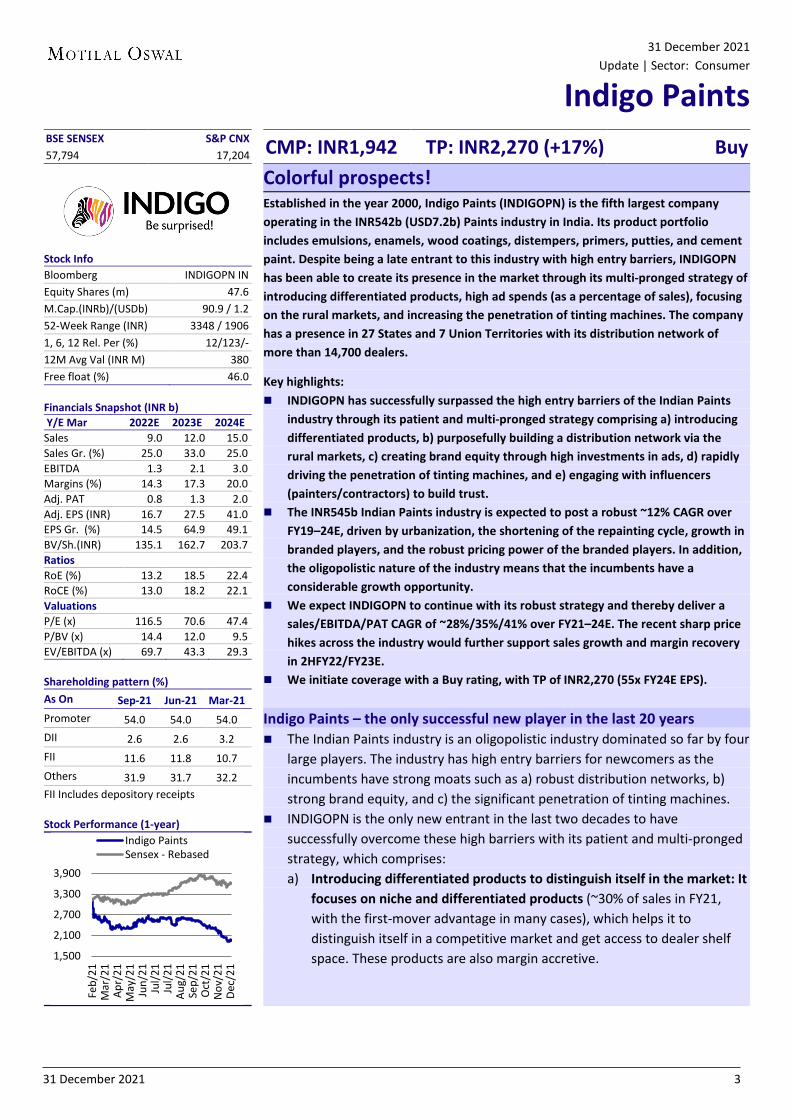
BSE SENSEX S&P CNX CMP: INR1,942 TP: INR2,270 (+17%) Buy 57,794 17,204
Stock Info Bloomberg INDIGOPN IN Equity Shares (m) 47.6 M.Cap.(INRb)/(USDb) 90.9 / 1.2 52-Week Range (INR) 3348 / 1906 1, 6, 12 Rel. Per (%) 12/123/- 12M Avg Val (INR M) 380 Free float (%) 46.0 Financials Snapshot (INR b) Y/E Mar 2022E 2023E 2024E Sales 9.0 12.0 15.0 Sales Gr. (%) 25.0 33.0 25.0 EBITDA 1.3 2.1 3.0 Margins (%) 14.3 17.3 20.0 Adj. PAT 0.8 1.3 2.0 Adj. EPS (INR) 16.7 27.5 41.0 EPS Gr. (%) 14.5 64.9 49.1 BV/Sh.(INR) 135.1 162.7 203.7 Ratios RoE (%) 13.2 18.5 22.4 RoCE (%) 13.0 18.2 22.1 Valuations P/E (x) 116.5 70.6 47.4 P/BV (x) 14.4 12.0 9.5 EV/EBITDA (x) 69.7 43.3 29.3 Shareholding pattern (%) As On Sep-21 Jun-21 Mar-21 Promoter 54.0 54.0 54.0 DII 2.6 2.6 3.2 FII 11.6 11.8 10.7 Others 31.9 31.7 32.2 FII Includes depository receipts Stock Performance (1-year)
Colorful prospects! Established in the year 2000, Indigo Paints (INDIGOPN) is the fifth largest company operating in the INR542b (USD7.2b) Paints industry in India. Its product portfolio includes emulsions, enamels, wood coatings, distempers, primers, putties, and cement paint. Despite being a late entrant to this industry with high entry barriers, INDIGOPN has been able to create its presence in the market through its multi-pronged strategy of introducing differentiated products, high ad spends (as a percentage of sales), focusing on the rural markets, and increasing the penetration of tinting machines. The company has a presence in 27 States and 7 Union Territories with its distribution network of more than 14,700 dealers.
Key highlights: INDIGOPN has successfully surpassed the high entry barriers of the Indian Paints
industry through its patient and multi-pronged strategy comprising a) introducing differentiated products, b) purposefully building a distribution network via the rural markets, c) creating brand equity through high investments in ads, d) rapidly driving the penetration of tinting machines, and e) engaging with influencers (painters/contractors) to build trust.
The INR545b Indian Paints industry is expected to post a robust ~12% CAGR over FY19–24E, driven by urbanization, the shortening of the repainting cycle, growth in branded players, and the robust pricing power of the branded players. In addition, the oligopolistic nature of the industry means that the incumbents have a considerable growth opportunity.
We expect INDIGOPN to continue with its robust strategy and thereby deliver a sales/EBITDA/PAT CAGR of ~28%/35%/41% over FY21–24E. The recent sharp price hikes across the industry would further support sales growth and margin recovery in 2HFY22/FY23E.
We initiate coverage with a Buy rating, with TP of INR2,270 (55x FY24E EPS). Indigo Paints – the only successful new player in the last 20 years The Indian Paints industry is an oligopolistic industry dominated so far by four
large players. The industry has high entry barriers for newcomers as the incumbents have strong moats such as a) robust distribution networks, b) strong brand equity, and c) the significant penetration of tinting machines.
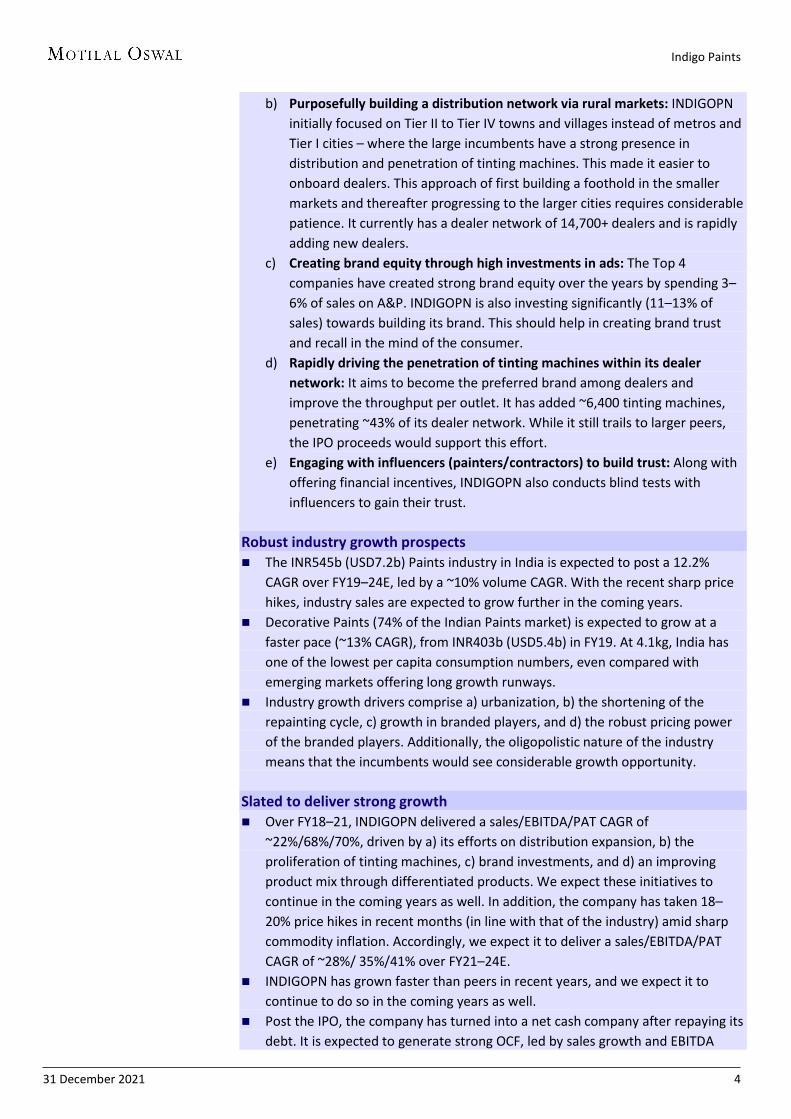
INDIGOPN is the only new entrant in the last two decades to have successfully overcome these high barriers with its patient and multi-pronged strategy, which comprises: a) Introducing differentiated products to distinguish itself in the market: It
focuses on niche and differentiated products (~30% of sales in FY21, with the first-mover advantage in many cases), which helps it to distinguish itself in a competitive market and get access to dealer shelf space. These products are also margin accretive.
1,500
2,100
2,700
3,300
3,900
Feb/
21M
ar/2
1Ap
r/21
May
/21
Jun/
21Ju
l/21
Jul/2
1Au
g/21
Sep/
21O
ct/2
1N
ov/2
1De
c/21
Indigo PaintsSensex - Rebased
31 December 2021 Update | Sector: Consumer
Indigo Paints
Indigo Paints
31 December 2021 4
b) Purposefully building a distribution network via rural markets: INDIGOPN initially focused on Tier II to Tier IV towns and villages instead of metros and Tier I cities – where the large incumbents have a strong presence in distribution and penetration of tinting machines. This made it easier to onboard dealers. This approach of first building a foothold in the smaller markets and thereafter progressing to the larger cities requires considerable patience. It currently has a dealer network of 14,700+ dealers and is rapidly adding new dealers.
c) Creating brand equity through high investments in ads: The Top 4 companies have created strong brand equity over the years by spending 3–6% of sales on A&P. INDIGOPN is also investing significantly (11–13% of sales) towards building its brand. This should help in creating brand trust and recall in the mind of the consumer.
d) Rapidly driving the penetration of tinting machines within its dealer network: It aims to become the preferred brand among dealers and improve the throughput per outlet. It has added ~6,400 tinting machines, penetrating ~43% of its dealer network. While it still trails to larger peers, the IPO proceeds would support this effort.
e) Engaging with influencers (painters/contractors) to build trust: Along with offering financial incentives, INDIGOPN also conducts blind tests with influencers to gain their trust.
Robust industry growth prospects The INR545b (USD7.2b) Paints industry in India is expected to post a 12.2%
CAGR over FY19–24E, led by a ~10% volume CAGR. With the recent sharp price hikes, industry sales are expected to grow further in the coming years.
Decorative Paints (74% of the Indian Paints market) is expected to grow at a faster pace (~13% CAGR), from INR403b (USD5.4b) in FY19. At 4.1kg, India has one of the lowest per capita consumption numbers, even compared with emerging markets offering long growth runways.
Industry growth drivers comprise a) urbanization, b) the shortening of the repainting cycle, c) growth in branded players, and d) the robust pricing power of the branded players. Additionally, the oligopolistic nature of the industry means that the incumbents would see considerable growth opportunity.
Slated to deliver strong growth Over FY18–21, INDIGOPN delivered a sales/EBITDA/PAT CAGR of
~22%/68%/70%, driven by a) its efforts on distribution expansion, b) the proliferation of tinting machines, c) brand investments, and d) an improving product mix through differentiated products. We expect these initiatives to continue in the coming years as well. In addition, the company has taken 18–20% price hikes in recent months (in line with that of the industry) amid sharp commodity inflation. Accordingly, we expect it to deliver a sales/EBITDA/PAT CAGR of ~28%/ 35%/41% over FY21–24E.
INDIGOPN has grown faster than peers in recent years, and we expect it to continue to do so in the coming years as well.
Post the IPO, the company has turned into a net cash company after repaying its debt. It is expected to generate strong OCF, led by sales growth and EBITDA
Indigo Paints
31 December 2021 5
margin expansion. INDIGOPN is currently expanding capacity at its Tamil Nadu facility with capex of INR2.25b spread over FY22 and FY23. This should lead to negative FCF for FY22E, which is expected to turn positive in subsequent years.
Although the cash infusion from the IPO led to a drop in INDIGOPN’s ROCE in FY21, we expect it to improve gradually in the coming years.
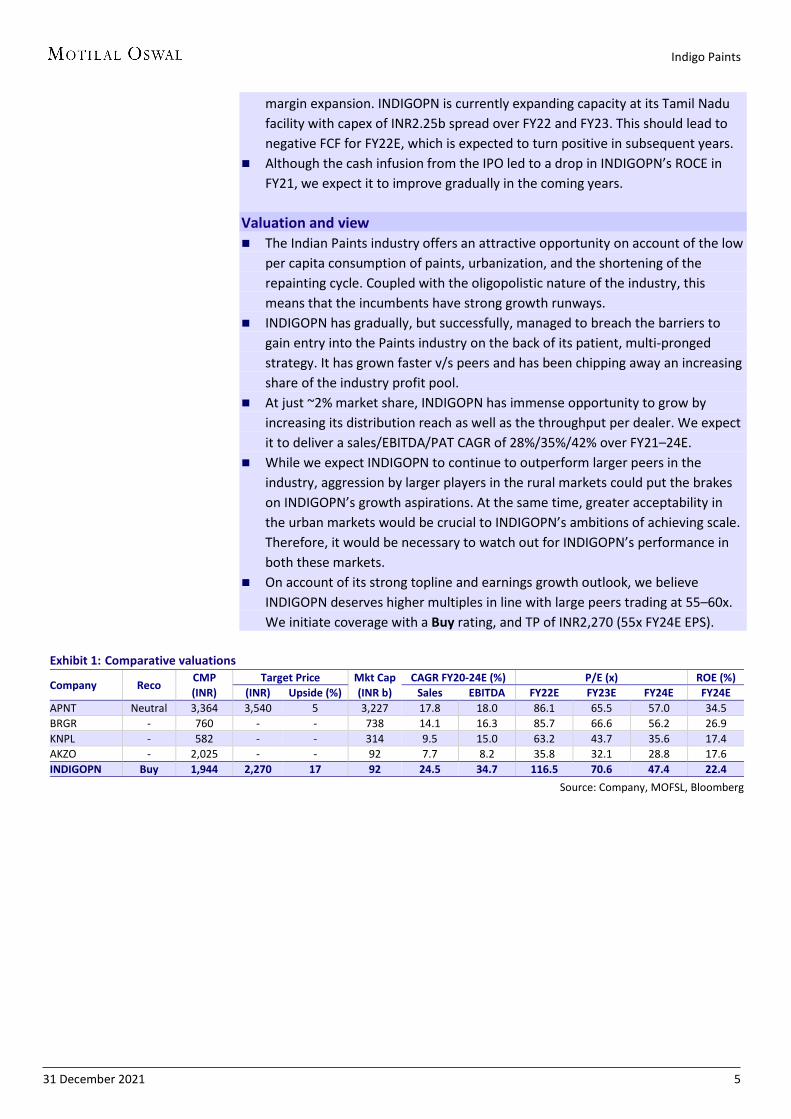
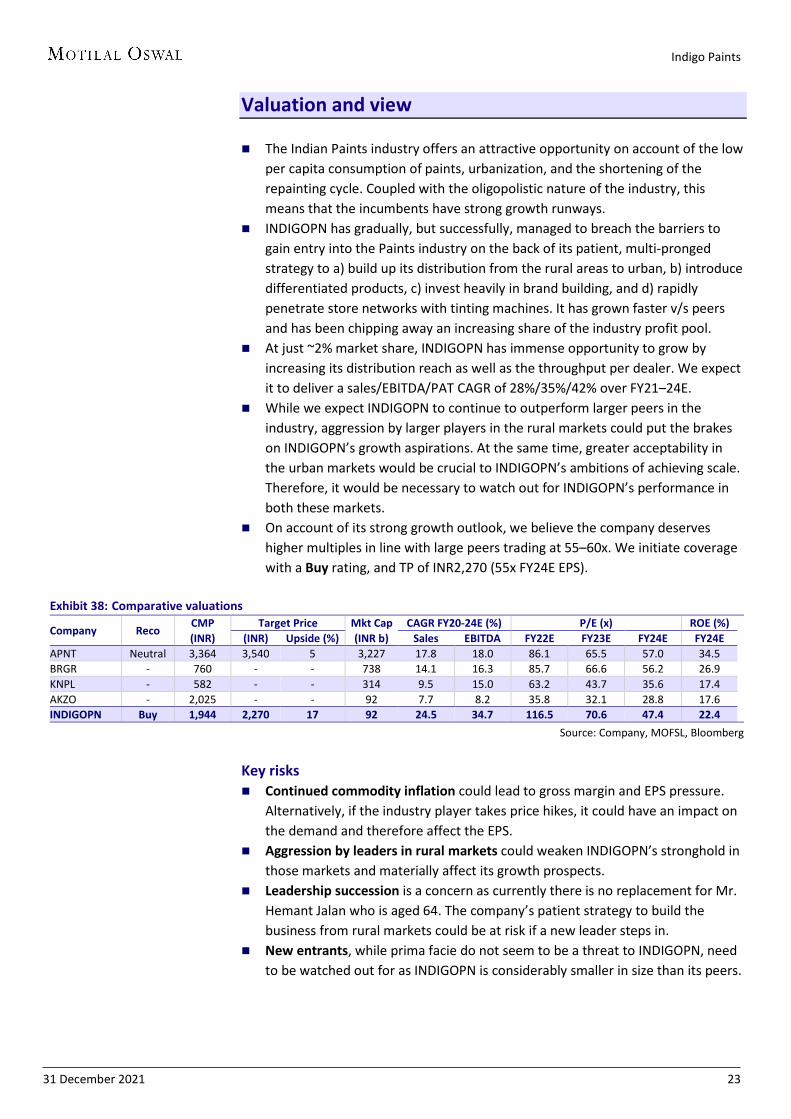
Valuation and view The Indian Paints industry offers an attractive opportunity on account of the low
per capita consumption of paints, urbanization, and the shortening of the repainting cycle. Coupled with the oligopolistic nature of the industry, this means that the incumbents have strong growth runways.
INDIGOPN has gradually, but successfully, managed to breach the barriers to gain entry into the Paints industry on the back of its patient, multi-pronged strategy. It has grown faster v/s peers and has been chipping away an increasing share of the industry profit pool.
At just ~2% market share, INDIGOPN has immense opportunity to grow by increasing its distribution reach as well as the throughput per dealer. We expect it to deliver a sales/EBITDA/PAT CAGR of 28%/35%/42% over FY21–24E.
While we expect INDIGOPN to continue to outperform larger peers in the industry, aggression by larger players in the rural markets could put the brakes on INDIGOPN’s growth aspirations. At the same time, greater acceptability in the urban markets would be crucial to INDIGOPN’s ambitions of achieving scale. Therefore, it would be necessary to watch out for INDIGOPN’s performance in both these markets.
On account of its strong topline and earnings growth outlook, we believe INDIGOPN deserves higher multiples in line with large peers trading at 55–60x. We initiate coverage with a Buy rating, and TP of INR2,270 (55x FY24E EPS).
Exhibit 1: Comparative valuations
Company Reco CMP Target Price Mkt Cap CAGR FY20-24E (%) P/E (x) ROE (%) (INR) (INR) Upside (%) (INR b) Sales EBITDA FY22E FY23E FY24E FY24E
APNT Neutral 3,364 3,540 5 3,227 17.8 18.0 86.1 65.5 57.0 34.5 BRGR - 760 - - 738 14.1 16.3 85.7 66.6 56.2 26.9 KNPL - 582 - - 314 9.5 15.0 63.2 43.7 35.6 17.4 AKZO - 2,025 - - 92 7.7 8.2 35.8 32.1 28.8 17.6 INDIGOPN Buy 1,944 2,270 17 92 24.5 34.7 116.5 70.6 47.4 22.4
Source: Company, MOFSL, Bloomberg
Indigo Paints
31 December 2021 6
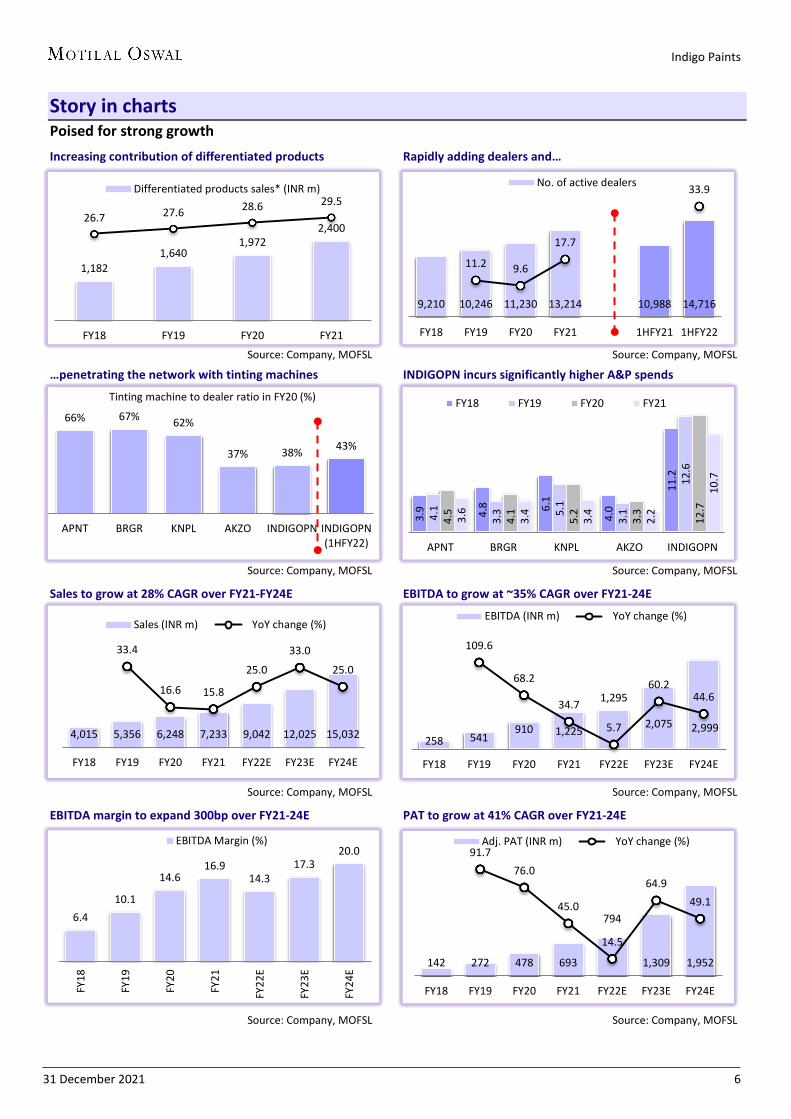
Story in charts Poised for strong growth
Increasing contribution of differentiated products Rapidly adding dealers and…
Source: Company, MOFSL Source: Company, MOFSL
…penetrating the network with tinting machines INDIGOPN incurs significantly higher A&P spends
Source: Company, MOFSL Source: Company, MOFSL
Sales to grow at 28% CAGR over FY21-FY24E EBITDA to grow at ~35% CAGR over FY21-24E
Source: Company, MOFSL Source: Company, MOFSL
EBITDA margin to expand 300bp over FY21-24E PAT to grow at 41% CAGR over FY21-24E
Source: Company, MOFSL Source: Company, MOFSL
1,182 1,640
1,972 2,400
26.7 27.6 28.6 29.5
FY18 FY19 FY20 FY21
Differentiated products sales* (INR m)
9,210 10,246 11,230 13,214 10,988 14,716
11.2 9.6
17.7
33.9
FY18 FY19 FY20 FY21 1HFY21 1HFY22
No. of active dealers
66% 67% 62%
37% 38% 43%
APNT BRGR KNPL AKZO INDIGOPN INDIGOPN(1HFY22)
Tinting machine to dealer ratio in FY20 (%)
3.9 4.8 6.
1
4.0
11.2
4.1
3.3 5.
1
3.1
12.6
4.5
4.1
5.2
3.3
12.7
3.6
3.4
3.4
2.2
10.7
APNT BRGR KNPL AKZO INDIGOPN
FY18 FY19 FY20 FY21
4,015 5,356 6,248 7,233 9,042 12,025 15,032
33.4
16.6 15.8
25.0
33.0
25.0
FY18 FY19 FY20 FY21 FY22E FY23E FY24E
Sales (INR m) YoY change (%)
258 541 910 1,225
1,295
2,075 2,999
109.6
68.2
34.7
5.7
60.2 44.6
FY18 FY19 FY20 FY21 FY22E FY23E FY24E
EBITDA (INR m) YoY change (%)
6.4 10.1
14.6 16.9
14.3 17.3
20.0
FY18
FY19
FY20
FY21
FY22
E
FY23
E
FY24
E
EBITDA Margin (%)
142 272 478 693
794
1,309 1,952
91.7 76.0
45.0
14.5
64.9 49.1
FY18 FY19 FY20 FY21 FY22E FY23E FY24E
Adj. PAT (INR m) YoY change (%)
Indigo Paints
31 December 2021 7
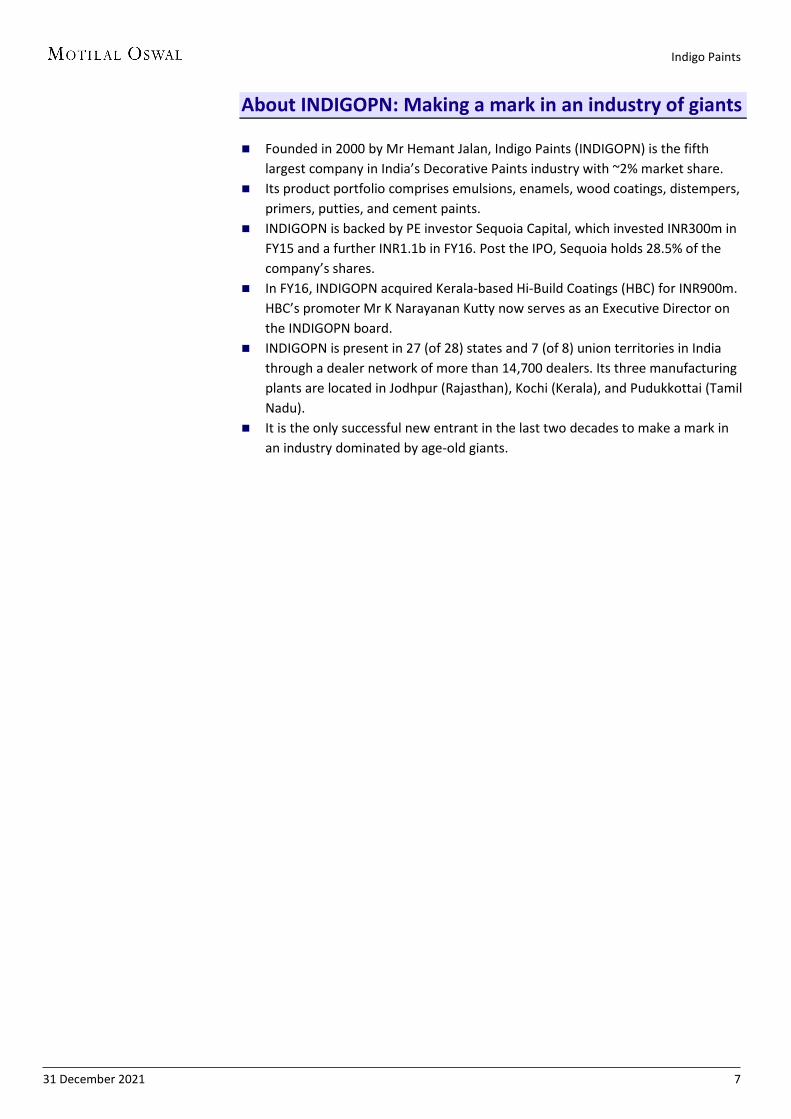
About INDIGOPN: Making a mark in an industry of giants Founded in 2000 by Mr Hemant Jalan, Indigo Paints (INDIGOPN) is the fifth
largest company in India’s Decorative Paints industry with ~2% market share. Its product portfolio comprises emulsions, enamels, wood coatings, distempers,
primers, putties, and cement paints. INDIGOPN is backed by PE investor Sequoia Capital, which invested INR300m in
FY15 and a further INR1.1b in FY16. Post the IPO, Sequoia holds 28.5% of the company’s shares.
In FY16, INDIGOPN acquired Kerala-based Hi-Build Coatings (HBC) for INR900m. HBC’s promoter Mr K Narayanan Kutty now serves as an Executive Director on the INDIGOPN board.
INDIGOPN is present in 27 (of 28) states and 7 (of 8) union territories in India through a dealer network of more than 14,700 dealers. Its three manufacturing plants are located in Jodhpur (Rajasthan), Kochi (Kerala), and Pudukkottai (Tamil Nadu).
It is the only successful new entrant in the last two decades to make a mark in an industry dominated by age-old giants.
Indigo Paints
31 December 2021 8
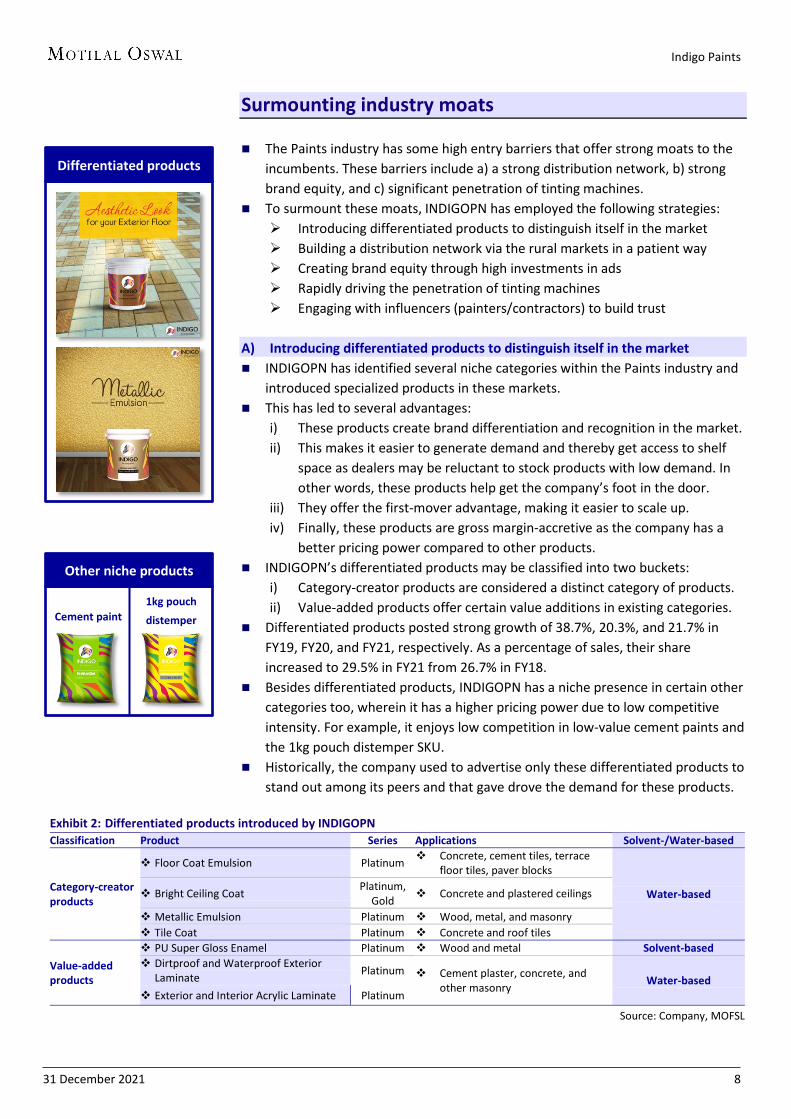
Surmounting industry moats The Paints industry has some high entry barriers that offer strong moats to the
incumbents. These barriers include a) a strong distribution network, b) strong brand equity, and c) significant penetration of tinting machines.
To surmount these moats, INDIGOPN has employed the following strategies: Introducing differentiated products to distinguish itself in the market Building a distribution network via the rural markets in a patient way Creating brand equity through high investments in ads Rapidly driving the penetration of tinting machines Engaging with influencers (painters/contractors) to build trust
A) Introducing differentiated products to distinguish itself in the market INDIGOPN has identified several niche categories within the Paints industry and
introduced specialized products in these markets. This has led to several advantages:
i) These products create brand differentiation and recognition in the market. ii) This makes it easier to generate demand and thereby get access to shelf
space as dealers may be reluctant to stock products with low demand. In other words, these products help get the company’s foot in the door.
iii) They offer the first-mover advantage, making it easier to scale up. iv) Finally, these products are gross margin-accretive as the company has a
better pricing power compared to other products. INDIGOPN’s differentiated products may be classified into two buckets:
i) Category-creator products are considered a distinct category of products. ii) Value-added products offer certain value additions in existing categories.
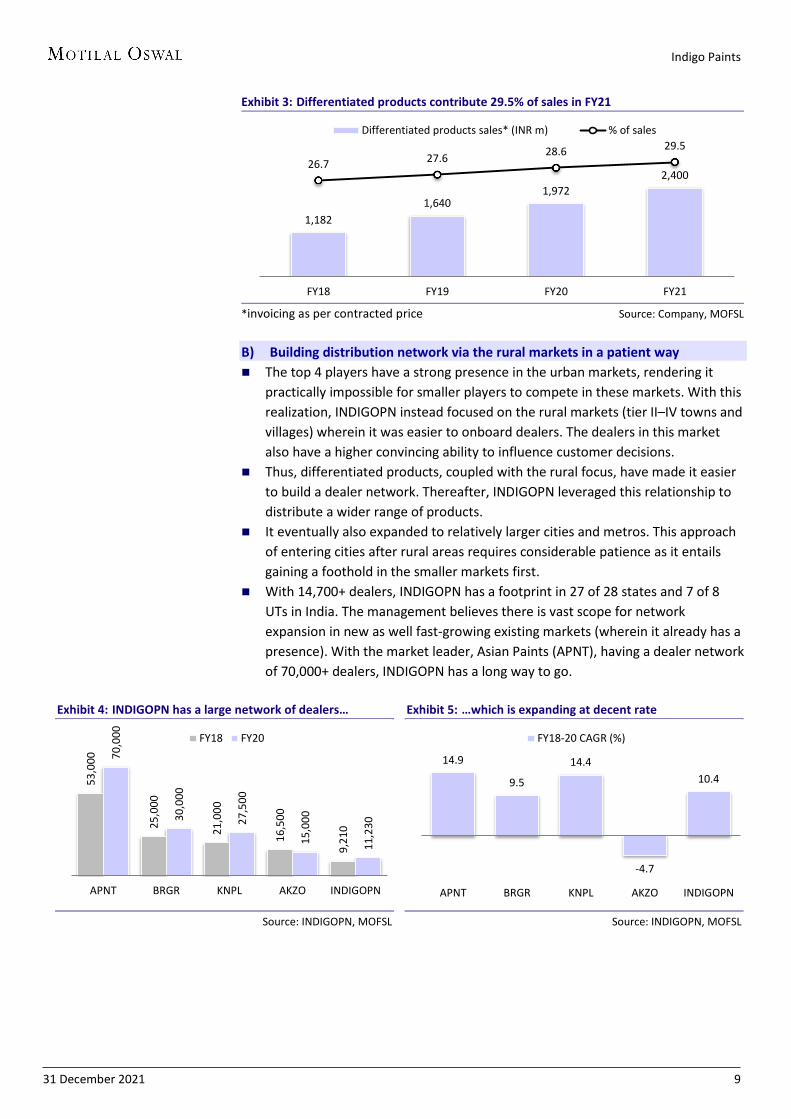
Differentiated products posted strong growth of 38.7%, 20.3%, and 21.7% in FY19, FY20, and FY21, respectively. As a percentage of sales, their share increased to 29.5% in FY21 from 26.7% in FY18.
Besides differentiated products, INDIGOPN has a niche presence in certain other categories too, wherein it has a higher pricing power due to low competitive intensity. For example, it enjoys low competition in low-value cement paints and the 1kg pouch distemper SKU.
Historically, the company used to advertise only these differentiated products to stand out among its peers and that gave drove the demand for these products.
Exhibit 2: Differentiated products introduced by INDIGOPN Classification Product Series Applications Solvent-/Water-based
Category-creator products
Floor Coat Emulsion Platinum Concrete, cement tiles, terrace floor tiles, paver blocks
Water-based Bright Ceiling Coat Platinum, Gold Concrete and plastered ceilings
Metallic Emulsion Platinum Wood, metal, and masonry Tile Coat Platinum Concrete and roof tiles
Value-added products
PU Super Gloss Enamel Platinum Wood and metal Solvent-based Dirtproof and Waterproof Exterior
Laminate Platinum Cement plaster, concrete, and other masonry Water-based
Exterior and Interior Acrylic Laminate Platinum
Source: Company, MOFSL
Cement paint
Differentiated products
Other niche products
1kg pouch distemper
Indigo Paints
31 December 2021 9
Exhibit 3: Differentiated products contribute 29.5% of sales in FY21
*invoicing as per contracted price Source: Company, MOFSL
B) Building distribution network via the rural markets in a patient way The top 4 players have a strong presence in the urban markets, rendering it
practically impossible for smaller players to compete in these markets. With this realization, INDIGOPN instead focused on the rural markets (tier II–IV towns and villages) wherein it was easier to onboard dealers. The dealers in this market also have a higher convincing ability to influence customer decisions.
Thus, differentiated products, coupled with the rural focus, have made it easier to build a dealer network. Thereafter, INDIGOPN leveraged this relationship to distribute a wider range of products.
It eventually also expanded to relatively larger cities and metros. This approach of entering cities after rural areas requires considerable patience as it entails gaining a foothold in the smaller markets first.
With 14,700+ dealers, INDIGOPN has a footprint in 27 of 28 states and 7 of 8 UTs in India. The management believes there is vast scope for network expansion in new as well fast-growing existing markets (wherein it already has a presence). With the market leader, Asian Paints (APNT), having a dealer network of 70,000+ dealers, INDIGOPN has a long way to go.
Exhibit 4: INDIGOPN has a large network of dealers…
Source: INDIGOPN, MOFSL
Exhibit 5: …which is expanding at decent rate
Source: INDIGOPN, MOFSL
1,182 1,640
1,972 2,400
26.7 27.6 28.6 29.5
FY18 FY19 FY20 FY21
Differentiated products sales* (INR m) % of sales
53,0
00
25,0
00
21,0
00
16,5
00
9,21
0
70,0
00
30,0
00
27,5
00
15,0
00
11,2
30
APNT BRGR KNPL AKZO INDIGOPN
FY18 FY20
14.9
9.5
14.4
-4.7
10.4
APNT BRGR KNPL AKZO INDIGOPN
FY18-20 CAGR (%)
Indigo Paints
31 December 2021 10
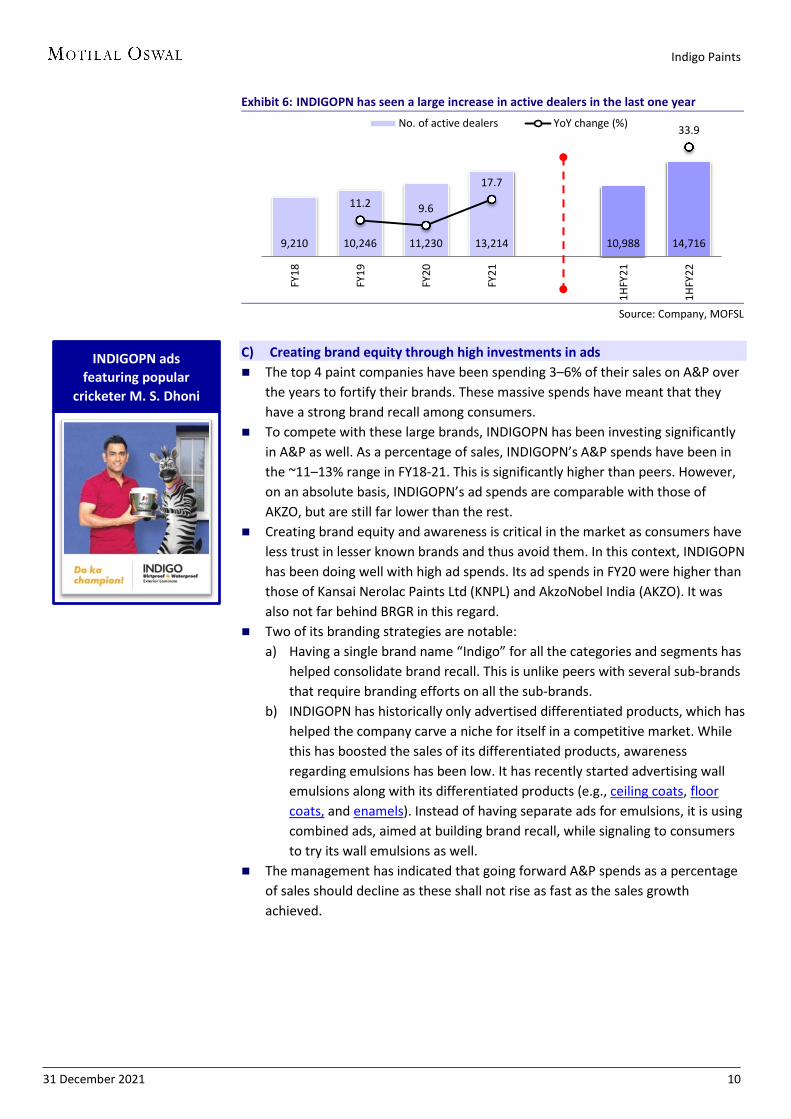
Exhibit 6: INDIGOPN has seen a large increase in active dealers in the last one year
Source: Company, MOFSL
C) Creating brand equity through high investments in ads The top 4 paint companies have been spending 3–6% of their sales on A&P over
the years to fortify their brands. These massive spends have meant that they have a strong brand recall among consumers.
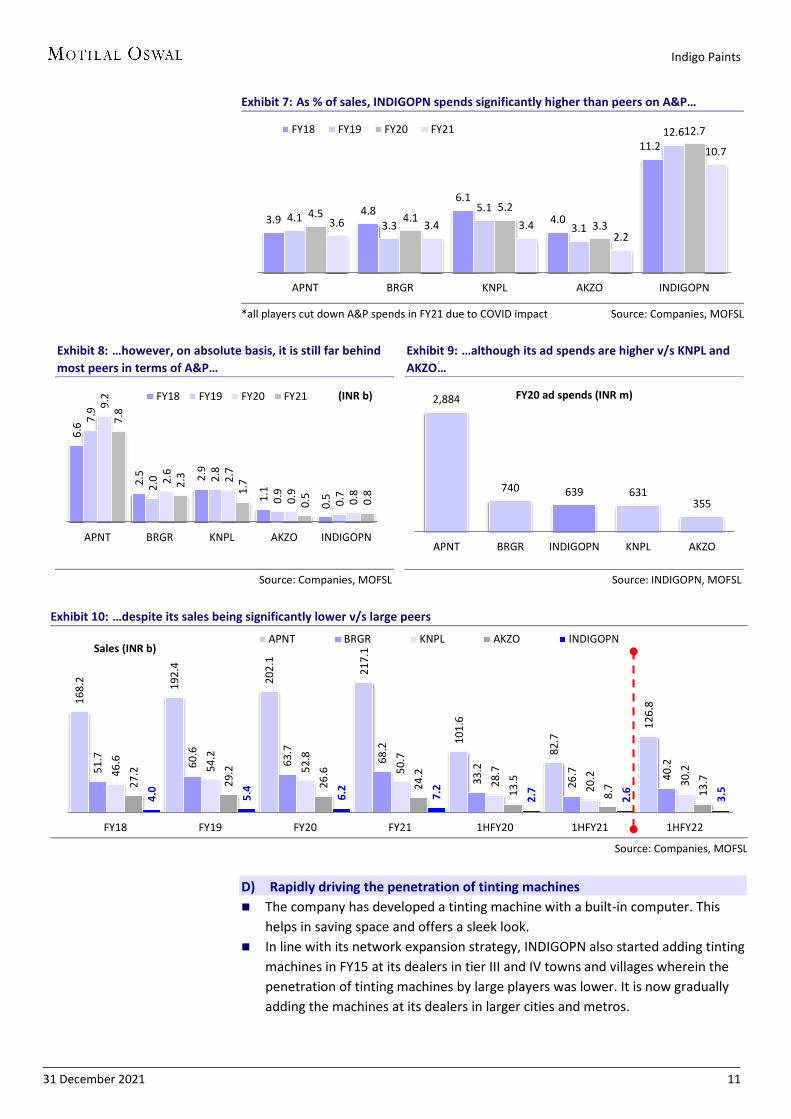
To compete with these large brands, INDIGOPN has been investing significantly in A&P as well. As a percentage of sales, INDIGOPN’s A&P spends have been in the ~11–13% range in FY18-21. This is significantly higher than peers. However, on an absolute basis, INDIGOPN’s ad spends are comparable with those of AKZO, but are still far lower than the rest.
Creating brand equity and awareness is critical in the market as consumers have less trust in lesser known brands and thus avoid them. In this context, INDIGOPN has been doing well with high ad spends. Its ad spends in FY20 were higher than those of Kansai Nerolac Paints Ltd (KNPL) and AkzoNobel India (AKZO). It was also not far behind BRGR in this regard.
Two of its branding strategies are notable: a) Having a single brand name “Indigo” for all the categories and segments has
helped consolidate brand recall. This is unlike peers with several sub-brands that require branding efforts on all the sub-brands.
b) INDIGOPN has historically only advertised differentiated products, which has helped the company carve a niche for itself in a competitive market. While this has boosted the sales of its differentiated products, awareness regarding emulsions has been low. It has recently started advertising wall emulsions along with its differentiated products (e.g., ceiling coats, floor coats, and enamels). Instead of having separate ads for emulsions, it is using combined ads, aimed at building brand recall, while signaling to consumers to try its wall emulsions as well.
The management has indicated that going forward A&P spends as a percentage of sales should decline as these shall not rise as fast as the sales growth achieved.
9,210 10,246 11,230 13,214 10,988 14,716
11.2 9.6
17.7
33.9
FY18
FY19
FY20
FY21
1HFY
21
1HFY
22
No. of active dealers YoY change (%)
INDIGOPN ads featuring popular
cricketer M. S. Dhoni
Indigo Paints
31 December 2021 11
Exhibit 7: As % of sales, INDIGOPN spends significantly higher than peers on A&P…
*all players cut down A&P spends in FY21 due to COVID impact Source: Companies, MOFSL
Exhibit 8: …however, on absolute basis, it is still far behind most peers in terms of A&P…
Source: Companies, MOFSL
Exhibit 9: …although its ad spends are higher v/s KNPL and AKZO…
Source: INDIGOPN, MOFSL
Exhibit 10: …despite its sales being significantly lower v/s large peers
Source: Companies, MOFSL
D) Rapidly driving the penetration of tinting machines The company has developed a tinting machine with a built-in computer. This
helps in saving space and offers a sleek look. In line with its network expansion strategy, INDIGOPN also started adding tinting
machines in FY15 at its dealers in tier III and IV towns and villages wherein the penetration of tinting machines by large players was lower. It is now gradually adding the machines at its dealers in larger cities and metros.
3.9 4.8
6.1
4.0
11.2
4.1 3.3
5.1
3.1
12.6
4.5 4.1 5.2
3.3
12.7
3.6 3.4 3.4 2.2
10.7
APNT BRGR KNPL AKZO INDIGOPN
FY18 FY19 FY20 FY21
6.6
2.5 2.9
1.1
0.5
7.9
2.0 2.
8
0.9
0.7
9.2
2.6
2.7
0.9
0.8
7.8
2.3
1.7
0.5 0.8
APNT BRGR KNPL AKZO INDIGOPN
FY18 FY19 FY20 FY21 (INR b) 2,884
740 639 631 355
APNT BRGR INDIGOPN KNPL AKZO
FY20 ad spends (INR m)
168.
2
192.
4
202.
1
217.
1
101.
6
82.7
126.
8
51.7
60.6
63.7
68.2
33.2
26.7
40.2
46.6
54.2
52.8
50.7
28.7
20.2
30.2
27.2
29.2
26.6
24.2
13.5
8.7
13.7
4.0
5.4
6.2
7.2
2.7
2.6
3.5
FY18 FY19 FY20 FY21 1HFY20 1HFY21 1HFY22
Sales (INR b) APNT BRGR KNPL AKZO INDIGOPN
Indigo Paints
31 December 2021 12
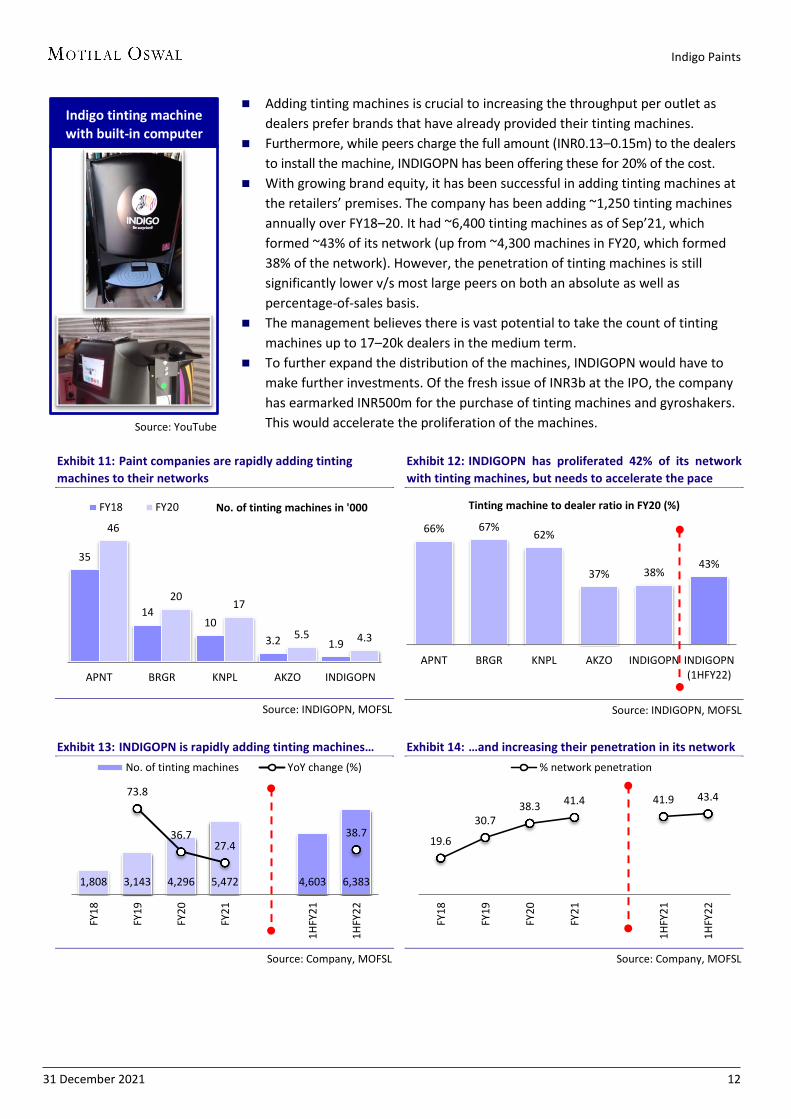
Adding tinting machines is crucial to increasing the throughput per outlet as dealers prefer brands that have already provided their tinting machines.
Furthermore, while peers charge the full amount (INR0.13–0.15m) to the dealers to install the machine, INDIGOPN has been offering these for 20% of the cost.
With growing brand equity, it has been successful in adding tinting machines at the retailers’ premises. The company has been adding ~1,250 tinting machines annually over FY18–20. It had ~6,400 tinting machines as of Sep’21, which formed ~43% of its network (up from ~4,300 machines in FY20, which formed 38% of the network). However, the penetration of tinting machines is still significantly lower v/s most large peers on both an absolute as well as percentage-of-sales basis.
The management believes there is vast potential to take the count of tinting machines up to 17–20k dealers in the medium term.
To further expand the distribution of the machines, INDIGOPN would have to make further investments. Of the fresh issue of INR3b at the IPO, the company has earmarked INR500m for the purchase of tinting machines and gyroshakers. This would accelerate the proliferation of the machines.
Exhibit 11: Paint companies are rapidly adding tinting machines to their networks
Source: INDIGOPN, MOFSL
Exhibit 12: INDIGOPN has proliferated 42% of its network with tinting machines, but needs to accelerate the pace
Source: INDIGOPN, MOFSL
Exhibit 13: INDIGOPN is rapidly adding tinting machines…
Source: Company, MOFSL
Exhibit 14: …and increasing their penetration in its network
Source: Company, MOFSL
35
14 10
3.2 1.9
46
20 17
5.5 4.3
APNT BRGR KNPL AKZO INDIGOPN
No. of tinting machines in '000 FY18 FY20
66% 67% 62%
37% 38% 43%
APNT BRGR KNPL AKZO INDIGOPN INDIGOPN(1HFY22)
Tinting machine to dealer ratio in FY20 (%)
1,808 3,143 4,296 5,472 4,603 6,383
73.8
36.7 27.4
38.7
FY18
FY19
FY20
FY21
1HFY
21
1HFY
22
No. of tinting machines YoY change (%)
19.6
30.7 38.3 41.4 41.9 43.4
FY18
FY19
FY20
FY21
1HFY
21
1HFY
22
% network penetration
Indigo tinting machine with built-in computer
Source: YouTube
Indigo Paints
31 December 2021 13
E) Engaging with influencers (painters/contractors) to build trust Painters and contractors are important influencers in the Paints industry. Paint
players engage with them to shore up their brand equity. APNT has been training them for several years now. Since 2007, APNT’s Colour Academy has offered vocational training to painters across 17 locations in India.
Along with offering financial incentives through redeemable coupons, INDIGOPN has also been conducting painter meets at which it carries out the blind testing of the company’s products against peer products. It also offers company-branded merchandise to the painters.
It is necessary to gain the trust of these influencers in the quality of the company’s products as they carry reputational risk in recommending the paint brand. Should any customer be dissatisfied with the products used, the painters/contractors stand to lose their reputation in the market, which would hamper prospects. In this context, INDIGOPN’s blind testing initiative is a step in the right direction.
Indigo Paints
31 December 2021 14
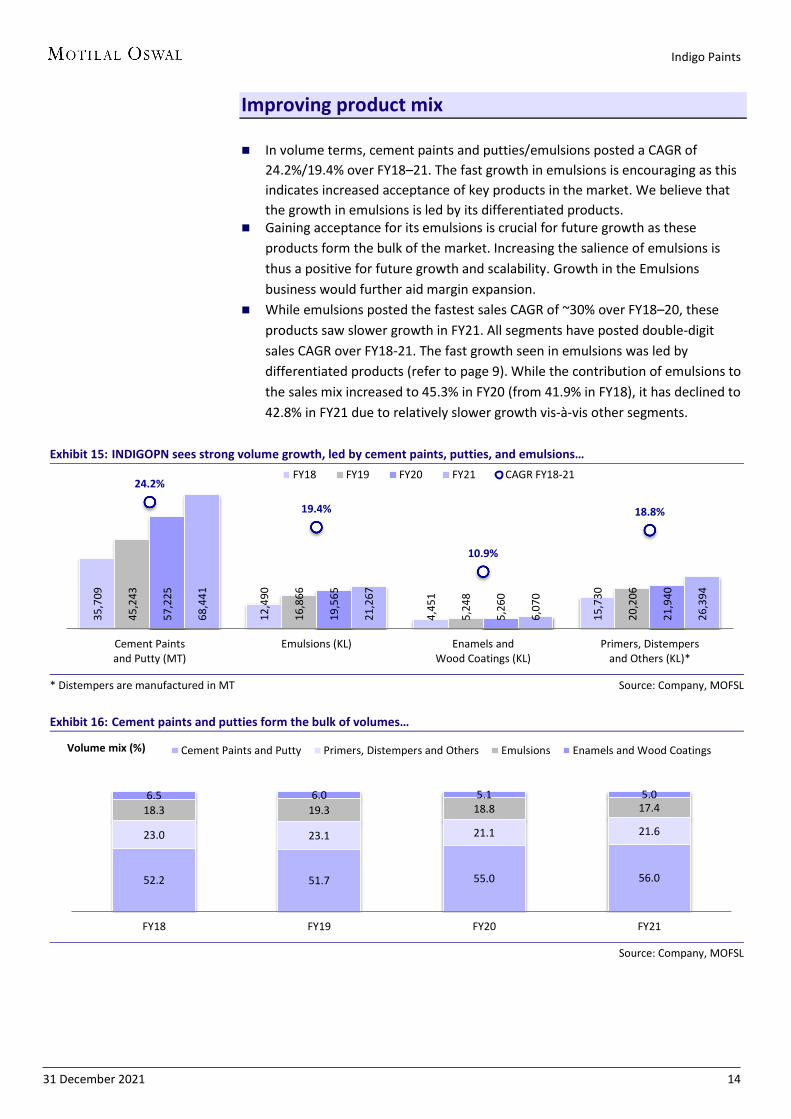
Improving product mix In volume terms, cement paints and putties/emulsions posted a CAGR of
24.2%/19.4% over FY18–21. The fast growth in emulsions is encouraging as this indicates increased acceptance of key products in the market. We believe that the growth in emulsions is led by its differentiated products.
Gaining acceptance for its emulsions is crucial for future growth as these products form the bulk of the market. Increasing the salience of emulsions is thus a positive for future growth and scalability. Growth in the Emulsions business would further aid margin expansion.
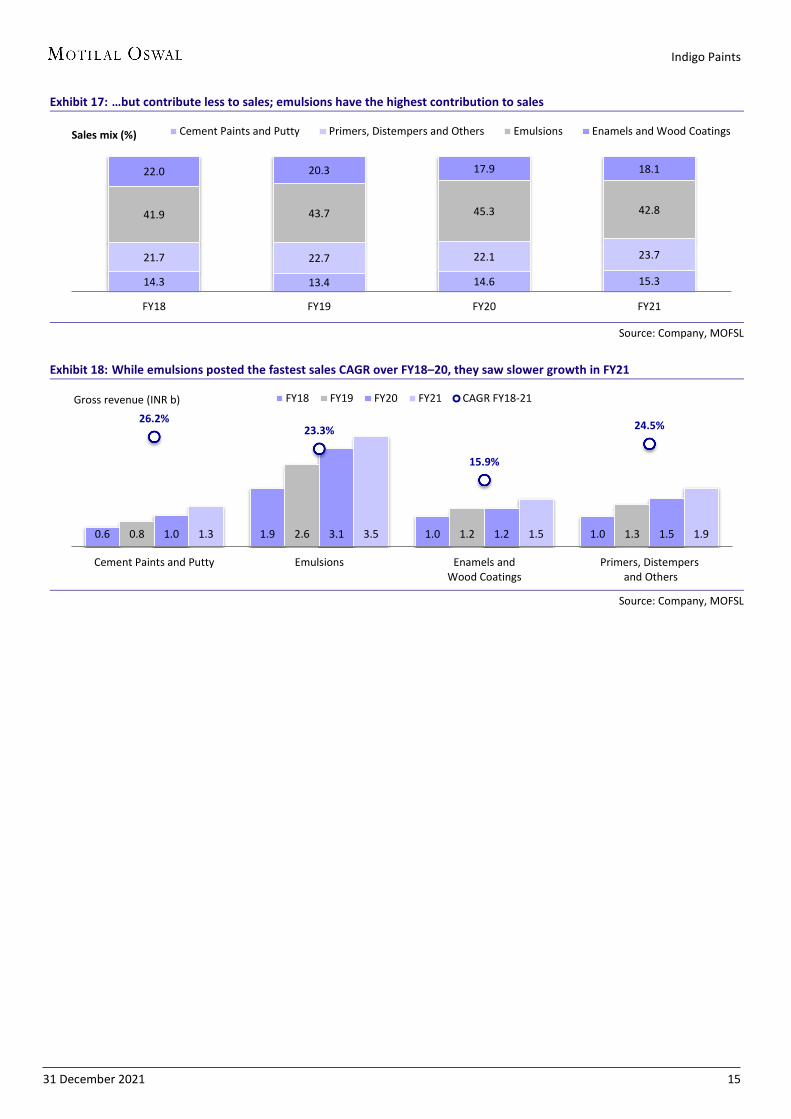
While emulsions posted the fastest sales CAGR of ~30% over FY18–20, these products saw slower growth in FY21. All segments have posted double-digit sales CAGR over FY18-21. The fast growth seen in emulsions was led by differentiated products (refer to page 9). While the contribution of emulsions to the sales mix increased to 45.3% in FY20 (from 41.9% in FY18), it has declined to 42.8% in FY21 due to relatively slower growth vis-à-vis other segments.
Exhibit 15: INDIGOPN sees strong volume growth, led by cement paints, putties, and emulsions…
* Distempers are manufactured in MT Source: Company, MOFSL
Exhibit 16: Cement paints and putties form the bulk of volumes…
Source: Company, MOFSL
35,7
09
12,4
90
4,45
1
15,7
30
45,2
43
16,8
66
5,24
8
20,2
06
57,2
25
19,5
65
5,26
0
21,9
40
68,4
41
21,2
67
6,07
0
26,3
94
24.2%
19.4%
10.9%
18.8%
Cement Paintsand Putty (MT)
Emulsions (KL) Enamels andWood Coatings (KL)
Primers, Distempersand Others (KL)*
FY18 FY19 FY20 FY21 CAGR FY18-21
52.2 51.7 55.0 56.0
23.0 23.1 21.1 21.6
18.3 19.3 18.8 17.4 6.5 6.0 5.1 5.0
FY18 FY19 FY20 FY21
Volume mix (%) Cement Paints and Putty Primers, Distempers and Others Emulsions Enamels and Wood Coatings
Indigo Paints
31 December 2021 15
Exhibit 17: …but contribute less to sales; emulsions have the highest contribution to sales
Source: Company, MOFSL
Exhibit 18: While emulsions posted the fastest sales CAGR over FY18–20, they saw slower growth in FY21
Source: Company, MOFSL
14.3 13.4 14.6 15.3
21.7 22.7 22.1 23.7
41.9 43.7 45.3 42.8
22.0 20.3 17.9 18.1
FY18 FY19 FY20 FY21
Sales mix (%) Cement Paints and Putty Primers, Distempers and Others Emulsions Enamels and Wood Coatings
0.6 1.9 1.0 1.0 0.8 2.6 1.2 1.3 1.0 3.1 1.2 1.5 1.3 3.5 1.5 1.9
26.2% 23.3%
15.9%
24.5%
Cement Paints and Putty Emulsions Enamels andWood Coatings
Primers, Distempers and Others
FY18 FY19 FY20 FY21 CAGR FY18-21Gross revenue (INR b)
Indigo Paints
31 December 2021 16
Ground checks: rural positive, but urban a monitorable Strong presence in Kerala: Kerala contributed ~35% to sales for INDIGOPN in
FY20; however, this declined to 30% in FY21, with other regions growing at a faster pace. Channel checks indicate INDIGOPN is among the top brands for dealers in Kerala with a meaningful contribution to overall sales. The dealers largely expressed an optimistic outlook for the brand.
Dealers largely sell differentiated or adjacent products: Most of the dealers we talked to indicated that for INDIGOPN, they largely sell one or more floor paints, ceiling paints, enamels, wood coatings, or primers. There is no particular product favored in any particular geography. We believe this higher salience of differentiated and adjacent products is owing to the company’s focused advertisements for the products. Consequently, we expect wall emulsion sales to pick up now that the company has begun to advertise these as well.
Low brand awareness hinders offtake, but dealers can convince customers to switch: In a market with well-entrenched large players, INDIGOPN is still a very small brand. Compared with the larger brands, there is much lower awareness for INDIGOPN, preventing customers from trying out its products. However, the dealers are able to convince the customers about the superior quality of several of INDIGOPN’s products, especially when the customers trust the dealers.
Smaller dealer network prevents inter-dealer competition: An unintended consequence of a vast dealer network of large brands is that within a geography, there are usually multiple dealers of the same brand. This leads to high inter-dealer competitive intensity, thereby eating into dealers’ margins as they have to offer higher discounts to drive sales. While this does not affect the company’s margins, it disincentivizes the dealers to sell the brands. In such a scenario, they prefer to focus on smaller brands with a smaller distribution footprint and, therefore, lower competition. This phenomenon especially benefits smaller brands such as INDIGOPN.
INDIGOPN’s fulfillment slower v/s bigger players: Due to its smaller size, INDIGOPN has fewer depots and a lower frequency of servicing dealers. In the case of an urgent order of any depleted product, the dealer can get the order fulfilled in a matter of hours from APNT, but order fulfillment may take 1–2 days for INDIGOPN. This does affect the dealer sentiment to some extent. However, we believe that as the company scales up, these issues should get resolved.
Good traction in rural, but urban markets to be monitored: INDIGOPN has scaled up its presence well in rural and small-town markets. However, the top 4 players dominate in the urban and metro areas. Our channel checks in Mumbai, for example, indicate a very low presence of INDIGOPN in the dealer’s brand mix. Again, the challenge to scale up here is threefold: a) low brand recognition and visibility lead to lower trust among consumers, b) large players have already penetrated their tinting machines in the market making them the preferred brands of the dealers, and c) the fast rate of fulfillment by larger players makes it easier for dealers to close orders faster for larger brands. Thus, INDIGOPN’s performance in urban markets will have to be monitored.
Indigo Paints
31 December 2021 17
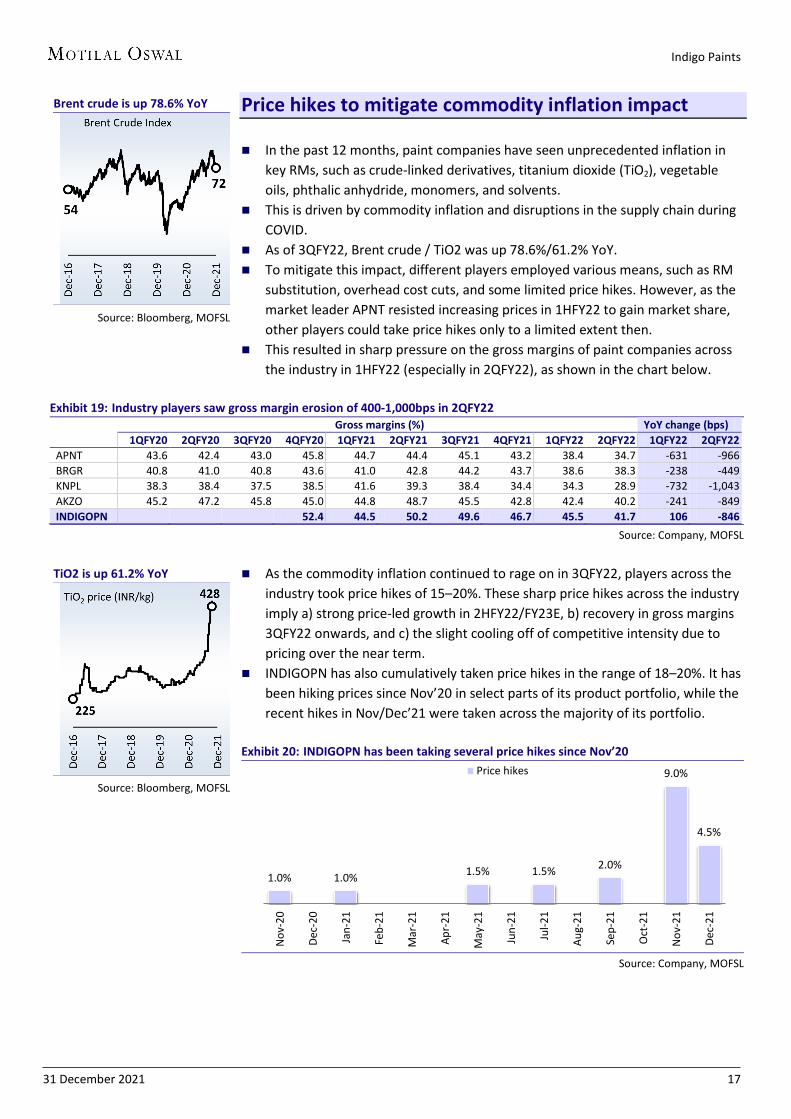
Price hikes to mitigate commodity inflation impact In the past 12 months, paint companies have seen unprecedented inflation in
key RMs, such as crude-linked derivatives, titanium dioxide (TiO2), vegetable oils, phthalic anhydride, monomers, and solvents.
This is driven by commodity inflation and disruptions in the supply chain during COVID.
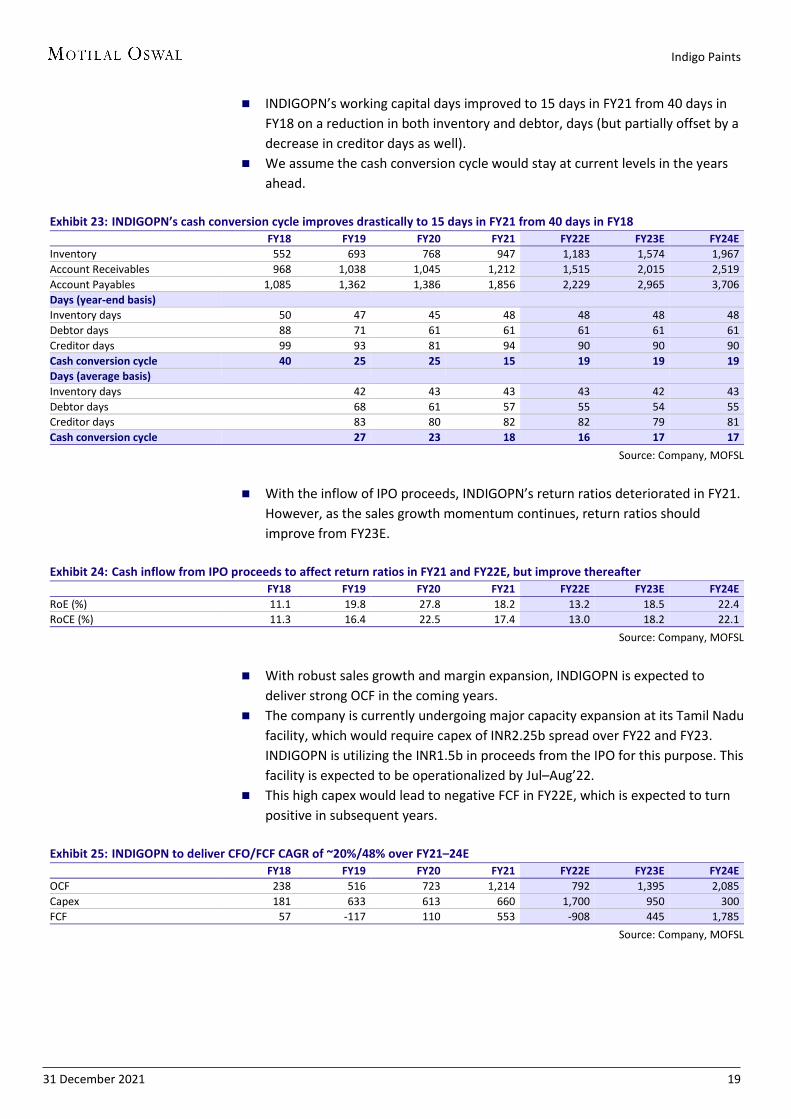
As of 3QFY22, Brent crude / TiO2 was up 78.6%/61.2% YoY. To mitigate this impact, different players employed various means, such as RM
substitution, overhead cost cuts, and some limited price hikes. However, as the market leader APNT resisted increasing prices in 1HFY22 to gain market share, other players could take price hikes only to a limited extent then.
This resulted in sharp pressure on the gross margins of paint companies across the industry in 1HFY22 (especially in 2QFY22), as shown in the chart below.
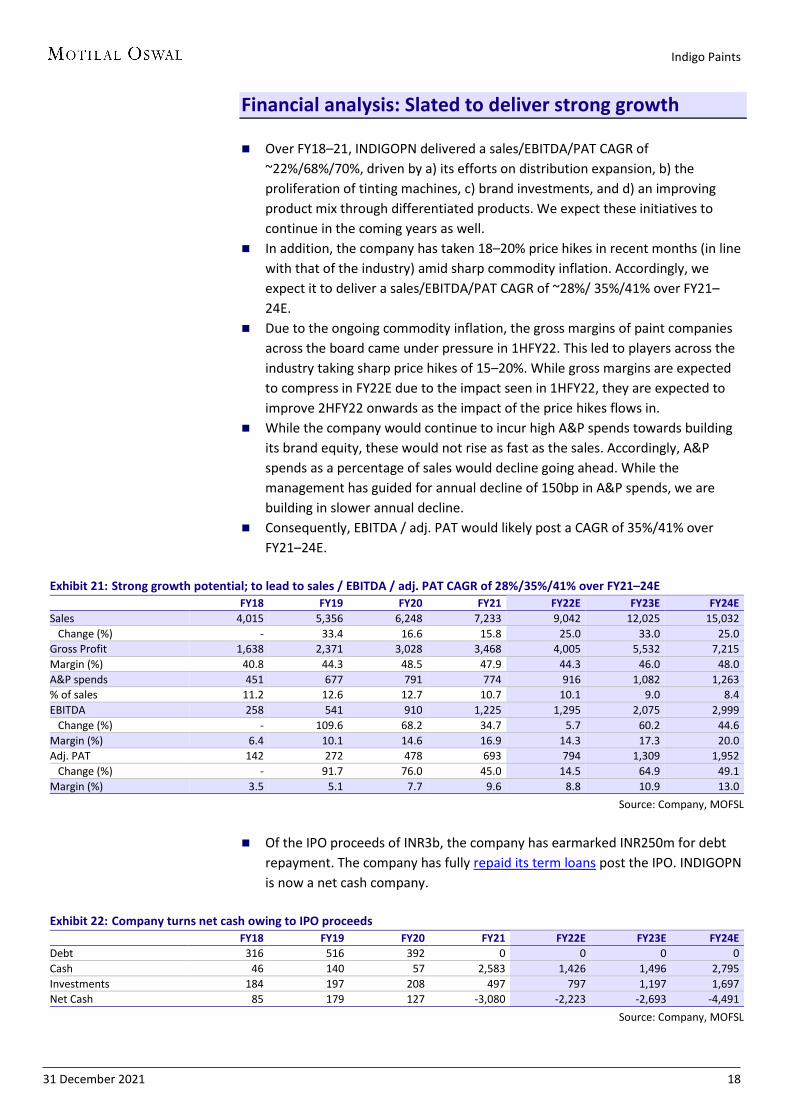
Exhibit 19: Industry players saw gross margin erosion of 400-1,000bps in 2QFY22
Gross margins (%) YoY change (bps)
1QFY20 2QFY20 3QFY20 4QFY20 1QFY21 2QFY21 3QFY21 4QFY21 1QFY22 2QFY22 1QFY22 2QFY22
APNT 43.6 42.4 43.0 45.8 44.7 44.4 45.1 43.2 38.4 34.7 -631 -966 BRGR 40.8 41.0 40.8 43.6 41.0 42.8 44.2 43.7 38.6 38.3 -238 -449 KNPL 38.3 38.4 37.5 38.5 41.6 39.3 38.4 34.4 34.3 28.9 -732 -1,043 AKZO 45.2 47.2 45.8 45.0 44.8 48.7 45.5 42.8 42.4 40.2 -241 -849 INDIGOPN
52.4 44.5 50.2 49.6 46.7 45.5 41.7 106 -846
Source: Company, MOFSL
As the commodity inflation continued to rage on in 3QFY22, players across the
industry took price hikes of 15–20%. These sharp price hikes across the industry imply a) strong price-led growth in 2HFY22/FY23E, b) recovery in gross margins 3QFY22 onwards, and c) the slight cooling off of competitive intensity due to pricing over the near term.
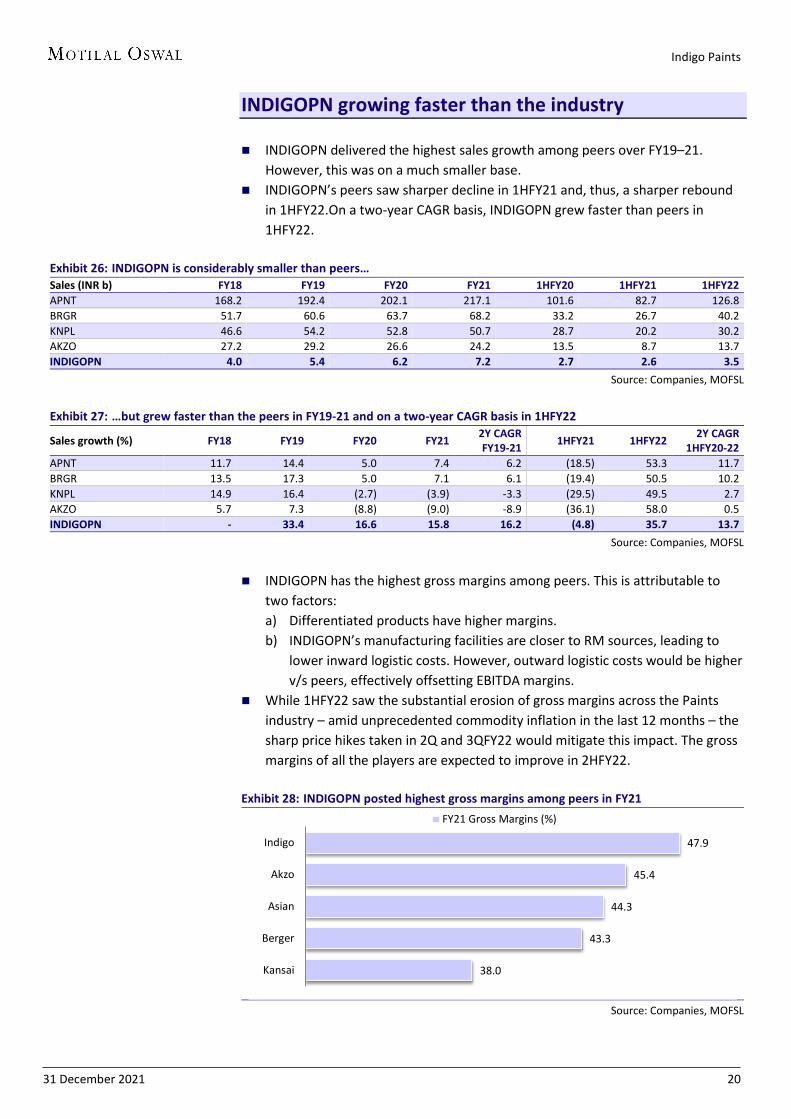
INDIGOPN has also cumulatively taken price hikes in the range of 18–20%. It has been hiking prices since Nov’20 in select parts of its product portfolio, while the recent hikes in Nov/Dec’21 were taken across the majority of its portfolio.
Exhibit 20: INDIGOPN has been taking several price hikes since Nov’20
Source: Company, MOFSL
1.0% 1.0% 1.5% 1.5% 2.0%
9.0%
4.5%
Nov
-20
Dec-
20
Jan-
21
Feb-
21
Mar
-21
Apr-
21
May
-21
Jun-
21
Jul-2
1
Aug-
21
Sep-
21
Oct
-21
Nov
-21
Dec-
21
Price hikes
Brent crude is up 78.6% YoY
Source: Bloomberg, MOFSL
TiO2 is up 61.2% YoY
Source: Bloomberg, MOFSL
Indigo Paints
31 December 2021 18
Financial analysis: Slated to deliver strong growth Over FY18–21, INDIGOPN delivered a sales/EBITDA/PAT CAGR of
~22%/68%/70%, driven by a) its efforts on distribution expansion, b) the proliferation of tinting machines, c) brand investments, and d) an improving product mix through differentiated products. We expect these initiatives to continue in the coming years as well.
In addition, the company has taken 18–20% price hikes in recent months (in line with that of the industry) amid sharp commodity inflation. Accordingly, we expect it to deliver a sales/EBITDA/PAT CAGR of ~28%/ 35%/41% over FY21–24E.
Due to the ongoing commodity inflation, the gross margins of paint companies across the board came under pressure in 1HFY22. This led to players across the industry taking sharp price hikes of 15–20%. While gross margins are expected to compress in FY22E due to the impact seen in 1HFY22, they are expected to improve 2HFY22 onwards as the impact of the price hikes flows in.
While the company would continue to incur high A&P spends towards building its brand equity, these would not rise as fast as the sales. Accordingly, A&P spends as a percentage of sales would decline going ahead. While the management has guided for annual decline of 150bp in A&P spends, we are building in slower annual decline.
Consequently, EBITDA / adj. PAT would likely post a CAGR of 35%/41% over FY21–24E.
Exhibit 21: Strong growth potential; to lead to sales / EBITDA / adj. PAT CAGR of 28%/35%/41% over FY21–24E
FY18 FY19 FY20 FY21 FY22E FY23E FY24E Sales 4,015 5,356 6,248 7,233 9,042 12,025 15,032 Change (%) - 33.4 16.6 15.8 25.0 33.0 25.0 Gross Profit 1,638 2,371 3,028 3,468 4,005 5,532 7,215 Margin (%) 40.8 44.3 48.5 47.9 44.3 46.0 48.0 A&P spends 451 677 791 774 916 1,082 1,263 % of sales 11.2 12.6 12.7 10.7 10.1 9.0 8.4 EBITDA 258 541 910 1,225 1,295 2,075 2,999 Change (%) - 109.6 68.2 34.7 5.7 60.2 44.6 Margin (%) 6.4 10.1 14.6 16.9 14.3 17.3 20.0 Adj. PAT 142 272 478 693 794 1,309 1,952 Change (%) - 91.7 76.0 45.0 14.5 64.9 49.1 Margin (%) 3.5 5.1 7.7 9.6 8.8 10.9 13.0
Source: Company, MOFSL
Of the IPO proceeds of INR3b, the company has earmarked INR250m for debt
repayment. The company has fully repaid its term loans post the IPO. INDIGOPN is now a net cash company.
Exhibit 22: Company turns net cash owing to IPO proceeds
FY18 FY19 FY20 FY21 FY22E FY23E FY24E Debt 316 516 392 0 0 0 0 Cash 46 140 57 2,583 1,426 1,496 2,795 Investments 184 197 208 497 797 1,197 1,697 Net Cash 85 179 127 -3,080 -2,223 -2,693 -4,491
Source: Company, MOFSL
Indigo Paints
31 December 2021 19
INDIGOPN’s working capital days improved to 15 days in FY21 from 40 days in FY18 on a reduction in both inventory and debtor, days (but partially offset by a decrease in creditor days as well).
We assume the cash conversion cycle would stay at current levels in the years ahead.
Exhibit 23: INDIGOPN’s cash conversion cycle improves drastically to 15 days in FY21 from 40 days in FY18
FY18 FY19 FY20 FY21 FY22E FY23E FY24E Inventory 552 693 768 947 1,183 1,574 1,967 Account Receivables 968 1,038 1,045 1,212 1,515 2,015 2,519 Account Payables 1,085 1,362 1,386 1,856 2,229 2,965 3,706 Days (year-end basis) Inventory days 50 47 45 48 48 48 48 Debtor days 88 71 61 61 61 61 61 Creditor days 99 93 81 94 90 90 90 Cash conversion cycle 40 25 25 15 19 19 19 Days (average basis) Inventory days 42 43 43 43 42 43 Debtor days 68 61 57 55 54 55 Creditor days 83 80 82 82 79 81 Cash conversion cycle 27 23 18 16 17 17
Source: Company, MOFSL
With the inflow of IPO proceeds, INDIGOPN’s return ratios deteriorated in FY21.
However, as the sales growth momentum continues, return ratios should improve from FY23E.
Exhibit 24: Cash inflow from IPO proceeds to affect return ratios in FY21 and FY22E, but improve thereafter
FY18 FY19 FY20 FY21 FY22E FY23E FY24E RoE (%) 11.1 19.8 27.8 18.2 13.2 18.5 22.4 RoCE (%) 11.3 16.4 22.5 17.4 13.0 18.2 22.1
Source: Company, MOFSL
With robust sales growth and margin expansion, INDIGOPN is expected to
deliver strong OCF in the coming years. The company is currently undergoing major capacity expansion at its Tamil Nadu
facility, which would require capex of INR2.25b spread over FY22 and FY23. INDIGOPN is utilizing the INR1.5b in proceeds from the IPO for this purpose. This facility is expected to be operationalized by Jul–Aug’22.
This high capex would lead to negative FCF in FY22E, which is expected to turn positive in subsequent years.
Exhibit 25: INDIGOPN to deliver CFO/FCF CAGR of ~20%/48% over FY21–24E
FY18 FY19 FY20 FY21 FY22E FY23E FY24E OCF 238 516 723 1,214 792 1,395 2,085 Capex 181 633 613 660 1,700 950 300 FCF 57 -117 110 553 -908 445 1,785
Source: Company, MOFSL
Indigo Paints
31 December 2021 20
INDIGOPN growing faster than the industry INDIGOPN delivered the highest sales growth among peers over FY19–21.
However, this was on a much smaller base. INDIGOPN’s peers saw sharper decline in 1HFY21 and, thus, a sharper rebound
in 1HFY22.On a two-year CAGR basis, INDIGOPN grew faster than peers in 1HFY22.
Exhibit 26: INDIGOPN is considerably smaller than peers… Sales (INR b) FY18 FY19 FY20 FY21 1HFY20 1HFY21 1HFY22 APNT 168.2 192.4 202.1 217.1 101.6 82.7 126.8 BRGR 51.7 60.6 63.7 68.2 33.2 26.7 40.2 KNPL 46.6 54.2 52.8 50.7 28.7 20.2 30.2 AKZO 27.2 29.2 26.6 24.2 13.5 8.7 13.7 INDIGOPN 4.0 5.4 6.2 7.2 2.7 2.6 3.5
Source: Companies, MOFSL
Exhibit 27: …but grew faster than the peers in FY19-21 and on a two-year CAGR basis in 1HFY22
Sales growth (%) FY18 FY19 FY20 FY21 2Y CAGR FY19-21 1HFY21 1HFY22 2Y CAGR
1HFY20-22 APNT 11.7 14.4 5.0 7.4 6.2 (18.5) 53.3 11.7 BRGR 13.5 17.3 5.0 7.1 6.1 (19.4) 50.5 10.2 KNPL 14.9 16.4 (2.7) (3.9) -3.3 (29.5) 49.5 2.7 AKZO 5.7 7.3 (8.8) (9.0) -8.9 (36.1) 58.0 0.5 INDIGOPN - 33.4 16.6 15.8 16.2 (4.8) 35.7 13.7
Source: Companies, MOFSL
INDIGOPN has the highest gross margins among peers. This is attributable to
two factors: a) Differentiated products have higher margins. b) INDIGOPN’s manufacturing facilities are closer to RM sources, leading to
lower inward logistic costs. However, outward logistic costs would be higher v/s peers, effectively offsetting EBITDA margins.
While 1HFY22 saw the substantial erosion of gross margins across the Paints industry – amid unprecedented commodity inflation in the last 12 months – the sharp price hikes taken in 2Q and 3QFY22 would mitigate this impact. The gross margins of all the players are expected to improve in 2HFY22.
Exhibit 28: INDIGOPN posted highest gross margins among peers in FY21
Source: Companies, MOFSL
38.0
43.3
44.3
45.4
47.9
Kansai
Berger
Asian
Akzo
Indigo
FY21 Gross Margins (%)
Indigo Paints
31 December 2021 21
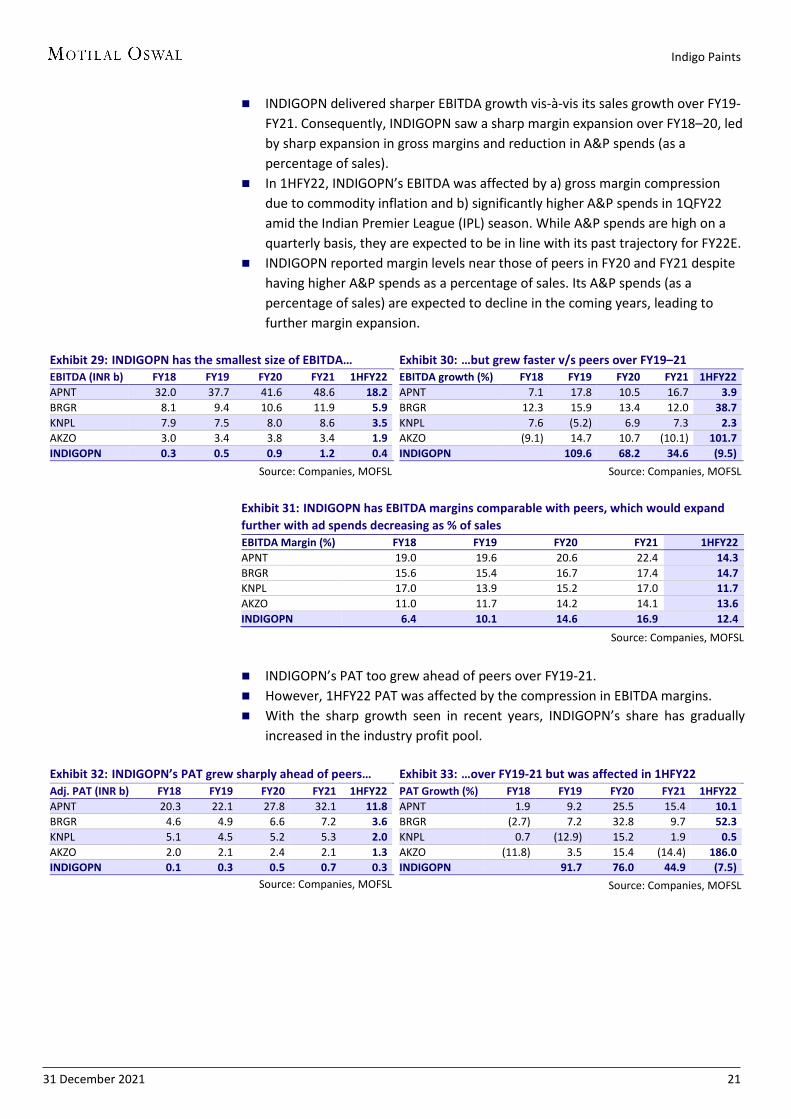
INDIGOPN delivered sharper EBITDA growth vis-à-vis its sales growth over FY19- FY21. Consequently, INDIGOPN saw a sharp margin expansion over FY18–20, led by sharp expansion in gross margins and reduction in A&P spends (as a percentage of sales).
In 1HFY22, INDIGOPN’s EBITDA was affected by a) gross margin compression due to commodity inflation and b) significantly higher A&P spends in 1QFY22 amid the Indian Premier League (IPL) season. While A&P spends are high on a quarterly basis, they are expected to be in line with its past trajectory for FY22E.
INDIGOPN reported margin levels near those of peers in FY20 and FY21 despite having higher A&P spends as a percentage of sales. Its A&P spends (as a percentage of sales) are expected to decline in the coming years, leading to further margin expansion.
Exhibit 29: INDIGOPN has the smallest size of EBITDA… EBITDA (INR b) FY18 FY19 FY20 FY21 1HFY22 APNT 32.0 37.7 41.6 48.6 18.2 BRGR 8.1 9.4 10.6 11.9 5.9 KNPL 7.9 7.5 8.0 8.6 3.5 AKZO 3.0 3.4 3.8 3.4 1.9 INDIGOPN 0.3 0.5 0.9 1.2 0.4
Source: Companies, MOFSL
Exhibit 30: …but grew faster v/s peers over FY19–21 EBITDA growth (%) FY18 FY19 FY20 FY21 1HFY22 APNT 7.1 17.8 10.5 16.7 3.9 BRGR 12.3 15.9 13.4 12.0 38.7 KNPL 7.6 (5.2) 6.9 7.3 2.3 AKZO (9.1) 14.7 10.7 (10.1) 101.7 INDIGOPN 109.6 68.2 34.6 (9.5)
Source: Companies, MOFSL
Exhibit 31: INDIGOPN has EBITDA margins comparable with peers, which would expand further with ad spends decreasing as % of sales EBITDA Margin (%) FY18 FY19 FY20 FY21 1HFY22 APNT 19.0 19.6 20.6 22.4 14.3 BRGR 15.6 15.4 16.7 17.4 14.7 KNPL 17.0 13.9 15.2 17.0 11.7 AKZO 11.0 11.7 14.2 14.1 13.6 INDIGOPN 6.4 10.1 14.6 16.9 12.4
Source: Companies, MOFSL
INDIGOPN’s PAT too grew ahead of peers over FY19-21. However, 1HFY22 PAT was affected by the compression in EBITDA margins. With the sharp growth seen in recent years, INDIGOPN’s share has gradually
increased in the industry profit pool.
Exhibit 32: INDIGOPN’s PAT grew sharply ahead of peers… Adj. PAT (INR b) FY18 FY19 FY20 FY21 1HFY22 APNT 20.3 22.1 27.8 32.1 11.8 BRGR 4.6 4.9 6.6 7.2 3.6 KNPL 5.1 4.5 5.2 5.3 2.0 AKZO 2.0 2.1 2.4 2.1 1.3 INDIGOPN 0.1 0.3 0.5 0.7 0.3
Source: Companies, MOFSL
Exhibit 33: …over FY19-21 but was affected in 1HFY22 PAT Growth (%) FY18 FY19 FY20 FY21 1HFY22 APNT 1.9 9.2 25.5 15.4 10.1 BRGR (2.7) 7.2 32.8 9.7 52.3 KNPL 0.7 (12.9) 15.2 1.9 0.5 AKZO (11.8) 3.5 15.4 (14.4) 186.0 INDIGOPN
91.7 76.0 44.9 (7.5)
Source: Companies, MOFSL
Indigo Paints
31 December 2021 22
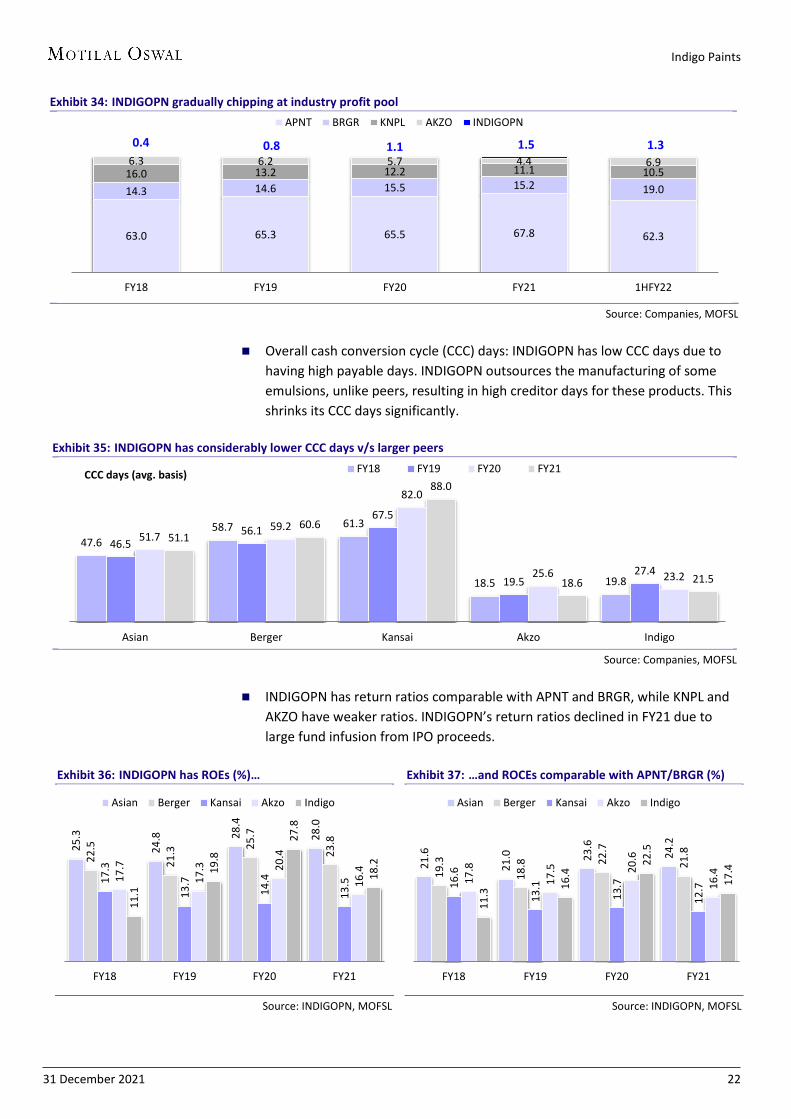
Exhibit 34: INDIGOPN gradually chipping at industry profit pool
Source: Companies, MOFSL
Overall cash conversion cycle (CCC) days: INDIGOPN has low CCC days due to having high payable days. INDIGOPN outsources the manufacturing of some emulsions, unlike peers, resulting in high creditor days for these products. This shrinks its CCC days significantly.
Exhibit 35: INDIGOPN has considerably lower CCC days v/s larger peers
Source: Companies, MOFSL
INDIGOPN has return ratios comparable with APNT and BRGR, while KNPL and
AKZO have weaker ratios. INDIGOPN’s return ratios declined in FY21 due to large fund infusion from IPO proceeds.
Exhibit 36: INDIGOPN has ROEs (%)…
Source: INDIGOPN, MOFSL
Exhibit 37: …and ROCEs comparable with APNT/BRGR (%)
Source: INDIGOPN, MOFSL
63.0 65.3 65.5 67.8 62.3
14.3 14.6 15.5 15.2 19.0 16.0 13.2 12.2 11.1 10.5 6.3 6.2 5.7 4.4 6.9
0.4 0.8 1.1 1.5 1.3
FY18 FY19 FY20 FY21 1HFY22
APNT BRGR KNPL AKZO INDIGOPN
47.6 58.7 61.3
18.5 19.8
46.5 56.1
67.5
19.5 27.4
51.7 59.2
82.0
25.6 23.2
51.1 60.6
88.0
18.6 21.5
Asian Berger Kansai Akzo Indigo
CCC days (avg. basis) FY18 FY19 FY20 FY21
25.3
24.8
28.4
28.0
22.5
21.3
25.7
23.8
17.3
13.7
14.4
13.5
17.7
17.3
20.4
16.4
11.1
19.8
27.8
18.2
FY18 FY19 FY20 FY21
Asian Berger Kansai Akzo Indigo
21.6
21.0
23.6
24.2
19.3
18.8
22.7
21.8
16.6
13.1
13.7
12.7
17.8
17.5
20.6
16.4
11.3
16.4
22.5
17.4
FY18 FY19 FY20 FY21
Asian Berger Kansai Akzo Indigo
Indigo Paints
31 December 2021 23
Valuation and view The Indian Paints industry offers an attractive opportunity on account of the low
per capita consumption of paints, urbanization, and the shortening of the repainting cycle. Coupled with the oligopolistic nature of the industry, this means that the incumbents have strong growth runways.
INDIGOPN has gradually, but successfully, managed to breach the barriers to gain entry into the Paints industry on the back of its patient, multi-pronged strategy to a) build up its distribution from the rural areas to urban, b) introduce differentiated products, c) invest heavily in brand building, and d) rapidly penetrate store networks with tinting machines. It has grown faster v/s peers and has been chipping away an increasing share of the industry profit pool.
At just ~2% market share, INDIGOPN has immense opportunity to grow by increasing its distribution reach as well as the throughput per dealer. We expect it to deliver a sales/EBITDA/PAT CAGR of 28%/35%/42% over FY21–24E.
While we expect INDIGOPN to continue to outperform larger peers in the industry, aggression by larger players in the rural markets could put the brakes on INDIGOPN’s growth aspirations. At the same time, greater acceptability in the urban markets would be crucial to INDIGOPN’s ambitions of achieving scale. Therefore, it would be necessary to watch out for INDIGOPN’s performance in both these markets.
On account of its strong growth outlook, we believe the company deserves higher multiples in line with large peers trading at 55–60x. We initiate coverage with a Buy rating, and TP of INR2,270 (55x FY24E EPS).
Exhibit 38: Comparative valuations
Company Reco CMP Target Price Mkt Cap CAGR FY20-24E (%) P/E (x) ROE (%) (INR) (INR) Upside (%) (INR b) Sales EBITDA FY22E FY23E FY24E FY24E
APNT Neutral 3,364 3,540 5 3,227 17.8 18.0 86.1 65.5 57.0 34.5 BRGR - 760 - - 738 14.1 16.3 85.7 66.6 56.2 26.9 KNPL - 582 - - 314 9.5 15.0 63.2 43.7 35.6 17.4 AKZO - 2,025 - - 92 7.7 8.2 35.8 32.1 28.8 17.6 INDIGOPN Buy 1,944 2,270 17 92 24.5 34.7 116.5 70.6 47.4 22.4
Source: Company, MOFSL, Bloomberg
Key risks Continued commodity inflation could lead to gross margin and EPS pressure.
Alternatively, if the industry player takes price hikes, it could have an impact on the demand and therefore affect the EPS.
Aggression by leaders in rural markets could weaken INDIGOPN’s stronghold in those markets and materially affect its growth prospects.
Leadership succession is a concern as currently there is no replacement for Mr. Hemant Jalan who is aged 64. The company’s patient strategy to build the business from rural markets could be at risk if a new leader steps in.
New entrants, while prima facie do not seem to be a threat to INDIGOPN, need to be watched out for as INDIGOPN is considerably smaller in size than its peers.
Indigo Paints
31 December 2021 24
Management profile Mr Hemant Jalan, Managing Director and Chairman Mr Jalan founded INDIGOPN in 2000 and currently serves as the MD and Chairman of the company. He has over 20 years of experience in the Paints industry. Previously, he was associated with AF Ferguson & Co. as a consultant. Presently, he is also associated with Halogen Chemicals as Director. He holds a B. Tech. in Chemical Engineering from IIT Kanpur, a Master’s in Science (M.S.) from Stanford University, and an MBA from the University of Chicago. Mr K Narayanan Kutty, Executive Director Mr Kutty is Executive Director of INDIGOPN since Feb’16. He previously served as MD of HBC. He holds a B.Sc. in Mechanical Engineering from the University of Kerala and a PGDM from IIM Calcutta. Mr Chetan Humane, Chief Financial Officer Mr Humane has been working with INDIGOPN since Sep’01 and was appointed CFO in Mar’20. He has over 19 years of experience in accounting and finance. Previously, he was associated with Jenson & Nicholson as a commercial assistant. He holds Bachelor’s and Master’s degrees in Commerce from the University of Pune. Mr T S Suresh Babu, Chief Operating Officer Mr Babu serves as COO of INDIGOPN and has over 16 years of experience in marketing and sales. He joined INDIGOPN post its acquisition of HBC. Previously, he was associated with Berger Paints Limited, Idea Cellular, Etisalat DB Telecom, and HBC. He holds a B.E. in Mechanical Engineering from Sambalpur University and a PGDM from Xavier Institute of Management, Bhubaneswar. Mr Varghese Idicula, Vice President – Technical Mr Idicula has over 35 years of experience in R&D and production and joined INDIGOPN post its acquisition of HBC. Previously, he was associated with Asian Paints, Pidilite, Sherwin Williams Saudi Arabia, and HBC. He holds a B.Sc. and an MBA from the University of Bombay. He has also received a diploma in paint technology from the Colour Society and the Indian Paint Association.
Mr Hemant Jalan Managing Director and Chairman
Indigo Paints
31 December 2021 25
Bull and bear case
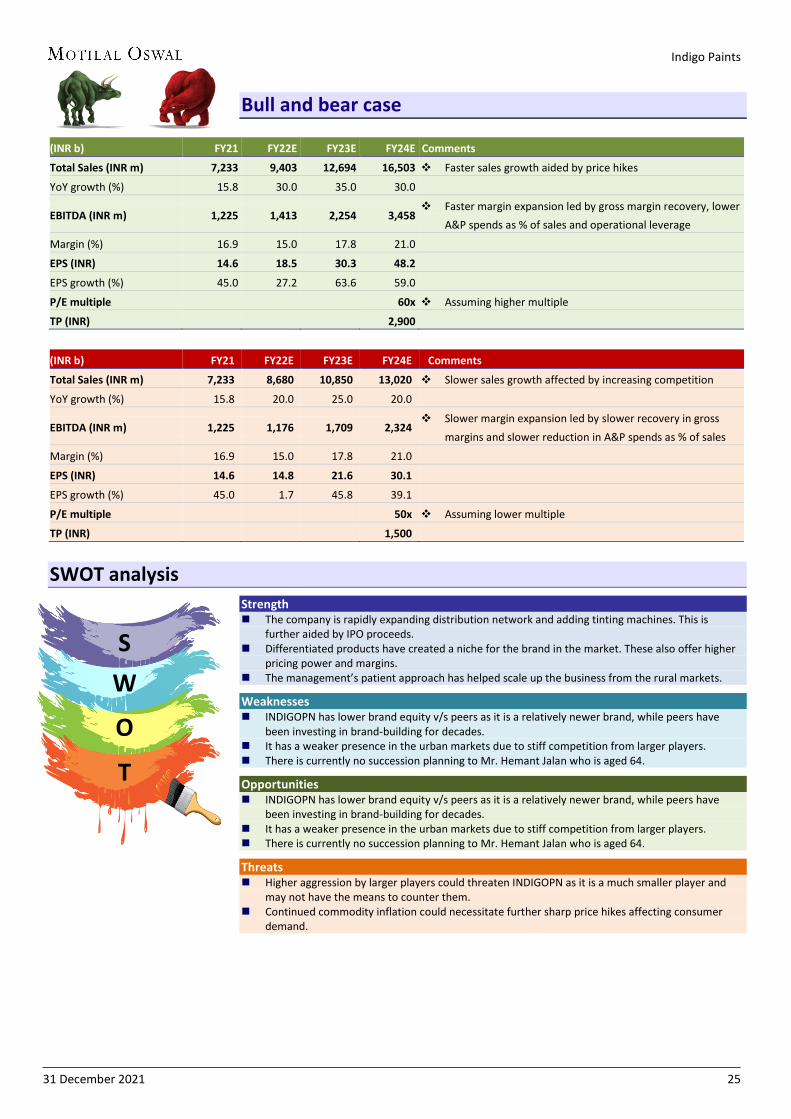
(INR b) FY21 FY22E FY23E FY24E Comments
Total Sales (INR m) 7,233 9,403 12,694 16,503 Faster sales growth aided by price hikes
YoY growth (%) 15.8 30.0 35.0 30.0
EBITDA (INR m) 1,225 1,413 2,254 3,458 Faster margin expansion led by gross margin recovery, lower
A&P spends as % of sales and operational leverage
Margin (%) 16.9 15.0 17.8 21.0
EPS (INR) 14.6 18.5 30.3 48.2
EPS growth (%) 45.0 27.2 63.6 59.0
P/E multiple
60x Assuming higher multiple
TP (INR)
2,900
(INR b) FY21 FY22E FY23E FY24E Comments
Total Sales (INR m) 7,233 8,680 10,850 13,020 Slower sales growth affected by increasing competition
YoY growth (%) 15.8 20.0 25.0 20.0
EBITDA (INR m) 1,225 1,176 1,709 2,324 Slower margin expansion led by slower recovery in gross
margins and slower reduction in A&P spends as % of sales
Margin (%) 16.9 15.0 17.8 21.0 EPS (INR) 14.6 14.8 21.6 30.1 EPS growth (%) 45.0 1.7 45.8 39.1 P/E multiple 50x Assuming lower multiple
TP (INR) 1,500
SWOT analysis
Strength The company is rapidly expanding distribution network and adding tinting machines. This is
further aided by IPO proceeds. Differentiated products have created a niche for the brand in the market. These also offer higher
pricing power and margins. The management’s patient approach has helped scale up the business from the rural markets.
Weaknesses INDIGOPN has lower brand equity v/s peers as it is a relatively newer brand, while peers have
been investing in brand-building for decades. It has a weaker presence in the urban markets due to stiff competition from larger players. There is currently no succession planning to Mr. Hemant Jalan who is aged 64.
Opportunities INDIGOPN has lower brand equity v/s peers as it is a relatively newer brand, while peers have
been investing in brand-building for decades. It has a weaker presence in the urban markets due to stiff competition from larger players. There is currently no succession planning to Mr. Hemant Jalan who is aged 64.
Threats Higher aggression by larger players could threaten INDIGOPN as it is a much smaller player and
may not have the means to counter them. Continued commodity inflation could necessitate further sharp price hikes affecting consumer
demand.
S W
O
T
Indigo Paints
31 December 2021 26
Annexure
Paints industry presents large opportunity
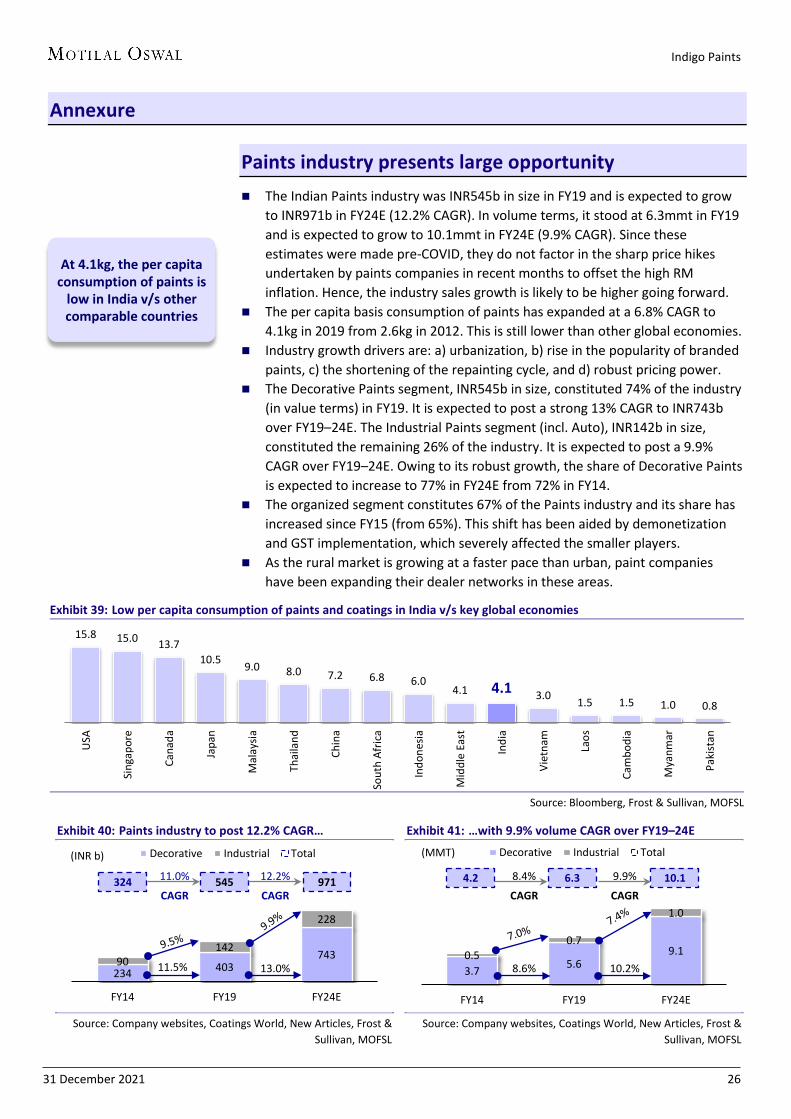
The Indian Paints industry was INR545b in size in FY19 and is expected to grow to INR971b in FY24E (12.2% CAGR). In volume terms, it stood at 6.3mmt in FY19 and is expected to grow to 10.1mmt in FY24E (9.9% CAGR). Since these estimates were made pre-COVID, they do not factor in the sharp price hikes undertaken by paints companies in recent months to offset the high RM inflation. Hence, the industry sales growth is likely to be higher going forward.
The per capita basis consumption of paints has expanded at a 6.8% CAGR to 4.1kg in 2019 from 2.6kg in 2012. This is still lower than other global economies.
Industry growth drivers are: a) urbanization, b) rise in the popularity of branded paints, c) the shortening of the repainting cycle, and d) robust pricing power.
The Decorative Paints segment, INR545b in size, constituted 74% of the industry (in value terms) in FY19. It is expected to post a strong 13% CAGR to INR743b over FY19–24E. The Industrial Paints segment (incl. Auto), INR142b in size, constituted the remaining 26% of the industry. It is expected to post a 9.9% CAGR over FY19–24E. Owing to its robust growth, the share of Decorative Paints is expected to increase to 77% in FY24E from 72% in FY14.
The organized segment constitutes 67% of the Paints industry and its share has increased since FY15 (from 65%). This shift has been aided by demonetization and GST implementation, which severely affected the smaller players.
As the rural market is growing at a faster pace than urban, paint companies have been expanding their dealer networks in these areas.
Exhibit 39: Low per capita consumption of paints and coatings in India v/s key global economies
Source: Bloomberg, Frost & Sullivan, MOFSL
Exhibit 40: Paints industry to post 12.2% CAGR…
Source: Company websites, Coatings World, New Articles, Frost &
Sullivan, MOFSL
Exhibit 41: …with 9.9% volume CAGR over FY19–24E
Source: Company websites, Coatings World, New Articles, Frost &
Sullivan, MOFSL
15.8 15.0 13.7 10.5 9.0 8.0 7.2 6.8 6.0
4.1 4.1 3.0 1.5 1.5 1.0 0.8
USA
Sing
apor
e
Cana
da
Japa
n
Mal
aysia
Thai
land
Chin
a
Sout
h Af
rica
Indo
nesia
Mid
dle
East
Indi
a
Viet
nam
Laos
Cam
bodi
a
Mya
nmar
Paki
stan
234 403 743 90
142
228
FY14 FY19 FY24E
Decorative Industrial Total
324 545 971
(INR b)
11.0%
CAGR
12.2%
CAGR
11.5% 13.0% 3.7 5.6 9.1 0.5
0.7
1.0
FY14 FY19 FY24E
Decorative Industrial Total
4.2 6.3 10.1
(MMT)
8.4%
CAGR
9.9%
CAGR
8.6% 10.2%
At 4.1kg, the per capita consumption of paints is
low in India v/s other comparable countries
Indigo Paints
31 December 2021 27
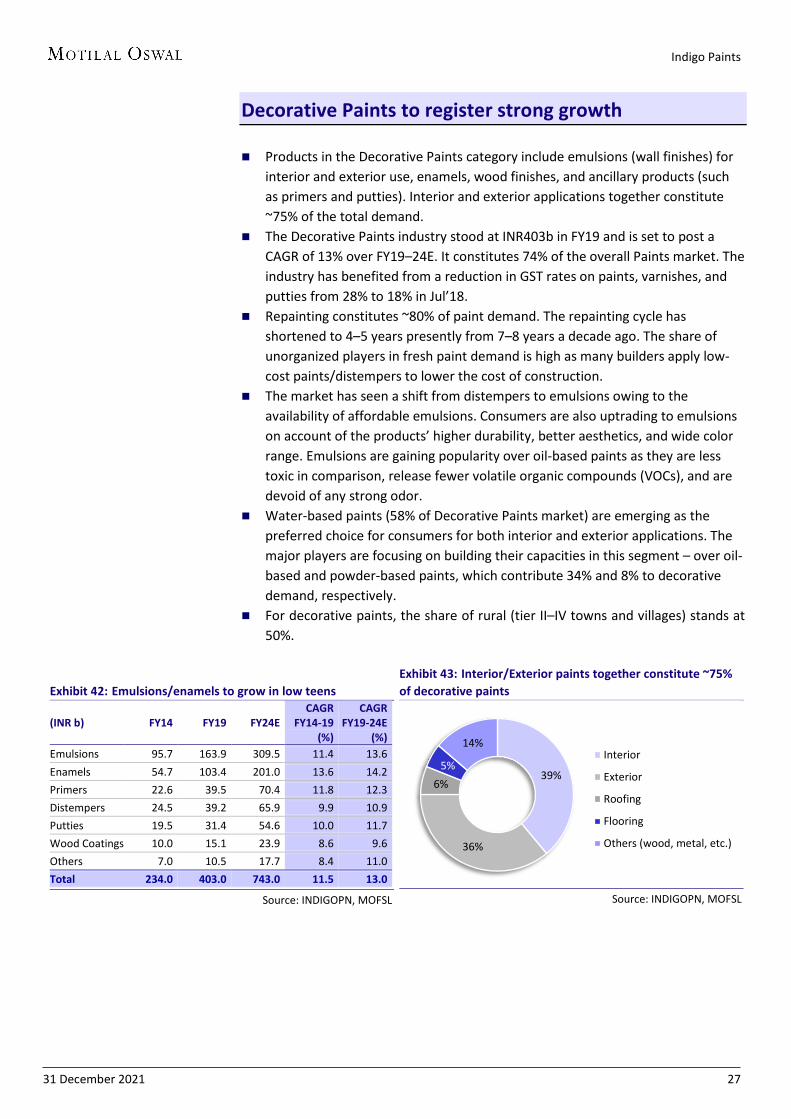
Decorative Paints to register strong growth Products in the Decorative Paints category include emulsions (wall finishes) for
interior and exterior use, enamels, wood finishes, and ancillary products (such as primers and putties). Interior and exterior applications together constitute ~75% of the total demand.
The Decorative Paints industry stood at INR403b in FY19 and is set to post a CAGR of 13% over FY19–24E. It constitutes 74% of the overall Paints market. The industry has benefited from a reduction in GST rates on paints, varnishes, and putties from 28% to 18% in Jul’18.
Repainting constitutes ~80% of paint demand. The repainting cycle has shortened to 4–5 years presently from 7–8 years a decade ago. The share of unorganized players in fresh paint demand is high as many builders apply low-cost paints/distempers to lower the cost of construction.
The market has seen a shift from distempers to emulsions owing to the availability of affordable emulsions. Consumers are also uptrading to emulsions on account of the products’ higher durability, better aesthetics, and wide color range. Emulsions are gaining popularity over oil-based paints as they are less toxic in comparison, release fewer volatile organic compounds (VOCs), and are devoid of any strong odor.
Water-based paints (58% of Decorative Paints market) are emerging as the preferred choice for consumers for both interior and exterior applications. The major players are focusing on building their capacities in this segment – over oil-based and powder-based paints, which contribute 34% and 8% to decorative demand, respectively.
For decorative paints, the share of rural (tier II–IV towns and villages) stands at 50%.
Exhibit 42: Emulsions/enamels to grow in low teens
(INR b) FY14 FY19 FY24E CAGR
FY14-19 (%)
CAGR FY19-24E
(%) Emulsions 95.7 163.9 309.5 11.4 13.6 Enamels 54.7 103.4 201.0 13.6 14.2 Primers 22.6 39.5 70.4 11.8 12.3 Distempers 24.5 39.2 65.9 9.9 10.9 Putties 19.5 31.4 54.6 10.0 11.7 Wood Coatings 10.0 15.1 23.9 8.6 9.6 Others 7.0 10.5 17.7 8.4 11.0 Total 234.0 403.0 743.0 11.5 13.0
Source: INDIGOPN, MOFSL
Exhibit 43: Interior/Exterior paints together constitute ~75% of decorative paints
Source: INDIGOPN, MOFSL
39%
36%
6% 5%
14% Interior
Exterior
Roofing
Flooring
Others (wood, metal, etc.)
Indigo Paints
31 December 2021 28
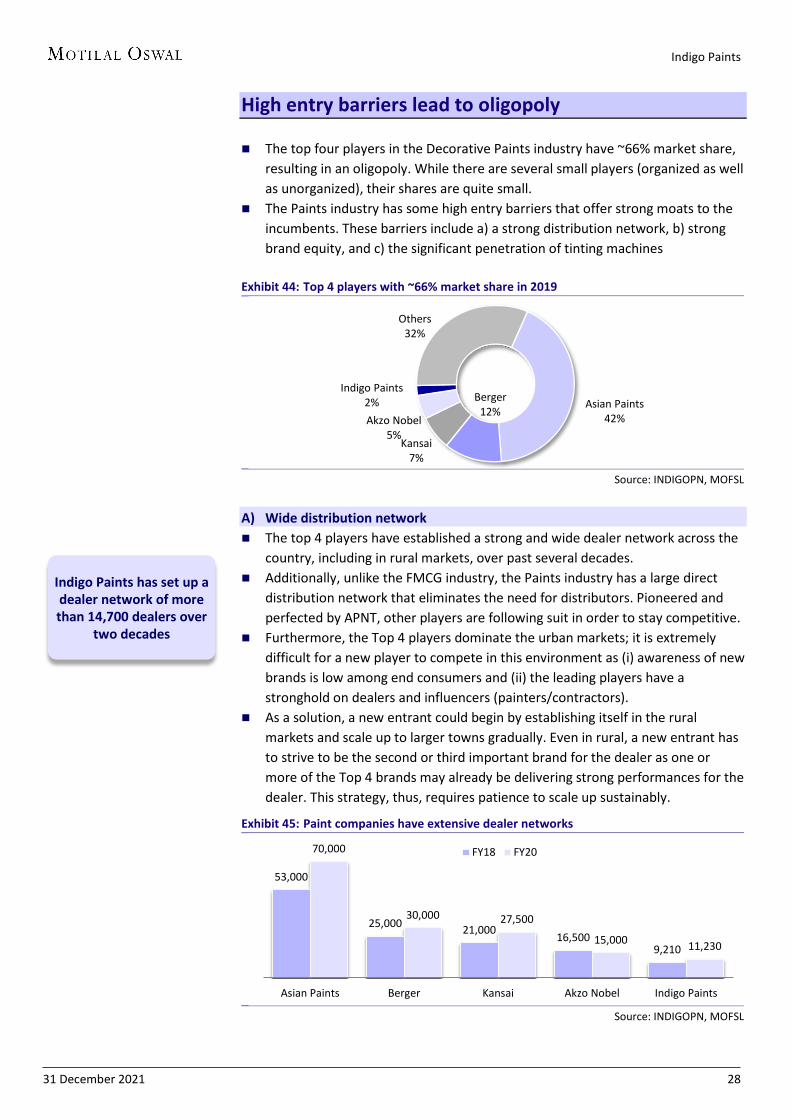
High entry barriers lead to oligopoly The top four players in the Decorative Paints industry have ~66% market share,
resulting in an oligopoly. While there are several small players (organized as well as unorganized), their shares are quite small.
The Paints industry has some high entry barriers that offer strong moats to the incumbents. These barriers include a) a strong distribution network, b) strong brand equity, and c) the significant penetration of tinting machines
Exhibit 44: Top 4 players with ~66% market share in 2019
Source: INDIGOPN, MOFSL
A) Wide distribution network The top 4 players have established a strong and wide dealer network across the
country, including in rural markets, over past several decades. Additionally, unlike the FMCG industry, the Paints industry has a large direct
distribution network that eliminates the need for distributors. Pioneered and perfected by APNT, other players are following suit in order to stay competitive.
Furthermore, the Top 4 players dominate the urban markets; it is extremely difficult for a new player to compete in this environment as (i) awareness of new brands is low among end consumers and (ii) the leading players have a stronghold on dealers and influencers (painters/contractors).
As a solution, a new entrant could begin by establishing itself in the rural markets and scale up to larger towns gradually. Even in rural, a new entrant has to strive to be the second or third important brand for the dealer as one or more of the Top 4 brands may already be delivering strong performances for the dealer. This strategy, thus, requires patience to scale up sustainably.
Exhibit 45: Paint companies have extensive dealer networks
Source: INDIGOPN, MOFSL
Asian Paints 42%
Berger 12%
Kansai 7%
Akzo Nobel 5%
Indigo Paints 2%
Others 32%
53,000
25,000 21,000 16,500 9,210
70,000
30,000 27,500
15,000 11,230
Asian Paints Berger Kansai Akzo Nobel Indigo Paints
FY18 FY20
Indigo Paints has set up a dealer network of more than 14,700 dealers over
two decades
Indigo Paints
31 December 2021 29
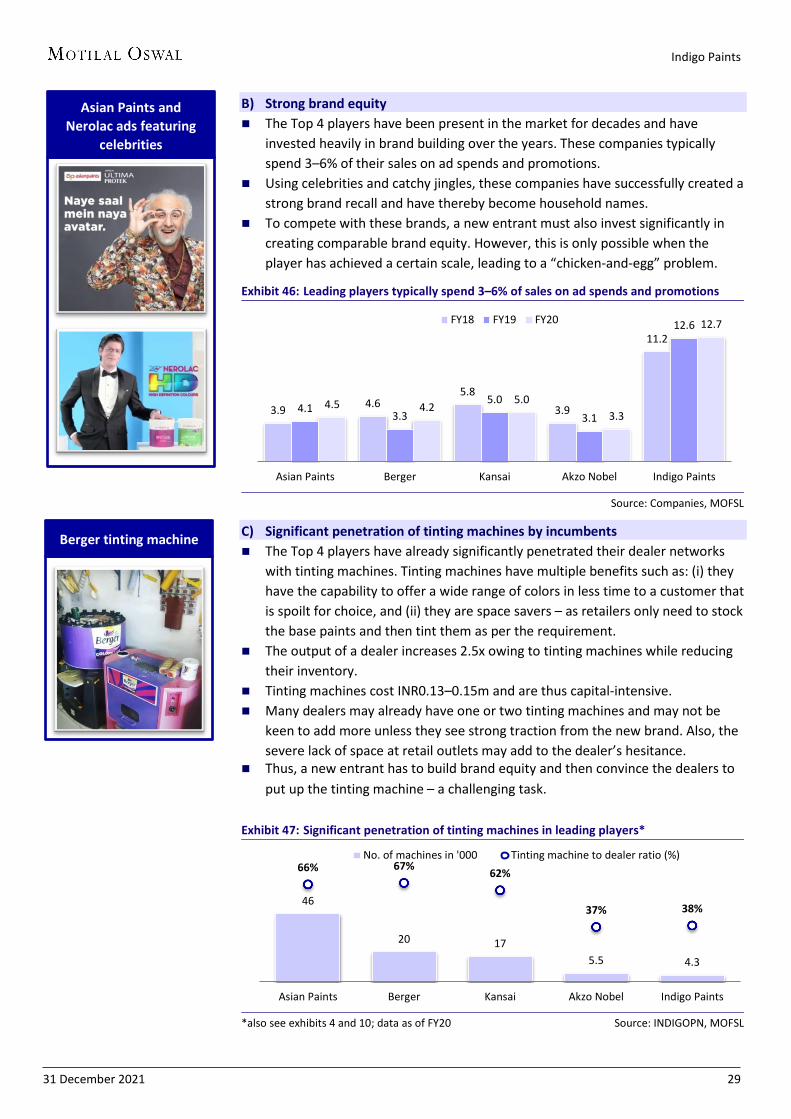
B) Strong brand equity The Top 4 players have been present in the market for decades and have
invested heavily in brand building over the years. These companies typically spend 3–6% of their sales on ad spends and promotions.
Using celebrities and catchy jingles, these companies have successfully created a strong brand recall and have thereby become household names.
To compete with these brands, a new entrant must also invest significantly in creating comparable brand equity. However, this is only possible when the player has achieved a certain scale, leading to a “chicken-and-egg” problem.
Exhibit 46: Leading players typically spend 3–6% of sales on ad spends and promotions
Source: Companies, MOFSL
C) Significant penetration of tinting machines by incumbents The Top 4 players have already significantly penetrated their dealer networks
with tinting machines. Tinting machines have multiple benefits such as: (i) they have the capability to offer a wide range of colors in less time to a customer that is spoilt for choice, and (ii) they are space savers – as retailers only need to stock the base paints and then tint them as per the requirement.
The output of a dealer increases 2.5x owing to tinting machines while reducing their inventory.
Tinting machines cost INR0.13–0.15m and are thus capital-intensive. Many dealers may already have one or two tinting machines and may not be
keen to add more unless they see strong traction from the new brand. Also, the severe lack of space at retail outlets may add to the dealer’s hesitance.
Thus, a new entrant has to build brand equity and then convince the dealers to put up the tinting machine – a challenging task.
Exhibit 47: Significant penetration of tinting machines in leading players*
*also see exhibits 4 and 10; data as of FY20 Source: INDIGOPN, MOFSL
3.9 4.6 5.8
3.9
11.2
4.1 3.3
5.0 3.1
12.6
4.5 4.2 5.0
3.3
12.7
Asian Paints Berger Kansai Akzo Nobel Indigo Paints
FY18 FY19 FY20
46
20 17 5.5 4.3
66% 67% 62%
37% 38%
Asian Paints Berger Kansai Akzo Nobel Indigo Paints
No. of machines in '000 Tinting machine to dealer ratio (%)
Berger tinting machine
Asian Paints and Nerolac ads featuring
celebrities
Indigo Paints
31 December 2021 30
Key trends in India’s Decorative Paints industry The GST rate reduction from 28% to 18% has boosted volumes, particularly in
lower end segments such as Emulsions, Distempers, and Putties. Paint companies are entering new categories such as Waterproofing and
Building Chemicals. Premiumization has been gaining salience as the share of paints in a painting
job has been declining, owing to which consumers are willing to spend more on them. The ratio of paints to labor cost has declined from 70:30 to 40:60 now.
The shift in preference from distempers to emulsions is driven by the availability of economical paints and a better value-for-money proposition offered by emulsions. Faster bottom-of-the-pyramid growth (economical emulsions, distempers, putties, and primers) is led by higher consumer awareness regarding applying an undercoat before applying paint.
With 50% of the demand coming from rural regions, leading companies have been focusing on expanding in the rural markets. The total universe of dealers in the country is expected to be 120–150k and is expanding at a 10% CAGR.
A market shift is seen towards low-VOC products such as water-based coatings, driven by health and environmental concerns. Paint companies are also increasingly offering value-added products such as anti-dust and anti-stain paints. The recent pandemic has led to companies launching anti-viral paints.
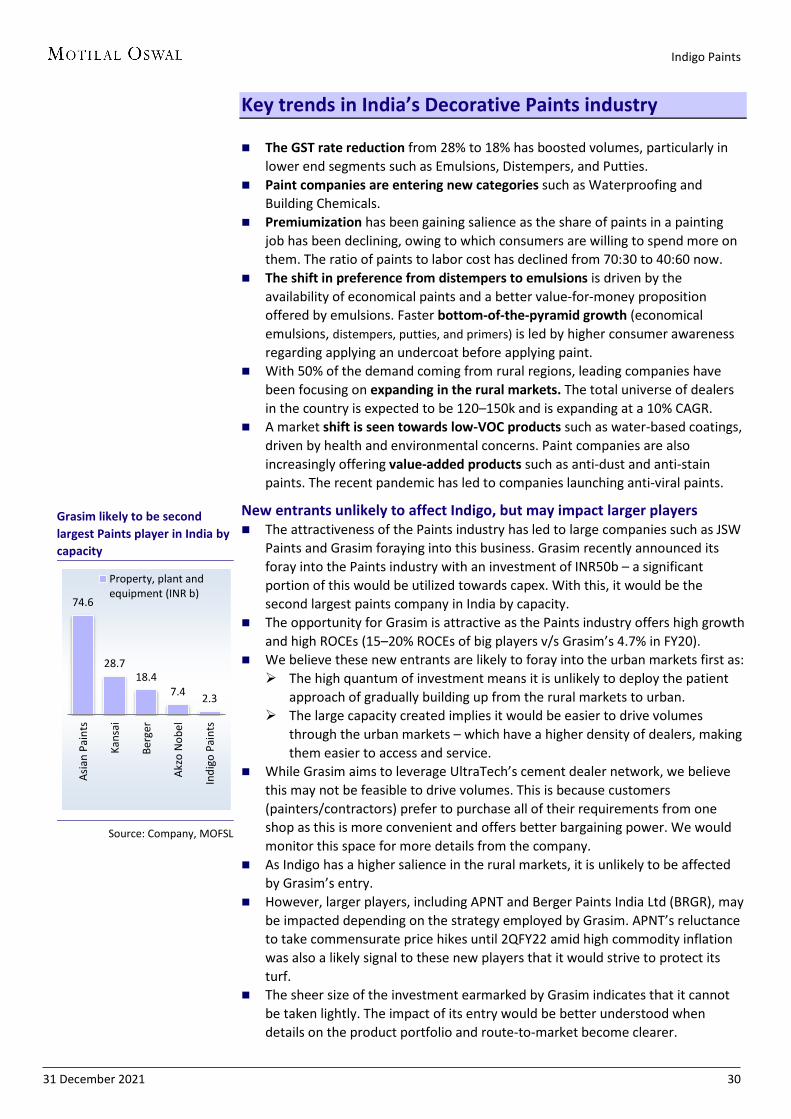
New entrants unlikely to affect Indigo, but may impact larger players The attractiveness of the Paints industry has led to large companies such as JSW
Paints and Grasim foraying into this business. Grasim recently announced its foray into the Paints industry with an investment of INR50b – a significant portion of this would be utilized towards capex. With this, it would be the second largest paints company in India by capacity.
The opportunity for Grasim is attractive as the Paints industry offers high growth and high ROCEs (15–20% ROCEs of big players v/s Grasim’s 4.7% in FY20).
We believe these new entrants are likely to foray into the urban markets first as: The high quantum of investment means it is unlikely to deploy the patient
approach of gradually building up from the rural markets to urban. The large capacity created implies it would be easier to drive volumes
through the urban markets – which have a higher density of dealers, making them easier to access and service.
While Grasim aims to leverage UltraTech’s cement dealer network, we believe this may not be feasible to drive volumes. This is because customers (painters/contractors) prefer to purchase all of their requirements from one shop as this is more convenient and offers better bargaining power. We would monitor this space for more details from the company.
As Indigo has a higher salience in the rural markets, it is unlikely to be affected by Grasim’s entry.
However, larger players, including APNT and Berger Paints India Ltd (BRGR), may be impacted depending on the strategy employed by Grasim. APNT’s reluctance to take commensurate price hikes until 2QFY22 amid high commodity inflation was also a likely signal to these new players that it would strive to protect its turf.
The sheer size of the investment earmarked by Grasim indicates that it cannot be taken lightly. The impact of its entry would be better understood when details on the product portfolio and route-to-market become clearer.
Grasim likely to be second largest Paints player in India by capacity
Source: Company, MOFSL
74.6
28.7 18.4
7.4 2.3
Asia
n Pa
ints
Kans
ai
Berg
er
Akzo
Nob
el
Indi
go P
aint
s
Property, plant andequipment (INR b)
Indigo Paints
31 December 2021 31
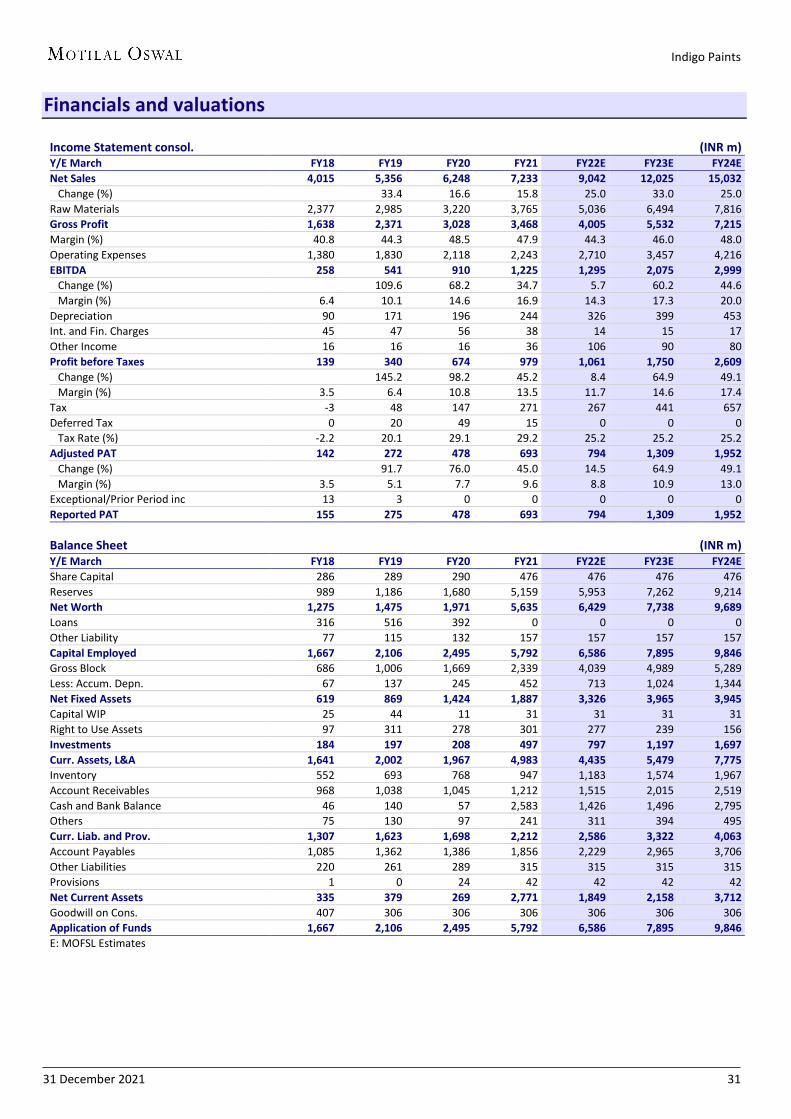
Financials and valuations
Income Statement consol. (INR m) Y/E March FY18 FY19 FY20 FY21 FY22E FY23E FY24E Net Sales 4,015 5,356 6,248 7,233 9,042 12,025 15,032 Change (%)
33.4 16.6 15.8 25.0 33.0 25.0
Raw Materials 2,377 2,985 3,220 3,765 5,036 6,494 7,816 Gross Profit 1,638 2,371 3,028 3,468 4,005 5,532 7,215 Margin (%) 40.8 44.3 48.5 47.9 44.3 46.0 48.0 Operating Expenses 1,380 1,830 2,118 2,243 2,710 3,457 4,216 EBITDA 258 541 910 1,225 1,295 2,075 2,999 Change (%)
109.6 68.2 34.7 5.7 60.2 44.6
Margin (%) 6.4 10.1 14.6 16.9 14.3 17.3 20.0 Depreciation 90 171 196 244 326 399 453 Int. and Fin. Charges 45 47 56 38 14 15 17 Other Income 16 16 16 36 106 90 80 Profit before Taxes 139 340 674 979 1,061 1,750 2,609 Change (%) 145.2 98.2 45.2 8.4 64.9 49.1 Margin (%) 3.5 6.4 10.8 13.5 11.7 14.6 17.4 Tax -3 48 147 271 267 441 657 Deferred Tax 0 20 49 15 0 0 0 Tax Rate (%) -2.2 20.1 29.1 29.2 25.2 25.2 25.2 Adjusted PAT 142 272 478 693 794 1,309 1,952 Change (%) 91.7 76.0 45.0 14.5 64.9 49.1 Margin (%) 3.5 5.1 7.7 9.6 8.8 10.9 13.0 Exceptional/Prior Period inc 13 3 0 0 0 0 0 Reported PAT 155 275 478 693 794 1,309 1,952 Balance Sheet (INR m) Y/E March FY18 FY19 FY20 FY21 FY22E FY23E FY24E Share Capital 286 289 290 476 476 476 476 Reserves 989 1,186 1,680 5,159 5,953 7,262 9,214 Net Worth 1,275 1,475 1,971 5,635 6,429 7,738 9,689 Loans 316 516 392 0 0 0 0 Other Liability 77 115 132 157 157 157 157 Capital Employed 1,667 2,106 2,495 5,792 6,586 7,895 9,846 Gross Block 686 1,006 1,669 2,339 4,039 4,989 5,289 Less: Accum. Depn. 67 137 245 452 713 1,024 1,344 Net Fixed Assets 619 869 1,424 1,887 3,326 3,965 3,945 Capital WIP 25 44 11 31 31 31 31 Right to Use Assets 97 311 278 301 277 239 156 Investments 184 197 208 497 797 1,197 1,697 Curr. Assets, L&A 1,641 2,002 1,967 4,983 4,435 5,479 7,775 Inventory 552 693 768 947 1,183 1,574 1,967 Account Receivables 968 1,038 1,045 1,212 1,515 2,015 2,519 Cash and Bank Balance 46 140 57 2,583 1,426 1,496 2,795 Others 75 130 97 241 311 394 495 Curr. Liab. and Prov. 1,307 1,623 1,698 2,212 2,586 3,322 4,063 Account Payables 1,085 1,362 1,386 1,856 2,229 2,965 3,706 Other Liabilities 220 261 289 315 315 315 315 Provisions 1 0 24 42 42 42 42 Net Current Assets 335 379 269 2,771 1,849 2,158 3,712 Goodwill on Cons. 407 306 306 306 306 306 306 Application of Funds 1,667 2,106 2,495 5,792 6,586 7,895 9,846 E: MOFSL Estimates
Indigo Paints
31 December 2021 32
Financials and valuations
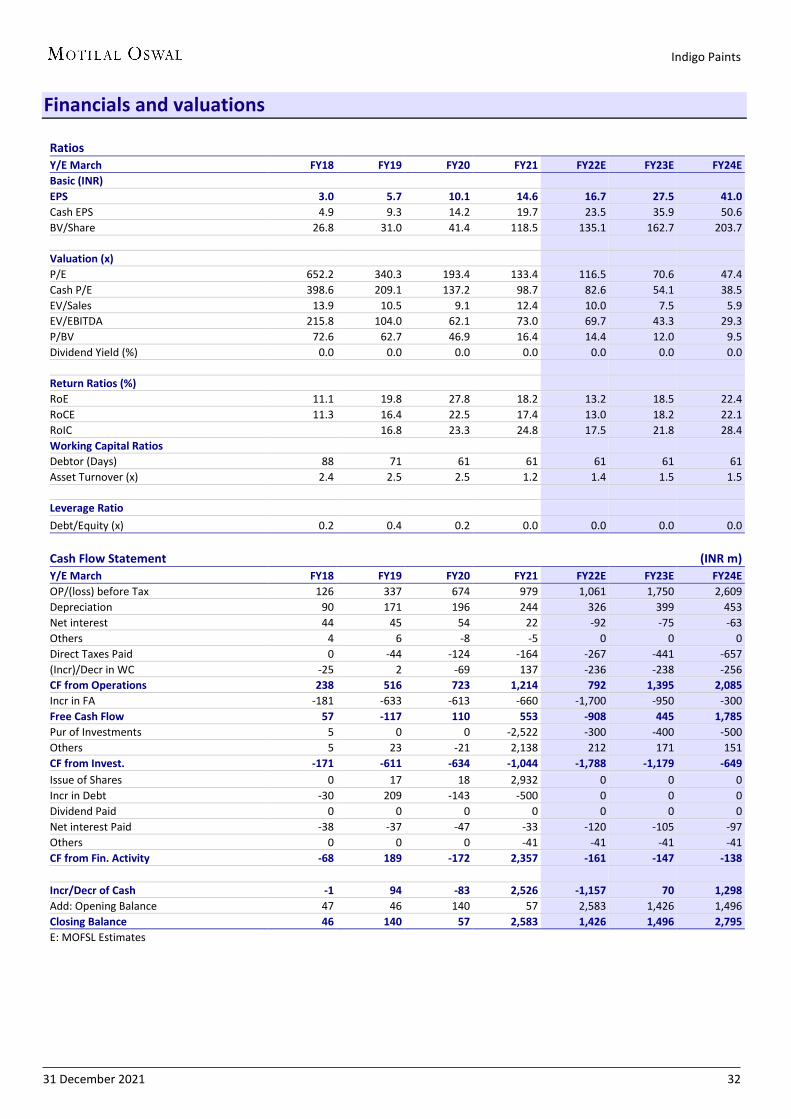
Ratios Y/E March FY18 FY19 FY20 FY21 FY22E FY23E FY24E Basic (INR)
EPS 3.0 5.7 10.1 14.6 16.7 27.5 41.0 Cash EPS 4.9 9.3 14.2 19.7 23.5 35.9 50.6 BV/Share 26.8 31.0 41.4 118.5 135.1 162.7 203.7
Valuation (x)
P/E 652.2 340.3 193.4 133.4 116.5 70.6 47.4 Cash P/E 398.6 209.1 137.2 98.7 82.6 54.1 38.5 EV/Sales 13.9 10.5 9.1 12.4 10.0 7.5 5.9 EV/EBITDA 215.8 104.0 62.1 73.0 69.7 43.3 29.3 P/BV 72.6 62.7 46.9 16.4 14.4 12.0 9.5 Dividend Yield (%) 0.0 0.0 0.0 0.0 0.0 0.0 0.0
Return Ratios (%)
RoE 11.1 19.8 27.8 18.2 13.2 18.5 22.4 RoCE 11.3 16.4 22.5 17.4 13.0 18.2 22.1 RoIC
16.8 23.3 24.8 17.5 21.8 28.4
Working Capital Ratios
Debtor (Days) 88 71 61 61 61 61 61 Asset Turnover (x) 2.4 2.5 2.5 1.2 1.4 1.5 1.5
Leverage Ratio
Debt/Equity (x) 0.2 0.4 0.2 0.0 0.0 0.0 0.0 Cash Flow Statement (INR m) Y/E March FY18 FY19 FY20 FY21 FY22E FY23E FY24E OP/(loss) before Tax 126 337 674 979 1,061 1,750 2,609 Depreciation 90 171 196 244 326 399 453 Net interest 44 45 54 22 -92 -75 -63 Others 4 6 -8 -5 0 0 0 Direct Taxes Paid 0 -44 -124 -164 -267 -441 -657 (Incr)/Decr in WC -25 2 -69 137 -236 -238 -256 CF from Operations 238 516 723 1,214 792 1,395 2,085 Incr in FA -181 -633 -613 -660 -1,700 -950 -300 Free Cash Flow 57 -117 110 553 -908 445 1,785 Pur of Investments 5 0 0 -2,522 -300 -400 -500 Others 5 23 -21 2,138 212 171 151 CF from Invest. -171 -611 -634 -1,044 -1,788 -1,179 -649 Issue of Shares 0 17 18 2,932 0 0 0 Incr in Debt -30 209 -143 -500 0 0 0 Dividend Paid 0 0 0 0 0 0 0 Net interest Paid -38 -37 -47 -33 -120 -105 -97 Others 0 0 0 -41 -41 -41 -41 CF from Fin. Activity -68 189 -172 2,357 -161 -147 -138
Incr/Decr of Cash -1 94 -83 2,526 -1,157 70 1,298 Add: Opening Balance 47 46 140 57 2,583 1,426 1,496 Closing Balance 46 140 57 2,583 1,426 1,496 2,795 E: MOFSL Estimates
RECENT INITIATING COVERAGE REPORTS
REPORT GALLERY
Indigo Paints
31 December 2021 34
Disclosures: The following Disclosures are being made in compliance with the SEBI Research Analyst Regulations 2014 (herein after referred to as the Regulations).
Motilal Oswal Financial Services Ltd. (MOFSL) is a SEBI Registered Research Analyst having registration no. INH000000412. MOFSL, the Research Entity (RE) as defined in the Regulations, is engaged in the business of providing Stock broking services, Investment Advisory Services, Depository participant services & distribution of various financial products. MOFSL is a subsidiary company of Passionate Investment Management Pvt. Ltd.. (PIMPL). MOFSL is a listed public company, the details in respect of which are available on www.motilaloswal.com. MOFSL (erstwhile Motilal Oswal Securities Limited - MOSL) is registered with the Securities & Exchange Board of India (SEBI) and is a registered Trading Member with National Stock Exchange of India Ltd. (NSE) and Bombay Stock Exchange Limited (BSE), Multi Commodity Exchange of India Limited (MCX) and National Commodity & Derivatives Exchange Limited (NCDEX) for its stock broking activities & is Depository participant with Central Depository Services Limited (CDSL) National Securities Depository Limited (NSDL),NERL, COMRIS and CCRL and is member of Association of Mutual Funds of India (AMFI) for distribution of financial products and Insurance Regulatory & Development Authority of India (IRDA) as Corporate Agent for insurance products. Details of associate entities of Motilal Oswal Financial Services Limited are available on the website at http://onlinereports.motilaloswal.com/Dormant/documents/Associate%20Details.pdf
Details of pending Enquiry Proceedings of Motilal Oswal Financial Services Limited are available on the website at https://galaxy.motilaloswal.com/ResearchAnalyst/PublishViewLitigation.aspx
MOFSL, it’s associates, Research Analyst or their relative may have any financial interest in the subject company. MOFSL and/or its associates and/or Research Analyst may have actual/beneficial ownership of 1% or more securities in the subject company in the past 12 months. MOFSL and its associate company(ies), their directors and Research Analyst and their relatives may; (a) from time to time, have a long or short position in, act as principal in, and buy or sell the securities or derivatives thereof of companies mentioned herein. (b) be engaged in any other transaction involving such securities and earn brokerage or other compensation or act as a market maker in the financial instruments of the company(ies) discussed herein or act as an advisor or lender/borrower to such company(ies) or may have any other potential conflict of interests with respect to any recommendation and other related information and opinions.; however the same shall have no bearing whatsoever on the specific recommendations made by the analyst(s), as the recommendations made by the analyst(s) are completely independent of the views of the associates of MOFSL even though there might exist an inherent conflict of interest in some of the stocks mentioned in the research report. Research Analyst may have served as director/officer, etc. in the subject company in the past 12 months. MOFSL and/or its associates may have received any compensation from the subject company in the past 12 months.
In the past 12 months , MOFSL or any of its associates may have: a) managed or co-managed public offering of securities from subject company of this research report, b) received compensation for investment banking or merchant banking or brokerage services from subject company of this research report, c) received compensation for products or services other than investment banking or merchant banking or brokerage services from the subject company of this research report. d) Subject Company may have been a client of MOFSL or its associates in the past 12 months.
MOFSL and it’s associates have not received any compensation or other benefits from the subject company or third party in connection with the research report. To enhance transparency, MOFSL has incorporated a Disclosure of Interest Statement in this document. This should, however, not be treated as endorsement of the views expressed in the report. MOFSL and / or its affiliates do and seek to do business including investment banking with companies covered in its research reports. As a result, the recipients of this report should be aware that MOFSL may have a potential conflict of interest that may affect the objectivity of this report. Compensation of Research Analysts is not based on any specific merchant banking, investment banking or brokerage service transactions. Above disclosures include beneficial holdings lying in demat account of MOFSL which are opened for proprietary investments only. While calculating beneficial holdings, It does not consider demat accounts which are opened in name of MOFSL for other purposes (i.e holding client securities, collaterals, error trades etc.). MOFSL also earns DP income from clients which are not considered in above disclosures. Above disclosures include beneficial holdings lying in demat account of MOFSL which are opened for proprietary investments only. While calculating beneficial holdings, It does not consider demat accounts which are opened in name of MOFSL for other purposes (i.e holding client securities, collaterals, error trades etc.). MOFSL also earns DP income from clients which are not considered in above disclosures.
Terms & Conditions: This report has been prepared by MOFSL and is meant for sole use by the recipient and not for circulation. The report and information contained herein is strictly confidential and may not be altered in any way, transmitted to, copied or distributed, in part or in whole, to any other person or to the media or reproduced in any form, without prior written consent of MOFSL. The report is based on the facts, figures and information that are considered true, correct, reliable and accurate. The intent of this report is not recommendatory in nature. The information is obtained from publicly available media or other sources believed to be reliable. Such information has not been independently verified and no guaranty, representation of warranty, express or implied, is made as to its accuracy, completeness or correctness. All such information and opinions are subject to change without notice. The report is prepared solely for informational purpose and does not constitute an offer document or solicitation of offer to buy or sell or subscribe for securities or other financial instruments for the clients. Though disseminated to all the customers simultaneously, not all customers may receive this report at the same time. MOFSL will not treat recipients as customers by virtue of their receiving this report. Analyst Certification The views expressed in this research report accurately reflect the personal views of the analyst(s) about the subject securities or issues, and no part of the compensation of the research analyst(s) was, is, or will be directly or indirectly related to the specific recommendations and views expressed by research analyst(s) in this report.
Disclosure of Interest Statement Companies where there is interest Analyst ownership of the stock No A graph of daily closing prices of securities is available at www.nseindia.com, www.bseindia.com. Research Analyst views on Subject Company may vary based on Fundamental research and Technical Research. Proprietary trading desk of MOFSL or its associates maintains arm’s length distance with Research Team as all the activities are segregated from MOFSL research activity and therefore it can have an independent view with regards to subject company for which Research Team have expressed their views.
Regional Disclosures (outside India) This report is not directed or intended for distribution to or use by any person or entity resident in a state, country or any jurisdiction, where such distribution, publication, availability or use would be contrary to law, regulation or which would subject MOFSL & its group companies to registration or licensing requirements within such jurisdictions.
For Hong Kong: This report is distributed in Hong Kong by Motilal Oswal capital Markets (Hong Kong) Private Limited, a licensed corporation (CE AYY-301) licensed and regulated by the Hong Kong Securities and Futures Commission (SFC) pursuant to the Securities and Futures Ordinance (Chapter 571 of the Laws of Hong Kong) “SFO”. As per SEBI (Research Analyst Regulations) 2014 Motilal Oswal Financial Services Limited(SEBI Reg No. INH000000412) has an agreement with Motilal Oswal capital Markets (Hong Kong) Private Limited for distribution of research report in Hong Kong. This report is intended for distribution only to “Professional Investors” as defined in Part I of Schedule 1 to SFO. Any investment or investment activity to which this document relates is only available to professional investor and will be engaged only with professional investors.” Nothing here is an offer or solicitation of these securities, products and services in any jurisdiction where their offer or sale is not qualified or exempt from registration. The Indian Analyst(s) who compile this report is/are not located in Hong Kong & are not conducting Research Analysis in Hong Kong.
For U.S: Motilal Oswal Financial Services Limited (MOFSL) is not a registered broker - dealer under the U.S. Securities Exchange Act of 1934, as amended (the"1934 act") and under applicable state laws in the United States. In addition MOFSL is not a registered investment adviser under the U.S. Investment Advisers Act of 1940, as amended (the "Advisers Act" and together with the 1934 Act, the "Acts), and under applicable state laws in the United States. Accordingly, in the absence of specific exemption under the Acts, any brokerage and investment services provided by MOFSL, including the products and services described herein are not available to or intended for U.S. persons. This report is intended for distribution only to "Major Institutional Investors" as defined by Rule 15a-6(b)(4) of the Exchange Act and interpretations thereof by SEC (henceforth referred to as "major institutional investors"). This document must not be acted on or relied on by persons who are not major institutional investors. Any investment or investment activity to which this document relates is only available to major institutional investors and will be engaged in only with major institutional investors. In reliance on the exemption from registration provided by Rule 15a-6 of the U.S. Securities Exchange Act of 1934, as amended (the "Exchange Act") and interpretations thereof by the U.S. Securities and Exchange Commission ("SEC") in order to conduct business with Institutional Investors based in the U.S., MOFSL has entered into a chaperoning agreement with a U.S. registered broker-dealer, Motilal Oswal Securities International Private Limited. ("MOSIPL"). Any business interaction pursuant to this report will have to be executed within the provisions of this chaperoning agreement.
The Research Analysts contributing to the report may not be registered /qualified as research analyst with FINRA. Such research analyst may not be associated persons of the U.S. registered broker-dealer, MOSIPL, and therefore, may not be subject to NASD rule 2711 and NYSE Rule 472 restrictions on communication with a subject company, public appearances and trading securities held by a research analyst account.
For Singapore: In Singapore, this report is being distributed by Motilal Oswal Capital Markets Singapore Pte Ltd (“MOCMSPL”) (Co.Reg. NO. 201129401Z) which is a holder of a capital markets services license and an exempt financial adviser in Singapore, as per the approved agreement under Paragraph 9 of Third Schedule of Securities and Futures Act (CAP 289) and Paragraph 11 of First Schedule of Financial Advisors Act (CAP 110) provided to MOCMSPL by Monetary Authority of Singapore. Persons in Singapore should contact MOCMSPL in respect of any matter arising from, or in connection with this report/publication/communication. This report is distributed solely to persons who qualify as “Institutional Investors”, of which some of whom may consist of "accredited" institutional investors as defined in section 4A(1) of the Securities and Futures Act, Chapter 289 of Singapore (“the SFA”). Accordingly, if a Singapore person is not or ceases to be such an institutional investor, such Singapore Person must immediately discontinue any use of this Report and inform MOCMSPL.
Disclaimer: The report and information contained herein is strictly confidential and meant solely for the selected recipient and may not be altered in any way, transmitted to, copied or distributed, in part or in whole, to any other person or to the media or reproduced in any form, without prior written consent. This report and information herein is solely for informational purpose and may not be used or considered as an offer document or solicitation of offer to buy or sell or subscribe for securities or other financial instruments. Nothing in this report constitutes investment, legal, accounting and tax advice or a representation that any investment or strategy is suitable or appropriate to your specific circumstances. The securities discussed and opinions expressed in this report may not be suitable for all investors, who must make their own investment decisions, based on their own investment objectives, financial positions and needs of specific recipient. This may not be taken in substitution for the exercise of independent judgment by any recipient. Each recipient of this document should make such investigations as it deems necessary to arrive at an independent evaluation of an investment in the securities of companies referred to in this document (including the merits and risks involved), and should consult its own advisors to determine the merits and risks of such an investment. The investment discussed or views expressed may not be suitable for all investors. Certain transactions -including those involving futures, options, another derivative products as well as non-investment grade securities - involve substantial risk and are not suitable for all investors. No representation or warranty, express or implied, is made as to the accuracy, completeness or fairness of the information and opinions contained in this document. The Disclosures of Interest Statement incorporated in this document is provided solely to enhance the transparency and should not be treated as endorsement of the views expressed in the report. This information is subject to change without any prior notice. The Company reserves the right to make modifications and alternations to this statement as may be required from time to time without any prior approval. MOFSL, its associates, their directors and the employees may from time to time, effect or have effected an own account transaction in, or deal as principal or agent in or for the securities mentioned in this document. They may perform or seek to perform investment banking or other services for, or solicit investment banking or other business from, any company referred to in this report. Each of these entities functions as a separate, distinct and independent of each other. The recipient should take this into account before interpreting the document. This report has been prepared on the basis of information that is already available in publicly accessible media or developed through analysis of MOFSL. The views expressed are those of the analyst, and the Company may or may not subscribe to all the views expressed therein. This document is being supplied to you solely for your information and may not be reproduced, redistributed or passed on, directly or indirectly, to any other person or published, copied, in whole or in part, for any purpose. This report is not directed or intended for distribution to, or use by, any person or entity who is a citizen or resident of or located in any locality, state, country or other jurisdiction, where such distribution, publication, availability or use would be contrary to law, regulation or which would subject MOFSL to any registration or licensing requirement within such jurisdiction. The securities described herein may or may not be eligible for sale in all jurisdictions or to certain category of investors. Persons in whose possession this document may come are required to inform themselves of and to observe such restriction. Neither the Firm, not its directors, employees, agents or representatives shall be liable for any damages whether direct or indirect, incidental, special or consequential including lost revenue or lost profits that may arise from or in connection with the use of the information. The person accessing this information specifically agrees to exempt MOFSL or any of its affiliates or employees from, any and all responsibility/liability arising from such misuse and agrees not to hold MOFSL or any of its affiliates or employees responsible for any such misuse and further agrees to hold MOFSL or any of its affiliates or employees free and harmless from all losses, costs, damages, expenses that may be suffered by the person accessing this information due to any errors and delays.
Registered Office Address: Motilal Oswal Tower, Rahimtullah Sayani Road, Opposite Parel ST Depot, Prabhadevi, Mumbai-400025; Tel No.: 022 71934200/ 022-71934263; Website www.motilaloswal.com. CIN No.: L67190MH2005PLC153397.Correspondence Office Address: Palm Spring Centre, 2nd Floor, Palm Court Complex, New Link Road, Malad(West), Mumbai- 400 064. Tel No: 022 7188 1000. Registration Nos.: Motilal Oswal Financial Services Limited (MOFSL)*: INZ000158836(BSE/NSE/MCX/NCDEX); CDSL and NSDL: IN-DP-16-2015; Research Analyst: INH000000412. AMFI: ARN - 146822; Investment Adviser: INA000007100; Insurance Corporate Agent: CA0579 ;PMS:INP000006712. Motilal Oswal Asset Management Company Ltd. (MOAMC): PMS (Registration No.: INP000000670); PMS and Mutual Funds are offered through MOAMC which is group company of MOFSL. Motilal Oswal Wealth Management Ltd. (MOWML): PMS (Registration No.: INP000004409) is offered through MOWML, which is a group company of MOFSL. Motilal Oswal Financial Services Limited is a distributor of Mutual Funds, PMS, Fixed Deposit, Bond, NCDs,Insurance Products and IPOs.Real Estate is offered through Motilal Oswal Real Estate Investment Advisors II Pvt. Ltd. which is a group company of MOFSL. Private Equity is offered through Motilal Oswal Private Equity Investment Advisors Pvt. Ltd which is a group company of MOFSL. Research & Advisory services is backed by proper research. Please read the Risk Disclosure Document prescribed by the Stock Exchanges carefully before investing. There is no assurance or guarantee of the returns. Investment in securities market is subject to market risk, read all the related documents carefully before investing. Details of Compliance Officer: Name: Neeraj Agarwal, Email ID: [email protected], Contact No.:022-71881085.
* MOSL has been amalgamated with Motilal Oswal Financial Services Limited (MOFSL) w.e.f August 21, 2018 pursuant to order dated July 30, 2018 issued by Hon'ble National Company Law Tribunal, Mumbai Bench.