Embed Size (px)
Citation preview
Emkay Research is also available on www.emkayglobal.com and Bloomberg EMKAY<GO>. Please refer to the last page of the report on Restrictions on Distribution. In Singapore, this research report or research analyses may only be distributed to Institutional Investors, Expert Investors or Accredited Investors as defined in the Securities and Futures Act, Chapter 289 of Singapore.
©
Your success is our success
Emkay
India Equity Research | Auto & Auto Ancillaries
June 17, 2022
Analyst Meet Update
Apollo Tyres Refer to important disclosures at the end of this report
Maintaining FY26 target of USD5bn revenue with 12-15% ROCE
In its analyst meet, APTY management reiterated its revenue target of USD5bn in FY26,
implying a 15% CAGR over FY22-26E vs. a 9% CAGR over FY18-22. Revenue growth
will be driven by underlying industry growth, premiumization, and market share gains in
India and Europe.
Management maintained the ROCE (pre-tax) target at 12-15% by FY26E (7% in FY22),
led by better asset turnover and margins. Future capacity expansions would be done
mainly through debottlenecking and brownfield capacities. Margin expansion is expected
to be driven by premiumization and cost-savings, such as reduction in material usage and
digitization efforts.
In the near term, cost pressures due to an increase in prices of crude derivatives and a
lag in the pass-through of commodity inflation are likely to impact margins. We reduce
FY23E/FY24E EPS by 8%/5% to Rs10.1/Rs17.9. Following the revision, we expect
revenue/earnings CAGRs of 15%/33% over FY22-24E.
The stock trades at 17x/10x P/E on FY23E/24E earnings. Near-term stock performance
would depend on the movement of crude prices as derivatives form a major portion of RM
costs (40%+). We retain our positive view on expectations of a cyclical upturn in the
underlying automobile industry and improving free cash flows (avg. Rs13bn/year over
FY23E/24E). Reaffirm Buy with a TP of Rs245 (Rs255 earlier), applying 13x Jun’24E EPS.
Relative price chart
Source: Bloomberg This report is solely produced by Emkay Global. The following person(s) are responsible for the production of the recommendation:
Raghunandhan N L
+91 22 6624 2428
Mumuksh Mandlesha
+91 22 6612 1334
Bhargava Perni
+91 22 6624 2429
-30
-22
-14
-6
2
10
150
170
190
210
230
250
Jun-21 Aug-21 Oct-21 Dec-21Feb-22 Apr-22 Jun-22
%Rs
Apollo Tyres (LHS) Rel to Nifty (RHS)
Key takeaways from Analyst Meet
FY26 revenue target at USD5bn: Management has guided for a revenue CAGR of 15%
over FY22-26E, driven by expectations of 1) volume growth in underlying segments such
as PCR, CVs and Tractors; 2) continuing radialization in Truck & Bus industry; 3) an
increase in the share of exports for standalone from 15% of revenue in FY22 to 20% in
FY26E, with focus on Europe, USA, Middle East and Africa regions; 4) the launch of new
products: Vredestein brand in India for PCRs/2Ws and all-season PCRs, TBR, OHT as
well as EV tyres for Europe/US markets; 5) an increase in revenue share of UHP/UUHP
categories in Europe PCR; 6) an increase in OEM market share in Europe; and 7) an
increase in distribution reach in rural India.
ROCE target at 12-15% for FY26E: EBITDA margin of over 15% and better asset turnover
are expected to drive ROCE from 7% in FY22 to 12-15% in FY26E. Future capex
requirements are likely to be lower as expansions would be done mainly through de-
bottlenecking and brownfield capacities. Debottlenecking efforts can increase the capacity
by 5-8%. Going forward, capex is likely to be in a staggered manner and not bunched up,
resulting in positive FCF generation.
Please see our sector model portfolio (Emkay Alpha Portfolio): Automobiles & Auto Ancillaries (Page 8)
CMP Target Price
Rs 176 Rs 245 (▼) as of (June 17, 2022) 12 months
Rating Upside
BUY (■) 39.7 %
Change in Estimates
EPS Chg FY23E/FY24E (%) (8.2)/ (5.4)
Target Price change (%) (3.8)
Target Period (Months) 12
Previous Reco BUY
Emkay vs Consensus
EPS Estimates
FY23E FY24E
Emkay 10.1 17.9
Consensus 13.9 19.2
Mean Consensus TP (12M) Rs 248
Stock Details
Bloomberg Code APTY IN
Face Value (Rs) 1
Shares outstanding (mn) 635
52 Week H/L 250 / 165
M Cap (Rs bn/USD bn) 112 / 1.43
Daily Avg Volume (nos.) 3,783,687
Daily Avg Turnover (US$ mn) 9.8
Shareholding Pattern Mar '22
Promoters 37.3%
FIIs 19.4%
DIIs 18.6%
Public and Others 24.7%
Price Performance
(%) 1M 3M 6M 12M
Absolute (18) (9) (18) (24)
Rel. to Nifty (13) 2 (9) (22)
Financial Snapshot (Consolidated)
(Rs mn) FY21 FY22 FY23E FY24E FY25E
Revenue 173,970 209,476 249,749 275,613 298,625
EBITDA 27,975 25,741 27,967 34,368 37,804
EBITDA Margin (%) 16.1 12.3 11.2 12.5 12.7
APAT 9,580 6,445 6,419 11,366 13,629
EPS (Rs) 15.1 10.1 10.1 17.9 21.5
EPS (% chg) 81.1 (32.7) (0.4) 77.1 19.9
ROE (%) 9.0 5.6 5.4 9.0 9.9
P/E (x) 11.6 17.3 17.4 9.8 8.2
EV/EBITDA (x) 5.9 6.5 5.8 4.6 4.0
P/BV (x) 1.0 0.9 0.9 0.8 0.8
Source: Company, Emkay Research
This report is intended for [email protected] use and downloaded at 06/20/2022 01:28 PM
This report is intended for [email protected] use and downloaded at 06/20/2022 01:28 PM
Apollo Tyres (APTY IN) India Equity Research | Analyst Meet Update
Emkay Research is also available on www.emkayglobal.com and Bloomberg EMKAY<GO>. Please refer to the last page of the report on Restrictions on Distribution. In Singapore, this research report or research analyses may only be distributed to Institutional Investors, Expert Investors or Accredited Investors as defined in the Securities and Futures Act, Chapter 289 of Singapore.
June 17, 2022 | 2
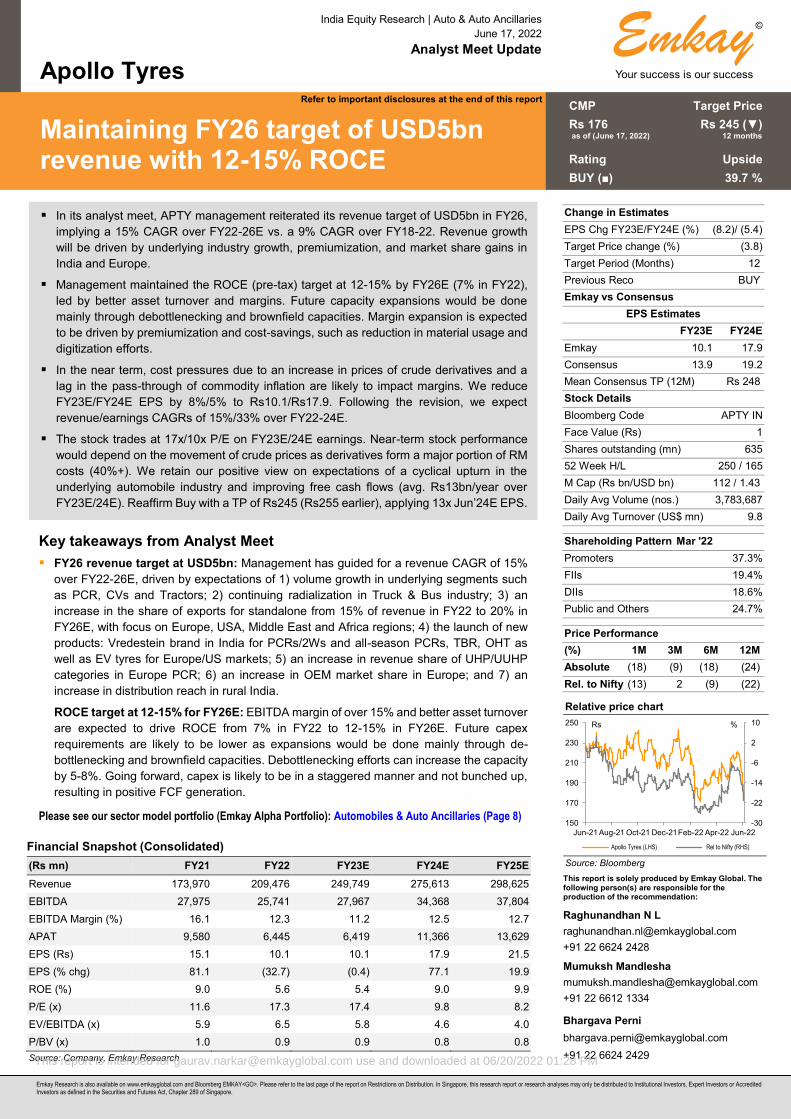
Story in Charts
Exhibit 1: APTY has been gaining market share across PCR and TBR segments
Source: Company, Emkay Research
Exhibit 2: Standalone: Export share likely to increase on higher exports to Europe, USA, Middle East and Africa
Source: Company, Emkay Research
Exhibit 3: Expect revenue CAGR of 15% over FY22-24E
Source: Company, ATMA, Crisil, Emkay Research
Exhibit 4: Expect ROCE to improve led by better asset turnover and margins
Source: Company, Emkay Research
Exhibit 5: Net Debt/EBITDA to reduce from 2.1x in FY22 to 1.3x in FY24E
Source: Company, Emkay Research
Exhibit 6: One-year forward P/E (10 year average at 13x)
Source: Company, Emkay Research
17%20%
27%30%
0%
5%
10%
15%
20%
25%
30%
35%
FY18 FY22
PCR TBR
9 9 9 11
9
15
20
0
5
10
15
20
25
FY17 FY18 FY19 FY20 FY21 FY22 FY26E
Standalone Export share (%)
(10)
(5)
0
5
10
15
20
25
0
50,000
1,00,000
1,50,000
2,00,000
2,50,000
3,00,000
3,50,000
FY19 FY20 FY21 FY22 FY23E FY24E FY25E
Consolidated revenue (Rs mn) Growth (%) RHS
11.2 11.9
16.1
12.311.2
12.5 12.7
5.7
3.7
6.54.9 5.4
7.7 8.5
0
5
10
15
20
FY19 FY20 FY21 FY22 FY23E FY24E FY25E
EBITDA margin (%) ROCE post tax (%) RHS
-
0.5
1.0
1.5
2.0
2.5
3.0
3.5
-
10
20
30
40
50
60
70
FY20 FY21 FY22 FY23E FY24E FY25E
Net Debt (Rsbn) Capex (Rsbn)
Net Debt/EBITDA (x) RHS
0
5
10
15
20
25
30
Jun
-12
Dec-1
2
Jun
-13
Dec-1
3
Jun
-14
Dec-1
4
Jun
-15
Dec-1
5
Jun
-16
Dec-1
6
Jun
-17
Dec-1
7
Jun
-18
Dec-1
8
Jun
-19
Dec-1
9
Jun
-20
Dec-2
0
Jun
-21
Dec-2
1
Jun
-22
1 year forward PE (x) 10 year average PE+1 STD -1 STD
This report is intended for [email protected] use and downloaded at 06/20/2022 01:28 PM
Apollo Tyres (APTY IN) India Equity Research | Analyst Meet Update
Emkay Research is also available on www.emkayglobal.com and Bloomberg EMKAY<GO>. Please refer to the last page of the report on Restrictions on Distribution. In Singapore, this research report or research analyses may only be distributed to Institutional Investors, Expert Investors or Accredited Investors as defined in the Securities and Futures Act, Chapter 289 of Singapore.
June 17, 2022 | 3
Key takeaways from Analyst Meet (continued)
Increasing penetration in US: APTY has presence in PCR, Truck & Bus and OHT
segments through both Vredestein and Apollo brands. Going forward, efforts will be made
to improve volumes with new products and network expansion.
Cost-reduction efforts remain a focus area with 1) digitization efforts to improve
production efficiency and reduce marketing spends; and 2) reduction in material usage
through new recipes and alternative sourcing.
Network expansion: APTY expanded its India network by 400 to 7,200 dealers in FY22.
The Europe network remains at the same level with 7,000 dealers. In India, it has been
expanding its network with an increased focus on rural areas.
New products: 1) Dedicated EV product lines have been developed with improved rolling
resistance and lower noise. 2) RFID tag technology product will be launched soon, which
will help tyre identification for fleet and customer services. 3) Tyre pressure monitoring
system technology will be launched soon to help in improving operational efficiency.
India CV replacement market is witnessing improvement in demand, and high-frequency
indicators such as GST collections, E-way bill generation, diesel demand, etc. are also
highlighting better truck movement. In addition, demand for bus tyres is picking up,
especially from state transport undertakings. LCV radial demand has been strong across
OEM, replacement and overseas segments, and peak utilization levels have been
achieved.
Europe demand has been supported by lower supplies from Russia/Ukraine.
In the near term, price increases in the India replacement market would continue with a
lag in commodity inflation. In Q1FY23, the RM basket is likely to see a 3-4% increase, and
a further increase is expected in Q2FY23. The company has taken a price increase of 3-
4% in the India market.
Cost pressures are severe in Europe, and the company has increased prices by almost
double-digits in Q1FY23 to offset the impact.
Anti-dumping duty on Chinese tyres will remain in force till Dec’22. The tyre industry will
discuss with the government a further extension of the deadline.
Capacity utilization in India stands at ~80%. The total capex plan for FY23 is Rs9bn
toward the AP Greenfield plant, debottlenecking of existing plants and maintenance capex
(~Rs4bn).
Capacity utilization in Europe stands at ~85%. FY23 capex is only maintenance capex
of EUR30-35mn.
This report is intended for [email protected] use and downloaded at 06/20/2022 01:28 PM
Apollo Tyres (APTY IN) India Equity Research | Analyst Meet Update
Emkay Research is also available on www.emkayglobal.com and Bloomberg EMKAY<GO>. Please refer to the last page of the report on Restrictions on Distribution. In Singapore, this research report or research analyses may only be distributed to Institutional Investors, Expert Investors or Accredited Investors as defined in the Securities and Futures Act, Chapter 289 of Singapore.
June 17, 2022 | 4
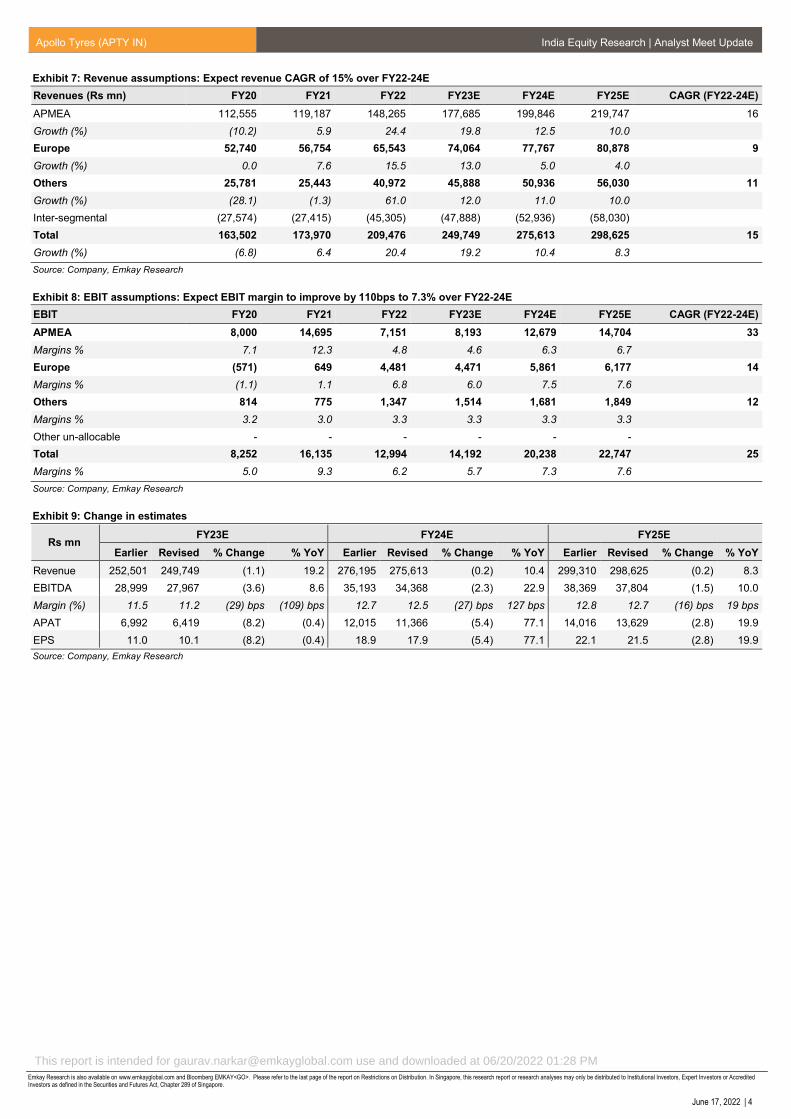
Exhibit 7: Revenue assumptions: Expect revenue CAGR of 15% over FY22-24E
Revenues (Rs mn) FY20 FY21 FY22 FY23E FY24E FY25E CAGR (FY22-24E)
APMEA 112,555 119,187 148,265 177,685 199,846 219,747 16
Growth (%) (10.2) 5.9 24.4 19.8 12.5 10.0
Europe 52,740 56,754 65,543 74,064 77,767 80,878 9
Growth (%) 0.0 7.6 15.5 13.0 5.0 4.0
Others 25,781 25,443 40,972 45,888 50,936 56,030 11
Growth (%) (28.1) (1.3) 61.0 12.0 11.0 10.0
Inter-segmental (27,574) (27,415) (45,305) (47,888) (52,936) (58,030)
Total 163,502 173,970 209,476 249,749 275,613 298,625 15
Growth (%) (6.8) 6.4 20.4 19.2 10.4 8.3
Source: Company, Emkay Research
Exhibit 8: EBIT assumptions: Expect EBIT margin to improve by 110bps to 7.3% over FY22-24E
EBIT FY20 FY21 FY22 FY23E FY24E FY25E CAGR (FY22-24E)
APMEA 8,000 14,695 7,151 8,193 12,679 14,704 33
Margins % 7.1 12.3 4.8 4.6 6.3 6.7
Europe (571) 649 4,481 4,471 5,861 6,177 14
Margins % (1.1) 1.1 6.8 6.0 7.5 7.6
Others 814 775 1,347 1,514 1,681 1,849 12
Margins % 3.2 3.0 3.3 3.3 3.3 3.3
Other un-allocable - - - - - -
Total 8,252 16,135 12,994 14,192 20,238 22,747 25
Margins % 5.0 9.3 6.2 5.7 7.3 7.6
Source: Company, Emkay Research
Exhibit 9: Change in estimates
Rs mn FY23E FY24E FY25E
Earlier Revised % Change % YoY Earlier Revised % Change % YoY Earlier Revised % Change % YoY
Revenue 252,501 249,749 (1.1) 19.2 276,195 275,613 (0.2) 10.4 299,310 298,625 (0.2) 8.3
EBITDA 28,999 27,967 (3.6) 8.6 35,193 34,368 (2.3) 22.9 38,369 37,804 (1.5) 10.0
Margin (%) 11.5 11.2 (29) bps (109) bps 12.7 12.5 (27) bps 127 bps 12.8 12.7 (16) bps 19 bps
APAT 6,992 6,419 (8.2) (0.4) 12,015 11,366 (5.4) 77.1 14,016 13,629 (2.8) 19.9
EPS 11.0 10.1 (8.2) (0.4) 18.9 17.9 (5.4) 77.1 22.1 21.5 (2.8) 19.9
Source: Company, Emkay Research
This report is intended for [email protected] use and downloaded at 06/20/2022 01:28 PM
Apollo Tyres (APTY IN) India Equity Research | Analyst Meet Update
Emkay Research is also available on www.emkayglobal.com and Bloomberg EMKAY<GO>. Please refer to the last page of the report on Restrictions on Distribution. In Singapore, this research report or research analyses may only be distributed to Institutional Investors, Expert Investors or Accredited Investors as defined in the Securities and Futures Act, Chapter 289 of Singapore.
June 17, 2022 | 5
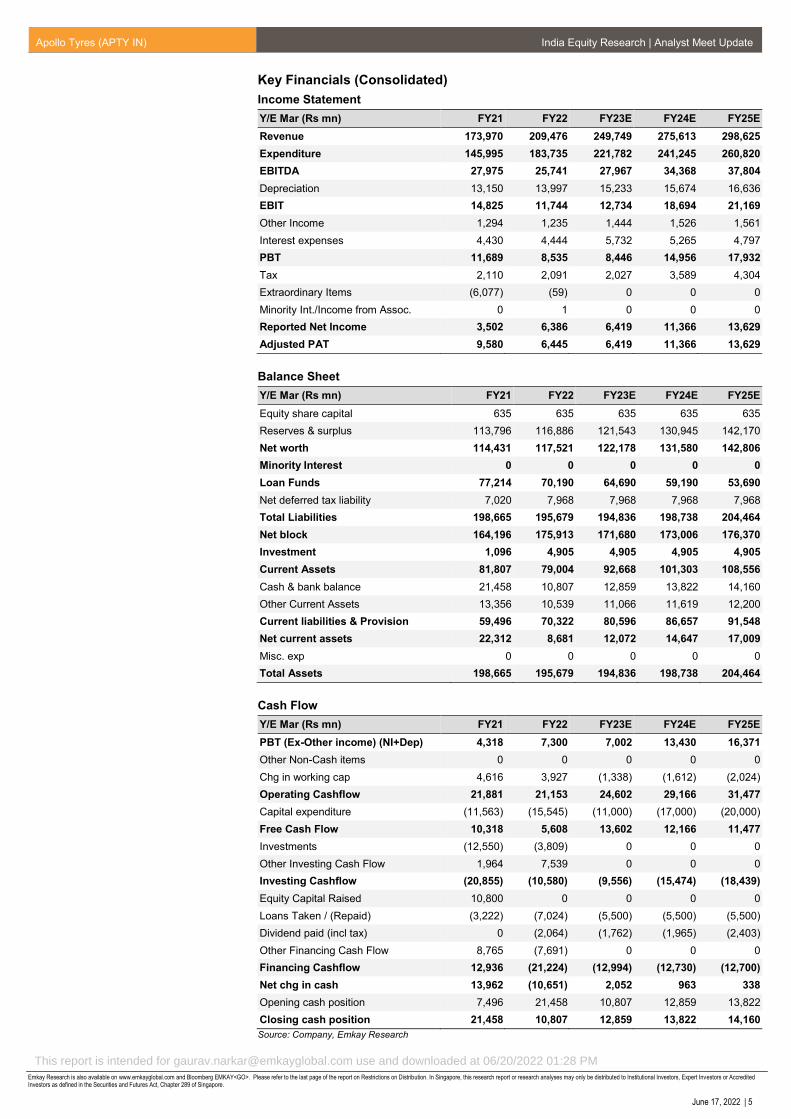
Key Financials (Consolidated)
Income Statement
Y/E Mar (Rs mn) FY21 FY22 FY23E FY24E FY25E
Revenue 173,970 209,476 249,749 275,613 298,625
Expenditure 145,995 183,735 221,782 241,245 260,820
EBITDA 27,975 25,741 27,967 34,368 37,804
Depreciation 13,150 13,997 15,233 15,674 16,636
EBIT 14,825 11,744 12,734 18,694 21,169
Other Income 1,294 1,235 1,444 1,526 1,561
Interest expenses 4,430 4,444 5,732 5,265 4,797
PBT 11,689 8,535 8,446 14,956 17,932
Tax 2,110 2,091 2,027 3,589 4,304
Extraordinary Items (6,077) (59) 0 0 0
Minority Int./Income from Assoc. 0 1 0 0 0
Reported Net Income 3,502 6,386 6,419 11,366 13,629
Adjusted PAT 9,580 6,445 6,419 11,366 13,629
Balance Sheet
Y/E Mar (Rs mn) FY21 FY22 FY23E FY24E FY25E
Equity share capital 635 635 635 635 635
Reserves & surplus 113,796 116,886 121,543 130,945 142,170
Net worth 114,431 117,521 122,178 131,580 142,806
Minority Interest 0 0 0 0 0
Loan Funds 77,214 70,190 64,690 59,190 53,690
Net deferred tax liability 7,020 7,968 7,968 7,968 7,968
Total Liabilities 198,665 195,679 194,836 198,738 204,464
Net block 164,196 175,913 171,680 173,006 176,370
Investment 1,096 4,905 4,905 4,905 4,905
Current Assets 81,807 79,004 92,668 101,303 108,556
Cash & bank balance 21,458 10,807 12,859 13,822 14,160
Other Current Assets 13,356 10,539 11,066 11,619 12,200
Current liabilities & Provision 59,496 70,322 80,596 86,657 91,548
Net current assets 22,312 8,681 12,072 14,647 17,009
Misc. exp 0 0 0 0 0
Total Assets 198,665 195,679 194,836 198,738 204,464
Cash Flow
Y/E Mar (Rs mn) FY21 FY22 FY23E FY24E FY25E
PBT (Ex-Other income) (NI+Dep) 4,318 7,300 7,002 13,430 16,371
Other Non-Cash items 0 0 0 0 0
Chg in working cap 4,616 3,927 (1,338) (1,612) (2,024)
Operating Cashflow 21,881 21,153 24,602 29,166 31,477
Capital expenditure (11,563) (15,545) (11,000) (17,000) (20,000)
Free Cash Flow 10,318 5,608 13,602 12,166 11,477
Investments (12,550) (3,809) 0 0 0
Other Investing Cash Flow 1,964 7,539 0 0 0
Investing Cashflow (20,855) (10,580) (9,556) (15,474) (18,439)
Equity Capital Raised 10,800 0 0 0 0
Loans Taken / (Repaid) (3,222) (7,024) (5,500) (5,500) (5,500)
Dividend paid (incl tax) 0 (2,064) (1,762) (1,965) (2,403)
Other Financing Cash Flow 8,765 (7,691) 0 0 0
Financing Cashflow 12,936 (21,224) (12,994) (12,730) (12,700)
Net chg in cash 13,962 (10,651) 2,052 963 338
Opening cash position 7,496 21,458 10,807 12,859 13,822
Closing cash position 21,458 10,807 12,859 13,822 14,160
Source: Company, Emkay Research
This report is intended for [email protected] use and downloaded at 06/20/2022 01:28 PM
Apollo Tyres (APTY IN) India Equity Research | Analyst Meet Update
Emkay Research is also available on www.emkayglobal.com and Bloomberg EMKAY<GO>. Please refer to the last page of the report on Restrictions on Distribution. In Singapore, this research report or research analyses may only be distributed to Institutional Investors, Expert Investors or Accredited Investors as defined in the Securities and Futures Act, Chapter 289 of Singapore.
June 17, 2022 | 6
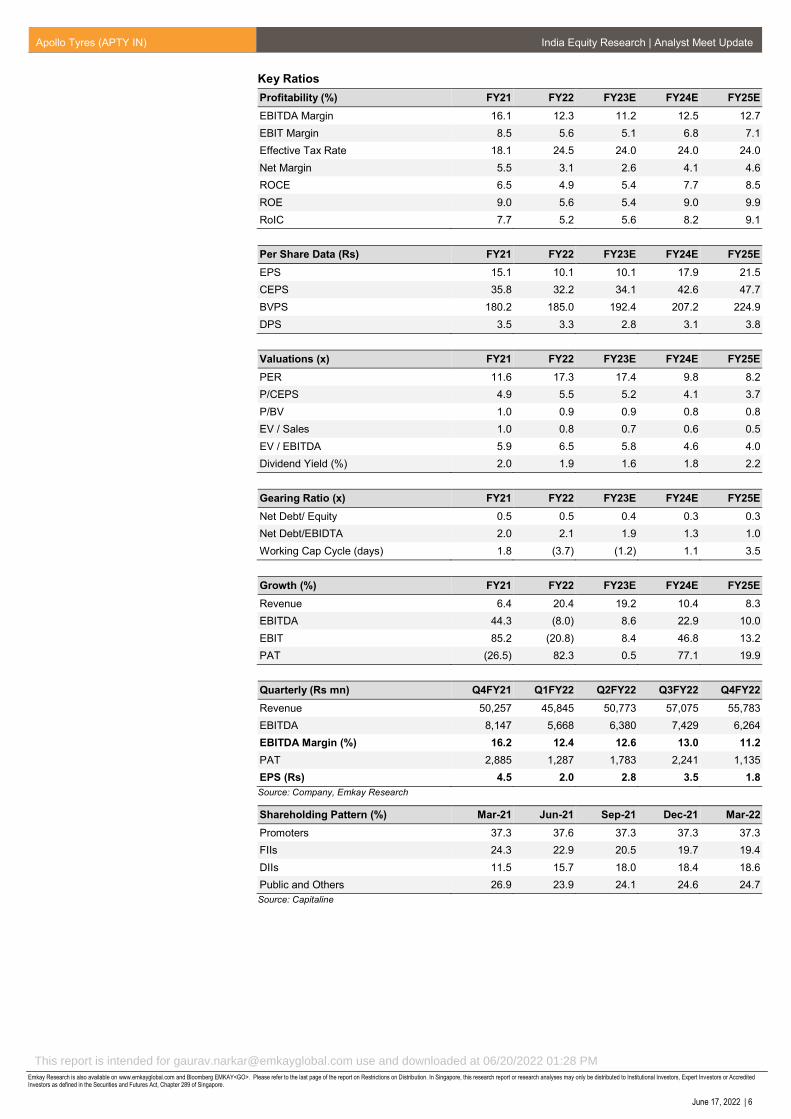
Key Ratios
Profitability (%) FY21 FY22 FY23E FY24E FY25E
EBITDA Margin 16.1 12.3 11.2 12.5 12.7
EBIT Margin 8.5 5.6 5.1 6.8 7.1
Effective Tax Rate 18.1 24.5 24.0 24.0 24.0
Net Margin 5.5 3.1 2.6 4.1 4.6
ROCE 6.5 4.9 5.4 7.7 8.5
ROE 9.0 5.6 5.4 9.0 9.9
RoIC 7.7 5.2 5.6 8.2 9.1
Per Share Data (Rs) FY21 FY22 FY23E FY24E FY25E
EPS 15.1 10.1 10.1 17.9 21.5
CEPS 35.8 32.2 34.1 42.6 47.7
BVPS 180.2 185.0 192.4 207.2 224.9
DPS 3.5 3.3 2.8 3.1 3.8
Valuations (x) FY21 FY22 FY23E FY24E FY25E
PER 11.6 17.3 17.4 9.8 8.2
P/CEPS 4.9 5.5 5.2 4.1 3.7
P/BV 1.0 0.9 0.9 0.8 0.8
EV / Sales 1.0 0.8 0.7 0.6 0.5
EV / EBITDA 5.9 6.5 5.8 4.6 4.0
Dividend Yield (%) 2.0 1.9 1.6 1.8 2.2
Gearing Ratio (x) FY21 FY22 FY23E FY24E FY25E
Net Debt/ Equity 0.5 0.5 0.4 0.3 0.3
Net Debt/EBIDTA 2.0 2.1 1.9 1.3 1.0
Working Cap Cycle (days) 1.8 (3.7) (1.2) 1.1 3.5
Growth (%) FY21 FY22 FY23E FY24E FY25E
Revenue 6.4 20.4 19.2 10.4 8.3
EBITDA 44.3 (8.0) 8.6 22.9 10.0
EBIT 85.2 (20.8) 8.4 46.8 13.2
PAT (26.5) 82.3 0.5 77.1 19.9
Quarterly (Rs mn) Q4FY21 Q1FY22 Q2FY22 Q3FY22 Q4FY22
Revenue 50,257 45,845 50,773 57,075 55,783
EBITDA 8,147 5,668 6,380 7,429 6,264
EBITDA Margin (%) 16.2 12.4 12.6 13.0 11.2
PAT 2,885 1,287 1,783 2,241 1,135
EPS (Rs) 4.5 2.0 2.8 3.5 1.8
Source: Company, Emkay Research
Shareholding Pattern (%) Mar-21 Jun-21 Sep-21 Dec-21 Mar-22
Promoters 37.3 37.6 37.3 37.3 37.3
FIIs 24.3 22.9 20.5 19.7 19.4
DIIs 11.5 15.7 18.0 18.4 18.6
Public and Others 26.9 23.9 24.1 24.6 24.7
Source: Capitaline
This report is intended for [email protected] use and downloaded at 06/20/2022 01:28 PM
Apollo Tyres (APTY IN) India Equity Research | Analyst Meet Update
Emkay Research is also available on www.emkayglobal.com and Bloomberg EMKAY<GO>. Please refer to the last page of the report on Restrictions on Distribution. In Singapore, this research report or research analyses may only be distributed to Institutional Investors, Expert Investors or Accredited Investors as defined in the Securities and Futures Act, Chapter 289 of Singapore.
June 17, 2022 | 7
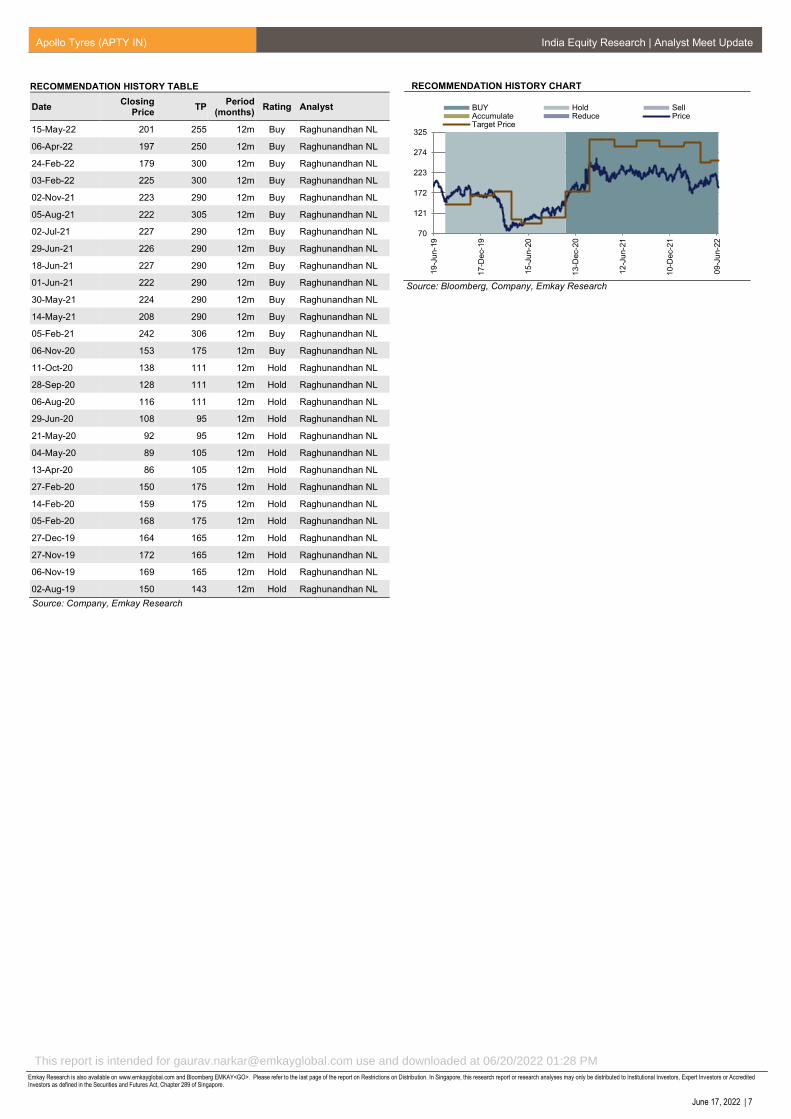
RECOMMENDATION HISTORY TABLE
Date Closing
Price TP
Period (months)
Rating Analyst
15-May-22 201 255 12m Buy Raghunandhan NL
06-Apr-22 197 250 12m Buy Raghunandhan NL
24-Feb-22 179 300 12m Buy Raghunandhan NL
03-Feb-22 225 300 12m Buy Raghunandhan NL
02-Nov-21 223 290 12m Buy Raghunandhan NL
05-Aug-21 222 305 12m Buy Raghunandhan NL
02-Jul-21 227 290 12m Buy Raghunandhan NL
29-Jun-21 226 290 12m Buy Raghunandhan NL
18-Jun-21 227 290 12m Buy Raghunandhan NL
01-Jun-21 222 290 12m Buy Raghunandhan NL
30-May-21 224 290 12m Buy Raghunandhan NL
14-May-21 208 290 12m Buy Raghunandhan NL
05-Feb-21 242 306 12m Buy Raghunandhan NL
06-Nov-20 153 175 12m Buy Raghunandhan NL
11-Oct-20 138 111 12m Hold Raghunandhan NL
28-Sep-20 128 111 12m Hold Raghunandhan NL
06-Aug-20 116 111 12m Hold Raghunandhan NL
29-Jun-20 108 95 12m Hold Raghunandhan NL
21-May-20 92 95 12m Hold Raghunandhan NL
04-May-20 89 105 12m Hold Raghunandhan NL
13-Apr-20 86 105 12m Hold Raghunandhan NL
27-Feb-20 150 175 12m Hold Raghunandhan NL
14-Feb-20 159 175 12m Hold Raghunandhan NL
05-Feb-20 168 175 12m Hold Raghunandhan NL
27-Dec-19 164 165 12m Hold Raghunandhan NL
27-Nov-19 172 165 12m Hold Raghunandhan NL
06-Nov-19 169 165 12m Hold Raghunandhan NL
02-Aug-19 150 143 12m Hold Raghunandhan NL
Source: Company, Emkay Research
RECOMMENDATION HISTORY CHART
Source: Bloomberg, Company, Emkay Research
70
121
172
223
274
325
19
-Ju
n-1
9
17
-De
c-1
9
15
-Ju
n-2
0
13
-De
c-2
0
12
-Ju
n-2
1
10
-De
c-2
1
09
-Ju
n-2
2
BUY Hold SellAccumulate Reduce PriceTarget Price
This report is intended for [email protected] use and downloaded at 06/20/2022 01:28 PM
Apollo Tyres (APTY IN) India Equity Research | Analyst Meet Update
Emkay Research is also available on www.emkayglobal.com and Bloomberg EMKAY<GO>. Please refer to the last page of the report on Restrictions on Distribution. In Singapore, this research report or research analyses may only be distributed to Institutional Investors, Expert Investors or Accredited Investors as defined in the Securities and Futures Act, Chapter 289 of Singapore.
June 17, 2022 | 8
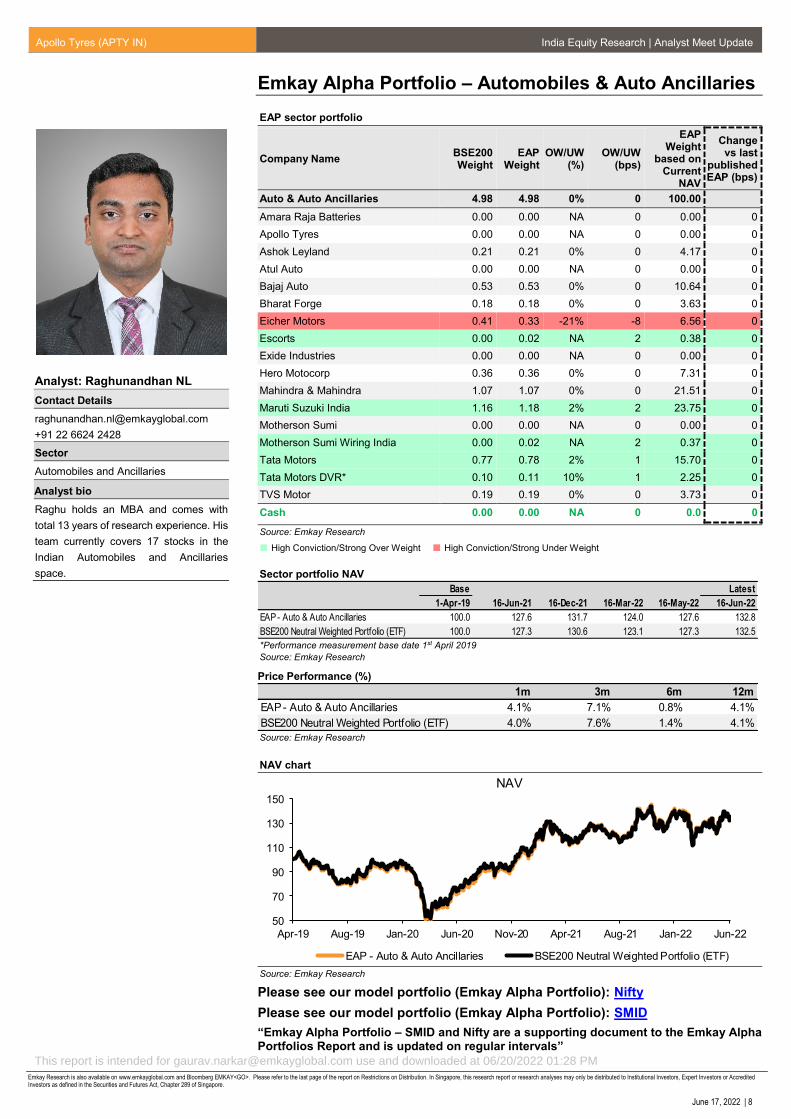
Emkay Alpha Portfolio – Automobiles & Auto Ancillaries
EAP sector portfolio
Company Name BSE200 Weight
EAP Weight
OW/UW (%)
OW/UW (bps)
EAP Weight
based on Current
NAV
Change vs last
published EAP (bps)
Auto & Auto Ancillaries 4.98 4.98 0% 0 100.00
Amara Raja Batteries 0.00 0.00 NA 0 0.00 0
Apollo Tyres 0.00 0.00 NA 0 0.00 0
Ashok Leyland 0.21 0.21 0% 0 4.17 0
Atul Auto 0.00 0.00 NA 0 0.00 0
Bajaj Auto 0.53 0.53 0% 0 10.64 0
Bharat Forge 0.18 0.18 0% 0 3.63 0
Eicher Motors 0.41 0.33 -21% -8 6.56 0
Escorts 0.00 0.02 NA 2 0.38 0
Exide Industries 0.00 0.00 NA 0 0.00 0
Hero Motocorp 0.36 0.36 0% 0 7.31 0
Mahindra & Mahindra 1.07 1.07 0% 0 21.51 0
Maruti Suzuki India 1.16 1.18 2% 2 23.75 0
Motherson Sumi 0.00 0.00 NA 0 0.00 0
Motherson Sumi Wiring India 0.00 0.02 NA 2 0.37 0
Tata Motors 0.77 0.78 2% 1 15.70 0
Tata Motors DVR* 0.10 0.11 10% 1 2.25 0
TVS Motor 0.19 0.19 0% 0 3.73 0
Cash 0.00 0.00 NA 0 0.0 0
Source: Emkay Research
High Conviction/Strong Over Weight High Conviction/Strong Under Weight
Sector portfolio NAV
Base Latest
1-Apr-19 16-Jun-21 16-Dec-21 16-Mar-22 16-May-22 16-Jun-22
EAP - Auto & Auto Ancillaries 100.0 127.6 131.7 124.0 127.6 132.8
BSE200 Neutral Weighted Portfolio (ETF) 100.0 127.3 130.6 123.1 127.3 132.5 *Performance measurement base date 1st April 2019
Source: Emkay Research
Price Performance (%)
1m 3m 6m 12m
EAP - Auto & Auto Ancillaries 4.1% 7.1% 0.8% 4.1%
BSE200 Neutral Weighted Portfolio (ETF) 4.0% 7.6% 1.4% 4.1% Source: Emkay Research
NAV chart
50
70
90
110
130
150
Apr-19 Aug-19 Jan-20 Jun-20 Nov-20 Apr-21 Aug-21 Jan-22 Jun-22
NAV
EAP - Auto & Auto Ancillaries BSE200 Neutral Weighted Portfolio (ETF) Source: Emkay Research
Please see our model portfolio (Emkay Alpha Portfolio): Nifty
Please see our model portfolio (Emkay Alpha Portfolio): SMID
“Emkay Alpha Portfolio – SMID and Nifty are a supporting document to the Emkay Alpha Portfolios Report and is updated on regular intervals”
Analyst: Raghunandhan NL
Contact Details
+91 22 6624 2428
Sector
Automobiles and Ancillaries
Analyst bio
Raghu holds an MBA and comes with
total 13 years of research experience. His
team currently covers 17 stocks in the
Indian Automobiles and Ancillaries
space.
This report is intended for [email protected] use and downloaded at 06/20/2022 01:28 PM
Apollo Tyres (APTY IN) India Equity Research | Analyst Meet Update
Emkay Research is also available on www.emkayglobal.com and Bloomberg EMKAY<GO>. Please refer to the last page of the report on Restrictions on Distribution. In Singapore, this research report or research analyses may only be distributed to Institutional Investors, Expert Investors or Accredited Investors as defined in the Securities and Futures Act, Chapter 289 of Singapore.
June 17, 2022 | 9
Emkay Rating Distribution
Ratings Expected Return within the next 12-18 months.
BUY Over 15%
HOLD Between -5% to 15%
SELL Below -5%
Completed Date: 18 Jun 2022 01:50:11 (SGT) Dissemination Date: 18 Jun 2022 01:51:11 (SGT)
Sources for all charts and tables are Emkay Research unless otherwise specified.
GENERAL DISCLOSURE/DISCLAIMER BY EMKAY GLOBAL FINANCIAL SERVICES LIMITED (EGFSL): Emkay Global Financial Services Limited (CIN-L67120MH1995PLC084899) and its affiliates are a full-service, brokerage, investment banking, investment management and financing group. Emkay Global Financial Services Limited (EGFSL) along with its affiliates are participants in virtually all securities trading markets in India. EGFSL was established in 1995 and is one of India's leading brokerage and distribution house. EGFSL is a corporate trading member of Bombay Stock Exchange Limited (BSE), National Stock Exchange of India Limited (NSE), MCX Stock Exchange Limited (MCX-SX). EGFSL along with its subsidiaries offers the most comprehensive avenues for investments and is engaged in the businesses including stock broking (Institutional and retail), merchant banking, commodity broking, depository participant, portfolio management, insurance broking and services rendered in connection with distribution of primary market issues and financial products like mutual funds, fixed deposits. Details of associates are available on our website i.e. www.emkayglobal.com EGFSL is registered as Research Analyst with SEBI bearing registration Number INH000000354 as per SEBI (Research Analysts) Regulations, 2014. EGFSL hereby declares that it has not defaulted with any stock exchange nor its activities were suspended by any stock exchange with whom it is registered in last five years, except that NSE had disabled EGFSL from trading on October 05, October 08 and October 09, 2012 for a manifest error resulting into a bonafide erroneous trade on October 05, 2012. However, SEBI and Stock Exchanges have conducted the routine inspection and based on their observations have issued advice letters or levied minor penalty on EGFSL for certain operational deviations in ordinary/routine course of business. EGFSL has not been debarred from doing business by any Stock Exchange / SEBI or any other authorities; nor has its certificate of registration been cancelled by SEBI at any point of time. EGFSL offers research services to clients as well as prospects. The analyst for this report certifies that all of the views expressed in this report accurately reflect his or her personal views about the subject company or companies and its or their securities, and no part of his or her compensation was, is or will be, directly or indirectly related to specific recommendations or views expressed in this report. Other disclosures by Emkay Global Financial Services Limited (Research Entity) and its Research Analyst under SEBI (Research Analyst) Regulations, 2014 with reference to the subject company(s) covered in this report EGFSL and/or its affiliates may seek investment banking or other business from the company or companies that are the subject of this material. Our salespeople, traders, and other professionals may provide oral or written market commentary or trading strategies to our clients that reflect opinions that are contrary to the opinions expressed herein, and our proprietary trading and investing businesses may make investment decisions that may be inconsistent with the recommendations expressed herein. In reviewing these materials, you should be aware that any or all of the foregoing, among other things, may give rise to real or potential conflicts of interest including but not limited to those stated herein. Additionally, other important information regarding our relationships with the company or companies that are the subject of this material is provided herein. This report is not directed to, or intended for distribution to or use by, any person or entity who is a citizen or resident of or located in any locality, state, country or other jurisdiction where such distribution, publication, availability or use would be contrary to law or regulation or which would subject EGFSL or its group companies to any registration or licensing requirement within such jurisdiction. Specifically, this document does not constitute an offer to or solicitation to any U.S. person for the purchase or sale of any financial instrument or as an official confirmation of any transaction to any U.S. person. Unless otherwise stated, this message should not be construed as official confirmation of any transaction. No part of this document may be used by private customers in United Kingdom. All material presented in this report, unless specifically indicated otherwise, is under copyright to Emkay. None of the material, nor its content, nor any copy of it, may be altered in any way, transmitted to, copied or distributed to any other party, without the prior express written permission of EGFSL . All trademarks, service marks and logos used in this report are trademarks or registered trademarks of EGFSL or its Group Companies. The information contained herein is not intended for publication or distribution or circulation in any manner whatsoever and any unauthorized reading, dissemination, distribution or copying of this communication is prohibited unless otherwise expressly authorized. Please ensure that you have read “Risk Disclosure Document for Capital Market and Derivatives Segments” as prescribed by Securities and Exchange Board of India before investing in Indian Securities Market. In so far as this report includes current or historic information, it is believed to be reliable, although its accuracy and completeness cannot be guaranteed.
This publication has not been reviewed or authorized by any regulatory authority. There is no planned schedule or frequency for updating research publication relating to any issuer.
Please contact the primary analyst for valuation methodologies and assumptions associated with the covered companies or price targets Disclaimer for U.S. persons only: This research report is a product of Emkay Global Financial Services Limited (Emkay), which is the employer of the research analyst(s) who has prepared the research report. The research analyst(s) preparing the research report is/are resident outside the United States (U.S.) and are not associated persons of any U.S. regulated broker-dealer and therefore the analyst(s) is/are not subject to supervision by a U.S. broker-dealer, and is/are not required to satisfy the regulatory licensing requirements of Financial Institutions Regulatory Authority (FINRA) or required to otherwise comply with U.S. rules or regulations regarding, among other things, communications with a subject company, public appearances and trading securities held by a research analyst account. This report is intended for distribution to "Major Institutional Investors" as defined by Rule 15a-6(b)(4) of the U.S. Securities and Exchange Act, 1934 (the Exchange Act) and interpretations thereof by U.S. Securities and Exchange Commission (SEC) in reliance on Rule 15a 6(a)(2). If the recipient of this report is not a Major Institutional Investor as specified above, then it should not act upon this report and return the same to the sender. Further, this report may not be copied, duplicated and/or transmitted onward to any U.S. person, which is not the Major Institutional Investor. In reliance on the exemption from registration provided by Rule 15a-6 of the Exchange Act and interpretations thereof by the SEC in order to conduct certain business with Major Institutional Investors.
This report is intended for [email protected] use and downloaded at 06/20/2022 01:28 PM
Apollo Tyres (APTY IN) India Equity Research | Analyst Meet Update
Emkay Research is also available on www.emkayglobal.com and Bloomberg EMKAY<GO>. Please refer to the last page of the report on Restrictions on Distribution. In Singapore, this research report or research analyses may only be distributed to Institutional Investors, Expert Investors or Accredited Investors as defined in the Securities and Futures Act, Chapter 289 of Singapore.
June 17, 2022| 10
ANALYST CERTIFICATION BY EMKAY GLOBAL FINANCIAL SERVICES LIMITED (EGFSL) The research analyst(s) primarily responsible for the content of this research report, in part or in whole, certifies that the views about the companies and their securities expressed in this report accurately reflect his/her personal views. The analyst(s) also certifies that no part of his/her compensation was, is, or will be, directly or indirectly, related to specific recommendations or views expressed in the report. The research analyst (s) primarily responsible of the content of this research report, in part or in whole, certifies that he or his associate1 does not serve as an officer, director or employee of the issuer or the new listing applicant (which includes in the case of a real estate investment trust, an officer of the management company of the real estate investment trust; and in the case of any other entity, an officer or its equivalent counterparty of the entity who is responsible for the management of the issuer or the new listing applicant). The research analyst(s) primarily responsible for the content of this research report or his associate does not have financial interests2 in relation to an issuer or a new listing applicant that the analyst reviews. EGFSL has procedures in place to eliminate, avoid and manage any potential conflicts of interests that may arise in connection with the production of research reports. The research analyst(s) responsible for this report operates as part of a separate and independent team to the investment banking function of the EGFSL and procedures are in place to ensure that confidential information held by either the research or investment banking function is handled appropriately. There is no direct link of EGFSL compensation to any specific investment banking function of the EGFSL. 1 An associate is defined as (i) the spouse, or any minor child (natural or adopted) or minor step-child, of the analyst; (ii) the trustee of a trust of which the analyst, his spouse, minor child (natural or adopted) or minor step-child, is a beneficiary or discretionary object; or (iii) another person accustomed or obliged to act in accordance with the directions or instructions of the analyst. 2 Financial interest is defined as interest that are commonly known financial interest, such as investment in the securities in respect of an issuer or a new listing applicant, or financial accommodation arrangement between the issuer or the new listing applicant and the firm or analysis. This term does not include commercial lending conducted at the arm’s length, or investments in any collective investment scheme other than an issuer or new listing applicant notwithstanding the fact that the scheme has investments in securities in respect of an issuer or a new listing applicant.
COMPANY-SPECIFIC / REGULATORY DISCLOSURES BY EMKAY GLOBAL FINANCIAL SERVICES LIMITED (EGFSL):
Disclosures by Emkay Global Financial Services Limited (Research Entity) and its Research Analyst under SEBI (Research Analyst) Regulations, 2014 with reference to the subject company(s) covered in this report-: 1. EGFSL, its subsidiaries and/or other affiliates do not have a proprietary position in the securities recommended in this report as of June 17, 2022 2. EGFSL, and/or Research Analyst does not market make in equity securities of the issuer(s) or company(ies) mentioned in this Research Report Disclosure of previous investment recommendation produced: 3. EGFSL may have published other investment recommendations in respect of the same securities / instruments recommended in this research
report during the preceding 12 months. Please contact the primary analyst listed in the first page of this report to view previous investment recommendations published by EGFSL in the preceding 12 months.
4. EGFSL , its subsidiaries and/or other affiliates and Research Analyst or his/her relative’s does not have any material conflict of interest in the securities recommended in this report as of June 17, 2022.
5. EGFSL, its subsidiaries and/or other affiliates and Research Analyst or his/her relative’s does not have actual/beneficial ownership of 1% or more securities of the subject company at the end of the month immediately preceding the June 17, 2022
6. EGFSL, its subsidiaries and/or other affiliates and Research Analyst have not received any compensation in whatever form including compensation for investment banking or merchant banking or brokerage services or for products or services other than investment banking or merchant banking or brokerage services from securities recommended in this report (subject company) in the past 12 months.
7. EGFSL, its subsidiaries and/or other affiliates and/or and Research Analyst have not received any compensation or other benefits from securities recommended in this report (subject company) or third party in connection with the research report.
8. Securities recommended in this report (Subject Company) has not been client of EGFSL, its subsidiaries and/or other affiliates and/or and Research Analyst during twelve months preceding the June 17, 2022
This report is intended for [email protected] use and downloaded at 06/20/2022 01:28 PM
Apollo Tyres (APTY IN) India Equity Research | Analyst Meet Update
Emkay Research is also available on www.emkayglobal.com and Bloomberg EMKAY<GO>. Please refer to the last page of the report on Restrictions on Distribution. In Singapore, this research report or research analyses may only be distributed to Institutional Investors, Expert Investors or Accredited Investors as defined in the Securities and Futures Act, Chapter 289 of Singapore.
June 17, 2022| 11
RESTRICTIONS ON DISTRIBUTION
General This report is not directed to, or intended for distribution to or use by, any person or entity who is a citizen or resident of or located in any locality, state, country or other jurisdiction where such distribution, publication, availability or use would be contrary to law or regulation.
Australia This report is not for distribution into Australia.
Hong Kong This report is not for distribution into Hong Kong.
Indonesia This report is being distributed in Indonesia by PT DBS Vickers Sekuritas Indonesia.
Malaysia This report is not for distribution into Malaysia.
Singapore
This report is distributed in Singapore by DBS Bank Ltd (Company Regn. No. 16800306E) or DBSVS (Company Regn. No. 1860024G) both of which are Exempt Financial Advisers as defined in the Financial Advisers Act and regulated by the Monetary Authority of Singapore. DBS Bank Ltd and/or DBSVS, may distribute reports produced by its respective foreign entities, affiliates or other foreign research houses pursuant to an agreement under Regulation 32C of the financial Advisers Regulations. Singapore recipients should contact DBS Bank Ltd at 6327 2288 for matters arising from, or in connection with the report.
Thailand This report is being distributed in Thailand by DBS Vickers Securities (Thailand) Co Ltd.
United Kingdom
This report is disseminated in the United Kingdom by DBS Vickers Securities (UK) Ltd, ("DBSVUK"). DBSVUK is authorised and regulated by the Financial Conduct Authority in the United Kingdom.
In respect of the United Kingdom, this report is solely intended for the clients of DBSVUK, its respective connected and associated corporations and affiliates only and no part of this document may be (i) copied, photocopied or duplicated in any form or by any means or (ii) redistributed without the prior written consent of DBSVUK. This communication is directed at persons having professional experience in matters relating to investments. Any investment activity following from this communication will only be engaged in with such persons. Persons who do not have professional experience in matters relating to investments should not rely on this communication.
Dubai International Financial Centre
This research report is being distributed by DBS Bank Ltd., (DIFC Branch) having its office at units 608-610, 6th Floor, Gate Precinct Building 5, PO Box 506538, Dubai International Financial Centre (DIFC), Dubai, United Arab Emirates. DBS Bank Ltd., (DIFC Branch) is regulated by The Dubai Financial Services Authority. This research report is intended only for professional clients (as defined in the DFSA rulebook) and no other person may act upon it.
United Arab Emirates
This report is provided by DBS Bank Ltd (Company Regn. No. 196800306E) which is an Exempt Financial Adviser as defined in the Financial Advisers Act and regulated by the Monetary Authority of Singapore. This report is for information purposes only and should not be relied upon or acted on by the recipient or considered as a solicitation or inducement to buy or sell any financial product. It does not constitute a personal recommendation or take into account the particular investment objectives, financial situation, or needs of individual clients. You should contact your relationship manager or investment adviser if you need advice on the merits of buying, selling or holding a particular investment. You should note that the information in this report may be out of date and it is not represented or warranted to be accurate, timely or complete. This report or any portion thereof may not be reprinted, sold or redistributed without our written consent.
United States
DBSVUSA did not participate in its preparation. The research analyst(s) named on this report are not registered as research analysts with FINRA and are not associated persons of DBSVUSA. The research analyst(s) are not subject to FINRA Rule 2241 restrictions on analyst compensation, communications with a subject company, public appearances and trading securities held by a research analyst. This report is being distributed in the United States by DBSVUSA, which accepts responsibility for its contents. This report may only be distributed to Major U.S. Institutional Investors (as defined in SEC Rule 15a-6) and to such other institutional investors and qualified persons as DBSVUSA may authorize. Any U.S. person receiving this report who wishes to effect transactions in any securities referred to herein should contact DBSVUSA directly and not its affiliate.
Other jurisdictions In any other jurisdictions, except if otherwise restricted by laws or regulations, this report is intended only for qualified, professional, institutional or sophisticated investors as defined in the laws and regulations of such jurisdictions.
Emkay Global Financial Services Ltd.
CIN - L67120MH1995PLC084899
7th Floor, The Ruby, Senapati Bapat Marg, Dadar - West, Mumbai - 400028. India
Tel: +91 22 66121212 Fax: +91 22 66121299 Web: www.emkayglobal.com
This report is intended for [email protected] use and downloaded at 06/20/2022 01:28 PM