Embed Size (px)
Citation preview

Britannia
Industries
Annual Report
Round-Up
15th June 2022

KRChoksey Researchis also available on Bloomberg KRCS<GO>
Thomson Reuters, Factset and Capital IQ
Phone: +91-22-6696 5555, Fax: +91-22-6691 9576www.krchoksey.com
Research AnalystVikrant Kashyap, [email protected], +91-22-6696 5413
Executive Summary
• Despite a challenging environment, Britannia Industries continued its strong growth momentum in topline growth
at 7.6% YoY (domestic sales grew by 8.4% while exports declined by 4.8%), through its healthy mix of a robust
portfolio, direct distribution, and enhanced distribution infrastructure. Britannia commenced its journey to become
a total food company in 2018 and entered various product categories such as salted snacks, milkshakes, cream
wafers, dairy products, value-added dairy products, and croissants incremental volume growth can be expected as
distribution of these products increase contribution. However, the contribution from these new categories is still at
an embryonic stage.
• Britannia’s strategy is to focus on value-added products that carry higher margin milk-based drinks, chees, and
dairy whiteners.
• Britannia is working on improving its distribution at a rapid pace, reducing the gap with the top players. Direct
reach has increased by more than 26% over the last two years to 2.49mn outlets. the pace is expected to continue at
200k addition per year
• Britannia currently does 60% of its manufacturing in-house and has been expanding its manufacturing capacity to
support continued expansion into new products/ categories.
• Cost management is a priority in view of increased commodity prices, packaging material, and fuel and
transportation costs, where many costs are at 10-year highs.
• Britannia’s advertising and promotion spending has historically been tilted towards trade promotions (offers/
discounts to channel partners). More recently, the company has been rationalizing its A&P spending gradually
shifting it towards brand-building exercises for the long term.
• The company has invested in a Dairy Greenfield plant in Ranjangaon, which is compliant with global standards. It
can function as a multi-category dairy plant with the capability to manufacture yogurt, ghee, cheddar, processed
cheese, skimmed milk powder etc. The capacity of the plant is 150,000 Tons P.A.

KRChoksey Researchis also available on Bloomberg KRCS<GO>
Thomson Reuters, Factset and Capital IQ
Phone: +91-22-6696 5555, Fax: +91-22-6691 9576www.krchoksey.com
Research AnalystVikrant Kashyap, [email protected], +91-22-6696 5413
Table of Content
No. Content Slide No.
1 Britannia Industries – View & Recommendation 04
2 Business Analysis 05
3 Key Performance Drivers 06
4 Financial Analysis 10
5 Environmental, Social, & Governance (ESG) Initiatives 14
6 Valuation 15
7 Exhibits 16
KRChoksey Researchis also available on Bloomberg KRCS<GO>
Thomson Reuters, Factset and Capital IQ
Phone: +91-22-6696 5555, Fax: +91-22-6691 9576www.krchoksey.com
Research AnalystVikrant Kashyap, [email protected], +91-22-6696 5413
Britannia Industries – View & Recommendation
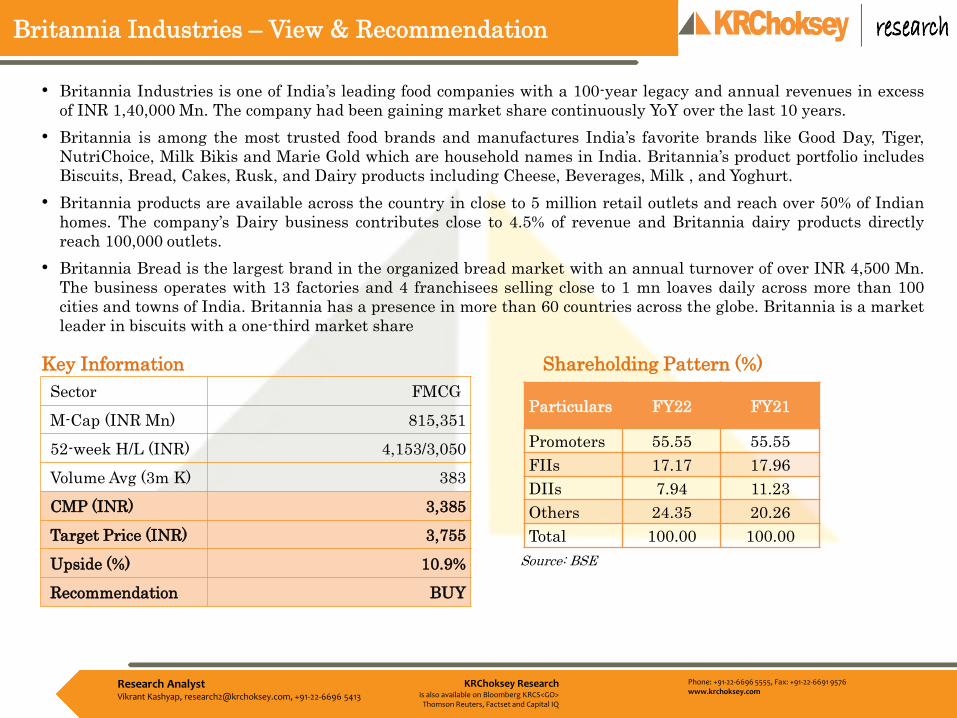
• Britannia Industries is one of India’s leading food companies with a 100-year legacy and annual revenues in excess
of INR 1,40,000 Mn. The company had been gaining market share continuously YoY over the last 10 years.
• Britannia is among the most trusted food brands and manufactures India’s favorite brands like Good Day, Tiger,
NutriChoice, Milk Bikis and Marie Gold which are household names in India. Britannia’s product portfolio includes
Biscuits, Bread, Cakes, Rusk, and Dairy products including Cheese, Beverages, Milk , and Yoghurt.
• Britannia products are available across the country in close to 5 million retail outlets and reach over 50% of Indian
homes. The company’s Dairy business contributes close to 4.5% of revenue and Britannia dairy products directly
reach 100,000 outlets.
• Britannia Bread is the largest brand in the organized bread market with an annual turnover of over INR 4,500 Mn.
The business operates with 13 factories and 4 franchisees selling close to 1 mn loaves daily across more than 100
cities and towns of India. Britannia has a presence in more than 60 countries across the globe. Britannia is a market
leader in biscuits with a one-third market share
Key Information Shareholding Pattern (%)
Source: BSE
Particulars FY22 FY21
Promoters 55.55 55.55
FIIs 17.17 17.96
DIIs 7.94 11.23
Others 24.35 20.26
Total 100.00 100.00
Sector FMCG
M-Cap (INR Mn) 815,351
52-week H/L (INR) 4,153/3,050
Volume Avg (3m K) 383
CMP (INR) 3,385
Target Price (INR) 3,755
Upside (%) 10.9%
Recommendation BUY
KRChoksey Researchis also available on Bloomberg KRCS<GO>
Thomson Reuters, Factset and Capital IQ
Phone: +91-22-6696 5555, Fax: +91-22-6691 9576www.krchoksey.com
Research AnalystVikrant Kashyap, [email protected], +91-22-6696 5413
Business Analysis
Britannia industries top-line growth driven across all business and channels
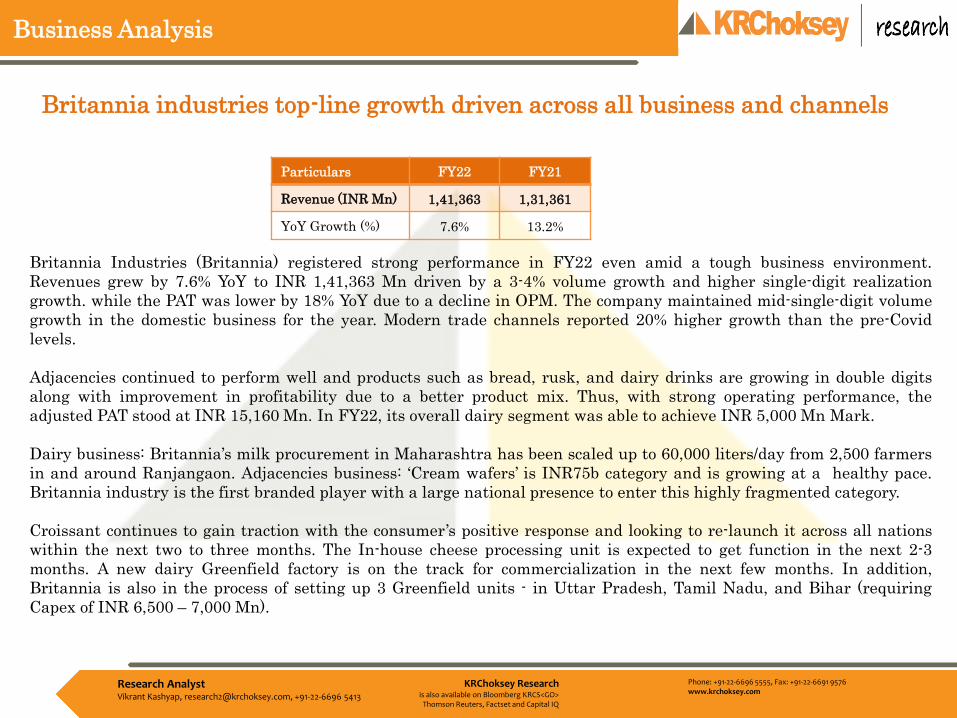
Britannia Industries (Britannia) registered strong performance in FY22 even amid a tough business environment.
Revenues grew by 7.6% YoY to INR 1,41,363 Mn driven by a 3-4% volume growth and higher single-digit realization
growth. while the PAT was lower by 18% YoY due to a decline in OPM. The company maintained mid-single-digit volume
growth in the domestic business for the year. Modern trade channels reported 20% higher growth than the pre-Covid
levels.
Adjacencies continued to perform well and products such as bread, rusk, and dairy drinks are growing in double digits
along with improvement in profitability due to a better product mix. Thus, with strong operating performance, the
adjusted PAT stood at INR 15,160 Mn. In FY22, its overall dairy segment was able to achieve INR 5,000 Mn Mark.
Dairy business: Britannia’s milk procurement in Maharashtra has been scaled up to 60,000 liters/day from 2,500 farmers
in and around Ranjangaon. Adjacencies business: ‘Cream wafers’ is INR75b category and is growing at a healthy pace.
Britannia industry is the first branded player with a large national presence to enter this highly fragmented category.
Croissant continues to gain traction with the consumer’s positive response and looking to re-launch it across all nations
within the next two to three months. The In-house cheese processing unit is expected to get function in the next 2-3
months. A new dairy Greenfield factory is on the track for commercialization in the next few months. In addition,
Britannia is also in the process of setting up 3 Greenfield units - in Uttar Pradesh, Tamil Nadu, and Bihar (requiring
Capex of INR 6,500 – 7,000 Mn).
Particulars FY22 FY21
Revenue (INR Mn) 1,41,363 1,31,361
YoY Growth (%) 7.6% 13.2%

KRChoksey Researchis also available on Bloomberg KRCS<GO>
Thomson Reuters, Factset and Capital IQ
Phone: +91-22-6696 5555, Fax: +91-22-6691 9576www.krchoksey.com
Research AnalystVikrant Kashyap, [email protected], +91-22-6696 5413
Key Performance Drivers
Addressing huge market size
• The adjacent business has a total addressable market size of more than Rs 3 trillion. We believe Britannia, with a
strong product portfolio and distribution reach, has the potential to gain market share in times to come.
• The company has rapidly gained market share in newer segments including Cake (Market share of more than 24%
and market Size INR 50,000 Mn), Bread and Rusk (market share of 12% and market size of more than INR 1,00,000
Mn), Value-added dairy (market share 10% chees and other value-added and market size more than INR 3,00,000
Mn) which is a demonstration of its execution is its ability.
• Wafers segment is growing at a healthy rate YoY and the market value of this category is currently at INR 7,500 Mn,
Britannia is a major brands in this category which is highly unorganized and fragmented.
Strong traction in adjacent business :• Britannia’s adjacent businesses have gained good traction during the year. The bakery business registered high
double-digit growths across divisions and reported healthy and consistent margins in the bread & rusk portfolios. The
Croissant business continued to gain traction with consumers and is expected to be launched across the country after
its regional success.
• The Dairy business reported a strong quarter with robust double-digit growth. The dairy business revenues crossed
the ‘INR. 5,000 Mn’ mark during the year and the company target dairy business revenue of INR 20,000 Mn in the
next four to five years. Revenues from Winkin Cow crossed the ‘INR 1000 Mn’ mark in Q4FY2022.
• In terms of the company’s international business, Nepal continued to perform well and joined the ‘INR 1,000 Mn’
revenue club during the quarter. Middle east delivered muted performance as distribution revamp in the region
impacted the performance
Expanding beyond the Biscuit market (market size INR 3,20,000 Mn), has
increased the addressable market by 9.3x to INR 3 trillion
KRChoksey Researchis also available on Bloomberg KRCS<GO>
Thomson Reuters, Factset and Capital IQ
Phone: +91-22-6696 5555, Fax: +91-22-6691 9576www.krchoksey.com
Research AnalystVikrant Kashyap, [email protected], +91-22-6696 5413
Key Performance Drivers
Market share gains continued• The company gained a market share of 80 bps in the last two years to 40% in the core biscuit categories. It is focusing
on ahead further share with defined strategies in key markets. Hindi Belt is growing 20% faster than the rest of
India. Smaller Hindi-Belt states need more attention. Uttar Pradesh is 50% of Hindi-Belt sales and is doing well.
Adjacencies and International business to scale up and will add to the topline. It will focus on improving the rural
market share and bringing close to the urban market through its defined strategies.
Focus on expanding the rural reach• Britannia now has a reach of 26,000 rural distributors against 19,000 distributors in March 2020. The majority of the
focus states are rural thus reinforcing the company’s aim to grow its footprint in these areas. Focus states such as
Uttar Pradesh, Rajasthan, Madhya Pradesh, and Uttarakhand grew at 1.2x rest of India. Britannia is looking to rural
distribution to come at par with the urban distribution. Products such as Milk Bikis and Tiger Crunch continue to
gain good traction in the Hindi belt and are growing in strong double digits. Tiger Crunch is growing by 30-35%.
A steady rise in the direct reach • Direct reach currently stands at 2.49 million outlets, up from 1.97 million outlets in March 2020. The company
targets direct coverage to reach 3.0 million outlets in the coming years.
RM Inflation was further elevated due to geopolitical factors • To counter inflation, the management undertook some forward covers and is focusing on controlled discretionary
spending (rationalization of A&P, controlled Overhead exp. etc), cost efficiency programs, packaging optimization,
backward integration, and process automation to improve productivity. The company increased the prices of its
products by nearly 13% in 9MFY22 and by 10% in Q4FY22. Britannia undertook these price hikes primarily by
reducing the grammage of its products
Healthy volume growth in a challenging environment

KRChoksey Researchis also available on Bloomberg KRCS<GO>
Thomson Reuters, Factset and Capital IQ
Phone: +91-22-6696 5555, Fax: +91-22-6691 9576www.krchoksey.com
Research AnalystVikrant Kashyap, [email protected], +91-22-6696 5413
Balance sheet and Cash flow analysis• Inter-corporate deposits slightly reduce as compared to FY21 and dividend pay-out ratio of 89.3%: Britannia’s
inter-corporate deposits (ICD) slightly reduced to INR 7,400 Mn in March 2022 as compared to INR 7,900 Mn
in March 2021.
• The management has given guidance on ICDs will not increase from the current levels. Sustained reduction in
ICDs to group entities and consistency in higher dividend pay-outs have the potential to rerate the stock.
• Cash flow from operating activities decreased to INR 12,995 Mn for the year ended March 2022 from INR
18,755 Mn for the year ended March 2021.
• Cash flow used in acquiring fixed assets during the year ended March 2022 stood at INR 5,501 Mn, compared
to INR 2,421 Mn during the year ended March 2021.
• Britannia’s gross debt increased significantly from INR 21.0 bn in FY21 to INR 24.7 bn in FY22. The increase
was partially driven by the issue of bonus debentures of INR 7.2b to equity investors. These debentures have
an interest rate of 8% and a term of 3 years.
• The total dividend payout for FY22 stands at Rs 13.6b (FY21: Rs 34.9bn). The board of directors recommended
a dividend of Rs 56.5 per share amounting to a payout of 89.3% for FY22. With a higher dividend payout,
Britannia’s Return on Equity (RoE) improved from 46.9% in FY21 to 49.8% in FY22.
• Average net working capital days in FY22 increased to 6 days from nil days in FY21 primarily on account of
higher inventory days. CFO/FCF declined by 29.8%/53.3% YoY during FY22.
• However, the Return on Capital Employed (RoCE) deteriorated from 45.26% in FY21 to 41.6% in FY22 on
account of higher loans taken in FY22.
Key Performance Drivers
KRChoksey Researchis also available on Bloomberg KRCS<GO>
Thomson Reuters, Factset and Capital IQ
Phone: +91-22-6696 5555, Fax: +91-22-6691 9576www.krchoksey.com
Research AnalystVikrant Kashyap, [email protected], +91-22-6696 5413
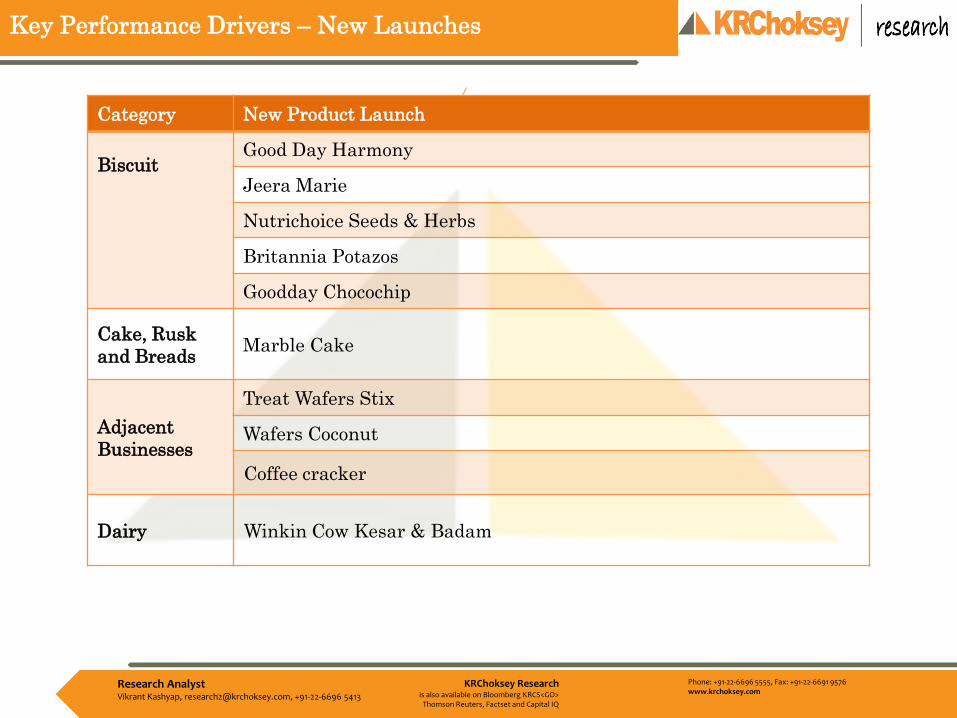
Key Performance Drivers – New Launches
Category New Product Launch
Biscuit Good Day Harmony
Jeera Marie
Nutrichoice Seeds & Herbs
Britannia Potazos
Goodday Chocochip
Cake, Rusk
and BreadsMarble Cake
Adjacent
Businesses
Treat Wafers Stix
Wafers Coconut
Coffee cracker
Dairy Winkin Cow Kesar & Badam

KRChoksey Researchis also available on Bloomberg KRCS<GO>
Thomson Reuters, Factset and Capital IQ
Phone: +91-22-6696 5555, Fax: +91-22-6691 9576www.krchoksey.com
Research AnalystVikrant Kashyap, [email protected], +91-22-6696 5413
Financial Analysis
Healthy volume growth driven by market share
gains
• The company reported revenue of INR 1,41,363 Mn, up 7.6% YoY, driven by
mid and single-digit volume growth of 3.25% on account of share gain from
unorganized players. In the latest quarter, the consensus-estimated flattish
growth from the industry but Britannia industry reported better than the
consensus-estimated number. The pressure on margins was due to high raw
material costs and other expenses. Raw material inflation of 14% in FY22
led to a 246 bps YoY decline in gross margins to 37.2%. However, lower other
expenses resulted in a decline in OPM to 15.6%. Adjacencies continued to
perform well and products such as bread, rusk, and dairy drinks are
growing in double digits along with improvement in profitability due to a
better product mix.
• Strong operating performance, the adjusted PAT stood at INR 15,250 Mn,
better than the consensus expectation. For FY2022, Britannia’s revenues
grew by 7.6%, while the PAT was lower by 18% YoY due to a decline in
OPM.
• In order to mitigate inflationary pressure, the company took judicious price hikes, controlled discretionary spending,
and initiated cost efficiency programs. It could achieve 5x cost savings in FY22.
• Nepal business is doing more than INR 1,000 Mn in revenue and performed well due to own distribution and
manufacturing facility. Britannia industry has 2 contract packers in Africa. UAE (largest business) was impacted due
to issues with distribution partners which are resolved. Europe, America, Australia, and South-East Asia export
business grew in double digits.
FY22 FY21
Revenue (INR Mn) 1,41,363 1,31,361
YoY Growth (%) 7.6% 13.2%
EBITDA (INR Mn) 22,015 25,093
YoY Growth (%) -12.3% 36.1%
EBITDA Margin 15.6% 19.1%
PAT (INR Mn) 15,250 18,653
YoY Growth (%) -18.2% 32.9%
PAT Margin 10.8% 14.2%
KRChoksey Researchis also available on Bloomberg KRCS<GO>
Thomson Reuters, Factset and Capital IQ
Phone: +91-22-6696 5555, Fax: +91-22-6691 9576www.krchoksey.com
Research AnalystVikrant Kashyap, [email protected], +91-22-6696 5413
4.9
5.6
5.35.1
5.3
4.4
4.6
4.8
5.0
5.2
5.4
5.6
5.8
FY18 FY19 FY20 FY21 FY22
Other Expenses
(As % of sales)
60.6 59.5 60.0 60.462.8
40
45
50
55
60
65
FY18 FY19 FY20 FY21 FY22
Cost of Goods Sold
(As % of sales)
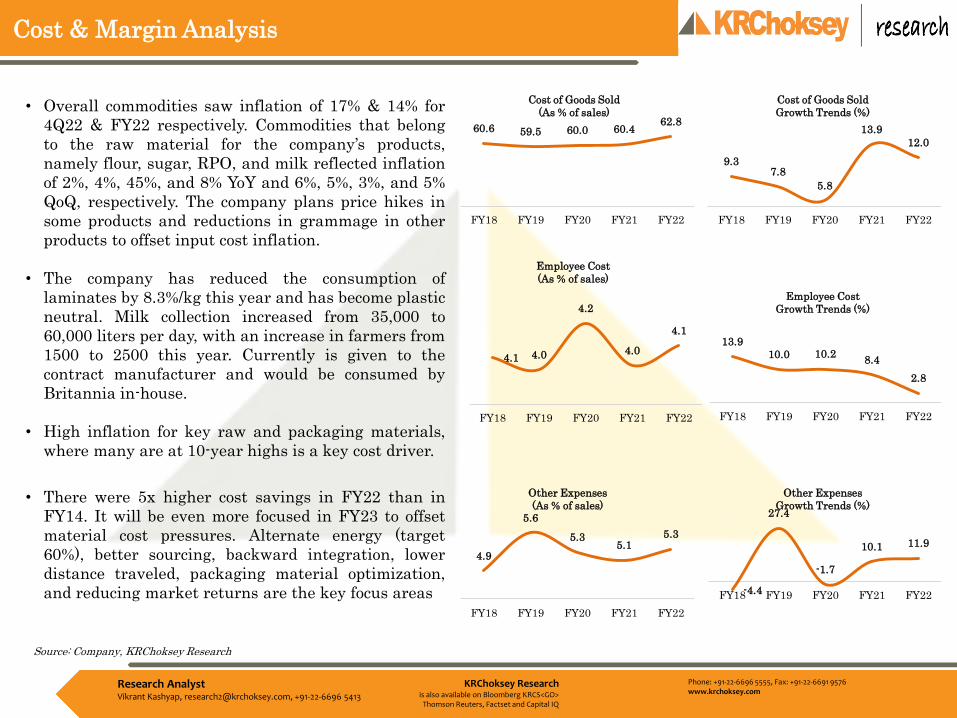
Cost & Margin Analysis
• Overall commodities saw inflation of 17% & 14% for
4Q22 & FY22 respectively. Commodities that belong
to the raw material for the company’s products,
namely flour, sugar, RPO, and milk reflected inflation
of 2%, 4%, 45%, and 8% YoY and 6%, 5%, 3%, and 5%
QoQ, respectively. The company plans price hikes in
some products and reductions in grammage in other
products to offset input cost inflation.
• The company has reduced the consumption of
laminates by 8.3%/kg this year and has become plastic
neutral. Milk collection increased from 35,000 to
60,000 liters per day, with an increase in farmers from
1500 to 2500 this year. Currently is given to the
contract manufacturer and would be consumed by
Britannia in-house.
• High inflation for key raw and packaging materials,
where many are at 10-year highs is a key cost driver.
• There were 5x higher cost savings in FY22 than in
FY14. It will be even more focused in FY23 to offset
material cost pressures. Alternate energy (target
60%), better sourcing, backward integration, lower
distance traveled, packaging material optimization,
and reducing market returns are the key focus areas
9.37.8
5.8
13.9
12.0
5
7
9
11
13
15
FY18 FY19 FY20 FY21 FY22
Cost of Goods Sold
Growth Trends (%)
13.9
10.0 10.28.4
2.8
0.000
5.000
10.000
15.000
20.000
FY18 FY19 FY20 FY21 FY22
Employee Cost
Growth Trends (%)
-4.4
27.4
-1.7
10.1 11.9
-10.00
-5.00
0.00
5.00
10.00
15.00
20.00
25.00
30.00
FY18 FY19 FY20 FY21 FY22
Other Expenses
Growth Trends (%)
4.1 4.0
4.2
4.0
4.1
3.850
3.900
3.950
4.000
4.050
4.100
4.150
4.200
4.250
FY18 FY19 FY20 FY21 FY22
Employee Cost
(As % of sales)
Source: Company, KRChoksey Research

KRChoksey Researchis also available on Bloomberg KRCS<GO>
Thomson Reuters, Factset and Capital IQ
Phone: +91-22-6696 5555, Fax: +91-22-6691 9576www.krchoksey.com
Research AnalystVikrant Kashyap, [email protected], +91-22-6696 5413
Cost & Margin Analysis
• For FY22, Gross Margin declined by 250 bps YoY on
account of an increase in input cost.
• EBITDA for FY22 stood at INR 22,015 Mn (-12.3%
YoY), with OPM at 15.6% (decline by 353 bps YoY).
• PAT for FY22 stood at INR 15,250 Mn, with a decline
of 18% YoY growth owing to lower operating profit
due to elevated input cost pressure. The profit
margin stood at 10.7% (declined by 340 bps YoY).
• EPS observed a declining trend in the past couple of
years with a decline of 18% YoY during FY22 to INR
63.5 per equity share.
9.9
17.5
3.7
12.3
0.9
0.00
2.00
4.00
6.00
8.00
10.00
12.00
14.00
16.00
18.00
20.00
FY18 FY19 FY20 FY21 FY22
Gross Profit Growth Trends (%)
17.5 15.46.3
36.1
-12.3
-20.00
-10.00
0.00
10.00
20.00
30.00
40.00
FY18 FY19 FY20 FY21 FY22
EBITDA Growth Trends (%)
10.110.5
12.0
14.1
10.7
10.00
10.50
11.00
11.50
12.00
12.50
13.00
13.50
14.00
14.50
FY18 FY19 FY20 FY21 FY22
PAT Margin Trends
(As % of sales)
13.5 15.220.5
32.8
-18.0
-30.00
-20.00
-10.00
0.00
10.00
20.00
30.00
40.00
FY18 FY19 FY20 FY21 FY22
PAT Growth Trends (%)
41.7
48.1
58.8
77.4
63.3
40.00
45.00
50.00
55.00
60.00
65.00
70.00
75.00
80.00
FY18 FY19 FY20 FY21 FY22
Earning per shares
38.440.5 40.0 39.6
37.2
21.00
26.00
31.00
36.00
41.00
46.00
FY18 FY19 FY20 FY21 FY22
Gross Margin Trends
(As % of sales)
15.1 15.7 15.919.1
15.6
0.00
5.00
10.00
15.00
20.00
25.00
FY18 FY19 FY20 FY21 FY22
EBITDA Margin Trends
(As % of sales)
Source: Company, KRChoksey Research

KRChoksey Researchis also available on Bloomberg KRCS<GO>
Thomson Reuters, Factset and Capital IQ
Phone: +91-22-6696 5555, Fax: +91-22-6691 9576www.krchoksey.com
Research AnalystVikrant Kashyap, [email protected], +91-22-6696 5413
Working Capital & Dividend Analysis
• Working capital: Britannia’s working capital
observed a sharp drop in working capital due
to a sharp drop in investments and a 25% rise
in inventory days.
• Dividend: The Board of Directors recommend
a final dividend of INR 56.50 per equity share
on face value of INR 1 each for financial year
2021-22, amounting to INR 13,609 Mn. In the
previous year, the Board of Directors declared
interim dividends of INR 83 per Equity Share
of INR 1 each at their Meeting held on 17
August 2020 and INR 62 per Equity Share of
INR 1 face value each at their Meeting held on
2 April 2021, amounting to INR 34,914 Mn.
Dividend payout ratio for 2022 stood at 89.2%
vs 187.2% for 2021, down by 9,800 bps YoY.
15.0 14.4
9.0
5.9
-1.3
-4.000
-2.000
0.000
2.000
4.000
6.000
8.000
10.000
12.000
14.000
16.000
FY18 FY19 FY20 FY21 FY22
Working Capital Trends
(As % of Sales)
24 22 23 2430
9 11 11 8 7
39
59 58 56 54
0
10
20
30
40
50
60
70
FY18 FY19 FY20 FY21 FY22
Working Capital Days
Inventory Days Receivable Days Payable Days
Particulars FY22 FY21
Special Dividend 0.0 0.0
Interim Dividend 0.0 145.0
Final Dividend 56.5 12.5
Dividend per share 56.5 157.5
YoY Growth -64.1% 350%
Total (INR Cr) 1361 3491
YoY Growth -62.3% 2.0%
Source: Company, KRChoksey Research

KRChoksey Researchis also available on Bloomberg KRCS<GO>
Thomson Reuters, Factset and Capital IQ
Phone: +91-22-6696 5555, Fax: +91-22-6691 9576www.krchoksey.com
Research AnalystVikrant Kashyap, [email protected], +91-22-6696 5413
Environment, Social, Governance Initiatives
• Britannia industry’s vision of sustainable growth is inspired by the trust of its loyal consumers and desire to
contribute positively to society and the environment. The sustainability journey has been accelerated by working
across 4 commitments related to the environment, growth, governance, and people. The Company’s efforts encompass
the entire value chain, where it actively engages with farmers, suppliers, employees, and consumers to increase
awareness about the planet.
• On governance, Britannia is looking at targeting the second or third quartile in the SMP Global DJSI in the food
production sector this year. Britannia has moved the DJSI score from 11% to 37%. Britannia is looking at moving
even further. The three ESG policies which are on sustainability, human rights, and vendor code, have got those
policies documented and they are getting entire ESG targets integrated with the Excom KPIs.
• People : The malnutrition Reduction Program run by the Britannia Nutrition Foundation aims to improve the
nutritional status and address malnutrition among children, adolescents, and women. This program has touched the
lives of more than 1,15,000 beneficiaries, resulting in the improvement of 47% of the children’s nutritional status from
severe & moderate acute malnutrition to normal.
• Dairy Former Connect Program : Company’s Dairy Farmer Connect Program continued to improve the socio-economic
farmers with the number of beneficiaries increasing from 1,250 in March 2021 to 2,500 during this financial year. The
company dairy farmers with 429 loose housings for cows over this period
• Packaging : Britannia has reduced the consumption of laminates by 8.3%/kg this year and has become plastic neutral.
Company has also been successful in reducing the consumption of 7,50,000 kgs of virgin plastic in secondary
packaging during the year which is more than twice the 3,50,000 kgs target set for the year
• Societal Initiatives : Britannia aims to positively address climate change by minimizing its environmental footprint.
Consistent with the goal of reducing the share of fossil fuel-based energy, Britannia’s use of renewable energy from
wind and solar power has increased by more than 10% over the previous year. This auger well for the attainment of
your Company’s target of sourcing 60% of its energy needs from renewable sources by 2024. On the growth pillar, they
have looked at sodium reduction and sugar reduction in their products by 6% and 8% again on track.
KRChoksey Researchis also available on Bloomberg KRCS<GO>
Thomson Reuters, Factset and Capital IQ
Phone: +91-22-6696 5555, Fax: +91-22-6691 9576www.krchoksey.com
Research AnalystVikrant Kashyap, [email protected], +91-22-6696 5413
Valuation
• Britannia has taken numerous initiatives over the years which resulted in continuous market share gain. Even with
inflationary pressure, the company has managed to grow its topline while there has been impact on margins. With
new product launches, higher traction on new channels including e-commerce, robust portfolio, and expansion of
distribution network (especially in rural markets), the company is expected to perform well in times to come. There
are near-term headwinds to profitability owing to RM headwinds which would initiate fresh price hikes that could
potentially impact volumes.
• The company has planned capex in the range of INR 6,500 Mn to INR 7,000 Mn. This would involve setting up three
plants in Uttar Pradesh, Bihar, and Tamil Nadu and expansion of Ranjangaon and Odisha plants, Commercialization
of these plants would be one of the growth catalysts.
• We assign 41.7x P/E multiple to FY24E EPS of INR 90.05 and arrive at our target price of INR 3,755 per share with
an upside potential of 10.9% from the CMP. Accordingly, we maintain a “ACCUMULATE” recommendation on the
shares of Britannia Industries.

KRChoksey Researchis also available on Bloomberg KRCS<GO>
Thomson Reuters, Factset and Capital IQ
Phone: +91-22-6696 5555, Fax: +91-22-6691 9576www.krchoksey.com
Research AnalystVikrant Kashyap, [email protected], +91-22-6696 5413
Exhibits: Quarterly Income Statement
Source: Company, KRChoksey Research
Particulars (INR Mn) Q4FY22 Q3FY22 Q4FY21 QoQ YoY FY22 FY21 YoY
Sales 35,505 35,750 31,308 -0.7% 13.4% 1,41,363 1,31,361 7.6%
Total Expenditure 30,008 30,353 26,254 -1.1% 14.3% 1,19,348 1,06,269 12.3%
Cost of Raw Materials 18,587 18,183 15,324 2.2% 21.3% 74,740 65,023 14.9%
Changes in Inventories -72 -117 260 -38.5% -127.6% -753 -371 102.7%
Other Expenses 6,795 6,878 6,375 -1.2% 6.6% 26,322 24,734 6.4%
EBITDA 5,497 5,397 5,054 1.8% 8.8% 22,015 25,093 -12.3%
EBITDA Margins (%) 15.5% 15.1% 16.1% 38 bps -66 bps 15.6% 19.1% -353 bps
Depreciation 509 504 528 1.1% -3.6% 2,005 1,979 1.4%
EBIT 4,988 4,893 4,526 1.9% 10.2% 20,010 23,114 -13.4%
Interest Expense 338 374 237 -9.7% 42.5% 1,443 1,109 30.1%
Other income 538 551 632 -2.4% -14.8% 2,228 3,129 -28.8%
PBT 5,179 5,071 4,921 2.1% 5.2% 20,785 25,128 -17.3%
Tax 1,410 1,362 1,326 3% 6.3% 5,624 6,630 -15.2%
Minority income -19 -20 -43 -4.0% -54.8% -88 -133 -33.6%
PAT 3,788 3,729 3,637 1.6% 4.1% 15,250 18,631 -18.1%
PAT Margin 10.7% 10.4% 11.6% 24 bps -95 bps 10.8% 14.2% -340 bps
EPS 15.8 15.4 15.1 2.3% 4.2% 63.3 77.4 -18.2%

KRChoksey Researchis also available on Bloomberg KRCS<GO>
Thomson Reuters, Factset and Capital IQ
Phone: +91-22-6696 5555, Fax: +91-22-6691 9576www.krchoksey.com
Research AnalystVikrant Kashyap, [email protected], +91-22-6696 5413
Exhibits: Income Statement
Source: Company, KRChoksey Research
INR Mn FY20 FY21 FY22 FY23E FY24E
Revenues 1,15,996 1,31,361 1,41,363 1,56,522 1,72,174
COGS 69,275 76,261 87,603 95,087 1,01,927
Gross profit 46,721 55,101 53,760 61,435 70,247
Employee cost 4,867 5,274 5,423 6,261 6,543
Other expenses 23,422 24,734 26,322 28,957 32,713
EBITDA 18,432 25,093 22,015 26,217 30,991
EBITDA Margin 15.9% 19.1% 15.6% 16.8% 18.0%
Depreciation & amortization 1,848 1,979 2,005 2,494 2,743
EBIT 16,584 23,114 20,010 23,724 28,248
Interest expense 769 1,109 1,443 1,943 1,943
PBT 18,439 25,134 20,785 23,858 28,795
Tax 4,507 6,630 5,624 5,965 7,199
Minority interest -90 -133 -88 -88 -90
PAT 14,026 18,653 15,250 17,988 21,692
Adj. PAT 14,196 18,653 15,260 17,998 21,702
EPS (INR) 58.32 77.43 63.30 74.67 90.05
Adj. EPS 59.03 77.43 63.34 74.71 90.09
KRChoksey Researchis also available on Bloomberg KRCS<GO>
Thomson Reuters, Factset and Capital IQ
Phone: +91-22-6696 5555, Fax: +91-22-6691 9576www.krchoksey.com
Research AnalystVikrant Kashyap, [email protected], +91-22-6696 5413
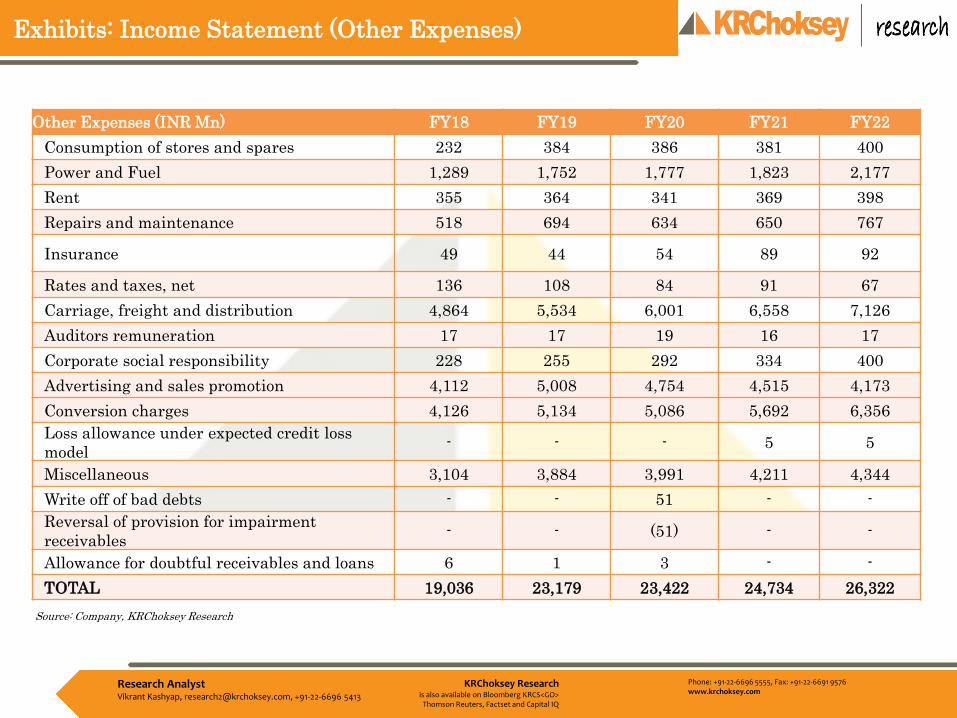
Exhibits: Income Statement (Other Expenses)
Source: Company, KRChoksey Research
Other Expenses (INR Mn) FY18 FY19 FY20 FY21 FY22
Consumption of stores and spares 232 384 386 381 400
Power and Fuel 1,289 1,752 1,777 1,823 2,177
Rent 355 364 341 369 398
Repairs and maintenance 518 694 634 650 767
Insurance 49 44 54 89 92
Rates and taxes, net 136 108 84 91 67
Carriage, freight and distribution 4,864 5,534 6,001 6,558 7,126
Auditors remuneration 17 17 19 16 17
Corporate social responsibility 228 255 292 334 400
Advertising and sales promotion 4,112 5,008 4,754 4,515 4,173
Conversion charges 4,126 5,134 5,086 5,692 6,356
Loss allowance under expected credit loss
model- - - 5 5
Miscellaneous 3,104 3,884 3,991 4,211 4,344
Write off of bad debts - - 51 - -
Reversal of provision for impairment
receivables- - (51) - -
Allowance for doubtful receivables and loans 6 1 3 - -
TOTAL 19,036 23,179 23,422 24,734 26,322
Source: Company, KRChoksey Research
KRChoksey Researchis also available on Bloomberg KRCS<GO>
Thomson Reuters, Factset and Capital IQ
Phone: +91-22-6696 5555, Fax: +91-22-6691 9576www.krchoksey.com
Research AnalystVikrant Kashyap, [email protected], +91-22-6696 5413
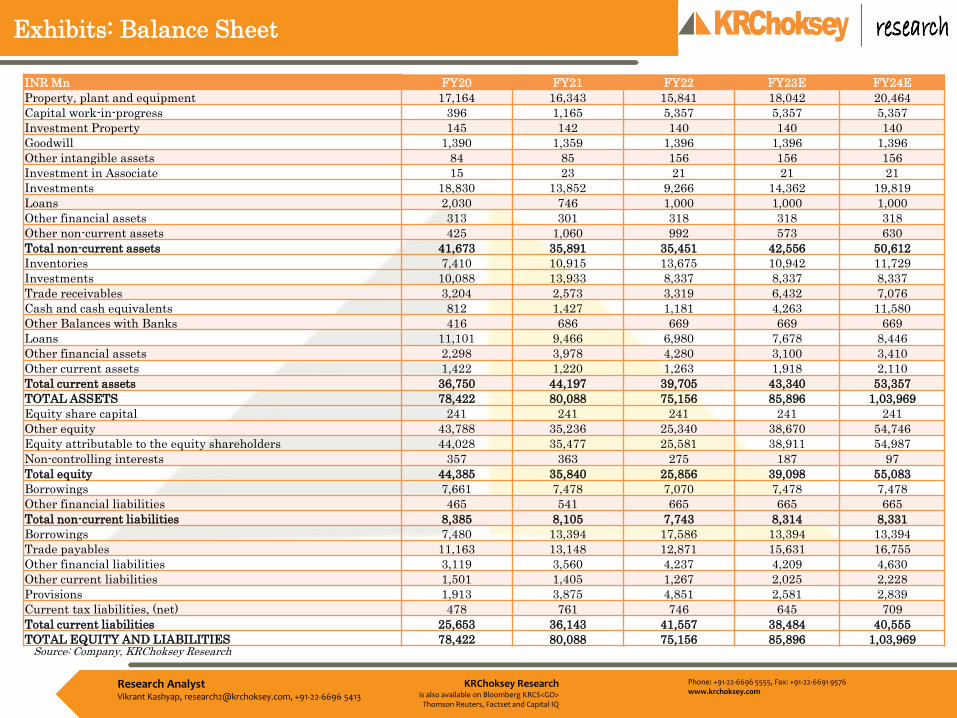
Exhibits: Balance Sheet
Source: Company, KRChoksey Research
INR Mn FY20 FY21 FY22 FY23E FY24E
Property, plant and equipment 17,164 16,343 15,841 18,042 20,464
Capital work-in-progress 396 1,165 5,357 5,357 5,357
Investment Property 145 142 140 140 140
Goodwill 1,390 1,359 1,396 1,396 1,396
Other intangible assets 84 85 156 156 156
Investment in Associate 15 23 21 21 21
Investments 18,830 13,852 9,266 14,362 19,819
Loans 2,030 746 1,000 1,000 1,000
Other financial assets 313 301 318 318 318
Other non-current assets 425 1,060 992 573 630
Total non-current assets 41,673 35,891 35,451 42,556 50,612
Inventories 7,410 10,915 13,675 10,942 11,729
Investments 10,088 13,933 8,337 8,337 8,337
Trade receivables 3,204 2,573 3,319 6,432 7,076
Cash and cash equivalents 812 1,427 1,181 4,263 11,580
Other Balances with Banks 416 686 669 669 669
Loans 11,101 9,466 6,980 7,678 8,446
Other financial assets 2,298 3,978 4,280 3,100 3,410
Other current assets 1,422 1,220 1,263 1,918 2,110
Total current assets 36,750 44,197 39,705 43,340 53,357
TOTAL ASSETS 78,422 80,088 75,156 85,896 1,03,969
Equity share capital 241 241 241 241 241
Other equity 43,788 35,236 25,340 38,670 54,746
Equity attributable to the equity shareholders 44,028 35,477 25,581 38,911 54,987
Non-controlling interests 357 363 275 187 97
Total equity 44,385 35,840 25,856 39,098 55,083
Borrowings 7,661 7,478 7,070 7,478 7,478
Other financial liabilities 465 541 665 665 665
Total non-current liabilities 8,385 8,105 7,743 8,314 8,331
Borrowings 7,480 13,394 17,586 13,394 13,394
Trade payables 11,163 13,148 12,871 15,631 16,755
Other financial liabilities 3,119 3,560 4,237 4,209 4,630
Other current liabilities 1,501 1,405 1,267 2,025 2,228
Provisions 1,913 3,875 4,851 2,581 2,839
Current tax liabilities, (net) 478 761 746 645 709
Total current liabilities 25,653 36,143 41,557 38,484 40,555
TOTAL EQUITY AND LIABILITIES 78,422 80,088 75,156 85,896 1,03,969
KRChoksey Researchis also available on Bloomberg KRCS<GO>
Thomson Reuters, Factset and Capital IQ
Phone: +91-22-6696 5555, Fax: +91-22-6691 9576www.krchoksey.com
Research AnalystVikrant Kashyap, [email protected], +91-22-6696 5413
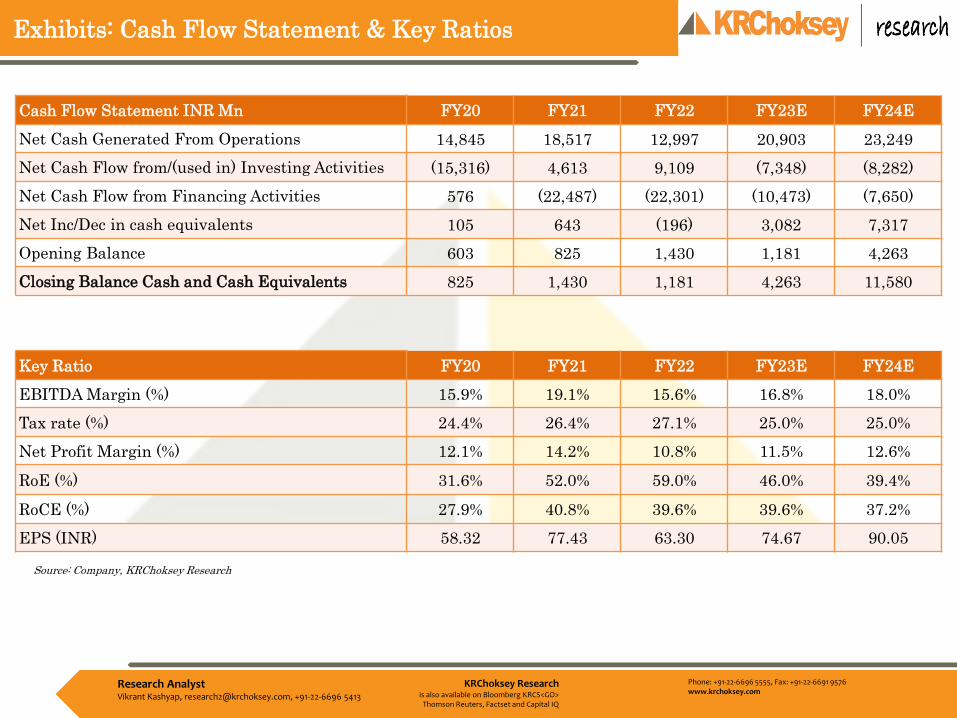
Exhibits: Cash Flow Statement & Key Ratios
Cash Flow Statement INR Mn FY20 FY21 FY22 FY23E FY24E
Net Cash Generated From Operations 14,845 18,517 12,997 20,903 23,249
Net Cash Flow from/(used in) Investing Activities (15,316) 4,613 9,109 (7,348) (8,282)
Net Cash Flow from Financing Activities 576 (22,487) (22,301) (10,473) (7,650)
Net Inc/Dec in cash equivalents 105 643 (196) 3,082 7,317
Opening Balance 603 825 1,430 1,181 4,263
Closing Balance Cash and Cash Equivalents 825 1,430 1,181 4,263 11,580
Key Ratio FY20 FY21 FY22 FY23E FY24E
EBITDA Margin (%) 15.9% 19.1% 15.6% 16.8% 18.0%
Tax rate (%) 24.4% 26.4% 27.1% 25.0% 25.0%
Net Profit Margin (%) 12.1% 14.2% 10.8% 11.5% 12.6%
RoE (%) 31.6% 52.0% 59.0% 46.0% 39.4%
RoCE (%) 27.9% 40.8% 39.6% 39.6% 37.2%
EPS (INR) 58.32 77.43 63.30 74.67 90.05
Source: Company, KRChoksey Research

KRChoksey Researchis also available on Bloomberg KRCS<GO>
Thomson Reuters, Factset and Capital IQ
Phone: +91-22-6696 5555, Fax: +91-22-6691 9576www.krchoksey.com
Research AnalystVikrant Kashyap, [email protected], +91-22-6696 5413
Please send your feedback to [email protected] us at www.krchoksey.com
KR Choksey Shares and Securities Pvt. LtdRegistered Office:
1102, Stock Exchange Tower, Dalal Street, Fort, Mumbai – 400 001.Phone: +91-22-6633 5000; Fax: +91-22-6633 8060.
Corporate Office: ABHISHEK, 5th Floor, Link Road, Andheri (W), Mumbai – 400 053.
Phone: +91-22-6696 5555; Fax: +91-22-6691 9576.
ANALYST CERTIFICATION:
I, Vikrant Kashyap (PGDBM Finance & IT), Research Analyst, author and the name subscribed to this report, hereby certify that all of the views expressed in this research report accurately reflect my views about the subject issuer(s) or securities. I also certify that no part ofour compensation was, is, or will be directly or indirectly related to the specific recommendation(s) or view(s) in this report.
Terms & Conditions and other disclosures:
KRChoksey Shares and Securities Pvt. Ltd (hereinafter referred to as KRCSSPL) is a registered member of National Stock Exchange of India Limited and Bombay Stock Exchange Limited. KRCSSPL is a registered Research Entity vides SEBI Registration No. INH000001295under SEBI (Research Analyst) Regulations, 2014.
We submit that no material disciplinary action has been taken on KRCSSPL and its associates (Group Companies) by any Regulatory Authority impacting Equity Research Analysis activities.
KRCSSPL prohibits its analysts, persons reporting to analysts and their relatives from maintaining a financial interest in the securities or derivatives of any companies that the analyst covers.
The information and opinions in this report have been prepared by KRCSSPL and are subject to change without any notice. The report and information contained herein is strictly confidential and meant solely for the selected recipient and may not be altered in any way,transmitted to, copied or distributed, in part or in whole, to any other person or to the media or reproduced in any form, without prior written consent of KRCSSPL. While we would endeavor to update the information herein on a reasonable basis, KRCSSPL is not under anyobligation to update the information. Also, there may be regulatory, compliance or other reasons that may prevent KRCSSPL from doing so. Non-rated securities indicate that rating on a particular security has been suspended temporarily and such suspension is incompliance with applicable regulations and/or KRCSSPL policies, in circumstances where KRCSSPL might be acting in an advisory capacity to this company, or in certain other circumstances.
This report is based on information obtained from public sources and sources believed to be reliable, but no independent verification has been made nor is its accuracy or completeness guaranteed. This report and information herein is solely for informational purpose andshall not be used or considered as an offer document or solicitation of offer to buy or sell or subscribe for securities or other financial instruments. Though disseminated to all the customers simultaneously, not all customers may receive this report at the same time.KRCSSPL will not treat recipients as customers by virtue of their receiving this report. Nothing in this report constitutes investment, legal, accounting and tax advice or a representation that any investment or strategy is suitable or appropriate to your specific circumstances.The securities discussed and opinions expressed in this report may not be suitable for all investors, who must make their own investment decisions, based on their own investment objectives, financial positions and needs of specific recipient. This may not be taken insubstitution for the exercise of independent judgment by any recipient. The recipient should independently evaluate the investment risks. The value and return on investment may vary because of changes in interest rates, foreign exchange rates or any other reason.KRCSSPL accepts no liabilities whatsoever for any loss or damage of any kind arising out of the use of this report. Past performance is not necessarily a guide to future performance. Investors are advised to see Risk Disclosure Document to understand the risks associatedbefore investing in the securities markets. Actual results may differ materially from those set forth in projections. Forward-looking statements are not predictions and may be subject to change without notice. Our employees in sales and marketing team, dealers and otherprofessionals may provide oral or written market commentary or trading strategies that reflect opinions that are contrary to the opinions expressed herein, .In reviewing these materials, you should be aware that any or all of the foregoing, among other things, may giverise to real or potential conflicts of interest.
Associates (Group Companies) of KRCSSPL might have received any commission/compensation from the companies mentioned in the report during the period preceding twelve months from the date of this report for services in respect of brokerage services or specifictransaction or for products and services other than brokerage services.
KRCSSPL or its Associates (Group Companies) have not managed or co-managed public offering of securities for the subject company in the past twelve months.
KRCSSPL encourages the practice of giving independent opinion in research report preparation by the analyst and thus strives to minimize the conflict in preparation of research report. KRCSSPL or its analysts did not receive any compensation or other benefits from thecompanies mentioned in the report or third party in connection with preparation of the research report. Accordingly, neither KRCSSPL nor Research Analysts have any material conflict of interest at the time of publication of this report.
It is confirmed that, Vikrant Kashyap (PGDBM Finance & IT), Research Analyst, of this report have not received any compensation from the companies mentioned in the report in the preceding twelve months. Compensation of our Research Analysts is not based on anyspecific brokerage service transactions.
KRCSSPL or its associates (Group Companies) collectively or its research analyst do not hold any financial interest/beneficial ownership of more than 1% (at the end of the month immediately preceding the date of publication of the research report) in the company coveredby Analyst, and has not been engaged in market making activity of the company covered by research analyst.
It is confirmed that, Vikrant Kashyap (PGDBM Finance & IT), Research Analyst , do not serve as an officer, director or employee of the companies mentioned in the report.
This report is not directed or intended for distribution to, or use by, any person or entity who is a citizen or resident of or located in any locality, state, country or other Jurisdiction, where such distribution, publication, availability or use would be contrary to law, regulationor which would subject KRCSSPL and affiliates to any registration or licensing requirement within such jurisdiction. The securities described herein may or may not be eligible for sale in all jurisdictions or to certain category of investors. Persons in whose possession thisdocument may come are required to inform them of and to observe such restriction.
DISCLAIMER