Embed Size (px)
Citation preview
Britannia Industries-Investment Note
Page 1
Contents Basics about the business ............................................................................................................................. 2
How does it make money?............................................................................................................................ 2
What are the numbers telling us? ................................................................................................................ 4
Why has there been a positive change in the trends? ................................................................................. 7
Does the company have competitive advantages? ...................................................................................... 7
What could be the competitive advantages? ............................................................................................... 8
Are the advantages sustainable? ................................................................................................................ 10
What is the dynamics of the industry in which it operates? ...................................................................... 11
What is the scope for future growth?......................................................................................................... 12
What are the risks to the business model? ................................................................................................ 13
How is the quality of Management? ........................................................................................................... 13
How is the market viewing the opportunity? ............................................................................................. 14
Britannia Industries-Investment Note
Page 2
Basics about the business Britannia, part of the Wadia group, is a major player in the Indian food market (the snack segment) with a
strong position in the domestic biscuit segment and a good presence in the other bakery products & dairy
segment
It began its operations since 1892
It is present across Pan-India, with its products and distribution network, and also exports some products to
other countries
Over the past financial year, it had revenues worth INR 7200 crore and PAT of INR 800 crore in FY15
How does it make money? It procures agricultural commodities-wheat primarily
Processes them to make snacks-mainly biscuits & baked items-Manufacturing facilities and R&D capabilities
Sells them as brands-Distribution Network and Promotional activities
Manufacturing Facilities
It has manufacturing facilities in West Bengal (Kolkata), New Delhi, Tamil Nadu (Chennai),
Maharashtra (Mumbai), Uttarakhand, Odisha and Bihar with an annual capacity of 8 lakh tonne.
It has recently established a bakery at Jhagadia in Gujarat and is also planning to set up a plant
each in Tamil Nadu and Karnataka (Bangalore)
R&D Center
Britannia has built R&D culture and invests heavily in its capabilities.
It will currently invest INR 900 crore new manufacturing, research and development (R&D) facilities
over a time period of two years
Its R&D capabilities have helped it build and strengthen brands
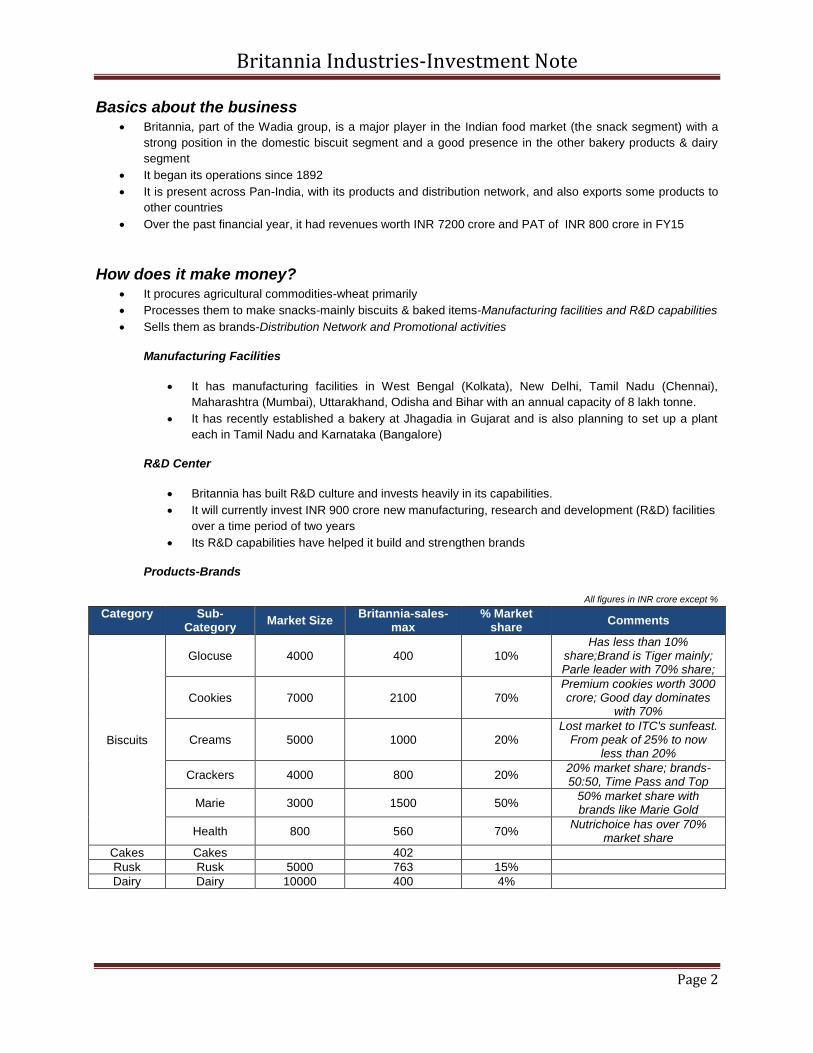
Products-Brands
All figures in INR crore except %
Category Sub-Category
Market Size Britannia-sales-
max % Market
share Comments
Biscuits
Glocuse 4000 400 10% Has less than 10%
share;Brand is Tiger mainly; Parle leader with 70% share;
Cookies 7000 2100 70% Premium cookies worth 3000 crore; Good day dominates
with 70%
Creams 5000 1000 20% Lost market to ITC's sunfeast.
From peak of 25% to now less than 20%
Crackers 4000 800 20% 20% market share; brands-50:50, Time Pass and Top
Marie 3000 1500 50% 50% market share with brands like Marie Gold
Health 800 560 70% Nutrichoice has over 70%
market share
Cakes Cakes 402
Rusk Rusk 5000 763 15%
Dairy Dairy 10000 400 4%
Britannia Industries-Investment Note
Page 3
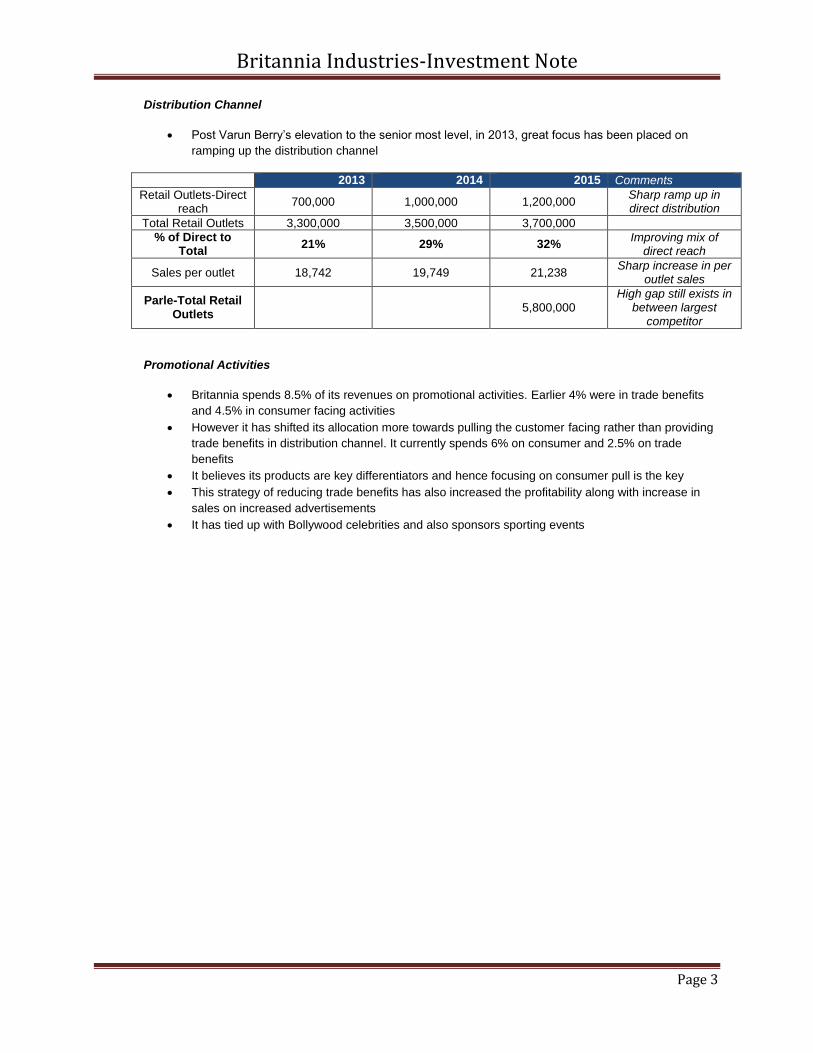
Distribution Channel
Post Varun Berry’s elevation to the senior most level, in 2013, great focus has been placed on
ramping up the distribution channel
2013 2014 2015 Comments
Retail Outlets-Direct reach
700,000 1,000,000 1,200,000 Sharp ramp up in direct distribution
Total Retail Outlets 3,300,000 3,500,000 3,700,000
% of Direct to Total
21% 29% 32% Improving mix of
direct reach
Sales per outlet 18,742 19,749 21,238 Sharp increase in per
outlet sales
Parle-Total Retail Outlets
5,800,000 High gap still exists in
between largest competitor
Promotional Activities
Britannia spends 8.5% of its revenues on promotional activities. Earlier 4% were in trade benefits
and 4.5% in consumer facing activities
However it has shifted its allocation more towards pulling the customer facing rather than providing
trade benefits in distribution channel. It currently spends 6% on consumer and 2.5% on trade
benefits
It believes its products are key differentiators and hence focusing on consumer pull is the key
This strategy of reducing trade benefits has also increased the profitability along with increase in
sales on increased advertisements
It has tied up with Bollywood celebrities and also sponsors sporting events
Britannia Industries-Investment Note
Page 4
What are the numbers telling us?
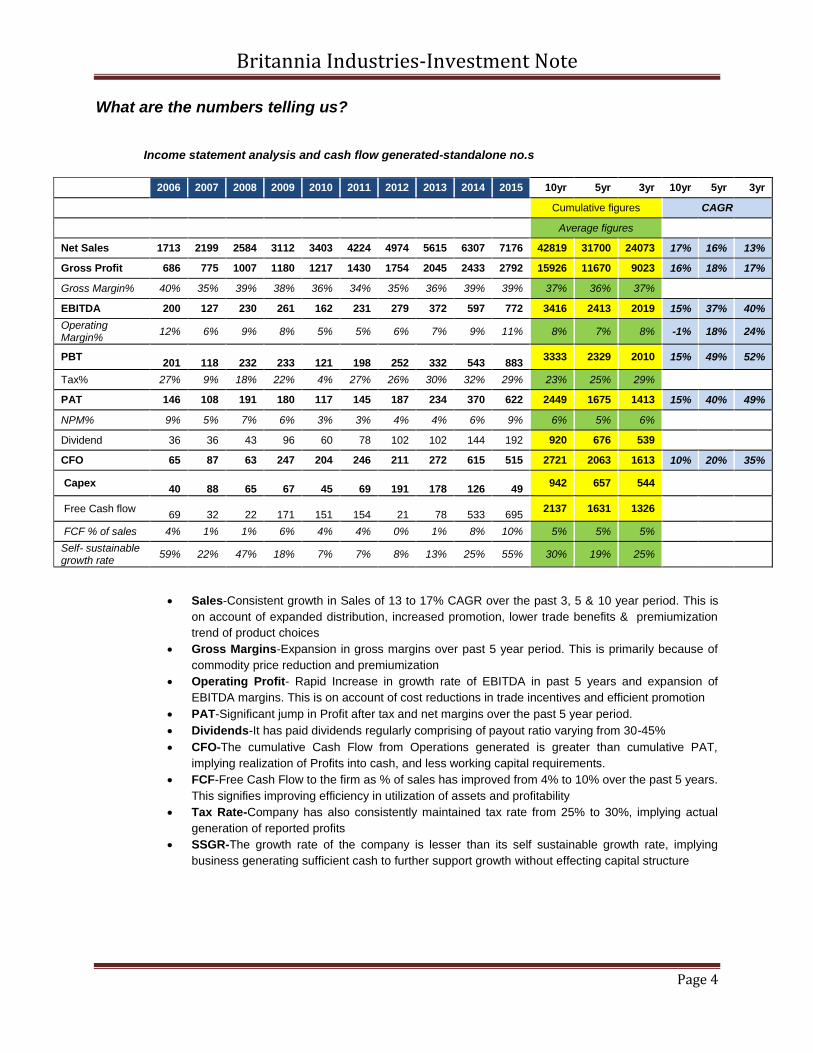
Income statement analysis and cash flow generated-standalone no.s
2006 2007 2008 2009 2010 2011 2012 2013 2014 2015 10yr 5yr 3yr 10yr 5yr 3yr
Cumulative figures CAGR
Average figures
Net Sales 1713 2199 2584 3112 3403 4224 4974 5615 6307 7176 42819 31700 24073 17% 16% 13%
Gross Profit 686 775 1007 1180 1217 1430 1754 2045 2433 2792 15926 11670 9023 16% 18% 17%
Gross Margin% 40% 35% 39% 38% 36% 34% 35% 36% 39% 39% 37% 36% 37%
EBITDA 200 127 230 261 162 231 279 372 597 772 3416 2413 2019 15% 37% 40%
Operating Margin%
12% 6% 9% 8% 5% 5% 6% 7% 9% 11% 8% 7% 8% -1% 18% 24%
PBT
201
118
232
233
121
198
252
332
543
883 3333 2329 2010 15% 49% 52%
Tax% 27% 9% 18% 22% 4% 27% 26% 30% 32% 29% 23% 25% 29%
PAT 146 108 191 180 117 145 187 234 370 622 2449 1675 1413 15% 40% 49%
NPM% 9% 5% 7% 6% 3% 3% 4% 4% 6% 9% 6% 5% 6%
Dividend 36 36 43 96 60 78 102 102 144 192 920 676 539
CFO 65 87 63 247 204 246 211 272 615 515 2721 2063 1613 10% 20% 35%
Capex
40
88
65
67
45
69
191
178
126
49 942 657 544
Free Cash flow
69
32
22
171
151
154
21
78
533
695 2137 1631 1326
FCF % of sales 4% 1% 1% 6% 4% 4% 0% 1% 8% 10% 5% 5% 5%
Self- sustainable growth rate
59% 22% 47% 18% 7% 7% 8% 13% 25% 55% 30% 19% 25%
Sales-Consistent growth in Sales of 13 to 17% CAGR over the past 3, 5 & 10 year period. This is
on account of expanded distribution, increased promotion, lower trade benefits & premiumization
trend of product choices
Gross Margins-Expansion in gross margins over past 5 year period. This is primarily because of
commodity price reduction and premiumization
Operating Profit- Rapid Increase in growth rate of EBITDA in past 5 years and expansion of
EBITDA margins. This is on account of cost reductions in trade incentives and efficient promotion
PAT-Significant jump in Profit after tax and net margins over the past 5 year period.
Dividends-It has paid dividends regularly comprising of payout ratio varying from 30-45%
CFO-The cumulative Cash Flow from Operations generated is greater than cumulative PAT,
implying realization of Profits into cash, and less working capital requirements.
FCF-Free Cash Flow to the firm as % of sales has improved from 4% to 10% over the past 5 years.
This signifies improving efficiency in utilization of assets and profitability
Tax Rate-Company has also consistently maintained tax rate from 25% to 30%, implying actual
generation of reported profits
SSGR-The growth rate of the company is lesser than its self sustainable growth rate, implying
business generating sufficient cash to further support growth without effecting capital structure
Britannia Industries-Investment Note
Page 5
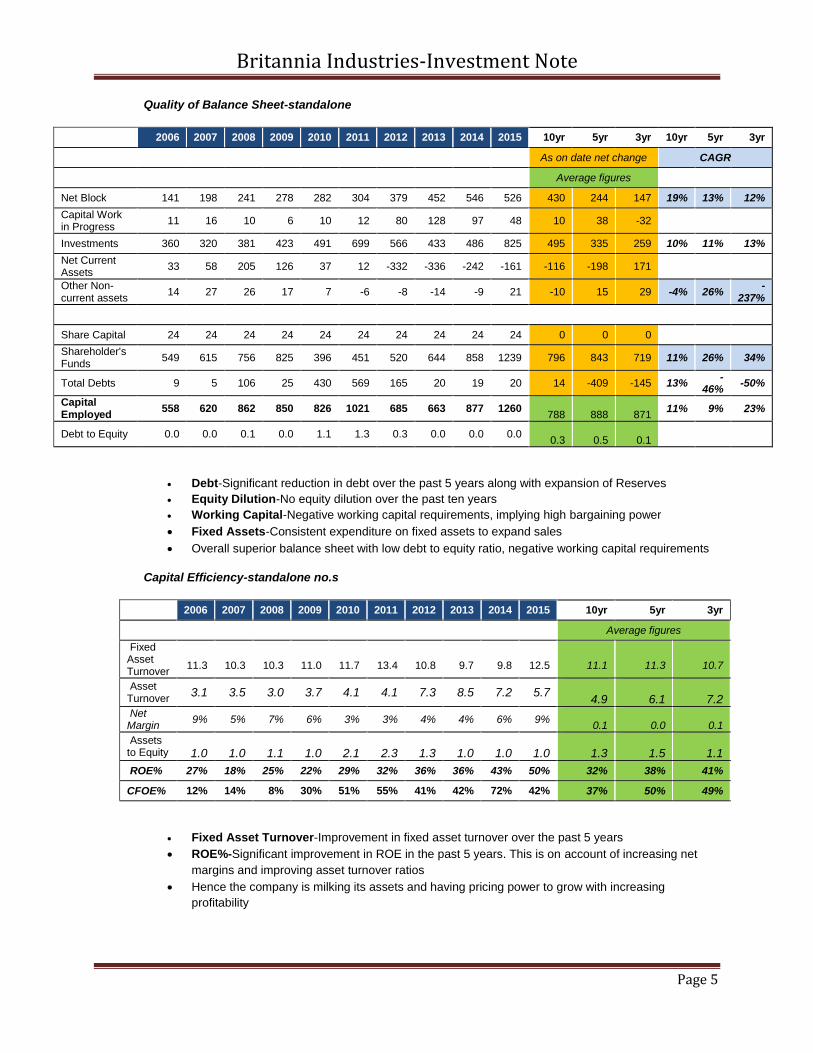
Quality of Balance Sheet-standalone
2006 2007 2008 2009 2010 2011 2012 2013 2014 2015 10yr 5yr 3yr 10yr 5yr 3yr
As on date net change CAGR
Average figures
Net Block 141 198 241 278 282 304 379 452 546 526 430 244 147 19% 13% 12%
Capital Work in Progress
11 16 10 6 10 12 80 128 97 48 10 38 -32
Investments 360 320 381 423 491 699 566 433 486 825 495 335 259 10% 11% 13%
Net Current Assets
33 58 205 126 37 12 -332 -336 -242 -161 -116 -198 171
Other Non-current assets
14 27 26 17 7 -6 -8 -14 -9 21 -10 15 29 -4% 26% -
237%
Share Capital 24 24 24 24 24 24 24 24 24 24 0 0 0
Shareholder's Funds
549 615 756 825 396 451 520 644 858 1239 796 843 719 11% 26% 34%
Total Debts 9 5 106 25 430 569 165 20 19 20 14 -409 -145 13% -
46% -50%
Capital Employed
558 620 862 850 826 1021 685 663 877 1260
788
888
871 11% 9% 23%
Debt to Equity 0.0 0.0 0.1 0.0 1.1 1.3 0.3 0.0 0.0 0.0
0.3
0.5
0.1
Debt-Significant reduction in debt over the past 5 years along with expansion of Reserves
Equity Dilution-No equity dilution over the past ten years
Working Capital-Negative working capital requirements, implying high bargaining power
Fixed Assets-Consistent expenditure on fixed assets to expand sales
Overall superior balance sheet with low debt to equity ratio, negative working capital requirements
Capital Efficiency-standalone no.s
2006 2007 2008 2009 2010 2011 2012 2013 2014 2015 10yr 5yr 3yr
Average figures
Fixed Asset Turnover
11.3
10.3
10.3
11.0
11.7
13.4
10.8
9.7
9.8
12.5
11.1
11.3
10.7
Asset Turnover
3.1 3.5 3.0 3.7 4.1 4.1 7.3 8.5 7.2 5.7
4.9
6.1
7.2 Net Margin
9% 5% 7% 6% 3% 3% 4% 4% 6% 9%
0.1
0.0
0.1
Assets to Equity
1.0
1.0
1.1
1.0
2.1
2.3
1.3
1.0
1.0
1.0
1.3
1.5
1.1
ROE% 27% 18% 25% 22% 29% 32% 36% 36% 43% 50% 32% 38% 41%
CFOE% 12% 14% 8% 30% 51% 55% 41% 42% 72% 42% 37% 50% 49%
Fixed Asset Turnover-Improvement in fixed asset turnover over the past 5 years
ROE%-Significant improvement in ROE in the past 5 years. This is on account of increasing net
margins and improving asset turnover ratios
Hence the company is milking its assets and having pricing power to grow with increasing
profitability
Britannia Industries-Investment Note
Page 6
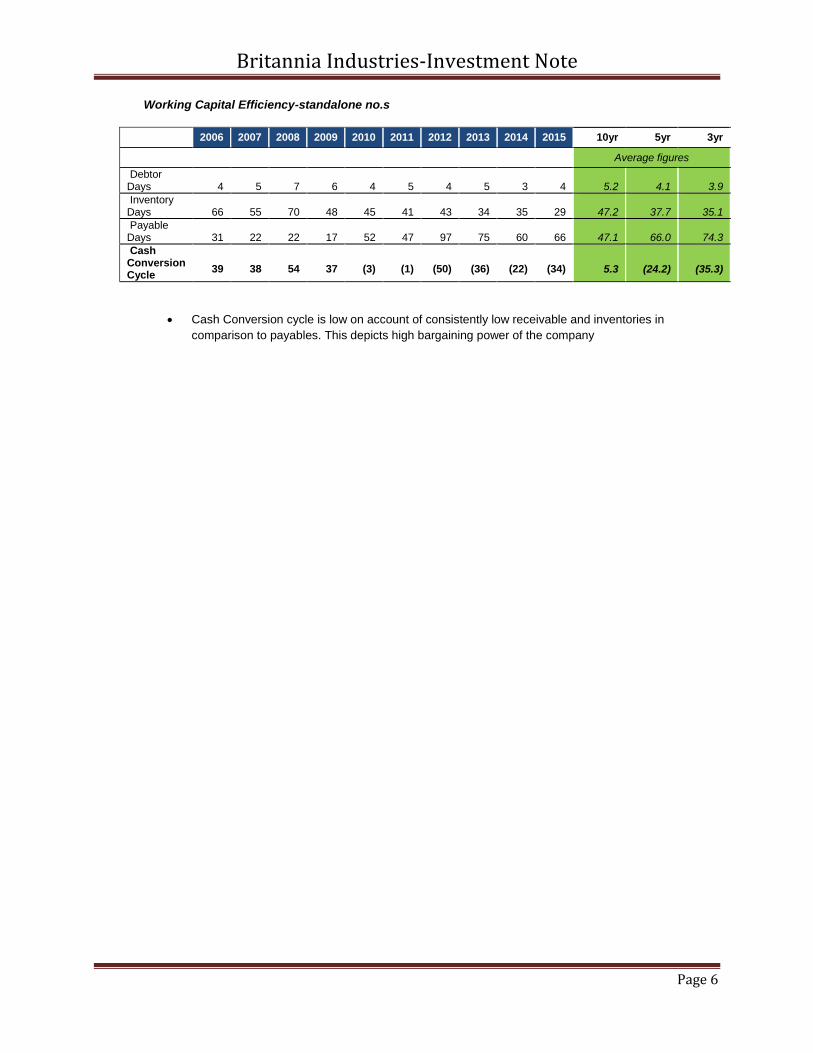
Working Capital Efficiency-standalone no.s
2006 2007 2008 2009 2010 2011 2012 2013 2014 2015 10yr 5yr 3yr
Average figures
Debtor Days
4
5
7
6
4
5
4
5
3
4
5.2
4.1
3.9
Inventory Days
66
55
70
48
45
41
43
34
35
29
47.2
37.7
35.1
Payable Days
31
22
22
17
52
47
97
75
60
66
47.1
66.0
74.3
Cash Conversion Cycle
39
38
54
37
(3)
(1)
(50)
(36)
(22)
(34)
5.3
(24.2)
(35.3)
Cash Conversion cycle is low on account of consistently low receivable and inventories in
comparison to payables. This depicts high bargaining power of the company
Britannia Industries-Investment Note
Page 7
Why has there been a positive change in the trends?
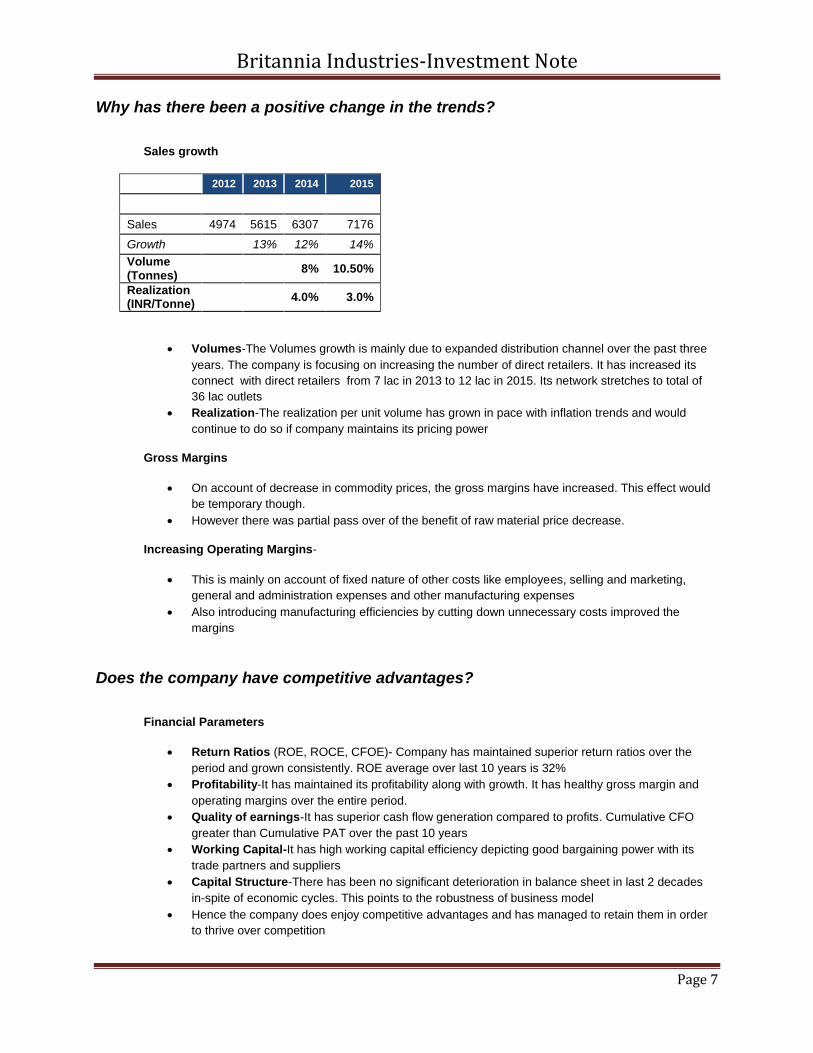
Sales growth
2012 2013 2014 2015
Sales 4974 5615 6307 7176
Growth 13% 12% 14%
Volume (Tonnes)
8% 10.50%
Realization (INR/Tonne)
4.0% 3.0%
Volumes-The Volumes growth is mainly due to expanded distribution channel over the past three
years. The company is focusing on increasing the number of direct retailers. It has increased its
connect with direct retailers from 7 lac in 2013 to 12 lac in 2015. Its network stretches to total of
36 lac outlets
Realization-The realization per unit volume has grown in pace with inflation trends and would
continue to do so if company maintains its pricing power
Gross Margins
On account of decrease in commodity prices, the gross margins have increased. This effect would
be temporary though.
However there was partial pass over of the benefit of raw material price decrease.
Increasing Operating Margins-
This is mainly on account of fixed nature of other costs like employees, selling and marketing,
general and administration expenses and other manufacturing expenses
Also introducing manufacturing efficiencies by cutting down unnecessary costs improved the
margins
Does the company have competitive advantages?
Financial Parameters
Return Ratios (ROE, ROCE, CFOE)- Company has maintained superior return ratios over the
period and grown consistently. ROE average over last 10 years is 32%
Profitability-It has maintained its profitability along with growth. It has healthy gross margin and
operating margins over the entire period.
Quality of earnings-It has superior cash flow generation compared to profits. Cumulative CFO
greater than Cumulative PAT over the past 10 years
Working Capital-It has high working capital efficiency depicting good bargaining power with its
trade partners and suppliers
Capital Structure-There has been no significant deterioration in balance sheet in last 2 decades
in-spite of economic cycles. This points to the robustness of business model
Hence the company does enjoy competitive advantages and has managed to retain them in order
to thrive over competition
Britannia Industries-Investment Note
Page 8
What could be the competitive advantages? R&D Capabilities
Britannia has imbibed the innovation culture anchored by its robust R&D capabilities, which has
helped it successfully launch a slew of new and innovative products over the past 2 years. To
further bolster its innovation drive, the company is investing INR650mn in another R&D centre in
Bengaluru. Moreover, Britannia is also targeting the less penetrated, higher margins and low
competition above INR200/kg category, which should lend further fillip to growth.
As a result, Britannia has been able to successfully launch many new products in past few years
such as Good Day Chunkies, Nutri Choice Heavens, Britannia Cakes, Chunk Cakes, Nut & Raisin
Romance, etc.
The company has also relaunched its power brand, Good Day (it has 7 power brands: Tiger, Good
Day, Marie, Milk Bikis, 50 50, Treat and Nutri Choice)
Overall R&D expenditure, as a percentage of sales, has been on the rise having increased from
0.12% in FY12 to 0.21% in FY15. Also, by Q4FY16, Britannia’s new R&D centre in Bengaluru is
expected to be ready.
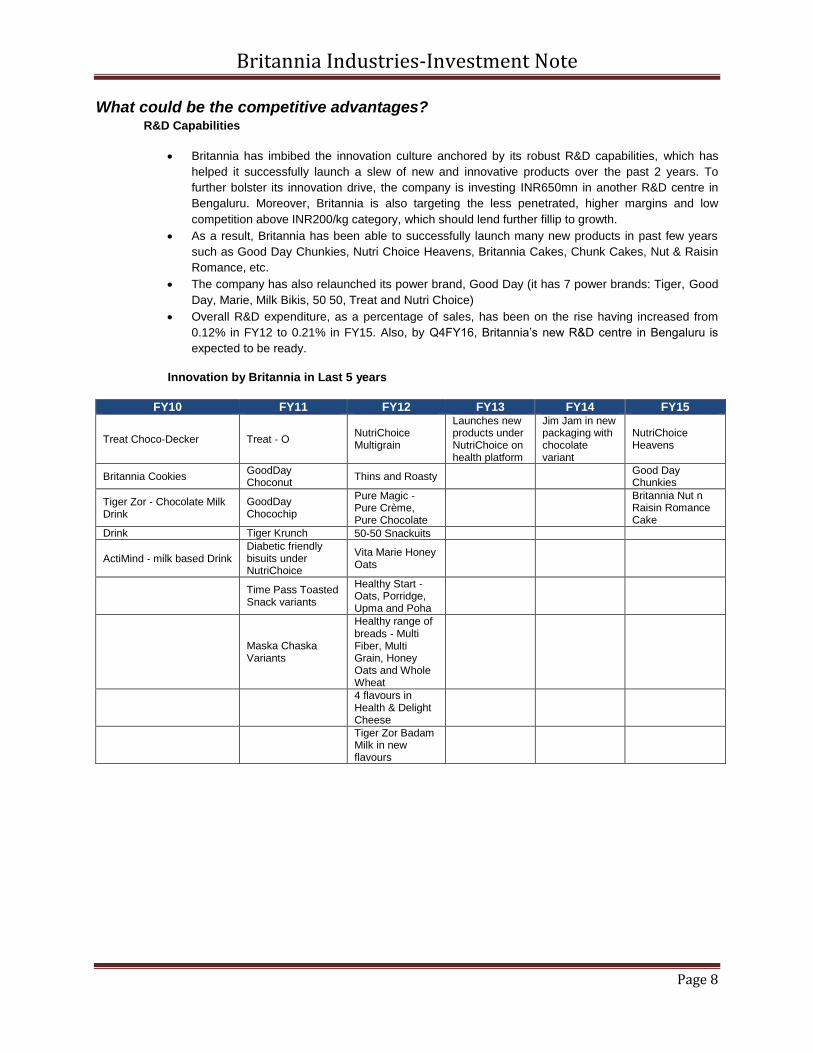
Innovation by Britannia in Last 5 years
FY10 FY11 FY12 FY13 FY14 FY15
Treat Choco‐Decker Treat ‐ O NutriChoice Multigrain
Launches new products under NutriChoice on health platform
Jim Jam in new packaging with chocolate variant
NutriChoice Heavens
Britannia Cookies GoodDay Choconut
Thins and Roasty Good Day Chunkies
Tiger Zor ‐ Chocolate Milk Drink
GoodDay Chocochip
Pure Magic ‐ Pure Crème, Pure Chocolate
Britannia Nut n Raisin Romance Cake
Drink Tiger Krunch 50‐50 Snackuits
ActiMind ‐ milk based Drink Diabetic friendly bisuits under NutriChoice
Vita Marie Honey Oats
Time Pass Toasted Snack variants
Healthy Start ‐ Oats, Porridge, Upma and Poha
Maska Chaska Variants
Healthy range of breads ‐ Multi Fiber, Multi Grain, Honey Oats and Whole Wheat
4 flavours in Health & Delight Cheese
Tiger Zor Badam Milk in new flavours
Britannia Industries-Investment Note
Page 9
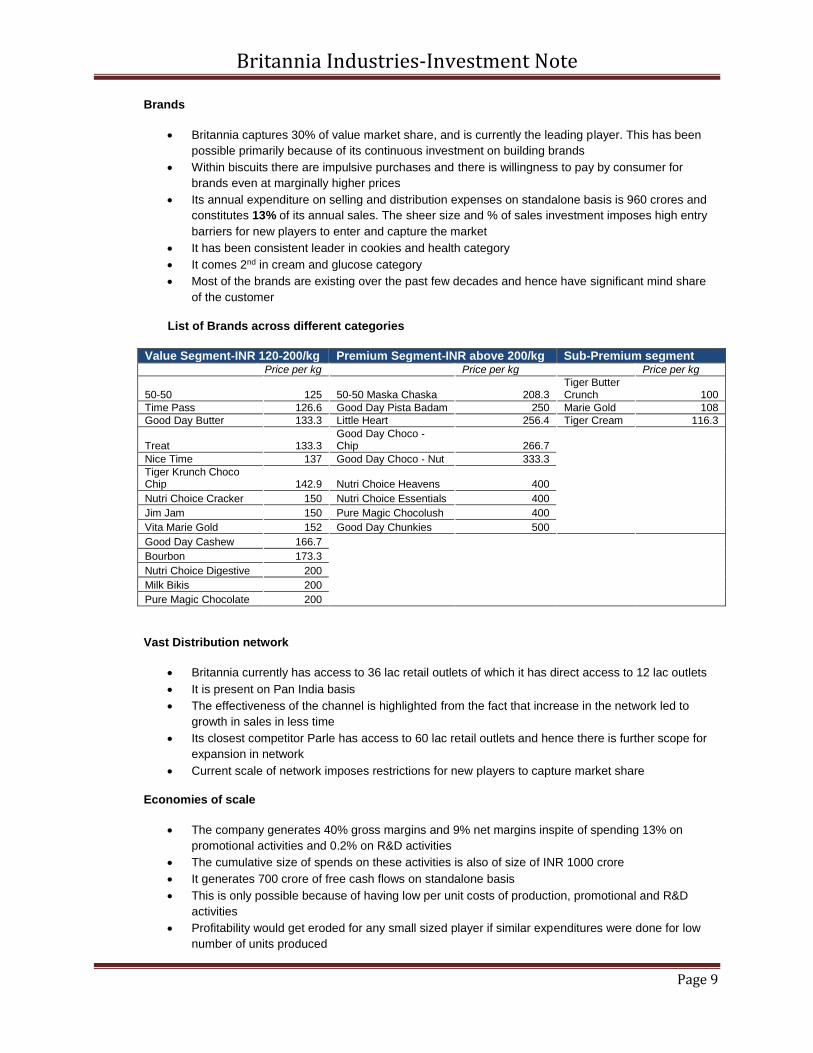
Brands
Britannia captures 30% of value market share, and is currently the leading player. This has been
possible primarily because of its continuous investment on building brands
Within biscuits there are impulsive purchases and there is willingness to pay by consumer for
brands even at marginally higher prices
Its annual expenditure on selling and distribution expenses on standalone basis is 960 crores and
constitutes 13% of its annual sales. The sheer size and % of sales investment imposes high entry
barriers for new players to enter and capture the market
It has been consistent leader in cookies and health category
It comes 2nd in cream and glucose category
Most of the brands are existing over the past few decades and hence have significant mind share
of the customer
List of Brands across different categories
Value Segment-INR 120-200/kg Premium Segment-INR above 200/kg Sub-Premium segment Price per kg Price per kg Price per kg
50‐50 125 50‐50 Maska Chaska 208.3 Tiger Butter Crunch 100
Time Pass 126.6 Good Day Pista Badam 250 Marie Gold 108
Good Day Butter 133.3 Little Heart 256.4 Tiger Cream 116.3
Treat 133.3 Good Day Choco ‐ Chip 266.7
Nice Time 137 Good Day Choco ‐ Nut 333.3
Tiger Krunch Choco Chip 142.9 Nutri Choice Heavens 400
Nutri Choice Cracker 150 Nutri Choice Essentials 400
Jim Jam 150 Pure Magic Chocolush 400
Vita Marie Gold 152 Good Day Chunkies 500
Good Day Cashew 166.7
Bourbon 173.3
Nutri Choice Digestive 200
Milk Bikis 200
Pure Magic Chocolate 200
Vast Distribution network
Britannia currently has access to 36 lac retail outlets of which it has direct access to 12 lac outlets
It is present on Pan India basis
The effectiveness of the channel is highlighted from the fact that increase in the network led to
growth in sales in less time
Its closest competitor Parle has access to 60 lac retail outlets and hence there is further scope for
expansion in network
Current scale of network imposes restrictions for new players to capture market share
Economies of scale
The company generates 40% gross margins and 9% net margins inspite of spending 13% on
promotional activities and 0.2% on R&D activities
The cumulative size of spends on these activities is also of size of INR 1000 crore
It generates 700 crore of free cash flows on standalone basis
This is only possible because of having low per unit costs of production, promotional and R&D
activities
Profitability would get eroded for any small sized player if similar expenditures were done for low
number of units produced
Britannia Industries-Investment Note
Page 10
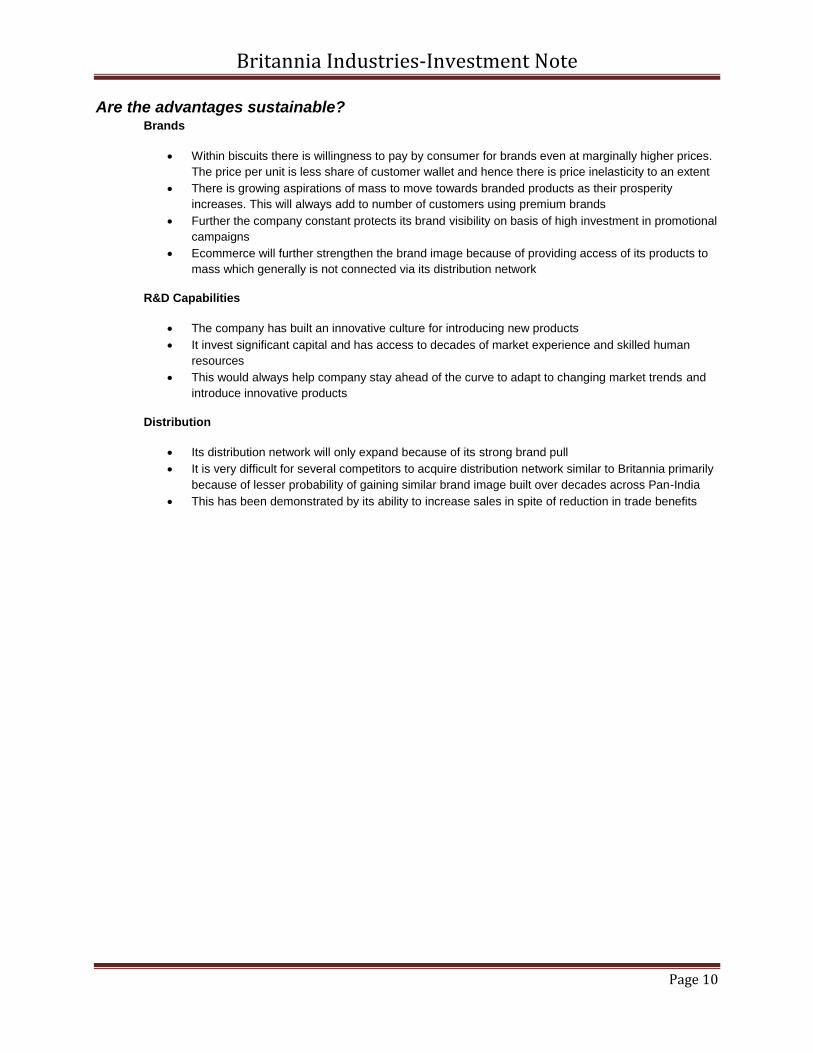
Are the advantages sustainable? Brands
Within biscuits there is willingness to pay by consumer for brands even at marginally higher prices.
The price per unit is less share of customer wallet and hence there is price inelasticity to an extent
There is growing aspirations of mass to move towards branded products as their prosperity
increases. This will always add to number of customers using premium brands
Further the company constant protects its brand visibility on basis of high investment in promotional
campaigns
Ecommerce will further strengthen the brand image because of providing access of its products to
mass which generally is not connected via its distribution network
R&D Capabilities
The company has built an innovative culture for introducing new products
It invest significant capital and has access to decades of market experience and skilled human
resources
This would always help company stay ahead of the curve to adapt to changing market trends and
introduce innovative products
Distribution
Its distribution network will only expand because of its strong brand pull
It is very difficult for several competitors to acquire distribution network similar to Britannia primarily
because of lesser probability of gaining similar brand image built over decades across Pan-India
This has been demonstrated by its ability to increase sales in spite of reduction in trade benefits
Britannia Industries-Investment Note
Page 11
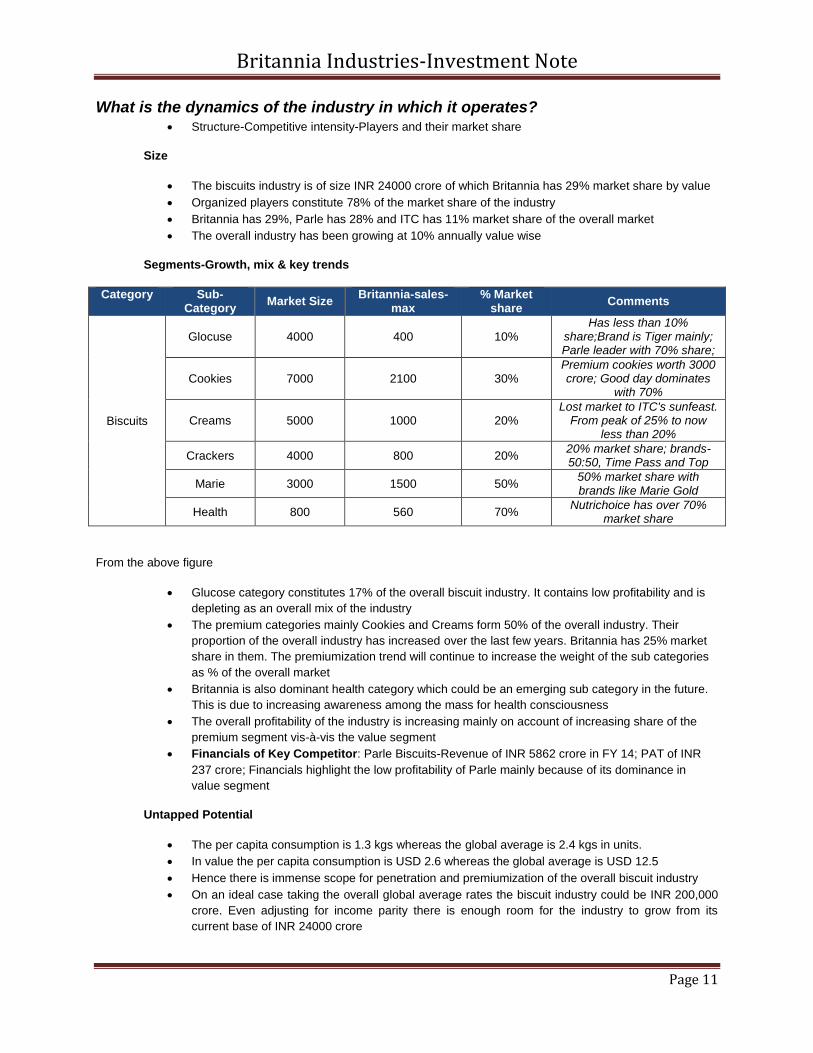
What is the dynamics of the industry in which it operates? Structure-Competitive intensity-Players and their market share
Size
The biscuits industry is of size INR 24000 crore of which Britannia has 29% market share by value
Organized players constitute 78% of the market share of the industry
Britannia has 29%, Parle has 28% and ITC has 11% market share of the overall market
The overall industry has been growing at 10% annually value wise
Segments-Growth, mix & key trends
Category Sub-Category
Market Size Britannia-sales-
max % Market
share Comments
Biscuits
Glocuse 4000 400 10% Has less than 10%
share;Brand is Tiger mainly; Parle leader with 70% share;
Cookies 7000 2100 30% Premium cookies worth 3000 crore; Good day dominates
with 70%
Creams 5000 1000 20% Lost market to ITC's sunfeast.
From peak of 25% to now less than 20%
Crackers 4000 800 20% 20% market share; brands-50:50, Time Pass and Top
Marie 3000 1500 50% 50% market share with brands like Marie Gold
Health 800 560 70% Nutrichoice has over 70%
market share
From the above figure
Glucose category constitutes 17% of the overall biscuit industry. It contains low profitability and is
depleting as an overall mix of the industry
The premium categories mainly Cookies and Creams form 50% of the overall industry. Their
proportion of the overall industry has increased over the last few years. Britannia has 25% market
share in them. The premiumization trend will continue to increase the weight of the sub categories
as % of the overall market
Britannia is also dominant health category which could be an emerging sub category in the future.
This is due to increasing awareness among the mass for health consciousness
The overall profitability of the industry is increasing mainly on account of increasing share of the
premium segment vis-à-vis the value segment
Financials of Key Competitor: Parle Biscuits-Revenue of INR 5862 crore in FY 14; PAT of INR
237 crore; Financials highlight the low profitability of Parle mainly because of its dominance in
value segment
Untapped Potential
The per capita consumption is 1.3 kgs whereas the global average is 2.4 kgs in units.
In value the per capita consumption is USD 2.6 whereas the global average is USD 12.5
Hence there is immense scope for penetration and premiumization of the overall biscuit industry
On an ideal case taking the overall global average rates the biscuit industry could be INR 200,000
crore. Even adjusting for income parity there is enough room for the industry to grow from its
current base of INR 24000 crore
Britannia Industries-Investment Note
Page 12
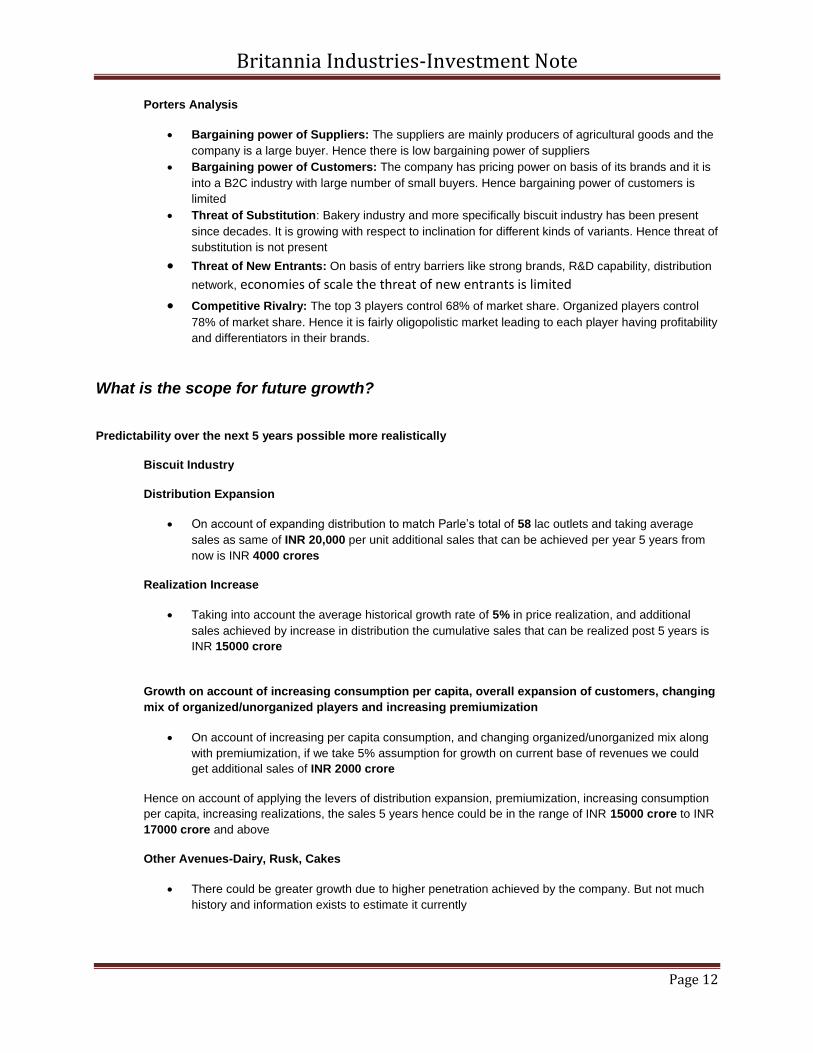
Porters Analysis
Bargaining power of Suppliers: The suppliers are mainly producers of agricultural goods and the
company is a large buyer. Hence there is low bargaining power of suppliers
Bargaining power of Customers: The company has pricing power on basis of its brands and it is
into a B2C industry with large number of small buyers. Hence bargaining power of customers is
limited
Threat of Substitution: Bakery industry and more specifically biscuit industry has been present
since decades. It is growing with respect to inclination for different kinds of variants. Hence threat of
substitution is not present
Threat of New Entrants: On basis of entry barriers like strong brands, R&D capability, distribution
network, economies of scale the threat of new entrants is limited
Competitive Rivalry: The top 3 players control 68% of market share. Organized players control
78% of market share. Hence it is fairly oligopolistic market leading to each player having profitability
and differentiators in their brands.
What is the scope for future growth?
Predictability over the next 5 years possible more realistically
Biscuit Industry
Distribution Expansion
On account of expanding distribution to match Parle’s total of 58 lac outlets and taking average
sales as same of INR 20,000 per unit additional sales that can be achieved per year 5 years from
now is INR 4000 crores
Realization Increase
Taking into account the average historical growth rate of 5% in price realization, and additional
sales achieved by increase in distribution the cumulative sales that can be realized post 5 years is
INR 15000 crore
Growth on account of increasing consumption per capita, overall expansion of customers, changing
mix of organized/unorganized players and increasing premiumization
On account of increasing per capita consumption, and changing organized/unorganized mix along
with premiumization, if we take 5% assumption for growth on current base of revenues we could
get additional sales of INR 2000 crore
Hence on account of applying the levers of distribution expansion, premiumization, increasing consumption
per capita, increasing realizations, the sales 5 years hence could be in the range of INR 15000 crore to INR
17000 crore and above
Other Avenues-Dairy, Rusk, Cakes
There could be greater growth due to higher penetration achieved by the company. But not much
history and information exists to estimate it currently
Britannia Industries-Investment Note
Page 13
What are the risks to the business model? Increase in prices of raw materials
In abrupt increase in prices of agricultural commodities on account of low acreage etc. the
company could face profitability pressure
The company does have pricing power on basis of its brands and it invests constantly to retain it.
This could provide it sustenance during tuff times
Competition
In cases of its existing players capturing significant market share due to strong product innovations
there could be loss of market share
Many local players like Patanjali and MNCs are trying to capture niche areas of the market
In order to counter its effect the company is also significantly investing in R&D activities
Also given that size of market is large and could expand, there lies great opportunity for the major
players
How is the quality of Management? The team has great credentials and capabilities on basis of their experience.
Varun Berry has demonstrated it on basis of changes introduced in the recent past
Management has been efficient capital allocators. Of free cash flows generated in last 3 years they
have invested 35% in capex, 30% has been repaid as dividends and 35% is retained for new
opportunities
They have also devised successful market strategies to regain lost market share
Management has also diversified into other avenues which currently generates 75% of the overall
revenues. They could be sources of growth in future
There has been no negative corporate governance issue in the past. Their level of disclosures and
transparencies are up to the required standard
They have also treated the minority shareholders fairly by providing them timely dividends, if not
much requirements of free cash
Britannia Industries-Investment Note
Page 14
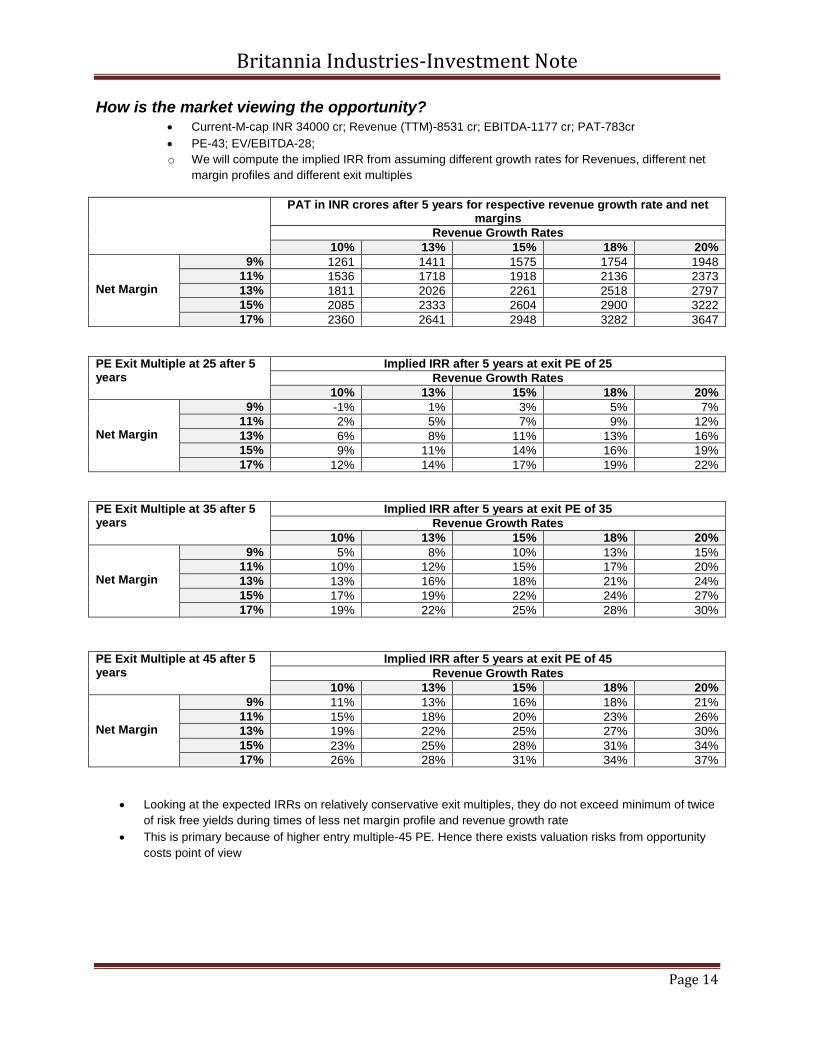
How is the market viewing the opportunity? Current-M-cap INR 34000 cr; Revenue (TTM)-8531 cr; EBITDA-1177 cr; PAT-783cr
PE-43; EV/EBITDA-28;
o We will compute the implied IRR from assuming different growth rates for Revenues, different net
margin profiles and different exit multiples
PAT in INR crores after 5 years for respective revenue growth rate and net margins
Revenue Growth Rates
10% 13% 15% 18% 20%
Net Margin
9% 1261 1411 1575 1754 1948
11% 1536 1718 1918 2136 2373
13% 1811 2026 2261 2518 2797
15% 2085 2333 2604 2900 3222
17% 2360 2641 2948 3282 3647
PE Exit Multiple at 25 after 5 years
Implied IRR after 5 years at exit PE of 25
Revenue Growth Rates
10% 13% 15% 18% 20%
Net Margin
9% -1% 1% 3% 5% 7%
11% 2% 5% 7% 9% 12%
13% 6% 8% 11% 13% 16%
15% 9% 11% 14% 16% 19%
17% 12% 14% 17% 19% 22%
PE Exit Multiple at 35 after 5 years
Implied IRR after 5 years at exit PE of 35
Revenue Growth Rates
10% 13% 15% 18% 20%
Net Margin
9% 5% 8% 10% 13% 15%
11% 10% 12% 15% 17% 20%
13% 13% 16% 18% 21% 24%
15% 17% 19% 22% 24% 27%
17% 19% 22% 25% 28% 30%
PE Exit Multiple at 45 after 5 years
Implied IRR after 5 years at exit PE of 45
Revenue Growth Rates
10% 13% 15% 18% 20%
Net Margin
9% 11% 13% 16% 18% 21%
11% 15% 18% 20% 23% 26%
13% 19% 22% 25% 27% 30%
15% 23% 25% 28% 31% 34%
17% 26% 28% 31% 34% 37%
Looking at the expected IRRs on relatively conservative exit multiples, they do not exceed minimum of twice
of risk free yields during times of less net margin profile and revenue growth rate
This is primary because of higher entry multiple-45 PE. Hence there exists valuation risks from opportunity
costs point of view


