Embed Size (px)
Citation preview
FINANCIAL ANALYSIS OF
BRITANNIA INDUSTRIES LTD
Project Report submitted to
UNIVERSITY OF CALICUT
In partial fulfillment of the requirement for the award of the degree of
BACHELOR OF COMMERCE
Submitted by
ADITYA RAJIV
(CCASBCM079)
Under the supervision of
MR. BABY JOHN
DEPARTMENT OF COMMERCE
CHRIST COLLEGE (AUTONOMOUS), IRINJALAKUDA
MARCH 2021
CHRIST COLLEGE (AUTONOMOUS), IRINJALAKUDA
CALICUT UNIVERSITY
DEPARTMENT OF COMMERCE
CERTIFICATE
This is to certify that the project report entitled “FINANCIAL ANALYSIS
OF BRITANNIA INDUSTRIES LTD” is a bonafide record of project done
by ADITYA RAJIV, Reg. No. CCASBCM079, under my guidance and
supervision in partial fulfillment of the requirement for the award of the degree
of BACHELOR OF COMMERCE and it has not previously formed the basis
for any Degree, Diploma and Associateship or Fellowship.
Prof. K.J. JOSEPH
Mr. BABY JOHN
Co-ordinator Project Guide
DECLARATION
I, ADITYA RAJIV, hereby declare that the project work entitled
“FINANCIAL ANALYSIS OF BRITANNIA INDUSTRIES LTD” is a record
of independent and bonafide project work carried out by me under the
supervision and guidance of Mr. BABY JOHN, Professor, Department of
Commerce, Christ College, Irinjalakuda.
The information and data given in the report is authentic to the best of my
knowledge. The report has not been previously submitted for the award of any
Degree, Diploma, Associateship or other similar title of any other university or
institute.
Place: Irinjalakuda ADITYA RAJIV
Date: CCASBCM079

ACKNOWLEDGEMENT
I would like to take the opportunity to express my sincere gratitude to all
people who have helped me with sound advice and able guidance.
Above all, I express my eternal gratitude to the Lord Almighty under whose
divine guidance; I have been able to complete this work successfully.
I would like to express my sincere obligation to Rev.Dr. Jolly Andrews,
Principal-in-Charge, Christ college Irinjalakuda for providing various facilities.
I am thankful to Prof. K.J. Joseph, Co-ordinator of B.Com (Finance), for
providing proper help and encouragement in the preparation of this report.
I am thankful to Mr. Lipin Raj, Class teacher for his cordial support, valuable
information and guidance, which helped me in completing this task through
various stages.
I express my sincere gratitude to Mr. Baby John, Professor, whose guidance
and support throughout the training period helped me to complete this work
successfully.
I would like to express my gratitude to all the faculties of the Department for
their interest and cooperation in this regard.
I extend my hearty gratitude to the librarian and other library staffs of my
college for their wholehearted cooperation.
I express my sincere thanks to my friends and family for their support in
completing this report successfully.
TABLES OF CONTENTS
CHAPTER NO. CONTENTS PAGE NO:
LIST OF TABLES
LIST OF FIGURES
CHAPTER 1 INTRODUCTION 1 – 3
CHAPTER 2 REVIEW OF LITERATURE 4 – 9
CHAPTER 3 INDUSTRY AND COMPANY
PROFILE 10 – 17
CHAPTER 4 DATA ANALYSIS AND
INTERPRETATION 18 – 28
CHAPTER 5 FINDINGS, SUGGESTIONS
& CONCLUSION 29 – 30
BIBLOGRAPHY
APPENDIX
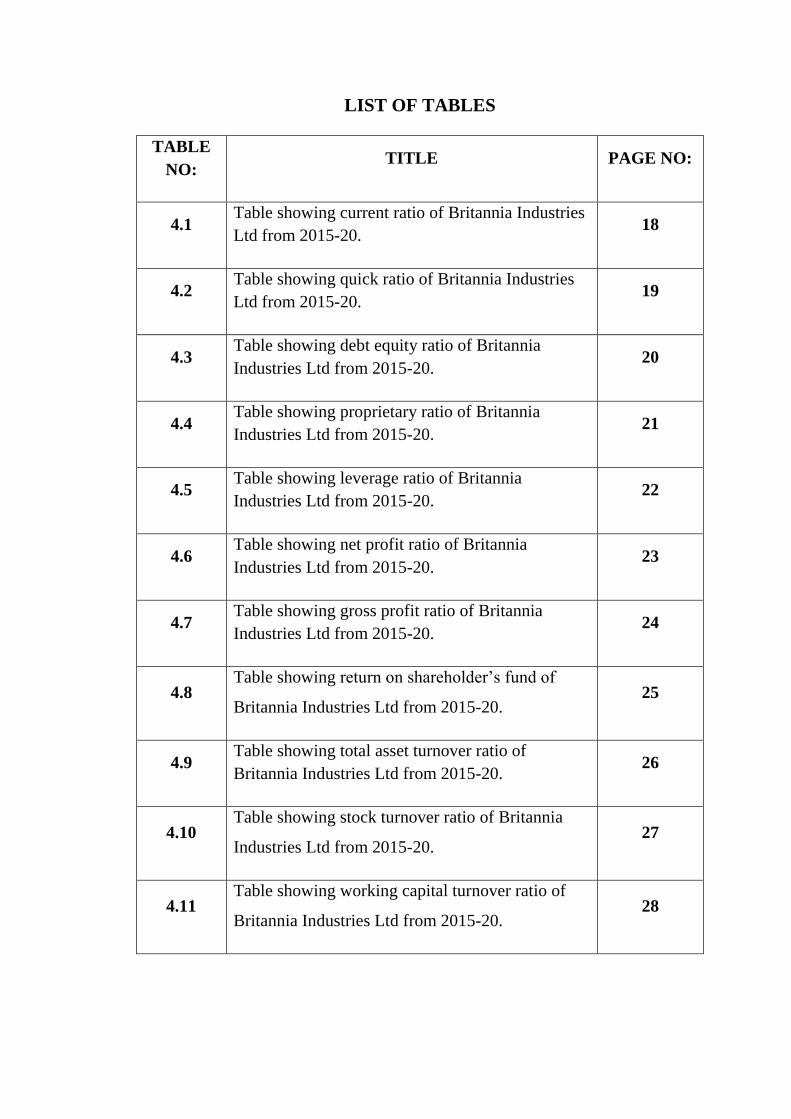
LIST OF TABLES
TABLE
NO: TITLE PAGE NO:
4.1 Table showing current ratio of Britannia Industries
Ltd from 2015-20. 18
4.2 Table showing quick ratio of Britannia Industries
Ltd from 2015-20. 19
4.3 Table showing debt equity ratio of Britannia
Industries Ltd from 2015-20. 20
4.4 Table showing proprietary ratio of Britannia
Industries Ltd from 2015-20. 21
4.5 Table showing leverage ratio of Britannia
Industries Ltd from 2015-20. 22
4.6 Table showing net profit ratio of Britannia
Industries Ltd from 2015-20. 23
4.7 Table showing gross profit ratio of Britannia
Industries Ltd from 2015-20. 24
4.8 Table showing return on shareholder’s fund of
Britannia Industries Ltd from 2015-20. 25
4.9 Table showing total asset turnover ratio of
Britannia Industries Ltd from 2015-20. 26
4.10 Table showing stock turnover ratio of Britannia
Industries Ltd from 2015-20. 27
4.11 Table showing working capital turnover ratio of
Britannia Industries Ltd from 2015-20. 28
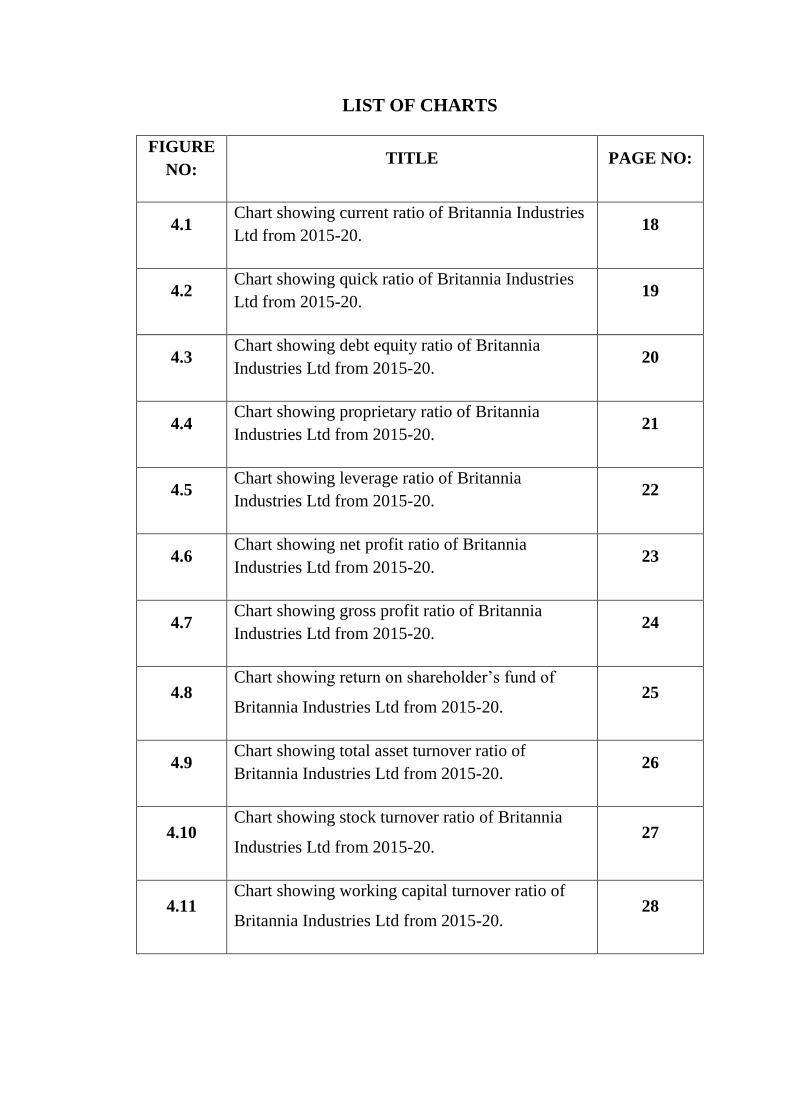
LIST OF CHARTS
FIGURE
NO: TITLE PAGE NO:
4.1 Chart showing current ratio of Britannia Industries
Ltd from 2015-20. 18
4.2 Chart showing quick ratio of Britannia Industries
Ltd from 2015-20. 19
4.3 Chart showing debt equity ratio of Britannia
Industries Ltd from 2015-20. 20
4.4 Chart showing proprietary ratio of Britannia
Industries Ltd from 2015-20. 21
4.5 Chart showing leverage ratio of Britannia
Industries Ltd from 2015-20. 22
4.6 Chart showing net profit ratio of Britannia
Industries Ltd from 2015-20. 23
4.7 Chart showing gross profit ratio of Britannia
Industries Ltd from 2015-20. 24
4.8 Chart showing return on shareholder’s fund of
Britannia Industries Ltd from 2015-20. 25
4.9 Chart showing total asset turnover ratio of
Britannia Industries Ltd from 2015-20. 26
4.10 Chart showing stock turnover ratio of Britannia
Industries Ltd from 2015-20. 27
4.11 Chart showing working capital turnover ratio of
Britannia Industries Ltd from 2015-20. 28

CHAPTER 1
INTRODUCTION
1
1.1 Introduction
Financial performance analysis is the process of identifying the financial
strength and weakness of firm by properly establishing relationship
between the items of balance sheet and profit and loss account. It is
performed by professionals who prepare reports using ratios and other
techniques, that makes use of information taken from financial statements
and other reports. These reports are usually presented to top management
as one of their bases in making business decisions. It also helps in short
term and long term forecasting and growth can be identified with the help
of financial performance analysis.
Finance is a term for matters regarding the management, creation, and
study of money and investments. Specifically, it deals with the questions of
how and why an individual, company or government acquires the money
needed called capital in the company context and how they spend or invest
that money. To determine the firm‟s efficiency the analyst attempt to
measure the firm‟s solvency, liquidity, profitability, turnover and other
indicator in rational and normal way. It is a process of measuring the result
of firm‟s policies operations in monetary terms. It is used to measure firm‟s
overall financial health over a given period of time and can also be used to
compare similar firms across same industry or to compare sectors in
aggregation.
1.2 Statement of problem
It basically examines the strength and weakness of the firm by properly
establishing the relationship between the items of balance sheet and the
profit and loss account of Britannia Industries Ltd.
1.3 Scope of study
The study was conducted on Britannia Industries Ltd to analyse the
financial performance of past 5 years. The study aims to analyse the
liquidity, profitability, turnover, solvency position of company the study is
based on the financial position of company by using ratio analysis and
trend analysis to take financial decision.
2
1.4 Objectives of study
1. To examine the solvency position of the company.
2. To know the liquidity position of the company.
3. To know the profitability position of the company.
4. To know the turnover of the company.
1.5 Research design
1.5.1 Nature of study
The study is analytical in nature.
1.5.2 Nature of data
Under this study secondary data is used for the analysis.
1.5.3 Source of data
Secondary data is collected from the official website of the Britannia
Industries Ltd.
1.5.4 Period of study
Period of study is from last 5 years from 2015-16 to 2019-20.
1.6 Tools for analysis
In this study, analysis has been done using ratio analysis. Liquidity ratio,
solvency ratio, profitability ratio and turnover ratio has been examined for
the study.
1.7 Limitations of study
1. This study has been carried out for the period of 5 years only.
2. Firms consider only the monetary aspects of the financial statements.
Non-monetary aspects like human behavior and their relationship etc
are not considered.

3
1.8 Chapterisation
Chapter 1: Introduction
Chapter 2: Review of Literature
Chapter 3: Theoretical Framework
Chapter 4: Data Analysis and Interpretation
Chapter 5: Findings, Suggestions, Conclusion

CHAPTER 2
REVIEW OF LITERATURE
4
Review of literature
2.1 conceptual review
Meaning
Financial Analysis is the process of evaluating businesses, projects, budgets
and other finance related transactions to determine their performance and
suitability. Typically, financial analysis is used to analyze whether an entity is
stable, solvent, liquid or profitable enough to warrant a monetary investment. It
also helps in identifying the financial strength and weaknesses of the firm by
properly establishing relationship between items of financial statements. A
financial statement is an organized collection of data according to logical and
conceptual framework. Financial statement analysis are intended to be
understandable by readers who have “a reasonable knowledge of business and
economic activities and accounting and who are willing to study the
information diligently”.
Definition
According to Kennedy and Muller, “the analysis and interpretation of financial
statements reveal each and every aspect regarding the well- being financial
soundness, operational efficiency and credit worthiness of the concerned”.
According to John Myer, “financial statement analysis is largely a study of
relationship among the various financial factors in a business as disclosed by
single set of statements and a study of the trend of these factors as shown in a
series of statements”.
Types of financial analysis
There are two types of financial analysis which are undertaken to interpret the
position of an enterprise. They are-
1. Vertical analysis
2. Horizontal analysis
VERTICAL ANALYSIS:
It is an analysis of relationship as between different individual components. It
is also the analysis between the components. It is also the analysis between
these components and their totals for a given period of time it is also regarded
as a static analysis. Comparison of current assets to current liabilities or
5
comparisons of debt to equity for one point of time are examples of vertical
analysis.
HORIZONTAL ANALYSIS:
It is the analysis of changes in different components of the financial
statements over different periods with help of a series of statements. Such an
analysis makes it possible to study periodic fluctuations in different
components of the financial statements. Study of trends in debt or share capital
or their relationship over the past.
Advantages of financial analysis
Budget Outline in real-time: Decision making for planning the future,
budget estimations, corrective actions required for efficient budgeting,
and many such decisions rely heavily on financial statements. The
statements reveal how much you can spend on marketing or product
launches, strategizing for marketing-campaigns, future expansions,
requirements of funding etc. Information is power in decision making
and planning.
Pattern Detection and forecasting: Financial statements have the
ability to reveal earnings per year, sales and profits accrued. Though
sales figures may vary, the financial planners will be in a position to find
a correlative pattern over a few years of data of sales-figures. Take the
example of a company that may reveal a trend of sales increases
whenever new products are marketed and released. Sales could drop after
let‟s say a year of the product launch. This trend analysis is a huge
company benefit as it forecasts a market life of about a year is useful, as
it shows sales patterns for product launches, a sales drop after a year, and
a need for new products in a year‟s time.
Disadvantages of financial analysis
Analysis of At-One-Time basis: As the name suggests the forecast and
analysis is applicable at that one time only. It does not reveal or
compare the past performance or future forecast at one glance. One will
6
need to exercise caution by generating and reporting on a continuous
basis rather than a one time basis. Such extrapolation of data and
financial analysis undertaken frequently is crucial to the company‟s
health and decision-making abilities.
Based on pattern of the market: A big disadvantage of the financial
statements analysis and use for making strategic decisions based on
figures and data pertaining to current market conditions which may
fluctuate. Past performance is a good indicator and motivator. It cannot,
however, guarantee the fluctuations and future demands. A cautious
approach is called for in interpretation of financial ratios and statements
to prevent excessive risk-taking based purely on forecasts.
2.2 Empirical literature:
Tony Weis (2007) published his book “The global food economy: The battle
for future of farming “. In this book author has mentioned two words Food &
Farming intentionally because of his family background. His grandfather
owned 81 hectare farm in Canada but after retirement sold his farm & moved
on to a successful business. The main aim of this book is to examine in a
concise and accessible way the major contemporary dynamics, problems and
inequities of the global food economy. As per this book, capital of the country
incredibly and increasingly concentrated mainly on food economy and in many
places significant measure of unconsciousness about food. This book can play
vital role in helping to nourish them.
Da-Wen-Sun (2006) in his book entitled “Emerging Technologies for food
processing” focus on modern and innovative tools and techniques for food
processing units. The author has contains a critical review of the use of
chemicals in biological preservation in this book. Discussion of non thermal
processing techniques has been explained, innovations in food refrigeration are
covered. Here, the author is not taken into account operational and functional
aspects of management.
P.K. Chattopadhyay (2012) stated in his book “ profitable Agro Based
projects with project profile” gives guidelines to the people who newly entered
in the food business. Cereals are used for both human and animals food and as
an industrial raw material. Major content of this book are project profiles of
projects like rice milling or rice products.
7
H. DAS (2005) entitled his book “Food processing operations analysis” carried
out unit operation in food processing by identifying dependent & independent
variables affecting the operations and developing mathematical relationship
among the variables. This book includes comprehensive numerical problems,
mathematical modeling, and solutions of numerical problems, exercise
problems and MATLAB problems of food processing operations. This book
helps the readers to find out responses at various levels.
Kalaki Majumdar (2013) in his article “Export performance of processed
food in India” describes importance of processed Indian foods for export
concern. As per his opinion Indian food processing industry is primarily export
oriented. The growth rate of Indian export market is 15% in international
market. This is a matter of concern; having potential for processed food this
sector is underutilized. The present study reveals that out of eight processed
food items there are four items where India enjoys comparative advantage in
the world market.
Kalamkar S.S. in his article (2007)“export opportunities & challenges for
Indian organic food” studied about Indian organic farm production & trade. He
has described that an organic farm production & trade emerged an important
sector in India in other part of developing world. More than 120 countries have
produce organic products & Australia is leading country to produce that type of
product. Author has described importance & problem in organic production in
India.
Tejasvini (2012) in her article name “rethinking Change; Downsizing
Business, Changing Behaviours & still Managing” discussed global change in
business, its behaviour & skill managing. Utilization of low capacity is
unsuitable to highly capital intensive industries. As per British Chamber of
Commerce (BCC) survey, 5600 companies found „Welcome Progress in
confidence level between April June 2009, which has been sustained
(BCC2009). Yet the BCC also revealed unemployment is still expected to
remain high. In her study, she is described model of facility closure
management. It is individual management concern of change in behaviour &
the recognition of huge emotional impact that on announcement of closure of
an entire plant can generate.
8
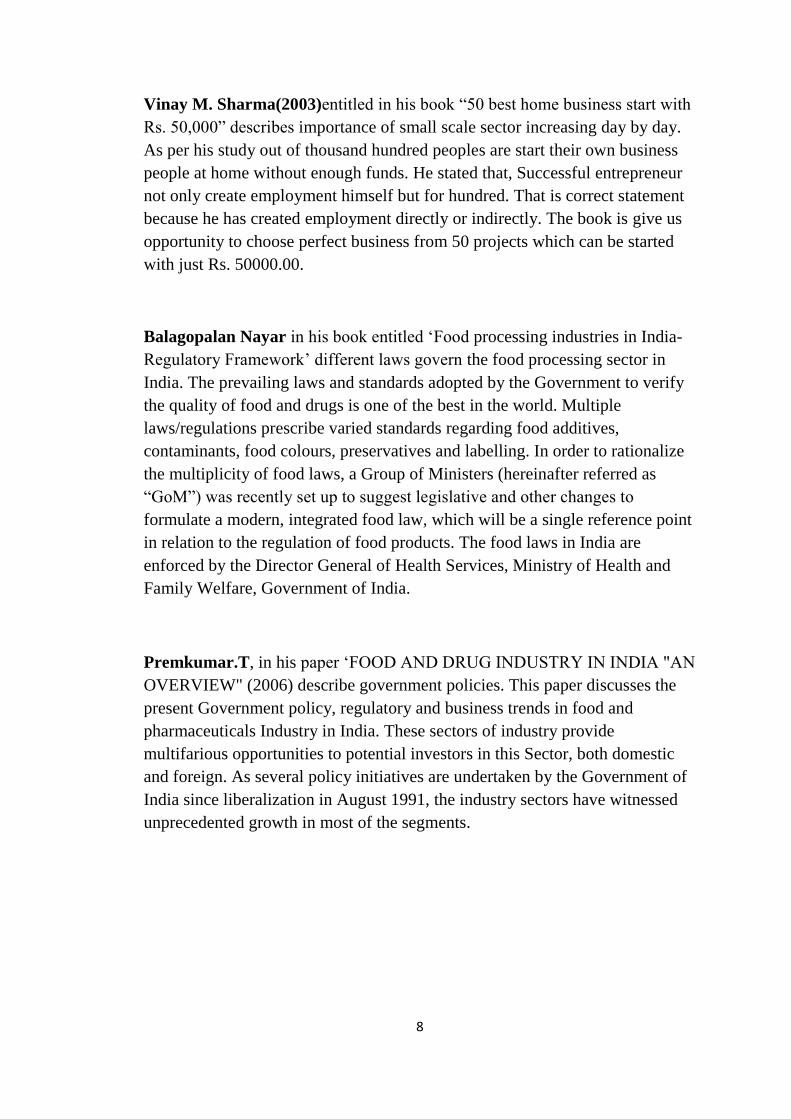
Vinay M. Sharma(2003)entitled in his book “50 best home business start with
Rs. 50,000” describes importance of small scale sector increasing day by day.
As per his study out of thousand hundred peoples are start their own business
people at home without enough funds. He stated that, Successful entrepreneur
not only create employment himself but for hundred. That is correct statement
because he has created employment directly or indirectly. The book is give us
opportunity to choose perfect business from 50 projects which can be started
with just Rs. 50000.00.
Balagopalan Nayar in his book entitled „Food processing industries in India-
Regulatory Framework‟ different laws govern the food processing sector in
India. The prevailing laws and standards adopted by the Government to verify
the quality of food and drugs is one of the best in the world. Multiple
laws/regulations prescribe varied standards regarding food additives,
contaminants, food colours, preservatives and labelling. In order to rationalize
the multiplicity of food laws, a Group of Ministers (hereinafter referred as
“GoM”) was recently set up to suggest legislative and other changes to
formulate a modern, integrated food law, which will be a single reference point
in relation to the regulation of food products. The food laws in India are
enforced by the Director General of Health Services, Ministry of Health and
Family Welfare, Government of India.
Premkumar.T, in his paper „FOOD AND DRUG INDUSTRY IN INDIA "AN
OVERVIEW" (2006) describe government policies. This paper discusses the
present Government policy, regulatory and business trends in food and
pharmaceuticals Industry in India. These sectors of industry provide
multifarious opportunities to potential investors in this Sector, both domestic
and foreign. As several policy initiatives are undertaken by the Government of
India since liberalization in August 1991, the industry sectors have witnessed
unprecedented growth in most of the segments.
9
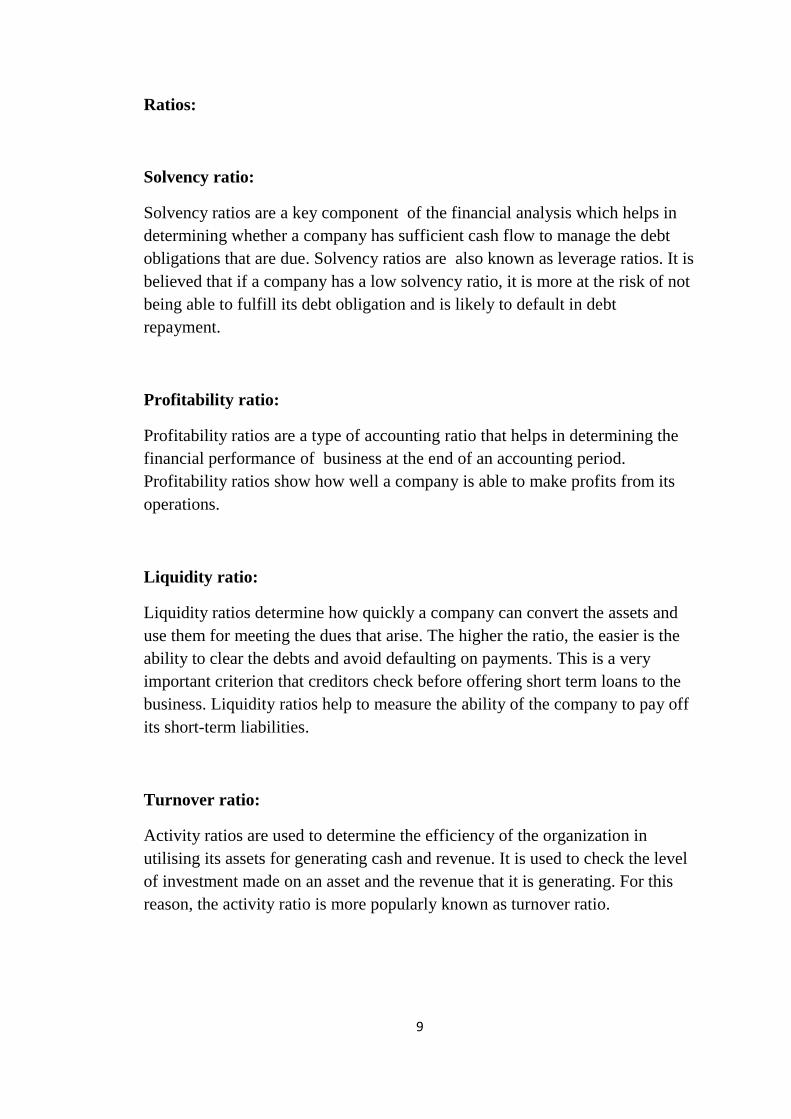
Ratios:
Solvency ratio:
Solvency ratios are a key component of the financial analysis which helps in
determining whether a company has sufficient cash flow to manage the debt
obligations that are due. Solvency ratios are also known as leverage ratios. It is
believed that if a company has a low solvency ratio, it is more at the risk of not
being able to fulfill its debt obligation and is likely to default in debt
repayment.
Profitability ratio:
Profitability ratios are a type of accounting ratio that helps in determining the
financial performance of business at the end of an accounting period.
Profitability ratios show how well a company is able to make profits from its
operations.
Liquidity ratio:
Liquidity ratios determine how quickly a company can convert the assets and
use them for meeting the dues that arise. The higher the ratio, the easier is the
ability to clear the debts and avoid defaulting on payments. This is a very
important criterion that creditors check before offering short term loans to the
business. Liquidity ratios help to measure the ability of the company to pay off
its short-term liabilities.
Turnover ratio:
Activity ratios are used to determine the efficiency of the organization in
utilising its assets for generating cash and revenue. It is used to check the level
of investment made on an asset and the revenue that it is generating. For this
reason, the activity ratio is more popularly known as turnover ratio.

CHAPTER 3
THEORETICAL FRAMEWORK
10
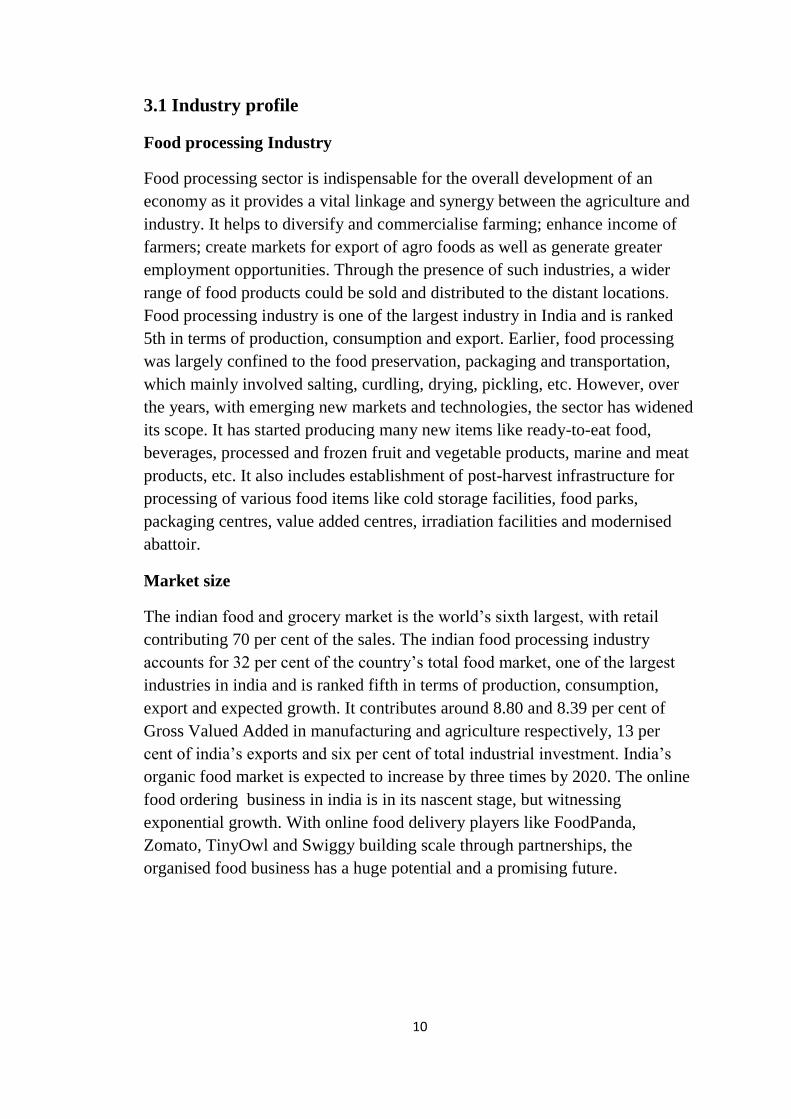
3.1 Industry profile
Food processing Industry
Food processing sector is indispensable for the overall development of an
economy as it provides a vital linkage and synergy between the agriculture and
industry. It helps to diversify and commercialise farming; enhance income of
farmers; create markets for export of agro foods as well as generate greater
employment opportunities. Through the presence of such industries, a wider
range of food products could be sold and distributed to the distant locations.
Food processing industry is one of the largest industry in India and is ranked
5th in terms of production, consumption and export. Earlier, food processing
was largely confined to the food preservation, packaging and transportation,
which mainly involved salting, curdling, drying, pickling, etc. However, over
the years, with emerging new markets and technologies, the sector has widened
its scope. It has started producing many new items like ready-to-eat food,
beverages, processed and frozen fruit and vegetable products, marine and meat
products, etc. It also includes establishment of post-harvest infrastructure for
processing of various food items like cold storage facilities, food parks,
packaging centres, value added centres, irradiation facilities and modernised
abattoir.
Market size
The indian food and grocery market is the world‟s sixth largest, with retail
contributing 70 per cent of the sales. The indian food processing industry
accounts for 32 per cent of the country‟s total food market, one of the largest
industries in india and is ranked fifth in terms of production, consumption,
export and expected growth. It contributes around 8.80 and 8.39 per cent of
Gross Valued Added in manufacturing and agriculture respectively, 13 per
cent of india‟s exports and six per cent of total industrial investment. India‟s
organic food market is expected to increase by three times by 2020. The online
food ordering business in india is in its nascent stage, but witnessing
exponential growth. With online food delivery players like FoodPanda,
Zomato, TinyOwl and Swiggy building scale through partnerships, the
organised food business has a huge potential and a promising future.
11
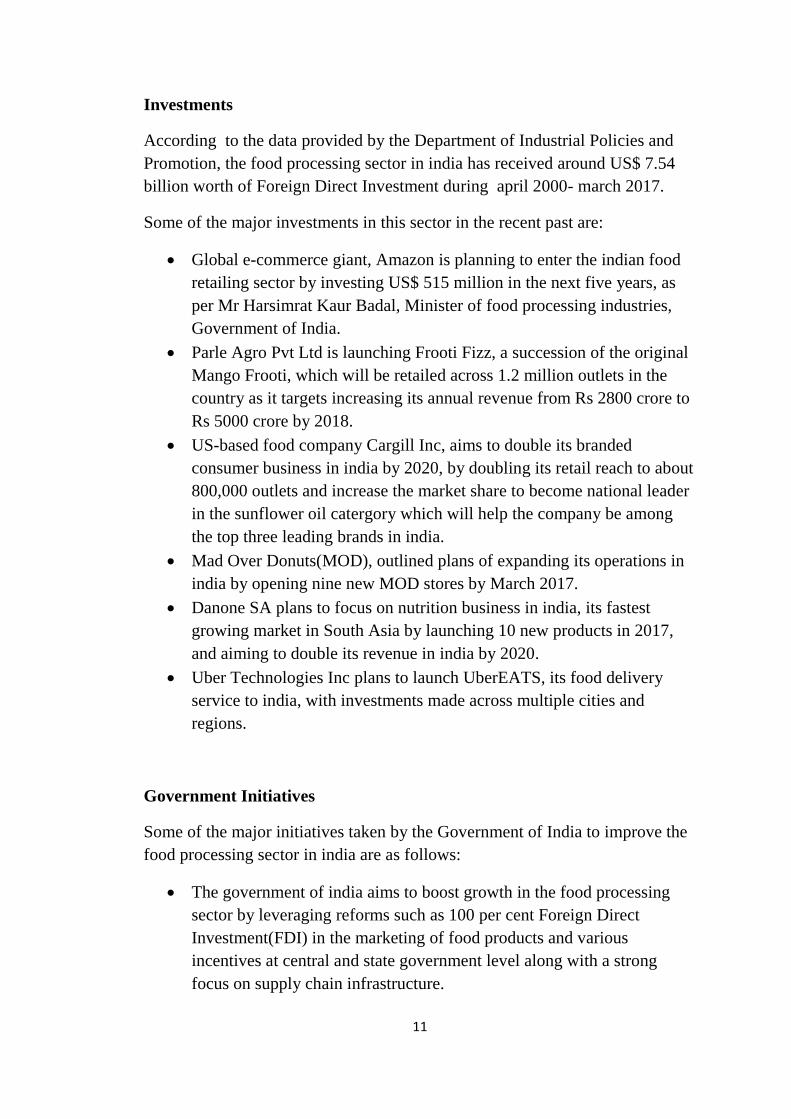
Investments
According to the data provided by the Department of Industrial Policies and
Promotion, the food processing sector in india has received around US$ 7.54
billion worth of Foreign Direct Investment during april 2000- march 2017.
Some of the major investments in this sector in the recent past are:
Global e-commerce giant, Amazon is planning to enter the indian food
retailing sector by investing US$ 515 million in the next five years, as
per Mr Harsimrat Kaur Badal, Minister of food processing industries,
Government of India.
Parle Agro Pvt Ltd is launching Frooti Fizz, a succession of the original
Mango Frooti, which will be retailed across 1.2 million outlets in the
country as it targets increasing its annual revenue from Rs 2800 crore to
Rs 5000 crore by 2018.
US-based food company Cargill Inc, aims to double its branded
consumer business in india by 2020, by doubling its retail reach to about
800,000 outlets and increase the market share to become national leader
in the sunflower oil catergory which will help the company be among
the top three leading brands in india.
Mad Over Donuts(MOD), outlined plans of expanding its operations in
india by opening nine new MOD stores by March 2017.
Danone SA plans to focus on nutrition business in india, its fastest
growing market in South Asia by launching 10 new products in 2017,
and aiming to double its revenue in india by 2020.
Uber Technologies Inc plans to launch UberEATS, its food delivery
service to india, with investments made across multiple cities and
regions.
Government Initiatives
Some of the major initiatives taken by the Government of India to improve the
food processing sector in india are as follows:
The government of india aims to boost growth in the food processing
sector by leveraging reforms such as 100 per cent Foreign Direct
Investment(FDI) in the marketing of food products and various
incentives at central and state government level along with a strong
focus on supply chain infrastructure.
12
In Union Budget 2017-18, the government of india has set up a diary
processing infra fund worth Rs 8000 crore.
The government of india has relaxed foreign direct investment norms for
the sector, allowing up to 100 per cent FDI in the food product e-
commerce through automatic route.
The Food Safety and Standards Authority of India(FSSAI) plans to
invest around Rs 482 crore to strengthen the food testing infrastructure
in india, by upgrading 59 existing food testing laboratories and setting
up 62 new mobile testing labs across the country.
The Indian Council for Fertilizer and Nutrient Research(ICFNR) will
adopt international best practices for research in the fertilizer sector,
which will enable farmers to get good quality fertilizers at affordable
rates and thereby achieve food security for the common man.
The Ministry of food processing industries announced a scheme for
Human Resource Development(HRD) in the food processing sector. The
scheme has following four components:
a. Creation of infrastructure facilities for degree/diploma courses in
food processing sector.
b. Entrepreneurship Development Programme(EDP)
c. Food Processing Training Centres(FPTC)
d. Training at recognized institutions at state/national level
Achievements
The Ministry of Food Processing Industries is implementing a number of
central sector schemes for promotion and development of food processing
sector in the country since 12th
plan. The major achievements of the Ministry
during 2016 are as under.
Foreign Direct Investment(FDI):
Government has allowed 100% FDI for trading including through e-
commerce, in respect of food products manufactured or produced in
india.
100% FDI is already permitted in manufacturing of food products
through automatic route.
This will provide impetus to the foreign investment in food processing
sector, benefit farmers immensely and will create vast employment
opportunities.
13
Scheme of Mega Food Parks:
The Indus Mega Food Park, Khargone(Madhya Pradesh); Jharkhand
Mega Food Park Ranchi, and Jangipur Bengal Mega Food Park,
Murshidabad(West Bengal) were made operational and inaugurated.
Foundation Stone of Punjab Agro Industries Corporation(PAIC) Mega
Food Park Project in Ludhiana was laid.
As such, 8 Mega Food Parks have been made operational so far.
A Mega Food Park is likely to benefit about 25000-30000 farmers apart
from creating employment for 5000-6000 persons, especially in rural
areas.
The Mega Food Park projects at Satara(Maharashtra),
Ajmer(Rajasthan), Rayagada(Odisha) and Agartala(Tripura) are at
advanced stage for operationalization by the end of current financial
year.
NABARD has sanctioned term loan of Rs 427.69 crore to 10 Mega
Food Park projects and 2 processing units under „Food Processing Fund‟
of Rs 2000 crore.
The ministry has notified 157 designated food parks in different states
for the purposes of availing affordable credit from special fund with
NABARD.
Scheme of integrated Cold Chain and Value Addition Infrastructure:
20 projects have been operationalized in 2016. With their
operationalization, Ministry has created an additional capacity of 0.63
lakh metric tonnes of cold storage, 15 metric tonnes per hour of
individual Quick Freezing(IQF), 10.65 lakh litres per day of milk of
processing/ storage and 99 reefer vans during 2016.
During last two and half years, 54 Integrated Cold Chain projects have
been made operational taking the total number of Cold Chain projects to
91.
The guidelines of scheme have been revised on the basis of feedback
and experience of this Ministry to make them investor friendly.
On an average, each Cold Chain project benefits to around 500 farmers
in fruits and vegetables sector and around 5000 farmers in diary sector
and creates employment for 100 persons.
During the year, 10 Food Testing Labs have been completed.
14
FSSAI‟s simplified product approval:
FSSAI has approved a large number of new additives harmonized with
the International Codex Standards.
Notified an amendment to the regulations as a result of which non-
standardized food products called proprietary foods that use ingredients
and additives approved in the regulations will no longer require product
approval.
A web-based on-line system has been operationalized for processing
claims for release of grants-in-aid under the schemes of Mega Food
Parks and the Integrated Cold Chain and Value Addition Infrastructure.
3.2 Company Profile
Britannia Industries Limited is an indian food and beverage company. Founded
in 1892 and headquartered in Kolkata, it is one of india‟s oldest existing
companies. It is now part of the Wadia Group headed by Nusil Wadia. The
company sells its Britannia and Tiger brands of biscuits, bread and diary
products throughout india and in more than 60 countries across the world.
Beginning with the circumstances of its takeover by the Wadia group in the
early 1990s, the company has been mired in several controversies connected to
its management. However, it does enjoy a large market share and is
exceedingly profitable. The company‟s international footprint includes
presence in Middle East through local manufacturing in UAE and Oman, are
the no2 biscuit player in UAE with strong contention to leadership and have a
similarly strong market position in the other GCC countries. Britannia is a
brand which many generations of Indians have grown up with and its brands
are cherished and loved in india and the world over. Britannia products are
available across the country in close to 5 million retail outlets and reach over
50% of indian homes.
History
The company was established in 1892 by a group of british businessmen with
an investment of Rs 295. Initially, biscuits were manufactured in a small
house in central Kolkata. Later, the enterprise was acquired by the Gupta
15
Brothers, mainly Nalin Chandra Gupta, an attorney, and operated under the
name “V.S Brothers”. In 1918, C.H. Holmes, an English businessman based in
Kolkata, was taken on as a partner and The Britannia Biscuit Company Limited
was launched. The Mumbai factory was set up in 1924 and Peek Freans UK,
acquired a controlling interest in BBCo. Biscuits were in high demand during
World War II, which gave a boost to the company‟s sales. The company name
was changed to the current “Britannia Industries Limited” in 1979. In 1982, the
American company Nabisco Brands, Inc. acquired the parent of Peek Freans
and became a major foreign shareholder.
Performance and profitability
Between 1998 and 2001, the company‟s sales grew at a compound annual rate
of 16% against the market, and operating profits reached 18%. More recently,
the company has been growing at 27% a year, compared to the industry‟s
growth rate of 20%. At present, 90% of Britannia‟s annual revenue of Rs 22
billion comes from biscuits.
Britannia is one of India‟s 100 most trusted brands listed in the Brand Trust
Report. Britannia has an estimated market share of 38%.
Businesses
The company‟s principal activity is the manufacturing and sale of biscuits,
bread, rusk, cakes and dairy products.
Biscuits:
Biscuits account for 90% of Britannia‟s annual revenue. The company‟s
factories have an annual capacity of 433,000 tonnes. The brand names of
Britannia‟s biscuits include VitaMarieGold, Tiger, Nutrichoice, Good day, 50-
50, Treat, Pure Magic, Milk Bikis, Bourbon, Nice Time and Little Hearts
among others.
In 2006, Tiger, the mass market brand, realised $150.75 million in sales
including exports to the U.S and Australia. This amounts to 20% of Britannia
revenues for that year.
Also Britannia Industries has roped in Bollywood actor Salman Khan to
endorse its range of „Tiger‟ brand of biscuits. According to Britannia, Khan
16
will play a role in further enhancing tiger‟s core values through his association
in presenting the brand, its products and promotional activities.
Dairy products:
Dairy products contribute close to 10% to Britannia‟s revenue. The company
not only markets dairy products to the public but also trades dairy commodities
business-to-business. Its dairy portfolio grew to 47% in 2000-01 and by 30% in
2001-02. Its main competitors are Nestle India, The National Dairy
Development Board(NDDB), and Amul(GCMMF). Britannia holds an equity
stake in Dynamix Dairy and outsources the bulk of its dairy products from its
associate.
On 27th
October 2001, Britannia announced a joint venture with Fonterra Co-
operative Group of New Zealand, an integrated dairy company which handles
all aspects of the value chain from procurement of milk to making value-added
products such as cheese and buttermilk. Britannia intends to source most of the
products from New Zealand, which they would market in india. The joint
venture will allow technology transfer to Britannia. Britannia and New Zealand
dairy each hold 49% of the JV and the remaining 2 per cent will be held by
strategic investor. Britannia has also tentatively announced that its dairy
business would be transferred to the joint venture. However, the authorities
approval to the joint venture obliged the company to start manufacturing
facilities of its own. It would not be allowed to trade, except at the wholesale
level, thus pitching it in competition with Danone, which had recently
established its own dairy business.
Awards
Britannia Industries Limited has received recognition from prestigious
marketing Forums- Indian Advertisers Association, AFAQs! and PITCH CMO
Summit.
Britannia was accorded with the Marketer of the Year- FMCG- Foods award by
the Indian Advertizers Association at the 4th
edition of the IAA Leadership
Awards on March 12, 2016. The IAA Leadership Awards recognizes the best
efforts in marketing, media and advertising and honours companies for their
incredible contribution in designing path-breaking and high impact marketing
17
initiatives to strengthen their respective brand‟s promise and standing amongst
consumers, in different products and service categories.
Britannia has been conferred as one of the Top 3 Buzziest Brands in the Food
Category by AFAQS! in its 11th
edition. AFAQs! is the number 1 website in
Asia-Pacific for advertising. Media and marketing professionals and the awards
recognize India‟s brands that have managed to create that elusive thing called
„Buzz‟ in the market place. Britannia was also recognized for having the
Maximum Customer Engagement by Exchange4media at the PITCH CMO
Summit on March 4, 2016. The award recognizes Best Practises in marketing
to the Indian consumer in a competitive and dynamic environment.
Britannia Industries Limited was bestowed with the awards for its constant
endeavour to make delightful products and to deliver them to their consumers
across the country in the most efficient and quality-conscious manner possible.
Britannia Industries Ltd was awarded the Global Performance Excellence
Award by Asia Pacific Quality Organization in Chicago on June 18. It won the
„Best in Class‟ award, an international recognition for its manufacturing units
and the overall processors of performance excellence adopted by the company.
CHAPTER 4
DATA ANALYSIS AND
INTERPRETATION
18
DATA ANALYSIS
Data analysis is the process of collecting and organising data in order to draw
helpful conclusions from it. Here we are determining the data analysis and
interpretations of Britannia Industries Ltd.
4.1 Liquidity Ratio
4.1.1 Current Ratio
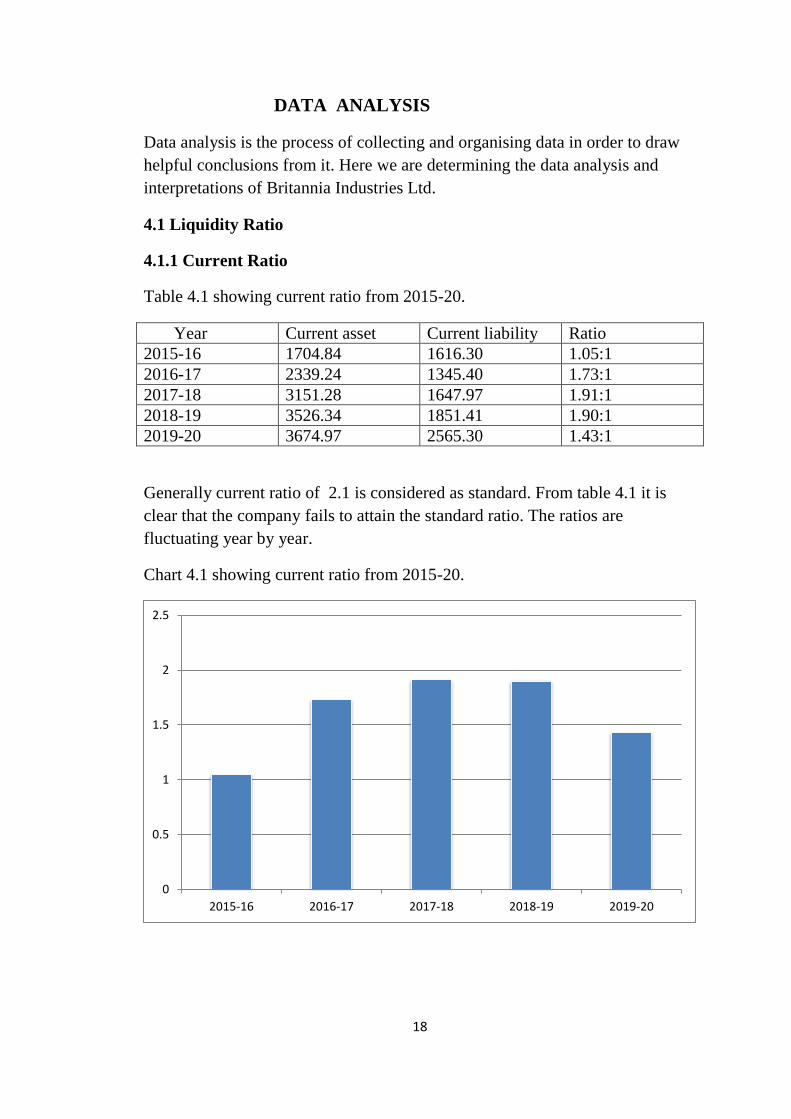
Table 4.1 showing current ratio from 2015-20.
Year Current asset Current liability Ratio
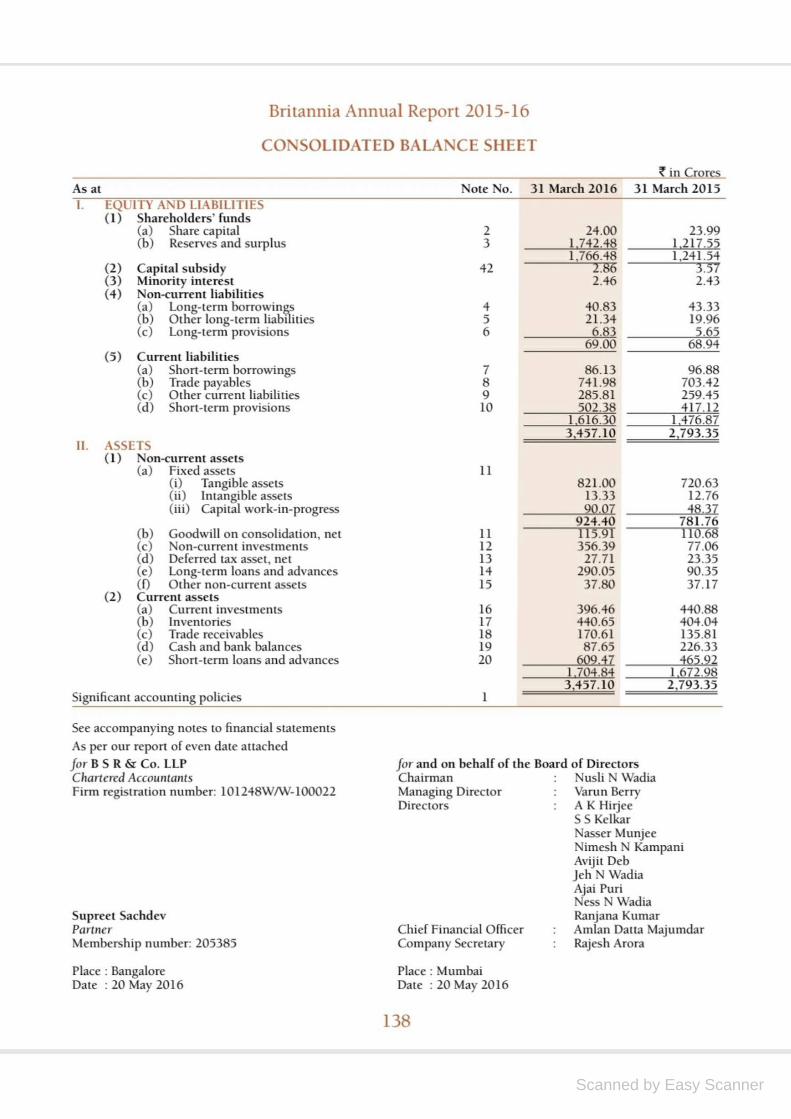
2015-16 1704.84 1616.30 1.05:1
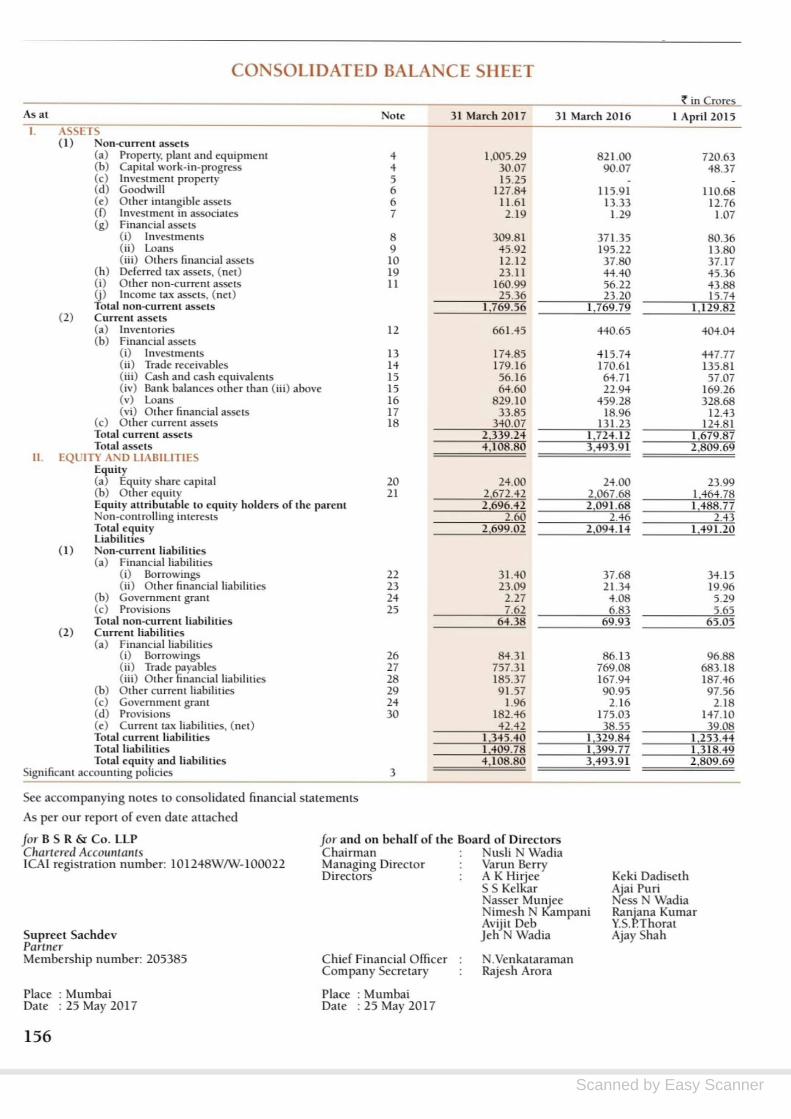
2016-17 2339.24 1345.40 1.73:1
2017-18 3151.28 1647.97 1.91:1
2018-19 3526.34 1851.41 1.90:1
2019-20 3674.97 2565.30 1.43:1
Generally current ratio of 2.1 is considered as standard. From table 4.1 it is
clear that the company fails to attain the standard ratio. The ratios are
fluctuating year by year.
Chart 4.1 showing current ratio from 2015-20.
0
0.5
1
1.5
2
2.5
2015-16 2016-17 2017-18 2018-19 2019-20
19
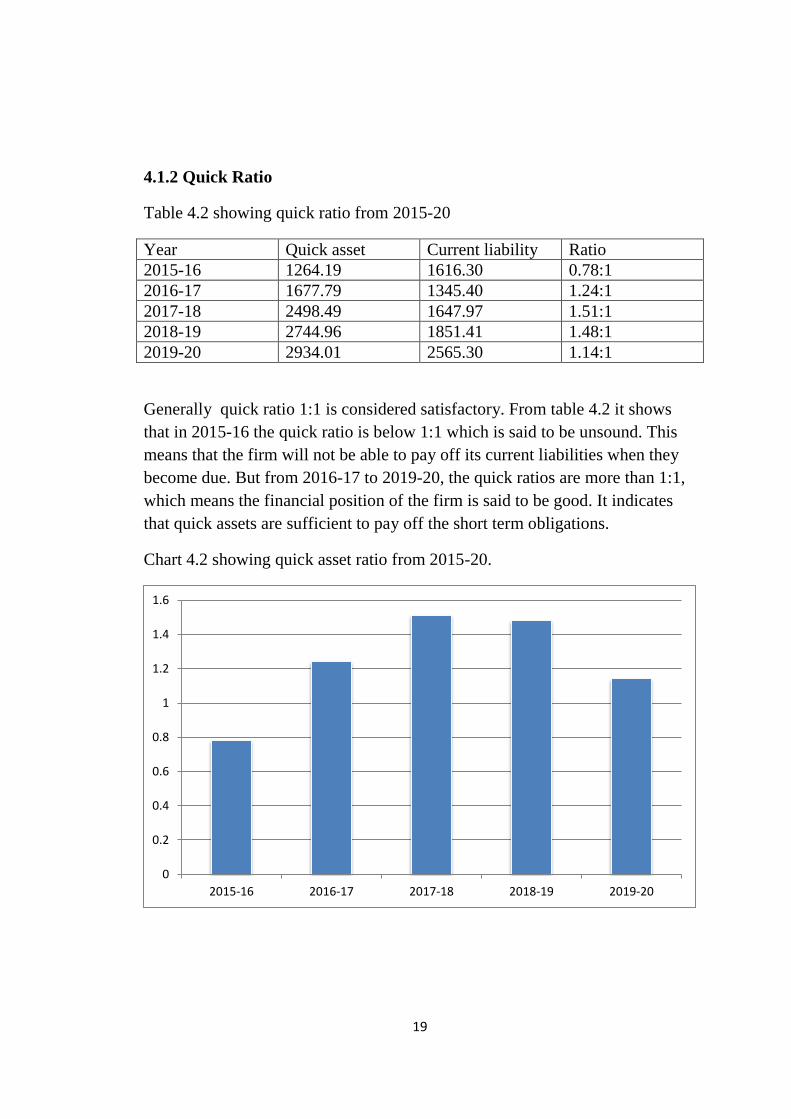
4.1.2 Quick Ratio
Table 4.2 showing quick ratio from 2015-20
Year Quick asset Current liability Ratio
2015-16 1264.19 1616.30 0.78:1
2016-17 1677.79 1345.40 1.24:1
2017-18 2498.49 1647.97 1.51:1
2018-19 2744.96 1851.41 1.48:1
2019-20 2934.01 2565.30 1.14:1
Generally quick ratio 1:1 is considered satisfactory. From table 4.2 it shows
that in 2015-16 the quick ratio is below 1:1 which is said to be unsound. This
means that the firm will not be able to pay off its current liabilities when they
become due. But from 2016-17 to 2019-20, the quick ratios are more than 1:1,
which means the financial position of the firm is said to be good. It indicates
that quick assets are sufficient to pay off the short term obligations.
Chart 4.2 showing quick asset ratio from 2015-20.
0
0.2
0.4
0.6
0.8
1
1.2
1.4
1.6
2015-16 2016-17 2017-18 2018-19 2019-20
20
4.2 Solvency Ratio
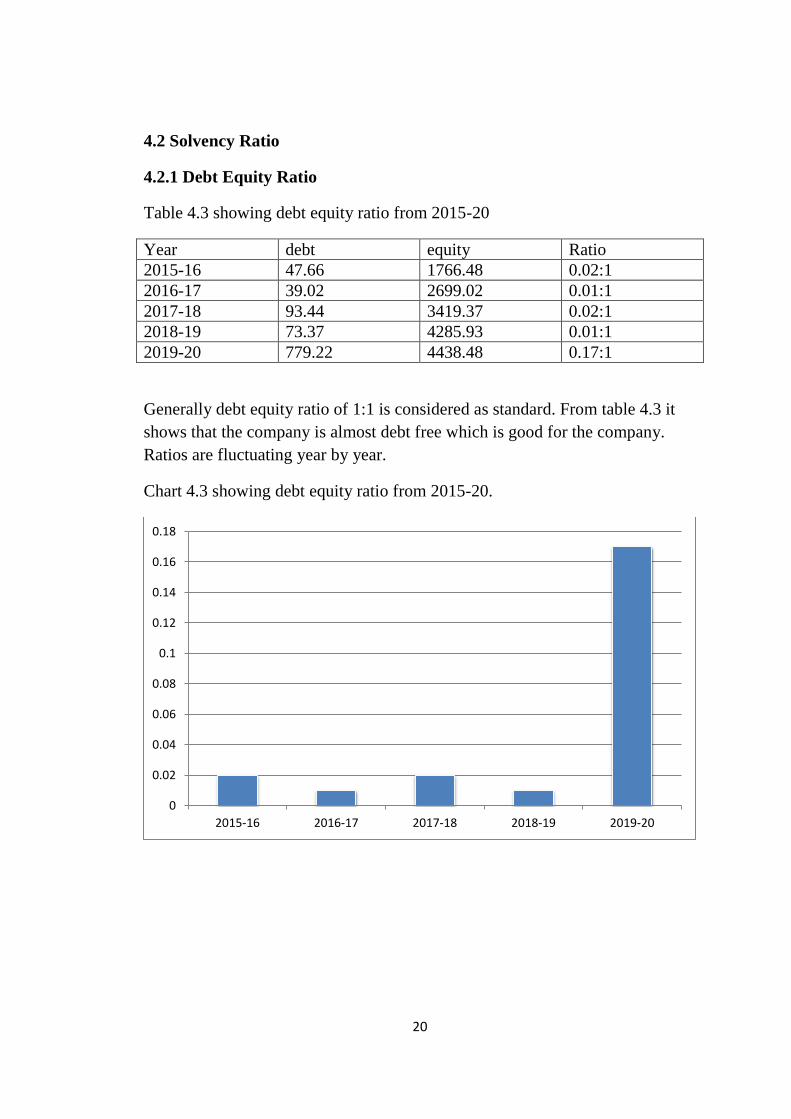
4.2.1 Debt Equity Ratio
Table 4.3 showing debt equity ratio from 2015-20
Year debt equity Ratio
2015-16 47.66 1766.48 0.02:1
2016-17 39.02 2699.02 0.01:1
2017-18 93.44 3419.37 0.02:1
2018-19 73.37 4285.93 0.01:1
2019-20 779.22 4438.48 0.17:1
Generally debt equity ratio of 1:1 is considered as standard. From table 4.3 it
shows that the company is almost debt free which is good for the company.
Ratios are fluctuating year by year.
Chart 4.3 showing debt equity ratio from 2015-20.
0
0.02
0.04
0.06
0.08
0.1
0.12
0.14
0.16
0.18
2015-16 2016-17 2017-18 2018-19 2019-20
21
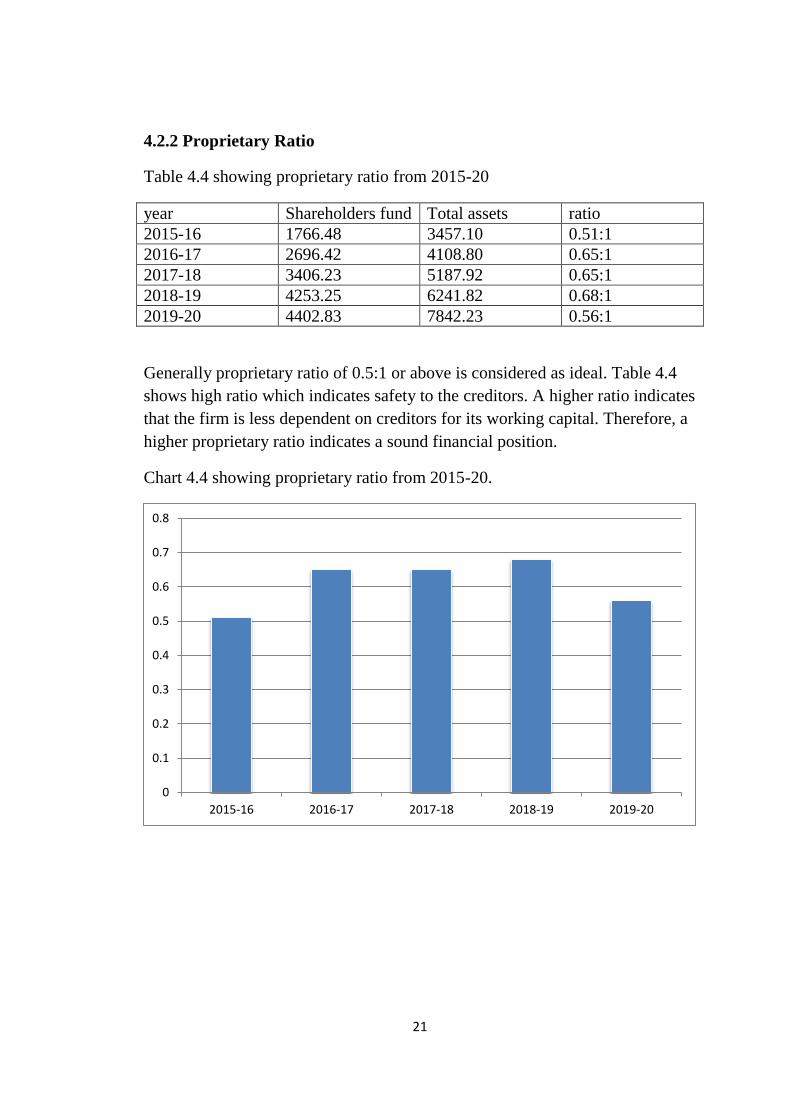
4.2.2 Proprietary Ratio
Table 4.4 showing proprietary ratio from 2015-20
year Shareholders fund Total assets ratio
2015-16 1766.48 3457.10 0.51:1
2016-17 2696.42 4108.80 0.65:1
2017-18 3406.23 5187.92 0.65:1
2018-19 4253.25 6241.82 0.68:1
2019-20 4402.83 7842.23 0.56:1
Generally proprietary ratio of 0.5:1 or above is considered as ideal. Table 4.4
shows high ratio which indicates safety to the creditors. A higher ratio indicates
that the firm is less dependent on creditors for its working capital. Therefore, a
higher proprietary ratio indicates a sound financial position.
Chart 4.4 showing proprietary ratio from 2015-20.
0
0.1
0.2
0.3
0.4
0.5
0.6
0.7
0.8
2015-16 2016-17 2017-18 2018-19 2019-20
22
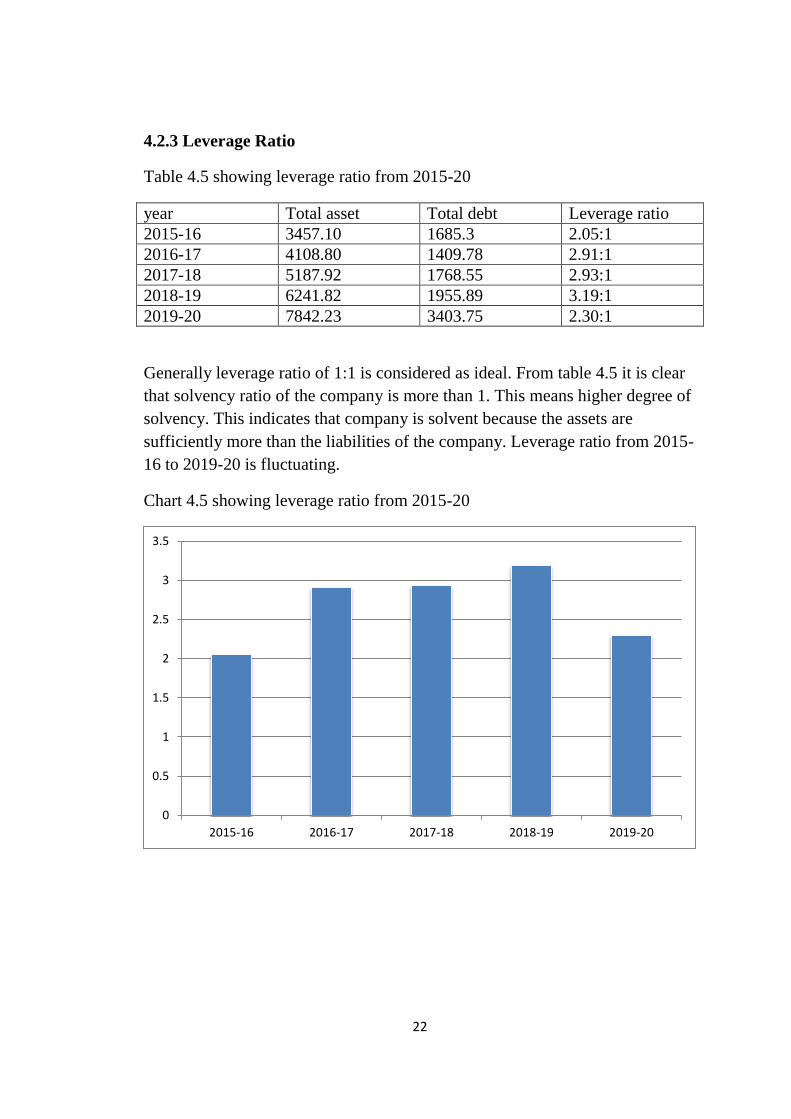
4.2.3 Leverage Ratio
Table 4.5 showing leverage ratio from 2015-20
year Total asset Total debt Leverage ratio
2015-16 3457.10 1685.3 2.05:1
2016-17 4108.80 1409.78 2.91:1
2017-18 5187.92 1768.55 2.93:1
2018-19 6241.82 1955.89 3.19:1
2019-20 7842.23 3403.75 2.30:1
Generally leverage ratio of 1:1 is considered as ideal. From table 4.5 it is clear
that solvency ratio of the company is more than 1. This means higher degree of
solvency. This indicates that company is solvent because the assets are
sufficiently more than the liabilities of the company. Leverage ratio from 2015-
16 to 2019-20 is fluctuating.
Chart 4.5 showing leverage ratio from 2015-20
0
0.5
1
1.5
2
2.5
3
3.5
2015-16 2016-17 2017-18 2018-19 2019-20
23
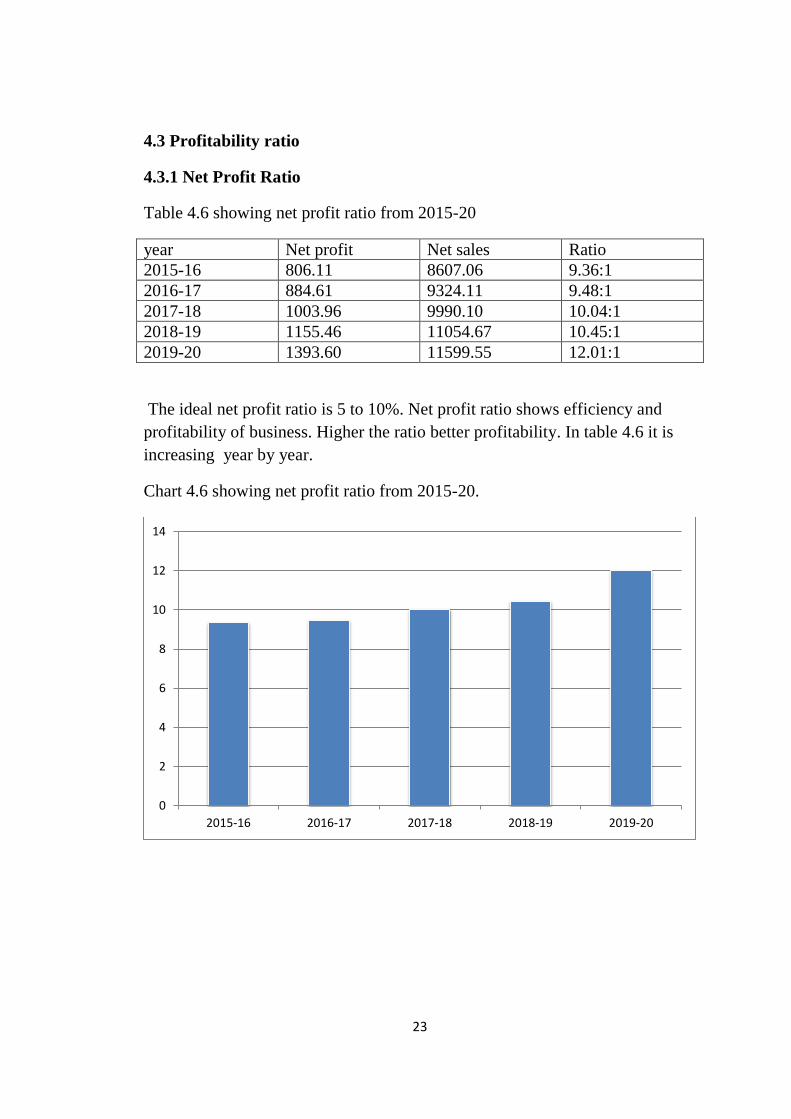
4.3 Profitability ratio
4.3.1 Net Profit Ratio
Table 4.6 showing net profit ratio from 2015-20
year Net profit Net sales Ratio
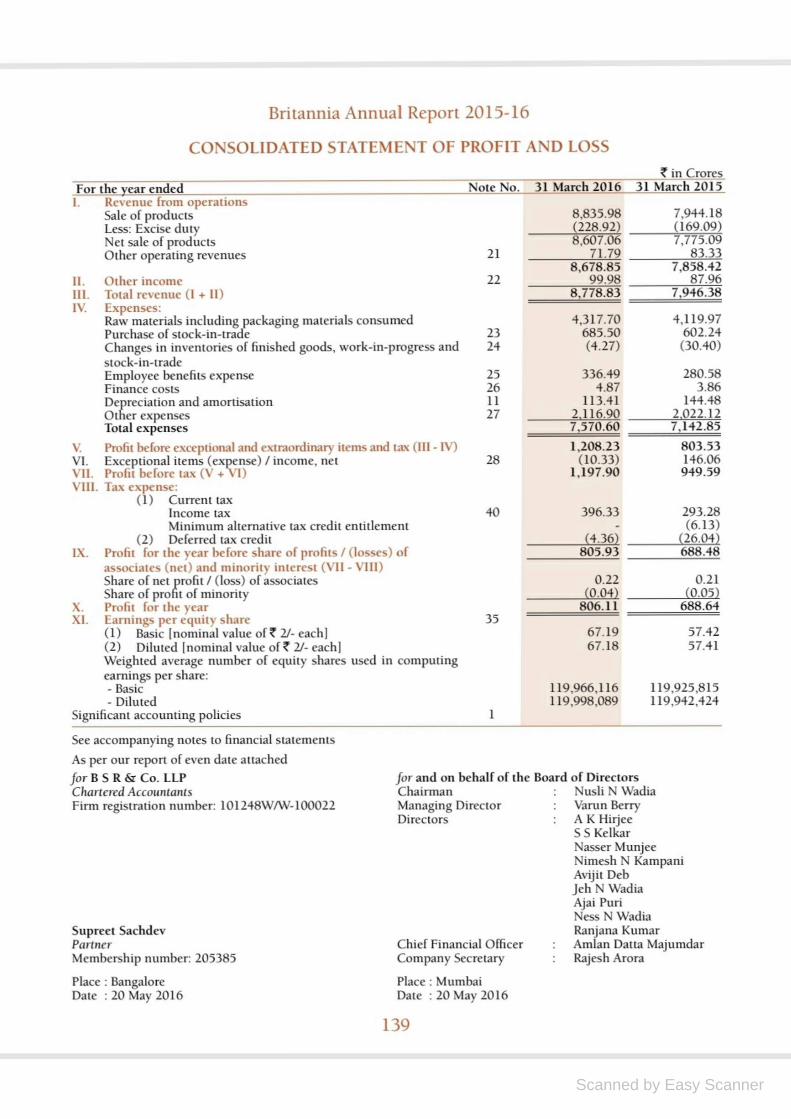
2015-16 806.11 8607.06 9.36:1
2016-17 884.61 9324.11 9.48:1
2017-18 1003.96 9990.10 10.04:1
2018-19 1155.46 11054.67 10.45:1
2019-20 1393.60 11599.55 12.01:1
The ideal net profit ratio is 5 to 10%. Net profit ratio shows efficiency and
profitability of business. Higher the ratio better profitability. In table 4.6 it is
increasing year by year.
Chart 4.6 showing net profit ratio from 2015-20.
0
2
4
6
8
10
12
14
2015-16 2016-17 2017-18 2018-19 2019-20
24
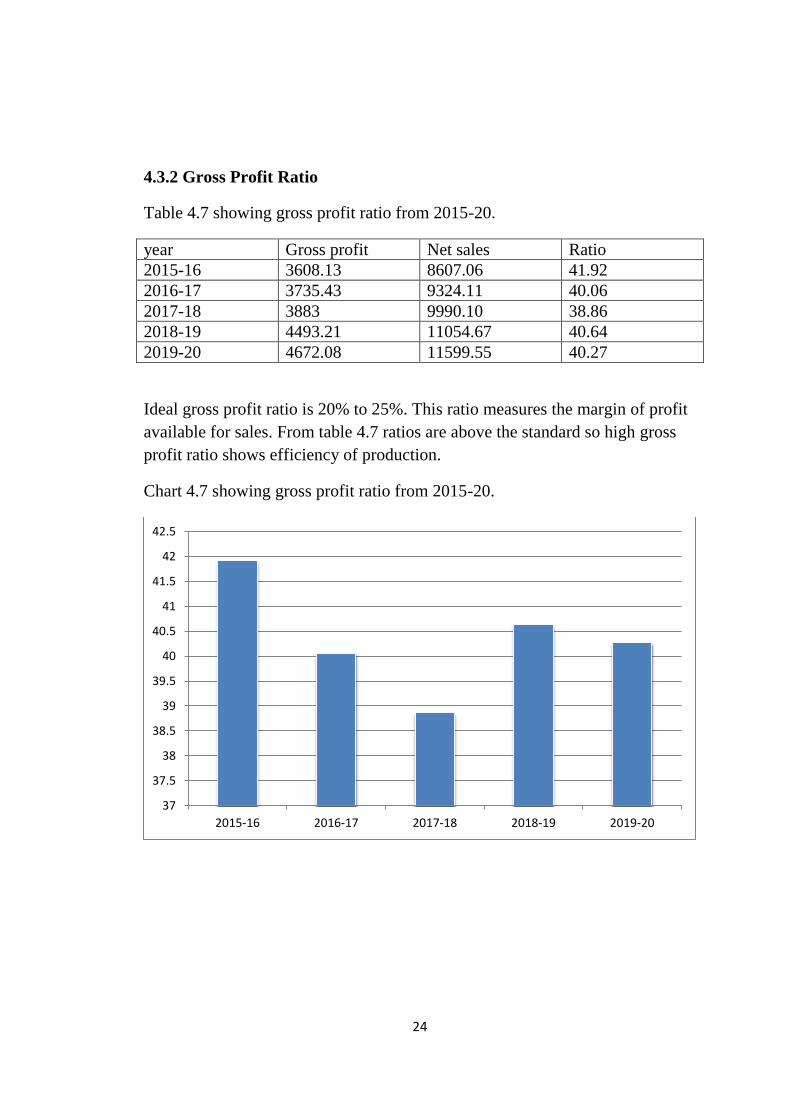
4.3.2 Gross Profit Ratio
Table 4.7 showing gross profit ratio from 2015-20.
year Gross profit Net sales Ratio
2015-16 3608.13 8607.06 41.92
2016-17 3735.43 9324.11 40.06
2017-18 3883 9990.10 38.86
2018-19 4493.21 11054.67 40.64
2019-20 4672.08 11599.55 40.27
Ideal gross profit ratio is 20% to 25%. This ratio measures the margin of profit
available for sales. From table 4.7 ratios are above the standard so high gross
profit ratio shows efficiency of production.
Chart 4.7 showing gross profit ratio from 2015-20.
37
37.5
38
38.5
39
39.5
40
40.5
41
41.5
42
42.5
2015-16 2016-17 2017-18 2018-19 2019-20
25
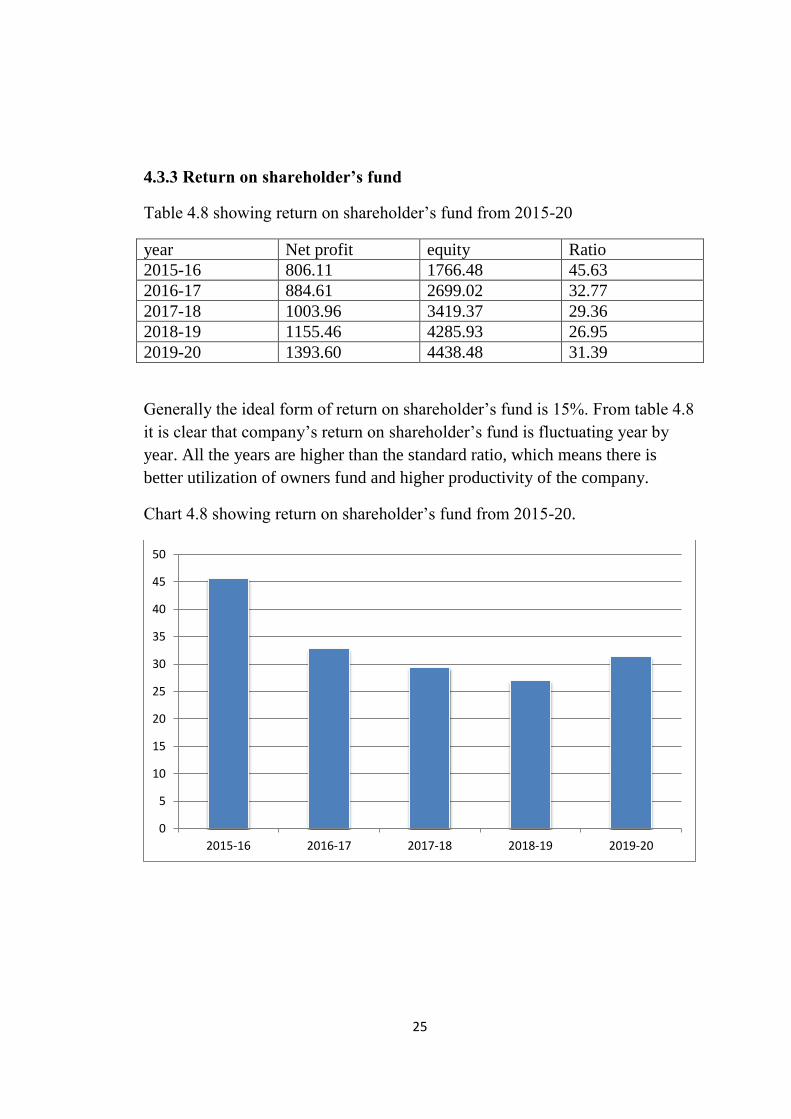
4.3.3 Return on shareholder’s fund
Table 4.8 showing return on shareholder‟s fund from 2015-20
year Net profit equity Ratio
2015-16 806.11 1766.48 45.63
2016-17 884.61 2699.02 32.77
2017-18 1003.96 3419.37 29.36
2018-19 1155.46 4285.93 26.95
2019-20 1393.60 4438.48 31.39
Generally the ideal form of return on shareholder‟s fund is 15%. From table 4.8
it is clear that company‟s return on shareholder‟s fund is fluctuating year by
year. All the years are higher than the standard ratio, which means there is
better utilization of owners fund and higher productivity of the company.
Chart 4.8 showing return on shareholder‟s fund from 2015-20.
0
5
10
15
20
25
30
35
40
45
50
2015-16 2016-17 2017-18 2018-19 2019-20
26
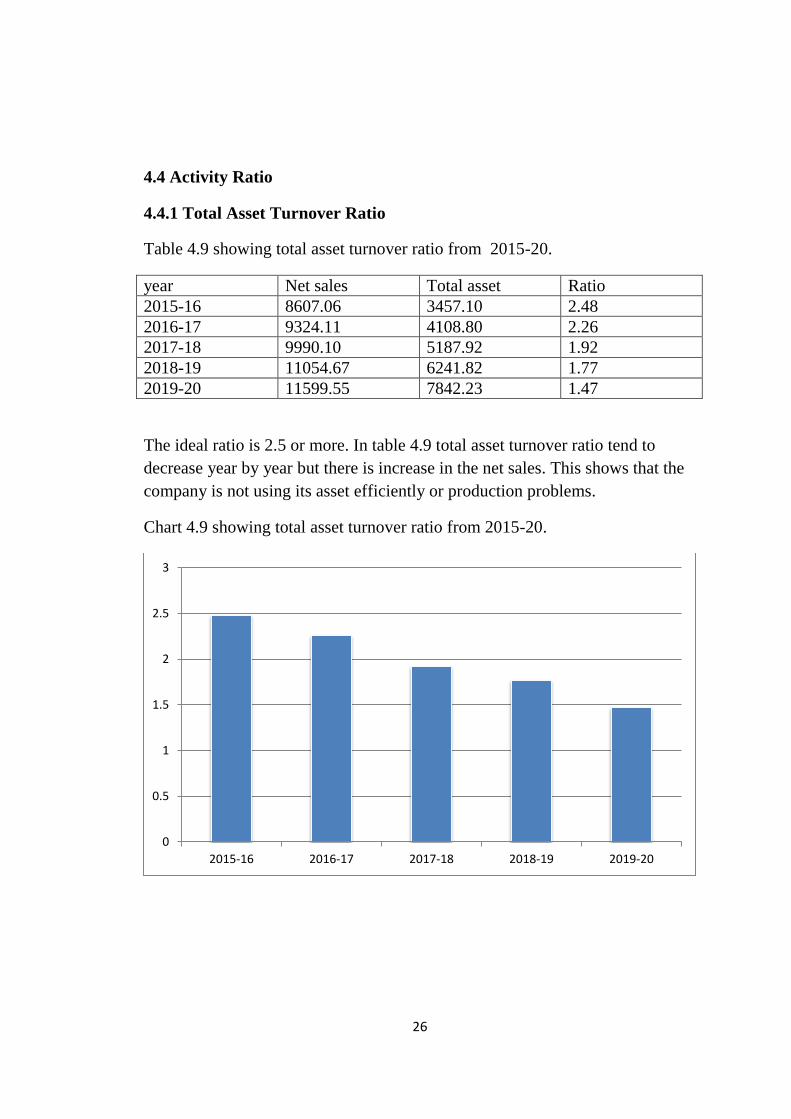
4.4 Activity Ratio
4.4.1 Total Asset Turnover Ratio
Table 4.9 showing total asset turnover ratio from 2015-20.
year Net sales Total asset Ratio
2015-16 8607.06 3457.10 2.48
2016-17 9324.11 4108.80 2.26
2017-18 9990.10 5187.92 1.92
2018-19 11054.67 6241.82 1.77
2019-20 11599.55 7842.23 1.47
The ideal ratio is 2.5 or more. In table 4.9 total asset turnover ratio tend to
decrease year by year but there is increase in the net sales. This shows that the
company is not using its asset efficiently or production problems.
Chart 4.9 showing total asset turnover ratio from 2015-20.
0
0.5
1
1.5
2
2.5
3
2015-16 2016-17 2017-18 2018-19 2019-20
27
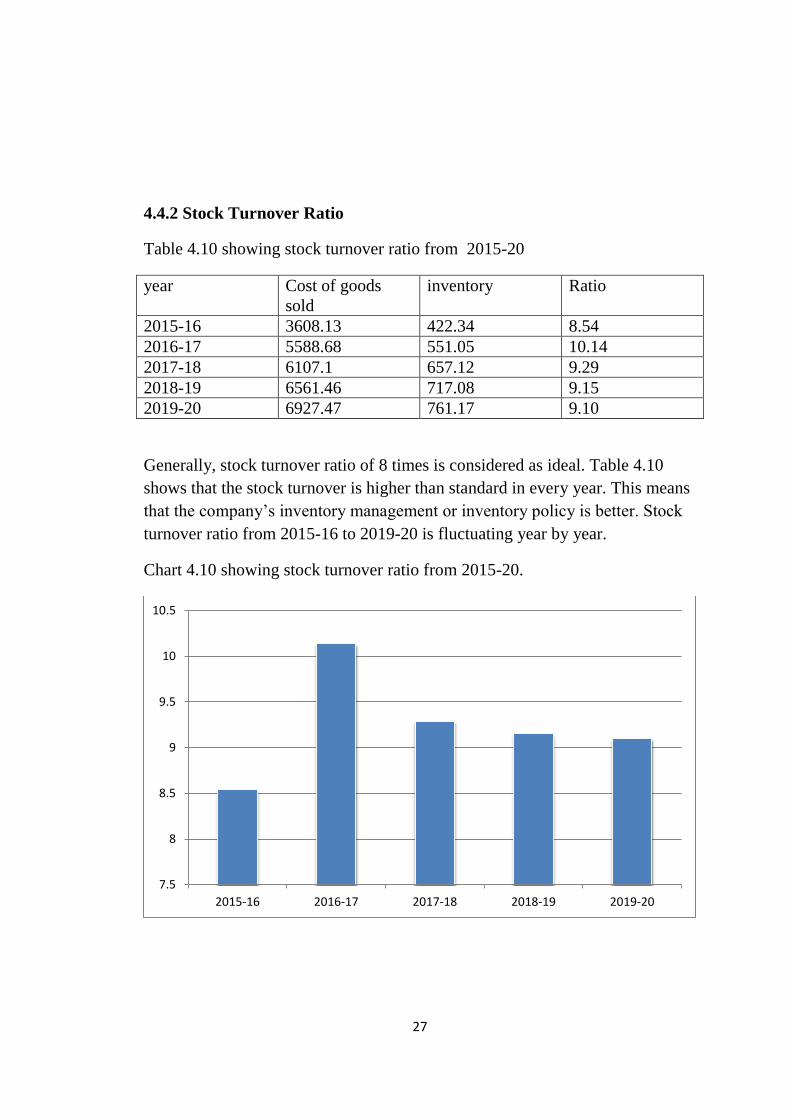
4.4.2 Stock Turnover Ratio
Table 4.10 showing stock turnover ratio from 2015-20
year Cost of goods
sold
inventory Ratio
2015-16 3608.13 422.34 8.54
2016-17 5588.68 551.05 10.14
2017-18 6107.1 657.12 9.29
2018-19 6561.46 717.08 9.15
2019-20 6927.47 761.17 9.10
Generally, stock turnover ratio of 8 times is considered as ideal. Table 4.10
shows that the stock turnover is higher than standard in every year. This means
that the company‟s inventory management or inventory policy is better. Stock
turnover ratio from 2015-16 to 2019-20 is fluctuating year by year.
Chart 4.10 showing stock turnover ratio from 2015-20.
7.5
8
8.5
9
9.5
10
10.5
2015-16 2016-17 2017-18 2018-19 2019-20
28
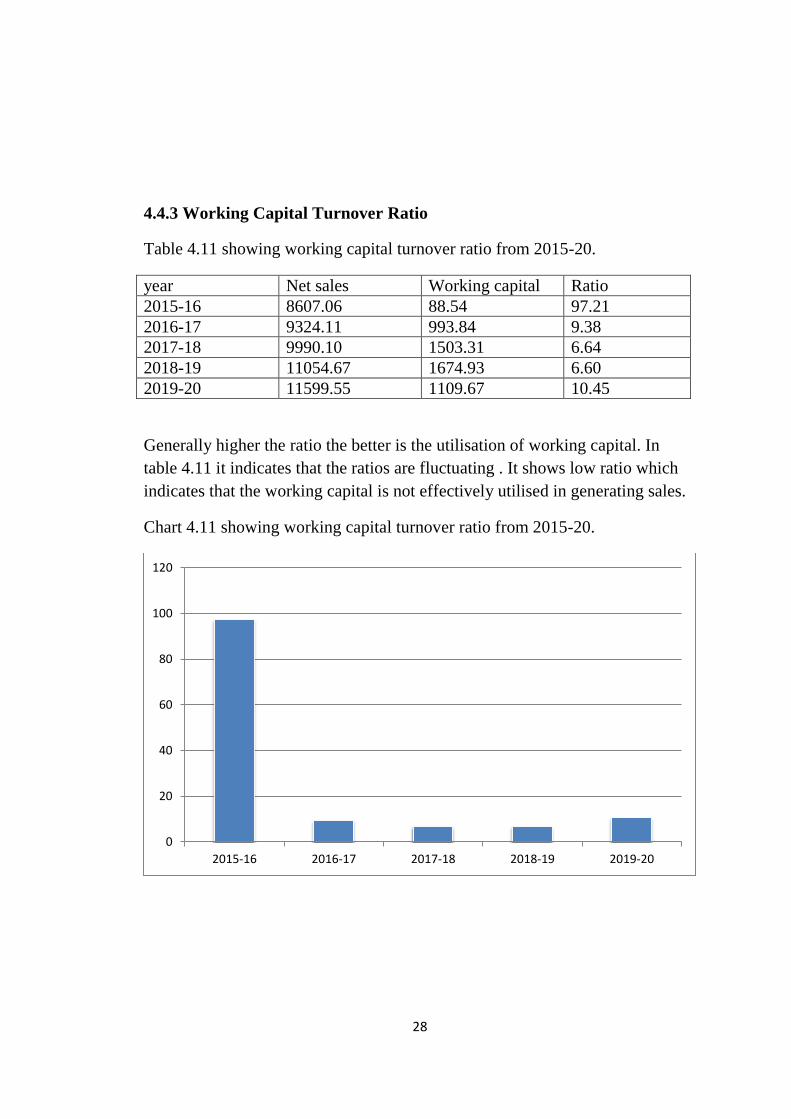
4.4.3 Working Capital Turnover Ratio
Table 4.11 showing working capital turnover ratio from 2015-20.
year Net sales Working capital Ratio
2015-16 8607.06 88.54 97.21
2016-17 9324.11 993.84 9.38
2017-18 9990.10 1503.31 6.64
2018-19 11054.67 1674.93 6.60
2019-20 11599.55 1109.67 10.45
Generally higher the ratio the better is the utilisation of working capital. In
table 4.11 it indicates that the ratios are fluctuating . It shows low ratio which
indicates that the working capital is not effectively utilised in generating sales.
Chart 4.11 showing working capital turnover ratio from 2015-20.
0
20
40
60
80
100
120
2015-16 2016-17 2017-18 2018-19 2019-20

CHAPTER 5
FINDINGS, SUGGESTIONS AND
CONCLUSION
29
5.1 Findings
The current ratio of the company fails to attain the standard ratio and are
fluctuating year by year.
The quick ratio in 2015-16 is said to be unsound and the ratios from
2016-17 to 2019-20 is said to be good.
Debt equity ratio shows that the company is almost debt free which is
good for the company.
Proprietary ratio shows high ratios which indicates safety to the
creditors and the firm has a sound position.
Solvency ratio (Leverage ratio) shows higher degree of solvency which
indicates that the assets are sufficiently more than the liabilities of the
company.
Net profit ratio shows increasing trend in the ratios which means
increasing profitability.
Gross profit ratio is above the standard so high gross profit ratio shows
efficiency of production.
Return on shareholder‟s fund are higher which means there is better
utilization of owners fund and higher productivity of company.
Total asset turnover ratio tends to decrease year by year which shows
that the industry is not using its assets efficiently.
Stock turnover ratio is higher than the standard ratio every year which
means the company‟s inventory policy is better.
Working capital turnover ratio shows that the ratios are fluctuating and
the working capital is not effectively utilized in generating sales.
30
5.2 Suggestions
Company must try to use working capital effectively for generating sales
and increasing activity ratio.
Company has to concentrate on debt capital to have smooth running of
the company.
The company must start using its assets efficiently as there has been
decrease in the total asset turnover ratio year by year.
It will be better if the company decreases its current liability to improve
the liquidity position.
The company can use effective cost control methods for future growth.
5.3 Conclusion
The project is entitled on “FINANCIAL ANALYSIS OF BRITANNIA
INDUSTRIES LIMITED”. Utmost care has been taken at all levels of the
project work, right from the beginning of analysing accounting information
provided by profit and loss account and balance sheet.
The study highlights that the financial performance of Britannia Industries Ltd
is satisfactory. This study helped you to know the financial strength and
weakness of the company. Under liquidity ratio, current ratio shows a negative
sign and quick ratio shows a positive sign. The solvency ratio and the
profitability ratio overall shows a positive signs. Under activity ratio, total asset
turnover ratio and working capital turnover ratio shows a negative sign,
whereas stock turnover ratio shows a positive sign. The financial statements of
the company was analysed and interpreted with the help of balance sheet and
profit& loss account of last 5 years 2015-20. The company has a scope of
improvement in the future.

BIBLIOGRAPHY
References
A. Vinod (2011), Accounting for Management.
Balagopalan Nayar, “Food processing industries in India-Regulatory
Framework”, pp 210.
Da-Wen-Sun (2006), “ Emerging Technologies in Food Processing”, pp
629-635.
H. Das (2005), “ Food Processing Operations Analysis”, pp 416.
Kakali Majumdar (2013), “ Export Performance of Processed Food in
India”, Vol 3, pp 261-270.
Kalamkar S.S (2007), “ Export Opportunities and challenges for Indian
Organic Foods”, Vol 19, pp 230.
P.K Chattopadhyay (2012), “ Profitable Agro Based Projects with
Project Profiles”, pp 216.
Premkumar.T, (2006) „FOOD AND DRUG INDUSTRY IN INDIA
"AN OVERVIEW", pp 169.
Tony Weis (2007), “ The Global Food Economy: The Battle for the
Future of Farming”, London: Zed Books, 2017, pp 217.
Vinay M Sharma (2003), “50 Best Home Businesses to start with Rs
50,000”, pp 255.
Websites
http//en.wikipedia.org

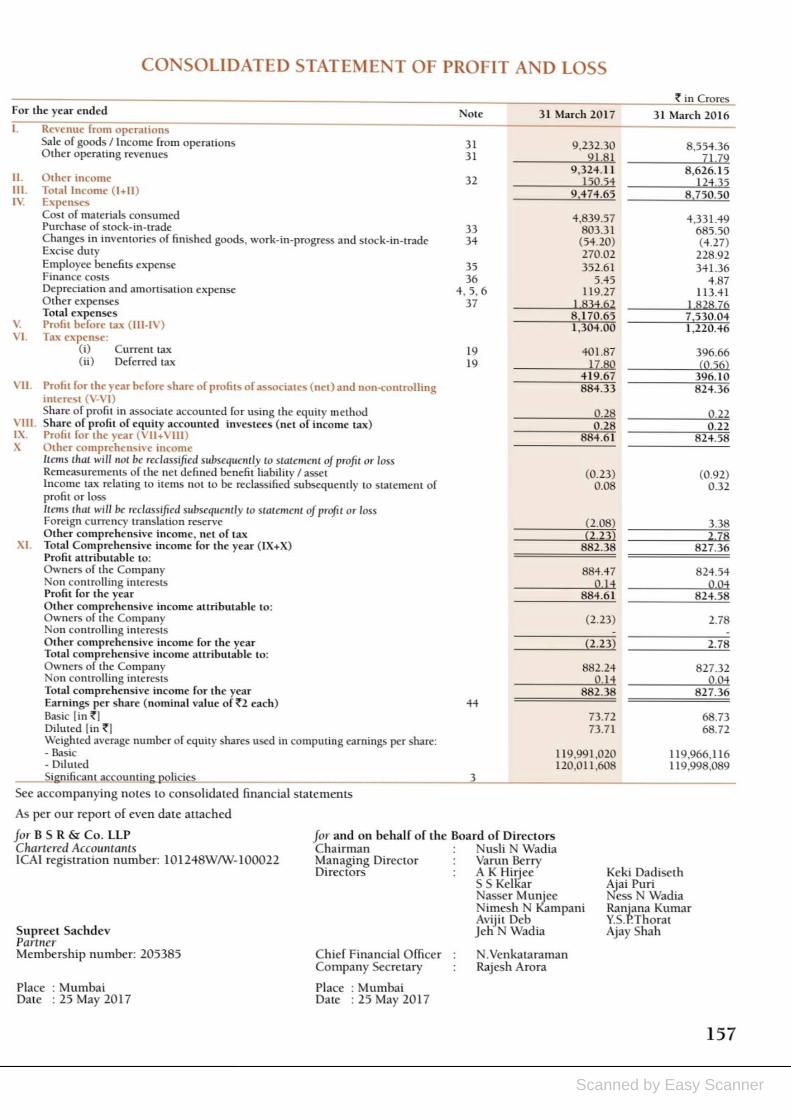
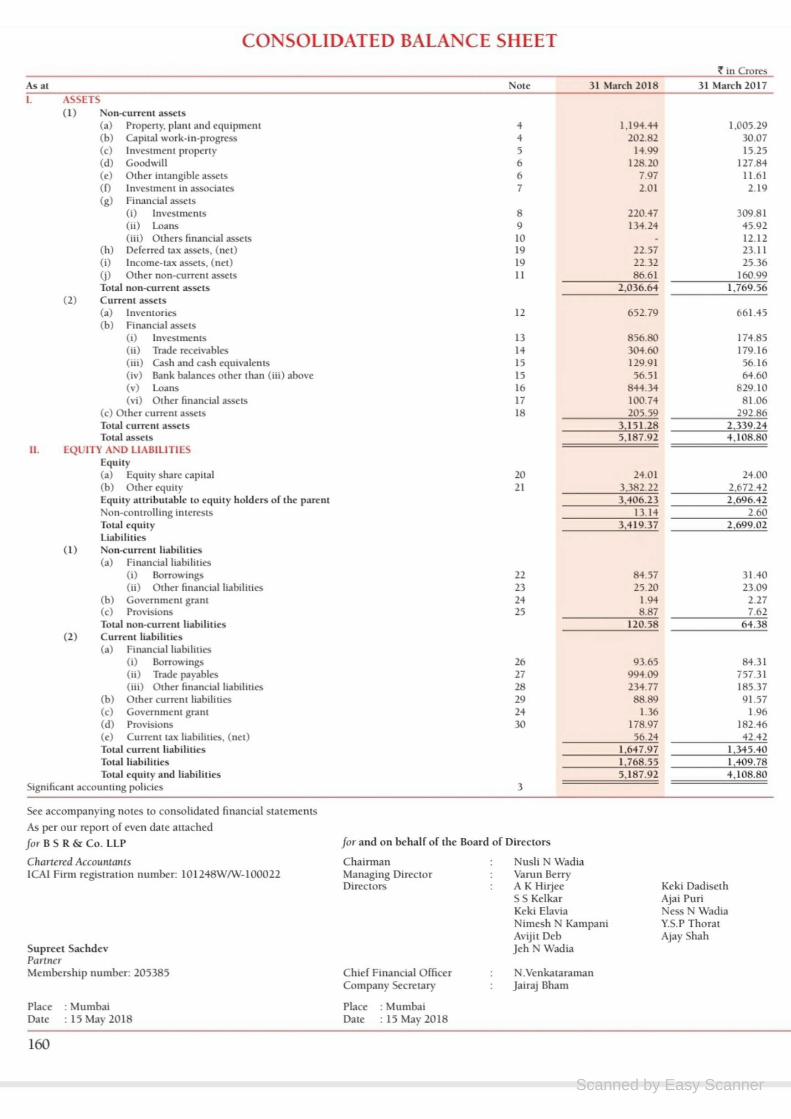
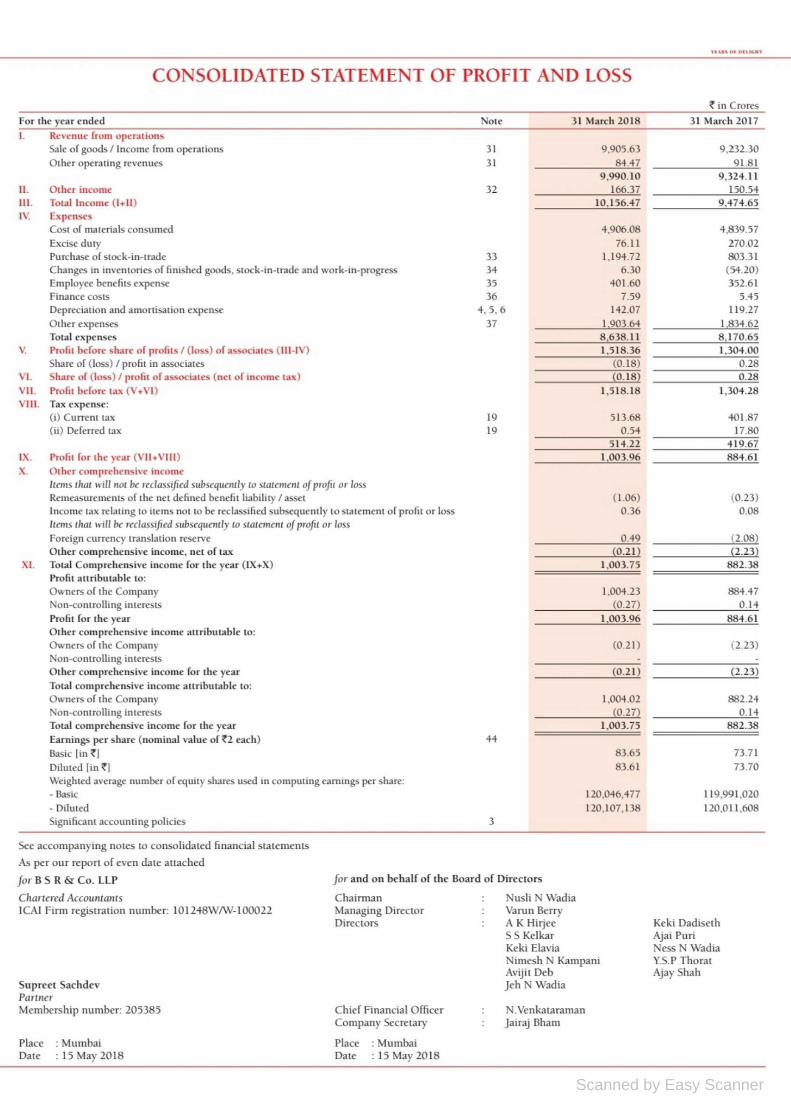
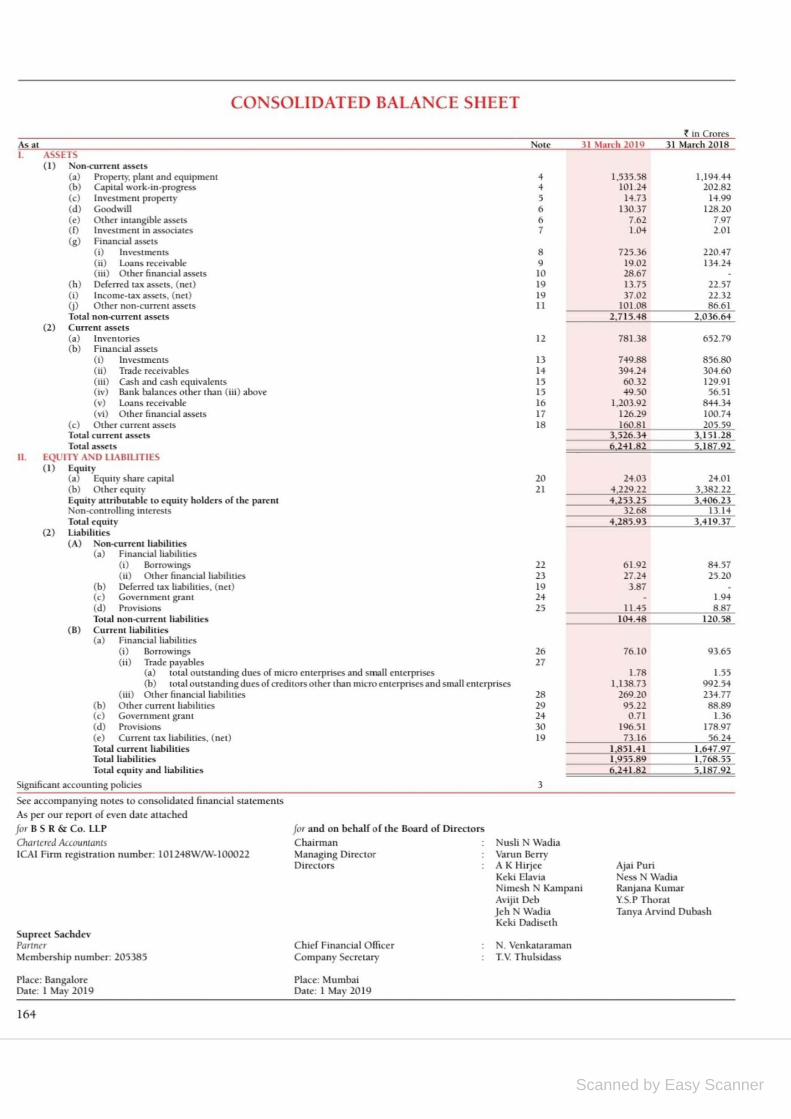
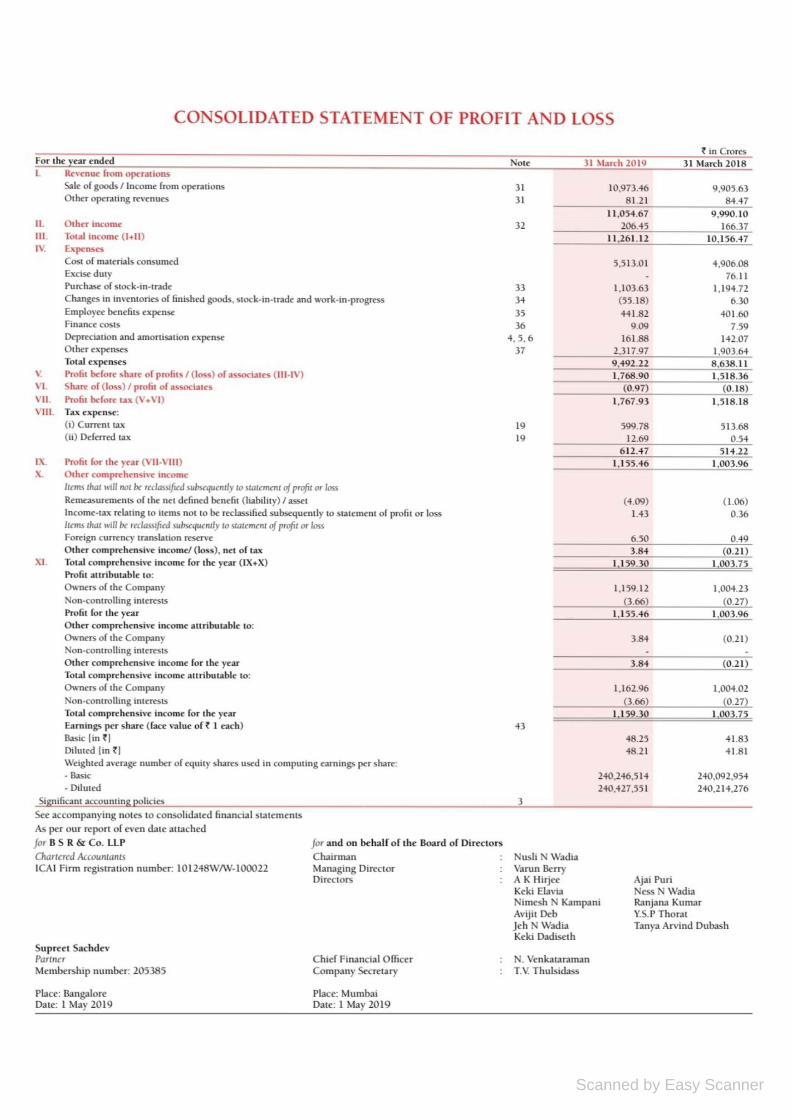
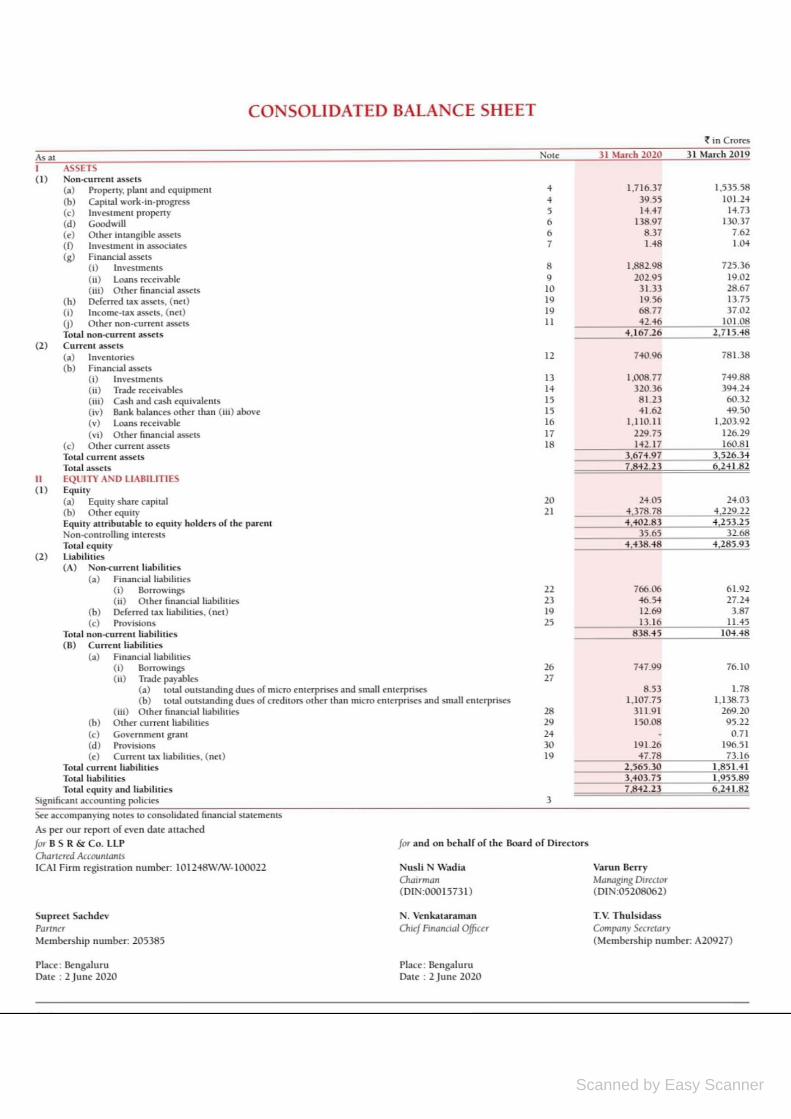
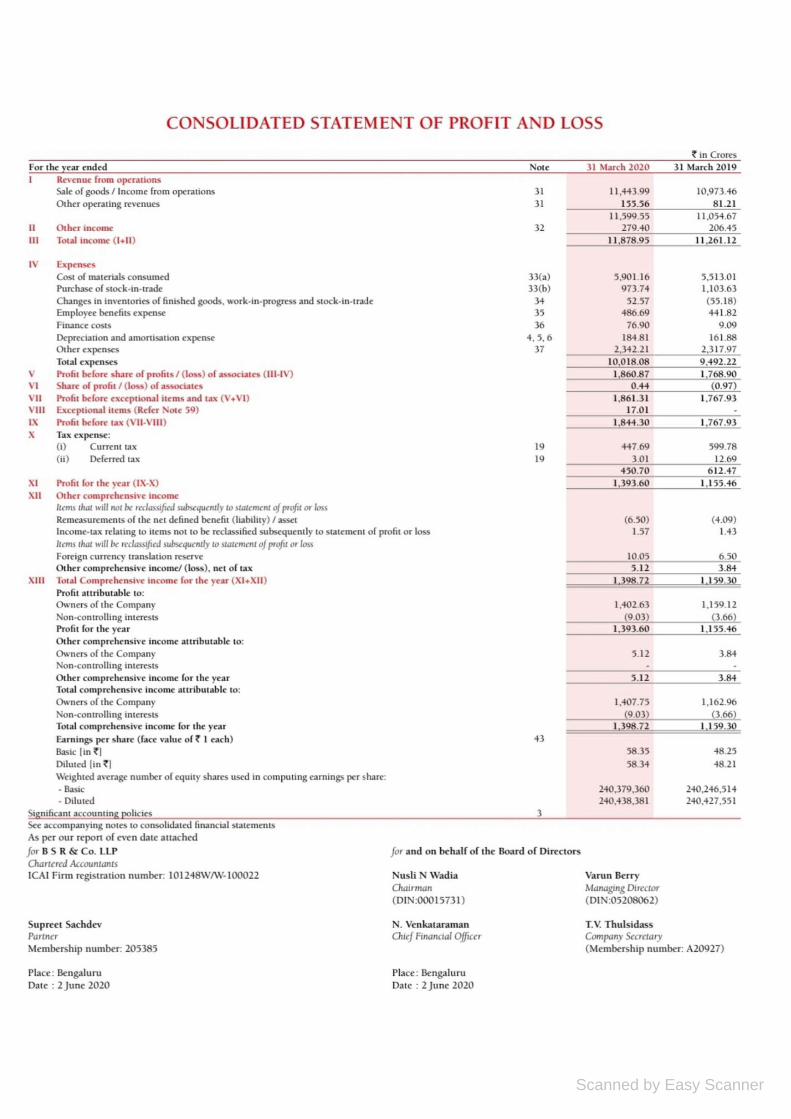
APPENDIX
Scanned by Easy Scanner
Scanned by Easy Scanner
Scanned by Easy Scanner
Scanned by Easy Scanner
Scanned by Easy Scanner
Scanned by Easy Scanner
Scanned by Easy Scanner
Scanned by Easy Scanner
Scanned by Easy Scanner
Scanned by Easy Scanner