Embed Size (px)
Citation preview
www.rudrashares.com 1
EIL will be the direct beneficiary from any structural change in the
auto demand owing to its leadership position having 60% market
share in the automotive battery and 86% market share in 2W
Looking ahead, expect the demand scenario for 2W to remain ro-
bust in next couple of years led by increased rural income, higher
MSP and new product launches by OEMs.
Company is well poised for cyclical uptick in OEM within automo-
tives and inverters and telecom segment within industrial batteries.
With an enriched portfolio, consistent focus on innovation, opera-
tional efficiencies, distribution network & service delivery, EXIDE is
setting new trends for the industry to provide customer with dif-
ferentiated experience and reach the next level of brand visibility
and reputation.
LEAD RATIONALE
BUY | CMP 226| TARGET 262 | POTENTIAL UPSIDE 16% 12 MARCH 2019
FUNDAMENTAL COVERAGE
RUDRA SHARES &
STOCK BROKERS LTD
EXIDE INDUSTRIES LTD
Index Detail
Sensex 37535.66
Nifty 11301.20
Index S&P BSE 100
M.Cap (` in cr) 19210
Equity ( ` in cr) 85
52 wk H/L ` 304/194
Face Value ` 1.00
Div. Yield 0.88%
NSE Code EXIDEIND
BSE Code 500086
Stock Data
Well placed to cater to demand recovery
Current growth in automobile sales translates into medium and long-
term opportunity for sale of replacement batteries. The rapid growth
in E-rickshaw population continues unabated and is quickly becoming
a huge source of business for aftermarket sales. Strong brand equity,
exceptional channel partnerships and technology leadership that com-
pany enjoys, places it in a unique position to leverage the
emerging opportunities and translate them into profitable
growth.
Moreover, we remain positive on demand and earnings prospects, owing to strong growth in underly-
ing segments, and the company's renewed strategy for technological up gradation and better after-
sales service. New product lines like SF Sonic brand and Boss/Dynex positioned at competitive
price points are expected to support market share gains from the unorganized players. It is a
technologically advanced player verses its peers and was one of the early ones to use grid technol-
ogy to manufacture batteries and also started working ahead of its peers in the Li-Ion battery
space. Although , it already has a couple of meaningful tie ups in this space.
P/E 25.68
EV/EBITDA 13.23
P/BV 3.2
RONW(%) 12%
Valuation Data
www.rudrashares.com 2
EIL entered into a JV with Switzerland based Leclanche to build
lithium-ion batteries & energy storage solutions to cater to India’s EV
market. Also, with its existing capacity utilization of 75%, EIL ac-
quired the plant of Tudor India that will help EIL serve the rising de-
mand. While the module and battery pack assembly line is due in
the next three months, the Li-ion cell production plant is slated
to be operational by mid-2020, would add to improve com-
pany’s performance and lower the raw material cost to some
extent.
Further, company would also be investing in producing batteries that
consume less lead, using technology sourced from Advanced Batter
Concepts of the US. These product lines would help Exide in reduc-
ing its dependence on conventional lead-acid batteries which have
been suffering from intense competition from rival Amara Raja as well as from the vagaries of lead price fluctuation that has been
impacting its margins and bottom-line .
Technology tie-up -
Exide JV gets a big
boost ahead of Li-
ion battery opera-
tions in India
Eyes HALDIA for next Expansion
Company is looking at a self-funded two pronged strategy for expansion at its Haldia facility in
West Bengal. A bulk of the capex will be invested in two new projects that includes a Greenfield
battery recycling plant and also the expansion of current battery manufacturing capacities The
company has envisaged setting up of a 40,000 square metre shed to carry out three activities.
This includes manufacturing of Nickel-Cadmium batteries, setting up of a mega charging station
and an additional battery manufacturing capacity. Nickel-Cadmium batteries will be manufactured
in technical collaboration with Furukawa of Japan and find application in bullet trains and metro
rail The new lead recycling plant in Haldia will have a monthly capacity of 15,000 metric tones
and has been set up in collaboration with Energitech Technologies, Italy. It has deployed the state-
of-art technologies conforming to technical norms set by the Basel Convention, this move will
make Haldia one of the largest and integrated self-sufficient battery making centers in South
-East Asia, where company will manufacture everything from recycled lead to finished bat-
tery.
FUNDAMENTAL COVERAGE
RUDRA SHARES &
STOCK BROKERS LTD
EXIDE INDUSTRIES LTD
www.rudrashares.com 3
An Eye on Quarterly numbers
Q3 numbers for Exide did not turn out to be very fruitful. Net profit stood at `155 crore, mainly
due to higher tax rate. Revenue stood at `2497 cr against ` 2278cr, registering growth of 10%
against previous year. EBITDA margin improved marginally 11bps at 12.5 % against 12.4 % in
the previous year quarter primarily due to higher other expenses. Though, volumes in Automotive,
Motorcycle, UPS and Solar Batteries in Quarter 3 have grown well.
For the nine months ended December 31, 2018, net turnover was ` 7989.65 crores as compared to
` 6726.90 crores in the same period of previous year. PBT was ` 933.45 crores and PAT `633.37
crores in the nine months period ended December 31, 2018 period.
FUNDAMENTAL COVERAGE
RUDRA SHARES &
STOCK BROKERS LTD
EXIDE INDUSTRIES LTD
Particulars Q3 FY 19 Q3 FY 18 Variation % Dec. 18 Dec. 17 Variation %
Revenue 2496.84 2278.29 9.59 7989.65 6726.90 18.77
EBITDA 320.52 293.63 9.16 1168.28 899.03 29.95
PBT 236.88 230.16 2.92 933.45 715.91 30.39
PAT 155.04 154.27 0.50 633.37 478.79 32.29
EPS 1.82 1.82 - 7.45 5.63 32.33
Key Financials (` in crores)
EV 20194.79
Net Worth 6003.01
BV 70.62
EPS(TTM) 8.80
Financial Data
FY 20 Est. Earnings 954.94
Equity Share Capital 85.00
FV 1.00
No. of Equity Shares 85.00
EPS(FY20 Est.) 11.23
Estimated P/E Ratio 23
Estimated Price/share 262
VALUATION ( ` in crores except per share)
` In crores except EPS
www.rudrashares.com 4
FUNDAMENTAL COVERAGE
RUDRA SHARES &
STOCK BROKERS LTD
EXIDE INDUSTRIES LTD
SWOT ANALYSIS
Strengths
Dominating brand name
Highest market share across categories in auto-
motive batteries
Deep relationship with OEMs
Best distribution network
Free service at any Exide center.
Acquisition of smaller firms has strengthened
its presence
Weaknesses
Dependence on OEM sales, which is generally
cyclical in nature
Higher cost structure
Intense competition
Opportunities
Opportunity to gain market share in the indus-
trial segment
Gain share from unorganized players in the re-
placement market who dominate 40% share
Price sensitive customers are increasing.
Expansion into new territories and global ex-
pansion
Threats
Slower economic activity and passenger vehicle
market
Increasing competitive activity
Growing perception of Amaron as the better
battery brand.
Industry Outlook India is a prominent auto exporter and has strong export
growth expectations for the near future. Automobile exports
grew 20.78 % during April-November 2018. In addition, sev-
eral initiatives by the Government of India and the major
automobile players in the Indian market are expected to
make India a leader in the 2W and 4W market in the
world by 2020. The passenger vehicle sales in India is ex-
pected increase to 10 million units by FY20.
www.rudrashares.com 5
2W dominate the industry and made up 81 % share in the domestic automobile sales in FY18.
Overall, Domestic automobiles sales increased at 7.01 % CAGR between FY13-18 with 24.97 mil-
lion vehicles being sold in FY18.Domestic automobile production increased at 7.08 % CAGR be-
tween FY13-18 with 29.07 million vehicles manufactured in the country in FY18. During April-
December 2018, automobile production increased by 11.34 per cent year-on-year to reach 23.86
million units.
Automobile exports grew by 18.53 % during April-December 2018. It is expected to grow at
a CAGR of 3.05 % during 2016-2026. Also, Luxury car market in India is expected to grow
at a 25 % CAGR till 2020. The Government of India expects automobile sector to attract
US$ 8-10 billion in local and foreign investments by 2023.
FUNDAMENTAL COVERAGE
RUDRA SHARES &
STOCK BROKERS LTD
EXIDE INDUSTRIES LTD
Outlook and Recommendation
Company is expected to improve its market share, given the prospects of economic recovery-led
demand from auto OEMs and the industrial segment. Early signs of improvement are visible in the
4W replacement segment, driven by a sharp improvement in sales and service processes. More-
over, company is likely to benefit from expected improvement in replacement demand on the back
of healthy primary sales, gaining market from unorganized players, Traction in the nascent e-
rickshaws /solar battery segments and strengthening distribution network through introduction of
the sub-distributor model.
Going forward, company’s Cost Control measures and Technology up gradation strategies
would help to improve the bottom-line. Also, tie up for batteries having lithium-ion cell tech-
nology at its plant is expected to become operational by mid-2020 would add to improve
company’s performance and lower the raw material cost to some extent. As, electric vehicles
to be the next leg for growth combined with 2W growth expected to remain strong in the
years to come due to increase in consumption & rural income. We remain positive for the
sector and Exide industries to maintain its share in the market.
However, continued escalation in lead prices remains a major concern. Adding to that,
muted auto sales numbers and competition pressures are also pulling back the margins
Estimating the share price of the company as per P/E valuation
P/E of FY20 E at 23x , EPS (Est.) at `11.23, the estimated share price for next 1 year tenure
turns around to be ` 262. We recommend to BUY this script.
www.rudrashares.com 6
FUNDAMENTAL COVERAGE
RUDRA SHARES &
STOCK BROKERS LTD
EXIDE INDUSTRIES LTD
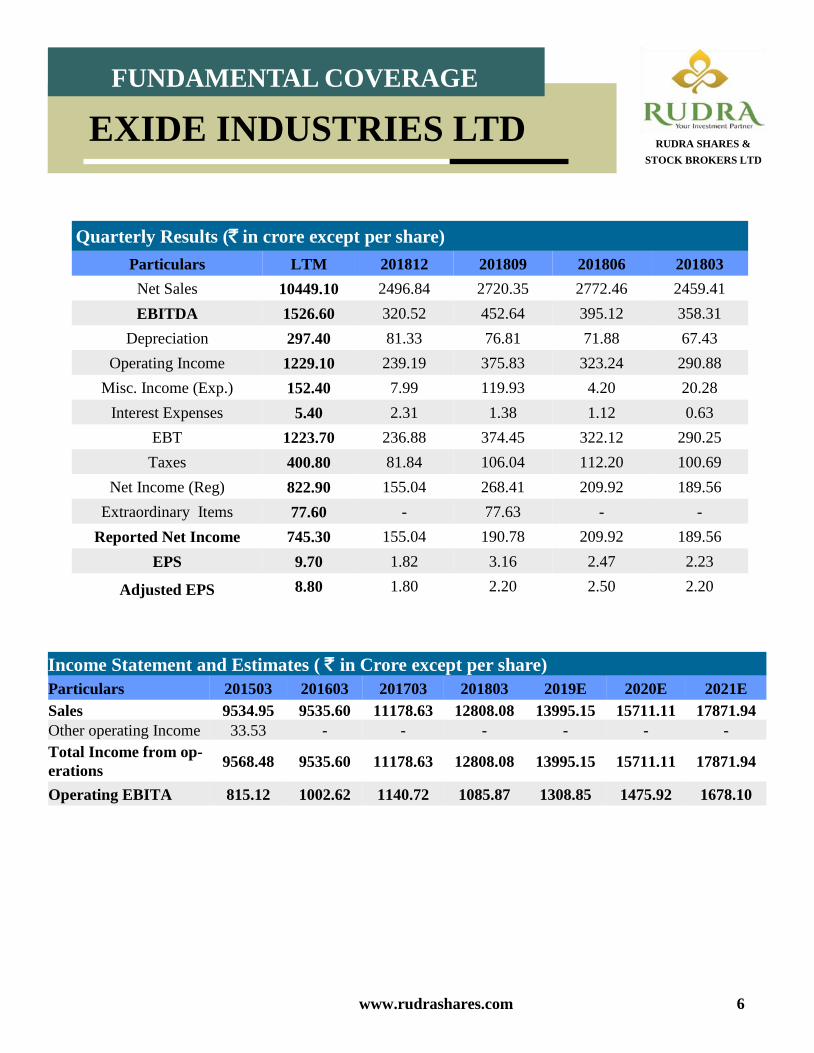
Quarterly Results (` in crore except per share)
Particulars LTM 201812 201809 201806 201803
Net Sales 10449.10 2496.84 2720.35 2772.46 2459.41
EBITDA 1526.60 320.52 452.64 395.12 358.31
Depreciation 297.40 81.33 76.81 71.88 67.43
Operating Income 1229.10 239.19 375.83 323.24 290.88
Misc. Income (Exp.) 152.40 7.99 119.93 4.20 20.28
Interest Expenses 5.40 2.31 1.38 1.12 0.63
EBT 1223.70 236.88 374.45 322.12 290.25
Taxes 400.80 81.84 106.04 112.20 100.69
Net Income (Reg) 822.90 155.04 268.41 209.92 189.56
Extraordinary Items 77.60 - 77.63 - -
Reported Net Income 745.30 155.04 190.78 209.92 189.56
EPS 9.70 1.82 3.16 2.47 2.23
Adjusted EPS 8.80 1.80 2.20 2.50 2.20
Income Statement and Estimates ( ` in Crore except per share)
Particulars 201503 201603 201703 201803 2019E 2020E 2021E
Sales 9534.95 9535.60 11178.63 12808.08 13995.15 15711.11 17871.94
Other operating Income 33.53 - - - - - -
Total Income from op-
erations 9568.48 9535.60 11178.63 12808.08 13995.15 15711.11 17871.94
Operating EBITA 815.12 1002.62 1140.72 1085.87 1308.85 1475.92 1678.10
www.rudrashares.com 7
FUNDAMENTAL COVERAGE
RUDRA SHARES &
STOCK BROKERS LTD
EXIDE INDUSTRIES LTD
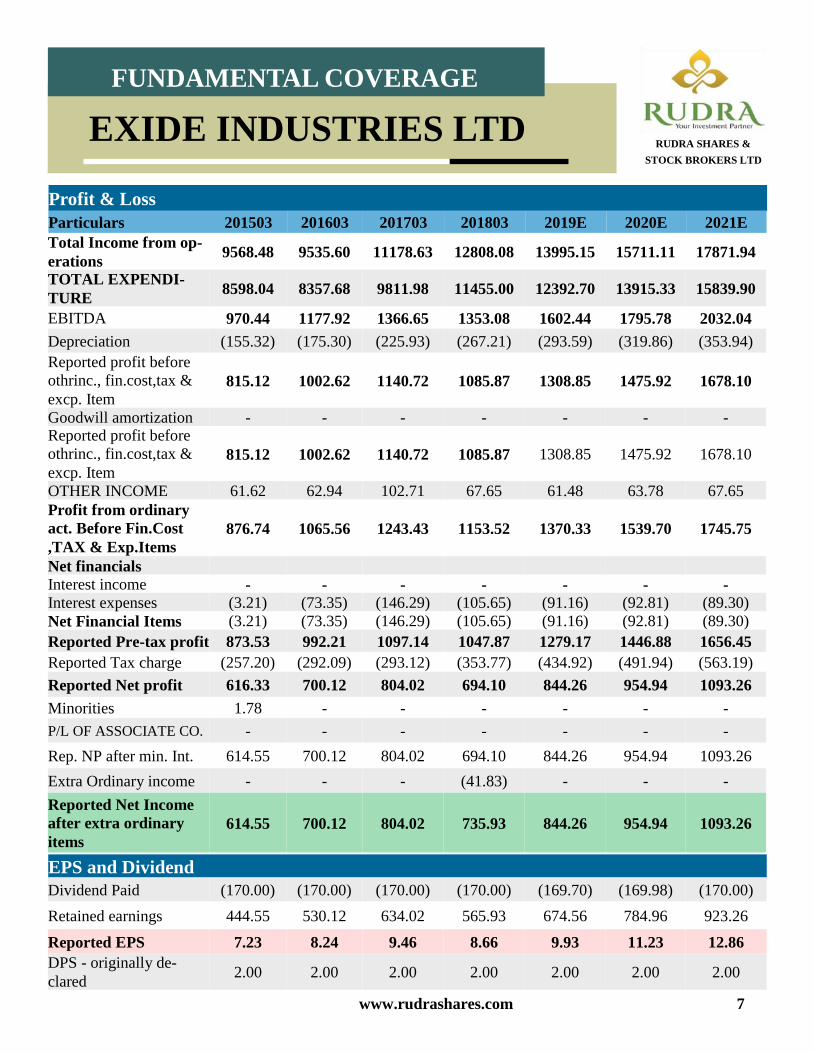
Total Income from op-
erations 9568.48 9535.60 11178.63 12808.08 13995.15 15711.11 17871.94
TOTAL EXPENDI-
TURE 8598.04 8357.68 9811.98 11455.00 12392.70 13915.33 15839.90
EBITDA 970.44 1177.92 1366.65 1353.08 1602.44 1795.78 2032.04
Depreciation (155.32) (175.30) (225.93) (267.21) (293.59) (319.86) (353.94)
Reported profit before
othrinc., fin.cost,tax &
excp. Item 815.12 1002.62 1140.72 1085.87 1308.85 1475.92 1678.10
Goodwill amortization - - - - - - - Reported profit before
othrinc., fin.cost,tax &
excp. Item 815.12 1002.62 1140.72 1085.87 1308.85 1475.92 1678.10
OTHER INCOME 61.62 62.94 102.71 67.65 61.48 63.78 67.65
Profit from ordinary
act. Before Fin.Cost
,TAX & Exp.Items
876.74 1065.56 1243.43 1153.52 1370.33 1539.70 1745.75
Net financials
Interest income - - - - - - -
Interest expenses (3.21) (73.35) (146.29) (105.65) (91.16) (92.81) (89.30)
Net Financial Items (3.21) (73.35) (146.29) (105.65) (91.16) (92.81) (89.30)
Reported Pre-tax profit 873.53 992.21 1097.14 1047.87 1279.17 1446.88 1656.45
Reported Tax charge (257.20) (292.09) (293.12) (353.77) (434.92) (491.94) (563.19)
Reported Net profit 616.33 700.12 804.02 694.10 844.26 954.94 1093.26
Minorities 1.78 - - - - - -
P/L OF ASSOCIATE CO. - - - - - - -
Rep. NP after min. Int. 614.55 700.12 804.02 694.10 844.26 954.94 1093.26
Extra Ordinary income - - - (41.83) - - -
Reported Net Income
after extra ordinary
items
614.55 700.12 804.02 735.93 844.26 954.94 1093.26
Profit & Loss
Particulars 201503 201603 201703 201803 2019E 2020E 2021E
EPS and Dividend
Dividend Paid (170.00) (170.00) (170.00) (170.00) (169.70) (169.98) (170.00)
Retained earnings 444.55 530.12 634.02 565.93 674.56 784.96 923.26
Reported EPS 7.23 8.24 9.46 8.66 9.93 11.23 12.86
DPS - originally de-
clared 2.00 2.00 2.00 2.00 2.00 2.00 2.00
www.rudrashares.com 8
FUNDAMENTAL COVERAGE
RUDRA SHARES &
STOCK BROKERS LTD
EXIDE INDUSTRIES LTD
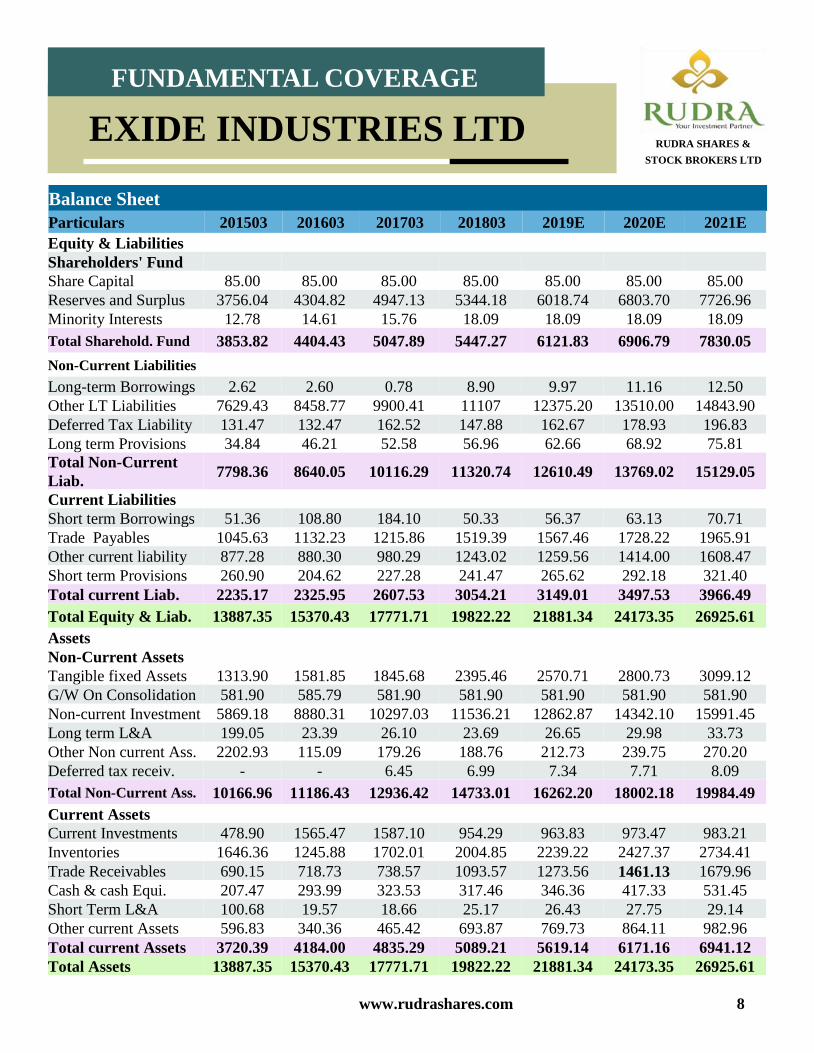
Balance Sheet
Particulars 201503 201603 201703 201803 2019E 2020E 2021E
Equity & Liabilities
Shareholders' Fund
Share Capital 85.00 85.00 85.00 85.00 85.00 85.00 85.00
Reserves and Surplus 3756.04 4304.82 4947.13 5344.18 6018.74 6803.70 7726.96
Minority Interests 12.78 14.61 15.76 18.09 18.09 18.09 18.09
Total Sharehold. Fund 3853.82 4404.43 5047.89 5447.27 6121.83 6906.79 7830.05
Non-Current Liabilities
Long-term Borrowings 2.62 2.60 0.78 8.90 9.97 11.16 12.50
Other LT Liabilities 7629.43 8458.77 9900.41 11107 12375.20 13510.00 14843.90
Deferred Tax Liability 131.47 132.47 162.52 147.88 162.67 178.93 196.83
Long term Provisions 34.84 46.21 52.58 56.96 62.66 68.92 75.81
Total Non-Current
Liab. 7798.36 8640.05 10116.29 11320.74 12610.49 13769.02 15129.05
Current Liabilities
Short term Borrowings 51.36 108.80 184.10 50.33 56.37 63.13 70.71
Trade Payables 1045.63 1132.23 1215.86 1519.39 1567.46 1728.22 1965.91
Other current liability 877.28 880.30 980.29 1243.02 1259.56 1414.00 1608.47
Short term Provisions 260.90 204.62 227.28 241.47 265.62 292.18 321.40
Total current Liab. 2235.17 2325.95 2607.53 3054.21 3149.01 3497.53 3966.49
Total Equity & Liab. 13887.35 15370.43 17771.71 19822.22 21881.34 24173.35 26925.61
Assets
Non-Current Assets
Tangible fixed Assets 1313.90 1581.85 1845.68 2395.46 2570.71 2800.73 3099.12
G/W On Consolidation 581.90 585.79 581.90 581.90 581.90 581.90 581.90
Non-current Investment 5869.18 8880.31 10297.03 11536.21 12862.87 14342.10 15991.45
Long term L&A 199.05 23.39 26.10 23.69 26.65 29.98 33.73
Other Non current Ass. 2202.93 115.09 179.26 188.76 212.73 239.75 270.20
Deferred tax receiv. - - 6.45 6.99 7.34 7.71 8.09
Total Non-Current Ass. 10166.96 11186.43 12936.42 14733.01 16262.20 18002.18 19984.49
Current Assets
Current Investments 478.90 1565.47 1587.10 954.29 963.83 973.47 983.21
Inventories 1646.36 1245.88 1702.01 2004.85 2239.22 2427.37 2734.41
Trade Receivables 690.15 718.73 738.57 1093.57 1273.56 1461.13 1679.96
Cash & cash Equi. 207.47 293.99 323.53 317.46 346.36 417.33 531.45
Short Term L&A 100.68 19.57 18.66 25.17 26.43 27.75 29.14
Other current Assets 596.83 340.36 465.42 693.87 769.73 864.11 982.96
Total current Assets 3720.39 4184.00 4835.29 5089.21 5619.14 6171.16 6941.12
Total Assets 13887.35 15370.43 17771.71 19822.22 21881.34 24173.35 26925.61
www.rudrashares.com 9
FUNDAMENTAL COVERAGE
RUDRA SHARES &
STOCK BROKERS LTD
EXIDE INDUSTRIES LTD
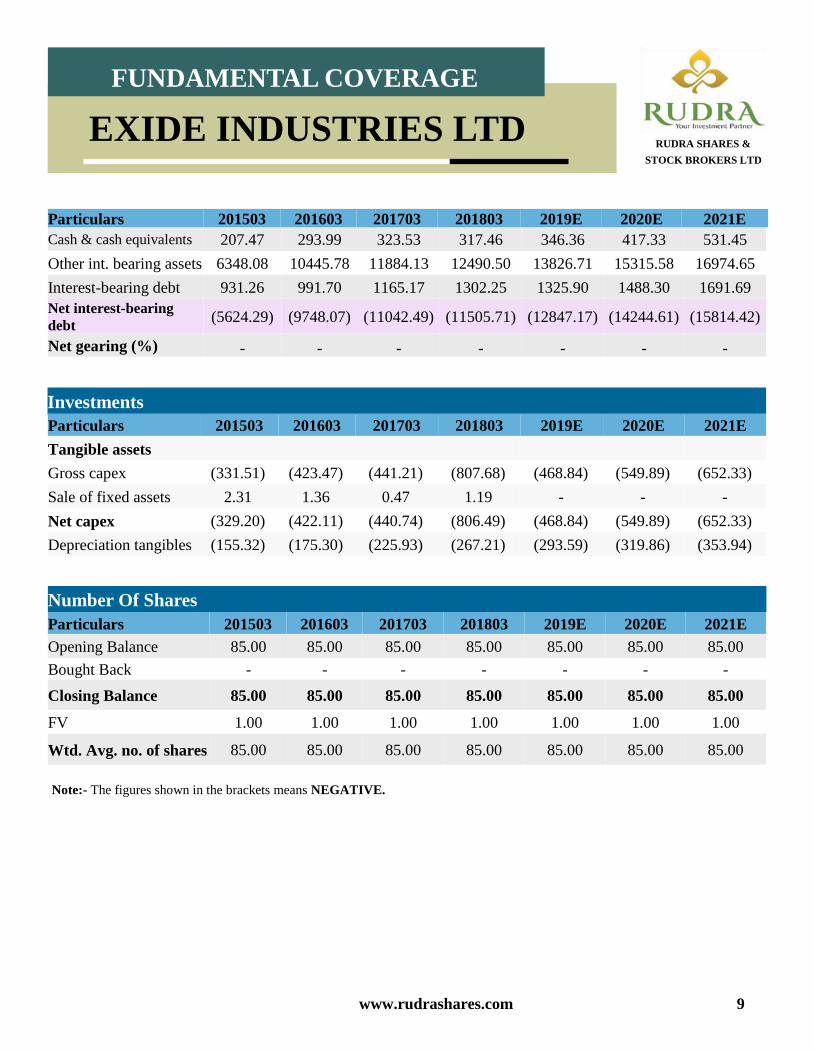
Particulars 201503 201603 201703 201803 2019E 2020E 2021E
Number Of Shares
Opening Balance 85.00 85.00 85.00 85.00 85.00 85.00 85.00
Bought Back - - - - - - -
Closing Balance 85.00 85.00 85.00 85.00 85.00 85.00 85.00
FV 1.00 1.00 1.00 1.00 1.00 1.00 1.00
Wtd. Avg. no. of shares 85.00 85.00 85.00 85.00 85.00 85.00 85.00
Cash & cash equivalents 207.47 293.99 323.53 317.46 346.36 417.33 531.45
Other int. bearing assets 6348.08 10445.78 11884.13 12490.50 13826.71 15315.58 16974.65
Interest-bearing debt 931.26 991.70 1165.17 1302.25 1325.90 1488.30 1691.69
Net interest-bearing
debt (5624.29) (9748.07) (11042.49) (11505.71) (12847.17) (14244.61) (15814.42)
Net gearing (%) - - - - - - -
Particulars 201503 201603 201703 201803 2019E 2020E 2021E
Investments
Tangible assets
Gross capex (331.51) (423.47) (441.21) (807.68) (468.84) (549.89) (652.33)
Sale of fixed assets 2.31 1.36 0.47 1.19 - - -
Net capex (329.20) (422.11) (440.74) (806.49) (468.84) (549.89) (652.33)
Depreciation tangibles (155.32) (175.30) (225.93) (267.21) (293.59) (319.86) (353.94)
Note:- The figures shown in the brackets means NEGATIVE.
Particulars 201503 201603 201703 201803 2019E 2020E 2021E
www.rudrashares.com 10
FUNDAMENTAL COVERAGE
RUDRA SHARES &
STOCK BROKERS LTD
EXIDE INDUSTRIES LTD
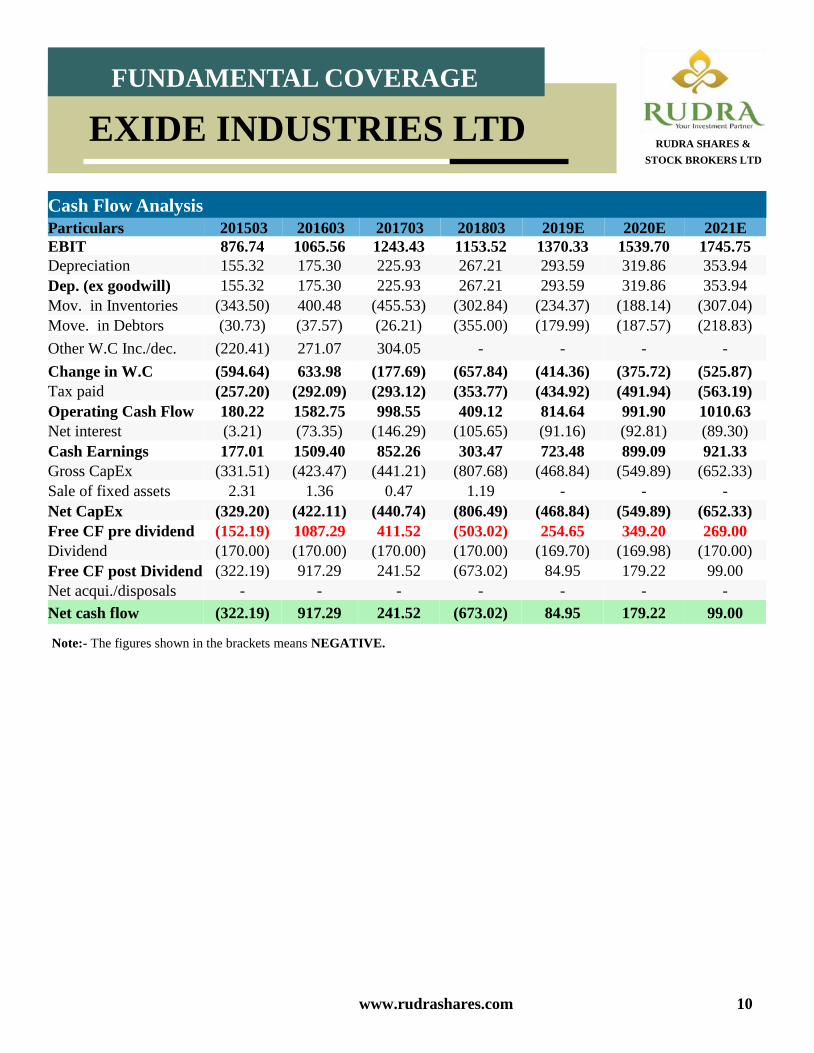
Particulars 201503 201603 201703 201803 2019E 2020E 2021E
Cash Flow Analysis
EBIT 876.74 1065.56 1243.43 1153.52 1370.33 1539.70 1745.75
Depreciation 155.32 175.30 225.93 267.21 293.59 319.86 353.94
Dep. (ex goodwill) 155.32 175.30 225.93 267.21 293.59 319.86 353.94
Mov. in Inventories (343.50) 400.48 (455.53) (302.84) (234.37) (188.14) (307.04)
Move. in Debtors (30.73) (37.57) (26.21) (355.00) (179.99) (187.57) (218.83)
Other W.C Inc./dec. (220.41) 271.07 304.05 - - - -
Change in W.C (594.64) 633.98 (177.69) (657.84) (414.36) (375.72) (525.87)
Tax paid (257.20) (292.09) (293.12) (353.77) (434.92) (491.94) (563.19)
Operating Cash Flow 180.22 1582.75 998.55 409.12 814.64 991.90 1010.63
Net interest (3.21) (73.35) (146.29) (105.65) (91.16) (92.81) (89.30)
Cash Earnings 177.01 1509.40 852.26 303.47 723.48 899.09 921.33
Gross CapEx (331.51) (423.47) (441.21) (807.68) (468.84) (549.89) (652.33)
Sale of fixed assets 2.31 1.36 0.47 1.19 - - -
Net CapEx (329.20) (422.11) (440.74) (806.49) (468.84) (549.89) (652.33)
Free CF pre dividend (152.19) 1087.29 411.52 (503.02) 254.65 349.20 269.00
Dividend (170.00) (170.00) (170.00) (170.00) (169.70) (169.98) (170.00)
Free CF post Dividend (322.19) 917.29 241.52 (673.02) 84.95 179.22 99.00
Net acqui./disposals - - - - - - -
Net cash flow (322.19) 917.29 241.52 (673.02) 84.95 179.22 99.00
Note:- The figures shown in the brackets means NEGATIVE.
www.rudrashares.com 11
FUNDAMENTAL COVERAGE
RUDRA SHARES &
STOCK BROKERS LTD
EXIDE INDUSTRIES LTD
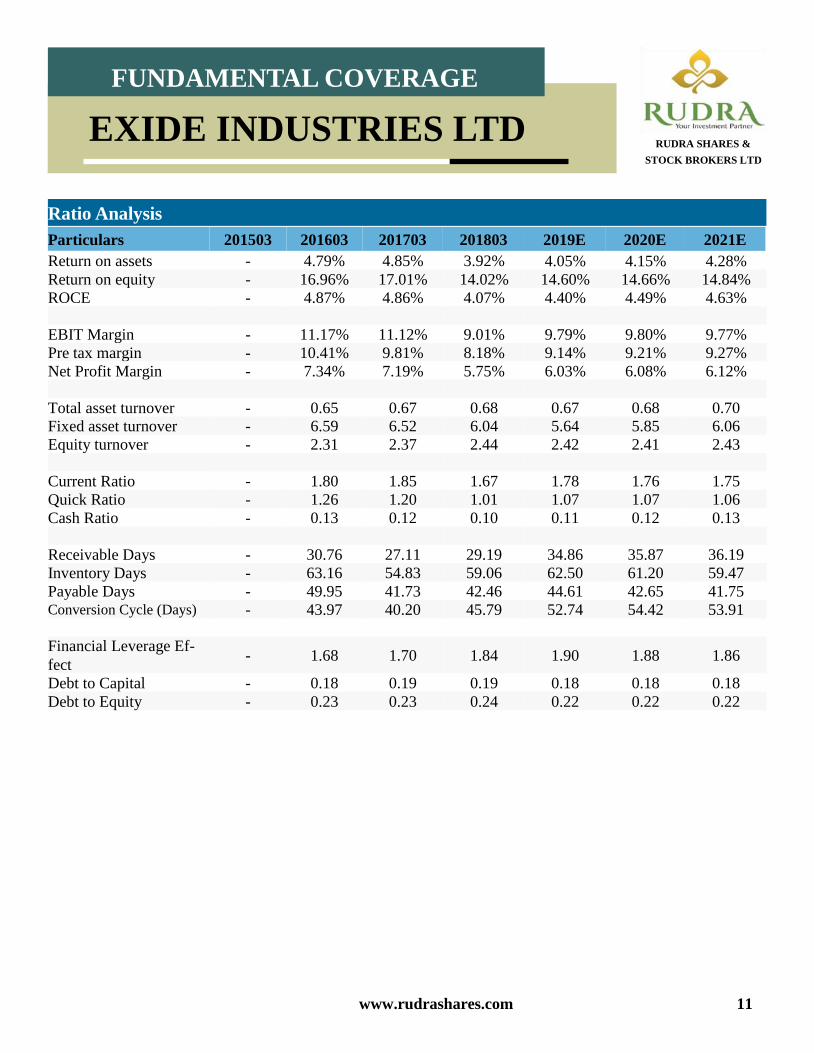
Particulars 201503 201603 201703 201803 2019E 2020E 2021E
Ratio Analysis
Return on assets - 4.79% 4.85% 3.92% 4.05% 4.15% 4.28%
Return on equity - 16.96% 17.01% 14.02% 14.60% 14.66% 14.84%
ROCE - 4.87% 4.86% 4.07% 4.40% 4.49% 4.63%
EBIT Margin - 11.17% 11.12% 9.01% 9.79% 9.80% 9.77%
Pre tax margin - 10.41% 9.81% 8.18% 9.14% 9.21% 9.27%
Net Profit Margin - 7.34% 7.19% 5.75% 6.03% 6.08% 6.12%
Total asset turnover - 0.65 0.67 0.68 0.67 0.68 0.70
Fixed asset turnover - 6.59 6.52 6.04 5.64 5.85 6.06
Equity turnover - 2.31 2.37 2.44 2.42 2.41 2.43
Current Ratio - 1.80 1.85 1.67 1.78 1.76 1.75
Quick Ratio - 1.26 1.20 1.01 1.07 1.07 1.06
Cash Ratio - 0.13 0.12 0.10 0.11 0.12 0.13
Receivable Days - 30.76 27.11 29.19 34.86 35.87 36.19
Inventory Days - 63.16 54.83 59.06 62.50 61.20 59.47
Payable Days - 49.95 41.73 42.46 44.61 42.65 41.75 Conversion Cycle (Days) - 43.97 40.20 45.79 52.74 54.42 53.91
Financial Leverage Ef-
fect - 1.68 1.70 1.84 1.90 1.88 1.86
Debt to Capital - 0.18 0.19 0.19 0.18 0.18 0.18
Debt to Equity - 0.23 0.23 0.24 0.22 0.22 0.22
www.rudrashares.com 12
Disclosures :
Business Activity :
Rudra Shares & Stock Brokers Limited is engaged in the business of providing broking services & distribu-
tion of various financial products. RUDRA is also registered as a Research Analyst under SEBI(Research
Analyst) Regulations, 2014. SEBI Reg. No. INH100002524.
Disciplinary History :
There has been no instance of any Disciplinary action, penalty etc. levied/passed by any regula-
tion/administrative agencies against RUDRA and its Directors. Pursuant to SEBI inspection of books and
records of Rudra, as a Stock Broker, SEBI has not issued any Administrative warning to Rudra.
Terms & Conditions of issuance of Research Report:
The Research report is issued to the registered clients. The Research Report is based on the facts, figures
and information that are considered true, correct and reliable. The information is obtained from publicly
available media or other sources believed to be reliable. The report is prepared solely for informational pur-
pose and does not constitute an offer document or solicitation to buy or sell or subscribe for securities or
other financial instruments for clients.
Disclosures with regard to ownership and material conflicts of interest :
Rudra or its research analysts, or his/her relative or associate has any direct or
Indirect financial interest in the subject company. NO
Rudra or its research analysts, or his/her relative or associate has any other
material conflict of interest at time of publication of the research report. NO
Rudra or its research analysts, or his/her relative or associates have actual
ownership of one per cent or more securities of the subject company. NO
Disclosures with regard to receipt of compensation :
Rudra or its associates have received any compensation from the subject
company in the past twelve months. NO
Rudra or its associates have managed or co-managed public offering of
securities for the subject in the past twelve months. NO
Rudra or its associates have received any compensation or other benefits
from the subject company or third party in connection with the
research report . NO
FUNDAMENTAL COVERAGE
RUDRA SHARES &
STOCK BROKERS LTD
EXIDE INDUSTRIES LTD
www.rudrashares.com 13
Other Disclosures:
The research analyst has served as an officer,director,employee of the
subject company. NO
Rudra or its research analyst has been engaged in market making activity
for the subject company. NO
Rudra or its or associates have received any compensation from the
subject company in the past twelve months. NO
Disclaimers:
This Research Report (hereinafter called report) has been prepared and presented by RUDRA SHARES & STOCK
BROKERS LIMITED, which does not constitute any offer or advice to sell or does solicitation to buy any securities.
The information presented in this report, are for the intended recipients only. Further, the intended recipients are ad-
vised to exercise restraint in placing any dependence on this report, as the sender, Rudra Shares & Stock Brokers
Limited, neither guarantees the accuracy of any information contained herein nor assumes any responsibility in rela-
tion to losses arising from the errors of fact, opinion or the dependence placed on the same.
Despite the information in this document has been previewed on the basis of publicly available information, internal
data , personal views of the research analyst(s)and other reliable sources, believed to be true, we do not represent it as
accurate, complete or exhaustive. It should not be relied on as such, as this document is for general guidance only.
Besides this, the research analyst(s) are bound by stringent internal regulations and legal and statutory requirements
of the Securities and Exchange Board of India( SEBI) and the analysts' compensation was, is, or will be not directly
or indirectly related with the other companies and/or entities of Rudra Shares & Stock Brokers Ltd and have no bear-
ing whatsoever on any recommendation, that they have given in the research report. Rudra Shares & Stock Brokers
Ltd or any of its affiliates/group companies shall not be in any way responsible for any such loss or damage that may
arise to any person from any inadvertent error in the information contained in this report. Rudra Shares & Stock Bro-
kers Ltd has not independently verified all the information, which has been obtained by the company for analysis
purpose, from publicly available media or other sources believed to be reliable. Accordingly, we neither testify nor
make any representation or warranty, express or implied, of the accuracy, contents or data contained within this
document. Rudra Share & Stock Brokers Ltd and its affiliates are engaged in investment advisory, stock broking,
retail & HNI and other financial services. Details of affiliates are available on our website i.e. www.rudrashares.com.
We hereby declare, that the information herein may change any time due to the volatile market conditions, therefore,
it is advised to use own discretion and judgment while entering into any transactions, whatsoever.
Individuals employed as research analyst by Rudra Shares & Stock Brokers Ltd or their associates are not allowed to
deal or trade in securities, within thirty days before and five days after the publication of a research report as pre-
scribed under SEBI Research Analyst Regulations.
Subject to the restrictions mentioned in above paragraph, we and our affiliates, officers, directors, employees and
their relative may: (a) from time to time, have long or short positions acting as a principal in, and buy or sell the secu-
rities or derivatives thereof, of Company mentioned herein or (b) be engaged in any other transaction involving such
securities and earn brokerage or profits.
FUNDAMENTAL COVERAGE
RUDRA SHARES &
STOCK BROKERS LTD
EXIDE INDUSTRIES LTD


