Embed Size (px)
Citation preview

Arihant Capital Markets Ltd
Ruchitaa Maheshwari022 4225 [email protected]
Transformational Growth
Dollar Industries Ltd
Arihant Capital Markets Ltd
Initiating Coverage06th September 2021
Arihant Capital Markets Limited|Research Analyst SEBI Registration No: INH0000027641011, Solitaire Corporate Park, Bldg No.10, 1st Floor, Andheri Ghatkopar Link Rd, Chakala, Andheri (E), Mumbai 400093
CMP: INR 367
Rating: BUY
Target Price: INR 569
Shareholding Pattern %(As on June, 2021)
Promoters 72.9
DII 3.4
FII 0.0
Public & Others 23.7
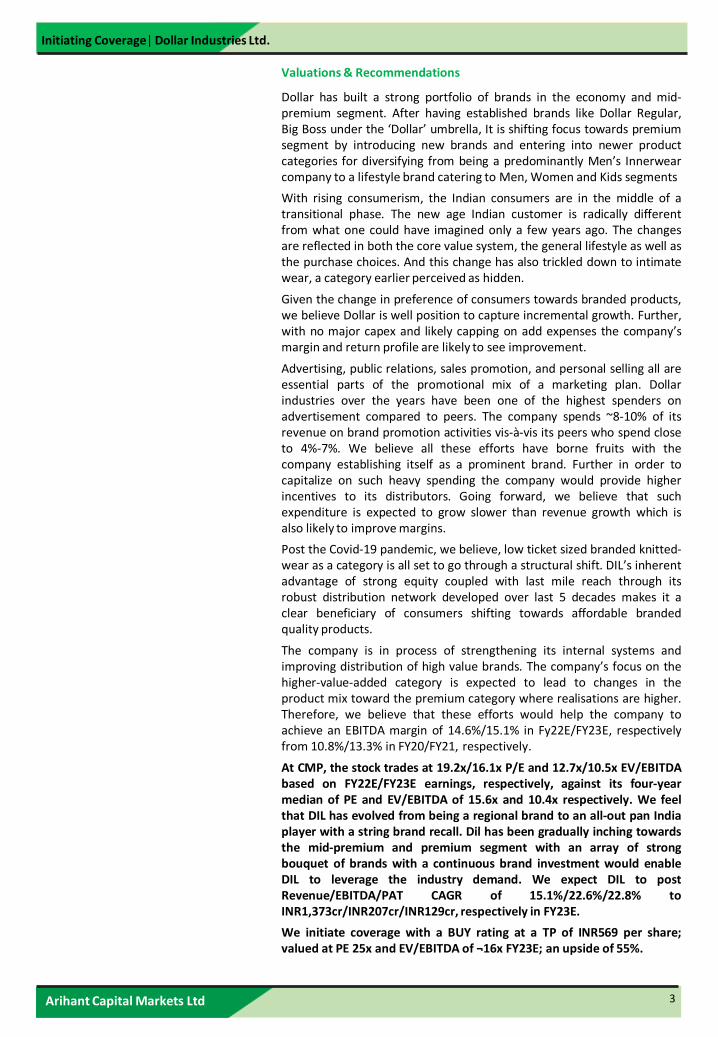
DIL Price Chart
Dollar Industries or DIL, over the years has transformed itself from mass marketbrand (86% in FY07) to a house of brands focusing mainly on mid-market andpremium segment which as on FY21 contributed 43% and 24% respectively. Webelieve that the company is riding on key pillars to drive growth; A) Increasingpenetration in its existing mass and mid market brands like ‘Dollar’ and ‘BigBoss’, B) Expanding its women’s product portfolio brand under ‘Missy’, C)Customer preference for leisure wear and active wear, which would driveathleisure’s share, given its affordable price points, D) Scaling up of premium &super premium segment under Pepe Jeans JV, E) Streamlining its WorkingCapital under Project Lakshya, F) Capex of INR1.05bn-1.1bn will be incurredover the next 1-1.5 years on doubling spinning capacity, the socks unit, andintegration of 6 warehouse facility, and G) Investment in digital transformationto strengthen the supply chain, coupled with increasing share from online sales.The Company is radically trying to change the way it operates by transformingitself to a value-driven, innovation inspired, asset light and brand poweredcompany. We initiate coverage with a BUY rating at a TP of INR569 per share;valued at PE 25x and EV/EBITDA of 16x FY23E; provides an upside of 55%.
Inefficiency in Supply Chain; mother of problem: Working Capital as a % of salesstood at 53.7%/60.2%/54.6% in FY19/FY20/FY21, respectively. During this periodinventory days stood at 181/173/183 and Debtor days stood at 122/134/115,respectively. The issue is inefficiency across supply chain, which leads toinventory clogging and rise in receivables. Through Project Lakshya, DIL andVector Consultants is applying Theory of Constraints, a process improvementmethodology that emphasizes the importance of identifying the "systemconstraint" or bottleneck. The objective is to increase the asset turns ofdistributors and retailers and to reduce the inventory levels.
Strong market positioning & climbing the ladder of premiumization: DIL has astrong portfolio of sub-brands like Dollar Big Boss (premium Innerwear), Missy(Women’s casuals), Champion (kids), Force Go wear & Dollar Ultra Thermals &Force NXT (Premium to super premium segment). DIL has aggressively pursuedvarious marketing & promotional activities to compete with existing players in theindustry. DIL has consistently invested in its brands. It spends 7-8% of its revenueson brand building through celebrity endorsements, extensive publicity & quality-enhancing programmes. This has helped drive a strong brand recall & helpedcreate strong brand equity leading to customer stickiness. This further enables itto pass on RM price rises & benefits to consumers without curtailing its margins.
Unlocking JV synergies with Pepe Jeans: DIL aims to further accelerate itsfootprint in the premium inner and leisure-wear space through 50:50 JV withPepe Jeans Innerfashion. This JV will have exclusive agreement for sales in India,Bangladesh, Bhutan and Srilanka. DIL has been in process of scaling-up brand“Pepe” through continuously expansion of its product range.
Improving financials: We expect DIL to report a Revenue/EBITDA/PAT CAGR of15.1%/22.6%/22.8% to INR1,373cr/INR207cr/INR129cr, respectively. EBITDAmargins to improve by 178.4bps to 15% in FY23E. RoCE/RoE/RoIC to improve by295bps/140bps/290bps over FY21-FY23E to 16.6%/18.6%/16.2%, respectively inFY23E.
Dollar Industries Ltd
Transformational Growth
Source: Company , Arihant Capital Research
Stock Info
BSE 541403
NSE DOLLAR
Bloomberg DOLLAR:IN
Reuters DOLL.NS
Sector Textile
Face Value (INR) 2
Equity Capital (INR cr) 11.34
Mkt Cap (INR cr) 2,081
52w H/L (INR) 408 / 127
Avg Yearly Vol (in 000’) 229
Stock Performance (%) 3m 6m 12m
DIL 7 40 148
NIFTY 10 14 53
Ruchitaa [email protected] 4225 4872
Balasubramanian A
INR in Cr FY19 FY20 FY21 FY22E FY23E
Revenue 1,029 967 1,037 1,190 1,373
EBITDA 136 105 138 174 207
EBITDA margin (%) 13.2 10.8 13.3 14.6 15.1
PAT 74 57 86 109 129
PATM (%) 7.2 5.9 8.3 9.1 9.4
EPS(in INR) 13.1 10.0 15.1 19.1 22.8
ROCE(%) 14.2 10.5 13.6 15.9 16.6
PE(x) 28.3 36.3 24.4 19.2 16.1
90
120
150
180
210
240
270
Sep
-20
Oct
-20
No
v-2
0
Dec
-20
Jan
-21
Feb
-21
Mar
-21
Ap
r-2
1
May
-21
Jun
-21
Jul-
21
Au
g-2
1
DIL Nifty 50
Arihant Capital Markets Ltd
Initiating Coverage| Dollar Industries Ltd.
3
Valuations & Recommendations
Dollar has built a strong portfolio of brands in the economy and mid-premium segment. After having established brands like Dollar Regular,Big Boss under the ‘Dollar’ umbrella, It is shifting focus towards premiumsegment by introducing new brands and entering into newer productcategories for diversifying from being a predominantly Men’s Innerwearcompany to a lifestyle brand catering to Men, Women and Kids segments
With rising consumerism, the Indian consumers are in the middle of atransitional phase. The new age Indian customer is radically differentfrom what one could have imagined only a few years ago. The changesare reflected in both the core value system, the general lifestyle as well asthe purchase choices. And this change has also trickled down to intimatewear, a category earlier perceived as hidden.
Given the change in preference of consumers towards branded products,we believe Dollar is well position to capture incremental growth. Further,with no major capex and likely capping on add expenses the company’smargin and return profile are likely to see improvement.
Advertising, public relations, sales promotion, and personal selling all areessential parts of the promotional mix of a marketing plan. Dollarindustries over the years have been one of the highest spenders onadvertisement compared to peers. The company spends ~8-10% of itsrevenue on brand promotion activities vis-à-vis its peers who spend closeto 4%-7%. We believe all these efforts have borne fruits with thecompany establishing itself as a prominent brand. Further in order tocapitalize on such heavy spending the company would provide higherincentives to its distributors. Going forward, we believe that suchexpenditure is expected to grow slower than revenue growth which isalso likely to improve margins.
Post the Covid-19 pandemic, we believe, low ticket sized branded knitted-wear as a category is all set to go through a structural shift. DIL’s inherentadvantage of strong equity coupled with last mile reach through itsrobust distribution network developed over last 5 decades makes it aclear beneficiary of consumers shifting towards affordable brandedquality products.
The company is in process of strengthening its internal systems andimproving distribution of high value brands. The company’s focus on thehigher-value-added category is expected to lead to changes in theproduct mix toward the premium category where realisations are higher.Therefore, we believe that these efforts would help the company toachieve an EBITDA margin of 14.6%/15.1% in Fy22E/FY23E, respectivelyfrom 10.8%/13.3% in FY20/FY21, respectively.
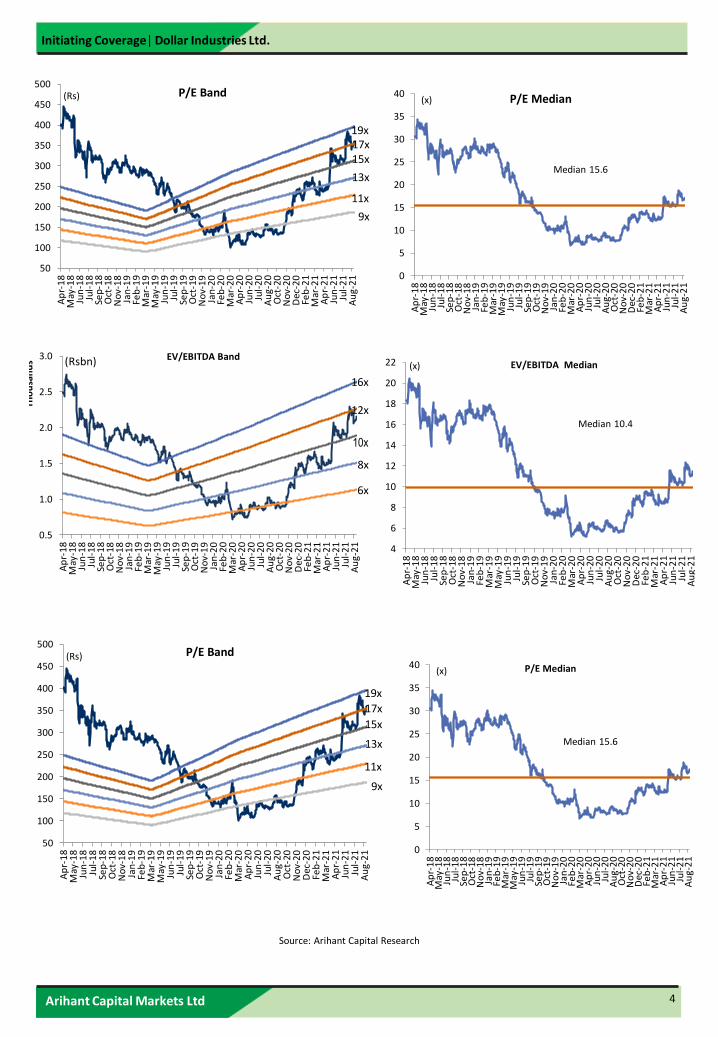
At CMP, the stock trades at 19.2x/16.1x P/E and 12.7x/10.5x EV/EBITDAbased on FY22E/FY23E earnings, respectively, against its four-yearmedian of PE and EV/EBITDA of 15.6x and 10.4x respectively. We feelthat DIL has evolved from being a regional brand to an all-out pan Indiaplayer with a string brand recall. Dil has been gradually inching towardsthe mid-premium and premium segment with an array of strongbouquet of brands with a continuous brand investment would enableDIL to leverage the industry demand. We expect DIL to postRevenue/EBITDA/PAT CAGR of 15.1%/22.6%/22.8% toINR1,373cr/INR207cr/INR129cr, respectively in FY23E.
We initiate coverage with a BUY rating at a TP of INR569 per share;valued at PE 25x and EV/EBITDA of ¬16x FY23E; an upside of 55%.
Arihant Capital Markets Ltd
Initiating Coverage| Dollar Industries Ltd.
4
Source: Arihant Capital Research
50
100
150
200
250
300
350
400
450
500
Ap
r-1
8M
ay-1
8Ju
n-1
8Ju
l-1
8Se
p-1
8O
ct-1
8N
ov-
18
Jan
-19
Feb
-19
Mar
-19
May
-19
Jun
-19
Jul-
19
Sep
-19
Oct
-19
No
v-1
9Ja
n-2
0Fe
b-2
0M
ar-2
0A
pr-
20
Jun
-20
Jul-
20
Au
g-2
0O
ct-2
0N
ov-
20
Dec
-20
Feb
-21
Mar
-21
Ap
r-2
1Ju
n-2
1Ju
l-2
1A
ug-
21
(Rs) P/E Band
11x
17x19x
15x
9x
13x
0
5
10
15
20
25
30
35
40
Ap
r-1
8M
ay-1
8Ju
n-1
8Ju
l-1
8Se
p-1
8O
ct-1
8N
ov-
18
Jan
-19
Feb
-19
Mar
-19
May
-19
Jun
-19
Jul-
19
Sep
-19
Oct
-19
No
v-1
9Ja
n-2
0Fe
b-2
0M
ar-2
0A
pr-
20
Jun
-20
Jul-
20
Au
g-2
0O
ct-2
0N
ov-
20
Dec
-20
Feb
-21
Mar
-21
Ap
r-2
1Ju
n-2
1Ju
l-2
1A
ug-
21
(x) P/E Median
Median 15.6
0.5
1.0
1.5
2.0
2.5
3.0
Ap
r-1
8M
ay-1
8Ju
n-1
8Ju
l-1
8Se
p-1
8O
ct-1
8N
ov-
18
Jan
-19
Feb
-19
Mar
-19
May
-19
Jun
-19
Jul-
19
Sep
-19
Oct
-19
No
v-1
9Ja
n-2
0Fe
b-2
0M
ar-2
0A
pr-
20
Jun
-20
Jul-
20
Au
g-2
0O
ct-2
0N
ov-
20
Dec
-20
Feb
-21
Mar
-21
Ap
r-2
1Ju
n-2
1Ju
l-2
1A
ug-
21
Tho
usa
nd
s EV/EBITDA Band(Rsbn)
16x
8x
12x
10x
6x
4
6
8
10
12
14
16
18
20
22
Ap
r-1
8M
ay-1
8Ju
n-1
8Ju
l-1
8Se
p-1
8O
ct-1
8N
ov-
18
Jan
-19
Feb
-19
Mar
-19
May
-19
Jun
-19
Jul-
19
Sep
-19
Oct
-19
No
v-1
9Ja
n-2
0Fe
b-2
0M
ar-2
0A
pr-
20
Jun
-20
Jul-
20
Au
g-2
0O
ct-2
0N
ov-
20
Dec
-20
Feb
-21
Mar
-21
Ap
r-2
1Ju
n-2
1Ju
l-2
1A
ug-
21
(x) EV/EBITDA Median
Median 10.4
50
100
150
200
250
300
350
400
450
500
Ap
r-1
8M
ay-1
8Ju
n-1
8Ju
l-1
8Se
p-1
8O
ct-1
8N
ov-
18
Jan
-19
Feb
-19
Mar
-19
May
-19
Jun
-19
Jul-
19
Sep
-19
Oct
-19
No
v-1
9Ja
n-2
0Fe
b-2
0M
ar-2
0A
pr-
20
Jun
-20
Jul-
20
Au
g-2
0O
ct-2
0N
ov-
20
Dec
-20
Feb
-21
Mar
-21
Ap
r-2
1Ju
n-2
1Ju
l-2
1A
ug-
21
(Rs) P/E Band
11x
17x
19x
15x
9x
13x
0
5
10
15
20
25
30
35
40
Ap
r-1
8M
ay-1
8Ju
n-1
8Ju
l-1
8Se
p-1
8O
ct-1
8N
ov-
18
Jan
-19
Feb
-19
Mar
-19
May
-19
Jun
-19
Jul-
19
Sep
-19
Oct
-19
No
v-1
9Ja
n-2
0Fe
b-2
0M
ar-2
0A
pr-
20
Jun
-20
Jul-
20
Au
g-2
0O
ct-2
0N
ov-
20
Dec
-20
Feb
-21
Mar
-21
Ap
r-2
1Ju
n-2
1Ju
l-2
1A
ug-
21
(x) P/E Median
Median 15.6
Arihant Capital Markets Ltd
Initiating Coverage| Dollar Industries Ltd.
5
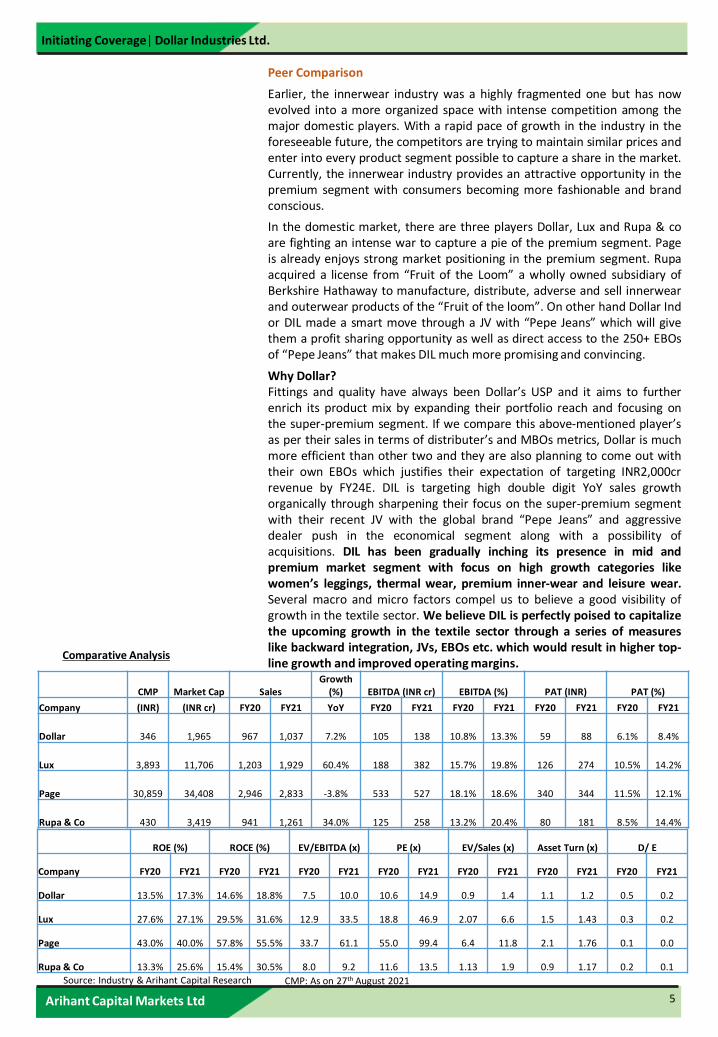
Peer Comparison
Earlier, the innerwear industry was a highly fragmented one but has nowevolved into a more organized space with intense competition among themajor domestic players. With a rapid pace of growth in the industry in theforeseeable future, the competitors are trying to maintain similar prices andenter into every product segment possible to capture a share in the market.Currently, the innerwear industry provides an attractive opportunity in thepremium segment with consumers becoming more fashionable and brandconscious.
In the domestic market, there are three players Dollar, Lux and Rupa & coare fighting an intense war to capture a pie of the premium segment. Pageis already enjoys strong market positioning in the premium segment. Rupaacquired a license from “Fruit of the Loom” a wholly owned subsidiary ofBerkshire Hathaway to manufacture, distribute, adverse and sell innerwearand outerwear products of the “Fruit of the loom”. On other hand Dollar Indor DIL made a smart move through a JV with “Pepe Jeans” which will givethem a profit sharing opportunity as well as direct access to the 250+ EBOsof “Pepe Jeans” that makes DIL much more promising and convincing.
Why Dollar?Fittings and quality have always been Dollar’s USP and it aims to furtherenrich its product mix by expanding their portfolio reach and focusing onthe super-premium segment. If we compare this above-mentioned player’sas per their sales in terms of distributer’s and MBOs metrics, Dollar is muchmore efficient than other two and they are also planning to come out withtheir own EBOs which justifies their expectation of targeting INR2,000crrevenue by FY24E. DIL is targeting high double digit YoY sales growthorganically through sharpening their focus on the super-premium segmentwith their recent JV with the global brand “Pepe Jeans” and aggressivedealer push in the economical segment along with a possibility ofacquisitions. DIL has been gradually inching its presence in mid andpremium market segment with focus on high growth categories likewomen’s leggings, thermal wear, premium inner-wear and leisure wear.Several macro and micro factors compel us to believe a good visibility ofgrowth in the textile sector. We believe DIL is perfectly poised to capitalizethe upcoming growth in the textile sector through a series of measureslike backward integration, JVs, EBOs etc. which would result in higher top-line growth and improved operating margins.
Source: Industry & Arihant Capital Research
Comparative Analysis
CMP Market Cap Sales Growth
(%) EBITDA (INR cr) EBITDA (%) PAT (INR) PAT (%)
Company (INR) (INR cr) FY20 FY21 YoY FY20 FY21 FY20 FY21 FY20 FY21 FY20 FY21
Dollar 346 1,965 967 1,037 7.2% 105 138 10.8% 13.3% 59 88 6.1% 8.4%
Lux 3,893 11,706 1,203 1,929 60.4% 188 382 15.7% 19.8% 126 274 10.5% 14.2%
Page 30,859 34,408 2,946 2,833 -3.8% 533 527 18.1% 18.6% 340 344 11.5% 12.1%
Rupa & Co 430 3,419 941 1,261 34.0% 125 258 13.2% 20.4% 80 181 8.5% 14.4%
ROE (%) ROCE (%) EV/EBITDA (x) PE (x) EV/Sales (x) Asset Turn (x) D/ E
Company FY20 FY21 FY20 FY21 FY20 FY21 FY20 FY21 FY20 FY21 FY20 FY21 FY20 FY21
Dollar 13.5% 17.3% 14.6% 18.8% 7.5 10.0 10.6 14.9 0.9 1.4 1.1 1.2 0.5 0.2
Lux 27.6% 27.1% 29.5% 31.6% 12.9 33.5 18.8 46.9 2.07 6.6 1.5 1.43 0.3 0.2
Page 43.0% 40.0% 57.8% 55.5% 33.7 61.1 55.0 99.4 6.4 11.8 2.1 1.76 0.1 0.0
Rupa & Co 13.3% 25.6% 15.4% 30.5% 8.0 9.2 11.6 13.5 1.13 1.9 0.9 1.17 0.2 0.1
CMP: As on 27th August 2021
Arihant Capital Markets Ltd
Initiating Coverage| Dollar Industries Ltd.
6
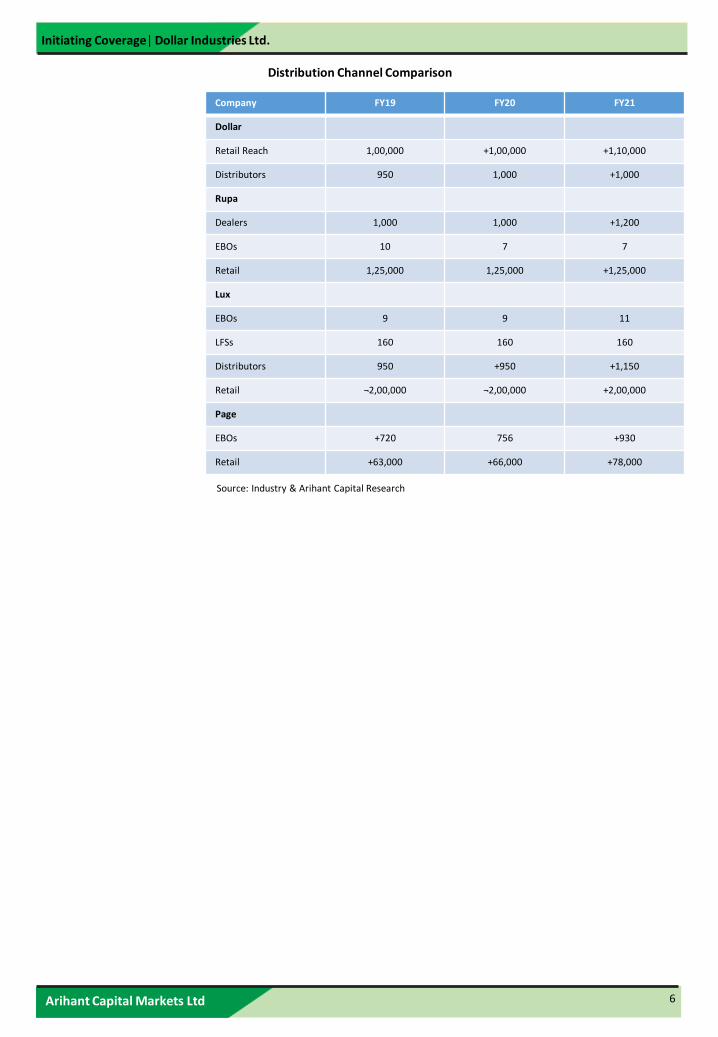
Distribution Channel Comparison
Company FY19 FY20 FY21
Dollar
Retail Reach 1,00,000 +1,00,000 +1,10,000
Distributors 950 1,000 +1,000
Rupa
Dealers 1,000 1,000 +1,200
EBOs 10 7 7
Retail 1,25,000 1,25,000 +1,25,000
Lux
EBOs 9 9 11
LFSs 160 160 160
Distributors 950 +950 +1,150
Retail ¬2,00,000 ¬2,00,000 +2,00,000
Page
EBOs +720 756 +930
Retail +63,000 +66,000 +78,000
Source: Industry & Arihant Capital Research
Arihant Capital Markets Ltd
Initiating Coverage| Dollar Industries Ltd.
7
Investment Rationale
Inefficiency in Supply Chain; mother of problem
In an innerwear industry which is highly fragmented and a lower pricepoint, it’s little product differentiation. Most of the players operate at thesimilar price points, comparable quality of products and relative to thesame consumer base (barring super premium category). Brand stickinessis the lowest and strong direct reach to the retailers is what sets youapart from the competition.
Retailers play a huge role in persuading a buyer to buy certain brands andare able to convert 55-60% of the time. Hence, these retailers becomecritical for any company. The problem arises, when the retailers of smalltowns are not serviced by the distributors. The semi-wholesale playersbridges the gap and they buy the product from the company’sdistributors and sell them to the retailers. This arises a major issue as theretailers ends up buying the products what these wholesalers suggests.This leads to inventory clogging pressure on distributors, retailers andcompany.
Further, many brand owners have not done any mapping of retailers atpan India level. This also poses a problem for not indentifying the truemarket potential. These two legged problem has negatively impacted theworking capital of the company.
Working Capital as a % of sales stood at 53.7%/60.2%/54.6% inFY19/FY20/FY21, respectively. During this period inventory days stood at181/173/183 and Debtor days stood at 122/134/115, respectively. Theissue is inefficiency across supply chain, which leads to inventory cloggingand rise in receivables.
To counter the negatives posed, Company has started to work withVector Consultants to implement Theory of constraints (TOC), in anattempt to identify the system constraints or bottleneck and to keep atab on its working capital mainly by reducing receivables and inventories.DIL initiated its inventory transformation project to replace its existinginventory push model. Through this project, DIL aims to increase theregional presence of its products by mapping out the potential retailoutlets, increase channel partners in the mix and optimise working capitallevels.
Company started appointing distributors in regions where it previouslyhad none or negligible reach. The project required mapping individualpotential stores wherein the company’s products are required to besold to a particular distributor appointed by DIL. This approach wouldenable them to reduce their working capital cycle by reducing theirreceivables and inventories.
All of its products were routed through the distributors before they weredelivered to the retail outlets, which were then marketed to theconsumers. Company is focusing on bridging this gap and marketing itsproducts directly to the retailers, thereby replacing the traditional pushmodel with the pull model. The primary objective was to strengthencapital efficiency at the retail level; the retailers would have the flexibilityof buying products on a per-piece basis instead of having to buy theentire box like before. This has resulted in the increase in stocks of itsproducts at the retail level, which in turn, has enabled it to widen anddeepen its footprint.
Arihant Capital Markets Ltd
Initiating Coverage| Dollar Industries Ltd.
8
Due to the size of the project, involvement of multiple parties and covid19 effectively slowed down the implementation as it requires field work,the company will require minimum 2 years for the successfulimplementation of the project. The process will result in maximised sales,better inventory management and better realizations for the company.
The company provides 10-12% of the distributor margin and is also on theverge of providing the ‘channel financing’ (below than the bank rate of11.5-12%) to the distributors via NBFCs in next 2 months and will enablethe distributor to be more aggressive in terms of selling and will entailthem for the payment on the day zero. Hence, management expectsreceivable days which stood at 120days in FY21 to reduce by 10days,which will eventually improve the working capital days by 15 in FY22E.
Process of getting retailers on board commences
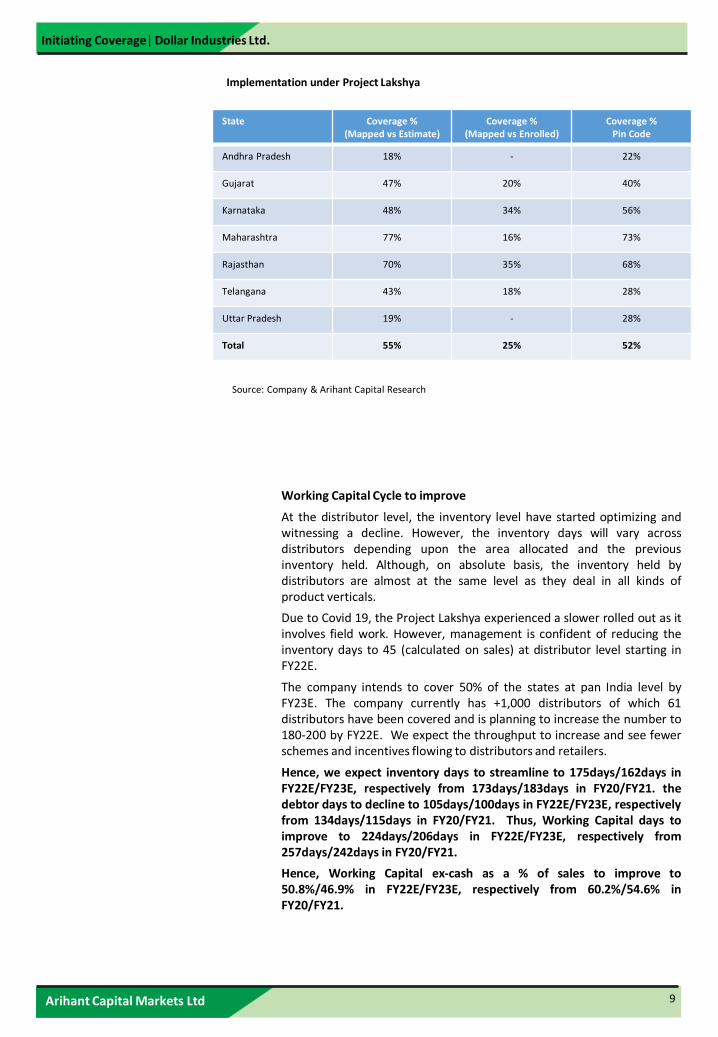
The sales force under the direction of Vector has been visiting retailers,explaining Project Lakshya and enrolling them. To date, 55% of estimatedoutlets mapped, 25% of mapped outlets enrolled, mapped 52% ofavailable pin codes. Mapped 125,000 retailers already, of which 30,000have been enrolled under the project. The unexpected Covid-19 secondwave slowed down the project. Planning to expand the project in TamilNadu and has started the mapping process in Andhra Pradesh. Of its+1,000 distributors, 61 are under Project Lakshya. By FY22E, the companywill enroll 150-200 distributors.
Company has successfully implemented this project across five states,namely: Karnataka, Rajasthan, Gujarat, Maharashtra and Telangana. As aresult of adding distributors in these regions, the number of retailers itused to engage with has grown multi-fold. Encouraged by the success ofthe model in these states, company plan on implementing this in 10 morestates in FY22E.
How DIL is effectively strategizing?
The company’s sales representatives physically visit to a potential outletand explain in detail the new model. The retailers who got onboard aregiven loyalty rewards. A tele-beat is planned for all the retailers wheretheir orders, complaints, queries and grievances are noted and addressedin time bound manner. In order to increase the replenishment model, theretailers are encouraged to place order in smaller quantities. Thecompany has implemented the universal price list of all retailers. Inaddition, the company is increasing focus on new appointments ofdistributors in the areas where no direct or low company representationexisted.
The retailers’ are serviced through the company appointed distributors.In addition, the retailers can also place orders through tele calling andphysical visits. Earlier, each distributor was serving 200 retailers and withimplementation of project Lakshya, the company has mapped ¬1000retailers in the allocated areas. This increased the target retailers to ¬400.However, the target number will differ depending upon the state to stateand the further rolling out of project. But, the management is confidentof increasing minimum 50% rise in targeted retailers under distributors.
We believe that with lower receivables and faster inventory turns at thedealers level, the company will be able to reduce its working capitalrequirement significantly. In addition, the entire process will improvethe sales and better realizations for the company going forward.
Arihant Capital Markets Ltd
Initiating Coverage| Dollar Industries Ltd.
9
State Coverage %(Mapped vs Estimate)
Coverage %(Mapped vs Enrolled)
Coverage %Pin Code
Andhra Pradesh 18% - 22%
Gujarat 47% 20% 40%
Karnataka 48% 34% 56%
Maharashtra 77% 16% 73%
Rajasthan 70% 35% 68%
Telangana 43% 18% 28%
Uttar Pradesh 19% - 28%
Total 55% 25% 52%
Implementation under Project Lakshya
Source: Company & Arihant Capital Research
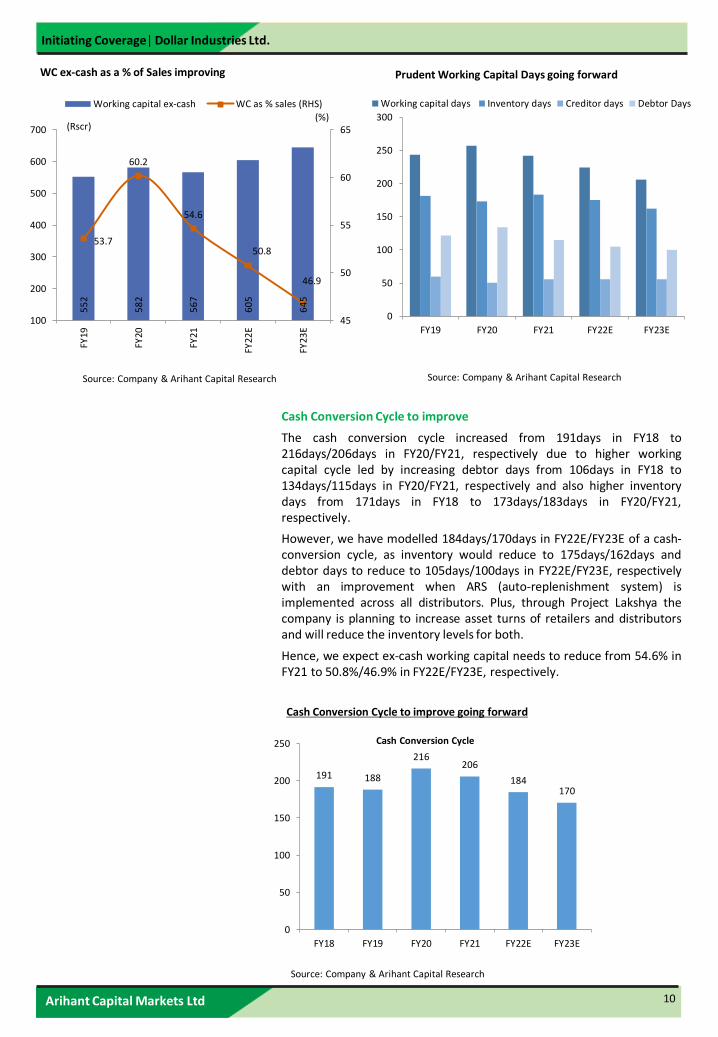
Working Capital Cycle to improve
At the distributor level, the inventory level have started optimizing andwitnessing a decline. However, the inventory days will vary acrossdistributors depending upon the area allocated and the previousinventory held. Although, on absolute basis, the inventory held bydistributors are almost at the same level as they deal in all kinds ofproduct verticals.
Due to Covid 19, the Project Lakshya experienced a slower rolled out as itinvolves field work. However, management is confident of reducing theinventory days to 45 (calculated on sales) at distributor level starting inFY22E.
The company intends to cover 50% of the states at pan India level byFY23E. The company currently has +1,000 distributors of which 61distributors have been covered and is planning to increase the number to180-200 by FY22E. We expect the throughput to increase and see fewerschemes and incentives flowing to distributors and retailers.
Hence, we expect inventory days to streamline to 175days/162days inFY22E/FY23E, respectively from 173days/183days in FY20/FY21. thedebtor days to decline to 105days/100days in FY22E/FY23E, respectivelyfrom 134days/115days in FY20/FY21. Thus, Working Capital days toimprove to 224days/206days in FY22E/FY23E, respectively from257days/242days in FY20/FY21.
Hence, Working Capital ex-cash as a % of sales to improve to50.8%/46.9% in FY22E/FY23E, respectively from 60.2%/54.6% inFY20/FY21.
Arihant Capital Markets Ltd
Initiating Coverage| Dollar Industries Ltd.
10
0
50
100
150
200
250
300
FY19 FY20 FY21 FY22E FY23E
Working capital days Inventory days Creditor days Debtor Days
Prudent Working Capital Days going forward5
52
58
2
56
7
60
5
64
5
53.7
60.2
54.6
50.8
46.9
45
50
55
60
65
100
200
300
400
500
600
700
FY19
FY20
FY21
FY22
E
FY23
E
(%)(Rscr)
Working capital ex-cash WC as % sales (RHS)
WC ex-cash as a % of Sales improving
Source: Company & Arihant Capital ResearchSource: Company & Arihant Capital Research
Cash Conversion Cycle to improve
The cash conversion cycle increased from 191days in FY18 to216days/206days in FY20/FY21, respectively due to higher workingcapital cycle led by increasing debtor days from 106days in FY18 to134days/115days in FY20/FY21, respectively and also higher inventorydays from 171days in FY18 to 173days/183days in FY20/FY21,respectively.
However, we have modelled 184days/170days in FY22E/FY23E of a cash-conversion cycle, as inventory would reduce to 175days/162days anddebtor days to reduce to 105days/100days in FY22E/FY23E, respectivelywith an improvement when ARS (auto-replenishment system) isimplemented across all distributors. Plus, through Project Lakshya thecompany is planning to increase asset turns of retailers and distributorsand will reduce the inventory levels for both.
Hence, we expect ex-cash working capital needs to reduce from 54.6% inFY21 to 50.8%/46.9% in FY22E/FY23E, respectively.
Cash Conversion Cycle to improve going forward
Source: Company & Arihant Capital Research
191 188
216206
184170
0
50
100
150
200
250
FY18 FY19 FY20 FY21 FY22E FY23E
Cash Conversion Cycle
Arihant Capital Markets Ltd
Initiating Coverage| Dollar Industries Ltd.
11
Strong market positioning & climbing the ladder of premiumization
Over the years, DIL has progressively graduated from a mass marketmen’s innerwear brand (89% revenues in 2006) to a house of brandsmainly focusing on mid & premium segment which caters to largeportion family innerwear requirements. The company has over theyears broadened its product portfolio, catering to both premium andeconomy class which spans innerwear products across all price ranges,thermal wear and casual outer wears.
DIL has grown over the last decade and chartered a ¬15% marketshare in the intensely competitive domestic hosiery industry. Its focuson branding and advertising has built a small hosiery company into aninnerwear giant. Over time, with the launch of products in differentsegments, it has transformed itself from merely men’s innerwear to alifestyle brand. The company through its Nine home grown brands, hascreated a strong position in economy and mid-premium innerwear.
Company has revamped its brand architecture in such a way that theword ‘Dollar’ became synonymous with all its products. It gives theconsumers a clear idea about its product offerings and enables it toseamlessly connect with millennials.
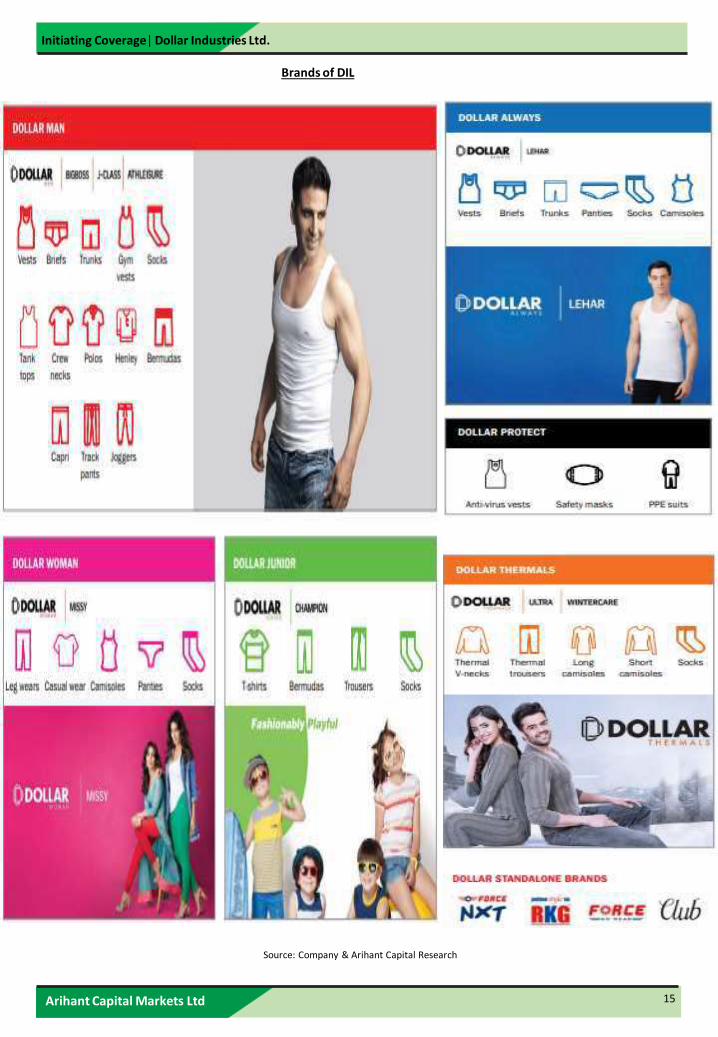
Post rebranding announcement in May, 2020, the brand has created 5broad categories – Dollar Man, Dollar Woman, Dollar Junior, DollarAlways, and Dollar Thermals under which there are various products.Additionally, Force NXT, RKG, Force Go Wear, and Club will bestandalone brands.
DIL has a strong portfolio of sub-brands like Dollar Big Boss (premiumInnerwear), Missy (Women’s casuals), Champion (kids), Force Go wearand Dollar Ultra Thermals and Force NXT (Premium to super premiumsegment). Dollar has products priced in the range of INR50-INR650with presence in both innerwear and knitted outerwear. The companyhas continuously strived at new product introduction every year.
The Company provides a wide choice in terms of product categories;DIL has extended from men's innerwear to casuals, from female innersto stylist leggings and capris from t-shirts for kids to seasonal winterthermals. The company have a very wide portfolio in terms of pricing,for men from INR50 to INR600 per unit contribute 70-75% of therevenue, for women from INR80 to INR650 per unit contribute 9%revenue and for children from INR50 to INR400 per unit contribute1% of the revenue.
DIL's chronological and tiered pricing strategy has made it possible forconsumers to graduate impeccably to the next quality level withoutincurring substantial increments. As a result, they have achievedsuperior price-value proposition when compared to internationalbrands and a steadily increasing slice of the market.
Arihant Capital Markets Ltd
Initiating Coverage| Dollar Industries Ltd.
12
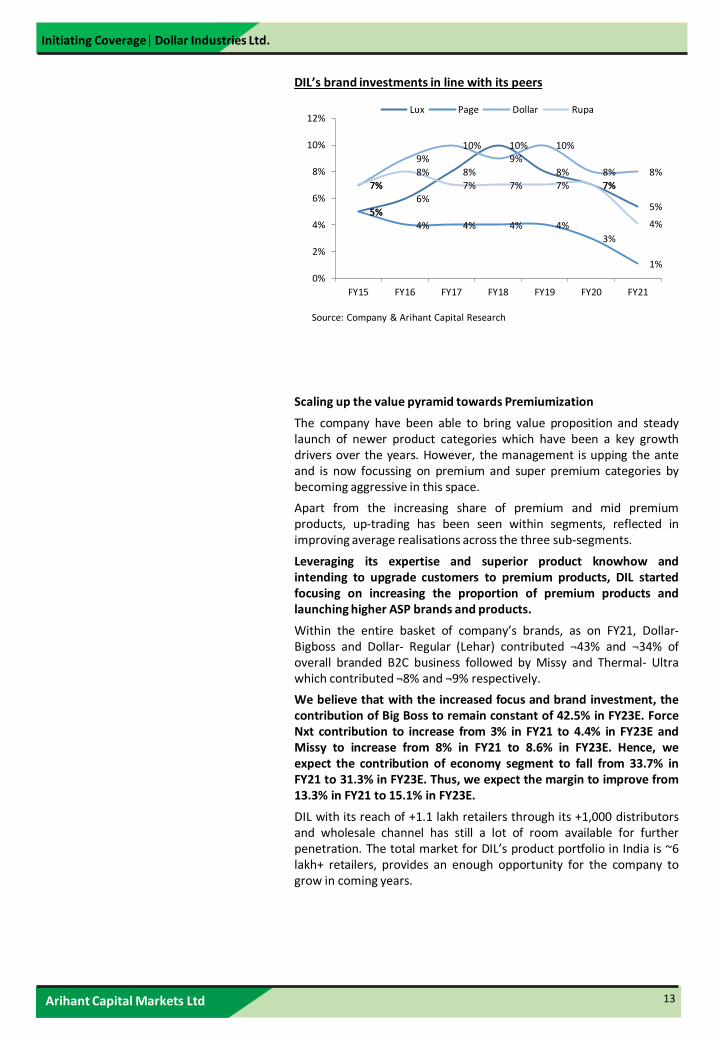
Persistent Brand Investments
Brand investments by organized players has been significant and inranges from 8-10%, barring Page Industries which has a brandinvestment to the tune of 3-4%. In order to create a strong andsustainable portfolio of brands, Dollar has been consistently investingaggressively behind its brand promotions and activities, extensivepublicities and quality enhancement programs. This has helped the increating a household brand with a strong brand recall. Dollar hassuccessfully used Bollywood celebrities to endorse its products. In2005-06, it signed Salman Khan as the brand ambassador and in2008, Akshay Kumar was signed as the brand ambassador of DollarBigboss.
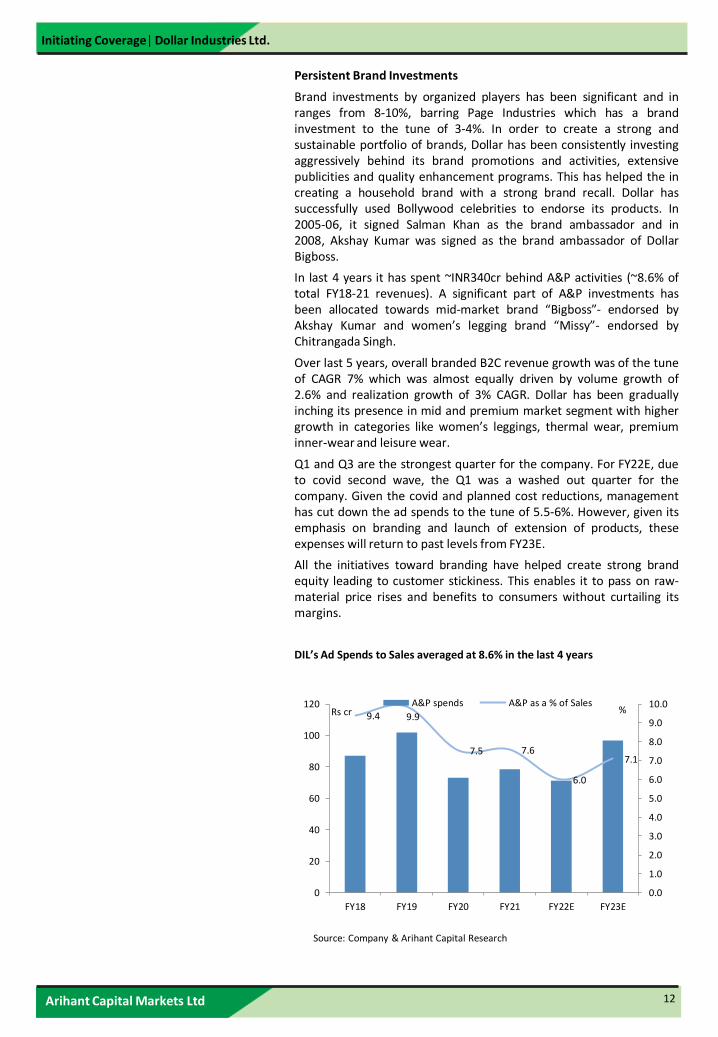
In last 4 years it has spent ~INR340cr behind A&P activities (~8.6% oftotal FY18-21 revenues). A significant part of A&P investments hasbeen allocated towards mid-market brand “Bigboss”- endorsed byAkshay Kumar and women’s legging brand “Missy”- endorsed byChitrangada Singh.
Over last 5 years, overall branded B2C revenue growth was of the tuneof CAGR 7% which was almost equally driven by volume growth of2.6% and realization growth of 3% CAGR. Dollar has been graduallyinching its presence in mid and premium market segment with highergrowth in categories like women’s leggings, thermal wear, premiuminner-wear and leisure wear.
Q1 and Q3 are the strongest quarter for the company. For FY22E, dueto covid second wave, the Q1 was a washed out quarter for thecompany. Given the covid and planned cost reductions, managementhas cut down the ad spends to the tune of 5.5-6%. However, given itsemphasis on branding and launch of extension of products, theseexpenses will return to past levels from FY23E.
All the initiatives toward branding have helped create strong brandequity leading to customer stickiness. This enables it to pass on raw-material price rises and benefits to consumers without curtailing itsmargins.
DIL’s Ad Spends to Sales averaged at 8.6% in the last 4 years
9.4 9.9
7.5 7.6
6.0
7.1
0.0
1.0
2.0
3.0
4.0
5.0
6.0
7.0
8.0
9.0
10.0
0
20
40
60
80
100
120
FY18 FY19 FY20 FY21 FY22E FY23E
A&P spends A&P as a % of SalesRs cr %
Source: Company & Arihant Capital Research
Arihant Capital Markets Ltd
Initiating Coverage| Dollar Industries Ltd.
13
DIL’s brand investments in line with its peers
Scaling up the value pyramid towards Premiumization
The company have been able to bring value proposition and steadylaunch of newer product categories which have been a key growthdrivers over the years. However, the management is upping the anteand is now focussing on premium and super premium categories bybecoming aggressive in this space.
Apart from the increasing share of premium and mid premiumproducts, up-trading has been seen within segments, reflected inimproving average realisations across the three sub-segments.
Leveraging its expertise and superior product knowhow andintending to upgrade customers to premium products, DIL startedfocusing on increasing the proportion of premium products andlaunching higher ASP brands and products.
Within the entire basket of company’s brands, as on FY21, Dollar-Bigboss and Dollar- Regular (Lehar) contributed ¬43% and ¬34% ofoverall branded B2C business followed by Missy and Thermal- Ultrawhich contributed ¬8% and ¬9% respectively.
We believe that with the increased focus and brand investment, thecontribution of Big Boss to remain constant of 42.5% in FY23E. ForceNxt contribution to increase from 3% in FY21 to 4.4% in FY23E andMissy to increase from 8% in FY21 to 8.6% in FY23E. Hence, weexpect the contribution of economy segment to fall from 33.7% inFY21 to 31.3% in FY23E. Thus, we expect the margin to improve from13.3% in FY21 to 15.1% in FY23E.
DIL with its reach of +1.1 lakh retailers through its +1,000 distributorsand wholesale channel has still a lot of room available for furtherpenetration. The total market for DIL’s product portfolio in India is ~6lakh+ retailers, provides an enough opportunity for the company togrow in coming years.
5%
6%
8%
10%
8%
7%
5%5%
4% 4% 4% 4%
3%
1%
7%
9%
10%
9%
10%
8% 8%
7%
8%
7% 7% 7% 7%
4%
0%
2%
4%
6%
8%
10%
12%
FY15 FY16 FY17 FY18 FY19 FY20 FY21
Lux Page Dollar Rupa
Source: Company & Arihant Capital Research
Arihant Capital Markets Ltd
Initiating Coverage| Dollar Industries Ltd.
14
Product Portfolio
Bigboss: The brand contributes ~42% to the total revenue in FY21 anddeals in the mid premium range, with the EBITDA margin of 12-13% andaverage selling price nearly INR65-67.
Missy: This brand line caters exclusively to the women innerwearsegment that contributes ~9% of the total revenue in FY21, which yieldsan EBITDA margin of 15-17% and the average selling price of the productsin this segment hovers around INR80-90. Off-late the, the managementhas become quite aggressive in this segment and plans to launchlingerie by end Nov 2021. It also plans to extend the brassiere segment,athleisure segment, intimate wear, etc. For this, the company plans toadd 100 odd people and 25-30 people will be added in the field. Thecompany targets to achieve INR180-200cr turnover from this segmentby FY25.
Economy Brand: This brand attracts the mass segment and contributes33.7% to total revenue in FY21, with the EBITDA margin of 8-10% andaverage selling price nearly INR35-40. Over a period, managementexpects the contribution from this segment to reduce.
Force NXT: DIL introduced Force NXT in recent past to foray intopremium men innerwear segment. ~3% of the total revenue comes fromthis segment in FY21 which generates an EBITDA margin of 18-20% andthe average selling price lingers around INR175-190. Going forward, withpremium drive, we expect the contribution from this segment to increaseto 3.4%/4.4%, in FY22E/FY23E, respectively.
Force Go: Forge Go was created with an idea to make the company'spresence felt in the sportswear and leisure wear segment. It contributes~4% of the revenue which fell down to 3% in FY21 due to covid 19lockdown. The brand achieves an EBITDA margin of 13-13.5%. Theaverage selling price in this segment is around INR125-150.
Champions: DIL made their inroads into the kids segment with thisbrand which contributes 1% of the total revenue in FY21. This brand lineoffers a considerably high EBITDA margin of 20-21% and the selling pricehovers around INR95-110. As of now, the company is developing amarketing strategy to increase penetration in the segment which is +90%unorganized & price sensitive. The kids-wear market in India isestimated at INR819bn with estimated CAGR at 8.5% for the next fiveyears based on booming population coupled with factors such as growingnumber of nuclear families system, which in turn facilitates increasedspending on children, greater brand awareness among kids, and betterfocus on this segment by organized players. We believe this provideshuge opportunity for DIL to grow in this segment. However, the segmentis very dynamic and every 2 months the design and color needs to bechanged. DIL is working on the formulation of strategy and will takeanother 2 months time to come up with a concrete plan.
Thermal: DIL's thermal wear business generates around 9% of therevenue despite its cyclical nature and high reliance on the intensity ofthe winter. It yields an EBITDA margin of 15-17% with average sellingprice of INR180-220.
Arihant Capital Markets Ltd
Initiating Coverage| Dollar Industries Ltd.
15
Brands of DIL
Source: Company & Arihant Capital Research
Arihant Capital Markets Ltd
Initiating Coverage| Dollar Industries Ltd.
16
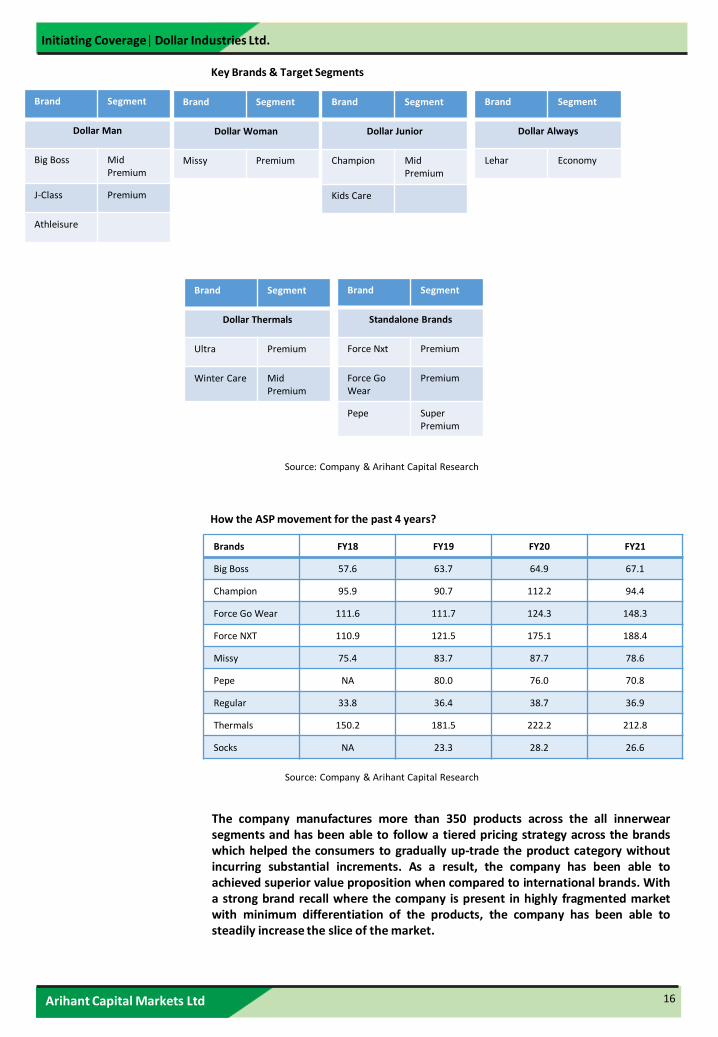
How the ASP movement for the past 4 years?
Brands FY18 FY19 FY20 FY21
Big Boss 57.6 63.7 64.9 67.1
Champion 95.9 90.7 112.2 94.4
Force Go Wear 111.6 111.7 124.3 148.3
Force NXT 110.9 121.5 175.1 188.4
Missy 75.4 83.7 87.7 78.6
Pepe NA 80.0 76.0 70.8
Regular 33.8 36.4 38.7 36.9
Thermals 150.2 181.5 222.2 212.8
Socks NA 23.3 28.2 26.6
Source: Company & Arihant Capital Research
The company manufactures more than 350 products across the all innerwearsegments and has been able to follow a tiered pricing strategy across the brandswhich helped the consumers to gradually up-trade the product category withoutincurring substantial increments. As a result, the company has been able toachieved superior value proposition when compared to international brands. Witha strong brand recall where the company is present in highly fragmented marketwith minimum differentiation of the products, the company has been able tosteadily increase the slice of the market.
Key Brands & Target Segments
Brand Segment
Dollar Man
Big Boss Mid Premium
J-Class Premium
Athleisure
Brand Segment
Dollar Woman
Missy Premium
Brand Segment
Dollar Junior
Champion Mid Premium
Kids Care
Brand Segment
Dollar Always
Lehar Economy
Brand Segment
Dollar Thermals
Ultra Premium
Winter Care Mid Premium
Brand Segment
Standalone Brands
Force Nxt Premium
Force Go Wear
Premium
Pepe Super Premium
Source: Company & Arihant Capital Research
Arihant Capital Markets Ltd
Initiating Coverage| Dollar Industries Ltd.
17
The Company provides a wide choice in terms of product categories;Dollar has extended from men's innerwear to casuals, from female innersto stylist leggings and capris from t-shirts for kids to seasonal winterthermals.
The company caters to the entire pyramid of consumers by offeringvaried product basket at various price points. DIL have a very wideportfolio in terms of pricing, for men from INR50 to INR600 per unitcontribute 70-75% of the revenue, for women from INR80 to INR650 perunit contribute ¬9% revenue and for children from INR50 to INR400 perunit contribute ¬1% of the revenue.
DIL has largely been present in economy and mid-premium segmentthrough its Dollar Regular (Realization ¬INR38/piece) and Big Boss(Realization ¬INR67/piece) brands with ¬34% and ¬43% revenuecontribution in FY21, respectively. The company is now focusing onpremium category with its brand Force NXT (Realization ¬INR189/piece)launched in August 2015 and contributed 3% of FY21 sales. In addition,the company plans to grow this brand focussed on aspiration segmentover the next 3-4 years.
Further, the company is becoming aggressive in ‘Missy’ brand throughlaunch of various products like brassiere, innerwear, athleisure andlegging products. DIL set to launch new lingerie category by the end ofNovember 2021.
As per the management, the company is increasingly focussing on thecategory between mid-range products and super premium products, thespace largely monopolised by Jockey. The company’s focus on thehigher-value-added category is expected to lead to changes in theproduct mix toward the premium category where realisations arehigher.
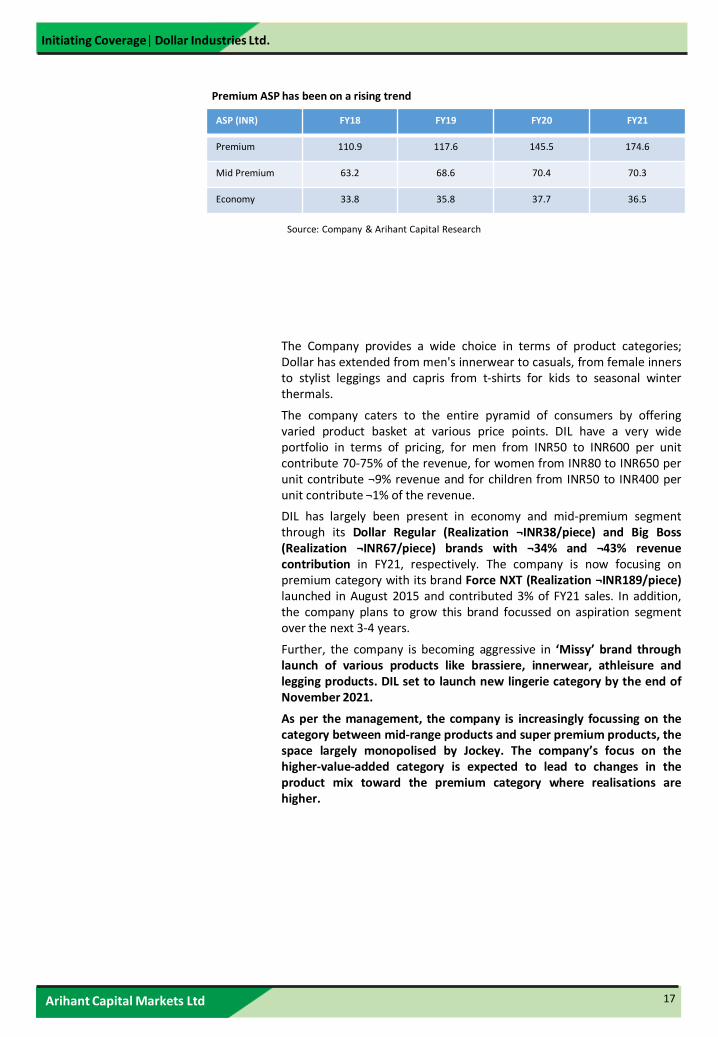
Premium ASP has been on a rising trend
ASP (INR) FY18 FY19 FY20 FY21
Premium 110.9 117.6 145.5 174.6
Mid Premium 63.2 68.6 70.4 70.3
Economy 33.8 35.8 37.7 36.5
Source: Company & Arihant Capital Research
Arihant Capital Markets Ltd
Initiating Coverage| Dollar Industries Ltd.
18
EBITDA margin to improve with rising premium contribution
Peers like Rupa and Company (Rupa) and Lux industries (Lux) havehigher EBITDA margin compared to Dollar as it had concentrated ongaining market share by pricing its products marginally lower than othermainstream players like Rupa and Lux. With brands of Dollar havinggained substantial acceptance amongst consumers, it has launched itspremium brand ‘Force NXT’ (revenue contribution of 3%) and focussingto achieve strong growth in the premium segment by aggressiveadvertisement spend and brand promotion activities.
DIL’s brands have been positioned around the tagline of 'affordablepremium'. The products carry certain attributes and consumers perceiveit as an aspirational brand with affordable pricing, quality and styling.This we believe will help the company to grow faster during the sectorialgrowth and will provide support during the sectorial troughs.
Over the years, Dollar has widened and deepened its distributionnetworks across India, to craft easy access to their product for theircustomers. The company works in unison with trade partners to makesure that its products and collateral are visibly showcased across urbanmetropolis and rural hinterlands. The Company has also boosted off-takethrough e-commerce, enhancing consumer convenience and sending outa strong message of adaptability.
The company currently has +1,000 distributors and +1.1 lakh retail touchpoints. In addition, the company is planning to open an EBO outlet, in-line with its peers, which will work under FOFO model. By the end ofOctober 2021, the company will open 1 outlet and 8-9 outlets by FY22E.The company is planning to have 100 EBOs in 2 years or more.
We expect EBITDA margins to improve going ahead on the back ofincreased share of premium products, gradual increase in ASP or averageselling prices, cost optimization and increasing distribution channels.
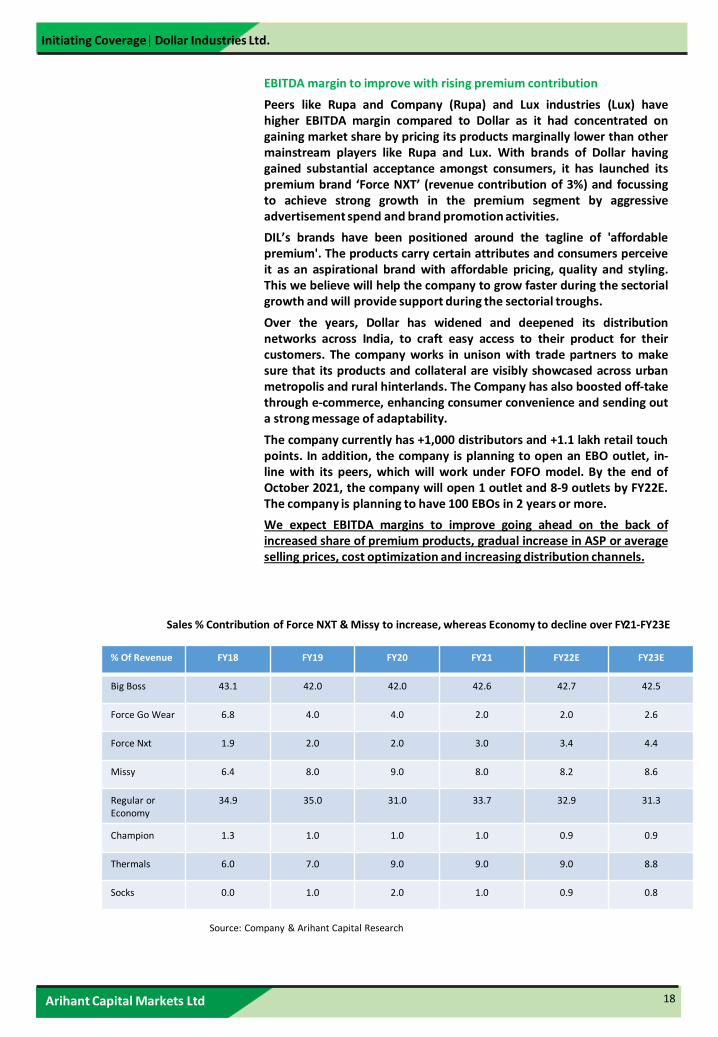
% Of Revenue FY18 FY19 FY20 FY21 FY22E FY23E
Big Boss 43.1 42.0 42.0 42.6 42.7 42.5
Force Go Wear 6.8 4.0 4.0 2.0 2.0 2.6
Force Nxt 1.9 2.0 2.0 3.0 3.4 4.4
Missy 6.4 8.0 9.0 8.0 8.2 8.6
Regular or Economy
34.9 35.0 31.0 33.7 32.9 31.3
Champion 1.3 1.0 1.0 1.0 0.9 0.9
Thermals 6.0 7.0 9.0 9.0 9.0 8.8
Socks 0.0 1.0 2.0 1.0 0.9 0.8
Source: Company & Arihant Capital Research
Sales % Contribution of Force NXT & Missy to increase, whereas Economy to decline over FY21-FY23E
Arihant Capital Markets Ltd
Initiating Coverage| Dollar Industries Ltd.
19
JV with Global Giant; Pepe Jeans to cater the super premium category
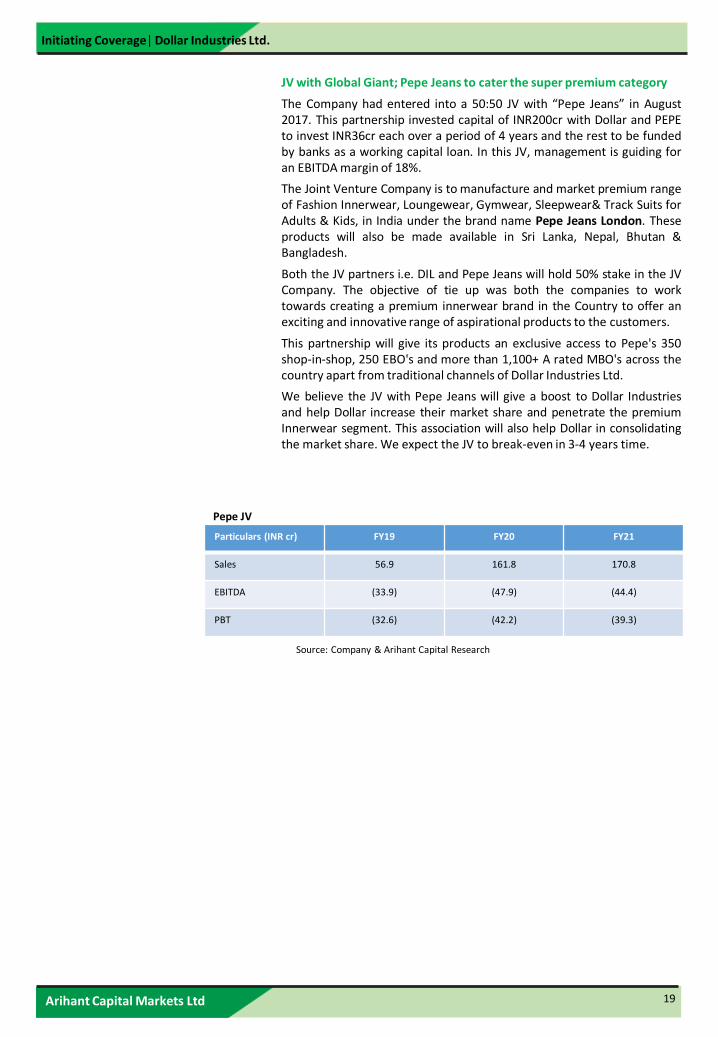
The Company had entered into a 50:50 JV with “Pepe Jeans” in August2017. This partnership invested capital of INR200cr with Dollar and PEPEto invest INR36cr each over a period of 4 years and the rest to be fundedby banks as a working capital loan. In this JV, management is guiding foran EBITDA margin of 18%.
The Joint Venture Company is to manufacture and market premium rangeof Fashion Innerwear, Loungewear, Gymwear, Sleepwear& Track Suits forAdults & Kids, in India under the brand name Pepe Jeans London. Theseproducts will also be made available in Sri Lanka, Nepal, Bhutan &Bangladesh.
Both the JV partners i.e. DIL and Pepe Jeans will hold 50% stake in the JVCompany. The objective of tie up was both the companies to worktowards creating a premium innerwear brand in the Country to offer anexciting and innovative range of aspirational products to the customers.
This partnership will give its products an exclusive access to Pepe's 350shop-in-shop, 250 EBO's and more than 1,100+ A rated MBO's across thecountry apart from traditional channels of Dollar Industries Ltd.
We believe the JV with Pepe Jeans will give a boost to Dollar Industriesand help Dollar increase their market share and penetrate the premiumInnerwear segment. This association will also help Dollar in consolidatingthe market share. We expect the JV to break-even in 3-4 years time.
Particulars (INR cr) FY19 FY20 FY21
Sales 56.9 161.8 170.8
EBITDA (33.9) (47.9) (44.4)
PBT (32.6) (42.2) (39.3)
Pepe JV
Source: Company & Arihant Capital Research
Arihant Capital Markets Ltd
Initiating Coverage| Dollar Industries Ltd.
20
Backward Integration model & Consolidation of warehouses to aidbetter operating efficiency
DIL has adopted a prudent & phased investment strategy towardsaugmenting its in-house manufacturing capacity. It is the only brandedinnerwear player which has fully backward integrated manufacturing set-up. The Company has invested in progressive backward integration –from the consumption of raw cotton to final product delivery. Thebackward integration would help it in offering quality product for ForceNXT brand.
In the spinning segment, DIL produces high quality NE20’s & 40’s 100%cotton combed yarn. Apart from captive usage it also sells premiumquality yarn & processed fabric to international brands.
Captive production has increased form 0% in FY13 to 30% in FY17 and iscurrently 30-35%, while balance ¬70% is outsourced. Going forward thecompany is planning to spend a capex of INR105-110cr over a period of1-1.5 years. Of which, INR55-60cr will be invested in behind in-housemanufacturing capacity of increasing the spindles capacity from current22,000 to 40,000 and INR45-50cr will be spent in the consolidation ofwarehouses in Kolkata. The company has 6 warehouses which is scatteredacross Kolkata. Kolkata is the one of the biggest market for the companyand to mitigate the supply chain issue. With consolidation, the companywill be able to manage prudently the inventory and freight cost, thusimproving the margin by roughly 100bps going forward.
The reason for investment in the backward integration is owing to thedemand supply mismatch and discrepancy in the quality of the fabric.
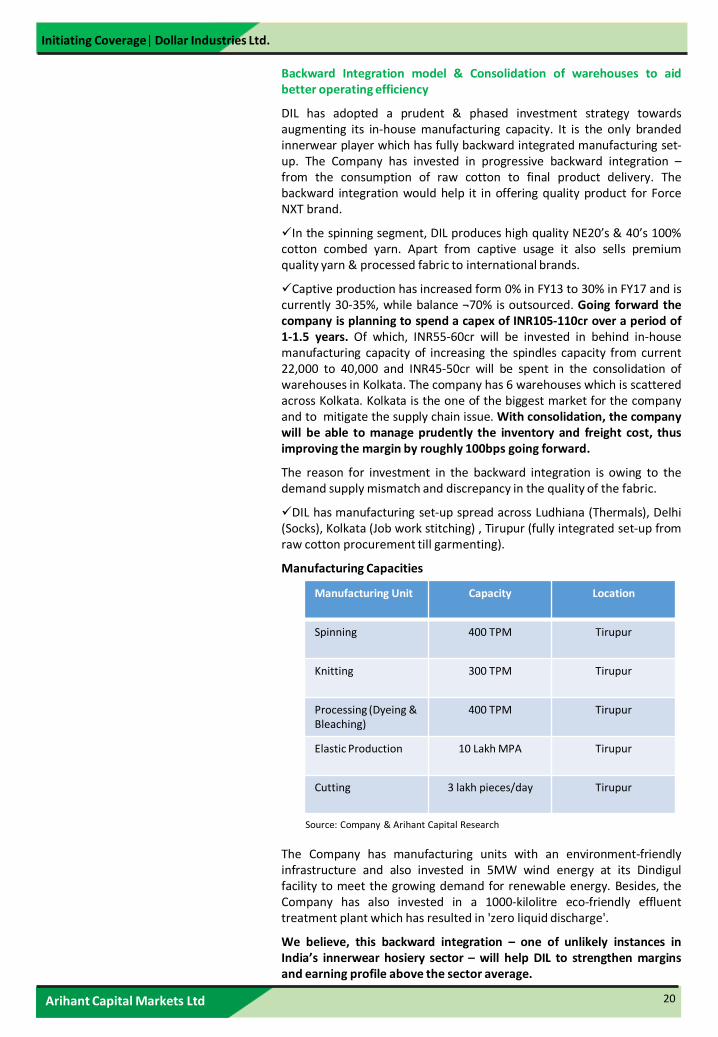
DIL has manufacturing set-up spread across Ludhiana (Thermals), Delhi(Socks), Kolkata (Job work stitching) , Tirupur (fully integrated set-up fromraw cotton procurement till garmenting).
Manufacturing Capacities
The Company has manufacturing units with an environment-friendlyinfrastructure and also invested in 5MW wind energy at its Dindigulfacility to meet the growing demand for renewable energy. Besides, theCompany has also invested in a 1000-kilolitre eco-friendly effluenttreatment plant which has resulted in 'zero liquid discharge'.
We believe, this backward integration – one of unlikely instances inIndia’s innerwear hosiery sector – will help DIL to strengthen marginsand earning profile above the sector average.
Manufacturing Unit Capacity Location
Spinning 400 TPM Tirupur
Knitting 300 TPM Tirupur
Processing (Dyeing & Bleaching)
400 TPM Tirupur
Elastic Production 10 Lakh MPA Tirupur
Cutting 3 lakh pieces/day Tirupur
Source: Company & Arihant Capital Research
Arihant Capital Markets Ltd
Initiating Coverage| Dollar Industries Ltd.
21
Financial Analysis
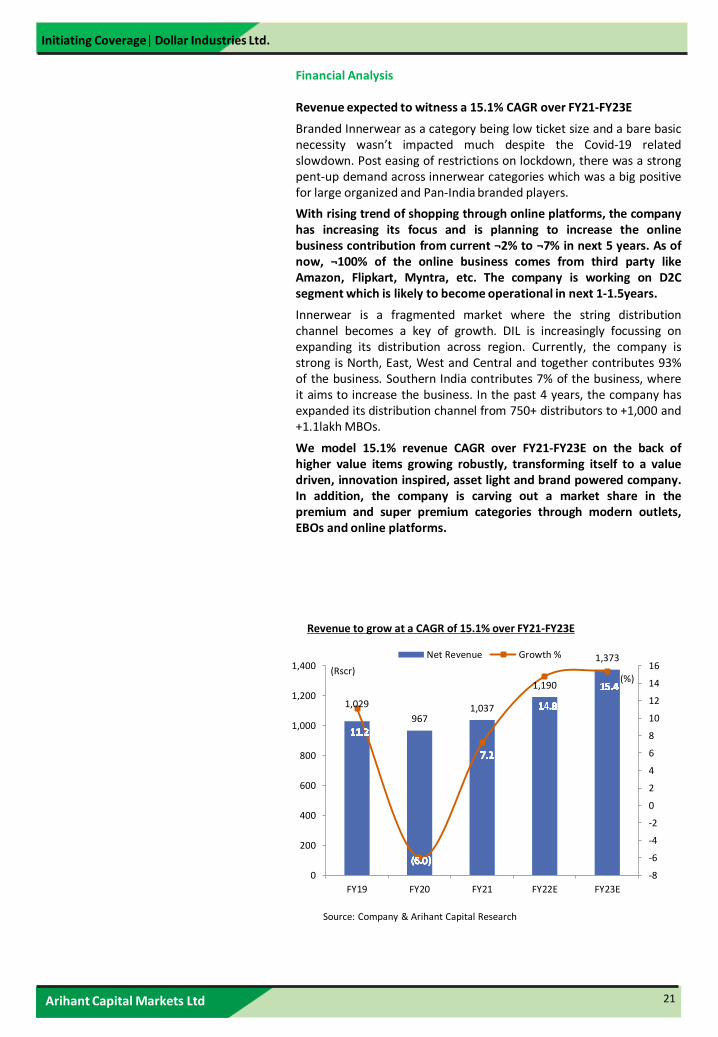
Revenue expected to witness a 15.1% CAGR over FY21‐FY23E
Branded Innerwear as a category being low ticket size and a bare basicnecessity wasn’t impacted much despite the Covid-19 relatedslowdown. Post easing of restrictions on lockdown, there was a strongpent-up demand across innerwear categories which was a big positivefor large organized and Pan-India branded players.
With rising trend of shopping through online platforms, the companyhas increasing its focus and is planning to increase the onlinebusiness contribution from current ¬2% to ¬7% in next 5 years. As ofnow, ¬100% of the online business comes from third party likeAmazon, Flipkart, Myntra, etc. The company is working on D2Csegment which is likely to become operational in next 1-1.5years.
Innerwear is a fragmented market where the string distributionchannel becomes a key of growth. DIL is increasingly focussing onexpanding its distribution across region. Currently, the company isstrong is North, East, West and Central and together contributes 93%of the business. Southern India contributes 7% of the business, whereit aims to increase the business. In the past 4 years, the company hasexpanded its distribution channel from 750+ distributors to +1,000 and+1.1lakh MBOs.
We model 15.1% revenue CAGR over FY21-FY23E on the back ofhigher value items growing robustly, transforming itself to a valuedriven, innovation inspired, asset light and brand powered company.In addition, the company is carving out a market share in thepremium and super premium categories through modern outlets,EBOs and online platforms.
Revenue to grow at a CAGR of 15.1% over FY21-FY23E
Source: Company & Arihant Capital Research
1,029
9671,037
1,190
1,373
-8
-6
-4
-2
0
2
4
6
8
10
12
14
16
0
200
400
600
800
1,000
1,200
1,400
FY19 FY20 FY21 FY22E FY23E
Net Revenue Growth %
(Rscr)(%)
Arihant Capital Markets Ltd
Initiating Coverage| Dollar Industries Ltd.
22
Financial Analysis... continued
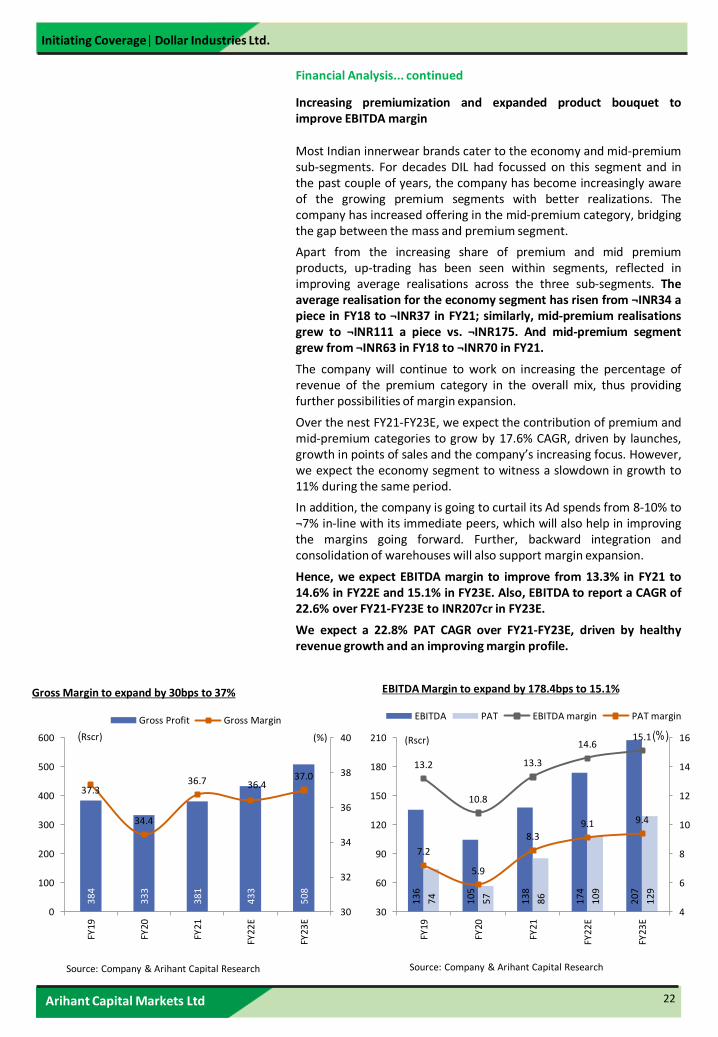
Increasing premiumization and expanded product bouquet toimprove EBITDA margin
Most Indian innerwear brands cater to the economy and mid-premiumsub-segments. For decades DIL had focussed on this segment and inthe past couple of years, the company has become increasingly awareof the growing premium segments with better realizations. Thecompany has increased offering in the mid-premium category, bridgingthe gap between the mass and premium segment.
Apart from the increasing share of premium and mid premiumproducts, up-trading has been seen within segments, reflected inimproving average realisations across the three sub-segments. Theaverage realisation for the economy segment has risen from ¬INR34 apiece in FY18 to ¬INR37 in FY21; similarly, mid-premium realisationsgrew to ¬INR111 a piece vs. ¬INR175. And mid-premium segmentgrew from ¬INR63 in FY18 to ¬INR70 in FY21.
The company will continue to work on increasing the percentage ofrevenue of the premium category in the overall mix, thus providingfurther possibilities of margin expansion.
Over the nest FY21-FY23E, we expect the contribution of premium andmid-premium categories to grow by 17.6% CAGR, driven by launches,growth in points of sales and the company’s increasing focus. However,we expect the economy segment to witness a slowdown in growth to11% during the same period.
In addition, the company is going to curtail its Ad spends from 8-10% to¬7% in-line with its immediate peers, which will also help in improvingthe margins going forward. Further, backward integration andconsolidation of warehouses will also support margin expansion.
Hence, we expect EBITDA margin to improve from 13.3% in FY21 to14.6% in FY22E and 15.1% in FY23E. Also, EBITDA to report a CAGR of22.6% over FY21-FY23E to INR207cr in FY23E.
We expect a 22.8% PAT CAGR over FY21-FY23E, driven by healthyrevenue growth and an improving margin profile.
38
4
33
3
38
1
43
3
50
8
37.3
34.4
36.7 36.437.0
30
32
34
36
38
40
0
100
200
300
400
500
600
FY19
FY20
FY21
FY22
E
FY23
E
Gross Profit Gross Margin
(%)(Rscr)
13
6
10
5
13
8
17
4
20
7
74
57
86
10
9
12
9
13.2
10.8
13.3
14.615.1
7.2
5.9
8.39.1 9.4
4
6
8
10
12
14
16
30
60
90
120
150
180
210
FY19
FY20
FY21
FY22
E
FY23
E
EBITDA PAT EBITDA margin PAT margin
(Rscr) (%)
Source: Company & Arihant Capital Research Source: Company & Arihant Capital Research
Gross Margin to expand by 30bps to 37% EBITDA Margin to expand by 178.4bps to 15.1%
Arihant Capital Markets Ltd
Initiating Coverage| Dollar Industries Ltd.
23
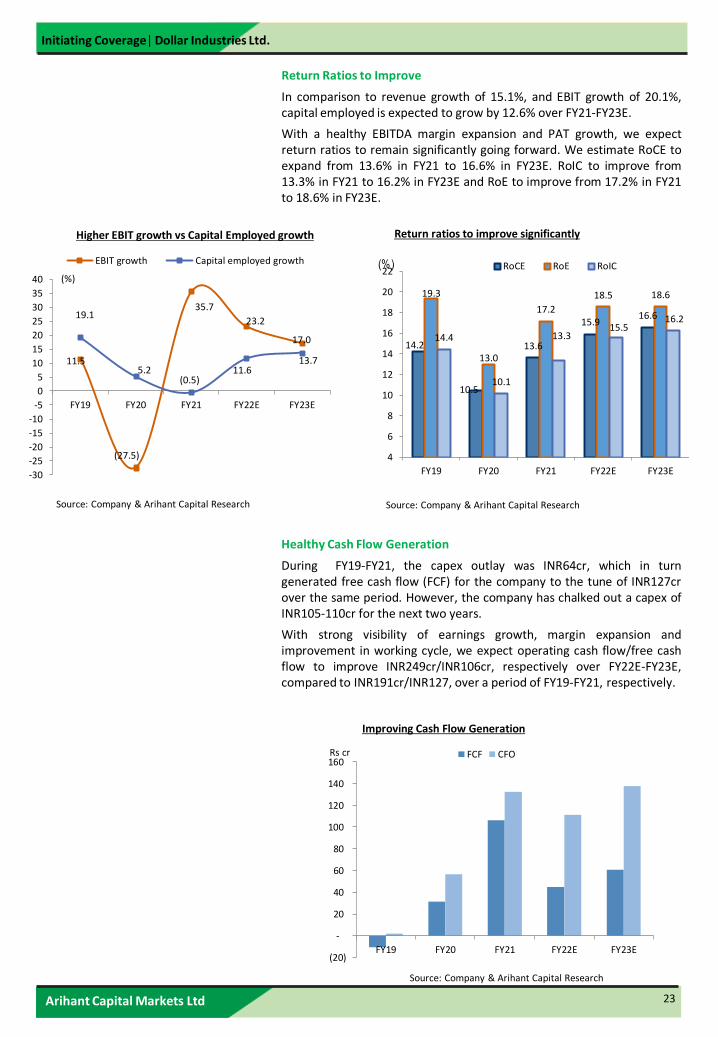
Return Ratios to Improve
In comparison to revenue growth of 15.1%, and EBIT growth of 20.1%,capital employed is expected to grow by 12.6% over FY21‐FY23E.
With a healthy EBITDA margin expansion and PAT growth, we expectreturn ratios to remain significantly going forward. We estimate RoCE toexpand from 13.6% in FY21 to 16.6% in FY23E. RoIC to improve from13.3% in FY21 to 16.2% in FY23E and RoE to improve from 17.2% in FY21to 18.6% in FY23E.
Return ratios to improve significantly
Source: Company & Arihant Capital Research
Source: Company & Arihant Capital Research
Improving Cash Flow Generation
14.2
10.5
13.6
15.916.6
19.3
13.0
17.2
18.5 18.6
14.4
10.1
13.315.5
16.2
4
6
8
10
12
14
16
18
20
22
FY19 FY20 FY21 FY22E FY23E
RoCE RoE RoIC(%)
11.5
(27.5)
35.7
23.2
17.0
19.1
5.2 (0.5)
11.6 13.7
-30
-25
-20
-15
-10
-5
0
5
10
15
20
25
30
35
40
FY19 FY20 FY21 FY22E FY23E
(%)
EBIT growth Capital employed growth
Higher EBIT growth vs Capital Employed growth
Source: Company & Arihant Capital Research
Healthy Cash Flow Generation
During FY19-FY21, the capex outlay was INR64cr, which in turngenerated free cash flow (FCF) for the company to the tune of INR127crover the same period. However, the company has chalked out a capex ofINR105-110cr for the next two years.
With strong visibility of earnings growth, margin expansion andimprovement in working cycle, we expect operating cash flow/free cashflow to improve INR249cr/INR106cr, respectively over FY22E‐FY23E,compared to INR191cr/INR127, over a period of FY19‐FY21, respectively.
(20)
-
20
40
60
80
100
120
140
160
FY19 FY20 FY21 FY22E FY23E
FCF CFORs cr
Arihant Capital Markets Ltd
Initiating Coverage| Dollar Industries Ltd.
24
Indian innerwear market expanding fast and wide
From a basic requirement of a commodity product to a fashion productwith an emphasis on comfort and styling, the innerwear industry hasbroadened its horizons over time.
Earlier, the innerwear industry was a fragmented space and wasdominated by local and unorganized players. The entire industry washighly price-sensitive and people exercised caution in spending oninnerwear. However, with rising incomes, higher discretionary spending,and growing fashion consciousness, the market witnessed a change in thetrend with the introduction of organized and branded players in theindustry.
The current size of the innerwear industry of India is INR27,931 cr(which accounts for 10% of the total apparel market) and is expected togrow with a CAGR of 10% to INR74,258 cr by 2027.
The men’s innerwear market is expected to grow with a CAGR of 7%whereas the women’s innerwear market is expected to grow with a CAGRof 12%.
The increase in per capita income implies a rise in the purchasing powerof the people. With massive economic growth, rising disposable incomes,and higher discretionary spending, there has been an emergence of amiddle class that has become more brand conscious and is ready toexperiment with fashion and style. Consequently, the per capitaexpenditure on innerwear is expected to double to INR300.
There has been a recent rise of occasion-specific products in theindustry for different purposes such as sports, fashion, comfort, casual,etc. Moreover, there has also been a recent uptake of the online retailchannels which has led to an increase in sales by targeting fashionableyouth without access to retail outlets.
The Innerwear Category is one of the high growth categories in theapparel market and promises growth and innovation. The higher income,along with higher discretionary spending, growing fashion orientation ofconsumers and product innovations by the innerwear market have turnedinnerwear from a traditionally utilitarian item to an essential fashionrequirement.
The growth of the innerwear category is primarily centred in urbanIndia. The trend towards Western outfits, combined with the demand foroccasion and outfit-based innerwear, is acting as a boost for the market.Demand for innerwear with higher functionality and greater comfort isrising fast. The market for innerwear product variations like seamlessintimates, plus size inner wear, body shape enhancers, etc., is burgeoningboth in the metros and mini-metros.
Arihant Capital Markets Ltd
Initiating Coverage| Dollar Industries Ltd.
25
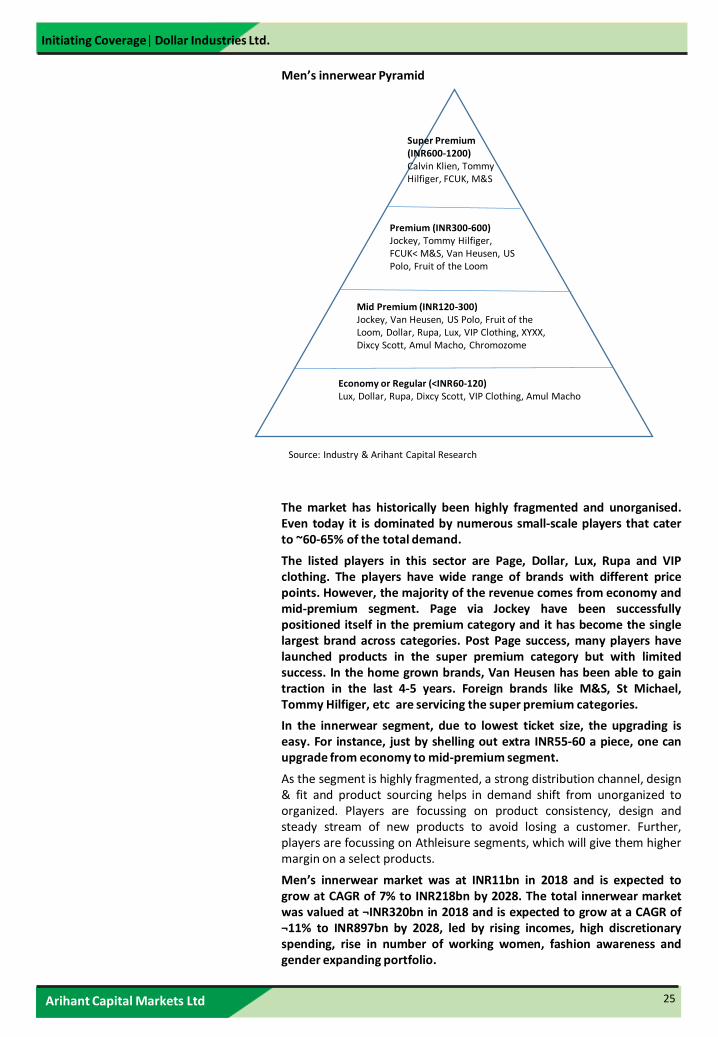
Men’s innerwear Pyramid
Super Premium (INR600-1200)Calvin Klien, Tommy Hilfiger, FCUK, M&S
Premium (INR300-600)Jockey, Tommy Hilfiger, FCUK< M&S, Van Heusen, US Polo, Fruit of the Loom
Mid Premium (INR120-300)Jockey, Van Heusen, US Polo, Fruit of the Loom, Dollar, Rupa, Lux, VIP Clothing, XYXX, Dixcy Scott, Amul Macho, Chromozome
Economy or Regular (<INR60-120)Lux, Dollar, Rupa, Dixcy Scott, VIP Clothing, Amul Macho
The market has historically been highly fragmented and unorganised.Even today it is dominated by numerous small-scale players that caterto ~60-65% of the total demand.
The listed players in this sector are Page, Dollar, Lux, Rupa and VIPclothing. The players have wide range of brands with different pricepoints. However, the majority of the revenue comes from economy andmid-premium segment. Page via Jockey have been successfullypositioned itself in the premium category and it has become the singlelargest brand across categories. Post Page success, many players havelaunched products in the super premium category but with limitedsuccess. In the home grown brands, Van Heusen has been able to gaintraction in the last 4-5 years. Foreign brands like M&S, St Michael,Tommy Hilfiger, etc are servicing the super premium categories.
In the innerwear segment, due to lowest ticket size, the upgrading iseasy. For instance, just by shelling out extra INR55-60 a piece, one canupgrade from economy to mid-premium segment.
As the segment is highly fragmented, a strong distribution channel, design& fit and product sourcing helps in demand shift from unorganized toorganized. Players are focussing on product consistency, design andsteady stream of new products to avoid losing a customer. Further,players are focussing on Athleisure segments, which will give them highermargin on a select products.
Men’s innerwear market was at INR11bn in 2018 and is expected togrow at CAGR of 7% to INR218bn by 2028. The total innerwear marketwas valued at ¬INR320bn in 2018 and is expected to grow at a CAGR of¬11% to INR897bn by 2028, led by rising incomes, high discretionaryspending, rise in number of working women, fashion awareness andgender expanding portfolio.
Source: Industry & Arihant Capital Research
Arihant Capital Markets Ltd
Initiating Coverage| Dollar Industries Ltd.
26
India's female innerwear market to double to $11 bn by 2025
The women’s innerwear market is considered to be more dynamic, withmany design variation and the regular introduction of innovativeproducts. Contrary to men’s innerwear where a consumer comes acrossadvertisements for several brands on a daily basis, brand promotion andadvertising activities are comparatively lower in women’s innerwear.
When it comes to price-wise segmentation, the women’s innerwearmarket is dominated by products of the mid-price and economy segment.These segments together contribute 80% of the market, while theremaining 20% comes from the premium and super premium segments.Like men’s innerwear, the mid-price and premium segments are expectedto grow more rapidly within women’s innerwear categories.
As per the report by consulting firm RedSeer, the female innerwearmarket will nearly double to $11-12bn by 2025 as incomes rise, moreyoung women join the workforce and people become aware of betterbrands.
The category comprises lingerie, athleisure (loungewear and active wear)and ancillaries such as shapewear and swimwear. It is among the fastestgrowing category in apparel, according to the report. The online femaleinnerwear market will be around $1-1.2bn by 2025: a rise of nearly sixtimes from 2020.
Innerwear is evolving into ‘casuals at home’ or 'at-home smartclothing’. Athleisure and active wear are benefiting from peoplebecoming fitness conscious, joining gyms and taking up activities likecycling. As per the report, the female innerwear market will grow insmaller cities will grow 1.5 times than in metropolises. In these cities, themajor growth factors will be digital penetration and brand awareness. It isgaining from social media influence and online shopping.
Huge Entry Barriers
The industry has managed to create huge brands backed by big celebrityendorsement. For eg, Akshay Kumar endorses Dollar’s Big Boss brand andChitraganda Singh endorses Dollar’s Missy brand. Varun Dhawanendorses Lux’s Cozi brand, Amitabh Bachchan endorses Lux’s Inferno andVenus brands, Virat Kohli endorses Lux’s ONN brand. Ranveer Singhendorses Rupa’s Frontline brand, Siddharth Malhotra endorses Rupa’sEuro brand and Anushka Sharma endorses Rupa’s Softline leggings.
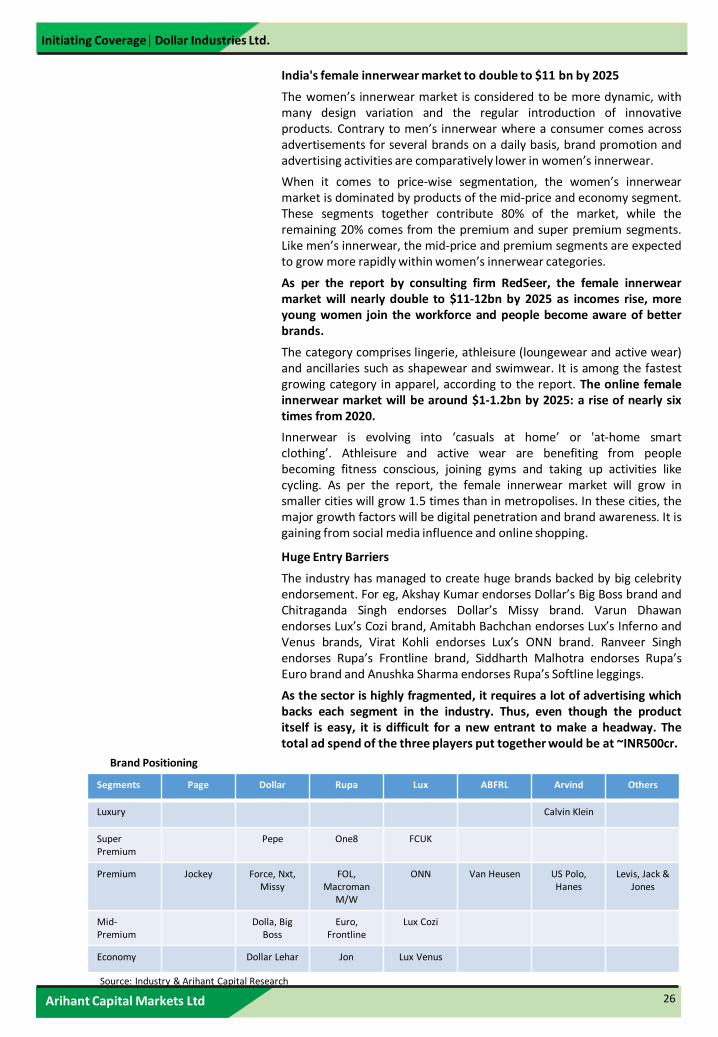
As the sector is highly fragmented, it requires a lot of advertising whichbacks each segment in the industry. Thus, even though the productitself is easy, it is difficult for a new entrant to make a headway. Thetotal ad spend of the three players put together would be at ~INR500cr.
Segments Page Dollar Rupa Lux ABFRL Arvind Others
Luxury Calvin Klein
Super Premium
Pepe One8 FCUK
Premium Jockey Force, Nxt, Missy
FOL, Macroman
M/W
ONN Van Heusen US Polo,Hanes
Levis, Jack & Jones
Mid-Premium
Dolla, Big Boss
Euro, Frontline
Lux Cozi
Economy Dollar Lehar Jon Lux Venus
Brand Positioning
Source: Industry & Arihant Capital Research
Arihant Capital Markets Ltd
Initiating Coverage| Dollar Industries Ltd.
27
Company Background
Dollar Industries Ltd (DIL) was established in 1972 by Dindayal Gupta as aproprietorship, the company was incorporated in 2005 as BhawaniTextiles, and then renamed as Dollar Industries in 2008. It began itsjourney with its signature brand “Dollar” in men's vests and briefs. Now, ithas a wide range of men's, women's and kids’ innerwear.
Dollar is amongst the large players in an otherwise fragmented innerwearmarket. Over the years, Dollar has built a strong portfolio of brands in theeconomy and mid-premium segment. After having established brands likeDollar Regular, Big Boss under the ‘Dollar’ umbrella, it is shifting focustowards premium segment by introducing new brands and entering intonewer product categories for diversifying from being a predominantlyMen’s Innerwear company to a lifestyle brand catering to Men, Womenand Kids segments.
The company is backward integrated and has manufacturing locations atTirupur, Kolkatta, Delhi and Ludhiana with spinning capacity of 400tonnes per month, knitting capacity of 300 tonnes per month, dyeing andbleaching capacity of 400 tonnes per month, cutting capacity of 3 lacpieces per day and elastic production capacity of 10 lakh metres permonth.
The company has a strong distribution network of +1,000 distributors and+1.1 lakh Multi Brand Outlets (MBO) and has increased focus fromconventional retail to large format stores, modern retail and e-commerce.As on FY21, it sold ¬18cr pieces of which 30-35% are made in-house andthe rest are outsourced.
Geographical presence: DIL's operations are spread across India, with thenorthern region contributing a major chunk of the revenue, followed byeastern, western and southern regions. North contributes ¬43% of therevenue, East and West contribute ¬26% and ¬23%, respectively; theresidual ¬8% comes from South. They are currently looking to expandtheir reach in the south region by increasing distributer's network.
Change in CFO: Mr Ankit Gupta has resigned as CFO and has been re-designated President (marketing) effective 10th Aug’21. Mr. Ajay KumarPatodia has been appointed as the new CFO with effect from 10th
Aug’21. Prior to joining Dollar he was associated with Lux Industries asCFO for the last 18 years.
Key Risks Aggressive investment by private label retailers in the innerwearcategory Increasing competitive intensity Reducing RoI for distributors/EBOsRaw material price fluctuation risk partly mitigated by various backwardintegration initiativesWorking capital intensiveness and deterioration in operating cycle Failure of launch of new products Inability to optimize the distribution channel A Covid 19 third wave can impose a lockdown and reduce mobilitywhich can impact the earnings of the company
Arihant Capital Markets Ltd
Initiating Coverage| Dollar Industries Ltd.
28
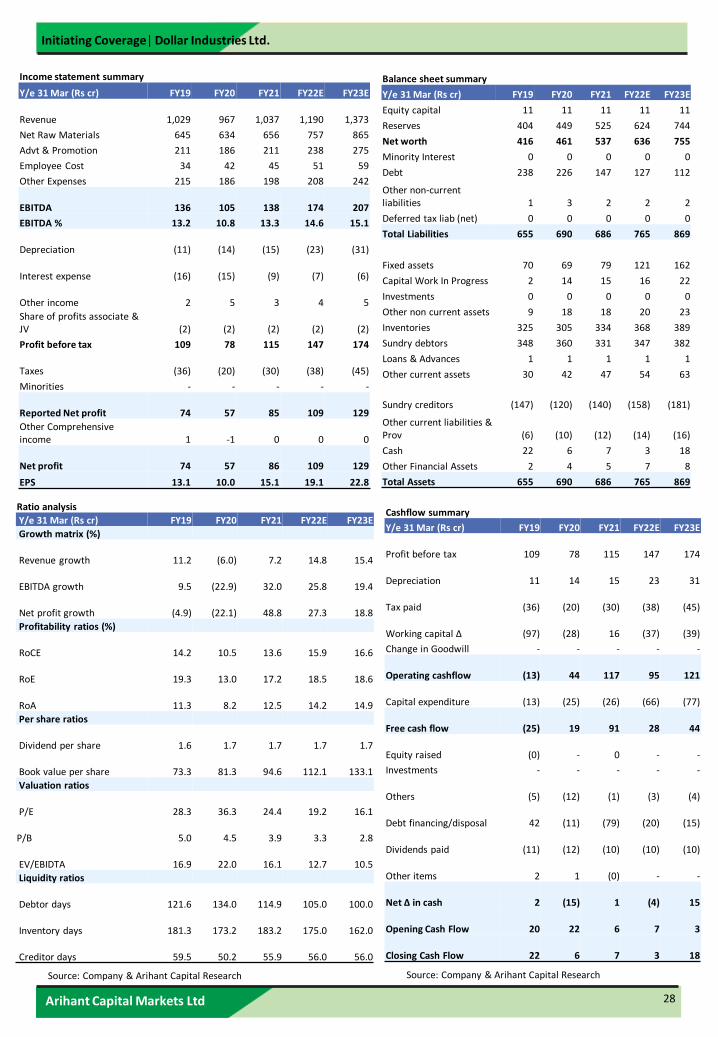
Income statement summary
Y/e 31 Mar (Rs cr) FY19 FY20 FY21 FY22E FY23E
Revenue 1,029 967 1,037 1,190 1,373
Net Raw Materials 645 634 656 757 865
Advt & Promotion 211 186 211 238 275
Employee Cost 34 42 45 51 59
Other Expenses 215 186 198 208 242
EBITDA 136 105 138 174 207
EBITDA % 13.2 10.8 13.3 14.6 15.1
Depreciation (11) (14) (15) (23) (31)
Interest expense (16) (15) (9) (7) (6)
Other income 2 5 3 4 5
Share of profits associate & JV (2) (2) (2) (2) (2)
Profit before tax 109 78 115 147 174
Taxes (36) (20) (30) (38) (45)
Minorities - - - - -
Reported Net profit 74 57 85 109 129
Other Comprehensive income 1 -1 0 0 0
Net profit 74 57 86 109 129
EPS 13.1 10.0 15.1 19.1 22.8
Balance sheet summary
Y/e 31 Mar (Rs cr) FY19 FY20 FY21 FY22E FY23E
Equity capital 11 11 11 11 11
Reserves 404 449 525 624 744
Net worth 416 461 537 636 755
Minority Interest 0 0 0 0 0
Debt 238 226 147 127 112
Other non-current liabilities 1 3 2 2 2
Deferred tax liab (net) 0 0 0 0 0
Total Liabilities 655 690 686 765 869
Fixed assets 70 69 79 121 162
Capital Work In Progress 2 14 15 16 22
Investments 0 0 0 0 0
Other non current assets 9 18 18 20 23
Inventories 325 305 334 368 389
Sundry debtors 348 360 331 347 382
Loans & Advances 1 1 1 1 1
Other current assets 30 42 47 54 63
Sundry creditors (147) (120) (140) (158) (181)
Other current liabilities & Prov (6) (10) (12) (14) (16)
Cash 22 6 7 3 18
Other Financial Assets 2 4 5 7 8
Total Assets 655 690 686 765 869
Ratio analysis
Y/e 31 Mar (Rs cr) FY19 FY20 FY21 FY22E FY23E
Growth matrix (%)
Revenue growth 11.2 (6.0) 7.2 14.8 15.4
EBITDA growth 9.5 (22.9) 32.0 25.8 19.4
Net profit growth (4.9) (22.1) 48.8 27.3 18.8
Profitability ratios (%)
RoCE 14.2 10.5 13.6 15.9 16.6
RoE 19.3 13.0 17.2 18.5 18.6
RoA 11.3 8.2 12.5 14.2 14.9
Per share ratios
Dividend per share 1.6 1.7 1.7 1.7 1.7
Book value per share 73.3 81.3 94.6 112.1 133.1
Valuation ratios
P/E 28.3 36.3 24.4 19.2 16.1
P/B 5.0 4.5 3.9 3.3 2.8
EV/EBIDTA 16.9 22.0 16.1 12.7 10.5
Liquidity ratios
Debtor days 121.6 134.0 114.9 105.0 100.0
Inventory days 181.3 173.2 183.2 175.0 162.0
Creditor days 59.5 50.2 55.9 56.0 56.0
Source: Company & Arihant Capital Research Source: Company & Arihant Capital Research
Cashflow summary
Y/e 31 Mar (Rs cr) FY19 FY20 FY21 FY22E FY23E
Profit before tax 109 78 115 147 174
Depreciation 11 14 15 23 31
Tax paid (36) (20) (30) (38) (45)
Working capital ∆ (97) (28) 16 (37) (39)
Change in Goodwill - - - - -
Operating cashflow (13) 44 117 95 121
Capital expenditure (13) (25) (26) (66) (77)
Free cash flow (25) 19 91 28 44
Equity raised (0) - 0 - -
Investments - - - - -
Others (5) (12) (1) (3) (4)
Debt financing/disposal 42 (11) (79) (20) (15)
Dividends paid (11) (12) (10) (10) (10)
Other items 2 1 (0) - -
Net ∆ in cash 2 (15) 1 (4) 15
Opening Cash Flow 20 22 6 7 3
Closing Cash Flow 22 6 7 3 18
Arihant Capital Markets Ltd
Initiating Coverage| Dollar Industries Ltd.
29
Head Office Registered Office
#1011, Solitaire Corporate Park
Building No. 10, 1st Floor Arihant House
Andheri Ghatkopar Link Road E-5 Ratlam Kothi
Chakala, Andheri (E) Indore - 452003, (M.P.)
Mumbai – 400093 Tel: (91-731) 3016100
Tel: (91-22) 42254800 Fax: (91-731) 3016199
Fax: (91-22) 42254880
Stock Rating Scale Absolute Return
BUY >20%
ACCUMULATE 12% to 20%
HOLD 5% to 12%
NEUTRAL -5% to 5%
REDUCE -5% to -12%
SELL <-12%
Research Analyst Registration No.
Contact Website Email Id
INH000002764 SMS: ‘Arihant’ to 56677 www.arihantcapital.com [email protected]
Disclaimer: This document has been prepared by Arihant Capital Markets Ltd. This document does not constitute an offer orsolicitation for the purchase and sale of any financial instrument by Arihant. This document has been prepared and issued on thebasis of publicly available information, internally developed data and other sources believed to be reliable. Whilst meticulous carehas been taken to ensure that the facts stated are accurate and opinions given are fair and reasonable, neither the analyst nor anyemployee of our company is in any way is responsible for its contents and nor is its accuracy or completeness guaranteed. Thisdocument is prepared for assistance only and is not intended to be and must not alone be taken as the basis for an investmentdecision. The user assumes the entire risk of any use made of this information. Arihant may trade in investments, which are thesubject of this document or in related investments and may have acted upon or used the information contained in this documentor the research or the analysis on which it is based, before its publication. This is just a suggestion and Arihant will not beresponsible for any profit or loss arising out of the decision taken by the reader of this document. Affiliates of Arihant may haveissued other reports that are inconsistent with and reach different conclusion from the information presented in this report. Nomatter contained in this document may be reproduced or copied without the consent of the firm.
Arihant Capital Markets Ltd.1011, Solitaire Corporate park, Building No. 10, 1st Floor,
Andheri Ghatkopar Link Road, Chakala, Andheri (E)Tel. 022-42254800Fax. 022-42254880
Arihant Research Desk
Email: [email protected]
Tel. : 022-42254800