Embed Size (px)
Citation preview
Malawi Country Report 2020 The African Seed Access Index
By
Edward Mabaya, Richard Kachule, Michael Waithaka, Mainza Mugoya, George Kanyenji, Krisztina Tihanyi
By
Edward Mabaya
Richard Kachule
Michael Waithaka
Mainza Mugoya
George Kanyenji
Krisztina Tihanyi
Reviewed by
Grace Kaudzu
Version August 2021
The findings in this report were presented to seed sector stakeholders in a TASAI dissemination meeting held online on July 28, 2021. The current version incorporates feedback from the meeting.
Cite as: Mabaya, E., Kachule, R., Waithaka, M., Mugoya, M., Kanyenji, G., and Tihanyi, K. 2021. Malawi 2020 Country Study - The African Seed Access Index (version August 2021).
Malawi Country Report 2020 The African Seed Access Index
CONTENTS
INTRODUCTION . . . . . . . . . . . . . . . . . . . . . . . . . . . . . . . . . . . . 1
RESEARCH AND DEVELOPMENT . . . . . . . . . . . . . . . . . . . . . . 5
INDUSTRY COMPETITIVENESS . . . . . . . . . . . . . . . . . . . . . . 12
SEED POLICY AND REGULATIONS . . . . . . . . . . . . . . . . . . . 17
INSTITUTIONAL SUPPORT . . . . . . . . . . . . . . . . . . . . . . . . . . 22
SERVICE TO SMALLHOLDER FARMERS . . . . . . . . . . . . . . . 24
CONCLUSION . . . . . . . . . . . . . . . . . . . . . . . . . . . . . . . . . . . . . 27
REFERENCES . . . . . . . . . . . . . . . . . . . . . . . . . . . . . . . . . . . . . . 30
LIST OF ACRONYMS:
AEDO – Agricultural Extension Development Officers
AFSTA – African Seed Trade Association
ATCC – Agriculture Technology Clearing Committee
CGIAR – Consultative Group on International Agricultural Research
CIAT – International Center for Tropical Agriculture
CIMMYT – International Maize and Wheat Improvement Center
COMESA – Common Market for Eastern and Southern Africa
DAES – Department of Agricultural Extension Services
DARS – Department of Agricultural Research Services
FISP – Farm Input Subsidy Program
ICRISAT – International Crops research Institute for the Semi-Arid Tropics
IITA – International Institute of Tropical Agriculture
LUANAR – Lilongwe University of Agriculture and Natural Resources
MoAIWD – Ministry of Agriculture, Irrigation, and Water Development
MRA – Malawi Revenue Authority
OPV – Open Pollinated Variety
SADC – Southern Africa Development Community
SSU – Seed Services Unit
STAM – Seed Trade Association of Malawi
TTU – Technology Transfer Unit
VCU – Value for Cultivation and Use
INTRODUCTION The formal sector is a structured and regulated value chain for the production of improved seed varieties. This process involves many actors and institutions, from breeding varieties to the production, processing, and distribution of certified seed. The different stages of improved seed production are regulated by governments based on approved regulations and standards. The sale of seed from this system takes place through limited distribution channels such as registered seed growers/companies and agrodealers. This system produces seed of the highest varietal purity, physical and sanitary quality. Malawi’s seed policy creates a framework for the growth of the formal seed sector by outlining the strategy for addressing the gaps in the industry (Malawi Government 2018).
The increased use of productivity-enhancing technologies, including mechanization, irrigation, fertilizer and improved seed, is critical to improving food and nutritional security across Africa. For field crops, a competitive formal seed sector is key to ensuring the timely availability of high-quality seed of improved, appropriate varieties at affordable prices for smallholder farmers. Improved seed can deliver state-of-the-art technology to farmers offering higher yields, disease and pest resistance, climate change adaptation, reduced post-harvest losses, and improved nutrition. To deliver these benefits, The African Seed Access Index (TASAI) conducts seed industry assessments at the national level and uses the findings to encourage public policymakers and development agencies to create and maintain enabling environments that will accelerate the development of competitive formal seed systems serving smallholder farmers in Africa.
This country report summarizes the key findings of the study conducted by TASAI in 2020 to appraise the structure and economic performance of Malawi’s formal seed sector. TASAI studies focus on the four grain and legume crops important to a country’s food and nutritional security (the “four focus crops”). In Malawi, these crops are maize, bean, groundnut and soya bean. The area across which these four crops are cultivated constitutes 73% of the country’s arable land (FAOSTAT, 2020).1 In addition, these four crops account for 95% of the total land area inspected by the Seed Services Unit (SSU) in 2018/19 (SSU, 2019).
OVERVIEW OF MALAWI’S FORMAL SEED INDUSTRYLike most other African countries, Malawi’s seed industry consists of two systems: the informal and formal sectors. This Country Report focuses almost exclusively on the formal seed sector.
The informal sector refers to a system in which seed is produced, maintained, and distributed through informal networks. These activities “tend to be decentralized and might revolve around local entrepreneurship, seed banking, community-based seed production, or seed villages” (McGuire and Sperling, 2016). In many cases, farmers keep seed from the harvest and exchange it with neighbors, relatives, and through rural markets. Seed from this system is of variable varietal purity, physical and sanitary quality.2 The informal sector is the primary source of seed for the majority of smallholder farmers in Malawi (Malawi Government 2018). It is estimated that over 70% of the seed used in Malawi is derived from the informal sector (Rutgers and AGRA, n.d.).
1 FAOSTAT http://www.fao.org/faostat/en/#data/QC
2 See seed system definitions at https://www.agrilinks.org/post/seed-system-definitions 1
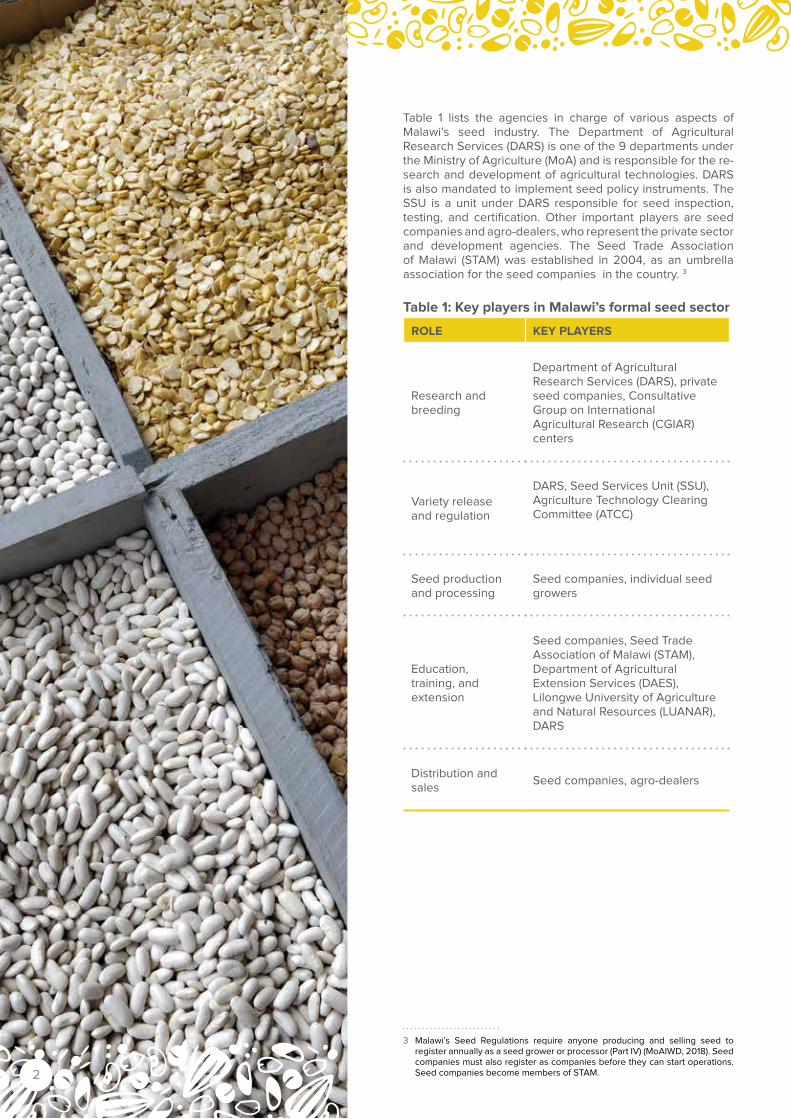
Table 1 lists the agencies in charge of various aspects of Malawi’s seed industry. The Department of Agricultural Research Services (DARS) is one of the 9 departments under the Ministry of Agriculture (MoA) and is responsible for the re-search and development of agricultural technologies. DARS is also mandated to implement seed policy instruments. The SSU is a unit under DARS responsible for seed inspection, testing, and certification. Other important players are seed companies and agro-dealers, who represent the private sector and development agencies. The Seed Trade Association of Malawi (STAM) was established in 2004, as an umbrella association for the seed companies in the country. 3
Table 1: Key players in Malawi’s formal seed sector
ROLE KEY PLAYERS
Research and breeding
Department of Agricultural Research Services (DARS), private seed companies, Consultative Group on International Agricultural Research (CGIAR) centers
Variety release and regulation
DARS, Seed Services Unit (SSU), Agriculture Technology Clearing Committee (ATCC)
Seed production and processing
Seed companies, individual seed growers
Education, training, and extension
Seed companies, Seed Trade Association of Malawi (STAM), Department of Agricultural Extension Services (DAES), Lilongwe University of Agriculture and Natural Resources (LUANAR), DARS
Distribution and sales
Seed companies, agro-dealers
3 Malawi’s Seed Regulations require anyone producing and selling seed to register annually as a seed grower or processor (Part IV) (MoAIWD, 2018). Seed companies must also register as companies before they can start operations. Seed companies become members of STAM. 2
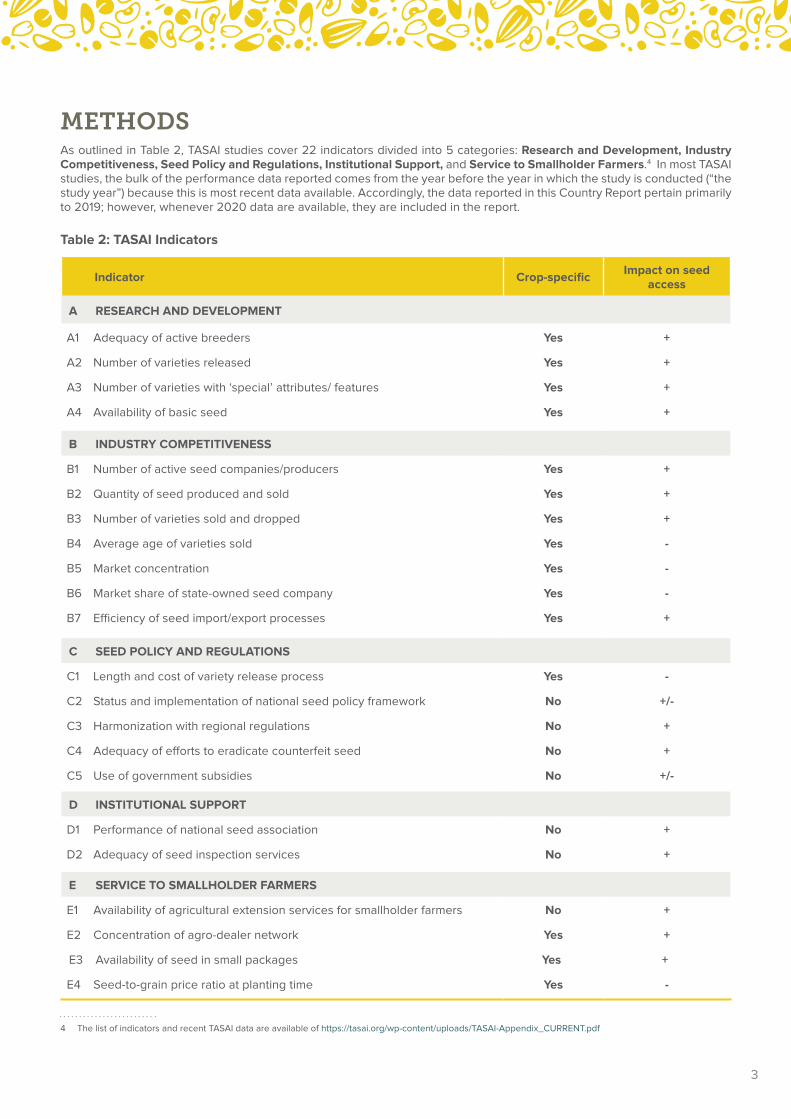
METHODSAs outlined in Table 2, TASAI studies cover 22 indicators divided into 5 categories: Research and Development, Industry Competitiveness, Seed Policy and Regulations, Institutional Support, and Service to Smallholder Farmers.4 In most TASAI studies, the bulk of the performance data reported comes from the year before the year in which the study is conducted (“the study year”) because this is most recent data available. Accordingly, the data reported in this Country Report pertain primarily to 2019; however, whenever 2020 data are available, they are included in the report.
Table 2: TASAI Indicators
Indicator Crop-specificImpact on seed
access
A RESEARCH AND DEVELOPMENT
A1 Adequacy of active breeders Yes +
A2 Number of varieties released Yes +
A3 Number of varieties with ‘special’ attributes/ features Yes +
A4 Availability of basic seed Yes +
B INDUSTRY COMPETITIVENESS
B1 Number of active seed companies/producers Yes +
B2 Quantity of seed produced and sold Yes +
B3 Number of varieties sold and dropped Yes +
B4 Average age of varieties sold Yes -
B5 Market concentration Yes -
B6 Market share of state-owned seed company Yes -
B7 Efficiency of seed import/export processes Yes +
C SEED POLICY AND REGULATIONS
C1 Length and cost of variety release process Yes -
C2 Status and implementation of national seed policy framework No +/-
C3 Harmonization with regional regulations No +
C4 Adequacy of efforts to eradicate counterfeit seed No +
C5 Use of government subsidies No +/-
D INSTITUTIONAL SUPPORT
D1 Performance of national seed association No +
D2 Adequacy of seed inspection services No +
E SERVICE TO SMALLHOLDER FARMERS
E1 Availability of agricultural extension services for smallholder farmers No +
E2 Concentration of agro-dealer network Yes +
E3 Availability of seed in small packages Yes +
E4 Seed-to-grain price ratio at planting time Yes -
4 The list of indicators and recent TASAI data are available of https://tasai.org/wp-content/uploads/TASAI-Appendix_CURRENT.pdf
3
To assess the progress of Malawi’s formal seed sector, the present Country Report draws comparisons with the findings of the 2017 TASAI Malawi study (which draws on performance data primarily from 2016). In addition, since TASAI has conducted similar studies in 20 other African countries, this report also draws relevant cross-country comparisons.
Using TASAI survey tools, data collection focused on three key seed industry players: seed companies, plant breeders, and representatives of government entities active in the country’s seed sector. Of these, seed companies were the primary source of information. For several indicators, TASAI supplements quantitative data with survey data, in which respondents were asked to rate various aspects of the seed sector in Malawi on a scale of 0-100, which are color-coded as follows: 0-19.99% extremely poor, 20-39.99% poor, 40-59.99% fair, 60-79.99% good, and 80-100% excellent .
According to the Seed Trade Association of Malawi (STAM), 24 registered seed companies were operating in the country as of February 2019. Out of these 24 registered seed companies:
● 17 produced and marketed certified seed of at least one of the four crops in 2019;
● 3 seed companies were inactive;
● 2 companies focused on other crops, such as cotton and tobacco;
● 2 companies did not market and sell any seed.
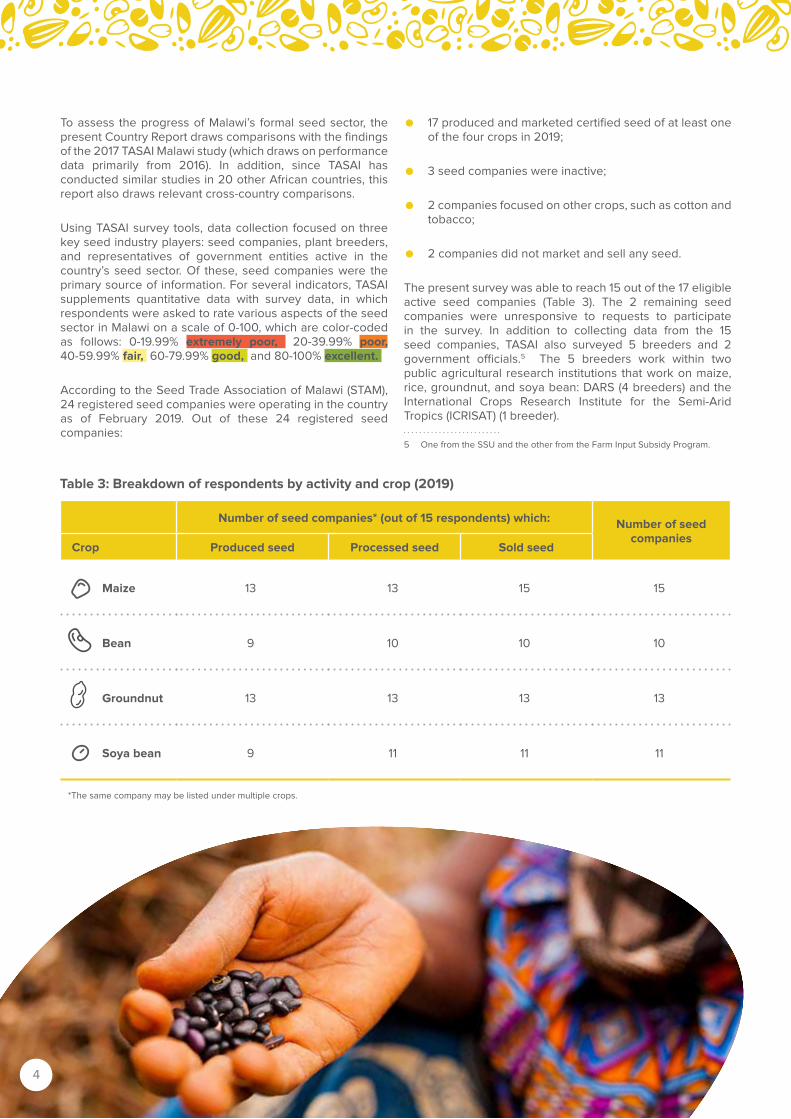
The present survey was able to reach 15 out of the 17 eligible active seed companies (Table 3). The 2 remaining seed companies were unresponsive to requests to participate in the survey. In addition to collecting data from the 15 seed companies, TASAI also surveyed 5 breeders and 2 government officials.5 The 5 breeders work within two public agricultural research institutions that work on maize, rice, groundnut, and soya bean: DARS (4 breeders) and the International Crops Research Institute for the Semi-Arid Tropics (ICRISAT) (1 breeder).
5 One from the SSU and the other from the Farm Input Subsidy Program.
Table 3: Breakdown of respondents by activity and crop (2019)
Number of seed companies* (out of 15 respondents) which:Number of seed
companies Crop Produced seed Processed seed Sold seed
Maize 13 13 15 15
Bean 9 10 10 10
Groundnut 13 13 13 13
Soya bean 9 11 11 11
*The same company may be listed under multiple crops.
4
RESEARCH AND DEVELOPMENT
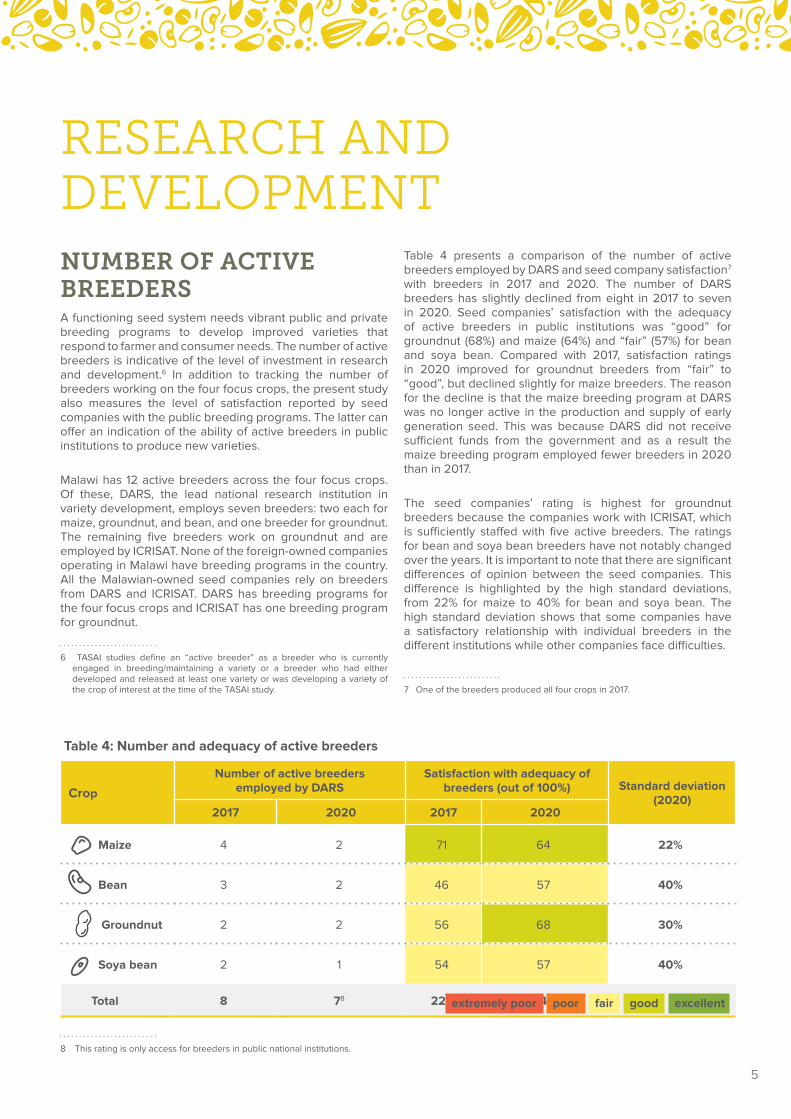
Table 4 presents a comparison of the number of active breeders employed by DARS and seed company satisfaction7 with breeders in 2017 and 2020. The number of DARS breeders has slightly declined from eight in 2017 to seven in 2020. Seed companies’ satisfaction with the adequacy of active breeders in public institutions was “good” for groundnut (68%) and maize (64%) and “fair” (57%) for bean and soya bean. Compared with 2017, satisfaction ratings in 2020 improved for groundnut breeders from “fair” to “good”, but declined slightly for maize breeders. The reason for the decline is that the maize breeding program at DARS was no longer active in the production and supply of early generation seed. This was because DARS did not receive sufficient funds from the government and as a result the maize breeding program employed fewer breeders in 2020 than in 2017.
The seed companies’ rating is highest for groundnut breeders because the companies work with ICRISAT, which is sufficiently staffed with five active breeders. The ratings for bean and soya bean breeders have not notably changed over the years. It is important to note that there are significant differences of opinion between the seed companies. This difference is highlighted by the high standard deviations, from 22% for maize to 40% for bean and soya bean. The high standard deviation shows that some companies have a satisfactory relationship with individual breeders in the different institutions while other companies face difficulties.
7 One of the breeders produced all four crops in 2017.
NUMBER OF ACTIVE BREEDERSA functioning seed system needs vibrant public and private breeding programs to develop improved varieties that respond to farmer and consumer needs. The number of active breeders is indicative of the level of investment in research and development.6 In addition to tracking the number of breeders working on the four focus crops, the present study also measures the level of satisfaction reported by seed companies with the public breeding programs. The latter can offer an indication of the ability of active breeders in public institutions to produce new varieties.
Malawi has 12 active breeders across the four focus crops. Of these, DARS, the lead national research institution in variety development, employs seven breeders: two each for maize, groundnut, and bean, and one breeder for groundnut. The remaining five breeders work on groundnut and are employed by ICRISAT. None of the foreign-owned companies operating in Malawi have breeding programs in the country. All the Malawian-owned seed companies rely on breeders from DARS and ICRISAT. DARS has breeding programs for the four focus crops and ICRISAT has one breeding program for groundnut.
6 TASAI studies define an “active breeder” as a breeder who is currently engaged in breeding/maintaining a variety or a breeder who had either developed and released at least one variety or was developing a variety of the crop of interest at the time of the TASAI study.
Table 4: Number and adequacy of active breeders
Crop
Number of active breeders employed by DARS
Satisfaction with adequacy of breeders (out of 100%) Standard deviation
(2020)2017 2020 2017 2020
Maize 4 2 71 64 22%
Bean 3 2 46 57 40%
Groundnut 2 2 56 68 30%
Soya bean 2 1 54 57 40%
Total 8 78 227 246
8 This rating is only access for breeders in public national institutions.
extremely poor poor fair good excellent
5
VARIETIES RELEASED IN THE LAST THREE YEARS The number of varieties released measures crop-speicfic outputs from the variety development and release system. The greater the number of varieties released in a country—counted across the prior three years—the higher the chances of enhancing smallholders’ access to improved seed. In addition to higher yields, new varieties often carry desired traits such as climate smartness, disease/pest resistance, and nutrition en-hancements.
VARIETIES WITH SPECIAL FEATURESVarieties may have special characteristics, for instance climate-smart, use-related (e.g. fast-cooking or nutri-tion-enhanced), or industry-demanded features. Examples of climate-smart features are drought tolerance, early maturity, or extra-early maturity. The variety data was obtained from extracts from the proceedings of Agriculture Technology Clearing Committee (ATCC) meetings. Between 2017 and 2019, a total of 38 varieties with special features were released, which are broken down by crop in Table 5. These features include climate-smart traits like early maturity and drought tolerance, pest and disease tolerance, and nutrition-enhanced features.
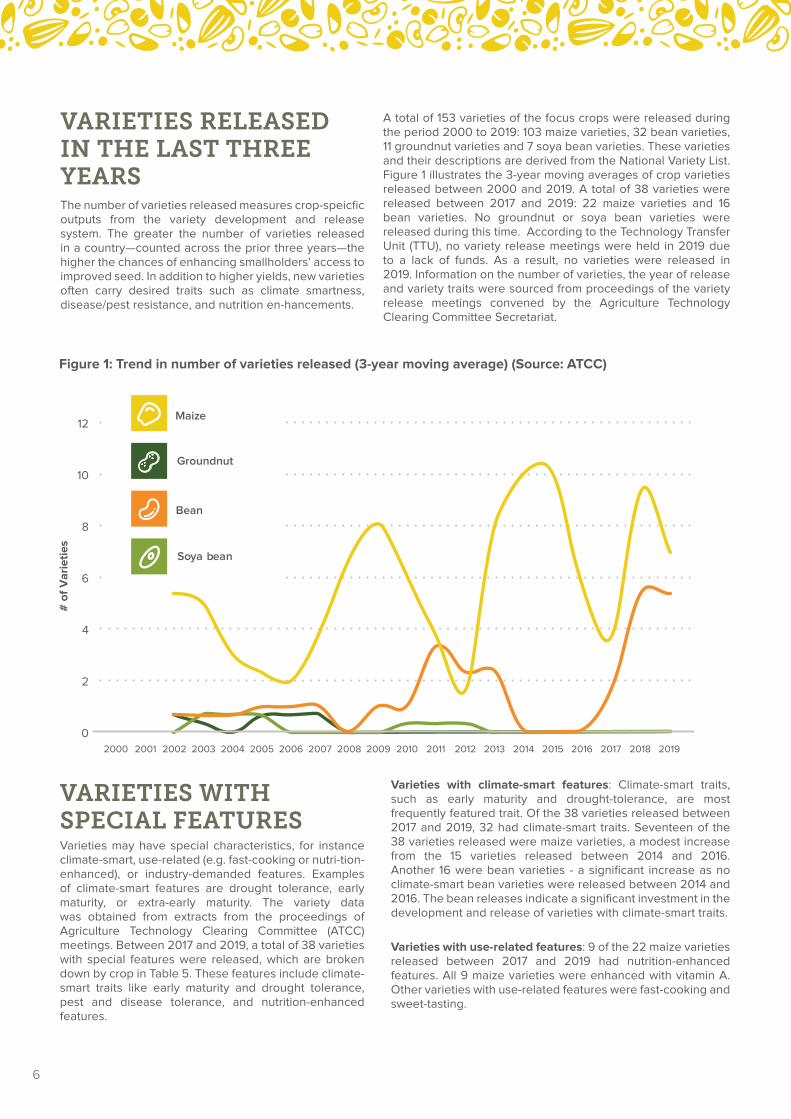
Figure 1: Trend in number of varieties released (3-year moving average) (Source: ATCC)
Varieties with climate-smart features: Climate-smart traits, such as early maturity and drought-tolerance, are most frequently featured trait. Of the 38 varieties released between 2017 and 2019, 32 had climate-smart traits. Seventeen of the 38 varieties released were maize varieties, a modest increase from the 15 varieties released between 2014 and 2016. Another 16 were bean varieties - a significant increase as no climate-smart bean varieties were released between 2014 and 2016. The bean releases indicate a significant investment in the development and release of varieties with climate-smart traits.
Varieties with use-related features: 9 of the 22 maize varieties released between 2017 and 2019 had nutrition-enhanced features. All 9 maize varieties were enhanced with vitamin A. Other varieties with use-related features were fast-cooking and sweet-tasting.
A total of 153 varieties of the focus crops were released during the period 2000 to 2019: 103 maize varieties, 32 bean varieties, 11 groundnut varieties and 7 soya bean varieties. These varieties and their descriptions are derived from the National Variety List. Figure 1 illustrates the 3-year moving averages of crop varieties released between 2000 and 2019. A total of 38 varieties were released between 2017 and 2019: 22 maize varieties and 16 bean varieties. No groundnut or soya bean varieties were released during this time. According to the Technology Transfer Unit (TTU), no variety release meetings were held in 2019 due to a lack of funds. As a result, no varieties were released in 2019. Information on the number of varieties, the year of release and variety traits were sourced from proceedings of the variety release meetings convened by the Agriculture Technology Clearing Committee Secretariat.
200220012000 2003 2004 2005 2006 2007 2008 2009 2010 2011 2012 2013 2014 2015 2016 2017 2018 2019
0
2
4
6
8
10
12
# o
f V
ari
eti
es
Maize
Groundnut
Bean
Soya bean
6
Table 5: Number of varieties with special features released
Attribute/ feature
Description of feature/ attribute
Number of varieties released 2017 - 2019
Ma
ize
Gro
un
dn
ut
Be
an
So
ya
be
an
TO
TA
L
All varieties released 22 0 16 0 38
All varieties released with special features
17 0 16 0 33
Climate-smart features
All climate-smart features
10 0 16 0 26
Drought tolerant
8 0 11 0 19
Early / extra-early maturing
5 0 5 0 10
Use-related attributes
All use-related attributes
9 0 0 0 9
Nutrition-enhanced features
9 0 0 0 9
NUMBER OF VARIETIES SOLD IN 2019An increase in the number of varieties sold in a country often reflects an increased choice of varieties available to farmers. In 2019, the seed companies surveyed sold 47 varieties of the four crops to farmers: 31 maize varieties, 6 bean varieties, 5 groundnut varieties, and 5 soya bean varieties (Table 6). More maize varieties were sold because local and foreign-owned private seed companies had invested in the development and the marketing of hybrid maize varieties, which are more profitable than open-pollinated varieties (OPV). None of the other crops have hybrid varieties. Due to their lower profitability, private companies do not invest as much in the marketing of varieties for the other three crops. The total number of varieties sold has not changed much since 2016, when 46 varieties were sold: 29 maize, 8 bean, 3 groundnut and 6 soya bean varieties.
Table 6 also shows the volume of each variety produced as a percentage of the certified production of each crop. The data on certified production is from SSU. For two crops - groundnut and soya bean, the top variety accounts for more than half of the overall crop production - 76% for groundnut and 54% for soya bean. However, The top four maize varieties account for 50% of the overall certified maize seed production in 2019.
7
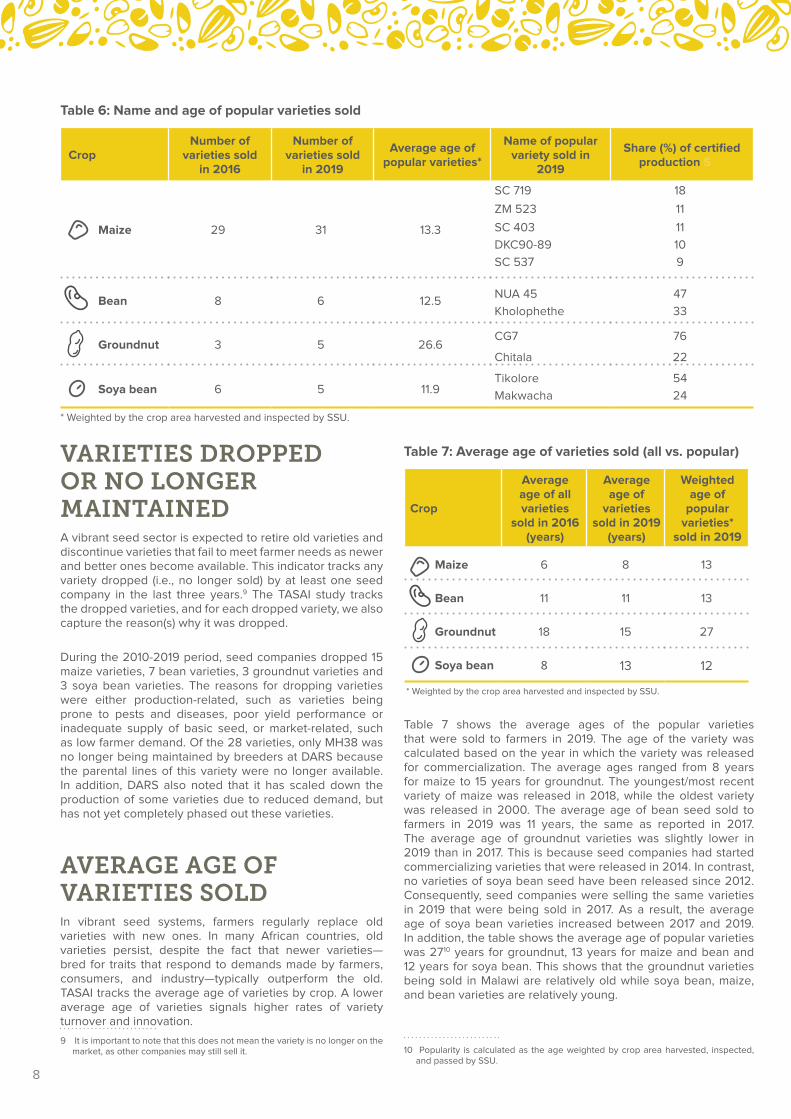
Table 6: Name and age of popular varieties sold
CropNumber of
varieties sold in 2016
Number of varieties sold
in 2019
Average age of popular varieties*
Name of popular variety sold in
2019
Share (%) of certified production Sha
Maize 29 31 13.3
SC 719 18
ZM 523 11
SC 403 11
DKC90-89 10
SC 537 9
Bean 8 6 12.5NUA 45 47
Kholophethe 33
Groundnut 3 5 26.6CG7 76
Chitala 22
Soya bean 6 5 11.9Tikolore 54
Makwacha 24
* Weighted by the crop area harvested and inspected by SSU.
VARIETIES DROPPED OR NO LONGER MAINTAINEDA vibrant seed sector is expected to retire old varieties and discontinue varieties that fail to meet farmer needs as newer and better ones become available. This indicator tracks any variety dropped (i.e., no longer sold) by at least one seed company in the last three years.9 The TASAI study tracks the dropped varieties, and for each dropped variety, we also capture the reason(s) why it was dropped.
During the 2010-2019 period, seed companies dropped 15 maize varieties, 7 bean varieties, 3 groundnut varieties and 3 soya bean varieties. The reasons for dropping varieties were either production-related, such as varieties being prone to pests and diseases, poor yield performance or inadequate supply of basic seed, or market-related, such as low farmer demand. Of the 28 varieties, only MH38 was no longer being maintained by breeders at DARS because the parental lines of this variety were no longer available. In addition, DARS also noted that it has scaled down the production of some varieties due to reduced demand, but has not yet completely phased out these varieties.
AVERAGE AGE OF VARIETIES SOLDIn vibrant seed systems, farmers regularly replace old varieties with new ones. In many African countries, old varieties persist, despite the fact that newer varieties—bred for traits that respond to demands made by farmers, consumers, and industry—typically outperform the old. TASAI tracks the average age of varieties by crop. A lower average age of varieties signals higher rates of variety turnover and innovation.
9 It is important to note that this does not mean the variety is no longer on the market, as other companies may still sell it.
Table 7: Average age of varieties sold (all vs . popular)
Crop
Average age of all varieties
sold in 2016 (years)
Average age of
varieties sold in 2019
(years)
Weighted age of
popular varieties*
sold in 2019
Maize 6 8 13
Bean 11 11 13
Groundnut 18 15 27
Soya bean 8 13 12
* Weighted by the crop area harvested and inspected by SSU.
Table 7 shows the average ages of the popular varieties that were sold to farmers in 2019. The age of the variety was calculated based on the year in which the variety was released for commercialization. The average ages ranged from 8 years for maize to 15 years for groundnut. The youngest/most recent variety of maize was released in 2018, while the oldest variety was released in 2000. The average age of bean seed sold to farmers in 2019 was 11 years, the same as reported in 2017. The average age of groundnut varieties was slightly lower in 2019 than in 2017. This is because seed companies had started commercializing varieties that were released in 2014. In contrast, no varieties of soya bean seed have been released since 2012. Consequently, seed companies were selling the same varieties in 2019 that were being sold in 2017. As a result, the average age of soya bean varieties increased between 2017 and 2019. In addition, the table shows the average age of popular varieties was 2710 years for groundnut, 13 years for maize and bean and 12 years for soya bean. This shows that the groundnut varieties being sold in Malawi are relatively old while soya bean, maize, and bean varieties are relatively young.
10 Popularity is calculated as the age weighted by crop area harvested, inspected, and passed by SSU.
8
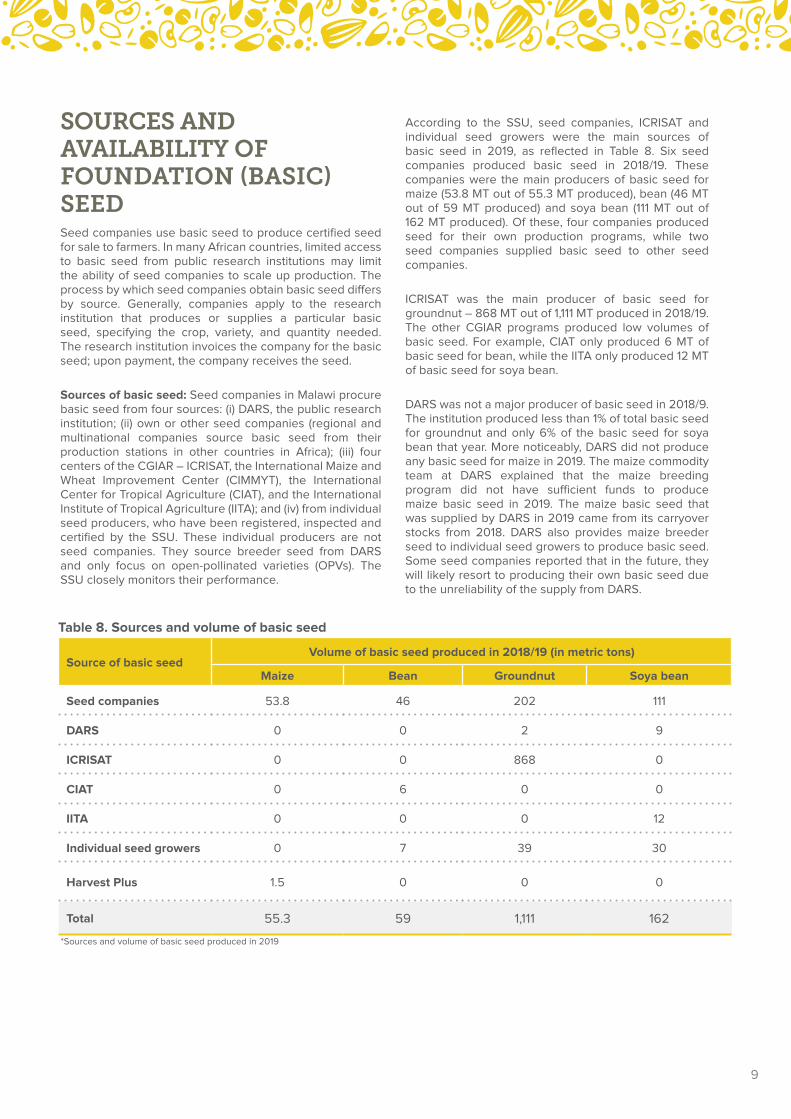
SOURCES AND AVAILABILITY OF FOUNDATION (BASIC) SEED Seed companies use basic seed to produce certified seed for sale to farmers. In many African countries, limited access to basic seed from public research institutions may limit the ability of seed companies to scale up production. The process by which seed companies obtain basic seed differs by source. Generally, companies apply to the research institution that produces or supplies a particular basic seed, specifying the crop, variety, and quantity needed. The research institution invoices the company for the basic seed; upon payment, the company receives the seed.
Sources of basic seed: Seed companies in Malawi procure basic seed from four sources: (i) DARS, the public research institution; (ii) own or other seed companies (regional and multinational companies source basic seed from their production stations in other countries in Africa); (iii) four centers of the CGIAR – ICRISAT, the International Maize and Wheat Improvement Center (CIMMYT), the International Center for Tropical Agriculture (CIAT), and the International Institute of Tropical Agriculture (IITA); and (iv) from individual seed producers, who have been registered, inspected and certified by the SSU. These individual producers are not seed companies. They source breeder seed from DARS and only focus on open-pollinated varieties (OPVs). The SSU closely monitors their performance.
According to the SSU, seed companies, ICRISAT and individual seed growers were the main sources of basic seed in 2019, as reflected in Table 8. Six seed companies produced basic seed in 2018/19. These companies were the main producers of basic seed for maize (53.8 MT out of 55.3 MT produced), bean (46 MT out of 59 MT produced) and soya bean (111 MT out of 162 MT produced). Of these, four companies produced seed for their own production programs, while two seed companies supplied basic seed to other seed companies.
ICRISAT was the main producer of basic seed for groundnut – 868 MT out of 1,111 MT produced in 2018/19. The other CGIAR programs produced low volumes of basic seed. For example, CIAT only produced 6 MT of basic seed for bean, while the IITA only produced 12 MT of basic seed for soya bean.
DARS was not a major producer of basic seed in 2018/9. The institution produced less than 1% of total basic seed for groundnut and only 6% of the basic seed for soya bean that year. More noticeably, DARS did not produce any basic seed for maize in 2019. The maize commodity team at DARS explained that the maize breeding program did not have sufficient funds to produce maize basic seed in 2019. The maize basic seed that was supplied by DARS in 2019 came from its carryover stocks from 2018. DARS also provides maize breeder seed to individual seed growers to produce basic seed. Some seed companies reported that in the future, they will likely resort to producing their own basic seed due to the unreliability of the supply from DARS.
Table 8 . Sources and volume of basic seed
Source of basic seedVolume of basic seed produced in 2018/19 (in metric tons)
Maize Bean Groundnut Soya bean
Seed companies 53.8 46 202 111
DARS 0 0 2 9
ICRISAT 0 0 868 0
CIAT 0 6 0 0
IITA 0 0 0 12
Individual seed growers 0 7 39 30
Harvest Plus 1.5 0 0 0
Total 55.3 59 1,111 162
*Sources and volume of basic seed produced in 2019
9
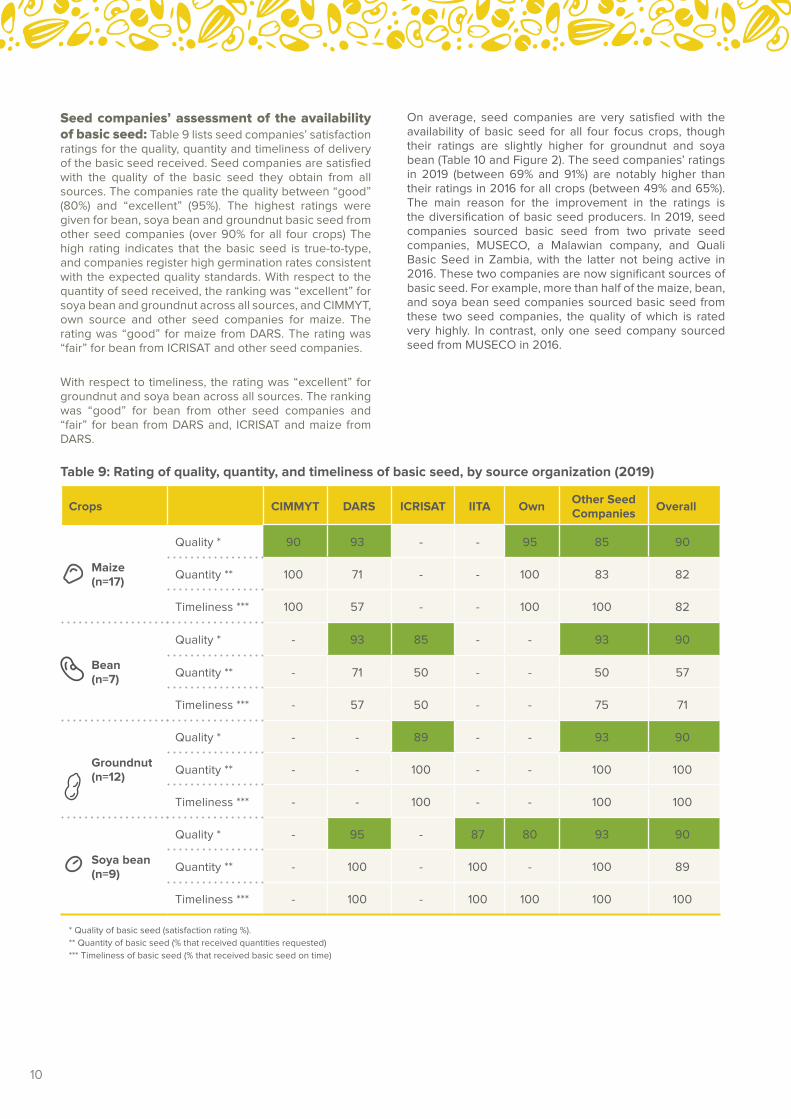
Seed companies’ assessment of the availability of basic seed: Table 9 lists seed companies’ satisfaction ratings for the quality, quantity and timeliness of delivery of the basic seed received. Seed companies are satisfied with the quality of the basic seed they obtain from all sources. The companies rate the quality between “good” (80%) and “excellent” (95%). The highest ratings were given for bean, soya bean and groundnut basic seed from other seed companies (over 90% for all four crops) The high rating indicates that the basic seed is true-to-type, and companies register high germination rates consistent with the expected quality standards. With respect to the quantity of seed received, the ranking was “excellent” for soya bean and groundnut across all sources, and CIMMYT, own source and other seed companies for maize. The rating was “good” for maize from DARS. The rating was “fair” for bean from ICRISAT and other seed companies.
With respect to timeliness, the rating was “excellent” for groundnut and soya bean across all sources. The ranking was “good” for bean from other seed companies and “fair” for bean from DARS and, ICRISAT and maize from DARS.
Table 9: Rating of quality, quantity, and timeliness of basic seed, by source organization (2019)
Crops CIMMYT DARS ICRISAT IITA OwnOther Seed Companies
Overall
Maize (n=17)
Quality * 90 93 - - 95 85 90
Quantity ** 100 71 - - 100 83 82
Timeliness *** 100 57 - - 100 100 82
Bean (n=7)
Quality * - 93 85 - - 93 90
Quantity ** - 71 50 - - 50 57
Timeliness *** - 57 50 - - 75 71
Groundnut (n=12)
Quality * - - 89 - - 93 90
Quantity ** - - 100 - - 100 100
Timeliness *** - - 100 - - 100 100
Soya bean (n=9)
Quality * - 95 - 87 80 93 90
Quantity ** - 100 - 100 - 100 89
Timeliness *** - 100 - 100 100 100 100
* Quality of basic seed (satisfaction rating %).
** Quantity of basic seed (% that received quantities requested)
*** Timeliness of basic seed (% that received basic seed on time)
On average, seed companies are very satisfied with the availability of basic seed for all four focus crops, though their ratings are slightly higher for groundnut and soya bean (Table 10 and Figure 2). The seed companies’ ratings in 2019 (between 69% and 91%) are notably higher than their ratings in 2016 for all crops (between 49% and 65%). The main reason for the improvement in the ratings is the diversification of basic seed producers. In 2019, seed companies sourced basic seed from two private seed companies, MUSECO, a Malawian company, and Quali Basic Seed in Zambia, with the latter not being active in 2016. These two companies are now significant sources of basic seed. For example, more than half of the maize, bean, and soya bean seed companies sourced basic seed from these two seed companies, the quality of which is rated very highly. In contrast, only one seed company sourced seed from MUSECO in 2016.
10

Table 10: Seed companies’ assessment of availability of basic seed by source organization and overall in 2019
OrganizationAvailability of basic seed (overall opinion in %)
Maize (n=17) Bean (n=7) Groundnut (n=12) Soya bean (n=9)
CIMMYT 85 NA NA NA
DARS 57 80 NA 70
ICRISAT NA 55 91 NA
IITA NA NA NA 97
Own 90 NA NA 60
Other seed companies 88 73 90 93
extremely poor poor fair good excellent
Figure 2: Comparison of overall satisfaction ratings of availability of basic seed
65%
49%58%
52%
75%69%
91% 86%
0%
20%
40%
60%
80%
100%
Maize Bean Groundnut Soya bean
Average satisfaction (2016) Average satisfaction (2019)
11
INDUSTRY COMPETITIVENESS
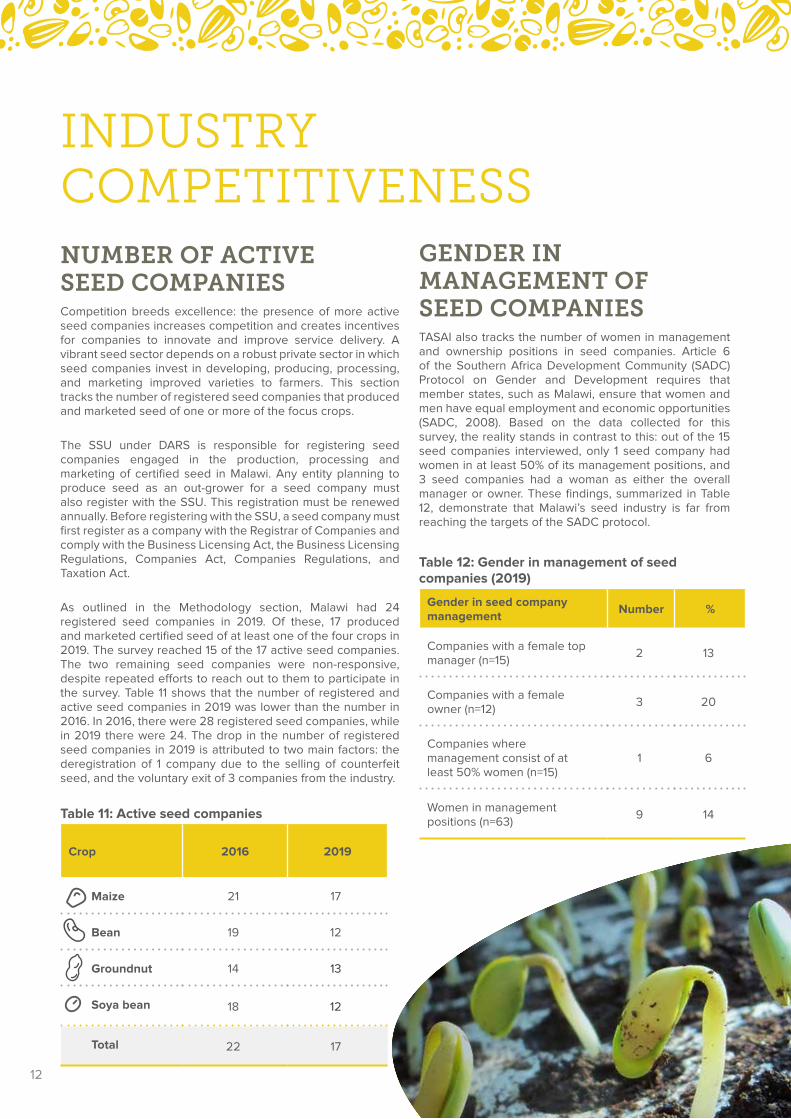
GENDER IN MANAGEMENT OF SEED COMPANIESTASAI also tracks the number of women in management and ownership positions in seed companies. Article 6 of the Southern Africa Development Community (SADC) Protocol on Gender and Development requires that member states, such as Malawi, ensure that women and men have equal employment and economic opportunities (SADC, 2008). Based on the data collected for this survey, the reality stands in contrast to this: out of the 15 seed companies interviewed, only 1 seed company had women in at least 50% of its management positions, and 3 seed companies had a woman as either the overall manager or owner. These findings, summarized in Table 12, demonstrate that Malawi’s seed industry is far from reaching the targets of the SADC protocol.
Table 12: Gender in management of seed companies (2019)
Gender in seed company management
Number %
Companies with a female top manager (n=15)
2 13
Companies with a female owner (n=12)
3 20
Companies where management consist of at least 50% women (n=15)
1 6
Women in management positions (n=63)
9 14
NUMBER OF ACTIVE SEED COMPANIESCompetition breeds excellence: the presence of more active seed companies increases competition and creates incentives for companies to innovate and improve service delivery. A vibrant seed sector depends on a robust private sector in which seed companies invest in developing, producing, processing, and marketing improved varieties to farmers. This section tracks the number of registered seed companies that produced and marketed seed of one or more of the focus crops.
The SSU under DARS is responsible for registering seed companies engaged in the production, processing and marketing of certified seed in Malawi. Any entity planning to produce seed as an out-grower for a seed company must also register with the SSU. This registration must be renewed annually. Before registering with the SSU, a seed company must first register as a company with the Registrar of Companies and comply with the Business Licensing Act, the Business Licensing Regulations, Companies Act, Companies Regulations, and Taxation Act.
As outlined in the Methodology section, Malawi had 24 registered seed companies in 2019. Of these, 17 produced and marketed certified seed of at least one of the four crops in 2019. The survey reached 15 of the 17 active seed companies. The two remaining seed companies were non-responsive, despite repeated efforts to reach out to them to participate in the survey. Table 11 shows that the number of registered and active seed companies in 2019 was lower than the number in 2016. In 2016, there were 28 registered seed companies, while in 2019 there were 24. The drop in the number of registered seed companies in 2019 is attributed to two main factors: the deregistration of 1 company due to the selling of counterfeit seed, and the voluntary exit of 3 companies from the industry.
Table 11: Active seed companies
Crop 2016 2019
Maize 21 17
Bean 19 12
Groundnut 14 13
Soya bean 18 12
Total 22 17
12
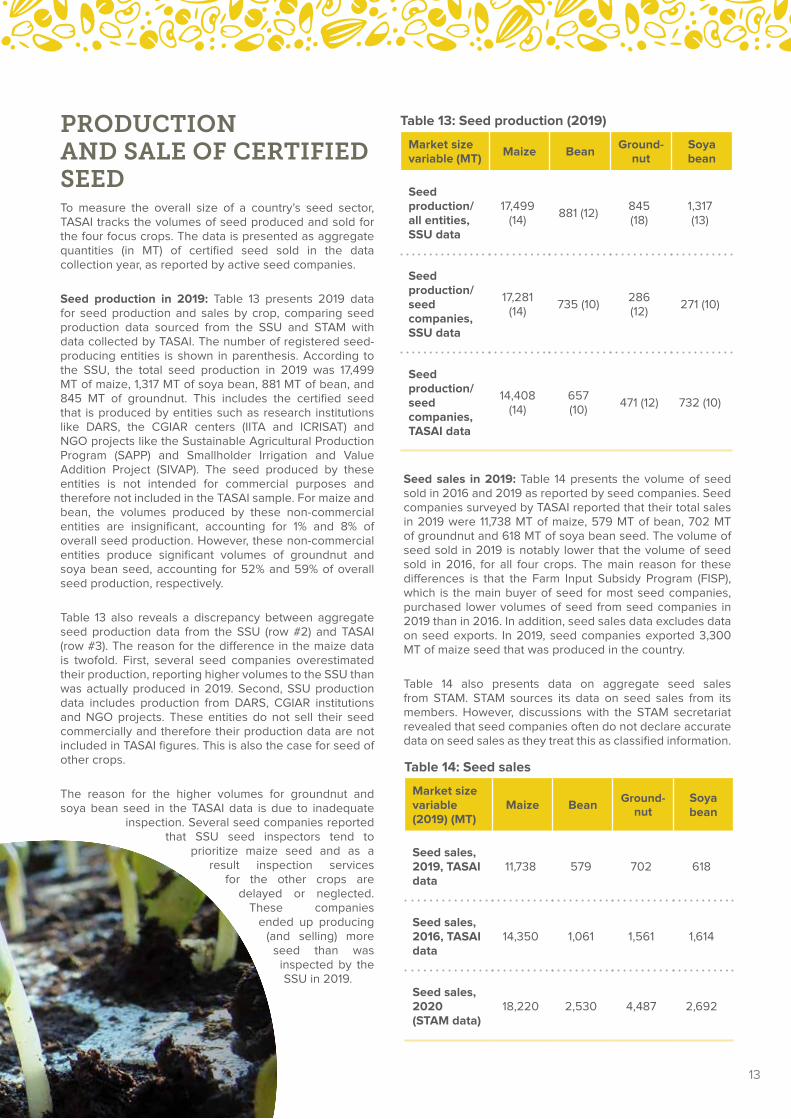
PRODUCTION AND SALE OF CERTIFIED SEEDTo measure the overall size of a country’s seed sector, TASAI tracks the volumes of seed produced and sold for the four focus crops. The data is presented as aggregate quantities (in MT) of certified seed sold in the data collection year, as reported by active seed companies.
Seed production in 2019: Table 13 presents 2019 data for seed production and sales by crop, comparing seed production data sourced from the SSU and STAM with data collected by TASAI. The number of registered seed-producing entities is shown in parenthesis. According to the SSU, the total seed production in 2019 was 17,499 MT of maize, 1,317 MT of soya bean, 881 MT of bean, and 845 MT of groundnut. This includes the certified seed that is produced by entities such as research institutions like DARS, the CGIAR centers (IITA and ICRISAT) and NGO projects like the Sustainable Agricultural Production Program (SAPP) and Smallholder Irrigation and Value Addition Project (SIVAP). The seed produced by these entities is not intended for commercial purposes and therefore not included in the TASAI sample. For maize and bean, the volumes produced by these non-commercial entities are insignificant, accounting for 1% and 8% of overall seed production. However, these non-commercial entities produce significant volumes of groundnut and soya bean seed, accounting for 52% and 59% of overall seed production, respectively.
Table 13 also reveals a discrepancy between aggregate seed production data from the SSU (row #2) and TASAI (row #3). The reason for the difference in the maize data is twofold. First, several seed companies overestimated their production, reporting higher volumes to the SSU than was actually produced in 2019. Second, SSU production data includes production from DARS, CGIAR institutions and NGO projects. These entities do not sell their seed commercially and therefore their production data are not included in TASAI figures. This is also the case for seed of other crops.
The reason for the higher volumes for groundnut and soya bean seed in the TASAI data is due to inadequate
inspection. Several seed companies reported that SSU seed inspectors tend to
prioritize maize seed and as a result inspection services
for the other crops are delayed or neglected.
These companies ended up producing
(and selling) more seed than was
inspected by the SSU in 2019.
Table 13: Seed production (2019)
Market size variable (MT)
Maize BeanGround-
nutSoya bean
Seed production/ all entities, SSU data
17,499 (14)
881 (12) 845 (18)
1,317 (13)
Seed production/ seed companies, SSU data
17,281 (14)
735 (10) 286 (12)
271 (10)
Seed production/ seed companies, TASAI data
14,408 (14)
657 (10)
471 (12) 732 (10)
Seed sales in 2019: Table 14 presents the volume of seed sold in 2016 and 2019 as reported by seed companies. Seed companies surveyed by TASAI reported that their total sales in 2019 were 11,738 MT of maize, 579 MT of bean, 702 MT of groundnut and 618 MT of soya bean seed. The volume of seed sold in 2019 is notably lower that the volume of seed sold in 2016, for all four crops. The main reason for these differences is that the Farm Input Subsidy Program (FISP), which is the main buyer of seed for most seed companies, purchased lower volumes of seed from seed companies in 2019 than in 2016. In addition, seed sales data excludes data on seed exports. In 2019, seed companies exported 3,300 MT of maize seed that was produced in the country.
Table 14 also presents data on aggregate seed sales from STAM. STAM sources its data on seed sales from its members. However, discussions with the STAM secretariat revealed that seed companies often do not declare accurate data on seed sales as they treat this as classified information.
Table 14: Seed sales
Market size variable (2019) (MT)
Maize BeanGround-
nutSoya bean
Seed sales, 2019, TASAI data
11,738 579 702 618
Seed sales, 2016, TASAI data
14,350 1,061 1,561 1,614
Seed sales, 2020 (STAM data)
18,220 2,530 4,487 2,692
13
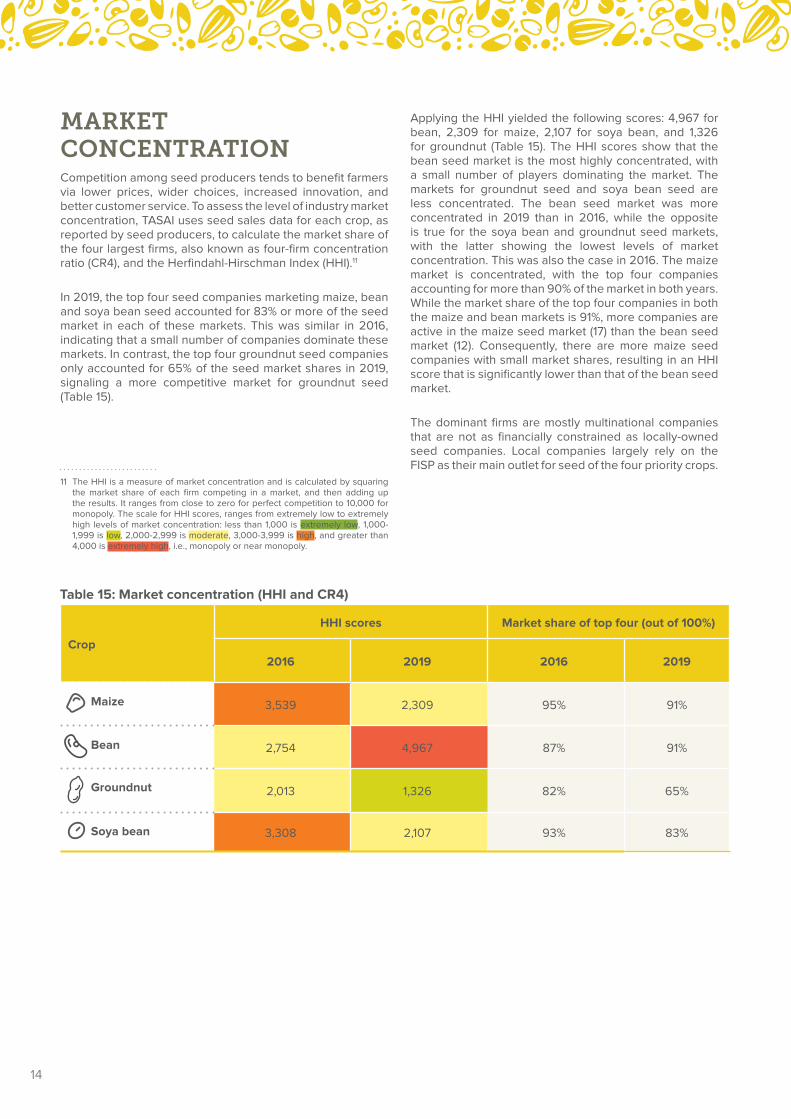
MARKET CONCENTRATIONCompetition among seed producers tends to benefit farmers via lower prices, wider choices, increased innovation, and better customer service. To assess the level of industry market concentration, TASAI uses seed sales data for each crop, as reported by seed producers, to calculate the market share of the four largest firms, also known as four-firm concentration ratio (CR4), and the Herfindahl-Hirschman Index (HHI).11
In 2019, the top four seed companies marketing maize, bean and soya bean seed accounted for 83% or more of the seed market in each of these markets. This was similar in 2016, indicating that a small number of companies dominate these markets. In contrast, the top four groundnut seed companies only accounted for 65% of the seed market shares in 2019, signaling a more competitive market for groundnut seed (Table 15).
11 The HHI is a measure of market concentration and is calculated by squaring the market share of each firm competing in a market, and then adding up the results. It ranges from close to zero for perfect competition to 10,000 for monopoly. The scale for HHI scores, ranges from extremely low to extremely high levels of market concentration: less than 1,000 is extremely low, 1,000-1,999 is low, 2,000-2,999 is moderate, 3,000-3,999 is high, and greater than 4,000 is extremely high, i.e., monopoly or near monopoly.
Table 15: Market concentration (HHI and CR4)
Crop
HHI scores Market share of top four (out of 100%)
2016 2019 2016 2019
Maize 3,539 2,309 95% 91%
Bean 2,754 4,967 87% 91%
Groundnut 2,013 1,326 82% 65%
Soya bean 3,308 2,107 93% 83%
Applying the HHI yielded the following scores: 4,967 for bean, 2,309 for maize, 2,107 for soya bean, and 1,326 for groundnut (Table 15). The HHI scores show that the bean seed market is the most highly concentrated, with a small number of players dominating the market. The markets for groundnut seed and soya bean seed are less concentrated. The bean seed market was more concentrated in 2019 than in 2016, while the opposite is true for the soya bean and groundnut seed markets, with the latter showing the lowest levels of market concentration. This was also the case in 2016. The maize market is concentrated, with the top four companies accounting for more than 90% of the market in both years. While the market share of the top four companies in both the maize and bean markets is 91%, more companies are active in the maize seed market (17) than the bean seed market (12). Consequently, there are more maize seed companies with small market shares, resulting in an HHI score that is significantly lower than that of the bean seed market.
The dominant firms are mostly multinational companies that are not as financially constrained as locally-owned seed companies. Local companies largely rely on the FISP as their main outlet for seed of the four priority crops.
14
MARKET SHARE OF GOVERNMENT PARASTATAL In some countries, public entities are still active players in the marketing and sale of certified seed. Public seed companies can play a critical role in meeting farmer demand for varieties that private seed companies deem less profitable. In addition to seed production, public companies may support other national objectives, such as university training and research. However, state-owned companies may benefit from preferential treatment, less stringent enforcement of regulations, access to competitor information, and indirect production subsidies. Collectively, these privileges can result in unfair competition against purely private seed companies. There was no government parastatal that was involved in producing and marketing certified seed for any food crops in Malawi.
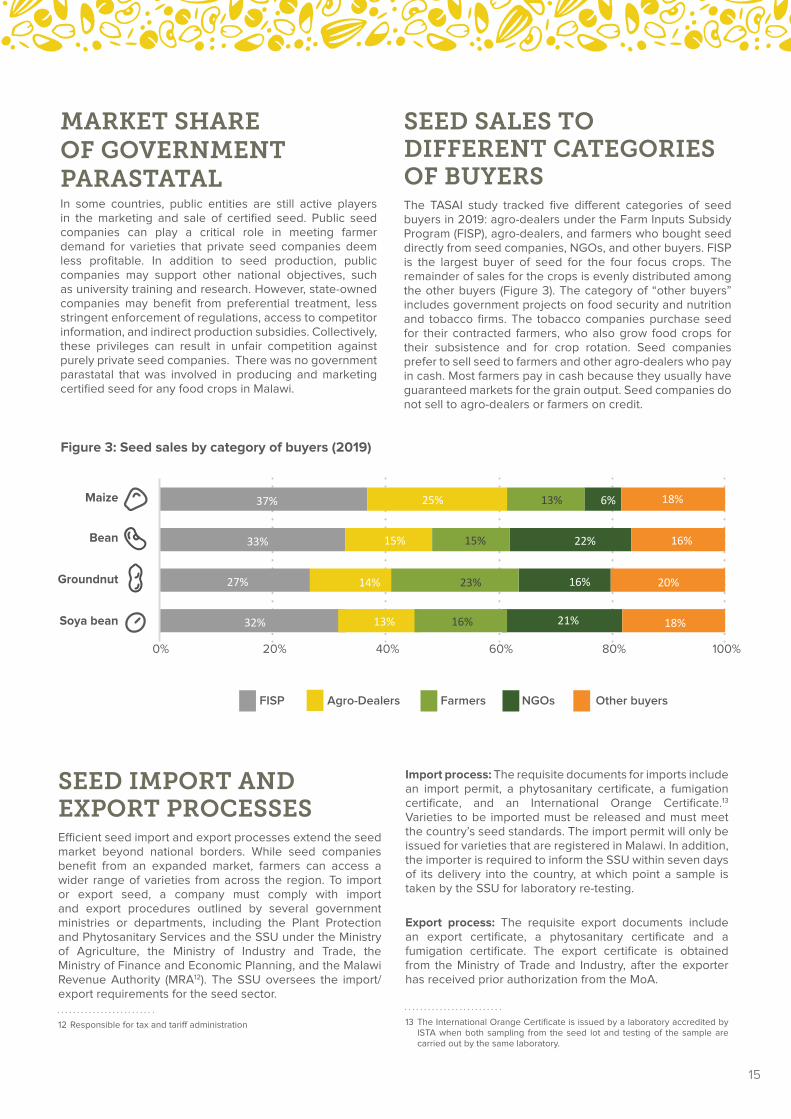
SEED SALES TO DIFFERENT CATEGORIES OF BUYERSThe TASAI study tracked five different categories of seed buyers in 2019: agro-dealers under the Farm Inputs Subsidy Program (FISP), agro-dealers, and farmers who bought seed directly from seed companies, NGOs, and other buyers. FISP is the largest buyer of seed for the four focus crops. The remainder of sales for the crops is evenly distributed among the other buyers (Figure 3). The category of “other buyers” includes government projects on food security and nutrition and tobacco firms. The tobacco companies purchase seed for their contracted farmers, who also grow food crops for their subsistence and for crop rotation. Seed companies prefer to sell seed to farmers and other agro-dealers who pay in cash. Most farmers pay in cash because they usually have guaranteed markets for the grain output. Seed companies do not sell to agro-dealers or farmers on credit.
Figure 3: Seed sales by category of buyers (2019)
SEED IMPORT AND EXPORT PROCESSESEfficient seed import and export processes extend the seed market beyond national borders. While seed companies benefit from an expanded market, farmers can access a wider range of varieties from across the region. To import or export seed, a company must comply with import and export procedures outlined by several government ministries or departments, including the Plant Protection and Phytosanitary Services and the SSU under the Ministry of Agriculture, the Ministry of Industry and Trade, the Ministry of Finance and Economic Planning, and the Malawi Revenue Authority (MRA12). The SSU oversees the import/export requirements for the seed sector.
12 Responsible for tax and tariff administration
Import process: The requisite documents for imports include an import permit, a phytosanitary certificate, a fumigation certificate, and an International Orange Certificate.13 Varieties to be imported must be released and must meet the country’s seed standards. The import permit will only be issued for varieties that are registered in Malawi. In addition, the importer is required to inform the SSU within seven days of its delivery into the country, at which point a sample is taken by the SSU for laboratory re-testing.
Export process: The requisite export documents include an export certificate, a phytosanitary certificate and a fumigation certificate. The export certificate is obtained from the Ministry of Trade and Industry, after the exporter has received prior authorization from the MoA.
13 The International Orange Certificate is issued by a laboratory accredited by ISTA when both sampling from the seed lot and testing of the sample are carried out by the same laboratory.
32%
27%
33%
37%
13%
14%
15%
25%
16%
23%
15%
13%
16%
6%
20%
18%
18%
0% 20% 40% 60% 80% 100%
FISP Agro-Dealers Farmers NGOs Other buyers
Soya bean
Groundnut
Bean
Maize
22%
16%
21%
15
The phytosanitary certificate is obtained from the MoA as proof that the seed meets the phytosanitary requirements of the destination country. The phytosanitary certificate also lists the original source of the seed being exported. The exporter also needs an International Orange Certificate for the seed lot. The fumigation certificate confirms that the material is treated. With these three documents, an exporter receives customs clearance from the MRA and is now able to export the consignment.
Malawi is a signatory of several bilateral and multilateral trade arrangements. The agreements relevant to the seed sector are the SADC Harmonized Seed Regulations14 and the Common Market for Eastern and Southern Africa (COMESA) Harmonized Seed Regulations of 2014 (COMESA, 2014).
14 The SADC Harmonized Seed Regulatory System took effect in 2013 when 10 member states signed the Memorandum of Under-standing on their implementation (Feed the Future 2016)
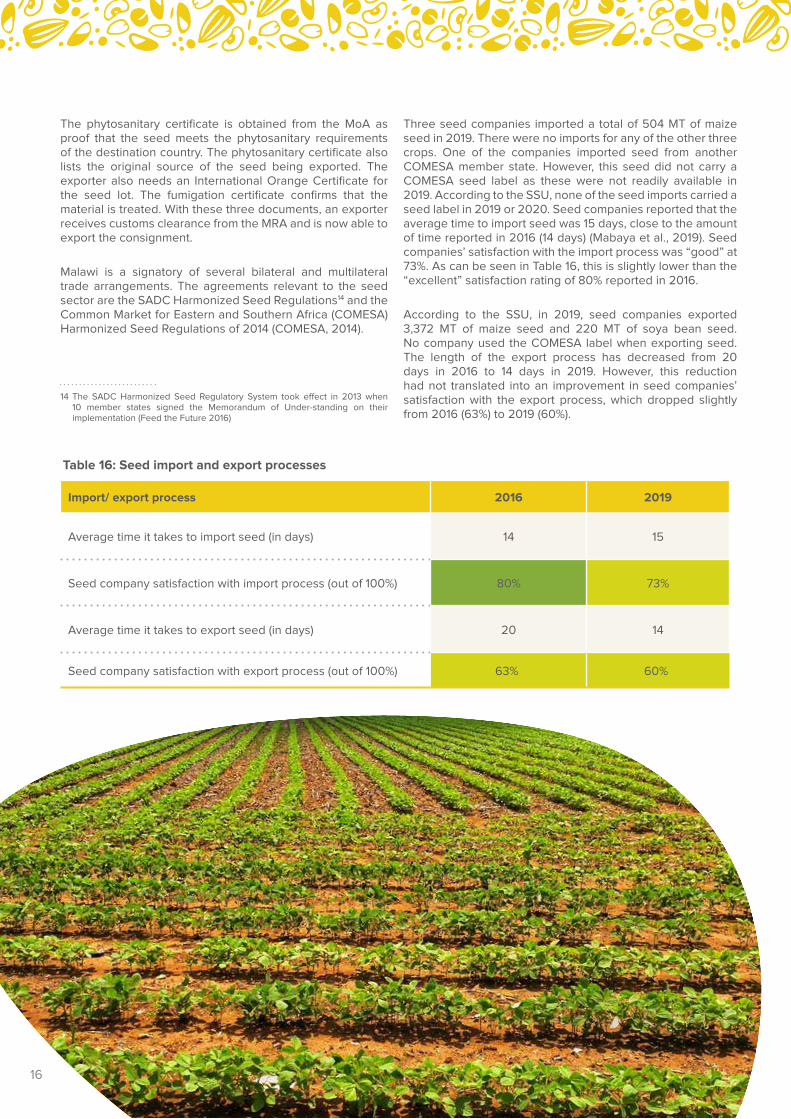
Three seed companies imported a total of 504 MT of maize seed in 2019. There were no imports for any of the other three crops. One of the companies imported seed from another COMESA member state. However, this seed did not carry a COMESA seed label as these were not readily available in 2019. According to the SSU, none of the seed imports carried a seed label in 2019 or 2020. Seed companies reported that the average time to import seed was 15 days, close to the amount of time reported in 2016 (14 days) (Mabaya et al., 2019). Seed companies’ satisfaction with the import process was “good” at 73%. As can be seen in Table 16, this is slightly lower than the “excellent” satisfaction rating of 80% reported in 2016.
According to the SSU, in 2019, seed companies exported 3,372 MT of maize seed and 220 MT of soya bean seed. No company used the COMESA label when exporting seed. The length of the export process has decreased from 20 days in 2016 to 14 days in 2019. However, this reduction had not translated into an improvement in seed companies’ satisfaction with the export process, which dropped slightly from 2016 (63%) to 2019 (60%).
Import/ export process 2016 2019
Average time it takes to import seed (in days) 14 15
Seed company satisfaction with import process (out of 100%) 80% 73%
Average time it takes to export seed (in days) 20 14
Seed company satisfaction with export process (out of 100%) 63% 60%
Table 16: Seed import and export processes
16
LENGTH OF VARIETY RELEASE PROCESSPlant variety release is the process during which new varieties undergo various tests for yield, Value for Cultivation and Use (VCU), and Distinctness, Uniformity, and Stability (DUS). Varieties that perform satisfactorily in these tests are approved for release by the ATCC. A vibrant seed sector has a functional variety release system that is well understood by its stakeholders. Lengthy and/or costly variety release processes can limit the number of released varieties, adversely affecting farmer choice. Lengthy variety release processes also mean longer lags between the emergence of new threats to crops—such as pests, disease, and extreme weather—and availability to farmers of varieties that mitigate the threats. The length of the variety release process is calculated from the date the variety is submitted to the ATCC to the date when it is approved for release. The calculation does not include the time the breeder spends developing the variety.
Crop varieties in Malawi are released by the ATCC. The Committee comprises experts in the agriculture sector, including technology development, extension, and product utilization. The ATCC receives variety release applications submitted by breeders through the Technology Transfer Unit (TTU) in the Department of Agricultural Research Services (DARS). The success of the application depends on the results of the DUS and VCU tests. The breeder conducts the DUS and
VCU tests and submits the results as part of the application for variety release. If the application meets the requirements, the ATCC approves the variety for release and commercialization. Released varieties are entered into the variety catalog, which is maintained by DARS.
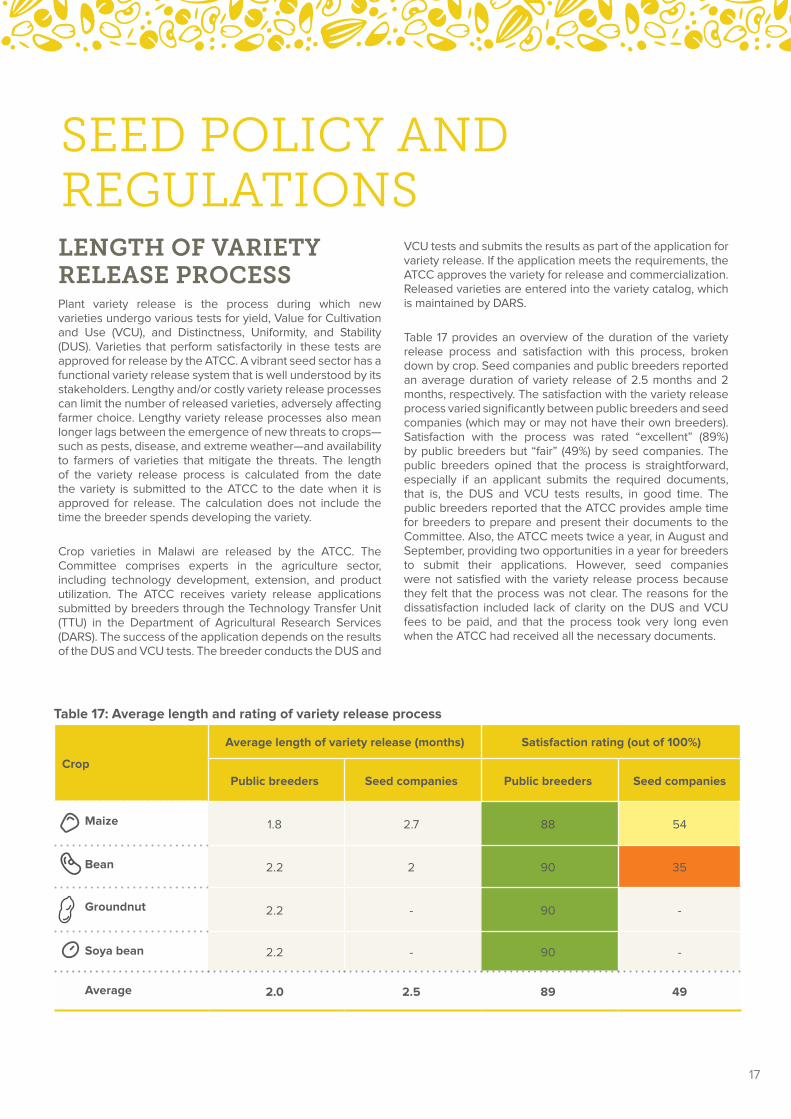
Table 17 provides an overview of the duration of the variety release process and satisfaction with this process, broken down by crop. Seed companies and public breeders reported an average duration of variety release of 2.5 months and 2 months, respectively. The satisfaction with the variety release process varied significantly between public breeders and seed companies (which may or may not have their own breeders). Satisfaction with the process was rated “excellent” (89%) by public breeders but “fair” (49%) by seed companies. The public breeders opined that the process is straightforward, especially if an applicant submits the required documents, that is, the DUS and VCU tests results, in good time. The public breeders reported that the ATCC provides ample time for breeders to prepare and present their documents to the Committee. Also, the ATCC meets twice a year, in August and September, providing two opportunities in a year for breeders to submit their applications. However, seed companies were not satisfied with the variety release process because they felt that the process was not clear. The reasons for the dissatisfaction included lack of clarity on the DUS and VCU fees to be paid, and that the process took very long even when the ATCC had received all the necessary documents.
SEED POLICY AND REGULATIONS
Table 17: Average length and rating of variety release process
Crop
Average length of variety release (months) Satisfaction rating (out of 100%)
Public breeders Seed companies Public breeders Seed companies
Maize 1.8 2.7 88 54
Bean 2.2 2 90 35
Groundnut 2.2 - 90 -
Soya bean 2.2 - 90 -
Average 2 .0 2 .5 89 49
17
COST OF VARIETY RELEASE PROCESSIn well-functioning seed systems, the costs of releasing a variety should not be so high as to disincentivize variety releases altogether. The ATCC has not yet specified the complete cost for variety release. This is because the ATCC is not involved in the conduct of the DUS and VCU tests. These are done by the breeder, who only needs to submit the results to the release committee. One seed company reported incurring an internal cost of US$ 10 per row of hybrid seed planted for the DUS and VCU tests.
STATUS OF SEED POLICY FRAMEWORKWell-functioning formal seed sectors have effective coordinating institutions that work well together, following rules and procedures stipulated in clearly defined and regularly updated legal instruments.
The seed sector in Malawi is governed by three main policy instruments: the seed policy, law and regulations. The Malawi National Seed Policy was passed in 2018 (Malawi Government, 2018a) and replaced the Seed Policy of 1993. The policy supports the regional harmonization of seed regulations and the formation of the National Seed Commission to improve seed service delivery. The Malawi Seed Act (No. 9 of 1996) has been reviewed, and a new seed bill has been drafted and submitted to the Ministry of Justice and Constitutional Affairs for finalization (Ministry of Justice and Constitutional Affairs, 2018). It will be presented to Cabinet for approval and then tabled in Parliament for debate and enactment. Unfortunately, the delayed passage of the Malawi Seed Bill is a major impediment to implementing key reforms in the seed industry in Malawi. The Malawian Parliament has passed the Plant Variety Protection Act of 2018 (Malawi Government, 2018b) and the Plant Breeders’ Act of 2018 (Malawi Government, 2018c). These laws are intended to outline measures for the eradication of pests and diseases that are disruptive to plants, and to establish procedures and rules regarding the registration of plant breeders’ rights.
Malawi is a member state of two Regional Economic Communities (RECs) – the Common Market for Eastern and Southern Africa (COMESA) and the Southern African Development Community (SADC). As such, the country is a signatory to both the COMESA and the SADC seed harmonization protocols. Sections 1.2 and 3.1 of the Malawi National Seed Policy recognize the importance of harmonizing the country’s law and regulations with the two regional instruments. Section 1.3 of the policy acknowledges that the COMESA and SADC frameworks have different seed standards, and that Malawi would need to meet both standards.
The Malawi Seed Regulations are not fully harmonized with the COMESA or SADC regional seed regulations. This is because the clauses in the Regulation do not explicitly state the areas of harmonization. The Malawi regulations only contain one specific reference to both COMESA and SADC, in Article 68 on seed importation. The Article states that seed imported from any COMESA or SADC member state does not need to carry an International Orange Certificate from ISTA. However, the Malawi Seed Regulations do not contain a section on variety release, and therefore, there is no mention of how the Malawi government will treat varieties that have been released under the COMESA or SADC frameworks.
IMPLEMENTATION AND ENFORCEMENT OF SEED REGULATIONS Seed regulations give structure to the formal seed sector. The TASAI study assesses stakeholder perspectives on various aspects of seed regulations, including whether they are supportive to the growth of the seed sector, the role stakeholders play in their design and implementation, stakeholders’ awareness of the laws and regulations, the presence of an enforcement agency, the costs of regulation, and the effectiveness of punitive measures.
The seed industry’s development is the responsibility of the Ministry of Agriculture (MoAIWD). DARS is one of the nine departments of the MoAIWD and is responsible for the research and development of agricultural technologies. DARS is also mandated to implement seed policy instruments. Two units under DARS implement various aspects of the seed law: the ATCC and the SSU. The ATCC oversees variety release and registration. The SSU is responsible for seed certification and quality assurance. It manages an ISTA-accredited seed laboratory at the Chitedze Agricultural Research Station. The SSU has three regional satellite seed laboratories at the Lunyangwa, Lifuwu and Bvumbwe research stations. In addition, the SSU registers all seed actors, including seed growers and seed sellers.
The overall coordination of seed services in Malawi is the responsibility of the SSU. Section III of the Seed Act of 1996 and Part II of the Seed Regulations of 2018 state that the Controller of Seeds (the SSU currently serves this role) is responsible for administering the law and regulations. As per the two policy instruments, the Controller of Seeds’ responsibilities are registering seed growers and processors, conducting seed analysis and testing15, seed inspection and certification, maintaining the variety list, and issuing import and export permits. In practice, these functions are implemented by the SSU, the ATCC, and the Division of Plant Protection and Phytosanitary Services. The SSU, a key institution that plays multiple roles in the seed industry, does not have sufficient financial resources or the means of transportation needed to execute its seed certification activities as required.
15 The SSU has a seed testing laboratory accredited to ISTA. This accreditation warrants the SSU to issue the Orange International Certificates, facilitating international seed trade.
18
The National Seed Policy and the Malawi Seed Bill propose the establishment of a National Seed Commission (NSC), which would replace the SSU and implement all the functions currently conducted by the different entities. The NSC will coordinate all the activities in the seed sector in Malawi. The Commission will also have a board that will report to the Minister of Agriculture. The members of the board will include representatives from seed companies, farmer organizations, agricultural research institutions, universities, and other related ministries and departments like the National Commission for Science and Technology. The NSC will also establish a fund to finance its seed inspection and certification activities.
However, the National Seed Commission is yet to be established because the Seed Bill has not yet been passed. In the absence of the NSC, the MoA serves as the coordinator for seed programs. The program has two main branches. The first is the FISP Task Force, which is chaired by the MoAIWD and includes members from DARS, the SSU, the Ministry of Finance, the Ministry of Development Planning and Cooperation, cooperating partners, the Anti-Corruption Bureau, the Fertilizer Association of Malawi, STAM and the Farmers Union of Malawi. The SSU plays a key role in ensuring that all seed suppliers are registered, and that supplied seed meets the quality standards stipulated in the Malawi Seed Regulations. The second branch is the FISP Coordinating Unit, which is under the MoAIWD and is responsible for collecting records and reporting. The Coordinating Unit reports to the FISP task force.
Implementation of national seed law: Both the SSU and ATCC play a central role in ensuring that the seed law is fully implemented. The SSU registers seed companies and inspects seed before it is certified and commercialized. All seed import and export transactions strictly follow regulatory guidelines, and imports meet the country’s seed standards. Seed companies are satisfied with the regulations’ enforcement, rating it “good” (62%), which is an improvement from the “fair” rating in 2016 (46%). The three main areas of improvements over the last three years were: (i) enforcement of registration of production of all basic seed; (ii) mandatory training of agro-dealers before they commence a business; and (iii) mandatory registration and routine inspection of seed processing and storage facilities. However, despite these developments, not all the clauses of the law are fully implemented. For instance, in 2019, a plan was proposed to introduce scratch labels on seed packages, as a measure to address the challenge of counterfeit seed, but it has not yet been implemented. In addition, due to the shortage of funds, the ATCC has not updated the national variety list since 2016, yet the updates are supposed to be annual. Furthermore, not all agro-dealers are registered with the SSU.
Implementation of SADC and COMESA regulations: Based on the SADC and COMESA harmonized seed regulations, member states of the two RECs are supposed to amend their respective national laws and regulations to conform to regional regulations. The seed certification standards in the SADC and COMESA Seed Regulations are incorporated in the Malawi Seed Regulations of 2018. The third schedule in the regulations outlines the field and laboratory standards for the seed industry in Malawi. These standards conform to both COMESA and SADC standards. Varieties will continue to be subject to the national variety release process before being officially registered and then commercialized in the country before the Seed Bill is enacted. Once the Seed Bill is enacted, it will allow for the adding of varieties released in at least two COMESA countries to the national catalogue.
19
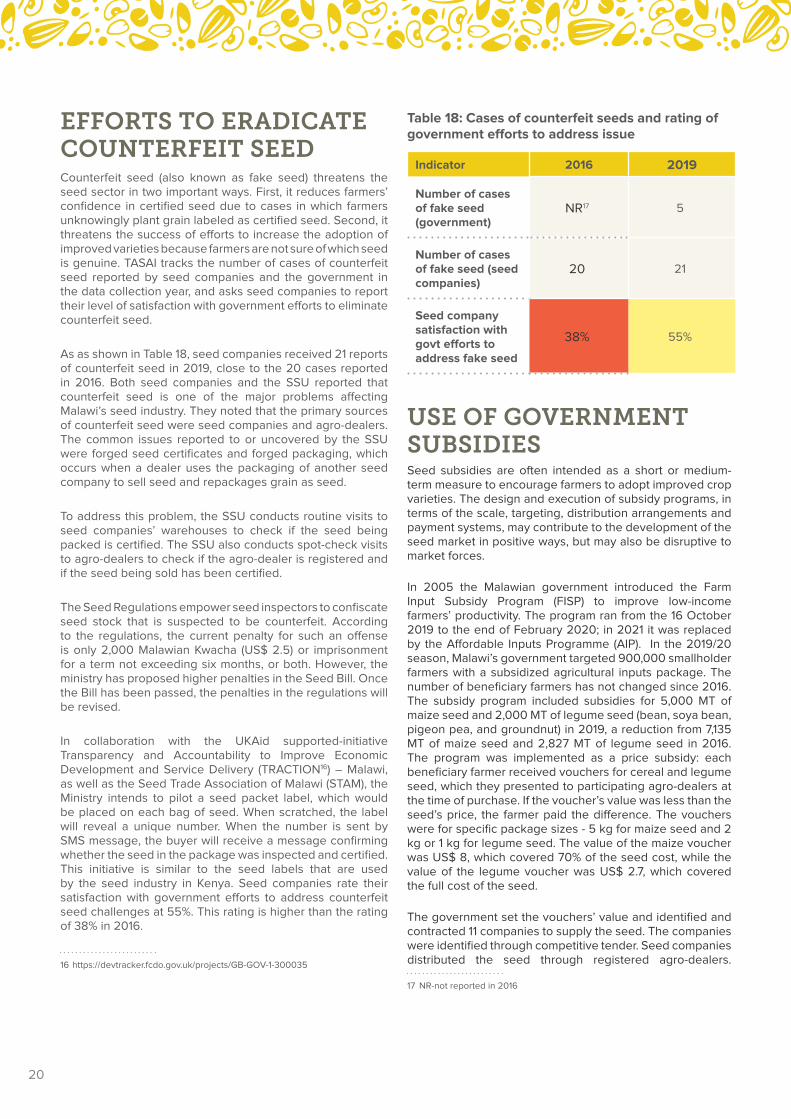
Table 18: Cases of counterfeit seeds and rating of government efforts to address issue
Indicator 2016 2019
Number of cases of fake seed (government)
NR17 5
Number of cases of fake seed (seed companies)
20 21
Seed company satisfaction with govt efforts to address fake seed
38% 55%
USE OF GOVERNMENT SUBSIDIESSeed subsidies are often intended as a short or medium-term measure to encourage farmers to adopt improved crop varieties. The design and execution of subsidy programs, in terms of the scale, targeting, distribution arrangements and payment systems, may contribute to the development of the seed market in positive ways, but may also be disruptive to market forces.
In 2005 the Malawian government introduced the Farm Input Subsidy Program (FISP) to improve low-income farmers’ productivity. The program ran from the 16 October 2019 to the end of February 2020; in 2021 it was replaced by the Affordable Inputs Programme (AIP). In the 2019/20 season, Malawi’s government targeted 900,000 smallholder farmers with a subsidized agricultural inputs package. The number of beneficiary farmers has not changed since 2016. The subsidy program included subsidies for 5,000 MT of maize seed and 2,000 MT of legume seed (bean, soya bean, pigeon pea, and groundnut) in 2019, a reduction from 7,135 MT of maize seed and 2,827 MT of legume seed in 2016. The program was implemented as a price subsidy: each beneficiary farmer received vouchers for cereal and legume seed, which they presented to participating agro-dealers at the time of purchase. If the voucher’s value was less than the seed’s price, the farmer paid the difference. The vouchers were for specific package sizes - 5 kg for maize seed and 2 kg or 1 kg for legume seed. The value of the maize voucher was US$ 8, which covered 70% of the seed cost, while the value of the legume voucher was US$ 2.7, which covered the full cost of the seed.
The government set the vouchers’ value and identified and contracted 11 companies to supply the seed. The companies were identified through competitive tender. Seed companies distributed the seed through registered agro-dealers.
17 NR-not reported in 2016
EFFORTS TO ERADICATE COUNTERFEIT SEEDCounterfeit seed (also known as fake seed) threatens the seed sector in two important ways. First, it reduces farmers’ confidence in certified seed due to cases in which farmers unknowingly plant grain labeled as certified seed. Second, it threatens the success of efforts to increase the adoption of improved varieties because farmers are not sure of which seed is genuine. TASAI tracks the number of cases of counterfeit seed reported by seed companies and the government in the data collection year, and asks seed companies to report their level of satisfaction with government efforts to eliminate counterfeit seed.
As as shown in Table 18, seed companies received 21 reports of counterfeit seed in 2019, close to the 20 cases reported in 2016. Both seed companies and the SSU reported that counterfeit seed is one of the major problems affecting Malawi’s seed industry. They noted that the primary sources of counterfeit seed were seed companies and agro-dealers. The common issues reported to or uncovered by the SSU were forged seed certificates and forged packaging, which occurs when a dealer uses the packaging of another seed company to sell seed and repackages grain as seed.
To address this problem, the SSU conducts routine visits to seed companies’ warehouses to check if the seed being packed is certified. The SSU also conducts spot-check visits to agro-dealers to check if the agro-dealer is registered and if the seed being sold has been certified.
The Seed Regulations empower seed inspectors to confiscate seed stock that is suspected to be counterfeit. According to the regulations, the current penalty for such an offense is only 2,000 Malawian Kwacha (US$ 2.5) or imprisonment for a term not exceeding six months, or both. However, the ministry has proposed higher penalties in the Seed Bill. Once the Bill has been passed, the penalties in the regulations will be revised.
In collaboration with the UKAid supported-initiative Transparency and Accountability to Improve Economic Development and Service Delivery (TRACTION16) – Malawi, as well as the Seed Trade Association of Malawi (STAM), the Ministry intends to pilot a seed packet label, which would be placed on each bag of seed. When scratched, the label will reveal a unique number. When the number is sent by SMS message, the buyer will receive a message confirming whether the seed in the package was inspected and certified. This initiative is similar to the seed labels that are used by the seed industry in Kenya. Seed companies rate their satisfaction with government efforts to address counterfeit seed challenges at 55%. This rating is higher than the rating of 38% in 2016.
16 https://devtracker.fcdo.gov.uk/projects/GB-GOV-1-300035
20
The seed was priced competitively and the government only paid the agreed voucher value. At the end of the season, the agro-dealers submit vouchers to the company that supplied them with seed. The seed company then submits the vouchers to government for payment. According to the FISP office, all maize seed vouchers in the last season were redeemed, while 97% of the legume seed vouchers were redeemed.
The program’s performance was monitored by the Ministry of Agriculture, the Malawi police, and the Farmers Union of Malawi. The Ministry convened meetings every fortnight to track the program’s implementation status at the different stages - input distribution, the redemption of vouchers, and payments to seed companies.
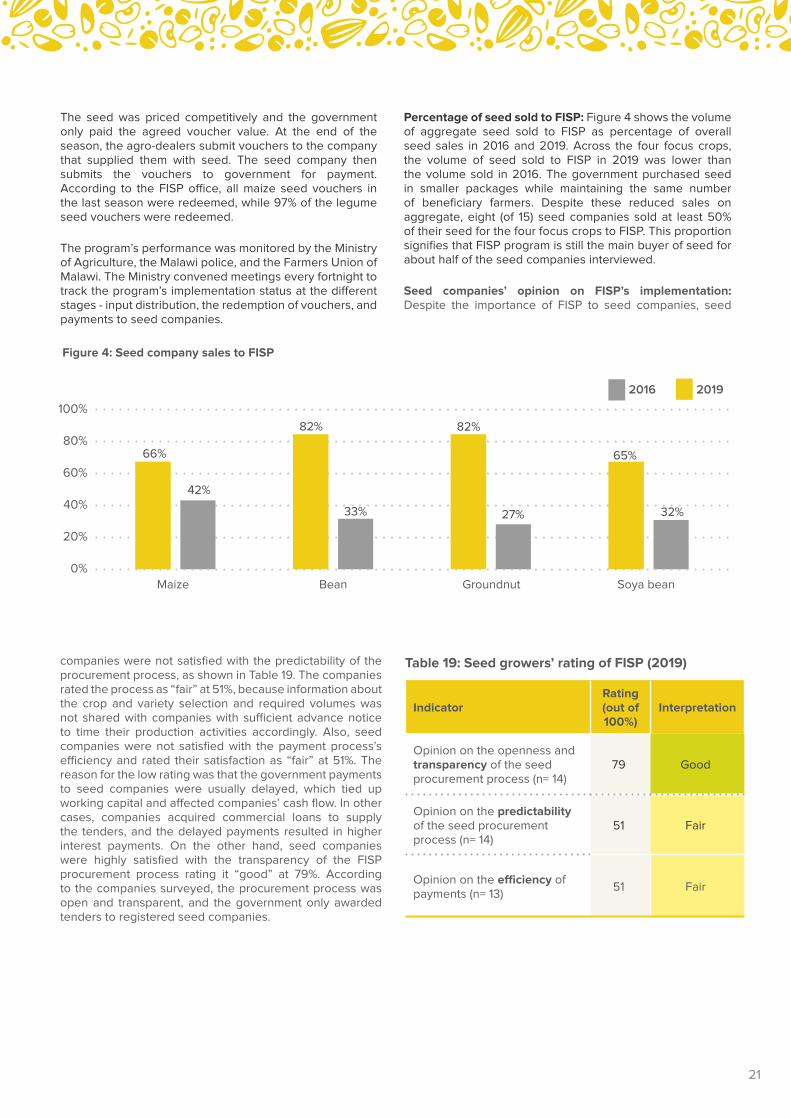
Percentage of seed sold to FISP: Figure 4 shows the volume of aggregate seed sold to FISP as percentage of overall seed sales in 2016 and 2019. Across the four focus crops, the volume of seed sold to FISP in 2019 was lower than the volume sold in 2016. The government purchased seed in smaller packages while maintaining the same number of beneficiary farmers. Despite these reduced sales on aggregate, eight (of 15) seed companies sold at least 50% of their seed for the four focus crops to FISP. This proportion signifies that FISP program is still the main buyer of seed for about half of the seed companies interviewed.
Seed companies’ opinion on FISP’s implementation: Despite the importance of FISP to seed companies, seed
companies were not satisfied with the predictability of the procurement process, as shown in Table 19. The companies rated the process as “fair” at 51%, because information about the crop and variety selection and required volumes was not shared with companies with sufficient advance notice to time their production activities accordingly. Also, seed companies were not satisfied with the payment process’s efficiency and rated their satisfaction as “fair” at 51%. The reason for the low rating was that the government payments to seed companies were usually delayed, which tied up working capital and affected companies’ cash flow. In other cases, companies acquired commercial loans to supply the tenders, and the delayed payments resulted in higher interest payments. On the other hand, seed companies were highly satisfied with the transparency of the FISP procurement process rating it “good” at 79%. According to the companies surveyed, the procurement process was open and transparent, and the government only awarded tenders to registered seed companies.
Table 19: Seed growers’ rating of FISP (2019)
IndicatorRating (out of 100%)
Interpretation
Opinion on the openness and transparency of the seed procurement process (n= 14)
79 Good
Opinion on the predictability of the seed procurement process (n= 14)
51 Fair
Opinion on the efficiency of payments (n= 13)
51 Fair
Figure 4: Seed company sales to FISP
66%
82% 82%
65%
42%
33% 27% 32%
0%
20%
40%
60%
80%
100%
Maize Bean Groundnut Soya bean
2016 2019
21
INSTITUTIONAL SUPPORTQUALITY OF THE NATIONAL SEED TRADE ASSOCIATIONWell-functioning national seed trade associations play a key role in representing the interests of the industry and engaging with the government. The membership of the national seed associations includes seed companies, seed growers, seed cooperatives, seed associations, individual seed producers and at times agro-dealers.
The Seed Trade Association of Malawi (STAM) is a membership-based organization of seed companies. It was established in 2004 and, as of 2019, had a membership of 24 seed companies. STAM’s mandate is to promote improved seed as a key to sustainable food security and social and economic development in Malawi. STAM’s mission is to deliver a steady stream of new seed varieties to smallholder farmers at affordable prices through an expanded network of agro-dealers.
STAM is run by a secretariat, led by a Chief Executive Officer and support staff, including a Business Development Manager, Finance and Administration Officer, Seed Systems Manager, Business Officer, and Seed Systems Officer (two of these positions are yet to be filled). The secretariat reports to a seven-member board, whose members are elected by members of the association and who serve a three-year term. The term for the current Board expired at the end of 2020. Currently, both the Board and secretariat have one female member each.
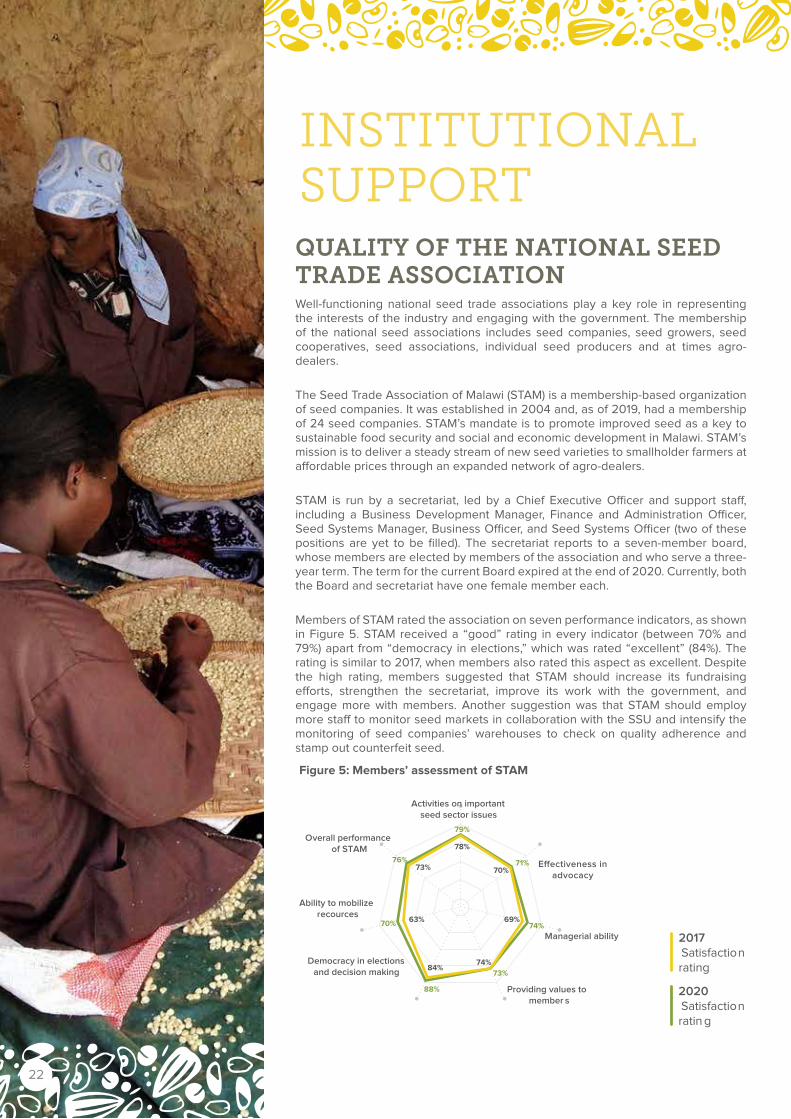
Members of STAM rated the association on seven performance indicators, as shown in Figure 5. STAM received a “good” rating in every indicator (between 70% and 79%) apart from “democracy in elections,” which was rated “excellent” (84%). The rating is similar to 2017, when members also rated this aspect as excellent. Despite the high rating, members suggested that STAM should increase its fundraising efforts, strengthen the secretariat, improve its work with the government, and engage more with members. Another suggestion was that STAM should employ more staff to monitor seed markets in collaboration with the SSU and intensify the monitoring of seed companies’ warehouses to check on quality adherence and stamp out counterfeit seed.
Figure 5: Members’ assessment of STAM
84%74%
73%
69%74%
70%71%
78%
79%
73%76%
63%70%
88%
2017 Satisfactionrating
2020Satisfactionratin g
Activities on important seed sector issues
Overall performance of STAM
Ability to mobilize recources
Democracy in elections and decision making
Providing values to member s
Managerial ability
22
The members identified several priority areas that STAM should work on, including:
● Lobbying the government to enact the Seed Bill: The Bill has been under review for more than five years. The members would like STAM to advocate more to advance the Bill. STAM members are keen to see that the National Seed Commission is established and sufficiently funded to implement its mandate. Members are also eager to see that the Bill is enforced, especially regarding stiff penalties and fines for entities that violate the law.
● Assisting members in dealing with defaulting agro-dealers: Seed companies sell a significant volume of seed through agro-dealers. However, some agro-dealers receive seed on credit but subsequently default on their payments. Some go to the extent of deliberately evading the companies. Since all the agro-dealers are also registered with STAM, the members would want STAM to play an active role in tracing the agro-dealers who default on payments. STAM should also publish a list of such agro-dealers as a warning to companies not to deal with them. As a last resort, STAM should work with the SSU to withdraw their licenses.
● Facilitate linkages between seed companies and farmers: FISP is the main buyer of seed for the four crops. However, since seed companies’ sales to FISP have declined between 2016 and 2019, members would like STAM to explore other market opportunities for seed to reduce the dependence on FISP. Seed companies would particularly like to improve their direct linkages to farmers. STAM can support this effort by raising awareness among farmers about the importance of certified seed.
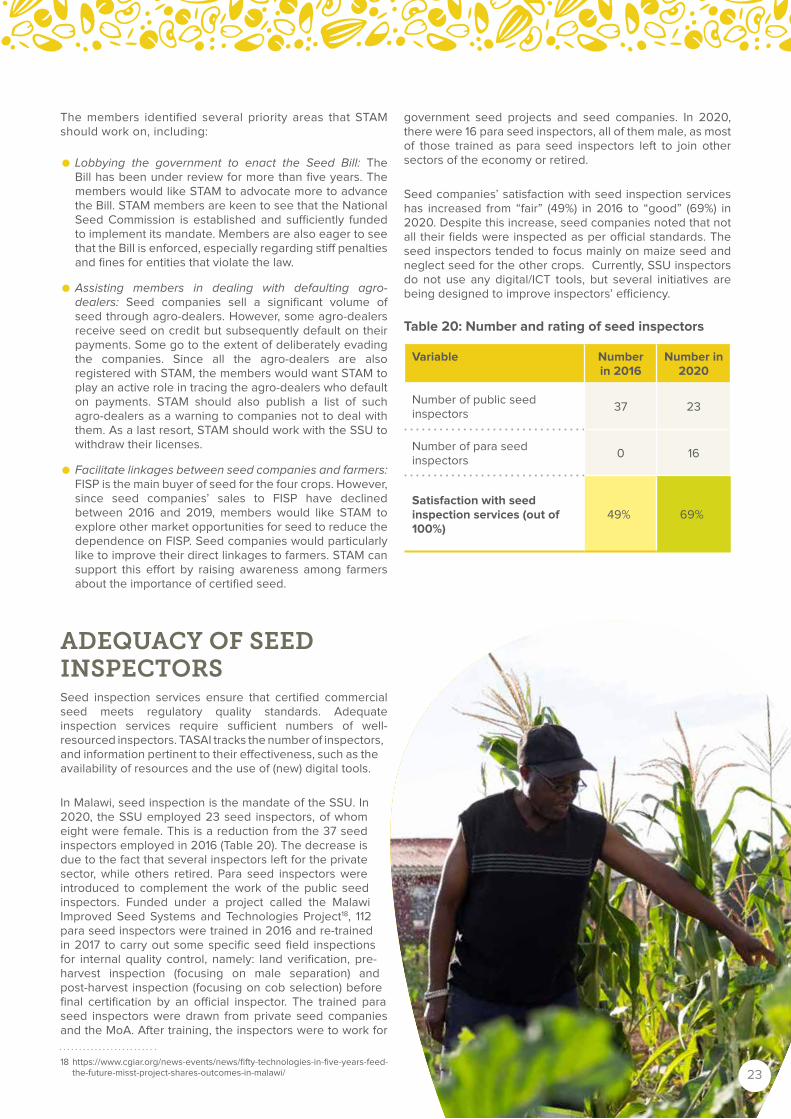
ADEQUACY OF SEED INSPECTORSSeed inspection services ensure that certified commercial seed meets regulatory quality standards. Adequate inspection services require sufficient numbers of well-resourced inspectors. TASAI tracks the number of inspectors, and information pertinent to their effectiveness, such as the availability of resources and the use of (new) digital tools.
In Malawi, seed inspection is the mandate of the SSU. In 2020, the SSU employed 23 seed inspectors, of whom eight were female. This is a reduction from the 37 seed inspectors employed in 2016 (Table 20). The decrease is due to the fact that several inspectors left for the private sector, while others retired. Para seed inspectors were introduced to complement the work of the public seed inspectors. Funded under a project called the Malawi Improved Seed Systems and Technologies Project18, 112 para seed inspectors were trained in 2016 and re-trained in 2017 to carry out some specific seed field inspections for internal quality control, namely: land verification, pre-harvest inspection (focusing on male separation) and post-harvest inspection (focusing on cob selection) before final certification by an official inspector. The trained para seed inspectors were drawn from private seed companies and the MoA. After training, the inspectors were to work for
18 https://www.cgiar.org/news-events/news/fifty-technologies-in-five-years-feed-the-future-misst-project-shares-outcomes-in-malawi/
government seed projects and seed companies. In 2020, there were 16 para seed inspectors, all of them male, as most of those trained as para seed inspectors left to join other sectors of the economy or retired.
Seed companies’ satisfaction with seed inspection services has increased from “fair” (49%) in 2016 to “good” (69%) in 2020. Despite this increase, seed companies noted that not all their fields were inspected as per official standards. The seed inspectors tended to focus mainly on maize seed and neglect seed for the other crops. Currently, SSU inspectors do not use any digital/ICT tools, but several initiatives are being designed to improve inspectors’ efficiency.
Table 20: Number and rating of seed inspectors
Variable Number in 2016
Number in 2020
Number of public seed inspectors
37 23
Number of para seed inspectors
0 16
Satisfaction with seed inspection services (out of 100%)
49% 69%
23
SERVICE TO SMALLHOLDER FARMERS
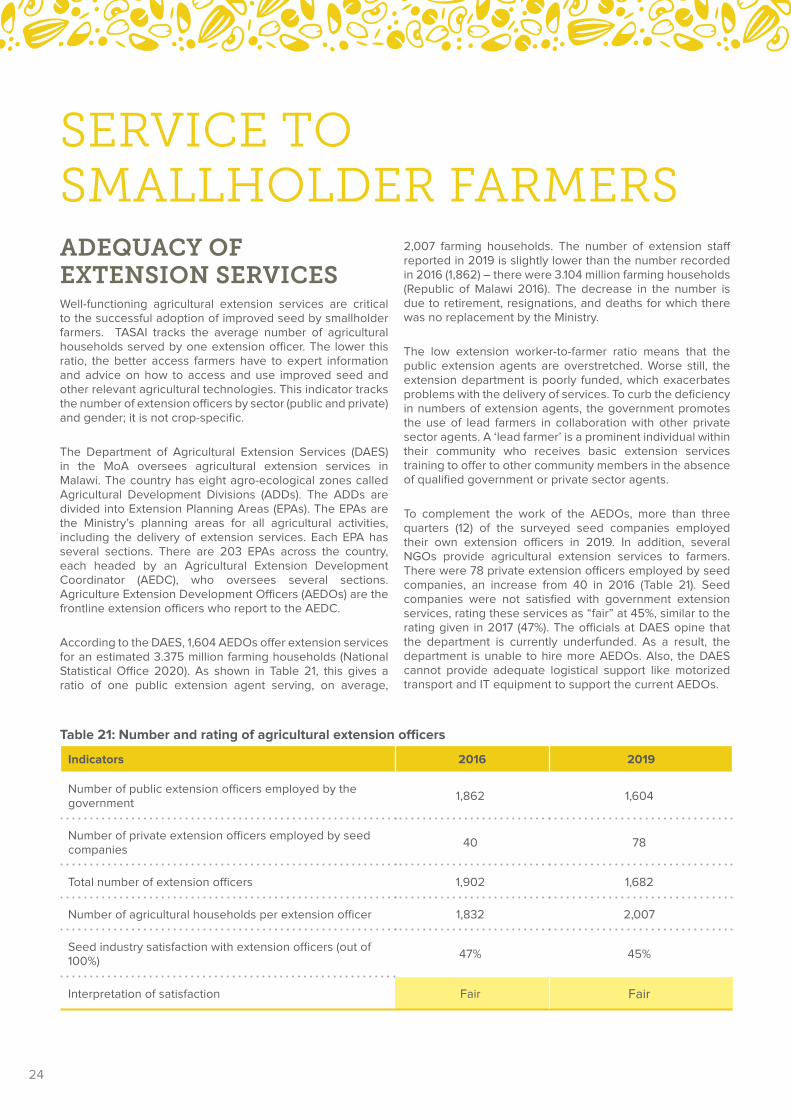
2,007 farming households. The number of extension staff reported in 2019 is slightly lower than the number recorded in 2016 (1,862) – there were 3.104 million farming households (Republic of Malawi 2016). The decrease in the number is due to retirement, resignations, and deaths for which there was no replacement by the Ministry.
The low extension worker-to-farmer ratio means that the public extension agents are overstretched. Worse still, the extension department is poorly funded, which exacerbates problems with the delivery of services. To curb the deficiency in numbers of extension agents, the government promotes the use of lead farmers in collaboration with other private sector agents. A ‘lead farmer’ is a prominent individual within their community who receives basic extension services training to offer to other community members in the absence of qualified government or private sector agents.
To complement the work of the AEDOs, more than three quarters (12) of the surveyed seed companies employed their own extension officers in 2019. In addition, several NGOs provide agricultural extension services to farmers. There were 78 private extension officers employed by seed companies, an increase from 40 in 2016 (Table 21). Seed companies were not satisfied with government extension services, rating these services as “fair” at 45%, similar to the rating given in 2017 (47%). The officials at DAES opine that the department is currently underfunded. As a result, the department is unable to hire more AEDOs. Also, the DAES cannot provide adequate logistical support like motorized transport and IT equipment to support the current AEDOs.
ADEQUACY OF EXTENSION SERVICESWell-functioning agricultural extension services are critical to the successful adoption of improved seed by smallholder farmers. TASAI tracks the average number of agricultural households served by one extension officer. The lower this ratio, the better access farmers have to expert information and advice on how to access and use improved seed and other relevant agricultural technologies. This indicator tracks the number of extension officers by sector (public and private) and gender; it is not crop-specific.
The Department of Agricultural Extension Services (DAES) in the MoA oversees agricultural extension services in Malawi. The country has eight agro-ecological zones called Agricultural Development Divisions (ADDs). The ADDs are divided into Extension Planning Areas (EPAs). The EPAs are the Ministry’s planning areas for all agricultural activities, including the delivery of extension services. Each EPA has several sections. There are 203 EPAs across the country, each headed by an Agricultural Extension Development Coordinator (AEDC), who oversees several sections. Agriculture Extension Development Officers (AEDOs) are the frontline extension officers who report to the AEDC.
According to the DAES, 1,604 AEDOs offer extension services for an estimated 3.375 million farming households (National Statistical Office 2020). As shown in Table 21, this gives a ratio of one public extension agent serving, on average,
Table 21: Number and rating of agricultural extension officers
Indicators 2016 2019
Number of public extension officers employed by the government
1,862 1,604
Number of private extension officers employed by seed companies
40 78
Total number of extension officers 1,902 1,682
Number of agricultural households per extension officer 1,832 2,007
Seed industry satisfaction with extension officers (out of 100%)
47% 45%
Interpretation of satisfaction Fair Fair
24
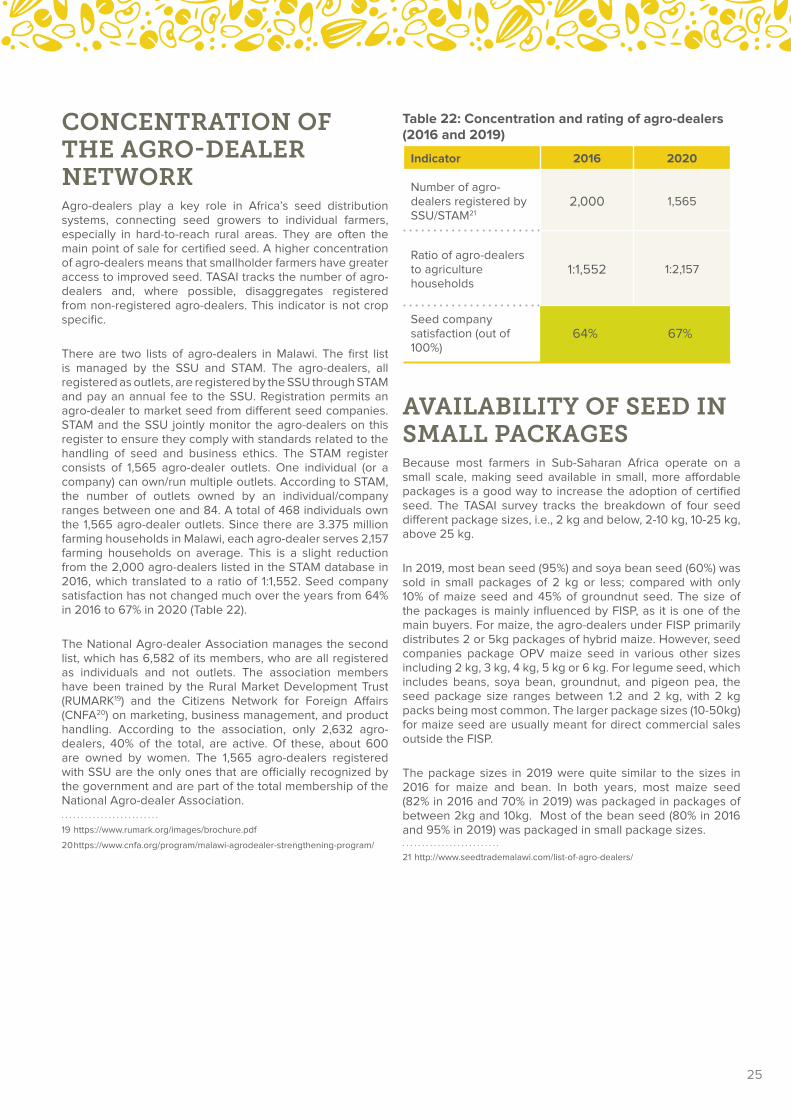
CONCENTRATION OF THE AGRO-DEALER NETWORKAgro-dealers play a key role in Africa’s seed distribution systems, connecting seed growers to individual farmers, especially in hard-to-reach rural areas. They are often the main point of sale for certified seed. A higher concentration of agro-dealers means that smallholder farmers have greater access to improved seed. TASAI tracks the number of agro-dealers and, where possible, disaggregates registered from non-registered agro-dealers. This indicator is not crop specific.
There are two lists of agro-dealers in Malawi. The first list is managed by the SSU and STAM. The agro-dealers, all registered as outlets, are registered by the SSU through STAM and pay an annual fee to the SSU. Registration permits an agro-dealer to market seed from different seed companies. STAM and the SSU jointly monitor the agro-dealers on this register to ensure they comply with standards related to the handling of seed and business ethics. The STAM register consists of 1,565 agro-dealer outlets. One individual (or a company) can own/run multiple outlets. According to STAM, the number of outlets owned by an individual/company ranges between one and 84. A total of 468 individuals own the 1,565 agro-dealer outlets. Since there are 3.375 million farming households in Malawi, each agro-dealer serves 2,157 farming households on average. This is a slight reduction from the 2,000 agro-dealers listed in the STAM database in 2016, which translated to a ratio of 1:1,552. Seed company satisfaction has not changed much over the years from 64% in 2016 to 67% in 2020 (Table 22).
The National Agro-dealer Association manages the second list, which has 6,582 of its members, who are all registered as individuals and not outlets. The association members have been trained by the Rural Market Development Trust (RUMARK19) and the Citizens Network for Foreign Affairs (CNFA20) on marketing, business management, and product handling. According to the association, only 2,632 agro-dealers, 40% of the total, are active. Of these, about 600 are owned by women. The 1,565 agro-dealers registered with SSU are the only ones that are officially recognized by the government and are part of the total membership of the National Agro-dealer Association.
19 https://www.rumark.org/images/brochure.pdf
20 https://www.cnfa.org/program/malawi-agrodealer-strengthening-program/
Table 22: Concentration and rating of agro-dealers (2016 and 2019)
Indicator 2016 2020
Number of agro-dealers registered by SSU/STAM21
2,000 1,565
Ratio of agro-dealers to agriculture households
1:1,552 1:2,157
Seed company satisfaction (out of 100%)
64% 67%
AVAILABILITY OF SEED IN SMALL PACKAGESBecause most farmers in Sub-Saharan Africa operate on a small scale, making seed available in small, more affordable packages is a good way to increase the adoption of certified seed. The TASAI survey tracks the breakdown of four seed different package sizes, i.e., 2 kg and below, 2-10 kg, 10-25 kg, above 25 kg.
In 2019, most bean seed (95%) and soya bean seed (60%) was sold in small packages of 2 kg or less; compared with only 10% of maize seed and 45% of groundnut seed. The size of the packages is mainly influenced by FISP, as it is one of the main buyers. For maize, the agro-dealers under FISP primarily distributes 2 or 5kg packages of hybrid maize. However, seed companies package OPV maize seed in various other sizes including 2 kg, 3 kg, 4 kg, 5 kg or 6 kg. For legume seed, which includes beans, soya bean, groundnut, and pigeon pea, the seed package size ranges between 1.2 and 2 kg, with 2 kg packs being most common. The larger package sizes (10-50kg) for maize seed are usually meant for direct commercial sales outside the FISP.
The package sizes in 2019 were quite similar to the sizes in 2016 for maize and bean. In both years, most maize seed (82% in 2016 and 70% in 2019) was packaged in packages of between 2kg and 10kg. Most of the bean seed (80% in 2016 and 95% in 2019) was packaged in small package sizes.
21 http://www.seedtrademalawi.com/list-of-agro-dealers/
25
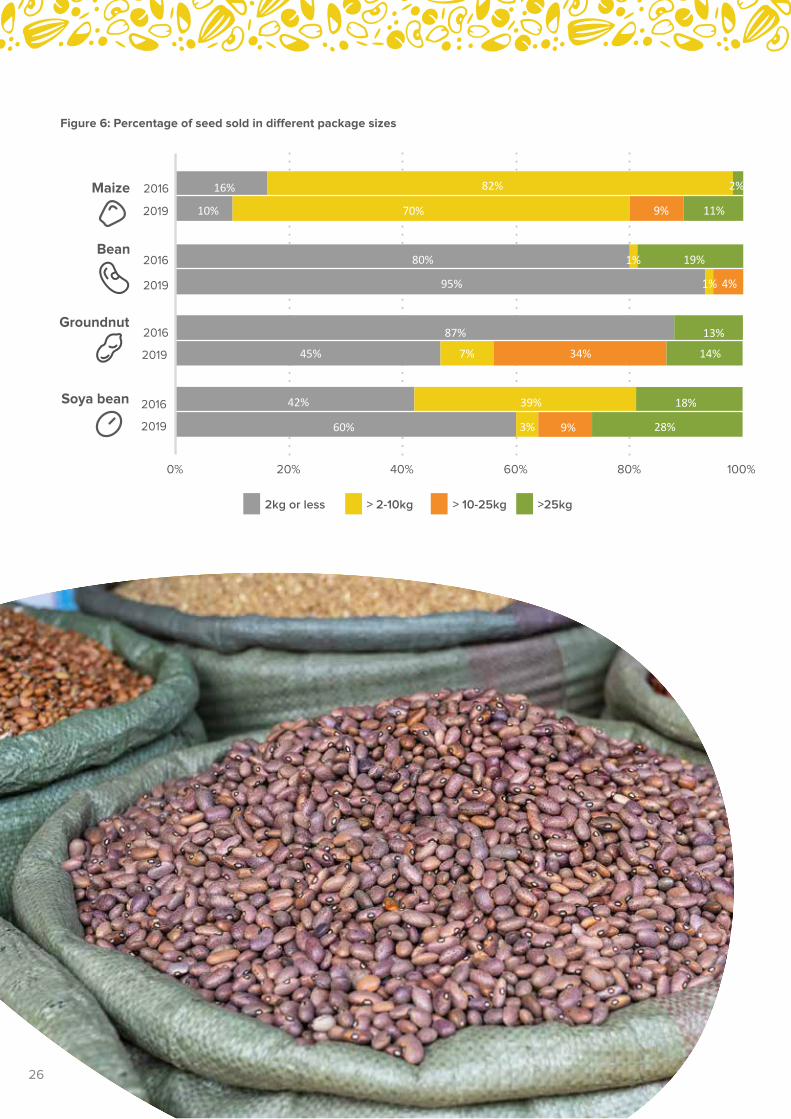
Figure 6: Percentage of seed sold in different package sizes
2kg or less > 2-10kg > 10-25kg >25kg
55%
80% 1%
16%
37%
70%10% 9%
95%
11%
82%
87%
19%
4%
45% 7% 34% 14%
2%
1%
13%
4%
42%
60% 3% 9% 28%
0% 20% 40% 60% 80% 100%
Soya bean
Groundnut
Bean
Maize
39% 18%
2016
2019
2016
2019
2016
2019
2016
2019
26
SEED-TO-GRAIN PRICE RATIOThe seed-to-grain price ratio at the time of planting is a good measure of affordability of improved seed. This data point is important as many smallholder farmers end up making a choice between purchasing seed from the formal sector and planting grain. The greater the price difference between the two, the less likely that resource-poor farmers will purchase certified seed. This indicator tracks the ratio of the retail price of seed (at agro-dealer level) vis-à-vis the market price of grain at the time of planting.
Table 23 presents the seed and grain (farmgate) prices. The retail seed price for each crop was computed as an average
of the seed companies’ prices. The grain prices are the minimum farmgate prices set by the government for the 2019/20 marketing season. The highest ratio is that of hybrid maize (3.6:1), followed by OPV maize (2.9:1). The ratios for the other three crops are below 2:1. The ratios reported in 2019 are similar to the ratios reported in 2017. In both years, the hybrid and OPV maize ratios are higher than the ratios for the other crops.
Seed companies report that FISP has helped make the price of certified seed more affordable for farmers. Without the subsidy, few smallholders could afford certified seed. Due to the relatively high prices of some of the varieties, seed companies noted that if the subsidy program were to end, the utilization of certified seed would likely go down.
Table 23: Seed-to-grain price ratios
Crop
Prices in 2019 (US$/kg) Seed to grain price ratio
Average retail seed price, with subsidy
Grain price (2019) (2017)
Maize (OPV) 1.6 0.55 2.9:1 4.1:1
Maize (hybrid) 2.0 0.55 3.6:1 4.2:1
Bean 2.7 1.53 1.8:1 1.5:1
Groundnut 2.5 1.64 1.5:1 1.9:1
Soya bean 1.4 1.02 1.4:1 1.8:1
27
CONCLUSIONensuring that the seed law is fully implemented. The SSU registers seed companies. It also inspects seed before it is certified and commercialized. While public breeders are happy with the variety release process, private breeders differed, noting that the process and costs of the tests were not clear. The ATCC has not yet specified the complete cost for variety release.
Seed companies were more satisfied with the enforcement of regulations in 2019, which was rated “good” an improvement from the “fair” rating in 2016. The three main areas of improvements in the regulatory environment over the last three years were: (i) the enforcement of registration of all production of basic seed, (ii) the mandatory training of agro-dealers before they commence business, and (iii) the mandatory registration and routine inspection of seed processing and storage facilities. The initiative to introduce scratch labels on seed packages, as a measure to address the challenge of counterfeit seed, is yet to be implemented. Further, the pending Seed Bill proposes the establishment of the National Seed Commission and enforcement of stiff penalties that would deter malpractices such as the sale of untested seed and counterfeit seed. Overall, while seed companies are satisfied with the transparency of the procurement process, they are not satisfied with its degree of predictability.
Institutional support for Malawi’s seed sector is strong. Members of STAM rated the association as “good” in every indicator apart from “democracy in elections,” which was rated “excellent”. Despite the high rating, members suggested that STAM should increase its fundraising efforts, strengthen its secretariat, work with the government more, and engage with members more. In 2020, the SSU employed seed inspectors to complement the work of public seed inspectors. Seed companies’ satisfaction with seed inspection services has improved from “fair” in 2016 to “good” in 2020.
Service to smallholder farmers in Malawi is one of the areas that has seen a decline since 2017. The number of extension staff reported in 2019 is slightly lower than the number recorded in 2016. Seed companies were not satisfied with government extension services, rating these as “fair”, similar to their rating in 2017. The officials at DAES opine that the department is underfunded.
STAM and the SSU jointly monitor that the agro-dealers on their register to comply with standards. Most bean and soya bean seed was sold in small packages of 2kg or less, compared with only 10% of maize seed and 45% of groundnut seed. The size of the packages is mainly influenced by FISP, as one of the main buyers. Seed companies report that FISP has helped make the price of certified seed more affordable for farmers. Without the seed being subsidized, the prices would not be affordable for most smallholder farmers. Due to the relatively high prices of some of the varieties, seed companies note that the utilization of certified seed would likely reduce if the subsidy program came to an end.
Malawi’s formal seed sector is in the growth stage of development (Ariga et al., 2019). This growth stage is characterized by well-established private companies that are supported by strong breeding programs. The policy environment is supportive of private-sector participation. In the growth stage, the marketing environment is highly competitive, with multinational and local seed companies producing a wide range of high-quality seed. The agro-dealer network is strong and well-linked to seed companies. The 2020 TASAI Malawi study has revealed some positive developments in some key aspects of the seed industry since 2016. However, some key challenges have persisted over the two periods.
Under the research and development category, the number of active breeders has increased slightly since the 2017 TASAI study. This increase is reflected by the seed companies’ satisfaction ratings of breeders, which are “good” for maize and groundnut. However, for the other crops, the ratings are “fair”, signifying that breeding programs for bean and soya bean need to be strengthened. The number of varieties released over the years has been inconsistent with periods of high numbers of releases followed by periods without any varieties being released. On a positive note, there was a significant increase in the number of bean and maize varieties released with climate-smart features compared to the 2017 study. In addition, several nutritionally-enhanced maize varieties were released. These releases indicate a steady improvement in the prioritization in breeding investments in the development and release of varieties with special features. Although the number of varieties sold did not change between 2016 and 2020, there were more maize hybrid varieties than OPV varieties.
In 2019, seed companies, ICRISAT and individual seed growers were the main sources of basic seed. The rating of the quality of seed from those institutions was high, indicating that the basic seed was true-to-type and conformed with farmers’ expected quality standards. The increase in overall satisfaction with the availability of basic seed was in part due to the diversification of basic seed producers. In 2019, two private seed companies - a Malawian company and Quali Basic Seed in Zambia - emerged as significant sources of maize, bean and soya bean basic seed in Malawi.
In the industry competitiveness category, this study concludes that Malawi’s seed industry is not competitive for all focus crops. In 2019, the maize and bean seed markets were highly concentrated, with few players dominating the market. The markets for groundnut seed and soya bean seed were less concentrated. The FISP is the largest buyer of seed for the four focus crops. The remainder of sales for the crops is evenly distributed among the other buyers. The average time to import seed remained the same, but satisfaction with the process declined. Both the average time of and satisfaction with the export process declined in 2019.
The seed policy environment in Malawi is supportive of private sector growth, as highlighted by the Seed Policy of 2018. The seed law was revised to comply with the new policy and harmonized with COMESA and SADC seed regulations, and is awaiting assent. There is a coherent coordination of seed sector activities in Malawi. The SSU and ATCC both play a central role in
28
29
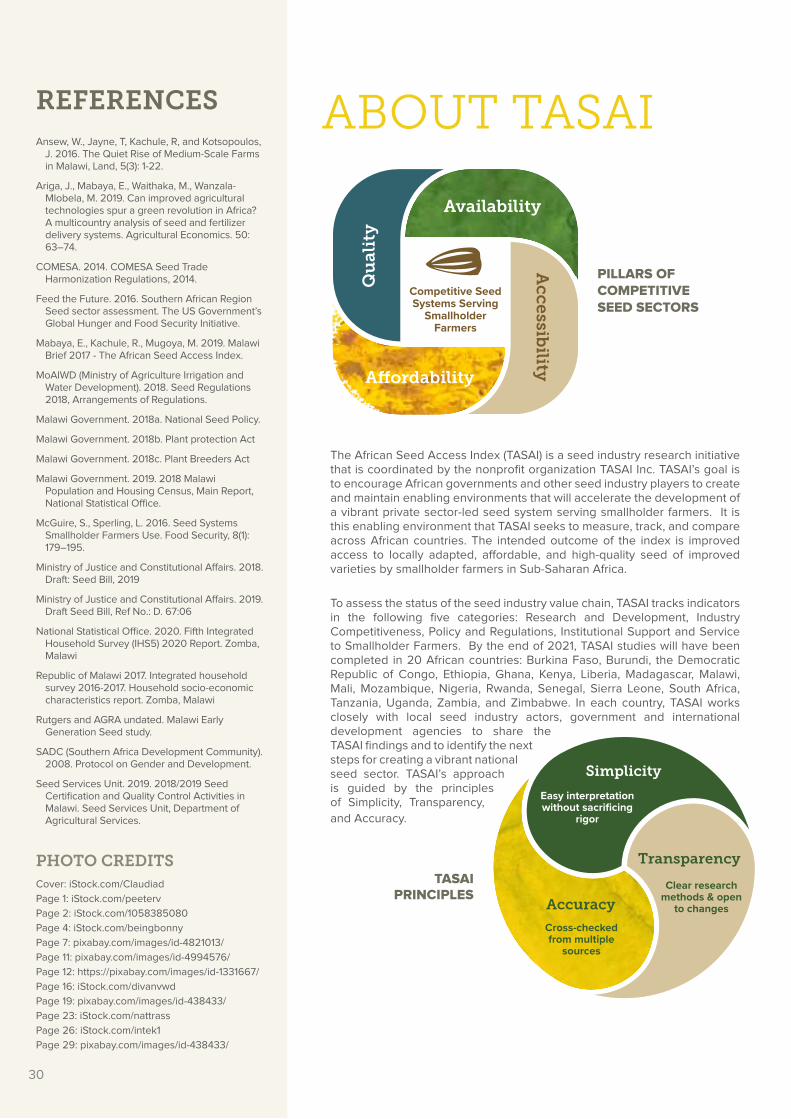
Simplicity
Easy interpretation without sacrificing
rigor
Transparency
Clear researchmethods & open
to changesAccuracy
Cross-checkedfrom multiple
sources
The African Seed Access Index (TASAI) is a seed industry research initiative that is coordinated by the nonprofit organization TASAI Inc. TASAI’s goal is to encourage African governments and other seed industry players to create and maintain enabling environments that will accelerate the development of a vibrant private sector-led seed system serving smallholder farmers. It is this enabling environment that TASAI seeks to measure, track, and compare across African countries. The intended outcome of the index is improved access to locally adapted, affordable, and high-quality seed of improved varieties by smallholder farmers in Sub-Saharan Africa.
To assess the status of the seed industry value chain, TASAI tracks indicators in the following five categories: Research and Development, Industry Competitiveness, Policy and Regulations, Institutional Support and Service to Smallholder Farmers. By the end of 2021, TASAI studies will have been completed in 20 African countries: Burkina Faso, Burundi, the Democratic Republic of Congo, Ethiopia, Ghana, Kenya, Liberia, Madagascar, Malawi, Mali, Mozambique, Nigeria, Rwanda, Senegal, Sierra Leone, South Africa, Tanzania, Uganda, Zambia, and Zimbabwe. In each country, TASAI works closely with local seed industry actors, government and international development agencies to share the TASAI findings and to identify the next steps for creating a vibrant national seed sector. TASAI’s approach is guided by the principles of Simplicity, Transparency,
and Accuracy.
ABOUT TASAI
PILLARS OF COMPETITIVE SEED SECTORS
Competitive Seed Systems Serving
SmallholderFarmers
Availability
Quality
Accessib
ility
TASAI PRINCIPLES
REFERENCESAnsew, W., Jayne, T, Kachule, R, and Kotsopoulos,
J. 2016. The Quiet Rise of Medium-Scale Farms in Malawi, Land, 5(3): 1-22.
Ariga, J., Mabaya, E., Waithaka, M., Wanzala-Mlobela, M. 2019. Can improved agricultural technologies spur a green revolution in Africa? A multicountry analysis of seed and fertilizer delivery systems. Agricultural Economics. 50: 63–74.
COMESA. 2014. COMESA Seed Trade Harmonization Regulations, 2014.
Feed the Future. 2016. Southern African Region Seed sector assessment. The US Government’s Global Hunger and Food Security Initiative.
Mabaya, E., Kachule, R., Mugoya, M. 2019. Malawi Brief 2017 - The African Seed Access Index.
MoAIWD (Ministry of Agriculture Irrigation and Water Development). 2018. Seed Regulations 2018, Arrangements of Regulations.
Malawi Government. 2018a. National Seed Policy.
Malawi Government. 2018b. Plant protection Act
Malawi Government. 2018c. Plant Breeders Act
Malawi Government. 2019. 2018 Malawi Population and Housing Census, Main Report, National Statistical Office.
McGuire, S., Sperling, L. 2016. Seed Systems Smallholder Farmers Use. Food Security, 8(1): 179–195.
Ministry of Justice and Constitutional Affairs. 2018. Draft: Seed Bill, 2019
Ministry of Justice and Constitutional Affairs. 2019. Draft Seed Bill, Ref No.: D. 67:06
National Statistical Office. 2020. Fifth Integrated Household Survey (IHS5) 2020 Report. Zomba, Malawi
Republic of Malawi 2017. Integrated household survey 2016-2017. Household socio-economic characteristics report. Zomba, Malawi
Rutgers and AGRA undated. Malawi Early Generation Seed study.
SADC (Southern Africa Development Community). 2008. Protocol on Gender and Development.
Seed Services Unit. 2019. 2018/2019 Seed Certification and Quality Control Activities in Malawi. Seed Services Unit, Department of Agricultural Services.
PHOTO CREDITSCover: iStock.com/Claudiad
Page 1: iStock.com/peeterv
Page 2: iStock.com/1058385080
Page 4: iStock.com/beingbonny
Page 7: pixabay.com/images/id-4821013/
Page 11: pixabay.com/images/id-4994576/
Page 12: https://pixabay.com/images/id-1331667/
Page 16: iStock.com/divanvwd
Page 19: pixabay.com/images/id-438433/
Page 23: iStock.com/nattrass
Page 26: iStock.com/intek1
Page 29: pixabay.com/images/id-438433/
30
READ TASAI REPORTS ONLINE: https://tasai.org/reports/
For a comparison of TASAI Indicators across different countries, please visit:
http://tasai.org/wp-content/uploads/TASAI-Appendix-CURRENT.pdf
FOR MORE INFORMATION:
TASAIndex
The African Seed Access Index
https://tasai.org
THE AFRICAN SEED ACCESS INDEX HAS BEEN SUPPORTED BY: