Embed Size (px)
Citation preview
Invited paper presented at the 6th African
Conference of Agricultural Economists,
September 23-26, 2019, Abuja, Nigeria
Copyright 2019 by [authors]. All rights reserved. Readers may make verbatim copies of this
document for non-commercial purposes by any means, provided that this copyright notice
appears on all such copies.
Page 1 of 36
6th AAAE Conference, 2019, “Theme: Rising to Meet Evolving Challenges: Africa’s Agricultural
Development Beyond 2020 Vision” 23 – 26 September 2019, Sheraton Hotel, Abuja, Nigeria
LAND ACCESS AND HOUSEHOLDS WELLBEING IN CAMEROON: DOES GENDER MATTER?
Eric Patrick FEUBI PAMEN [Laboratory of Analysis and Research in Mathematical Economics (LAREM) - University of Yaounde 2-Soa, E-mail:
[email protected] / [email protected], Phone: +221 776 848 736 , +237 677 40 18 23/+237 699 19 03 62, Po.Box: 562 Yaounde, Cameroon]
And Carele Guilaine DJOFANG YEPNDO
[E-mail: [email protected], Phone: +237 674 288 252/ (+237) 696 107 324, Sub Regional Institute of Statistics and Applied Economics (ISSEA-CEMAC) and University of Dschang, Po Box: 562, Yaounde - Cameroon.]
TABLE OF CONTENTS ABSTRACT ................................................................................................................................................ 2
RESUME ................................................................................................................................................... 3
I. INTRODUCTION ............................................................................................................................... 4
I.1 Background .............................................................................................................................. 4
I.2 Problem and Objective ............................................................................................................ 7
I.3 Relevance of the study ............................................................................................................ 8
II. CAMEROONIAN ECONOMIC PROFILE .............................................................................................. 8
III. LITERATURE ............................................................................................................................... 10
II.1 Theoretical review ................................................................................................................. 10
II.2 Empirical review .................................................................................................................... 11
IV. RECENT TRENDS ON LAND TENURE CONCERN ......................................................................... 13
III.1 Lessons from other countries ................................................................................................ 13
III.2 The Cameroonian experience ............................................................................................... 18
V. METHOD ........................................................................................................................................ 21
III.1 Analytical framework ............................................................................................................ 21
III.2 Data ....................................................................................................................................... 24
VI. EMPIRICAL FINDINGS................................................................................................................. 24
IV.1 LAND ACCESS DETERMINANTS .............................................................................................. 24
IV.2 IMPLICATIONS ON WELLBEING ............................................................................................. 26
VII. CONCLUSION ............................................................................................................................. 27
REFERENCES .......................................................................................................................................... 28
APPENDICES ........................................................................................................................................... 32
Page 2 of 36
LAND ACCESS AND HOUSEHOLDS WELLBEING IN CAMEROON: DOES GENDER MATTER?
ABSTRACT The aim of this paper is to examine the relationship between land access and household
wellbeing in Cameroon. We use the multiple component analysis to capture land access
determinants and a bivariate probit model to put on evidence effect on wellbeing. With our
sample size of 11,391 household’s heads obtained from data of living conditions surveys, our
main results show that land access is easier in rural area (72.86%) for female household head
than in urban area (29.85%). They are mostly widowed (49.03%), married women in polygamy
regime (12.77%) and divorced or separated (10.62%). Those women are uneducated (50.03%)
or have fulfilled only primary school (33.66%). They are engaged in informal activities or in
the primary sector. They are aged 40-49 years old, have access to financial services and most
of them in rural area have poor characteristics of housing. Only about 23.03% of male
household heads do not have access to land in rural area with 65.67% of them owning land with
no have land certificate and as far as education is concerned, they have just completed primary
education (39.66%). They have poor housing characteristics and difficult access to drinkable
water and electricity. In urban area, 32.107% of male household head have access to land. They
achieved more than secondary school. Regarding their marital status, they are married
monogamy or just living together. The latter achieved higher education. Land owner without
land certificate (62.45%) are mostly those working as self-employed or low scale workers. Only
7.53% of male household heads have a land certificate in urban area. In addition, land access
has a positive effect on the household wellbeing. In fact, owning land for a household head
increases up to 1.86 the probability to be non-poor, than for household where the head does not
have access to land. Possessing land in rural area is not a significant guarantee to escape from
poverty and give only about 20% of chance to the household head to be non-poor, than a one
having access to land in urban area. Households headed by women owning land, regardless the
type of document for the ownership, have 13.9% of chance to be non-poor than those headed
by a man. Land possession by female-headed households have a relevant impact on the
wellbeing of the household as a whole in term of income and consumption. And being landless
increases the probability of being poor and vulnerable. Land tenure security and full and equal
access of women to property rights and land titles stand like an asset and also as an engine for
economic growth that can be engaged in development agenda UN-2030 and AU 2063.
Keys Words: Land, gender, poverty, Cameroon.
JEL Classification: C2, H, I, Q15.
Page 3 of 36
RESUME L’objectif de cet article est d’examiner la relation entre l’accès à la terre et le bien-être des
ménages au Cameroun. Nous procédons par une analyse en correspondances multiples pour
identifier les déterminants de l’accès à la terre, et nous utilisons un modèle probit bivarié pour
capter les effets de l’accès à la terre sur le bien-être. Avec un échantillon de 11 391 chefs de
ménages provenant des données d’enquêtes sur les conditions de vie, nos principaux résultats
montrent que l’accès à la terre est plus facile pour les femmes chefs de ménages en zone rurale
(72,86%) qu’en zone urbaine (29,85%). Elles sont pour la plupart veuves (49,03%), mariées
sous régime polygamique (12,77%) et divorcées/séparées (10,62%). Ces femmes n’ont pas fait
des études (50.03%) ou ont achevé juste le cycle primaire (33,66%). Elles sont engagées dans
des activités informelles ou le secteur primaire. Elles sont âgées de 40 à 49 ans, ont accès aux
services financiers et la plupart d’entre elles ont, en zone rurale, un habitat insalubre et de
moindre qualité. Seulement 23,03% des chefs de ménages de sexe masculin ont accès à la terre
en milieu rural dont 65,67% ne disposant pas de titre foncier avec un niveau d’éducation
primaire (39,63%). Ils possèdent des habitats peu viables et ont difficilement accès à l’eau
potable et à l’électricité. En milieu urbain, 32,107% des hommes chefs de ménage ont accès à
la terre et ont un niveau d’étude au moins secondaire. Ils sont soit mariés monogames soit en
union libre. Ces derniers ont un niveau d’éducation supérieur. Les propriétaires terriens sans
titre foncier (62,45%) sont majoritairement ceux qui s’auto-emploient ou des manœuvres.
Seulement 7,53% des chefs de ménage de sexe masculin possèdent un titre foncier en zone
urbaine. De plus, l’accès à la terre a un effet positif sur le bien-être du ménage. En effet,
posséder la terre pour un chef de ménage accroit de 1,86 la probabilité qu’il soit non-pauvre,
qu’un ménage où le chef n’a pas accès à la terre. La possession de terre en zone rurale n’est pas
une garantie significative pour se prémunir de la pauvreté et donne juste 20% de chance au chef
de ménage d’être non pauvre, par rapport à un chef de ménage ayant accès à la terre en milieu
urbain. Les ménages dirigés par des femmes possédant la terre, quelque-soit son mode
d’acquisition, ont 1,39 fois plus de chance d’être non-pauvres que ceux dirigés par les hommes.
La possession de terre par les femmes chefs de ménages a un impact significatif sur le bien-être
du ménage en termes de revenu et consommation. Et n’avoir pas accès à la terre accroît la
probabilité d’être pauvre et vulnérable. Une politique foncière équitable pour les femmes
permettrait de voir la terre comme un élément de patrimoine et un moteur de croissance
économique dans le cadre des agendas de développement ONU-2030 et UA- 2063.
Mots Clés: Terre, genre, pauvreté, Cameroun.
Classification JEL: C2, H, I, Q15.
Page 4 of 36
I. INTRODUCTION
I.1 Background
Up till today, Africa remains a net food importing region spending more than USD1 35
billion annually on food imports, although this continent has about 65% of the uncultivated
arable land left in the world to feed 9 billion people by 2050 (AfDB, 2016). Land tenure remains
a major challenge across the continent and only about 10% of Africa’s rural land is registered.
In most of African countries, we notice an inefficient land administration leading to transferring
land title deeds costs twice the price and takes twice as long as it does. Most of those countries
have basic land tenure laws that are incomplete and poorly enforced, deterring private
investment. Applicable legislation remains voluntary and non‑binding, as well as weak policy
and institutional frameworks that are the leading cause of corruption in the land administration.
Meanwhile, women and young’s access to land is on average less than half that of men.
Generally, title and inheritance rights across Africa countries are bestowed to male family
members. Yet women remain the primary users of agricultural land in most African
communities. In those countries, there is a growing threat to local peoples’ land tenure security
which directly affects their social, cultural and economic development. This situation is mostly
due to the fast growing large-scale land acquisitions by foreign investors and some locals
companies, national governments, rich and also powerful individuals. Such a situation is
harmful for local populations, both in rural and urban area. Since, securing tenure rights over
lands and natural resources is very important for poverty alleviation, employment, cultural
survival, social cohesion, intergenerational connection, ecosystem sustainability and a dignified
life for communities that depend on land
Land access in vital to generate income to move out of poverty, to produce food in order to
address food security concern. Land is also a factor of social exclusion or inclusion and an
economic growth driver. In Cameroon, concern with inclusive growth has been nurtured by the
recent 2000s international crisis implications. They are the food, climate, financial and
economic crisis. It is noteworthy that those crisis occurred against a somewhat paradoxical
background of a period where Cameroonian authorities in 2006, just from the completion point
of the Heavily Indebted Poor Countries Initiative (HIPC) of the International Monetary Fund
(IMF) and the World Bank (WB) were struggling to improve on economic performances in the
country. And in the meantime in order to achieve the Millennium Development Goals (MDGs).
Finally, Cameroon didn’t achieved the MDGs by the 2015 deadline. In September 2015,
1 United States Dollar (USD).
Page 5 of 36
Cameroonian authorities moved forward to the 2030 United Nations (UN) development agenda
with Sustainable Development Goals (SDGs)2 and the 2063 development agenda of the African
Union (AU)3, with an emphasis on an inclusive approach of economic growth in order to
address wellbeing concern. One of the main driver of inclusive growth in developing countries
stands to be agriculture. But an agricultural-based structural economic transformation needs
some inputs among which land stands to be one of the major one.
In Cameroon, land as an asset, an input or an income source is not equally possessed by any
individual or household with respect to gender and place of living. This is as a result of some
land law, cultural norms and behavior that as in many countries are gender-related and extended
beyond biological differences. They are namely the family role of men and women, their social
responsibility, their allocation of work time and risk management, their right and access to
reproductive resource such as land. In view of this, land tenure are more secured for men than
for women in Cameroon (figure 8).
As far as customary land tenure is concerned, it is self-administering in the sense that it depends
upon local consensus in the ten regions of Cameroon to be upheld and retained, even where
traditional rulers or local chiefs are endowed with day-to-day administration powers. These
customary land tenure regimes that are flexible regime and respondent to changing local
conditions from a region to another, are not always equitable and at time the rights of women
and very poor client families are generally weak and easy to exclude from land access. In
addition, most of the customary estate is purposely held for non-permanent cultivation and is
owned collectively, the greater part of the citizen’s land resource is especially vulnerable to
allocation to grantees or buyers of government’s choice.
Regarding the legal framework in Cameroon, the land law that dates from 1974s4 and emerged
from the colonial law5 that distinguished registered and unregistered land. That law underlines
the fact that unregistered land is the de facto property of the State in the form of national lands.
Cameroonian law fails to acknowledge customary land-holding as amounting to real property
interests, and therefore according the protection of private property, including paying
customary owners the market value for lands which government appropriates for public
purpose. If even national law provides some security of occupancy for unregistered house plots
2 SDG 15, SDG5, SDG 2 and SDG1 emphasis on land, gender and wellbeing issues. 3 Aspiration 6 focus on an Africa whose development is people-driven, relying on the potential of African people, especially its women and youth, and caring for children. In the same line, the African woman should be fully empowered in all spheres, with equal social, political and economic rights, including the rights to own and inherit property sign contracts, register and manage businesses. Rural women will then have access to productive assets like land, credit, inputs and financial services. 4 Ordinance No. 74-1 / 74-2 of 6th July 1974, to establish rules governing land tenure and government -owned landed property of Cameroon and Decree No. 76-165 of April 27 1976 to establish the conditions for obtaining land title. 5 The Order of 15th September 1921 relating to the organization of conservation of private property and land rights in the territory of Cameroon; The Decree of 21rst July 1932 instituting the land registration system in Cameroon; and the Decree of 12th January 1938 and its Order of Application of 31rst October 1938 on land matters; and Law No. 59-47 of 17th June 1959 concerning the organization of private and national property.
Page 6 of 36
and farms, but only to the limited extent that compensation is payable for loss of permanent
crops or infrastructure when the government requires the land for other purposes, rural
Cameroonians are deeply insecured in their land tenure. It seems also important to highlight the
fact that, Cameroonian law or practice does not make it easy for customary landowners to
formally register their holdings to secure their property. Land registration in Cameroon is a
remote, complex and expensive process. It also converts customary lands into individualized
parcels without social conditions, impacting negatively upon family and community interests.
Registration process is even limited to lands which have been cleared or cultivated or physically
settled with houses.
Land market and land access in Cameroon seem then to be complex to easily or explicitly
address the special needs of disadvantaged groups such as women, orphans, newcomers,
pastoralists, hunter-gatherers and others, in an inclusive framework. If even those
disadvantaged groups because of some labour market failures and imperfections are more
involved in agricultural and others pastoral activities that need land as the main input, without
special or target policies their rights and land tenure can be easily defeated by stronger interests
that can be harmful for economic growth, households social and economic wellbeing and their
social inclusion.
In fact and according to OECD6 (2014), as quality jobs creation is a necessary step towards
inclusive growth in developing countries like Cameroon, fast growth of Gross Domestic
Product (GDP) in those countries has helped lifting hundreds of millions of people out of acute
poverty. However, that fast growth has also widened income gaps between the better-off and
those who have been left behind with no or bad jobs. Then for countries to facilitate a structural
transformation that fosters both employment and growth through policies that keep demand
high while boosting productivity in low productivity sectors and facilitate movement of labour
to high-productivity sector, they need a significant development of the potential of agricultural
productivity. That is for instance through mechanization and improving investment practices or
by providing credit support and land tenure security to smallholders. In manufacturing-based
economies, productivity improvements and upgrading can be better fostered by supporting
small and medium-sized enterprises involved in agriculture to facilitate access to finance
coupled to land tenure security to sustain food production. IFPRI7(2017) shows that global food
prices fell for the fifth straight year in 2016 due to increasing supply. But in Africa and
according to FAO8(2016) crop prospects and food situation report, dry-weather-reduced
outputs in North and Southern Africa more than outweighed production gains in East and West
6 OECD is the Organization for Economic Cooperation and Development. 7 IFPRI is the International Food Policy Research Institute. 8 FAO is the Food and Agriculture Organization of the United Nations.
Page 7 of 36
Africa, resulting in an overall reduced aggregate cereal production in 2016 for example.
Moreover, the low harvests in Southern Africa severely stressed food security conditions, while
conflicts, notably in Nigeria and in South Sudan, continued to severely erode productive
capacities and acutely intensified food insecurity in the affected areas and neighbouring
countries. In Cameroon that share a large border with Central African Republic and Nigeria,
influx of refugees is putting strain on host communities within the various regions of the
countries. The number of refugees from the Central African Republic, who mainly entered East,
Adamawa and North regions, was estimated in October 2017 at 274, 000 (UNHCR). In addition,
about 86, 000 refugees from Nigeria have entered the Far north and North regions since May
2013. Insecurity along the borders with Nigeria also led to the internal displacement of more
than 200, 000 individuals. The number of food insecure people is currently estimated at 2.6
million, more than twice the level in June 2015. Such situation leads to reinforcing pressure on
land demand to feed people.
Innovative approaches to land management, tenure policy, housing provision and food security
are more and more presented like challenge for policy-makers and others stakeholders as far as
agricultural policy is concerned both in international (UN 2030 and AU 2063) and national
development agenda. In fact, Cameroonian authorities are on the same path with the Rural
Sector Development Strategy Paper (RSDSP) on implementation since 2005 and the Growth
and Employment Strategy Paper (GESP) of 2009. Securing land rights can then be a tool of
improving household’s wellbeing through agriculture and others pastoral activities.
Therefore, we assume that land rights from a gender perspective could be more useful in
developing country like Cameroon that need agricultural structural transformation to address
social inclusion concern.
I.2 Problem and Objective From the best of our knowledge, there are very little evidence on how land policies impact on
wellbeing in Cameroon. At the time of writing this paper, UN 2030 and AU 2063 development
agenda have just been adopted with an emphasis on land, gender and wellbeing issues (SDG
15, SDG5, SDG 2 and SDG1). Cameroonian authorities are on the same path with the RSDSP
and GESP on implementation. The main research question of this study is: What is the effect
of land access on household’s wellbeing in Cameroon? Specific questions are: (Q1) What are
the characteristics of land owners in Cameroon? (Q2) To which extent a gender-based land
access can impact on households living conditions?
The main objective of this study is to examine the effect of land access on household’s
wellbeing in Cameroon. Specific objectives are: (O1) to highlight the characteristics of land
Page 8 of 36
owners in Cameroon (O2) to evaluate the extent to which gender-based land access can affect
household living conditions. The main hypothesis of our study is that land access better improve
household’s living conditions when it is headed by a woman.
I.3 Relevance of the study Land plays a fundamental role for the development and social inclusion in a country. Land
possession by individuals or households can have a relevant impact on their living conditions
through its various use. And being landless increases the probability of being poor and
vulnerable. Evaluating the implications of land access on wellbeing is a part of the design of
development policies in a context of sustainable development strategies. This study is important
for academic discussion and stakeholders since, among other things, if even attention to gender
and land governance is not new. So that land tenure security and full and equal access of
everybody to ownership, property rights and land titles in Cameroon could be seen not only as
an asset as others but also as an engine for an agricultural based-inclusive economic growth that
can be engaged for the post-2015 development agenda. The paper also contributes to this
discussion and the findings could encourage further research in this field.
The rest of the paper is structured as follows. In section 2, we present the Cameroonian socio-
economic context of the study and illustrate how land governance and poverty analysis are
actually a policy concern for local authorities and others stakes-holders looking for better anti-
poverty policy tool. Section 3 summarizes related theoretical and empirical literature. Section
4 presents recent trends on land tenure. Section 5 outlines the procedure of determinants the
characteristics of people owning land, explains how incorporating land and wellbeing in the
same analysis and presents the database. In section 6 we present empirical findings that are
discussed in section 7. Section 8 highlights some evidence-based policies advices and suggests
elements for further research.
II. CAMEROONIAN ECONOMIC PROFILE
Cameroon is a lower-middle-income country with a population of 24, 277 inhabitants (NIS,
2015) sharing its borders with Nigeria, Chad, the Central African Republic, Equatorial Guinea,
and Gabon. Cameroon is endowed with significant natural resources, including oil and gas, high
value timber species, minerals, and agricultural products, such as coffee, cotton, cocoa, maize,
and cassava. It is the largest economy in the Central African Economic and Monetary Union
(CEMAC), with a growing population rate of about 2.9% per year. The number of poor
increased by 12 percent to 8.1 million people between 1996 and 2014. Poverty is increasingly
Page 9 of 36
concentrated in Cameroon’s northern regions, with an estimated 56 percent of the poor living
in the north and far north regions alone. This poverty trend is reinforced due to labor market
failure and imperfections and land access and land tenure that remain a huge challenge, mostly
for poor. In 2017, Cameroon is still suffering from shocks caused by the crisis of early 2000s
and a slump in oil prices and increased security threats that started early in 2014. Oil revenue
declined and security and humanitarian spending increased, while needed infrastructure
programs continued, leading to widening fiscal and current account deficits as well as a rapid
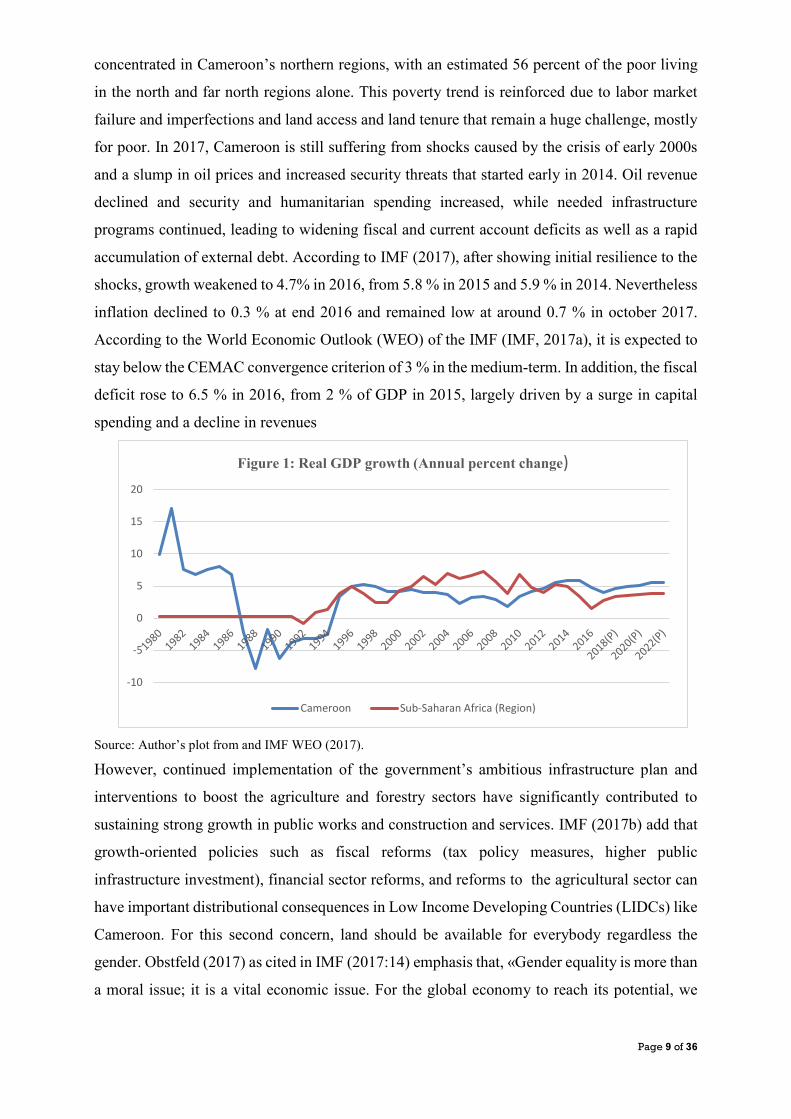
accumulation of external debt. According to IMF (2017), after showing initial resilience to the
shocks, growth weakened to 4.7% in 2016, from 5.8 % in 2015 and 5.9 % in 2014. Nevertheless
inflation declined to 0.3 % at end 2016 and remained low at around 0.7 % in october 2017.
According to the World Economic Outlook (WEO) of the IMF (IMF, 2017a), it is expected to
stay below the CEMAC convergence criterion of 3 % in the medium-term. In addition, the fiscal
deficit rose to 6.5 % in 2016, from 2 % of GDP in 2015, largely driven by a surge in capital
spending and a decline in revenues
Source: Author’s plot from and IMF WEO (2017).
However, continued implementation of the government’s ambitious infrastructure plan and
interventions to boost the agriculture and forestry sectors have significantly contributed to
sustaining strong growth in public works and construction and services. IMF (2017b) add that
growth-oriented policies such as fiscal reforms (tax policy measures, higher public
infrastructure investment), financial sector reforms, and reforms to the agricultural sector can
have important distributional consequences in Low Income Developing Countries (LIDCs) like
Cameroon. For this second concern, land should be available for everybody regardless the
gender. Obstfeld (2017) as cited in IMF (2017:14) emphasis that, «Gender equality is more than
a moral issue; it is a vital economic issue. For the global economy to reach its potential, we
-10
-5
0
5
10
15
20
Figure 1: Real GDP growth (Annual percent change)
Cameroon Sub-Saharan Africa (Region)
Page 10 of 36
need to create conditions in which all women can reach their potential ». Following the same
line, we assume that a gender responsive land governance could be useful in Cameroon.
III. LITERATURE
II.1 Theoretical review In a simplest view, the goal of economic development is to create material wealth in a
country, with impact on wellbeing indicators such as health care, education, housing, sanitation.
In fact, since its theoretical conception objective of economic development is complex and
multidimensional, and have resulted in the development of a number of theories, explanations,
arguments and assertions from various scholars. These theories describe tools and strategies for
making development goals achievable in a given context. Nevertheless and from a classical
approach, there are some of the most prominent theories of economic development that can be
highlighted. There are four main clusters of classical theories of economic development. They
are, the linear stages of growth models (Rostow, 1960), the structural change models (Lewis,
1954; Chenery, 1960; Kuznets; 1971); the international dependence models (Cohen, 1973;
Kuhnen, 1986; Todaro and al., 2003) and the neoclassical counter-revolution models (Lucas,
1976; Bauer, 1984). With the industrial revolution coupled to the growth in modern industry,
those development theories experienced some market coordination failures coupled with an
unclear role of the government. Apart from new growth theory of 1990s, structural
transformation of the economic is taking place as an alternative approach of development.
Therefore, concern like land, social inclusion, governance of local resource for development
are more and more highlighted by policy makers and development agencies. Our study then
follow this paradigm and is focused on land access and ownership implications. Secure rights
to land have multiple benefits for the poor and provide a readily available means for people to
rise out of poverty, especially for women. In rural, urban and peri-urban areas where population
density is high and land markets can be very competitive, even very small plots of land can
provide these benefits. Land access provides a supplementary source of income and food to the
poor, as part of diversified livelihood strategies that also include work as wage labourers, trade
or cottage industries and remittances. Small plots can also function as sources of credit, social
status and security in times of crisis. In fact, the stronger their land security the easier it is for
households to invest in the land, improve production and escape from poverty. However, some
scholars focused their research on the topic of land.
Binswanger and Elgin (1998) on land reform and farm size showed that, rural poor have limited
access to land even when rural factor markets are competitive and operate efficiently. In fact
Page 11 of 36
and as early argued by Carter et al. (1993), one of the outcome of the competitive market is that
poor people whose income are at the subsistence margin are unable to purchase land at a
competitive price. Since they cannot reduce their consumption below the subsistence margin in
order to finance land purchases, even if the land would be useful for them to generate new and
higher income. Ducan et al. (2001) argues that a gradual increase in tenure security leads to
agricultural growth and poverty reduction in rural china. Many other authors highlight the value
of small household plots for the poor in South Asia. Hanstad et al. (2004) show that the
distribution of land plots to land-poor households in India has had a positive impact on
livelihood opportunities. In Pakistan and Bangladesh (Gazdar et al., 2004), ownership of even
relatively small plots of land is associated with supplying enough vegetables, fruit and milk to
meet agricultural laboring households own needs and generate incomes from commercial sales.
For women, house and garden plots are readily accessible and easily tended with fresh produce
available directly, resulting in improved welfare for children and for families as a whole.
However, let us mention that land as a production factor or a social asset is not accessible for
all in Cameroon and all over the world. The 2008 UN-Habitat reports show some innovation
and good practices in providing secure land rights for all such as low-cost registration and
formalization of customary rights, temporary occupation licenses, certificates of comfort, and
specific measures for pastoralist peoples, and so one and so forth. More recently, the ever-rising
demand for food and natural resources has caused a dramatic increase in land based investments
in the 2000s. This increase has raised a number of issues and challenges for governments,
international agencies and Civil Society Organizations (CSO) to explore and address the most
burning of which being how to ensure that land investments are transparent, sustainable and
responsible. As global demand for food and natural resources grows, land-based investments in
developing countries like Cameroon have increased dramatically (Feubi P. et al., 2014). To
create economic opportunities these investments face challenges of engaging responsibly with
local communities and creating links with regional economies without undermining the
livelihoods, access to resources and established rights of those who have lived off the land for
generations. Foreign investors are usually aware of local tenure rights, however most large land
investments fail to take these into account, and consequently the livelihoods impacts that
projects will have.
II.2 Empirical review
In the economic literature, numerous studies always seek to explain observed land-use
decisions in terms of profit-maximizing behavior, either from the demand or supply side. Then
Page 12 of 36
many tools, either qualitative or quantitative-based approaches have been used to highly various
socio-economics implications of land related issue. Qualitative studies mostly used Focus
Group Discussion (FGD) approach from a simple stratified sampling framework and others
used qualitative econometrics models. As far as quantitative studies are concerned, they used
quantitative or qualitative variables. For example, from a times series study on data from Latin
America, De Janvry and Sadoulet (2000) found that agrarian growth is associated with sharply
increasing rural inequality. To empirically test the economic relationship between access to
land and rural poverty in Nepal, Adhikari B. et al. (2014) employ a non-parametric technique
on a Generalized Additive Model (GAM). Such a model does not make the usual assumption
of the linearity of the shape of the relationship between variables and also allows comparisons
with result from Ordinary Least Squared (OLS) estimations on linear econometric model. They
found that a greater access to land increases income and consumption of the household and
thereby reduces poverty. Keswel and Carter (2014), paid attention to the South Africa’s Land
Redistribution for Agricultural Development (LRAD) program and capture its effects on
poverty. They use a propensity score methods to identify the observable characteristics of
beneficiaries of land transfer. Since the implications of land transfer as others asset transfer
program is not instantaneous, in order to appreciate its impacts on wellbeing, Keswel and Carter
(2014) estimate a duration response function by following the Hirano et al. (2004) approach of
mapping the generalized propensity score into outcomes and then averaging outcomes by
duration. These estimates show that, the living standard of land transfer beneficiaries initially
drop for households with less than 1 year under the LRAD and then, after 3 or 4 years their
living standard rise to about 150% of their pre-transfer level. Due to the imperfections of land
market, econometric-based landscape simulation models have also been developed to
understand the nature and extent of land market failure problem and to identify and quantify
the effects of corrective land-use policies. Plantinga A. J. et al. (2014) discussed landscape
simulations based on econometric land-use models in a context of landscapes dominated by
private ownership with four basic challenges, namely:- variation in the private economic return
to land at the same scale at which land use varies, -modeling the private information that
landowners possess about the returns to their land, -the best account for land-use intensity and,
-the probabilistic nature of the land-use transition rules derived from econometric analysis as
shown by Bokstael (1996). Plantinga A. J. et al. (2014) highly an application of their method
based on Lewis et al. (2009) and Lewis (2010) to modeling shoreline development along 140
lakes in northern Wisconsin in United States of America (USA). Their model represents both
the decision to develop and the development intensity where the unit of observation is a parcel
of land. This model is used in a landscape simulation and coupled with a previously published
Page 13 of 36
regression model on green frog population expressed as a function of lake’s development
density in the sense of Woodford et al. (2003). Among others things, they found that,
elimination of the zoning policy increase the likelihood of a larger number of lots being built,
and relaxing the zoning constraint along the lakes translates in a greater probability of extinction
for green frog populations. At the best of our knowledge, very few or none authors paid
attention to the probit model to empirically test effects of land access on wellbeing in
Cameroon. In this paper, we make use of a probit regression approach. We assume that more
land access for women and used for agriculture could be more useful in improving income and
consumption for households.
IV. RECENT TRENDS ON LAND TENURE CONCERN
III.1 Lessons from other countries
Land stands like a basic building block for a social and economic development of human
communities. Furthermore, it is a decisive social and economic asset which is the gateway to
cultural identity, political power and decision making. It is of paramount importance to such an
extent that traditional societies have had, since the days of yore, a corpus of customary rules
that govern the relationship between mankind and land as well as other natural resources. In
every country, a modern, efficient and transparent land administration system is an important
tool of addressing poverty and promoting growth and sustainable development. Security of
property rights is central to preserving livelihoods, maintaining social stability, and increasing
incentives for investment and for sustainable, productive land use. Making land rights
transferable allows the landless to access land through sales and rental markets or through
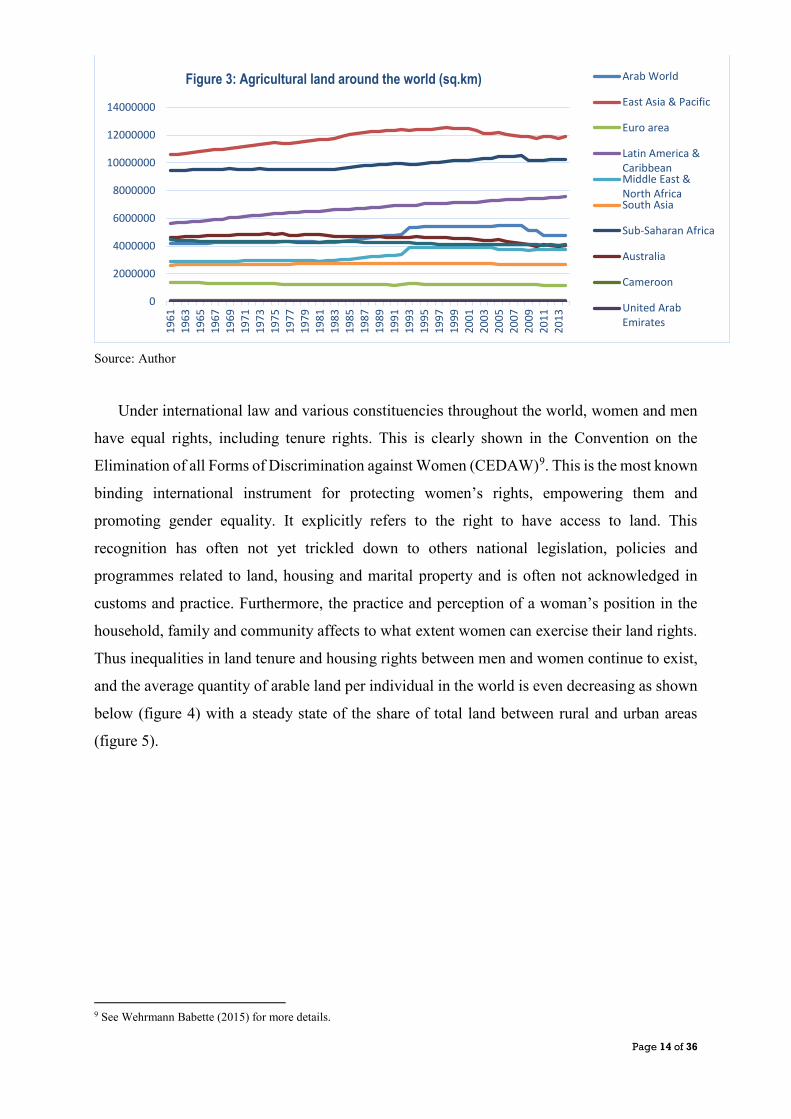
public transfers, and further increases investment incentives. The land tenure challenge is
reinforced by an increasing demand of agricultural land in various regions of the world (figure
3). Let us also mention that up-till today ownership of the world’s agricultural lands is a major
source of contestation around the globe, affecting prospects for rural economic development,
human rights and dignity, cultural survival, environmental conservation, and efforts to combat
climate change. Nevertheless, uncertainty remains about land ownership and occupancy rights.
This situation not only complicates development planning for governments, it also increases
vulnerability, especially of poor (figure 5) and marginalized groups.
Page 14 of 36
Source: Author
Under international law and various constituencies throughout the world, women and men
have equal rights, including tenure rights. This is clearly shown in the Convention on the
Elimination of all Forms of Discrimination against Women (CEDAW)9. This is the most known
binding international instrument for protecting women’s rights, empowering them and
promoting gender equality. It explicitly refers to the right to have access to land. This
recognition has often not yet trickled down to others national legislation, policies and
programmes related to land, housing and marital property and is often not acknowledged in
customs and practice. Furthermore, the practice and perception of a woman’s position in the
household, family and community affects to what extent women can exercise their land rights.
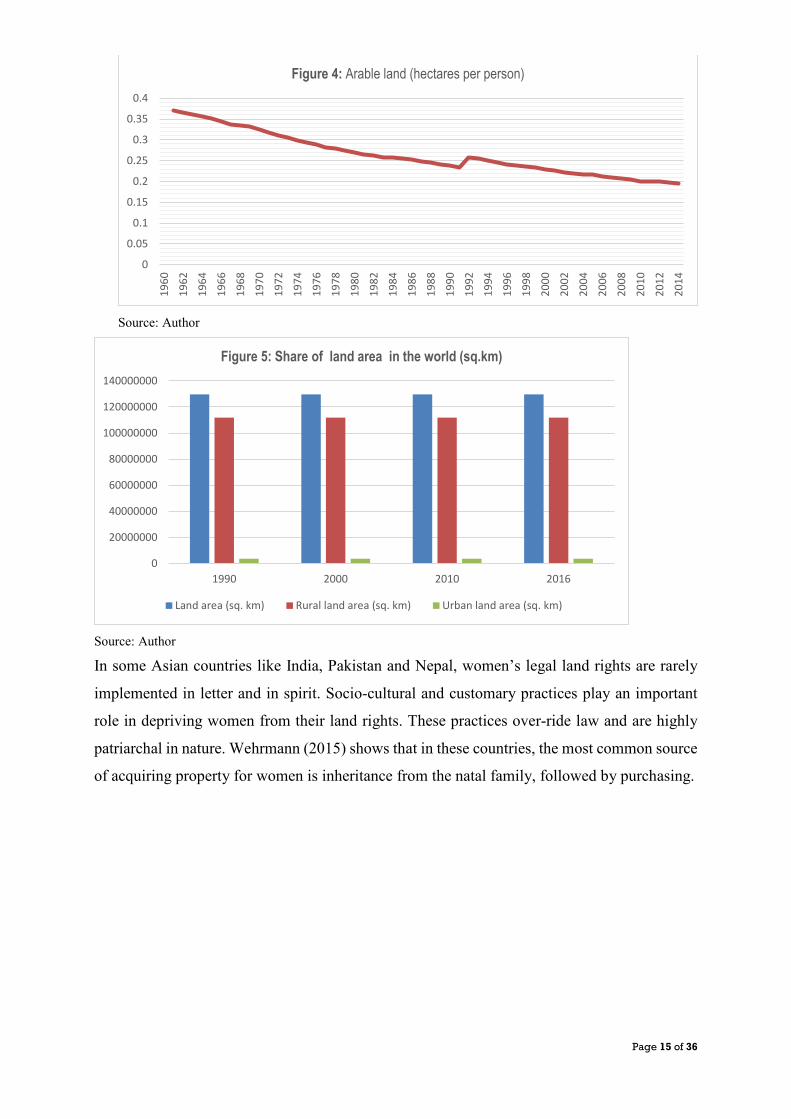
Thus inequalities in land tenure and housing rights between men and women continue to exist,
and the average quantity of arable land per individual in the world is even decreasing as shown
below (figure 4) with a steady state of the share of total land between rural and urban areas
(figure 5).
9 See Wehrmann Babette (2015) for more details.
0
2000000
4000000
6000000
8000000
10000000
12000000
14000000
1961
1963
1965
1967
1969
1971
1973
1975
1977
1979
1981
1983
1985
1987
1989
1991
1993
1995
1997
1999
2001
2003
2005
2007
2009
2011
2013
Figure 3: Agricultural land around the world (sq.km) Arab World
East Asia & Pacific
Euro area
Latin America &CaribbeanMiddle East &North AfricaSouth Asia
Sub-Saharan Africa
Australia
Cameroon
United ArabEmirates
Page 15 of 36
Source: Author
Source: Author
In some Asian countries like India, Pakistan and Nepal, women’s legal land rights are rarely
implemented in letter and in spirit. Socio-cultural and customary practices play an important
role in depriving women from their land rights. These practices over-ride law and are highly
patriarchal in nature. Wehrmann (2015) shows that in these countries, the most common source
of acquiring property for women is inheritance from the natal family, followed by purchasing.
0
0.05
0.1
0.15
0.2
0.25
0.3
0.35
0.4
1960
1962
1964
1966
1968
1970
1972
1974
1976
1978
1980
1982
1984
1986
1988
1990
1992
1994
1996
1998
2000
2002
2004
2006
2008
2010
2012
2014
Figure 4: Arable land (hectares per person)
0
20000000
40000000
60000000
80000000
100000000
120000000
140000000
1990 2000 2010 2016
Figure 5: Share of land area in the world (sq.km)
Land area (sq. km) Rural land area (sq. km) Urban land area (sq. km)
Page 16 of 36
Source: Author’s calculation
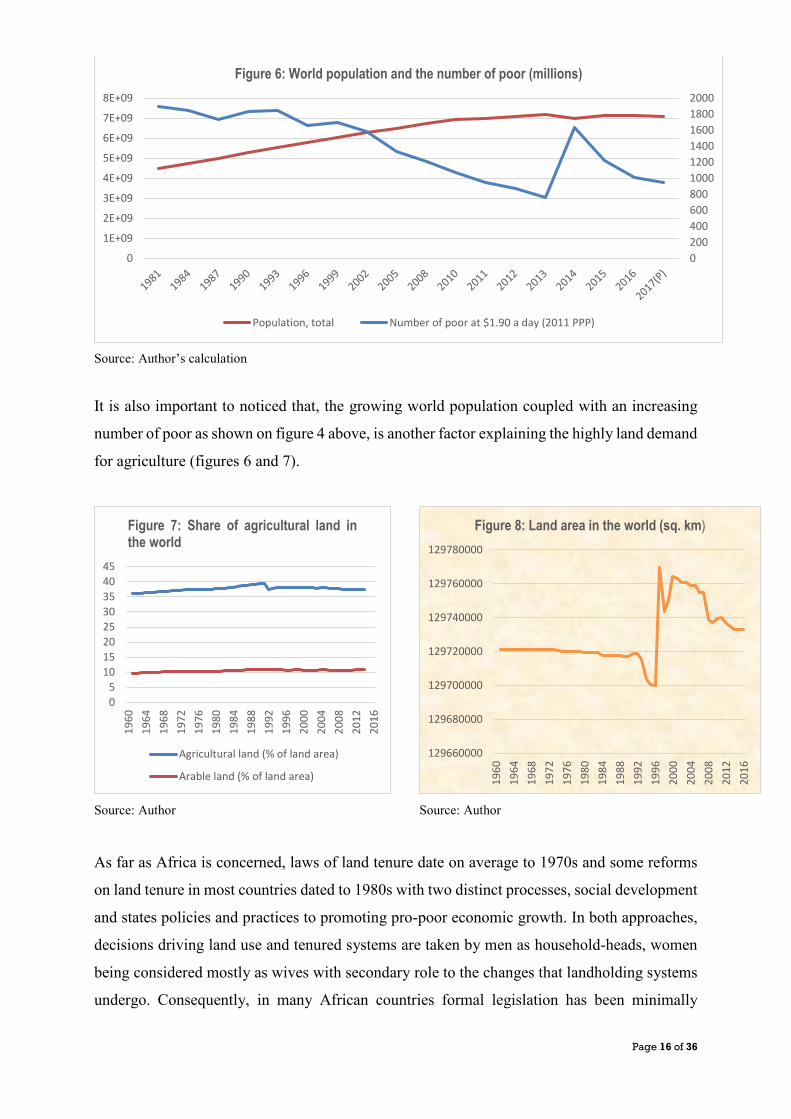
It is also important to noticed that, the growing world population coupled with an increasing
number of poor as shown on figure 4 above, is another factor explaining the highly land demand
for agriculture (figures 6 and 7).
Source: Author
Source: Author
As far as Africa is concerned, laws of land tenure date on average to 1970s and some reforms
on land tenure in most countries dated to 1980s with two distinct processes, social development
and states policies and practices to promoting pro-poor economic growth. In both approaches,
decisions driving land use and tenured systems are taken by men as household-heads, women
being considered mostly as wives with secondary role to the changes that landholding systems
undergo. Consequently, in many African countries formal legislation has been minimally
0200400600800100012001400160018002000
0
1E+09
2E+09
3E+09
4E+09
5E+09
6E+09
7E+09
8E+09
Figure 6: World population and the number of poor (millions)
Population, total Number of poor at $1.90 a day (2011 PPP)
05
1015202530354045
1960
1964
1968
1972
1976
1980
1984
1988
1992
1996
2000
2004
2008
2012
2016
Figure 7: Share of agricultural land inthe world
Agricultural land (% of land area)
Arable land (% of land area)
129660000
129680000
129700000
129720000
129740000
129760000
129780000
1960
1964
1968
1972
1976
1980
1984
1988
1992
1996
2000
2004
2008
2012
2016
Figure 8: Land area in the world (sq. km)
Page 17 of 36
effective in dealing with women’s rights to land. While some laws may guarantee gender
equality with regard to land rights (for example, a land law), other laws, such as family law,
may be based on patriarchal norms and undermine or directly contradict the concept of equal
land rights by not giving wives equal rights to marital property or daughters equal inheritance
rights. Even where legislation is generally positive towards women’s land rights, in many
countries the state and its institutions, including the judiciary, have a weak presence beyond
major urban areas. The state, therefore, does not have the resources, or is unwilling to commit
resources, to advocating, promoting, enforcing, and protecting women’s formal legal rights to
land and property. In the absence of state institutions to enforce equal rights for women as well
as other laws such as land use, customary and local norms and practices predominate. While
continued gender inequality in African local customs and institutions affect women’s ownership
and control of land and natural resources, some gains have been in made in specific countries
In Liberia for example, the government has enacted laws and adopted policies intended to
advance the equality of women to men in terms of acquisition of property including land. These
include the Domestic Relations and Inheritance Act of 1998 that specifically highlights equal
rights in marriage and inheritance under Customary and Statutory Laws, the 2003 Act to Govern
the Devolution of estates and establish Rights of Inheritance for spouses of Statutory and
Customary Marriages also called the Equal Rights of the Customary Marriage Law of 1998.
Other policies include the Liberian National Gender Policy (LNGP), the National Gender-
Based Violence Plan of Action (NGBVPA) and the National Action Plan to implement UN
Security Council Resolution 1325.
In Mali, after political changes in 1991, government authorities begun a process of
decentralization passing authority down to local governments for the management of land,
natural resources and public services. That was done in a progressive, consultative and
participatory approach including the creation of local councils. That are local governments
established by the voluntary affiliation of neighboring villages, and the demarcation of
boundaries. Through decentralization, the national government aimed to empowering local
government, encourage development, protect the environment, and foster political stability.
Nevertheless, we can notice some difficulties with this decentralization approach of land
governance in Mali. In fact he laws governing decentralization are dense, complex and overlap
with other laws concerning land and natural resources. The local councils negotiate
conventions, which establish rules for the private use of village lands, for grazing and fishing
rights, and for other uses of natural resources. Enforcement is difficult, however, because local
conventions are not legally binding. Rather, their purpose is for communities to commit to a
way of working together and be involved in natural resource management. In addition, few
Page 18 of 36
local councils have demarcated their land, further complicating their ability to enforce local
agreements relating to the use of land and other resources. Local councils have the power to
appropriate land held under customary tenure, subdivide it, and then lease or sell the land for
residential use. This process, known as “lotissement”, is much abused, fueling land speculation
and benefitting the elite. However, it is one of the few available means by which communes
can finance themselves. Despite its imperfections, decentralization in Mali has proven to be an
important avenue for communities to gain greater control over land-use decisions and over the
natural resources on which they depend. The situation is Cameroon differs from various points
of views.
III.2 The Cameroonian experience
In 2017 the challenge about land in Cameroon remains too large through countless land
disputes and land restitution requests, farming and housing by vulnerable people chiefly made
of women and children who are displaced for various reasons. The situation varies for both
women and men. The right to have access to land and property ensures a production security
which offers a choice of livelihood and gives room to life autonomy. Nevertheless, there are
shortcomings in the gender’s rate integration into the access rules and security of land law in
Cameroon which impact women’s living conditions and make them more vulnerable.
Moreover, scan attention is paid to the gender regarding land issue in Cameroon. The
overwhelming power of the custom and socio anthropological considerations in rural areas are
brought to being by a patrilineal management of land and access right to natural resources to
the detriment of women.
In Cameroon and by customary law, land belongs to the government. In addition and by
statutory law, most forests are the property of the government. If even forests are a major
common property resource of rural communities, both settled and mobile. Access and the share
of land in Cameroon, is not the same for men, women and young people, regardless the area or
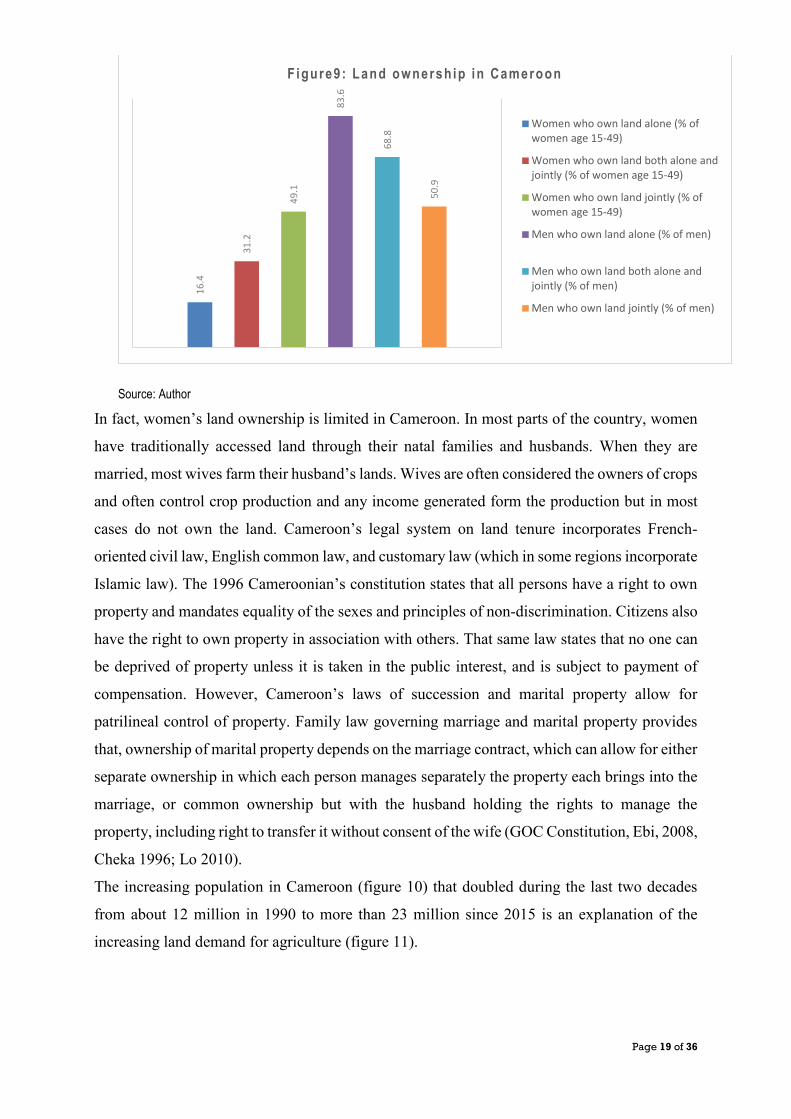
the place of living (figure 9). Men remain with about 83.6% of the total land and women with
only 16.4%.
Page 19 of 36
Source: Author
In fact, women’s land ownership is limited in Cameroon. In most parts of the country, women
have traditionally accessed land through their natal families and husbands. When they are
married, most wives farm their husband’s lands. Wives are often considered the owners of crops
and often control crop production and any income generated form the production but in most
cases do not own the land. Cameroon’s legal system on land tenure incorporates French-
oriented civil law, English common law, and customary law (which in some regions incorporate
Islamic law). The 1996 Cameroonian’s constitution states that all persons have a right to own
property and mandates equality of the sexes and principles of non-discrimination. Citizens also
have the right to own property in association with others. That same law states that no one can
be deprived of property unless it is taken in the public interest, and is subject to payment of
compensation. However, Cameroon’s laws of succession and marital property allow for
patrilineal control of property. Family law governing marriage and marital property provides
that, ownership of marital property depends on the marriage contract, which can allow for either
separate ownership in which each person manages separately the property each brings into the
marriage, or common ownership but with the husband holding the rights to manage the
property, including right to transfer it without consent of the wife (GOC Constitution, Ebi, 2008,
Cheka 1996; Lo 2010).
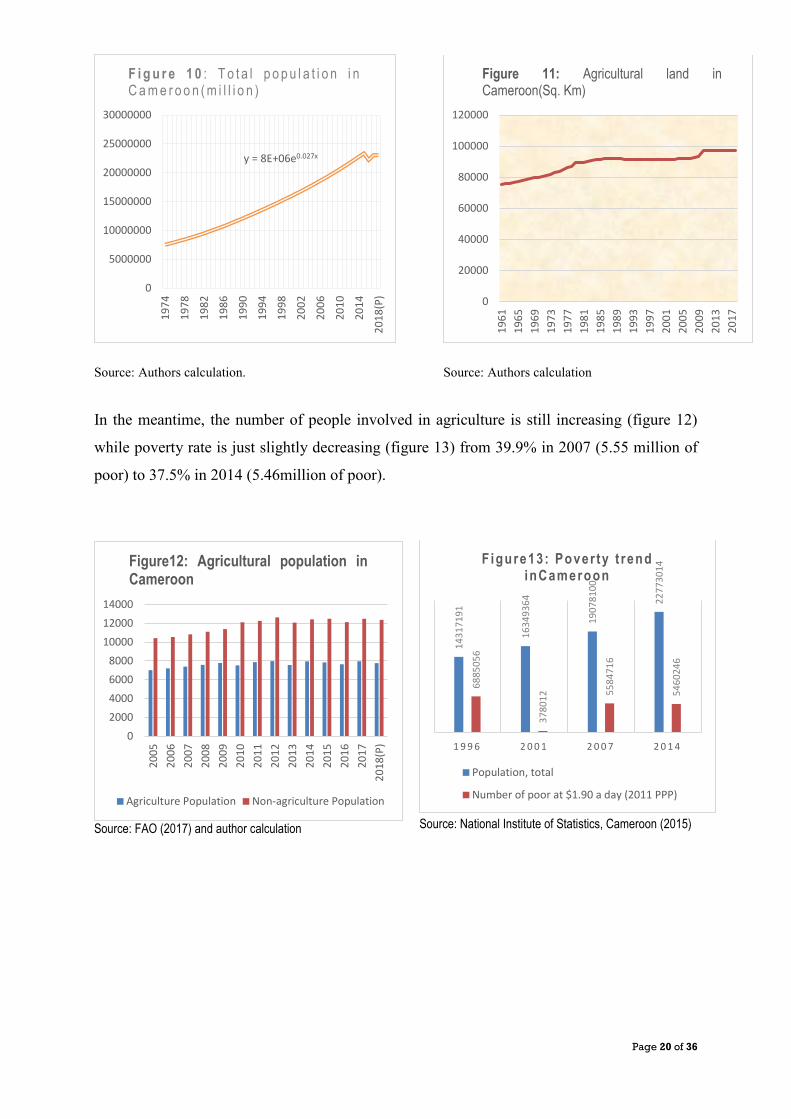
The increasing population in Cameroon (figure 10) that doubled during the last two decades
from about 12 million in 1990 to more than 23 million since 2015 is an explanation of the
increasing land demand for agriculture (figure 11).
16.4
31.2
49.1
83.6
68.8
50.9
Figure9 : Land ownersh ip in Cameroon
Women who own land alone (% ofwomen age 15-49)
Women who own land both alone andjointly (% of women age 15-49)
Women who own land jointly (% ofwomen age 15-49)
Men who own land alone (% of men)
Men who own land both alone andjointly (% of men)
Men who own land jointly (% of men)
Page 20 of 36
Source: Authors calculation.
Source: Authors calculation
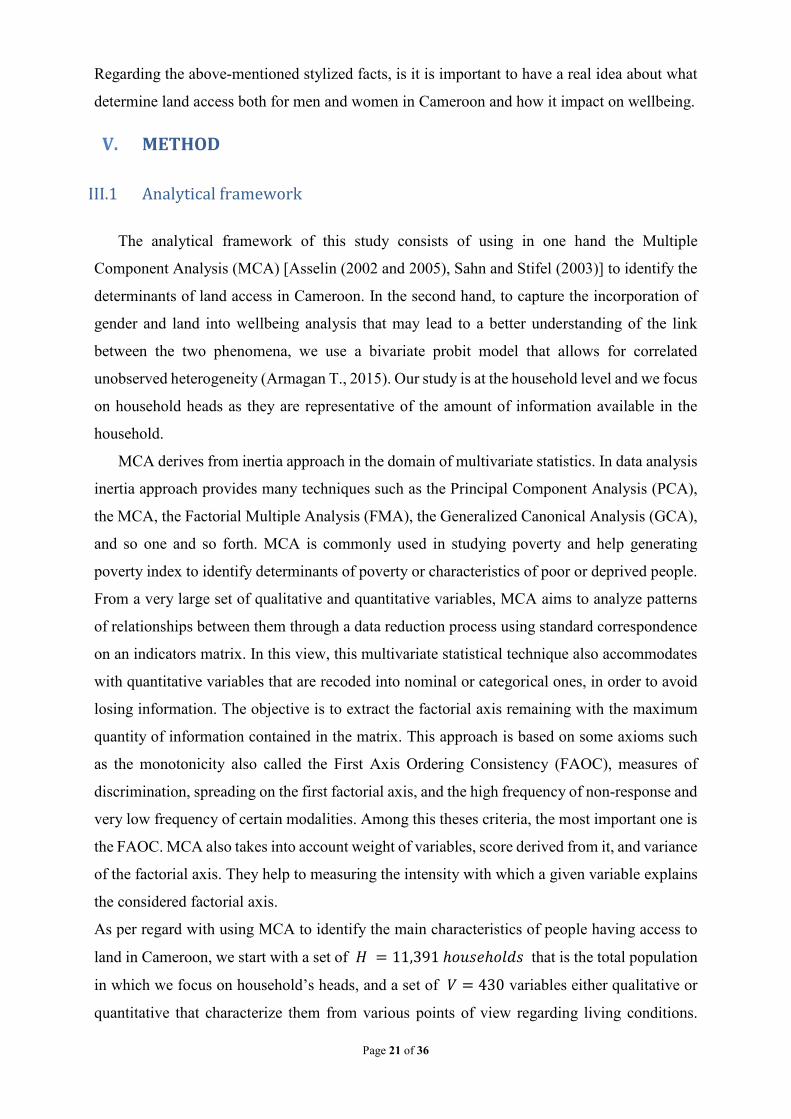
In the meantime, the number of people involved in agriculture is still increasing (figure 12)
while poverty rate is just slightly decreasing (figure 13) from 39.9% in 2007 (5.55 million of
poor) to 37.5% in 2014 (5.46million of poor).
Source: FAO (2017) and author calculation
Source: National Institute of Statistics, Cameroon (2015)
y = 8E+06e0.027x
0
5000000
10000000
15000000
20000000
25000000
30000000
1974
1978
1982
1986
1990
1994
1998
2002
2006
2010
2014
2018
(P)
F i g u r e 1 0 : T o t a l p o p u l a t i o n i nC a m e r o o n ( m i l l i o n )
0
20000
40000
60000
80000
100000
120000
1961
1965
1969
1973
1977
1981
1985
1989
1993
1997
2001
2005
2009
2013
2017
Figure 11: Agricultural land inCameroon(Sq. Km)
1431
7191
1634
9364
1907
8100
2277
3014
6885
056
3780
12 5584
716
5460
246
1 9 9 6 2 0 0 1 2 0 0 7 2 0 1 4
Figure13 : Pover ty t rend inCameroon
Population, total
Number of poor at $1.90 a day (2011 PPP)
02000400060008000
100001200014000
2005
2006
2007
2008
2009
2010
2011
2012
2013
2014
2015
2016
2017
2018
(P)
Figure12: Agricultural population inCameroon
Agriculture Population Non-agriculture Population
Page 21 of 36
Regarding the above-mentioned stylized facts, is it is important to have a real idea about what
determine land access both for men and women in Cameroon and how it impact on wellbeing.
V. METHOD
III.1 Analytical framework
The analytical framework of this study consists of using in one hand the Multiple
Component Analysis (MCA) [Asselin (2002 and 2005), Sahn and Stifel (2003)] to identify the
determinants of land access in Cameroon. In the second hand, to capture the incorporation of
gender and land into wellbeing analysis that may lead to a better understanding of the link
between the two phenomena, we use a bivariate probit model that allows for correlated
unobserved heterogeneity (Armagan T., 2015). Our study is at the household level and we focus
on household heads as they are representative of the amount of information available in the
household.
MCA derives from inertia approach in the domain of multivariate statistics. In data analysis
inertia approach provides many techniques such as the Principal Component Analysis (PCA),
the MCA, the Factorial Multiple Analysis (FMA), the Generalized Canonical Analysis (GCA),
and so one and so forth. MCA is commonly used in studying poverty and help generating
poverty index to identify determinants of poverty or characteristics of poor or deprived people.
From a very large set of qualitative and quantitative variables, MCA aims to analyze patterns
of relationships between them through a data reduction process using standard correspondence
on an indicators matrix. In this view, this multivariate statistical technique also accommodates
with quantitative variables that are recoded into nominal or categorical ones, in order to avoid
losing information. The objective is to extract the factorial axis remaining with the maximum
quantity of information contained in the matrix. This approach is based on some axioms such
as the monotonicity also called the First Axis Ordering Consistency (FAOC), measures of
discrimination, spreading on the first factorial axis, and the high frequency of non-response and
very low frequency of certain modalities. Among this theses criteria, the most important one is
the FAOC. MCA also takes into account weight of variables, score derived from it, and variance
of the factorial axis. They help to measuring the intensity with which a given variable explains
the considered factorial axis.
As per regard with using MCA to identify the main characteristics of people having access to
land in Cameroon, we start with a set of 𝐻𝐻 = 11,391 ℎ𝑜𝑜𝑜𝑜𝑜𝑜𝑜𝑜ℎ𝑜𝑜𝑜𝑜𝑜𝑜𝑜𝑜 that is the total population
in which we focus on household’s heads, and a set of 𝑉𝑉 = 430 variables either qualitative or
quantitative that characterize them from various points of view regarding living conditions.
Page 22 of 36
Among those households, we focus on households head (𝑖𝑖) having access to land and on what
characterize them. The variables of interest are for example the education level, the place of
living, the gender, the employment and the marital status, religion, the place of living; age,
etc… All the variables are recoded into nominal one and each of them has 𝐽𝐽𝑣𝑣 levels or
modalities. The indicators matrix is of rank 𝐻𝐻 × 𝑉𝑉 and is denoted 𝐼𝐼𝐼𝐼. After successive data
reduction into the complete data table (the Burt table) and 𝐼𝐼𝐼𝐼, and performing correspondence
analysis on 𝐼𝐼𝐼𝐼 , we obtain a smaller set 𝑈𝑈 (𝑈𝑈 < 𝑉𝑉) of variables that provide us one factor (𝑓𝑓1)
scores for rows (households head) and another (𝑓𝑓2) for columns (variables). These two factors
scores are assumed to be scaled so that their variance are equal to their corresponding
eigenvalues (𝑜𝑜1 𝑎𝑎𝑎𝑎𝑜𝑜 𝑜𝑜2). Those factors are the one with the maximum amount of information
contained in 𝐼𝐼𝐼𝐼. It seems important to precise that this extraction of factors is done after the
diagonalization of the Burt matrix denoted 𝐵𝐵𝐼𝐼 = 𝐼𝐼𝐼𝐼𝑡𝑡𝐼𝐼𝐼𝐼. All this is done basing on one of
the main criteria of the MCA’s technique that is the FAOC.
In addition, since some discrete variables can violate the Gaussian distributional assumption of
inertia approach [Ritchie-Scott (1918), Pearson (1922) and Olsson (1979)] and thus bias the
analysis, where necessary we use Polychoric MCA based on the Polychoric coefficients.
Conceptually, the Polychoric MCA work as follows: let 𝑣𝑣1𝑎𝑎𝑎𝑎𝑜𝑜 𝑣𝑣2 be two ordinal variables
with 𝑐𝑐1𝑎𝑎𝑎𝑎𝑜𝑜 𝑐𝑐2 respective categories each derived by discretizing the latent continuous variable
𝑣𝑣1∗ 𝑎𝑎𝑎𝑎𝑜𝑜 𝑣𝑣2∗ according to a set of threshold 𝑏𝑏𝑗𝑗,1, . . . 𝑏𝑏𝑗𝑗,𝑐𝑐𝑗𝑗−1 𝑓𝑓𝑜𝑜𝑓𝑓 𝑗𝑗 = 1,2:
𝑣𝑣𝑗𝑗 = � 𝑞𝑞 𝑖𝑖𝑓𝑓 𝑏𝑏𝑗𝑗,𝑞𝑞𝑗𝑗−1 < 𝑦𝑦𝑗𝑗∗ < 𝑏𝑏𝑗𝑗,𝑞𝑞𝑗𝑗 𝑓𝑓𝑜𝑜𝑓𝑓 𝑞𝑞 = 1, … , 𝑐𝑐𝑗𝑗−1 0 𝑜𝑜𝑜𝑜ℎ𝑜𝑜𝑓𝑓𝑒𝑒𝑖𝑖𝑜𝑜𝑜𝑜
The polychoric correlation is the correlation for the latent continuous variables 𝑣𝑣1∗ 𝑎𝑎𝑎𝑎𝑜𝑜 𝑣𝑣2∗
implied by the observed ordinal variables 𝑣𝑣1𝑎𝑎𝑎𝑎𝑜𝑜 𝑣𝑣2. Assuming a distribution for the latent
variables 𝑣𝑣1∗ 𝑎𝑎𝑎𝑎𝑜𝑜 𝑣𝑣2∗ gives the likelihood function for the polychoric correlation coefficients,
which can then be estimated using the observed 𝑣𝑣1𝑎𝑎𝑎𝑎𝑜𝑜 𝑣𝑣2.
Typically a bivariate normal distribution is used, assuming means of zero (0) and standard
deviations of one (1) for the latent variables (Olsson, 1979). If one of the observed variables is
discrete and the other is continuous, then the polyserial correlation is calculated, which assumes
only the discrete variable has an underlying latent variable. Combining pairwise estimates of
the polychoric or polyserial correlations gives the overall correlation matrix for the observed
data, which can then be used to conduct the final MCA (Kolenikov and Angeles, 2009).
Let us recall that, given a set of variables 𝑣𝑣1, … , 𝑣𝑣𝑝𝑝, the MCA seeks to find the linear
combinations of those variables with maximum variance: Standard MCA commonly implies
both positive and negative weights when calculating principal factors. However, the underlying
Page 23 of 36
interpretation of the data and analysis may require that the weights all be positive as both
positive and negative weights that are used to calculate principal factors in linear combination
of variables may partly cancel each other.
At the end, two main interpretations are done on results obtained from the MCA:
(a) Each modality of a selected variable has a coordinate on each of the extracted factors (also
called axis). That coordinate represent the factorial score (𝛼𝛼) equivalent to the weight �𝑒𝑒𝑗𝑗𝑣𝑣𝛽𝛽� of
the variable in that axis. For example, the score of a modality 𝑗𝑗 of a variable 𝑉𝑉 on the first factor
is computed as 𝛼𝛼1𝑗𝑗 = �𝐻𝐻𝑗𝑗𝑗𝑗𝑣𝑣𝑜𝑜1𝑒𝑒𝑗𝑗𝑣𝑣
1 .
(b) While performing the MCA, a discrimination value is calculated for each ordinal value on
each factorial axes. That is the variance of the factorial score of all the modalities of the
considered variable on the axis. It measures the intensity with which that variable explains the
axis.
To capture the incorporation of gender responsive land access into wellbeing analysis
that may lead to a better understanding of the link between these two main variables, we use a
bivariate probit model that allows for correlated unobserved heterogeneity (Armagan T., 2015).
In this paper, we are interested in household head owning land; both land under exploitation or
not are taken into consideration. Since in wellbeing or poverty studies, land is usually seen like
an asset, a good subject to any exchange on the market; or like an input that can be used to
produce and generate additional earnings for the household of individual owning the land. Let
us recall that, empirical studies on the measurement of poverty or wellbeing level generally use
income or total expenditure per capita or per equivalent adult (or children when it applies), or
a wellbeing composite index from selected indicators. Once a household head owning land is
identified among the 11,391 households of the total sample size, we compute the probability of
having access to land conditional to his living standards characteristics or wellbeing status.
Since this study aims at simultaneously analyzes the relationship between land access and
wellbeing, we use a bivariate probit model that allows for correlated unobserved heterogeneity.
Our model is then specified in the following:
� 𝑌𝑌ℎ𝑙𝑙𝑙𝑙 = 𝑋𝑋ℎ𝑙𝑙𝑙𝑙𝛾𝛾ℎ𝑙𝑙𝑙𝑙 + 𝜏𝜏ℎ𝑙𝑙𝑙𝑙
𝑌𝑌ℎ𝑤𝑤𝑙𝑙 = 𝑋𝑋ℎ𝑤𝑤𝑙𝑙𝛾𝛾ℎ𝑤𝑤𝑙𝑙 + 𝜏𝜏ℎ𝑤𝑤𝑙𝑙
𝑌𝑌ℎ𝑙𝑙𝑙𝑙 is the variable indicating the land status (𝑜𝑜𝑜𝑜) of the household’s head. It takes the value
zero (0) if the household head owns land and one (1) in the contrary. 𝑌𝑌ℎ𝑤𝑤𝑙𝑙 indicates the
wellbeing status (𝑒𝑒𝑜𝑜) of the household’s head. 𝑋𝑋ℎ𝑙𝑙𝑙𝑙 and 𝑋𝑋ℎ𝑤𝑤𝑙𝑙 are the vector of socio-
demographic characteristics (detailed in the tables below) of the household’s head with regard
Page 24 of 36
to land and wellbeing status. And 𝛾𝛾ℎ𝑙𝑙𝑙𝑙 𝑎𝑎𝑎𝑎𝑜𝑜 𝛾𝛾ℎ𝑤𝑤𝑙𝑙 are vectors of coefficients, 𝜏𝜏ℎ𝑙𝑙𝑙𝑙 and 𝜏𝜏ℎ𝑤𝑤𝑙𝑙 represent
residual terms.
In this study we consider four sub-groups of the main population (𝐻𝐻), with the respect
to the place of living (urban or rural) and the household head gender (male or female). We then
have female-headed households living in rural area (𝐹𝐹𝐻𝐻𝐻𝐻𝐹𝐹, 𝐻𝐻1 =
1,393 𝑝𝑝𝑜𝑜𝑜𝑜𝑝𝑝𝑜𝑜𝑜𝑜 𝑜𝑜𝑏𝑏𝑜𝑜𝑜𝑜𝑓𝑓𝑣𝑣𝑜𝑜𝑜𝑜 𝑜𝑜𝑎𝑎 112 𝑣𝑣𝑎𝑎𝑓𝑓𝑖𝑖𝑎𝑎𝑏𝑏𝑜𝑜𝑜𝑜𝑜𝑜 ), female-headed households living in urban area
(𝐹𝐹𝐻𝐻𝐻𝐻𝑈𝑈, 𝐻𝐻2 = 1,648 𝑝𝑝𝑜𝑜𝑜𝑜𝑝𝑝𝑜𝑜𝑜𝑜 𝑜𝑜𝑏𝑏𝑜𝑜𝑜𝑜𝑓𝑓𝑣𝑣𝑜𝑜𝑜𝑜 𝑜𝑜𝑎𝑎 161 𝑣𝑣𝑎𝑎𝑓𝑓𝑖𝑖𝑎𝑎𝑏𝑏𝑜𝑜𝑜𝑜𝑜𝑜), male-headed households
leaving in rural area (𝐼𝐼𝐻𝐻𝐻𝐻𝐹𝐹,𝐻𝐻3 = 3,633 𝑝𝑝𝑜𝑜𝑜𝑜𝑝𝑝𝑜𝑜𝑜𝑜 𝑜𝑜𝑏𝑏𝑜𝑜𝑜𝑜𝑓𝑓𝑣𝑣𝑜𝑜𝑜𝑜 𝑜𝑜𝑎𝑎 158 𝑣𝑣𝑎𝑎𝑓𝑓𝑖𝑖𝑎𝑎𝑏𝑏𝑜𝑜𝑜𝑜𝑜𝑜 ) and male-
headed households living in urban area (𝐼𝐼𝐻𝐻𝐻𝐻𝑈𝑈,𝐻𝐻4 =
4,717 𝑝𝑝𝑜𝑜𝑜𝑜𝑝𝑝𝑜𝑜𝑜𝑜 𝑜𝑜𝑏𝑏𝑜𝑜𝑜𝑜𝑓𝑓𝑣𝑣𝑜𝑜𝑜𝑜 𝑜𝑜𝑎𝑎 163 𝑣𝑣𝑎𝑎𝑓𝑓𝑖𝑖𝑎𝑎𝑏𝑏𝑜𝑜𝑜𝑜𝑜𝑜 ). For a total sample size of 11,391 people.
III.2 Data
In this study Statistics on households living conditions are from cross-sectional
microeconomic data from Cameroonian Households Consumption Surveys (CHCS). They are
official surveys namely CHCS 1 in 1996, CHCS 2 in2001, CHCS 3 in 2007 and CHCS 4 in
2014 conducted by the National Institute of Statistics of Cameroon. The aim of those surveys
covering all the ten regions of Cameroon stratified into urban, semi-urban and rural strata is to
investigate on household living standards and conditions, so that to help updating the poverty
profile and served in preparing benchmark indicators to monitor progress in reducing poverty.
We also use time series data of the 2017 World Development Indicators (WDI) from the World
Bank for land statistics in the world. Statistics on gender are from the World Bank gender portal
(2017). Some of those on agricultural are from the Food and Agricultural Organization (FAO).
The software used for computation are Excel; SPAD, SPSS and STATA.
VI. EMPIRICAL FINDINGS In this section we presents main results regarding characteristics of household’s head owning
and those on living conditions.
IV.1 LAND ACCESS DETERMINANTS
We have a sample size of 1,393 rural female household’s head observed on total of 112
variables. Our final MCA shows that 72.86% of them own land. They are mostly widowed
(49.03%), follow by married women in polygamy regime (12.77%) and divorced or separated
(10.62%). Those women are uneducated (50.03%) or have fulfilled only primary school
(33.66%). Regarding labour market, they are engaged in informal activities or in the primary
Page 25 of 36
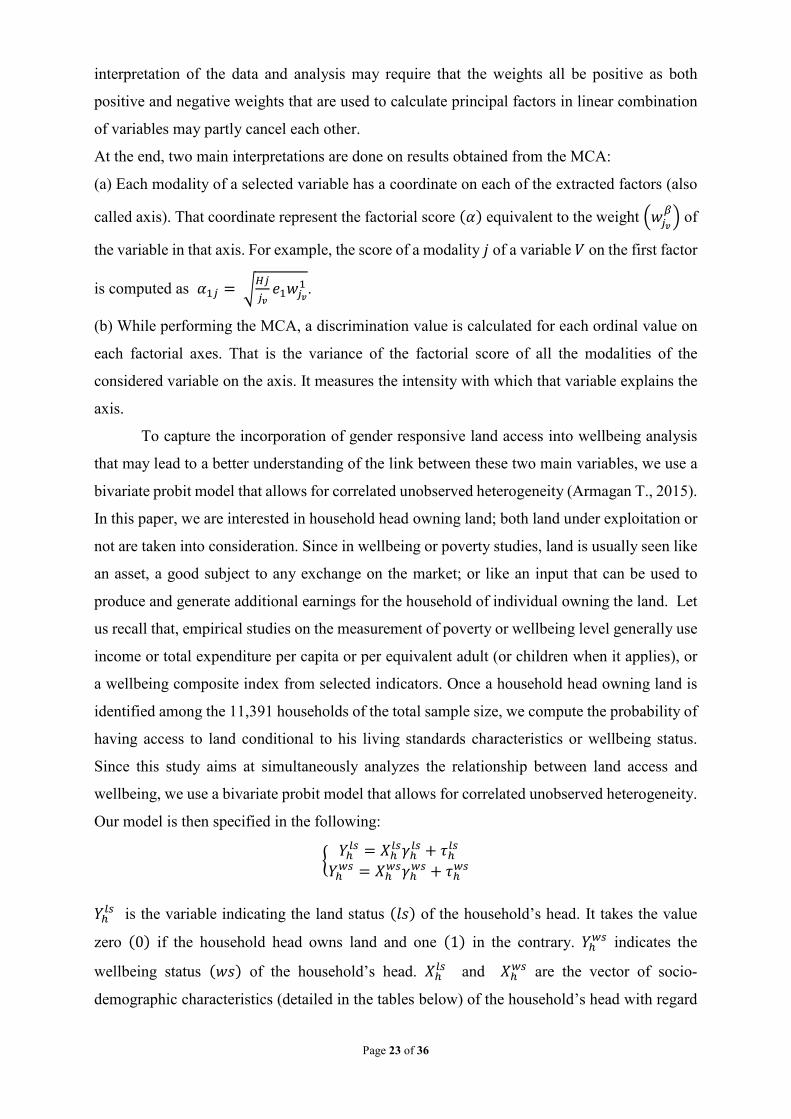
sector. Those women are all aged above 40, can have access to financial service (from credit
union of social group) to fund agro-pastoral activities, and poor characteristics of housing.
Figure 14: Cloud of variables for rural women household’s head
Source: Author with SPAD 6.
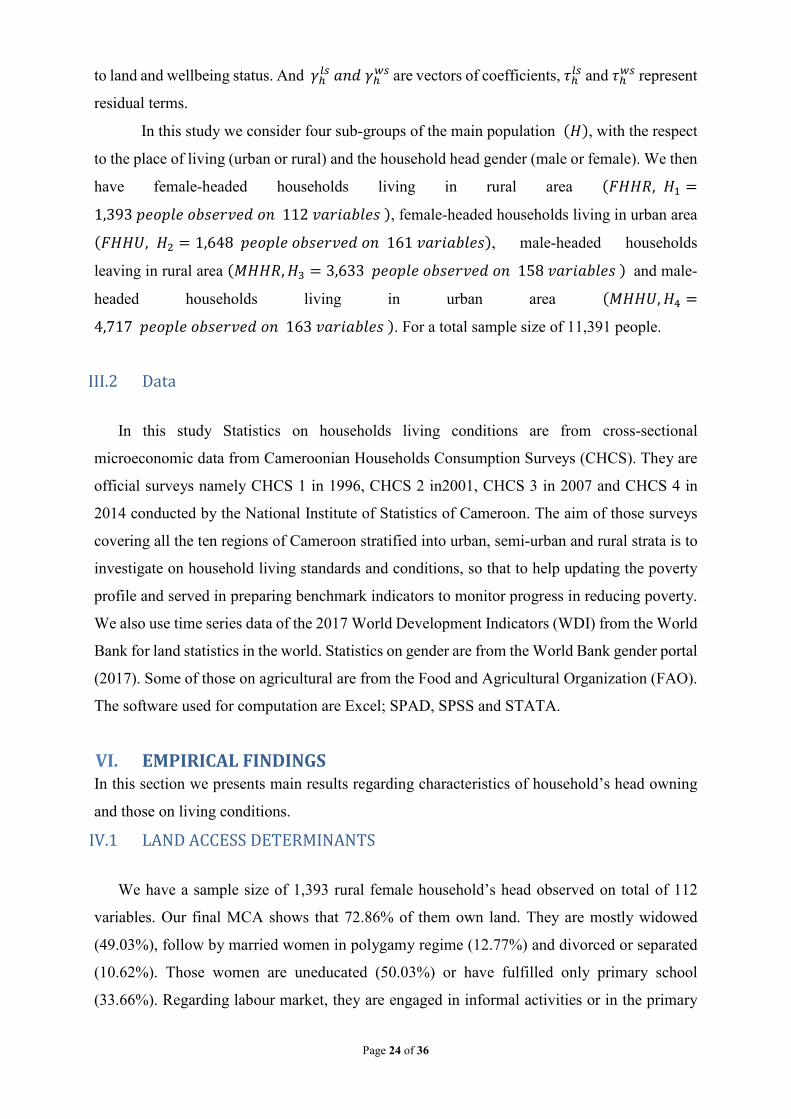
In urban area, only 492 of the 1,648 female household’s head, that is 29.85%, have access
to land and most of them are widowed (33.79%). Some others are married monogamy (14.62%),
divorced/separated (11.77%). As far as education is concerned, land owner achieved only
primary school (29.55%) or are uneducated (21.17%) and are aged 40-49 years (24%) with
access to credit or others financial services.
Figure 15: Cloud of variables for urban women household’s head
Source: Author with SPAD 6.
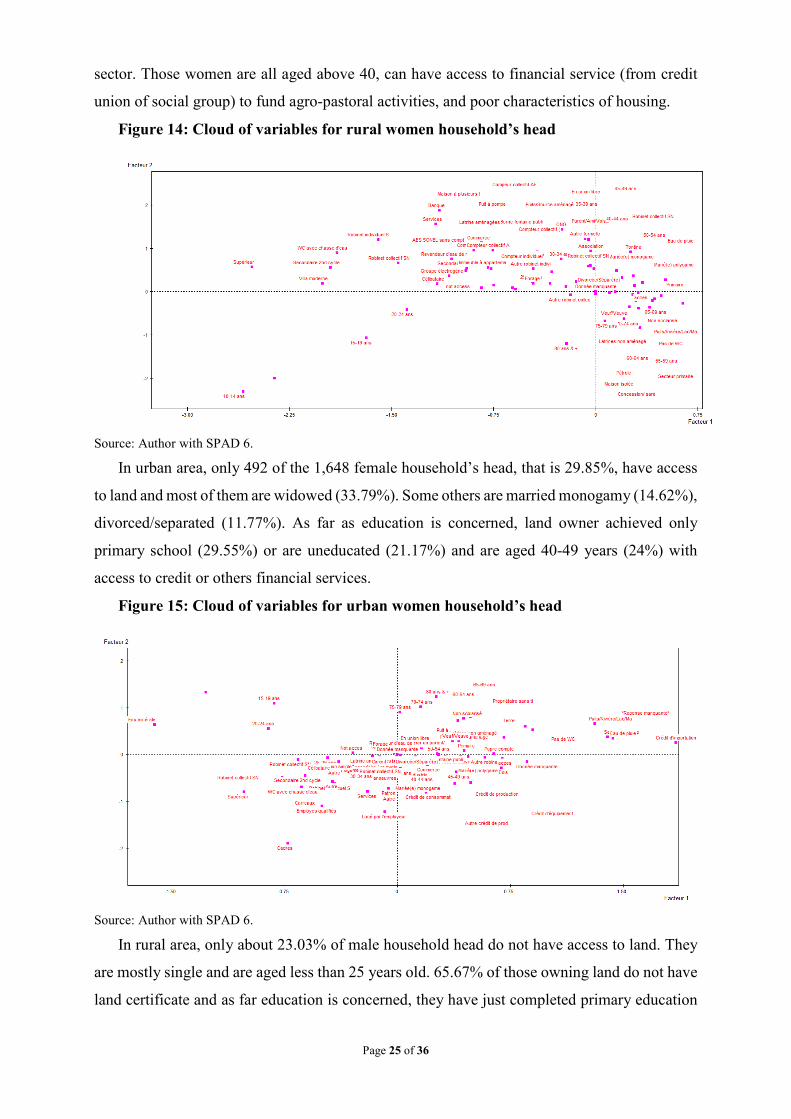
In rural area, only about 23.03% of male household head do not have access to land. They
are mostly single and are aged less than 25 years old. 65.67% of those owning land do not have
land certificate and as far education is concerned, they have just completed primary education
Page 26 of 36
(39.66%). They have poor housing characteristics and difficult access to some basics needs
such as water and energy.
Figure 16: Cloud of variables for rural men household’s head
Source: Author with SPAD 6.
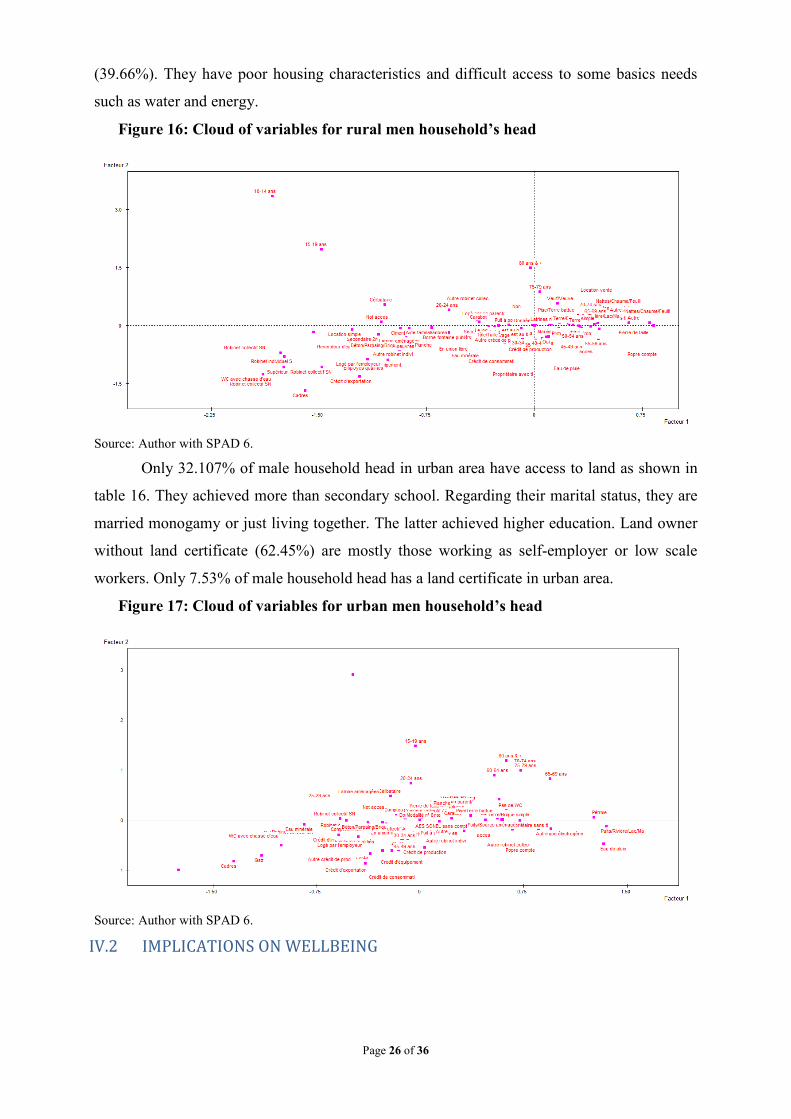
Only 32.107% of male household head in urban area have access to land as shown in
table 16. They achieved more than secondary school. Regarding their marital status, they are
married monogamy or just living together. The latter achieved higher education. Land owner
without land certificate (62.45%) are mostly those working as self-employer or low scale
workers. Only 7.53% of male household head has a land certificate in urban area.
Figure 17: Cloud of variables for urban men household’s head
Source: Author with SPAD 6.
IV.2 IMPLICATIONS ON WELLBEING
Page 27 of 36
Our empirical findings (tables 21 and 22) show that, land access has a positive effect on
the household wellbeing. In fact, owning land for a household’s head increases up to 1.86 the
probability to be non-poor, than for household where the head does not have access to land.
Living in rural area with access to land is not a significant guarantee to escape from poverty. In
others words, having access to land in rural area give only 20% of chance to the household’s
head to be non-poor, than a household’s head having access to land in urban area. Households
headed by women owning land, regardless the type of document for the ownership, have 139%
of chance to be non-poor than those head by men.
VII. CONCLUSION
Land possession by female-headed households have a relevant impact on the wellbeing of
the household as a whole in term of income and consumption. And being landless increases the
probability of being poor (low income and consumption) and vulnerable.
This study is important for stakeholders since, among other things, if even attention to gender
and land governance is not new. So that land tenure security and full and equal access of women
to ownership, property rights and land titles in Cameroon could be seen not only as an assets as
others but also as an engine for economic growth that can be engaged in the UN-2030 and the
AU-2063 development agenda.
Page 28 of 36
REFERENCES -Adhikari Bahadour C. and Bjorndal Trond, (2014), « Economic relationship between access
to land and rural poverty in Nepal», Center for Applied Economics Research, Applied
Economics Journal, ISSN 0858-9291, Vol. 21, N°1, pp. 20-41.
-African Development Bank, AfDB, (2016), «Feed Africa: Strategy for Africa transformation
in Africa 2016-2025», the high 5 for transforming Africa, AfDB group, august 2016, 74 pages.
-African Union Commission, AUC, (2015), «Agenda 2063: The Africa we want», the African
Union Commission, ISBN 978-92-95104-23-5, April 2015, 24 pages.
-Allendorf, Keera, (2007), “Do women’s land rights promote empowerment and child health in
Nepal?”, World Development Vol. 35, N° 11, pp. 1975 -1988.
-Armagan T. Aktuna-Gunes, (2015), «Measuring the effect of informal work and domestic
activities on poverty and income inequality in Turkey», February, 2015, Documents de Travail
du Centre d'Economie de la Sorbonne N° 2015.17, Maison des Sciences Économiques, 106-
112 boulevard de l'Hôpital, 75647 Paris Cedex 13, http://centredeconomiesorbonne.univ-
paris1.fr, ISSN : 1955-611X, 25 pages;
-Asselin, L.M. (2002), «Pauvreté multidimensionnelle», Institut de Mathématique Gauss,
Québec, Canada.Pages 89-96.
-Asselin, L.M., (2002), «Composite Indicator of Multidimensional Poverty», CECI, June
-Asselin, L.-M., and Tuan Anh, V., forthcoming, «Multidimensional Poverty and Multiple
Correspondance Analysis», in N. Kakwani and J. Silber, «Quantitative Approaches to
Multidimensional Poverty Measurement», London, Palgrave-Macmillan.
-Asselin L. M and Vu Tuan Anh, (2005), «Multidimensional Poverty in Vietnam 1993-1998,
according to CBMS indicators», Vietnam Socio-Economic Development Review, Spring 2005,
N°. 41.
-Binswanger H. and Elgin M., (1998), « Reflections on land reform and farm size», in
«Agricultural Development in the Third Wordl», Eicher C. K. and Staatz J. M. (Eds), 2nd edition
John Hopking University Press, Baltimore and London, pp. 342-354.
-Bockstael Nancy E., (1996), «Modeling economics and ecology : The importance of a spatial
perspective », American Journal of Agricultural Economics, Vol. 78, N° 5, pp. 1168-1180.
-Carter M. and Mesbah D., (1993), «Can land market reform mitigate the exclusionary aspect
of rapid agro-export growth? », World Development, Vol. 21, pp. 1085-1100.
-Chenery, H. B. (1960), «Patterns of Industrial Growth », The American Economic Review,
50(4), pp. 624-654.
-Cohen, B. J., (1973), «The question of imperialism: The political economy of dominance and
dependence», New York: Basic Books.
Page 29 of 36
-De Janvry A. and Sadoulet E., (2000), «Growth, poverty and inequality in Latin America: A
causal analysis, 1970-1994», Review of Income and Wealth, Vol. 46, pp. 267-287.
-Deaton, A, and Grosh, M.. (2000), «Consumption» In «Designing Household Survey
Questionnaires for Developing Countries: Lessons from fifteen Years of Living Standards
Measurement Study», Edited by Margaret Grosh and Paul Glewwe, Washington, DC: World
Bank, pp 91-133.
-Duncan, J.E., Lei, Y., D'Souza, P., Rodin, D., Chen, W., Sahni, H., Cheng, A., Warrior, R,
(2001), « EMS mutagenesis screen for lethal loci within cytogenetic region», 52D2-53A1. A.
Dros. Res. Conf. 42: 948C
-Feubi P., Besso. R., Biloa E. and Ze. A., (2014), « Foreign Direct Investment, Land Access
and Land Market In Cameroon, a Way of Boosting Intra-Regional Trade» Paper Presented At
Inaugural Conference On Land Policy In Africa, Addis-Ababa-Ethiopia-AUCC
-Food and Agriculture Organization of the United Nations, FAO,
(2011b), «The state of food and agriculture 2010-2011: Women in Agriculture: Closing the
gender gap for development ». Rome, FAO.
(2016), «Crop prospects and food situation », N° 4, December 2016, 40 Pages.
-Hanstad, T., Nielsen, R. & Brown, J. (2004), “Land and livelihoods: making land rights for
India’s rural poor”. LSP Working Paper, Access to Natural resources Sub-Programme. FAO,
Rome.
-International Food Policy Research Institute, IFPRI,
(2013), « 2012 Global food policy report», IFPRI-CGIAR consortium, Washington DC 20006-
1002, USA, 129 pages.
(2017), «2017 Global Food Policy Report» Washington, DC: International Food Policy
Research Institute. https://doi.org.10.2499/9780896292529, 148 pages.
International Monetary Fund (IMF),
(2017a), «World Economic Outlook: Seeking sustainable growth, short term recovery, long-
term challenges », occasional papers, IMF, October 2017, ISBN 978-1-48431-249-0, 304
pages.
(2017b), «IMF annual report: Promoting inclusive growth», IMF Policy Work, 114 pages.
-Katz, Elizabeth and Chamorro, Juan Sebastian, (2002), «Gender, land rights, and the household
economy in rural Nicaragua and Honduras». Paper prepared for USAID/BASIS CRSP.
Madison, Wisconsin.
-Keith Fuglie and Alejandro Nin-Pratt, (2013), «Agricultural productivity: A changing global
harvest», chapter 2 in IFPRI (2013), « 2012 Global food policy report». pp. 15-27.
Page 30 of 36
-Keswell M. and Carter R. M., (2014), «Poverty and land redistribution», Journal of
Development Economics, Vol. 110, pp. 250-261.
-Klasen, S. (2000), « Measuring poverty and deprivation in South Africa», Review of Income
and Wealth, N° 46, pp 33-58.
-Kolenikov, S., Angeles, G., (2009), «Socioeconomic status measurement with discrete proxy
variables: Is principal component analysis a reliable answer? » Review of Income and Wealth
N° 55, pp.128-165.
-Kuznets, S. (1971), «Economic growth of nations: total output and production structure»,
Belknap Press of Harvard University Press.
-Lewis David J., Plantinga Andrew J. and Wu J., (2009), «Targeting incentives to reduce habit
fragmentation», American Journal of Agricultural Economics, Vol. 91, N°4, pp. 1080-1096.
-Lewis David J., (2010), «An economic framework for forecasting land use and ecosystem
change», Resource and Energy Economics, Vol. 32, N° 2, pp. 98-116.
-Lewis William Arthur, (1954), «Economic development with unlimited supplies of labour»,
The Manchester School of Economic and Social Studies, 22(2), pp. 139-191.
-Liz Alden Wily, (2011), «Whose land is it? The status of customary land tenure in Cameroon»,
Centre for Environment and Development (Cameroon), FERN and The Rainforest Foundation
UK (England), February 2011, Ed Fenton, ISBN 978-1-906607-14-2, 189 pages.
-Lucas, R. E., (1976), «Econometric policy evaluation: A critique. In the Phillips curve and
labor markets », edited by K. Brunner and A. H. Meltzer, Carnegie-Rochester Conference
Series on Public Policy. Amsterdam: North Holland.
-Nancy L. J., Kovarika., C., Meinzen-Dicka, R., Njuki, B. and Quisumbinga, A., (2016),
«Gender, assets, and agricultural development: lessons from eight projects», World
Development, Vol. 83, pp. 295-311.
National Institute of Statistics (NIS), Cameroon,
(2002), « Evolution of poverty in Cameroon between 1996 and 2001 », 53 pages.
(2008), «Trends, profile and determinants of poverty in Cameroon between 2001 and
2007 » 108 pages
(2015), « Trends, profile and determinants of poverty in Cameroon between 2001 and 2014 »,
December 2015, 72 pages.
-Olsson, U., (1979), «Maximum likelihood estimation of the polychoric correlation»,
Psychometrika N°44, pp. 443-460.
-Organization for Economic Cooperation and Development, OECD, (2014), «All on Board:
Making Inclusive Growth Happen », the OECD Secretariat and the Ford Foundation, for the
OECD Inclusive Growth Initiative; 202 pages.
Page 31 of 36
-Pearson, K., Pearson, E., (1922), «On polychoric coefficients of correlation. Biometrika»,
N°14, pp. 127-156.
-Plantinga Adrew J. and Lewis David J., (2014), « Landscape simulations with econometric-
based land-use models», Chapter 15 in the Oxford Handbook of Land Economics, Oxford
University Press, New York, 38 pages.
Ravallion, M. (1996), « Issues in measuring and modelling poverty», The Economic Journal,
Vol. 106, No. 438, pp. 1328-1343.
-Republic of Cameroon,
(2009), « Growth and Employment Strategy Paper», Ministry of the Economy, Planning and
Regional Development, MINEPAT, 167 pages.
(2005), « Rural Sector Development Strategy Paper», Ministry of Agriculture and Rural
Development, MINADER, 114 pages.
-Ritchie-Scott, A., (1918), «The Correlation Coefficient of Polychoric Table», Biometrika, Vol.
12, pp. 93-133.
-Rostow, W. W. (1960), «The stages of economic growth: A non-communist manifesto»,
Cambridge University Press, Cambridge, pp 4-16.
-Ruth Meizen-Dick and Agnes Quisumbing (2013); «Women in agriculture: Closing the gender
gap», chapter 4 in IFPRI (2013), « 2012 Global food policy report», pp. 39-47.
Sahn, D. and Stifel, D., (2003), « Exploring alternative measures of welfare in the absence of
expenditure data», Review of Income and Wealth, Series 49, Number 4, December 2003.
-Shenggen Fan, (2013), «Food policy in 2012: Walk the talk», chapter 1 in IFPRI (2013), «
2012 Global food policy report», pp 1-13.
-Todaro Michael P. and Smith Stephen C, (2003), «Economic Development», Pearson
Education, New Delhi, pp. 124-126.
Tsui, K. Y., (2002), « Multidimensional Poverty Indices», Social Choice and Welfare, Vol.
19; pp. 76-900.
-Wehrmann Babette, (2015), «Voluntary guidelines on the responsible governance of tenure of
land, fisheries and forests in the context of national food security: from a Gender Perspective»,
Analysis and policy recommendations, Oxfam Deutschland.de September 2015, 36 pages.
-Woodford J. E and Meyer M. W., (2003), «Impact of lakeshore development on green frog
abundance», Biological Conservation, Vol. 110, pp 277-284.
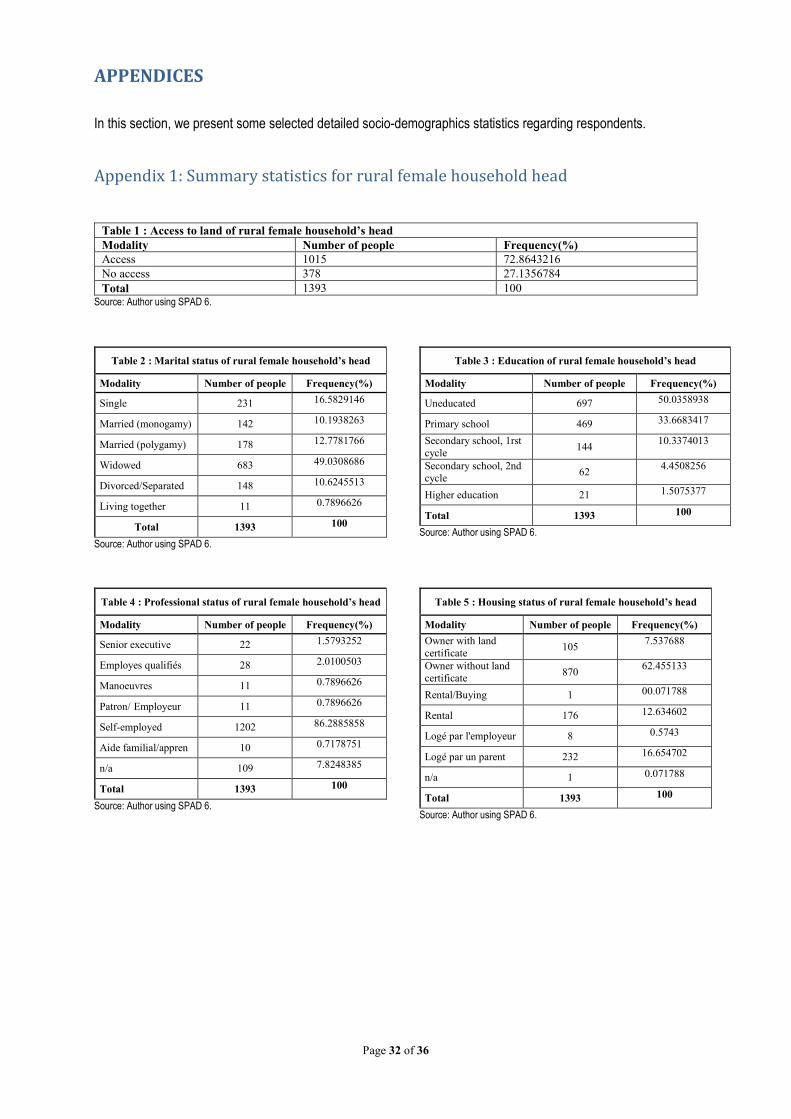
Page 32 of 36
APPENDICES In this section, we present some selected detailed socio-demographics statistics regarding respondents.
Appendix 1: Summary statistics for rural female household head
Table 1 : Access to land of rural female household’s head Modality Number of people Frequency(%) Access 1015 72.8643216 No access 378 27.1356784 Total 1393 100
Source: Author using SPAD 6.
Table 2 : Marital status of rural female household’s head
Modality Number of people Frequency(%)
Single 231 16.5829146
Married (monogamy) 142 10.1938263
Married (polygamy) 178 12.7781766
Widowed 683 49.0308686
Divorced/Separated 148 10.6245513
Living together 11 0.7896626
Total 1393 100
Source: Author using SPAD 6.
Table 3 : Education of rural female household’s head
Modality Number of people Frequency(%)
Uneducated 697 50.0358938
Primary school 469 33.6683417
Secondary school, 1rst cycle 144 10.3374013
Secondary school, 2nd cycle 62 4.4508256
Higher education 21 1.5075377
Total 1393 100
Source: Author using SPAD 6.
Table 4 : Professional status of rural female household’s head
Modality Number of people Frequency(%)
Senior executive 22 1.5793252
Employes qualifiés 28 2.0100503
Manoeuvres 11 0.7896626
Patron/ Employeur 11 0.7896626
Self-employed 1202 86.2885858
Aide familial/appren 10 0.7178751
n/a 109 7.8248385
Total 1393 100
Source: Author using SPAD 6.
Table 5 : Housing status of rural female household’s head
Modality Number of people Frequency(%) Owner with land certificate 105 7.537688
Owner without land certificate 870 62.455133
Rental/Buying 1 00.071788
Rental 176 12.634602
Logé par l'employeur 8 0.5743
Logé par un parent 232 16.654702
n/a 1 0.071788
Total 1393 100
Source: Author using SPAD 6.
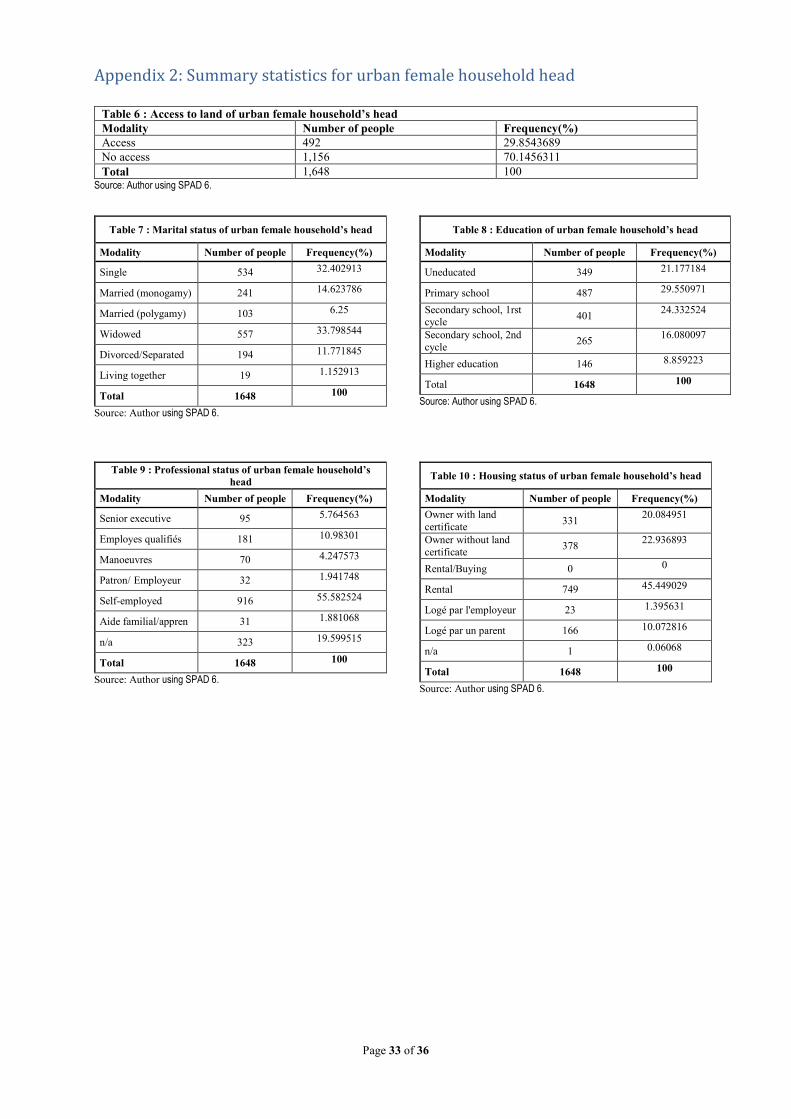
Page 33 of 36
Appendix 2: Summary statistics for urban female household head
Table 6 : Access to land of urban female household’s head Modality Number of people Frequency(%) Access 492 29.8543689 No access 1,156 70.1456311 Total 1,648 100
Source: Author using SPAD 6.
Table 7 : Marital status of urban female household’s head
Modality Number of people Frequency(%)
Single 534 32.402913
Married (monogamy) 241 14.623786
Married (polygamy) 103 6.25
Widowed 557 33.798544
Divorced/Separated 194 11.771845
Living together 19 1.152913
Total 1648 100
Source: Author using SPAD 6.
Table 8 : Education of urban female household’s head
Modality Number of people Frequency(%)
Uneducated 349 21.177184
Primary school 487 29.550971
Secondary school, 1rst cycle 401 24.332524
Secondary school, 2nd cycle 265 16.080097
Higher education 146 8.859223
Total 1648 100
Source: Author using SPAD 6.
Table 9 : Professional status of urban female household’s
head Modality Number of people Frequency(%)
Senior executive 95 5.764563
Employes qualifiés 181 10.98301
Manoeuvres 70 4.247573
Patron/ Employeur 32 1.941748
Self-employed 916 55.582524
Aide familial/appren 31 1.881068
n/a 323 19.599515
Total 1648 100
Source: Author using SPAD 6.
Table 10 : Housing status of urban female household’s head
Modality Number of people Frequency(%) Owner with land certificate 331 20.084951
Owner without land certificate 378 22.936893
Rental/Buying 0 0
Rental 749 45.449029
Logé par l'employeur 23 1.395631
Logé par un parent 166 10.072816
n/a 1 0.06068
Total 1648 100
Source: Author using SPAD 6.
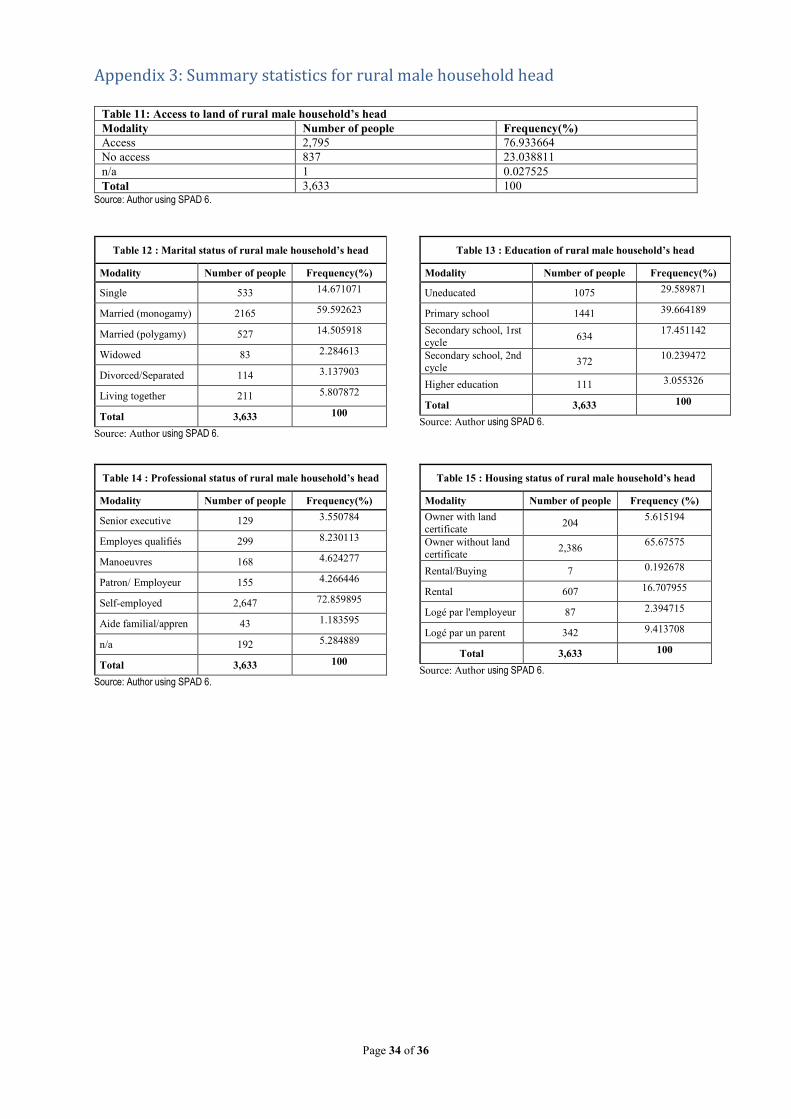
Page 34 of 36
Appendix 3: Summary statistics for rural male household head
Table 11: Access to land of rural male household’s head Modality Number of people Frequency(%) Access 2,795 76.933664 No access 837 23.038811 n/a 1 0.027525 Total 3,633 100
Source: Author using SPAD 6.
Table 12 : Marital status of rural male household’s head
Modality Number of people Frequency(%)
Single 533 14.671071
Married (monogamy) 2165 59.592623
Married (polygamy) 527 14.505918
Widowed 83 2.284613
Divorced/Separated 114 3.137903
Living together 211 5.807872
Total 3,633 100
Source: Author using SPAD 6.
Table 13 : Education of rural male household’s head
Modality Number of people Frequency(%)
Uneducated 1075 29.589871
Primary school 1441 39.664189
Secondary school, 1rst cycle 634 17.451142
Secondary school, 2nd cycle 372 10.239472
Higher education 111 3.055326
Total 3,633 100
Source: Author using SPAD 6.
Table 14 : Professional status of rural male household’s head
Modality Number of people Frequency(%)
Senior executive 129 3.550784
Employes qualifiés 299 8.230113
Manoeuvres 168 4.624277
Patron/ Employeur 155 4.266446
Self-employed 2,647 72.859895
Aide familial/appren 43 1.183595
n/a 192 5.284889
Total 3,633 100
Source: Author using SPAD 6.
Table 15 : Housing status of rural male household’s head
Modality Number of people Frequency (%) Owner with land certificate 204 5.615194
Owner without land certificate 2,386 65.67575
Rental/Buying 7 0.192678
Rental 607 16.707955
Logé par l'employeur 87 2.394715
Logé par un parent 342 9.413708
Total 3,633 100
Source: Author using SPAD 6.

Page 35 of 36
Appendix 4: Summary statistics for urban male household head
Table 16 : Access to land of urban male household’s head Modality Number of people Frequency(%) Access 1,656 35.10706 No access 3,061 64.89294 Total 4,717 100
Source: Author using SPAD 6.
Table 17 : Marital status of urban male household’s head
Modality Number of people Frequency(%)
Single 1,056 22.38711
Married (monogamy) 2,813 59.635361
Married (polygamy) 297 0,06296375
Widowed 80 0,01695993
Divorced/Separated 101 0,02141191
Living together 370 0,07843969
Total 4,717 100 Source: Author using SPAD 6.
Table 18 : Education of urban male household’s head
Modality Number of people Frequency(%)
Uneducated 587 12.44435
Primary school 1,386 29.383082
Secondary school, 1rst cycle 1,075 22.789909
Secondary school, 2nd cycle 1,040 22.047912
Higher education 629 13.334747
Total 4,717 100
Source: Author using SPAD 6.
Table 19 : Professional status of urban male household’s head
Modality Number of people Frequency(%)
Senior executive 491 0,10409158
Employes qualifiés 1142 0,24210303
Manoeuvres 328 0,06953572
Patron/ Employeur 214 0,04536782
Self-employed 2005 0,4250583
Aide familial/appren 91 0,01929192
n/a 446 0,09455162
Total 4,717 100
Source: Author using SPAD 6.
Table 20 : Housing status of urban male household’s head
Modality Number of people Frequency(%) Owner with land certificate 791 16.769133
Owner without land certificate 946 20.05512
Rental/Buying 11 0.233199
Rental 2515 53.317787
Logé par l'employeur 86 1.823193
Logé par un parent 365 7.737969
n/a 3 0.0636
Total 4717 100
Source: Author using SPAD 6.
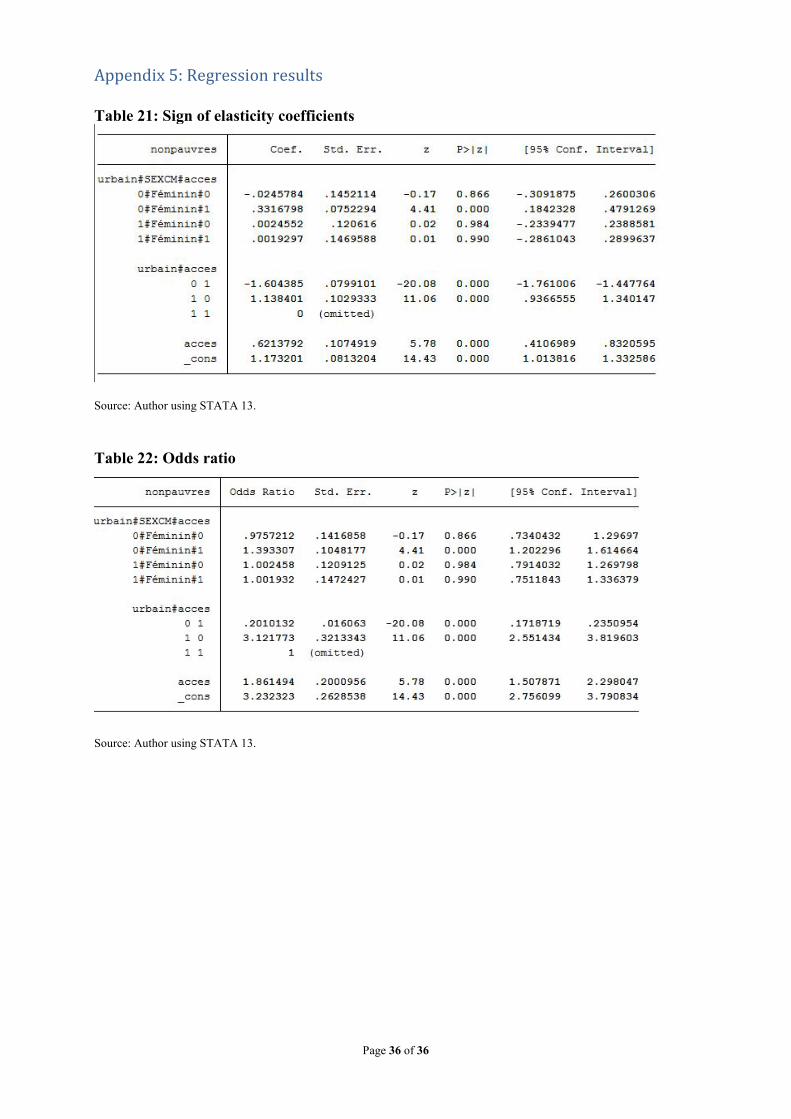
Page 36 of 36
Appendix 5: Regression results Table 21: Sign of elasticity coefficients
Source: Author using STATA 13.
Table 22: Odds ratio
Source: Author using STATA 13.