Embed Size (px)
Citation preview
Agricultural Enterprise Studies
in England and Wales
Economic Report No. 7
4.1
SUGAR BEETA Study of Sugar Production in the UK
and the feasibility of expansion
F. G. Sturrock & M. C. Thompson
Agricultural Economics Unit
De artment of Land Economy
-University of Cambridge
1972 Price 4op

Agricultural Enterprise Studies
in England and Wales
Economic Report No. 7
SUGAR BEETA Study of Sugar Production in the UK
and the feasibility of expansion
F. G. Sturrock & M. C. Thompson
Agricultural Economics UnitDepartment of Land EconomyUniversity of Cambridge
1972
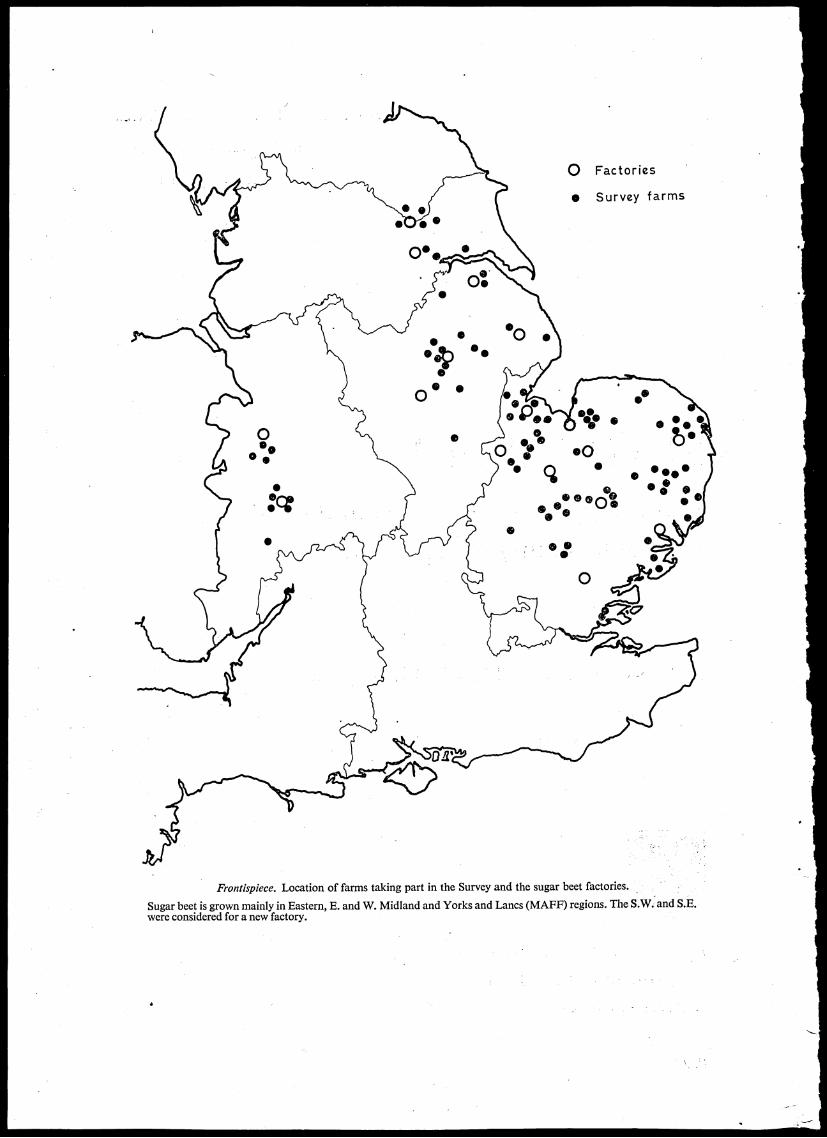
0 Factories
0 Survey farms
Frontispiece. Location of farms taking part in the Survey and the sugar beet factories.
Sugar beet is grown mainly in Eastern, E. and W. Midland and Yorks and Lancs (MAFF) regions. The S.W. and S.E.were considered for a new factory.

Contents
• Page
Foreword 4
Introduction 6
Chapter 1 A Survey of British Sugar Beet Production:
(a) The sample 8
(b) Costs of production 9
(c) Low labour crops 15
(d) Transport 16
Chapter 2 The Implications of Growing More Sugar Beet:
(a) Sugar beet and sugar cane 19
(b) The place of sugar beet in British farming 23
(c) British sugar beet in the E.E.C. 27
Chapter 3 The Feasibility of Increasing Sugar Production:
(a) The scope for increased production 30
(b) An economic appraisal 35
(c) Balance of payments 38
(d) Australian sugar 38
Summary 40
Appendix 42
Bibliography 45
3

Foreword
The economics of particular crop or livestock enterprises have been investigated and reported on by
individual departments of agricultural economics at universities in England and Wales for several
decades. In this work the departments have received—and continue to receive—generous support,
financial and technical, from the Ministry of Agriculture, Fisheries and Food.
From time to time, the departments meet—together with representatives of the Ministry—to discuss
common problems in their enterprise study work. One recent development has been the mounting
of joint studies by two or more departments with a special interest in a particular enterprise. As a
natural sequence, it has been decided that, although the reports will continue to be prepared and
issued by individual departments, this community of interest should be recognised by giving the reports
a common series title. Hence emerged the series the 'Agricultural Enterprise Studies in England and
Wales'. Any views expressed or conclusions drawn are those of the authors.
Recent titles and the addresses of university departments concerned are given at the back of the
report.
4
Preface
This report is based on a national survey of sugar beet organised in Cambridge. The opportunity
has been taken, however, to discuss possible future developments. It is now three years since the
present writer made a comparison with West Indies production and first suggested an expansion of
sugar beet in this country by 100,000 acres. This report deals with the feasibility of such a project) in
more detail. As entry to the E.E.C. seems imminent, the subject is obviously of topical interest.
The authors are indebted to the farmers who so willingly provided information on their methods
of growing sugar beet. They are also indebted to their colleagues in the Universities of Bristol, Not-
tingham and Manchester who interviewed farmers in their areas. Their thanks are also due to Mr.
W. C. Housden who prepared much of the statistical material and Mrs. Ann Bain who typed and
corrected the manuscript.
• Cambridge
July, 1972
5
F. G. STURROCK
Director, Agricultural Economics Unit
Introduction
For many years our policy with regard to sugar supplies has remained unaltered. A very reasonableworking arrangement had been reached—we produced a third of our supplies from home grown sugarbeet and we imported the remainder, nearly all of it cane sugar from the Commonwealth. The prospectof joining the Common Market however has thrown this convenient division of the market into themelting pot and before the Commonwealth Sugar Agreement expires in 1974, a new policy must beevolved. This therefore is the time at which to look afresh at the arrangements for our supplies.
Before doing so, it is worth reviewing briefly the circumstances that dictated policy in the past. Inthe seventeenth and eighteenth centuries, most of our supplies came from West Indian islands inBritish possession and were produced on estates worked with slave labour. For many years sugarcane was a prosperous industry but when in 1834 slavery was abolished in British possessions, theplantations were hard hit and production declined in importance until it revived once. again in thiscentury.In the meantime, the sugar beet industry had come into being. The extraction of sugar was first
accomplished by Marggraf, a German chemist, in 1747 but production on a commercial scale inEurope did not take place until it was encouraged by Napoleon during the blockade of the Frenchcoast by the British navy. Once started, however, the sugar beet industry was fostered and grew inimportance. Indeed, by 1913, 80 per cent of our supplies were beet sugar imported from Europe.
During the First World War, supplies from that source were interrupted and the trade in cane sugarwas revived. In the 1920's Empire trade was fostered and again we came to depend on imported rawcane sugar refined in this country.During the Second World War, supplies were secured by the Ministry of Food, largely from the
Commonwealth and this arrangement was formalised in 1951 by the Commonwealth Sugar Agreement.Under this arrangement, we guaranteed a market for a quota of sugar at an agreed price based ona . . reasonably remunerative price to efficient producers'.In the meantime, a sugar beet industry had been created in this country in 1924. At that time, British
agriculture was depressed and arable farming in particular was vulnerable to cheap imports. In thetraditional Norfolk four course rotation, (clover, wheat, fodder roots, barley) soil fertility was main-tained by clover that fixed nitrogen and fodder roots that allowed the farmers to clean the land ofweeds. So long as either cereals or fat livestock were profitable, this system (and other variants basedon it) held together but in the 1920's and 1930's the prices of grain and meat were both low and arablefarmers had to face the competition of cheap imports from countries that did not require as expensivea system of maintaining fertility.There were two weaknesses in the traditional arable rotations. The first was that the proportion of
cash crops was low. The second was that the growing of fodder roots whether for folding sheep in thefield or for carting to cattle in yards was labour intensive and the output was insufficient to pay thewages of the labour force required.One solution proposed by the Ministry of Agriculture was the introduction of sugar beet. Not
only did this provide an additional high value cash crop to replace the fodder roots but the tops andthe sugar beet pulp provided fodder for livestock. Sugar beet was also a cleaning crop.To, establish the crop, a subsidy was promised for ten years, while farmers became accustomed to
growing the crop. At the end of this time, however, the industry was still not viable and the subsidywas continued. The eighteen factories which had until then been managed by private enterprise werehowever taken over by the British Sugar Corporation, a public corporation in which the Governmenthas an interest.Although from the point of view of husbandry sugar beet seemed an ideal remedy for the hard
pressed arable farmer, the introduction of this crop was severely criticised at the time. There weretwo main reasons. The first was that by growing sugar we were depriving the West Indies of a market
6

for their produce and that if we improved the lot of the British arable farmer, it was at the expense ofWest Indies sugar workers who were also suffering from the effects of the world wide depression.The second criticism was that a subsidy on sugar beet was an expensive way of giving aid and helped
farmers in only one part of the country—the East of England. It was further suggested that a labourintensive crop such as sugar beet was never likely to compete with sugar cane grown in tropical countrieswith much lower wage rates. Indeed, for many years it was taken for granted by writers on agriculturalpolicy that sugar beet survived as a crop only because it was protected from competition from imports.Production in this country was also limited to preserve a market for Commonwealth countries, mostof them undeveloped and heavily dependent on the British market for traditional exports such assugar.As will be shown in this report, the position has changed. The efficiency of production of sugar
beet has improved substantially. The yield per acre has doubled and labour requirements have fallenby more than 80 per cent. Sugar beet is thus competitive at least with West Indian cane sugar. It istherefore no longer necessary to defend the sugar beet crop solely as a special form of protection forBritish farmers.In joining the Common Market, moreover, a new aspect is introduced. We shall no longer be able
to choose supplies from the cheapest sources but will be compelled to pay for refined sugar at E.E.C.prices which are higher than those now paid to our farmers or to the Commonwealth. In these circum-stances, it would be to our advantage to grow more sugar in this country. The aim of this report isto examine this proposition from such evidence as is available.
7

CHAPTER 1
A Survey of British Sugar Beet Production
The Sample
The survey of sugar beet grown in 1970 was based on a random sample of 104 farmers. The sample
which was drawn by the British Sugar Corporation was stratified into three size groups according
to the acreage of beet grown on each farm under 20 acres, 20 to 50 acres, and over 50 acres. As the
number of farms in each stratum was approximately proportional to the acreage of sugar beet in
that stratum, each acre of sugar beet in England and Wales had an equal chance of inclusion in the
sample.
Acres Holdings - Sugar Beet
Stratum Sugar Beet Number Per cent Acres Per cent
1 1-191 14,826 696 105,554 25.0
2 20-49-1 4,428 20.8 132,114 312
3 Over 50 2,046 9.6 185,241 43.8
21,300 100.0 422,909 100.0
Representative farms were drawn from all the factories. The distribution was as follows :—
Eastern Counties . . 71East Midlands . . . . 16West Midlands . . . . 10Yorkshire . . • • • • 8
105
No attempt was made to sample Scottish growers (which are outside the jurisdiction of this depart-
ment). Since then, the Cupar factory has been closed.
Statistical Criteria
The analysis of the survey results was carried out using the normal distribution and the associated
probability functions. Figure 1.1 shows the distribution of gross margin per acre over the whole sample
and clearly demonstrates the normality of the sample.Some of the survey results are concerned with examining and describing sub samples classified
within the total sample by a variety of classifications. All comparisons between sub samples are
examined using Analysis of Variance to test for significant classifications. Where more than two
'classes' are analysed at the same time t tests are used to examine the significance of the difference
between class means. The residual variance obtained in the analysis of variance was used as a best
estimate of the population variance.Bartlett's test for homogeneity of variance was used with every analysis of variance and in no analysis
was there need to reject the results because of heterogeneity of variance.
The calculated F and t ratios are only quoted in the results where conclusions are based on marginally
significant results but the level of significance is indicated by asterisks placed near the results, thus:—
* = P 0.05 ** = P 0.01 *** = P 0.001
8

Farms25-
20-
15 -
10
5
Figure 1 Distribution of Gross Margin per acre
0 • 20- 39.9 40- 59.9 60-799 80 -99.9 100 -119-9
per acre. Gross margin
Costs of Production
Details of the assumptions made are given in the Appendix. The costs and returns of the three sizegroups are shown in Table 1.1. Three results are shown:-1 Gross Margin A. This is output less variable costs for seed, fertiliser and sprays. As the same itemsof cost are deducted on each farm the Gross Margin A provides a useful method of comparing indi-vidual farms and groups. In this case, the figures are £93.0, £93.2 and £80-7 on the small, middle andlarge groups. As the costs of seed, fertiliser and sprays are fairly similar in all three size groups, thelower G.M. of the large group is mainly due to the lower yield and output (£100-5 per acre comparedto £115.2 and £114.2).2 Gross Margin B. This is output less all variable costs including contract work and casual labour.This is the G.M. that reflects most accurately the marginal contribution of the crop on each farmtowards covering fixed and overhead costs and providing a profit. It is thus the figure used to planan individual farm. It is less useful however as a means of comparing groups because the list of costitems deducted is not the same on all farms. The 'other' variable costs on the small group at £22.0 aresubstantially higher than the medium or large groups (£14.5 and £10-7 respectively). This is becausefarmers in the small group rely more heavily on contractors for haulage and cultivations. In the largergroups where the farmers make more use of their own lorries and implements, the costs of this equip-ment appear lower down in fixed costs.3 Net Margin. To arrive at this figure deductions are made from the output not only for variablecosts but also for an estimated share of fixed costs and overheads.In total, fixed costs are apparently similar in all three groups. There are, however, some differences
in detail. The smaller units have lower costs for machinery because as already noted, they rely oncontractors to a greater extent.As can be seen in Tables 1.2 and 1.3, the large units use significantly less labour for ploughing,
seedbed preparation, hoeing and spraying. As these are mostly on large farms with large fields andimplements, this is to be expected. On the other hand, more labour is used for haulage and otheroperations left to contractors on the small units.4 Total Costs. In total, costs decline significantly from £93.8 on large units to £78.8 on small units.Receipts are £115.2 and £114.2 on small and medium units and £100.5 on the larger units. The latterfigure reflects the lower yields on the large units (13.5 tons per acre compared to 15.6 and 151 tonsper acre). The net margins are £21.4, £31.5 and £21.4 per acre respectively.
9
•
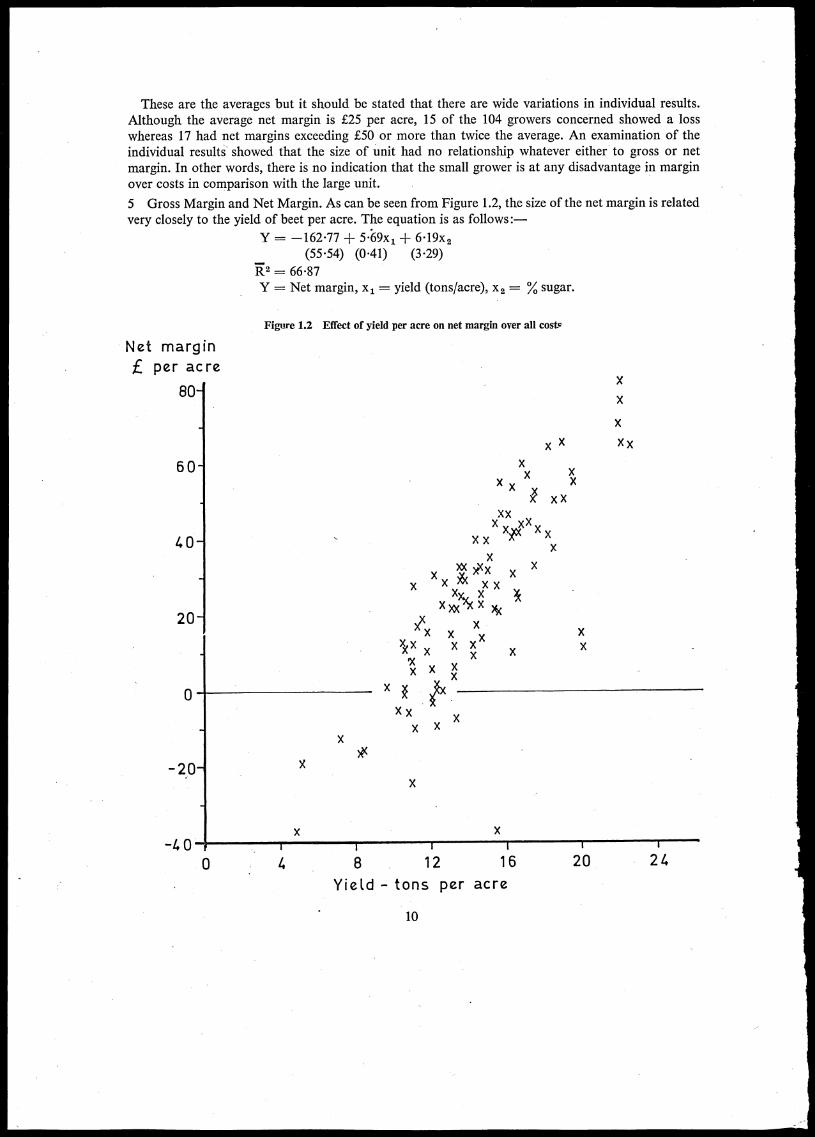
These are the averages but it should be stated that there are wide variations in individual results.Although the average net margin is £25 per acre, 15 of the 104 growers concerned showed a losswhereas 17 had net margins exceeding £50 or more than twice the average. An examination of theindividual results showed that the size of unit had no relationship whatever either to gross or netmargin. In other words, there is no indication that the small grower is at any disadvantage in marginover costs in comparison with the large unit.
5 Gross Margin and Net Margin. As can be seen from Figure 1.2, the size of the net margin is relatedvery closely to the yield of beet per acre. The equation is as follows :—
Y = —162-77 ± 569x1 + 6-19x2(5554) (0.41) (3.29)
172 = 66-87Y = Net margin, x, = yield (tons/acre), x2 = % sugar.
Net marginper acre
80
60
1.0
20
-20
-40
•
Figure 1.2 Effect of yield per acre on net margin over all costs
X
XX
X
x x X>
XXX
x X
Xp X XX X
X
X x )°(%( XX X XX X
Xx, XX xx ')( X
YX
)?(x x
X
x X
X X
x x
X X
x X XX
X
X
X
XX
X X
1 1
8 12 16 20 24
Yield - tons per acre
10
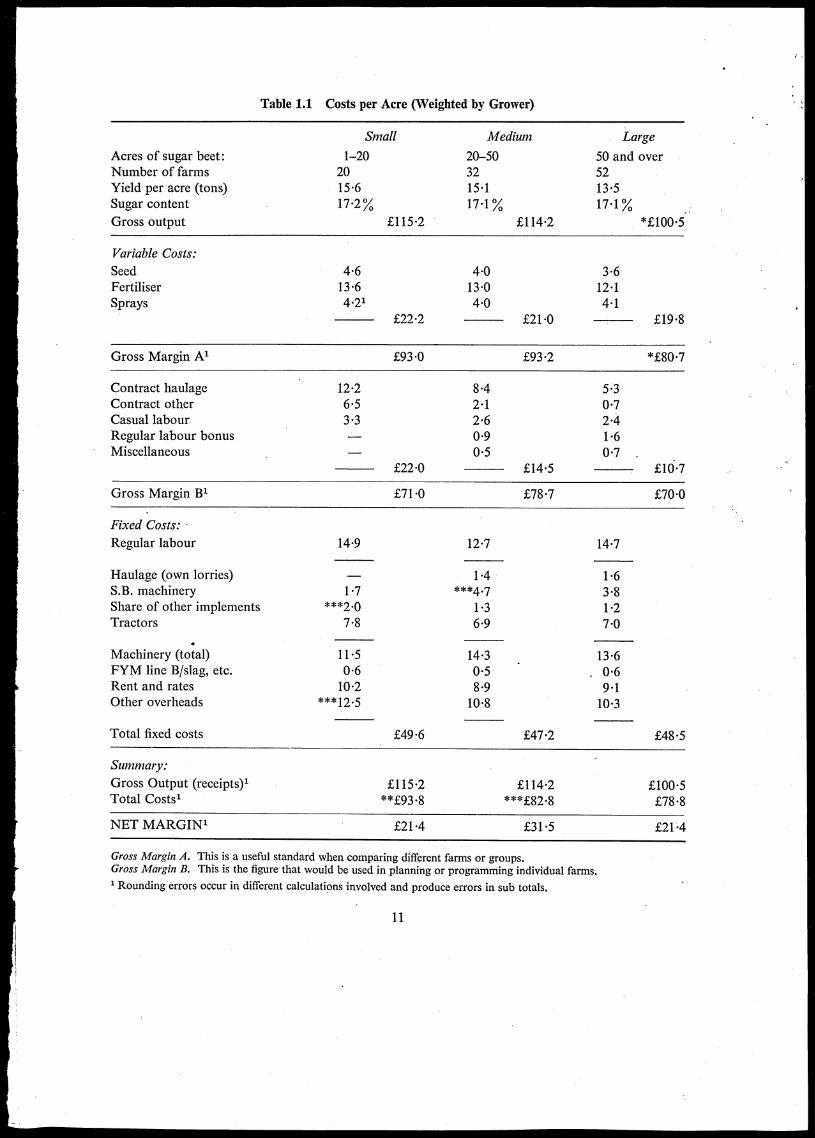
Table 1.1 Costs per Acre (Weighted by Grower)
Small Medium Large
Acres of sugar beet: 1-20 20-50 50 and overNumber of farms 20 32 52Yield per acre (tons) 15-6 15-1 13-5Sugar content 17-2% 17-1% 17-1% ,Gross output £115-2 £114-2
Variable Costs:
Seed 4-6 4-0 3-6Fertiliser 13-6 13-0 12-1Sprays 4-21 4-0 4-1
£22-2 £21-0 £19-8
Gross Margin A1 £93-0 £93-2 *£80-7
Contract haulageContract otherCasual labourRegular labour bonusMiscellaneous
12-26-53-3
£22-0
8-4 5-32-1 0-72-6 2-40-9 1'60-5 0-7 ,
£14-5 E1d-7
Gross Margin B1 £71-0 £78-7 £70-0
Fixed Costs: -
Regular labour 14-9
Haulage (own lorries)S.B. machinery 1-7Share of other implementsTractors 7-8
Machinery (total) 11-5FYM line B/slag, etc. 0-6Rent and rates 10'2Other overheads ***12-5
Total fixed costs £49-6
12-7
1-4***4-7
1-36-9
14-30-58-910-8
14-7
1-63 -81-27-0
13-6. 0-6
9-110-3
£47-2 £48'5
Summary:
Gross Output (receipts)1Total Costs'
£115-2**£93-8
£114-2***£82-8
£100-508-8
NET MARGIN' £21-4 £31-5 £21-4
Gross Margin A. This is a useful standard when comparing different farms or groups.Gross Margin B. This is the figure that would be used in planning or programming individual farms.1 Rounding errors occur in different calculations involved and produce errors in sub totals.
11

Table 1.2 Labour Requirements
Man hours/acre Small Medium Large Average S.E.
Stubble workFYM applicationPloughingSeedbed preparationFertiliser applicationDrilling and weed sprayingSprayingHandhoeingTractor hoeingHarvesting and loadingHaulage
1-3 0.8 1.0 1.0 0.140.5 0.5 0.5 0.5 0.122.5 1.6 1.5 1-7 0.092-9 1•4 1.2 1.6 0.131.3 0.6 0.6 0.7 0.070.3 0.8 0-8 0.7 0.050.5 0.5 0.4 0.4 0.0415.9 9.6 13.0 12.8 1.149.8 3.9 2.9 4.5 0.619-6 9-7 10.3 10.0 0.650.5 2.1 3.5 2.5 0.47
TotalS.E.
45.1 31.5 35-7 36.5 1.806.9 1.8 1.9
Table 1.3 Tractor Requirements
Tractor hours/acre Small Medium Large Average S.E.
Stubble workFYM applicationPloughingSeedbed preparationFertiliser applicationDrilling and weed sprayingSprayingTractor hoeingHarvesting and loading
1.3 0.8 1.0 1.0 0.140.5 0.4 0.5 0.5 0.102-5 1.7 1.5 1.7 0.092.9 1.4 1.2 1.6 0.131.3 0.6 0.6 0.7 0.070.3 0-8 0.8 0.7 0.050-5 0.4 0.4 0-4 0.045.7 3-4 2.9 3.6 0.328.7 9.7 10.6 10.0 0.64
Total 23.6 19.2 19.4 20.2 0.90
Of the variance in net margin, yield alone accounts for 66.03 per cent. As will be noted, the breakeven point (at 16 per cent sugar) is 11 tons per acre. In other words, crops below 11 tons show a negativenet margin. Total costs including a share of overheads and other fixed costs, have been used hithertoin the Price Review to calculate changes from year to year.
Total costs and net margin are not of much interest to the farm adviser. If the net margin is £25,an extra acre will not necessarily increase the profit of the farm as a whole by £25. Nor will a loss ofone acre necessarily reduce it by £25. This is because nearly 60 per cent of the costs are fixed and donot change in proportion to the area of sugar beet grown.If a farmer growing 50 acres of sugar beet were able to grow an extra 10 acres, the additional profit
would be the Gross Margin B less any extra fixed costs incurred for labour, machinery and overheads.If the G.M. were £70 an acre and if the existing labour and sugar beet harvester could deal with theextra 10 acres, the extra profit would be £70 per acre less the G.M. of the crop displaced. If this werebarley (G.M. £30) the net increase in profit would be £40 per acre or £400 for 10 acres.
12
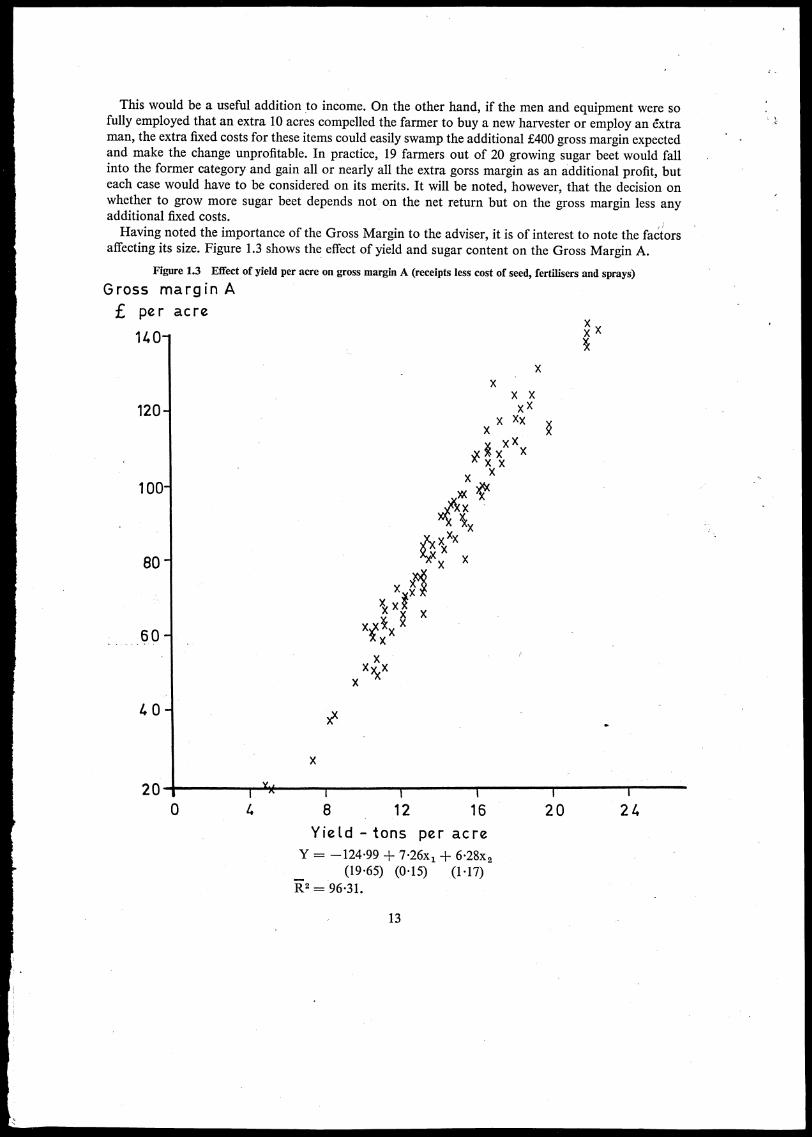
This would be a useful addition to income. On the other hand, if the men and equipment were sofully employed that an extra 10 acres compelled the farmer to buy a new harvester or employ an extraman, the extra fixed costs for these items could easily swamp the additional £400 gross margin expectedand make the change unprofitable. In practice, 19 farmers out of 20 growing sugar beet would fallinto the former category and gain all or nearly all the extra gorss margin as an additional profit, buteach case would have to be considered on its merits. It will be noted, however, that the decision onwhether to grow more sugar beet depends not on the net return but on the gross margin less anyadditional fixed costs.Having noted the importance of the Gross Margin to the adviser, it is of interest to note the factors
affecting its size. Figure 1.3 shows the effect of yield and sugar content on the Gross Margin A.
Figure 1.3 Effect of yield per acre on gross margin A (receipts less cost of seed, fertilisers and sprays)
Gross margin A
per acre
140-
120-
100-
80-
60-
4 0-
204
XX )s(X
X
X
X
18 12 16 20 24
Yield - tons per acreY = —124.99 + 7-26x1 6.28x2
(19.65) (015) (117)= 96.31.
13
Yield per acre alone accounts for 95.28 per cent of the variance and yield with sugar content for
96.31 per cent. It is thus obvious that the gross margin A depends almost entirely on yield per acre.
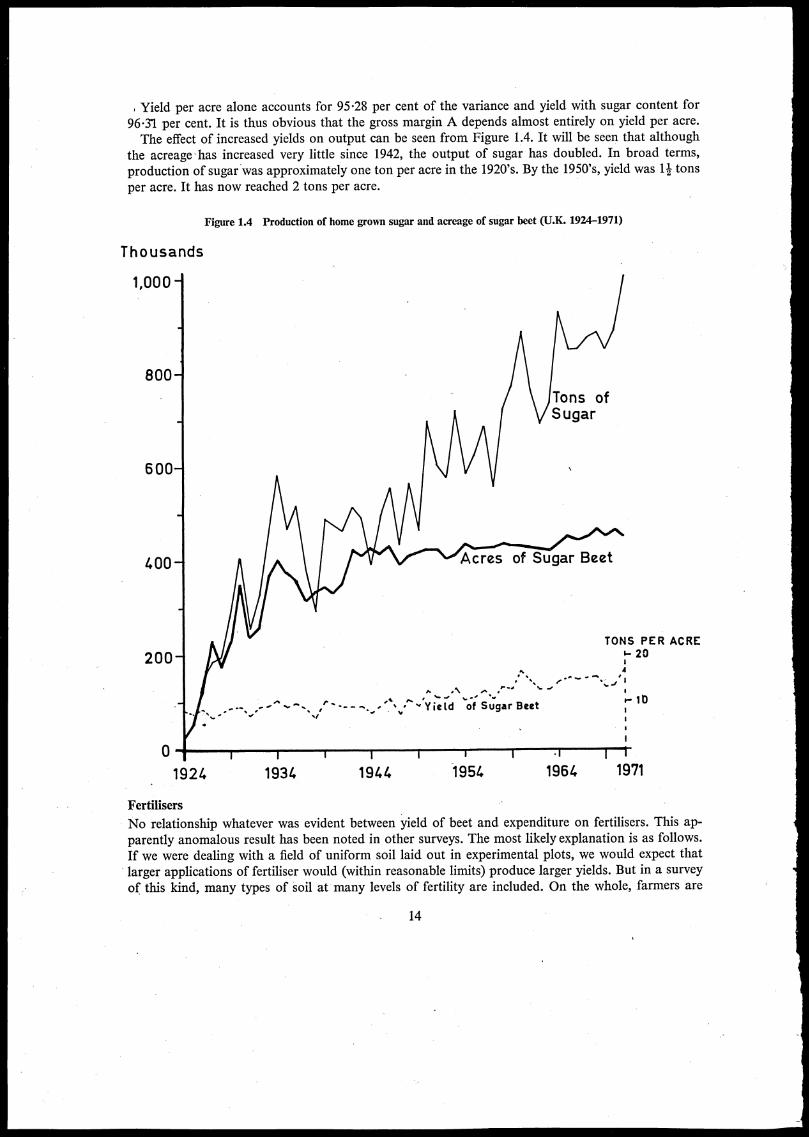
The effect of increased yields on output can be seen from Figure 1.4. It will be seen that although
the acreage-has increased very little since 1942, the output of sugar has doubled. In broad terms,
production of sugar was approximately one ton per acre in the 1920's. By the 1950's, yield was 11 tons
per acre. It has now reached 2 tons per acre.
Thousands
1,000-
800-
600-
400-
200-
Figure 1.4 Production of home grown sugar and acreage of sugar beet (U.K. 1924-1971)
• .•• I
•••
Tons ofSugar
Acres of Sugar Beet
TONS PER ACREir 20
4
F.
•""• •%
•N • '
••• t- 10• v• Yield of Sugar Beet
0 11 •1
192/. 1934 1944 1951. 1964 1971
Fertilisers
No relationship whatever was evident between yield of beet and expenditure on fertilisers. This ap-
parently anomalous result has been noted in other surveys. The most likely explanation is as follows.
If we were dealing with a field of uniform soil laid out in experimental plots, we would expect that
larger applications of fertiliser would (within reasonable limits) produce larger yields. But in a survey
of this kind, many types of soil at many levels of fertility are included. On the whole, farmers are
14
knowledgeable about the use of fertiliser. In consequence, we find that farmer A intending to growsugar beet on a thin sandy soil in poor condition applies a heavy dressing and obtains only a modestyield. Farmer B on rich fen soil applies a light dressing because this is all it requires and neverthelessobtains a higher yield than farmer A. Without allowing for differences in soil and fertility, these tworesults by themselves might appear to indicate a negative return to fertiliser. It is thus obvious thatit is to the experimental plot and not the general survey that we must look for an accurate estimate ofthe affect of increasing dressings of fertiliser.
Low Labour Crops
As harvesting is now largely mechanised, the remaining labour peak is thinning and hand hoeing thecrop in late spring.One objective of the survey was to analyse the difference between crops grown in the traditional way,
with polygerm seed and large labour inputs, and those grown using monogerm seed, drilled to a standand with minimal hand labour. A 'very low labour group' of 27 farmers using less than 10 man hoursfor hand hoeing was therefore separated from the whole sample to analyse the differences. It was hopedthat there would be a number using no hand hoeing. There were farmers who used no hand hoeingon part of their crop but only three (all small farms) had grown the whole of their crop using none.Many growers however merely 'walked over' their crops to tidy up localised weed problems or becausethere was little other work available for the staff. These growers were included in the 'very low labourgroup'.
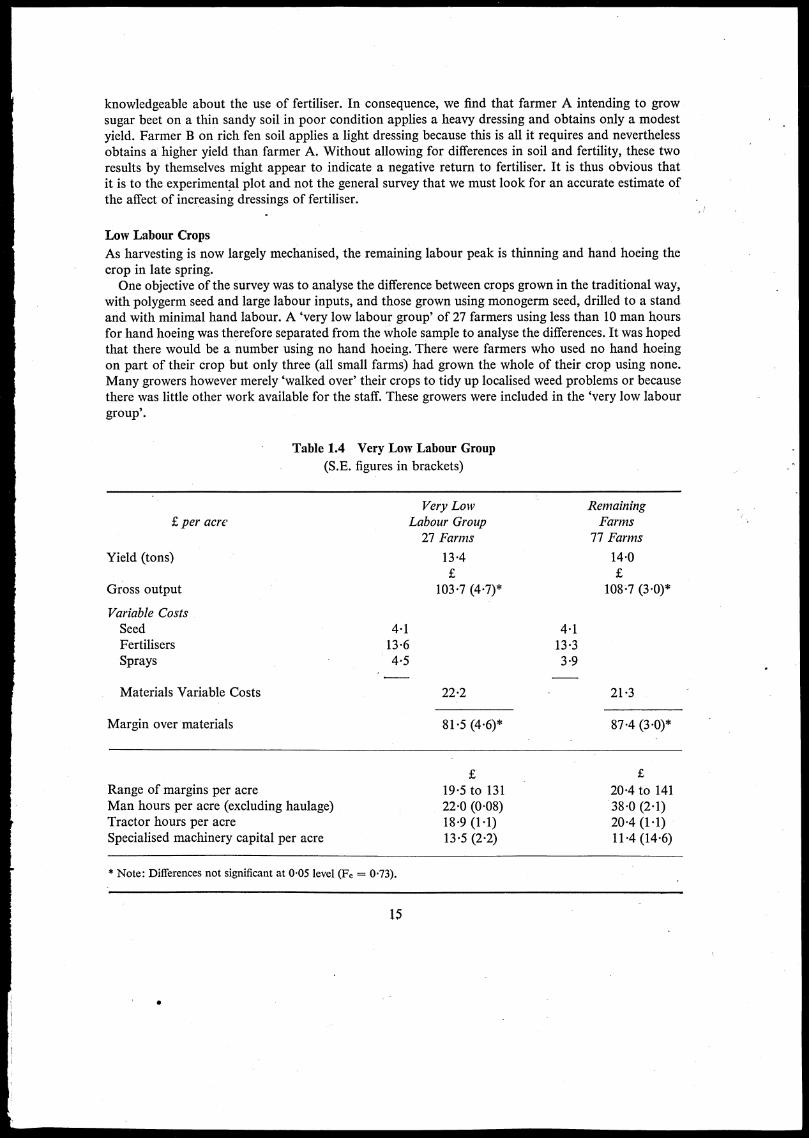
Table 1.4 Very Low Labour Group
(S.E. figures in brackets)
Very Low Remaining£ per acre Labour Group Farms
27 Farms 77 Farms
Yield (tons) 13-4 14.0
Gross output 103-7 (4-7)* 108-7 (3.0)*
Variable CostsSeed 4-1 4-1Fertilisers 13.6 133Sprays 4.5 3.9
Materials Variable Costs 22-2 21.3
Margin over materials 81-5 (4-6 87-4 (3-0)*
Range of margins per acreMan hours per acre (excluding haulage)Tractor hours per acreSpecialised machinery capital per acre
19-5 to 13122-0 (0-08)18.9 (1-1)13-5 (2-2)
20-4 to 14138.0 (2-1)20.4 (1.1)11-4 (14-6)
* Note: Differences not significant at 0.05 level (Fe = 0.73).
15
•
The results for the high and low labour groups are shown in Table 1.4 where a 'Gross Margin overmaterials only' (A) has been used to highlight the differences between groups.' It will be seen from Table 1.4 that the seemingly large difference between the average Gross Outputsis not statistically significant. This is because of the variation found within the two samples. Thevariation is reflected to some extent in the 'range of margins' shown in Table 1.4. The variation doubtlessarises from'many factors including soils, climates, and management.
Experimental work on yields of sugar beet and such factors as variety, type, seed spacing, hand workand machinery work has been carried out for some time, particularly by the National Institute ofAgricultural Botany (N.I.A.B.)1 and the British Sugar Corporation (B.S.C.).2 The findings of thiswork have shown quite clearly that (a) monogerm varieties have a 5 per cent lower yield potential thanpolygerm varieties.(b) That hand singled crops, singled from close seed spacing, usually produces higher plant popula-
tions and thus higher yields irrespective of varieties.The results of this survey, shown in Table 1.4, show that in farm practice the variations are greater
than in field trials and that experimental findings are camouflaged by other factors.One important fact emerges. In 1970 the difficult spring followed by summer droughts produced
very testing conditions for crops drilled to wide spacings to reduce hand work. It is clear from thisstudy that the low labour group did not suffer more than the higher labour group.Thus the low labour techniques passed a severe test in 1970 and growers can be encouraged by this
if the system appeals to them in spite of the acknowledged lower yield potential.The saving of hand hoeing will only improve income, of course, if bills can be decreased or saved
regular labour can be diverted to more profitable work elsewhere on the farm. It will be noted onTable 1.4 that seed and herbicide costs are not very dissimilar in the two groups. One would expectto find higher seed and herbicide costs associated with low labour systems but it is clear from analysisof the survey that many growers had trouble with unreliability or unpredictability of herbicides.Many growers for instance had to use overall sprays of Herbon Gold after band spraying had producedunsatisfactory results. It is well known that herbicides are still not completely reliable but this situationis improving and, except in unusual years like 1970, one can expect to see a cost differential appear.The effects of the price differential between seed varieties is disguised by the mixed varieties and tech-niques used on the same farm.The relationship between man hours per acre for hand hoeing and thinning and yield per acre is
shown in Figure 1.5. It is evident that farmers using only a minimum of labour do not seem to havesuffered lower yields.
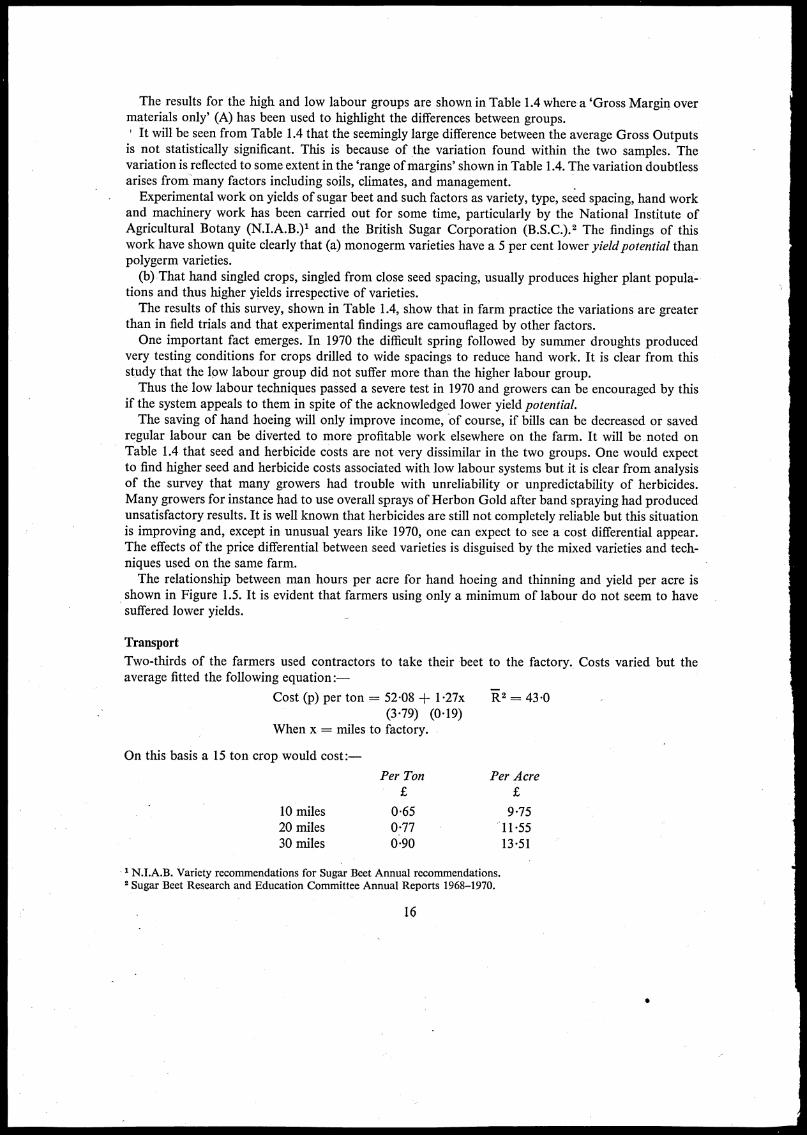
Transport
Two-thirds of the farmers used contractors to take their beet to the factory. Costs varied but theaverage fitted the following equation:—
Cost (p) per ton = 52-08 + 1-27x R2 = 43-0(379) (0.19)
When x = miles to factory.
On this basis a 15 ton crop would cost:-
10 miles20 miles30 miles
Per Ton Per Acre
0-65 9-750-77 11-550-90 13-51
1 N.I.A.B. Variety recommendations for Sugar Beet Annual recommendations.Sugar Beet Research and Education Committee Annual Reports 1968-1970.
16
•

About a third of the farmers used their own lorries. The following is a comparison of the costs peracre:—
Contract Haulage Own Lorry
Average cost £11.5 Fuel £1.4Share of lorry upkeep £3.6Driver £1.0
£6.0
As one would expect, the farmer's lorry on average cost less than the contractor—otherwise thefarmer would presumably not have invested capital in one. A lorry is, of course, worth while only ifthe farmer has sufficient use for it, not only in the sugar beet season but at other times of the year.
Yieldtons per acre
J
201
Figure 1.5 Relationship of Labour Input and Yield per acre
X
X
X Xx
X
X X
-, X X X XXXx X X
)1( X
. ( X XX x
X )(15- x x x x xxx x x x x
X Xxxxx x
xxi)cx_ x x x x
x x x x x xxx. x x. x )S(4,
x xx x x10-r.
5
T
X
X
X
X
X
X
10 20 30 40 50
Manhours. per acre
17
Pence per ton
Figure 1.6 Cost of transporting sugar beet (per ton)
X
X
I 1t i I 110 20 30
Miles from factory
40
Specialised Machinery Costs
The capital value of specialised sugar beet machinery, that is excluding tractors and general purposetrailers, averaged El 1 -8 per sugar beet acre over the whole sample. This varied from nil, where contractservices were used for all mechanical operations, to £41 per acre where new expensive machinerywas associated with a relatively small acreage of sugar beet.There were a number of shared harvesters in the survey, particularly associated with multi-row,
multi-machine systems.The cost for specialised machinery per sugar beet acre was taken as 20 per cent depreciation of the
1970 opening valuation plus the total repair bills for 1970; this total being divided by the sugar beetacreage handled. This cost averaged £3-7 per acre with a range of observations from nil to £15-7 persugar beet acre. It was very noticeable, however, that only 14 farmers of the 104 recorded had a figurehigher than £6 per acre. None of these 14 farmers however used multi-row harvesters. The high costreflected the recent purchase of pew harvesters and the consequent high depreciation charge in thatyear.
18
CHAPTER 2
Implications of Growing More Sugar eet
Sugar Beet and Sugar Cane
In considering the wider implications of growing more sugar beet in this country or importing, thereare a number of aspects to be considered—some economic and some political. It may be asked whythe production of sugar is not left to market forces. If so, the crop would be grown in countries witha natural advantage and low costs of production. Sugar would be imported by other countries whoseclimate was less suited to the crop. Unfortunately there seems to be no likelihood whatever of thishappening. The reasons are several:-
1 Sugar grown for the home market is often protected and farmers have a vested interest in seeingthat such protection is continued. The E.E.C. and the countries from which it was formed have pro-tected sugar beet for many years. There can be little doubt that in consequence, many uneconomicsugar industries have been sustained artificially; for example, sugar cane in Louisiana, where the wintersare rather cold for the crop, could hardly survive without protection by the U.S. government.
2 Nearly all the exporting countries have bilateral marketing arrangements with importing countries.In some cases, these are between former colonies or overseas territories and the mother country e.g.U.S.A. and Puerto Rico, France and Guadiloupe, Reunion and Martinique, Portugal and her Africanterritories, the U.S.S.R. and Cuba, and the U.K. and Commonwealth countries. Most of the exportingcountries in this category are developing countries who put a high value on a guaranteed market andprice. When world prices have been high, the Commonwealth Sugar Agreement has secured us suppliesat a modest price. Over most of the period since 1951, the C.S.A. price has been above world prices,thus furnishing a subsidy to developing Commonwealth countries. During most of 1971/2, however,the world price has been above the C.S.A. price.
3 As already mentioned, World Market prices have been highly unstable and have often remainedfor long periods far below the lowest cost of production in any country.
There are two main reasons for these fluctuating prices. The first is that the demand for sugar isinelastic. This means that shortages and surplusses tend to have a more than proportionate effecton prices. The second is that the 'World Market' is a. residual market for only about one-eighth ofworld production. As a result, fluctuations in demand and supply tend to be passed on to this com-paratively small market and thus have an exaggerated effect on prices. As a result no developingcountry could in the past have depended on selling sugar in such a market.
It is true that since 1968, the International Sugar Agreement has helped to increase prices althoughthey are still very variable. Even so, developing countries are unlikely to wish to leave the protectionof their present bilateral agreements until they can be quite certain that the International Agreementcan be relied upon as a permanent arrangement.
If complete free trade in sugar is not practicable, on what principles should British policy be based?Until now, the choice has been between beet sugar grown here and cane sugar imported from theCommonwealth. It is sometimes argued that sugar cane is inherently the more economic form ofproduction and for this reason should have the lowest costs. Groganl for example, gives three reasons:-
1 The yield of sugar beet per acre is less than that of cane.
2 Sugar cane (unlike beet) can be grown year after year on the same soil. Plantations can thereforebe concentrated close to the factory, thus reducing the cost of transporting cane to the factory.
3 Sugar cane is a perennial and unlike beet does not have to be sown every year.
1 F. 0. Grogan, International Trade in Temperate Zone Products.
19
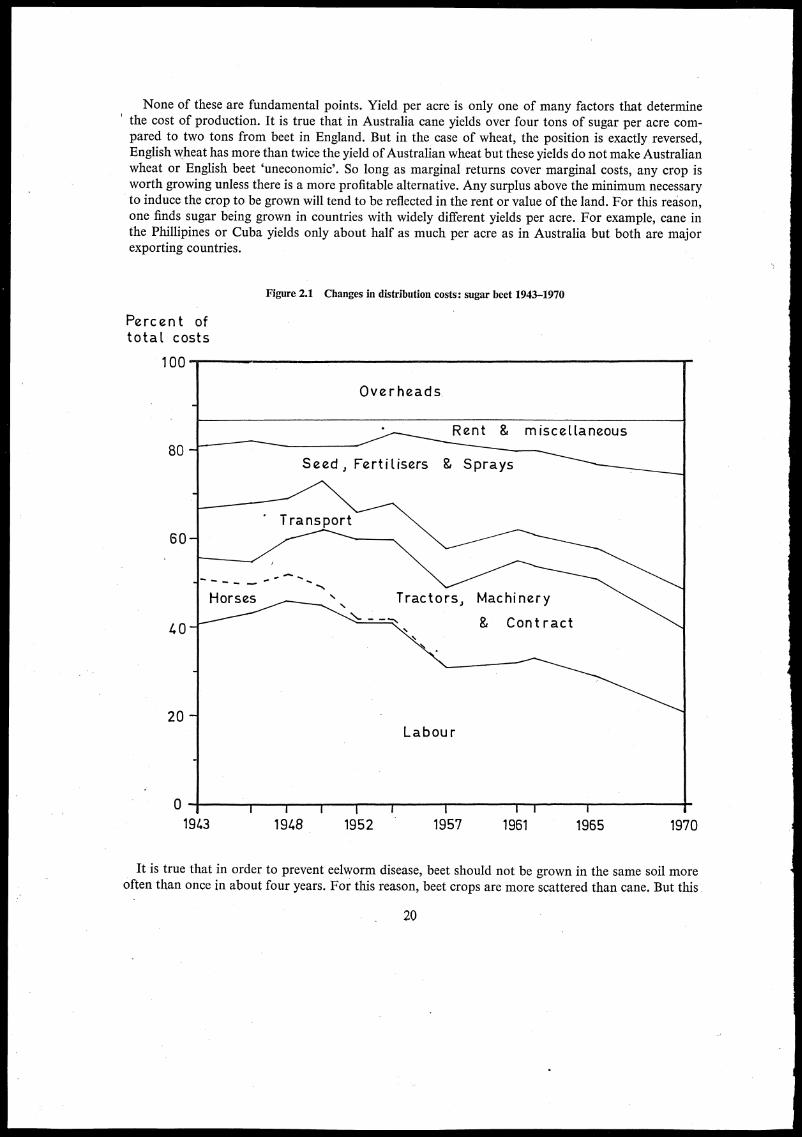
None of these are fundamental points. Yield per acre is only one of many factors that determinethe cost of production. It is true that in Australia cane yields over four tons of sugar per acre com-pared to two tons from beet in England. But in the case of wheat, the position is exactly reversed,English wheat has more than twice the yield of Australian wheat but these yields do not make Australianwheat or English beet 'uneconomic'. So long as marginal returns cover marginal costs, any crop isworth growing unless there is a more profitable alternative. Any surplus above the minimum necessaryto induce the crop to be grown will tend to be reflected in the rent or value of the land. For this reason,one finds sugar being grown in countries with widely different yields per acre. For example, cane inthe Phillipines or Cuba yields only about half as much per acre as in Australia but both are majorexporting countries.
Percent oftotal costs
100
80
Figure 2.1 Changes in distribution costs: sugar beet 1943-1970
Overheads
60-
40
20 —
Horses
Rent & miscellaneous
Seed s Fertilisers & Sprays
" Transport
Tractors, Machinery
Labour
Contract
0 1 1 11943 1948 1952 1957 1961 1965 1970
It is true that in order to prevent eelworm disease, beet should not be grown in the same soil moreoften than once in about four years. For this reason, beet crops are more scattered than cane. But this
20

fact does not cause difficulties in transport. On the assumption that 60 per cent of the area round afactory is arable land and that 10 per cent of this is in beet, even a large factory processing 90,000 tonsof sugar could have the crop grown within a radius of 20 miles. In fact, the difference in cost of transportbetween, say, 10 and 20 miles is only 12p per ton or about 2 per cent of the receipts. Sugar beet iseasy to handle and in our cool climate can be stored if need be until transport is available. By contrast,cane is often difficult and expensive to move on poor roads in tropical conditions where cane deterior-ates rapidly after cutting.The remaining point—the relative cost of planting and sowing seed is a small matter and can be
taken as part of the total cost of growing the crops mentioned later.On the other hand, imported cane sugar suffers from .several cost disadvantages in comparison
with sugar beet grown for home consumption.
1 Cane sugar has to be loaded and shipped to this country. Beet sugar is already here.
2 Imported sugar is processed abroad into raw sugar. This is then redissolved and refined in thiscountry. Home grown beet sugar can be processed and refined in a single operation which is lessexpensive.
Manhoursper acre
200
1 5 0
10 0
50-
0
Figure 2.2 Decline in man-hours per acre for sugar beet 1943-1970
Other
Thinning
Harvesting
II f
1943 1948 1952
21
1957I
1961 1965 1970
3 Cane sugar plantations are usually monocrop. For this reason, labour requirements are unevenand a large proportion of the workers can be employed for only a few months in the year. Muchof the cultivating equipment also stands idle for a large part of the year. Sugar beet by contrast ispart of a mixed arable system with a variety of crops and livestock that provide employment forlabour and much of the machinery throughout the year. A combination of enterprises also providesa broad base to carry overhead costs.
There can be little doubt that the economics of sugar beet production have altered fundamentallyin the past thirty years. This is illustrated in Figure 2.1 based on enterprise studies carried out atCambridge since 1943. It is interesting to note that costs have changed in relative importance. In1943, labour accounted for 41 per cent of the total. At that time, sugar beet was a labour intensivecrop and with our relatively high wage rates was obviously at a disadvantage compared to sugar canegrown in the tropics with lower wage rates. By 1970, labour accounted for only 21 per cent of costs.Differences in wage rates between this country and those from which we import are thus of less im-portance.By contrast, materials now account for a larger proportion of the total. Sprays and fertilisers have
risen from 12 per cent to 21 per cent. Seed has increased from 2 per cent to 5 per cent of the total due
to the introduction of pelleted and monogerm seed. The increased expenditure on sprays and seed isto a large extent a substitute for labour.Changes in labour requirements are shown more precisely in Figure 2.2. Overall, man hours per
acre have dropped from 200 to 36. The steepest fall is in harvesting from 89 to 10. As mentioned else-where, this is due to mechanisation, particularly since 1954. Although the total is still falling, thefigure is now so small that further economies are bound to be small. Man hours for thinning havefallen from 32 to 13. This item will undoubtedly decline further as techniques now coming into useare perfected.
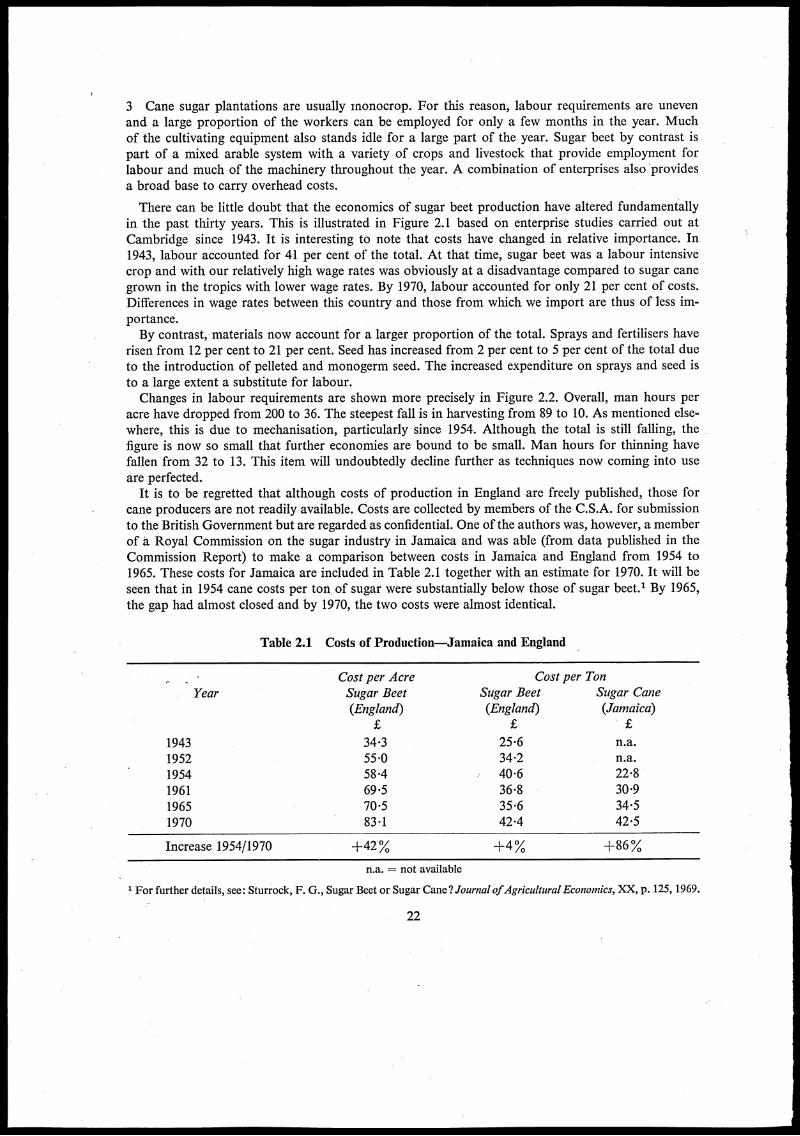
It is to be regretted that although costs of production in England are freely published, those forcane producers are not readily available. Costs are collected by members of the C.S.A. for submissionto the British Government but are regarded as confidential. One of the authors was, however, a memberof a Royal Commission on the sugar industry in Jamaica and was able (from data published in theCommission Report) to make a comparison between costs in Jamaica and England from 1954 to1965. These costs for Jamaica are included in Table 2.1 together with an estimate for 1970. It will beseen that in 1954 cane costs per ton of sugar were substantially below those of sugar beet.' By 1965,the gap had almost closed and by 1970, the two costs were almost identical.
Table 2.1 Costs of Production—Jamaica and England
Cost per Acre Cost per TonYear Sugar Beet Sugar Beet Sugar Cane
(England) (England) (Jamaica)£ £ £
1943 34.3 25.6 n.a.1952 55.0 34-2 n.a.1954 58.4 40.6 22.81961 69.5 36.8 30.91965 70.5 35.6 34.51970 83.1 42.4 42.5
Increase 1954/1970 +42% +4% +86%
n.a. = not available
1 For further details, see: Sturrock, F. G., Sugar Beet or Sugar Cane? Journal of Agricultural Economics, XX, p. 125, 1969.
22
The reason is that although costs per acre in England had increased by 42 per cent since 1954, this waslargely offset by an increase in yield of 36 per cent. In consequence, costs per ton increased by only4 per cent. In Jamaica, costs of wages and other items increased substantially and as yields were almoststatic, costs per ton increased by 86 per cent.These costs are for growing, harvesting and transporting the two crops to the factory gate. Apart
from the fact that cane is crushed with rollers and the beet is sliced, the extraction process is similar.As already mentioned, however, imported cane sugar requires an extra stage in refining as it has tobe shipped to this country. These two items (which do not apply to beet sugar) add about £6 per tonto the cost of cane sugar. It is thus apparent that beet sugar grown in England costs appreciably lessthan cane sugar delivered to this country from Jamaica.
This is, of course, a comparison with only one country. Costs in developed cane producing countriessuch as Australia and South Africa are believed to be less than in Jamaica. As we are joining theCommon Market, however, it seems unlikely that we shall be able to continue to import sugar fromAustralia except with a large levy. On the other hand, we may be able to continue to import suppliesfrom the West Indies and other undeveloped Commonwealth countries.
The Place of Sugar Beet in British Farming
As is well known, the area of sugar beet that a farmer can grow depends on his contract with theBritish Sugar Corporation. Many farmers would willingly grow more if they had the opportunitybecause the crop is one of the most profitable on the arable farm. In particular, it has a much highergross margin (say £75 per acre) than barley (say £30). It thus follows that a change from barley tosugar beet would increase returns by £45 per acre provided there were no increase in fixed costs.
There is in fact very little evidence that fixed costs would be appreciably increased by growing moresugar beet. None of the farmers on this survey who wished to grow more sugar beet would have em-ployed more labour and nearly all of them had harvesters and seed drills large enough to deal with theextra acreage they desired. Ten per cent of the farmers stated that they would change their equipmentbut most of this would take place in any case. Additional costs for the wear and tear of tractors andother equipment while working on beet will be largely balanced by savings on cultivating cereals orother crops displaced. The addition to fixed costs is thus likely to be minimal. Farmers are thus ableto recover in increased profits, most of the differences in Gross Margins between sugar beet and othercrops such as cereals—and they are well aware of this fact.
Quite apart from profit per acre, there are other advantages in growing sugar beet that should betaken into account:-
1 The proportion of cereals on arable farms has been increasing rapidly in the last twenty years.Farmers who at one time would have hesitated to grow one cereal crop after another commonlygrow two, three or more in succession. There are even attempts to grow barley continuously and totake winter wheat after winter wheat, thus leaving very little gap between one crop and the next.This has led to an increase in disease and even when resistant varieties are bred, there is a constantdanger that new strains of pathogens will appear that can overcome this resistance. The tendancy togrow more grain crops is likely to be reinforced by the expected increase in cereal prices when we jointhe E.E.C.The arable areas of England are thus in urgent need of profitable break crops to allow the soil a
rest between cereal crops. Apart from vegetables which can be grown in only a limited area, the mostprofitable break crops are sugar beet and potatoes. The demand for potatoes is, however, tendingto decline. The other alternatives are beans or leys which are much less profitable than sugar beetand generally less profitable than cereals. Oilseed rape is likely to become more profitable if we jointhe Common Market but will be less so than sugar beet. It is also believed to harbour sugar beet eel-worm which makes it less suitable for a grower who already has some sugar beet.
23
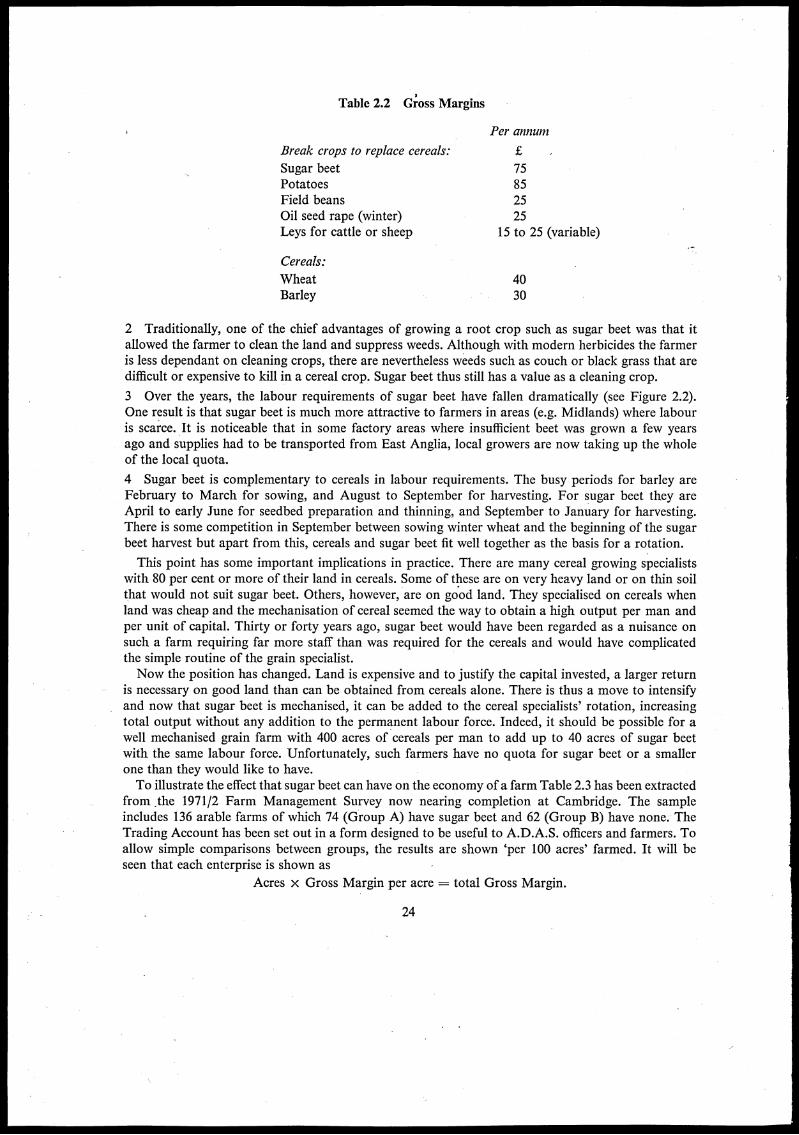
Table 2.2 Gross Margins
Per annum
Break crops to replace cereals:
Sugar beet 75Potatoes 85Field beans 25Oil seed rape (winter) 25Leys for cattle or sheep 15 to 25 (variable)
Cereals:
WheatBarley
4030
2 Traditionally, one of the chief advantages of growing a root crop such as sugar beet was that itallowed the farmer to clean the land and suppress weeds. Although with modern herbicides the farmeris less dependant on cleaning crops, there are nevertheless weeds such as couch or black grass that aredifficult or expensive to kill in a cereal crop. Sugar beet thus still has a value as a cleaning crop.
3 Over the years, the labour requirements of sugar beet have fallen dramatically (see Figure 2.2).One result is that sugar beet is much more attractive to farmers in areas (e.g. Midlands) where labouris scarce. It is noticeable that in some factory areas where insufficient beet was grown a few yearsago and supplies had to be transported from East Anglia, local growers are now taking up the wholeof the local quota.
4 Sugar beet is complementary to cereals in labour requirements. The busy periods for barley areFebruary to March for sowing, and August to September for harvesting. For sugar beet they areApril to early June for seedbed preparation and thinning, and September to January for harvesting.There is some competition in September between sowing winter wheat and the beginning of the sugarbeet harvest but apart from this, cereals and sugar beet fit well together as the basis for a rotation.
This point has some important implications in practice. There are many cereal growing specialistswith 80 per cent or more of their land in cereals. Some of these are on very heavy land or on thin soilthat would not suit sugar beet. Others, however, are on good land. They specialised on cereals whenland was cheap and the mechanisation of cereal seemed the way to obtain a high output per man andper unit of capital. Thirty or forty years ago, sugar beet would have been regarded as a nuisance onsuch a farm requiring far more staff than was required for the cereals and would have complicatedthe simple routine of the grain specialist.Now the position has changed. Land is expensive and to justify the capital invested, a larger return
is necessary on good land than can be obtained from cereals alone. There is thus a move to intensifyand now that sugar beet is mechanised, it can be added to the cereal specialists' rotation, increasingtotal output without any addition to the permanent labour force. Indeed, it should be possible for awell mechanised grain farm with 400 acres of cereals per man to add up to 40 acres of sugar beetwith the same labour force. Unfortunately, such farmers have no quota for sugar beet or a smallerone than they would like to have.To illustrate the effect that sugar beet can have on the economy of a farm Table 2.3 has been extracted
from ,the 1971/2 Farm Management Survey now nearing completion at Cambridge. The sampleincludes 136 arable farms of which 74 (Group A) have sugar beet and 62 (Group B) have none. TheTrading Account has been set out in a form designed to be useful to A.D.A.S. officers and farmers. Toallow simple comparisons between groups, the results are shown 'per 100 acres' farmed. It will beseen that each enterprise is shown as
Acres x Gross Margin per acre = total Gross Margin.
24
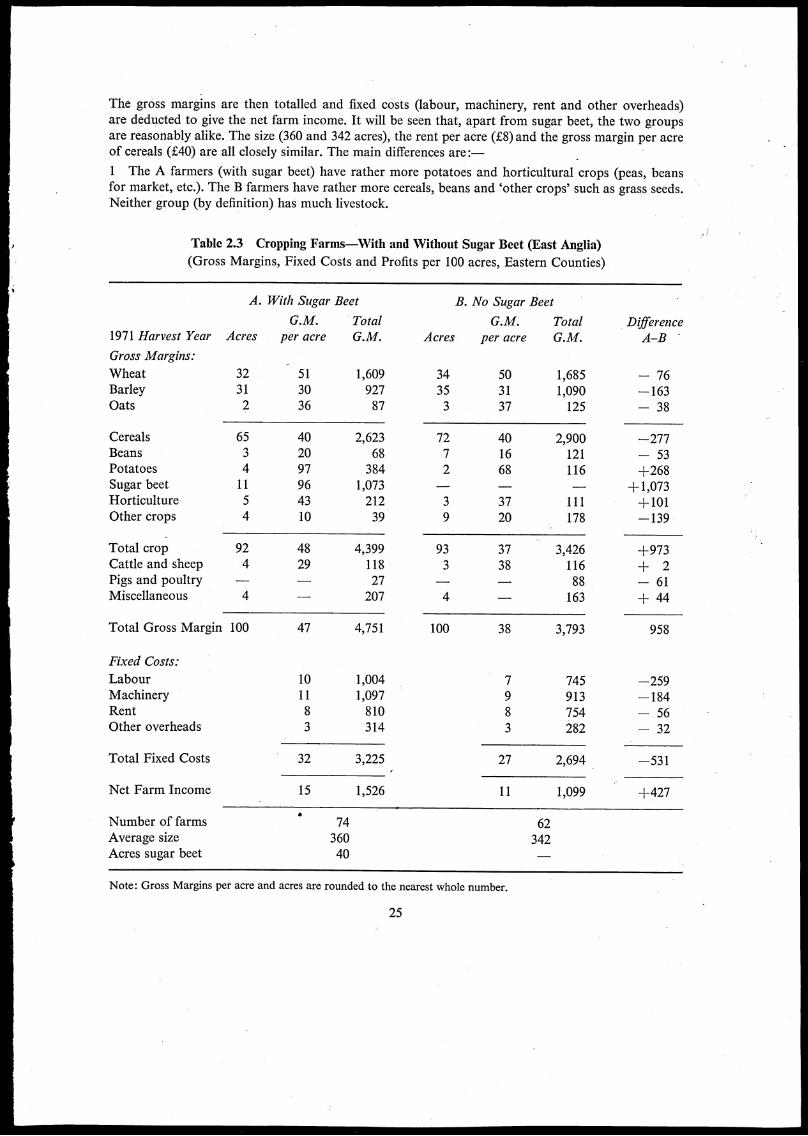
The gross margins are then totalled and fixed costs (labour, machinery, rent and other overheads)are deducted to give the net farm income. It will be seen that, apart from sugar beet, the two groupsare reasonably alike. The size (360 and 342 acres), the rent per acre (£8) and the gross margin per acreof cereals (£40) are all closely similar. The main differences are
The A farmers (with sugar beet) have rather more potatoes and horticultural crops (peas, beansfor market, etc.). The B farmers have rather more cereals, beans and 'other crops' such as grass seeds.Neither group (by definition) has much livestock.
Table 2.3 Cropping Farms—With and Without Sugar Beet (East Anglia)(Gross Margins, Fixed Costs and Profits per 100 acres, Eastern Counties)
A. With Sugar Beet B. No Sugar Beet
G.M. Total G.M. Total Dfference1971 Harvest Year Acres per acre G.M. Acres per acre G.M. A—B -
Gross Margins: _Wheat 32 51 1,609 34 50 1,685 — 76Barley 31 30 927 35 31 1,090 —163Oats 2 36 87 3 37 125 — 38
Cereals 65 40 2,623 72 40 2,900 —277Beans 3 20 68 7 16 121 — 53Potatoes 4 97 384 2 68 116 +268Sugar beet 11 96 1,073 — +1,073Horticulture 5 43 212 3 37 111 +101Other crops 4 10 39 9 20 178 —139
Total crop 92 48 4,399 93 37 3,426 +973Cattle and sheep 4 29 118 3 38 116 ± 2Pigs and poultry — 27 88 — 61Miscellaneous 4 207 4 163 ± 44
Total Gross Margin 100 47 4,751 100 38 3,793 958
Fixed Costs:
Labour 10 1,004 7 745 —259Machinery 11 1,097 9 913 —184Rent 8 810 8 754 — 56Other overheads 3 314 3 282 — 32
Total Fixed Costs 32 3,225 27 2,694 —531
Net Farm Income 15 1,526 11 1,099 +427
Number of farms 74 62Average size 360 342Acres sugar beet 40 —
Note: Gross Margins per acre and acres are rounded to the nearest whole number.
25

2 In total, Group A has a total gross margin of £4,751 compared to £3,793 for Group B. This dif-ference (£958) is largely accounted for by the contribution of sugar beet (£1,073) to Group A. Theseare, of course, the results for only one year and one in which yields and returns for sugar beet andwheat were above average. As prices for these products are higher in the E.E.C., the gross marginsare however nearer the levels to be expected if we join that organisation.
3 The A farmers being more intensive spend £531 more on fixed costs—principally on labour andmachinery. On balance, the profit of the A farms is £427 per 100 acres or 39 per cent more than theB farms. A large part of this is attributable to the sugar beet.
4 These are averages. Nonetheless, they portray fairly accurately the organisation of the two farmtypes of most interest in sugar beet growing. Type A would be classified by the M.A.F.F. as 'GeneralCropping' and 88 per cent of such farms in the Eastern Region grow sugar beet. Type B would beclassified as 'Mostly Cereals' and 57 per cent of those in the Eastern Region do not grow sugar beet.
5 Many of the B farms would welcome a contract for sugar beet. Would they then resemble the GroupA farms? Not in every particular. The B farms, for example, carry about one man less per farm butwould be most unlikely to recruit extra workers simply to grow sugar beet. With a contract for, say,30 acres of sugar beet replacing cereals, the extra gross margin might be no more than £1,200 whichwould be swallowed up by the wages of a man and the upkeep of a beet harvester. There can be littledoubt that such farmers would contract for only as much beet as could be managed by existing staff.To do so, they might simplify farm systems by giving up some minor crops such as potatoes, whoseharvesting conflicts with sugar beet and grass seeds which are less profitable. With a good break cropsuch as sugar beet, they would be tempted by high E.E.C. prices to try to grow more wheat. In thesecircumstances, the B farms would be fully as profitable as the A farms.
The Effect on the Output of Agriculture
Another point of more general interest, is whether an increase in sugar beet would imply a reductionin other output. Most farmers on this survey who wished to grow more beet stated that it woulddisplace barley. If we assume an increase of 100,000 acres, this would mean a reduction of 2 per centin the present barley acreage of 5m. in England and Wales. This is negligible. It is moreover argueablethat the beneficial effect on yields of cereals following sugar beet could well result in no net reductionin the output of cereals.'
If this is true, then an increase in sugar beet would be a net addition to the agricultural outputof this country. In addition, each acre of sugar beet would furnish 1.3 tons of sugar beet pulp with afeeding value of 11 tons of barley.
There would also be up to 12 tons of tops suitable for feeding. If half of this were fed, this wouldbe worth the equivalent of up to 10 cwt. of barley. Sugar beet pulp and tops are, of course, mostsuitable for sheep or cattle. Nonetheless, the by products of sugar beet produce nearly as much fodderfor cattle or sheep as the barley displaced—in addition to sugar for human consumption.
It is possible that some farmers growing both potatoes and sugar beet might give up potatoes andconcentrate on sugar beet. This could save the farmer from the need to carry two different types ofharvesting and other equipment. This need not result in a reduction in potatoes grown because thereare other farmers who would grow more potatoes if they were not restricted. Indeed, there might besome advantage if the south east of England concentrated rather more on sugar beet and left some ofthe potato acreage to their colleagues further north—for example; at Cupar to compensate for theloss of their sugar beet factory.
1 If an arable farmer with 70% of his arable land in cereals increased his quota of sugar beet from 8% to 10%, this wouldmean a reduction of cereals to 68 %. An increase in cereal yields of 3 %, say from 32 cwt. to 33 cwt. per acre, wouldgive the same total yield of barley.
26

So far, the effect of increasing the acreage of sugar beet has been stated in husbandry terms. It isperhaps worth restating the implications in conventional economic terms. Under conditions of freecompetition, the size and combination of crops on arable farms will tend towards an optimum.Farmers would therefore tend to include the acreage of sugar beet that most efficiently utilises the land,labour and capital available. Under present conditions, farmers are prevented from reaching thislevel. If the present restrictions on sugar beet were relaxed, cropping plans would move towards anoptimum leading to more efficient uses of' resources. On theoretical grounds, therefore, one wouldexpect the marginal costs of the additional output of sugar to be low. It would not be difficult todemonstrate this point with a series of programmed models.
British Sugar Beet in the E.E.C.
Sugar is the only crop in the E.E.C. for which production is restricted. At present the British farmeris restricted to the acreage named in his contract and he can send to the factory whatever tonnage hecan grow on this area. In the E.E.C., the farmer is virtually restricted to a quantity of sugar. This isdone by giving the farmer a basic quota of so many tons at, say, 16 per cent sugar. If the sugar contentis high, say 17 per cent, the basic quota is reduced and if the sugar content is low, the quota is raisedThere are some further points:-
1 The farmer receives the full price for his basic quota. If he exceeds the quota by up to 35 per cent,he receives a lower price for the excess. No payment is necessarily made for beet exceeding the quotaby 35 per cent.
2 Carriage is normally paid by the factory and the farmer receives a free quota of sugar beet pulp.
Although there is a quota of sugar for each country, there is some latitude in the way in which theregulations are applied within each country. A few examples based on the German regulations aregiven to show how the British farmer might be expected to fare under such regulations. These arehowever merely illustrative because details for this country have still to be decided.
Table 2.4 Comparison of Sugar Beet Receipts under U.K. and E.E.C. Regulations
Assume that a farmer is given a basic quota of 1,000 tons and a maximum quota of 1,350 tons (135% of basic quota)
Farmers' Receipts under E.E.C. Conditions:—Weight of sugar beet grown
Receipts(a) Basic quota
(b) Basic to maximum quota
Value of dried pulp'Average receipts per ton
Quota Not ExceededAverage LowSugar Sugar
HighSugar
16% 15-5% 17%1,000 tons 1,000 tons 1,000 tons
1,000 tons 1,000 tons 900 tons@ £7-48 @7145 @E815
100 tons@ £4-40
950 950 9508-43 8-09 8-72
Quota Exceeded (Sugar 16%)
By 10%, By 35% By 50%,1,100 tons 1,350 tons 1,500 tons
• 1,000 tons 1,000 tons 1,000 tons@ £7-48 @ £7-48 @ £7-48100 tons 350 tons 350 tons3@440 @440 @E4401,040 1,220 1,2208-15 7-58 6-83
Total receipts E.E.C.Total receipts U.K.2
£8,430 £8,095£7,000 £6,640
£8,725 £8,960 £10,240 £10,240£7,720
U.K. price £8-0 per ton at 16% (±9% per 1% sugar content)
Price source: M.A.F.F. translation of a German Contract and April 1972 price agreements.
'Dried pulp-4.75% of weight of crop @ E20.2 Transport. El per ton clean beet deducted from U.K. receipts.3 150 tons exceed quota so are not necessarily purchased.
27
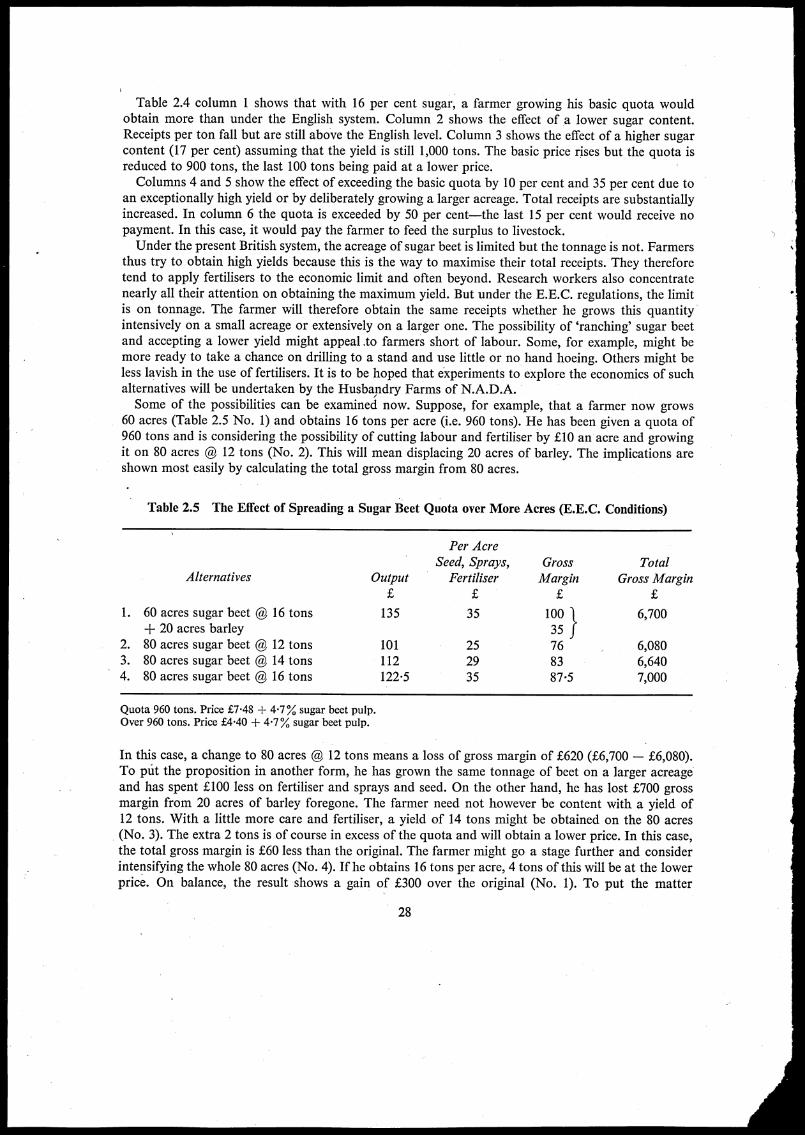
Table 2.4 column 1 shows that with 16 per cent sugar, a farmer growing his basic quota wouldobtain more than under the English system. Column 2 shows the effect of a lower sugar content.Receipts per ton fall but are still above the English level. Column 3 shows the effect of a higher sugarcontent (17 per cent) assuming that the yield is still 1,000 tons. The basic price rises but the quota isreduced to 900 tons, the last 100 tons being paid at a lower price.Columns 4 and 5 show the effect of exceeding the basic quota by 10 per cent and 35 per cent due to
an exceptionally high yield or by deliberately growing a larger acreage. Total receipts are substantiallyincreased. In column 6 the quota is exceeded by 50 per cent—the last 15 per cent would receive nopayment. In this case, it would pay the farmer to feed the surplus to livestock.Under the present British system, the acreage of sugar beet is limited but the tonnage is not. Farmers
thus try to obtain high yields because this is the way to maximise their total receipts. They thereforetend to apply fertilisers to the economic limit and often beyond. Research workers also concentratenearly all their attention on obtaining the maximum yield. But under the E.E.C. regulations, the limitis on tonnage. The farmer will therefore obtain the same receipts whether he grows this quantityintensively on a small acreage or extensively on a larger one. The possibility of 'ranching' sugar beetand accepting a lower yield might appeal ,to farmers short of labour. Some, for example, might bemore ready to take a chance on drilling to a stand and use little or no hand hoeing. Others might beless lavish in the use of fertilisers. It is to be hoped that experiments to explore the economics of suchalternatives will be undertaken by the Husbapdry Farms of N.A.D.A.Some of the possibilities can be examined now. Suppose, for example, that a farmer now grows
60 acres (Table 2.5 No. 1) and obtains 16 tons per acre (i.e. 960 tons). He has been given a quota of960 tons and is considering the possibility of cutting labour and fertiliser by £10 an acre and growingit on 80 acres @ 12 tons (No. 2). This will mean displacing 20 acres of barley. The implications areshown most easily by calculating the total gross margin from 80 acres.
Table 2.5 The Effect of Spreading a Sugar Beet Quota over More Acres (E.E.C. Conditions)
Alternatives
1. 60 acres sugar beet @ 16 tons± 20 acres barley
2. 80 acres sugar beet @ 12 tons3. 80 acres sugar beet @ 14 tons4. 80 acres sugar beet @ 16 tons
Output
135
101112122-5
Per AcreSeed, Sprays,
Fertiliser
35
252935
Gross TotalMargin Gross Margin
100 1 6,7003576 6,08083 6,64087.5 7,000
Quota 960 tons. Price £7.48 + 4.7% sugar beet pulp.Over 960 tons. Price £4.40 + 4.7% sugar beet pulp.
In this case, a change to 80 acres @ 12 tons means a loss of gross margin of £620 (£6,700 — £6,080).To put the proposition in another form, he has grown the same tonnage of beet on a larger acreageand has spent £100 less on fertiliser and sprays and seed. On the other hand, he has lost £700 grossmargin from 20 acres of barley foregone. The farmer need not however be content with a yield of12 tons. With a little more care and fertiliser, a yield of 14 tons might be obtained on the 80 acres(No. 3). The extra 2 tons is of course in excess of the quota and will obtain a lower price. In this case,the total gross margin is £60 less than the original. The farmer might go a stage further and considerintensifying the whole 80 acres (No. 4). If he obtains 16 tons per acre, 4 tons of this will be at the lowerprice. On balance, the result shows a gain of £300 over the original (No. 1). To put the matter
28
in another way, the first 60 acres obtains a gross margin of £100 per acre as in case 1. This uses up thequota and the beet from additional acres can be sold for only £4.40 per ton. Allowing for the pulp,this is equivalent to a gross margin of £50 per acre—only £15 more than the barley displaced. The netgain is thus 20 acres x £15 = £300.There are, however, other possible benefits from growing a larger area of sugar beet. If the farmer•
could follow the extra 20 acres of sugar beet by wheat instead of barley (say, an extra £10 gross marginper acre = £200) and if an additional break crop produced increases in yield elsewhere in the rotation,this could be added to the returns for cases 2, 3 and 4.
29
CHAPTER 3
The Feasibility of Increasing Sugar Production
The Scope for Increased Production
If more sugar beet is grown in this country, where is this likely to be? There are three possibilities:-
1 Many existing growers would like to grow more.2 Many farmers near the existing factories with no contract would like to grow the crop.
3 A new factory could be erected in an area suitable for the crop.
Existing Growers
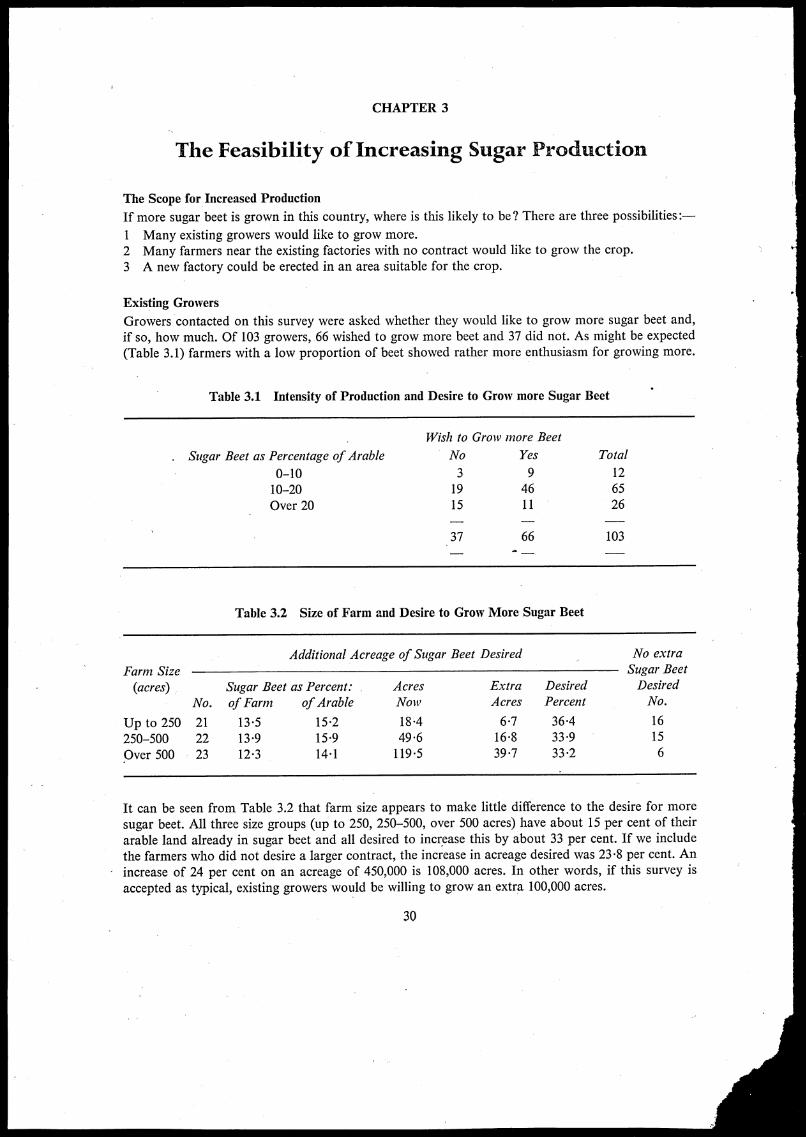
Growers contacted on this survey were asked whether they would like to grow more sugar beet and,
if so, how much. Of 103 growers, 66 wished to grow more beet and 37 did not. As might be expected
(Table 3.1) farmers with a low proportion of beet showed rather more enthusiasm for growing more.
Table 3.1 Intensity of Production and Desire to Grow more Sugar Beet
Wish to Grow more Beet
Sugar Beet as Percentage of Arable No
0-10 310-20 19Over 20 15
37
Yes
94611
66
Total
126526
103
Table 3.2 Size of Farm and Desire to Grow More Sugar Beet
Additional Acreage of Sugar Beet Desired No extra
Farm Size Sugar Beet
(acres) Sugar Beet as Percent: Acres Extra Desired Desired
No. of Farm of Arable Now Acres Percent No.
Up to 250 21 13.5 152 18.4 6.7 36.4 16
250-500 22 139 15.9 49.6 16.8 33.9 15
Over 500 23 12.3 141 119.5 39.7 33.2 6
It can be seen from Table 3.2 that farm size appears to make little difference to the desire for more
sugar beet. All three size groups (up to 250, 250-500, over 500 acres) have about 15 per cent of their
arable land already in sugar beet and all desired to increase this by about 33 per cent. If we include
the farmers who did not desire a larger contract, the increase in acreage desired was 23.8 per cent. An
increase of 24 per cent on an acreage of 450,000 is 108,000 acres. In other words, if this survey is
accepted as typical, existing growers would be willing to grow an extra 100,000 acres.
30
New Growers Near Existing Factories
An estimate of the number of growers willing to start growing sugar beet can be derived from theFarm Classification carried out by the Ministry of Agriculture? Fisheries and Food. The types offarm already growing beet are shown in Table 3.3.
Table 3.3 Types of Farm Growing Sugar Beet (England and Wales)
Farm Type
General CroppingCropping, mostly cerealsMixedGeneral horticulturePart time holdingsMainly dairyPigs and poultryOthers
No.Farms
9,5931,8241,4781,4324,286553526488
Farmers with Sugar Beet
Sugar Beet S.B. perAcres Farm Acres
309,165 32-242,494 23336,052 24.423,366 16-316,077 3-78,092 14.68,500 16-26,314 12-9
Percentwith S.B.
65-620111-915.04-22-89-408
All farms
No. AverageFarms Size
14,619 2659,053 35012,471 2359,571 53
100,879 2519,960 1615,620 74
57,779 124
20,180 450,060 22-3 8-8 229,952 103
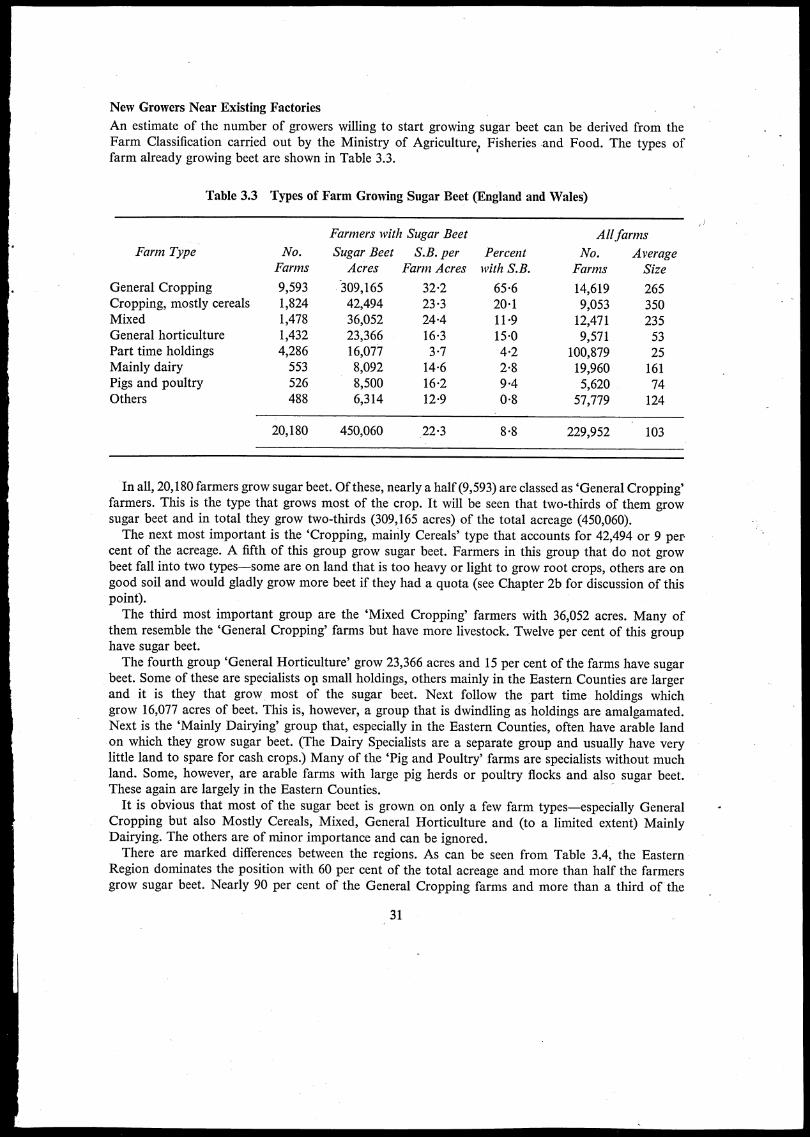
In all, 20,180 farmers grow sugar beet. Of these, nearly a half (9,593) are classed as 'General Cropping'farmers. This is the type that grows most of the crop. It will be seen that two-thirds of them growsugar beet and in total they grow two-thirds (309,165 acres) of the total acreage (450,060).The next most important is the 'Cropping, mainly Cereals' type that accounts for 42,494 or 9 per
cent of the acreage. A fifth of this group grow sugar beet. Farmers in this group that do not growbeet fall into two types—some are on land that is too heavy or light to grow root crops, others are ongood soil and would gladly grow more beet if they had a quota (see Chapter 2b for discussion of thispoint).The third most important group are the 'Mixed Cropping' farmers with 36,052 acres. Many of
them resemble the 'General Cropping' farms but have more livestock. Twelve per cent of this grouphave sugar beet.The fourth group 'General Horticulture' grow 23,366 acres and 15 per cent of the farms have sugar
beet. Some of these are specialists on small holdings, others mainly in the Eastern Counties are largerand it is they that grow most of the sugar beet. Next follow the part time holdings whichgrow 16,077 acres of beet. This is, however, a group that is dwindling as holdings are amalgamated.Next is the 'Mainly Dairying' group that, especially in the Eastern Counties, often have arable landon which they grow sugar beet. (The Dairy Specialists are a separate group and usually have verylittle land to spare for cash crops.) Many of the Pig and Poultry' farms are specialists without muchland. Some, however, are arable farms with large pig herds or poultry flocks and also sugar beet.These again are largely in the Eastern Counties.
It is obvious that most of the sugar beet is grown on only a few farm types—especially GeneralCropping but also Mostly Cereals, Mixed, General Horticulture and (to a limited extent) MainlyDairying. The others are of minor importance and can be ignored.There are marked differences between the regions. As can be seen from Table 3.4, the Eastern
Region dominates the position with 60 per cent of the total acreage and more than half the farmersgrow sugar beet. Nearly 90 per cent of the General Cropping farms and more than a third of the
31

* Table 3.4 Types of Farm Growing Sugar Beet-by Region
. -Eastern Region
Farm TypeSugar Beet (acres)
Total Per FarmFarms Percent
With S.B. Without S.B. With S.B.
General Cropping 186,682 33.8Mostly Cereals 27,538 24-3Mixed 23,059 29.1General Horticulture 20,446 16 .2Mainly Dairying 4,046 16.2
Total (including other types) 272,301 28.2
5,523 764 881,135 1,508 43792 529 60
1,262 1,990 39249 419 37
9,652 8,382 53
Counties: Beds., Cambs., Essex, Herts., Hunts., Holland (Lincs.), Norfolk, Suffolk.Factories: Spalding, King's Lynn, Wissington, Cantley, Peterborough, Ely, Bury St. Edmunds, Ipswich, Felstead.
East Midland Region
General Cropping 68,020 33'2Mostly Cereals 10,981 22.5Mixed 4,871 21.3General Horticulture 1,249 15.4Mainly Dairying 1,205 13 .2
Total (including other types) 87,977 28.8
2,048 614 77488 1,321 27229 1,035 1881 449 1591 1,654 5
3,055 9,282 25
Counties: Derby, Leicester, Kesteven and Lindsey (Lincs.), Northants, Notts., Rutland.Factories: Brigg, Bardney, Nottingham, Newark.
West Midland Region
General Cropping 24,180 44.8Mostly Cereals 1,029 21'OMixed 5,220 23.0General Horticulture 992 27.6Mainly dairying 2,183 15.8
540 729 4349 537 8227 1,409 1436 931 4138 2,747 . 5
Total (including other types) 35,312 32.0 1,102 15,429 - 7
Counties: Cheshire, Hereford, Shropshire, Staffs., Warwick, Worcs.Factories: Allscott, Kidderminster. •
Lancashire and Yorkshire Region
General Cropping 19,422 18'9Mostly Cereals 1,696 18.4Mixed - 1,641 12.9General Horticulture 517 115Mainly Dairying 259 6.8
1,029 1,110 4892 992 8127 1,069 1145 1,279 338 2,273 2
Total (including other types) 24,054 17.4 1,385 13,289 9
Counties: Lancs., Yorks., East Riding, West Riding.Factories: York, Selby.
* These are the regions used in Farm Classification, M.A.F.F. (see frontispiece).A few farmers growing sugar beet in the Northern Region have been ignored.
32
•
General Horticulture and Mainly Dairy grow sugar beet. In the other regions listed, most of the sugarbeet is grown on General Cropping farms.From the lists of farmers not at present growing sugar beet, an estimate has been made of the number
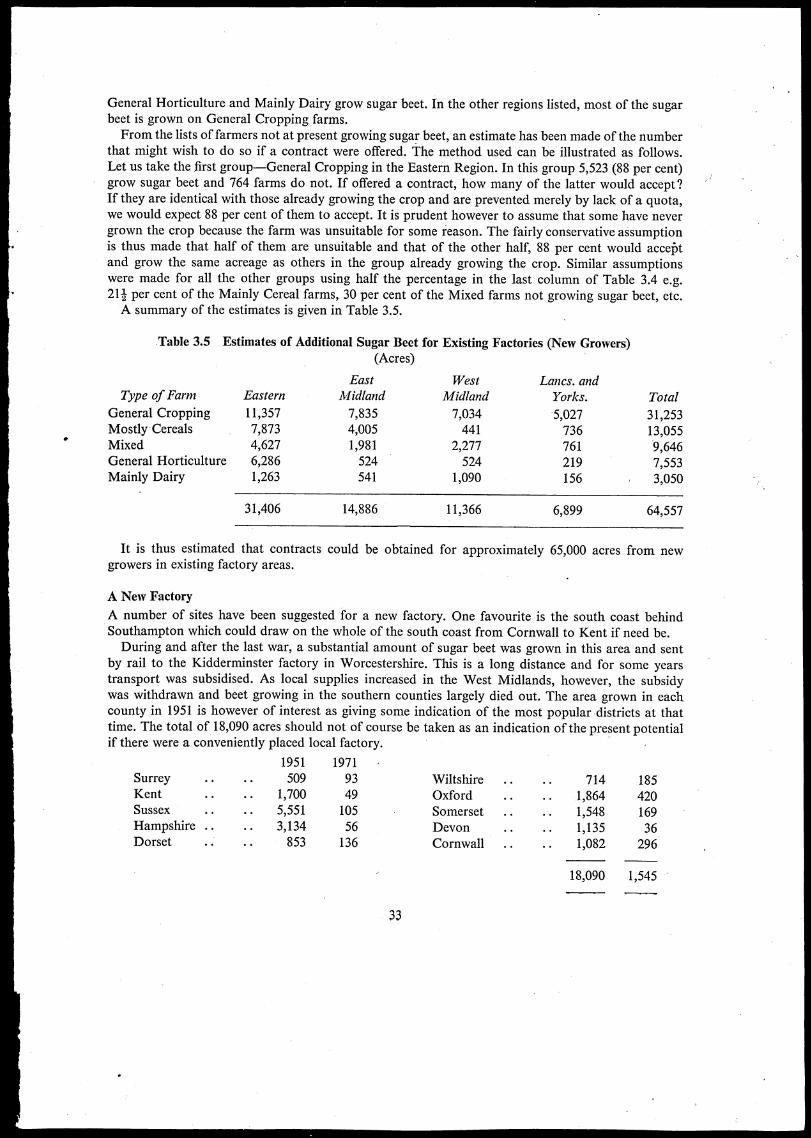
that might wish to do so if a contract were offered. The method used can be illustrated as follows.Let us take the first group-General Cropping in the Eastern Region. In this group 5,523 (88 per cent)grow sugar beet and 764 farms do not. If offered a contract, how many of the latter would accept?If they are identical with those already growing the crop and are prevented merely by lack of a quota,we would expect 88 per cent of them to accept. It is prudent however to assume that some have nevergrown the crop because the farm was unsuitable for some reason. The fairly conservative assumptionis thus made that half of them are unsuitable and that of the other half, 88 per cent would accebtand grow the same acreage as others in the group already growing the crop. Similar assumptionswere made for all the other groups using half the percentage in the last column of Table 3.4 e.g.211 per cent of the Mainly Cereal farms, 30 per cent of the Mixed farms not growing sugar beet, etc.A summary of the estimates is given in Table 3.5.
Table 3.5 Estimates of Additional Sugar Beet for Existing Factories (New Growers)(Acres)
Type of Farm
General CroppingMostly CerealsMixedGeneral HorticultureMainly Dairy
Eastern
11,3577,8734,6276,2861,263
EastMidland
7,8354,0051,981524541
WestMidland
7,034441
2,277524
1,090
Lancs. andYorks.
5,027736761219156
Total
31,25313,0559,6467,5533,050
31,406 14,886 11,366 6,899 64,557
It is thus estimated that contracts could be obtained for approximately 65,000 acres from newgrowers in existing factory areas.
A New Factory
A number of sites have been suggested for a new factory. One favourite is the south coast behindSouthampton which could draw on the whole of the south coast from Cornwall to Kent if need be.During and after the last war, a substantial amount of sugar beet was grown in this area and sent
by rail to the Kidderminster factory in Worcestershire. This is a long distance and for some yearstransport was subsidised. As local supplies increased in the West Midlands, however, the subsidywas withdrawn and beet growing in the southern counties largely died out. The area grown in eachcounty in 1951 is however of interest as giving some indication of the most popular districts at thattime. The total of 18,090 acres should not of course be taken as an indication of the present potentialif there were a conveniently placed local factory.
1951 1971Surrey • • • • 509 93 Wiltshire • • • •Kent • • • • 1,700 49 Oxford • • • •Sussex • • • • 5,551 105 Somerset • • • •Hampshire . . • • 3,134 56 Devon • • • •Dorset • • • • 853 136 Cornwall • • • •
33
714 1851,864 4201,548 1691,135 361,082 296
18,090 1,545
As break crops in the south, there are two other newcomers worth mention—maize and oilseedrape. Although they will be more profitable at E.E.C. prices neither is likely to be as profitable assugar beet on good soil.An estimate has therefore been prepared on the same lines as for new growers in existing factory
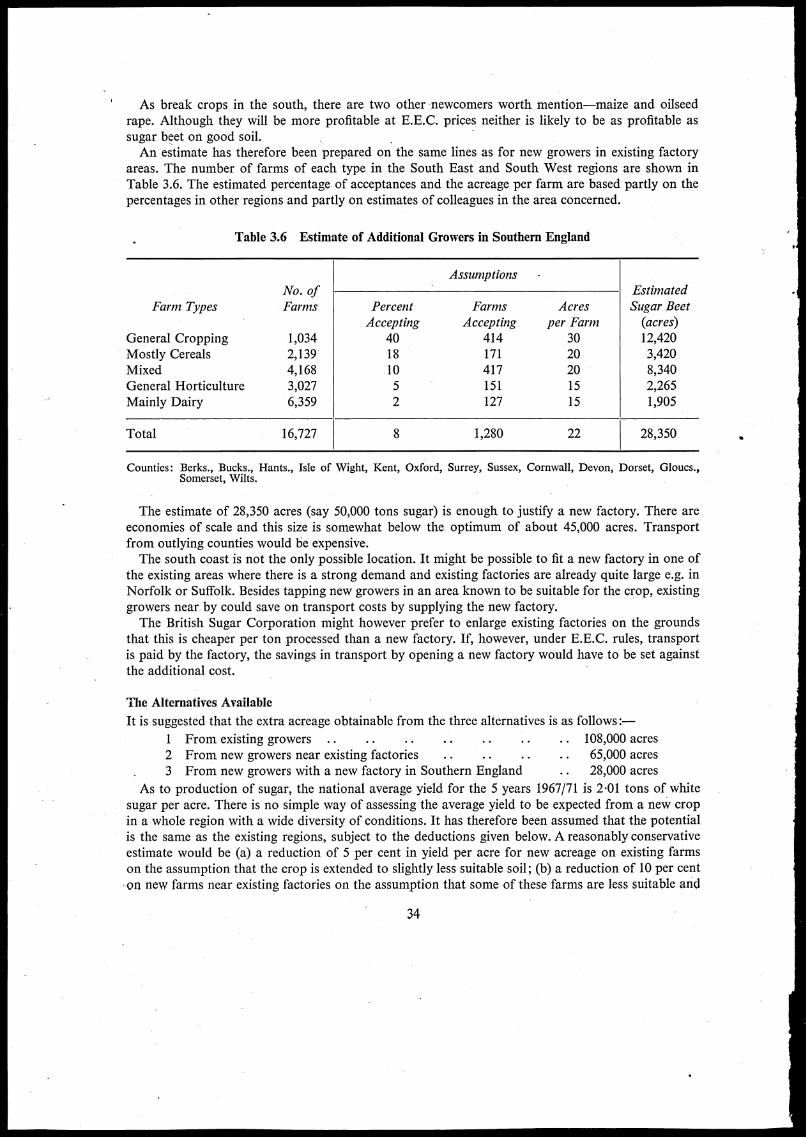
areas. The number of farms of each type in the South East and South West regions are shown inTable 3.6. The estimated percentage of acceptances and the acreage per farm are based partly on thepercentages in other regions and partly on estimates of colleagues in the area concerned.
Table 3.6 Estimate of Additional Growers in Southern England
AssumptionsNo. of Estimated
Farm Types Farms Percent Farms Acres Sugar BeetAccepting Accepting per Farm (acres)
General Cropping 1,034 40 414 30 12,420Mostly Cereals 2,139 18 171 20 3,420Mixed 4,168 10 417 20 8,340General Horticulture 3,027 5 151 15 2,265Mainly Dairy 6,359 2 127 15 1,905
Total 16,727 8 1,280 22 28,350
Counties: Berks., Bucks., Hants., Isle of Wight, Kent, Oxford, Surrey, Sussex, Cornwall, Devon, Dorset, Gloucs.,Somerset, Wilts.
The estimate of 28,350 acres (say 50,000 tons sugar) is enough to justify a new factory. There areeconomies of scale and this size is somewhat below the optimum of about 45,000 acres. Transportfrom outlying counties would be expensive.The south coast is not the only possible location. It might be possible to fit a new factory in one of
the existing areas where there is a strong demand and existing factories are already quite large e.g. inNorfolk or Suffolk. Besides tapping new growers in an area known to be suitable for the crop, existinggrowers near by could save on transport costs by supplying the new factory.The British Sugar Corporation might however prefer to enlarge existing factories on the grounds
that this is cheaper per ton processed than a new factory. If, however, under E.E.C. rules, transportis paid by the factory, the savings in transport by opening a new factory would have to be set againstthe additional cost.
The Alternatives Available
It is suggested that the extra acreage obtainable from the three alternatives is as follows:-
1 From existing growers .. • • • • • • • • • •2 From new growers near existing factories .. • • • •3 From new growers with a new factory in Southern England
.. 108,000 acres
.. 65,000 acres
.. 28,000 acres
As to production of sugar, the national average yield for the 5 years 1967/71 is 2.01 tons of whitesugar per acre. There is no simple way of assessing the average yield to be expected from a new cropin a whole region with a wide diversity of conditions. It has therefore been assumed that the potentialis the same as the existing regions, subject to the deductions given below. A reasonably conservativeestimate would be (a) a reduction of 5 per cent in yield per acre for new acreage on existing farmson the assumption that the crop is extended to slightly less suitable soil; (b) a reduction of 10 per cent
• on new farms near existing factories on the assumption that some of these farms are less suitable and
34

the growers are less experienced; (c) a reduction of 10 per cent for new growers in a new factory area.This will allow for inexperience and errors in the choice of farms and farmers to grow the crop. Onthe other hand, the best land has not yet been pre-empted. On this basis, production might be:-
1 From existing growers:108,000 acres x 1.90 tons per acre = 205,200 tons
2 From new growers near existing factories:65,000 acres x 1.80 tons per acre = 117,000 tons
3 From new growers near a new factory:28,000 acres x 1.80 tons per acre = 50,400 tons
Total 201,000 acres 372,600 tons
These totals should be compared with the Australian quota of 335,000 tons of raw or approximately308,000 tons of white sugar which these new supplies would be expected to replace.These three targets could not be attained with equal speed. Existing growers could expand their
acreage quite quickly. Farmers would realise that if they did not take up offers of increased acreage,the opportunity might not come again. New growers in existing factory areas could be recruitedfairly quickly but might require three or four years to attain full yields. They would, however, besurrounded by other experienced growers and would profit from their example.The recruiting of growers for a new factory would be the most difficult of the three. It would be
an entirely new and strange crop to most of the growers and five or six years might be required toattain either the acreage suggested or reasonable yields per acre. There are, of course, farmers in thearea who grew sugar beet twenty years ago but techniques have changed greatly since then. Indeed,the yields obtained in the South at that time would be quite uneconomic now.
While these are no more than tentative estimates, there can be little doubt that an increase of100,000 acres or even 200,000 acres of sugar could be attained without undue difficulty. A target of400,000 tons would probably be feasible.
Before erecting a new factory, it would be advisable to interview a sample survey of farmers to testdemand. It is suggested that time could be saved by concentrating on the farm types shown in thissection to be the most likely to grow the crop. In an existing factory area, such a survey would not bedifficult. Even farmers who had never grown the crop would be familiar with it. The majority of themwould probably have quite definite opinions on whether or not they would like to grow the crop. Itwould be more difficult to get reliable answers in a new area. Many farmers would prefer to waitfor a neighbour to try it first.
AN ECONOMIC APPRAISAL
It now remains to estimate the effect on the national economy of growing more sugar beet in thiscountry. This is not necessarily the same as the effect on an individual firm such as the farmer or theBritish Sugar Corporation. To give an example, the subsidy on fertilisers is a receipt so far as thefarmer is concerned. From the national point of view, however, it is a transfer payment which isomitted from the calculation. The appraisal given here is no more than tentative because very littleinformation about inputs is published either by the British Sugar Corporation or by any of the otherbodies that deal with sugar production on a national or international scale. The financial gains infavour of extending seem, however, to be large enough to cover by a substantial margin any likelyerror in the estimates made. The following are the assumptions made.
1 The Australian quota under the Commonwealth Sugar Agreement is for 335,000 tons of raw sugarwhich is purchased for £50 per ton. If this is given up when the Commonwealth Sugar Agreementexpires, there are three alternatives sources of supply:-
35
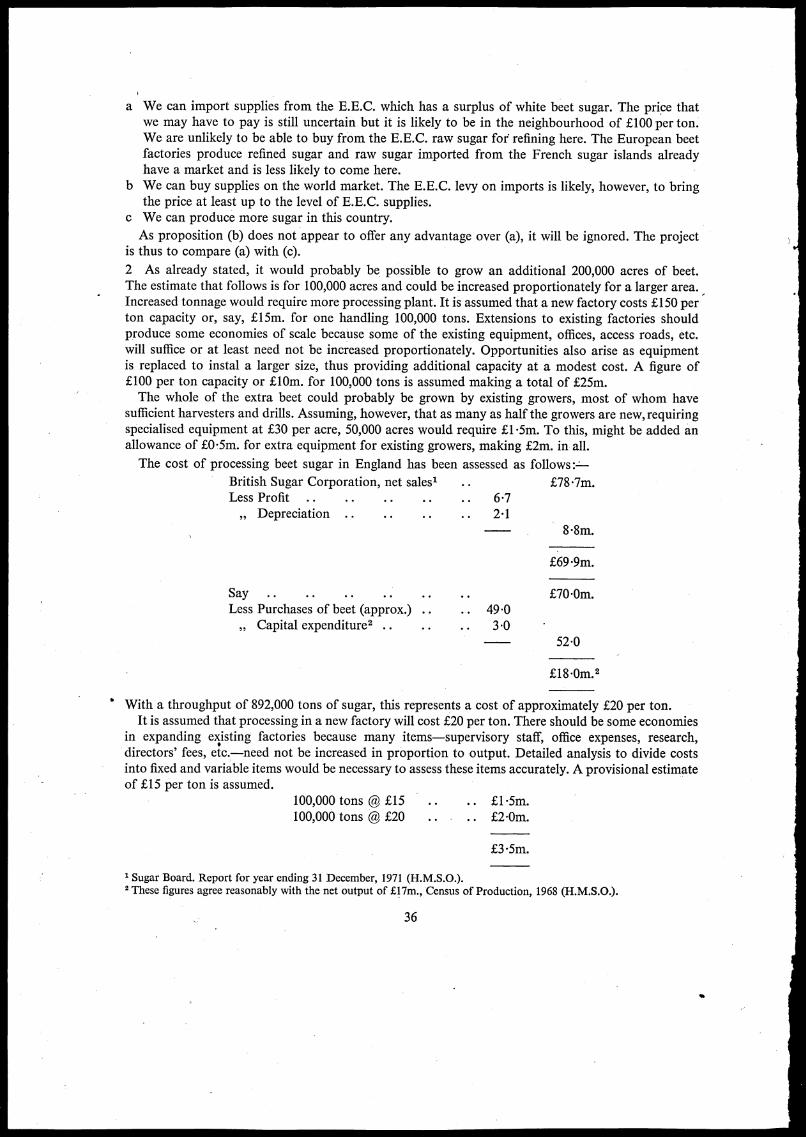
a We can import supplies from the E.E.C. which has a surplus of white beet sugar. The price thatwe may have to pay is still uncertain but it is likely to be in the neighbourhood of £100 per ton.We are unlikely to be able to buy from the E.E.C. raw sugar for refining here. The European beetfactories produce refined sugar and raw sugar imported from the French sugar islands alreadyhave a market and is less likely to come here.
b We can buy supplies on the world market. The E.E.C. levy on imports is likely, however, to bringthe price at least up to the level of E.E.C. supplies.
c We can produce more sugar in this country.As proposition (b) does not appear to offer any advantage over (a), it will be ignored. The project
is thus to compare (a) with (c).
2 As already stated, it would probably be possible to grow an additional 200,000 acres of beet.The estimate that follows is for 100,000 acres and could be increased proportionately for a larger area.Increased tonnage would require more processing plant. It is assumed that a new factory costs £150 perton capacity or, say, £15m. for one handling 100,000 tons. Extensions to existing factories shouldproduce some economies of scale because some of the existing equipment, offices, access roads, etc.will suffice or at least need not be increased proportionately. Opportunities also arise as equipmentis replaced to instal a larger size, thus providing additional capacity at a modest cost. A figure of£100 per ton capacity or £10m. for 100,000 tons is assumed making a total of £25m.The whole of the extra beet could probably be grown by existing growers, most of whom have
sufficient harvesters and drills. Assuming, however, that as many as half the growers are new, requiringspecialised equipment at £30 per acre, 50,000 acres would require £1 -5m. To this, might be added anallowance of £05m. for extra equipment for existing growers, making £2m. in all.The cost of processing beet sugar in England has been assessed as follows
British Sugar Corporation, net sales' . £78 -7m.Less Profit . . • • • • • • 6-7„ Depreciation . • • • • . . 2-1
Say . . • • • • • • • • • •Less Purchases of beet (approx.) . . 49-0
9, Capital expenditure2 . . • • 30
88m.
£.69 -9m.
£70 -Om.
52-0
£18 -0m.2
With a throughput of 892,000 tons of sugar, this represents a cost of approximately £20 per ton.It is assumed that processing in a new factory will cost £20 per ton. There should be some economies
in expanding existing factories because many items—supervisory staff, office expenses, research,directors' fees, etc.—need not be increased in proportion to output. Detailed analysis to divide costsinto fixed and variable items would be necessary to assess these items accurately. A provisional estimateof £15 per ton is assumed.
100,000 tons @ £15 . . £15m.100,000 tons @ £20 . . . . £2-0m.
£35m.
1 Sugar Board. Report for year ending 31 December, 1971 (H.M.S.0.).2 These figures agree reasonably with the net output of E17m., Census of Production, 1968 (H.M.S.0.).
36
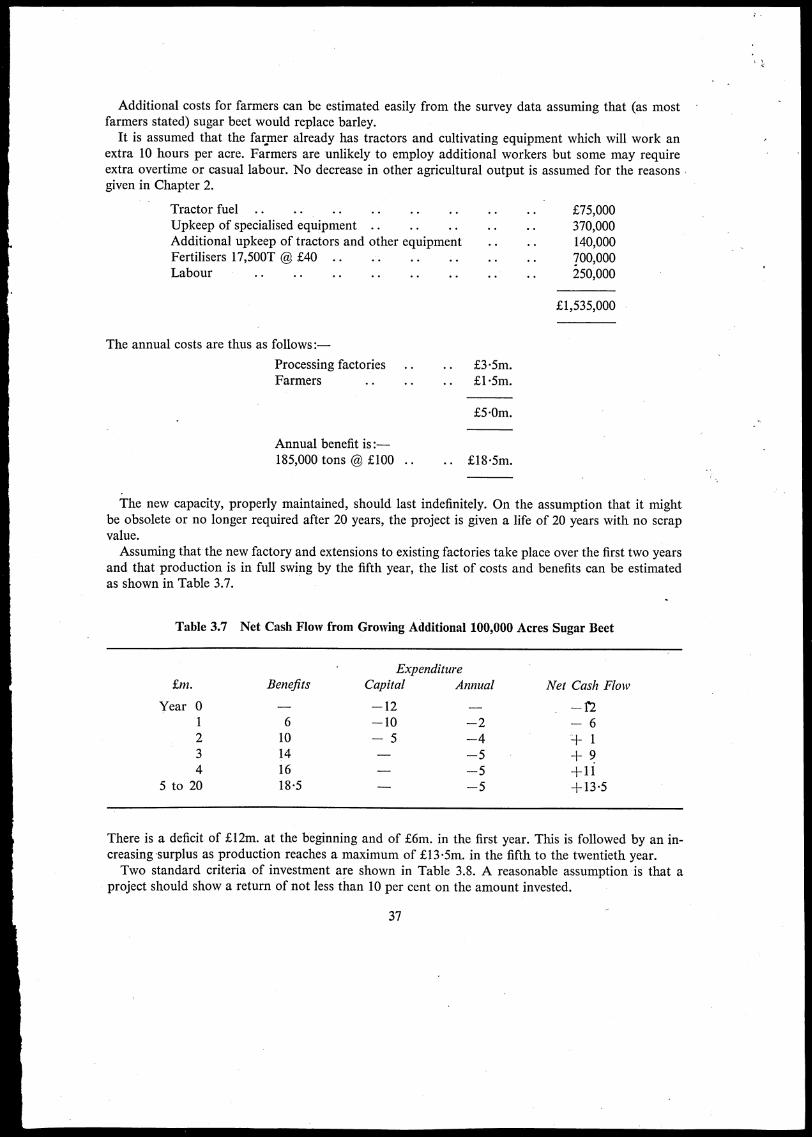
Additional costs for farmers can be estimated easily from the survey data assuming that (as mostfarmers stated) sugar beet would replace barley.
It is assumed that the farmer already has tractors and cultivating equipment which will work anextra 10 hours per acre. Farmers are unlikely to employ additional workers but some may requireextra overtime or casual labour. No decrease in other agricultural output is assumed for the reasonsgiven in Chapter 2.
Tractor fuel .. • • . • • • • • • • • • • • £75,000Upkeep of specialised equipment .. • • • • • • • • 370,000Additional upkeep of tractors and other equipment • • • • 140,000Fertilisers 17,500T @ £40 .. • • • • • • • • • • 700,000Labour • • • • • • • • • • • • • • • • 250,000
£1,535,000
The annual costs are thus as follows
Processing factories • £3-5m.Farmers • • • • • £1-5m.
£5-0m.
Annual benefit is:-185,000 tons @ £100 .. £18-5m.
The new capacity, properly maintained, should last indefinitely. On the assumption that it mightbe obsolete or no longer required after 20 years, the project is given a life of 20 years with no scrapvalue.Assuming that the new factory and extensions to existing factories take place over the first two years
and that production is in full swing by the fifth year, the list of costs and benefits can be estimatedas shown in Table 3.7.
•
Table 3.7 Net Cash Flow from Growing Additional 100,000 Acres Sugar Beet
Expenditure£m. Benefits Capital Annual Net Cash Flow
Year 0 —12 —1'21 6 —10 —2 —62 10 —5 —4 ± 13 14 —5 + 9‘4 16 —5 +11
5 to 20 185 — —5 +13-5
There is a deficit of £12m. at the beginning and of £6m. in the first year. This is followed by an in-creasing 'surplus as production reaches a maximum of £13-5m. in the fifth to the twentieth year.Two standard criteria of investment are shown in Table 3.8. A reasonable assumption is that a
project should show a return of not less than 10 per cent on the amount invested.
37

Table 3.8 I.R.R. and N.P.V. from an Additional 100,000 Acres Sugar Beet
Discounted atfm. Net Cash Flow 10% 39 %
Year 0 —12 —12 —121 —6 —5-454 —4-3172 +1 0-826 0-5183 9 6-759 3-3514 11 7-513 2-947
5 to 20 13-5 72-144 9-225
Net Present Value 69-788 —0-276
Column 2 shows that after allowing interest and writing off the investment, there is a surplus or NetPresent Value of nearly £30m. A second criterion, much favoured by the World Bank, is the InternalRate of Return (I.R.R.). This is the rate which equals benefits and costs. It will be seen from column 3that the return on capital is 39 per cent—a very high rate.One further point should be noted. This assessment assumes that the capital investment is written
off in 20 years. The factories would no doubt have a value and still be in operation after that date.The estimate of benefits is therefore a conservative one.
BALANCE OF PAYMENTS
In the appraisal just made, the benefits obviously provide a large saving of imports. What of the costs?Apart from the raw materials for fertilisers and fuel oil, the direct import element in these costs isquite small. The effect on the balance of payments of setting up such a project does, however, gowell beyond this point. Any expenditure means the diversion of resources from some other use includingthe production of goods for export. In a booming economy and indeed in a developing country whereresources are tightly stretched, the cost of inputs used for a project might represent a loss of othergoods that could be exported or could replace imports. Even on this conservative basis, it is obviousthat the saving in imports of sugar far outweighs the cost of all resources used.
If the economy is not fully stretched and resources are underemployed, different considerationsapply. If, for example, the fertiliser manufacturers are working below capacity, then the marginalcost of producing some more fertiliser might be very little more than the cost of imported raw materials.The same could apply to labour if the workers would otherwise be idle. In that case, the cost would bethe difference between their wages and social security payments.At present, there is some unemployment of men and manufacturing capacity in this country. It
could, therefore, be argued that the net cost (or shadow price) of a number of the inputs requiredfor expansion of the sugar industry could be valued at less than that stated in this appraisal. If so,the project would (to the nation as a whole) be more advantageous and give a higher return on thecapital employed than that stated.
It would, however, be difficult to estimate 'such indirect effects without a detailed analysis of theinputs required.' In any case, the amount of 'slack' in the economy might diminish substantially withinthe next year or two. Such a form of special pleading is however unnecessary because the projectappears to provide an adequate return even under conditions of full employment.
AUSTRALIAN SUGAR
Another possibility if we did not join the E.E.C. or subsequently left it is that we should substitutehome grown sugar for Australian sugar at the C.S.A. price. This project gives a return of 11 per centon capital invested. It might thus be just worthwhile to substitute home grown sugar for Australian.
38

This does not mean the British sugar costs less to produce than Australian. On the contrary, Australiansugar costs per ton are reputedly amongst the lowest in the world. This fact is however irrelevantbecause the C.S.A. price is set high enough to provide a very reasonable margin of profit to Australianproducers and at that price, British beet sugar is competitive. In fact, the advantage of changing fromAustralian to British sugar would be comparatively small. There would in theory be more advantagein changing from West Indian, Mauritian or. Fijian sugar to British home supplies because the C.S.A. ,price for them is higher than for Australian. We are, however, most unlikely to wish to deprive develop-ing Commonwealth countries of a market for their sugar.
These propositions are however of no more than academic interest. If we did not join the E.E.C.,the Commonwealth Sugar Agreement would almost certainly be continued so long as Commonwealthcountries wished it.Assuming that we do join the Common Market, there is a different aspect worth comment. If under
E.E.C. rules we cease to import sugar from Australia, this might effect our exports to that country.The point has been examined by Phillips and Ritsonl who found significant correlations between theamount of imports and exports to countries that traded heavily with this country. They found, forexample, a 'reciprocity coefficient' of 0.7 for trade with Australia and for sugar in particular of 0.5.This appears to mean that if we ceased to import £10m. of sugar from Australia, our exports toAustralia would decline by £5m.Some economists, however, are sceptical of this relationship. Indeed, if trade is relatively free between
two countries, they fail to see what mechanism could relate the actions of importers and exporterswho are usually different persons with entirely different interests. It is, however, possible if Common-wealth preferences disappear, that the Australians may tend in the long run to find new markets inAsia or America for produce that formerly came to this country. This may lead to other trade linksfor Australian imports. Such a reorientation of Australian trade may be regrettable but inevitable.Sugar exports to the U.K. which account for only 1 per cent of total Australian exports will howeverplay only a minor part in this process.
1 Phillips, S. and Ritson, C. Agricultural Expansion and the U.K. Balance of Payments. National Westminster BankReview. February, 1970.
39
Summary
Chapter 1
1 A survey of sugar beet growers covering the 1970 harvest was carried out, based on a randomsample of 104 growers, stratified in three size groups-1-20 acres, 20-50 acres and over 50 acres ofsugar beet. The costs and returns are given in detail in Table 1.1. The large units had lower yieldsand lower gross margins per acre than the medium and small.
2 It was evident that farmers with small units spent on average almost the same amount on fertilisers,seeds and sprays as the medium and larger farmers and obtained the same yields as the medium andrather better yields than the large units. Their disadvantage is that the acreage is too small to justifythe purchase of new harvesters and other equipment. They are thus more dependent on contractors,on buying second hand equipment, or on sharing equipment with neighbours.
3 Over the whole sample, the gross margin and net margin both depended heavily on yield per acre.There was no evidence that growers adopting labour saving devices such as drilling to a stand or usingherbicides to eliminate weeds suffered any loss of yield.
Chapter 2
1 There is no reason to believe that sugar beet suffers from any fundamental cost disadvantagein comparison with sugar cane. As evidence, a comparison between England and Jamaica showsthat the gap in costs per ton of sugar up to the factory gate has disappeared between 1954 and 1970.In processing and transport, sugar beet grown in this country has a natural advantage over importedcane sugar.
2 The economics of producing sugar beet have changed substantially in recent years. Man hoursper acre have fallen by 85 per cent between 1943 and 1970 and the crop is now much less labourintensive. The yield of sugar per acre has in the same period increased by 50 per cent.
3 An expansion of sugar beet would benefit British agriculture in a number of ways :—a Apart from potatoes and vegetables, it is one of the most profitable crops on the arable farm.
b The proportion of cereals has increased and is likely to increase further with higher E.E.C. prices,The practice of growing cereals after cereals on the same soil increases the risk of disease. Sugarbeet would provide a break crop which is more profitable than alternatives such as field beans,oilseed rape or leys for livestock. The only alternatives as profitable as sugar beet are potatoes,for which the market is static or declining and vegetables for which opportunities are limited.
c Sugar beet is complementary to cereal crops. The traditional reason was that it was a cleaningcrop. With the introduction of herbicides, this is a less vital factor but it is still an asset. A moreimportant aspect is that sugar beet is complementary to cereals in the use of labour. The additionof sugar beet to a cereal growing farm can thus enable the farmer to produce a larger output withthe same staff and furnish him with a larger farm income.
d An expansion of sugar beet might help to slow down the loss of farm workers to agriculture—aprocess which, if too rapid, could be damaging to the industry.
4 If more sugar beet is grown, it will displace other crops—principallrbarley. The loss of 100,000 acresamong 5 million acres of barley is however negligible and could well be compensated by increasedyields of cereal crops following sugar beet. In addition, the sugar beet pulp produced as a by productwould produce nearly as much cattle food as the barley displaced. The extra sugar produced is thuslikely to be a net increase in output.
5 If we join the E.E.C., the farmers' receipts seem likely to increase to some extent. The farmers'quota is likely to be on a tonnage not an acreage basis. The farmer would thus have a choice of growing
40
his quota intensively on a small acreage or less intensively on a larger acreage. This and the 35 percent excess at a lower, price will introduce more flexibility into farmers' plans. The factory, havingcontracted for a definite tonnage, will be able to plan the length of the processing season with moreprecision.
Chapter 3
1 If sugar production is expanded, additional acreage of beet can be obtained from three sources:
(a) existing growers; (b) new growers in existing factory areas; (c) a new factory and new growers.
2 Two-thirds of the farmers interviewed would like to grow more sugar beet. If this random sampleis accepted as representative, existing growers would be prepared to grow an extra 108,000 acres or205,000 tons of sugar.
3 An attempt was made to estimate the potential demand from new growers in existing areas. Thiswas prepared by identifying the types of farm at present growing the crop and estimating the proportionof those not growing the crop who were prevented by lack of a contract from doing so. The estimate
was 65,000 acres or 117,000 tons of sugar.
4 A similar estimate was prepared for a new factory in the south of England. This amounted to28,000 acres or 50,000 tons of sugar.
5 It would be advisable before erecting a new factory to test the demand in the area concerned.Time could be saved by concentrating on the farm types shown to be the most likely to adopt thecrop.
6 These estimates total 370,000 tons of white sugar which is more than enough to replace the AustralianC.S.A. quota of 308,000 tons (335,000 tons raw sugar).These three alternative targets could not be attained with equal speed. Existing growers could
expand their acreages quite quickly. New growers in existing areas could be recruited fairly quicklybut would require three or four years to attain reasonable yields. Recruiting for a new factory in anew area would be the most difficult of the three.
7 An attempt has been made to assess in national terms the return on the capital requiredfor 100,000 acres or 185,000 tons of white sugar. It is assumed that the alternative to growing moresugar here is to import it at £100 per ton. On a sum of £25m. for factory erection and £2m. for farmers'equipment, the Net Present Value of the investment over 20 years is £70m. The Internal Rate ofReturn is 39 per cent. These are presented as no more than tentative estimates based on this surveyand such published material as is available. The margin of advantage seems however to be large enoughto allow for contingencies.
8 This result depends on the price that would have to be paid in the E.E.C. for imported sugar. Theprice assumed is £100 per ton. With a price as low as £50 per ton, the return on investment on theassumptions made would still exceed 10 per cent.
41
Appendix
Costs Used in the Survey
Labour was charged on the basis of the annual wage plus National Insurance payments. The minimumwage rate was charged at 33p per hour (6/8-1). Other rates were calculated in the same way to arriveat rates applicable to each farm.
Tractors were charged at the following hourly rates which allow for depreciation, fuel and oil andrepairs :—
a Wheeled tractors (2 wheel drive)
1 Less than 46 b.h.p. . . • • • • £0-3 per hr.2 46.5-58.5 b.h.p. • • • • £0.35 per hr.3 Greater than 58.5 b.h.p. • • • • £0.45 per hr.
b Crawler and powerful 4 wheel drive were all charged at £0.9 per hr.
Non Specialised Machinery was charged at standard rates as follows:—
Per Acre
Ploughs • • • • £0-3
Per Hour
Cultivators.. • • • • £0.1F.Y.M. Spreader • • £0-1Harrows . . • • • • £0.3
. Fertiliser spinners • • £0.3Sprayers . . • • • • £0.45
Specialised Machines were costed individually using 20 per cent depreciation rates and including 1970repair bills. Where necessary, the costs were allocated according to total acreage covered in the year.
Seed, Fertilisers and Sprays were charged at cost. (Net of subsidy.)
Farmyard Manure was charged at £0.5 per ton. This allowed for an expected nutrient value of £1 perton to be spread over 2 years. The cost of application was also spread over 2 years.
Lime Costs. Liming materials were recorded at cost but only one-third was charged to the sugar beetcrop.
Rent was the actual amount paid per acre, or in the case of owner-occupiers, an estimate of localmarket value. Drainage rate was added where paid.
General Farm Overheads were allowed at 15 per cent of total allocated costs.
Value of, Sugar Beet Tops was excluded from the output figures used in producing statistical data,but where comments are made they have been valued at £4 per acre. This assumes a utilisation of 1 tonof tops per acre.
42
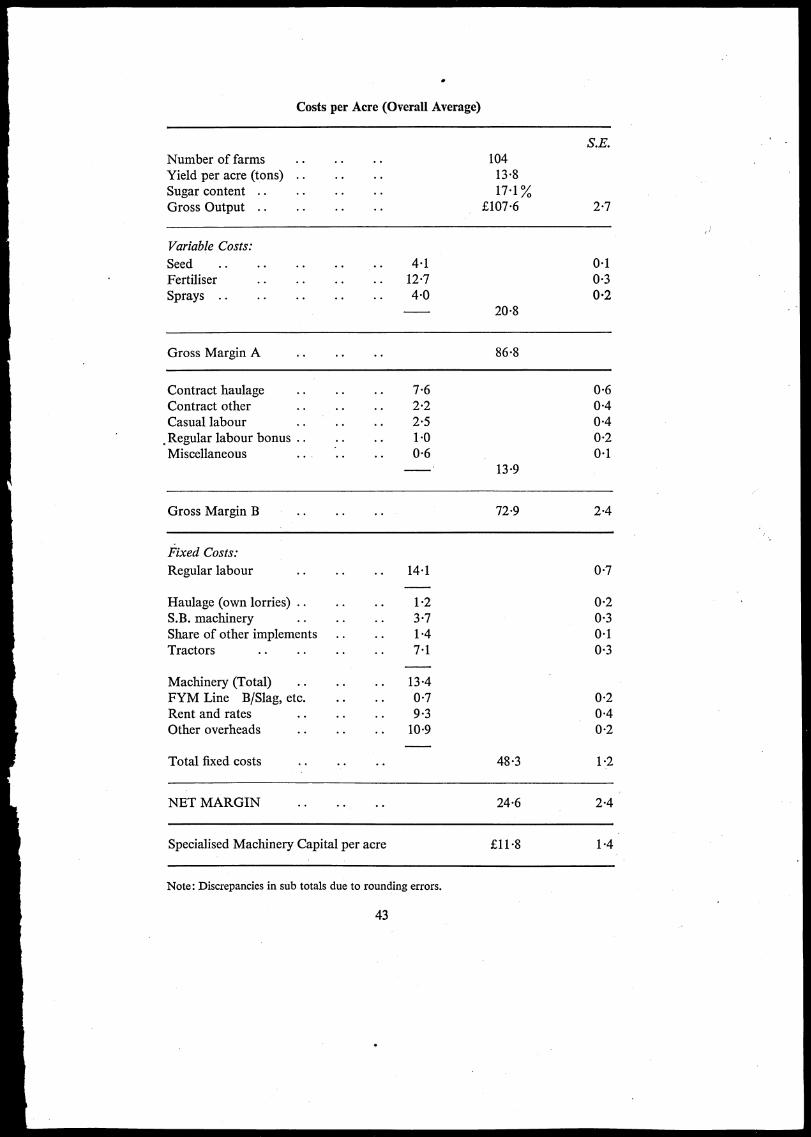
Costs per Acre (Overall Average)
Number of farms • • • • • • 104Yield per acre (tons) • • • • • • 13.8Sugar content .. • • • • • • 171 %Gross Output .. • • • • • • £107-6
S.E.
2-7
Variable Costs:
Seed .. • • • • • • 41 01Fertiliser • • • • • • .. 12.7 0.3Sprays .. • • • • • • .. 4.0 0•2
20.8
Gross Margin A • • • • • • 86-8
Contract haulage • • • • • • 7.6 0.6Contract other • • • • • • 2.2 0.4Casual labour • • • • • • 2.5 01.Regular labour bonus .. • • • • 1.0 0-2Miscellaneous • • • • • • 0.6 0.1
13.9
Gross Margin B • • 72.9 2.4
Fixed Costs:
Regular labour • • • • • • 141 0.7
Haulage (own lorries) .. • • • • 1 -2 0-2S.B. machinery • • • • • • 3.7 0.3Share of other implements .. • • 1.4 0.1Tractors • • • • • • • • 71 0.3
Machinery (Total) • • • • • • 131FYM Line B/Slag, etc. • • • • 0.7 0-2Rent and rates • • • • • • 9.3 0.4Other overheads • • • • • • 10.9 0.2
Total fixed costs • • • • 48.3 1.2
NET MARGIN 24.6 2.4
Specialised Machinery Capital per acre £11-8 1.4
Note: Discrepancies in sub totals due to rounding errors.
43
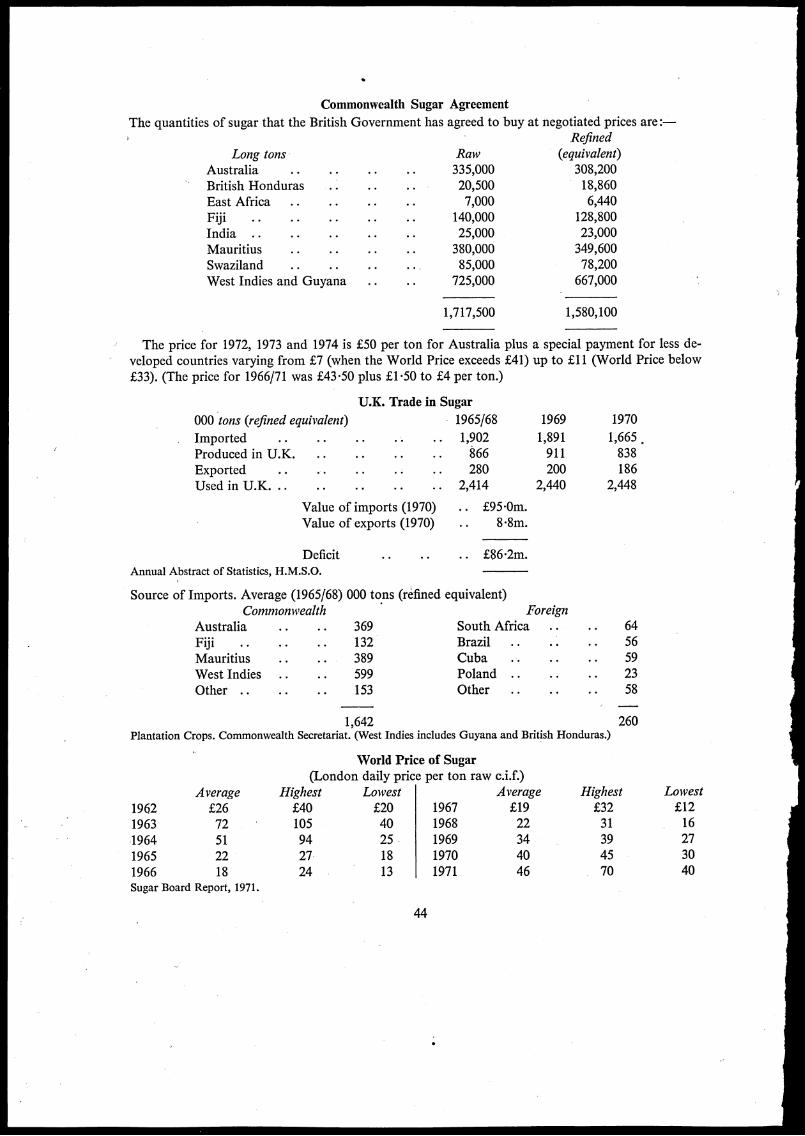
The quantities
Long tonsAustralia • •British HondurasEast AfricaFiji • •India ..MauritiusSwazilandWest Indies and Guyana
Commonwealth Sugar Agreement
of sugar that the British Government has agreed to buy at negotiated prices are:—Refined
(equivalent)•• •• •• 308,200
• • • • 18,860•• •• •• 6,440
•• •• •• •• 128,800•• •• •• •• 23,000•• •• •• •• 349,600
• • • . 78,200• • • • 667,000
Raw335,00020,5007,000
140,00025,000380,00085,000
725,000
1,717,500 1,580,100
The price for 1972, 1973 and 1974 is £50 per ton for Australia plus a special payment for less de-veloped countries varying from £7 (when the World Price exceeds £41) up to £11 (World Price below
£33). (The price for 1966/71 was £43.50 plus £1.50 to £4 per ton.)
U.K. Trade in Sugar
000 tons (refined equivalent) 1965/68
Imported • • .. • • • • • . 1,902Produced in U.K. .. • • • • .. 866Exported • • • . • • • • 280Used in U.K. — .. • • • • . • 2,414
Value of imports (1970)Value of exports (1970)
£95.0m... 8.8m.
Deficit • • • • • . £86.2m.Annual Abstract of Statistics, H.M.S.O.
Source of Imports. Average (1965/68) 000 tons (refined equivalent)Commonwealth
Australia • • • •Fiji • • • •Mauritius • • • •West Indies • •Other • • • •
1969
1,891911200
2,440
Foreign369 South Africa132 Brazil • • • •389 Cuba • •599 Poland .. • •153 Other . • • •
• •
• •
• •
• •
1970
1,665838186
2,448
6456592358
1,642 260Plantation Crops. Commonwealth Secretariat. (West Indies includes Guyana and British Honduras.)
Average1962 £261963 721964 511965 221966 18Sugar Board Report, 1971.
Highest£40105942724
World Price of Sugar(London daily price per ton raw c.i.f.)
Lowest£20 196740 196825 196918 197013 1971
44
Average Highest£19 £3222 3134 3940 4546 70
Lowest£1216273040

Bibliography
British Sugar CorporationHome Grown Sugar. 1961
Johnson, H. G. Professor'Sugar Protectionism and the Export Earnings of Less Developed Countries', Variations on a theme byR. H. Snape, Economica. Vol. XXXII, 1966. Pages 35-42
National Economic Development OfficeN.E.D.C. for Agriculture: 'Agriculture's Import Saving Role'. 1968
Report of the U.K. Sugar Industry Inquiry CommitteeCmd. 4871. 1935 •
Report on the Sugar Beet IndustryMAFF. Econ. Series No. 27. 1931
Snape, R. H.'Some Effects of Protection in the World Sugar Industry'. Economica. Vol. XXX. 1963. Pages 63-73
Snape, R. H.
'Sugar: Costs* of Protection and Taxation'. Economica. Vol. XXXVI. February, 1969. Pages 29-41
Sturrock, F. G.A policy for British sugar supplies. Westminster Bank Review. August, 1969
Sturrock, F. G.British sugar supplies: A Rejoinder. Westminster Bank Review. February, 1970
Sturrock, F. G.Outlook for sugar beet. Journal Royal Agricultural Society of England. No. 131. 1970. Pages 18-29
Sturrock, F. G.Sugar beet or sugar cane. Journal of Agricultural Economics. Vol. XX, No. 1. 1969
Sugar Board
Annual Reports
Tasker, A.
British sugar supplies: An Alternative View. Westminster Bank Review. November, 1969
Viton & Pignalosa
FAO Commodity Series No. 32. Trends and Forces of World Sugar Consumption. Rome, 1961
45
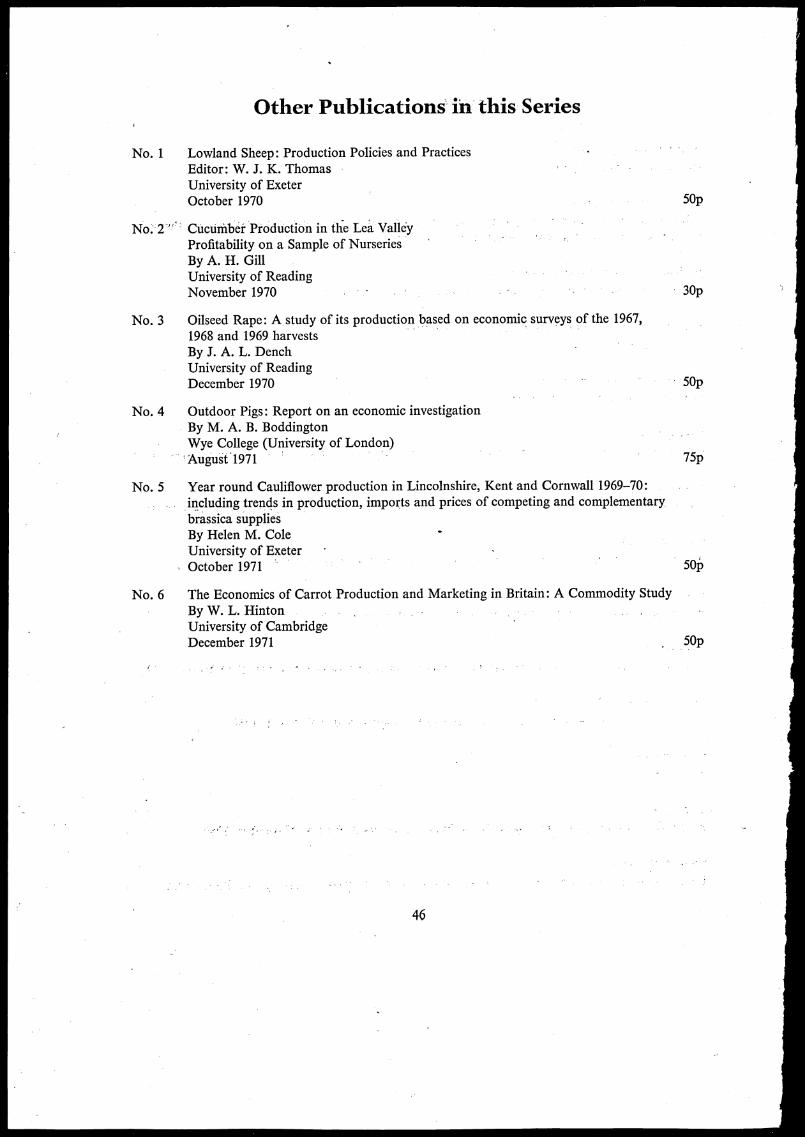
No. 1
No. 2 '
No. 3
No. 4
No. 5
No. 6
Other Publications in this Series
Lowland Sheep: Production Policies and PracticesEditor: W. J. K. ThomasUniversity of ExeterOctober 1970
CUctinibet Production in the Lea ValleyProfitability on a Sample of NurseriesBy A. H. GillUniversity of ReadingNovember 1970
Oilseed Rape: A study of its production based on economic surveys of the 1967,
1968 and 1969 harvestsBy J. A. L. DenchUniversity of ReadingDecember 1970
Outdoor Pigs: Report on an economic investigationBy M. A. B. BoddingtonWye College (University of London)August 1971
Year round Cauliflower production in Lincolnshire, Kent and Cornwall 1969-70:including trends in production, imports and prices of competing and complementary
brassica suppliesBy Helen M. ColeUniversity of Exeter •October 1971
The Economics of Carrot Production and Marketing in Britain: A Commodity Study
By W. L. HintonUniversity of CambridgeDecember 1971
46
50p
30p
50p
75p
5
50p

University Departments
BRISTOL Agricultural Economics Research UnitUniversity of Bristol79 Woodland RoadBristol, BS8 lUT
CAMBRIDGE Agricultural Economics UnitDepartment of Land EconomyUniversity of CambridgeSilver StreetCambridge, CB3 9EP
EXETER Agricultural Economics UnitDepartment of EconomicsUniversity of ExeterLafrowda, St. German's RoadExeter, EX4 6TL
LEEDS Agricultural Economics DepartmentUniversity of Leeds34 University RoadLeeds, LS2 9JT
LONDON School of Rural Economics and Related StudiesWye College (University of London)Near AshfordKent .
" MANCHESTER
NEWCASTLE
NOTTINGHAM
READING
WALES
Department of Agricultural EconomicsThe UniversityManchester, M13 9PL
Department of Agricultural EconomicsThe University of Newcastle-upon-TyneNewcastle-upon-Tyne, NE1 7RU
Department of Agriculture and HorticultureUniversity of NottinghamSchool of AgricultureSutton BoningtonLoughborough, LE12 5RD
Department of Agricultural EconomicsUniversity of ReadingBuilding No. 4Earley Gate, Whiteknights RoadReading, RG6 2AR
Department of Agricultural EconomicsUniversity College of WalesInstitute of Rural SciencePenglaisAberystwythCardiganshire
47
•

•
R. I. SEVERS LTD, CAMBRIDGE


