Embed Size (px)
Citation preview

OPTIMIZATION OF OSMOTIC DEHYDRATION OF APPLES INSUGAR BEET MOLASSESGORDANA B. KOPRIVICA1,3, LATO L. PEZO2, BILJANA L. CURCIC1, LJUBINKO B. LEVIC1 andDANIJELA Z. ŠUPUT1
1Faculty of Technology, University of Novi Sad, 21000 Novi Sad, Serbia2Institute of General and Physical Chemistry, University of Beograd, 11000 Beograd, Serbia
3Corresponding author.Tel: +381 21 485 360;Fax: +381 21 450 413;Email: [email protected]
Received for Publication December 26, 2012Accepted for Publication April 4, 2013
doi:10.1111/jfpp.12133
ABSTRACT
This paper describes the effects of different concentrations of sugar beet molasses(40–80%) and immersion times (1–5 h) on osmotic dehydration/impregnation ofapple cubes. Osmotic dehydration process was conducted at constant temperatureof 55C and under atmospheric pressure. Analysis of variance was used in order tofind significant effects of solution concentration and immersion time on waterloss, solid gain, carbohydrates and minerals content, as well as change in colorsand textural characteristics. It was found that the influence of both process vari-ables were statistically significant at P < 0.05 level, on almost all of examinedresponses, with the exception of minerals content (Ca and K content were foundinsignificant, while Na was found significant at P < 0.10 level). The optimum pro-cessing conditions were determined by response surface method, coupled withfuzzy synthetic evaluation algorithm, using membership trapezoidal function,with defined optimal interval values, depending on a final usage of dehydratedfruit.
PRACTICAL APPLICATIONS
Osmotic dehydration (OD) of foods presents some advantages compared withcommon drying techniques, such as minimizing heat damage to the color andflavor, inhibiting enzymatic browning and reducing energy costs. The use of OD,as a complementary treatment in food processing, particularly prior to drying andfreezing operations, reduces energy requirements of these processes. The tech-nique aims to dehydrate food products by immersing them in hypertonic solution.The effects of different concentrations of sugar beet molasses (40–80%) andimmersion times (1–5 h) on kinetics of mass transfer during OD/impregnation ofapple cubes were studied. Sugar beet molasses as hypertonic solution is presentedin this article because of high dry matter content and the enrichment of the foodmaterial in minerals and vitamins, which penetrate from molasses to the planttissue. This investigation is also focused on finding the appropriate mathematicalmodel for water loss, solid gain, sugars and minerals content, as well as change incolors and textural characteristics, during OD of apples in sugar beet molasses.The optimum processing conditions were determined by response surfacemethod, coupled with fuzzy synthetic evaluation algorithm, using membershiptrapezoidal function, with defined optimal interval values, depending on a finalusage of dehydrated fruit.
INTRODUCTION
Osmotic dehydration (OD) is a complementary treatmentin the processing of dehydrated foods since it presents some
advantages such as minimizing heat damage to the colorand flavor, inhibiting enzymatic browning and reducingenergy costs (Alkali et al. 2006; Torres et al. 2006, 2007).This is one alternative to reduce postharvest losses of fruits,
Journal of Food Processing and Preservation ISSN 1745-4549
Journal of Food Processing and Preservation •• (2013) ••–•• © 2013 Wiley Periodicals, Inc. 1

and a common process for producing dried fruits, whichcan be directly consumed or used as an ingredient in cakes,pastries and many others (Mercali et al. 2011). The qualityof osmotically dehydrated products is better and shrinkageis considerably lower as compared to products from con-ventional drying processes (Bekele and Ramaswamy 2010).The use of OD in food processing, particularly prior todrying and freezing operations, reduces energy require-ments of these processes (Ozdemir et al. 2008).
The technique aims to dehydrate food products byimmersing them in hypertonic solution. Water is removeddue to the difference of osmotic pressure between the foodand the osmotic solution, reducing the water activity of thefood, and consequently, the water availability for chemicaland biological deterioration. During the process, two simul-taneous flows through the cell walls are created in countercurrent: one is the water leaving from fruit into the solution(the most important from the dehydration point of view),and other is the osmotic solute (usually salt or sugar) fromthe solution into the fruit (Bernardi et al. 2009).
Solution concentration, temperature, immersion time,sample size, geometry and ratio of sample to solution arethe main parameters that have influence on the mass trans-fer during the process (Ganjloo et al. 2011).
For fruits and vegetables dehydration, the most com-monly used osmotic agents are sucrose and sodium chlorideand their combination. Glucose, fructose, dextrose, malto-dextrin and sorbitol also can be used for OD (Shi and LeMaguer 2002; Ispir and Togrul 2009). Recent research hasshown that use of sugar beet molasses as hypertonic solu-tion improves OD processes due to high dry matter contentand specific nutrient content. An important advantage ofsugar beet molasses used as hypertonic solution, from anutrient point of view, is enrichment of the food material inminerals and vitamins, which penetrate from molasses tothe plant tissue (Koprivica et al. 2009).
An adequate control of dehydrated material’s composi-tion and the correct operational design are attainablethrough the knowledge on the kinetics of mass transferduring the process. For the mass transfer modeling duringthe osmosis process, different approaches based on Fick’ssecond law have been reported. From a practical point ofview, in food industry, approaches based on Fick’s secondlaw are not very useful because of their complexity andunrealistic assumption (i.e. significant mass transfer resis-tance in high-viscosity hypertonic solution; Ganjloo et al.2011). Thus, several simpler semi-empirical approachesconcerning parameters with physical meaning are advisedto model the kinetics of mass transfers during OD (Hawkesand Flink 1978; Peleg 1988). Response surface methodology(RSM) is an effective tool for optimizing a variety of foodprocesses including OD (Azoubel and Murr 2003; Ozdemiret al. 2008; Singh et al. 2010; Eren And Kaymak-Ertekin
2006). The main advantage of RSM is the reduced numberof experimental runs that provide sufficient information forstatistically valid results. The RSM equations describe effectsof the test variables on the observed responses, determinetest variables interrelationships and represent the combinedeffect of all test variables in the observed responses,enabling the experimenter to make efficient exploration ofthe process.
The current study intends to investigate the effects ofconcentration and immersion duration on the kinetics ofmass transfer. Also, investigation is focused on finding theappropriate mathematical model for water loss (WL), solidgain (SG), sugars and minerals content, as well as change incolors and textural characteristics, during OD of apples insugar beet molasses.
MATERIAL AND METHODS
Sample Preparation
Apples, type Idared, were purchased in a local market inNovi Sad (Serbia) and stored at 4C until use. Initial mois-ture content, mo, was 86.95 � 0.95%. Prior to the treatment,the apples were thoroughly washed and cut into 1 ¥1 ¥ 1 cm cubes, manually using very sharp stainless steelknife.
Osmotic Solution Preparation
In this experiment, different concentrations of sugar beetmolasses solutions, (40, 60 and 80°Brix) were used. Sugarbeet molasses was obtained from the sugar factory Pecinci,Serbia. Initial dry matter content in sugar beet molasses was83.68°Brix. The osmotic solutions were prepared by dilutionof initial sugar beet molasses with appropriate amount ofheated distilled water. The osmotic solution concentration,throughout each experiment, was determined refracto-metrically by Abbe refractometer, Carl Zeiss, Jena, Germany.
Experimental Procedure
Simplified scheme of the apparatus for OD is shown inFig. 1. Apparatus was made of stainless steel (AISI 304, foodprocessing grade) and it is equipped with centrifugal pumpthat enables circulation of the osmotic solution and with aheater and thermoregulation system, which provides main-tenance of constant temperature during the experiment.Centrifugal pump ensures the velocity of 1·10-3 m/s forsolution circulation, inside the main barrel.
Double wall of main barrel is continuously supplied withhot water from two electric heaters (2 ¥ 1.5 kW) assembledwith apparatus. Along with this apparatus, there is a
OSMOTIC DEHYDRATION, SUGAR BEET, APPLE, RSM, FSE G.B. KOPRIVICA ET AL.
Journal of Food Processing and Preservation •• (2013) ••–•• © 2013 Wiley Periodicals, Inc.2

stainless, perforated basket divided into several sections.After a certain time, a sample from one of the sections inthe perforated basket was removed and the rest continueswith dehydration.
In all experiments, weight ratio of solution to applesamples of 8:1 was used. The selection of solution to mate-rial ratio was made according to our previous investigations(Koprivica et al. 2009; Mišljenovic et al. 2012). This ratio isconsidered to be high enough to neglect concentrationchanges during the process, and also low enough consider-ing economical and ecological aspects. The experimentswere conducted in an apparatus presented in Fig. 1, underatmospheric pressure at 55C. According to Mišljenovic et al.(2012), more influential variables for WL and SG evalua-tion, during OD of carrots, were solution concentration andimmersion time, and they were chosen to be input variablesof interest for mathematical model in this article, while theexact value of working temperature was also chosen accord-ing to this reference.
Dehydration lasted 5 h and sampling was performed intime intervals of 60, 180 and 300 min, and then the samplesrinsed quickly with distilled water to eliminate the solutionfrom the surface and carefully blotted with tissue paper toremove the excess surface water. The velocity of solution cir-culation was constant for all experimental units.
From the obtained data, WL and SG were determined atdifferent time intervals, according to the following expres-sion (Ganjloo et al. 2011):
WLm z m z
m= − ⎡
⎣⎢⎤⎦⎥
i i f f
i
g
g fresh sample(1)
SGm s m s
m= − ⎡
⎣⎢⎤⎦⎥
f f i i
i
g
g fresh sample(2)
where mi and mf are the initial and final weight (g) of thesamples, respectively; zi and zf are the initial and final massfraction of water (g water/g sample), respectively; si and sf
are the initial and final mass fraction of total solids (g totalsolids/g sample), respectively.
Analytical Determinations
Moisture Content Dry matter content in fresh and dehy-drated apple cubes, after each contact times, were deter-mined by drying in oven (Instrumentaria Sutjeska, Zagreb,Croatia) at 105C for 24 h. In order to determine masschange, all samples were weighed before and after treatmentusing an analytical balance, with accuracy of �0.001 g,model PLJ 360 M (KERN & SOHN GmbH, Balingen,Germany). All analyses were done in triplicate.
Mineral Composition Analysis Minerals compositionof fresh and dehydrated apple cubes, in the solution ofsugar beet molasses, was investigated. The combination ofthermal treatment at 350C and wet acidic treatment at 160Cwas used for samples preparation. The dehydrated sampleswere processed for minerals determination by wet digestion,where approximately 5 g each, were weighed exactly to fourdecimal places, and transferred to vessels, into which 4.5 mL65% HNO3 and 10.5 mL 35% HCl were added. The treat-ments were repeated to obtain the white sediments thatwere dissolved in 0.07 M HNO3. The content of metals,present in the corresponding solutions, was determined byinductively coupled plasma optic emission spectrometry(ICP-OES). ICP-OES measurement was performed usingThermo Scientific ICAP 6500 Duo ICP (Thermo Fisher Sci-entific, Cambridge, U.K.) spectrometer equipped withRACID86 Charge Injector device detector, standard glassconcentric nebulizer, quartz torch and alumina injector.Samples were analyzed in triplicate.
Sucrose and invert sugar content have been determinedaccording to Luff–Schoorl method, based on Cu2+ ionreduction. By using this method, values of the total invertsugar (%) and natural invert sugar (%) content, could bedetermined. Based on this result, sucrose content (%) in thefresh and dehydrated apple could be calculated.
Color Measurement Color measurements were per-formed with a three-filter colorimeter CR-400 (KonicaMinolta, Inc., Tokyo, Japan), at room temperature. Themeasured color values of the apple sample during osmoticdrying are presented in CIE L*a*b* color system. L* is con-sidered as measure of lightness, which is the property thatallows any color to be regarded as equivalent to a member
FIG. 1. SIMPLIFIED SCHEME OF THE APPARATUS FOR OSMOTICDEHYDRATION (1 – OSMOTIC SOLUTION; 2 – BASKET WITH SAMPLE;3 – CENTRIFUGAL PUMP; 4 – ELECTRIC HEATERS; 5 – SYSTEM FORTHERMOREGULATION; 6 – DOUBLE WALL HEAT EXCHANGER)
G.B. KOPRIVICA ET AL. OSMOTIC DEHYDRATION, SUGAR BEET, APPLE, RSM, FSE
Journal of Food Processing and Preservation •• (2013) ••–•• © 2013 Wiley Periodicals, Inc. 3

of the gray scale, between black (L* = 100) and white(L* = 0). The coordinate a* takes positive values for reddishcolors and negative values for the greenish ones, while b*takes positive values for yellowish colors and negative valuesfor the bluish ones.
Texture Analysis Firmness of the apples was determinedby measuring the compressive force using a TA-XT2 TextureAnalyzer (Stable Micro Systems, Surrey, Great Britain) witha 3-mm-diameter punch probe. Each apple cubes was sub-jected to a compression force at a 0.5 mm/s after contactand penetrated 5 mm. The firmness was reported as peakforce and expressed in Newton (N). Samples were analyzedin triplicate.
Response Surface Methodology
The RSM method was selected to estimate the main effect ofthe process variables on mass transfer variables, light coor-dinates and texture, during the OD of apples cubes. Theaccepted 32 full factorial experimental design, with twolevels and three parameters in one block was taken fromBox and Behnken (1960), Montgomery (1984) andMadamba (2002). The independent variables were osmotictime (X1) of 1, 3 and 5 h; and sugar beet molasses concen-tration (X2) of 40, 60 and 80% (by weight), and the depen-dent variables were the responses: WL (Y1), SG (Y2), mineralcontent: potassium, [K] (Y3), sodium, [Na] (Y4), calcium,[Ca] (Y5), magnesium, [Mg] (Y6), sugars content: sucrose –[S] (Y7), invert sugar – [IS] (Y8), color coordinate changes:at the surface of the sample Ls* (Y9), as* (Y10), bs* (Y11), atthe cross-section Lc* (Y12), ac* (Y13), bc* (Y14) and fractureforce FF (Y15).
The following second-order polynomial (SOP) modelwas fitted to the data. Fifteen models (k = 15) of the follow-ing form were developed to relate responses (Y) to twoprocess variables (X):
Y X X X Xk i i
i
ii i
i
ij i j
j ii
= + + += = = +=∑ ∑ ∑∑β β β β0
1
22
1
2
1
2
1
2
(3)
where b0, bi, bii, bij are constant regression coefficients; Yk,response variables Xi, Xj process parameters. The significantterms in the model were found using analysis of variance(ANOVA) for each response variable.
Fuzzy Synthetic Evaluation
The fuzzy composite operator is the critical factor that willaffect the final optimization results. Two fuzzy compositeoperators are widely used in a variety of evaluation systems.The supremum–infimum operator M (∧,⁄) and themultiplication–summation operator M (•,�) determine thefuzzy algorithm of the comprehensive relative importance
sets. In fuzzy synthetic evaluation models, “∧”and “⁄”denote the supremum and the infimum operator, respec-tively, while “•” and “�” are the notations for the algebraicmultiplication and algebraic summation separately. Accord-ing to the study of Wang et al. (2009), the fuzzy model usingM (∧,⁄) operator will lose more information than that of M(•,�) operator; therefore, O = M (•,�) was chosen in thisstudy, where O represents the optimization function.
Fuzzy synthetic optimization method was implementedusing the results of models proposed, to represent WL, SG,[K], [Na], [Ca], [Mg], [S], [IS], Ls*, as*, bs*, Lc*, ac*, bc* andFF, according to Eq. (3). FSE is commonly used technique tosolve problems with constraints involving nonlinear func-tions. These methods aim to solve a sequence of simpleproblems whose solutions converge to the solution of theoriginal problem.
Trapezoidal membership function used could be writtenas
A x a m n b
a x mx a
m am x n
n x bx n
b n
, , , ,
,
,
,
( ) =
≤ < −−
≤ <
≤ < − −−
⎧
⎨
⎪⎪
⎩
⎪⎪
1
1
(4)
where x is wheather WL, SG, [K], [Na], [Ca], [Mg], [S], [IS],Ls*, as*, bs*, Lc*, ac*, bc* or FF, and the values of a, b, m and nare function parameters. Interval a–b represent the range inwhich measured values occur in the experiment (minimumand maximum values), while range m–n is the proposedoptimal values range for response variables, chosen forcertain consumer groups (such as baby food, or food forfitness and sport). An optimization with procedure was per-formed according to FSE algorithm, using Microsoft Excel2007 to determine the workable optimum conditions forosmotic dehydration on apple cubes.
Statistical Analysis
Descriptive statistical analyses for calculating the means andthe standard error of the mean, ANOVA, post hoc Tukey’stests and RSM were performed using StatSoft Statistica 10software (Statsoft Inc., Tulsa, OK, http://www.statsoft.com).All obtained results were expressed as the mean �standarddeviation (SD).
RESULTS AND DISCUSSION
The osmotic process was studied in terms of commonkinetics parameters, such as WL, SG and mineral content:[K], [Na], [Ca], [Mg]; sugar’s content: [S], [IS]; changes incolor: Ls*, as*, bs* (surface), Lc*, ac*, bc* (cross-section) andchanges in texture during OD FF.
OSMOTIC DEHYDRATION, SUGAR BEET, APPLE, RSM, FSE G.B. KOPRIVICA ET AL.
Journal of Food Processing and Preservation •• (2013) ••–•• © 2013 Wiley Periodicals, Inc.4
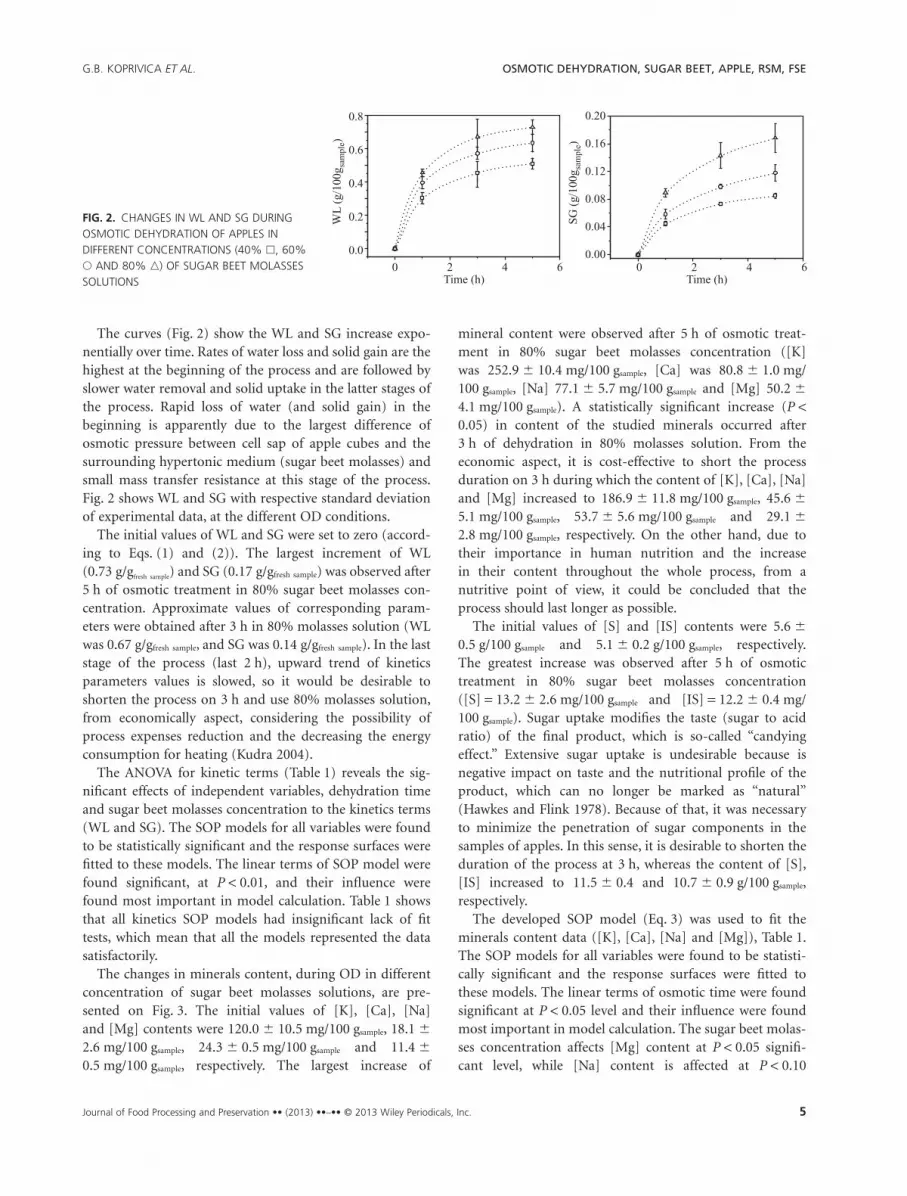
The curves (Fig. 2) show the WL and SG increase expo-nentially over time. Rates of water loss and solid gain are thehighest at the beginning of the process and are followed byslower water removal and solid uptake in the latter stages ofthe process. Rapid loss of water (and solid gain) in thebeginning is apparently due to the largest difference ofosmotic pressure between cell sap of apple cubes and thesurrounding hypertonic medium (sugar beet molasses) andsmall mass transfer resistance at this stage of the process.Fig. 2 shows WL and SG with respective standard deviationof experimental data, at the different OD conditions.
The initial values of WL and SG were set to zero (accord-ing to Eqs. (1) and (2)). The largest increment of WL(0.73 g/gfresh sample) and SG (0.17 g/gfresh sample) was observed after5 h of osmotic treatment in 80% sugar beet molasses con-centration. Approximate values of corresponding param-eters were obtained after 3 h in 80% molasses solution (WLwas 0.67 g/gfresh sample, and SG was 0.14 g/gfresh sample). In the laststage of the process (last 2 h), upward trend of kineticsparameters values is slowed, so it would be desirable toshorten the process on 3 h and use 80% molasses solution,from economically aspect, considering the possibility ofprocess expenses reduction and the decreasing the energyconsumption for heating (Kudra 2004).
The ANOVA for kinetic terms (Table 1) reveals the sig-nificant effects of independent variables, dehydration timeand sugar beet molasses concentration to the kinetics terms(WL and SG). The SOP models for all variables were foundto be statistically significant and the response surfaces werefitted to these models. The linear terms of SOP model werefound significant, at P < 0.01, and their influence werefound most important in model calculation. Table 1 showsthat all kinetics SOP models had insignificant lack of fittests, which mean that all the models represented the datasatisfactorily.
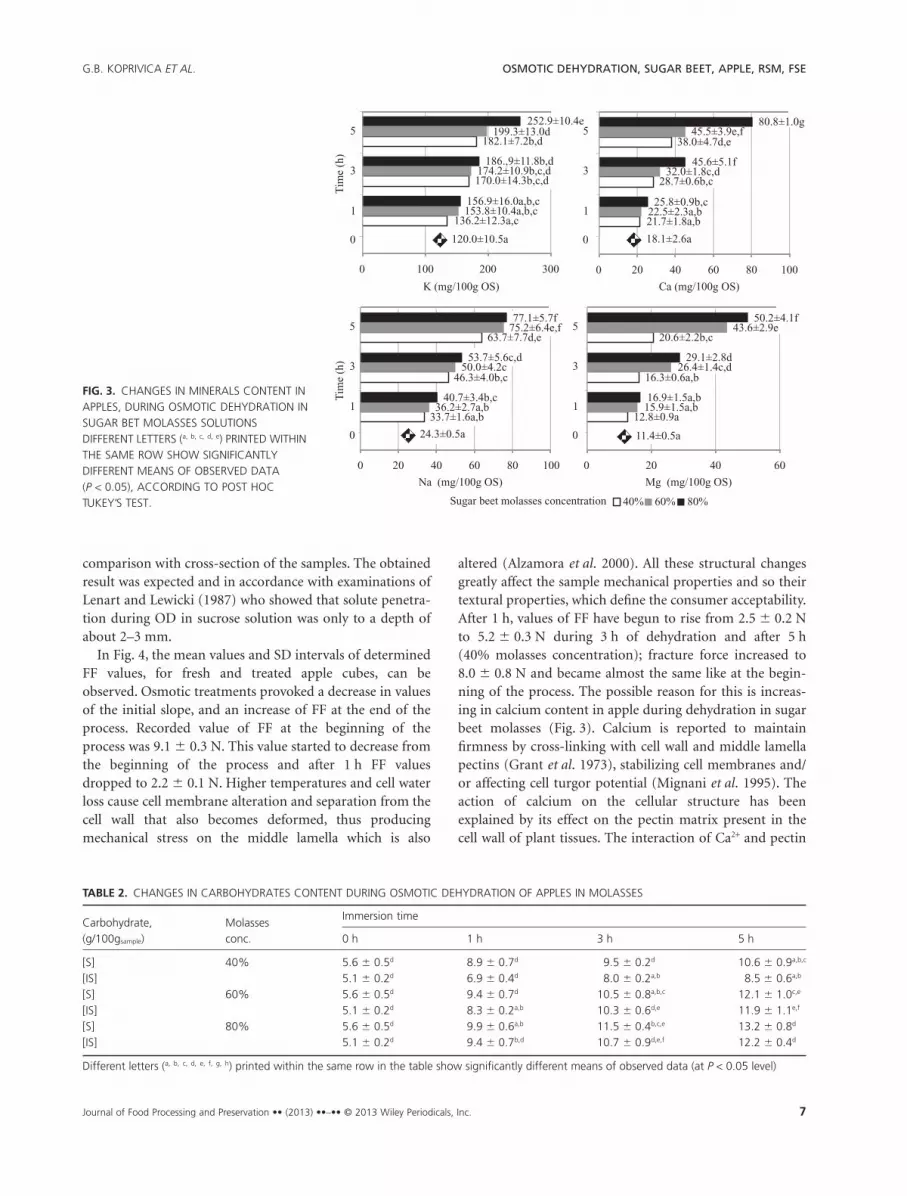
The changes in minerals content, during OD in differentconcentration of sugar beet molasses solutions, are pre-sented on Fig. 3. The initial values of [K], [Ca], [Na]and [Mg] contents were 120.0 � 10.5 mg/100 gsample, 18.1 �
2.6 mg/100 gsample, 24.3 � 0.5 mg/100 gsample and 11.4 �
0.5 mg/100 gsample, respectively. The largest increase of
mineral content were observed after 5 h of osmotic treat-ment in 80% sugar beet molasses concentration ([K]was 252.9 � 10.4 mg/100 gsample, [Ca] was 80.8 � 1.0 mg/100 gsample, [Na] 77.1 � 5.7 mg/100 gsample and [Mg] 50.2 �
4.1 mg/100 gsample). A statistically significant increase (P <0.05) in content of the studied minerals occurred after3 h of dehydration in 80% molasses solution. From theeconomic aspect, it is cost-effective to short the processduration on 3 h during which the content of [K], [Ca], [Na]and [Mg] increased to 186.9 � 11.8 mg/100 gsample, 45.6 �
5.1 mg/100 gsample, 53.7 � 5.6 mg/100 gsample and 29.1 �
2.8 mg/100 gsample, respectively. On the other hand, due totheir importance in human nutrition and the increasein their content throughout the whole process, from anutritive point of view, it could be concluded that theprocess should last longer as possible.
The initial values of [S] and [IS] contents were 5.6 �
0.5 g/100 gsample and 5.1 � 0.2 g/100 gsample, respectively.The greatest increase was observed after 5 h of osmotictreatment in 80% sugar beet molasses concentration([S] = 13.2 � 2.6 mg/100 gsample and [IS] = 12.2 � 0.4 mg/100 gsample). Sugar uptake modifies the taste (sugar to acidratio) of the final product, which is so-called “candyingeffect.” Extensive sugar uptake is undesirable because isnegative impact on taste and the nutritional profile of theproduct, which can no longer be marked as “natural”(Hawkes and Flink 1978). Because of that, it was necessaryto minimize the penetration of sugar components in thesamples of apples. In this sense, it is desirable to shorten theduration of the process at 3 h, whereas the content of [S],[IS] increased to 11.5 � 0.4 and 10.7 � 0.9 g/100 gsample,respectively.
The developed SOP model (Eq. 3) was used to fit theminerals content data ([K], [Ca], [Na] and [Mg]), Table 1.The SOP models for all variables were found to be statisti-cally significant and the response surfaces were fitted tothese models. The linear terms of osmotic time were foundsignificant at P < 0.05 level and their influence were foundmost important in model calculation. The sugar beet molas-ses concentration affects [Mg] content at P < 0.05 signifi-cant level, while [Na] content is affected at P < 0.10
0 2 4 6
0.0
0.2
0.4
0.6
0.8
Time (h)0 2 4 6
0.00
0.04
0.08
0.12
0.16
0.20
WL
(g/1
00g
)sa
mpl
e
SG
(g/1
00g
)sa
mp l
e
Time (h)
FIG. 2. CHANGES IN WL AND SG DURINGOSMOTIC DEHYDRATION OF APPLES INDIFFERENT CONCENTRATIONS (40% �, 60%� AND 80% �) OF SUGAR BEET MOLASSESSOLUTIONS
G.B. KOPRIVICA ET AL. OSMOTIC DEHYDRATION, SUGAR BEET, APPLE, RSM, FSE
Journal of Food Processing and Preservation •• (2013) ••–•• © 2013 Wiley Periodicals, Inc. 5
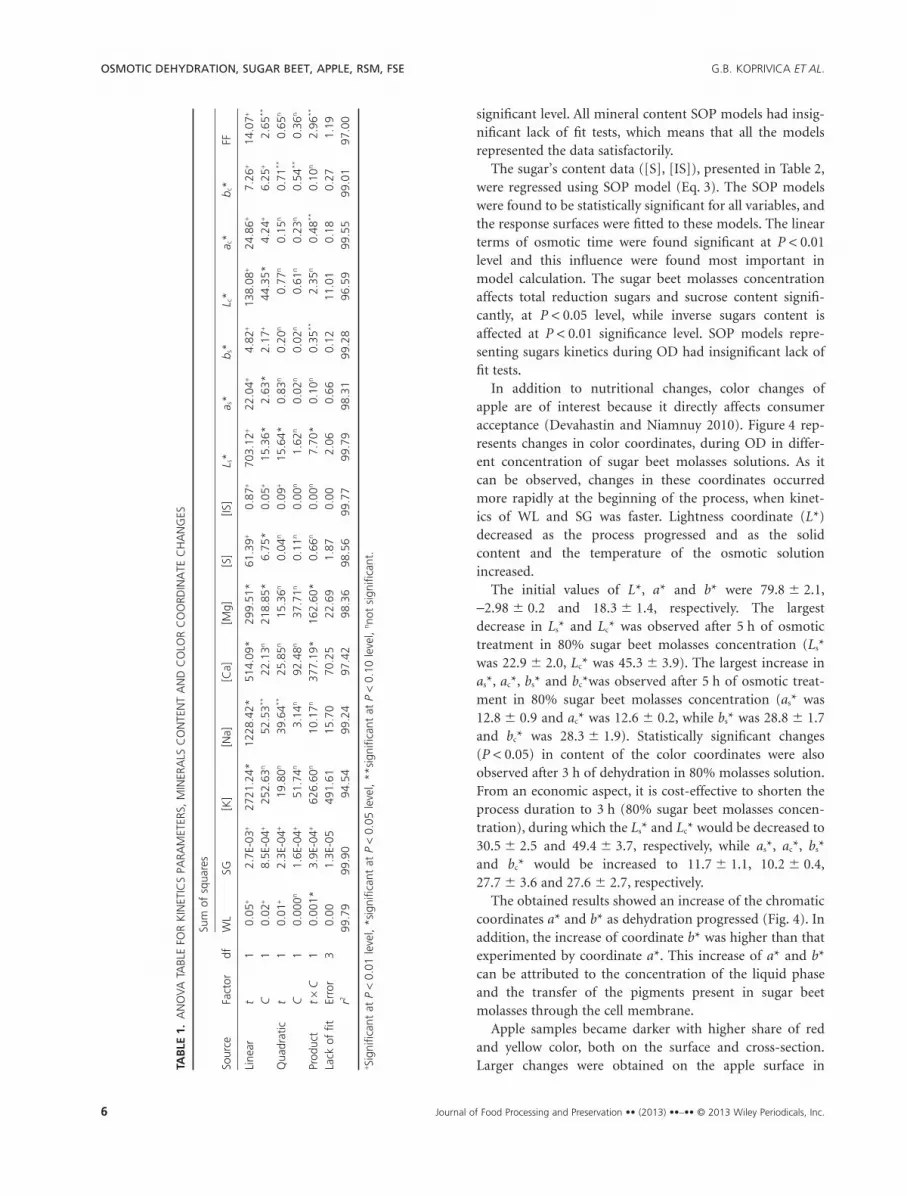
significant level. All mineral content SOP models had insig-nificant lack of fit tests, which means that all the modelsrepresented the data satisfactorily.
The sugar’s content data ([S], [IS]), presented in Table 2,were regressed using SOP model (Eq. 3). The SOP modelswere found to be statistically significant for all variables, andthe response surfaces were fitted to these models. The linearterms of osmotic time were found significant at P < 0.01level and this influence were found most important inmodel calculation. The sugar beet molasses concentrationaffects total reduction sugars and sucrose content signifi-cantly, at P < 0.05 level, while inverse sugars content isaffected at P < 0.01 significance level. SOP models repre-senting sugars kinetics during OD had insignificant lack offit tests.
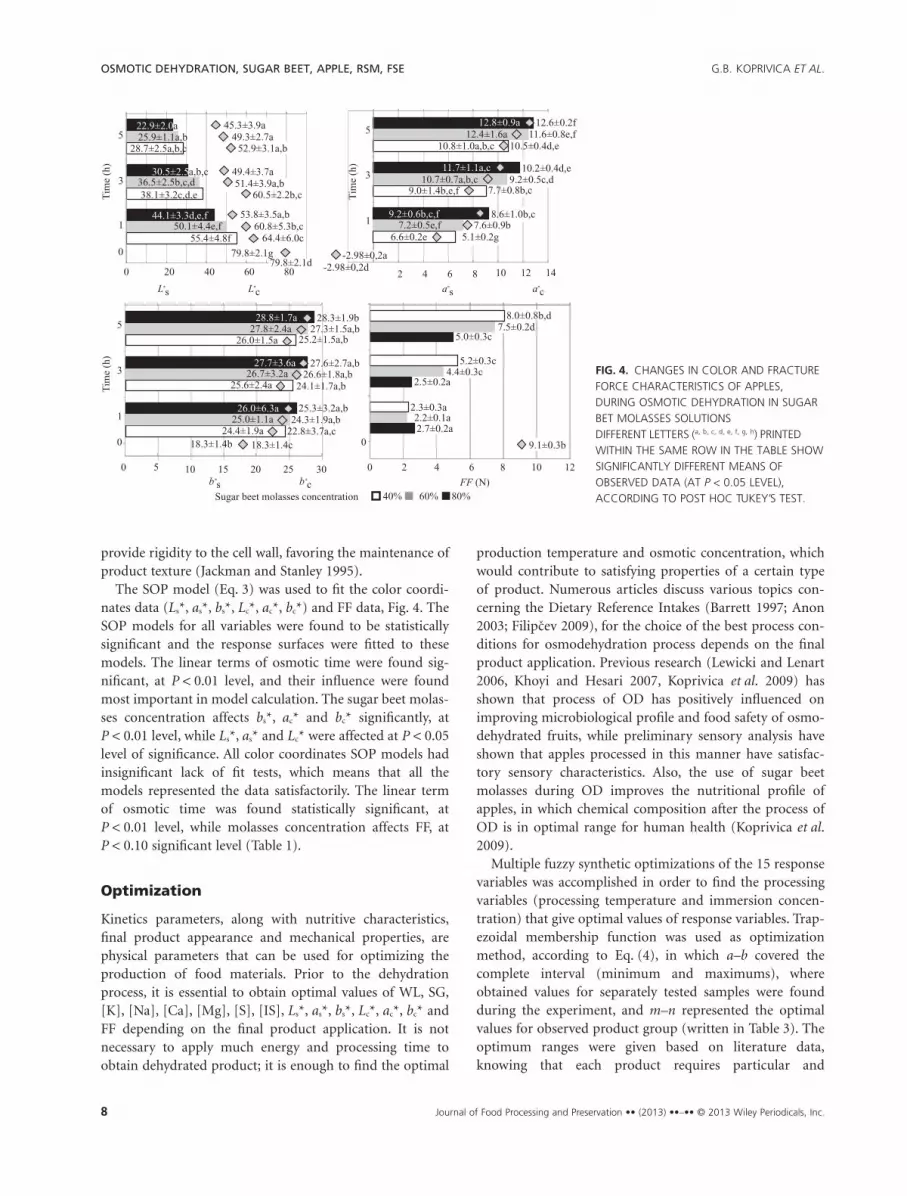
In addition to nutritional changes, color changes ofapple are of interest because it directly affects consumeracceptance (Devahastin and Niamnuy 2010). Figure 4 rep-resents changes in color coordinates, during OD in differ-ent concentration of sugar beet molasses solutions. As itcan be observed, changes in these coordinates occurredmore rapidly at the beginning of the process, when kinet-ics of WL and SG was faster. Lightness coordinate (L*)decreased as the process progressed and as the solidcontent and the temperature of the osmotic solutionincreased.
The initial values of L*, a* and b* were 79.8 � 2.1,-2.98 � 0.2 and 18.3 � 1.4, respectively. The largestdecrease in Ls* and Lc* was observed after 5 h of osmotictreatment in 80% sugar beet molasses concentration (Ls*was 22.9 � 2.0, Lc* was 45.3 � 3.9). The largest increase inas*, ac*, bs* and bc*was observed after 5 h of osmotic treat-ment in 80% sugar beet molasses concentration (as* was12.8 � 0.9 and ac* was 12.6 � 0.2, while bs* was 28.8 � 1.7and bc* was 28.3 � 1.9). Statistically significant changes(P < 0.05) in content of the color coordinates were alsoobserved after 3 h of dehydration in 80% molasses solution.From an economic aspect, it is cost-effective to shorten theprocess duration to 3 h (80% sugar beet molasses concen-tration), during which the Ls* and Lc* would be decreased to30.5 � 2.5 and 49.4 � 3.7, respectively, while as*, ac*, bs*and bc* would be increased to 11.7 � 1.1, 10.2 � 0.4,27.7 � 3.6 and 27.6 � 2.7, respectively.
The obtained results showed an increase of the chromaticcoordinates a* and b* as dehydration progressed (Fig. 4). Inaddition, the increase of coordinate b* was higher than thatexperimented by coordinate a*. This increase of a* and b*can be attributed to the concentration of the liquid phaseand the transfer of the pigments present in sugar beetmolasses through the cell membrane.
Apple samples became darker with higher share of redand yellow color, both on the surface and cross-section.Larger changes were obtained on the apple surface inTA
BLE
1.A
NO
VATA
BLE
FOR
KIN
ETIC
SPA
RAM
ETER
S,M
INER
ALS
CO
NTE
NT
AN
DC
OLO
RC
OO
RDIN
ATE
CH
AN
GES
Sour
ceFa
ctor
df
Sum
ofsq
uare
s
WL
SG[K
][N
a][C
a][M
g][S
][IS
]L s
*a s
*b s
*L c
*a c
*b c
*FF
Line
art
10.
05+
2.7E
-03+
2721
.24*
1228
.42*
514.
09*
299.
51*
61.3
9+0.
87+
703.
12+
22.0
4+4.
82+
138.
08+
24.8
6+7.
26+
14.0
7+
C1
0.02
+8.
5E-0
4+25
2.63
n52
.53**
22.1
3n21
8.85
*6.
75*
0.05
+15
.36*
2.63
*2.
17+
44.3
5*4.
24+
6.25
+2.
65**
Qua
drat
ict
10.
01+
2.3E
-04+
19.8
0n39
.64**
25.8
5n15
.36n
0.04
n0.
09+
15.6
4*0.
83n
0.20
n0.
77n
0.15
n0.
71**
0.65
n
C1
0.00
0n1.
6E-0
4+51
.74n
3.14
n92
.48n
37.7
1n0.
11n
0.00
n1.
62n
0.02
n0.
02n
0.61
n0.
23n
0.54
**0.
36n
Prod
uct
t¥
C1
0.00
1*3.
9E-0
4+62
6.60
n10
.17n
377.
19*
162.
60*
0.66
n0.
00n
7.70
*0.
10n
0.35
**2.
35n
0.48
**0.
10n
2.96
**
Lack
offit
Erro
r3
0.00
1.3E
-05
491.
6115
.70
70.2
522
.69
1.87
0.00
2.06
0.66
0.12
11.0
10.
180.
271.
19r2
99.7
999
.90
94.5
499
.24
97.4
298
.36
98.5
699
.77
99.7
998
.31
99.2
896
.59
99.5
599
.01
97.0
0
+ Sig
nific
ant
atP
<0.
01le
vel,
*sig
nific
ant
atP
<0.
05le
vel,
**si
gnifi
cant
atP
<0.
10le
vel,
n not
sign
ifica
nt.
OSMOTIC DEHYDRATION, SUGAR BEET, APPLE, RSM, FSE G.B. KOPRIVICA ET AL.
Journal of Food Processing and Preservation •• (2013) ••–•• © 2013 Wiley Periodicals, Inc.6
comparison with cross-section of the samples. The obtainedresult was expected and in accordance with examinations ofLenart and Lewicki (1987) who showed that solute penetra-tion during OD in sucrose solution was only to a depth ofabout 2–3 mm.
In Fig. 4, the mean values and SD intervals of determinedFF values, for fresh and treated apple cubes, can beobserved. Osmotic treatments provoked a decrease in valuesof the initial slope, and an increase of FF at the end of theprocess. Recorded value of FF at the beginning of theprocess was 9.1 � 0.3 N. This value started to decrease fromthe beginning of the process and after 1 h FF valuesdropped to 2.2 � 0.1 N. Higher temperatures and cell waterloss cause cell membrane alteration and separation from thecell wall that also becomes deformed, thus producingmechanical stress on the middle lamella which is also
altered (Alzamora et al. 2000). All these structural changesgreatly affect the sample mechanical properties and so theirtextural properties, which define the consumer acceptability.After 1 h, values of FF have begun to rise from 2.5 � 0.2 Nto 5.2 � 0.3 N during 3 h of dehydration and after 5 h(40% molasses concentration); fracture force increased to8.0 � 0.8 N and became almost the same like at the begin-ning of the process. The possible reason for this is increas-ing in calcium content in apple during dehydration in sugarbeet molasses (Fig. 3). Calcium is reported to maintainfirmness by cross-linking with cell wall and middle lamellapectins (Grant et al. 1973), stabilizing cell membranes and/or affecting cell turgor potential (Mignani et al. 1995). Theaction of calcium on the cellular structure has beenexplained by its effect on the pectin matrix present in thecell wall of plant tissues. The interaction of Ca2+ and pectin
0 100 200 300
1
3
5
0 20 40 60 80 100
3
0 20 40 60 80 100 0 20 40 60
1
5T
ime
(h)
40% 60% 80%
K (mg/100g OS) Ca (mg/100g OS)
Na (mg/100g OS) Mg (mg/100g OS)
0
0
3 3
5
5
1
1
0
0
Tim
e(h
)
Sugar beet molasses concentration
136.2±12.3a,c
170.0±14.3b,c,d
182.1±7.2b,d
153.8±10.4a,b,c
174.2±10.9b,c,d
199.3±13.0d
156.9±16.0a,b,c
186.,9±11.8b,d
252.9±10.4e
21.7±1.8a,b
28.7±0.6b,c
38.0±4.7d,e
22.5±2.3a,b
32.0±1.8c,d
45.5±3.9e,f
25.8±0.9b,c
45.6±5.1f
80.8±1.0g
33.7±1.6a,b
46.3±4.0b,c
63.7±7.7d,e
36.2±2.7a,b
50.0±4.2c
75.2±6.4e,f
40.7±3.4b,c
53.7±5.6c,d
77.1±5.7f
12.8±0.9a
16.3±0.6a,b
20.6±2.2b,c
15.9±1.5a,b
26.4±1.4c,d
43.6±2.9e
16.9±1.5a,b
29.1±2.8d
50.2±4.1f
120.0±10.5a 18.1±2.6a
24.3±0.5a 11.4±0.5a
FIG. 3. CHANGES IN MINERALS CONTENT INAPPLES, DURING OSMOTIC DEHYDRATION INSUGAR BET MOLASSES SOLUTIONSDIFFERENT LETTERS (a, b, c, d, e) PRINTED WITHINTHE SAME ROW SHOW SIGNIFICANTLYDIFFERENT MEANS OF OBSERVED DATA(P < 0.05), ACCORDING TO POST HOCTUKEY’S TEST.
TABLE 2. CHANGES IN CARBOHYDRATES CONTENT DURING OSMOTIC DEHYDRATION OF APPLES IN MOLASSES
Carbohydrate,(g/100gsample)
Molassesconc.
Immersion time
0 h 1 h 3 h 5 h
[S] 40% 5.6 � 0.5d 8.9 � 0.7d 9.5 � 0.2d 10.6 � 0.9a,b,c
[IS] 5.1 � 0.2d 6.9 � 0.4d 8.0 � 0.2a,b 8.5 � 0.6a,b
[S] 60% 5.6 � 0.5d 9.4 � 0.7d 10.5 � 0.8a,b,c 12.1 � 1.0c,e
[IS] 5.1 � 0.2d 8.3 � 0.2a,b 10.3 � 0.6d,e 11.9 � 1.1e,f
[S] 80% 5.6 � 0.5d 9.9 � 0.6a,b 11.5 � 0.4b,c,e 13.2 � 0.8d
[IS] 5.1 � 0.2d 9.4 � 0.7b,d 10.7 � 0.9d,e,f 12.2 � 0.4d
Different letters (a, b, c, d, e, f, g, h) printed within the same row in the table show significantly different means of observed data (at P < 0.05 level)
G.B. KOPRIVICA ET AL. OSMOTIC DEHYDRATION, SUGAR BEET, APPLE, RSM, FSE
Journal of Food Processing and Preservation •• (2013) ••–•• © 2013 Wiley Periodicals, Inc. 7
provide rigidity to the cell wall, favoring the maintenance ofproduct texture (Jackman and Stanley 1995).
The SOP model (Eq. 3) was used to fit the color coordi-nates data (Ls*, as*, bs*, Lc*, ac*, bc*) and FF data, Fig. 4. TheSOP models for all variables were found to be statisticallysignificant and the response surfaces were fitted to thesemodels. The linear terms of osmotic time were found sig-nificant, at P < 0.01 level, and their influence were foundmost important in model calculation. The sugar beet molas-ses concentration affects bs*, ac* and bc* significantly, atP < 0.01 level, while Ls*, as* and Lc* were affected at P < 0.05level of significance. All color coordinates SOP models hadinsignificant lack of fit tests, which means that all themodels represented the data satisfactorily. The linear termof osmotic time was found statistically significant, atP < 0.01 level, while molasses concentration affects FF, atP < 0.10 significant level (Table 1).
Optimization
Kinetics parameters, along with nutritive characteristics,final product appearance and mechanical properties, arephysical parameters that can be used for optimizing theproduction of food materials. Prior to the dehydrationprocess, it is essential to obtain optimal values of WL, SG,[K], [Na], [Ca], [Mg], [S], [IS], Ls*, as*, bs*, Lc*, ac*, bc* andFF depending on the final product application. It is notnecessary to apply much energy and processing time toobtain dehydrated product; it is enough to find the optimal
production temperature and osmotic concentration, whichwould contribute to satisfying properties of a certain typeof product. Numerous articles discuss various topics con-cerning the Dietary Reference Intakes (Barrett 1997; Anon2003; Filipcev 2009), for the choice of the best process con-ditions for osmodehydration process depends on the finalproduct application. Previous research (Lewicki and Lenart2006, Khoyi and Hesari 2007, Koprivica et al. 2009) hasshown that process of OD has positively influenced onimproving microbiological profile and food safety of osmo-dehydrated fruits, while preliminary sensory analysis haveshown that apples processed in this manner have satisfac-tory sensory characteristics. Also, the use of sugar beetmolasses during OD improves the nutritional profile ofapples, in which chemical composition after the process ofOD is in optimal range for human health (Koprivica et al.2009).
Multiple fuzzy synthetic optimizations of the 15 responsevariables was accomplished in order to find the processingvariables (processing temperature and immersion concen-tration) that give optimal values of response variables. Trap-ezoidal membership function was used as optimizationmethod, according to Eq. (4), in which a–b covered thecomplete interval (minimum and maximums), whereobtained values for separately tested samples were foundduring the experiment, and m–n represented the optimalvalues for observed product group (written in Table 3). Theoptimum ranges were given based on literature data,knowing that each product requires particular and
55.4±4.8f
38.1±3.2c,d,e
28.7±2.5a,b,c
50.1±4.4e,f
36.5±2.5b,c,d
25.9±1.1a,b
44.1±3.3d,e,f
30.5±2.5a,b,c
22.9±2.0a
1
3
5
20 40 60 80
0
L s*
9 0. ±1.4b,e,f
10 8. ±1.0a,b,c
10 7. ±0.7a,b,c
12 4. ±1.6a
11 7. ±1.1a,c
12 8. ±0.9a
2 4 6 8 10 12 14
Tim
e(h
)
24.4±1.9a
25.6±2.4a
26.0±1.5a
25.0±1.1a
26.7±3.2a
27.8±2.4a
26.0±6.3a
27.7±3.6a
28.8±1.7a
0 5 10 15 20 25 30
18.3±1.4b
-2 98 0,2. ± d
18.3±1.4c
3
5
1
3
5
0
Tim
e(h
)
FF (N)40% 60% 80%Sugar beet molasses concentration
0
L c* a s
* a c*
b s* b c
*
0 2 4 6 8 10 12
Tim
e(h
)
6 6. ±0.2e7 2. ±0.5e,f
9 2. ±0.6b,c,f1
0
-2 98 0,2. ± a
22.8±3.7a,c
25.2±1.5a,b
24.3±1.9a,b
26.6±1.8a,b
27.3±1.5a,b
25.3±3.2a,b
27.6±2.7a,b
28.3±1.9b
24.1±1.7a,b
10 5. ±0.4d,e11 6. ±0.8e,f
12 6. ±0.2f
7 7. ±0.8b,c
10 2. ±0.4d,e9 2. ±0.5c,d
8 6. ±1.0b,c
5 1. ±0.2g7 6. ±0.9b
79.8±2.1g
49 3. ±2.7a45 3. ±3.9a
49 4. ±3.7a
60 5. ±2.2b,c51 4. ±3.9a,b
64 4. ±6.0c60 8. ±5.3b,c
53 8. ±3.5a,b
52 9. ±3.1a,b
79.8±2.1d
2.7±0.2a
2.5±0.2a
5.0±0.3c
2.2±0.1a
4.4±0.3c
7.5±0.2d
2.3±0.3a
5.2±0.3c
8.0±0.8b,d
9.1±0.3b
FIG. 4. CHANGES IN COLOR AND FRACTUREFORCE CHARACTERISTICS OF APPLES,DURING OSMOTIC DEHYDRATION IN SUGARBET MOLASSES SOLUTIONSDIFFERENT LETTERS (a, b, c, d, e, f, g, h) PRINTEDWITHIN THE SAME ROW IN THE TABLE SHOWSIGNIFICANTLY DIFFERENT MEANS OFOBSERVED DATA (AT P < 0.05 LEVEL),ACCORDING TO POST HOC TUKEY’S TEST.
OSMOTIC DEHYDRATION, SUGAR BEET, APPLE, RSM, FSE G.B. KOPRIVICA ET AL.
Journal of Food Processing and Preservation •• (2013) ••–•• © 2013 Wiley Periodicals, Inc.8

appropriate characteristics (Barrett 1997; Anon 2003;Filipcev 2009).
Minimum and maximum of response variables, obtainedduring the experiment, are shown in Table 3, with a fewlisted consuming groups. Each consumption group is pre-sented with its own response variables optimal values.
The objective function (F) is the mathematical functionwhose maximum would be determined, by summing theFSE results for of the five models, according to Eq. (1). Eachresponse variable (WL, SG, [K], [Na], [Ca], [Mg], [S], [IS],Ls*, as*, bs*, Lc*, ac*, bc* and FF) has its weight, when calcu-lating the function F:
F t Conc w WL w SG w w w
w w
, .( ) = ⋅ + ⋅ + ⋅[ ]+ ⋅[ ]+ ⋅[ ]+ ⋅[ ]+ + ⋅
1 2 3 4 5
6 7
K Na Ca
Mg SS IS s
s s c c c
[ ]+ ⋅[ ]+ ⋅
+ ⋅ + ⋅ + ⋅ + ⋅ + ⋅
w w L
w a w b w L w a w b
8 9
10 11 12 13 14
*
* * * * **
+ ⋅w FF15 (5)
The maximum of function F (Eq. 5) represents the optimalparameters for processing parameters, and also theoptimum for response variables. The graphs of the depen-dent variables with significant parameters were obtainedusing objective function to determine optimum productionconditions, plotted on optimization graphic. If the value ofmembership trapezoidal function is close to 1, it shows thetendency of tested processing parameters of being optimal.
FSE evaluation results were presented in Table 4. The bestscores were marked in bolded characters. Optimizationprocess parameters for all consumption groups are asfollows: sugar beet concentration 80% and 3 h osmotictime, with constant temperature of 55C.
CONCLUSION
The OD of apple cubes at various conditions, concentra-tions of sugar beet molasses (40–80%) and immersiontimes (1–5 h) were investigated in this article.
TABLE 3. OPTIMIZING VALUES FOR 100 G DEHYDRATED MATERIAL
Consuming group Param. WL SG K Na Ca Mg S IS Ls* as* bs* Lc* ac* bc* FF
Observed extremevalues
a 0.0 0.0 120.0 24.3 18.1 11.4 5.6 5.1 79.8 -2.98 18.3 79.8 -2.98 18.3 9.1b 0.7 0.2 253.1 77.2 80.9 50.2 13.2 12.2 55.4 12.9 28.9 64.5 12.6 28.3 8.0
Baby food m 0.7 0.0 400 120 210 30 60 60 79.8 -2.98 18.3 79.8 -2.98 18.3 9.1n 0.7 0.1 700 370 800 75 100 100 79.8 -2.98 18.3 79.8 -2.98 18.3 9.1
Children m 0.7 0.0 3000 1000 500 80 60 60 79.8 -2.98 18.3 79.8 -2.98 18.3 9.1n 0.7 0.1 3800 1200 800 130 100 100 79.8 -2.98 18.3 79.8 -2.98 18.3 9.1
Adult men m 0.7 0.0 4500 1200 1000 240 125 125 79.8 -2.98 18.3 79.8 -2.98 18.3 9.1n 0.7 0.1 4700 1500 1300 420 275 275 79.8 -2.98 18.3 79.8 -2.98 18.3 9.1
Adult women m 0.7 0.0 4500 1200 1000 240 125 125 79.8 -2.98 18.3 79.8 -2.98 18.3 9.1n 0.7 0.1 4700 1500 1300 320 275 275 79.8 -2.98 18.3 79.8 -2.98 18.3 9.1
Pregnant women m 0.7 0.0 4700 1500 1000 350 125 125 79.8 -2.98 18.3 79.8 -2.98 18.3 9.1n 0.7 0.1 4700 1500 1300 400 275 275 79.8 -2.98 18.3 79.8 -2.98 18.3 9.1
Nursing mothers m 0.7 0.0 5100 1500 1000 310 155 155 79.8 -2.98 18.3 79.8 -2.98 18.3 9.1n 0.7 0.1 5100 1500 1300 360 305 305 79.8 -2.98 18.3 79.8 -2.98 18.3 9.1
Sport m 0.7 0.0 4500 1200 1000 240 175 175 79.8 -2.98 18.3 79.8 -2.98 18.3 9.1n 0.7 0.1 4700 1500 1300 420 425 425 79.8 -2.98 18.3 79.8 -2.98 18.3 9.1
Elders m 0.7 0.1 4500 1200 1000 80 60 60 79.8 -2.98 18.3 79.8 -2.98 18.3 9.1n 0.7 0.1 4500 1200 1000 130 100 100 79.8 -2.98 18.3 79.8 -2.98 18.3 9.1
Weights w 0.25 0.05 0.10
TABLE 4. FSE RESULTS FOR DIFFERENT CONSUMPTION GROUPS
Time ConcBabyfood Children
Adultmen
Adultwomen Pregnant
Nursingmothers Sport Elders
1 0.4 0.239 0.239 0.239 0.239 0.239 0.239 0.239 0.1913 0.4 0.400 0.380 0.377 0.377 0.376 0.376 0.377 0.3565 0.4 0.446 0.405 0.398 0.398 0.397 0.397 0.398 0.3911 0.6 0.254 0.243 0.240 0.240 0.240 0.240 0.240 0.2073 0.6 0.530 0.486 0.475 0.475 0.474 0.475 0.475 0.4835 0.6 0.558 0.498 0.476 0.476 0.474 0.474 0.475 0.4961 0.8 0.368 0.352 0.348 0.348 0.347 0.347 0.347 0.3423 0.8 0.591 0.535 0.522 0.522 0.521 0.521 0.522 0.5345 0.8 0.256 0.185 0.157 0.157 0.154 0.155 0.156 0.459
G.B. KOPRIVICA ET AL. OSMOTIC DEHYDRATION, SUGAR BEET, APPLE, RSM, FSE
Journal of Food Processing and Preservation •• (2013) ••–•• © 2013 Wiley Periodicals, Inc. 9
Kinetics parameters (WL and SG), sugars content ([S]and [IS]) and minerals content ([Na], [K], [Ca] and [Mg])were increased with the treatment time and concentration.SOP models for all system responses were statistically sig-nificant and predicted and observed responses correspondvery well. All investigated parameters (immersion time,osmotic solution concentration) had statistically significantinfluence on kinetic (WL, SG), minerals content ([K], [Na],[Ca], [Mg]), sugars content ([S], [IS]), color coordinatesvalues (Ls*, as*, bs*, Lc*, ac*, bc*) and texture (FF), duringOD of apples cubes in sugar beet molasses. The ANOVAand RSM were successfully used for determination of thesystem responses, all input variables were found statisticallysignificant while predicted and observed responses corre-spond well, with coefficients of determination in the rangeof 0.945–0.999. The proposed process conditions formaximum product quality were found to be osmotic timeof 3 h, sugar beet molasses concentration of 80% and tem-perature of 55C.
ACKNOWLEDGMENTS
The authors wish to express their gratitude to the Ministryof Education and Science of the Republic of Serbia for thefinancial support, TR-31055, and III 46005, 2011–2014.
REFERENCES
ALKALI, J.S., ARIAHU, C.C. and NKPA, N.N. 2006. Kinetics ofosmotic dehydration of mango. J. Food Process. Preserv. 30,597–607.
ALZAMORA, S.M., CASTRO, M.A., VIDALES, S.L., NIETO,A.B. and SALVATORI, D. 2000. The roll of tissuemicrostructure in the textural characteristics of minimallyprocessed fruits. In Minimally Processed Fruits and Vegetables,Fundamental Aspects and Applications (S.M., Alzamora, M.S.,Tapia and Malo López) pp. 153–171, A. Aspen Publishers Inc.,Gaithersburg, MD.
Anonymous 2003. The development of the dietary referenceintakes. Health Canada. Her Majesty the Queen in Right ofCanada Cat. (H44-47/2003E-HTML ISBN 0-662-34956-3).http://www.hc-sc.gc.ca/fn-an/nutrition/reference/index-eng.php (accessed January 1, 2013).
AZOUBEL, P.M. and MURR, F.E.X. 2003. Optimization of theosmotic dehydration of cashew apple (Anacardium occidentaleL.) in sugar solutions. Food Sci. Technol. Int. 9, 427–433.
BARRETT, S. 1997. Doing the DRIs: A no-nonsense guide to thenation’s new nutritional yardsticks. In Nutrition Forum.Prometheus Books, Amherst, NY.
BEKELE, Y. and RAMASWAMY, H. 2010. Going beyondconventional osmotic dehydration for quality advantage andenergy savings, review paper. EJAST 1(1), 1–15.
BERNARDI, S., BODINI, R.B., MARCATTI, B., RODRIGUESPETRUS, R. and EAVARO-TRINDADE, C.S. 2009. Quality
and sensorial characteristics of osmotically dehydrated mangowith syrups of inverted sugar and sucrose. Sci. Agric. 66(1),40–43.
BOX, G.E.P. and BEHNKEN, D.W. 1960. Some new three leveldesigns for the study of quantitative variables. Technometrics2, 455–475.
DEVAHASTIN, S. and NIAMNUY, C. 2010. Modelling qualitychanges of fruits and vegetables during drying: A review. Int.J. Food Sci. and Tech. 45(9), 1755–1767.
EREN, I. and KAYMAK-ERTEKIN, F. 2006. Optimization ofosmotic dehydration of potato using response surfacemethodology. J. Food Eng. 79, 344–352.
FILIPCEV, B. 2009. Nutrition Profile, Antioxidative Potential andSensory Quality of Bread Supplemented with Sugar BeetMolasses (in Serbian), University of Novi Sad, Faculty ofTechnology, Novi Sad, Serbia.
GANJLOO, A., RAHMAN, R.A., BAKAR, J., OSMAN, A. andBIMAKR, M. 2011. Kinetics modeling of mass transfer usingPeleg’s equation during osmotic dehydration of seedless guava(Psidium guajava L.): Effect of process parameters. FoodBioprocess Technol. 5, 2151–2159.
GRANT, G.T., MORRIS, E.R., REES, D.A., SMITH, P.J.C. andTHOM, D. 1973. Biological interactions betweenpolysaccharides and divalent cations: The egg-box model.FEBS Lett. 32, 195–198.
HAWKES, J. and FLINK, J.M. 1978. Osmotic concentration offruit slices prior to freeze dehydration. J. Food Process.Preserv. 2(4), 265–284.
ISPIR, A. and TOGRUL, I. 2009. Osmotic dehydration ofapricot: Kinetics and the effect of process parameters. Chem.Eng. Res. Des. 87(2), 166–180.
JACKMAN, R.L. and STANLEY, D.W. 1995. Perspectives in thetextural evaluation of plant foods. Trends Food Sci. Technol.6, 187–194.
KHOYI, M.R. and HESARI, J. 2007. Osmotic dehydrationkinetics of apricot using sucrose solution. J. Food Eng. 78(4),1355–1360.
KOPRIVICA, G., MIŠLJENOVIC, N., LEVIC, L.J. and PRIBIŠ, V.2009. Changes in nutritive and textural quality off appleosmodehydrated in sugar beet molasses and saccharosesolutions. APTEF 40, 47–55.
KUDRA, T. 2004. Energy aspects in drying. Drying Technol. 22,917–932.
LENART, A. and LEWICKI, P.P. 1987. Kinetics of osmoticdehydration of plant tissue. In Drying 87 (A.S. Mujumdar,ed.) pp. 239–248, Hemisphere Publication Corporation, NewYork.
LEWICKI, P.P. and LENART, A. 2006. Osmotic dehydration offruits and vegetables. In Handbook of Industrial Drying, 3-RdEdition (A.S. Mujumdar, ed.) pp. 665–688, Taylor & FrancisGroup, LLC, New York.
MADAMBA, P.S. 2002. The response surface methodology:An application to optimize dehydration operations ofselected agricultural crops. LWT Food Sci. Technol. 35,584–592.
OSMOTIC DEHYDRATION, SUGAR BEET, APPLE, RSM, FSE G.B. KOPRIVICA ET AL.
Journal of Food Processing and Preservation •• (2013) ••–•• © 2013 Wiley Periodicals, Inc.10
MERCALI, G.D., MARCZAK, L.D.F., TESSARO, I.C. andNORENA, C.P.Z. 2011. Evaluation of water, sucrose and NaCleffective diffusivities during osmotic dehydration of banana(Musa sapientum, shum.). LWT Food Sci. Technol. 44,82–91.
MIGNANI, I., GREVE, L.C., BEN-ARIE, R., STOTZ, H.U., LI,C., SHACKEL, K.A. and LABAVITCH, J.M. 1995. The effectsof GA3 and divalent cations on aspects of pectin metabolismand tissue softening in ripening tomato pericarp. Physiol.Plant. 93, 108–115.
MIŠLJENOVIC, N.M., KOPRIVICA, G. B., PEZO L.L., LEVIC,L.J.B., CURCIC, B.L.J., FILIPOVIC, V.S. and NICETIN, M.2012. Optimization of the osmotic dehydration of carrotcubes in sugar beet molasses. Thermal Science 16(1),43–52M.
MONTGOMERY D.C. 1984. Design and Analysis of Experiments,2nd Ed., Wiley, New York.
OZDEMIR, M., OZEN, B.F., DOCK, L.L. and FLOROS, J.D.2008. Optimization of osmotic dehydration of diced greenpeppers by response surface methodology. LWT Food Sci.Technol. 41, 2044–2050.
PELEG, M. 1988. An empirical model for the description ofmoisture sorption curves. J. Food Sci. 53(4), 1216–1218.
SHI, J. and LE MAGUER, M. 2002. Osmotic dehydration offoods: Mass transfer and modeling aspects. Food. Rev. Int. 18,305–336.
SINGH, B., PANESAR, P.S., NANDA, V. and KENNEDY, J.F.2010. Optimisation of osmotic dehydration process of carrotcubes in mixtures of sucrose and sodium chloride solutions.Food Chem. 123, 590–600.
TORRES, J.D., TALENS, P., ESCRICHE, I. and CHIRALT, A.2006. Influence of process conditions on mechanicalproperties of osmotically dehydrated mango. J. Food Eng. 74,240–246.
TORRES, J.D., TALENS, P., CAROT, J.M., CHIRALT, A. andESCRICHE, I. 2007. Volatile profile of mango (Mangiferaindica L.) as affected by osmotic dehydration. Food Chem.101, 219–228.
WANG, J.-H., LU, X.-G., JIANG, M., LI, X.-Y. and TIAN, J.-H.2009. Fuzzy synthetic evaluation of wetland soil qualitydegradation: A case study on the Sanjiang Plain, NortheastChina. Pedosphere 19(6), 756–764.
G.B. KOPRIVICA ET AL. OSMOTIC DEHYDRATION, SUGAR BEET, APPLE, RSM, FSE
Journal of Food Processing and Preservation •• (2013) ••–•• © 2013 Wiley Periodicals, Inc. 11