Embed Size (px)
Citation preview

International Commission of Agricultural Engineering (CIGR). E-Journal, Vol IV. www.ucd.ie/cigr/
International Commission of Agricultural Engineering (CIGR). E-Journal, Vol IV. www.ucd.ie/cigr/
EVALUATION OF FOUR CONSERVATION TILLAGE METHODS
IN THE SUGAR BEET CROP
C.K. Cavalaris, T.A. Gemtos
Laboratory of Farm Mechanisation, Department of Agriculture, University of Thessaly,
Fytoko Street, N. Ionia, Magnisias, 38446, Tel: +3042193228, Fax: +3042193144, e-
mail: [email protected]
ABSTRACT
In Greece there is a need for reducing sugar beet production costs and adopting
methods enhancing sustainable agriculture. Minimizing tillage operations by adopting
conservation tillage can provide significant energy and cost production savings.
Additionally, reduced or no-tillage can offer the opportunity to the farmers to conform
to the good management practices imposed by the EU. A three year conservation tillage
experiment was carried out in Central Greece in order to evaluate the profits. Tested
methods were: reduced tillage with a heavy cultivator (HC), rotary cultivator (RC), disk
harrow (DH) and no-tillage (NT) compared with a conventional tillage method (CT)
using plough. Reduced tillage methods caused an increase of weeds, of the soil dry bulk
density, penetration resistance and shear strength. Soil retained a greater amount of
water in the seedbed layer. As a result, crop emergence was facilitated in dry years.
Plant growth was better in the methods of CT and HC. Conservation tillage reduced
yields compared to CT method, by 1,2-8,9% in the HC by 19,7-34,3% in the RH, by
20,4-31,3% in the DH and by 26,1-46,6% in the NT.
Keywords: Conservation tillage, Reduced tillage, No-tillage, Sugarbeet.
INTRODUCTION
Sugar beet is the fifth most important arable crop in Greece. (National Statistics
Bureau, 2000). EU’ s CAP reform and the World Trade Agreement resulted in lower
prices. Farmers are under pressure to reduce production costs to remain competitive. At
the same time EU Agenda 2000 and the directive for good agricultural practices require
the adoption of cultivation techniques friendly to the environment. Tillage is a labour
and energy intensive field work (Larney, et al., 1988, Hernanz et al., 1995). It can have
considerable effects to the crops (Ekeberg and Riley, 1997), the soil (Watts et al., 1996)
and the environment (Uri et al, 1998). In Greece farmers are ploughing their fields for
spring-sown crops every autumn before the rainy period which starts in November or
December. Fields are left undisturbed until seedbed preparation. For sugar beet crop
they start seedbed preparation in February to drill the crop by the end of February or
March. Seedbed preparation is accomplished by several passes of disk or tooth harrows.
In the recent years rotary tillers were imported and used, especially in dry years.
In Greece limited data exist on the use of minimum or no-tillage methods of crop
establishment. Gemtos et al. (1998) have presented data of successful wheat
establishment with minimum tillage, after cotton crop. In an experiment contacted at
Northern Greece, Doundoulakakis (1992) found that establishment of sugar beet crop
planted under no-till with a winter wheat cover crop was one week earlier and stands

International Commission of Agricultural Engineering (CIGR). E-Journal, Vol IV. www.ucd.ie/cigr/
International Commission of Agricultural Engineering (CIGR). E-Journal, Vol IV. www.ucd.ie/cigr/
were 9,4% more than with conventional tillage. Generally speaking the data on
conservation tillage are limited for Greek conditions and this is a draw back for any
attempt to enhance minimum tillage adaptation by Greek farmers although international
data suggest that a lot of benefits can be expected for the farmers and the environment.
A serious problem caused by conventional tillage practices is soil erosion. In
Greece 34% of the arable land is in slopes. Mitsios et al. (1995) estimated that about
150-300 million tones of fertile soil are removed annually from the surface with
erosion. Conservation tillage is defined as any tillage and planting system that keeps at
least 30% of the soil surface covered by residue after planting and includes such
practices as no-tillage, ridge tillage, strip tillage, mulch tillage and reduced tillage.
Covering the soil surface with crop residue provide significant protection from soil
erosion (James and Russell, 1996). The plant residue also impedes evaporation of soil
water keeping the upper layer moist (Gantzer and Blake, 1978). Increased soil moisture
in the seedling depth advance emergence of the seedlings (Giles et al., 1995, Gemtos
and Lellis, 1997).
Another serious problem, which had led to serious soil degradation of the arable
Greek lands is the compaction caused by heavy machinery. In conventional tillage there
is intensive use of heavy machinery for field operations such as large tractors and
harvesters. Cooke and Scott (1993), found in Germany that the intensity of freight
movement in the field, for the sugar beet crop is about 300 - 400 t*km/ha for the whole
productive period. Up to nine passes might be necessary just for seedbed preparation,
application of fertilisers, herbicides and planting. Compaction decreases soil porosity
and water capacity and adversely affects crop establishment, plant growth and final
yield (Arvidsson and Hakansson, 1996, Gemtos and Lellis, 1997). With reduced tillage
however traffic in the field is minimised and compaction is prevented (Chancellor,
1977). In addition soil aggregate stability is increased and strength to compaction is
improved (Mahboubi and Lal, 1998).
In the sugar beet crop, about 30% of the plant mass is allocated in the tops and
usually return to the field as green manure. In conservation tillage systems the organic
matter of the upper layer of the soil is gradually increased due to the decomposition of
crop residue (Hao, 2001). Increased organic matter improves soil structure and fertility
and prevents compaction (Haiquan et al., 1997, Thomas et al., 1996).
As a result of the improved soil properties, the yield of the crop is increased.
According to Koch et al. (1994), sugar beet yields with reduced tillage are similar to
that of beets grown in ploughed soil when the N-application is increased. N-fertilization
during the first years of adoption of conservation methods of tillage must be increased
because the soil micro-organisms that decompose the crop residue compete with the
crop for N usage (McConnell et al., 1994).
Miller and Dexter (1983) found that yield of sugar beet in no-tillage is equal to that
of conventional tillage if there is sufficient control of weeds. Hao et al. (2001) also
found no significant reduction in sugar beet yield when ploughing was substituted by
chisel cultivation. According to Dragovic (1982) there is no significant improvement in
sugar beet yields by deep tillage. However by reducing tillage depth to 12-18 cm
Koowenhoven, (2002) found a reduction in sugar beet yield up to 9% compared with
mouldboard ploughing at a depth of 20-30 cm.
In order to investigate the margins for reducing the intensity of tillage in the sugar
beet crop by identifying the effects on soil compaction, soil moisture conservation,
weed control, crop emergence, growth, yield and product profits, as well as energy
consumption, a three-year experiment was established in 1997 at the Farm of
University of Thessaly, in Velestino, Central Greece

International Commission of Agricultural Engineering (CIGR). E-Journal, Vol IV. www.ucd.ie/cigr/
International Commission of Agricultural Engineering (CIGR). E-Journal, Vol IV. www.ucd.ie/cigr/
MATERIALS AND METHODS
The experiment was carried out in two fields, a silty - clay (sand 9.7%, silt 41.1, clay
49.2, O.M. 1.26%) and a clay (sand 20.1%, silt 32.7%, clay 47.1%, O.M. 1.08). The
experimental design was split strip blocks with four replications. Main plots had a
width of 6 m with twelve rows of sugar beets and a length of 10 m. Five methods of
tillage:
1. Conventional tillage (CT) with ploughing at 25-30 cm in autumn and 2-3 passes
of a disk harrow at 7-9 cm or a light cultivator at 6-8 cm for seedbed preparation.
2. Reduced tillage (HC) using a heavy cultivator at a depth of 20-25 cm or a
subsoiler at 30-35 cm and 2 passes of a disk harrow or a light cultivator for
seedbed preparation.
3. Reduced tillage (RC) with one pass of a rotary cultivator at 10-15 cm for primary
tillage, and one or two passes of a disk harrow or a light cultivator before
planting.
4. Reduced tillage (DH) Primary and secondary tillage with a disk harrow at 6-8 cm.
One or two passes in autumn or early in the winter for residue management and
weed destruction and one or two passes for seedbed preparation before planting
the crop. In the third year a field cultivator was used for secondary tillage
5. No-tillage (NT). Direct planting using a conventional pneumatic planting machine.
The weeds were destroyed with glyphosate application within one week after
planting the crop.
Sub-plots included two local varieties of sugar beet. RHIZOR which is considered
resistant to rhizomania and TURBO, which is an early maturing one. Sugar beet were
grown in rotation with other common crops in Greece as shown in Table 1.
A conventional seeder was used for planting. Fifteen seeds/m were placed in rows
50 cm apart and at a depth of 3 cm. Five plants per m were left after thinning.
Fertilization for the first year was based on soil analysis and the recommendations of
the Hellenic Sugar Industry. In the silty-clay field a basic dressing was applied by
incorporating 50, 110 and 350 units of N, P, and K respectively per ha, while in the clay
field fertilization applied at 120, 110 and 300 units of N, P and K respectively per ha.
For the other two years fertilization was applied according to local conventional
practices 140, 70 and 20 units of N, P and K respectively per ha applied in both fields.
In both fields, two to three sprayings with a mixture of low doses of the herbicides:
(phenmedipham, enthofumesate, metamitron and paraffinic oil, each at 500g\ha) were
carried out each year to control broad leave weeds. In addition, one or two sprayings
were done with haloxyphop at about 800g\ha to control cereals. In order to obtain better
control during the third year 10 kg/ha metamitron were incorporated into the soil before
planting. Two manual hoeing were applied in 1997 and 1998 and one in 1999. Each
year, about 500 mm of water were applied during the growing period using a drip
irrigation system with pipes placed every two beet rows (1 m apart). A prolonged
period of draught after planting in 1998 a water application was necessary to enhance
crop emergence. In the clay field irrigation was applied one week later than in the silty-
clay field. Harvesting was done by hand by extracting plants from two rows of 7,5 m
long in each plot. In Table 2 the timetable of the field operations for each year is
presented.

International Commission of Agricultural Engineering (CIGR). E-Journal, Vol IV. www.ucd.ie/cigr/
International Commission of Agricultural Engineering (CIGR). E-Journal, Vol IV. www.ucd.ie/cigr/
Table 1. Rotations of sugar beet crop
Previous crops First year crops Second year crops Third year crops
(1996) (1997) (1998) (1999)
Rotation 1 Cotton Cotton Sugar beet Corn
Rotation 2 Cotton Corn Sugar beet Cotton
Rotation 3 Wheat* Cotton Corn Sugar beet
Rotation 4 Wheat* Sugar beet Cotton Corn
* Only in the silty-clay field. In they clay field a cotton crop existed
Sub-plots included two local varieties of sugar beet. RHIZOR which is considered
resistant to rhizomania and TURBO, which is an early maturing one. Sugar beet were
grown in rotation with other common crops in Greece as shown in Table 1.
A conventional seeder was used for planting. Fifteen seeds/m were placed in rows 50
cm apart and at a depth of 4 cm. Five plants per m were left after thinning. Fertilization
for the first year was based on soil analysis and the recommendations of the Hellenic
Sugar Industry. In the silty-clay field a basic dressing was applied by incorporating 50,
110 and 350 units of N, P, and K respectively per ha, while in the clay field fertilization
applied at 120, 110 and 300 units of N, P and K respectively per ha. For the other two
years fertilization was applied according to local conventional practices 140, 70 and 20
units of N, P and K respectively per ha applied in both fields.
Table 2. Field operations for the five methods of tillage for each year.
CT HC RC DH NT CT HC RC DH NT CT HC RC DH NT
Primary tillage
Ploughing + + +
Heavy cultivator + +
Subsoiler +
Rotary cultivator + + +
Disk harrow ++ + ++
Secondary tillage
Disk harrow ++ ++ ++ ++ ++ + + +
Field cultivator ++ ++ + +
Glyphosate application 26/3 8/4 5/3
Fertilization
Metamitron incorporation
planting
Sprinkler irrigation
Halloxyphop application
thining
Manual hoeing
Harvest
28/5 & 5/7
10/10
20/3 6/4
18/5 15/5
5/5 & 12/6
19/10
21/4 (29/4)
1997 1998 1999
26/3
2/4
11/11
17/3
20/1
25/2
28/4
28/5
30/9
3/3
4/3
Low doses herbicide
application
9/5 16/4 & 20/6
14/4 & 23/4 & 18/627/4 & 4/56/5 & 13/5
28/4
3/3
3/419/3

International Commission of Agricultural Engineering (CIGR). E-Journal, Vol IV. www.ucd.ie/cigr/
International Commission of Agricultural Engineering (CIGR). E-Journal, Vol IV. www.ucd.ie/cigr/
In both fields, two to three sprayings with a mixture of low doses of the herbicides:
(phenmedipham, enthofumesate, metamitron and paraffinic oil, each at 500g\ha) were
carried out each year to control broad leave weeds. In addition, one or two sprayings
were done with haloxyphop at about 800g\ha to control cereals. In order to obtain better
control during the third year 10 kg/ha metamitron were incorporated into the soil before
planting. Two manual hoeing were applied in 1997 and 1998 and one in 1999. Each
year, about 500 mm of water were applied during the growing period using a drip
irrigation system with pipes placed every two beet rows (1 m apart). Because a
prolonged period of draught prevailed after planting in 1998, sprinkler irrigation was
necessary to enhance crop emergence. In the clay field irrigation was applied one week
later than in the silty-clay field. Harvesting for yield estimation was done by hand by
extracting plants from an area of 7,5 m2 in each plot. The rest of the area was harvested
with a conventional sugar beet harvester after taking the samples. In Table 2 the
timetable of the field operations for each year is presented.
Soil physical properties, weed biomass and plant’s growth measurements were
carried out each year.
Weed dry biomass was estimated by sampling the aerial part of the plants at two
random square sampling areas in each plot. Squares had dimensions of 50 cm. The
weeds were weighed and samples were oven dried at 720C for 48 h. Dry mass per m
2
for each plot was calculated.
Soil dry bulk density and moisture content were measured at the beginning of each
period at two depths, 0,5-3 cm and 7,5-10 cm. Sampling for dry bulk density was made
by means of metal cores with a diameter of 70 mm and a height of 25 mm. Soil
moisture content was estimated into the same samples by oven drying at 1040C for 48
h. Soil shear strength and penetration resistance was also measured during the period
of root development. Shear strength was measured by means of a shear vane at depths
of 5, 10, 15, 20 and 25 cm. The vane had a height of 5 cm and a width of 2,5 cm. Three
sets of measurements were taken at each plot and a mean for each sampling depth was
calculated. Penetration resistance was measured with a Bush soil penetrometer
supporting a cone with base diameter 12,83 mm. Measurements were taken at intervals
of 1 cm to a final depth of 35 cm. Five measurements were taken on each plot and
average values for intervals of 5 cm were calculated.
During emergence of the crop, beet populations were monitored every three to five
day intervals. Measurements were carried out at two marked rows, 1 m long, on each
plot. During the growing periods, the leaf area was monitored. From each plot plants of
a row of 1 m were collected. LAI was estimated by comparing the leaves with
templates of known area. In addition, during the second and third year, the length, the
max diameter and the angle of development of the sampled plants were monitored.
Yield was measured in October of each year, the middle of the harvesting period in
Greece. Two rows of a length of 7,5 m were collected by hand from each plot. The tops
were removed with knife and the fresh relative weight of roots and tops was measured.
Root samples were analysed by the Hellenic Sugar Industry for the sucrose content and
the Na and N-impurities.
An instrumented tractor described by Gemtos and Tsiricoglou (1994) and Gemtos et
al. (2000) was used for the tillage operations to estimate the energy consumed for the
five tillage treatments. The implements measured draft forces, PTO torque and turning
velocity as well as travelling speed of the tractor. The data were used to estimate the
energy consumed through traction and through PTO i.e. the net energy for tillage.
Energy for tractor movement and the other energy spent were not taken into account.
International Commission of Agricultural Engineering (CIGR). E-Journal, Vol IV. www.ucd.ie/cigr/
International Commission of Agricultural Engineering (CIGR). E-Journal, Vol IV. www.ucd.ie/cigr/
RESULTS
Weeds
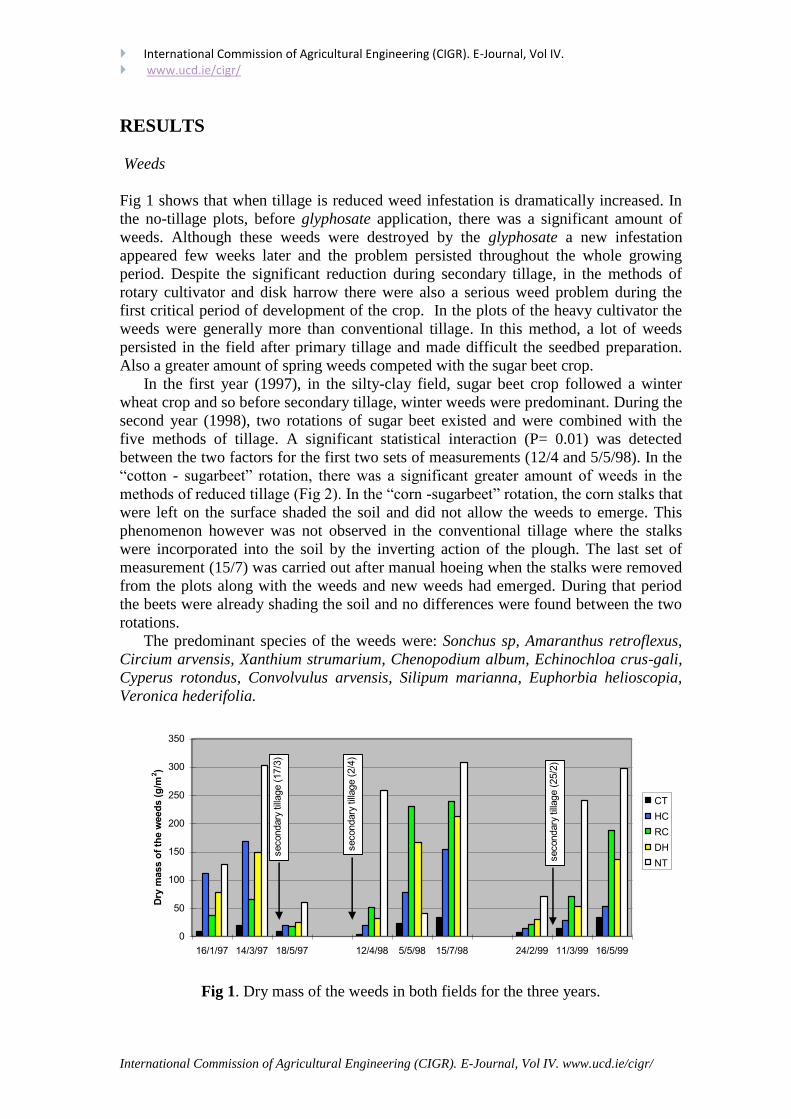
Fig 1 shows that when tillage is reduced weed infestation is dramatically increased. In
the no-tillage plots, before glyphosate application, there was a significant amount of
weeds. Although these weeds were destroyed by the glyphosate a new infestation
appeared few weeks later and the problem persisted throughout the whole growing
period. Despite the significant reduction during secondary tillage, in the methods of
rotary cultivator and disk harrow there were also a serious weed problem during the
first critical period of development of the crop. In the plots of the heavy cultivator the
weeds were generally more than conventional tillage. In this method, a lot of weeds
persisted in the field after primary tillage and made difficult the seedbed preparation.
Also a greater amount of spring weeds competed with the sugar beet crop.
In the first year (1997), in the silty-clay field, sugar beet crop followed a winter
wheat crop and so before secondary tillage, winter weeds were predominant. During the
second year (1998), two rotations of sugar beet existed and were combined with the
five methods of tillage. A significant statistical interaction (P= 0.01) was detected
between the two factors for the first two sets of measurements (12/4 and 5/5/98). In the
“cotton - sugarbeet” rotation, there was a significant greater amount of weeds in the
methods of reduced tillage (Fig 2). In the “corn -sugarbeet” rotation, the corn stalks that
were left on the surface shaded the soil and did not allow the weeds to emerge. This
phenomenon however was not observed in the conventional tillage where the stalks
were incorporated into the soil by the inverting action of the plough. The last set of
measurement (15/7) was carried out after manual hoeing when the stalks were removed
from the plots along with the weeds and new weeds had emerged. During that period
the beets were already shading the soil and no differences were found between the two
rotations.
The predominant species of the weeds were: Sonchus sp, Amaranthus retroflexus,
Circium arvensis, Xanthium strumarium, Chenopodium album, Echinochloa crus-gali,
Cyperus rotondus, Convolvulus arvensis, Silipum marianna, Euphorbia helioscopia,
Veronica hederifolia.
0
50
100
150
200
250
300
350
16/1/97 14/3/97 18/5/97 12/4/98 5/5/98 15/7/98 24/2/99 11/3/99 16/5/99
Dry
mass o
f th
e w
eed
s (
g/m
2)
CT
HC
RC
DH
NT
secondary
till
age (
17/3
)
secondary
till
age (
25/2
)
secondary
till
age (
2/4
)
Fig 1. Dry mass of the weeds in both fields for the three years.

International Commission of Agricultural Engineering (CIGR). E-Journal, Vol IV. www.ucd.ie/cigr/
International Commission of Agricultural Engineering (CIGR). E-Journal, Vol IV. www.ucd.ie/cigr/
0
50
100
150
200
250
300
350
400
12/4 5/5 15/7
Dry
mass o
f th
e w
eed
s (
g/m
2)
CT
HC
RC
DH
NT
Cotton - Sugarbeets
1998
0
50
100
150
200
250
300
350
400
12/4 5/5 15/7
Dry
mass o
f th
e w
eed
s (
g/m
2)
Corn - Sugarbeets
Fig 2. Dry mass of the weeds in both fields for the two rotations in 1998.
Soil properties
Reduced tillage plots presented a higher bulk density (Table 3). Differences were
greater at the upper layer of the soil. Greater values were found in no-tillage plots. On
the second and third year bulk density was further increased because no soil loosening
operations were performed to alleviate the compaction caused by tractor and machinery
traffic. As a result, soil porosity was low and at a depth of 7,5-10 cm it was less than
40%. The methods of disk harrow and rotary cultivator presented also higher bulk
densities at a depth of 7,5 -10 cm. The most loose soil surface was found in
conventional tillage with bulk densities ranging from 1,05 - 1,15 g/cm3. As a result,
soil porosity was about 60%.
Table 3. Dry bulk density of the soil
0.5-3 cm 7.5-10 cm 0.5-3 cm 7.5-10 cm 0.5-3 cm 7.5-10 cm
CV (%) 8,44 6,82 9,81 7,80 9,86 6,96
Conventional 1,09 1,27 1,16 1,42 1,09 1,36
Heavy cultivator 1,13 1,27 1,19 1,44 1,10 1,42
Rotary cultivator 1,18 1,37 1,29 1,54 1,21 1,47
Disk harrow 1,16 1,38 1,27 1,56 1,21 1,47
No-tillage 1,31 1,45 1,46 1,60 1,48 1,59
** ** ** * ** **
LSD (P = 95%) 0,10 0,09 0,13 0,12 0,12 0,11
Location X Tillage ns ns ns ns ns ns
26/3/97 22/4/98 11/3/99
Dry bulk density (g/cm3)

International Commission of Agricultural Engineering (CIGR). E-Journal, Vol IV. www.ucd.ie/cigr/
International Commission of Agricultural Engineering (CIGR). E-Journal, Vol IV. www.ucd.ie/cigr/
Penetration resistance of the soil is a function of tillage depth and soil moisture
content. At the upper layer of the soil (0-10 cm) resistance was greater in no-tillage.
The methods of disk harrow and rotary cultivator presented a looser surface while the
loosest were found in the methods of heavy cultivator and conventional tillage. At a
greater depth however, penetration resistance in the methods of disk harrow and rotary
cultivator was increased. Especially in the method of disk harrow, a peak can be
noticed at a depth of about 10-cm, just beyond the tillage depth. The increased
penetration resistance indicates the existence of a compacted layer at that depth caused
probably by the tillage implement. Concave side of the disks can cause compaction
below the working depth. From the tillage implements used, disk harrow was the only
towed which means that all the weight is transferred to the soil by the concave side of
the disks. The implement weighed about 1 t and in the method of (DH) it was used both
for primary and secondary tillage, operating at about the same depth three to four times
repeatedly. The soil beyond the tillage depth in the method of disk harrow was
undisturbed and so compaction was concentrated on a thin layer beyond depth of
tillage. In the other methods of tillage however, the disk harrow was used only for
secondary tillage and the soil was already loosened at a greater depth by the
implements of primary tillage. The loose subsoil was subjected to compaction at a
greater depth and no compact layer was detected. The loosest soil to a depth of 25 cm
was found again in the methods of heavy cultivator and conventional tillage. In Fig 3
the results of two sets of measurements are presented, the first at 20/7/97 and the
second at 10/6/98.
Penetration resistance (kPa) Penetration resistance (kPa)
Dep
th (
cm
)
Dep
th (
cm
)
0
5
10
15
20
25
30
35
500 1000 1500 2000 2500
CT
HC
RC
DH
NT
LSD0,0520/7/97
0
5
10
15
20
25
30
35
500 1000 1500 2000 2500
LSD0,05
10/6/98
ns
ns
ns
Fig 3. Penetration resistance. Average over the two fields.

International Commission of Agricultural Engineering (CIGR). E-Journal, Vol IV. www.ucd.ie/cigr/
International Commission of Agricultural Engineering (CIGR). E-Journal, Vol IV. www.ucd.ie/cigr/
Shear strength (kPa) Shear strength (kPa)
Dep
th (
cm
)
Dep
th (
cm
)
0
5
10
15
20
25
0 60 120 180
CT
HC
RC
DH
NT
LSD0,05
20/5/98
0
5
10
15
20
25
0 60 120 180
LSD0,05
21/6/99
Fig 4. Shear strength of the soil. Average over the two fields
Results of soil shear strength were similar to those of penetration resistance. At a
depth of 5 cm the soil of the methods of conventional tillage and heavy cultivator
presented lower shear strength as a result of the great shear forces which caused soil
loosening during tillage. At the same depth, shear strength in the plots with rotary
cultivator and disk harrow was greater while the more compact soil was detected in the
method of no-tillage (Fig 4). At a depth of 10 cm the methods of rotary cultivator and
disk harrow presented also high shear strength, which sometimes were greater of that of
no-tillage. As with penetration resistance, shear strength of the soil is also a function of
tillage depth and soil moisture content but also a function of root existence in the soil.
At depths where no tillage operation was performed the roots of previous crops
impeded the revolution of the shear vane resulting in greater shear stresses. The loosest
soil up to a depth of 25 cm was found in the method of conventional tillage followed by
the method of heavy cultivator. Mouldboard ploughs apply great stresses during tillage
that cause shear planes and results in soil loosening.
Soil moisture content is a function of soil dry bulk density and soil coverage by
crop residue and weeds and therefore statistical significant differences were detected
among the methods of tillage (Table 4). Differences were greater at the upper layer of
the soil where fluctuation was greater. The higher moisture content was found in the
no-tillage plots. Next were the methods of disk harrow and rotary cultivator. These
methods had a relatively compact soil surface with a higher bulk density. High bulk
density results to lower porosity and consequently reduced air circulation and water
vapour losses. Soil surface also was covered by crop residue, which impeded solar
radiation from reaching the soil and reduced water evaporation. The lower moisture

International Commission of Agricultural Engineering (CIGR). E-Journal, Vol IV. www.ucd.ie/cigr/
International Commission of Agricultural Engineering (CIGR). E-Journal, Vol IV. www.ucd.ie/cigr/
content was found at the method of conventional tillage, which had a loose soil with a
total porosity about 60% while the soil surface was completely uncovered.
Table 4. Soil moisture content
26/3 20/4 8/5 21/4 12/5 15/5 11/3 17/4 16/5
CV (%) 6,06 5,58 6,80 5,77 8,07 7,68 6,11 6,08 7,58
0,5 - 3 cm
Conventional 20,82 18,01 17,36 5,52 23,19 17,73 11,41 15,90 17,79
Heavy cultivator 22,88 19,15 17,88 6,97 25,29 18,90 11,90 15,92 17,07
Rotary cultivator 25,55 20,83 20,42 11,71 27,79 20,87 21,01 20,97 20,47
Disk harrow 24,23 19,86 18,71 9,60 27,60 21,23 21,27 20,30 20,32
No-tillage 24,04 24,32 23,17 11,42 28,78 25,72 27,13 22,73 18,35
** ** ** ** ** ** ** ** **
LSD (P = 95%) 1,85 1,42 1,79 0,72 2,71 1,62 1,11 1,63 1,84
7,5-10 cm
Conventional 29,68 25,09 25,09 15,77 29,94 24,63 22,02 26,03 25,63
Heavy cultivator 30,78 26,18 25,88 16,66 30,40 24,89 23,70 27,25 25,99
Rotary cultivator 34,09 25,86 25,93 20,14 30,86 26,75 26,98 30,26 29,49
Disk harrow 33,32 28,11 26,43 21,67 31,34 27,25 27,07 30,89 29,38
No-tillage 32,69 28,83 28,28 20,75 31,26 27,57 32,54 32,27 27,95
** ** ** ** ns ** ** ** **
LSD (P = 95%) 1,62 1,21 1,29 0,93 - 1,65 1,67 1,30 1,69
Location X Tillage ns ns ns ns ns ns ns ns ns
Depth X Tillage ns ** * ** ns ** ** ns ns
Soil moisture content (% vol)
1997 1998 1999
At 20/4/97 and 8/5/97, 12/5/98 and 15/5/98 and 16/3/99 the soil in the method of
no-tillage presented the highest moisture content. During those periods, the weeds in
the method were destroyed by the action of the glyphosate and had created mulch over
the soil surface, which impeded evaporation. At 26/3/97 and 21/4/98, however, the
weeds were still alive. Also at 20/4/99 and 8/5/99, about two months after the
glyphosate application, new weeds had emerged. Although the weeds were covering
again the soil and impeded evaporation they also pumped soil water through
transpiration. As a result, the soil moisture content was at the levels of rotary cultivator
and disk harrow. At 12/5/98 measurements were made a couple of days after a heavy
rainfall. Average soil moisture content was high and differences were detected only at
the upper layer of the soil.
No significant interactions were found between location and tillage for moisture
content. There was however a significant interaction between sampling depth and
method of tillage when average soil moisture content was low. In that case, differences
between the methods of tillage were much greater at the upper layer of the soil.
Crop emergence
Results of the three years show no consistency. 1997 was a year with normal rainfall
during spring. A rain occurred a day after planting and enhanced crop emergence.
However emergence progress was differentiated between the two fields. In the silty-
clay field, emergence was delayed and a lower population was obtained with no-tillage

International Commission of Agricultural Engineering (CIGR). E-Journal, Vol IV. www.ucd.ie/cigr/
International Commission of Agricultural Engineering (CIGR). E-Journal, Vol IV. www.ucd.ie/cigr/
(Fig 5a). In the clayey field however, no-tillage, along with disk harrow favoured an
earlier crop emergence and a larger final population (Fig 5b).
Silty-clay field Clay field
Days after planting
Days after planting
Days after planting
0
10
20
30
40
50
60
70
14 17 20 23 27
em
erg
en
ce (
%)
0
10
20
30
40
50
60
70
14 17 20 23 27
1997a b
0
10
20
30
40
50
60
15 18 21 24 27 30 33 36 39 42 45
em
erg
en
ce (
%)
0
10
20
30
40
50
60
15 18 21 24 27 30 33 36 39 42 45
1998c d
0
10
20
30
40
50
60
70
19 22 25 28 31 35 39
em
erg
en
ce (
%)
0
10
20
30
40
50
60
70
19 22 25 28 31 35 39
ConventionalHeavy CultivatorRotary CultivatorDisk HarrowNo-Tillage
1999e f
Fig 5. Crop emergence for the five methods of tillage on the two fields and the three
years of experimentation.
Differences are attributed to the different rotations in each field during that year. In
the silty-clay field sugar beets followed a winter wheat crop while in the clay field,
beets followed a cotton crop. In the winter wheat rotation, the excessive mulch impeded
the covering mechanisms of the conventional planter to work efficiently when no-
tillage was applied and so a greater amount of seed were left uncovered in the slot.

International Commission of Agricultural Engineering (CIGR). E-Journal, Vol IV. www.ucd.ie/cigr/
International Commission of Agricultural Engineering (CIGR). E-Journal, Vol IV. www.ucd.ie/cigr/
Additionally, straw was incorporated into the soil with seed and it is possible to cause
toxins production during decomposition. In the cotton rotation however, the woody
crop residue was in small quantities and a better coverage of the seed was obtained.
Provided an improved seed coverage, the higher soil moisture content retained in the
methods of reduced tillage, favoured emergence of the seeds.
1998 was a year with a prolonged period of draught after planting. In conventional
tillage, in both fields, emergence started only after irrigation was applied (Fig 5c,d). In
the methods of reduced tillage however, emergence was able to start even without
irrigation. Especially in the method of rotary cultivator, in the silty-clay field, the
emergence progress could have been completed without the addition of any water. It
seems, the higher moisture content retained in the soil with reduced tillage is a crucial
factor to obtain a satisfactory population in dry years. Such an advantage however
wasn’t obtained in the method of no-tillage, even though the soil had the highest water
content. After the first year of no-tillage, soil surface became more compact and
cohesive. Under these conditions, the planter had difficulty to penetrate the soil while
no loose soil was found by the covering mechanisms to cover the seed. In addition, crop
residue on the soil surface exacerbated the task. As a result, the greater amount of the
seed were left uncovered in the slot or buried by a thin soil layer where the moisture
content wasn’t enough for emergence to proceed. As with conventional tillage,
emergence started only after irrigation was applied.
1999 was a year with excessive rainfall after planting. While soil moisture content
wasn’t a restricting factor emergence started in all methods of tillage at the same time
and no advantage was revealed for the reduced methods of tillage (Fig 5e,f). Even
though the seed in the method of no tillage was again poorly covered it emerged quite
well and a higher population was achieved. The repeated rains after planting kept the
surface wet for as long as the emergence was completed. As the seed was placed on a
smaller depth it was much easier for it to emerge.
In all three years a satisfactory final population was achieved. Statistical significant
differences between the five methods were obtained only for the second and third year
(Table 5). Interaction between location and tillage was found only for the first year,
which however was attributed to the different rotations. No interaction was obtained
between variety and tillage.
Table 5. Final populations of sugar beets for the five methods of tillage.
1997 1998 1999 combined
CV (%) 16,3 17,6 15,4 15,8
Conventional 15,81 13,78 17,38 15,66
Heavy cultivator 16,56 13,19 16,88 15,54
Rotary cultivator 15,38 12,69 14,38 14,15
Disk harrow 16,75 10,78 15,19 14,24
No-tillage 15,06 12,28 17,75 15,03
ns ** ** **
LSD (P = 95%) 1,10 1,78 0,60
Year Χ Tillage **
Location Χ Tillage * ns ns *
Variety Χ Tillage ns ns ns ns
plants / m2

International Commission of Agricultural Engineering (CIGR). E-Journal, Vol IV. www.ucd.ie/cigr/
International Commission of Agricultural Engineering (CIGR). E-Journal, Vol IV. www.ucd.ie/cigr/
Crop development
Measurements of leaf area index revealed a better growth in the method of conventional
tillage for all three years (Table 6). Second best growth was detected in the method of
heavy cultivator while the beets in the methods of rotary cultivator and disk harrow
presented a restricted growth. The worst growth, with a poor canopy was found in the
method of no-tillage. For every year, a location X tillage interaction was found.
Generally, plants growth was better in the silty-clay field where the differences between
the methods of tillage where greater.
Table 6. Leaf area index for the five methods of tillage
22/6 1/7 10/7 22/5 12/6 2/7 10/5 6/6 26/6
CV (%) 23,6 15,9 12,6 33,8 17,4 12,1 24,1 19,5 15,8
Conventional 3,10 3,98 4,33 0,14 1,40 2,49 1,40 2,68 4,16
Heavy cultivator 2,85 3,76 4,24 0,28 1,53 2,42 1,10 1,91 3,93
Rotary cultivator 2,19 3,04 3,64 0,31 1,35 1,89 0,59 1,22 2,49
Disk harrow 1,73 2,79 3,34 0,28 1,34 1,84 0,68 1,24 2,66
No-tillage 1,63 1,97 2,58 0,08 0,95 1,62 0,61 1,32 2,72
** ** ** ** ** ** ** ** **
LSD (P = 95%) 0,39 0,35 0,32 0,04 0,11 0,12 0,15 0,23 0,36
Location Χ Tillage ** ** ** ** ** ns * ns ns
Variety Χ Tillage ns ns ns ns ns ns ns ns ns
1999
Leaf area index
1997 1998
Measurements of the root growth during the second and third year proved that the
differences found for the above ground growth are related with differences of the root
development. Regression analysis between leaf area index and root length shown a
significant correlation at P<0,01 between the two parameters (r = 0,79 for 1998 and r =
0,71 for 1999). A significant correlation at P<0,01 was also found between leaf area
index and root max diameter (r = 0,86 for 1998 and r = 0,72 for 1999).
Table 7 presents the results of the first and the last measurement of root growth for
each year. Beets in the methods of deep tillage, i.e. conventional tillage and tillage with
heavy cultivator were longer and had a larger diameter except for conventional tillage
at 2/6/98. During that year, emergence in the method of conventional tillage was
delayed and until the first date of measurement the beets did not achieve the growth of
the earlier emerged beets. One month later however, the deeper loosened soil helped the
plants to develop a more vigorous root which in turn, favoured above ground growth. In
the method of no tillage, on the contrary, where a compact soil layer impeded the root
growth, the roots presented a smaller diameter and were developing on a smaller depth.
It is also remarkable to notice that the roots in the methods of rotary cultivator and
disk harrow had not a vertical pattern of development but formed an angle at about the
depth of tillage (Fig 6). It is obvious that when the tip of the roots reached the lower
point of tilled soil it met a hard subsoil in which it had difficulty to penetrate. So, roots
preferred a horizontal development on the loose soil layer. Such a phenomenon was not
detected in the method of no-tillage where the soil was evenly compact at all depths.

International Commission of Agricultural Engineering (CIGR). E-Journal, Vol IV. www.ucd.ie/cigr/
International Commission of Agricultural Engineering (CIGR). E-Journal, Vol IV. www.ucd.ie/cigr/
When beets did not have a more favourable layer to develop their roots, the plants
formed a vertical main root, which however had a smaller length and diameter.
Table 7. Root development for the five methods of tillage
2/6 2/7 2/6 2/7 2/6 2/7 10/5 15/6 10/5 15/6 10/5 15/6
CV (%) 18,0 11,5 23,5 13,5 63,4 29,6 21,2 12,4 25,3 12,5 56,6 22,6
Conventional 10,5 20,3 1,4 5,4 18,5 21,1 14,0 29,8 2,1 9,2 4,9 21,6
Heavy cultivator 11,2 20,0 1,9 5,5 19,6 19,5 12,9 27,8 1,7 8,6 7,8 15,8
Rotary cultivator 11,1 17,4 1,9 5,0 33,4 39,6 7,9 18,7 1,3 7,0 33,9 39,9
Disk harrow 11,0 17,0 2,2 4,5 37,4 43,3 9,0 18,7 1,3 7,1 36,2 39,6
No-tillage 8,6 16,3 1,2 4,0 18,1 23,8 7,0 21,0 1,1 5,8 9,9 18,4
** ** ** ** ** ** ** ** ** ** ** **
LSD (P = 95%) 0,9 1,0 0,2 0,3 8,0 4,3 1,5 2,0 0,3 0,7 7,5 4,4
Location Χ Tillage * * ** ns ns ns ** ns ns ns ns ns
Variety Χ Tillage ns ns ns ns ns ns ns ns ns ns ns ns
1998 1999
Root length Root angle Root length Root angle
Root
diameter
Root
diameter
Fig 6. Typical patterns of root growth for the five methods of tillage in 2/6/98. During
that period, the roots in the method of conventional tillage were thinner because of the
later emergence of the plants.
Crop yield
A significant yield reduction was found for all three years in the methods of reduced
tillage (Table 8 & Fig 7). Yield losses were greater in the method of (NT). Every year,
(CT) gave a stable yield of about 63-66 t/ha. Compared with the (CT), during the first
year, root yield in the method (HC) was 7,3% smaller, in the methods of (RC) and
(DH), 19,7% and 20,4% respectively smaller while in the method of (NT) 27,6%

International Commission of Agricultural Engineering (CIGR). E-Journal, Vol IV. www.ucd.ie/cigr/
International Commission of Agricultural Engineering (CIGR). E-Journal, Vol IV. www.ucd.ie/cigr/
smaller. Similar were the results during the second year except for the method of (HC)
that gave almost the same yield with (CT) (1,2% smaller) probably because of the
earlier emergence. During the third year however a significant greater reduction was
marked in the methods of (RC) (34,3%), (DH) (31,3%) and (NT) (46,6%) compared
with (CT). The method of (HC) gave 8,9% smaller yield compared with (CT).
Yield losses in the methods of reduced tillage are attributed to the reduced
development of the roots. In Table 8, mean weight of the roots was considerable lower
in the methods of rotary cultivator, disk harrow and no-tillage. The compact layer of the
soil beyond the tillage depth along with the greater competition of the weeds, are two
probably factors that led to this yield reduction. From Table 8 also it can be seen that
during harvest the plants in the methods of reduced tillage retained a greater amount of
their mass on the canopy. This is an indication of crop lateness. Combined analysis for
the three years is also shown in Table 8. CT gave the significant higher yields than all
the other tillage treatments.
Table 8. Yield parameters of the sugar beets for the five method of tillage.
1997 1998 1999 comb 1997 1998 1999 comb 1997 1998 1999 comb
CV (%) 13,6 21,4 17,0 16,7 2,7 5,2 6,6 7,9 19,2 24,8 19,6 18,1
Conventional 65,6 66,2 63,8 65,2 79,9 80,8 74,6 78,5 673 670 664 669
Heavy cultivator 60,8 65,4 58,1 61,4 79,5 79,4 74,4 77,8 615 688 629 644
Rotary cultivator 52,6 52,3 41,9 48,9 78,0 76,6 70,3 75,0 540 598 454 531
Disk harrow 52,2 51,6 43,8 49,2 79,2 77,2 70,6 75,6 505 604 474 528
No-tillage 47,5 48,9 34,1 43,5 81,4 76,4 68,5 75,4 555 539 380 491
** ** ** ** ** ** ** ** ** ** ** **
LSD (P = 95%) 5,4 6,1 5,8 2,7 1,5 2,0 3,4 1,5 79 76 72 42
Year Χ Tillage ** ** **
Location Χ Tillage ** ns ns * * ns ns ns ** ** ns **
Variety Χ Tillage ns ns ns ns ns ns ns ns ns ns ns ns
Fresh root yield (t/ha) (%) root weightRoot mean fresh weight
(g/root)
1997 1998 1999
0
10
20
30
40
50
60
70
80
90
100
CT HC RC DH NT
Yie
ld (
t/h
a)
CT HC RC DH NT
tops
roots
LSD
at P=0,05
CT HC RC DH NT

International Commission of Agricultural Engineering (CIGR). E-Journal, Vol IV. www.ucd.ie/cigr/
International Commission of Agricultural Engineering (CIGR). E-Journal, Vol IV. www.ucd.ie/cigr/
Fig 7. Fresh root and tops yield of the sugar beets for the five methods of tillage in the
three years of the experiment.
Table 9. Chemical characteristics of beet harvested roots for the five methods of tillage
in the three years of the experiment.
1997 1998 1999 comb 1997 1998 1999 comb 1997 1998 1999 comb
CV (%) 4,5 6,9 8,8 6,4 20,9 24,0 14,3 19,4 14,2 23,5 13,7 13,5
Conventional 14,7 13,45 12,42 13,5 3,33 2,55 3,00 3,0 5,01 2,38 3,29 3,56
Heavy cultivator 14,8 13,74 12,58 13,7 3,42 2,24 2,76 2,8 5,09 2,55 3,24 3,63
Rotary cultivator 14,9 13,69 12,17 13,6 3,58 2,29 3,01 3,0 5,44 2,53 3,21 3,73
Disk harrow 14,8 13,76 12,37 13,6 3,47 2,18 3,05 2,9 4,96 2,51 3,22 3,56
No-tillage 14,8 13,59 13,01 13,8 3,04 2,23 2,92 2,7 4,89 2,52 3,26 3,55
ns ns ns ns ns ns ns ns ns ns ns ns
LSD (P = 95%) 5,4 - - - - - - - - - - -
Year Χ Tillage ns ns ns
Location Χ Tillage ** ns ns ns * ns ns ns ** ns ns ns
Variety Χ Tillage ns ns ns ns ns ns ns ns ns ns ns ns
Sugar content (%) Na N - impurities
No differences were found among the methods of tillage for the sugar content of the
roots and neither for the Na and N-impurities contents (Table 9).
Energy consumption
Net energy, absorbed from the tillage implements, was estimated during second and
third year. Results are shown on Table 10. For both years, the most energy intensive
method was the CT. Compared with the CT, energy conservation with the HC method
was 39,6% in 1998, when a heavy cultivator was used and 12,7% in 1999 when a
subsoiler was used. The method of RC provided energy savings of 26,4% in 1998 and
34% in 1999. With DH energy conservation was 84,8% in 1998 and 74% in 1999.
Energy requirements for glyphosate application with the sprayer in the NT method
were neglectable.
Table 10. Net energy requirements for the tillage operations.

International Commission of Agricultural Engineering (CIGR). E-Journal, Vol IV. www.ucd.ie/cigr/
International Commission of Agricultural Engineering (CIGR). E-Journal, Vol IV. www.ucd.ie/cigr/
Methods of tillage: CT HC RC DH NT CT HC RC DH NT
Ploughing 228,5 302,9
Heavy cultivator 144,6
Subsoiler 246,5
Rotary cultivator 200,8 207,1
Disk harrow (1st pass) 23,7 20,2 22,0 28,2
Disk harrow (2nd pass) 20,4 19,5 28,5
Field cultivator (1st pass) 45,2 51,9 46,8 43,4
Field cultivator (2nd pass) 36,5 37,1
Sprayer 0,05 0,05
Total 272,7 164,8 200,8 41,6 0,05 384,5 335,5 253,9 100,1 0,05
"1998" "1999"
Net energy (MJ/ha)
Table 11. Estimation of soil specific resistance and intensity of energy use per soil
volume during tillage operations. Average values from the last two years.
Working
width
Average
working
depth Draft
Absorbed
energy
Specific
resistance
Intensity of
energy use for
tillage
(m) (m) (kN) (MJ/ha) (N/cm2) (kJ/m
3)
1 Moaldboard plough 1,2 0,27 31,9 265,7 9,93 99,3
2 Heavy cultivator 2 0,18 28,9 144,6 8,03 80,3
3 Subsoiler 1,8 0,37 44,4 246,5 6,70 67,0
4 Rotary cultivator 2,5 0,10 5,7 209,6 - 209,6
5 Disk harrow 3 0,08 7,0 23,2 2,90 29,0
6 Field cultivator 2,3 0,06 10,0 43,5 7,26 72,6
On Table 11 according to the cutting front (working width X working depth) and
the average draft it is calculated the soil specific resistance for each implement except
for the rotary cultivator on which power is transmitted through the PTO. It is also
estimated the “intensity of energy use for tillage” per soil volume unit. From the results
shown it is obvious that the energy use per cultivated soil volume is two times greater
with the rotary cultivator compared with the mouldboard plough. However from the
measurements of soil properties (dry bulk density, penetration resistance and shear
strength) and crop development, this additional energy wasn’t found to improve soil
porosity neither to increase crop yields. The patterns of root development indicated that
despite of using it only at the upper layer, the energy should be used to provide soil
loosening on a greater depth. On the contrary, with the heavy cultivator and especially
the subsoiler, despite the lower energy sequestered into the soil during tillage,
compared with ploughing, there were no great differences on soil properties and crop
yield.
DISCUSSION
Soil water content and dry bulk density seem to be a function of tillage intensity and
depth as found and by other researchers (Tebrügge, and Düring, 1999, Arshad, et al.,
1999). Greater soil water content in the soil enhance earlier beet emergence (Gemtos
and Lellis, 1997, Guérif, et al., 2001). Differences of the final populations were
significant for the two last years but results show no consistency. Differences in the

International Commission of Agricultural Engineering (CIGR). E-Journal, Vol IV. www.ucd.ie/cigr/
International Commission of Agricultural Engineering (CIGR). E-Journal, Vol IV. www.ucd.ie/cigr/
emergence rate between the methods of tillage were small in years with adequate
rainfalls. In dry years however, the methods of rotary cultivator and disk harrow that
retained a greater moisture content in the seedbed layer, favoured an earlier crop
emergence. This advantage is very important for Greek farmers as very often in spring
prolonged periods of draught lead to poor crop establishment. In most serious cases,
replanting may be necessary. This advantage was not obtained for the method of no-
tillage, despite the greatest moisture content, because conventional drilling machine
used in the experiment was not able to penetrate to the soil, place the seed at the
appropriate depth and cover it. During planting a three times denser seed spacing in the
row was used, in all the methods of tillage, and so, for the three years, a satisfactory
final population was achieved and thinning was applied to regulate the population at
about 100.000 pl/ha.
For all three years, crop development was significantly better in (CT) and (HC)
with worst (NT). Leaf area index was greater and root development was significant
better. Plant development for the (RC) and (DH) methods were similar and at an
intermediate stage between (CT) and (NT).
Similar results were obtained for yield. (CT) and (HC) gave the higher yields.
Average fresh root yield for the three years were 65,2 t ha-1
and 61,4 t ha-1
respectively.
It should be noted that that (CT) gave more stable yields, which is important for the
farmer. (RC) and (DH) gave the second best yield with a three year average of 48,9 t
ha-1
and 49,2 t ha-1
respectively. Every year the (NT) gave the lower yields. The three
year average was 43,5 t ha-1
. Hao et al. (2001) reported that yield of sugar beets was
similar for conventional tillage and reduced tillage with a chisel plough. Koowenhoven
et al. (2002) found a 9% yield reduction for sugar beets when deep ploughing at 20-30
cm were substituted with shallow tillage at a depth of 12-18 cm. Miller and Dexter
(1983) report higher sugar beet yields under no-tillage if no weed competition is
allowed, but in a field with 6% organic matter.
In the present experiment yield reductions are attributed mainly in the firm cohesive
soil, which impeded root growth, and to the greater competition of the weeds.
According to Gregory (1988) the most of the cultivated plants can exert a maximum
root pressure of about 700-2500 kPa to penetrate the soil. In the methods of shallow
tillage (RC, DH) and (NT) however, the soil at a depth more than 10 cm exhibited a
penetration resistance greater than 1800 kPa. In dry conditions the resistance would be
much greater and probably the root development was restrained. This suggestion is
further proved by the patterns of root growth. As a result roots harvested in the reduced
tillage plots were smaller. Chancellor (1977) refers that Taylor and Bruce, 1968 found
that sugar beet root weight is considerably reduced when penetration resistance is
increased.
The main reason for yield reduction in the (HC) method was weed competition.
According to Scott, et al. (1979) weed competition in the sugar beet crop have to be
terminated until the 4-6 leaf stage if yield reduction is to be avoided. Weeds however
are another main problem with reduced and no tillage techniques. Deibert et al. (1979)
found a root yield decrease of 37,5% caused by competition from weed Kochia. NT
plots had most of the weeds. HC plots had a lot of weeds. It is important to note that
most of them remained in the field from autumn tillage because heavy cultivators
although disturb the soil in the ploughing depth they do not disturb soil surface and
leave established weed. This seems to be a disadvantage of the heavy cultivators. Disk
harrows and rotary cultivators destroy weeds but the population is relatively high in
April due to the emergence of the seeds left on soil surface during tillage. In the third
year a better chemical weed control alleviated the problem.

International Commission of Agricultural Engineering (CIGR). E-Journal, Vol IV. www.ucd.ie/cigr/
International Commission of Agricultural Engineering (CIGR). E-Journal, Vol IV. www.ucd.ie/cigr/
Another probable reason for yield reduction in the method of no-tillage is the
negative effect of the crop and weed residue. In this method all the destroyed plant
material were left on the soil surface. Richard et al., (1995) found that early growth of
sugar beets when sown in crop residue was slower because of the shading effect of the
reside and probably due to nitrogen immobilation from the microorganisms that
decompose the plant material However they found no negative effect of the residues on
soil temperature.
Despite the improved beet yields, (CT) method was the most energy intensive one.
Net energy requirements for tillage operations was 272 MJ ha-1
for 1998 and 384 MJ
ha-1
for 1999. Average energy savings with the (HC) method were 23,9% and average
yield reduction 5,8% compared with (CT). With the (RC) method energy savings were
30,8% and with (DH) 78,4%. However these methods resulted also to a significant
yield reduction of the order of 24-25% compared with (CT). No energy was required
for seedbed preparation in the (NT) method, (discarding the negligible amount required
for glyphosate application). However average yield reduction of about 33,4% is a
discouraging factor for the adoption of the method. By overviewing the profits and
penalties resulted from the five methods of tillage tested on the experiment it is obvious
that Greek farmers could substitute conventional mouldboard ploughing by using heavy
cultivators or subsoilers without significant sugar beet yield reductions but with
considerable energy savings and environmental benefits arising from soil and water
conservation.
CONCLUSIONS
Conservation tillage dramatically increased weed infestation. Applied crop rotations
had an effect on weeds but they were not sufficient to solve the problem.
Soil in the methods of conservation tillage presented higher bulk density, shear
strength and penetration resistance. It also retained higher moisture content.
As a result of the greater moisture, emergence of the crop in the reduced tillage was
facilitated when dry conditions prevailed after planting.
Crop development and yields in the methods of reduced tillage were reduced. The
reduction was greater in the method of (NT).
Yield reduction is attributed to weed competition and deterioration of soil physical
properties.
Heavy cultivators or subsoilers use appears to be a viable alternative to
conservation tillage due to the small yield reductions but with considerable energy
savings.
LITERATURE
Arshad, M.A. Franzluebbers, A.J. and Azooz, R.H. (1999). Components of surface soil
structure under conventional and no-tillage in northwestern Canada, Soil and Tillage
Research, Volume 53Pages 41-47
Arvidsson, J. and Hakansson, I. (1996). Do effects of soil compaction persist after
ploughing? Results from 21 long-term experiments in Sweden. Soil and Tillage
Research, 39. pp.175-197.
International Commission of Agricultural Engineering (CIGR). E-Journal, Vol IV. www.ucd.ie/cigr/
International Commission of Agricultural Engineering (CIGR). E-Journal, Vol IV. www.ucd.ie/cigr/
Chancellor W. J. (1977). Compaction of soil by agricultural equipment. University of
California. Division of Agricultural sciences. Bulletin 1881.
Cooke, D.A. and Scott, R.K. (1993). The Sugar Beet Crop. Science into practice.
University Press, Cambridge, Britain.
Dragovic, S. (1982), Effect of tillage depth, with and without subsoiling, and different
levels of nitrogen fertilization and irrigation on the yield and quality of sugarbeet
grown on the soils of heavy texture. Proceedings of the 9th Conference of the
International Soil Tillage Research Organization. Osijek 1982. pp 340-345.
Deibert, E.J., Giles, J.F. and Enz, J. (1979). Reduced tillage sugarbeet production.
Sugarbeet Research and Extension Reports, Vol 10, pp. 105-110.
Deibert, E.J., Giles, J.F., Enz, J. and Lizotte, D. (1981). Reduced tillage sugarbeet
production. Sugarbeet Research and Extension Reports. Vol 12 pp 123-27.
Ekeberg, E. and Riley, H.C.F. (1997). Tillage intensity effects on soil properties and
crop yields in a long-term trial on morainic loam soil in southeast Norway, Soil and
Tillage Research, Volume 42, Issue 4, Pages 277-293
Gantzer, C.J. and Blake, G.R. (1978). Physical characteristics of Le Sueur clay loam
soil following no-till and conventional tillage. Agronomy Journal. 70. pp 853-857.
Gemtos T.A., Th. Tsiricoglou. 1994. Design, Construction and Testing of a Farm
Tractor for Measuring Forces in Three Dimensions for Mounted Tools (in Greek).
Geotechnical Scientific Issues. Published by the Geotechnical Chambers of Greece
(4):89-96.
Gemtos T.A. and Lellis Th. (1997). Effects of soil compaction, water and organic
matter contends on emergence and initial plant growth of cotton and sugar beet.
Journal of Agricultural Engineering Research. 66. pp.134.
Gemtos, T.A., Galanopoulou, St., and Kavalaris, C. (1998). Wheat establishment after
cotton with minimal tillage. European Journal of Agronomy. 8 (1998), pp 137-147.
Gemtos T.A., J. Papathanassiou, Th. Kylindris and Chr. Karamoutis. 2000.
Instrumentation of a Tractor to Measure the Power Absorbed by Implements. In
Proc. 2nd National Conference of the Hellenic Society of Agricultural Engineers,
Volos, Greece.
Giles, J. F., Cattanach, A.W., Cattanach, N.R. (1995). Effect of seedbed moisture
management on sugar beet stand establishment, yield and quality. Proceedings of
the 58th Winter Congress International Institution of Sugar Beet Research.. pp.521-
522.
Gregory, P.J. (1988). Water and crop growth. In: (Alan Wild, Editor) Russell’s Soil
Conditions and Plant Growth. 11th edn. Longman Group UK Limited pp. 338-77.
Guérif, J., Richard, G., Dürr, C., Machet, J.M., Recous, S., and Roger-Estrade, J.
(2001). A review of tillage effects on crop residue management, seedbed conditions
and seedling establishment, Soil and Tillage Research, Volume 61, p 13-32
Hatfield, J.L. and Karlen, D.L. (1992). Sustainable Agriculture Systems.
Haiquan Zhang, Hartge, K.H. and Ringe, H. (1997). Effectiveness of organic matter
incorporation in reducing soil compactibility. Soil Science Society American
Journal. 61. pp.239-245.
Hao, X., Chang, C., and Lindwall, C.W. (2001). Tillage and crop sequence effects on
organic carbon and total nitrogen content in an irrigated Alberta soil, Soil and
Tillage Research, Volume 62, Issues 3-4, Pages 167-169
Hernanz, J.L., Giron, V.S. and Cerisola, C. (1995). Long-term energy use and
economic evaluation of three tillage systems for cereal and legume production in
central Spain, Soil and Tillage Research, Volume 35, Issue 4, Pages 183-198

International Commission of Agricultural Engineering (CIGR). E-Journal, Vol IV. www.ucd.ie/cigr/
International Commission of Agricultural Engineering (CIGR). E-Journal, Vol IV. www.ucd.ie/cigr/
James, E.B. and Russell, B. (1996). The effect of surface cover on infiltration and soil
erosion. In: Agasi, M. (editor), Soil Erosion, Consevation, and Rehabilitation.
Marcel Dekker, Inc. N.Y. pp. 107-20.
Koch, H.J. and Marlander, B. (1994). Wetchen Beitrag Kann die Bodenbearbeitung
zum integrierten Anbau von Zuckerruben leisten? Proc. 57th Winter Congr. Int.
Inst. S. Beet Res. pp.1-22.
Kouwenhoven, J.K.,, Perdok, U.D., Boer, J. and Oomen, G.J.M. (2002). Soil
management by shallow mouldboard ploughing in The Netherlands, Soil and
Tillage Research, Vol. 65, p 125-139
Larney, F.J., Fortune, R.A. and Collins, J.F. (1988). Intrinsic soil physical parameters
influencing intensity of cultivation procedures for sugar beet seedbed preparation.
Soil and Tillage Research.12. pp.253-67.
Mahboubi A.A. and Lai R. (1998). Long term tillage effects on changes in structural
properties of two soils in central Ohio. Soil and Tillage Research 45 pp. 107-118.
McConnell, J.S., Baker, W.H., Rothrock, C.S. and Frizzell, B.S. (1994). Reduced
tillage and cover crops. Arkansas Experimental Station Special Report 166, pp 27-
30.
Miller, S.D. and Dexter, A.G. (1983). No-tillage sugarbeet production. Sugarbeet
Research and Extension Reports. Vol 21 pp 124-25
Mitsios, I.K., Paschalidis, C.D. and Paganias, K.P. (1995). Soil erosion and methods of
protection. Zymel Press. Athens.
National Statistics Bureau (2000). Agricultural Crops and Production 1999, Athens
2000.
Richard, G., Boiffin, J. and Duval, Y. (1995). Direct drilling of sugar beet (Beta
vulgaris L.) into a cover crop: effects on soil physical conditions and crop
establishment, Soil and Tillage Research, Vol 34, p 169-185
Scott, R.K., Wilcockson, S.J. and Moisey, F.R. (1979). The effects of time of weed
removal on growth and yield of sugar beet, Journal of Agricultural Sciences,
Cambridge, Vol 93 p. 693-709.
Tebrügge, F. and Düring, R.A. (1999). Reducing tillage intensity - a review of results
from a long-term study in Germany, Soil and Tillage Research, Vol 53, p 15-28
Thomas, W.G., Hazler, G.R. and Blevins, R.L. (1996). The effects of organic matter
and tillage on maximum compactability of soils using proctor test. Soil Science.
Vol 161, No 8. pp.502-508.
Uri, N.D., Atwood, J.D. and Sanabria, J. (1998). An evaluation of the environmental
costs and benefits of conservation tillage, Environmental Impact Assessment
Review, Volume 18, Issue 6 Pages 521-550
Watts, C.W., Dexter, A.R., and Longstaff, D.J. (1996). An assessment of the
vulnerability of soil structure to destabilization during tillage. Part II. Field trials.
Soil and Tillage Research, 37, pp. 161-174.


