Embed Size (px)
Citation preview
Agricultural and Forest Meteorology 109 (2001) 13–25
Modelling radiation interception and radiation use efficiency forsugar beet under variable climatic stress
Goetz M. Richter a,∗, Keith W. Jaggard b, Rowan A.C. Mitchell a
a Soil Science Department, IACR-Rothamsted, Harpenden, Herts AL5 2JQ, UKb IACR-Broom’s Barn, Higham, Bury Saint Edmunds IP28 6NP, UK
Received 31 October 2000; received in revised form 19 March 2001; accepted 23 March 2001
Abstract
European sugar beet crops suffer drought stress, and climate change is likely to increase the frequency and severity ofdrought. Changes in rainfall pattern may also affect the radiation environment. Modelling is an appropriate tool to assessthe scale of these problems. In a sugar beet model we included the effects of water stress on foliage dynamics (radiationinterception) and of variable radiation use efficiency (RUE). Foliage expansion and senescence were related to the relativewater content in the root zone and drought response factors were calibrated from rain-shelter experiments for early and latedrought in England. Simulating variable drought response in different growth phases explained 70–96% of the foliage variationfor rain-fed growth. The dependence of RUE on the fraction of radiation that is diffuse was described theoretically; measuredvariation of RUE (0.9 g DM MJ−1) matched well the empirical representation of this theoretical relationship. We evaluatedthese modifications using experimental total dry matter and sugar yields in the UK and in Germany (1965–1995). Includingfoliage dynamics and variable RUE improved the simulation of observed yields in the UK in some years. For continentalsites mean sugar yields were well described when differences in the antecedent soil water balance were accounted for. Theagreement between estimated and observed yields was close to 1:1, explaining between 30 and 45% of observed variation,though not appreciably different from when the original model was used. This was because the test data included only a fewseasons with either severe water stress or abnormal fractions of diffuse sunlight. Ideally the model should be tested againstcrop growth data from more extreme environments. Nevertheless, we conclude that the expanded model is now more suitablefor use across much of Europe and future climatic change. © 2001 Elsevier Science B.V. All rights reserved.
Keywords: Atmospheric transmission; Drought stress; Canopy dynamics; Light use efficiency; Productivity assessment; Crop modelling
1. Introduction
Drought stress is the major cause of yield loss insugar beet in the UK. It causes an average annualyield reduction of 10% (Jaggard et al., 1998), and invery dry years it has decreased experimental yields byas much as 50%, corresponding to 4 t ha−1 sugar. Irri-
∗ Corresponding author. Tel.: +44-1582-763-133;fax: +44-1582-769-222.E-mail address: [email protected] (G.M. Richter).
gation water is in short supply and is mostly reservedfor more valuable crops (vegetables and potatoes), soalternative methods must be sought to solve the prob-lem of drought stress. Improving drought tolerance ofcommercial varieties of beet is a promising approach(Jaggard et al., 1998), but sugar beet breeding islong-term (∼15 years) and expensive. Breedingcompanies need to be assured that the problem iswidespread and likely to persist. Therefore, we needto assess the extent and complexity of the water stressproblem in sugar beet production throughout Europe,
0168-1923/01/$ – see front matter © 2001 Elsevier Science B.V. All rights reserved.PII: S0 1 6 8 -1 9 23 (01 )00242 -8
14 G.M. Richter et al. / Agricultural and Forest Meteorology 109 (2001) 13–25
now and in the future. An efficient way of doing thisis to use a crop growth modelling approach to assessthe effect of future climate scenarios for up to 50years hence.
The crop growth model for sugar beet (Werker andJaggard, 1997; Jaggard and Werker, 1999) predicts to-tal dry matter and sugar yields from estimated valuesof the fraction of global radiation intercepted, radia-tion use efficiency (RUE) and relative evapotranspira-tion. The model was developed and parameterised forUK climate conditions during the 1980s (Werker andJaggard, 1997, 1998) and was designed to be usedwhere measurements of changes in foliage cover (e.g.due to drought) were available from remote sensingsources (Steven and Jaggard, 1995). This procedureis commonly used for tuning more complex simula-tion models (Bouman, 1992; Guérif and Duke, 1998),which do not include direct drought effects on canopydynamics. Nevertheless, the work of Milford et al.(1985) and Brown et al. (1987) clearly showed thatdrought affects leaf expansion and longevity and soaffects solar radiation interception. Similar studiesin other crops suggest that water stress effects varyfor different growth processes and developmentalphases (Muchow, 1985; Sinclair, 1986; Craufurd andWheeler, 1999). For long-term predictive purposeson a European scale, the current model of sugar beetgrowth seems inappropriate unless it is modified topredict foliage cover in response to drought.
The model also uses a fixed value of RUE, irre-spective of the solar radiation environment. While themodel is confined to the UK climate for the latterpart of the 20th century, this is appropriate. How-ever, climate change and any shift from a maritimeto a continental location are both likely to affect thefraction of bright sunlight. DeWit (1965) showed the-oretically the importance of the intensity of sunlight,relating RUE to the fraction of the diffuse componentin incident radiation. Across a range of temperate cli-mates, the fraction of diffuse radiation is related to thevariation in atmospheric transmission (Spitters et al.,1986) and this was included in the universal cropsimulator SUCROS (van Laar et al., 1992). Experi-mentally, Glauert (1983) showed that carbon fixationefficiency of sugar beet declines from about 8% ondull to 5% on bright days during July and August,when the foliage is still young and disease-free.Sinclair and Muchow (1999) concluded that similar
effects in other crops are significant, when RUE iscompared across different environments.
Here, we extend the sugar beet growth model ofJaggard and Werker (1999) to account for two phe-nomena: (a) effects of drought on the size of cropcanopy and light interception, and (b) changes inRUE as a function of a fraction of diffuse radiation.Both processes were calibrated using experimentaldata. These changes to the model were then evaluatedby comparison with independent long-term yield datafrom UK and Germany, and by comparing simulationsof the original and expanded model. These changesshould enable the revised model to be used to assessthe effects of climate variation on a continental scaleboth now and under future climatic scenarios, whichmay decrease the availability of water still further.
2. Model description and parameterisation
2.1. Modelling fractional foliage cover andintercepted radiation, f
The model (Werker and Jaggard, 1997) describesthe fractional foliage cover and radiation interception,f, by a general growth function (Eq. (1)). It is dynamicin relation to thermal time (◦C d), which is the sum ofdaily mean air temperature above a threshold (3◦C)after emergence (T − T 0). It accommodates a highinitial relative growth rate µ0 and small or negativefinal relative growth rate µmin (senescence) of thesugar beet canopy.
f = f0 exp
(µmin(T − T0)
+µ0 − µmin
kf
(1 − exp(−kf (T − T0)))
)(1)
The coefficient kf is the rate constant determiningthe speed at which the initial relative growth rateapproaches µmin as a function of thermal time. It isdefined as a function of initial foliage cover, f0, (1.5×10⁻⁵ ha ha−1) and maximum cover, fmax (µ = 0), andinitial and final growth rates, µ0 and µmin (Eq. (2)).
kf = µ0 − log(−µmin/(µ0 − µmin))µmin
log(fmax/f0)(2)
Initial mean values for the parameters (indicated by abar over the symbols in Eq. (4a-c)) were derived from
G.M. Richter et al. / Agricultural and Forest Meteorology 109 (2001) 13–25 15
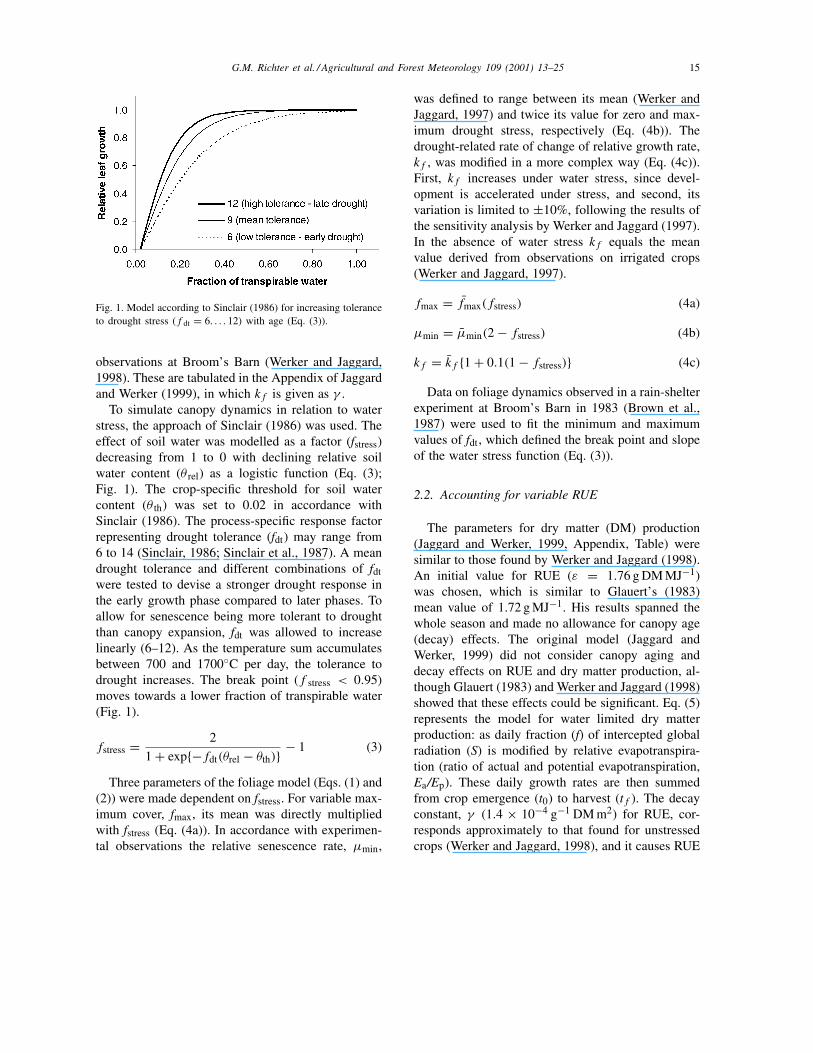
Fig. 1. Model according to Sinclair (1986) for increasing toleranceto drought stress (f dt = 6. . . . 12) with age (Eq. (3)).
observations at Broom’s Barn (Werker and Jaggard,1998). These are tabulated in the Appendix of Jaggardand Werker (1999), in which kf is given as γ .
To simulate canopy dynamics in relation to waterstress, the approach of Sinclair (1986) was used. Theeffect of soil water was modelled as a factor (fstress)decreasing from 1 to 0 with declining relative soilwater content (θ rel) as a logistic function (Eq. (3);Fig. 1). The crop-specific threshold for soil watercontent (θ th) was set to 0.02 in accordance withSinclair (1986). The process-specific response factorrepresenting drought tolerance (fdt) may range from6 to 14 (Sinclair, 1986; Sinclair et al., 1987). A meandrought tolerance and different combinations of fdtwere tested to devise a stronger drought response inthe early growth phase compared to later phases. Toallow for senescence being more tolerant to droughtthan canopy expansion, fdt was allowed to increaselinearly (6–12). As the temperature sum accumulatesbetween 700 and 1700◦C per day, the tolerance todrought increases. The break point (f stress < 0.95)moves towards a lower fraction of transpirable water(Fig. 1).
fstress = 2
1 + exp{−fdt(θrel − θth)} − 1 (3)
Three parameters of the foliage model (Eqs. (1) and(2)) were made dependent on fstress. For variable max-imum cover, fmax, its mean was directly multipliedwith fstress (Eq. (4a)). In accordance with experimen-tal observations the relative senescence rate, µmin,
was defined to range between its mean (Werker andJaggard, 1997) and twice its value for zero and max-imum drought stress, respectively (Eq. (4b)). Thedrought-related rate of change of relative growth rate,kf , was modified in a more complex way (Eq. (4c)).First, kf increases under water stress, since devel-opment is accelerated under stress, and second, itsvariation is limited to ±10%, following the results ofthe sensitivity analysis by Werker and Jaggard (1997).In the absence of water stress kf equals the meanvalue derived from observations on irrigated crops(Werker and Jaggard, 1997).
fmax = f̄max(fstress) (4a)
µmin = µ̄min(2 − fstress) (4b)
kf = k̄f {1 + 0.1(1 − fstress)} (4c)
Data on foliage dynamics observed in a rain-shelterexperiment at Broom’s Barn in 1983 (Brown et al.,1987) were used to fit the minimum and maximumvalues of fdt, which defined the break point and slopeof the water stress function (Eq. (3)).
2.2. Accounting for variable RUE
The parameters for dry matter (DM) production(Jaggard and Werker, 1999, Appendix, Table) weresimilar to those found by Werker and Jaggard (1998).An initial value for RUE (ε = 1.76 g DM MJ−1)was chosen, which is similar to Glauert’s (1983)mean value of 1.72 g MJ−1. His results spanned thewhole season and made no allowance for canopy age(decay) effects. The original model (Jaggard andWerker, 1999) did not consider canopy aging anddecay effects on RUE and dry matter production, al-though Glauert (1983) and Werker and Jaggard (1998)showed that these effects could be significant. Eq. (5)represents the model for water limited dry matterproduction: as daily fraction (f) of intercepted globalradiation (S) is modified by relative evapotranspira-tion (ratio of actual and potential evapotranspiration,Ea/Ep). These daily growth rates are then summedfrom crop emergence (t0) to harvest (tf ). The decayconstant, γ (1.4 × 10⁻⁴ g−1 DM m2) for RUE, cor-responds approximately to that found for unstressedcrops (Werker and Jaggard, 1998), and it causes RUE
16 G.M. Richter et al. / Agricultural and Forest Meteorology 109 (2001) 13–25
to decrease with accumulated dry weight (W (g m−2)),representing thereby age of the canopy.
�W = εfS exp(−γW)Ea
Ep(5)
The SUCROS model (Goudriaan and van Laar, 1978;van Laar et al., 1992) was used to generate the theo-retical relationship between RUE and the fraction ofdiffuse radiation for variable radiation levels underUK conditions. The fraction of diffuse radiation, fdif ,was calculated from daily atmospheric transmission,derived from day of the year (DOY), latitude andobserved global radiation. These data were used toderive a function of variable RUE, εvar, versus fdif(Eq. (6)). Under predominantly diffuse radiation atBroom’s Barn (average of fdif for May–October ∼0.6in 1982–1991) the average of εvar equals ε. The max-imum value of εvar (1.27ε) is constant for all sites,in contrast to ε, which is specific to the UK. Theconstant value for ε in Eq. (5) is substituted by εvarin the modified model.
εvar = 1.27ε exp(−0.64(1 − fdif)) (6)
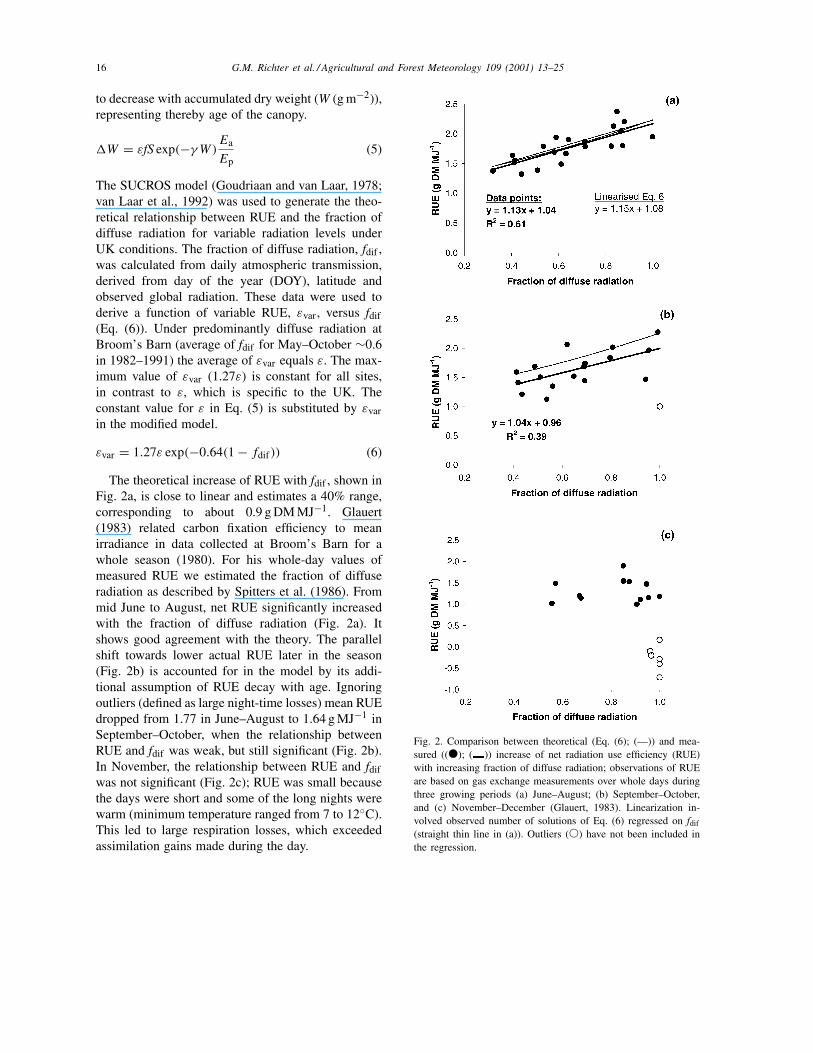
The theoretical increase of RUE with fdif , shown inFig. 2a, is close to linear and estimates a 40% range,corresponding to about 0.9 g DM MJ−1. Glauert(1983) related carbon fixation efficiency to meanirradiance in data collected at Broom’s Barn for awhole season (1980). For his whole-day values ofmeasured RUE we estimated the fraction of diffuseradiation as described by Spitters et al. (1986). Frommid June to August, net RUE significantly increasedwith the fraction of diffuse radiation (Fig. 2a). Itshows good agreement with the theory. The parallelshift towards lower actual RUE later in the season(Fig. 2b) is accounted for in the model by its addi-tional assumption of RUE decay with age. Ignoringoutliers (defined as large night-time losses) mean RUEdropped from 1.77 in June–August to 1.64 g MJ−1 inSeptember–October, when the relationship betweenRUE and fdif was weak, but still significant (Fig. 2b).In November, the relationship between RUE and fdifwas not significant (Fig. 2c); RUE was small becausethe days were short and some of the long nights werewarm (minimum temperature ranged from 7 to 12◦C).This led to large respiration losses, which exceededassimilation gains made during the day.
Fig. 2. Comparison between theoretical (Eq. (6); (—)) and mea-sured ((�); ( )) increase of net radiation use efficiency (RUE)with increasing fraction of diffuse radiation; observations of RUEare based on gas exchange measurements over whole days duringthree growing periods (a) June–August; (b) September–October,and (c) November–December (Glauert, 1983). Linearization in-volved observed number of solutions of Eq. (6) regressed on fdif
(straight thin line in (a)). Outliers (�) have not been included inthe regression.
G.M. Richter et al. / Agricultural and Forest Meteorology 109 (2001) 13–25 17
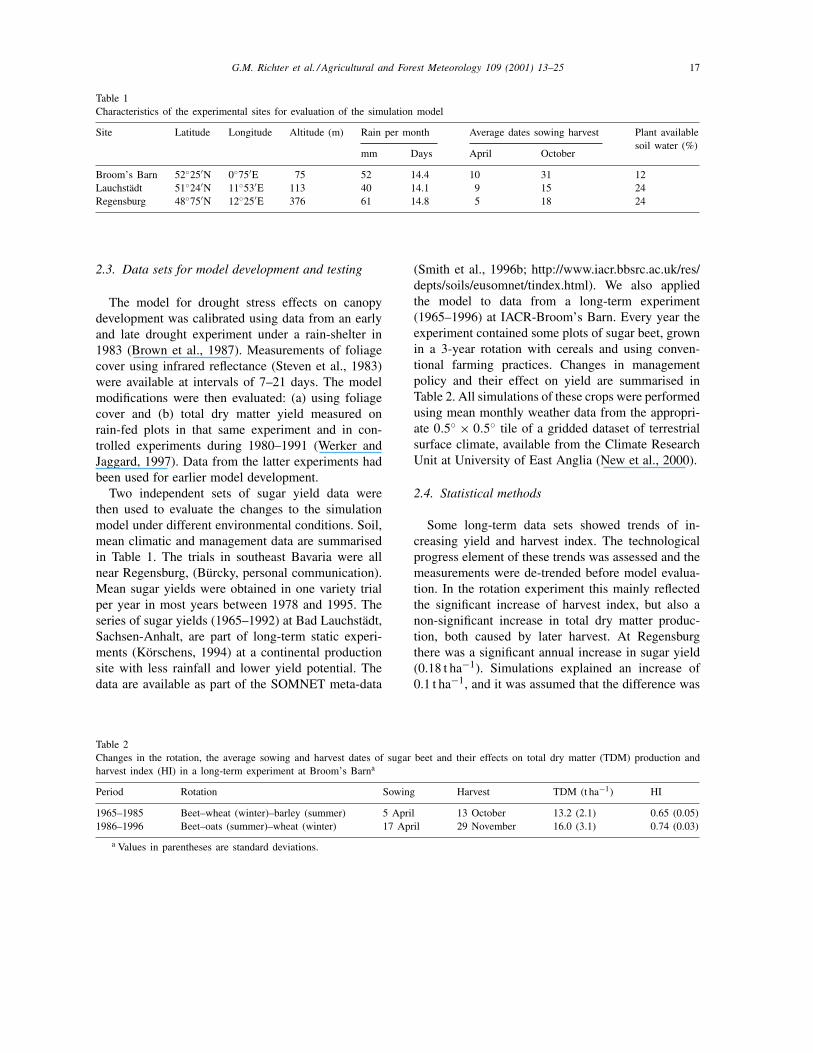
Table 1Characteristics of the experimental sites for evaluation of the simulation model
Site Latitude Longitude Altitude (m) Rain per month Average dates sowing harvest Plant availablesoil water (%)
mm Days April October
Broom’s Barn 52◦25′N 0◦75′E 75 52 14.4 10 31 12Lauchstädt 51◦24′N 11◦53′E 113 40 14.1 9 15 24Regensburg 48◦75′N 12◦25′E 376 61 14.8 5 18 24
2.3. Data sets for model development and testing
The model for drought stress effects on canopydevelopment was calibrated using data from an earlyand late drought experiment under a rain-shelter in1983 (Brown et al., 1987). Measurements of foliagecover using infrared reflectance (Steven et al., 1983)were available at intervals of 7–21 days. The modelmodifications were then evaluated: (a) using foliagecover and (b) total dry matter yield measured onrain-fed plots in that same experiment and in con-trolled experiments during 1980–1991 (Werker andJaggard, 1997). Data from the latter experiments hadbeen used for earlier model development.
Two independent sets of sugar yield data werethen used to evaluate the changes to the simulationmodel under different environmental conditions. Soil,mean climatic and management data are summarisedin Table 1. The trials in southeast Bavaria were allnear Regensburg, (Bürcky, personal communication).Mean sugar yields were obtained in one variety trialper year in most years between 1978 and 1995. Theseries of sugar yields (1965–1992) at Bad Lauchstädt,Sachsen-Anhalt, are part of long-term static experi-ments (Körschens, 1994) at a continental productionsite with less rainfall and lower yield potential. Thedata are available as part of the SOMNET meta-data
Table 2Changes in the rotation, the average sowing and harvest dates of sugar beet and their effects on total dry matter (TDM) production andharvest index (HI) in a long-term experiment at Broom’s Barna
Period Rotation Sowing Harvest TDM (t ha−1) HI
1965–1985 Beet–wheat (winter)–barley (summer) 5 April 13 October 13.2 (2.1) 0.65 (0.05)1986–1996 Beet–oats (summer)–wheat (winter) 17 April 29 November 16.0 (3.1) 0.74 (0.03)
a Values in parentheses are standard deviations.
(Smith et al., 1996b; http://www.iacr.bbsrc.ac.uk/res/depts/soils/eusomnet/tindex.html). We also appliedthe model to data from a long-term experiment(1965–1996) at IACR-Broom’s Barn. Every year theexperiment contained some plots of sugar beet, grownin a 3-year rotation with cereals and using conven-tional farming practices. Changes in managementpolicy and their effect on yield are summarised inTable 2. All simulations of these crops were performedusing mean monthly weather data from the appropri-ate 0.5◦ × 0.5◦ tile of a gridded dataset of terrestrialsurface climate, available from the Climate ResearchUnit at University of East Anglia (New et al., 2000).
2.4. Statistical methods
Some long-term data sets showed trends of in-creasing yield and harvest index. The technologicalprogress element of these trends was assessed and themeasurements were de-trended before model evalua-tion. In the rotation experiment this mainly reflectedthe significant increase of harvest index, but also anon-significant increase in total dry matter produc-tion, both caused by later harvest. At Regensburgthere was a significant annual increase in sugar yield(0.18 t ha−1). Simulations explained an increase of0.1 t ha−1, and it was assumed that the difference was
18 G.M. Richter et al. / Agricultural and Forest Meteorology 109 (2001) 13–25
due to the gradual improvement in varieties. For BadLauchstädt no trend was observed, and thus the weaktrend for Regensburg data was ignored in the modelevaluation.
The performance of the model was evaluated bycomparing simulated and observed de-trended values.Performance was expressed as the mean difference(MD) and root mean square error (RMSE, ρRMSE inEq. (7)) for n modelled (M) versus observed (O) fo-liage cover and dry matter or sugar yields. A detaileddescription of relevant statistical calculations forthe model evaluation can be found in Smith et al.(1996a).
ρRMSE =√∑n
i=1(Mi − Oi)2
n(7)
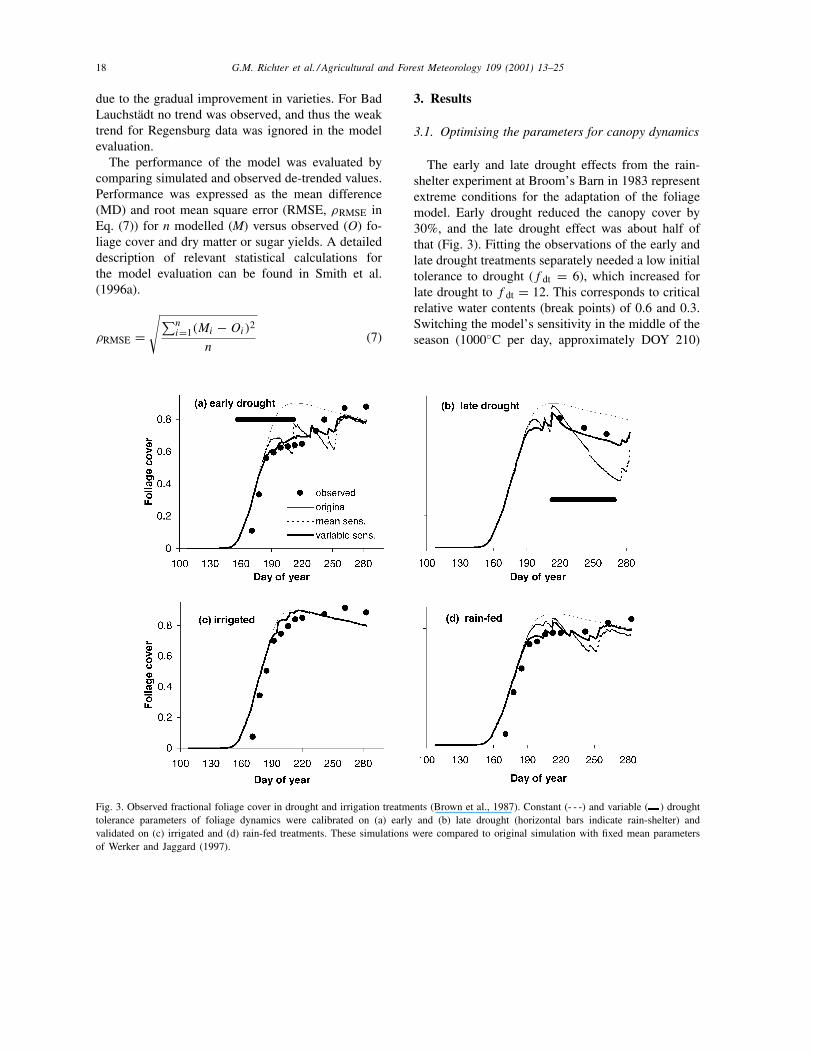
Fig. 3. Observed fractional foliage cover in drought and irrigation treatments (Brown et al., 1987). Constant (- - -) and variable ( ) droughttolerance parameters of foliage dynamics were calibrated on (a) early and (b) late drought (horizontal bars indicate rain-shelter) andvalidated on (c) irrigated and (d) rain-fed treatments. These simulations were compared to original simulation with fixed mean parametersof Werker and Jaggard (1997).
3. Results
3.1. Optimising the parameters for canopy dynamics
The early and late drought effects from the rain-shelter experiment at Broom’s Barn in 1983 representextreme conditions for the adaptation of the foliagemodel. Early drought reduced the canopy cover by30%, and the late drought effect was about half ofthat (Fig. 3). Fitting the observations of the early andlate drought treatments separately needed a low initialtolerance to drought (f dt = 6), which increased forlate drought to f dt = 12. This corresponds to criticalrelative water contents (break points) of 0.6 and 0.3.Switching the model’s sensitivity in the middle of theseason (1000◦C per day, approximately DOY 210)
G.M. Richter et al. / Agricultural and Forest Meteorology 109 (2001) 13–25 19
Table 3Statistical evaluation of model calibration (drought treatments) and validation (rain-fed, irrigated) for the effect of using mean and variabledrought tolerance, fdt , on simulated fractional canopy covera
Calibration, 1983 period Validation, 1983 period 1980–1991
Early treatment Early + late treatment Rain-fed treatment Irrigated treatment Rain-fed treatment
Mean fdt
Correlation 0.922 0.816 0.919 0.945 0.825RMSE 0.107 0.118 0.114 0.112 0.125
Variable fdt
Correlation 0.984 0.983 0.978 0.974 0.846RMSE 0.082 0.074 0.088 0.098 0.117
a Crop and weather data were taken from Broom’s Barn, rain-shelter experiments in 1983 and rain-fed crops from (1980–1991, n = 87);RMSE (Eq. (7)).
caused an abrupt change in foliage cover. To avoidthis, a linear shift from a low to high drought toler-ance was introduced. This simple model of variabledrought sensitivity accommodates both early andlate drought effects alike. However, recovery andre-growth of the canopy is not fast enough. In reality,after the extreme early drought conditions ceased, theplants recovered more quickly than predicted (Fig. 3).The model overestimates water stress because it av-erages relative water content across the whole rootprofile, whereas in reality the plants absorb watermore rapidly from wetter horizons.
For reasons of model simplicity we tested whetherthe foliage dynamics could be described using a sin-gle value for fdt. However, a mean tolerance factor(f dt = 9) under-predicted the effects of early droughtand grossly over-predicted the effects of late drought;it also mismatched foliage cover under rain-fed con-ditions (Fig. 3d). The improvement of the modelarising from use of a variable drought stress was es-pecially apparent when both early and late droughteffects were pooled (Table 3). Statistical evaluationof the model shows a significant reduction (>20%) inthe RMSE of the rain-fed treatment in 1983 when avariable drought tolerance factor is included.
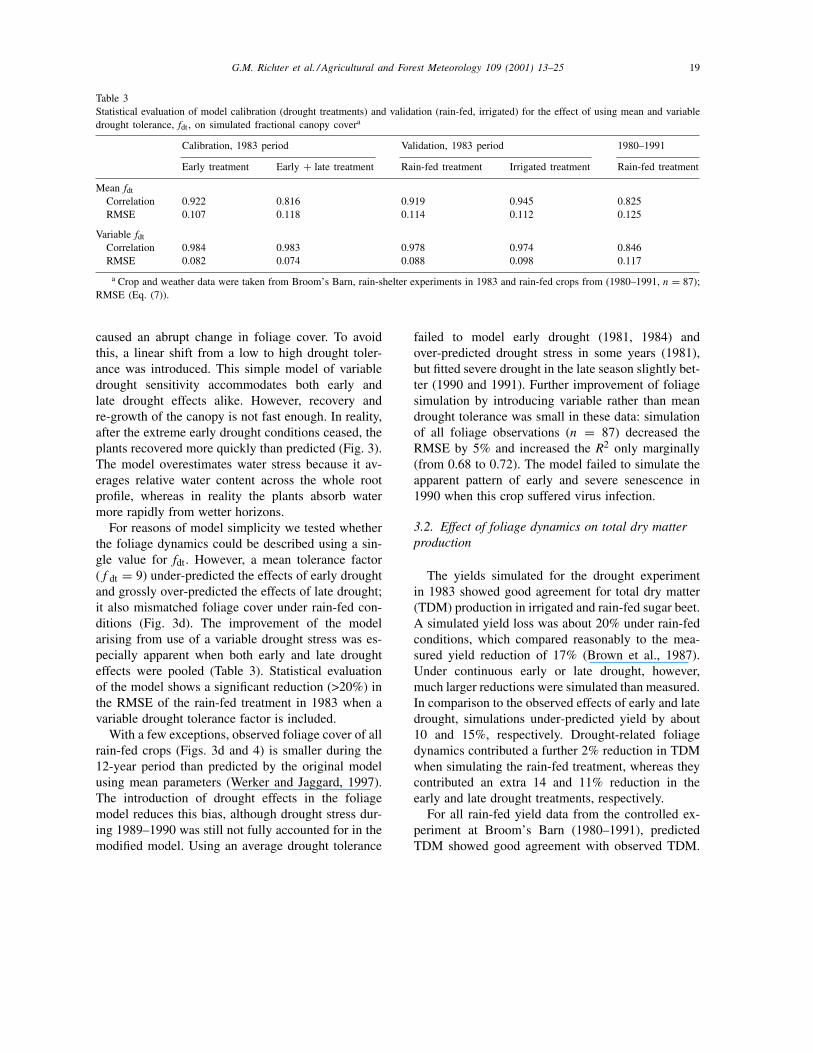
With a few exceptions, observed foliage cover of allrain-fed crops (Figs. 3d and 4) is smaller during the12-year period than predicted by the original modelusing mean parameters (Werker and Jaggard, 1997).The introduction of drought effects in the foliagemodel reduces this bias, although drought stress dur-ing 1989–1990 was still not fully accounted for in themodified model. Using an average drought tolerance
failed to model early drought (1981, 1984) andover-predicted drought stress in some years (1981),but fitted severe drought in the late season slightly bet-ter (1990 and 1991). Further improvement of foliagesimulation by introducing variable rather than meandrought tolerance was small in these data: simulationof all foliage observations (n = 87) decreased theRMSE by 5% and increased the R2 only marginally(from 0.68 to 0.72). The model failed to simulate theapparent pattern of early and severe senescence in1990 when this crop suffered virus infection.
3.2. Effect of foliage dynamics on total dry matterproduction
The yields simulated for the drought experimentin 1983 showed good agreement for total dry matter(TDM) production in irrigated and rain-fed sugar beet.A simulated yield loss was about 20% under rain-fedconditions, which compared reasonably to the mea-sured yield reduction of 17% (Brown et al., 1987).Under continuous early or late drought, however,much larger reductions were simulated than measured.In comparison to the observed effects of early and latedrought, simulations under-predicted yield by about10 and 15%, respectively. Drought-related foliagedynamics contributed a further 2% reduction in TDMwhen simulating the rain-fed treatment, whereas theycontributed an extra 14 and 11% reduction in theearly and late drought treatments, respectively.
For all rain-fed yield data from the controlled ex-periment at Broom’s Barn (1980–1991), predictedTDM showed good agreement with observed TDM.
20 G.M. Richter et al. / Agricultural and Forest Meteorology 109 (2001) 13–25
Fig. 4. Validation of the revised foliage model for rain-fed sugar beet (1980–1991): observed at Broom’s Barn annual experiments (opencircles) compared to simulated foliage with fixed mean parameters. (Eq. (1); (—)) and after introducing constant (- - -) and variable drought( ) tolerance (Eqs. (1), (3) and (4)).
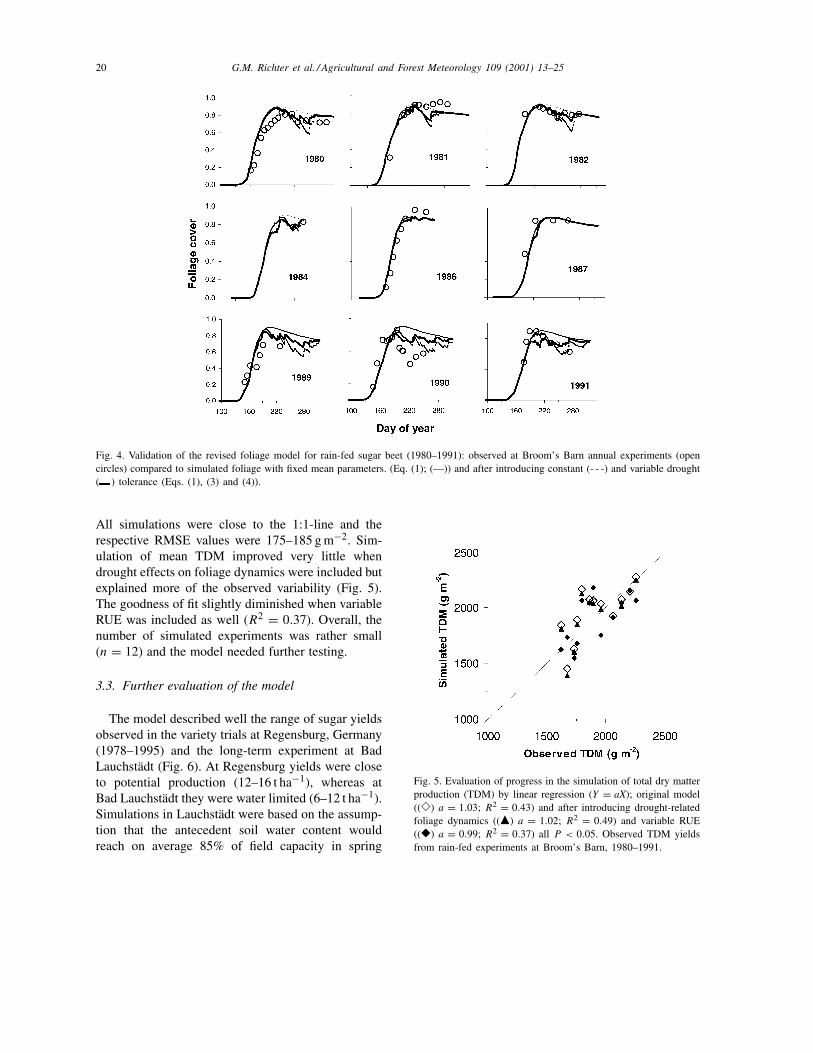
All simulations were close to the 1:1-line and therespective RMSE values were 175–185 g m−2. Sim-ulation of mean TDM improved very little whendrought effects on foliage dynamics were included butexplained more of the observed variability (Fig. 5).The goodness of fit slightly diminished when variableRUE was included as well (R2 = 0.37). Overall, thenumber of simulated experiments was rather small(n = 12) and the model needed further testing.
3.3. Further evaluation of the model
The model described well the range of sugar yieldsobserved in the variety trials at Regensburg, Germany(1978–1995) and the long-term experiment at BadLauchstädt (Fig. 6). At Regensburg yields were closeto potential production (12–16 t ha−1), whereas atBad Lauchstädt they were water limited (6–12 t ha−1).Simulations in Lauchstädt were based on the assump-tion that the antecedent soil water content wouldreach on average 85% of field capacity in spring
Fig. 5. Evaluation of progress in the simulation of total dry matterproduction (TDM) by linear regression (Y = aX); original model((�) a = 1.03; R2 = 0.43) and after introducing drought-relatedfoliage dynamics ((�) a = 1.02; R2 = 0.49) and variable RUE((�) a = 0.99; R2 = 0.37) all P < 0.05. Observed TDM yieldsfrom rain-fed experiments at Broom’s Barn, 1980–1991.
G.M. Richter et al. / Agricultural and Forest Meteorology 109 (2001) 13–25 21
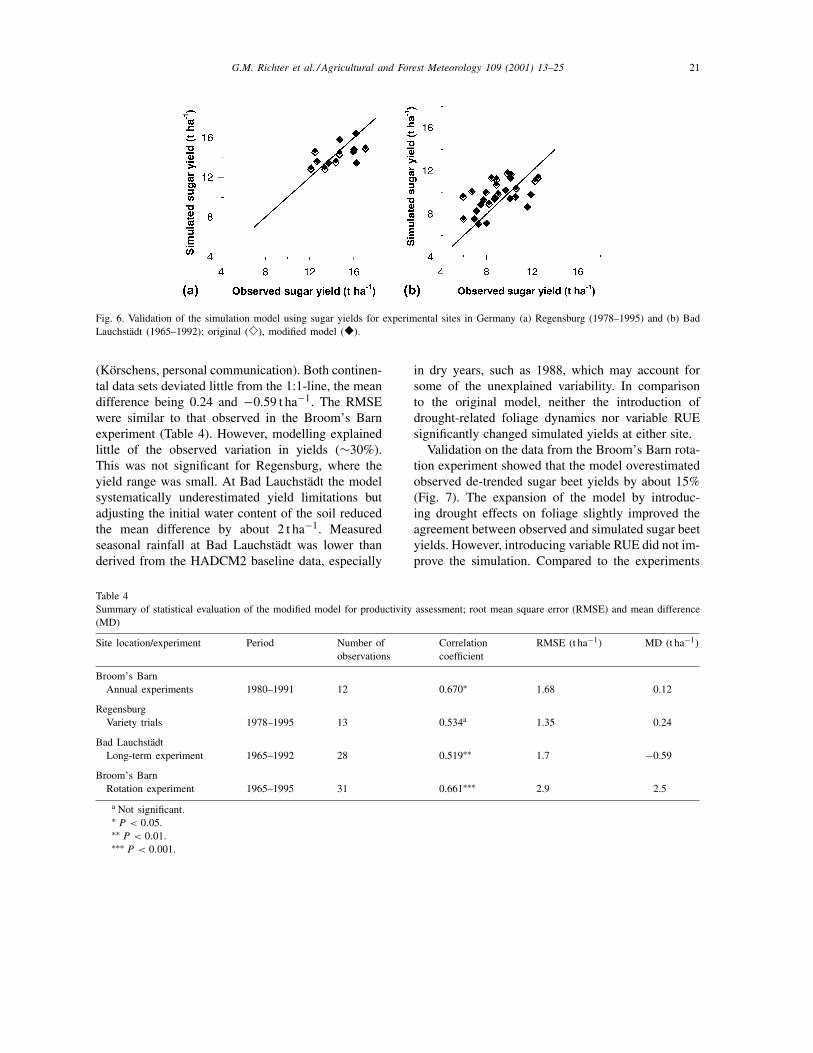
Fig. 6. Validation of the simulation model using sugar yields for experimental sites in Germany (a) Regensburg (1978–1995) and (b) BadLauchstädt (1965–1992); original (�), modified model (�).
(Körschens, personal communication). Both continen-tal data sets deviated little from the 1:1-line, the meandifference being 0.24 and −0.59 t ha−1. The RMSEwere similar to that observed in the Broom’s Barnexperiment (Table 4). However, modelling explainedlittle of the observed variation in yields (∼30%).This was not significant for Regensburg, where theyield range was small. At Bad Lauchstädt the modelsystematically underestimated yield limitations butadjusting the initial water content of the soil reducedthe mean difference by about 2 t ha−1. Measuredseasonal rainfall at Bad Lauchstädt was lower thanderived from the HADCM2 baseline data, especially
Table 4Summary of statistical evaluation of the modified model for productivity assessment; root mean square error (RMSE) and mean difference(MD)
Site location/experiment Period Number ofobservations
Correlationcoefficient
RMSE (t ha−1) MD (t ha−1)
Broom’s BarnAnnual experiments 1980–1991 12 0.670∗ 1.68 0.12
RegensburgVariety trials 1978–1995 13 0.534a 1.35 0.24
Bad LauchstädtLong-term experiment 1965–1992 28 0.519∗∗ 1.7 −0.59
Broom’s BarnRotation experiment 1965–1995 31 0.661∗∗∗ 2.9 2.5
a Not significant.∗ P < 0.05.∗∗ P < 0.01.∗∗∗ P < 0.001.
in dry years, such as 1988, which may account forsome of the unexplained variability. In comparisonto the original model, neither the introduction ofdrought-related foliage dynamics nor variable RUEsignificantly changed simulated yields at either site.
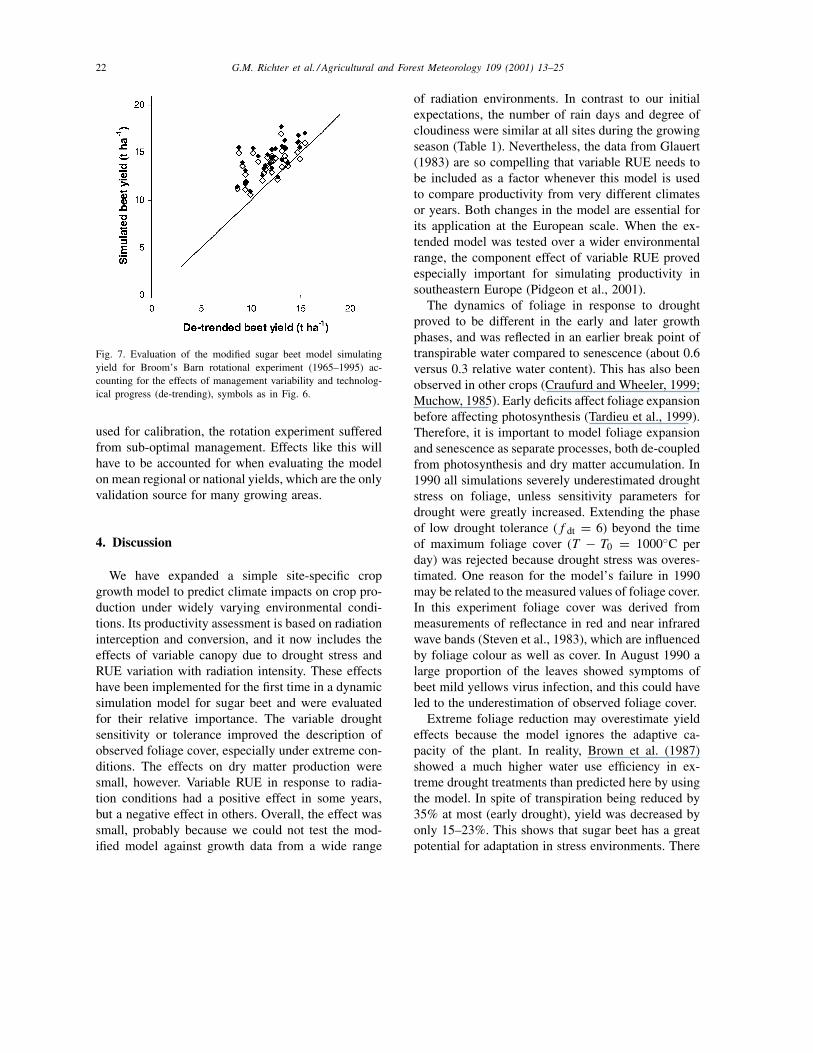
Validation on the data from the Broom’s Barn rota-tion experiment showed that the model overestimatedobserved de-trended sugar beet yields by about 15%(Fig. 7). The expansion of the model by introduc-ing drought effects on foliage slightly improved theagreement between observed and simulated sugar beetyields. However, introducing variable RUE did not im-prove the simulation. Compared to the experiments
22 G.M. Richter et al. / Agricultural and Forest Meteorology 109 (2001) 13–25
Fig. 7. Evaluation of the modified sugar beet model simulatingyield for Broom’s Barn rotational experiment (1965–1995) ac-counting for the effects of management variability and technolog-ical progress (de-trending), symbols as in Fig. 6.
used for calibration, the rotation experiment sufferedfrom sub-optimal management. Effects like this willhave to be accounted for when evaluating the modelon mean regional or national yields, which are the onlyvalidation source for many growing areas.
4. Discussion
We have expanded a simple site-specific cropgrowth model to predict climate impacts on crop pro-duction under widely varying environmental condi-tions. Its productivity assessment is based on radiationinterception and conversion, and it now includes theeffects of variable canopy due to drought stress andRUE variation with radiation intensity. These effectshave been implemented for the first time in a dynamicsimulation model for sugar beet and were evaluatedfor their relative importance. The variable droughtsensitivity or tolerance improved the description ofobserved foliage cover, especially under extreme con-ditions. The effects on dry matter production weresmall, however. Variable RUE in response to radia-tion conditions had a positive effect in some years,but a negative effect in others. Overall, the effect wassmall, probably because we could not test the mod-ified model against growth data from a wide range
of radiation environments. In contrast to our initialexpectations, the number of rain days and degree ofcloudiness were similar at all sites during the growingseason (Table 1). Nevertheless, the data from Glauert(1983) are so compelling that variable RUE needs tobe included as a factor whenever this model is usedto compare productivity from very different climatesor years. Both changes in the model are essential forits application at the European scale. When the ex-tended model was tested over a wider environmentalrange, the component effect of variable RUE provedespecially important for simulating productivity insoutheastern Europe (Pidgeon et al., 2001).
The dynamics of foliage in response to droughtproved to be different in the early and later growthphases, and was reflected in an earlier break point oftranspirable water compared to senescence (about 0.6versus 0.3 relative water content). This has also beenobserved in other crops (Craufurd and Wheeler, 1999;Muchow, 1985). Early deficits affect foliage expansionbefore affecting photosynthesis (Tardieu et al., 1999).Therefore, it is important to model foliage expansionand senescence as separate processes, both de-coupledfrom photosynthesis and dry matter accumulation. In1990 all simulations severely underestimated droughtstress on foliage, unless sensitivity parameters fordrought were greatly increased. Extending the phaseof low drought tolerance (f dt = 6) beyond the timeof maximum foliage cover (T − T0 = 1000◦C perday) was rejected because drought stress was overes-timated. One reason for the model’s failure in 1990may be related to the measured values of foliage cover.In this experiment foliage cover was derived frommeasurements of reflectance in red and near infraredwave bands (Steven et al., 1983), which are influencedby foliage colour as well as cover. In August 1990 alarge proportion of the leaves showed symptoms ofbeet mild yellows virus infection, and this could haveled to the underestimation of observed foliage cover.
Extreme foliage reduction may overestimate yieldeffects because the model ignores the adaptive ca-pacity of the plant. In reality, Brown et al. (1987)showed a much higher water use efficiency in ex-treme drought treatments than predicted here by usingthe model. In spite of transpiration being reduced by35% at most (early drought), yield was decreased byonly 15–23%. This shows that sugar beet has a greatpotential for adaptation in stress environments. There
G.M. Richter et al. / Agricultural and Forest Meteorology 109 (2001) 13–25 23
are two likely reasons for the model’s underestima-tions of yield when the crop has been stressed. First,the model estimates the intensity of stress from thewater availability averaged over the whole rooted soilprofile. When water is added to the top of a dry profileit is readily available and preferentially taken up fromthe surface layers. Therefore, the crop recovers morerapidly than the model predicts. Second, the modeltakes no account of translocation of dry matter fromdying leaves back into the plant’s storage. Bürcky andBiscoe (1983) showed that for nitrogenous compoundsat least, this could account for 75% of leaf content.This phenomenon is included in SUCROS but only inits most general form (van Laar et al., 1992) and hasyet to be described as a function of drought stress.
Throughout, we have considered water stress, nothigh temperature stress. The current model takesno account of any deleterious effects of high (leaf)temperatures on photosynthesis, respiration and drymatter production because it was developed and cal-ibrated in an environment where such conditions arerare (eastern UK). Stress from high temperaturesprobably plays an important role in limiting produc-tivity in continental climates (Paulsen, 1994). In sugarbeet these effects are poorly understood but shouldbe considered before the model is developed further.
We have implemented a method of varying RUEin relation to irradiance which, beyond expectation,matched variation measured for sugar beet. This fillsa gap in our knowledge about differences in cropresponse (Sinclair and Muchow, 1999) and on theeffects of radiation quality. There is no other relation-ship in the literature for sugar beet, and at this scaleit is uncommon to find reliable data for global anddiffuse radiation related to crop productivity. Werkerand Jaggard (1998) commented that in their anal-ysis there was a tendency for RUE to be inverselyrelated to mean incident radiation from May to Oc-tober. Artificial shading increased the proportion ofdiffuse radiation and consequently the RUE of a grasscanopy by 46–50% (Healey et al., 1998). Rochetteet al. (1996) measured instantaneous RUE in a maizecrop and related it to the intercepted photosyntheticactive radiation (IPAR). Aggregating measurementsfor completely cloudy and clear days, they found a∼30% decrease in net photosynthetic efficiency (2versus 1.4 mg CO2 mmol−1 IPAR, respectively). Thisis a smaller change than evident in Glauert’s (1983)
data and, on the basis of the shape of the light re-sponse curves, one expects the C4 maize crop to retainits efficiency in bright light better than sugar beet.
Model evaluations under temperate and summer-humid conditions showed that the introduction ofdrought-related foliage dynamics and variable RUEdid not significantly change the overall prediction ofrain-fed dry matter production. Comparing potentialproduction with and without the foliage dynamicscomponent in the model reveals the contribution offoliage reduction to dry matter production. In yearswhen the foliage was severely affected by drought(1989–1991), the reduction of light interception de-creased yield by at least 7%, and possibly twice this,because we may have underestimated the decrease inground cover. As shown in a companion paper (Pid-geon et al., 2001) an effect of variable RUE will onlybe seen in very sunny summers in the UK (e.g. 1976,1995). The simultaneous effect of drought stress onphotosynthesis, however, may be dominant comparedto drought effects on the canopy and the consequentialreduction of radiation interception.
For model application in continental regions, thewater balance and differences in management arevery important. Sugar yields were reduced by lowinitial water contents due to insufficient winter rain-fall. Strictly, these have to be simulated for each yearto account for the pre-season water balance and wateravailability. This is also important when rainfall islimited during the growing season and water storagein the profile contributes significantly to the crop’swater supply. Therefore, simulating on the basis of amean initial water content can only improve the meanestimate of production and will explain little of thevariation within a region. Carry-over effects in thewater balance will need to be included in future im-pact assessments. Another possible cause for the overestimation of yield is the down-scaling procedure ofmonthly meteorological inputs. Linear interpolationand random distribution of mean rainfall rates willsmooth the simulated water stress. In addition, thedifferences between measured weather data and thoseprovided for the 0.5◦ × 0.5◦ region (New et al., 2000)are a third reason for the large amount of unexplainedvariation in evaluating the model. For Bad Lauchstädtthe averages of measured and simulated input of pre-season precipitation (October–March) were simi-lar (180 versus 192 mm). However, for years with
24 G.M. Richter et al. / Agricultural and Forest Meteorology 109 (2001) 13–25
unpredicted low yields (e.g. 1988) the discrepancies inprecipitation were 80–100 mm. Regional adjustmentfactors, currently used to match predicted to observedyields, may reflect this difference in simulated andactual weather as well as variation in management.
5. Conclusions
Having included two known, potentially limiting,processes in our simulation model, we can now re-late sugar beet production to input variables acrossa large range of environments. We have shown theimportance of each additional process on the localscale, and we now have an efficient tool to apply themodel for scenario analyses at the continental scale.However, the users of such simulation tools shouldremain aware of the limitations, which arise fromdown-scaling regional inputs.
The first modification allowed RUE to vary with thefraction of diffuse light derived from an establishedempirical relationship with atmospheric transmission.Observed RUE from gas exchange measurementsmatched the modelling approach closely. This is im-portant at the macroscopic scale and with respect tothe description of extreme climatic events (Pidgeonet al., 2001, companion paper).
Second, drought-related foliage dynamics has twoconsequences, one of which is described in this mod-elling approach: variable radiation interception. Asshown here, this direct effect on canopy expansionand senescence is less important than anticipated. Inits second consequence, drought affects DM parti-tioning and translocation. The current model makesno allowance for the fate of foliage dry matter whenleaves die, either as a result of ageing or prematurelyas a result of water stress. Future work will have toestablish a relation between drought and translocationrates from leaves/tops to the storage organ.
Acknowledgements
The Ministry for Agriculture Fisheries and Foodfunded this work, commission project “Assessing cli-mate impact for key crops in the UK”, Project No. CC0336. We thank D. Bürcky (Südzucker, Ochsenfurt)for the yield data for Regensburg and M. Körschens
(UFZ-Bodenforschung, Halle) for supplying yieldand weather data for Bad Lauchstädt. We also thankJohn Pidgeon at Broom’s Barn for his inspiration toextend our views to the continental scale and DavidLister (CRU, University of East Anglia) for extract-ing weather data for appropriate grid boxes of theEuropean weather database.
References
Bouman, B.A.M., 1992. Linking physical remote sensing modelswith crop growth simulation models, applied for sugar beet.Int. J. Remote Sensing 13, 2565–2581.
Brown, K.F., Messem, A.B., Dunham, R.J., Biscoe, P.V., 1987.Effect of drought in growth and water use of sugar beet. J.Agric. Sci., Cambridge 109, 421–435.
Bürcky, K., Biscoe, P.V., 1983. Stickstoff im Rübenblatt undN-Translokation aus alternden Blättern. In: Proceedings of 46thCongress of the International Institute for Sugar Beet Research,Brussels, pp. 63–75.
Craufurd, P.Q., Wheeler, T.R., 1999. Effect of drought and plantdensity on radiation interception, radiation-use efficiency andpartitioning of dry matter to seeds in cowpea. Exp. Agric. 35,309–325.
DeWit, C.T., 1965. Photosynthesis of leaf canopies. AgriculturalResearch Report No, 663. Institute for Biological and ChemicalResearch on Field Crops and Herbs, Wageningen, TheNetherlands.
Glauert, W., 1983. Carbon exchange of a sugar beet crop througha season. PhD Thesis, University of Nottingham, 207 p.
Goudriaan, J., van Laar, H.H., 1978. Calculation of daily totalsof the gross CO2 assimilation of leaf canopies. Neth. J. Agric.Sci. 26, 373–382.
Guérif, M., Duke, C., 1998. Calibration of the SUCROS emergenceand early growth module for sugar beet using optical remotesensing data assimilation. Eur. J. Agron. 9, 127–136.
Healey, K.D., Rickert, K.G., Hammer, G.L., Bange, M.P., 1998.Radiation use efficiency increases when the diffuse componentof incident radiation is enhanced under shade. Aust. J. Agric.Res. 49, 665–672.
Jaggard, K.W., Werker, A.R., 1999. An evaluation of the potentialbenefits and costs of autumn sown sugarbeet in NW Europe.J. Agric. Sci., Cambridge 132, 91–102.
Jaggard, K.W., Dewar, A.M., Pidgeon, J.D., 1998. The relativeeffects of drought stress and virus yellows on the yield ofsugarbeet in the UK, 1980–1995. J. Agric. Sci., Cambridge103, 337–343.
Körschens, M. (Ed.), 1994. Der Statische DüngungsversuchBad Lauchstädt nach 90 Jahren. Einfluß der Düngung aufBoden, Pflanze und Umwelt. B.G. Teubner Verlagsgesellschaft,Stuttgart Leipzig, 179 p.
Milford, G.F.J., Pocock, T.O., Riley, J., Messem, A.B., 1985. Ananalysis of leaf growth in sugar beet. Part III. Leaf expansionin field crops. Ann. Appl. Biol. 106, 187–203.
G.M. Richter et al. / Agricultural and Forest Meteorology 109 (2001) 13–25 25
Muchow, R.C., 1985. Canopy development in grain legumesgrown under different soil water regimes in a semi-arid tropicalenvironment. Field Crops Res. 11, 99–109.
New, M., Hulme, M., Jones, P.D., 2000. Representing 20th-centuryspace–time climate variability. Part II. Development of1901–1996 monthly grids of terrestrial surface climate. J.Climate 13, 2217–2238.
Paulsen, G.M., 1994. High temperature responses of crop plants.In: Boote, K.J., Bonnett, J.M., Sinclair, T.R., Paulsen, G.M.(Eds.), Physiology and Determination of Crop Yield. Agron.Soc. Am., Crop Sci. Soc. Am., Soil Sci. Soc. Am., pp. 365–389.
Pidgeon, J.D., Werker, A.R., Jaggard, K.W., Richter, G.M., Lister,D.H., Jones, P.D., 2001. Climatic impact on the productivity ofsugar beet in Europe, 1961–1995. Agric Forest Meteorol 109,27–38.
Rochette, P., Desjardins, R.L., Pattey, E., Lessard, R., 1996.Instantaneous measurement of radiation and water useefficiencies of a maize crop. Agron. J. 88, 627–635.
Sinclair, T.R., 1986. Water and nitrogen limitations in soybeangrain production. Part I. Model development. Field Crops Res.15, 125–141.
Sinclair, T.R., Muchow, R.C., 1999. Radiation use efficiency.Advances Agron. 65, 215–265.
Sinclair, T.R., Muchow, R.C., Ludlow, M.M., Leach, G.J., Lawn,R.J., Foale, M.A., 1987. Field and model analysis of the effect ofwater deficits on carbon and nitrogen accumulation by soybean,cowpea and black gram. Field Crops Res. 17, 121–140.
Smith, J., Smith, P., Addiscott, T., 1996a. Quantitative methods toevaluate and compare soil organic matter (SOM) models.In: Powlson, D.S., Smith, P., Smith, J. (Eds.), Evaluation ofSoil Organic Matter Models, Vol. I 38. NATO ASI Series,pp. 181–199.
Smith, P., Smith, J.U., Powlson, D.S. (Eds.), 1996b. SoilOrganic Matter Network (SOMNET): Model and ExperimentalMetadata. GCTE Report 7, GCTE Focus 3 Office, Wallingford,Oxon.
Spitters, C.J.T., Toussaint, H.A.J.M., Goudriaan, J., 1986.Separating the diffuse and direct component of global radiationand its implication for modeling canopy photosynthesis. PartI. Components of incoming radiation. Agric. Forest Meteorol.38, 217–229.
Steven, M.D., Jaggard, K.W., 1995. Advances in crop monitoringby remote sensing. In: Danson, F.M., Plumer, S.E. (Eds.),Advances in Environmental Remote Sensing. Wiley, Chichester,pp.143–153.
Steven, M.D., Biscoe, P.V., Jaggard, K.W., 1983. Estimation ofsugar beet productivity from reflection in the red and infra-redspectral band. Int. J. Remote Sensing 4, 325–334.
Tardieu, F., Granier, C., Muller, B., 1999. Modelling leafexpansion in a fluctuating environment: are changes in specificleaf area a consequence of changes in expansion rate? NewPhytol. 143, 33–44.
van Laar, H.H., Goudriaan, J., van Keulen, H., 1992. Simulationof crop growth for potential and water-limited productionsituations (as applied to spring wheat). CABO-DLO, SimulationReport 27.
Werker, A.R., Jaggard, K.W., 1997. Modelling asymmetricalgrowth curves that rise and then fall: applications to foliagedynamics of sugar beet (Beta vulgaris L.). Ann. Botany 79,657–665.
Werker, A.R., Jaggard, K.W., 1998. Dependence of sugar beetyield on light interception and evapotranspiration. Agric. ForestMeteorol. 89, 229–240.


