Embed Size (px)
Citation preview

AGRICULTURAL AND
FOREST METEOROLOGY
E LS EV I ER Agricultural and Forest Meteorology 69 (1994) 247-266
Radiative transfer in shrub savanna sites in Niger: preliminary results from HAPEX-Sahel.
2. Photosynthetically active radiation interception of the woody layer
A. B6gu6*, N.P. Hanan and S.D. Prince University of Maryland, Geography Department, 1113 Lefrak Hall, College Park, MD 20742, USA
(Received 22 February 1993; revision accepted 6 September 1993)
Abstract
Interception by the woody layer of photosynthetically active radiation (PAR) was measured and calculated for two Guiera senegalensis J.F. Gruel. shrub savannas in Ouallam, Western Niger, in 1991 as part of the HAPEX-Sahel experiment.
Two different scales were considered. At the plant scale, PAR interception was measured throughout the day with amorphous silicon sensors, together with detailed measurements of the structure of the shrubs (size of the 'envelope' of the shrub, area index, and angular distribution of the leaves and the branches). These data permitted us to develop and validate a simple radiative transfer model in which the shrubs are represented by porous cylinders; the total transmissivity (or porosity) of the shrubs estimated by the model was approximately 0.4. It indicates that semi-arid shrubs cannot be considered opaque objects and that the fraction of ground covered with plants is a poor indicator of the PAR interception efficiency of the canopy.
The model was also applied at a landscape scale to calculate the daily PAR interception of two shrub savanna sites. This value is needed to model primary production in conjunction with remotely sensed and production data acquired simultaneously on the sites.
* Corresponding author at CIRAD/CA, Laboratoire de t~l~d&ection, Val de Montferrand, BP 5 035, Montpellier, Cedex 34 032, France.
0168-1923/94/$07.00 © 1994 Elsevier Science B.V. All rights reserved SSDI 0168-1923('93)02116-N
248 A. Bdgud et al./Agricultural and Forest Meteorology 69 (1994) 247 -266
1. Introduction
This paper is part of a series of three publications about remote sensing of vegetation primary production of shrub savannas. The first and third papers were concerned with the radiometric properties of the shrub savannas (Franklin et al.. 1994; Van Leeuwen et al., 1994), while this one deals with the photosynthetically active radiation (PAR) interception of the woody layer of the savanna. These studies were conducted in 1991, within the framework of the first year of HAPEX-Sahet experiment in Niger, West Africa.
The radiation interception and absorption of a canopy in the PAR region (400-700 nm) is a key variable that affects primary production (Monteith, 1972). Radiative transfer inside canopies has been studied for homogeneous temperate canopies. especially for crops and forests, but has hardly been considered in the case of sparse, semi-arid vegetation. The radiative environment of a canopy is mainly a function of the structure of the vegetation (Monteith, 1981; B6gu~ et al., 1991). A crude classification of the semi-arid Sahelian vegetation can be based on the following structural criteria
(1) Grass savanna consisting of a more or less continuous cover of perennial and annual grasses, and some forbs (Hopkins, 1965). For the purpose of radiative transfer modeling, it can be considered as a homogeneous medium. In this case, radiative transfers are quite well-described and can be approximated by two (e.g. Sellers, 1985) or three flux (e.g. Allen et al., 1970; Suits, 1972) models.
(2) Degraded woody savannas and cereal crops consisting of clumps of vegetation over bare soil. In natural vegetation the clumps can be randomly distributed or clustered, while in crops the spatial pattern is more regular. Generally, there is little overlap between adjacent clumps of vegetation and the structure of the canopy becomes more open in drier regions. The radiative regime of such canopies is more complex than in the previous case and requires a larger number of parameters to describe it adequately. Nevertheless, some modeling efforts have been made and these are discussed later.
(3) Between the first two extremes, all combinations of woody layer and herb layer exist. Hopkins (1965) classifies them into shrub savanna (no trees), tree savanna (scattered trees and shrubs) and savanna woodland (trees and shrubs lbrming a sparse cover). To our knowledge no attempt has been made to model the radiative interactions between the homogeneous (herb) and the discontinuous (woody) layers. This endeavor requires first a good understanding of the radiative transfer regimes of both layers.
Development of a model for a discontinuous tree or shrub layer is the subject of this paper. The PAR absorption of the woody layer affects the primary production of savanna, since it constitutes the energy available for photosynthesis and, by difference with the incoming PAR radiation, it gives the PAR incident on the herb layer. Absorption is defined as the algebric sum of incident radiation, canopy transmitted, soil and canopy reflected radiations. In practise it generally differs rather little from interception which differs only in the omission of the reflection terms.

A. Bggud et al./Agricultural and Forest Meteorology 69 (1994) 247-266 249
The simplest way to model a discontinuous medium is to use the geometric optical theory. For this, two basic features must first be defined: (1) the representation of the clumps of vegetation and (2) their spatial distribution.
(1) According to Egbert (1976) the shape of the clumps (e.g. sphere, spheroid, cylinder, cone) is less relevant in terms of radiative transfer than their density and average size. It was decided to add to these characteristics the porosity of the clump, which is a fundamental parameter in terms of layer transmittance. Most existant geometric models treat vegetation clumps as opaque objects (Egbert, 1976; Li and Strahler, 1985), but this is a crude approximation, except for some coniferous trees and temperate plants in full leaf (Albers et al., 1990). Studies on trees in savanna (Van der Meulen and Werger, 1984; Franklin et al., 1991; Prince, 1987) and cereals crops (B~gu6, 1992) have shown that these clumps of vegetation cannot always be considered as opaque objects. A simple model to calculate the porosity of a clump of vegetation has been developed by B6gu6 (1992) on the basis of average trans- mittance theory (Goel, 1987) applied to cylinders. The inputs of the model are the optical path of the incident radiation (determined by the shape and the size of the clump), the leaf area index of the clump, the leaf inclination distribution function and the transmittance of the leaves in the appropriate wavelength.
(2) In the Sahelian region, all types of spatial distribution of clumps can be found. A hexagonal pattern can be used to describe the spatial arrangement of cereal crops (Brown and Pandolfo, 1969; B+gu~, 1992). Clumps in rows with random spacing (Mann et al., 1979) can also represent crops and, perhaps, vegetation arcs such as the 'tiger bush'. Statistical models, such as the positive and negative binomial, or the Poisson (Li and Strahler, 1985) can adequately describe the spatial distributions of the woody component of all types of woody savannas.
In order to study and model the PAR interception of the woody layer of a shrub savanna, an experiment was conducted in the Sahelian zone of Western Niger. Owing to the northern location of the experimental site, only shrub savanna was available, but the approach would have been similar in the case of a tree savanna. In this paper, the sites and the biological and radiative measurements are described, and the adaptation of a geometric radiative transfer model to woody clumps with a random pattern is discussed. After validation at the plant scale, the model is applied at the landscape scale to calculate daily PAR interception of two shrub savannas.
2. Field measurements
2.1. Description of the sites
The measurements were carried out near Ouallam (14°19~N; 1 °58rE), 100 km North of Niamey in Niger, West Africa. This area is characterized by a short rainy season (mid-June-mid-September) and low rainfall (annual average of about 300 mm for the last 10 years). The year of the experiment, 1991, was exceptionally wet, with rains starting in mid-May and 510 mm of total rainfall.
Two shrub fallow sites of about 0.5 km 2 were selected: a degraded bushland (Guiera

250 A. B~gu~ et al./Agrieultural and Forest Meteorology 69 (1994) 247-266
senegalensis J.F. Gmel. and eroded bare soil) and a bush/grassland (Guiera senegalensis and grass and legume herbaceous cover dominated by Aristida mutabilis Trin. & Rupr.). The soils are sandy with patchy erosion crusts. The measurements were made in early September, at the end of the growing season. The shrubs were still green and in all phenological stages: vegetative, flowering and fruiting.
2.2. Biological measurements
A few shrubs were destructively sampled and the measurements were used to develop allometric relationships. Site scale estimates were made using these allometric relationships.
Site scale At the site scale, the macro-structure of' the vegetation was characterized by
Franklin et al. (1994) who measured the density, the maximum height h and diameter d of the shrubs, in ten circular sub-plots of 15-20 m 2 radius. In order to be closer to the hypothesis of the radiative transfer model, the maximum lengths h and d were transformed in average lengths, after intercalibration of the two techniques on a sample of 56 shrubs (Figs. l(a) and l(b), respectively). The average lengths technique gives more stable results with the allometric relationships by reducing the scatter owing to individual long branches, although it does introduce a subjective element into the measurement.
The shrubs were less dense in the bush/grassland than in the bushland, but the shrubs were larger. This resulted in a similar ground cover by shrubs in the two sites (Table 1). In the bushland, the size frequency distribution of the shrubs followed a semi-logarithmic distribution, which is characteristic of a well-balanced population, while on the bush/grassland, the proportions of young and old shrubs were equal (Fig. 2). This anomaly can be explained by the heavy grazing of the bush/grassland
7~
H~
t) i . . . . . . . . . . . . . . . . . . . . . . . . . . . . . . . . . . . . . . . . . . .
I
, i
(e) (b)
Fig. 1. Measurement of the macro-structure of a Guiera senegalensis shrub: (a) maximal lengths technique, (b) average lengths technique (measurements of the height and diameter of the mean cylindrical envelope).

A. B~gug et al./Agricuhural and Forest Meteorology 69 (1994) 247-266
Table 1 Macro-structure of the shrubs at the site scale
251
Number of samples Density h d V (shrubs ha-] ) (m) (m) (m 3)
Soil coverage" (%)
Bushland 342 484 0.97 1.16 1.40 5.97 (standard error) (0.30) ( 0 . 4 7 ) (1.69) Bush/grassland 259 280 1.45 1.49 3.19 5.55 (standard error) (0.37) ( 0 . 5 6 ) (2.54)
"Projected area of the crowns as a percentage of the total area.
site by goats, which affected mainly the small shrubs, and by the possible suppression of small shrubs by the herb layer and fire.
Plant scale At the plant scale, biomass and structure measurements were made on a sample of
56 shrubs; 46 shrubs were selected at random along transects in the two sites and the others were the shrubs on which PAR interception measurements were performed.
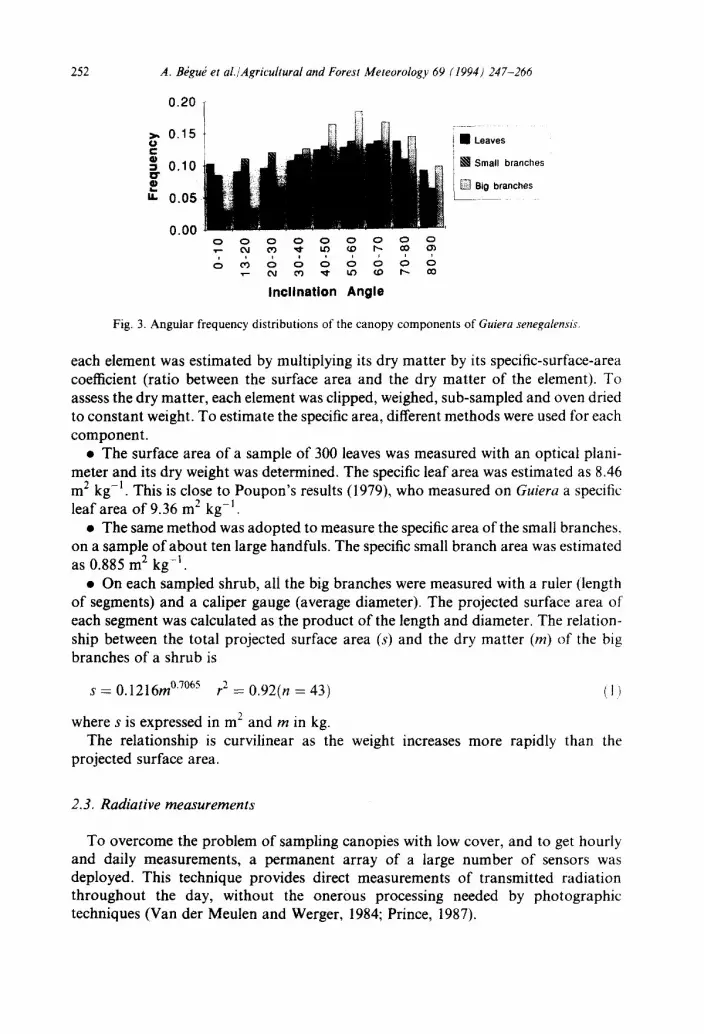
The micro-structure of a shrub can be adequately described by the surface area and the angular distribution of its canopy elements. The canopy components can be considered in three categories: the leaves, small branches (d < 0.3 cm) and big branches (d i> 0.3 cm). The primary stems (trunks) were classified together with the big branches.
The angular distribution of the elements was measured directly with a protractor on 320 leaves, 280 small branches and 170 big branches, selected at random on different shrubs. Figure 3 indicates that the distribution of the leaves is very close to a uniform distribution (no preferential angles), while the branches, especially the big ones, are more plagio-uniformly distributed (most of the branches are oblique).
As the surface area of all the elements of a shrub cannot be measured, the area of
0.250"30 ~ I • Bushland
0.20 . . . . . .
0 .15
0 .10
0 .05
0 .00 Lo o . Lo Q Lo o . Lo o Lo q Lo Q u~ Lq
v A
Volume (m3)
Fig. 2. Frequency distribution of the volume of the Guiera senegalensis shrubs in the two sites.
252 A. B~gu~ et al./Agricultural and Forest Meteorology 69 (1994) 247-266
0.20 f
>, 0 .15 0 ¢,,.
", 0 .10 == u. 0 .05
IIB Leaves
[ ] S m a l l branches
[ ] B i g branches
0 .00 0 0 0 0 0 0 0 0 Q
& m & & o o 6 ~ o
Inc l lnat i0n Angle
Fig. 3. Angular frequency distributions of the canopy components of Guiera senegalensis.
each element was estimated by multiplying its dry matter by its specific-surface-area coefficient (ratio between the surface area and the dry matter of the element). To assess the dry matter, each element was clipped, weighed, sub-sampled and oven dried to constant weight. To estimate the specific area, different methods were used for each component.
• The surface area of a sample of 300 leaves was measured with an optical plani- meter and its dry weight was determined. The specific leaf area was estimated as 8.46 m 2 kg -1. This is close to Poupon's results (1979), who measured on Guiera a specific leaf area of 9.36 m 2 kg -].
• The same method was adopted to measure the specific area of the small branches, on a sample of about ten large handfuls. The specific small branch area was estimated as 0.885 m 2 kg -I.
• On each sampled shrub, all the big branches were measured with a ruler (length of segments) and a caliper gauge (average diameter). The projected surface area of each segment was calculated as the product of the length and diameter. The relation- ship between the total projected surface area (s) and the dry matter (m) of the big branches of a shrub is
s = 0.1216m °7°65 r 2 = 0.92(n = 43) (I)
where s is expressed in m 2 and m in kg. The relationship is curvilinear as the weight increases more rapidly than the
projected surface area.
2.3. Radia t ive measuremen t s
To overcome the problem of sampling canopies with low cover, and to get hourly and daily measurements, a permanent array of a large number of sensors was deployed. This technique provides direct measurements of transmitted radiation throughout the day, without the onerous processing needed by photographic techniques (Van der Meulen and Werger, 1984; Prince, 1987).

A. BOguO et al./Agricultural and Forest Meteorology 69 (1994) 247-266 253
The PAR sensors used were amorphous silicon cells (Chartier et al., 1989). B6gu~ et al. (1991) showed that, with adequate protection, these cells can be used throughout a growing season in tropical conditions.
Radiative measurements were made continuously throughout the day on three plots. For convenience, the PAR sensors were set up in the degraded bushland (no grass layer), in a subjectively selected regular and average patch of vegetation. On each plot, about 120 cells were placed on the ground to measure transmitted PAR, while six cells measured incident PAR above the canopy. The cells were connected to a Campbell 2 IX data logger, recording the output at 10 s intervals and storing them as 15 min means. The sensors were placed on the ground around a central shrub. The sampled area was the unit area of the central shrub. On plots 1 and 3, the limits of the unit area were defined by bisecting the distance between the neighboring shrubs (Figs. 4(a) and 4(c)). On plot 2, the unit area was arbitrarily defined around an isolated shrub at a distance such that the shrub had little influence on the PAR interception measured by cells at the edge of the area (Fig. 4(b)). The characteristics of the plots are given in Tables 2 and 3. Each plot was measured for 1 week, then the cells were moved to another plot. During the first half of the week, the measurements were made on intact shrubs. Then the leaves were clipped off and measurements were continued to estimate wood interception.
Measurements were omitted from the data set if sand obscured the cells owing to rain or disturbance by animals. Only data for clear days were analyzed in order to have comparable irradiance conditions for the three plots. The final PAR data set is composed of hourly measurements for each plot with leaves, plus measurements on plot 2 alone without leaves (clear sky conditions were not available for sites 1 and 3 following leaf removal).
N
(b)
I r . . . . . . . . . . I
I . . . . . . . . . i
0 5rn I I I I - + - q
Fig. 4. Plans of the sampled areas in (a) plot 1, (b) plot 2 and (c) plot 3. The shrubs are represented by circles. Sampling areas of transmitted PAR are delineated by dashed lines.

254 A. Bdgu~ et al./Agricultural and Forest Meteorology 69 (1994) 247-266
Table 2 Sizes of the sampled plots.
Plot 1 Plot 2 Ptol 3
Average distance e between the shrubs (m) 5.48 5.01 a 4.65 Sampling area A ( m 2) 26.00" 21.70 18.7W
'~ For an hexagonal pattern, A = e 2 x/~'~/2
3. Radiative transfer model
The radiative transfer model used to calculate the interception efficiency of the shrubs consists of two sub-models, each describing a different level of structure: the structure of the clump of vegetation (or micro-structure) and the structure of the canopy (or macro-structure). These two sub-models are linked by the porosity of the clumps of vegetation, which is the output from the micro-structure sub-model and an input to the macro-structure sub-model. The sub-models both depend on the shape of the clump. A cylinder was chosen to represent the clump shape. It is a very simple shape characterized by only two parameters (height and diameter) and is azimuthally symmetrical.
3,1. Mic ro - s t ruc tu re mode l
The micro-structure of a clumped canopy is defined here as the external envelope of the clump (cylindrical shape) and the internal structure of the clumps (surface and angular distribution of the canopy elements). The directional porosity p of a clump composed of only one element i (e.g. leaves or branches), is related to its micro- structure as follows (B6gu6, 1992)
p(Os) = e x p ( - K c ( O ~ ) L i ( l - Ti)) (2)
where Os is the solar zenith angle, K¢. is the extinction coefficient of the cylinder which is equal to the product of the average optical path through the cylinder by the average projection of a unit element a r e a , L i is the element area index of the clump (ratio between the area of the element i and the area of the horizontal projection of the clump), and ri is the transmittance of the element in the given spectral band.
If the components of a clump are characterized by different optical properties, Eq. (2) becomes more complicated. Under the assumption of random spatial arrangement of the different elements in the clump, the probability of non-interception of the clump equals the product of the probabilities of non-interception of the individual elements 1 . . . n
P = P l P 2 . . . P n (3)
In the case of Guiera, the assumption of a homogeneous mixed medium of leaves and wood is reasonable (no trunk, only branches covered with leaves). To simplify the calculations, the angular distribution of the leaves and the branches is approximated by a uniform distribution. As the wood is opaque, the expression for the total porosity
A. B~gu~ et al./Agricultural and Forest Meteorology 69 (1994) 247-266 255
of a shrub is
p(Os) = exp(-Kc(Os)(Ll(1 - Z,) + Lw) ) (4)
where the subscripts l and w stand for leaves and wood, respectively. B6gu4 (1992) showed that, for uniform canopies and clumps with a d:h ratio of 1.2,
the directional porosity p(O~) varies little with Os and can be replaced by a constant value equal to the porosity p calculated for diffuse radiation. This porosity is computed substituting Kc(Os) in Eq. (4) by the extinction coefficient of the diffuse radiation K,. which can be approximated for uniform canopies as
K,. = 0.713 - 0.628 exp ( -0 .6115d/h) (5)
3.2. Macro-structure model
The macro-structure of the canopy is defined by the average size, density and spatial pattern of the clumps (Egbert, 1976). The spatial pattern of the clumps is scale-dependent. Franklin et al. (1985) show that, at the inter-plant scale, the pattern tends to be regular (controlled by biological interactions), while, at the macro- scale, the sites can be described by a random pattern (controlled by environmental interactions).
Inter-plant scale The interception efficiency of a regular canopy can be derived from analytical
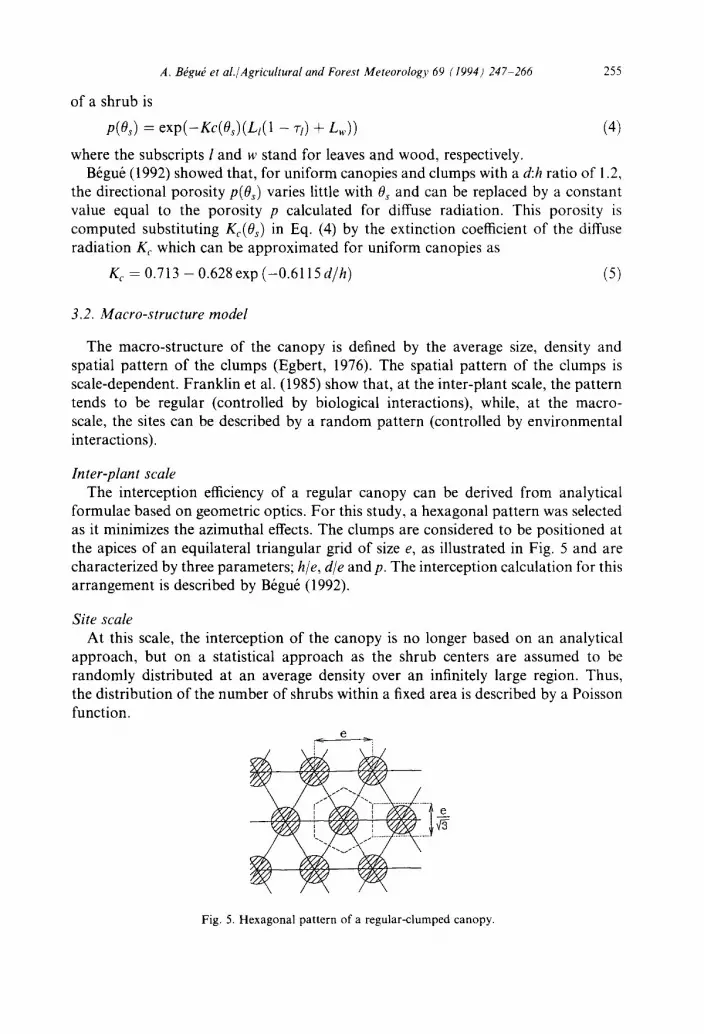
formulae based on geometric optics. For this study, a hexagonal pattern was selected as it minimizes the azimuthal effects. The clumps are considered to be positioned at the apices of an equilateral triangular grid of size e, as illustrated in Fig. 5 and are characterized by three parameters; h/e, die and p. The interception calculation for this arrangement is described by B6gu6 (1992).
Site scale At this scale, the interception of the canopy is no longer based on an analytical
approach, but on a statistical approach as the shrub centers are assumed to be randomly distributed at an average density over an infinitely large region. Thus, the distribution of the number of shrubs within a fixed area is described by a Poisson function.
e
Fig. 5. Hexagonal pattern of a regular-clumped canopy.
256 A. B,dgu( " et al./Agricultural and Forest Meteorology 69 (1994) 247-266
In the case of a random distribution, and only in this case, a Boolean model can be applied. The theory of the Boolean model is discussed by Serra (1982). Mutual shadowing in a clumped canopy is normally treated as a two-dimensional problem. When transposed from the multi-dimensional case to two dimensions, as in our case, a Boolean model indicates that the counts of interception follow a Poisson law with parameter
~(0) ((,i~ where ~ is the density of the object centers on a plane at the base of a layer and A(0) is the average area of an object projected at angle 0 onto the base of the layer.
The probability P of n interceptions is thus
P,(0) - (6A(6))~ exp(-6A(0)) 17~ n!
Strahler and Jupp (1990) have treated the case of opaque objects to model bi-directional reflectance of forests. The trees are simulated by spheroids on sticks and the proportion of sunlit background is given by the Boolean model (Eq. (7)) with n = 0 (no interception). Thus, the interception efficiency ~i(0~) is calculated simply as (1 - P 0 ( 0 s ) ) .
In the case of porous objects, the count of interceptions is very important. In effect. the total interception ei(0s) is the sum of fractional shadows each weighed by a coefficient depending on the porosity p of the objects and the number of previously intercepted objects
ei(O.~) = [ei(0s)(1 -p)] + [Pe(Os)p(1 - p ) ] + . . . + [P,(Os)p"-I(1 - p ) ] (8
The probabilities P of 1 ,2 . . . n interceptions are given by the Boolean model (Eq. (7)).
For cylinders, the mean area A is a function of the distributions of d and h. and of the solar zenith angle 0~
A(Os)= J~' Jo" [Trd ~ dhtan(Os)]g(d)g(h)dddh o t-4 " + (9i
where g(d) and g(h) are the probability density functions of d and h, respectively.
3.3. Daily interception efficiency by the green part of the shrubs
Primary production models generally work on a daily time step. The daily inter- ception efficiency ci is computed as the ratio between the daily amount of intercepted radiation by the canopy and the daily amount of incident radiation (PAR0)
I n I fto eiPARodt (10)
ei - ft~ PAR0dt
where t o and t n are the time of sunrise and sunset, respectively, and f i t is the instanta- neous interception efficiency defined as
~'i = ~i(O,)( l - . f~ ) + ~j;~ (l I)

A. B~gu~ et al./Agricultural and Forest Meteorology 69 (1994) 247 266 257
j= Q.
1
0.8
0.6
0.4
0.2
0
~ pl = exp (-0.337 LAIc)
r2 = 0.93
~ t I I I - - I
0 1 2 3 4 5 6
LAIc
1
0.95
0.9
0.85
0.8
0.75
pw = exp(-0.375 WAIc)
r2 = 0.81
I I - - I b - - I
0.1 0.2 0.3 0.4 0.5
W A I ¢
(a)
(b)
Fig. 6. Regression lines between the porosity of a shrub and its area index, established on 50 sampled shrubs (points) for two types of vegetation components, (a) leaves and (b) wood.
wherefd is the fraction of diffuse radiation and eid is the interception efficiency of the diffuse radiation, calculated by integrating the direct beam interception ei(0s) over the upper hemisphere.
Only the radiation intercepted by the photosynthetically active elements of the plant is significant in terms of primary production. The fraction of PAR intercepted by the leaves (el j) is related to the PAR interception of the whole shrub (ei) by the proportion of leaves in the total average projection of the components of the shrub,

258 A. Bdgui et al./Agricultural and Forest Meteorology 69 (1994) 247-266
Table 3 Shrub structural parameters for the sampled plots (see text)
Central shrub Average shrub
Plot 1 Plot 2 Plot 3 Plot 1 Plot 2 Plot
h 1.12 1.10 1.20 1.12 + d 1.00 1,30 I, 5b 1.34 + LAI 0.073 0.171 0.255 0.129 WAI 0.007 0.020 0.024 0.013 LAI, 2.42 2.80 2.50 2.38 WAI,. 0.23 0.32 0.24 0.23 p~ 0.47 0.36 0.38 0.45 t,, 0.92 0.88 0.90 0,92 p 0.43 0.32 0.34 0.41
[ . 2 ~ ~
1.4U 0.251 0.020 2.96 0.24 0.37 0.91 0.34
"Calculated with Eq. (14).
transmittance included
In p~ ell lnpt + In p~, '
4. Results
4.1. Validation at the plant scale
Input parameters The parameters required for the radiative transfer model are of three types; the
incoming PAR geometry, the structure of the canopy and the optical properties of the elements.
The interception of a discontinuous canopy is generally highly dependent on the geometry of the incoming radiation (B6gu6 et al., 1991). No diffuse radiation mea- surements were made in the field, so empirical values of fraction of diffuse radiation.l) were estimated from a regression established with a data set of solar radiation on clear sky in Niamey (A. B+gu6, unpublished data, 1989)
0.25 f j = (t 3)
0.25 + cos(O.~)
For the validation, two sets of structural parameters were tested: (1) the height, diameter and porosity of the central shrub; (2) an average of the height, diameter and porosity of all the shrubs shadowing the plot during the day.
In the second case, the exact formulation for A is given in Eq. (9). But, for small samples, A can be directly calculated from the "equivalent height' (he) and diameter

A. Bggu~ et al./Agricuhural and Forest Meteorology 69 (1994) 247-266 259
0 . 7
0.6
"~ 0.5 q , .
m 0.4 E
o 0 .3 . m ,(, . ,
0.2 0
• 0.1 E
- - 0
¢J e"
IJ.I
4- o ° m
== O a , .
' ~ ,e.
.e. ,e.
I I I I I I
90 -60 - 30 0 30 60 90
Solar Zenith Angle
0.7
0.6
0.5
0.4
0.3
0.2
0.1
0
- 9 0 - 6 0 - 3 0 0
O
30 60 90
Solar Zenith Angle
(a)
(b)
Fig. 7. Comparisons between measured (points) and simulated (lines) hourly interception efficiencies for (a) plot 1 and (b) plot 3. Central shrub (dotted lines) and average of all shrubs that shadowed the plot (solid line).
(de) o f the sh rubs , def ined as
~ a7 F,i~l dihi de = a n d he - n d e (14)
where n is the n u m b e r o f samples .

260 A. B#gu# et al./Agricultural and Forest Meteorology 69 (1994) 247-266
Calculation of the exact average porosity of the shrubs would be very complicated as not only the size of each shadow, but also the relative position in space of the shrubs should be taken into account. To simplify, a relationship was developed between the area index of the components of the shrubs and their porosity (Figs. 6(a) and 6(b) for the leaves and the wood, respectively). The difference between leaf and wood relationships comes from the transmittance of the elements. These were assumed to be 10% for the leaves and 0% for the wood.
0.70 o ¢" 0.60 .m .9 0.50
tu 0.40
o 0.30 ".~,
0.20
0.10
- - 0.00
-90
i ' ~ t ¸/
i ~ ~ ~ O O G--- ~ - #- ÷ 4 . . . . . . . . . . .
-60 -30 0 30 60 90
S o l a r Z e n i t h A n g l e
0 . 7
0 ~ 0.6
i "° 0.51- .
tu 0 . 4 ~ !.0.
o 0 . 3 -
0.2 . 0 e
e
- - 0 ! ~ - - i I
-90 -60 -30 0 30 60 90
S o l a r Z e n i t h A n g l e
(a)
Fig, 8. Comparisons between measured (points) and simulated (line) hourly PAR interception efficiencies for plot 2 (a) with and (b) without leaves,

A. B~gu~ et al./Agricultural and Forest Meteorology 69 (1994) 247-266 261
Table 3 shows the calculated values of the leaf and wood area indices of the plots (LAI and WAI, respectively), of the clumps (LAIc and WAI¢, respectively), and the daily porosity p of the clumps calculated from the relationships given in Figs. 6(a) and 6(b), and Eq. (3).
Results The examination of the hourly measurements displayed in Figs. 7 and 8 leads to
three general comments. (1) The PAR interception efficiency is very low for the three plots (between 5 and
20%) (2) The PAR interception varies little during the day until a solar zenith angle of
about 60 ° . Beyond this limit, the interception increases rapidly. The small variations during the day are due to the uneven distribution and different sizes of the surround- ing shrubs.
(3) The interception by the leaves represent the larger part of the total interception of the shrubs.
Simulated values computed with the parameters of the central shrub were closer to the measured ones around midday, while the simulated values with the average shrub were better for high solar zenith angles (Fig. 7). This is consistent with shadowing throughout the day. Simulated values fitted the measured ones fairly well, except for a little bias at the beginning and the end of the day. This bias may be partly due to an over-estimation of the fraction of diffuse radiation. For plot 2, the model under- estimates the interception efficiency of the leafless shrub (Fig. 8(b)). This could be explained by sampling error, which would be more obvious in this case because of the
° B
co
"10
m
E
0.2
0.15
0.1
0.05
J Plot 3 o J
Plot 2
Plot 1 ~
~ 0 PIll 2 (leafless)
0 0.05 0.1 0.15 0.2
Measured E J
Fig, 9. Comparisons between measured and simulated daily PAR interception efficiencies. The solid line is the 1 : 1 line.
262 A. BOgu~ et al./ Agricultural and Forest Meteorology 69 (1994) 247-266
Table 4 Micro-structure and biomass of the shrubs at the site scale
m (t ha i) LAI WAI LAI c WAI, p/ p. p
Bushland 0.59 0.121 0.015 2.02 0.25 0.51 Ik90 0.4(~ Bush/grassland 0.77 0.159 0.020 2.86 0.33 0.38 i).88 0.34
size and the clumped nature of the branches (it is more difficult to obtain a good sample when the shadow has a small area and is not well-distributed in space).
To compute the daily interception efficiency of the plots, the structural parameters were taken as those of the central shrub, since the central shrub had a dominant role in the PAR interception at noon which corresponds to the peak of incident radiation. Simulated values are compared with the measurements in Fig. 9. Once again the model simulates fairly well the PAR interception of a Guiera canopy, except in the leafless configuration.
4.2. Application at the site scale
Input parameters 'Equivalent' heights and diameters (Eq. (14)) of the populations of the two sites
were 0.98 m, 1.25 m and 1.45 m, 1.59 m for the bushland and the bush/grassland, respectively.
An attempt was made to estimate the porosity from allometric relationships established on the 56 shrubs sample. Although some relationships were apparent, no significant correlations between the macro-structure parameters of the shrubs and their porosity were found (r 2 of 0.16, 0.09, 0.08 and 0.07 for relationships with the
U
¢J
w
t -
0
g P
e -
l . m 4 o
..... ' ~. 0.2 LU
i / ,
• 0
J ' / ~" 0.1
[
~ . . . . . . . . . . . 0
0 3 0 6 0 9 0
S o l a r Z e n i t h A n g l e
0.2
0.1
I Bush Grassland [ . . . .
./ !J-Jim'///
. . . . . . . . . . +
0 30 60 90
Solar Zenith Angle
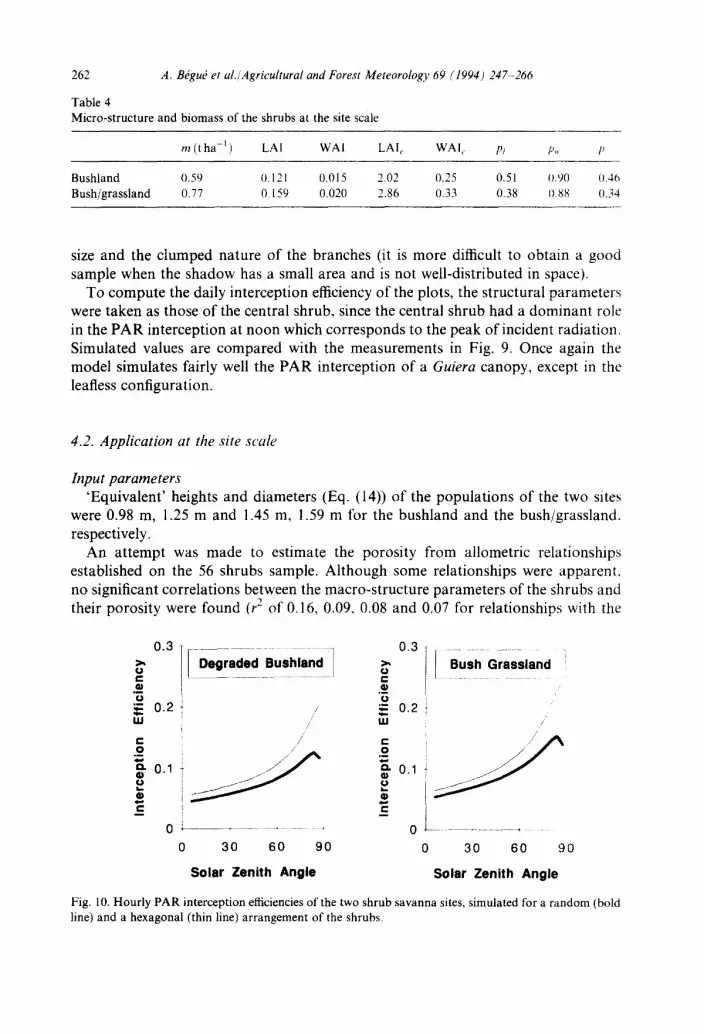
Fig. 10. Hourly PAR interception efficiencies of the two shrub savanna sites, simulated for a random (bold line) and a hexagonal (thin line) arrangement of the shrubs.

A. B~gu~ et al./Agricultural and Forest Meteorology 69 (1994) 247-266 263
Table 5 Computed daily PAR interception efficiencies of the sites for different spatial arrangements of the clumps and for the different canopy components
Bushland Bush/grassland
Total Leafless Leaves only Total Leafless Leaves only
Poisson 6.61% 1.27% 5.73% 8.09% 1.53% 7.16% Hexagonal 8.56% 1.63% 7.42% 10.15% 1.91% 8.98%
height, diameter, volume and horizontal projection of the crown of the shrubs, respectively). The leaves, small branches and big branches surface areas, however, were well-correlated with the volume of the shrubs (r 2 of 0.88, 0.72 and 0.76, respec- tively). Knowing the average horizontal projection of the shrubs for each site it was easy to calculate LAIc and WAIt. These values were then used to estimate shrub porosity on the two sites (Table 4) using the relationships developed in Figs. 6(a) and 6(b).
In the degraded bushland, the shrubs were more porous than in the bush/grassland (0.46 and 0.34, respectively). This may be related to the size of the shrubs (Table 1), since small shrubs have generally a lower LAI c and so a higher porosity. The values of porosity for Guiera are comparable with the few data given in the literature for trees in semi-arid zones of southern and eastern Africa: 0.34 (Van der Meulen and Werger, 1984) and 0.5 (Prince, 1987), respectively. At the time of the measure- ments, the contribution of the wood to the porosity of the shrubs was quite small, approximatively 10%.
Interception efficiency o f the sites Although the more realistic distribution of shrubs at the site scale is random,
hourly (Fig. 10) and daily (Table 5), interception efficiencies of the two sites were computed for randomly and regularly distributed clumps of vegetation for com- parison.
The hourly £i pattern can be characterized by the interception efficiency at midday which is related to the fraction of plant cover and the slope of the interception curve which is related to the height of the clump (B6gu6 et al., 1991). As expected, our data displayed low values of midday ~i corresponding to low values of plant cover (higher values for the bush/grassland than for the bushland) and exhibited certain directional effects (ei doubles with an increase from 0 ° to 65 ° of solar zenith angle) a little more pronounced in the case of the bush/grassland. The decrease of interception at the end of the day is explained by the combined effects of (1) the balance between the inter- ception of diffuse radiation (13.6% throughout the day, for the bushland with a regular distribution of the shrubs) and the interception of direct radiation (from 4% at midday to 100% at the sunset for the same example); (2) the increase of the fraction of diffuse radiation at high solar zenith angles.
A regular arrangement of the shrubs is more efficient in terms of interception and
264 A. B~gu~ et al./Agrieultural and Forest Meteorology 69 (1994) 247-266
has more pronounced directional effects than randomly distributed shrubs, because mutual shadowing is reduced to a minimum. Because of these strong directional effects, the decrease of interception at high solar zenith angle is almost non-existent for a regular distribution of the shrubs.
Nevertheless, in both cases, the daily ~i of the bushlands is very low, less then 11% (Table 5). For the random case, daily Ei is similar to the fraction of covered soil (Table 1), but this does not imply that ei and fraction of covered soil are equivalent (Prince, 1987). A close examination of the data shows that the bushland has more woody vegetation cover than the bush/grassland, but displays a lower daily el. The relation- ship between fraction of covered soil and ei is mainly determined by the porosity of the clumps of vegetation, which can be very variable according to the environment and the phenological stage.
The absolute PAR interception of the wood is negligible (less than 2% of the incoming radiation). The ratio between the PAR interception by the photosynthetic (leaves) and non-photosynthetic elements (wood) is about 0.9 (Eq. (12)).
5. Discussion
Porous cylinders were shown to be a satisfactory representation of Guiera shrubs for the purpose of describing radiative transfer in shrub savannas dominated by this species. The average porosity was about 0.4, which is not negligible in terms of canopy transmittance. In the particular case studied here, the Sahelian bushlands at the end of the growing season, the leaves were the main component determining porosity. Thus, the porosity depends on the same factors as the leaf area, such as physical environ- ment and human management. Unlike millet (B~gu~, 1992), the porosity of Guiera is dependent on time and species (Prince, 1987; Franklin et al., 1991).
Another important factor in terms of radiative transfer, is the secondary and higher-order clumping of the elements inside a clump of vegetation. A homogeneous distribution of the photosynthetic elements seems to be a good approximation in our case, but would not be correct for bigger shrubs or trees, in particular with the presence of a big trunk. Clumping complicates the description of radiative transfer formulation as its modeling requires the introduction of a new parameter, a clumping index, which is a function of the solar zenith angle (Miller, 1967; Chan and Black, 1991) and is not directly provided by field measurements.
This study was interesting in terms of methodology and displayed very encouraging results for the use of simple radiative transfer models for complex canopies. In the year following these studies (1992), the measurements were repeated at a larger temporal and spatial scales and many complementary measurements were made during the HAPEX-Sahel Intensive Observation Period. The larger data set thus acquired should permit us to validate the model for a random pattern of shrubs. and to develop a mixed model of woody and herb layers. The ultimate intention is to couple PAR interception measurements with production and directional reflec- tance measurements to build a primary production model (Prince, 1991), in order to help to model primary production from remotely sensed data.
A. B~gu~ et al./Agricultural and Forest Meteorology 69 (1994) 247-266
Acknowledgments
265
This work was supported by NASA Grants NAG 5-1471. Thanks to Garba and Sidikou for their help in the fields, and to Janet Franklin and Albert Olioso for their useful comments on the manuscript.
References
Albers, B.J., Strahler, A.H., Li, X., Liang, S. and Clarke, K.C., 1990. Radiometric measurements of gap probability in conifer tree canopies. Remote Sens. Environ., 34:179 192.
Allen, W.A., Gayle, T.V. and Richardson, A.J., 1970. Plant canopy irradiance specified by the Duntley equations. J. Opt. Soc Am., 60: 372-376.
B~gu~, A., 1992. Modeling hemispherical and directional radiative fluxes in regular-clumped canopies. Remote Sens. Environ., 40:219 230.
B+gu+, A., Desprat, J.F., Imbernon, J. and Baret, F., 1991. Radiation use efficiency of pearl millet in Sahelian zone. Agric. For. Meteorol., 56:93 110.
Brown, P.S. and Pandolfo, J.P., 1969. An equivalent-obstacle model for the computation of radiation flux in obstructed layers. Agric. Meteorol., 6: 407--421.
Chartier, M., Bonchr&ien, P., Allirand P. and Gosse, G., 1989. Utilisation des cellules au silicium amorphe pour la mesure du rayonnement photosynth&iquement actif. Agronomie, 9: 281-284.
Chen, J.M. and Black, T.A., 1991. Measuring leaf area index of plant canopies with branch architecture. Agric. For. Meteorol., 57: 1-12.
Egbert, D.D., 1976. Determination of the optical bidirectional reflectance from shadowing parameters. PhD thesis, University of Kansas.
Franklin, J., Duncan, J., Huete, A.R., van Leeuwen, W.J.D., Li, X, and B+gu& A., 1994. Radiative transfer in shrub savanna sites in Niger: preliminary results from HAPEX-Sahel. 1. Modelling surface reflec- tance using a geometric-optical approach. Agric. For. Meteorol. 69: 223-245.
Franklin, J., Prince, S.D., Strahler, A.H., Hanan, N.P. and Simonett, D.S., 1991. Reflectance and trans- mission properties of West African savanna trees from ground radiometer measurements. Int. J. Remote Sens., 12: 1369-1385.
Franklin, J., Michaelsen, J. and Strahler, A.H., 1985. Spatial analysis of density dependent pattern in coniferous forest stands. Vegetatio, 64: 29-36.
Goel, N.S., 1987. Models of vegetation canopy reflectance and their use in estimation of biophysical parameters from reflectance data. Remote Sens. Rev., 3:1 212.
Hopkins, B., 1965. Forest and savanna. Heinemann Educational Books, London, 1965. Li, X. and Strahler, A.H., 1975. Geometric-optical modeling of a conifer forest canopy. IEEE Trans.
Geosci. Remote Sens., GE-23: 705-721. Mann, J.E., Curry, G.L., deMichele, D.W. and Baker, D.N., 1979. Light penetration in a row-crop with
random plant spacing. Agron. J., 72: 131-142. Miller, P.C., 1967. Leaf temperatures, leaf orientation and energy exchange in quaking aspen (Populus
tremuloides) and Gambell's oak (Quercus gambellii). Ecol. Plant., 2:241 270. Monteith, J.L., 1972. Solar radiation and productivity in tropical ecosystems. J. Appl. Ecol., 9: 747-766. Monteith, J.L., 1981. Does light limit crop production? In: C.B. Johnson (Editor), Physiological Processes
Limiting Plant Production. Butterworths, London, pp. 23-38. Poupon, H., 1979. Structure et dynamique de la strate ligneuse d'une steppe sah+lienne au nord du S~n~gal.
Th+se de Doctorat, Universit6 Paris-Sud Orsay. Prince, S.D., 1987. Measurement of canopy interception of solar radiation by stands of trees in sparsely
wooded savanna. Int. J. Remote Sens., 8: 1747-1766. Prince, S.D., 1991. A model of regional primary production for use with coarse resolution satellite data. Int.
J. Remote Sens., 12: 1313-1330.

266 A. B~guk et al./Agricultural and Forest Meteorology 69 (1994) 247-266
Sellers, P.J., 1985. Canopy reflectance, photosynthesis and transpiration. Int. J. Remote Sens., 6:1335 1372.
Serra, J., 1982. Image analysis and mathematical morphology. Academic, London, New York. Strabler, A.H. and Jupp, D.L.B., 1990. Modeling bidirectional reflectance of forests and woodlands using
boolean models and geometric optics. Remote Sens. Environ., 34:153-166. Suits, G.H., 1972. The calculation of the directional reflectance of vegetative canopy. Remote Sens.
Environ., 2:117 125. Van der Meulen, F. and Werger, M.J.A., 1984. Crown characteristics, leaf size and light through fall of some
savanna trees in southern Africa. S. Afr. J. Bot., 3: 208-218. Van Leeuwen, W.J.D., Huete, A.R., Duncan, J. and Franklin, J., 1994. Radiative transfer in shrub savanna
sites in Niger: preliminary results from HAPEX-Sahel. 3. Optical dynamics and vegetation index sensitivity to biomass and plant cover. Agric. For. Meteorol., 69:267 288.


