Embed Size (px)
Citation preview
Genetical metabolomics in apples
(Malus x domestica Borkh)
Sabaz Ali Khan
ii
Thesis committee Thesis supervisor
Prof. dr. ir. E. Jacobsen Professor of Plant Breeding (Genetical Variation and Reproduction) Wageningen University Thesis co-supervisor
Dr. ir. H. J. Schouten Senior Scientist Plant Research International, Wageningen University Other members Dr. M.G.M. Aarts, Wageningen University Prof. dr. ir. H.J. Bouwmeester, Wageningen University Dr. J.J.B. Keurentjes, Wageningen University Prof. dr. ing. E.J. Woltering, Wageningen University This research was conducted under the auspices of the Graduate School of Experimental Plant Sciences
iii
Genetical metabolomics in apples
(Malus x domestica Borkh)
Sabaz Ali Khan
Thesis
submitted in fulfilment of the requirements for the degree of doctor
at Wageningen University
by the authority of the Rector Magnificus
Prof. dr. M.J. Kropff,
in the presence of the
Thesis Committee appointed by the Academic Board
to be defended in public
on Thursday 12th, January 2012
at 11 a.m. in the Aula.
iv
Sabaz Ali Khan Genetical metabolomics in apples (Malus x domestica Borkh), 184 pages. PhD thesis, Wageningen University, Wageningen, NL (2012) With references, with summaries in English and Dutch ISBN: 978-94-6173-137-1
v
CONTENTS
Chapter 1
General Introduction 1-14
Chapter 2
Diversity Arrays Technology (DArT) markers in apple for genetic linkage maps
15-36
Chapter 3 Loss and gain of metabolites during apple breeding
37-54
Chapter 4
Genetical metabolomics in apple indicates an mQTL hotspot for phenolic compounds on Linkage Group 16
55-82
Chapter 5 The leucoanthocyanidin reductase gene causes an mQTL hotspot on LG16 for phenolic compounds in apple fruits
83-102
Chapter 6
Differences in acidity of mature apples are mainly caused by a malic acid transporter gene on LG16
103-126
Chapter 7
Anthocyanin production as a potential visual selection marker during plant transformation
127-144
Chapter 8
General Discussion
145-154
References
155-174
Summary in English
175-179
Summary in Dutch
180-184
Acknowledgements
About the author
List of publications
Educational Certificate
vi
Dedicated to my beloved parents

Chapter 1
General Introduction
Chapter 1
2
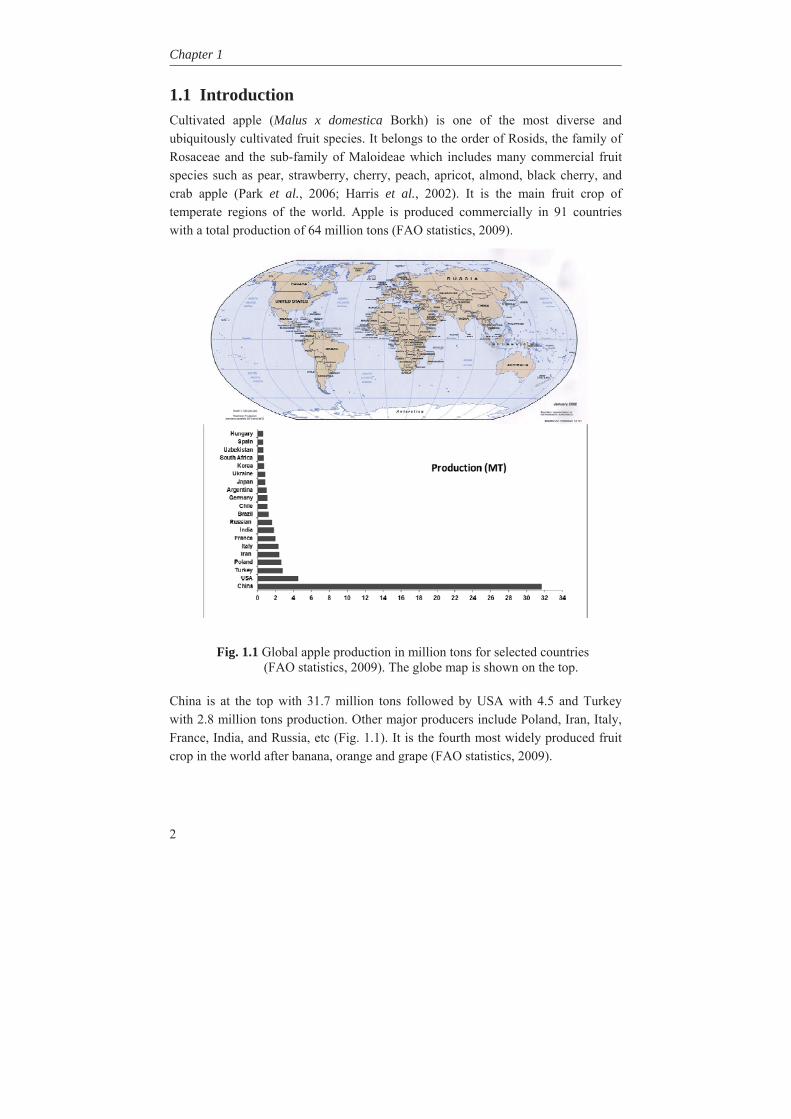
1.1 Introduction Cultivated apple (Malus x domestica Borkh) is one of the most diverse and ubiquitously cultivated fruit species. It belongs to the order of Rosids, the family of Rosaceae and the sub-family of Maloideae which includes many commercial fruit species such as pear, strawberry, cherry, peach, apricot, almond, black cherry, and crab apple (Park et al., 2006; Harris et al., 2002). It is the main fruit crop of temperate regions of the world. Apple is produced commercially in 91 countries with a total production of 64 million tons (FAO statistics, 2009).
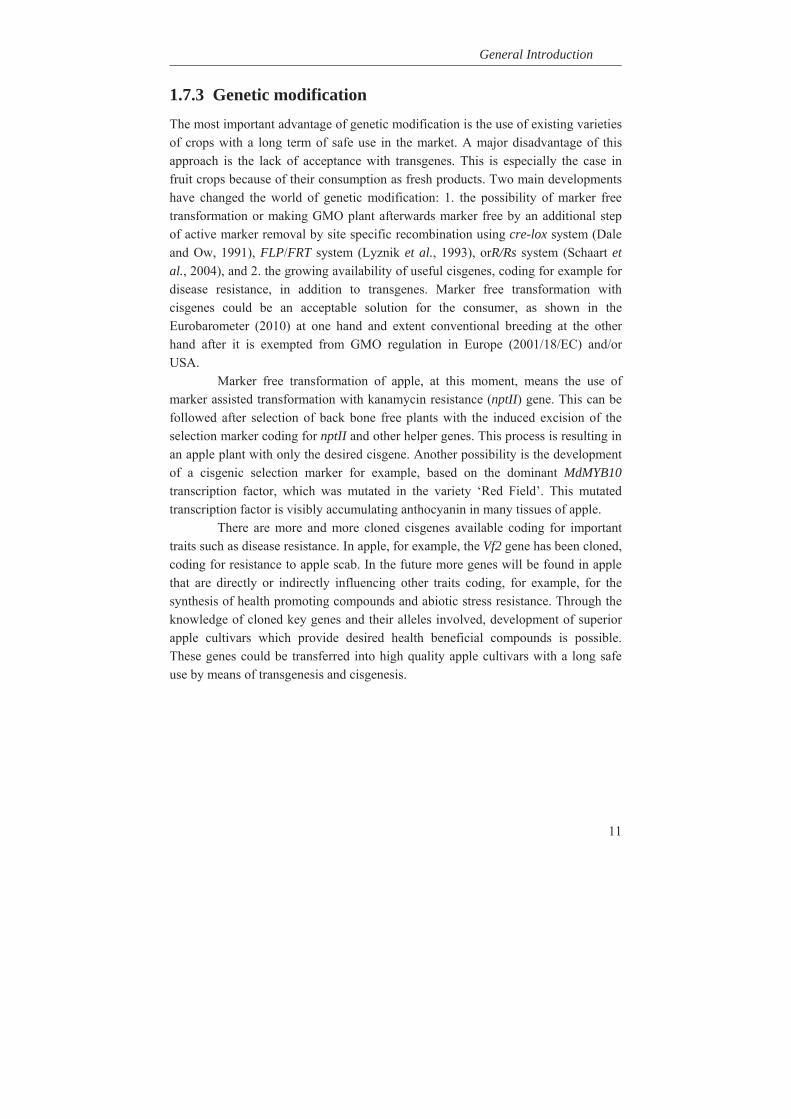
Fig. 1.1 Global apple production in million tons for selected countries (FAO statistics, 2009). The globe map is shown on the top.
China is at the top with 31.7 million tons followed by USA with 4.5 and Turkey with 2.8 million tons production. Other major producers include Poland, Iran, Italy, France, India, and Russia, etc (Fig. 1.1). It is the fourth most widely produced fruit crop in the world after banana, orange and grape (FAO statistics, 2009).
General Introduction
3
1.2 Apple crop breeding and the potential challenges Apple was improved through selection within natural variation over a period of thousands of years starting by early farmers with domestication. The haploid (x) chromosome number for most Rosaceae crops is 7, 8 or 9, however, Pyreae has a distinctive number of x = 17. The reason is that Pyreae has long been considered to be allopolyploid between species related to extant Spiraeoideae (x = 9) and Amygdaleoideae (x = 8) (Evans and Campbell, 2002). It has been reported that an auto-polyploidization also occurred in apple (Evans and Campbell, 2002) which is recently proven with whole genome sequence information of apple cv. ‘Golden Delicious’ (Velasco et al., 2010). The transition from 9 to 17 chromosomes in the Pyreae is the result of a relatively recent genome wide duplication (Velasco et al., 2010), followed by partial reduction at chromosome and gene level. There is no clear agreement among the taxonomists on how many species the genus Malus consists of and as a result of this, the number of species belonging to the genus Malus varies from 25 to 47 according to Robinson et al. (2001) while Harris et al. (2002) mentioned that Malus comprises of 55 species.
The cultivation of apple is supposed to be started long time ago by domestication (Juniper et al., 1999). Sweetness of the fruit appeared to be one of the first domestication traits (Juniper et al., 1999). There is evidence of apple fruit gathering having started as early as the Neolithic times (Juniper et al., 1999). Later cultivation of apple geared up with vegetative propagation of selected phenotypes through cuttings and also with the discovery of grafting techniques (Morgan and Richards, 1993). Nowadays, because of grafting, it is treated as a vegetatively propagated crop in breeding schemes. About 200 years ago, the traditional method of apple improvement by selecting the best individual phenotypes from seedlings grown from open-pollinated seeds was replaced by deliberate hybridization by artificial hand pollination (Gardener et al., 2007).The scientific breeding started with the first controlled cross-pollination carried out by Thomas Knight early in the nineteenth century (Brown, 1975).
Apple is, however, a self-incompatible and highly heterozygous crop, which results in highly diverse progeny plants with only a few of them combining a sufficient number of traits being a major improvement on both the parents (Gardener et al., 2007). Moreover, most of the characters are under polygenic control which results in low efficiency in genetic improvement of breeding clones. This situation is further hampered by the long juvenile period which makes breeding in this crop a very slow and expensive process (Gardener et al., 2007). Another problem is the linkage drag i.e. the introgression of other (undesired) trait(s) along with the trait of interest. This problem is more prominent if introgression of traits from wild species is needed. In that case several backcrosses are needed to remove undesired traits
Chapter 1
4
from the donor species which take at least seven years per single backcross cycle. Development of new apple varieties by means of traditional (introgression) breeding is very slow and takes 25-50 years in developing a superior variety to be available at the market and generally during this long period the new variety becomes deteriorated for its newly acquired traits. This demands the use of new breeding techniques in apple such as marker assisted breeding (Kellerhals et al., 2000; Markussen et al., 1995; Khan et al., 2007; Moriya et al., 2009; Durel et al., 2009; Zhu et al., 2011; Bus et al., 2000) which allows indirect selection of desired traits at a much earlier stage and genetic modification for improvement of existing varieties (James et al., 2003; Puite and Schaart, 1996; Telias et al., 2011; Chagne et al., 2007). Such genetic modification could be done in many ways e.g. by cisgenesis. Cisgenesis is defined as ‘the genetic modification of a recipient plant with natural gene(s) from a sexually compatible plant’ (Schouten et al., 2006a, b).
1.3 The metabolic diversity in apple crop Plants are a rich source of secondary metabolites. It has been estimated that over 100,000 metabolites can be found in plants (Keurentjes et al., 2006). Moreover, substantial qualitative and quantitative variation in metabolite composition is often observed within different individuals of the same plant species (Keurentjes et al., 2006). The currently available metabolic profiling technologies have shown to be effective in detecting differences and similarities in the composition of plant breeding germplasm and species (Harrigan et al., 2007a). Metabolic changes are associated with plant development and responses to applied stresses (Harrigan et al., 2007a). Though, variation in the levels of metabolites within a species or population is quantitative and moderately heritable (Schauer et al., 2006; Rowe et al., 2008), and shows polygenic inheritance (Beló et al., 2008) controlled by the interaction of environmental and genetic factors (Harrigan et al., 2007b; Skogerson et al., 2010).However, it could also be monogenic and could be mapped accurately. Quality traits in many important crop plants are dependent on metabolic composition (Harrigan et al., 2007a). The metabolome represents a critical aspect of a plant’s physiology, growth characteristics, and ultimately its economic value (Harrigan et al., 2007a).
Many cultivated apple genotypes trace their ancestry to a small number of progenitor lineages and, therefore, share a relatively high degree of genetic identity (Richards et al., 2009). Therefore, these relatively few progenitors caused sharp decrease in the genetic biodiversity within the cultivated apples. The narrowness of this genetic base has been further increased, as the number of different varieties used in commercial production has decreased over the last century (Richards et al., 2009). In contrast, wild species within this genus are known to contain substantial genetic diversity such as resistance to biotic stress and quality traits (Richards et al., 2009).
General Introduction
5
1.4 Potential role of apple in human health Fruits are well known for their high value in human health. Epidemiological studies indicate that consumption of fruits, vegetables and their (processed) products are inversely related to carcinogenesis, coronary heart disease, mortality, and aging processes (Sanchez et al., 2004). On one hand, it has been suggested that this reduction is not only due to increased levels of vitamins and fibers, but that other compounds, such as phenolic compounds, also appear to play an important role in the overall antioxidant capacity of fruits and vegetables (Sanchez et al., 2004). On the other hand, it is clear from the fact that there has been recorded a substantial increase in heart and vascular diseases, obesity, cancer and also diabetes due to less fruit intake in food (Hollman and Katan, 1999; Kaur and Kapoor, 2001). The antioxidant properties of phenolic compounds present in plant food may contribute to these health beneficial effects (Hollman and Katan, 1999; Kaur and Kapoor, 2001). In other studies, during the past few years, these secondary metabolites, which occur abundantly in plant foods, have been discovered to be beneficial components of functional food (Treutter, 2001). Their positive effects on human health were first proposed by Bentsáth (1936) and are now widely accepted. Plant phenolic compounds are well recognized for their antioxidative activities and apple is well known for its high levels of these compounds. They scavenge free radicals, thus breaking the free radical chain reaction of lipid peroxidation (Hertog et al., 1993; Hertog, 1992).
“An apple a day keeps the doctor away”. This saying has encouraged many researchers to search for the “magic” ingredients of apple. The beneficial role of apple phenolics prompted Ridgway et al. (1997) to call the apple a “new agrochemical crop”. Apple possesses many health beneficial properties for human being as a rich source of phenolic compounds. It has been associated with lowering the risks of cancers, particularly prostate, liver, colon, and lung cancers (Xing et al., 2001) cardiovascular diseases (Hertog et al., 1993; Hertog, 1992; Hyson et al., 2000), coronary heart diseases, asthma, type-2 diabetes, thrombotic stroke, and ischemic heart disease (Mcghie et al., 2005).
Phenolic compounds are an important part of the human diet and have great importance in the nutritional and commercial properties of agricultural foodstuffs. Phenolic compounds comprise one of the largest and most ubiquitous group of plant metabolites. The most commonly occurring ones in foods are flavonoids and phenolic acids. The diversity of the chemical structures and variability in foods make calculation of the phenolic content difficult. One study in The Netherlands on flavonols and flavones estimated the average intake at 23 mg/day (Hertog et al., 1993). Phenolic content of plant food is currently considered a measure of product quality (Hertog et al., 1993). Some of the major phenolic compounds isolated and
Chapter 1
6
identified from apple are chlorogenic acid, hydroxycinnamic acid, epicatechin, catechin, gallaocatechin, procyanidins, phloretin-glucosides, quercetin glycosides, and dihydrochalcone glycosides (Treutter, 2001; Lu and Foo, 1997; Mazza and Velioglu, 1992; Lancaster, 1992; Nicolas et al., 1994; Awad et al., 2000).
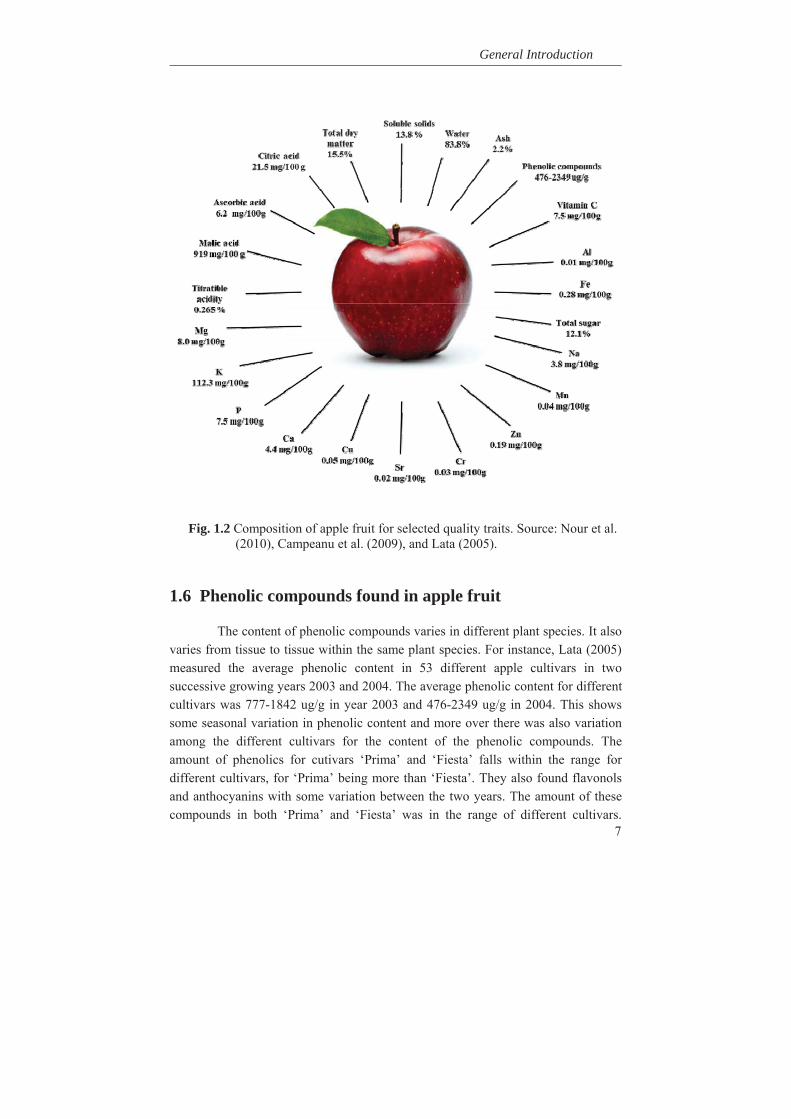
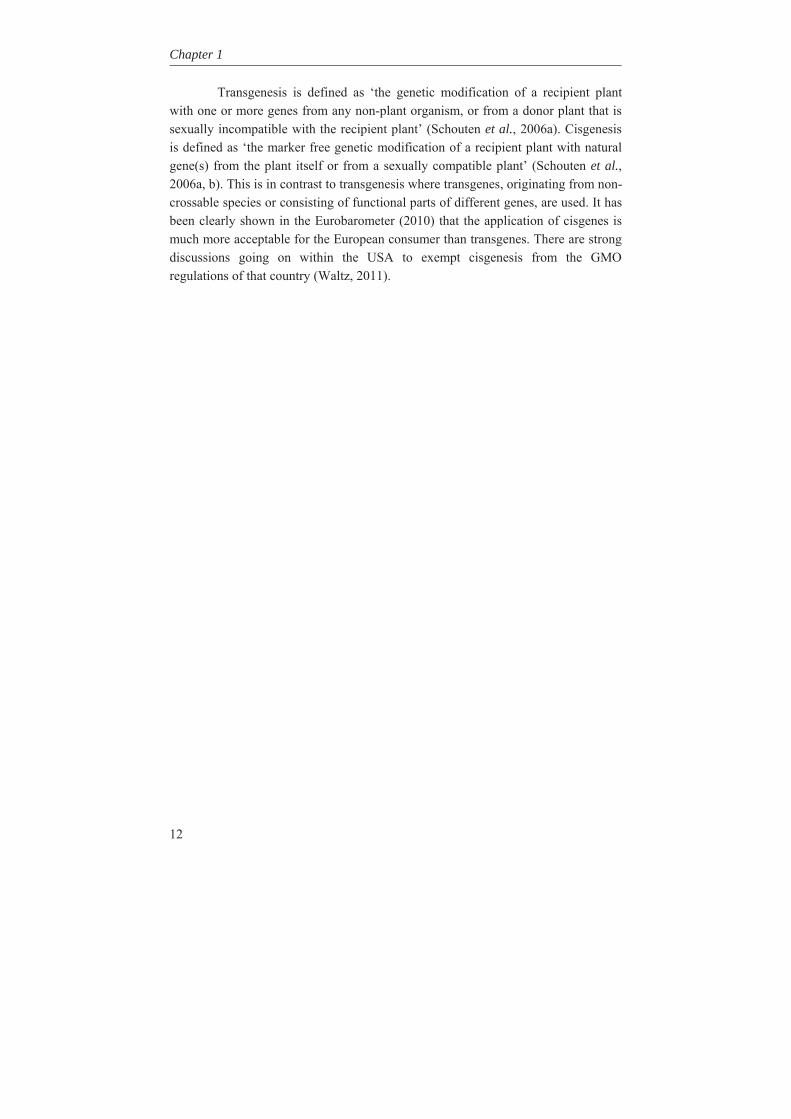
1.5 Importance of taste in fruit consumption The consumption quality of a fruit is one of the important criteria which determine its value for cultivation and breeding (Visser et al., 1968). The organoleptic appreciation of apple depends on both the acid and sugar contents, or rather on the ratio between them, though this ratio alone did not entirely explain the sensation of sweetness. It was concluded that at optimal acidity, the content of aromatic compounds becomes of primary importance for the appreciation of apple. On the other hand, in breeding it should be taken into account that sugar content and acidity inherit independently. A proper balance between sugar content and acidity - the former high, the latter medium - is an essential prerequisite of a dessert apple (Visser et al., 1968; Van der Sluis et al., 2001). The low acidity behaves as a recessive character and because most cultivars appear to be heterozygous, a quarter of the seedlings in progenies may be of the low acid kind (Van der Sluis et al., 2001). The so-called `sweet' fruits constitute a loss to the breeder. However, high-acid cum `sour' fruits are equally undesirable in progenies because their sourness remains unpleasant, irrespective of their sugar content. Composition of apple fruit for selected quality traits as average for 15 different cultivars is given in Fig. 1.2 (Nour et al., 2010).
General Introduction
7
Fig. 1.2 Composition of apple fruit for selected quality traits. Source: Nour et al. (2010), Campeanu et al. (2009), and Lata (2005).
1.6 Phenolic compounds found in apple fruit
The content of phenolic compounds varies in different plant species. It also varies from tissue to tissue within the same plant species. For instance, Lata (2005) measured the average phenolic content in 53 different apple cultivars in two successive growing years 2003 and 2004. The average phenolic content for different cultivars was 777-1842 ug/g in year 2003 and 476-2349 ug/g in 2004. This shows some seasonal variation in phenolic content and more over there was also variation among the different cultivars for the content of the phenolic compounds. The amount of phenolics for cutivars ‘Prima’ and ‘Fiesta’ falls within the range for different cultivars, for ‘Prima’ being more than ‘Fiesta’. They also found flavonols and anthocyanins with some variation between the two years. The amount of these compounds in both ‘Prima’ and ‘Fiesta’ was in the range of different cultivars.
Chapter 1
8
‘Prima’ showed a bit higher amount than ‘Fiesta’ (Lata et al., 2005). This also shows that both ‘Prima’ and ‘Fiesta’ contain significant amounts of the important phenolic compounds. We used a segregating F1 population during our study derived from the cross of both these parents. Apple cultivars with increased levels of beneficial phenolic compounds could incline the consumer for more fruit consumption because of improved health values.
In another study by Lata (2007) phenolics for whole fruit was found to be
1.6-4.6 mg/g where ‘Fiesta’ contained 2.0 mg/g and ‘Prima’ 2.4 mg/g. They found that the total phenolics in peel were three times higher than in flesh by HPLC and folin-ciocalteu method (Lata, 2007). Van der Sluis et al. (2001) also found that flavonoids are not equally distributed throughout the apple. For instance, quercetin glycosides are almost exclusively found in peel and have very low concentration in flesh. Phloridzin was found both in peel and flesh. Mcghie et al. (2005) found on average 46% of the phenolic compounds of apple in the peel and determined that flavanols contents were higher in flesh than in peel. Like Van der Sluis et al. (2001), Mcghie et al. (2005) also observed that phloridzin was present in both peel and flesh as well as procyanidins. Chlorogenic acid was more in flesh (80-85%) whereas anthocyanins only were determined (100%) in peel (Mcghie et al., 2005).
1.7 Improvement of apple through advanced technologies In spite of its importance to agriculture and its pervasive role in human health, relatively little is known about apple fruit and its development, physiology, biochemistry, and metabolomics, including secondary metabolites. This lack of knowledge has contributed to perpetual difficulties in breeding, production, and storage of apple (Park et al., 2006).
General Introduction
9
There is a direct need for the fast development of apple varieties with increased health promoting compounds. There is a need to identify genes responsible for these health beneficial compounds. The developments in plant biotechnology offer a very promising solution for that, especially for direct improvement of existing varieties of vegetatively propagated crops like apple. Extensive research on genetic engineering of crop plants is in progress. Literature is also available regarding the genetic modification of apple (Puite and Schaart, 1996; James et al., 1989; Bolar et al., 2000; Faize et al., 2003; Faize et al., 2004; Belfanti et al., 2004; Malnoy et al., 2008). A good collection of apple expressed sequence tags (ESTs) is also available (Park et al., 2006). This can be further accelerated when the whole genome sequence for apple will become publically available in near future.
1.7.1 QTL mapping It has been known for nearly a century that the approximate genetic position of loci controlling the quantitative traits can be identified through association of markers with phenotypic variation in a structured population (Flint and Mott, 2001; Mackay, 2001). This association is the foundation for quantitative trait locus (QTL) mapping that attempt to identify number, phenotypic impact and interaction of the loci controlling a quantitative trait (Flint and Mott, 2001; Mackay, 2001; Asins, 2002). The diversity between individuals is partitioned into both environmental and genetic variation. Frequently genetic variation studied to date tends to be qualitative so that there are one or more distinct and non-overlapping phenotypic states. However, most phenotypic differences are quantitative such that there are numerous overlapping phenotypic states (Flint and Mott, 2001; Mackay, 2001). The availability of genetic linkage maps enable the detection, analysis and use of QTL contributing to quantitative traits of the genotype (Zini et al., 2005). The combination of molecular markers and trait data to explore individual genes concerned with quantitative traits has become an important tool for biologists to dissect the genetics of complex traits (Kearsey, 1998).
In crop plants, quantitative variation is a feature of many important traits, such as those related with yield, quality or disease resistance (Asins, 2002). Although most of the advancements in genetics over the last century have been concerned with structural variation in single ‘major genes’, much of the natural variation observed in our species and crops, domestic animals and other populations that are studied are due to minor genetic changes in many genes, called polygenes (Kearsey, 1998). Over the last 15 years, QTL mapping has become a popular method for understanding the genetic basis of continuous variation in a variety of
Chapter 1
10
complex traits. For example, the technique of QTL mapping is now an integral tool in medical genetics, livestock production, plant breeding and population genetics of model organisms (Slate, 2005). Plant breeding is a dynamic area of applied science. It relies on genetic variation and uses selection methods to improve plants for traits and characteristics that are of interest for the growers and the consumers (Asins, 2002). This allows the QTL mapping to unravel the genetic base of many important complex traits such as disease resistance (Calenge et al., 2004; Calenge and Durel, 2006; Khan et al., 2006), fruit quality (Liebhard et al., 2003; King et al., 2001; Davey et al., 2006) or tree morphology (Kenis and Keulemans, 2007).
1.7.2 Marker assisted selection Conventional apple breeding is a slow process and many of the traits nowadays can be selected by the use of molecular markers technology. In apple this technology is also more and more available because of the presence of molecular markers maps and the availability of markers linked with important traits such as resistance to diseases (Durel et al., 2009) and even to select indirectly for skin colour of apple fruit (Zhu et al., 2011). The knowledge of positions of markers on chromosomes can be used and could help to identify genes responsible for the production of health beneficial phenolic compounds. This can be done easily by extracting the DNA and developing molecular markers for marker assisted selection (MAS) as already practised for several biotic stress resistances (Kellerhals et al., 2000; Markussen et al., 1995; Khan et al., 2007; Moriya et al., 2009; Durel et al., 2009; Zhu et al., 2011; Bus et al., 2000). The molecular markers developed for localization of different phenolic compounds in the genome may be used to obtain the presence of genes responsible for synthesis of potential health beneficial compounds. This approach can also be used to assess the genetic diversity of crops (Schulman, 2007). Marker assisted selection is also employed for columnar type growth in apple (Moriya et al., 2009). Khan et al. (2007) found two markers (SCAR, SSR) linked to a fire blight resistance QTL, explaining nearly 50% of the phenotypic variation for this trait in apple. These markers were fixed to the resistant progenies and were stable across different backgrounds and thus are useful for marker assisted selection. In another study, Bus et al. (2000) performed marker assisted selection for pest and disease resistance in an apple breeding programme.
General Introduction
11
1.7.3 Genetic modification The most important advantage of genetic modification is the use of existing varieties of crops with a long term of safe use in the market. A major disadvantage of this approach is the lack of acceptance with transgenes. This is especially the case in fruit crops because of their consumption as fresh products. Two main developments have changed the world of genetic modification: 1. the possibility of marker free transformation or making GMO plant afterwards marker free by an additional step of active marker removal by site specific recombination using cre-lox system (Dale and Ow, 1991), FLP/FRT system (Lyznik et al., 1993), orR/Rs system (Schaart et al., 2004), and 2. the growing availability of useful cisgenes, coding for example for disease resistance, in addition to transgenes. Marker free transformation with cisgenes could be an acceptable solution for the consumer, as shown in the Eurobarometer (2010) at one hand and extent conventional breeding at the other hand after it is exempted from GMO regulation in Europe (2001/18/EC) and/or USA.
Marker free transformation of apple, at this moment, means the use of marker assisted transformation with kanamycin resistance (nptII) gene. This can be followed after selection of back bone free plants with the induced excision of the selection marker coding for nptII and other helper genes. This process is resulting in an apple plant with only the desired cisgene. Another possibility is the development of a cisgenic selection marker for example, based on the dominant MdMYB10 transcription factor, which was mutated in the variety ‘Red Field’. This mutated transcription factor is visibly accumulating anthocyanin in many tissues of apple.
There are more and more cloned cisgenes available coding for important traits such as disease resistance. In apple, for example, the Vf2 gene has been cloned, coding for resistance to apple scab. In the future more genes will be found in apple that are directly or indirectly influencing other traits coding, for example, for the synthesis of health promoting compounds and abiotic stress resistance. Through the knowledge of cloned key genes and their alleles involved, development of superior apple cultivars which provide desired health beneficial compounds is possible. These genes could be transferred into high quality apple cultivars with a long safe use by means of transgenesis and cisgenesis.
Chapter 1
12
Transgenesis is defined as ‘the genetic modification of a recipient plant with one or more genes from any non-plant organism, or from a donor plant that is sexually incompatible with the recipient plant’ (Schouten et al., 2006a). Cisgenesis is defined as ‘the marker free genetic modification of a recipient plant with natural gene(s) from the plant itself or from a sexually compatible plant’ (Schouten et al., 2006a, b). This is in contrast to transgenesis where transgenes, originating from non-crossable species or consisting of functional parts of different genes, are used. It has been clearly shown in the Eurobarometer (2010) that the application of cisgenes is much more acceptable for the European consumer than transgenes. There are strong discussions going on within the USA to exempt cisgenesis from the GMO regulations of that country (Waltz, 2011).
General Introduction
13
1.8 Outline of the thesis In this thesis, variability for synthesis of secondary metabolites in apple has been investigated as well as genetic factors involved. In Chapter 2, genetic linkage maps were constructed and extended with the inclusion of a great number of DArT (Diversity Array Technology) markers. An integrated map of 1286 cM length containing 820 molecular markers was obtained. Availability of a high density genetic linkage map is a prerequisite for mapping of many genetic traits. In Chapter 3, we studied the metabolic variation in wild germplasm and advanced selections of apple as well as the metabolic variation in a segregating F1 population in comparison with the crossing parents involved. It was found that many different metabolites could be found in wild species but to a lesser extent in advanced breeding selections and the described F1 population of apple. It was also found that certain metabolites could be lost during inbreeding while certain other metabolites could be gain. The genetic factors causing this loss and gain of metabolites are discussed in this chapter.
In Chapter 4, we investigated the genetic basis of the quantitative variation of the earlier described potentially health beneficial compounds. We mapped these secondary metabolites in the segregating F1 population from the cross between the cultivars ‘Prima’ and ‘Fiesta’. Mapping of genetic factors influencing synthesis of metabolites is the next step in developing apple cultivars with increased levels of specific health beneficial metabolites. Two approaches were adopted for mQTL (metabolite QTL) mapping, a wide non-targeted approach using MetaNetwork (Fu et al., 2007) and a targeted approach using MapQTL® (Van Ooijn, 2009). Untargeted metabolic profiling of peel and flesh tissues of ripe fruits was applied by liquid chromatography-mass spectrometry (LC-MS), resulting in the detection of 418 metabolites in the peel and 254 in the flesh. An mQTL hotspot was found on LG16. We located structural genes involved in the phenolic biosynthetic pathway, using the recently published whole apple genome sequence of cv. Golden Delicious (Velasco et al., 2010). The structural gene coding for leucoanthocyanidin reductase (MdLAR1) was found within the mQTL hotspot window on LG16, as were in addition seven transcription factor genes. Chapter 5 deals with the expression profile of the genes in the mQTL on LG16 and also all the structural genes of the phenylpropanoid pathway in apple. Structural gene (MdLAR1) showed differential expression. We believe that this MdLAR1 has caused the mQTL hotspot which is reported in chapter 4 above. The mQTLs located upstream in the pathway could be explained by the negative feedback mechanism. Chapter 6 deals with the finding of genes influencing acidity in apple fruits. Acidity is an important determinant for fruit quality. An optimum acidity together with optimum sugar content is required
Chapter 1
14
for consumers. We located MdALMT2, coding for a malic acid transporter, as candidate gene which causes changes in acidity and is ultimately influencing the pH in apple.
In Chapter 7 MdMYB10, a dominantly mutated transcription factor gene, involved in the up-regulation of anthocyanin in many tissues of apple, was inserted into apple cultivar ‘Gala’ and also in potato cv. Desiree and strawberry cv. Calypso by antibiotic marker free selection. It can be used as a cisgenic selectable reporter gene for cisgenic apple plant transformation. All the experimental chapters are combined and discussed in Chapter 8. The different steps from genotyping and phenotyping of a segregating F1 population, studying the metabolic diversity of the apple germplasm, mapping of the phenolic compounds, the expression profile of the candidate genes and all other phenylpropanoid pathway genes, finding candidate genes for pH determination in apple fruits, and transformation of the MdMYB10 gene are discussed in more detail in chapter 8.
Chapter 2
Diversity Arrays Technology (DArT) markers in
apple for genetic linkage maps
Henk J. Schouten1*, W. Eric van de Weg1*, Jason Carling2, Sabaz Ali Khan1, Steven J. McKay3, Martijn P.W. Van Kaauwen1, Alexander H. J. Wittenberg6, Herma J.J. Koehorst-van Putten1, Yolanda Noordijk1, Zhongshan Gao4, D. Jasper G. Rees7, Maria M. Van Dyk7, Damian Jaccoud2, Michael J. Considine5, and Andrzej Kilian2 1Wageningen University and Research Centre, P.O. Box 16, 6700 AA, Wageningen, The Netherlands. 2Diversity Arrays Technology, PO Box 7141, Yarralumla, ACT 2600, Australia. 3Department of Horticultural Science, University of Minnesota, Alderman Hall, 1970 Folwell Ave, St. Paul, MN 55108, USA. 4Department of Horticulture, Zhejiang University, Hangzhou 310029, China. 5School of Plant Biology, and the Institute of Agriculture, University of Western Australia, M084, Crawley, WA 6009, Australia and Department of Agriculture and Food Western Australia, South Perth, WA 6151, Australia. 6Present address: KeyGene bv, P.O. Box 216, 6700 AE Wageningen, The Netherlands. 7Department of Biotechnology, University of the Western Cape, Private Bag X17, Bellville 7535, South Africa. Corresponding author: [email protected] * These authors contributed equally to this work. Mol Breeding DOI 10.1007/s11032-011-9579-5
Chapter 2
16
Abstract Diversity Arrays Technology (DArT) provides a high-throughput whole genome genotyping platform for the detection and scoring of hundreds of polymorphic loci without any need for prior sequence information. The work presented here details the development and performance of a DArT genotyping array for apple. This is the first paper on DArT in horticultural trees. Genetic mapping of DArT markers in two mapping populations and their integration with other marker types showed that DArT is a powerful high-throughput method for obtaining accurate and reproducible marker data, despite the low cost per data point. This method appears to be suitable for aligning the genetic maps of different segregating populations. The standard complexity reduction method, based on the methylation-sensitive PstI restriction enzyme, resulted in a high frequency of markers, although there was 52 to 54% redundancy due to the repeated sampling of highly similar sequences. Sequencing the marker clones showed that they are significantly enriched for low copy, genic regions. The genome coverage using the standard method was 55 to 76%. For improved genome coverage, an alternative complexity reduction method was examined, that resulted in less redundancy and additional segregating markers. The DArT markers proved to be of high quality and were very suitable for genetic mapping at low cost for the apple, providing moderate genome coverage.
Keywords: apple, DArT, genetic mapping, molecular markers, diversity
Diversity Arrays Technology markers in apple
17
1 Introduction The genus Malus has been a focus of molecular studies since the mid 1980s, when Weeden and Lamb (1985) used isozymes as a means of discriminating between different apple cultivars. As new marker types have been developed, scientists have readily adopted them into their studies of apple genetics, progressing from RAPDs (Koller et al. 1993), through RFLPs and isozymes (Maliepaard et al. 1998), to AFLPs and SSRs (Guilford et al. 1997, Hokanson et al. 1998) and on to targeted markers (e.g., Broothaerts 2003; Calenge et al. 2005; Chagné et al. 2007) and SNP arrays (Micheletti et al. 2011). The progress in the molecular characterisation of the Malus genome has recently gained further momentum with whole-genome sequencing (Velasco et al. 2010).
Molecular markers have been applied widely to evolutionary and pedigree studies in apple, including both wild Malus species (Richards et al. 2009) and domestic cultivars (e.g., Cabe et al. 2005, Evans et al. 2010). Additionally, markers developed for the apple have been applied fairly widely to other pome species, and vice versa, notably pear (Pyrus spp., Yamamoto et al. 2001; Hemmat et al. 2003; Dondini et al. 2004), quince (Cydonia oblonga; Yamamoto et al. 2004) and loquat (Eriobotrya japonica; Gisbert et al. 2009; He et al. 2010). Simultaneously, linkage maps have been constructed for a number of domestic cultivars, and several map alignments have been reported (Maliepaard et al. 1998; N’Diaye et al. 2008; Patocchi et al. 2009; Van Dyk et al. 2010). The construction of linkage maps has facilitated the identification of molecular markers associated with numerous phenotypic traits. Among the traits examined to date are resistance to apple scab caused by the fungus Venturia inaequalis (Koller et al. 1994; Calenge et al. 2004; Bus et al. 2005a, b; Soriano et al. 2009), fire blight caused by the bacterium Erwinia amylovora (Peil et al. 2007), columnar growth habit (Moriya et al. 2009), several fruit quality traits (e.g., King et al. 2001; Liebhard et al. 2003a; Costa et al. 2005, 2008, 2010; Kenis et al. 2008) and chilling requirement (Van Dyk et al. 2010). The identification of such molecular markers is essential for marker-assisted selection in apple breeding programs (Gianfranceschi et al. 1996; Liebhard et al. 2003b; Gardiner et al. 2007; Zhu and Barrett 2008). In recent years, genomic methods have been embraced by apple researchers. The enhanced ability to study gene expression has resulted in new understandings of developmental processes (Ban et al. 2007; Espley et al. 2009). Transcription analyses of apple fruit development using cDNA microarrays (Soglio et al. 2009) and plant physiological responses to pathogens (Norelli et al. 2009) has facilitated the development of new molecular markers (e.g., Chagne et al. 2008; Igarashi et al. 2008). The further development of high-throughput genetic technologies will continue to expand the ability of scientists to
Chapter 2
18
investigate the details of the genetics of apple and its relatives (Shulaev et al. 2008). Since the proof-of-concept paper (Jaccoud et al. 2001), DArT has been developed as an inexpensive whole-genome profiling technique for many organisms, especially plants. The website www.diversityarrays.com has a current list of organisms for which arrays are available (>50). DArT, in its current implementation, is a hybridisation-based genome profiling technology that does not require sequence information and uses microarrays to identify and type DNA polymorphisms. As the DArT markers are typed in parallel, it is possible to identify hundreds or even thousands of polymorphic markers in a single experiment (Wittenberg et al. 2009). This highly parallel assay results in a reduction of the per data point price to around US$ 0.01 in organisms with well-developed arrays. The DArT assay primarily detects dominant markers, mostly resulting from single nucleotide polymorphisms and indels in restriction sites and differences in methylation of restriction sites. When methylation-sensitive restriction enzymes (like PstI; see Gruenbaum et al. 1981) were used in the large genomes of cereals (Wenzl et al. 2004, 2006; Akbari et al. 2006), DArT markers were located preferentially at the gene-rich, subtelomeric regions of the chromosomes. The use of methylation-sensitive enzymes may provide also an insight into epigenetic variation (Wenzl et al. 2004).
Interestingly, while DArT has performed well in over 50 crops, there are no reported applications of DArT in horticultural trees. As DArT has been applied successfully to complex amphidiploid genomes like wheat (Akbari et al. 2006), oat (Tinker et al. 2009) and sugarcane (Heller-Uszynska et al. 2010), application to the duplicated genomes of the pome fruits such as apple (Velasco et al. 2010), pear and loquat should have good perspectives too. Here, we present the development and validation of Diversity Arrays Technology (DArT) for apple using a complexity reduction method similar to the one used for the cereal genomes. We compare this with a second complexity reduction method that is similar to the method used for the fungus Mycosphaerella graminicola (Wittenberg et al. 2009), and we discuss the characteristics of the detected markers. We combined DArT markers with other marker types in genetic linkage maps, providing insight into the coverage of the DArT markers in the apple genome. We used as a starting point the progeny and genetic linkage map of ‘Prima’ x ‘Fiesta,’ which was the first genetic linkage map for apple covering all 17 chromosomes (Maliepaard 1998). In addition, we used a more recent progeny of other parents for genetic mapping. Furthermore, we evaluated the performance of DArT in a genetic diversity analysis of 44 diverse apple accessions and a set of Australian breeding lines.
Diversity Arrays Technology markers in apple
19
2. Materials and methods
2.1 Plant Material
For making of the DArT libraries, care was taken to represent a wide genetic diversity, including several major founders in apple breeding worldwide, founders of more local breeding programs, modern cultivars and some very recent selections from ongoing breeding programs. Forty-four accessions of Malus were used for the library development (Online Resource 1a).
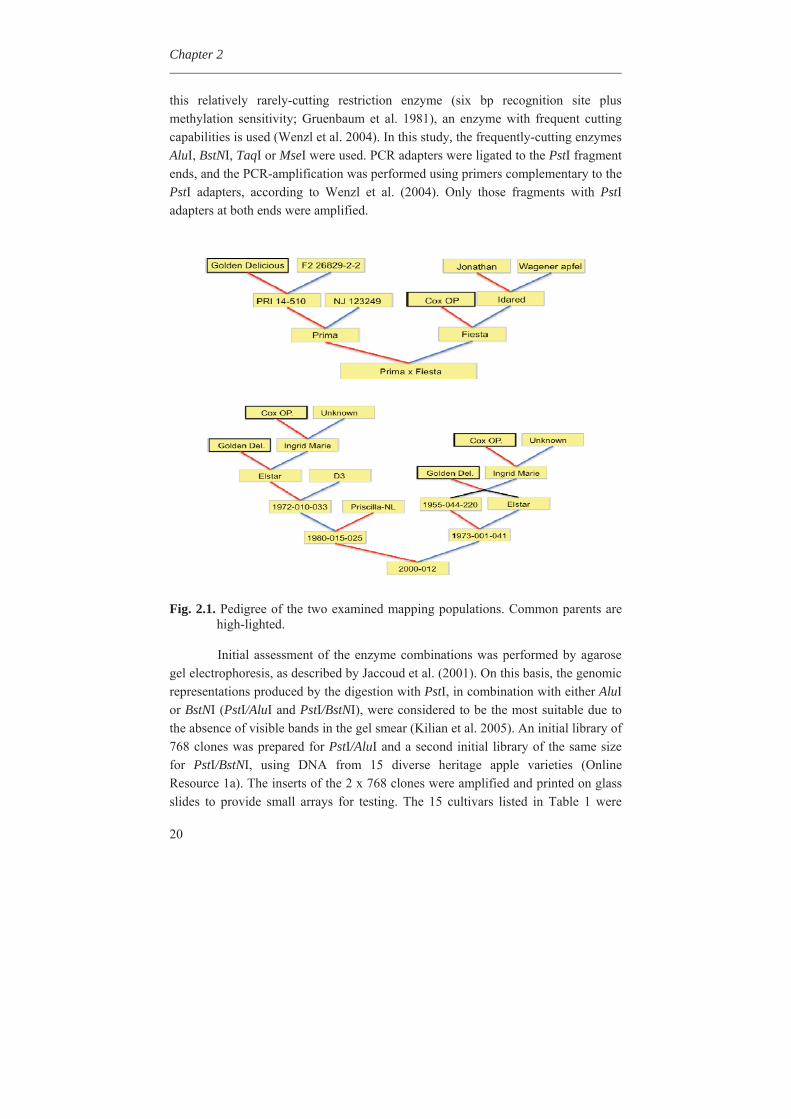
For mapping, two populations were used. The first, ‘Prima’ x ‘Fiesta,’ was used to examine the reliability of the DArT data by evaluating the ease by which the DArT markers were integrated in an existing, well-established linkage map. This population consists of 156 individuals (Maliepaard et al. 2008), of which a subset of 121 individuals were DArT genotyped. The second population, 2000-012 (Soriano et al. 2009), was used to demonstrate the ease by which DArT markers allow for the alignment between mapping populations. Further, this population was used to compare two DArT complexity reduction methods with respect to the number of markers and genome coverage. It comprises 894 individuals, 399 of which were used in the current study. The parentages of both populations are presented in Fig. 2.1.
2.2 DNA extraction For the development of the DArT libraries and genetic diversity studies, leaves were collected from grafted trees with a preference for younger, actively expanding leaf material. Genomic DNA was extracted using a modified cetyltrimethylammonium bromide (CTAB) / chloroform / isoamylalcohol protocol based on the method of Doyle and Doyle (1987). The addition of 2% W/V polyvinylpyrrolidone (PVP-40, Sigma, K value: 29-32) (Aljanabi et al. 1999; Kim et al. 1997) appeared to be essential for preventing the inhibition of restriction endonuclease digestion in many of the apple leaf samples tested. For the mapping populations, DNA was extracted according to Maliepaard et al. (1998) and Soriano et al. (2009).
2.3 Construction of DArT Arrays A crucial step in the Diversity Arrays Technology is the complexity reduction of genomic representations. In this manuscript, complexity reduction refers to the reproducible selection of a subset of DNA fragments from a whole genome. These fragments, after being cloned into E. coli vectors (TOPO) and amplified with M13 primers, were printed onto slides as probes for microarray hybridisations. The complexity reduction method used most often in DArT involves digestion with the methylation-sensitive restriction enzyme, PstI. In conjunction with digestion using
Chapter 2
20
this relatively rarely-cutting restriction enzyme (six bp recognition site plus methylation sensitivity; Gruenbaum et al. 1981), an enzyme with frequent cutting capabilities is used (Wenzl et al. 2004). In this study, the frequently-cutting enzymes AluI, BstNI, TaqI or MseI were used. PCR adapters were ligated to the PstI fragment ends, and the PCR-amplification was performed using primers complementary to the PstI adapters, according to Wenzl et al. (2004). Only those fragments with PstI adapters at both ends were amplified.
Fig. 2.1. Pedigree of the two examined mapping populations. Common parents are
high-lighted.
Initial assessment of the enzyme combinations was performed by agarose gel electrophoresis, as described by Jaccoud et al. (2001). On this basis, the genomic representations produced by the digestion with PstI, in combination with either AluI or BstNI (PstI/AluI and PstI/BstNI), were considered to be the most suitable due to the absence of visible bands in the gel smear (Kilian et al. 2005). An initial library of 768 clones was prepared for PstI/AluI and a second initial library of the same size for PstI/BstNI, using DNA from 15 diverse heritage apple varieties (Online Resource 1a). The inserts of the 2 x 768 clones were amplified and printed on glass slides to provide small arrays for testing. The 15 cultivars listed in Table 1 were
Diversity Arrays Technology markers in apple
21
hybridised in duplicate to the arrays, according to Wenzl et al. (2004). The PstI/AluI complexity reduction method was found to give a higher number of candidate polymorphic markers (16% of clones) as compared to the PstI/BstNI method (10% of clones). Therefore the PstI/AluI library was expanded by an additional 3,840 clones derived from the 15 heritage cultivars, and 9,984 clones from modern apple cultivars and breeding lines (Online Resource 1a). The total size of the expanded library for the PstI/AluI complexity reduction was 14,592 clones.
2.4 Hybridisation to the expanded array To gain insight into the applicability of DArT in mapping, two segregating populations were hybridised to the expanded array. All genotypes were hybridised with two to four replicate arrays per genotype, using both Cy-3 and Cy-5 fluorescent labelling. Hybridisation, subsequent processing and data analysis were performed according to Wenzl et al. (2004).
2.5 Integration of existing genetic markers into genetic linkage maps The genetic linkage map of ‘Prima’ x ‘Fiesta’ was the first for apple covering all 17 chromosomes (Maliepaard 1998). It consisted of 138 dominant markers (mainly RAPDs and some AFLPs) and 152 essentially co-dominant markers (mainly RFLP, some isozymes and SSRs). Since then, 313 new markers have been added through successive European projects, of which 180 are dominant (mainly AFLP) and 133 are co-dominant, mainly consisting of SSR markers from the gDNA based CH and Hi series (Liebhard et al. 2003b, Silfverberg-Dilworth et al. 2006) as gathered from EST sequences (Soglio 2009). Some of the new markers were specifically designed for fruit quality genes (Costa et al. 2005, 2008, 2010) and allergy genes (Gao et al. 2005a,b,c). The quality of the map was thoroughly validated and improved, using JoinMap (Van Ooijen and Voorrips 2008). This newly enriched, evaluated and extended map of ‘Prima’ x ‘Fiesta’, covers approximately 90% of the apple genome, and was used as a starting point for the mapping of DArT markers.
Chapter 2
22
2.6 An alternative method for complexity reduction We evaluated an alternative complexity reduction method that was applied by Wittenberg et al. (2005) to microbial genomes. This approach involved digestion with two six-base cutters, PstI and EcoRI. A standard adapter was ligated to the PstI ends of the restriction fragments and a long, asymmetric adapter with a 3’-amino (NH2) group on the short strand was ligated to the EcoRI ends. The amino group, combined with PCR suppression (Siebert et al. 1995; Broude et al. 2000), was used to prevent ampli cation of the EcoRI - EcoRI fragments. Only the PstI - PstI and PstI - EcoRI fragments were ampli ed. To further reduce the complexity of the genomic representations, a third endonuclease, the four basepair cutter MboI, was used. No adapters were ligated to the MboI sites. Consequently, the fragments cut by MboI were not ampli ed (Wittenberg et al. 2005).
For this alternative complexity reduction method, the DNA of the apple selection 1980-015-025, a parent of population 2000-012 (Fig. 2.1), was used to construct a library of 6144 fragments, which were printed onto slides (Wittenberg et al. 2005). Target DNA from this selection’s progeny, population 2000-012, was assayed with this array, using the same alternative complexity reduction method. The adapters ligated to the target DNA of this progeny differed from those of the parental fragments printed on the slides, in order to prevent hybridisation of adapters to one another (Wittenberg et al. 2005).
The alternative array was used for the genotyping of 244 progenies of population 2000-012, all of which had also been genotyped with the standard method too. The maternal map of the heterozygous parent 1980-015-025 was constructed using DArT markers from both complexity reduction methods. In addition, several SSR markers were used as references on the linkage map. They were generated according to Patocchi et al. (2008).
Diversity Arrays Technology markers in apple
23
3. Results
3.1 Mapping of DArT markers in ‘Prima’ x ‘Fiesta’
The ‘Prima’ x ‘Fiesta’ progeny were hybridised to the expanded DArT array for the standard complexity reduction method, which provided 776 polymorphic markers. The call rate for the parental genotypes was 99.2%. The call rate is the percentage of targets that could reliably be assigned a score of ‘0’ or ‘1’ for a given candidate marker. The average call rate for the entire ‘Prima’ x ‘Fiesta’ mapping population was 96.7%.
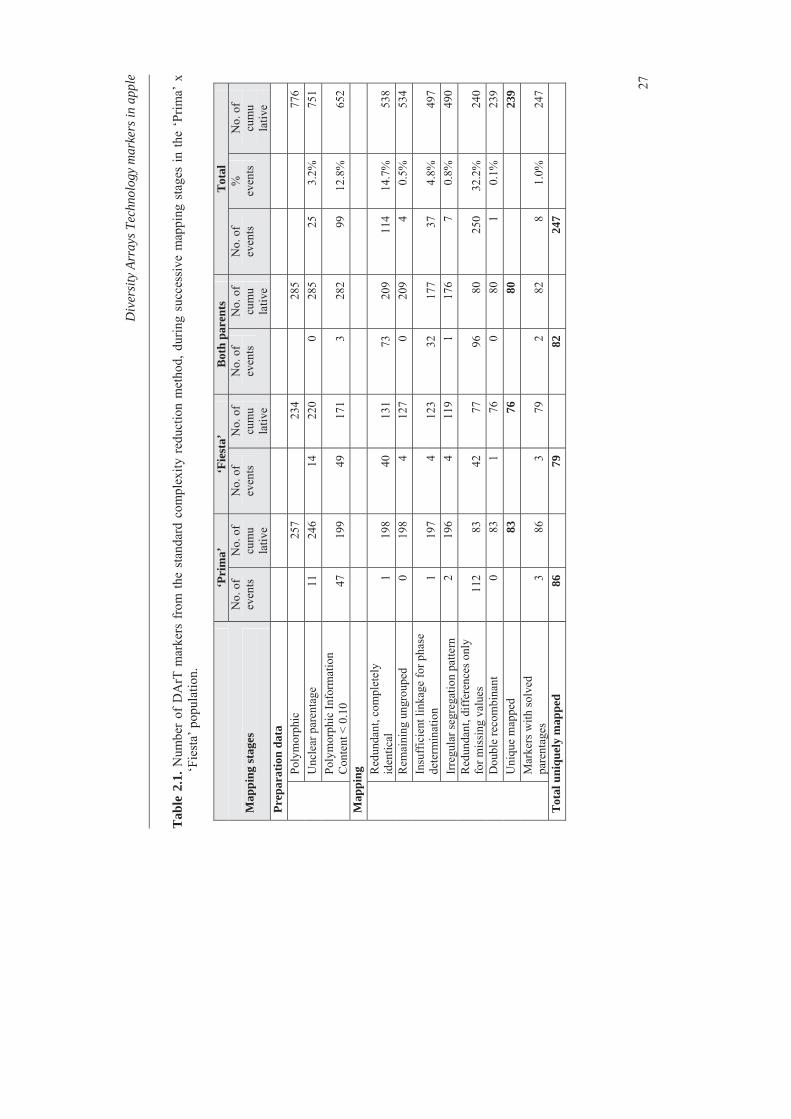
Of the aforementioned 776 ‘Prima’ x ‘Fiesta’ DArT markers, 247 (32%) were mapped to a unique position (Fig. 2.2). The other 68% were eliminated during the mapping process for several reasons (Table 2.1). Only 4.6% of the markers were discarded due to possible scoring problems. Of these, 3.5% were due to incomplete data on the mapping parents, leaving only 1.1% of the markers being possibly discarded for inadequate scoring, remaining ungrouped or showing irregular segregation patterns. The two latter phenomena could also be due to reasons other than scoring difficulties, such as a lack of marker coverage of the genomic regions or the presence of duplicated loci. Online Resource 1b documents that adding DArT markers did not affect the previous high overall map quality, as measured by the average 2 value.
A considerable number of clones exhibited identical segregation patterns in ‘Prima’ x ‘Fiesta’ compared to other clones, and therefore did not provide a higher genetic resolution in the map. As a result, a total of 364 (54%) of the 677 clones (=776-99; Table 2.1) were classified as redundant.
Chapter 2
24
E32M52-212+ 0CH03g12z+
OPAF-12-2000+ 2OPAD-12-0510+ 4
442943 - 5MH876+ - 11
E35M52-82+ 15OPAD-18-1130 - 17UBC249-2000 - 21
MC014a+ - 22OPC-08-1100+ 29
182573+OPAB-19-1430+
30
OPO-14-1700+ 31MC111+ 32
E35M52-133 -460697 - 33
OPAF-13-2100+OPA-11-2200+UBC213-2100+
E31M52-320+35
OPC-09-0900+ 36OPD-07-1600 -
pB610a -TPI-5 -
41
E35M47-310 -MC110-H+ - 42
OPD-20-0500+OPAG-05-1900+ 43
pB610a+MdExp7+ 44MC112+ - 45
OPA-15-0900+ 47OPAL-07-0580+ 52OPM-18-0900+
M18+ 53Vf+ 54
OPU-01-0400+ 57E35M51-305 - 58
PGM-1+ 60E33M52-253+ 61
OPAG-12-0800+ 66# 182512+ - 67
Conf-1-CAPS+ 68Ch05g08+ - 75
PF1
519579 + -0186603 +3186596 +4
CHvF1 +/-25186132 -28526906 -29182512 # + -35442410 + -518923 + -553494 + -460910 + -526944 + -
36
10J16 + -38441548 +4311E23_D1 + -46
012-1
183257+ 0443074+ 1
E34M48-171 - 3Mald4.02A+ - 6
ME-1 - 10OPAC-01-1470+
Mald4.02.01 - 11E34M59-265+ 13# 184117+ - 15
461303 -460938+
17
Mald4.02+ 18185353 -525950 -
19
E36M57-243+ 20UBC225-1500 -
518995+ - 21
MC003 - 24OPD-08-1000+ 25# 182991 - 27CN493139z+ -
MC003+ 28
442050+# 183073 -
442706+ -29
# 182463 - 30E35M51-98 - 31186257+ - 33553289+Hi03e04x+ -
38
E34M59-390+ 41Conf-2-CAPS+ - 46E31M52-280 - 47
MDMADS2 - 48CH04e05y+ - 52CH02a04y+ -CH03d10+ - 55
441647+ - 56460970+ -CH05e03+
57
E34M59-192+MC116b+ - 58
pAP79+ - 59MC096a+ -
# 183313+ - 60
# 183742+ 61519399+ -183703+
62
OPAG-05-1600+ 63184544+ - 66
OPAL-07-0780 - 67CH03d01 -
E33M52-71 -CH03d01+
68
MC029a+ - 69OPT-02-0900 - 71# 182415+ - 72
MC064b - 73
PF2
184966 + -0442431 -2
CH02f06 +/-6
RsaN2-14T + -10
186908 + -441940 +
32
525950 + -33186257 + -34186838 +183604 # +
35
186063 +36518937 + -37182463 # -42184600 + -45
185846 + -53
184305 # +631A21 +8L10 +CH05e03b +
66
CH03d10 +/-68183742 # +69
10I23 +74
CH03d01 +78
182415 # +85
186429 +94
012-2PRX-3 -PRX-2 - 0
CH03e03 -# 184119 - 3
OPD-05-2000 - 4OPT-06-0550 - 9
OPA-09-2000 - 13519280+ - 14
Conf-21-SCAR - 19
# 183577+ - 23CH03g07+ - 24
E35M51-154+ 26E35M50-215-5+ 27OPAC-06-1700+ 28
MC004a+ - 31
461798+ - 34# 184120+ - 36
UBC220-1250+ 43442761 - 45
OPE-19-1550+OPD-01-2600+ 50E36M59-152+ 53
MC228d+MH602-D+ - 56
525579+ 57186485 -554833 -
59
MC012b+ 60E34M55-272+ 63
442766+ 647BC7a - 68
E31M52-218 - 71442361+ 73
OPAB-12-1150+ 75E35M50-102-8+
E35M53-120+ 76OPF-05-1000+
442855+ 77
MS14h03+ - 78MC043 - 82
Conf-3-SSR+ 854H10 - 86
461092 -P126-1000+
87
CH03g12y - 89LY27c+ 90
PF3
183126 + -0184693 -1555018 -4CH03e03 -5183577 # -13460705 + -15553952 -16526067 + -461392 +185887 + -552850 + -441860 +
17
CH03g07 +/-18552845 + -19187001 + -28442219 + -29460847 + -336P19 + -40461800 +41186469 +441630 +443230 +
42
519400 +43442848 -45AU223657b +48525579 + -50183445 # -527D13 +186485 -
53
7O24 +56
AU223657a -70184471 + -461256 + -
73
185218 -76442825 -79526535 -80
461092 -86
012-3
443206 - 0NZ05g08 - 4
MC013+ - 6Conf-4-CAPS+
CH04e02+ - 11NZ05g08+ 12185348+ -
MC036a+OPE-18-0550+
15
E34M59-291+ 16MC069b+
E32M52-175 -E33M51-207+
17
526087+ 20CN491231-SSR+
MC034a+ 22MC023c+ 24
E35M52-292 - 30E34M59-167+
MC127a+ -E33M51-225+E33M52-169+
LY27b+CH02h11a+ -
31
OPT-18-1600+MC009+ -
MC019b+ -32
OPAC-03-0560 - 35Conf-5-+ 36
# 184104+ - 41MH134+
Conf-6-SSR+ 46
519662+ 47526018+ 48526572+ - 49461502 - 51
# 182559+ 52186532+ 54Mald3.02+ 57462170+ 60186208+ - 62
SOD-3+ 66MC105a - 68
553934+ - 71AT000420+ 77
CH01b12z - 91
PF4
186634 + -0518939 + -1
182651 -5
3O5 + -22461699 + -186787 + -
26
1M10 + -27184740 + -28CH02h11 -30460809 + -441674 + -525869 + -
32
461271 + -33186532 +36182559 # +38
012-4
pAP4a-X - 0
CN493139x+ - 7# 182773+ 10# 183668+ - 12
CO-2_C+ 13461684+ 24
MC028b - 26MC127c+ - 28
525645+CH03a09+ -
E36M51-143+E35M48-112+
32
184650+MC030b+
OPAB-14-0700 -33
461614+ -# 182654+ -
526705+ -34
MC123a+ 37MC025+ 39
E33M51-127+ 41AC12+ 43
461169+ 45461279+ 46461508+ 47
MC097b+MC227b+ 48
443333 -518988+
56
442627+ - 57E32M52-375+ 59
460995+ - 60MC095+ -
526764+ - 61
442210+ 62443367+ 63
MC109c -E34M59-251+ 65E34M55-85 -
OPAD-02-0400 -GD103 -
68
E35M50-206 -MC245+ -MC018+ -
69
OPS-10-1100_B+ 71OPAG-15-1250+ 73
E35M47-111+MC024b+
E33M52-177+E33M51-202+
MC204b+
75
OPAC-03-0510+ 76OPL-01-0900 -E35M47-158 -E36M51-243+E34M59-97 -
525837 -
77
E36M59-171 -CH02b12y+ -
LY29b -78
MC123b+ -185871+ - 79
CH04e03+ - 80E34M48-154 -E34M55-59 - 81
MC244a+ - 84MC202+ - 88
PF5
7N16 +6519616 +7553843 +183668 # +
8
11G4 +9182773 # +11185646 + -184384 # + -Hi04a08 + -
19
1.00E+17 + -2110N23 + -23460976 -2811A15 + -3010K2 + -31CH05e06 +/-5J19 + -33
CH04g09z -35186614 -37525645 + -38182520 # -419.00E+21 + -47
6B6 + -53183517 # -55
5M22 +59442210 -9I22 +
60
GD103 +/-70
7K9 +797H3 +5I22 +
80
CH02b12 +82186344 +85185935 + -526844 + -183675 # + -
86
6H16 + -888D18_D1 + -892N15 +91
012-5OPE-04-1400 - 0E36M59-315 - 3
185017 - 6OPD-10-2000 -E34M48-205 - 7
MC019a+ 10Mald1.05 - 11MC023a+ - 13MC034b+ - 14
186937+ - 15OPAF-13-1800+ 16
OPC-06-1300_B+MC096b+ - 17
E35M51-158+E35M51-110+ 18E35M51-252 - 21
NZ23g04+ - 25
CH03d12+ - 37MC040b - 39
554574 - 40461879+ -
7B9+42
442310+ - 44E34M55-84+ 48
OPAB-12-0680 - 49
CH05a05+ -MC204a+ - 63
MC011-+ - 66
PF6
CH03d07? +0
CH03d12 +15
461879 +19
CH02b10? +406P2 +4310H11 +44
3.00E+19 +69
CH05a05 +/-74
012-6MC056+ - 0
MC228b+ 22B12a -
MC029b -Sd1 -
OPT-14-0800+3
527002+MC064a+ -
442697+461103+
MC057a+# 182694+ -
4
526661 -184957 -
5
184765+ 6186359+
# 183619+7
186460+ 10OPAE-19-1600+ 11
# 182859+ 13MC116a+
E36M51-206+OPAB-13-2600+
15
OPC-08-1700 -E35M47-220 - 16
OPT-09-1200 -186378+ - 18
OPA-09-0700_BD+# 183153+ 21
E35M48-131+ 22E34M48-252+
E35M47-275-2+CH04e05z+ -
23
441985+OPAM-19-0800+
443137+ -24
MC014b+ - 25186703+ - 27182820 - 31
OPA-10-1000 - 33MS06c09+ - 35460767 - 39553337+ -461607+ -185711+ -
41
553964 - 45525517+ -186911+ -
46
E33M51-64 -E34M59-83 -Conf-8-SSR -
526070+ -
47
PGM-2 - 53
PF7
183165 # +011D9 + -311B5 + -4527002 + -186990 + -
6
Hi03a10p +/-22
186378 -302D12 +441985 + -
35
183153 # +36442371 + -460884 + -
37
443137 + -38186703 + -396N4 + -40184379 # +43182820 +4412H8 +10O2 +CH04e05 +/-
47
184661 +443057 +
54
6I7 + -6010C5 + -62184289 # + -184686 + -184313 # -
66
185711 -72518887 +75553337 +553964 -
76
012-7
518983+ - 0LY21+ - 1
OPAB-14-0600+ 2# 182536 - 3
519609 - 4443379 - 11186096 -461686+186784+
12
E33M51-68+ 13AAT-2+
OPT-06-0800+ 18CH01e12+ 21
E34M48-323+ 24MC206+ -
Mald4.03 -LY16 -
185289 -E31M52-230+
26
E31M52-465 - 27MC022+ - 28
OPAF-12-1600+OPD-15-1300+
LAP-2_C+E33M51-280+
CH01f09+ -
29
Mald4.03+# 182916+ - 30
E35M52-124+E34M59-213+ 32E35M48-326+ 34
CH05a02y - 37MC027+ - 38
441714 - 39OPAF-13-0800 - 43
461663+ 44CH01h10+ 45
E35M48-330 - 46E31M52-198 - 48E36M57-142+ 52
186111+OPAC-11-0780+
55
OPT-19-2200 - 58MC104a - 59
E35M50-226 - 60525634 - 68
PF8
182536 # +0
6I3 + -5
461789 +11
186784 +461737 +
15
518577 + -20
CH01c06 +/-349O24 + -5M2 + -
37
5B10 + -39184826 +185283 +
41
526028 +442481 +183036 # +
42
185289 +43CH02g09 +/-459M2 +492G7 + -50441714 + -51
CH01h10 +63
441618 +76526690 +77
012-8
Diversity Arrays Technology markers in apple
25
Conf-12-CAPS - 0
E36M51-198 - 5# 184321+ - 6
442368 - 7# 184050+ - 8
554103+ - 10441965+ 16
OPAC-06-0590 - 21519109+ -
OPAB-14-0800 -23
460707 - 24OPAB-08-0940+ 26
MC104b+ 29MC007+ 31
CH05c07+ -186510 - 34
184700+ 36185101 -
# 182598 -38
E34M55-181+ 39# 184328+ 43
CX023634-SSR - 47Conf-9-SSR+ 52
OPAE-01-1190 - 54E34M48-83 - 55
E35M50-284 -E36M51-480 -E36M57-114+
56
Mald4.01 - 57OPAE-01-1210+
Conf-10-STS+Conf-13-SSR -
58
Conf-11-SSR+OPAE-08-1000+ 59
E33M52-96+E32M52-242+
OPD-01-0600+E35M50-281-2+
61
MC224a+CH01h02+ - 64MC038a+ 65
462205+ -MC117+
66
Mald2.01B+ - 68Mald2.01A+ - 70185333+ 71
MC115b+ 76
PF9
442368 +0184050 # +2
9D20 +6554103 + -8
526197 +13519109 +14CH01f03 +/-19442542 +21441884 +22553238 +460707 -
23
184328 # +35
182598 # -38
443058 +42
CH01h02 +/-49
CN444542a +55
185333 +60
012-9
MC244b - 0
pADH32a - 7MC228a - 9
519383+ 17OPAF-07-0890+ 18
186012+ 19OPE-12-1600+ 20
461634 -MC024a -
22
MC049+ -CH02b07+ -
E36M51-195+23
OPAG-04-1000+ 24460957+ 25
OPAD-14-1020 - 26Conf-15 - 27
LY29a+ - 28461747+ - 30442891+ 31
E35M50-239 - 35E34M59-410 -
EST-1 -E34M59-314+
MC109a -36
E33M51-169 -Hi03e04y -
OPAB-13-2200 -OPAE-19-0250 -
37
518575 - 38186714 - 39462175 - 41
# 183247+ -CH02c11+ -
44
MC227a+ - 53CH03d11+ - 57
E35M52-224+MC030a+MC025b+
62
443095+ 64E35M48-159+
OPA-09-0200+ 68
# 183529 - 72MC127d -MC028a+ - 76
OPA-11-1050 -MC060+ -
USASSR11+ -77
CH02b03b+ - 80MS02A01+ - 85
# 183090+OPC-08-0790 -
91
MS06g03+ - 96186434 - 97
pAP4b - 98
PF10
183555 # +0
552809 + -6184025 # + -7460957 -9554953 -11
553408 + -17
1H17 + -21
442891 + -37186714 + -38
462175 -44442053 -45461749 + -46183714 # + -49CH02c11 +/-51442552 -183247 # -
53
CH03d11 +/-58186426 -59184838 -60
CH04g09y -71
9M8 + -90
1L20-! + -97182835 # +183090 # +
103
5H14 +184374 # -
105
6G15 +1062I8 +107MS06g03 +/-1088C7 +11212L9 +8F3 +
113
012-10
185131 - -4184618 - -1
Conf-16-SSR+ 0CH04h02z+ -CH04h02y+ -
Conf-17--SSR -2
E35M53-150+ 5E34M59-139+ 6
OPA-09-0600+MC004 - 12
461385 - 13E35M53-187 - 15E34M55-410+
OPAD-02-0500 -# 183677+
17
MC045+ 18CH02d12+ - 21MC036b - 26
CH04a12+ - 31E35M51-301+ 33
MC051+ 35UBC203-0400+ 39
E33M52-115 -E33M51-133+
460857+41
185136 - 47525720+ 48461081 - 49186843+ 50
UBC213-1200 - 51E34M55-292 -E33M52-322 - 52E31M52-114 - 54
441813 - 55MH116+ - 57
OPAE-19-1800 - 60E34M55-91+184555+ 61
518989+7BC7b -
62
526057 -525861 -
63
526003 - 64441669 -525825 -
66
OPAC-11-0600 - 67# 183719+ - 71E34M48-190 -
185124 - 73
443193 - 75442863 - 76
PF11
CH04a12 +/-0
CH02d08 +/-14
6P21 +28
518573 + -42
461081 -51184554 + -53
10D23 +59
CH04g07 +63
CH03d02 +83
186331 + -89
442695 -95
526557 -99518909 -100
555037 -105
CH04d10 +/-110
185320 + -115CH04h02e +/-116443030 -117185357 -118
9B21 + -124
012-11
186490+ - 0MC016+ - 1
518917+ - 4MC032b+ -
443179+ - 6
MC225+ -443372+ - 7
OPA-06-1200+ 8443303 - 11
MC125a+ - 13E34M55-202 -
CN493139+OPC-08-0700 -
CH04g04+ -15
443032+E31M52-290 -
16
442826+NZ28F4+ -
17
OPAB-12-2100 - 19MC070+ - 20
E35M48-196+ 22184451+ 23
MC127b+ 30OPA-10-1100_B+ 38
E35M50-113 - 43CH01f02+ - 46
443308+ 49OPAM-19-1020+ 53OPAD-12-0800 - 54
443077+ - 56185669+ - 62
E34M48-175 - 64# 183720+
Hi07f01+ -65
460973+ 66OPA-01-0700+ 67# 183485+ -
MC105b+ -69
461822+ - 70185621+ - 71525670+ 75
PF12
186490 -0
CH05d04 +/-5
10M16 + -13
Ch04g04 +/-19
461499 +3310J9 +10B21 +
34
CH01g12 +/-40
3L18 + -45CH04d02 + -3N14 +49
9H3 +50525882 + -6H17 +
51
519342 + -59183985 # -183186 # +
60
183701 + -61
183986 # +72183720 # +73Hi07f01 +/-75
184963 + -81183485 # +82461822 +525797 +
86
184694 + -185896 + -
87
012-12
# 182625+ 0CH05h05+
E33M51-355+ 2
184627+ 4
553807+ 12E34M48-286+ 14E34M59-255+
LY05-Hi+MC001a+
16
E36M57-117+ 17MC039+ -MC130+ -GD147+ -
21
441485+ - 27
DIA_5+ 34NH009b+ - 35
OPAC-15-2050+OPAC-15-2000+ 36
Mald1.01+ 43MH128 - 44
Hi03e04z+ - 46E35M47-240-3+ 47
185125 - 49
MC221b - 56MC041a+
E34M55-380+ 60OPAC-11-0460 - 62
CH03h03+ - 63CH03a08+ - 65CH05f04+ -Hi04g05+ 67
CH01b12y+ -OPT-06-1200 - 68
E35M51-75+ 69
PF13
441502 + -0
184627 -10554693 -11
CH05h05z + -15
461022 +24
182529 # +27
CH02g01 +31
NH009b +46
5P13 +56
183891 # +63441485 -6O5 +
66
CH05f04 +81
012-13
441808 -442037 -
MC023b -0
E31M52-410 - 1MC225b -
461548+E36M51-360 -
2
MC032a - 3MC125b - 8
E32M52-85 - 9518676+ 15184790+ 16
OPD-01-1200+E34M48-181+ 21
CH01e01+ -PGD-1 - 24
E34M59-239 -519152 -
E34M48-182 -E35M53-177 -E35M53-314 -
461773 -# 182874 -
CH01g05+ -
25
OPAD-18-0680 - 26E36M57-253 - 30# 183655+ - 31
MS01a05 - 35442170 - 36185549 - 37
OPJ-06-1300 - 41CH05d03+ - 44
E33M51-300 - 47OPT-02-0400 - 48
184742 -# 184110 -
51
553959 -552945 -553118 -
E35M50-69 -
52
185879 - 53CH03g06+ -
7B9a+ 54E33M52-193+ 55
E35M47-149-8+E35M47-151-7+ 59
PF14
441808 + -0442037 + -1
1M11 +16
185082 +22
7P5 +26
441509 + -31554678 + -32185319 +33
443195 +62
526150 +73
552945 -87
012-14
E35M51-286 - 0
Hi03g06 - 11
# 182590 -443085+
18
LY37a+ - 19AAT-4 - 22
NZ02b01+ - 23LY26+ - 24
CH05a02+ - 25# 182459+
184477+ -27
E32M52-165+ 31526179 -184899 -
34
E31M52-110+ 37pB610b+ 38
CH01d08+ - 42184544+ - 43
Conf-24-seq+ 52554081+ 56
E35M51-230+ 61E31M52-214+ 62
462056 -525795 -
66
E32M52-114+ 70MdACS1+ - 71
OPAC-08-0630+CH02d11+ - 73
442008+ -185550+ -185550+ -
74
OPA-16-1800+441762+ - 75
442482+ -CH03b10+ -
76
E35M51-245+ 82E31M52-164+ 84
441511+ -526908+ -
85
526299+ - 86# 182445 - 90
Conf-19--SSR+ 92CH02c09+ 95
# 183710+ 99E36M51-101+
460791+ -441510+461923+ -
100
460798+ - 101461175 - 108553104 - 109
PF15
461263 + -0
NZ02b01 +/-65B20 +1O3 +
7
184280 # +9184477 + -10
184574 + -31
CH01d08 + -34183149 # + -36
184899 + -39519690 + -41184708 + -42526669 + -45
462056 + -62
526576 + -71
526173 + -78552762 + -81182599 # + -82526885 + -84
461423 + -88
182445 # -97526167 +99
11B12 + -103Hi23g12 -106183710 # + -1079D2 +108
012-15CH02a03+ - 0442923+ -441883+ -
2
Ma+ - 3CH05e04+ - 12MC001b+ 13
MC044+ -LY05b - 18
MC050+ -MC242+ - 21
E34M48-198+ 25MC078+ - 26
Hi04e04+ - 28526724+ - 29442132+ - 30Mald1.09+CH05a04+ - 36Mald1.02+ 37Mald1.06+CH05a04+Mald1.03+
38
185214+ 39E35M51-67+ 41462075+ 43462051+ 44
MC191+OPJ-01-0950+
MC221a+45
OPAF-13-0900+OPAF-07-0640+
MC041b+46
CH03a08y+P137-1250 -
pAP260b+# 184079+
47
E32M52-113+E32M52-330+
CH04f10+ -# 183165 -
MC057b+E35M47-156-6+
441862+4G11 -
50
HB03AT+ -E36M59-177+
LY27a+ -51
# 183930 -OPAG-15-0680+
52
# 183421 - 63
PF16CH05h05y +0461640 + -1Ch02a03 +28K19 + -7A6 +
5
443159 +6461310 +525633 +185494 +184045 # +442923 + -442679 + -441883 + -185094 +
7
186214 +183169 # +
8
3D6 + -16Hi04e04 +/-30
CH05a04 +/-54442727 + -184122 # + -
56
552929 + -65184362 +66553235 + -69442544 + -441862 + -
71
HB03AT -72Hi02c07p + -184722 + -73
12P22 + -764J15 + -78
CH04f10 +/-93
012-16
Chapter 2
26
CH04c06y+ - 0E33M52-333 -
CH04c10+ - 1
442865+ 2FDH-1 - 5
461519 - 6553948 -443198+ -
8
519569 - 9184490+ - 10
E35M48-245 - 114F11 - 13
# 182634+ 16CH01h01+ - 21
MDMADS_1+ 24MC098+ 26
461612+E35M52-305+
32
MC228c - 33
GE212858-SSR+ 48MC121+ - 49
MC012a -460877+ 52
E36M51-133+ 53E33M51-265 - 59E31M52-238+ 64
441670 - 69E35M51-385+
MC224b+ - 70
185405 -MC052b+
72
S+ -E35M47-137-9+ 73
E35M52-117+E35M48-105+ 74Conf-23-seq+
OPAD-12-0580 - 75AAT+ - 76
CH05d08 - 77MC115a+ - 80
# 183185+ 82
PF17
184490 +0461367 + -4184664 + -182816 # + -461023 + -526235 + -
5
184746 + -186513 -
6
553948 -7525628 + -8183635 # + -184756 + -186441 + -183853 # + -
9
182634 # + -526188 -
12
CH01h01 +/-18525524 + -184808 + -
21
460877 +37
8C17 +44
183534 # +605N4 +62461202 +461443 +
63
182778 # +6510L5 +66525667 +68
012-17
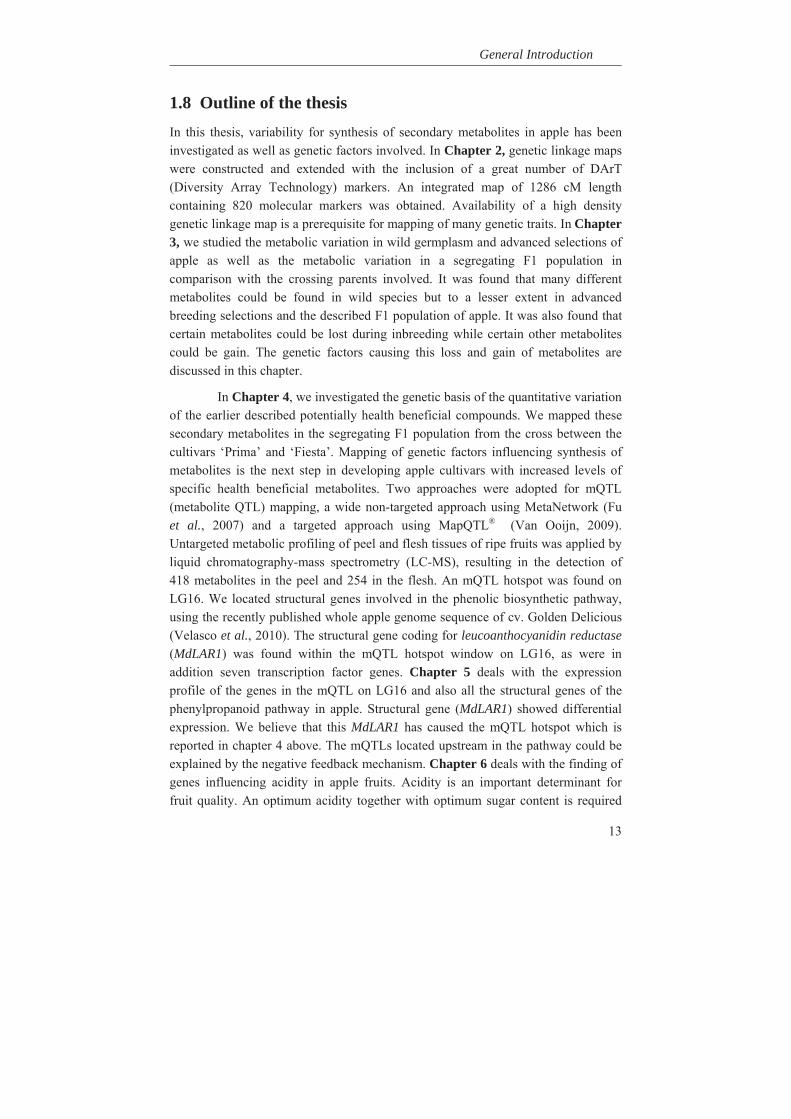
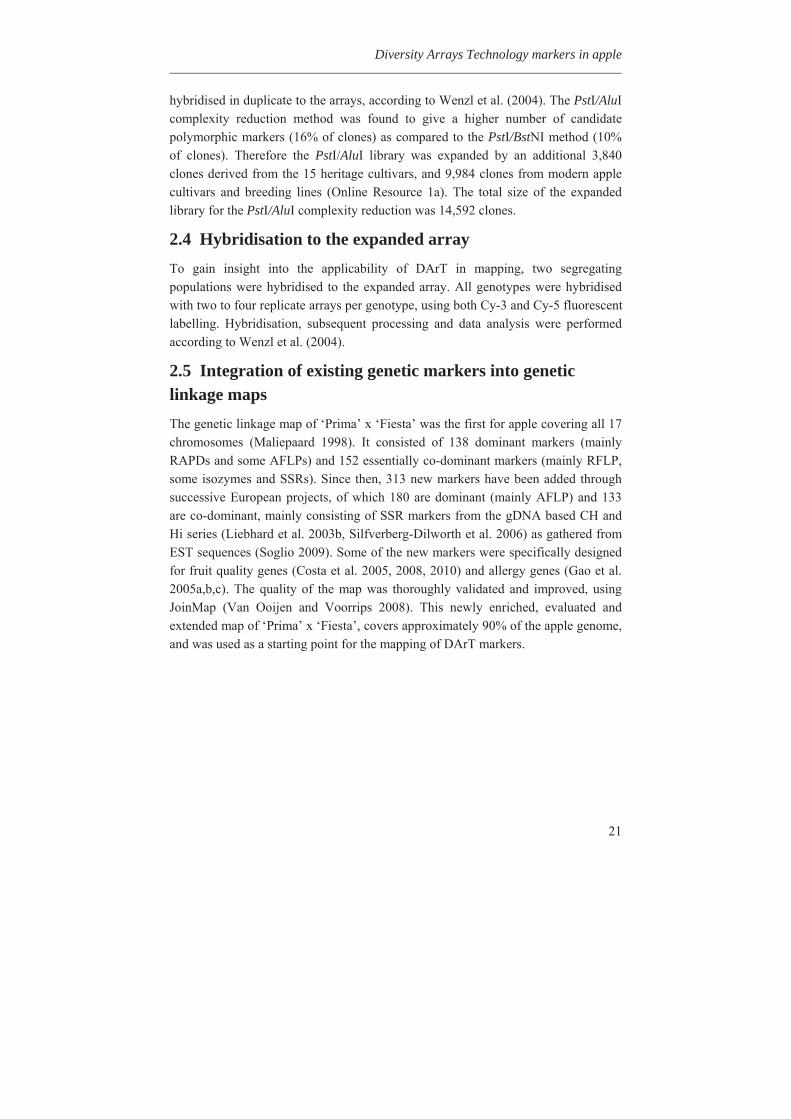
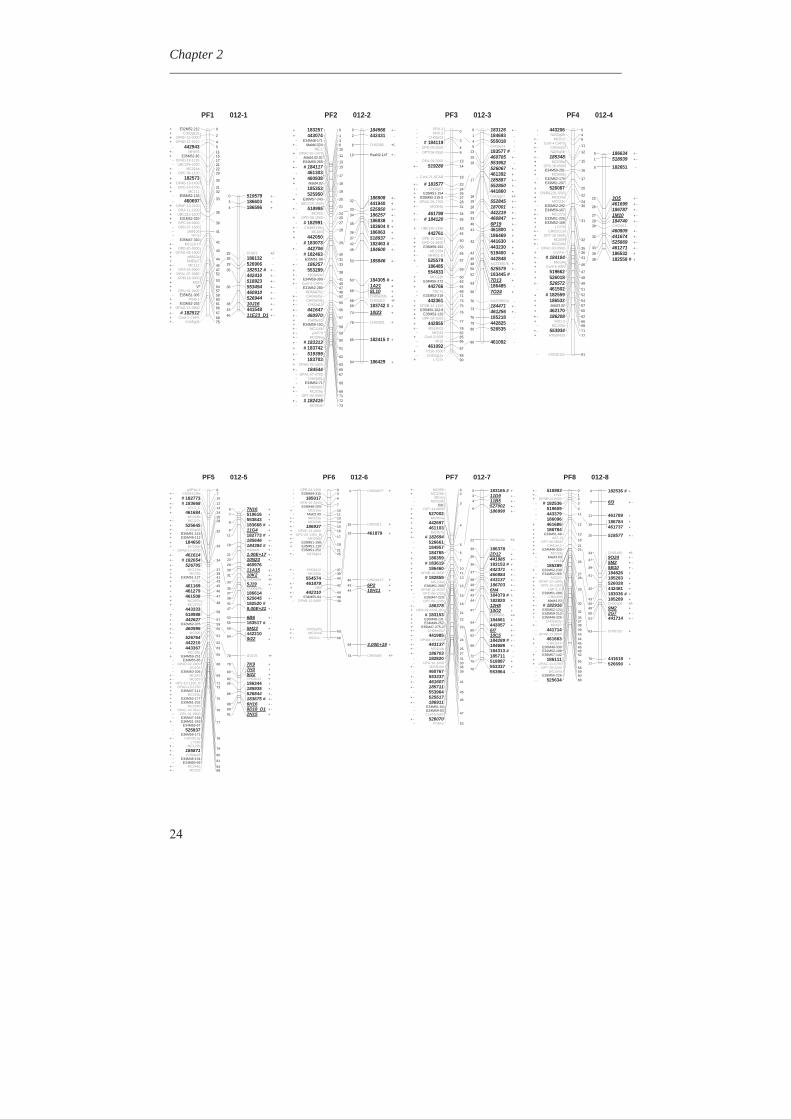
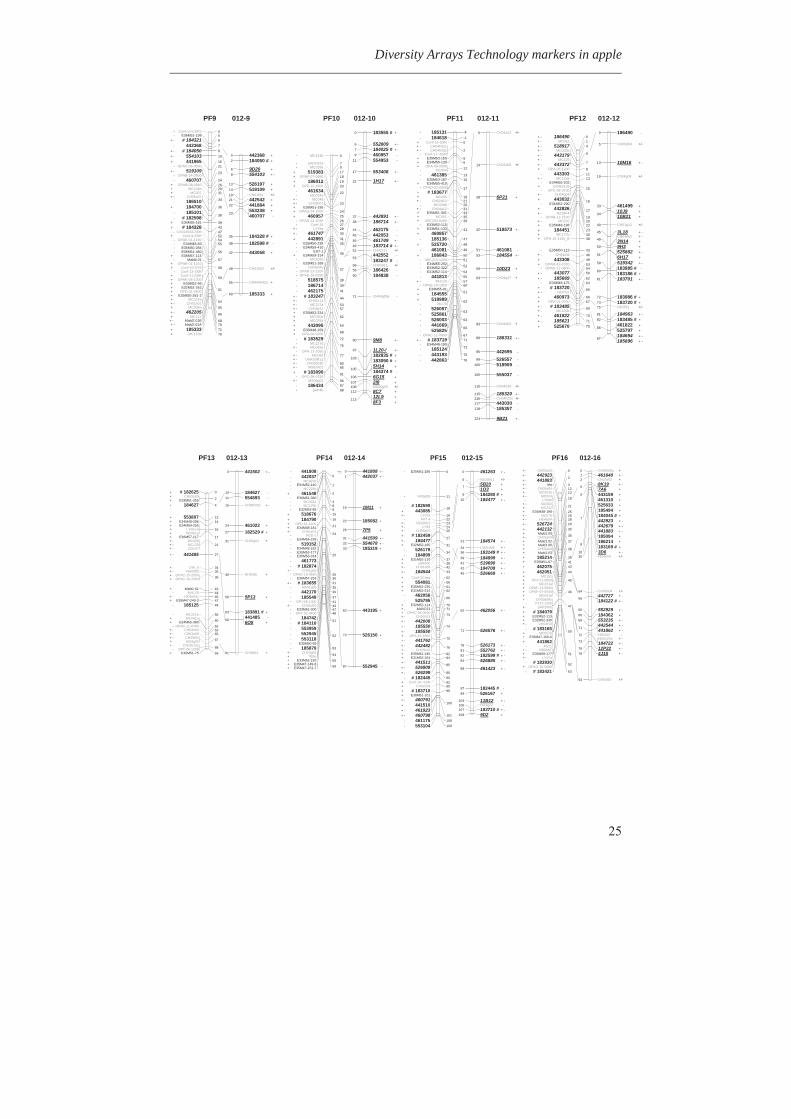
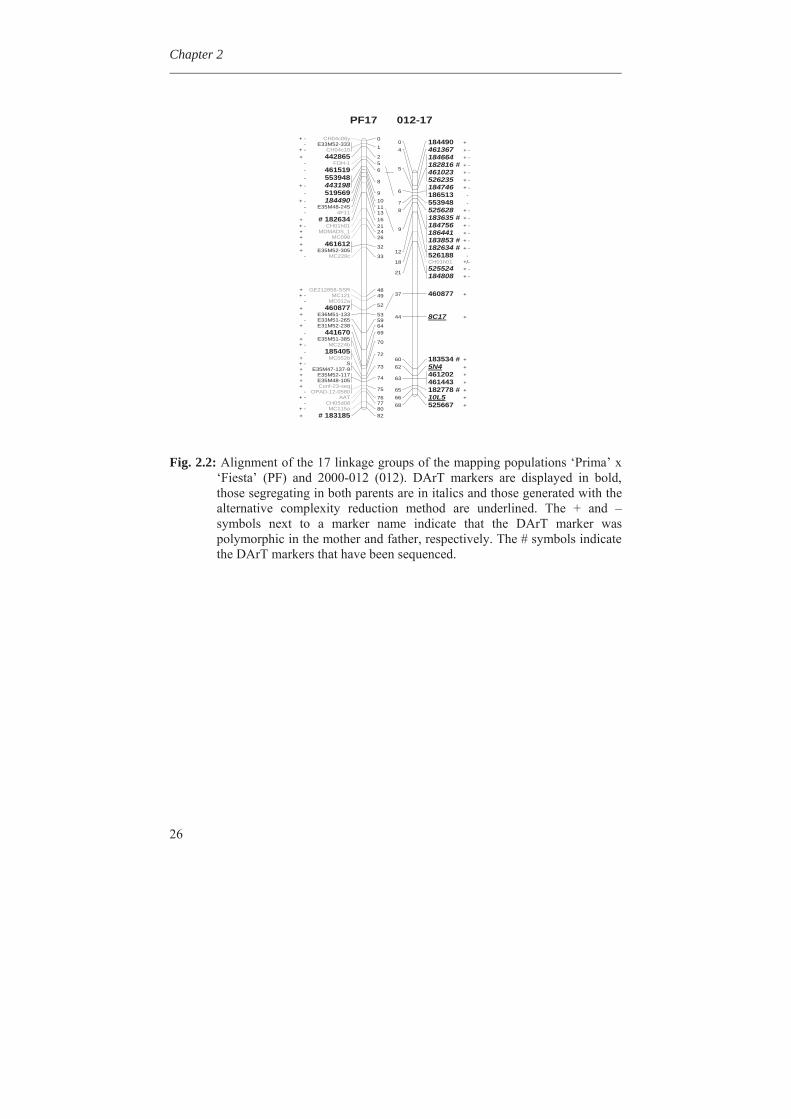
Fig. 2.2: Alignment of the 17 linkage groups of the mapping populations ‘Prima’ x
‘Fiesta’ (PF) and 2000-012 (012). DArT markers are displayed in bold, those segregating in both parents are in italics and those generated with the alternative complexity reduction method are underlined. The + and – symbols next to a marker name indicate that the DArT marker was polymorphic in the mother and father, respectively. The # symbols indicate the DArT markers that have been sequenced.
Div
ersi
ty A
rray
s Tec
hnol
ogy
mar
kers
in a
pple
27
Tab
le 2
.1. N
umbe
r of
DA
rT m
arke
rs f
rom
the
stan
dard
com
plex
ity r
educ
tion
met
hod,
dur
ing
succ
essi
ve m
appi
ng s
tage
s in
the
‘Prim
a’ x
‘F
iest
a’ p
opul
atio
n.
‘P
rim
a’
‘Fie
sta’
B
oth
pare
nts
Tot
al
Map
ping
stag
es
No.
of
even
ts
No.
of
cum
u la
tive
No.
of
even
ts
No.
of
cum
u la
tive
No.
of
even
ts
No.
of
cum
u la
tive
No.
of
even
ts
%
even
ts
No.
of
cum
u la
tive
Prep
arat
ion
data
Po
lym
orph
ic
25
7
234
28
5
77
6
Unc
lear
par
enta
ge
11
246
14
220
0 28
5 25
3.
2%
751
Po
lym
orph
ic In
form
atio
n C
onte
nt <
0.1
0 47
19
9 49
17
1 3
282
99
12.8
%
652
Map
ping
R
edun
dant
, com
plet
ely
iden
tical
1
198
40
131
73
209
114
14.7
%
538
R
emai
ning
ung
roup
ed
0 19
8 4
127
0 20
9 4
0.5%
53
4
In
suff
icie
nt li
nkag
e fo
r pha
se
dete
rmin
atio
n 1
197
4 12
3 32
17
7 37
4.
8%
497
Ir
regu
lar s
egre
gatio
n pa
ttern
2
196
4 11
9 1
176
7 0.
8%
490
R
edun
dant
, diff
eren
ces o
nly
for m
issi
ng v
alue
s 11
2 83
42
77
96
80
25
0 32
.2%
24
0
Dou
ble
reco
mbi
nant
0
83
1 76
0
80
1 0.
1%
239
U
niqu
e m
appe
d
83
76
80
239
M
arke
rs w
ith so
lved
pa
rent
ages
3
86
3 79
2
82
8 1.
0%
247
Tot
al u
niqu
ely
map
ped
86
79
82
247
Chapter 2
28
3.2 Genome coverage The current DArT array provided moderate genome coverage. Fig. 2.2 illustrates this. Many markers clustered, producing several short genomic segments containing multiple markers, such as a segment of 4 cM at the top of LG7 that contained eight unique ‘Prima’-specific DArT markers and one marker for both parental cultivars. However, several extended regions had no or very few markers, such as the entire LG1 of ‘Prima,’ which contained only one ‘Prima’-specific and one common marker. Genome coverage was estimated using the integrated map of Fig. 2.2 as a reference and the following thresholds: i) only parent-specific markers were considered, as markers common to both parents carry little genetic information, and ii) a single marker covers 10 cM surrounding its position. In these calculations, the current DArT array offered sufficient coverage for performing classical QTL mapping studies on around 55% of the ‘Prima’ and 60% of the ’Fiesta’ genome. If a single marker was to sufficiently cover a larger window of 30 cM, then the genome coverage for ‘Prima’ and ‘Fiesta’ would be 76% and 74%, respectively.
3.3 Suitability of DArT markers for map alignment
To examine the power of DArT markers for aligning maps, the second mapping population, 2000-012, was hybridised to the same DArT array used for ‘Prima’ x ‘Fiesta’. Additionally, several previously mapped SSR markers were included to confirm the DArT marker alignment. A similar number of polymorphic DArT markers was obtained (774 in 2000-012 versus 776 in ‘Prima’ x ‘Fiesta’), in addition to a similar call rate (97.3%) and a similar redundancy level, leading to a comparable number of unique single locus markers (260 versus 247).
The two mapping populations were shown to have 70 common polymorphic DArT markers that consistently aligned homologous linkage groups with regard to their identity and orientation for all 17 linkage groups of apple (Fig. 2.3). Several cases of minor differences in marker order were observed, depicted as the crossing lines in Fig. 2.2. The overall consistency in the identity and orientation of the linkage groups and the marker order show that the DArT markers support the alignment of the mapping populations.
Diversity Arrays Technology markers in apple
29
3.4 DNA sequencing of DArT markers and redundancy estimation
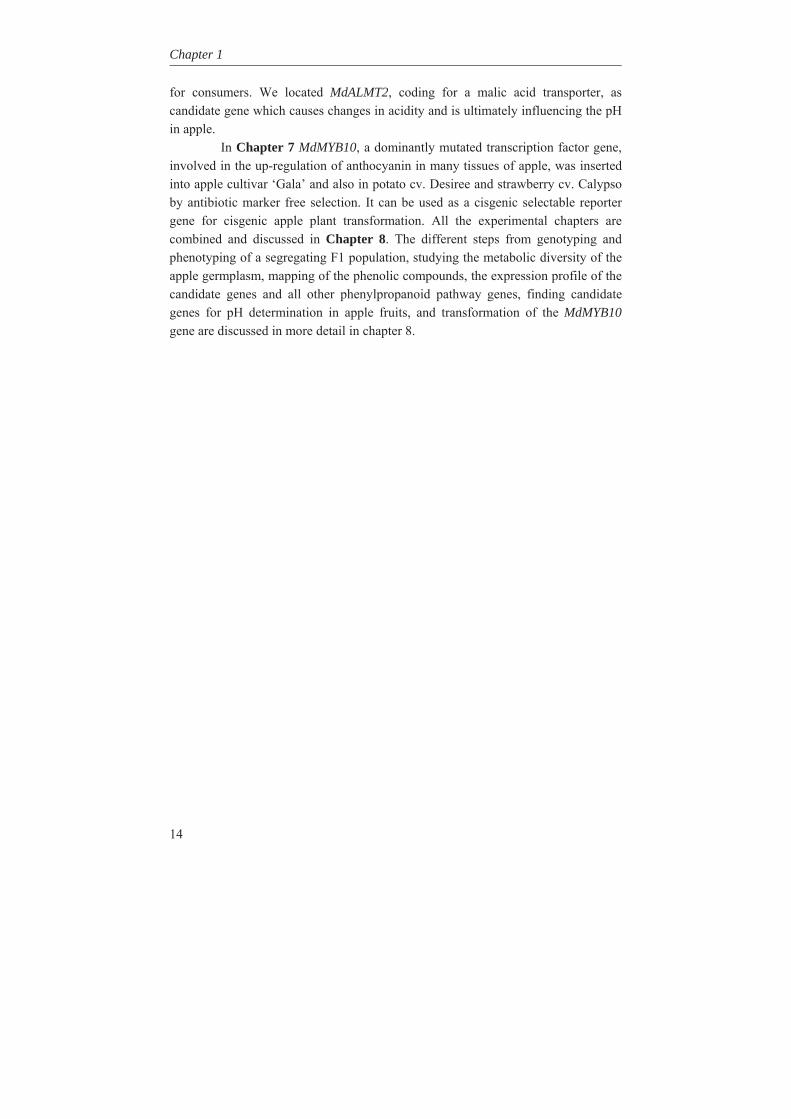
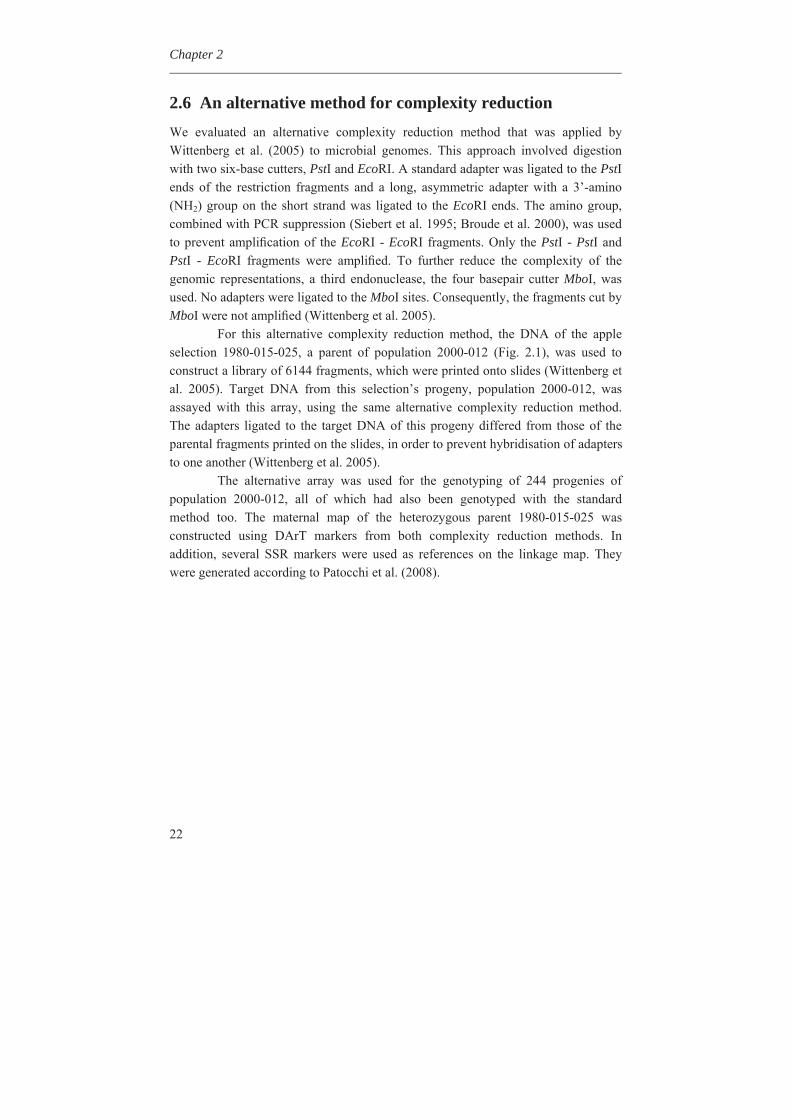
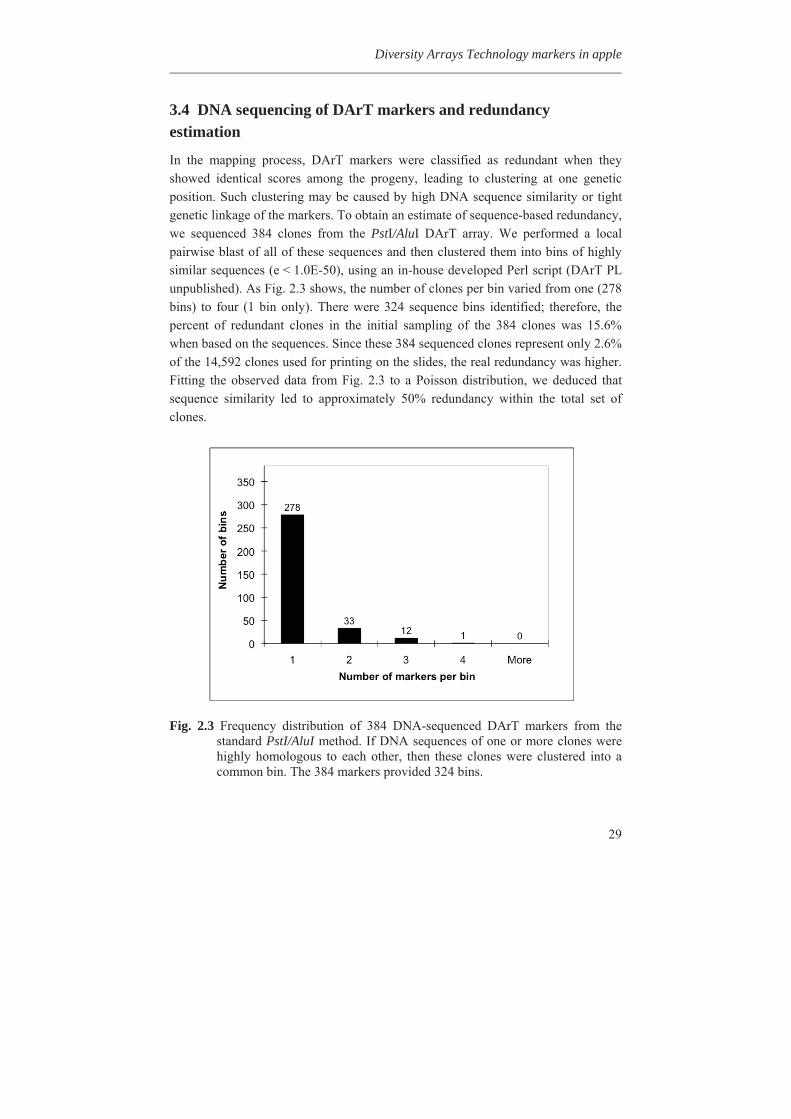
In the mapping process, DArT markers were classified as redundant when they showed identical scores among the progeny, leading to clustering at one genetic position. Such clustering may be caused by high DNA sequence similarity or tight genetic linkage of the markers. To obtain an estimate of sequence-based redundancy, we sequenced 384 clones from the PstI/AluI DArT array. We performed a local pairwise blast of all of these sequences and then clustered them into bins of highly similar sequences (e < 1.0E-50), using an in-house developed Perl script (DArT PL unpublished). As Fig. 2.3 shows, the number of clones per bin varied from one (278 bins) to four (1 bin only). There were 324 sequence bins identified; therefore, the percent of redundant clones in the initial sampling of the 384 clones was 15.6% when based on the sequences. Since these 384 sequenced clones represent only 2.6% of the 14,592 clones used for printing on the slides, the real redundancy was higher. Fitting the observed data from Fig. 2.3 to a Poisson distribution, we deduced that sequence similarity led to approximately 50% redundancy within the total set of clones.
Fig. 2.3 Frequency distribution of 384 DNA-sequenced DArT markers from the
standard PstI/AluI method. If DNA sequences of one or more clones were highly homologous to each other, then these clones were clustered into a common bin. The 384 markers provided 324 bins.
Chapter 2
30
Comparison of these DNA-sequences to sequences in NCBI GenBank databases showed that close to 90% of BlastN and TblastX searches returned highly significant similarities to EST sequences (Online Resource 2). This indicates that the PstI/AluI DArT clones were derived mainly from genes or gene-like sequences.
3.5 Alternative complexity reduction method
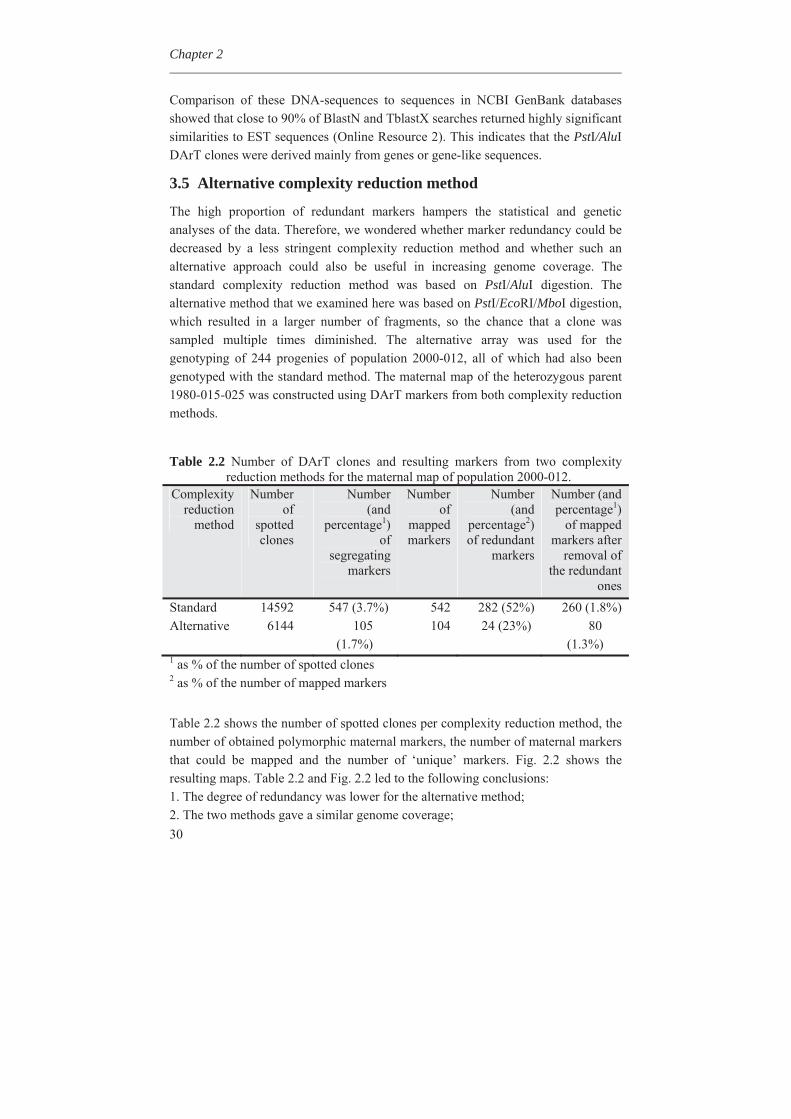
The high proportion of redundant markers hampers the statistical and genetic analyses of the data. Therefore, we wondered whether marker redundancy could be decreased by a less stringent complexity reduction method and whether such an alternative approach could also be useful in increasing genome coverage. The standard complexity reduction method was based on PstI/AluI digestion. The alternative method that we examined here was based on PstI/EcoRI/MboI digestion, which resulted in a larger number of fragments, so the chance that a clone was sampled multiple times diminished. The alternative array was used for the genotyping of 244 progenies of population 2000-012, all of which had also been genotyped with the standard method. The maternal map of the heterozygous parent 1980-015-025 was constructed using DArT markers from both complexity reduction methods.
Table 2.2 Number of DArT clones and resulting markers from two complexity
reduction methods for the maternal map of population 2000-012. Complexity
reduction method
Number of
spotted clones
Number (and
percentage1) of
segregating markers
Number of
mapped markers
Number (and
percentage2) of redundant
markers
Number (and percentage1)
of mapped markers after
removal of the redundant
ones Standard 14592 547 (3.7%) 542 282 (52%) 260 (1.8%)
Alternative 6144 105 (1.7%)
104 24 (23%) 80 (1.3%)
1 as % of the number of spotted clones 2 as % of the number of mapped markers Table 2.2 shows the number of spotted clones per complexity reduction method, the number of obtained polymorphic maternal markers, the number of maternal markers that could be mapped and the number of ‘unique’ markers. Fig. 2.2 shows the resulting maps. Table 2.2 and Fig. 2.2 led to the following conclusions: 1. The degree of redundancy was lower for the alternative method; 2. The two methods gave a similar genome coverage;
Diversity Arrays Technology markers in apple
31
3. There are no clear indications that the two methods differ in the genomic regions for which they raise polymorphic markers; 4. Performance of both methods increased genome coverage compared to application of one method only.
4. Discussion
4.1 Comparison of DArT with other marker technologies
After being initially developed for rice, DArT markers have been developed for many additional plant species (Jaccoud et al. 2001; Xie et al. 2006). These include barley (Wenzl et al. 2004), wheat (Akbari et al. 2006; White et al. 2008), cassava (Xia et al. 2005), Arabidopsis (Wittenberg et al. 2005), pigeon pea (Yang et al. (2006), oat (Tinker et al. 2009), sorghum (Mace et al. 2008) and many others (collated at www.diversityarrays.com/publications.html). The present study demonstrates the performance of DArT technology for low-cost, high-throughput genotyping in apple (Malus).
Several lines of evidence support the utility of DArT for apple genomics studies. First, the call rate and reproducibility appear to be high. Non-DArT marker data required repeated examinations for identification of erroneous data, consuming many months of labour. DArT markers, however, did not require this laborious scrutinising; DArT genotyping was fully automated and more accurate than other marker systems. The non-DArT markers were gel-based systems, i.e. RFLP, RAPD, AFLP, SSR, and were scored manually. Second, the DArT markers integrated smoothly into the existing ‘Prima’ x ‘Fiesta’ map. Only one marker could not be placed (0.4%). This percentage is very low compared to that found in other marker systems, like RFLP, RAPD, AFLP and SSRs. Also, DArT markers were robust among different mapping populations, allowing for map alignment.
The standard DArT array gave similar numbers of non-redundant markers in the two mapping populations, indicating that it is robust over populations. Moreover, the majority of these markers were population-specific, indicating that the extensive pool of clones that are not polymorphic in one population are a vast reservoir of possible new markers in other populations. Thus, the DArT array is applicable over a wide range of mapping populations. The number of unique markers is therefore expected to increase further in more extensive studies.
Chapter 2
32
DArT lends its general applicability for wide germplasm coverage to the hybridisation of PCR fragments that are hundreds of base pairs long. Polymorphisms are based on the presence or absence of restriction sites and are insensitive to SNPs and short indels in the hundreds of basepairs between the restriction sites (Wittenberg et al. 2005). This is reflected by the sequence data. Map-redundant DArT markers were often based on clones that differed in size and sequence but nevertheless showed identical segregation patterns in mapping. For instance, the three markers 183247, 183997 and 184057 showed identical segregation patterns and therefore mapped to the same position (LG10, ‘Prima’ x ‘Fiesta’, linkage group 4, 44cM; Fig. 2.2, only 183247 is shown). The three DArT fragments varied in size (479, 469 and 502 bp, respectively) and exhibited some sequence polymorphism as occurs for different alleles of a single gene. Their map-redundancy was confirmed at the sequence level as “blasting” matched them to the same gene (Resource Online 2). This insensitivity to SNPs and short indels in the probe makes DArT robust for applications on genetically diverse germplasm. This contrasts with the sensitivity of SNP arrays to similar polymorphisms. The proportion of informative markers from SNP arrays drops quickly when applied to germplasm that is genetically distinct from accessions that were used in the design of the SNP array. DArT appears to be less prone to this limitation.
DArT and SNP platforms are both suitable for high-throughput genotyping, benefiting from automated scoring and data quality checks. The first small-scale SNP arrays for Malus were developed recently for ‘Golden Delicious’ (Micheletti et al. 2011). Recently, initiatives have been undertaken for worldwide collaboration on the development of large-scale, multiple accession-based arrays. We expect that DArT will also play a longer term role because of its own specific advantages, including wide applicability, as discussed above, and low cost even when small numbers of accessions have to be genotyped.
Diversity Arrays Technology markers in apple
33
4.2 Impact of pedigree structure
Although the standard DArT array gave similar numbers of non-redundant markers for both mapping populations (247 for ‘Prima’ x ‘Fiesta’ versus 260 for 2000-012), differences were observed in the distribution of these markers among the parents. Whereas the proportion of maternal, paternal and bi-parental markers were similar in ‘Prima’ x ‘Fiesta’ (35%, 32%, 33%, respectively), unbalanced proportions were observed in 2000-012, with relative under-representation of paternal markers and over-representation of bi-parental markers (35%, 20%, 45%). These differences in representation reflect differences in the pedigree structures of these populations (Fig. 2.1). The father of population 2000-012 arose from a cross between two sibs, resulting in an expected level of homozygosity of approximately 25%. This parent would yield no segregating markers in these homozygous regions. In addition, the parents of population 2000-012 have common ancestors, ‘Golden Delicious’ and ‘Ingrid Marie’, reducing levels of allelic diversity. This increases the number of bi-parental markers that segregate for both the father and the mother. ‘Prima’ and ‘Fiesta’ lack such recent common ancestors. The distribution of segregating DArT markers among the parents thus reflects the pedigree structures, further supporting the suitability of DArT for genetic studies.
4.3 Redundancy
Markers that perfectly co-segregate do not provide additional genetic information, but slow down the mapping process and lead to the statistical overweighting of that specific position. Therefore, redundant markers were removed. This reduced the number of polymorphic markers used in the mapping process by about half. Markers that segregated in both populations needed to be preferentially retained to facilitate linkage map alignment.
Clustering of DArT markers can be caused by: (i) an absence of recombination between the markers due to tight genetic linkage; (ii) sequence identity; or (iii) high sequence similarity derived from different alleles from different apple accessions. The effective population size of ‘Prima’ x ‘Fiesta’ was 121, which can only partially explain the current high degree of redundancy in the DArT markers as a result of a lack of recombination between markers. Consequently, sequence identity and high sequence similarity were likely to be significant sources of redundancy. This is consistent with our estimation from Fig. 2.3 that sequence identity indeed led to approximately 50% redundancy. Based on the sequence information, we conclude that the clustering of PstI-AluI markers is mainly due to sequence similarity among the markers, in addition to genetic linkage.
Chapter 2
34
In classifying markers as “redundant” using a mapping process, more than just similar mapping positions were taken into account. For a proper classification, the parental origin and linkage phase have to be identical too. For example, JoinMap® mapped the bi-parental DArT markers 183313 and 184063 within 0.1 cM from each other. Considering the size of the ‘Prima’ x ‘Fiesta’ population (n=121 for the DArT markers) and the type of marker (bi-parental), both markers belonged to the same genetic bin: there was no evidence that they mapped to different positions. Their scores did not indicate any recombination. Although this suggests that they are identical, their linkage phase was different: They were in repulsion phase, indicating that these markers come from different genomic positions. Indeed, DNA sequencing confirmed a substantial sequence difference of the two clones (Online Resource 2).
The positive side of redundancy is that the underlying markers can be regarded as repeats when present on the same slide and thus confirm validity of marker scores. The co-segregation of markers with highly similar sequences highlights the high reliability of the DArT markers.
4.4 DArT markers mainly derived from gene rich regions
Our analysis of the sequences shows that 90% of the sequenced markers are highly homologous to mRNA sequences that are deposited in EST databases (Resource Online 2). This indicates that the set of DArT markers is highly enriched for genic regions. This phenomenon has been observed previously in other species like barley (Wenzl et al. 2006), wheat (Akbari et al. 2006) and sorghum (Mace et al. 2008). DArT markers are predominantly located in gene-rich islands in the subtelomeric regions of chromosomes. This is not surprising, as the PstI enzyme is methylation sensitive (Gruenbaum et al. 1981), and targets hypomethylated, low-copy sequences, which occur primarily in the gene-rich regions (Feng et al. 2010).
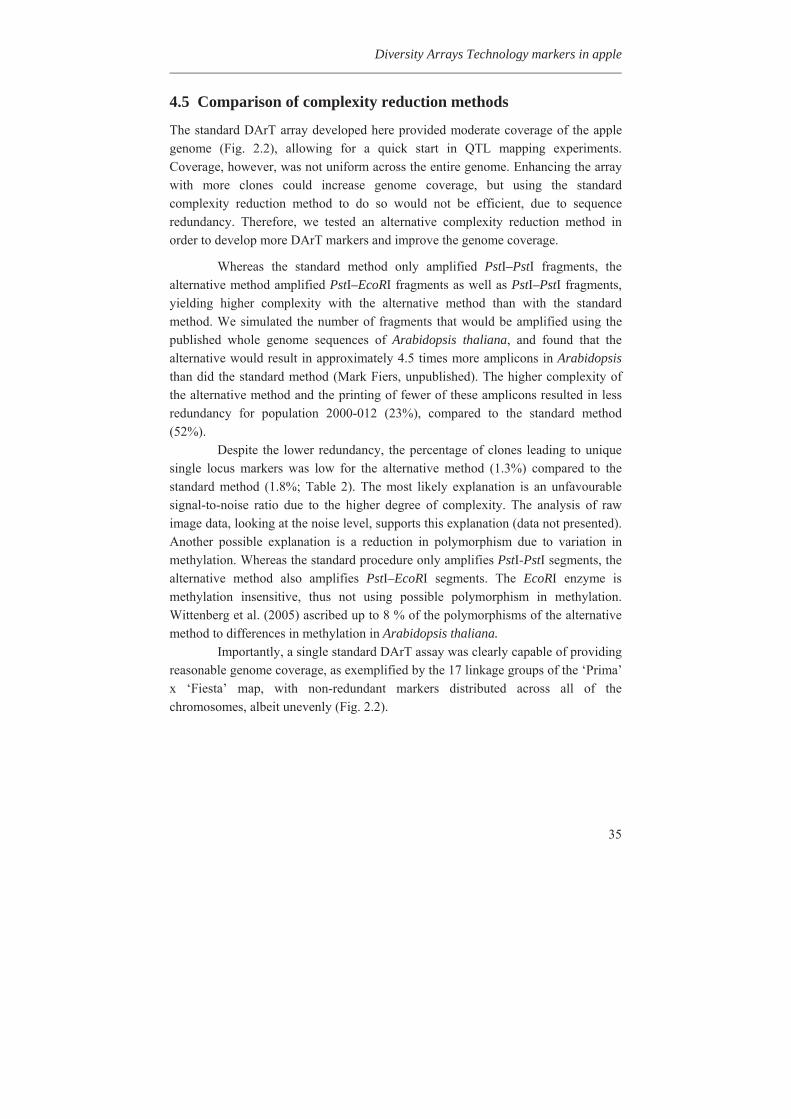
Diversity Arrays Technology markers in apple
35
4.5 Comparison of complexity reduction methods
The standard DArT array developed here provided moderate coverage of the apple genome (Fig. 2.2), allowing for a quick start in QTL mapping experiments. Coverage, however, was not uniform across the entire genome. Enhancing the array with more clones could increase genome coverage, but using the standard complexity reduction method to do so would not be efficient, due to sequence redundancy. Therefore, we tested an alternative complexity reduction method in order to develop more DArT markers and improve the genome coverage.
Whereas the standard method only amplified PstI–PstI fragments, the alternative method amplified PstI–EcoRI fragments as well as PstI–PstI fragments, yielding higher complexity with the alternative method than with the standard method. We simulated the number of fragments that would be amplified using the published whole genome sequences of Arabidopsis thaliana, and found that the alternative would result in approximately 4.5 times more amplicons in Arabidopsis than did the standard method (Mark Fiers, unpublished). The higher complexity of the alternative method and the printing of fewer of these amplicons resulted in less redundancy for population 2000-012 (23%), compared to the standard method (52%).
Despite the lower redundancy, the percentage of clones leading to unique single locus markers was low for the alternative method (1.3%) compared to the standard method (1.8%; Table 2). The most likely explanation is an unfavourable signal-to-noise ratio due to the higher degree of complexity. The analysis of raw image data, looking at the noise level, supports this explanation (data not presented). Another possible explanation is a reduction in polymorphism due to variation in methylation. Whereas the standard procedure only amplifies PstI-PstI segments, the alternative method also amplifies PstI–EcoRI segments. The EcoRI enzyme is methylation insensitive, thus not using possible polymorphism in methylation. Wittenberg et al. (2005) ascribed up to 8 % of the polymorphisms of the alternative method to differences in methylation in Arabidopsis thaliana.
Importantly, a single standard DArT assay was clearly capable of providing reasonable genome coverage, as exemplified by the 17 linkage groups of the ‘Prima’ x ‘Fiesta’ map, with non-redundant markers distributed across all of the chromosomes, albeit unevenly (Fig. 2.2).
Chapter 2
36
4.6 Linked research
The genetic maps shown here are the basis for several QTL studies that are currently underway, examining metabolomics (Khan et al., submitted), disease resistance, fruit quality traits, and low allergenicity (Van de Weg et al., in prep.). Additionally, the standard DArT assay is being applied worldwide to a number of mapping populations and to the construction of consensus genetic maps (Van Dyk et al., in prep.). All of the markers in this study are being sequenced and will be aligned with the apple genome sequence (Velasco et al. 2010). This will allow for the integration of the genetic positions of phenotypic traits with the whole genome sequence of apple, thereby aiding in the search for underlying genes.
Acknowledgements
This study had been carried out with financial support from the Ministry of Agriculture, Nature and Food Quality, The Netherlands. Unpublished data from the European projects DARE and ISAFRUIT were used, which were supported financially by the Commission of the European Communities under the Thematic Priority FAIR5 of the 4th Framework Programme of RTD (Contract no FP4-FAIR-CT-1997-3898), and 5–Food Quality and Safety of the 6th Framework Programme of RTD (Contract no. FP6-FOOD–CT-2006-016279), respectively. Also, unpublished data from a Voluntary Contribution project between the Australian National Apple Breeding Program, and Horticulture Australia Ltd, Australia (AP06009) were used. We are grateful to Mark Fiers (Plant and Food Research, New Zealand), for simulating the number of DArT restriction fragments in Arabidopsis, for different combinations of restriction enzymes. We acknowledge also James J. Luby and James M. Bradeen (University of Minnesota) for their contribution in selection of Malus genotypes for construction of libraries for the diversity arrays.
Chapter 3
Loss and gain of metabolites during apple
breeding
Sabaz Ali Khan1, Yury Tikunov1, Pierre-Yves Chibon1, Chris Maliepaard1, Jules Beekwilder2, Evert Jacobsen1
and Henk J. Schouten1*
1 Wageningen University and Research Centre, Wageningen UR Plant Breeding, P.O. Box 386, 6700 AJ Wageningen, The Netherlands.
2 Wageningen University and Research Centre, Plant Research International, Business Unit Bioscience, P.O. Box 16, 6700 AA Wageningen, The Netherlands.
*For correspondence (fax +31 317 41 80 94; e-mail [email protected])
Manuscript in preparation
Chapter 3
38
Abstract The domesticated apple (Malus x domestica Borkh) is a rich source of secondary metabolites. In this study, fruits from 23 wild species, eight advanced selections and a segregating population from the cross between ‘Prima’ and ‘Fiesta’ were analysed for metabolic profiling, using liquid chromatography-mass spectrometry (LC-MS). The data were subjected to Principle Components Analysis (PCA). Variance analysis of the first principle component (PC) showed that genetic variation accounted for 96.6 % in peel and 97.4 % in flesh of the total metabolic variation. Technical variation accounted for 1.4 % and 0.8%, while environmental variation accounted for 2.0% and 1.8% in peel and flesh respectively. The genetic variation between wild genotypes was very large, compared to the advanced selections and the F1 progeny. Only 8 % of the genetic variation of the first principle component was captured by the advanced selections. This indicates a strong genetic erosion. This genetic erosion was mainly caused by reduction of the contents of several flavonoids including catechin, epicatechin and procyanidins. PCA of the F1 progeny of ‘Prima’ x ‘Fiesta’ cross showed a clear 3:1 Mendelian segregation of metabolites. These metabolites were 4.2 fold less in both peel and flesh in progeny that had inherited the recessive alleles of a gene at the top of Linkage Group 16 (LG16) from the heterozygous parents. We found a separate group of 11 metabolites in peel and 12 in flesh. These metabolites were putatively identified as glycosylated forms of -glycols: R-octane-1,3-diol and its unsaturated form R-5-(Z)-octene-1,3-diol. The contents of these metabolites were up to 50 fold more abundant in some progeny compared to both parents. Genetic mapping showed that this strong increase was caused by one locus at the top of LG8, in progeny that had inherited only the recessive alleles of that locus from the heterozygous parents. These metabolites belong to -glycols group of secondary metabolites which have a potential role in controlling infecting microorganisms and influence the aroma of some ciders. This research illustrates the strong genetic erosion in apple breeding regarding metabolic diversity, but also shows that inbreeding can lead to a strong increase of metabolites that were present at much lower contents in the parents and advanced selections, because of accumulation of recessive alleles during inbreeding.
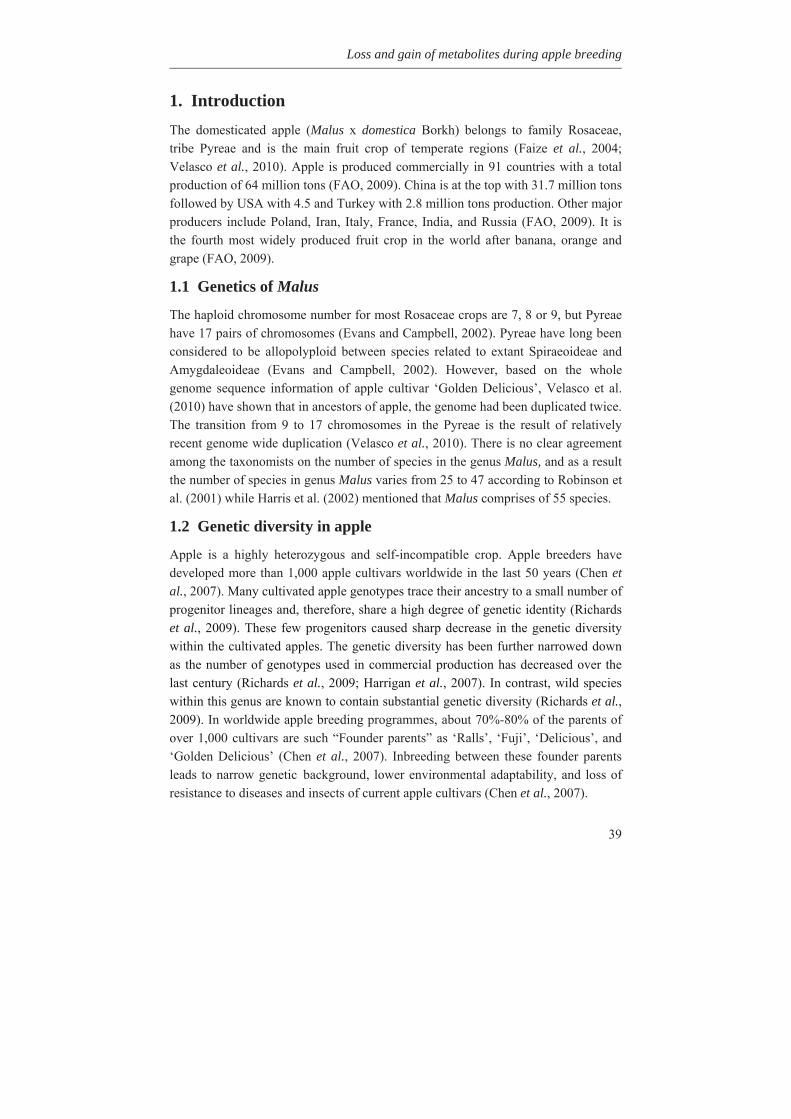
Loss and gain of metabolites during apple breeding
39
1. Introduction The domesticated apple (Malus x domestica Borkh) belongs to family Rosaceae, tribe Pyreae and is the main fruit crop of temperate regions (Faize et al., 2004; Velasco et al., 2010). Apple is produced commercially in 91 countries with a total production of 64 million tons (FAO, 2009). China is at the top with 31.7 million tons followed by USA with 4.5 and Turkey with 2.8 million tons production. Other major producers include Poland, Iran, Italy, France, India, and Russia (FAO, 2009). It is the fourth most widely produced fruit crop in the world after banana, orange and grape (FAO, 2009).
1.1 Genetics of Malus
The haploid chromosome number for most Rosaceae crops are 7, 8 or 9, but Pyreae have 17 pairs of chromosomes (Evans and Campbell, 2002). Pyreae have long been considered to be allopolyploid between species related to extant Spiraeoideae and Amygdaleoideae (Evans and Campbell, 2002). However, based on the whole genome sequence information of apple cultivar ‘Golden Delicious’, Velasco et al. (2010) have shown that in ancestors of apple, the genome had been duplicated twice. The transition from 9 to 17 chromosomes in the Pyreae is the result of relatively recent genome wide duplication (Velasco et al., 2010). There is no clear agreement among the taxonomists on the number of species in the genus Malus, and as a result the number of species in genus Malus varies from 25 to 47 according to Robinson et al. (2001) while Harris et al. (2002) mentioned that Malus comprises of 55 species.
1.2 Genetic diversity in apple
Apple is a highly heterozygous and self-incompatible crop. Apple breeders have developed more than 1,000 apple cultivars worldwide in the last 50 years (Chen et al., 2007). Many cultivated apple genotypes trace their ancestry to a small number of progenitor lineages and, therefore, share a high degree of genetic identity (Richards et al., 2009). These few progenitors caused sharp decrease in the genetic diversity within the cultivated apples. The genetic diversity has been further narrowed down as the number of genotypes used in commercial production has decreased over the last century (Richards et al., 2009; Harrigan et al., 2007). In contrast, wild species within this genus are known to contain substantial genetic diversity (Richards et al., 2009). In worldwide apple breeding programmes, about 70%-80% of the parents of over 1,000 cultivars are such “Founder parents” as ‘Ralls’, ‘Fuji’, ‘Delicious’, and ‘Golden Delicious’ (Chen et al., 2007). Inbreeding between these founder parents leads to narrow genetic background, lower environmental adaptability, and loss of resistance to diseases and insects of current apple cultivars (Chen et al., 2007).
Chapter 3
40
Many modern varieties resulted from domestication of wild species to produce plants with more desirable traits, thereby reducing the original diversity among resources (Sasaki, 2009).
1.3 Functions of plant secondary metabolites
Plants are a rich source of secondary metabolites. It has been estimated that over 100,000 metabolites can be found in plants (Keurentjes et al., 2006). Dixon and Strack, (2003) reported ~ 200, 000 metabolites in plant kingdom and the number is even more as reported by Trethewey (2004). Moreover, substantial qualitative and quantitative variations in metabolites composition is often observed within the plant species (Keurentjes et al., 2006). Many of these secondary metabolites e.g. quercetin, procyanidins and chlorogenic acid have potential health benefits for humans (Eberhardt et al., 2000; Mcghie et al., 2005).
The current metabolic profiling technologies have shown to be effective in detecting the similarities and differences in the composition of different plant breeding germplasm and wild species (Harrigan et al., 2007). Metabolic changes are associated with plant development and responses to stresses (Harrigan et al., 2007). Quality traits such as flavour, aroma, colour and texture, their storage properties and performance in the field in many important crops and ornamental plants are dependent on metabolic composition (Harrigan et al., 2007; Memelink, 2005). The metabolome represents a critical aspect of a plant’s physiology, growth characteristics and ultimately economic value (Harrigan et al., 2007). Secondary metabolites in plants are also involved in the interaction between host and parasite. For example, the resistance of apple against fungus Venturia inaequalis is associated with a rapid and localized accumulation of phenylpropanoids which is induced by the infection (Leser and Treutter, 2007).
Metabolomics has proven to be of increasing popularity in assessing genotypic and phenotypic diversity in plants and in defining biochemical changes associated with developmental changes during plants’ growth (Harrigan et al., 2007). The metabolic profiling technologies can be applied to investigate metabolic differences between different plant species and cultivars (Harrigan et al., 2007). Further, the plant metabolome has been suggested as bridging the genotype-phenotype gap (Fiehn, 2002; Hall, 2006).
Loss and gain of metabolites during apple breeding
41
1.4 Present study
In this study, the metabolic diversity in wild germplasm and advanced selections of apple was evaluated. Also metabolic diversity in the F1 progeny of a segregating population from ‘Prima’ x ‘Fiesta’ cross was compared to the metabolic diversity in the parents of that population. A large number of metabolites were found in the wild species and advanced selections of apple. The variation in metabolites was mainly because of the genetical differences between genotypes and to a little extent because of the environmental and technical differences. Moreover, metabolites were detected that were significantly less or more abundant in some of the progeny compared to both the parents. The loss of metabolites was caused by an mQTL hotspot on LG16. These metabolites appeared to be phenolic compounds of the phenylpropanoid pathway, as described in Chapter 4. The gain of metabolites in some of the progeny was caused by an mQTL on LG 8. The annotation revealed that these metabolites were glycosylated forms of -glycols: R-octane-1,3-diol and its unsaturated form R-5-(Z)-octene-1,3-diol.
2. Materials and methods
2.1 Plant material and samples collection
Fruits from 23 wild Malus species were harvested in the botanical garden of Wageningen, the Netherlands in 2008. For each genotype, fruits from one to four trees (trees as biological replicates), depending on the availability of replicates, were harvested. Additionally, fruits from eight advanced selections of apple were harvested, preferably from four trees per genotype (Table 3.1). These fruits were harvested at the experimental station, Randwijk, the Netherlands. A segregating F1 population from the cross between ‘Prima’ and ‘Fiesta’, containing 118 progeny genotypes, located in the experimental orchard in Elst, the Netherlands, was also included. For this population we had two trees per genotype and five trees per parent. More than ten fruits from each individual tree were picked, in order to compensate for the injuries and other damages of the fruits during transportation.
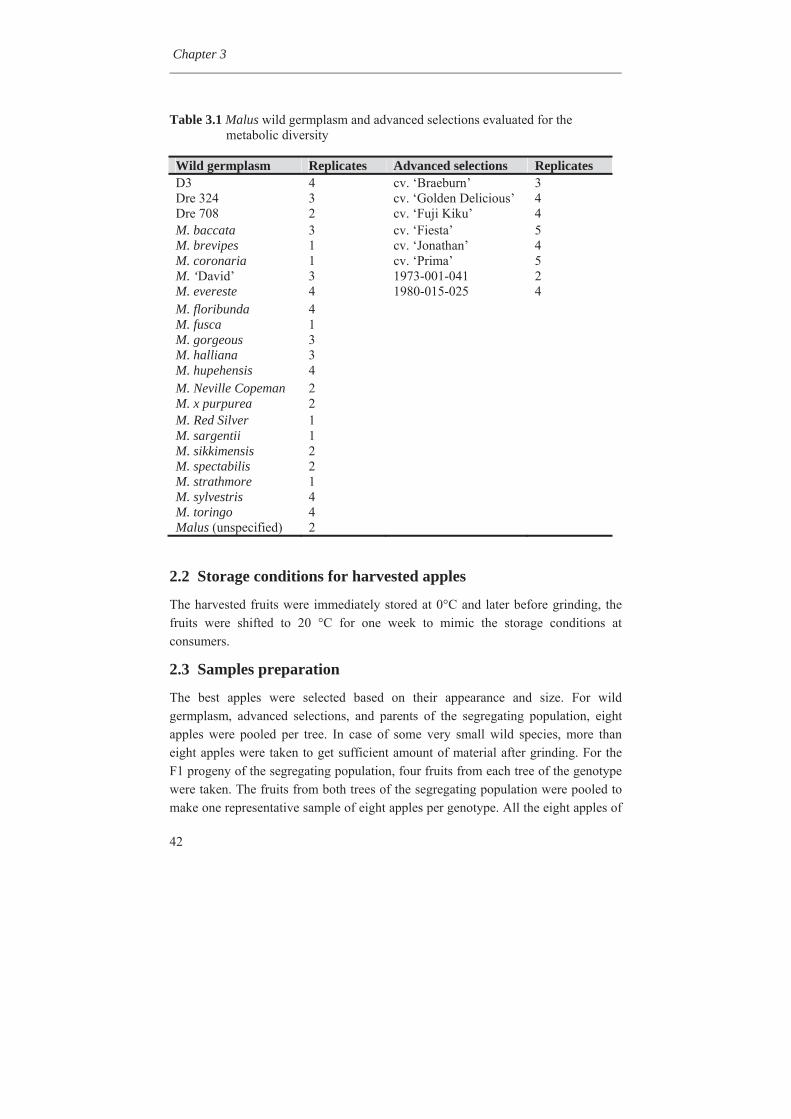
Chapter 3
42
Table 3.1 Malus wild germplasm and advanced selections evaluated for the metabolic diversity
Wild germplasm Replicates Advanced selections Replicates D3 4 cv. ‘Braeburn’ 3 Dre 324 3 cv. ‘Golden Delicious’ 4 Dre 708 2 cv. ‘Fuji Kiku’ 4 M. baccata 3 cv. ‘Fiesta’ 5 M. brevipes 1 cv. ‘Jonathan’ 4 M. coronaria 1 cv. ‘Prima’ 5 M. ‘David’ 3 1973-001-041 2 M. evereste 4 1980-015-025 4 M. floribunda 4 M. fusca 1 M. gorgeous 3 M. halliana 3 M. hupehensis 4 M. Neville Copeman 2 M. x purpurea 2 M. Red Silver 1 M. sargentii 1 M. sikkimensis 2 M. spectabilis 2 M. strathmore 1 M. sylvestris 4 M. toringo 4 Malus (unspecified) 2
2.2 Storage conditions for harvested apples
The harvested fruits were immediately stored at 0°C and later before grinding, the fruits were shifted to 20 °C for one week to mimic the storage conditions at consumers.
2.3 Samples preparation
The best apples were selected based on their appearance and size. For wild germplasm, advanced selections, and parents of the segregating population, eight apples were pooled per tree. In case of some very small wild species, more than eight apples were taken to get sufficient amount of material after grinding. For the F1 progeny of the segregating population, four fruits from each tree of the genotype were taken. The fruits from both trees of the segregating population were pooled to make one representative sample of eight apples per genotype. All the eight apples of
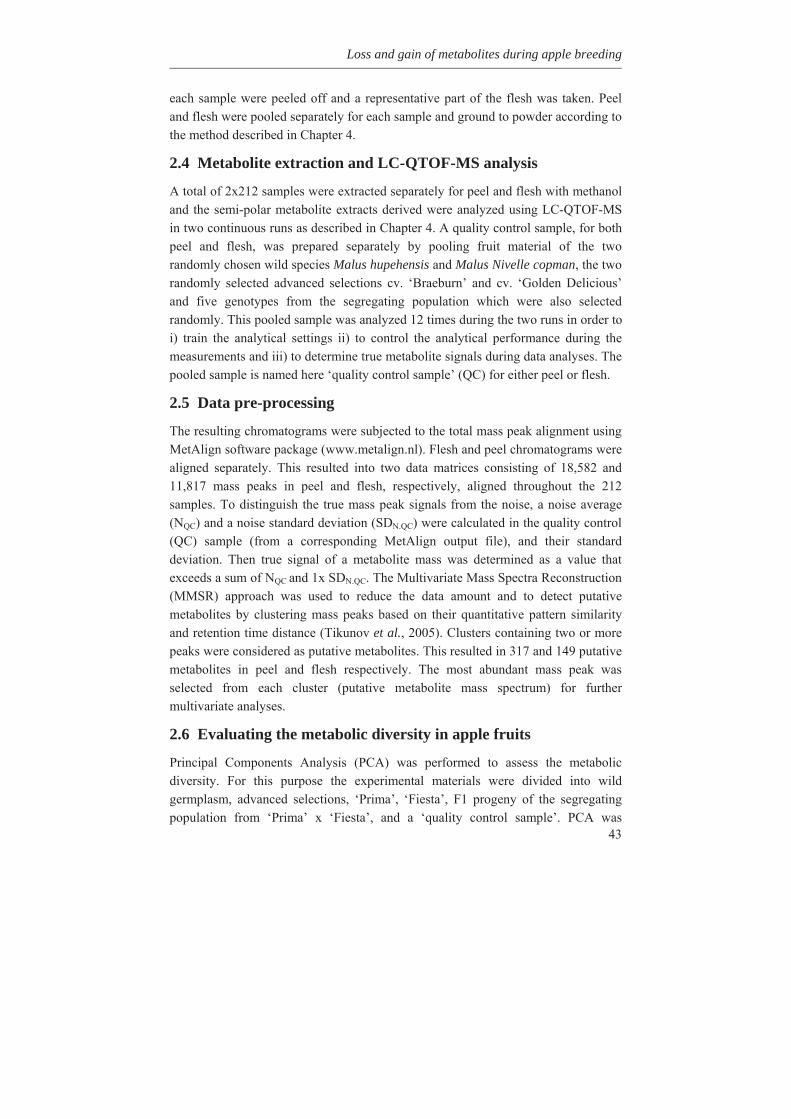
Loss and gain of metabolites during apple breeding
43
each sample were peeled off and a representative part of the flesh was taken. Peel and flesh were pooled separately for each sample and ground to powder according to the method described in Chapter 4.
2.4 Metabolite extraction and LC-QTOF-MS analysis
A total of 2x212 samples were extracted separately for peel and flesh with methanol and the semi-polar metabolite extracts derived were analyzed using LC-QTOF-MS in two continuous runs as described in Chapter 4. A quality control sample, for both peel and flesh, was prepared separately by pooling fruit material of the two randomly chosen wild species Malus hupehensis and Malus Nivelle copman, the two randomly selected advanced selections cv. ‘Braeburn’ and cv. ‘Golden Delicious’ and five genotypes from the segregating population which were also selected randomly. This pooled sample was analyzed 12 times during the two runs in order to i) train the analytical settings ii) to control the analytical performance during the measurements and iii) to determine true metabolite signals during data analyses. The pooled sample is named here ‘quality control sample’ (QC) for either peel or flesh.
2.5 Data pre-processing
The resulting chromatograms were subjected to the total mass peak alignment using MetAlign software package (www.metalign.nl). Flesh and peel chromatograms were aligned separately. This resulted into two data matrices consisting of 18,582 and 11,817 mass peaks in peel and flesh, respectively, aligned throughout the 212 samples. To distinguish the true mass peak signals from the noise, a noise average (NQC) and a noise standard deviation (SDN.QC) were calculated in the quality control (QC) sample (from a corresponding MetAlign output file), and their standard deviation. Then true signal of a metabolite mass was determined as a value that exceeds a sum of NQC and 1x SDN.QC. The Multivariate Mass Spectra Reconstruction (MMSR) approach was used to reduce the data amount and to detect putative metabolites by clustering mass peaks based on their quantitative pattern similarity and retention time distance (Tikunov et al., 2005). Clusters containing two or more peaks were considered as putative metabolites. This resulted in 317 and 149 putative metabolites in peel and flesh respectively. The most abundant mass peak was selected from each cluster (putative metabolite mass spectrum) for further multivariate analyses.
2.6 Evaluating the metabolic diversity in apple fruits
Principal Components Analysis (PCA) was performed to assess the metabolic diversity. For this purpose the experimental materials were divided into wild germplasm, advanced selections, ‘Prima’, ‘Fiesta’, F1 progeny of the segregating population from ‘Prima’ x ‘Fiesta’, and a ‘quality control sample’. PCA was
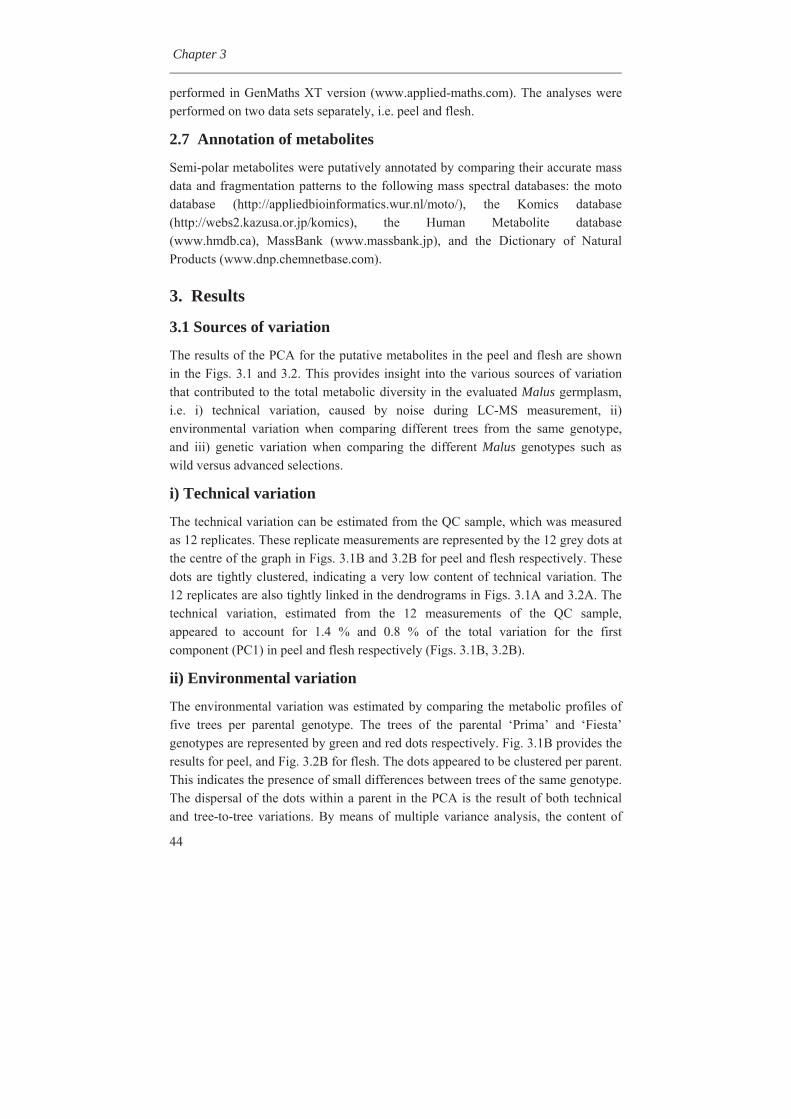
Chapter 3
44
performed in GenMaths XT version (www.applied-maths.com). The analyses were performed on two data sets separately, i.e. peel and flesh.
2.7 Annotation of metabolites
Semi-polar metabolites were putatively annotated by comparing their accurate mass data and fragmentation patterns to the following mass spectral databases: the moto database (http://appliedbioinformatics.wur.nl/moto/), the Komics database (http://webs2.kazusa.or.jp/komics), the Human Metabolite database (www.hmdb.ca), MassBank (www.massbank.jp), and the Dictionary of Natural Products (www.dnp.chemnetbase.com).
3. Results
3.1 Sources of variation
The results of the PCA for the putative metabolites in the peel and flesh are shown in the Figs. 3.1 and 3.2. This provides insight into the various sources of variation that contributed to the total metabolic diversity in the evaluated Malus germplasm, i.e. i) technical variation, caused by noise during LC-MS measurement, ii) environmental variation when comparing different trees from the same genotype, and iii) genetic variation when comparing the different Malus genotypes such as wild versus advanced selections.
i) Technical variation
The technical variation can be estimated from the QC sample, which was measured as 12 replicates. These replicate measurements are represented by the 12 grey dots at the centre of the graph in Figs. 3.1B and 3.2B for peel and flesh respectively. These dots are tightly clustered, indicating a very low content of technical variation. The 12 replicates are also tightly linked in the dendrograms in Figs. 3.1A and 3.2A. The technical variation, estimated from the 12 measurements of the QC sample, appeared to account for 1.4 % and 0.8 % of the total variation for the first component (PC1) in peel and flesh respectively (Figs. 3.1B, 3.2B).
ii) Environmental variation
The environmental variation was estimated by comparing the metabolic profiles of five trees per parental genotype. The trees of the parental ‘Prima’ and ‘Fiesta’ genotypes are represented by green and red dots respectively. Fig. 3.1B provides the results for peel, and Fig. 3.2B for flesh. The dots appeared to be clustered per parent. This indicates the presence of small differences between trees of the same genotype. The dispersal of the dots within a parent in the PCA is the result of both technical and tree-to-tree variations. By means of multiple variance analysis, the content of
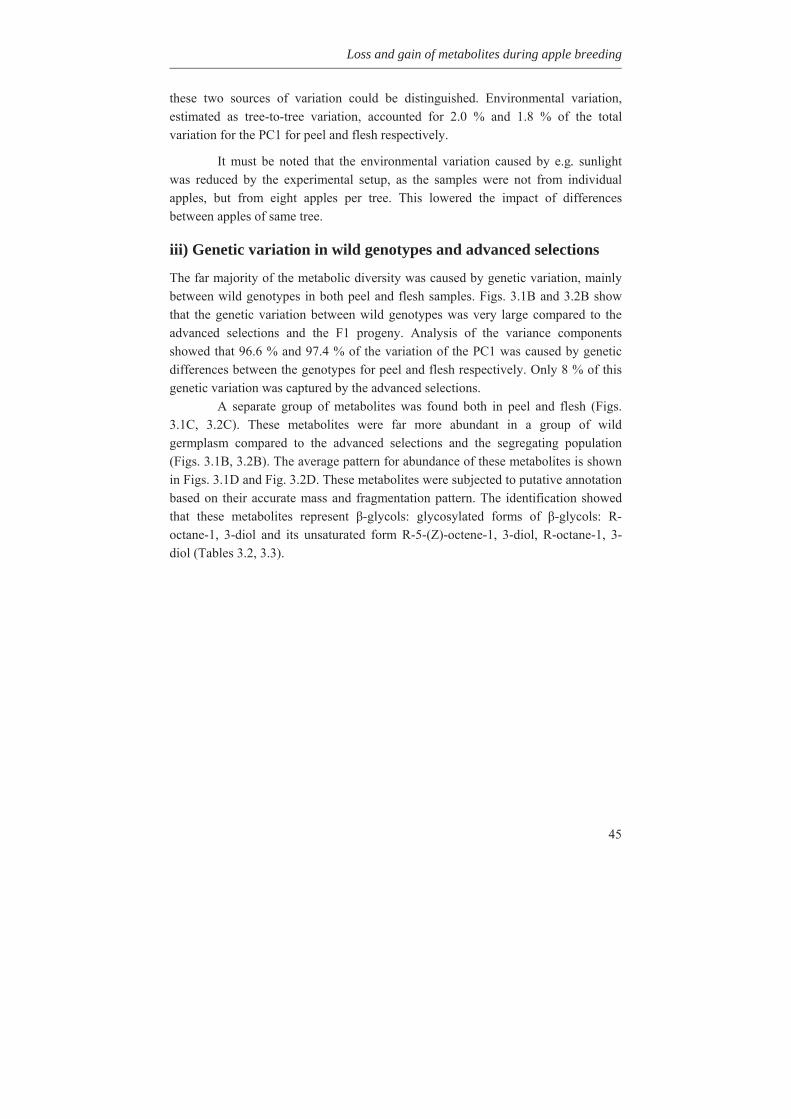
Loss and gain of metabolites during apple breeding
45
these two sources of variation could be distinguished. Environmental variation, estimated as tree-to-tree variation, accounted for 2.0 % and 1.8 % of the total variation for the PC1 for peel and flesh respectively.
It must be noted that the environmental variation caused by e.g. sunlight was reduced by the experimental setup, as the samples were not from individual apples, but from eight apples per tree. This lowered the impact of differences between apples of same tree.
iii) Genetic variation in wild genotypes and advanced selections
The far majority of the metabolic diversity was caused by genetic variation, mainly between wild genotypes in both peel and flesh samples. Figs. 3.1B and 3.2B show that the genetic variation between wild genotypes was very large compared to the advanced selections and the F1 progeny. Analysis of the variance components showed that 96.6 % and 97.4 % of the variation of the PC1 was caused by genetic differences between the genotypes for peel and flesh respectively. Only 8 % of this genetic variation was captured by the advanced selections.
A separate group of metabolites was found both in peel and flesh (Figs. 3.1C, 3.2C). These metabolites were far more abundant in a group of wild germplasm compared to the advanced selections and the segregating population (Figs. 3.1B, 3.2B). The average pattern for abundance of these metabolites is shown in Figs. 3.1D and Fig. 3.2D. These metabolites were subjected to putative annotation based on their accurate mass and fragmentation pattern. The identification showed that these metabolites represent -glycols: glycosylated forms of -glycols: R-octane-1, 3-diol and its unsaturated form R-5-(Z)-octene-1, 3-diol, R-octane-1, 3-diol (Tables 3.2, 3.3).
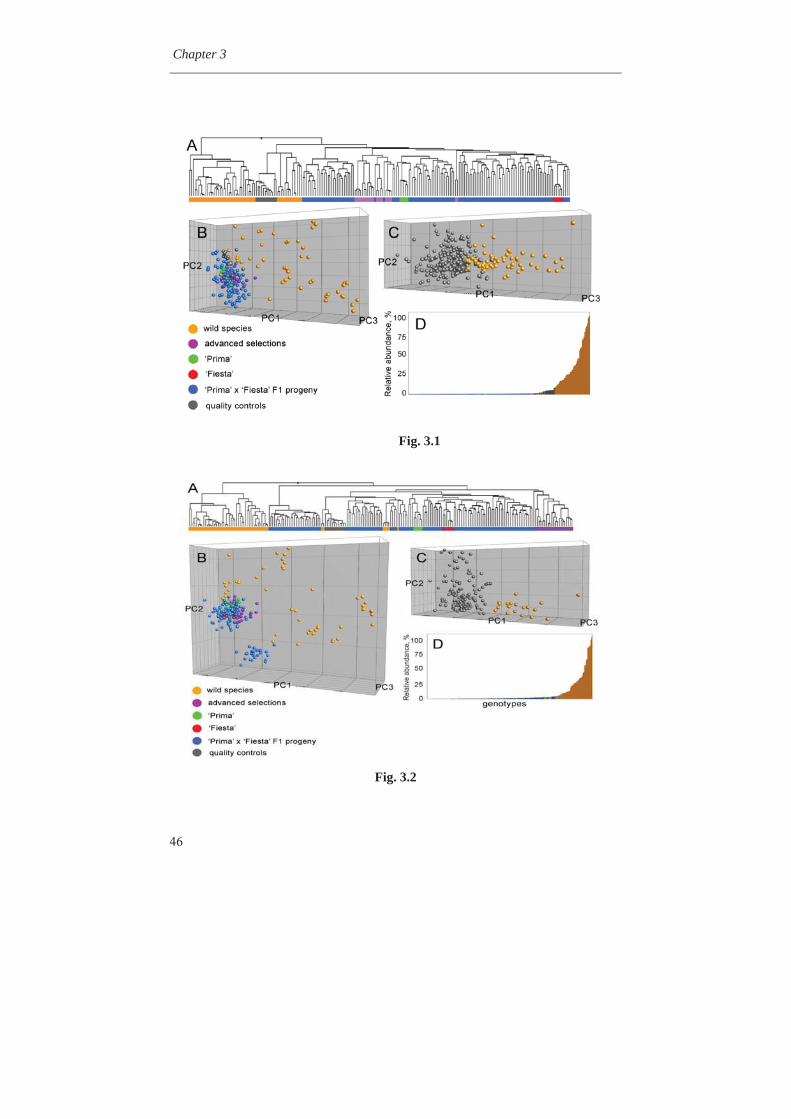
Chapter 3
46
Fig. 3.1
Fig. 3.2
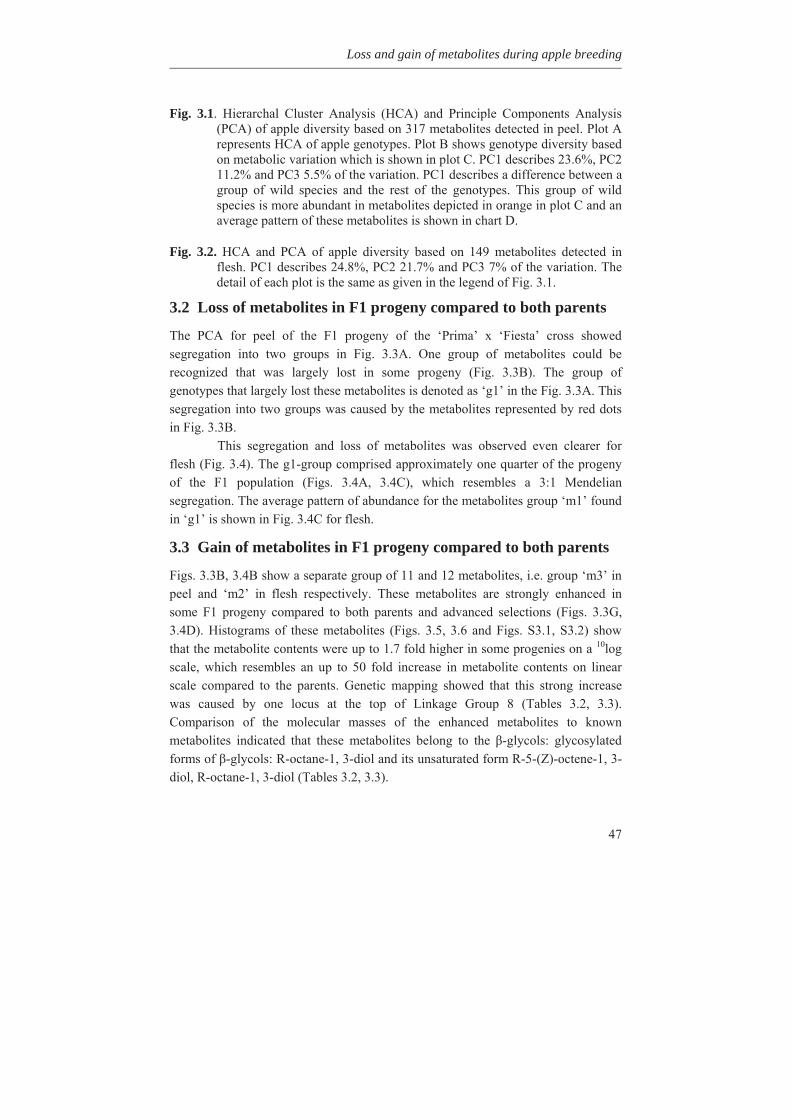
Loss and gain of metabolites during apple breeding
47
Fig. 3.1. Hierarchal Cluster Analysis (HCA) and Principle Components Analysis
(PCA) of apple diversity based on 317 metabolites detected in peel. Plot A represents HCA of apple genotypes. Plot B shows genotype diversity based on metabolic variation which is shown in plot C. PC1 describes 23.6%, PC2 11.2% and PC3 5.5% of the variation. PC1 describes a difference between a group of wild species and the rest of the genotypes. This group of wild species is more abundant in metabolites depicted in orange in plot C and an average pattern of these metabolites is shown in chart D.
Fig. 3.2. HCA and PCA of apple diversity based on 149 metabolites detected in flesh. PC1 describes 24.8%, PC2 21.7% and PC3 7% of the variation. The detail of each plot is the same as given in the legend of Fig. 3.1.
3.2 Loss of metabolites in F1 progeny compared to both parents
The PCA for peel of the F1 progeny of the ‘Prima’ x ‘Fiesta’ cross showed segregation into two groups in Fig. 3.3A. One group of metabolites could be recognized that was largely lost in some progeny (Fig. 3.3B). The group of genotypes that largely lost these metabolites is denoted as ‘g1’ in the Fig. 3.3A. This segregation into two groups was caused by the metabolites represented by red dots in Fig. 3.3B.
This segregation and loss of metabolites was observed even clearer for flesh (Fig. 3.4). The g1-group comprised approximately one quarter of the progeny of the F1 population (Figs. 3.4A, 3.4C), which resembles a 3:1 Mendelian segregation. The average pattern of abundance for the metabolites group ‘m1’ found in ‘g1’ is shown in Fig. 3.4C for flesh.
3.3 Gain of metabolites in F1 progeny compared to both parents
Figs. 3.3B, 3.4B show a separate group of 11 and 12 metabolites, i.e. group ‘m3’ in peel and ‘m2’ in flesh respectively. These metabolites are strongly enhanced in some F1 progeny compared to both parents and advanced selections (Figs. 3.3G, 3.4D). Histograms of these metabolites (Figs. 3.5, 3.6 and Figs. S3.1, S3.2) show that the metabolite contents were up to 1.7 fold higher in some progenies on a 10log scale, which resembles an up to 50 fold increase in metabolite contents on linear scale compared to the parents. Genetic mapping showed that this strong increase was caused by one locus at the top of Linkage Group 8 (Tables 3.2, 3.3). Comparison of the molecular masses of the enhanced metabolites to known metabolites indicated that these metabolites belong to the -glycols: glycosylated forms of -glycols: R-octane-1, 3-diol and its unsaturated form R-5-(Z)-octene-1, 3-diol, R-octane-1, 3-diol (Tables 3.2, 3.3).
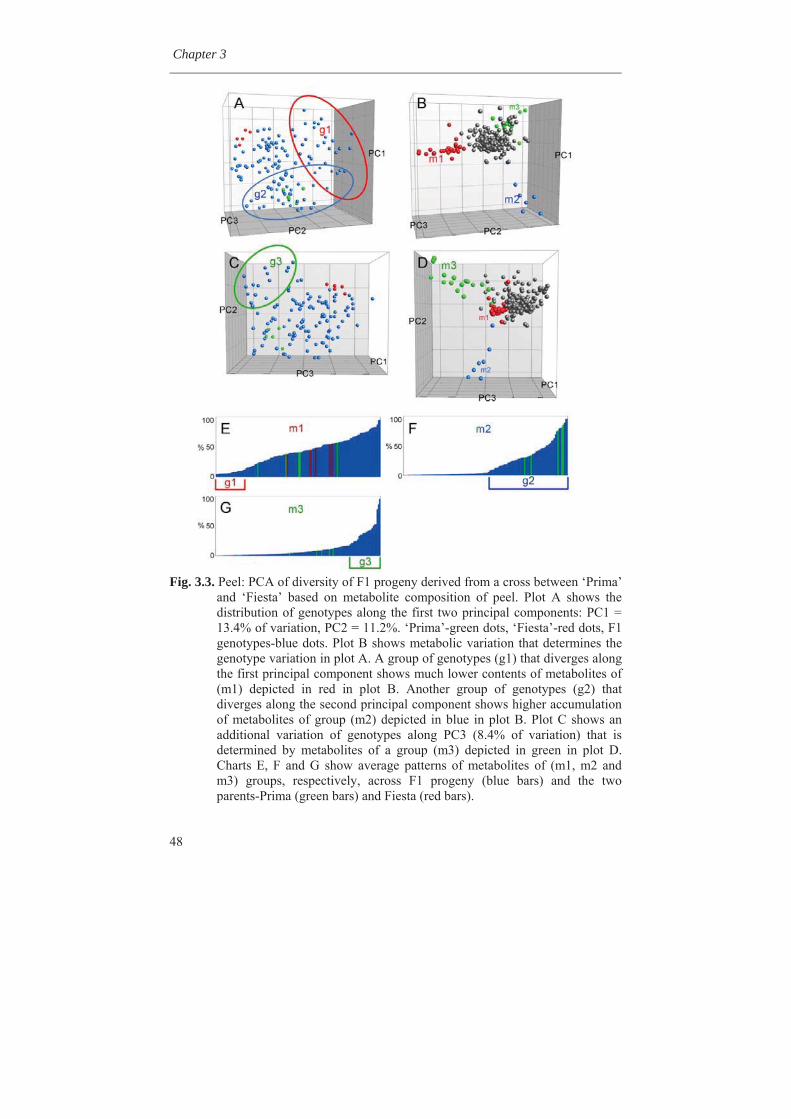
Chapter 3
48
Fig. 3.3. Peel: PCA of diversity of F1 progeny derived from a cross between ‘Prima’ and ‘Fiesta’ based on metabolite composition of peel. Plot A shows the distribution of genotypes along the first two principal components: PC1 = 13.4% of variation, PC2 = 11.2%. ‘Prima’-green dots, ‘Fiesta’-red dots, F1 genotypes-blue dots. Plot B shows metabolic variation that determines the genotype variation in plot A. A group of genotypes (g1) that diverges along the first principal component shows much lower contents of metabolites of (m1) depicted in red in plot B. Another group of genotypes (g2) that diverges along the second principal component shows higher accumulation of metabolites of group (m2) depicted in blue in plot B. Plot C shows an additional variation of genotypes along PC3 (8.4% of variation) that is determined by metabolites of a group (m3) depicted in green in plot D. Charts E, F and G show average patterns of metabolites of (m1, m2 and m3) groups, respectively, across F1 progeny (blue bars) and the two parents-Prima (green bars) and Fiesta (red bars).
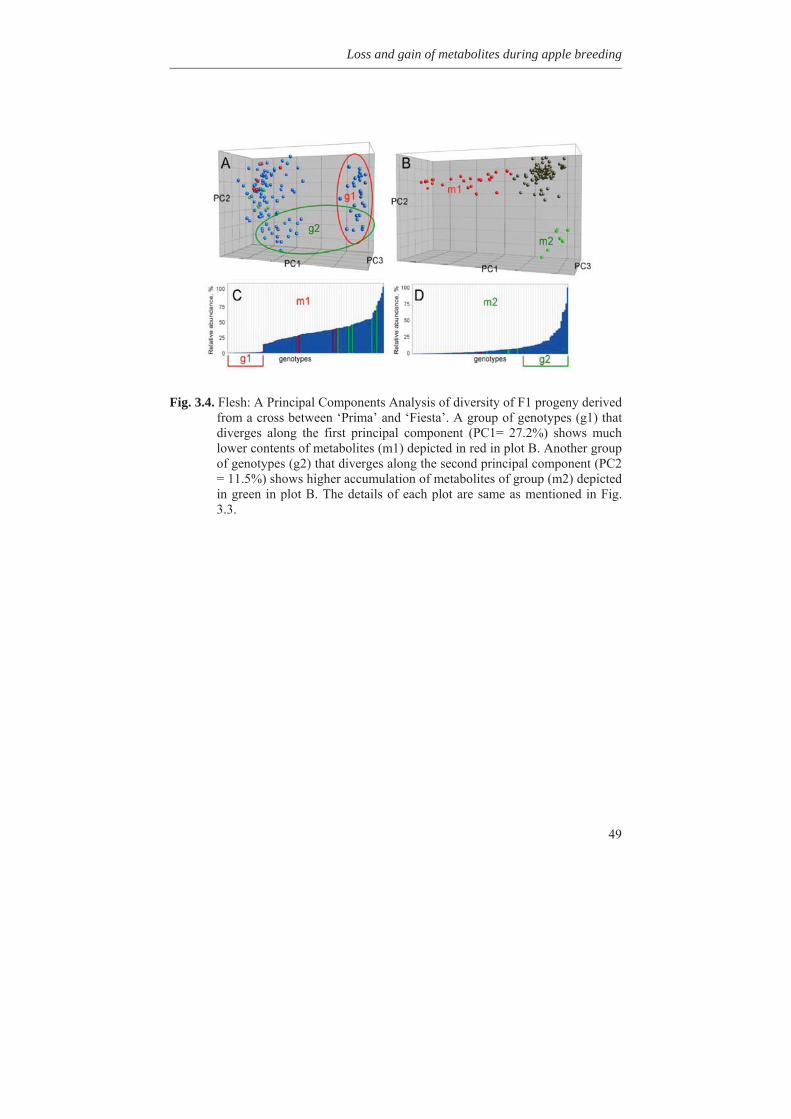
Loss and gain of metabolites during apple breeding
49
Fig. 3.4. Flesh: A Principal Components Analysis of diversity of F1 progeny derived from a cross between ‘Prima’ and ‘Fiesta’. A group of genotypes (g1) that diverges along the first principal component (PC1= 27.2%) shows much lower contents of metabolites (m1) depicted in red in plot B. Another group of genotypes (g2) that diverges along the second principal component (PC2 = 11.5%) shows higher accumulation of metabolites of group (m2) depicted in green in plot B. The details of each plot are same as mentioned in Fig. 3.3.
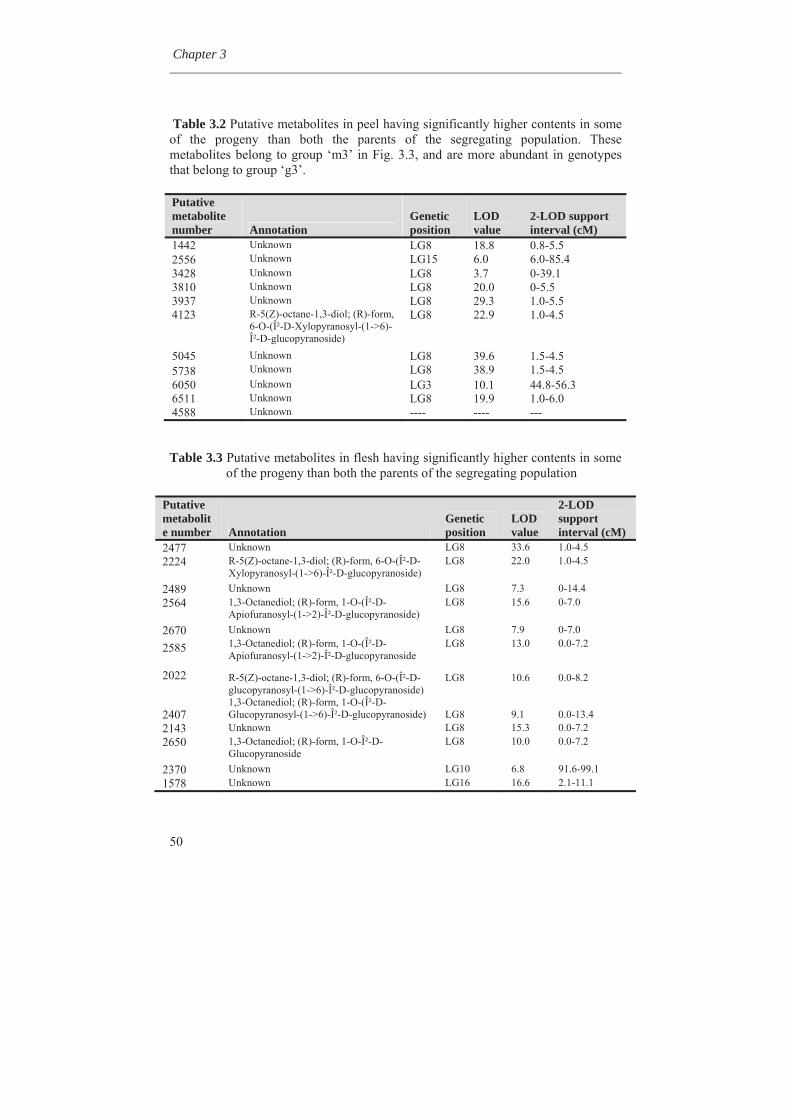
Chapter 3
50
Table 3.2 Putative metabolites in peel having significantly higher contents in some of the progeny than both the parents of the segregating population. These metabolites belong to group ‘m3’ in Fig. 3.3, and are more abundant in genotypes that belong to group ‘g3’.
Table 3.3 Putative metabolites in flesh having significantly higher contents in some of the progeny than both the parents of the segregating population
Putative metabolite number Annotation
Genetic position
LOD value
2-LOD support interval (cM)
2477 Unknown LG8 33.6 1.0-4.5 2224
R-5(Z)-octane-1,3-diol; (R)-form, 6-O-(β-D-Xylopyranosyl-(1->6)-β-D-glucopyranoside)
LG8 22.0 1.0-4.5
2489 Unknown LG8 7.3 0-14.4 2564
1,3-Octanediol; (R)-form, 1-O-(β-D-Apiofuranosyl-(1->2)-β-D-glucopyranoside)
LG8 15.6 0-7.0
2670 Unknown LG8 7.9 0-7.0
2585
1,3-Octanediol; (R)-form, 1-O-(β-D-Apiofuranosyl-(1->2)-β-D-glucopyranoside
LG8 13.0 0.0-7.2
2022
R-5(Z)-octane-1,3-diol; (R)-form, 6-O-(β-D-glucopyranosyl-(1->6)-β-D-glucopyranoside)
LG8
10.6
0.0-8.2
2407 1,3-Octanediol; (R)-form, 1-O-(β-D-Glucopyranosyl-(1->6)-β-D-glucopyranoside)
LG8
9.1
0.0-13.4
2143 Unknown LG8 15.3 0.0-7.2 2650
1,3-Octanediol; (R)-form, 1-O-β-D-Glucopyranoside
LG8 10.0 0.0-7.2
2370 Unknown LG10 6.8 91.6-99.1 1578 Unknown LG16 16.6 2.1-11.1
Putative metabolite number Annotation
Genetic position
LOD value
2-LOD support interval (cM)
1442 Unknown LG8 18.8 0.8-5.5 2556 Unknown LG15 6.0 6.0-85.4 3428 Unknown LG8 3.7 0-39.1 3810 Unknown LG8 20.0 0-5.5 3937 Unknown LG8 29.3 1.0-5.5 4123
R-5(Z)-octane-1,3-diol; (R)-form, 6-O-(β-D-Xylopyranosyl-(1->6)-β-D-glucopyranoside)
LG8 22.9 1.0-4.5
5045 Unknown LG8 39.6 1.5-4.5 5738 Unknown LG8 38.9 1.5-4.5 6050 Unknown LG3 10.1 44.8-56.3 6511 Unknown LG8 19.9 1.0-6.0 4588 Unknown ---- ---- ---
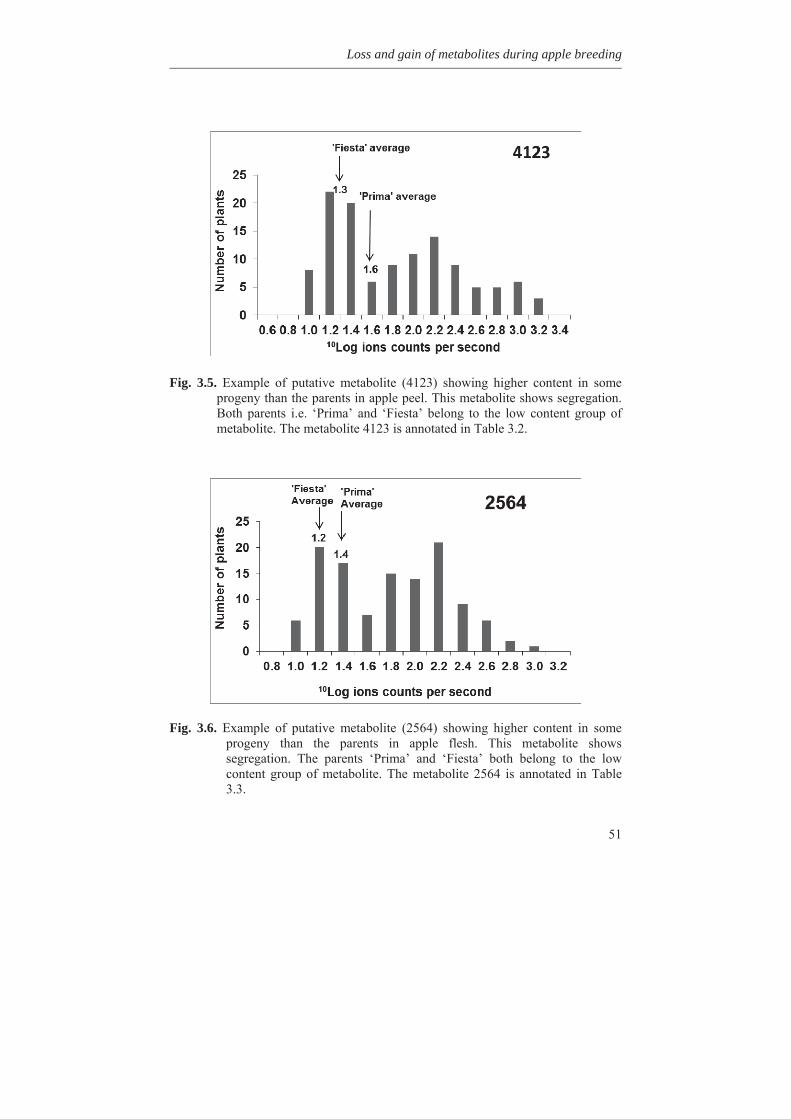
Loss and gain of metabolites during apple breeding
51
Fig. 3.5. Example of putative metabolite (4123) showing higher content in some progeny than the parents in apple peel. This metabolite shows segregation. Both parents i.e. ‘Prima’ and ‘Fiesta’ belong to the low content group of metabolite. The metabolite 4123 is annotated in Table 3.2.
Fig. 3.6. Example of putative metabolite (2564) showing higher content in some progeny than the parents in apple flesh. This metabolite shows segregation. The parents ‘Prima’ and ‘Fiesta’ both belong to the low content group of metabolite. The metabolite 2564 is annotated in Table 3.3.
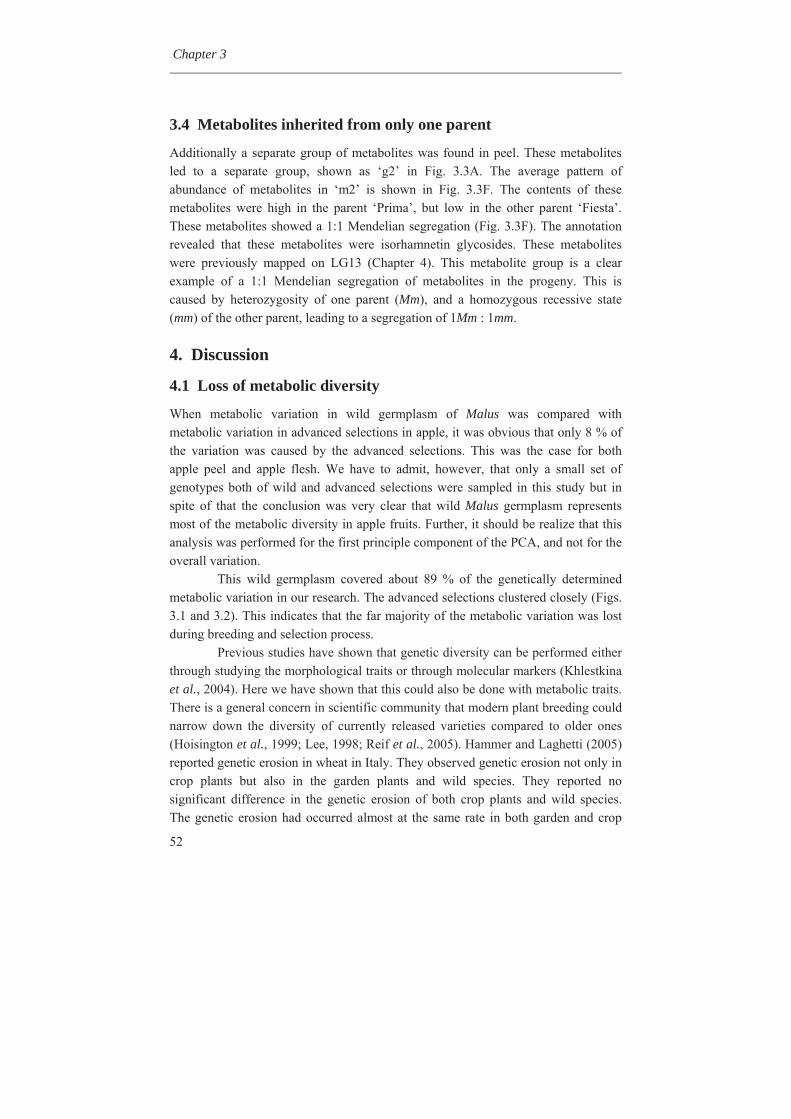
Chapter 3
52
3.4 Metabolites inherited from only one parent
Additionally a separate group of metabolites was found in peel. These metabolites led to a separate group, shown as ‘g2’ in Fig. 3.3A. The average pattern of abundance of metabolites in ‘m2’ is shown in Fig. 3.3F. The contents of these metabolites were high in the parent ‘Prima’, but low in the other parent ‘Fiesta’. These metabolites showed a 1:1 Mendelian segregation (Fig. 3.3F). The annotation revealed that these metabolites were isorhamnetin glycosides. These metabolites were previously mapped on LG13 (Chapter 4). This metabolite group is a clear example of a 1:1 Mendelian segregation of metabolites in the progeny. This is caused by heterozygosity of one parent (Mm), and a homozygous recessive state (mm) of the other parent, leading to a segregation of 1Mm : 1mm.
4. Discussion
4.1 Loss of metabolic diversity
When metabolic variation in wild germplasm of Malus was compared with metabolic variation in advanced selections in apple, it was obvious that only 8 % of the variation was caused by the advanced selections. This was the case for both apple peel and apple flesh. We have to admit, however, that only a small set of genotypes both of wild and advanced selections were sampled in this study but in spite of that the conclusion was very clear that wild Malus germplasm represents most of the metabolic diversity in apple fruits. Further, it should be realize that this analysis was performed for the first principle component of the PCA, and not for the overall variation.
This wild germplasm covered about 89 % of the genetically determined metabolic variation in our research. The advanced selections clustered closely (Figs. 3.1 and 3.2). This indicates that the far majority of the metabolic variation was lost during breeding and selection process.
Previous studies have shown that genetic diversity can be performed either through studying the morphological traits or through molecular markers (Khlestkina et al., 2004). Here we have shown that this could also be done with metabolic traits. There is a general concern in scientific community that modern plant breeding could narrow down the diversity of currently released varieties compared to older ones (Hoisington et al., 1999; Lee, 1998; Reif et al., 2005). Hammer and Laghetti (2005) reported genetic erosion in wheat in Italy. They observed genetic erosion not only in crop plants but also in the garden plants and wild species. They reported no significant difference in the genetic erosion of both crop plants and wild species. The genetic erosion had occurred almost at the same rate in both garden and crop
Loss and gain of metabolites during apple breeding
53
plants. There are several reports where studies were conducted on wheat varieties
showing that modern plant breeding causes this genetic erosion (Gregova et al., 1997; Donini et al., 1998). Comparable studies performed in barley have confirmed the differences in genetic diversity between landraces and cultivars, however, it appeared not to be as dramatic as has often been assumed (Backes et al., 2003; Petersen et al., 1994; Struss and Plieske, 1998).
4.2 Loss of metabolites during breeding Comparison of metabolite contents in the F1 progeny to the contents in the parents revealed that the contents of metabolites could drop strongly during one generation, both in peel and flesh. This is illustrated by Figs. 3.3 and 3.4. Analysis of mass fragmentation and retention time revealed that these metabolites belong to the phenylpropanoid pathway as explained in Chapter 4. The gene that caused this segregation is located at the top of linkage group 16 (Chapter 4). Both parental varieties, ‘Prima’ and ‘Fiesta’ harbour one dominant and one recessive allele of this gene (Mm), leading to a 3:1 segregation in the F1 progeny (1MM:2Mm:1mm). One quarter of the population inherited the two recessive alleles from the parents (mm), and lacked therefore the dominant allele that provided high contents of the phenolic compounds (Chapter 4). The 3:1 segregation can also be recognized in Figs. 3.3 and 3.4. This example illustrates that due to loss of a dominant allele, metabolic contents can drop strongly within one generation. In this case, the contents dropped by 0.62 on 10log scale, which is 4.2 fold decrease on the linear scale (Chapter 4).
As both parents contained one dominant allele, the contents of the phenolic compounds were similar in both parents. As a result, the parents grouped rather closely to one another in the PCA (Figs. 3.3, 3.4). The segregation in the F1 was apparent in the second PC in Fig. 3.4, but not in the first PC. This indicated that the metabolic diversity in the F1 population was not caused by the metabolites that segregated in the wild germplasm, but by other metabolites.
4.3 Gain of metabolites during breeding Remarkably, not only some metabolites were largely lost during one generation in some progeny, but other metabolites were up to 50 fold more abundant in some progeny genotypes compared to both parents. This was the case for 11 metabolites in the peel and 12 metabolites in the flesh (Tables 3.2, 3.3). The majority of these metabolites could be mapped genetically, and appeared to segregate as a monogenic trait, leading to sometimes very high LOD scores of up to 40. The causal locus was positioned at the top of LG8. The southern flanking marker of the mQTL region was
Chapter 3
54
a DArT marker 519609, located 4.5 cM from the top of LG8 (Schouten et al., 2011). The DNA sequence of this marker aligned well with a physical position on chromosome 8 of the DNA sequence of ‘Golden Delicious’ (Velasco et al., 2010).
Analysis of the masses and retention times indicated that the compounds that mapped at the top of LG8 were putatively identified as glycosylated forms of -glycols: R-octane-1, 3-diol and its unsaturated form R-5-(Z)-octene-1, 3-diol. R-octane-1,3-diol and R-5-(Z)-octene-1,3-diol have been previously identified and play an important role in some cider apple varieties as aroma precursors (Beuerle and Schwab, 1999; Dietrich et al., 1997). These compounds are produced from linoleic acid via -oxidation or lipoxygenase pathway both of which lead to biosynthesis of R-3-hydroxyoctanoyl-SCoA. These compounds can be further metabolized via two pathways: (i) to its S-enantiomer through 2(E)-octenoyl-SCoA or (ii) to 3-hydroxyoctanoic acid which is subsequently reduced to R-octane-1,3-diol (Beuerle and Schwab, 1999). The segregation of these metabolites in the F1 population analysed suggests that their accumulation was the result of inheritance of two recessive alleles of one of the genes involved in the first pathway, which subsequently redirects the flux to the second pathway leading to R-octane-1, 3-diol and R-5-(Z)-octene-1, 3-diol.
This research illustrates not only the strong genetic erosion in apple breeding regarding metabolic diversity, but also shows that inbreeding can lead to a strong increase of metabolites that were present at much lower contents in the parents and advanced selections, because of accumulation of recessive alleles during inbreeding.
Chapter 4
Genetical metabolomics in apple indicates an
mQTL hotspot for phenolic compounds on
Linkage Group 16
Sabaz Ali Khan1**, Pierre-Yves Chibon1**, Ric C.H. de Vos2,4,5, Bert A. Schipper2,4,5, Evert Walraven3, Jules Beekwilder2, Thijs van Dijk1, Richard Finkers2, R.G.F Visser, Eric W. van de Weg2, Arnaud Bovy2,5, Alessandro Cestaro6, Riccardo Velasco6, Evert Jacobsen2 and Henk J. Schouten2*
1Wageningen UR Plant Breeding, Graduate School Experimental Plant Sciences (EPS), Wageningen University and Research Centre, 6708 PB Wageningen, The Netherlands.
2Wageningen University and Research Centre, P.O. Box 16, 6700 AA, Wageningen, The Netherlands.
3Wageningen University and Research Centre, Lingewal 1, 6668 LA Randwijk, The Netherlands.
4Netherlands Metabolomics Centre, Einsteinweg 55, 2333 CC Leiden, The Netherlands.
5 Centre for BioSystems Genomics, P.O. Box 98, 6700 AB, Wageningen, The Netherlands.
6 Istituto Agrario San Michele all'Adige Research and Innovation Centre, Foundation Edmund Mach, Trento, Italy.
*For correspondence (fax +31 317 41 80 94; e-mail [email protected]).
** contributed equally to this work
Accepted in Journal of Experimental Botany
Chapter 4
56
Abstract
Apple (Malus x domestica Borkh) is among the main sources of phenolic compounds in the human diet. We investigated the genetic basis of the quantitative variations of these potentially beneficial compounds. A segregating population was used to map metabolite quantitative trait loci (mQTLs). Untargeted metabolic profiling of peel and flesh tissues of ripe fruits was applied by liquid chromatography-mass spectrometry (LC-MS), resulting in the detection of 418 metabolites in the peel and 254 in the flesh. In mQTL mapping using MetaNetwork, 669 significant mQTLs were detected: 488 in the peel and 181 in the flesh. Four linkage groups (LGs) i.e. LG1, LG8, LG13 and LG16 were found to contain mQTL hotspots, mainly regulating metabolites that belong to the phenylpropanoid-flavonoid pathway. The genetics of annotated metabolites was studied in more detail using MapQTL®. The quercetin conjugates had mQTLs on LG1 and LG13. The most important mQTL hotspot with the largest number of metabolites was detected on LG16: mQTLs for 33 peel-related and 17 flesh-related phenolic compounds. We located structural genes involved in the phenolic biosynthetic pathway, using the apple genome sequence. The structural gene leucoanthocyanidin reductase (MdLAR1) was in the mQTL hotspot on LG16, as were seven transcription factor genes. We believe this is the first time that a QTL analysis was performed on such a high number of metabolites in an outbreeding plant species.
Key words: Malus x domestica Borkh, untargeted and targeted mQTL mapping, genetical metabolomics, LC-MS, MetaNetwork, MapQTL.
Genetical metabolomics in apple
57
1. Introduction The fruit of apple (Malus x domestica Borkh) is a rich source of phytochemicals including phenolic compounds (Gerhauser, 2008). There is increasing evidence that apple is an important source for various compounds that are beneficial for human health (Han and Korban, 2009). Its consumption has been associated with a risk reduction of many human diseases, such as asthma, type-2 diabetes, thrombotic stroke, ischemic heart disease, and various cancers (Eberhardt et al., 2000; Mcghie et al., 2005). Some of the major phenolic compounds isolated and identified from apple are procyanidins, anthocyanins, chlorogenic acid, hydroxycinnamic acid, flavan-3-ols such as; (-)-epicatechin, (+)-catechin, and gallaocatechin; phloridzin and quercetin glycosides (Lu and Foo, 1997; Mazza and Velioglu, 1992; Lancaster, 1992; Nicolas et al., 1994; Treutter, 2001; Awad et al., 2000). The current study aims at elucidation of the genetic basis of metabolic variability in apple fruits. We initiated this study without any a priori with regard to the specific metabolites group. For that reasons we chose for large-scale LC-MS based metabolic profiling.
Metabolomics is defined as the large scale analysis of metabolites in an organism, and it concerns the simultaneous measurement of these metabolites in a given biological system (Dixon and Strack, 2003). Metabolomics is developing as an important functional genomics tool in crop plants, including fruit trees (Moco et al., 2006; Carrari and Fernie, 2006). Although QTLs have been mapped in cultivated apples for different traits such as disease resistance (Calenge et al., 2004; Calenge and Durel, 2006; Khan et al., 2006), fruit quality (Liebhard et al., 2003; King et al., 2001; Davey et al., 2006) and tree morphology (Kenis and Keulemans, 2007), there is only one report on the genetic mapping of a large number of metabolites in apple fruits, and, in that case, on volatiles (Dunemann et al., 2009).
In our study, the LC-MS metabolomics showed numerous metabolic compounds in the segregating F1 population, both in peel and in flesh of the fruits, allowing mQTL mapping. Standard QTL mapping software is designed to map individual traits, one by one, and is not suited to map hundreds of metabolites simultaneously. Therefore we decided to use the software MetaNetwork (Fu et al., 2007). MetaNetwork enables simultaneous genome-wide screening of numerous traits. MetaNetwork has been designed for self-pollinating species, and not for highly heterozygous, cross-pollinating parents that segregate in the F1, such as apple. Therefore we developed an approach to make MetaNetwork also suitable for a segregating F1 population.
MetaNetwork revealed clusters of mQTLs on the apple genome. We annotated the underlying LC-MS mass peaks of mQTL clusters, and aimed at studying the genetics of these metabolites in more detail, such as revealing the
Chapter 4
58
allelic contributions to traits, and perform co-factors analysis to filter out the effect of strong mQTLs. MetaNetwork appeared to be less suitable for these deeper analyses of individual metabolites. Therefore, we decided to use MapQTL® (Van Ooijn, 2009a) for this.
2. Materials and methods
2.1 Plant Materials
For mQTL mapping, a segregating F1 population from the cross ‘Prima’ x ‘Fiesta’ (PF) was used. This population was also used for the first international reference linkage map of apple covering all chromosomes (Maliepaard et al., 1998). In this study we used a subset of 113 progenies and both parents. For the F1 population, two trees per genotype were present.
2.2 Harvesting and storage of the apples
Mature fruits of all genotypes were harvested in September and October, 2008 in a trial orchard in Elst, The Netherlands. The maturity of the fruits was assessed by checking the colour of the peel, the taste, and the browning of the seeds. For each progeny, more than ten fruits from each of the two trees were harvested separately, while for the two parents ‘Prima’ and ‘Fiesta’ fruits from five trees (five replicates) were harvested. The fruits were harvested randomly from different sides of each individual tree to level out possible differences due to environmental factors such as light. Fruits were over sampled in the field to forestall the possible damage or decay during transit. After harvesting, fruits were immediately stored at 0 °C in a cold storage room to minimize enzymatic activities. Once fruits for all of the genotypes were harvested, these were shifted to a storage room at 20 °C for seven days. This was done to mimic the storage conditions in a consumer’s household.
2.3 Selection and grinding of apples
Samples of eight apples per genotype were selected. For the progeny genotypes, four apples from each of the two trees of one genotype were combined as one sample. For each sample, the individual fruit was cut transverse wise to obtain a 1-cm thick round slice, and the round slice was peeled. The peel (1.4 mm thick) was chopped into small pieces and snap-frozen in a separate beaker with liquid nitrogen. The core was removed from the flesh and a slice (3.2 mm thick) of the fresh flesh was also chopped into small pieces and snap-frozen. This was repeated for all of the eight apples of one genotype, and the samples from a tissue were pooled per genotype. The samples were then ground using an IKA coffee grinder (model A11 basic). The powder for the flesh and peel was collected separately in 50-ml falcon tubes and
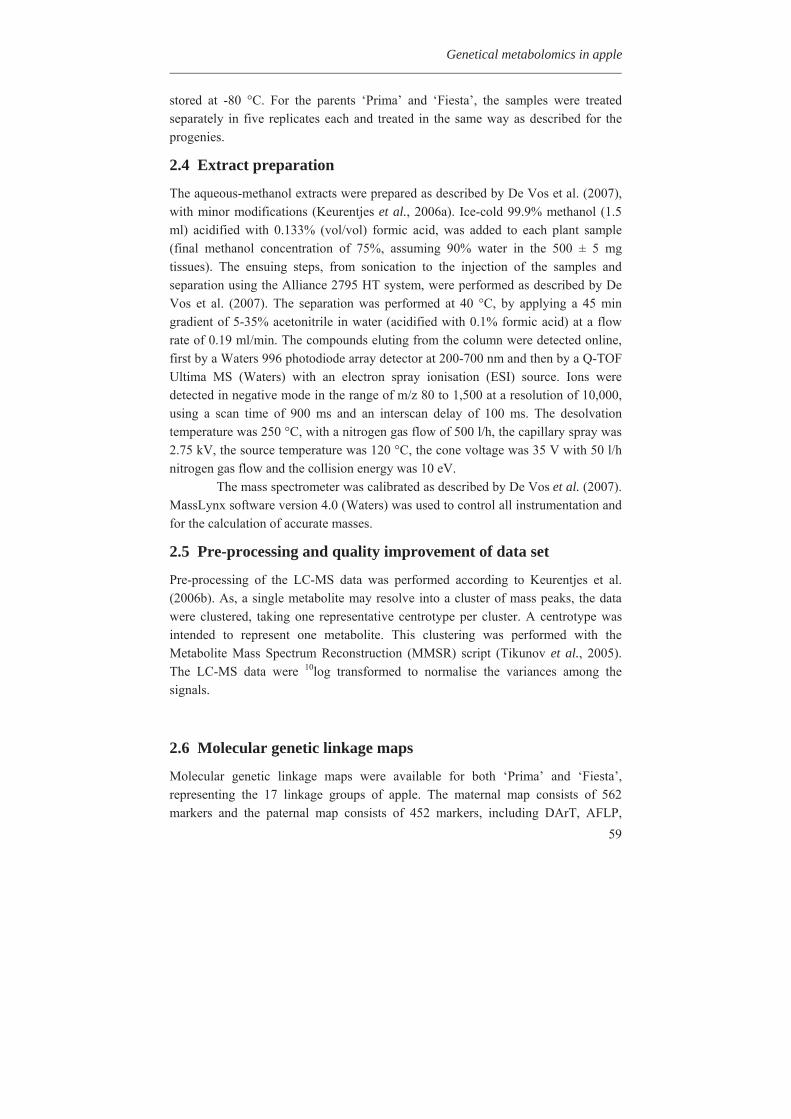
Genetical metabolomics in apple
59
stored at -80 °C. For the parents ‘Prima’ and ‘Fiesta’, the samples were treated separately in five replicates each and treated in the same way as described for the progenies.
2.4 Extract preparation
The aqueous-methanol extracts were prepared as described by De Vos et al. (2007), with minor modifications (Keurentjes et al., 2006a). Ice-cold 99.9% methanol (1.5 ml) acidified with 0.133% (vol/vol) formic acid, was added to each plant sample (final methanol concentration of 75%, assuming 90% water in the 500 ± 5 mg tissues). The ensuing steps, from sonication to the injection of the samples and separation using the Alliance 2795 HT system, were performed as described by De Vos et al. (2007). The separation was performed at 40 °C, by applying a 45 min gradient of 5-35% acetonitrile in water (acidified with 0.1% formic acid) at a flow rate of 0.19 ml/min. The compounds eluting from the column were detected online, first by a Waters 996 photodiode array detector at 200-700 nm and then by a Q-TOF Ultima MS (Waters) with an electron spray ionisation (ESI) source. Ions were detected in negative mode in the range of m/z 80 to 1,500 at a resolution of 10,000, using a scan time of 900 ms and an interscan delay of 100 ms. The desolvation temperature was 250 °C, with a nitrogen gas flow of 500 l/h, the capillary spray was 2.75 kV, the source temperature was 120 °C, the cone voltage was 35 V with 50 l/h nitrogen gas flow and the collision energy was 10 eV.
The mass spectrometer was calibrated as described by De Vos et al. (2007). MassLynx software version 4.0 (Waters) was used to control all instrumentation and for the calculation of accurate masses.
2.5 Pre-processing and quality improvement of data set
Pre-processing of the LC-MS data was performed according to Keurentjes et al. (2006b). As, a single metabolite may resolve into a cluster of mass peaks, the data were clustered, taking one representative centrotype per cluster. A centrotype was intended to represent one metabolite. This clustering was performed with the Metabolite Mass Spectrum Reconstruction (MMSR) script (Tikunov et al., 2005). The LC-MS data were 10log transformed to normalise the variances among the signals.
2.6 Molecular genetic linkage maps
Molecular genetic linkage maps were available for both ‘Prima’ and ‘Fiesta’, representing the 17 linkage groups of apple. The maternal map consists of 562 markers and the paternal map consists of 452 markers, including DArT, AFLP,
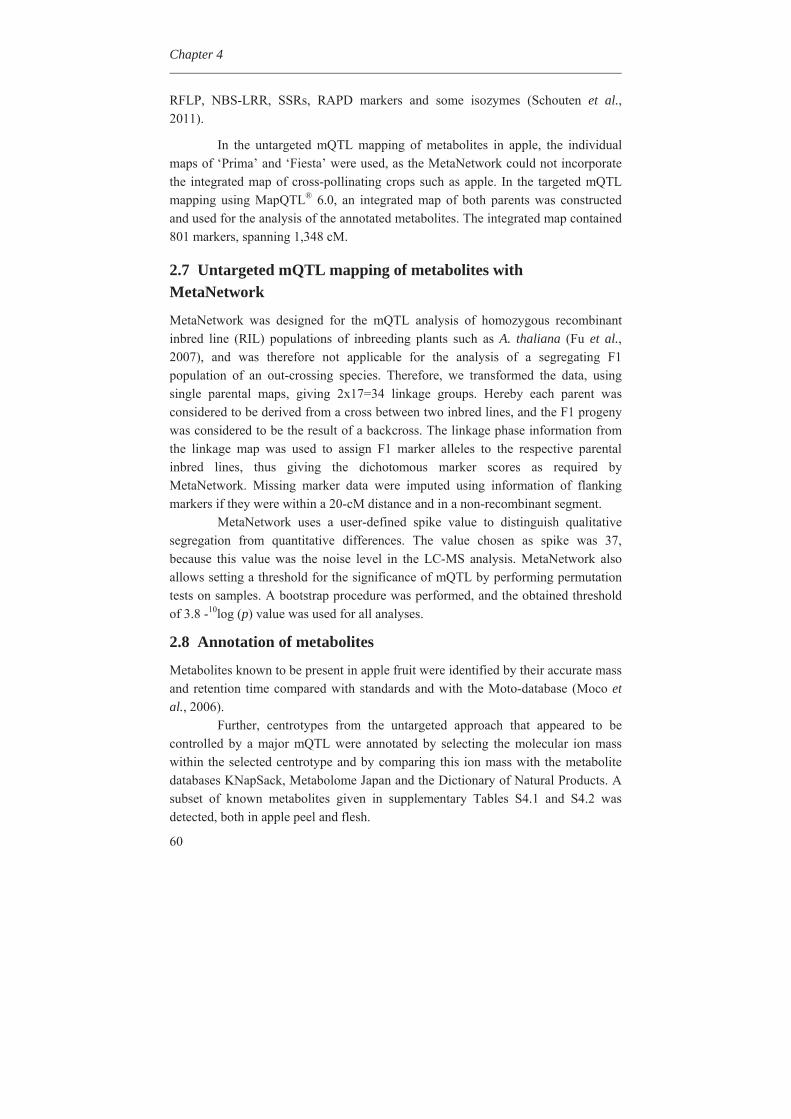
Chapter 4
60
RFLP, NBS-LRR, SSRs, RAPD markers and some isozymes (Schouten et al., 2011).
In the untargeted mQTL mapping of metabolites in apple, the individual maps of ‘Prima’ and ‘Fiesta’ were used, as the MetaNetwork could not incorporate the integrated map of cross-pollinating crops such as apple. In the targeted mQTL mapping using MapQTL® 6.0, an integrated map of both parents was constructed and used for the analysis of the annotated metabolites. The integrated map contained 801 markers, spanning 1,348 cM.
2.7 Untargeted mQTL mapping of metabolites with MetaNetwork
MetaNetwork was designed for the mQTL analysis of homozygous recombinant inbred line (RIL) populations of inbreeding plants such as A. thaliana (Fu et al., 2007), and was therefore not applicable for the analysis of a segregating F1 population of an out-crossing species. Therefore, we transformed the data, using single parental maps, giving 2x17=34 linkage groups. Hereby each parent was considered to be derived from a cross between two inbred lines, and the F1 progeny was considered to be the result of a backcross. The linkage phase information from the linkage map was used to assign F1 marker alleles to the respective parental inbred lines, thus giving the dichotomous marker scores as required by MetaNetwork. Missing marker data were imputed using information of flanking markers if they were within a 20-cM distance and in a non-recombinant segment.
MetaNetwork uses a user-defined spike value to distinguish qualitative segregation from quantitative differences. The value chosen as spike was 37, because this value was the noise level in the LC-MS analysis. MetaNetwork also allows setting a threshold for the significance of mQTL by performing permutation tests on samples. A bootstrap procedure was performed, and the obtained threshold of 3.8 -10log (p) value was used for all analyses.
2.8 Annotation of metabolites
Metabolites known to be present in apple fruit were identified by their accurate mass and retention time compared with standards and with the Moto-database (Moco et al., 2006).
Further, centrotypes from the untargeted approach that appeared to be controlled by a major mQTL were annotated by selecting the molecular ion mass within the selected centrotype and by comparing this ion mass with the metabolite databases KNapSack, Metabolome Japan and the Dictionary of Natural Products. A subset of known metabolites given in supplementary Tables S4.1 and S4.2 was detected, both in apple peel and flesh.
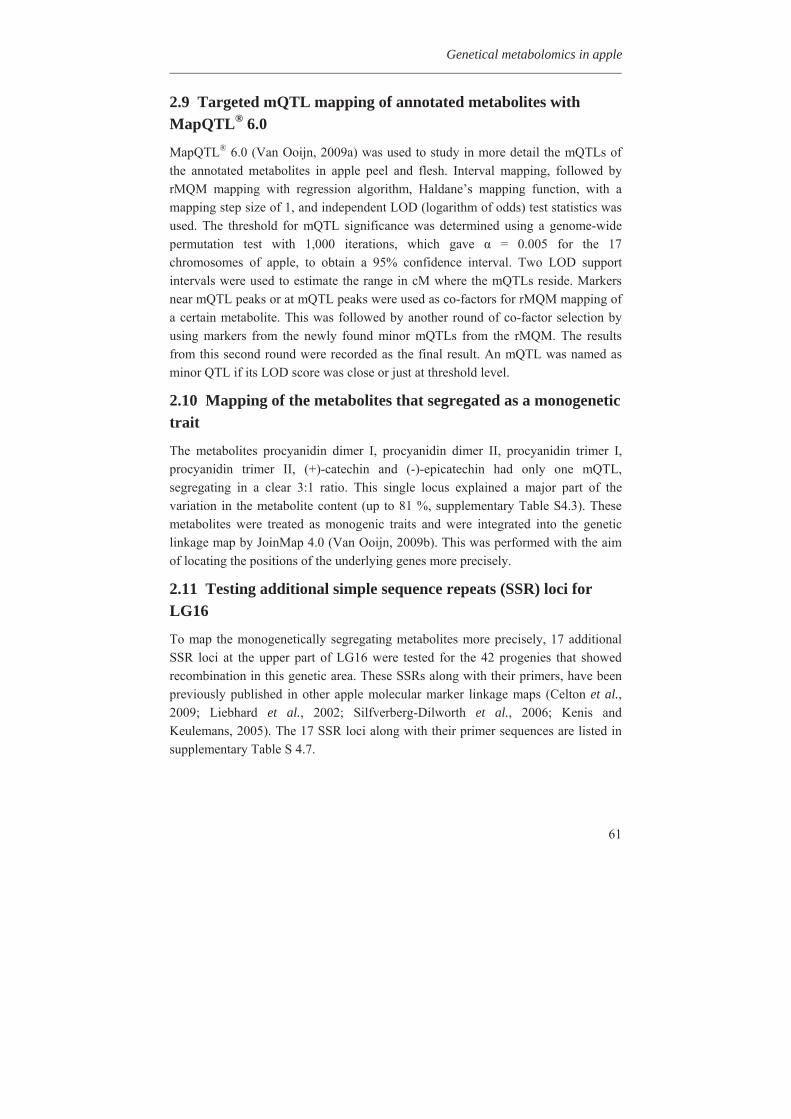
Genetical metabolomics in apple
61
2.9 Targeted mQTL mapping of annotated metabolites with MapQTL® 6.0
MapQTL® 6.0 (Van Ooijn, 2009a) was used to study in more detail the mQTLs of the annotated metabolites in apple peel and flesh. Interval mapping, followed by rMQM mapping with regression algorithm, Haldane’s mapping function, with a mapping step size of 1, and independent LOD (logarithm of odds) test statistics was used. The threshold for mQTL significance was determined using a genome-wide permutation test with 1,000 iterations, which gave = 0.005 for the 17 chromosomes of apple, to obtain a 95% confidence interval. Two LOD support intervals were used to estimate the range in cM where the mQTLs reside. Markers near mQTL peaks or at mQTL peaks were used as co-factors for rMQM mapping of a certain metabolite. This was followed by another round of co-factor selection by using markers from the newly found minor mQTLs from the rMQM. The results from this second round were recorded as the final result. An mQTL was named as minor QTL if its LOD score was close or just at threshold level.
2.10 Mapping of the metabolites that segregated as a monogenetic trait
The metabolites procyanidin dimer I, procyanidin dimer II, procyanidin trimer I, procyanidin trimer II, (+)-catechin and (-)-epicatechin had only one mQTL, segregating in a clear 3:1 ratio. This single locus explained a major part of the variation in the metabolite content (up to 81 %, supplementary Table S4.3). These metabolites were treated as monogenic traits and were integrated into the genetic linkage map by JoinMap 4.0 (Van Ooijn, 2009b). This was performed with the aim of locating the positions of the underlying genes more precisely.
2.11 Testing additional simple sequence repeats (SSR) loci for LG16
To map the monogenetically segregating metabolites more precisely, 17 additional SSR loci at the upper part of LG16 were tested for the 42 progenies that showed recombination in this genetic area. These SSRs along with their primers, have been previously published in other apple molecular marker linkage maps (Celton et al., 2009; Liebhard et al., 2002; Silfverberg-Dilworth et al., 2006; Kenis and Keulemans, 2005). The 17 SSR loci along with their primer sequences are listed in supplementary Table S 4.7.
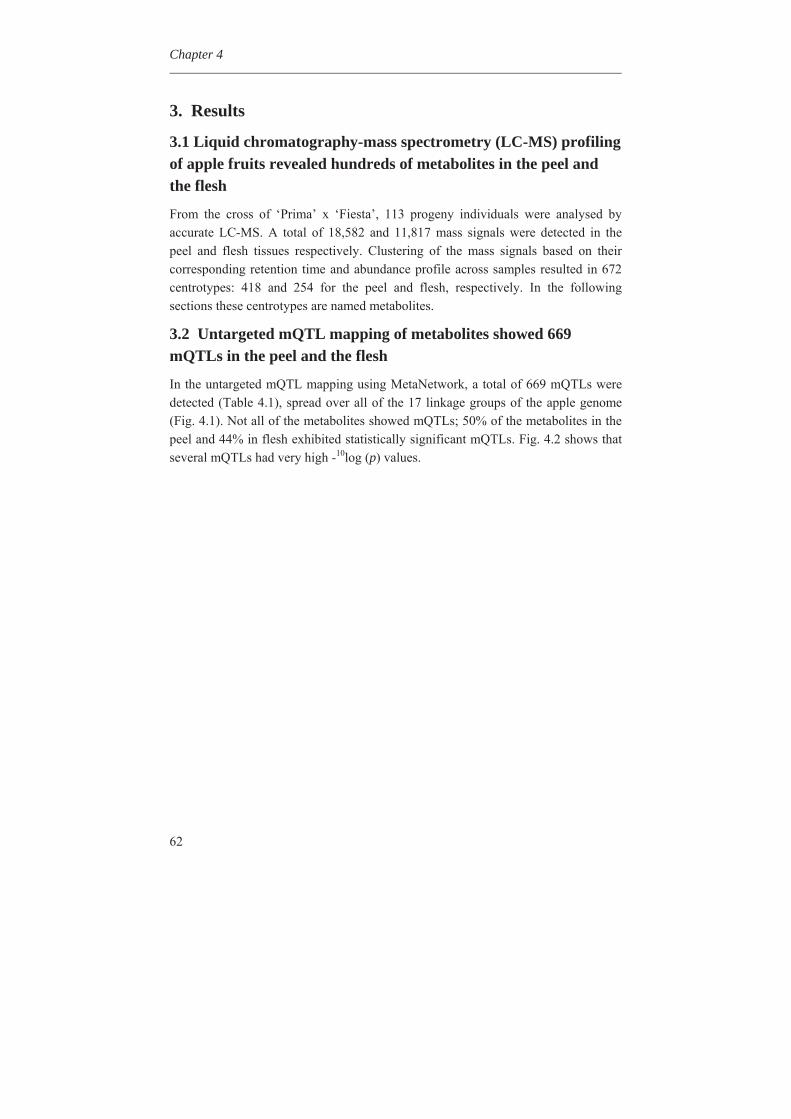
Chapter 4
62
3. Results
3.1 Liquid chromatography-mass spectrometry (LC-MS) profiling of apple fruits revealed hundreds of metabolites in the peel and the flesh
From the cross of ‘Prima’ x ‘Fiesta’, 113 progeny individuals were analysed by accurate LC-MS. A total of 18,582 and 11,817 mass signals were detected in the peel and flesh tissues respectively. Clustering of the mass signals based on their corresponding retention time and abundance profile across samples resulted in 672 centrotypes: 418 and 254 for the peel and flesh, respectively. In the following sections these centrotypes are named metabolites.
3.2 Untargeted mQTL mapping of metabolites showed 669 mQTLs in the peel and the flesh
In the untargeted mQTL mapping using MetaNetwork, a total of 669 mQTLs were detected (Table 4.1), spread over all of the 17 linkage groups of the apple genome (Fig. 4.1). Not all of the metabolites showed mQTLs; 50% of the metabolites in the peel and 44% in flesh exhibited statistically significant mQTLs. Fig. 4.2 shows that several mQTLs had very high -10log (p) values.
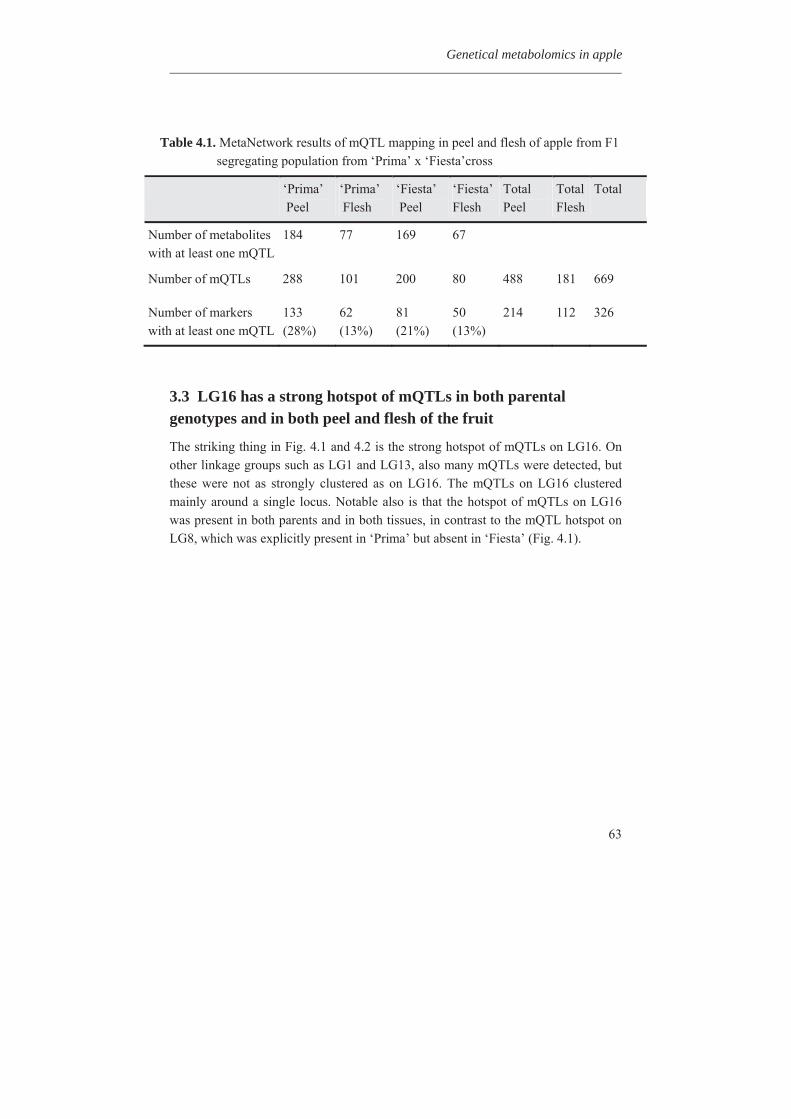
Genetical metabolomics in apple
63
Table 4.1. MetaNetwork results of mQTL mapping in peel and flesh of apple from F1 segregating population from ‘Prima’ x ‘Fiesta’cross
‘Prima’ Peel
‘Prima’ Flesh
‘Fiesta’ Peel
‘Fiesta’ Flesh
Total Peel
Total Flesh
Total
Number of metabolites with at least one mQTL
184 77 169 67
Number of mQTLs 288 101 200 80 488 181 669
Number of markers with at least one mQTL
133 (28%)
62 (13%)
81 (21%)
50 (13%)
214 112 326
3.3 LG16 has a strong hotspot of mQTLs in both parental genotypes and in both peel and flesh of the fruit
The striking thing in Fig. 4.1 and 4.2 is the strong hotspot of mQTLs on LG16. On other linkage groups such as LG1 and LG13, also many mQTLs were detected, but these were not as strongly clustered as on LG16. The mQTLs on LG16 clustered mainly around a single locus. Notable also is that the hotspot of mQTLs on LG16 was present in both parents and in both tissues, in contrast to the mQTL hotspot on LG8, which was explicitly present in ‘Prima’ but absent in ‘Fiesta’ (Fig. 4.1).
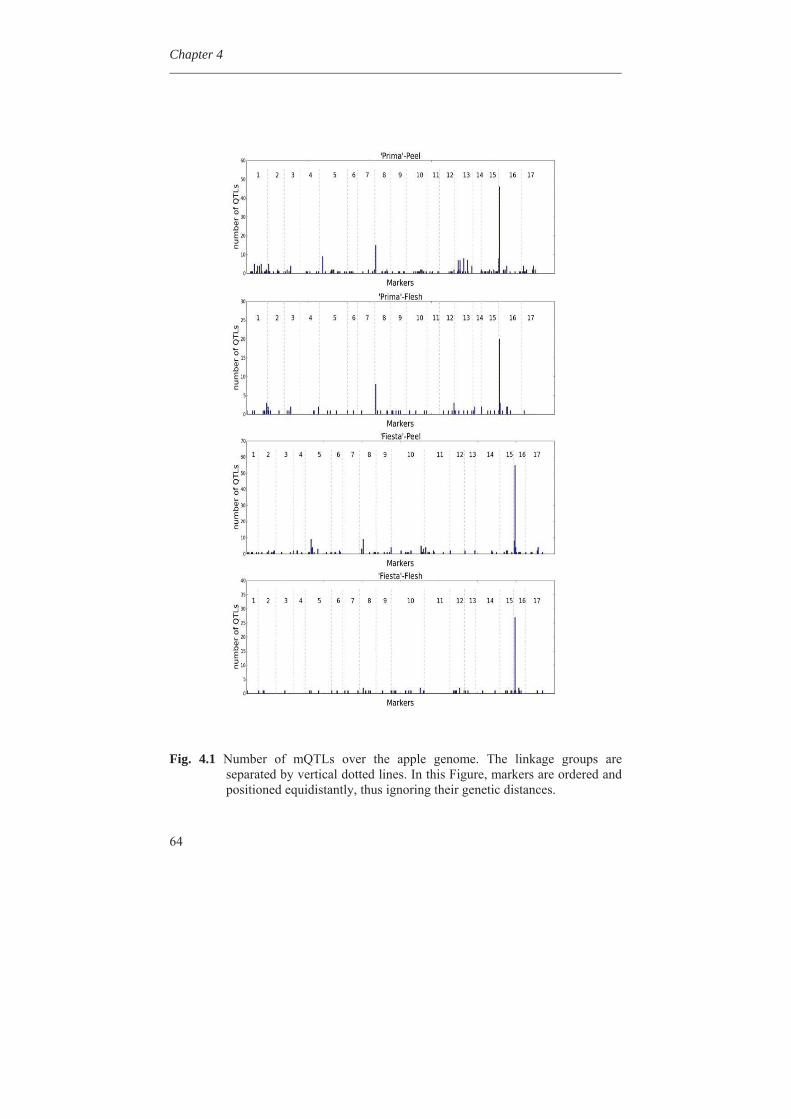
Chapter 4
64
Fig. 4.1 Number of mQTLs over the apple genome. The linkage groups are separated by vertical dotted lines. In this Figure, markers are ordered and positioned equidistantly, thus ignoring their genetic distances.
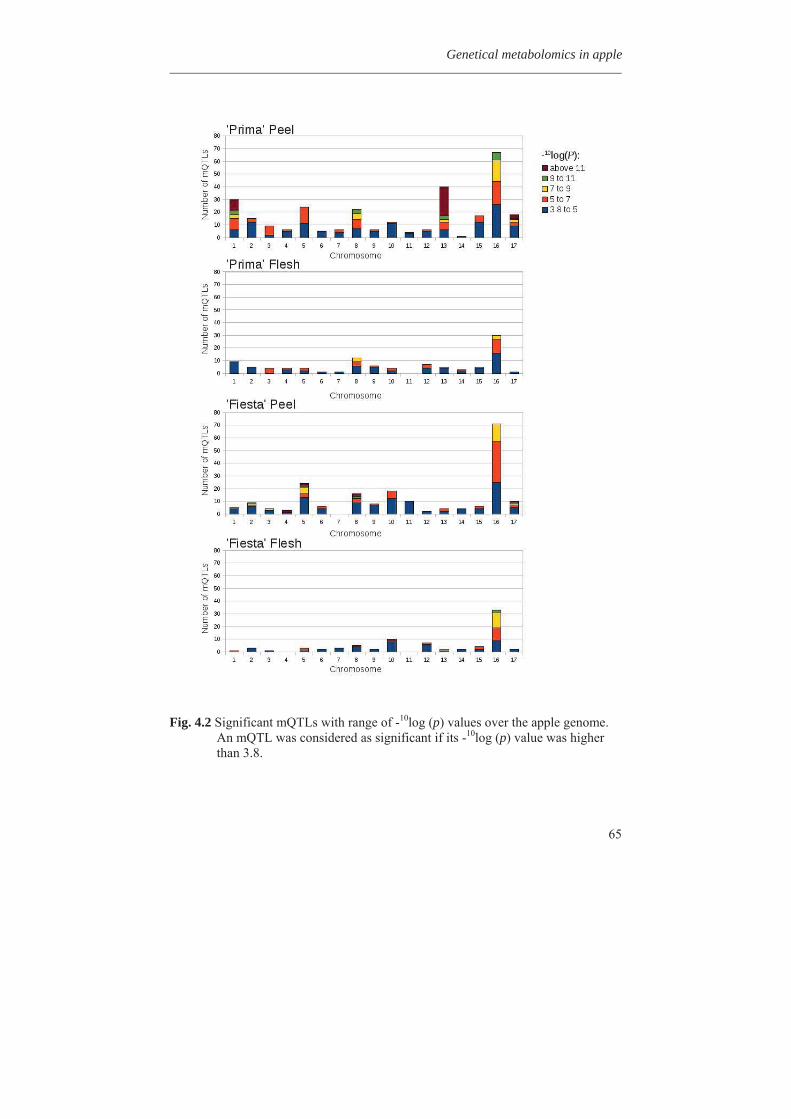
Genetical metabolomics in apple
65
Fig. 4.2 Significant mQTLs with range of -10log (p) values over the apple genome. An mQTL was considered as significant if its -10log (p) value was higher than 3.8.
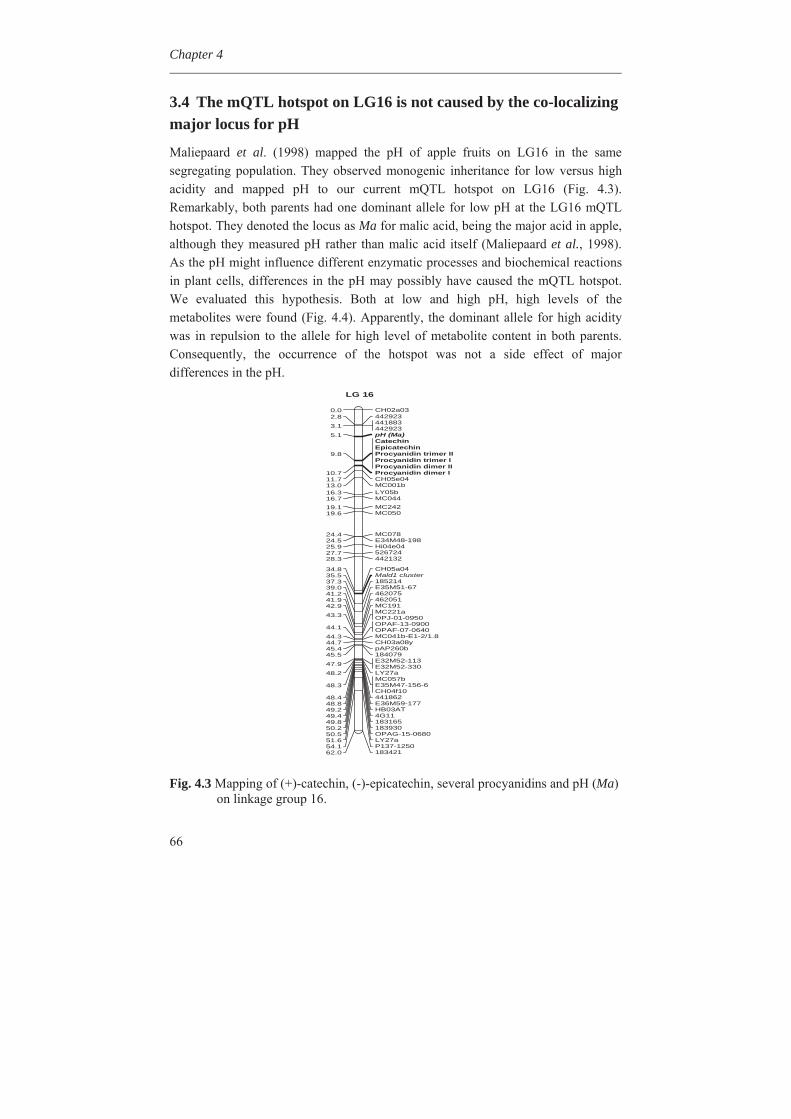
Chapter 4
66
3.4 The mQTL hotspot on LG16 is not caused by the co-localizing major locus for pH
Maliepaard et al. (1998) mapped the pH of apple fruits on LG16 in the same segregating population. They observed monogenic inheritance for low versus high acidity and mapped pH to our current mQTL hotspot on LG16 (Fig. 4.3). Remarkably, both parents had one dominant allele for low pH at the LG16 mQTL hotspot. They denoted the locus as Ma for malic acid, being the major acid in apple, although they measured pH rather than malic acid itself (Maliepaard et al., 1998). As the pH might influence different enzymatic processes and biochemical reactions in plant cells, differences in the pH may possibly have caused the mQTL hotspot. We evaluated this hypothesis. Both at low and high pH, high levels of the metabolites were found (Fig. 4.4). Apparently, the dominant allele for high acidity was in repulsion to the allele for high level of metabolite content in both parents. Consequently, the occurrence of the hotspot was not a side effect of major differences in the pH.
CH02a030.04429232.84418834429233.1pH (Ma)5.1CatechinEpicatechinProcyanidin trimer IIProcyanidin trimer IProcyanidin dimer II
9.8
Procyanidin dimer I10.7CH05e0411.7MC001b13.0LY05b16.3MC04416.7MC24219.1MC05019.6
MC07824.4E34M48-19824.5Hi04e0425.952672427.744213228.3
CH05a0434.8Mald1 cluster35.518521437.3E35M51-6739.046207541.246205141.9MC19142.9MC221aOPJ-01-095043.3OPAF-13-0900OPAF-07-064044.1MC041b-E1-2/1.844.3CH03a08y44.7pAP260b45.418407945.5E32M52-113E32M52-33047.9LY27a48.2MC057bE35M47-156-6CH04f10
48.3
44186248.4E36M59-17748.8HB03AT49.24G1149.418316549.818393050.2OPAG-15-068050.5LY27a51.6P137-125054.118342162.0
LG 16
Fig. 4.3 Mapping of (+)-catechin, (-)-epicatechin, several procyanidins and pH (Ma) on linkage group 16.
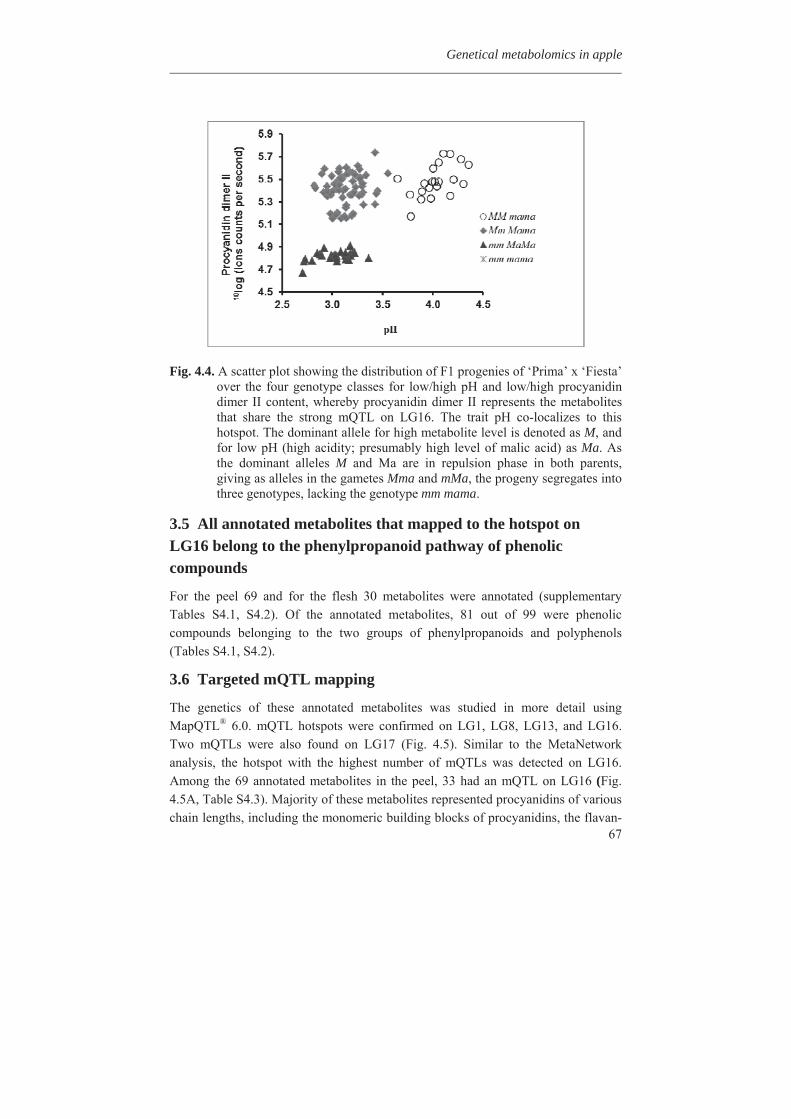
Genetical metabolomics in apple
67
Fig. 4.4. A scatter plot showing the distribution of F1 progenies of ‘Prima’ x ‘Fiesta’ over the four genotype classes for low/high pH and low/high procyanidin dimer II content, whereby procyanidin dimer II represents the metabolites that share the strong mQTL on LG16. The trait pH co-localizes to this hotspot. The dominant allele for high metabolite level is denoted as M, and for low pH (high acidity; presumably high level of malic acid) as Ma. As the dominant alleles M and Ma are in repulsion phase in both parents, giving as alleles in the gametes Mma and mMa, the progeny segregates into three genotypes, lacking the genotype mm mama.
3.5 All annotated metabolites that mapped to the hotspot on LG16 belong to the phenylpropanoid pathway of phenolic compounds
For the peel 69 and for the flesh 30 metabolites were annotated (supplementary Tables S4.1, S4.2). Of the annotated metabolites, 81 out of 99 were phenolic compounds belonging to the two groups of phenylpropanoids and polyphenols (Tables S4.1, S4.2).
3.6 Targeted mQTL mapping
The genetics of these annotated metabolites was studied in more detail using MapQTL® 6.0. mQTL hotspots were confirmed on LG1, LG8, LG13, and LG16. Two mQTLs were also found on LG17 (Fig. 4.5). Similar to the MetaNetwork analysis, the hotspot with the highest number of mQTLs was detected on LG16. Among the 69 annotated metabolites in the peel, 33 had an mQTL on LG16 (Fig. 4.5A, Table S4.3). Majority of these metabolites represented procyanidins of various chain lengths, including the monomeric building blocks of procyanidins, the flavan-
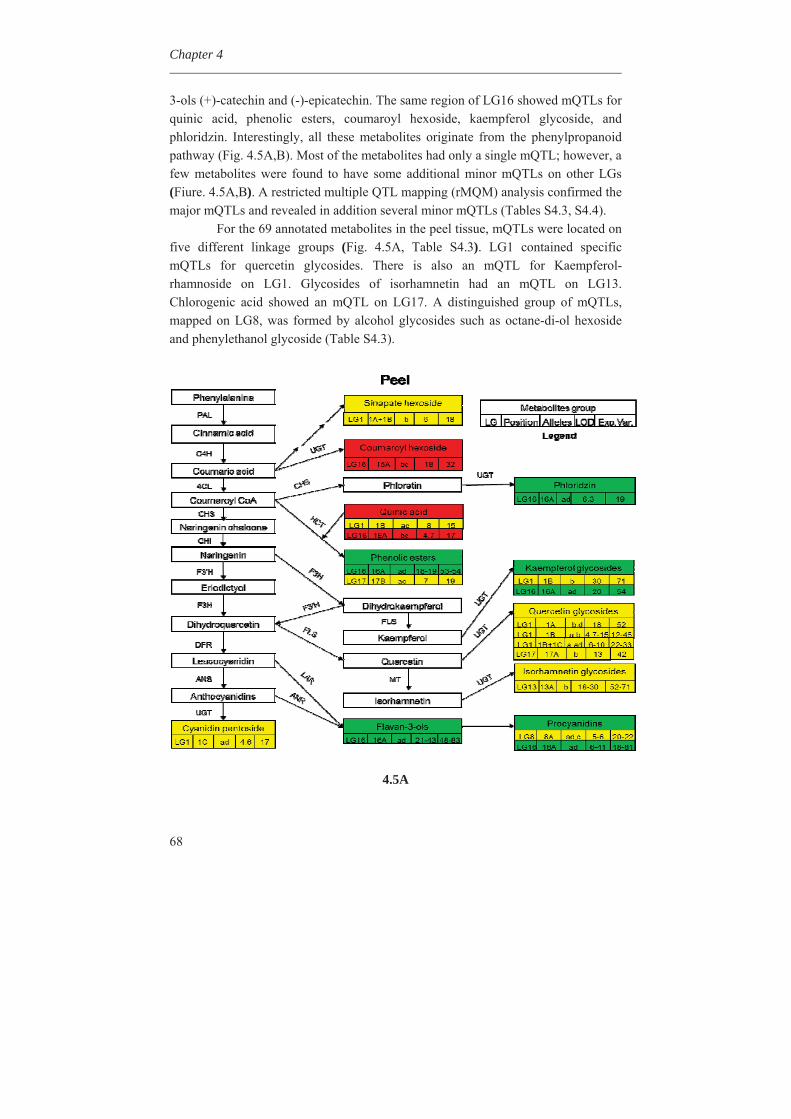
Chapter 4
68
3-ols (+)-catechin and (-)-epicatechin. The same region of LG16 showed mQTLs for quinic acid, phenolic esters, coumaroyl hexoside, kaempferol glycoside, and phloridzin. Interestingly, all these metabolites originate from the phenylpropanoid pathway (Fig. 4.5A,B). Most of the metabolites had only a single mQTL; however, a few metabolites were found to have some additional minor mQTLs on other LGs (Fiure. 4.5A,B). A restricted multiple QTL mapping (rMQM) analysis confirmed the major mQTLs and revealed in addition several minor mQTLs (Tables S4.3, S4.4).
For the 69 annotated metabolites in the peel tissue, mQTLs were located on five different linkage groups (Fig. 4.5A, Table S4.3). LG1 contained specific mQTLs for quercetin glycosides. There is also an mQTL for Kaempferol-rhamnoside on LG1. Glycosides of isorhamnetin had an mQTL on LG13. Chlorogenic acid showed an mQTL on LG17. A distinguished group of mQTLs, mapped on LG8, was formed by alcohol glycosides such as octane-di-ol hexoside and phenylethanol glycoside (Table S4.3).
4.5A
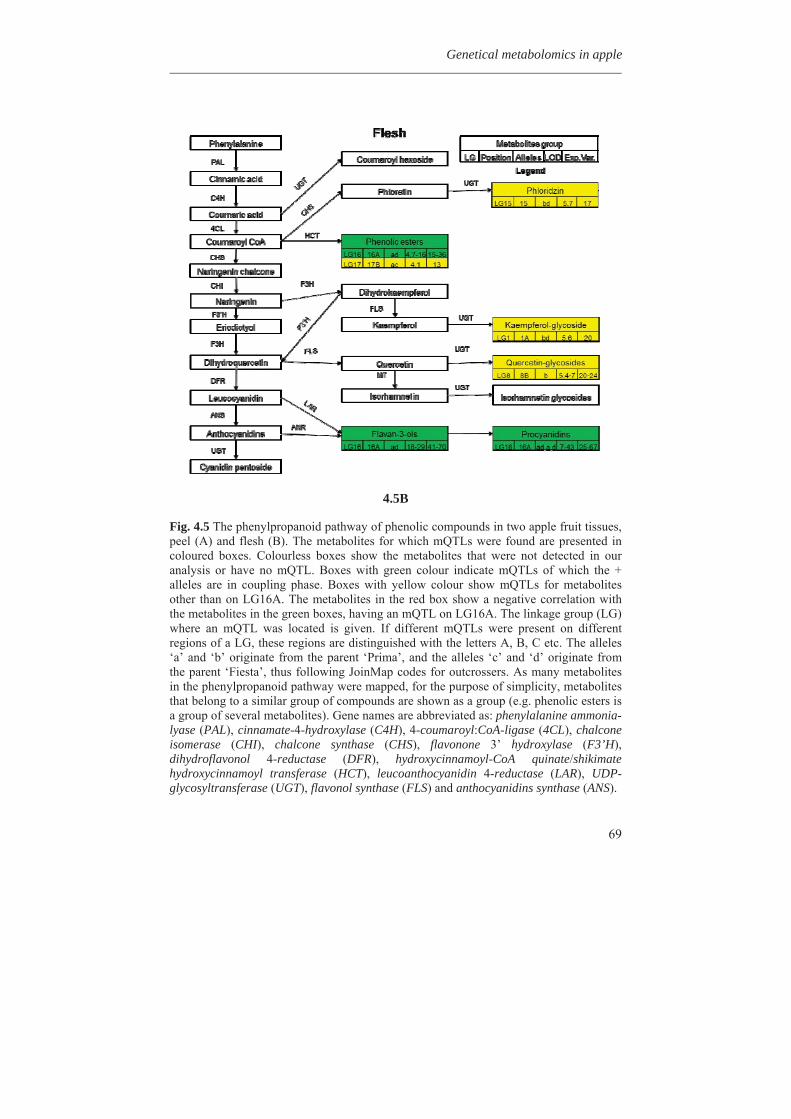
Genetical metabolomics in apple
69
4.5B
Fig. 4.5 The phenylpropanoid pathway of phenolic compounds in two apple fruit tissues, peel (A) and flesh (B). The metabolites for which mQTLs were found are presented in coloured boxes. Colourless boxes show the metabolites that were not detected in our analysis or have no mQTL. Boxes with green colour indicate mQTLs of which the + alleles are in coupling phase. Boxes with yellow colour show mQTLs for metabolites other than on LG16A. The metabolites in the red box show a negative correlation with the metabolites in the green boxes, having an mQTL on LG16A. The linkage group (LG) where an mQTL was located is given. If different mQTLs were present on different regions of a LG, these regions are distinguished with the letters A, B, C etc. The alleles ‘a’ and ‘b’ originate from the parent ‘Prima’, and the alleles ‘c’ and ‘d’ originate from the parent ‘Fiesta’, thus following JoinMap codes for outcrossers. As many metabolites in the phenylpropanoid pathway were mapped, for the purpose of simplicity, metabolites that belong to a similar group of compounds are shown as a group (e.g. phenolic esters is a group of several metabolites). Gene names are abbreviated as: phenylalanine ammonia-lyase (PAL), cinnamate-4-hydroxylase (C4H), 4-coumaroyl:CoA-ligase (4CL), chalcone isomerase (CHI), chalcone synthase (CHS), flavonone 3’ hydroxylase (F3’H), dihydroflavonol 4-reductase (DFR), hydroxycinnamoyl-CoA quinate/shikimate hydroxycinnamoyl transferase (HCT), leucoanthocyanidin 4-reductase (LAR), UDP-glycosyltransferase (UGT), flavonol synthase (FLS) and anthocyanidins synthase (ANS).
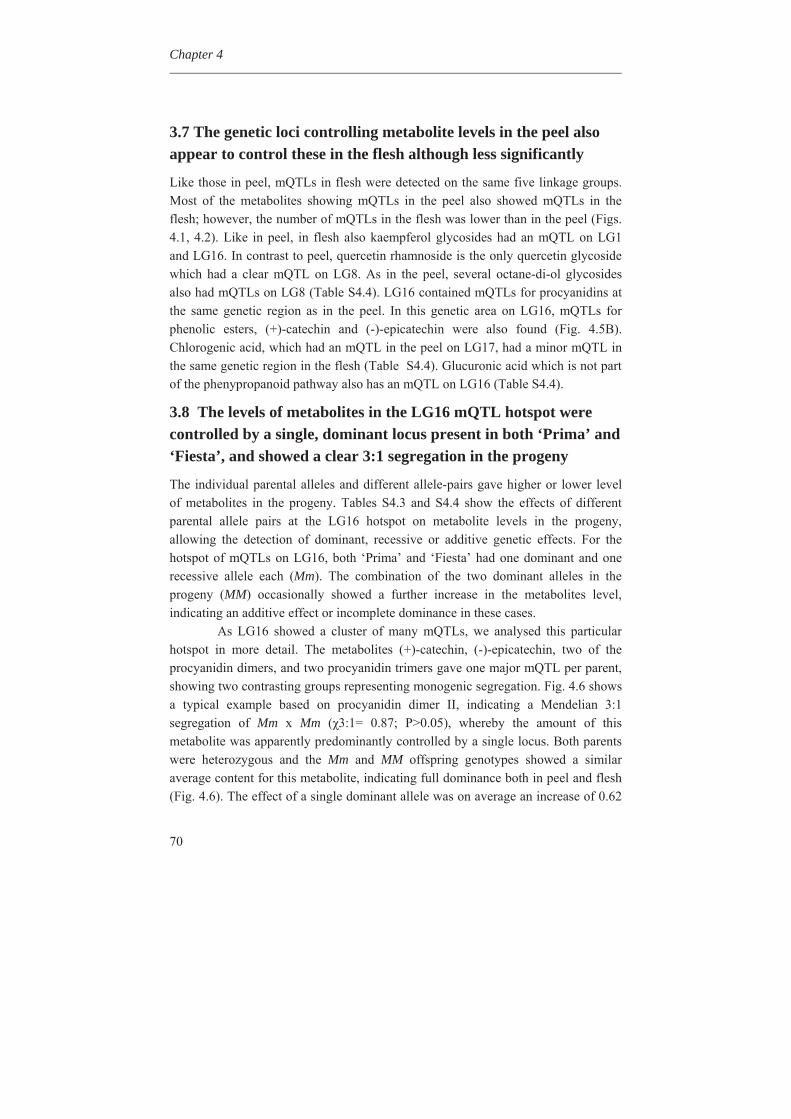
Chapter 4
70
3.7 The genetic loci controlling metabolite levels in the peel also appear to control these in the flesh although less significantly
Like those in peel, mQTLs in flesh were detected on the same five linkage groups. Most of the metabolites showing mQTLs in the peel also showed mQTLs in the flesh; however, the number of mQTLs in the flesh was lower than in the peel (Figs. 4.1, 4.2). Like in peel, in flesh also kaempferol glycosides had an mQTL on LG1 and LG16. In contrast to peel, quercetin rhamnoside is the only quercetin glycoside which had a clear mQTL on LG8. As in the peel, several octane-di-ol glycosides also had mQTLs on LG8 (Table S4.4). LG16 contained mQTLs for procyanidins at the same genetic region as in the peel. In this genetic area on LG16, mQTLs for phenolic esters, (+)-catechin and (-)-epicatechin were also found (Fig. 4.5B). Chlorogenic acid, which had an mQTL in the peel on LG17, had a minor mQTL in the same genetic region in the flesh (Table S4.4). Glucuronic acid which is not part of the phenypropanoid pathway also has an mQTL on LG16 (Table S4.4).
3.8 The levels of metabolites in the LG16 mQTL hotspot were controlled by a single, dominant locus present in both ‘Prima’ and ‘Fiesta’, and showed a clear 3:1 segregation in the progeny
The individual parental alleles and different allele-pairs gave higher or lower level of metabolites in the progeny. Tables S4.3 and S4.4 show the effects of different parental allele pairs at the LG16 hotspot on metabolite levels in the progeny, allowing the detection of dominant, recessive or additive genetic effects. For the hotspot of mQTLs on LG16, both ‘Prima’ and ‘Fiesta’ had one dominant and one recessive allele each (Mm). The combination of the two dominant alleles in the progeny (MM) occasionally showed a further increase in the metabolites level, indicating an additive effect or incomplete dominance in these cases.
As LG16 showed a cluster of many mQTLs, we analysed this particular hotspot in more detail. The metabolites (+)-catechin, (-)-epicatechin, two of the procyanidin dimers, and two procyanidin trimers gave one major mQTL per parent, showing two contrasting groups representing monogenic segregation. Fig. 4.6 shows a typical example based on procyanidin dimer II, indicating a Mendelian 3:1 segregation of Mm x Mm ( 3:1= 0.87; P>0.05), whereby the amount of this metabolite was apparently predominantly controlled by a single locus. Both parents were heterozygous and the Mm and MM offspring genotypes showed a similar average content for this metabolite, indicating full dominance both in peel and flesh (Fig. 4.6). The effect of a single dominant allele was on average an increase of 0.62
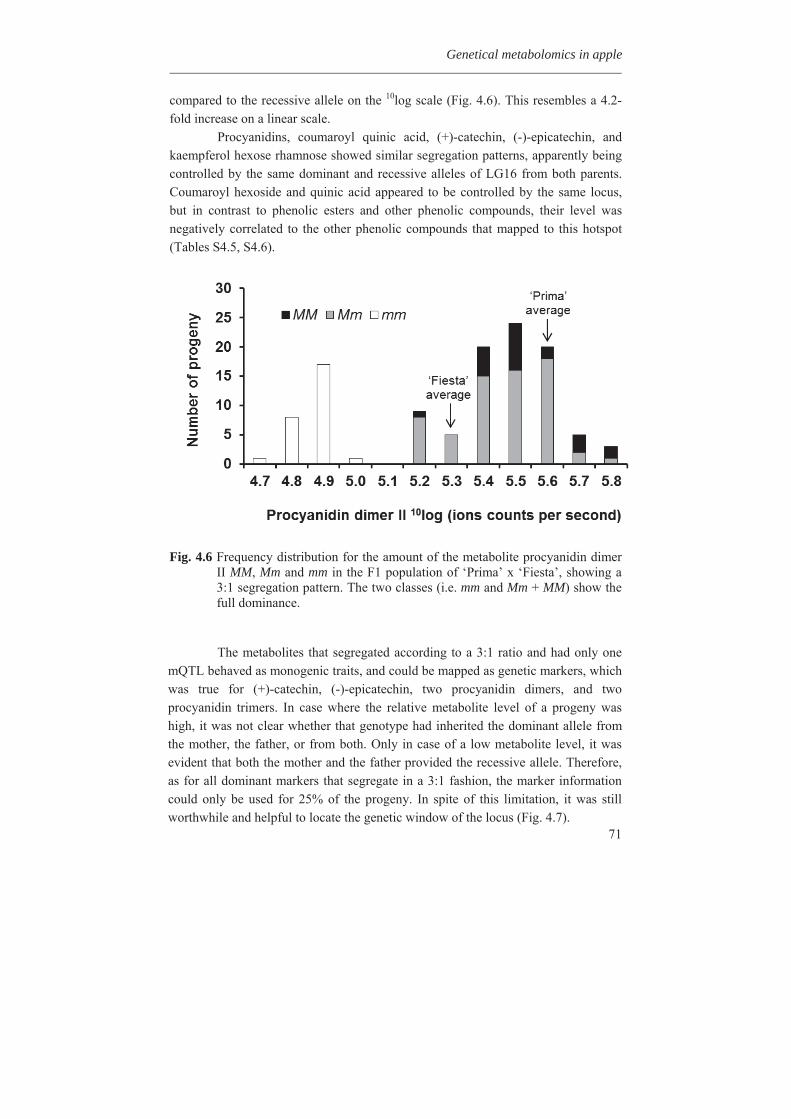
Genetical metabolomics in apple
71
compared to the recessive allele on the 10log scale (Fig. 4.6). This resembles a 4.2-fold increase on a linear scale.
Procyanidins, coumaroyl quinic acid, (+)-catechin, (-)-epicatechin, and kaempferol hexose rhamnose showed similar segregation patterns, apparently being controlled by the same dominant and recessive alleles of LG16 from both parents. Coumaroyl hexoside and quinic acid appeared to be controlled by the same locus, but in contrast to phenolic esters and other phenolic compounds, their level was negatively correlated to the other phenolic compounds that mapped to this hotspot (Tables S4.5, S4.6).
Fig. 4.6 Frequency distribution for the amount of the metabolite procyanidin dimer
II MM, Mm and mm in the F1 population of ‘Prima’ x ‘Fiesta’, showing a 3:1 segregation pattern. The two classes (i.e. mm and Mm + MM) show the full dominance.
The metabolites that segregated according to a 3:1 ratio and had only one mQTL behaved as monogenic traits, and could be mapped as genetic markers, which was true for (+)-catechin, (-)-epicatechin, two procyanidin dimers, and two procyanidin trimers. In case where the relative metabolite level of a progeny was high, it was not clear whether that genotype had inherited the dominant allele from the mother, the father, or from both. Only in case of a low metabolite level, it was evident that both the mother and the father provided the recessive allele. Therefore, as for all dominant markers that segregate in a 3:1 fashion, the marker information could only be used for 25% of the progeny. In spite of this limitation, it was still worthwhile and helpful to locate the genetic window of the locus (Fig. 4.7).
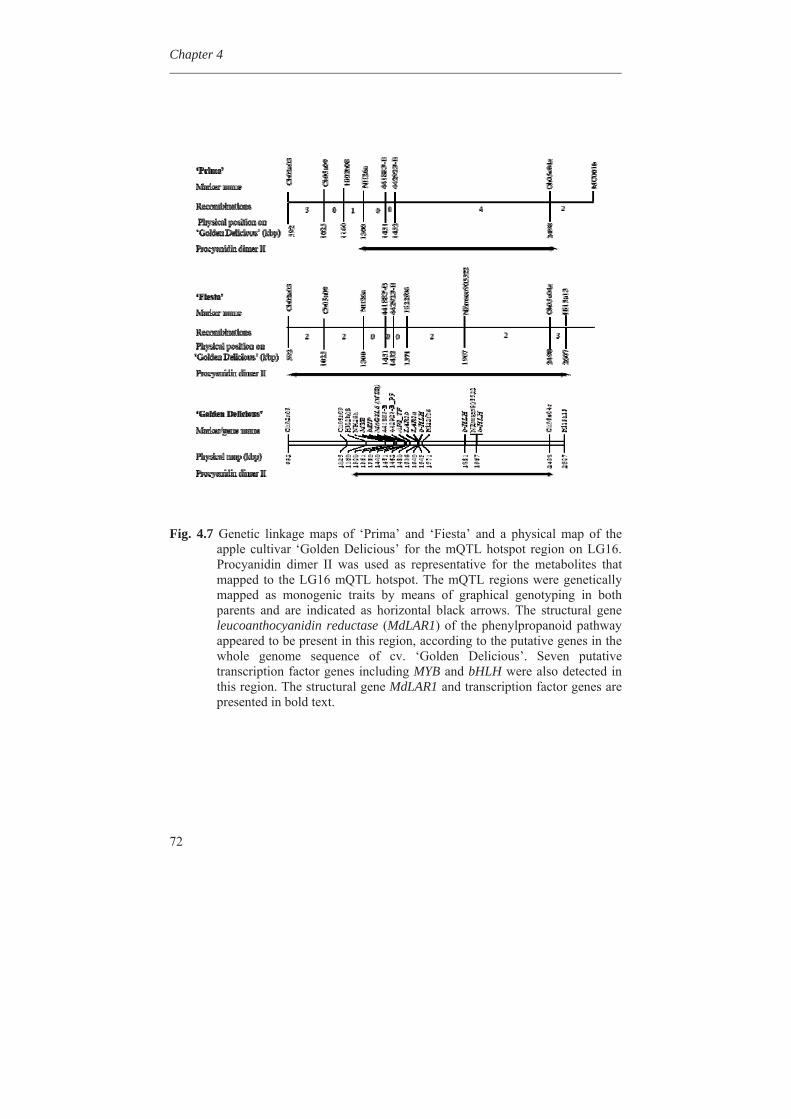
Chapter 4
72
Fig. 4.7 Genetic linkage maps of ‘Prima’ and ‘Fiesta’ and a physical map of the apple cultivar ‘Golden Delicious’ for the mQTL hotspot region on LG16. Procyanidin dimer II was used as representative for the metabolites that mapped to the LG16 mQTL hotspot. The mQTL regions were genetically mapped as monogenic traits by means of graphical genotyping in both parents and are indicated as horizontal black arrows. The structural gene leucoanthocyanidin reductase (MdLAR1) of the phenylpropanoid pathway appeared to be present in this region, according to the putative genes in the whole genome sequence of cv. ‘Golden Delicious’. Seven putative transcription factor genes including MYB and bHLH were also detected in this region. The structural gene MdLAR1 and transcription factor genes are presented in bold text.
Genetical metabolomics in apple
73
For more-detailed mapping of this locus on LG16, additional SSR markers in the LG16 mQTL hotspot were mapped. Several of the new SSR loci mapped in the genetic window (Fig. 4.7). The names and allelic sizes of these markers are given in Table S4.7. Graphical genotyping of the metabolite ‘procyanidin dimer II’ revealed that the gene causing the mQTL hotspot on LG16 is located between the locus NH26a and the locus Ch05e04 in ‘Prima’, and between the locus Ch02a03 and locus Hi15a13 in ‘Fiesta’ (Fig. 4.7).
3.9 The structural gene MdLAR1 and seven transcription factors are at the mQTL hotspot
To find the position of the orthologous genes on the 17 chromosomes of apple, the DNA sequences of the structural genes of A. thaliana (Table 4.2) were aligned to the entire genome sequence of the apple cv. ‘Golden Delicious’ (Velasco et al., 2010). The results of these alignments are shown in Table 4.2 and also in Figs. 4.5 and 4.7. Among the fifteen different structural genes, only the structural gene MdLAR1 was found in the mQTL hotspot on LG16 (Figs. 4.5, 4.7). A closer look revealed that the published ‘Golden Delicious’ genome sequence had at this locus at least five LAR-like sequences in overlapping contigs. However, a sequence homology search using the EMBOSS software package revealed that these sequences were identical or highly homologous, and actually only two different genomic sequences were found. These two sequences probably represent the two alleles for the MdLAR1 gene. Apart from MdLAR1, seven putative transcription factor genes were also identified in the genetic window of the mQTL hotspot on LG16 (Table 4.3). Two of these belong to MYB class, four to basic helix-loop-helix (bHLH) class, one to bZIP and one to AP2 class of transcription factor genes.
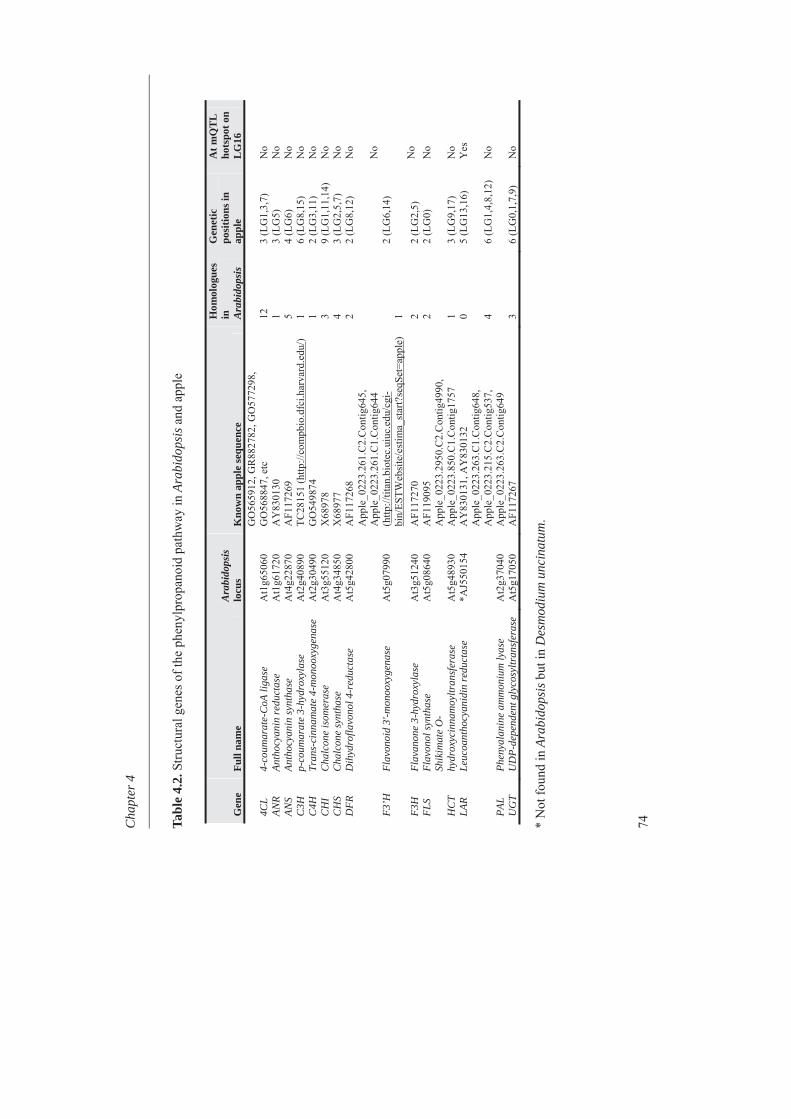
Cha
pter
4
74
Ta
ble
4.2.
Stru
ctur
al g
enes
of t
he p
heny
lpro
pano
id p
athw
ay in
Ara
bido
psis
and
app
le
* N
ot fo
und
in A
rabi
dops
is b
ut in
Des
mod
ium
unc
inat
um.
Gen
e Fu
ll na
me
Ara
bido
psis
lo
cus
Kno
wn
appl
e se
quen
ce
Hom
olog
ues
in
Ara
bido
psis
Gen
etic
po
sitio
ns in
ap
ple
At m
QT
L
hots
pot o
n L
G16
4CL
4-co
umar
ate-
CoA
liga
se
At1
g650
60
GO
5659
12, G
R88
2782
, GO
5772
98,
GO
5688
47, e
tc
12
3 (L
G1,
3,7)
N
o AN
R An
thoc
yani
n re
duct
ase
At1
g617
20
AY
8301
30
1 3
(LG
5)
No
ANS
Anth
ocya
nin
synt
hase
A
t4g2
2870
A
F117
269
5 4
(LG
6)
No
C3H
p-
coum
arat
e 3-
hydr
oxyl
ase
At2
g408
90
TC28
151
(http
://co
mpb
io.d
fci.h
arva
rd.e
du/)
1 6
(LG
8,15
) N
o C
4H
Tran
s-ci
nnam
ate
4-m
onoo
xyge
nase
A
t2g3
0490
G
O54
9874
1
2 (L
G3,
11)
No
CH
I C
halc
one
isom
eras
e A
t3g5
5120
X
6897
8 3
9 (L
G1,
11,1
4)
No
CH
S C
halc
one
synt
hase
A
t4g3
4850
X
6897
7 4
3 (L
G2,
5,7)
N
o D
FR
Dih
ydro
flavo
nol 4
-red
ucta
se
At5
g428
00
AF1
1726
8 2
2 (L
G8,
12)
No
F3’H
Flav
onoi
d 3'
-mon
ooxy
gena
se
A
t5g0
7990
App
le_0
223.
261.
C2.
Con
tig64
5,
App
le_0
223.
261.
C1.
Con
tig64
4 (h
ttp://
titan
.bio
tec.
uiuc
.edu
/cgi
-bi
n/ES
TWeb
site
/est
ima_
star
t?se
qSet
=app
le)
1 2
(LG
6,14
)
No
F3H
Fl
avan
one
3-hy
drox
ylas
e A
t3g5
1240
A
F117
270
2 2
(LG
2,5)
N
o FL
S Fl
avon
ol sy
ntha
se
At5
g086
40
AF1
1909
5 2
2 (L
G0)
N
o
HC
T Sh
ikim
ate
O-
hydr
oxyc
inna
moy
ltran
sfer
ase
At5
g489
30
App
le_0
223.
2950
.C2.
Con
tig49
90,
App
le_0
223.
850.
C1.
Con
tig17
57
1 3
(LG
9,17
) N
o LA
R Le
ucoa
ntho
cyan
idin
redu
ctas
e *A
J550
154
AY
8301
31, A
Y83
0132
0
5 (L
G13
,16)
Y
es
PAL
Phen
yala
nine
am
mon
ium
lyas
e A
t2g3
7040
App
le_0
223.
263.
C1.
Con
tig64
8,
App
le_0
223.
215.
C2.
Con
tig53
7,
App
le_0
223.
263.
C2.
Con
tig64
9 4
6 (L
G1,
4,8,
12)
No
UG
T U
DP-
depe
nden
t gly
cosy
ltran
sfer
ase
At5
g170
50
AF1
1726
7 3
6 (L
G0,
1,7,
9)
No
Genetical metabolomics in apple
75
Table 4.3. Transcription factor genes at the mQTL hotspot on LG16
Putative gene Apple sequence
Position on chromosome (bp)
Size (kbp)
MYB MDP0000375685 1361220-1362093 1.3 MYB MDP0000703817 1440436-1442198 1.7 bHLH MDP0000319726 1543934-1555640 11.7 bHLH MDP0000154272 1881558-1884164 2.6 bHLH MDP0000261293 1967365-1970040 2.6 AP2 MDP0000939633 1475660-1476865 1.2 bZIP MDP0000250967 1376596-1386527 9.9
4. Discussion
Phenolic compounds are not equally distributed throughout the apple fruit and are more abundant in the peel (Van der Sluis et al., 2001). Quercetin glycosides are found almost exclusively in the peel tissue (Van der Sluis et al., 2001). Anthocyanins, the red pigments, are predominantly present in the peel, except for the red-fleshed genotypes of apple. In contrast, chlorogenic acid and flavanols are more abundant in the flesh (Mcghie et al., 2005; Van der Sluis et al., 2001).
Many genes involved in the biosynthesis of phenylpropanoids and flavonoids in different plant species have been identified and appear to occur throughout the plant kingdom (Dixon and Steele, 1999). In apple, most of the structural genes and several regulatory genes have been isolated as cDNA sequences (Takos et al., 2006; Szankowski et al., 2009; Kim et al., 2003). However, it is not yet clear which of these genes are critical for the variation in metabolite levels between tissues and genotypes. Genetic mapping of metabolites is a useful step to elucidate which genes are critical for this variation in metabolite levels.
By combining the metabolomic data with genetic linkage maps, we detected 488 mQTLs in peel and 254 mQTLs in flesh, using the software MetaNetwork. MetaNetwork is designed for the simultaneous mapping of a large series of traits in homozygous recombinant inbred line (RIL) populations of self-fertilising crops or in F2 populations from crosses between homozygous inbred lines. However, the parents of the apple population are heterozygous, and the markers and traits do segregate in the F1. Therefore, the input files had to be transformed, as indicated in the Materials and methods, to make MetaNetwork compatible with the apple genetic model. To our knowledge, the present study is the first report of this large-scale mapping software being applied to a cross-fertilising crop. This opens wider applications for MetaNetwork.
Chapter 4
76
To gain more insight into the biochemical pathways regulated by the detected mQTLs, the centrotypes that showed highly probable mQTLs were manually annotated using accurate mass, in-source MS/MS and UV/Vis-absorbance information. The annotation revealed several groups of metabolites in both peel and flesh, including phenylpropanoid esters and glycosides (such as coumaroyl-hexoside, chlorogenic acid and coumaroyl-quinic acid) and flavonoids (such as (+)-catechin, (-)-epicatechin, procyanidins, quercetin, and kaempferol glycosides) (Tables S4.1, S4.2). Except for the alcohol glycosides and glucuronic acid all of these metabolites originate from the phenylpropanoid and flavonoid biosynthetic pathway. This bias towards the phenylpropanoid pathway was at least partially caused by the sample preparation (aqueous-methanol extracts) and the LC-MS system used (C18-reversed phase LC and ESI ionisation in negative mode; Moco et al. (2006). Other apple fruit metabolites, such as apolar steroids and volatiles could not be detected with these parameter settings and thus did not show up in our approach.
4.1 A flavonoid-mQTL hotspot is located on LG16From MetaNetwork analysis, an mQTL hotspot on LG16 was found for both the parents and both the peel and flesh tissues (Figs. 4.1, 4.2). To find the putative underlying gene(s) causing this mQTL hotspot, we positioned the structural genes of the phenylpropanoid pathway on the chromosomes of apple, as shown in Fig. 4.5 and Table 4.2. In this case, the position of the structural genes was not determined by means of genetic mapping in a segregating population, but via the alignment of the known sequences of these structural genes in A. thaliana with the first draft whole genome sequence of the apple cv. ‘Golden Delicious’ (Velasco et al., 2010). Only the structural gene MdLAR1 was found in the mQTL hotspot on LG16. MdLAR 1 catalyzes the conversion of leucocyanidins into the flavan-3-ols (+)-catechin and (-)-epicatechin, which are the building blocks of procyanidins (Fig. 4.5). Both the flavan-3-ols and the procyanidins showed an mQTL in this region. The MdLAR1 gene may explain the mQTL hotspot on LG16, as 23 procyanidins in peel and 13 procyanidins in flesh were mapped to this locus, as well as the two flavan-3-ols (+)-catechin and (-)-epicatechin in both tissues. This was also observed with the alleles involved: the level of flavan-3-ols was increased by the ‘a’ allele from ‘Prima’ and/or the ‘d’ allele from ‘Fiesta’ (Fig. 4.5). These same alleles also increased the level of procyanidins (Fig. 4.5, Tables S4.3, S4.4).
A contra-indication that MdLAR1 being the responsible gene for the hotspot is the presence of mQTLs at this locus for the chlorogenic acid and coumaroyl quinic acid (phenolic esters), phloridzin, and kaempferol glycosides. These metabolites are upstream of the substrate for MdLAR1 (Fig. 4.5). Furthermore, their
Genetical metabolomics in apple
77
levels were simultaneously increased with flavan-3-ols and procyanidins (Fig. 4.5). It is unlikely that MdLAR1 causes all these mQTLs. A likely explanation for this result is the presence of a transcription factor gene that regulates the structural genes for these metabolites. In view of this, we searched for transcription factor genes at the mQTL hotspot and detected seven transcription factor genes here. Some of these transcription factor genes belong to the MYB and bHLH types of transcriptional regulators. One of these transcription factor genes may be responsible for the mQTL hotspot for the phenolic esters and kaempferol glycosides and possibly also for the mQTL hotspot for flavan-3-ols, procyanidins and coumaroyl hexoside.
The level of coumaroyl hexoside and quinic acid (Fig. 4.5A) were negatively correlated with the level of flavan-3-ols and procyanidins (Tables S4.5, S4.6) in the progeny, as indicated by a red colour in Fig. 4.5A. This was also indicated by the alleles that increase the levels of coumaroyl hexoside: whereas the levels of flavan-3-ols and procyanidins were elevated by presence of the marker alleles ‘a’ and ‘d’, the coumaroyl hexoside and quinic acid were elevated when these alleles were absent (Fig. 4.5A, Tables S4.3, S4.4). This may be explained by a strong sink effect for the production of flavan-3-ols and procyanidins, thus, competing with coumaroyl hexoside for the substrates cinnamic acid and coumaric acid. This sink effect may have been enhanced by the subsequent side branches from the main route from the cinnamic acids to the flavan-3-ols and the procyanidins (Fig. 4.5).
4.2 Quercetin glycosides are not controlled by the flavonoid-mQTL hotspot on LG16 Quercetin glycosides are commonly found in apple fruits (Van der Sluis et al., 2001). Although quercetin glycosides are part of the phenylpropanoid and flavonoid biosynthetic pathways, they did not exhibit any significant mQTL on LG16 (Fig. 4.5). Instead, these compounds had mQTLs on LG1 in peel. On LG1, the structural gene UGT is located, which is responsible for the glycosidation of quercetins. This UGT gene may be responsible for the mQTL on LG1 (Fig. 4.5). Takos et al. (2006) identified and characterised an UGT gene in apple, using a functional genomics approach. As UGT genes consist of a large gene family, further studies would be needed to verify which UGT gene would be responsible for the glycosidation of quercetin. In flesh, quercetin glycosides showed an mQTL on LG8 (Fig. 4.5).
Another quercetin derivative, i.e. isorhamnetin (a methoxylated form of quercetin) had a strong mQTL on LG13. Possibly, a gene for methoxylation is located on LG13 (Fig. 4.5). We observed that both quercetin metabolites (quercetin glycosides and isorhamnetin glycosides) were not depending on LG16, and we did not detect any free, unmodified quercetin in apple. Together, these observations
Chapter 4
78
suggest that the rate-limiting step in the formation of quercetin derivatives in apple is determined by the modifying enzymes (UGT, OMT), and that the flux of phenylpropanoid towards quercetin is adapted to the availability of modification opportunities.
4.3 Structural and transcription factor genes of the phenylpropanoid pathway in other studiesSeveral structural genes for flavonoid biosynthesis have been described in apple. Takos et al. (2006) described two LAR genes and an Anthocyanidin reductase (ANR) gene, detected in cDNA from the peel of the red apple cv. ‘Cripps Red’. They named the two LAR genes MdLAR1 and MdLAR2. BLAST results of the sequences of these genes from apple revealed that only MdLAR1 is present in the LG16 mQTL hotspot. The MdLAR2 is located on LG13. A major part of LG16 contains homoeologous sequences of LG13 due to whole genome duplication (Maliepaard et al., 1998; Velasco et al., 2010). Park et al. (2006) also identified LAR and ANR in apple fruits by statistically analyzing the expressed sequence tags (ESTs). ANR utilizes anthocyanidin and LAR use leucocyanidin as substrate. Both ANR and LAR participate in synthesis of flavan-3-ol monomers, whereas these monomers are the building blocks of procyanidin polymers (Xie et al., 2003). In grape, ANR and LAR genes strongly influence procyanidin accumulation and composition during berry development (Bogs et al., 2005).
In pear (Pyrus communis L.), a closely related species to apple, cDNAs for the prominent genes in flavonoids biosynthesis mentioned in Fig. 4.5 have been isolated via homology with the apple sequences in order to elucidate the functions of these genes (Fischer et al., 2007). They found high homology to apple in the DNA and cDNA. Substrate specificities of the recombinant enzymes expressed in yeast were determined for physiological and non-physiological substrates and found to be in general agreement with the characteristic pear flavonoid metabolite pattern (Fischer et al., 2007). In strawberry, another member of the rosaceous family, genes in the flavonoid pathway could be clearly classified into two groups according to their expression pattern; one having two transcription peaks at early and late stages (i.e., FaANR, FaANS, FaCHI, FaFHT and FaLAR), and the other showing an up-regulation trend with a single peak at the turning and/or ripening stage (i.e., FaDFR, FaFGT, FaFLS and FaMYB (Almeida et al., 2007). This shows that expression pattern for flavonoid genes can be different and fruit stage for the expression of certain flavonoid genes can be very critical.
Bogs et al. (2007) characterized a grapevine MYB transcription factor gene, VvMYBPA1. This regulatory gene was shown to be able to activate the LAR and ANR genes, and several other flavonoid pathway genes in grapevines (Bogs et al.,
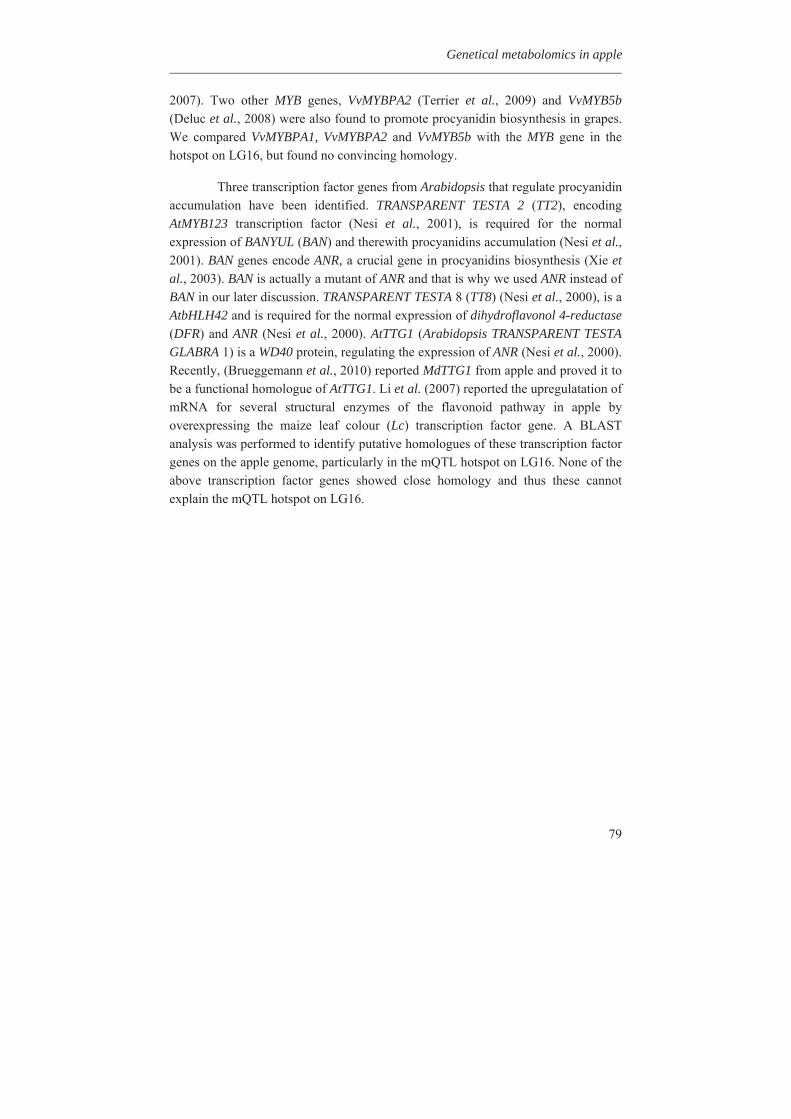
Genetical metabolomics in apple
79
2007). Two other MYB genes, VvMYBPA2 (Terrier et al., 2009) and VvMYB5b (Deluc et al., 2008) were also found to promote procyanidin biosynthesis in grapes. We compared VvMYBPA1, VvMYBPA2 and VvMYB5b with the MYB gene in the hotspot on LG16, but found no convincing homology.
Three transcription factor genes from Arabidopsis that regulate procyanidin accumulation have been identified. TRANSPARENT TESTA 2 (TT2), encoding AtMYB123 transcription factor (Nesi et al., 2001), is required for the normal expression of BANYUL (BAN) and therewith procyanidins accumulation (Nesi et al., 2001). BAN genes encode ANR, a crucial gene in procyanidins biosynthesis (Xie et al., 2003). BAN is actually a mutant of ANR and that is why we used ANR instead of BAN in our later discussion. TRANSPARENT TESTA 8 (TT8) (Nesi et al., 2000), is a AtbHLH42 and is required for the normal expression of dihydroflavonol 4-reductase (DFR) and ANR (Nesi et al., 2000). AtTTG1 (Arabidopsis TRANSPARENT TESTA GLABRA 1) is a WD40 protein, regulating the expression of ANR (Nesi et al., 2000). Recently, (Brueggemann et al., 2010) reported MdTTG1 from apple and proved it to be a functional homologue of AtTTG1. Li et al. (2007) reported the upregulatation of mRNA for several structural enzymes of the flavonoid pathway in apple by overexpressing the maize leaf colour (Lc) transcription factor gene. A BLAST analysis was performed to identify putative homologues of these transcription factor genes on the apple genome, particularly in the mQTL hotspot on LG16. None of the above transcription factor genes showed close homology and thus these cannot explain the mQTL hotspot on LG16.
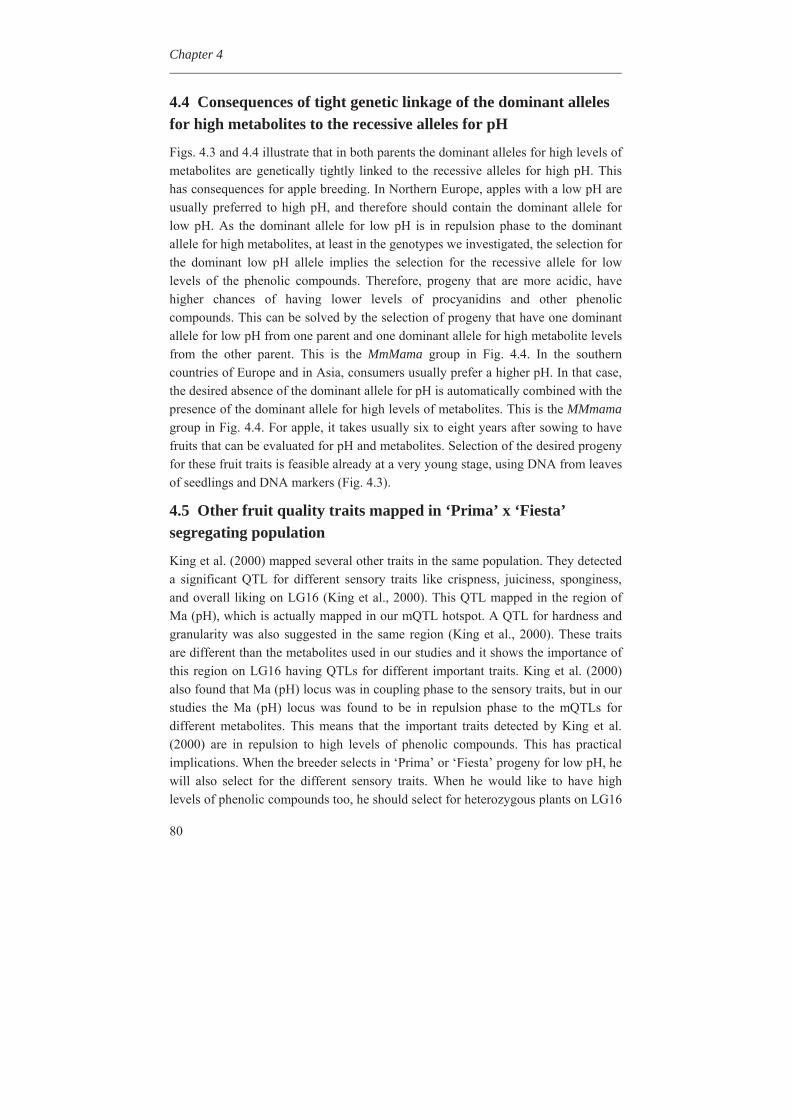
Chapter 4
80
4.4 Consequences of tight genetic linkage of the dominant alleles for high metabolites to the recessive alleles for pH
Figs. 4.3 and 4.4 illustrate that in both parents the dominant alleles for high levels of metabolites are genetically tightly linked to the recessive alleles for high pH. This has consequences for apple breeding. In Northern Europe, apples with a low pH are usually preferred to high pH, and therefore should contain the dominant allele for low pH. As the dominant allele for low pH is in repulsion phase to the dominant allele for high metabolites, at least in the genotypes we investigated, the selection for the dominant low pH allele implies the selection for the recessive allele for low levels of the phenolic compounds. Therefore, progeny that are more acidic, have higher chances of having lower levels of procyanidins and other phenolic compounds. This can be solved by the selection of progeny that have one dominant allele for low pH from one parent and one dominant allele for high metabolite levels from the other parent. This is the MmMama group in Fig. 4.4. In the southern countries of Europe and in Asia, consumers usually prefer a higher pH. In that case, the desired absence of the dominant allele for pH is automatically combined with the presence of the dominant allele for high levels of metabolites. This is the MMmama group in Fig. 4.4. For apple, it takes usually six to eight years after sowing to have fruits that can be evaluated for pH and metabolites. Selection of the desired progeny for these fruit traits is feasible already at a very young stage, using DNA from leaves of seedlings and DNA markers (Fig. 4.3).
4.5 Other fruit quality traits mapped in ‘Prima’ x ‘Fiesta’ segregating population
King et al. (2000) mapped several other traits in the same population. They detected a significant QTL for different sensory traits like crispness, juiciness, sponginess, and overall liking on LG16 (King et al., 2000). This QTL mapped in the region of Ma (pH), which is actually mapped in our mQTL hotspot. A QTL for hardness and granularity was also suggested in the same region (King et al., 2000). These traits are different than the metabolites used in our studies and it shows the importance of this region on LG16 having QTLs for different important traits. King et al. (2000) also found that Ma (pH) locus was in coupling phase to the sensory traits, but in our studies the Ma (pH) locus was found to be in repulsion phase to the mQTLs for different metabolites. This means that the important traits detected by King et al. (2000) are in repulsion to high levels of phenolic compounds. This has practical implications. When the breeder selects in ‘Prima’ or ‘Fiesta’ progeny for low pH, he will also select for the different sensory traits. When he would like to have high levels of phenolic compounds too, he should select for heterozygous plants on LG16
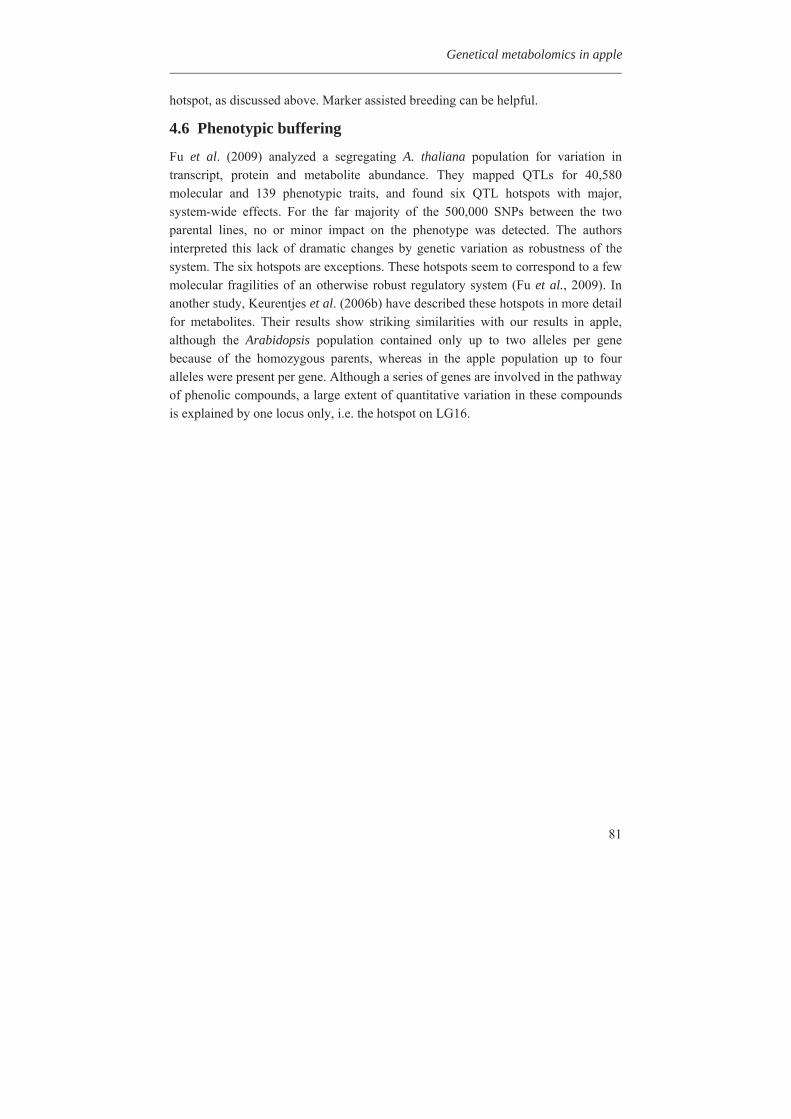
Genetical metabolomics in apple
81
hotspot, as discussed above. Marker assisted breeding can be helpful.
4.6 Phenotypic buffering
Fu et al. (2009) analyzed a segregating A. thaliana population for variation in transcript, protein and metabolite abundance. They mapped QTLs for 40,580 molecular and 139 phenotypic traits, and found six QTL hotspots with major, system-wide effects. For the far majority of the 500,000 SNPs between the two parental lines, no or minor impact on the phenotype was detected. The authors interpreted this lack of dramatic changes by genetic variation as robustness of the system. The six hotspots are exceptions. These hotspots seem to correspond to a few molecular fragilities of an otherwise robust regulatory system (Fu et al., 2009). In another study, Keurentjes et al. (2006b) have described these hotspots in more detail for metabolites. Their results show striking similarities with our results in apple, although the Arabidopsis population contained only up to two alleles per gene because of the homozygous parents, whereas in the apple population up to four alleles were present per gene. Although a series of genes are involved in the pathway of phenolic compounds, a large extent of quantitative variation in these compounds is explained by one locus only, i.e. the hotspot on LG16.
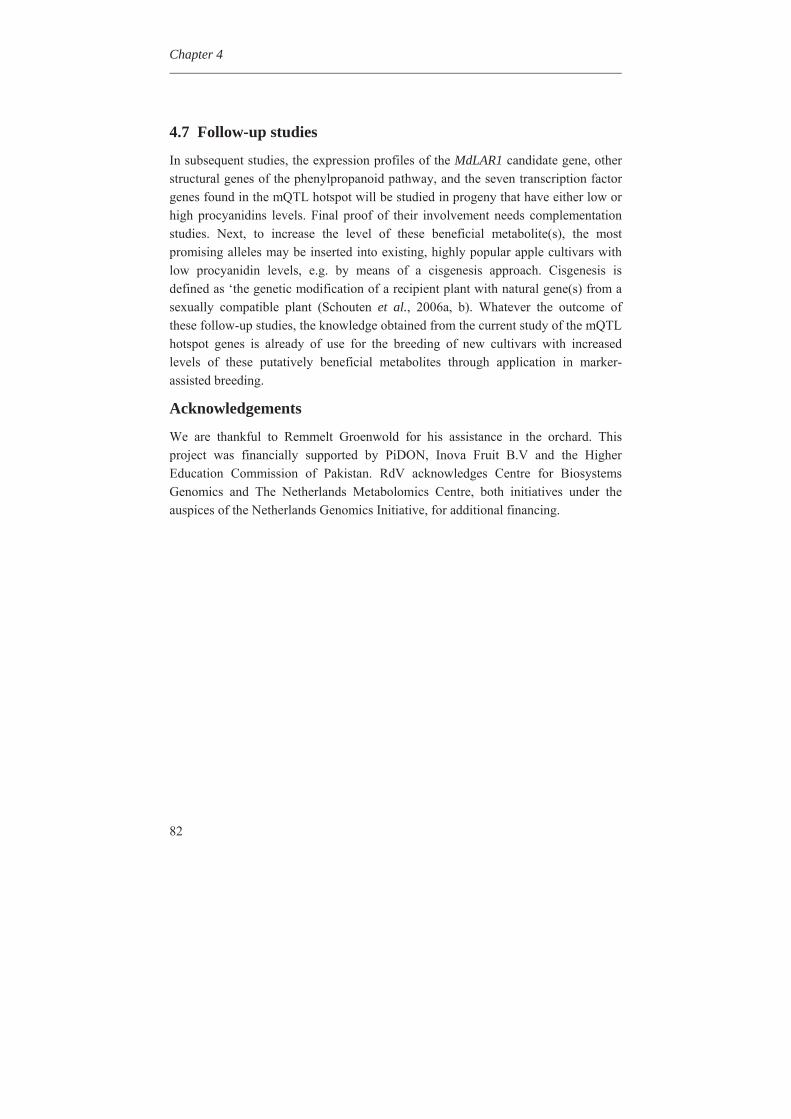
Chapter 4
82
4.7 Follow-up studies
In subsequent studies, the expression profiles of the MdLAR1 candidate gene, other structural genes of the phenylpropanoid pathway, and the seven transcription factor genes found in the mQTL hotspot will be studied in progeny that have either low or high procyanidins levels. Final proof of their involvement needs complementation studies. Next, to increase the level of these beneficial metabolite(s), the most promising alleles may be inserted into existing, highly popular apple cultivars with low procyanidin levels, e.g. by means of a cisgenesis approach. Cisgenesis is defined as ‘the genetic modification of a recipient plant with natural gene(s) from a sexually compatible plant (Schouten et al., 2006a, b). Whatever the outcome of these follow-up studies, the knowledge obtained from the current study of the mQTL hotspot genes is already of use for the breeding of new cultivars with increased levels of these putatively beneficial metabolites through application in marker-assisted breeding.
Acknowledgements
We are thankful to Remmelt Groenwold for his assistance in the orchard. This project was financially supported by PiDON, Inova Fruit B.V and the Higher Education Commission of Pakistan. RdV acknowledges Centre for Biosystems Genomics and The Netherlands Metabolomics Centre, both initiatives under the auspices of the Netherlands Genomics Initiative, for additional financing.
Chapter 5
The leucoanthocyanidin reductase gene causes an mQTL hotspot on LG16 for phenolic compounds in apple fruits
Sabaz Ali Khan1, Jan G. Schaart1, Jules Beekwilder2, Andrew C. Allan3, Evert Jacobsen1 and Henk J. Schouten1*
1Wageningen UR Plant Breeding, P.O. Box 16, 6700 AA, Wageningen, The Netherlands.
2Wageningen University and Research Centre, Plant Research International, Business Unit Bioscience, P.O. Box 16, 6700 AA Wageningen, The Netherlands.
3New Zealand Institute for Plant and Food Research Limited, Mt Albert Research Centre, Auckland 1025, New Zealand.
*for correspondence (fax +31 317 418094; e-mail [email protected])
Manuscript in preparation
Chapter 5
84
Abstract Apple (Malus × domestica Borkh) is an important source of phenolic compounds in our food. In the previous study on ripe apples from a progeny of a cross between ‘Prima’ and ‘Fiesta’, it was shown that at the top of LG16 there was a hotspot of mQTLs for phenolic compounds in peel and flesh. In the present study, we investigated the expression profiles of genes that are related to the metabolism of phenolic compounds during fruit development. This was done for structural genes of the phenylpropanoid pathway, putative transcription factor genes on the LG16 mQTL hotspot and putative transcription factor genes elsewhere in the apple genome that may regulate the phenylpropanoid pathway. The gene expression profiles were studied for peel and flesh of apples from 19 progeny genotypes. Only the structural gene leucoanthocyanidin reductase (MdLAR1) showed a significant correlation between transcript level of different alleles and content of metabolites that mapped on the mQTL hotspot. Progeny that had inherited one or two copies of the dominant alleles (Mm, MM) showed on the average a 4.4- and 11.8-fold higher expression level of MdLAR1, respectively, compared to the progeny that had inherited the recessive alleles (mm). This led to a 4.0-fold increase of procyanidin dimer II content at the ripe stage. Upstream metabolites such as phenolic esters and kaempferol glycosides also showed a positive correlation with transcript levels of MdLAR1, suggesting feedback mechanism within the pathway. We also found in literature that the 4-coumarate-CoA ligase (4CL) step is regulated in the phenylpropanoid pathway. This could also explain the mQTLs upstream in the pathway. The consequences for indirect breeding for increased phenolic compounds content in apple fruits are discussed.
The causal gene for phenolic compounds in apple
85
1. Introduction Apple (Malus × domestica Borkh) is a member of the Rosaceae family, sub family Pomoideae, which includes crop species such as pear, cotoneaster, and quince (Janssen et al., 2008). It is an important fruit crop of the temperate regions of the world. Apple is an important source of many secondary metabolites known as phenolic compounds. These phenolic compounds have various functions in the plant such as protection against ultra violet (UV) light and defence against pathogens. One of the important benefits of these compounds to consumers is their potential role against various human diseases such as cancer, coronary heart diseases, cardiovascular diseases, and diabetes (Eberhardt et al., 2000; Mcghie et al., 2005).
The phenylpropanoid pathway is the biochemical pathway of flavonoids in plants. This is, however, a complex metabolic pathway and involves several enzymes. Many of these enzymes have been functionally characterized (Han and Korban, 2009; Jugde et al., 2008; Takos et al., 2006; Kim et al., 2003).
To date, variations in gene expression have been extensively studied in different populations, species and tissues of plants (Ince et al., 2010). For example, Ince et al. (2010) studied the expression of genes containing SSRs in different tissues and at different developmental stages of pepper plant. Janssen et al. (2008) made gene expression studies for apple fruit development at eight time points using microarray. Costa et al. (2010) also studied gene expression in apple during development, maturation and ripening with specific focus on ethylene. They found that gene expression in apples is coordinated with specific developmental stages (Janssen et al., 2008; Costa et al., 2010).
Expression of candidate genes can be correlated with the end-products of the pathway, from which the genes are part of, by correlating the transcript levels to the compound content such as phenolic compounds. The expression studies can be performed through various techniques such as microarray hybridization and quantitative reverse transcriptase PCR (q-RT-PCR). q RT-PCR is a very efficient technique for measuring the expression profiles of candidate genes. It is a more targeted and reliable approach for studying the expression of target genes.
Apple fruit develops over a period of 150 days from fertilization to fully ripe fruit (Janssen et al., 2008). During this period it passes through different developmental stages. A pictorial representation of the different stages of apple can be found on the Michigan University website as http://web1.msue.msu.edu/fruit/applgrw.htm.
In Chapter 4, phenolic compounds were genetically mapped that were detected in peel and flesh of ripe apple fruits, and a hotspot of mQTLs was detected on LG16. By looking closer at the draft sequence of the whole genome of the apple cultivar ‘Golden Delicious’ (Velasco et al., 2010), the structural gene
Chapter 5
86
leucoanthocyanidin reductase (MdLAR1) and eight transcription factor genes were detected in the genetic window of the mQTL hotspot.
The aim of the present study was to know whether one or more of the candidate genes are responsible for this mQTL hotspot. The approach was the analysis of expression of structural and transcription factor genes of the phenylpropanoid pathway. Therefore the expression of the structural gene MdLAR1 and seven transcription factor genes in the mQTL hotspot was investigated. In addition, expression profiles of transcription factor genes outside of the mQTL hotspot and the structural genes of the phenylpropanoid pathway were also studied. A strong positive correlation between the expression level of the MdLAR1 gene and the level of metabolites that mapped on LG16 was observed. This was not found for any other gene among the genes that were studied. This indicates that different alleles of the MdLAR1 gene cause the mQTL hotspot on LG16.
2. Materials and methods In this study fruits from the F1 segregating population derived from the cross between the cultivars ‘Prima’ and ‘Fiesta’ were used. This population was used in our previous study too in which the mQTL hotspot was detected (For detail see Chapter 4).
2.1 Selection of genotypes and harvesting of fruits for gene expression studies
We selected genotypes based on the clear segregation of metabolite ‘procyanidin dimer II’. This metabolite belongs to the phenylpropanoid pathway and its metabolic content showed a clear segregation and was mapped at the mQTL hotspot on LG16 as described in Chapter 4. This metabolite was used as representative metabolite for all metabolites that mapped at the mQTL hotspot. The progeny genotypes from the cross ‘Prima’ x ‘Fiesta’ were divided into two groups based on ‘procyanidin dimer II’ clear segregation, i.e. one group having high content and one having low content of ‘procyanidin dimer II’. The trees were at full bloom from 26-30th April, 2010. The different developmental stages of fruits were observed. Fruits from trees in the trial orchard located in Randwijk, the Netherlands were harvested as described in Chapter 6. Ten genotypes were selected from ‘Group A’ and nine genotypes were selected from ‘Group B’ with two trees per genotype (two biological replicates). For reference, the parents of the segregating population were included in the analysis with two trees for each parent. Both parents belong to the heterozygous dominant class. The genotypes number and genotypes classes used in this study are given in Table 5.1. The sizes (diameter) of individual fruits was measured at each developmental stage using an electronic digital caliper, model VWRI819-0012 of
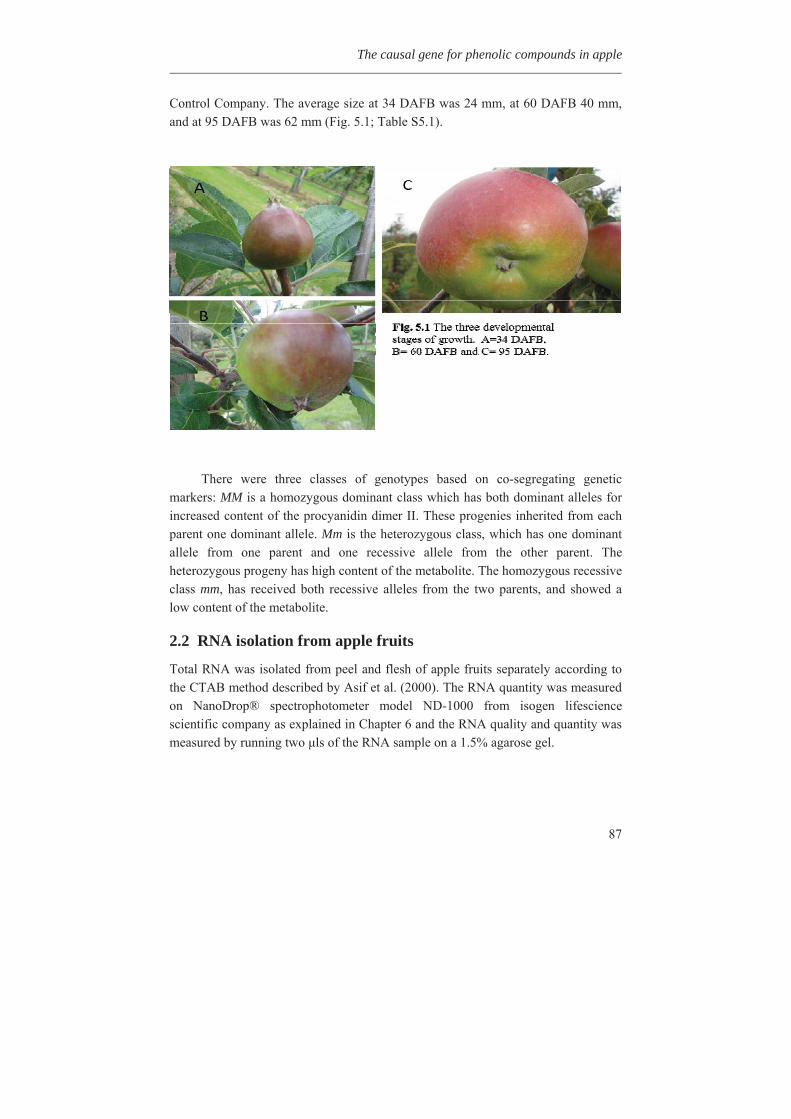
The causal gene for phenolic compounds in apple
87
Control Company. The average size at 34 DAFB was 24 mm, at 60 DAFB 40 mm, and at 95 DAFB was 62 mm (Fig. 5.1; Table S5.1).
There were three classes of genotypes based on co-segregating genetic markers: MM is a homozygous dominant class which has both dominant alleles for increased content of the procyanidin dimer II. These progenies inherited from each parent one dominant allele. Mm is the heterozygous class, which has one dominant allele from one parent and one recessive allele from the other parent. The heterozygous progeny has high content of the metabolite. The homozygous recessive class mm, has received both recessive alleles from the two parents, and showed a low content of the metabolite.
2.2 RNA isolation from apple fruits
Total RNA was isolated from peel and flesh of apple fruits separately according to the CTAB method described by Asif et al. (2000). The RNA quantity was measured on NanoDrop® spectrophotometer model ND-1000 from isogen lifescience scientific company as explained in Chapter 6 and the RNA quality and quantity was measured by running two ls of the RNA sample on a 1.5% agarose gel.
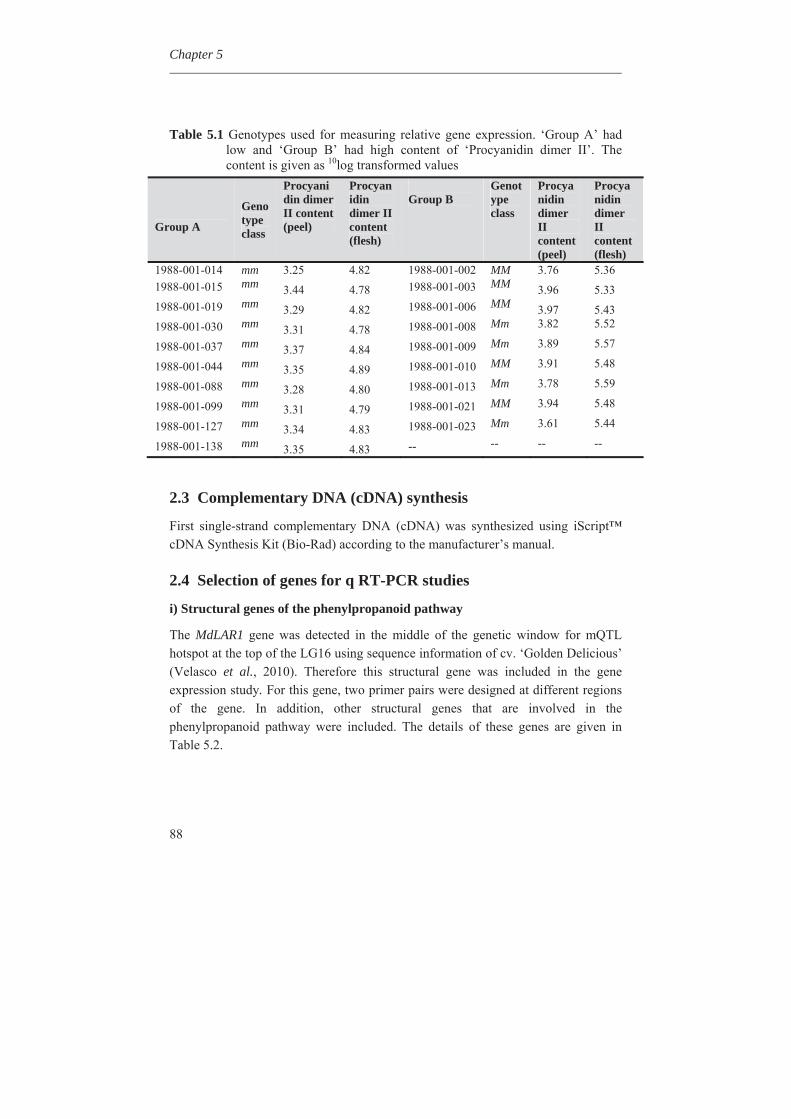
Chapter 5
88
Table 5.1 Genotypes used for measuring relative gene expression. ‘Group A’ had low and ‘Group B’ had high content of ‘Procyanidin dimer II’. The content is given as 10log transformed values
Group A
Genotype class
Procyanidin dimer II content (peel)
Procyanidin dimer II content (flesh)
Group B
Genotype class
Procyanidin dimer II content (peel)
Procyanidin dimer II content (flesh)
1988-001-014 mm 3.25 4.82 1988-001-002 MM 3.76 5.36 1988-001-015 mm 3.44 4.78 1988-001-003 MM 3.96 5.33 1988-001-019 mm 3.29 4.82 1988-001-006 MM 3.97 5.43 1988-001-030 mm 3.31 4.78 1988-001-008 Mm 3.82 5.52
1988-001-037 mm 3.37 4.84 1988-001-009 Mm 3.89 5.57
1988-001-044 mm 3.35 4.89 1988-001-010 MM 3.91 5.48
1988-001-088 mm 3.28 4.80 1988-001-013 Mm 3.78 5.59
1988-001-099 mm 3.31 4.79 1988-001-021 MM 3.94 5.48
1988-001-127 mm 3.34 4.83 1988-001-023 Mm 3.61 5.44
1988-001-138 mm 3.35 4.83 -- -- -- --
2.3 Complementary DNA (cDNA) synthesis
First single-strand complementary DNA (cDNA) was synthesized using iScript™ cDNA Synthesis Kit (Bio-Rad) according to the manufacturer’s manual.
2.4 Selection of genes for q RT-PCR studies
i) Structural genes of the phenylpropanoid pathway
The MdLAR1 gene was detected in the middle of the genetic window for mQTL hotspot at the top of the LG16 using sequence information of cv. ‘Golden Delicious’ (Velasco et al., 2010). Therefore this structural gene was included in the gene expression study. For this gene, two primer pairs were designed at different regions of the gene. In addition, other structural genes that are involved in the phenylpropanoid pathway were included. The details of these genes are given in Table 5.2.
The causal gene for phenolic compounds in apple
89
ii) Transcription factor genes in the mQTL hotspot on LG16
Seven transcription factor genes that were found in the mQTL hotspot window on LG16 were included in the q RT-PCR studies (Table 5.2).
iii) Transcription factor genes located outside the mQTL hotspot on LG16
Further, 11 other transcription factor genes located outside the mQTL hotspot but are known as candidates for regulation of the phenylpropanoid pathway such as TTG1 and bHLH3 were also added (Table 5.2).
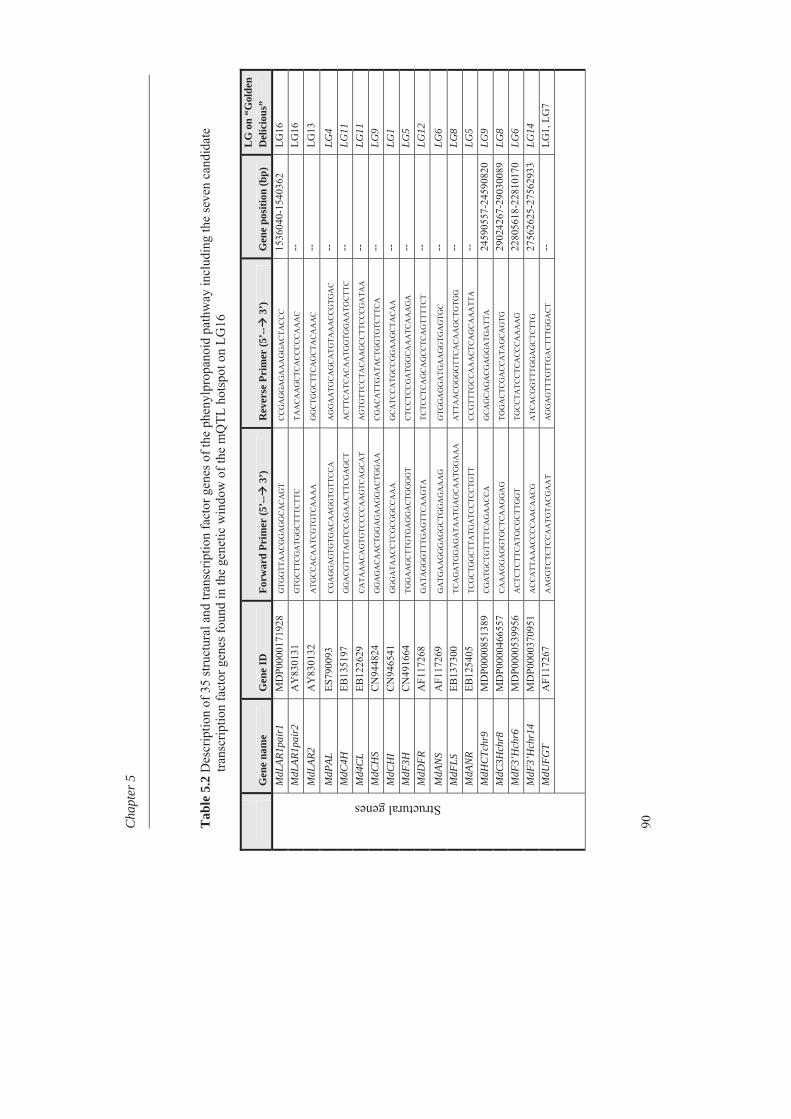
Cha
pter
5
90
T
able
5.2
Des
crip
tion
of 3
5 st
ruct
ural
and
tran
scrip
tion
fact
or g
enes
of t
he p
heny
lpro
pano
id p
athw
ay in
clud
ing
the
seve
n ca
ndid
ate
trans
crip
tion
fact
or g
enes
foun
d in
the
gene
tic w
indo
w o
f the
mQ
TL h
otsp
ot o
n LG
16
G
ene
nam
e G
ene
ID
Forw
ard
Prim
er (5
’--
3’)
R
ever
se P
rim
er (5
’--
3’)
G
ene
posi
tion
(bp)
L
G o
n “G
olde
n D
elic
ious
”
Structural genes
MdL
AR1p
air1
M
DP0
0001
7192
8 G
TGG
TTA
AC
GG
AG
GC
AC
AG
T C
CG
AG
GA
GA
AA
GG
AC
TAC
CC
15
3604
0-15
4036
2 LG
16
MdL
AR1p
air2
A
Y83
0131
G
TGC
TTC
GA
TGG
CTT
TCTT
C
TAA
CA
AG
CTC
AC
CC
CC
AA
AC
--
LG
16
MdL
AR2
AY
8301
32
ATG
CC
AC
AA
TCG
TGTC
AA
AA
G
GC
TGG
CTT
CA
GC
TAC
AA
AC
--
LG
13
MdP
AL
ES79
0093
C
GA
GG
AG
TGTG
AC
AA
GG
TGTT
CC
A
AG
GA
ATG
CA
GC
ATG
TAA
AC
CG
TGA
C
--
LG4
MdC
4H
EB13
5197
G
GA
CG
TTTA
GTC
CA
GA
AC
TTC
GA
GC
T A
CTT
CA
TCA
CA
ATG
GTG
GA
ATG
CTT
C
--
LG11
M
d4C
L EB
1226
29
CA
TAA
AC
AG
TGTC
CC
CA
AG
TCA
GC
AT
AG
TGTT
CC
TAC
AA
GC
CTT
CC
CG
ATA
A
--
LG11
M
dCH
S C
N94
4824
G
GA
GA
CA
AC
TGG
AG
AA
GG
AC
TGG
AA
C
GA
CA
TTG
ATA
CTG
GTG
TCTT
CA
--
LG
9 M
dCH
I C
N94
6541
G
GG
ATA
AC
CTC
GC
GG
CC
AA
A
GC
ATC
CA
TGC
CG
GA
AG
CTA
CA
A
--
LG1
MdF
3H
CN
4916
64
TGG
AA
GC
TTG
TGA
GG
AC
TGG
GG
T C
TCC
TCC
GA
TGG
CA
AA
TCA
AA
GA
--
LG
5 M
dDFR
A
F117
268
GA
TAG
GG
TTTG
AG
TTC
AA
GTA
TC
TCC
TCA
GC
AG
CC
TCA
GTT
TTC
T --
LG
12
MdA
NS
AF1
1726
9 G
ATG
AA
GG
GA
GG
CTG
GA
GA
AA
G
GTG
GA
GG
ATG
AA
GG
TGA
GTG
C
--
LG6
MdF
LS
EB13
7300
TC
AG
ATG
GA
GA
TAA
TGA
GC
AA
TGG
AA
A
ATT
AA
CG
GG
GTT
CA
CA
AG
CTG
TGG
--
LG
8 M
dAN
R EB
1254
05
TCG
CTG
GC
TTA
TGA
TCC
TCC
TGTT
C
CG
TTTG
CC
AA
AC
TCA
GC
AA
ATT
A
--
LG5
MdH
CTc
hr9
MD
P000
0851
389
CG
ATG
CTG
TTTT
CA
GA
AC
CA
G
CA
GC
AG
AC
GA
GG
ATG
ATT
A
2459
0557
-245
9082
0 LG
9 M
dC3H
chr8
M
DP0
0004
6655
7 C
AA
AG
GA
GG
TGC
TCA
AG
GA
G
TGG
AC
TCG
AC
CA
TAG
CA
GTG
29
0242
67-2
9030
089
LG8
MdF
3’H
chr6
M
DP0
0005
3995
6 A
CTC
TCTT
CA
TGC
GC
TTG
GT
TGC
CTA
TCC
TCA
CC
CA
AA
AG
22
8056
18-2
2810
170
LG6
MdF
3’H
chr1
4 M
DP0
0003
7095
1 A
CC
ATT
AA
AC
CC
CA
AC
AA
CG
A
TCA
CG
GTT
TGG
AG
CTC
TTG
27
5626
25-2
7562
933
LG14
M
dUFG
T A
F117
267
AA
GG
TCTC
TCC
AA
TGTA
CG
AA
T A
GG
AG
TTTG
TTG
AC
TTTG
GA
CT
--
LG1,
LG
7
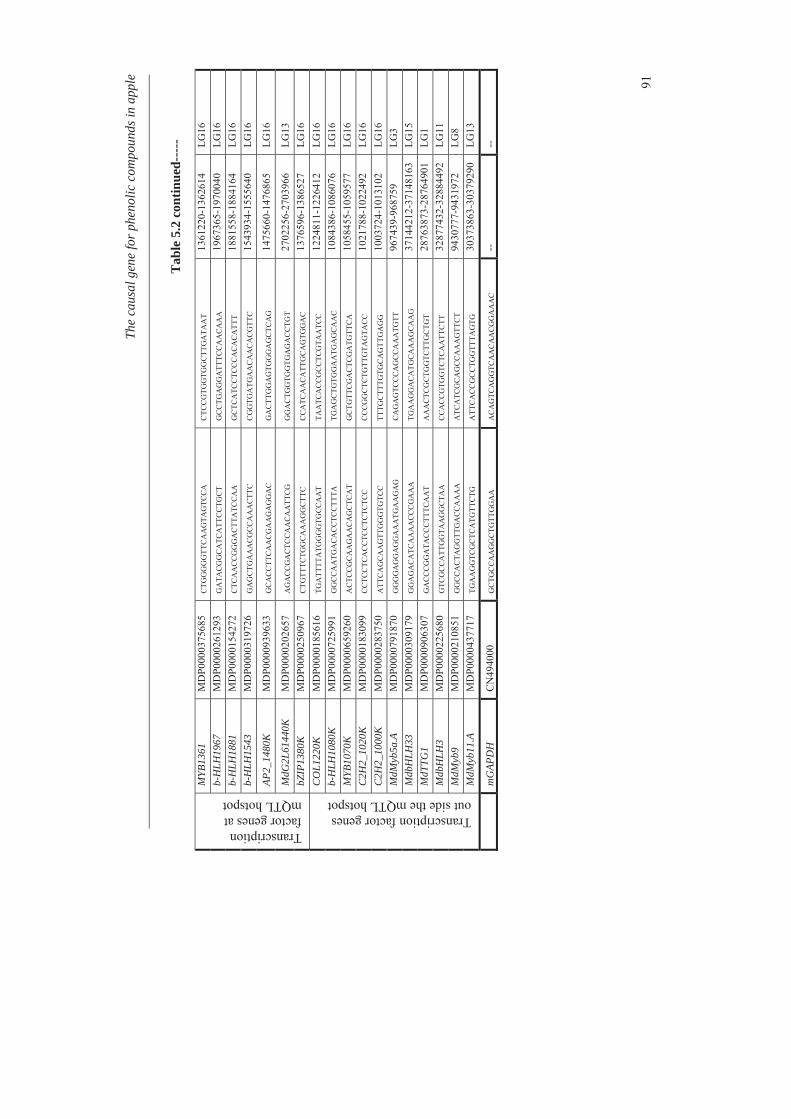
Th
e ca
usal
gen
e fo
r phe
nolic
com
poun
ds in
app
le
91
Transcription factor genes at mQTL hotspot
MYB
1361
M
DP0
0003
7568
5 C
TGG
GG
GTT
CA
AG
TAG
TCC
A
CTC
CG
TGG
TGG
CTT
GA
TAA
T 13
6122
0-13
6261
4 LG
16
b-H
LH19
67
MD
P000
0261
293
GA
TAC
GG
CA
TCA
TTC
CTG
CT
GC
CTG
AG
GA
TTTC
CA
AC
AA
A
1967
365-
1970
040
LG16
b-
HLH
1881
M
DP0
0001
5427
2 C
TCA
AC
CG
GG
AC
TTA
TCC
AA
G
CTC
ATC
CTC
CC
AC
AC
ATT
T 18
8155
8-18
8416
4 LG
16
b-H
LH15
43
MD
P000
0319
726
GA
GC
TGA
AA
CG
CC
AA
AC
TTC
C
GG
TGA
TGA
AC
AA
CA
CG
TTC
15
4393
4-15
5564
0 LG
16
AP2_
1480
K
MD
P000
0939
633
GC
AC
CTT
CA
AC
GA
AG
AG
GA
C
GA
CTT
GG
AG
TGG
GA
GC
TCA
G
1475
660-
1476
865
LG16
MdG
2L61
440K
M
DP0
0002
0265
7 A
GA
CC
GA
CTC
CA
AC
AA
TTC
G
GG
AC
TGG
TGG
TGA
GA
CC
TGT
2702
256-
2703
966
LG13
bZ
IP13
80K
M
DP0
0002
5096
7 C
TGTT
TCTG
GC
AA
AG
GC
TTC
C
CA
TCA
AC
ATT
GC
AG
TGG
AC
13
7659
6-13
8652
7 LG
16
Transcription factor genes out side the mQTL hotspot
CO
L122
0K
MD
P000
0185
616
TGA
TTTT
ATG
GG
GTG
CC
AA
T TA
ATC
AC
CG
CC
TCG
TAA
TCC
12
2481
1-12
2641
2 LG
16
b-H
LH10
80K
M
DP0
0007
2599
1 G
GC
CA
ATG
AC
AC
CTC
CTT
TA
TGA
GC
TGTG
GA
ATG
AG
CA
AC
10
8438
6-10
8607
6 LG
16
MYB
1070
K
MD
P000
0659
260
AC
TCC
GC
AA
GA
AC
AG
CTC
AT
GC
TGTT
CG
AC
TCG
ATG
TTC
A
1058
455-
1059
577
LG16
C
2H2_
1020
K
MD
P000
0183
099
CC
TCC
TCA
CC
TCC
TCTC
TCC
C
CC
GG
CTC
TGTT
GTA
GTA
CC
10
2178
8-10
2249
2 LG
16
C2H
2_10
00K
M
DP0
0002
8375
0 A
TTC
AG
CA
AG
TTG
GG
TGTC
C
TTTG
CTT
TGTG
CA
GTT
GA
GG
10
0372
4-10
1310
2 LG
16
MdM
yb5a
.A
MD
P000
0791
870
GG
GG
AG
GA
GG
AA
ATG
AA
GA
G
CA
GA
GTC
CC
AG
CC
AA
ATG
TT
9674
39-9
6875
9 LG
3 M
dbH
LH33
M
DP0
0003
0917
9 G
GA
GA
CA
TCA
AA
AC
CC
GA
AA
TG
AA
GG
AC
ATG
CA
AA
GC
AA
G
3714
4212
-371
4816
3 LG
15
MdT
TG1
MD
P000
0906
307
GA
CC
CG
GA
TAC
CC
TTTC
AA
T A
AA
CTC
GC
TGG
TCTT
GC
TGT
2876
3873
-287
6490
1 LG
1 M
dbH
LH3
MD
P000
0225
680
GTC
GC
CA
TTG
GTA
AG
GC
TAA
C
CA
CC
GTG
GTC
TCA
ATT
CTT
32
8774
32-3
2884
492
LG11
M
dMyb
9 M
DP0
0002
1085
1 G
GC
CA
CTA
GG
TTG
AC
CA
AA
A
ATC
ATC
GC
AG
CC
AA
AG
TTC
T 94
3077
7-94
3197
2 LG
8 M
dMyb
11.A
M
DP0
0004
3771
7 TG
AA
GG
TCG
CTC
ATG
TTC
TG
ATT
CA
CC
GC
CTG
GTT
TAG
TG
3037
3863
-303
7929
0 LG
13
m
GAP
DH
C
N49
4000
G
CTG
CC
AA
GG
CTG
TTG
GA
A
AC
AG
TCA
GG
TCA
AC
AA
CG
GA
AA
C
--
--
Tab
le 5
.2 c
ontin
ued-
----
Chapter 5
92
2.5 Designing and testing of primers for q RT-PCR
Primer pairs for candidate genes MdLAR1, transcription factor genes in the mQTL hotspot and outside the mQTL hotspot were designed with online available program ‘Primer3Plus’ (http://www.bioinformatics.nl/cgi-bin/primer3plus/primer3plus.cgi). Primer pairs for structural genes of phenylpropanoid pathway were kindly provided by HortResearch New Zealand. The primer names and their forward and reverse sequences are given in Table 5.2. The primers were tested using q RT-PCR in the same way as explained in the chapter 6. The q RT-PCR products were checked for quality by checking their clear single peak in the melting curve and a clear band of the expected amplicon size on 1.5% agarose gel.
2.6 Sequencing of MdLAR1 gene
The amplicons of the two primer pairs of the MdLAR1 gene were sequenced. For this purpose several genotypes from each MM (homozygous dominant), Mm (heterozygous dominant) and mm (homozygous recessive) genotype classes were sequenced. This was done for verification of the specificity of the primers, as MdLAR1 and MdLAR2 have very similar sequences. Moreover, as the primers were designed on cv. ‘Golden Delicious’ sequence, it was checked for the correct primer annealing sites in the ‘Prima’ x ‘Fiesta’ segregating population.
2.7 Performing q RT-PCR
Gene expression in 216 cDNA samples was measured using Fluidigm Dynamic Array integrated fluidic circuits. The Fluidigm q RT-PCR for quantification of relative expression of the candidate genes was used. Fluidigm used the BioMark™ System and Evagreen DNA binding dye (http://www.fluidigm.com). Three 96x96 Dynamic Arrays of Integrated Fluidic Circuits, comprising 48 primer pairs in two replicates were used for this purpose. The q RT-PCR set up for reference gene and other control samples was same as explained in Chapter 6.
2.8 Analysis of q RT-PCR data
The q RT-PCR data were analysed using the Fluidigm® Real-Time PCR Analysis Software version 3 (http://www.fluidigm.com) as explained in the Chapter 6.
The causal gene for phenolic compounds in apple
93
3. Results 3.1 Expression profiles of structural genes of the phenylpropanoid pathway
None of the 17 structural genes of phenylpropanoid pathway which were evaluated for gene expression, showed a significant correlation with the content of procyanidin dimer II, except the MdLAR1 gene (Table 5.3 and Table S5.1). This was observed both in peel and flesh tissues and at the three different developmental stages. For MdLAR1 we evaluated the expression using two different primer pairs, annealing at different places of the MdLAR1 gene. Expression using both primer pairs showed a positive correlation between the expression level and the procyanidin dimer II and other metabolites content which mapped in the mQTL hotspot.
The progeny that had inherited the recessive alleles for low procyanidin dimer II content (mm), showed a low expression of MdLAR1 throughout the fruit development, both in peel and flesh (Fig. 5.1). However, the heterozygous group (Mm) showed a higher expression, compared to the homozygous recessive (mm) group, whereas the homozygous dominant progeny (MM) with high content of procyanidin dimer II showed the highest expression of MdLAR1 (Fig. 5.2). For all other structural genes we could not find any differential expression for the three genotype classes (data not shown). This strongly indicates that MdLAR1 gene is the causal gene for the mQTL of procyanidin dimer II and all other phenolic compounds that mapped at the mQTL hotspot on LG16 and are highly correlated with procyanidin dimer II content in peel and flesh.
Table 5.3 (next page) Correlations between the expression levels of the phenylpropanoid pathway genes in flesh. The blue colour represents the transcription factor genes that were detected in the mQTL hotspot. Yellow colour shows the transcription factor genes that were not in the mQTL hotspot but were located on the LG16. Pink colour represents transcription factor genes of the phenylpropanoid pathway that are not located in the mQTL hotspot nor on the LG16 but are at other regions of the genome. In grey colour are the structural genes. The metabolites are highlighted in purple and the correlations with the expression level of all the genes is given in bold text. The metabolites contents were 10log transformed. The significant correlation between expression level of genes and metabolite content is given in dark green colour. Metabolite A=Procyanidin dimer I , metabolite B=Procyanidin dimer II , Metabolite C=Procyanidin trimer I, Metabolite D=Procyanidin trimer II, Metabolite E=Epicatechin and Metabolite F=Catechin. Light green colour shows other significant correlations.
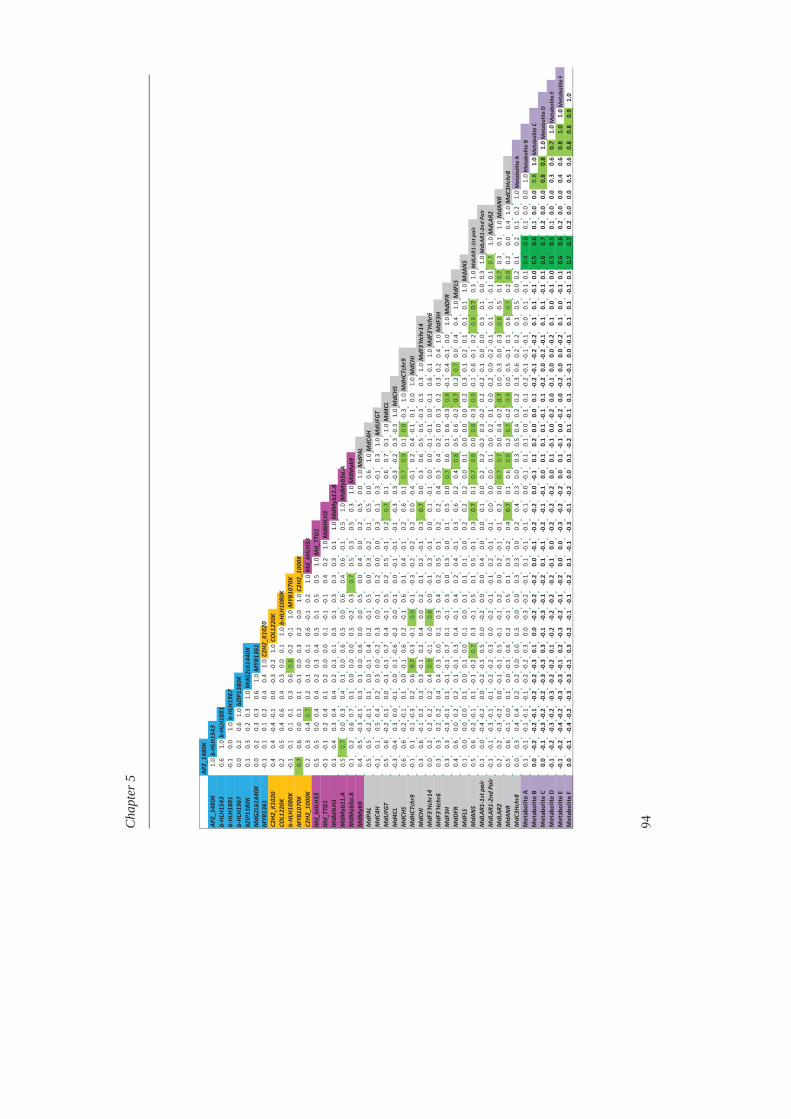
Cha
pter
5
94
AP2_14
80K
AP2_14
80K
1.0bHL
H15
43bHLH
1543
0.6
1.0bHL
H188
1bHLH
1881
0.1
0.0
1.0bHL
H196
7bHLH
1967
0.0
0.2
0.6
1.0bZIP13
80K
bZIP13
80K
0.1
0.3
0.2
0.3
1.0MdG
2L61
440K
MdG
2L61
440K
0.0
0.2
0.3
0.3
0.6
1.0MYB
1361
MYB
1361
0.1
0.1
0.1
0.2
0.4
0.4
1.0C2
H2_K
1020
C2H2
_K10
200.4
0.4
0.4
0.1
0.0
0.3
0.2
1.0CO
L122
0KCO
L122
0K0.2
0.5
0.4
0.6
0.4
0.3
0.0
0.1
1.0bHL
H108
0KbHLH
1080
K0.1
0.1
0.1
0.1
0.3
0.6
0.8
0.2
0.1
1.0MYB
1070
KMYB
1070
K0.7
0.6
0.0
0.1
0.1
0.1
0.0
0.3
0.2
0.0
1.0C2
H2_100
0KC2
H2_100
0K0.2
0.3
0.4
0.7
0.2
0.1
0.0
0.1
0.6
0.1
0.2
1.0Md_bH
LH33
Md_bH
LH33
0.5
0.5
0.0
0.4
0.4
0.2
0.3
0.4
0.5
0.1
0.5
0.5
1.0Md_TTG1
Md_TTG1
0.1
0.1
0.2
0.4
0.1
0.2
0.0
0.0
0.1
0.1
0.1
0.4
0.2
1.0Mdb
HLH3
Mdb
HLH3
0.1
0.4
0.3
0.4
0.4
0.2
0.1
0.1
0.5
0.1
0.3
0.3
0.3
0.1
1.0MdM
yb11
.AMdM
yb11
.A0.5
0.7
0.0
0.3
0.4
0.1
0.0
0.6
0.5
0.0
0.6
0.4
0.6
0.1
0.5
1.0MdM
yb5a
.AMdM
yb5a
.A0.1
0.2
0.6
0.7
0.1
0.0
0.0
0.0
0.5
0.2
0.3
0.7
0.5
0.3
0.5
0.3
1.0MdM
yb9
MdM
yb9
0.4
0.5
0.3
0.1
0.3
0.1
0.0
0.6
0.0
0.0
0.5
0.0
0.4
0.0
0.2
0.5
0.0
1.0MdP
ALMdP
AL0.5
0.5
0.2
0.1
0.1
0.0
0.1
0.4
0.2
0.1
0.5
0.0
0.3
0.2
0.1
0.5
0.0
0.6
1.0MdC
4HMdC
4H0.1
0.1
0.5
0.4
0.2
0.3
0.0
0.2
0.3
0.0
0.1
0.2
0.0
0.0
0.3
0.1
0.3
0.1
0.3
1.0MdU
FGT
MdU
FGT
0.5
0.6
0.2
0.1
0.0
0.1
0.1
0.7
0.4
0.1
0.5
0.2
0.5
0.1
0.2
0.7
0.1
0.6
0.7
0.1
1.0Md4
CLMd4
CL0.3
0.4
0.3
0.0
0.1
0.0
0.1
0.6
0.2
0.0
0.1
0.0
0.1
0.1
0.1
0.3
0.3
0.3
0.2
0.3
0.3
1.0MdC
HSMdC
HS0.6
0.6
0.2
0.1
0.1
0.0
0.1
0.6
0.2
0.1
0.6
0.1
0.4
0.1
0.2
0.6
0.1
0.7
0.9
0.1
0.8
0.3
1.0MdH
CTchr9
MdH
CTchr9
0.1
0.1
0.1
0.3
0.2
0.6
0.7
0.3
0.1
0.9
0.1
0.3
0.2
0.2
0.2
0.0
0.4
0.1
0.2
0.4
0.1
0.1
0.0
1.0MdC
HIMdC
HI0.3
0.6
0.1
0.2
0.3
0.3
0.1
0.2
0.4
0.0
0.2
0.1
0.2
0.1
0.3
0.7
0.0
0.3
0.6
0.5
0.5
0.3
0.5
0.3
1.0MdF3'Hc
hr14
MdF3'Hc
hr14
0.0
0.2
0.2
0.2
0.2
0.4
0.9
0.1
0.0
0.8
0.0
0.1
0.3
0.1
0.0
0.1
0.1
0.0
0.0
0.1
0.1
0.0
0.1
0.6
0.1
1.0MdF3'Hc
hr6
MdF3'Hc
hr6
0.3
0.3
0.2
0.2
0.4
0.4
0.3
0.0
0.1
0.3
0.4
0.2
0.5
0.1
0.2
0.2
0.4
0.3
0.4
0.2
0.0
0.3
0.2
0.3
0.2
0.4
1.0MdF3H
MdF3H
0.3
0.3
0.3
0.1
0.1
0.1
0.1
0.7
0.1
0.1
0.3
0.0
0.3
0.0
0.1
0.5
0.0
0.7
0.6
0.1
0.6
0.3
0.8
0.1
0.4
0.1
0.0
1.0MdD
FRMdD
FR0.4
0.6
0.0
0.2
0.2
0.1
0.1
0.3
0.4
0.1
0.4
0.2
0.4
0.1
0.3
0.6
0.2
0.4
0.8
0.5
0.6
0.2
0.7
0.2
0.7
0.0
0.4
0.4
1.0MdFLS
MdFLS
0.1
0.0
0.0
0.0
0.1
0.0
0.1
0.0
0.1
0.0
0.1
0.1
0.1
0.0
0.2
0.2
0.2
0.0
0.1
0.0
0.0
0.0
0.2
0.3
0.1
0.2
0.1
0.1
0.1
1.0MdA
NS
MdA
NS
0.5
0.6
0.2
0.1
0.1
0.1
0.2
0.7
0.3
0.1
0.5
0.1
0.5
0.1
0.3
0.7
0.1
0.7
0.8
0.0
0.8
0.3
0.9
0.1
0.6
0.1
0.2
0.8
0.7
0.3
1.0MdLAR
11stp
air
MdLAR
11stp
air
0.1
0.0
0.4
0.2
0.0
0.2
0.1
0.5
0.0
0.2
0.0
0.0
0.4
0.0
0.0
0.1
0.0
0.2
0.2
0.2
0.3
0.2
0.2
0.2
0.1
0.0
0.0
0.3
0.1
0.0
0.3
1.0MdLAR
12n
dPa
irMdLAR
12n
dPa
ir0.1
0.1
0.3
0.1
0.1
0.2
0.2
0.3
0.0
0.2
0.1
0.1
0.2
0.1
0.1
0.0
0.0
0.0
0.1
0.0
0.2
0.1
0.0
0.2
0.0
0.2
0.1
0.1
0.1
0.1
0.1
0.7
1.0MdLAR
2MdLAR
20.2
0.2
0.3
0.2
0.0
0.1
0.1
0.5
0.1
0.1
0.2
0.0
0.2
0.1
0.1
0.2
0.0
0.7
0.7
0.0
0.4
0.2
0.7
0.0
0.3
0.0
0.3
0.8
0.5
0.1
0.7
0.3
0.1
1.0MdA
NR
MdA
NR
0.5
0.6
0.1
0.0
0.1
0.0
0.1
0.6
0.2
0.1
0.5
0.1
0.3
0.2
0.4
0.7
0.1
0.6
0.8
0.2
0.7
0.2
0.9
0.0
0.5
0.1
0.1
0.6
0.7
0.2
0.8
0.2
0.0
0.4
1.0MdC
3Hchr8
MdC
3Hchr8
0.0
0.3
0.4
0.4
0.2
0.2
0.0
0.0
0.5
0.0
0.0
0.3
0.3
0.0
0.2
0.4
0.3
0.0
0.3
0.5
0.4
0.2
0.2
0.3
0.6
0.2
0.2
0.1
0.5
0.0
0.2
0.1
0.2
0.1
0.2
1.0Metab
olite
AMetabolite
A0.1
0.1
0.1
0.1
0.1
0.2
0.2
0.3
0.0
0.3
0.2
0.1
0.1
0.1
0.1
0.1
0.0
0.1
0.1
0.1
0.0
0.1
0.1
0.2
0.1
0.1
0.1
0.0
0.1
0.1
0.1
0.4
0.6
0.1
0.0
0.0
1.0Metab
olite
BMetabolite
B0.0
0.2
0.2
0.1
0.2
0.2
0.3
0.1
0.0
0.2
0.2
0.2
0.0
0.1
0.2
0.2
0.0
0.1
0.1
0.2
0.0
0.0
0.1
0.2
0.1
0.2
0.2
0.1
0.1
0.1
0.0
0.5
0.6
0.1
0.0
0.0
0.8
1.0Metab
olite
CMetabolite
C0.0
0.1
0.3
0.2
0.2
0.3
0.3
0.3
0.1
0.3
0.1
0.2
0.1
0.1
0.2
0.1
0.1
0.0
0.1
0.1
0.1
0.1
0.1
0.2
0.0
0.2
0.1
0.1
0.1
0.1
0.1
0.6
0.7
0.2
0.0
0.0
0.8
0.8
1.0Metab
olite
DMetabolite
D0.1
0.2
0.3
0.2
0.3
0.2
0.2
0.1
0.2
0.2
0.2
0.2
0.1
0.0
0.2
0.2
0.2
0.0
0.1
0.1
0.0
0.2
0.0
0.1
0.0
0.0
0.2
0.1
0.0
0.1
0.0
0.5
0.5
0.1
0.0
0.0
0.3
0.6
0.7
1.0Metab
olite
EMetabolite
E0.1
0.2
0.4
0.2
0.3
0.3
0.1
0.2
0.3
0.2
0.1
0.2
0.0
0.0
0.3
0.2
0.2
0.0
0.1
0.1
0.0
0.2
0.0
0.2
0.0
0.0
0.2
0.1
0.0
0.1
0.1
0.6
0.6
0.2
0.0
0.0
0.4
0.6
0.8
1.0
1.0Metab
olite
FMetabolite
F0.0
0.1
0.4
0.2
0.3
0.3
0.1
0.3
0.2
0.1
0.1
0.2
0.1
0.1
0.3
0.1
0.2
0.0
0.1
0.2
0.1
0.1
0.1
0.1
0.1
0.0
0.1
0.1
0.1
0.1
0.1
0.7
0.7
0.2
0.0
0.0
0.5
0.6
0.8
0.8
0.9
1.0
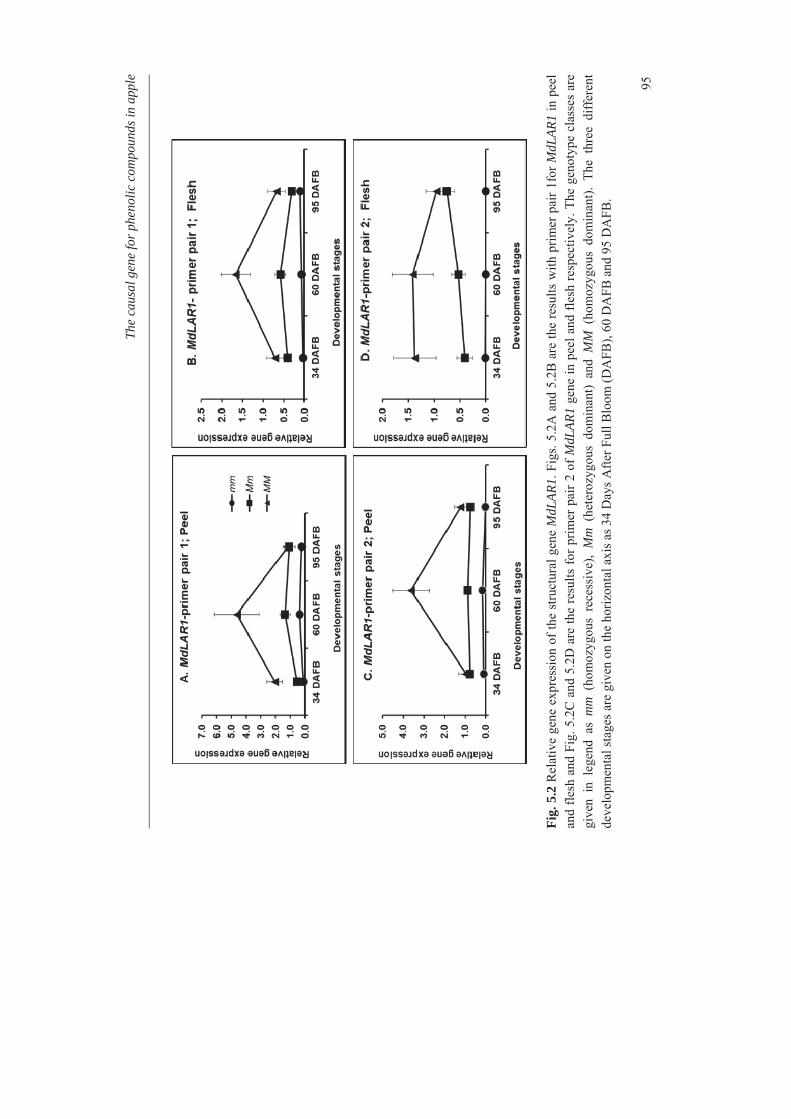
Th
e ca
usal
gen
e fo
r phe
nolic
com
poun
ds in
app
le
95
Fig.
5.2
Rel
ativ
e ge
ne e
xpre
ssio
n of
the
stru
ctur
al g
ene
MdL
AR1.
Fig
s. 5.
2A a
nd 5
.2B
are
the
resu
lts w
ith p
rimer
pai
r 1fo
r MdL
AR1
in p
eel
and
flesh
and
Fig
. 5.2
C a
nd 5
.2D
are
the
resu
lts fo
r prim
er p
air 2
of M
dLAR
1 ge
ne in
pee
l and
fles
h re
spec
tivel
y. T
he g
enot
ype
clas
ses
are
give
n in
leg
end
as m
m (
hom
ozyg
ous
rece
ssiv
e),
Mm
(he
tero
zygo
us d
omin
ant)
and
MM
(ho
moz
ygou
s do
min
ant).
The
thr
ee d
iffer
ent
deve
lopm
enta
l sta
ges a
re g
iven
on
the
horiz
onta
l axi
s as 3
4 D
ays A
fter F
ull B
loom
(DA
FB),
60 D
AFB
and
95
DA
FB.
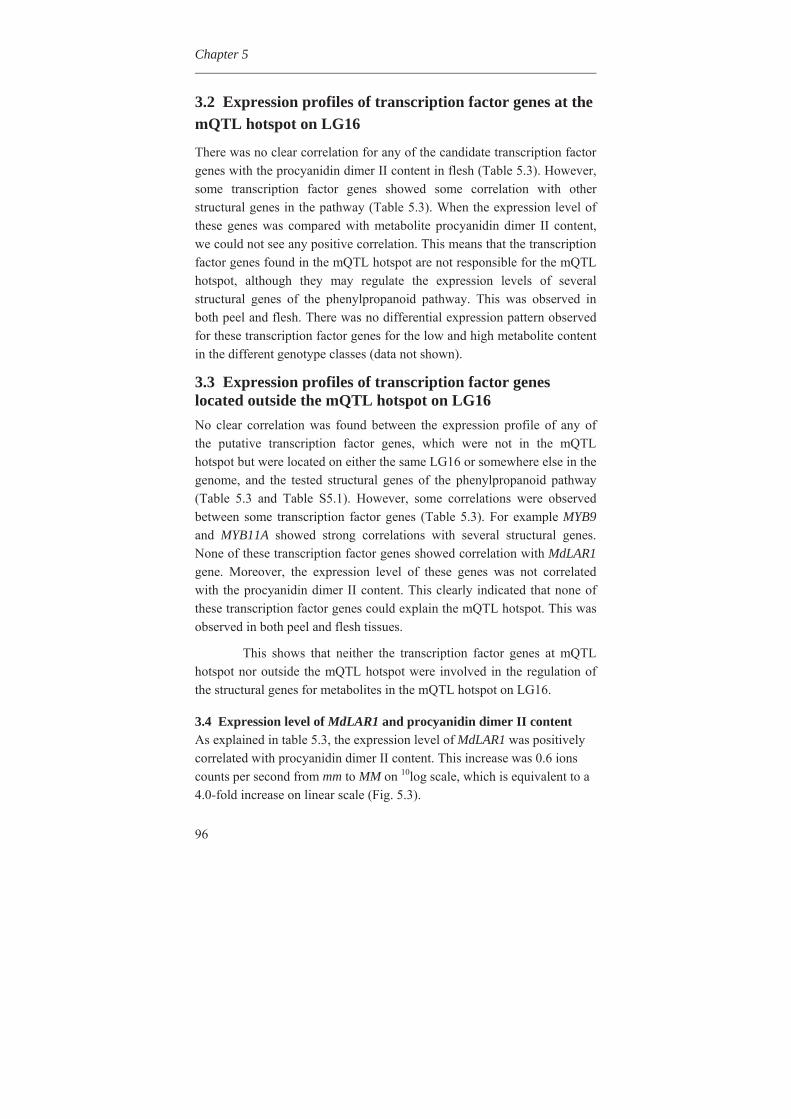
Chapter 5
96
3.2 Expression profiles of transcription factor genes at the mQTL hotspot on LG16
There was no clear correlation for any of the candidate transcription factor genes with the procyanidin dimer II content in flesh (Table 5.3). However, some transcription factor genes showed some correlation with other structural genes in the pathway (Table 5.3). When the expression level of these genes was compared with metabolite procyanidin dimer II content, we could not see any positive correlation. This means that the transcription factor genes found in the mQTL hotspot are not responsible for the mQTL hotspot, although they may regulate the expression levels of several structural genes of the phenylpropanoid pathway. This was observed in both peel and flesh. There was no differential expression pattern observed for these transcription factor genes for the low and high metabolite content in the different genotype classes (data not shown).
3.3 Expression profiles of transcription factor genes located outside the mQTL hotspot on LG16 No clear correlation was found between the expression profile of any of the putative transcription factor genes, which were not in the mQTL hotspot but were located on either the same LG16 or somewhere else in the genome, and the tested structural genes of the phenylpropanoid pathway (Table 5.3 and Table S5.1). However, some correlations were observed between some transcription factor genes (Table 5.3). For example MYB9 and MYB11A showed strong correlations with several structural genes. None of these transcription factor genes showed correlation with MdLAR1 gene. Moreover, the expression level of these genes was not correlated with the procyanidin dimer II content. This clearly indicated that none of these transcription factor genes could explain the mQTL hotspot. This was observed in both peel and flesh tissues.
This shows that neither the transcription factor genes at mQTL hotspot nor outside the mQTL hotspot were involved in the regulation of the structural genes for metabolites in the mQTL hotspot on LG16.
3.4 Expression level of MdLAR1 and procyanidin dimer II content As explained in table 5.3, the expression level of MdLAR1 was positively correlated with procyanidin dimer II content. This increase was 0.6 ions counts per second from mm to MM on 10log scale, which is equivalent to a 4.0-fold increase on linear scale (Fig. 5.3).
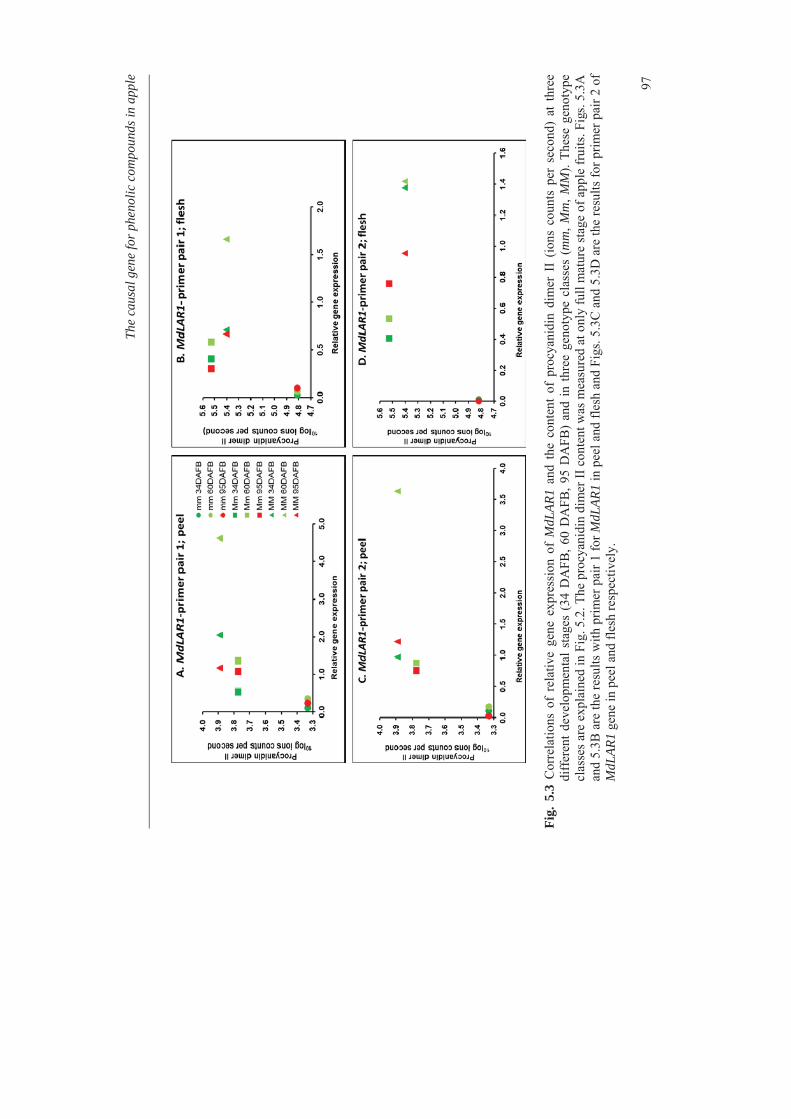
Th
e ca
usal
gen
e fo
r phe
nolic
com
poun
ds in
app
le
97
Fig.
5.3
Cor
rela
tions
of
rela
tive
gene
exp
ress
ion
of M
dLAR
1 an
d th
e co
nten
t of
pro
cyan
idin
dim
er I
I (io
ns c
ount
s pe
r se
cond
) at
thr
ee
diff
eren
t dev
elop
men
tal s
tage
s (3
4 D
AFB
, 60
DA
FB, 9
5 D
AFB
) an
d in
thre
e ge
noty
pe c
lass
es (
mm
, Mm
, MM
). Th
ese
geno
type
cl
asse
s are
exp
lain
ed in
Fig
. 5.2
. The
pro
cyan
idin
dim
er II
con
tent
was
mea
sure
d at
onl
y fu
ll m
atur
e st
age
of a
pple
frui
ts. F
igs.
5.3A
an
d 5.
3B a
re th
e re
sults
with
prim
er p
air 1
for M
dLAR
1 in
pee
l and
fles
h an
d Fi
gs. 5
.3C
and
5.3
D a
re th
e re
sults
for p
rimer
pai
r 2 o
f M
dLAR
1 ge
ne in
pee
l and
fles
h re
spec
tivel
y.
Chapter 5
98
4. DiscussionIn Chapter 4, we reported on mapping of phenolic compounds in ripe fruits of a segregating population derived from the cross between ‘Prima’ and ‘Fiesta’. There appeared to be a strong hotspot of mQTLs at the top of LG16. Annotation of the metabolites showed that the compounds that mapped on the LG16 hotspot belong to the phenylpropanoid pathway of secondary metabolites (adapted Fig. 5.3 from chapter 4).
Fig. 5.4 Mapping results of phenolic compounds in the mature apple fruits. The metabolites that mapped at the mQTL hotspot on LG16 are shown in bold. The mQTL which was found negatively correlated with other mQTLs is in bold italic. The LOD value, % explained variance and favorable allele(s) for increased content of the metabolite are shown in the legend for each mQTL (Fig. adapted from Chapter 4). The alleles ‘a, b’ come from parent ‘Prima’ and ‘c, d’ are from parent ‘Fiesta’.
The causal gene for phenolic compounds in apple
99
We wanted to detect the underlying gene(s) in this mQTL hotspot. Therefore, in the present research, gene expression studies in selected genotypes for the candidate genes in the mQTL region were performed. In addition, structural genes of the phenylpropanoid pathway and putative transcription factor genes that are candidates for regulating the phenylpropanoid pathway and located elsewhere were also evaluated as mentioned in Materials and Methods section in detail.
4.1 MdLAR1 seems to be the only gene which can explain the mQTL hotspot on LG16
As shown in Table 5.3, MdLAR1 was the only gene for which the expression was clearly correlated with the metabolite content. None of the other genes showed a clear correlation with procyanidin dimer II content. Moreover, Fig. 5.2 shows clearly that the expression of MdLAR1 was low for the genotypes that had inherited the recessive alleles (mm), and had low content of the representative metabolite procyanidin dimer II. The progeny that had inherited one or two dominant alleles (Mm, MM) had higher expression levels of MdLAR1 and higher content of procyanidin dimer II (Fig. 5.3) and this pattern was observed both in peel and in flesh. This was not the case for any of the other studied genes, which indicates that MdLAR1 was responsible for the hotspot of mQTLs on LG16. Further, it shows that MdLAR1 exerted its influence by means of its expression level. Most likely the recessive alleles of MdLAR1 did not lose their ability to increase the metabolite content via a mutation that affected the MdLAR1 gene function, but lost their ability to increase the metabolite content because of a mutation that led to a low transcript level of the recessive MdLAR1 alleles. This mutation may be in the promoter region of MdLAR1, or another region of the gene that affects the expression level of this gene. The sequences of MdLAR1 in ‘Prima’ x ‘Fiesta’ also showed good alignment with sequences from cv. ‘Golden Delicious’ on which the primers for q RT-PCR were designed.
Based on the obtained results in this study, it is clear that MdLAR1 is the probable responsible gene for controlling the mQTL hotspot for phenolic compounds on LG16 of apple.
4.2 More upstream mQTLs in the pathway might be explained by a feed-back mechanism
The MdLAR1 gene is located rather downstream in the phenylpropanoid pathway (Fig. 5.4). However we found several mQTLs related to upstream metabolites in this pathway in the same mQTL hotspot on LG16. This may indicate that more upstream
Chapter 5
100
genes could play a role in causing the mQTL hotspot but this was not indicated by the expression data. An alternative explanation is a feedback mechanism determined by the low expression of MdLAR1 in the recessive plant.
In literature it has been reported that flavonoid pathway is often regulated at the 4-coumarate-CoA ligase (4CL) step (Muir et al., 2001; Verhoeyen et al., 2002; Voo Kui et al., 1995). This fits with our results and could explain the mQTLs found for metabolites upstream of the MdLAR1 step such as for phloridzin and kaempferol glycoside. These compounds are upstream of the 4CL step and were also found in mQTL hotspot on LG16. This would suggest regulation at enzyme activity level and not at gene expression level (Table 5.3). The coumaroyl hexoside and quinic acid mQTL which has negative correlation with other mQTLs found on LG16 could be explained by the MdLAR1 activity. The strong activity of MdLAR1 could cause a strong flow towards the production of procyanidins causing a decrease in the coumaroyl hexoside content. There are also reports on feedback inhibition in tomato peel flavonoid pathway upstream of the chalcone isomerase step (Muir et al., 2001; Verhoeyen et al., 2002) as well as direct in vitro evidence for inhibition of 4CL by naringenin chalcone (Voo Kui et al., 1995). So probably this negative feedback mechanism also plays a role in apple. However, this has been reported for only one compound so far i.e. naringenin and to prove this, further research is needed.
4.3 Metabolite content at the ripe stage may be a result of expression of genes at earlier stages
Gene expression can be studied at different fruit developmental stages. Metabolite genes may be expressed earlier in the fruit development and give their final product during later stages. Therefore, the fruit developmental stage is critical for the expression of such genes. Janssen et al. (2008) made gene expression studies for fruit development at eight time points using microarray. They found that gene expression in apple fruit is depending on developmental stages (Janssen et al., 2008). In the present study gene expression was performed at three different developmental stages i.e. 34 DAFB, 60 DAFB and 95 DAFB (Fig. 5.1). Different expression levels were found at different stages. The mid stage i.e. 60 DAFB showed increased expression of the MdLAR1 gene. This indicated that perhaps the metabolites were produced more at certain stage. However, in the present study metabolites were measured only at mature stage and therefore it is apparently difficult to prove about this hypothesis.
The causal gene for phenolic compounds in apple
101
4.4 Metabolic engineering
Two classes of genes determine the flavonoid pathway of secondary metabolites, i.e. structural genes which encode enzymes that directly participate in the formation of flavonoids such as PAL, DFR, and regulatory genes that control the expression of these structural genes (Szankowski et al., 2009). Harrigan et al (2007) also found that the genetic diversity in metabolites as intermediate and end products are controlled by both structural and transcription factor genes. Most known regulatory genes involved in the regulation of genes of the flavonoid pathway are belonging to MYB and basic helix-loop-helix (bHLH) transcription factor families (Szankowski et al., 2009). In our case, we have shown that a structural gene is responsible for the mQTL hotspot, rather than a regulatory gene.
Metabolic engineering is an interesting and growing field and several groups in the world are performing research in this area in apple. Using metabolic engineering many genes responsible for regulating important metabolites have been cloned. For example, recently, three genes, designated as MdF3’H1, MdF3’H2-1, and MdF3’H2-2 were identified from cv. ‘GoldRush’ based on EST database assembly and BAC library screening (Han and Korban, 2009). In another study, using a functional genomics approach, a novel UGT from apple belonging to the UGT88 family was identified and characterized. It was established that the MdPGT1 enzyme utilizes the dihydrochalcone phloretin as its primary substrate (Jugde et al., 2008). Relative expression of MdPGT1 was assessed in apple root, leaf, flower and fruit by quantitative PCR experiments which were repeated twice (Jugde et al., 2008). In another study, three genes encoding enzymes involved in condensed tannins synthesis from cDNA of peel of the red apple variety ‘Cripps Red’, two LAR and an ANS gene, were cloned. Steady-state transcript levels of the CT genes and the other structural genes of the flavonoids pathway were measured by Real Time PCR and correlated with flavonoid accumulation in the peel throughout early fruit growth and during ripening (Takos et al., 2006).
Genes involved in anthocyanin biosynthetic pathway, which is a sub-branch in the flavonoid pathway were isolated from apple fruit and characterized to understand the regulation of the genes during fruit development (Kim et al., 2003). Espley et al (2007) isolated an apple transcription factor gene, MdMYB10, responsible for skin colour of apple fruits. A mutant allele was found in the apple cv. Red Field that results in purple-stained skin and flesh of fruits. We reported the mutant MdMYB10 allele from cv. Red Field as a selectable marker gene for plant transformation, Chapter 7 (Kortstee et al., 2011). In pear, a close relative to apple, Fischer et al (2007) have cloned cDNAs of main enzymes such as PAL, CHS, CHI, FLS, DFR, LAR1, LAR2, ANS, ANR, and flavonoid 7-O-glucosyltransferase (F7GT),
Chapter 5
102
which have been isolated via homology with apple sequences to elucidate gene functions, gene copy numbers, and gene relationships within the Maloideae.
Next step could be genetic engineering with these genes. All these findings indicate that in coming years more research will be focused on gene cloning and gene characterization of apple and other important fruits for potential health beneficial compounds in different biochemical pathways such as flavonoid pathway.
4.5 Marker assisted breeding and cisgenesis
The dominant allele of the MdLAR1 gene causing increased content of metabolites which are potentially health beneficial could be used in marker assisted selection of current apple breeding programs. This selection could be made at seedling stage. This would reduce the production costs for the breeders by discarding the undesired seedlings at earlier stage of growth. Another possibility is to clone the dominant allele or alleles for engineering increased content of metabolite(s) into existing apple cultivars by different transformation technologies including cisgenesis. In this case cisgenesis is defined as ‘the genetic modification of a recipient plant with the natural dominant allele of MdLAR1 from the apple variety itself’ (Schouten et al., 2006a, b).
Chapter 6
Differences in acidity of mature apples are mainly
caused by a malic acid transporter gene on LG16
Sabaz Ali Khan1, Jules Beekwilder2, Jan G. Schaart1, Roland Mumm2, Evert Jacobsen1
, and Henk J. Schouten1*
1Wageningen University and Research Centre, Wageningen UR Plant Breeding, P.O. Box 386, 6700 AJ Wageningen, The Netherlands. 2 Wageningen University and Research Centre, Plant Research International, Business Unit Bioscience, P.O. Box 16, 6700 AA Wageningen, The Netherlands. *For correspondence (fax +31317418094; e-mail [email protected]) Submitted
Chapter 6
104
Abstract Apple (Malus x domestica Borkh) is an important fruit crop of temperate regions. Acidity has profound effects on the organoleptic quality of apples. Malic acid is the predominant organic acid associated with the pH in apples. Its concentration decreases during development and maturation of the fruit and varies strongly between cultivars. It is synthesized in the cytosol, and transported into the vacuoles, where it can be accumulated. In view of the vital role of malic acid in the citric acid cycle, it is unlikely that apples of low malic acid content, have a defect in a structural gene that would hamper the production of malic acid. Furthermore, the cytosol where most enzymatic activities occur should have a rather constant pH. In view of that, it is more likely that differences in malic acid content and pH in apple are caused by differences in accumulation of malic acid in the vacuole. The pH of mature apples was genetically mapped on LG16 in the segregating F1 population from the cross ‘Prima’ x ‘Fiesta’. A strong negative correlation was found between malic acid content and pH of apples, which confirmed the strong impact of malic acid on pH. The genetic position of the pH gene on LG16 in the segregating population from ‘Prima’ x ‘Fiesta’ was determined more precisely by adding more markers and applying graphical genotyping. In the obtained genetic window, two candidate genes, i.e. MdALMT1 and MdALMT2 were detected, using the published genome sequence information of cv. ‘Golden Delicious’. Putatively, these two candidate genes are malic acid transporters. The relative expression of the candidate gene MdALMT1 showed no correlation to pH or malic acid content, whereas the expression of MdALMT2 had a significant positive correlation with the malic acid content and a negative correlation with pH. The combination of the genetic position, annotation and the expression profile indicates that the malic acid transporter gene MdALMT2 was responsible for the clear differences in malic acid content and pH in mature apple fruits of the segregating F1 population. This malic acid transporter gene is located on the top of LG16. The genetic inheritance of at least one dominant allele of this gene sufficed for an increased expression level that led to a three-fold increase of the malic acid concentration and a reduction of the pH from 4 to 3 in ripe apples, compared to the presence of the recessive, lowly expressed allele only. To our knowledge, this is the first time that the genetic segregation of the pH in apples is assigned to a specific gene. Further, this gene has not been reported yet in conjunction to pH of apple or other fruits.
Causal gene for acidity in apple
105
1. Introduction Apple (Malus x domestica Borkh) is an important fruit crop of temperate regions. Its consumption is global, available throughout the year, and represents a major source of dietary antioxidants (Wojdy o et al., 2008). The major part of the production is consumed as fresh fruits, while a lesser part is processed into juices, concentrates, and purees (Wojdy o et al., 2008).
Acidity has profound effects on the perception of apple fruit quality (Lobit et al., 2006). In organoleptic evaluations of apple juice, sweet taste was found to be strongly correlated with low acid content. Sweetness appeared to be almost exclusively determined by the pH while the sugar content was found to have a minor role (Visser et al., 1968). A proper balance between sugar and acid content is therefore important for a desired apple variety (Brown and Harvey, 1971). From a genetic point of view, however, the sweetness (sugar content) and acidity are inherited independently (Brown and Harvey, 1971). Sweetness is quantitatively inherited while acidity is mainly caused by a single gene (Brown and Harvey, 1971).
Malic acid is the predominant acid in many fruits, especially in apples (Yao et al., 2009). It was first isolated in 1785 by Carl Wilhelm Scheele from apple juice (Jensen, 2007). Malic acid contributes to the sourness of fruits, and is the source of extreme tartness in confectionery. When added to food products, it is denoted by E number E296 (http://www.food-info.net/uk/e/e296.htm). Via acidity, malate content of apple is an important determinant for fruit quality, and has enormous effects on the taste and flavour (Maliepaard et al., 1998). Among the eleven organic acids in apple pulp and five in the whole fruit, malic acid was the predominant one (Hulme et al., 1971). Malic acid accumulated up to 100 mmol g-1 fresh weight in young fruit, and gradually decreased with fruit ripening (Ulrich R, 1970). Zhang et al. (2010) found that malic acid was the major organic acid in the esh of mature ‘Honeycrisp’ apples. Yamaki (1984) isolated vacuoles from apple fruit flesh, and detected that more than 90% of the malic acid was located in the vacuole.
The salts and esters of malic acid are known as malates. Malate is the predominant form of malic acid in many fresh fruits (Yao et al., 2011). Malate works together with other organic acids, soluble sugars and aromas to contribute to the overall organoleptic quality of fruits (Yao et al., 2011). Malic acid is also known as carboxylic diacid. It has two stereoisomeric forms (L- and D-enantiomers), though only the L-isomer exists naturally (Yamamoto et al., 2001).
Malic acid, in the form of its anion malate, occurs in all metabolizing cells, as a key intermediate in the major energy-producing biochemical pathway, known as the citric acid or Krebs cycle that occurs in the mitochondria. Also it is part of the cytosolic pyruvate metabolism as an intermediate between oxaloacetate and acetyl CoA. Both the citric acid cycle and the pyruvate metabolism have extensively been
Chapter 6
106
studied, and the enzymes involved in metabolism of malate are well known. For example PEPC is considered to be an important enzyme involved in fruit malic acid synthesis, while cyME is indicated as the key enzyme in malic acid degradation (Yao et al., 2009; Berüter, 2004). Yao et al. (2011) cloned the apple gene MdcyMDH, encoding the cyMDH enzyme that catalyzes the reaction from oxalacetic acid to malate. The expression level of this gene was positively correlated with malate dehydrogenase activity throughout fruit development, but not with malate content (Yao et al., 2011). The activity of the citric acid cycle is regulated based on requirements of energy, rather than on requirements of fruit acidity. In fact, acidity of apples is considered to be determined by storage of malate in the vacuole (Ulrich R, 1970).
The vacuole is by far the largest organelle in fruits and can occupy more than 90 % of the cell volume (Shiratake and Martinoia, 2007). This is because it stores sugars, organic acids and secondary metabolites in high concentration which are required for the fruit quality (Shiratake and Martinoia, 2007). Transport of metabolites into the vacuole is often an active, energy-requiring process, in which many different transporters are involved (Shiratake and Martinoia, 2007).
Vacuolar transport of malic acid in Arabidopsis is controlled by a transporter (Emmerlich et al., 2003) and by a channel (Kovermann et al., 2007). The channel is more passive, and can be opened or closed, but there is no energy needed to transport the malic acid, while a transporter consumes energy when pumping malic acid into the vacuole. A detailed biochemical analysis of two genetic variants of cv. “Usterapfel” revealed that vacuolar transport of malic acid plays an important role in malic acid fruit content (Beruter, 2004). Therefore it is likely that malic acid transporters, homologous to those found in Arabidopsis, play a role in differences in apple acidity.
In previous work, a segregating F1 population from the cross of apple cultivars ‘Prima’ and ‘Fiesta’ was used to map acidity on a locus of linkage group 16. Recently, the genome sequence of the apple cv. ‘Golden Delicious’ has been published. Here information of both genetic and genomic resources has been used for detection of a novel putative vacuolar malic acid transporter MdALMT2, determining malic acid levels and acidity in apple fruit.
2. Materials and Methods
2.1 Genetic mapping of the pH locus
Maliepaard et al (1998) were the first to construct genetic linkage maps for apple, covering all 17 chromosomes. They used a segregating F1 population of 164 genotypes from the cross ‘Prima’ x ‘Fiesta’. They measured the pH of mature fruits
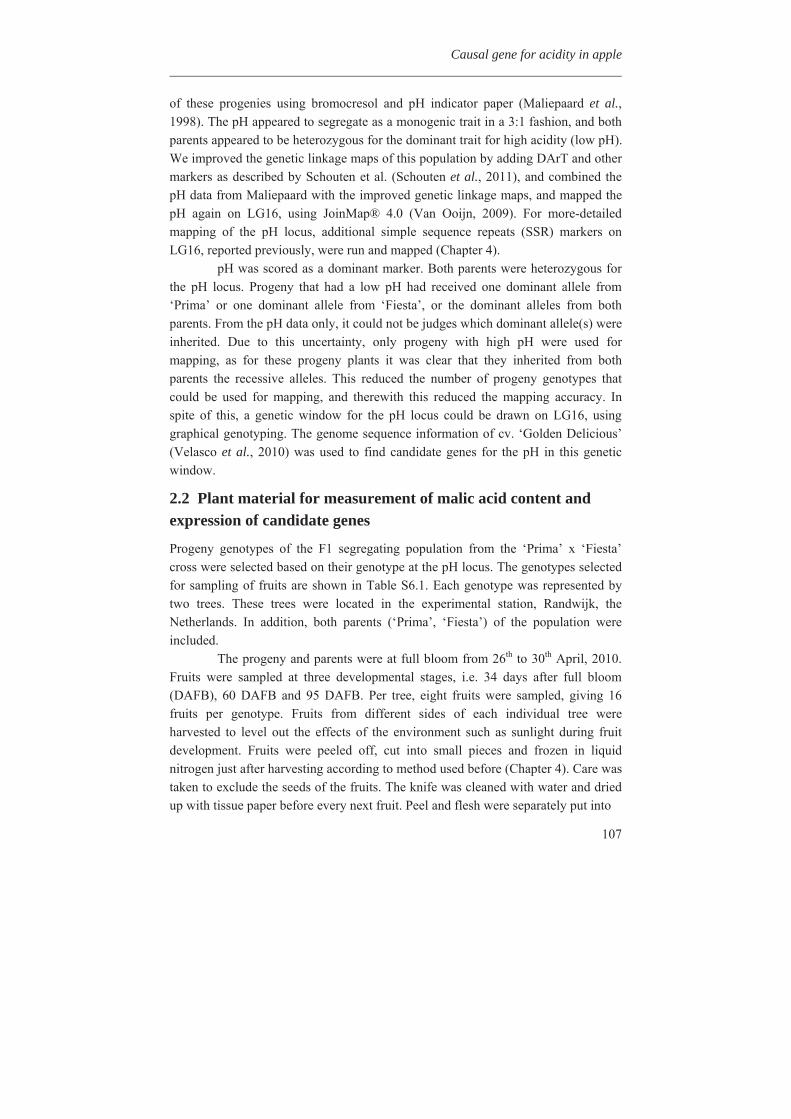
Causal gene for acidity in apple
107
of these progenies using bromocresol and pH indicator paper (Maliepaard et al., 1998). The pH appeared to segregate as a monogenic trait in a 3:1 fashion, and both parents appeared to be heterozygous for the dominant trait for high acidity (low pH). We improved the genetic linkage maps of this population by adding DArT and other markers as described by Schouten et al. (Schouten et al., 2011), and combined the pH data from Maliepaard with the improved genetic linkage maps, and mapped the pH again on LG16, using JoinMap® 4.0 (Van Ooijn, 2009). For more-detailed mapping of the pH locus, additional simple sequence repeats (SSR) markers on LG16, reported previously, were run and mapped (Chapter 4).
pH was scored as a dominant marker. Both parents were heterozygous for the pH locus. Progeny that had a low pH had received one dominant allele from ‘Prima’ or one dominant allele from ‘Fiesta’, or the dominant alleles from both parents. From the pH data only, it could not be judges which dominant allele(s) were inherited. Due to this uncertainty, only progeny with high pH were used for mapping, as for these progeny plants it was clear that they inherited from both parents the recessive alleles. This reduced the number of progeny genotypes that could be used for mapping, and therewith this reduced the mapping accuracy. In spite of this, a genetic window for the pH locus could be drawn on LG16, using graphical genotyping. The genome sequence information of cv. ‘Golden Delicious’ (Velasco et al., 2010) was used to find candidate genes for the pH in this genetic window.
2.2 Plant material for measurement of malic acid content and expression of candidate genes
Progeny genotypes of the F1 segregating population from the ‘Prima’ x ‘Fiesta’ cross were selected based on their genotype at the pH locus. The genotypes selected for sampling of fruits are shown in Table S6.1. Each genotype was represented by two trees. These trees were located in the experimental station, Randwijk, the Netherlands. In addition, both parents (‘Prima’, ‘Fiesta’) of the population were included.
The progeny and parents were at full bloom from 26th to 30th April, 2010. Fruits were sampled at three developmental stages, i.e. 34 days after full bloom (DAFB), 60 DAFB and 95 DAFB. Per tree, eight fruits were sampled, giving 16 fruits per genotype. Fruits from different sides of each individual tree were harvested to level out the effects of the environment such as sunlight during fruit development. Fruits were peeled off, cut into small pieces and frozen in liquid nitrogen just after harvesting according to method used before (Chapter 4). Care was taken to exclude the seeds of the fruits. The knife was cleaned with water and dried up with tissue paper before every next fruit. Peel and flesh were separately put into
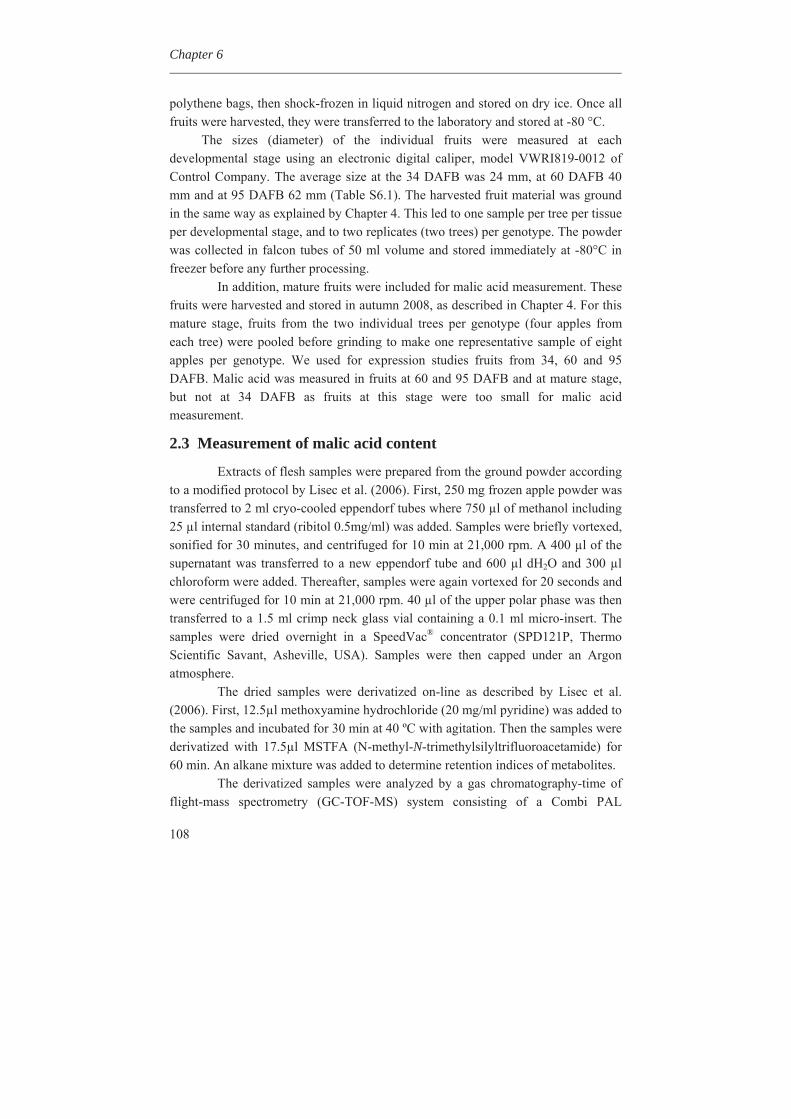
Chapter 6
108
polythene bags, then shock-frozen in liquid nitrogen and stored on dry ice. Once all fruits were harvested, they were transferred to the laboratory and stored at -80 °C. The sizes (diameter) of the individual fruits were measured at each developmental stage using an electronic digital caliper, model VWRI819-0012 of Control Company. The average size at the 34 DAFB was 24 mm, at 60 DAFB 40 mm and at 95 DAFB 62 mm (Table S6.1). The harvested fruit material was ground in the same way as explained by Chapter 4. This led to one sample per tree per tissue per developmental stage, and to two replicates (two trees) per genotype. The powder was collected in falcon tubes of 50 ml volume and stored immediately at -80°C in freezer before any further processing. In addition, mature fruits were included for malic acid measurement. These fruits were harvested and stored in autumn 2008, as described in Chapter 4. For this mature stage, fruits from the two individual trees per genotype (four apples from each tree) were pooled before grinding to make one representative sample of eight apples per genotype. We used for expression studies fruits from 34, 60 and 95 DAFB. Malic acid was measured in fruits at 60 and 95 DAFB and at mature stage, but not at 34 DAFB as fruits at this stage were too small for malic acid measurement.
2.3 Measurement of malic acid content
Extracts of flesh samples were prepared from the ground powder according to a modified protocol by Lisec et al. (2006). First, 250 mg frozen apple powder was transferred to 2 ml cryo-cooled eppendorf tubes where 750 μl of methanol including 25 μl internal standard (ribitol 0.5mg/ml) was added. Samples were briefly vortexed, sonified for 30 minutes, and centrifuged for 10 min at 21,000 rpm. A 400 μl of the supernatant was transferred to a new eppendorf tube and 600 μl dH2O and 300 μl chloroform were added. Thereafter, samples were again vortexed for 20 seconds and were centrifuged for 10 min at 21,000 rpm. 40 μl of the upper polar phase was then transferred to a 1.5 ml crimp neck glass vial containing a 0.1 ml micro-insert. The samples were dried overnight in a SpeedVac® concentrator (SPD121P, Thermo Scientific Savant, Asheville, USA). Samples were then capped under an Argon atmosphere.
The dried samples were derivatized on-line as described by Lisec et al. (2006). First, 12.5μl methoxyamine hydrochloride (20 mg/ml pyridine) was added to the samples and incubated for 30 min at 40 ºC with agitation. Then the samples were derivatized with 17.5μl MSTFA (N-methyl-N-trimethylsilyltrifluoroacetamide) for 60 min. An alkane mixture was added to determine retention indices of metabolites.
The derivatized samples were analyzed by a gas chromatography-time of flight-mass spectrometry (GC-TOF-MS) system consisting of a Combi PAL
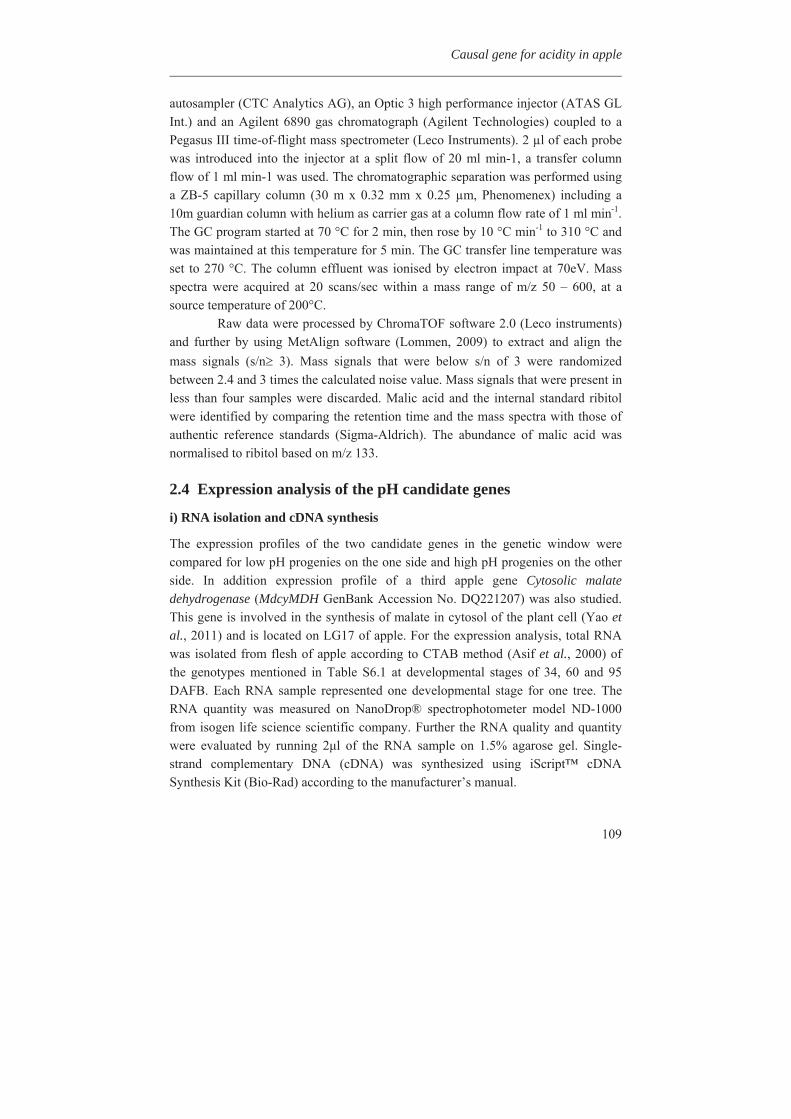
Causal gene for acidity in apple
109
autosampler (CTC Analytics AG), an Optic 3 high performance injector (ATAS GL Int.) and an Agilent 6890 gas chromatograph (Agilent Technologies) coupled to a Pegasus III time-of-flight mass spectrometer (Leco Instruments). 2 μl of each probe was introduced into the injector at a split flow of 20 ml min-1, a transfer column flow of 1 ml min-1 was used. The chromatographic separation was performed using a ZB-5 capillary column (30 m x 0.32 mm x 0.25 μm, Phenomenex) including a 10m guardian column with helium as carrier gas at a column flow rate of 1 ml min-1. The GC program started at 70 °C for 2 min, then rose by 10 °C min-1 to 310 °C and was maintained at this temperature for 5 min. The GC transfer line temperature was set to 270 °C. The column effluent was ionised by electron impact at 70eV. Mass spectra were acquired at 20 scans/sec within a mass range of m/z 50 – 600, at a source temperature of 200°C.
Raw data were processed by ChromaTOF software 2.0 (Leco instruments) and further by using MetAlign software (Lommen, 2009) to extract and align the mass signals (s/n 3). Mass signals that were below s/n of 3 were randomized between 2.4 and 3 times the calculated noise value. Mass signals that were present in less than four samples were discarded. Malic acid and the internal standard ribitol were identified by comparing the retention time and the mass spectra with those of authentic reference standards (Sigma-Aldrich). The abundance of malic acid was normalised to ribitol based on m/z 133.
2.4 Expression analysis of the pH candidate genes
i) RNA isolation and cDNA synthesis
The expression profiles of the two candidate genes in the genetic window were compared for low pH progenies on the one side and high pH progenies on the other side. In addition expression profile of a third apple gene Cytosolic malate dehydrogenase (MdcyMDH GenBank Accession No. DQ221207) was also studied. This gene is involved in the synthesis of malate in cytosol of the plant cell (Yao et al., 2011) and is located on LG17 of apple. For the expression analysis, total RNA was isolated from flesh of apple according to CTAB method (Asif et al., 2000) of the genotypes mentioned in Table S6.1 at developmental stages of 34, 60 and 95 DAFB. Each RNA sample represented one developmental stage for one tree. The RNA quantity was measured on NanoDrop® spectrophotometer model ND-1000 from isogen life science scientific company. Further the RNA quality and quantity were evaluated by running 2 l of the RNA sample on 1.5% agarose gel. Single-strand complementary DNA (cDNA) was synthesized using iScript™ cDNA Synthesis Kit (Bio-Rad) according to the manufacturer’s manual.
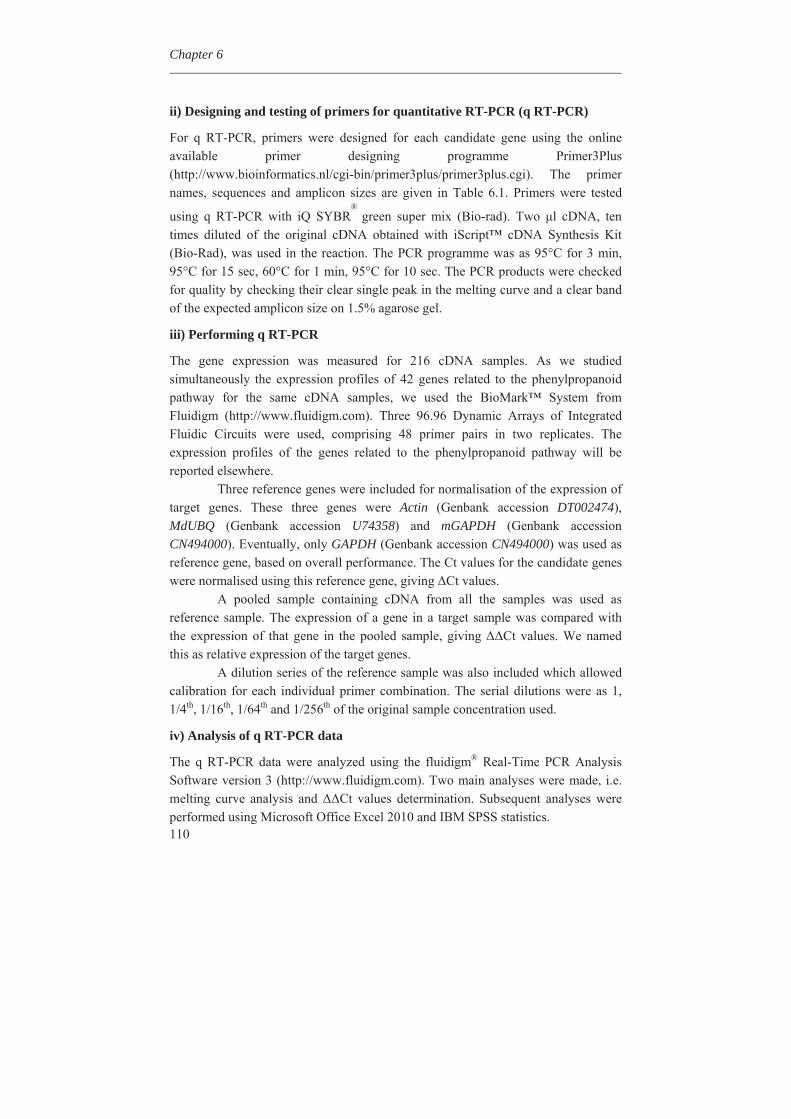
Chapter 6
110
ii) Designing and testing of primers for quantitative RT-PCR (q RT-PCR)
For q RT-PCR, primers were designed for each candidate gene using the online available primer designing programme Primer3Plus (http://www.bioinformatics.nl/cgi-bin/primer3plus/primer3plus.cgi). The primer names, sequences and amplicon sizes are given in Table 6.1. Primers were tested
using q RT-PCR with iQ SYBR®
green super mix (Bio-rad). Two l cDNA, ten times diluted of the original cDNA obtained with iScript™ cDNA Synthesis Kit (Bio-Rad), was used in the reaction. The PCR programme was as 95°C for 3 min, 95°C for 15 sec, 60°C for 1 min, 95°C for 10 sec. The PCR products were checked for quality by checking their clear single peak in the melting curve and a clear band of the expected amplicon size on 1.5% agarose gel.
iii) Performing q RT-PCR
The gene expression was measured for 216 cDNA samples. As we studied simultaneously the expression profiles of 42 genes related to the phenylpropanoid pathway for the same cDNA samples, we used the BioMark™ System from Fluidigm (http://www.fluidigm.com). Three 96.96 Dynamic Arrays of Integrated Fluidic Circuits were used, comprising 48 primer pairs in two replicates. The expression profiles of the genes related to the phenylpropanoid pathway will be reported elsewhere.
Three reference genes were included for normalisation of the expression of target genes. These three genes were Actin (Genbank accession DT002474), MdUBQ (Genbank accession U74358) and mGAPDH (Genbank accession CN494000). Eventually, only GAPDH (Genbank accession CN494000) was used as reference gene, based on overall performance. The Ct values for the candidate genes were normalised using this reference gene, giving Ct values.
A pooled sample containing cDNA from all the samples was used as reference sample. The expression of a gene in a target sample was compared with the expression of that gene in the pooled sample, giving Ct values. We named this as relative expression of the target genes.
A dilution series of the reference sample was also included which allowed calibration for each individual primer combination. The serial dilutions were as 1, 1/4th, 1/16th, 1/64th and 1/256th of the original sample concentration used.
iv) Analysis of q RT-PCR data
The q RT-PCR data were analyzed using the fluidigm® Real-Time PCR Analysis Software version 3 (http://www.fluidigm.com). Two main analyses were made, i.e. melting curve analysis and Ct values determination. Subsequent analyses were performed using Microsoft Office Excel 2010 and IBM SPSS statistics.
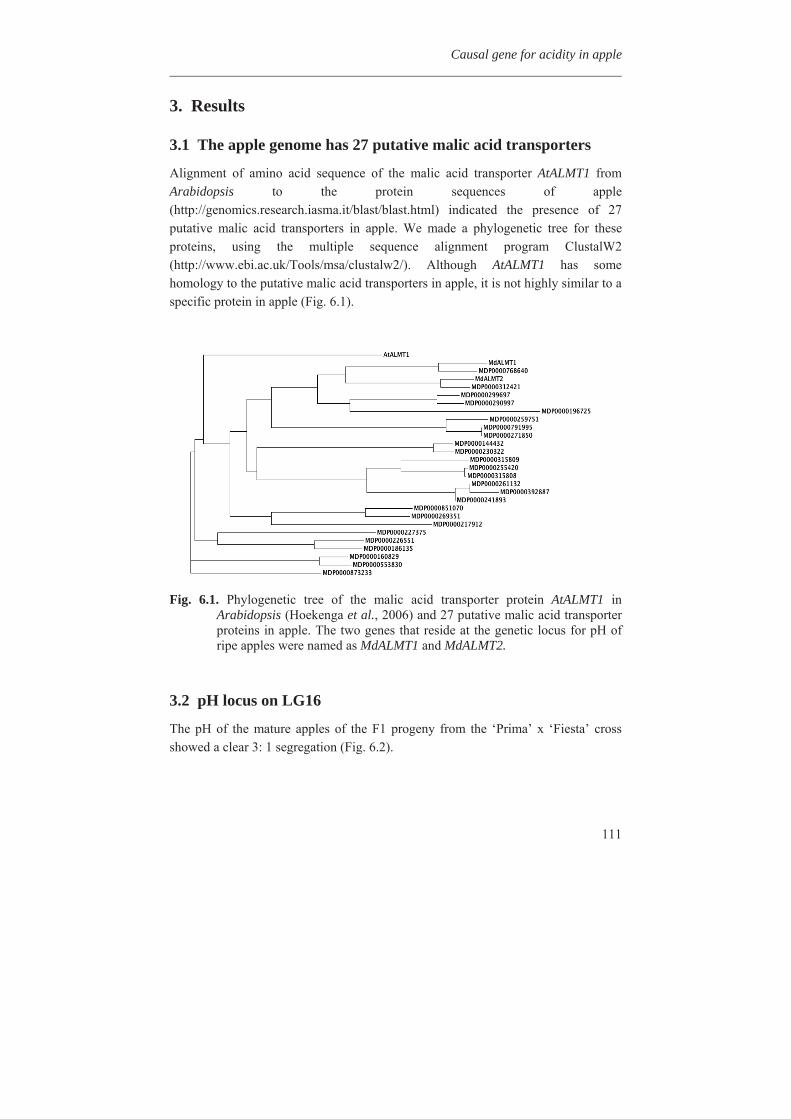
Causal gene for acidity in apple
111
3. Results
3.1 The apple genome has 27 putative malic acid transporters
Alignment of amino acid sequence of the malic acid transporter AtALMT1 from Arabidopsis to the protein sequences of apple (http://genomics.research.iasma.it/blast/blast.html) indicated the presence of 27 putative malic acid transporters in apple. We made a phylogenetic tree for these proteins, using the multiple sequence alignment program ClustalW2 (http://www.ebi.ac.uk/Tools/msa/clustalw2/). Although AtALMT1 has some homology to the putative malic acid transporters in apple, it is not highly similar to a specific protein in apple (Fig. 6.1).
Fig. 6.1. Phylogenetic tree of the malic acid transporter protein AtALMT1 in
Arabidopsis (Hoekenga et al., 2006) and 27 putative malic acid transporter proteins in apple. The two genes that reside at the genetic locus for pH of ripe apples were named as MdALMT1 and MdALMT2.
3.2 pH locus on LG16
The pH of the mature apples of the F1 progeny from the ‘Prima’ x ‘Fiesta’ cross showed a clear 3: 1 segregation (Fig. 6.2).
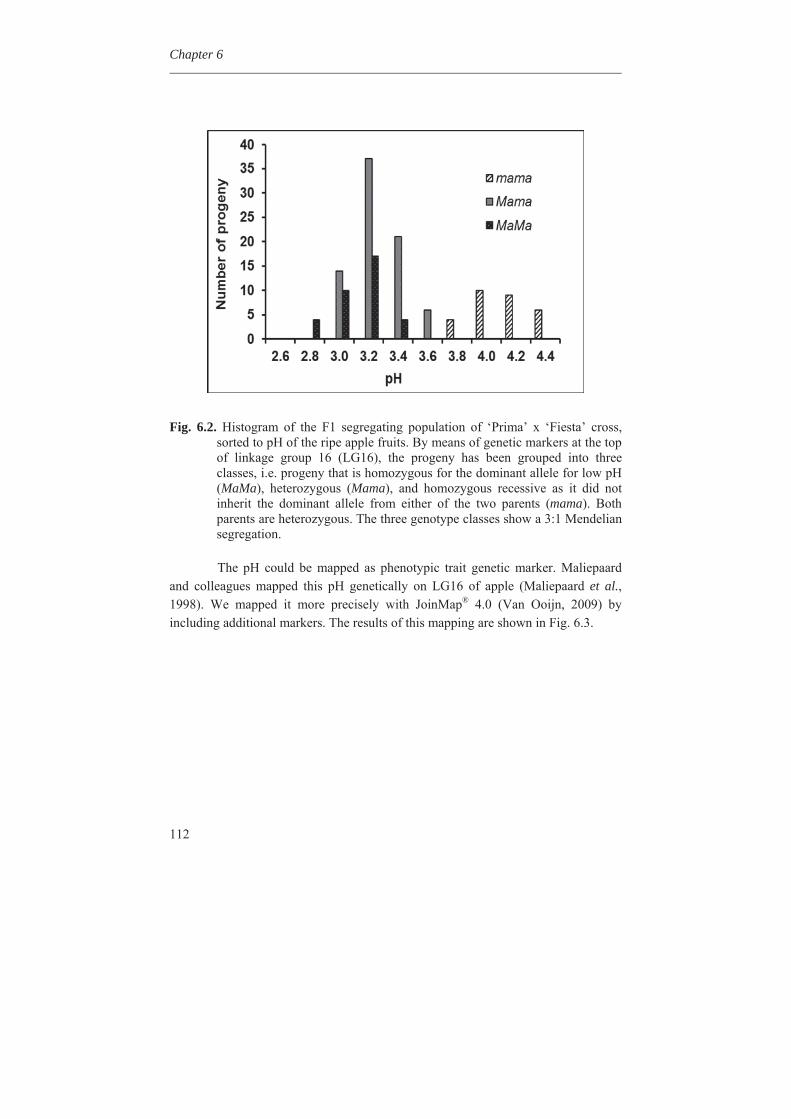
Chapter 6
112
Fig. 6.2. Histogram of the F1 segregating population of ‘Prima’ x ‘Fiesta’ cross,
sorted to pH of the ripe apple fruits. By means of genetic markers at the top of linkage group 16 (LG16), the progeny has been grouped into three classes, i.e. progeny that is homozygous for the dominant allele for low pH (MaMa), heterozygous (Mama), and homozygous recessive as it did not inherit the dominant allele from either of the two parents (mama). Both parents are heterozygous. The three genotype classes show a 3:1 Mendelian segregation. The pH could be mapped as phenotypic trait genetic marker. Maliepaard
and colleagues mapped this pH genetically on LG16 of apple (Maliepaard et al., 1998). We mapped it more precisely with JoinMap® 4.0 (Van Ooijn, 2009) by including additional markers. The results of this mapping are shown in Fig. 6.3.
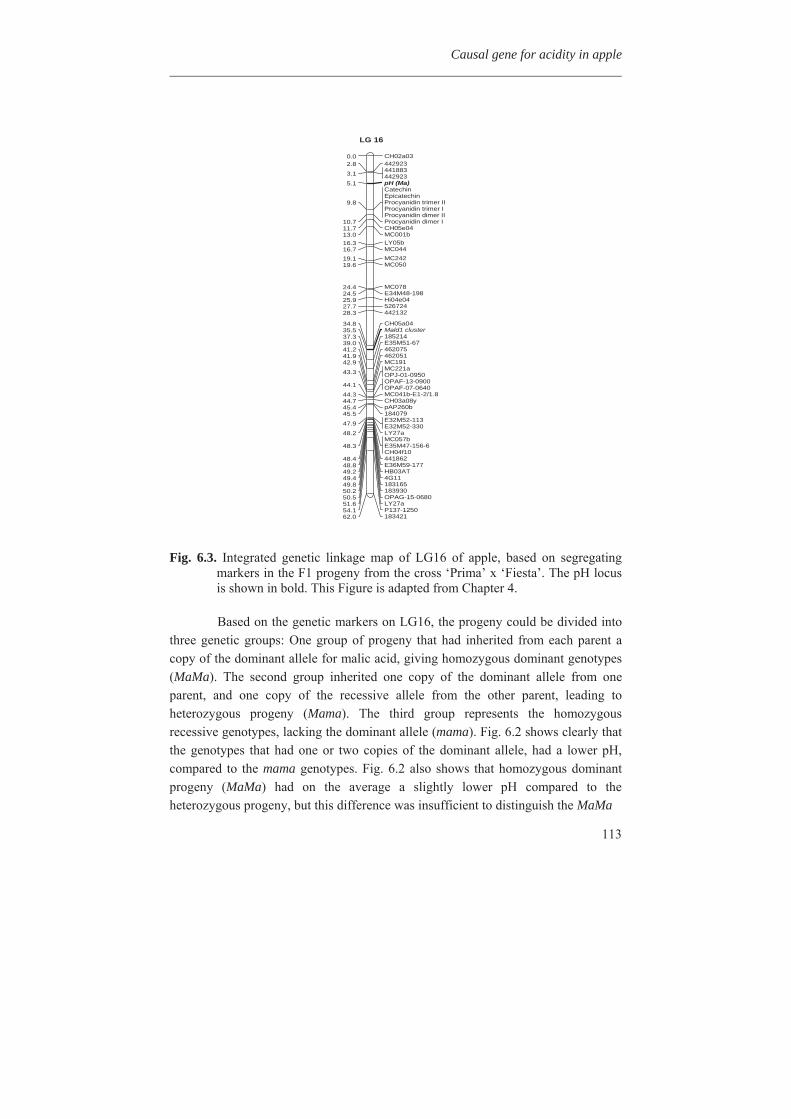
Causal gene for acidity in apple
113
CH02a030.04429232.84418834429233.1pH (Ma)5.1CatechinEpicatechinProcyanidin trimer IIProcyanidin trimer IProcyanidin dimer II
9.8
Procyanidin dimer I10.7CH05e0411.7MC001b13.0LY05b16.3MC04416.7MC24219.1MC05019.6
MC07824.4E34M48-19824.5Hi04e0425.952672427.744213228.3
CH05a0434.8Mald1 cluster35.518521437.3E35M51-6739.046207541.246205141.9MC19142.9MC221aOPJ-01-095043.3OPAF-13-0900OPAF-07-064044.1MC041b-E1-2/1.844.3CH03a08y44.7pAP260b45.418407945.5E32M52-113E32M52-33047.9LY27a48.2MC057bE35M47-156-6CH04f10
48.3
44186248.4E36M59-17748.8HB03AT49.24G1149.418316549.818393050.2OPAG-15-068050.5LY27a51.6P137-125054.118342162.0
LG 16
Fig. 6.3. Integrated genetic linkage map of LG16 of apple, based on segregating
markers in the F1 progeny from the cross ‘Prima’ x ‘Fiesta’. The pH locus is shown in bold. This Figure is adapted from Chapter 4.
Based on the genetic markers on LG16, the progeny could be divided into
three genetic groups: One group of progeny that had inherited from each parent a copy of the dominant allele for malic acid, giving homozygous dominant genotypes (MaMa). The second group inherited one copy of the dominant allele from one parent, and one copy of the recessive allele from the other parent, leading to heterozygous progeny (Mama). The third group represents the homozygous recessive genotypes, lacking the dominant allele (mama). Fig. 6.2 shows clearly that the genotypes that had one or two copies of the dominant allele, had a lower pH, compared to the mama genotypes. Fig. 6.2 also shows that homozygous dominant progeny (MaMa) had on the average a slightly lower pH compared to the heterozygous progeny, but this difference was insufficient to distinguish the MaMa
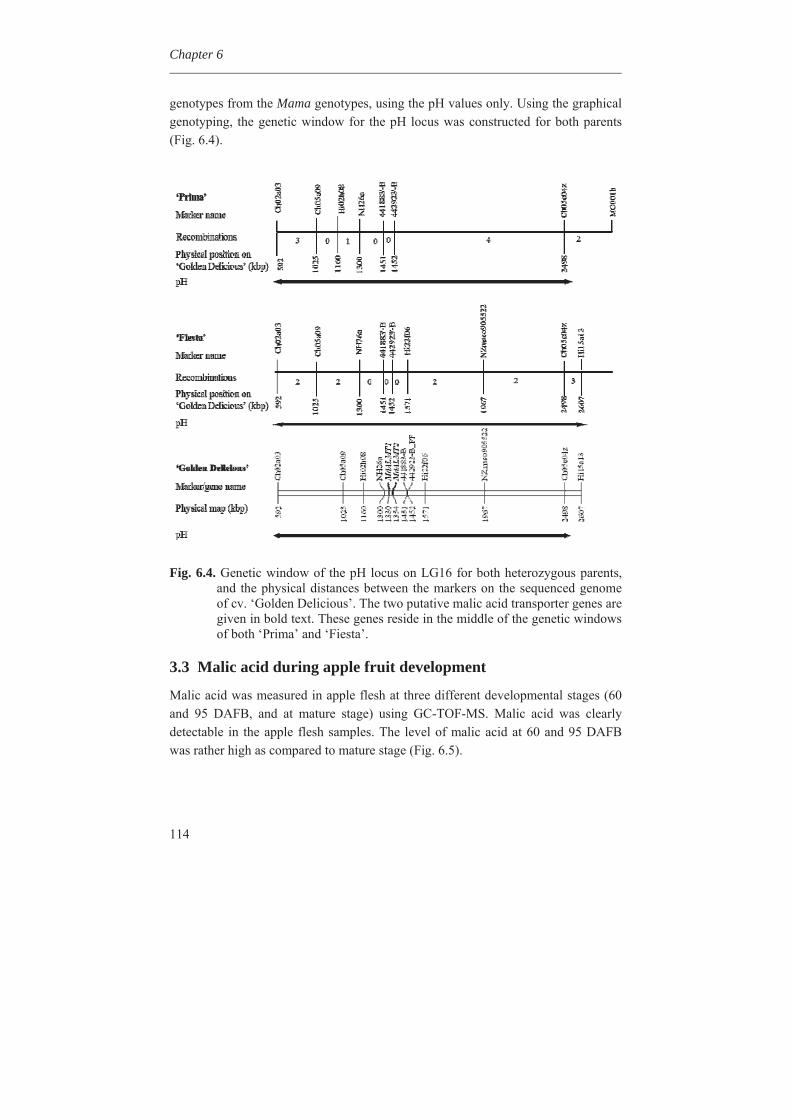
Chapter 6
114
genotypes from the Mama genotypes, using the pH values only. Using the graphical genotyping, the genetic window for the pH locus was constructed for both parents (Fig. 6.4).
Fig. 6.4. Genetic window of the pH locus on LG16 for both heterozygous parents,
and the physical distances between the markers on the sequenced genome of cv. ‘Golden Delicious’. The two putative malic acid transporter genes are given in bold text. These genes reside in the middle of the genetic windows of both ‘Prima’ and ‘Fiesta’.
3.3 Malic acid during apple fruit development
Malic acid was measured in apple flesh at three different developmental stages (60 and 95 DAFB, and at mature stage) using GC-TOF-MS. Malic acid was clearly detectable in the apple flesh samples. The level of malic acid at 60 and 95 DAFB was rather high as compared to mature stage (Fig. 6.5).
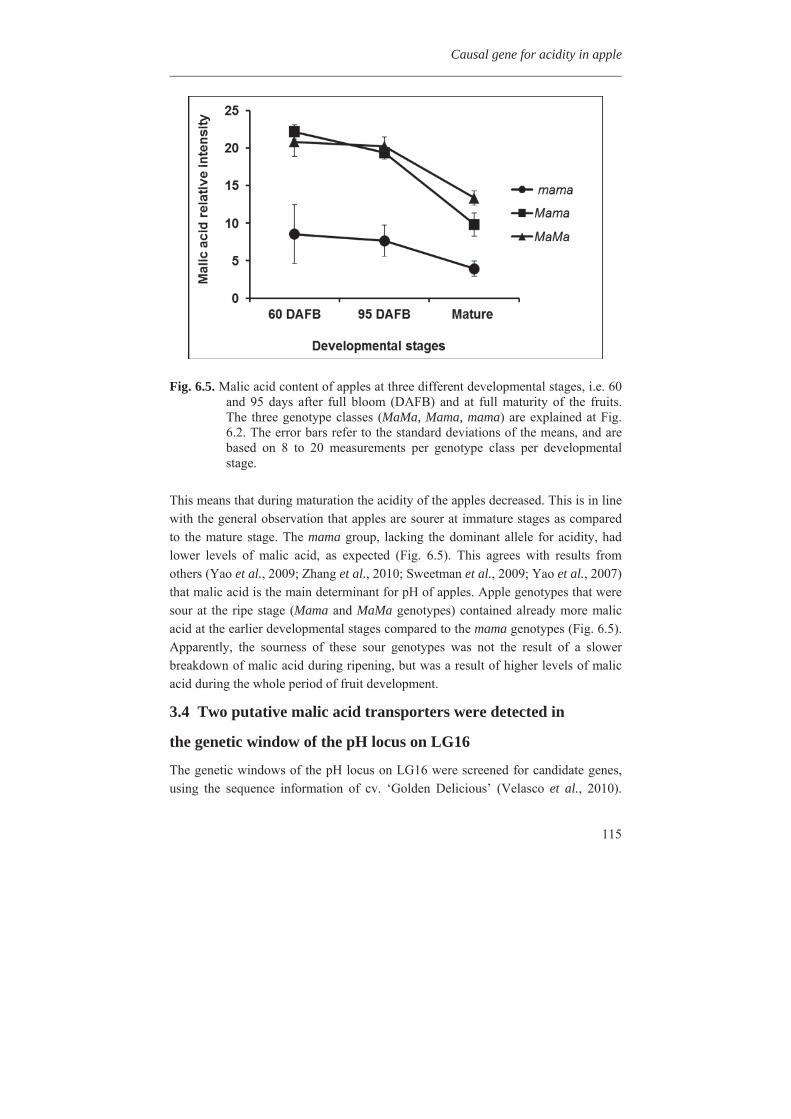
Causal gene for acidity in apple
115
Fig. 6.5. Malic acid content of apples at three different developmental stages, i.e. 60
and 95 days after full bloom (DAFB) and at full maturity of the fruits. The three genotype classes (MaMa, Mama, mama) are explained at Fig. 6.2. The error bars refer to the standard deviations of the means, and are based on 8 to 20 measurements per genotype class per developmental stage.
This means that during maturation the acidity of the apples decreased. This is in line with the general observation that apples are sourer at immature stages as compared to the mature stage. The mama group, lacking the dominant allele for acidity, had lower levels of malic acid, as expected (Fig. 6.5). This agrees with results from others (Yao et al., 2009; Zhang et al., 2010; Sweetman et al., 2009; Yao et al., 2007) that malic acid is the main determinant for pH of apples. Apple genotypes that were sour at the ripe stage (Mama and MaMa genotypes) contained already more malic acid at the earlier developmental stages compared to the mama genotypes (Fig. 6.5). Apparently, the sourness of these sour genotypes was not the result of a slower breakdown of malic acid during ripening, but was a result of higher levels of malic acid during the whole period of fruit development.
3.4 Two putative malic acid transporters were detected in
the genetic window of the pH locus on LG16
The genetic windows of the pH locus on LG16 were screened for candidate genes, using the sequence information of cv. ‘Golden Delicious’ (Velasco et al., 2010).
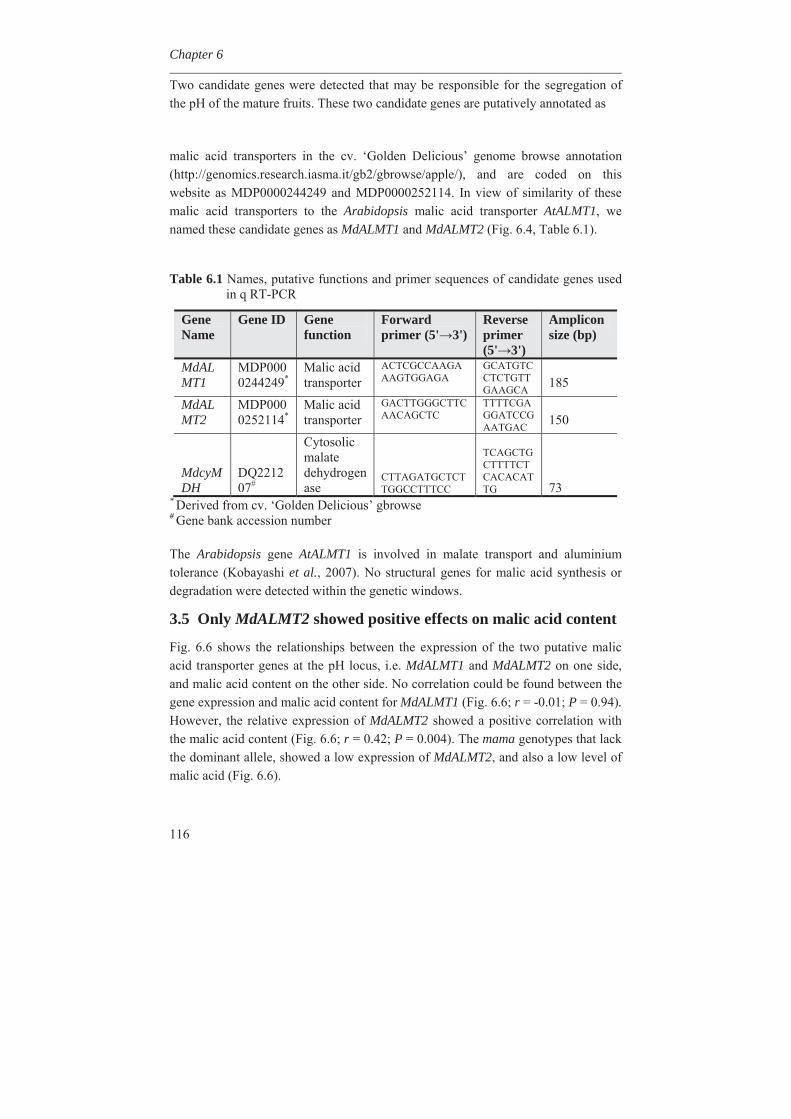
Chapter 6
116
Two candidate genes were detected that may be responsible for the segregation of the pH of the mature fruits. These two candidate genes are putatively annotated as
malic acid transporters in the cv. ‘Golden Delicious’ genome browse annotation (http://genomics.research.iasma.it/gb2/gbrowse/apple/), and are coded on this website as MDP0000244249 and MDP0000252114. In view of similarity of these malic acid transporters to the Arabidopsis malic acid transporter AtALMT1, we named these candidate genes as MdALMT1 and MdALMT2 (Fig. 6.4, Table 6.1).
Table 6.1 Names, putative functions and primer sequences of candidate genes used in q RT-PCR
Gene Name
Gene ID Gene function
Forward primer (5' 3')
Reverse primer (5' 3')
Amplicon size (bp)
MdALMT1
MDP0000244249*
Malic acid transporter
ACTCGCCAAGAAAGTGGAGA
GCATGTCCTCTGTTGAAGCA
185
MdALMT2
MDP0000252114*
Malic acid transporter
GACTTGGGCTTCAACAGCTC
TTTTCGAGGATCCGAATGAC
150
MdcyMDH
DQ221207#
Cytosolic malate dehydrogenase
CTTAGATGCTCTTGGCCTTTCC
TCAGCTGCTTTTCTCACACATTG
73
* Derived from cv. ‘Golden Delicious’ gbrowse # Gene bank accession number The Arabidopsis gene AtALMT1 is involved in malate transport and aluminium tolerance (Kobayashi et al., 2007). No structural genes for malic acid synthesis or degradation were detected within the genetic windows.
3.5 Only MdALMT2 showed positive effects on malic acid content
Fig. 6.6 shows the relationships between the expression of the two putative malic acid transporter genes at the pH locus, i.e. MdALMT1 and MdALMT2 on one side, and malic acid content on the other side. No correlation could be found between the gene expression and malic acid content for MdALMT1 (Fig. 6.6; r = -0.01; P = 0.94). However, the relative expression of MdALMT2 showed a positive correlation with the malic acid content (Fig. 6.6; r = 0.42; P = 0.004). The mama genotypes that lack the dominant allele, showed a low expression of MdALMT2, and also a low level of malic acid (Fig. 6.6).
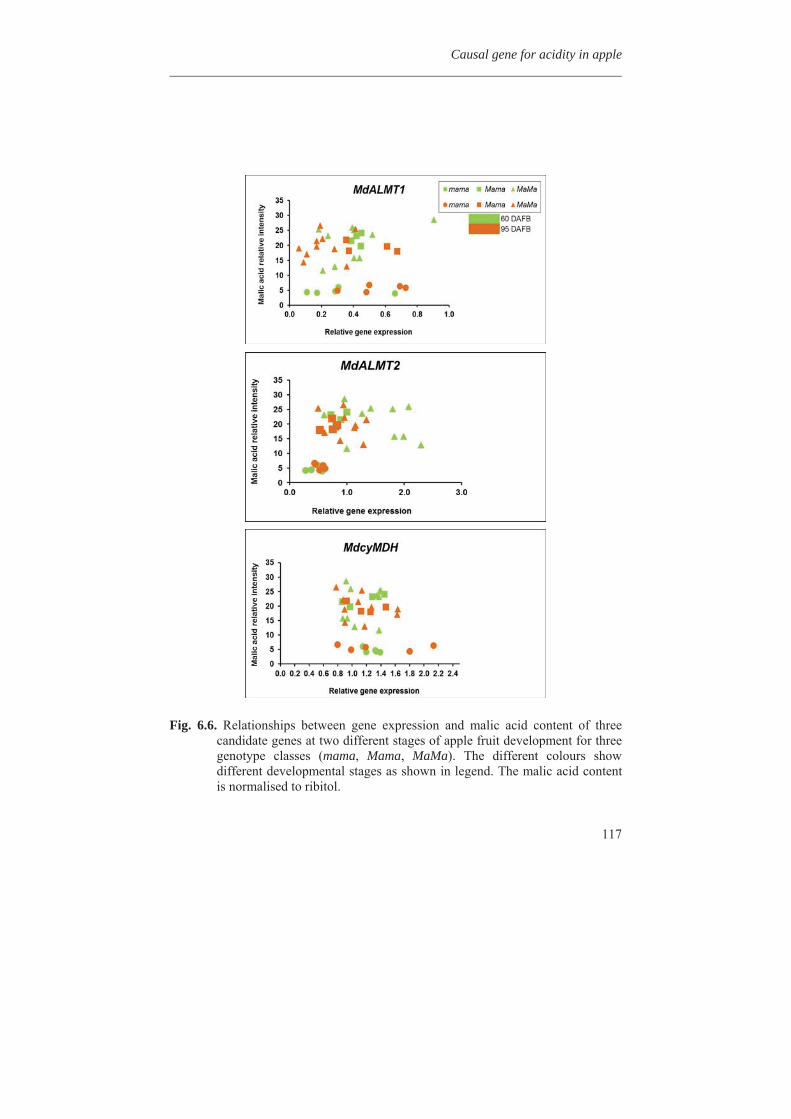
Causal gene for acidity in apple
117
Fig. 6.6. Relationships between gene expression and malic acid content of three
candidate genes at two different stages of apple fruit development for three genotype classes (mama, Mama, MaMa). The different colours show different developmental stages as shown in legend. The malic acid content is normalised to ribitol.
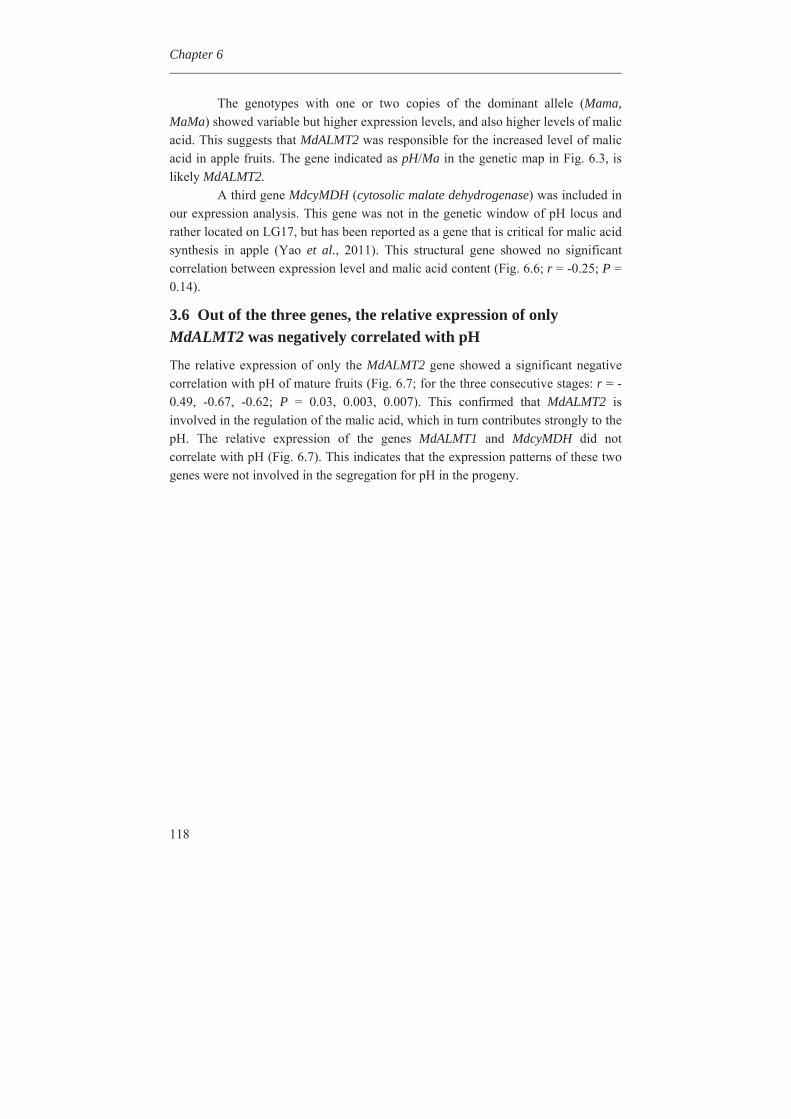
Chapter 6
118
The genotypes with one or two copies of the dominant allele (Mama,
MaMa) showed variable but higher expression levels, and also higher levels of malic acid. This suggests that MdALMT2 was responsible for the increased level of malic acid in apple fruits. The gene indicated as pH/Ma in the genetic map in Fig. 6.3, is likely MdALMT2.
A third gene MdcyMDH (cytosolic malate dehydrogenase) was included in our expression analysis. This gene was not in the genetic window of pH locus and rather located on LG17, but has been reported as a gene that is critical for malic acid synthesis in apple (Yao et al., 2011). This structural gene showed no significant correlation between expression level and malic acid content (Fig. 6.6; r = -0.25; P = 0.14).
3.6 Out of the three genes, the relative expression of only MdALMT2 was negatively correlated with pH
The relative expression of only the MdALMT2 gene showed a significant negative correlation with pH of mature fruits (Fig. 6.7; for the three consecutive stages: r = -0.49, -0.67, -0.62; P = 0.03, 0.003, 0.007). This confirmed that MdALMT2 is involved in the regulation of the malic acid, which in turn contributes strongly to the pH. The relative expression of the genes MdALMT1 and MdcyMDH did not correlate with pH (Fig. 6.7). This indicates that the expression patterns of these two genes were not involved in the segregation for pH in the progeny.
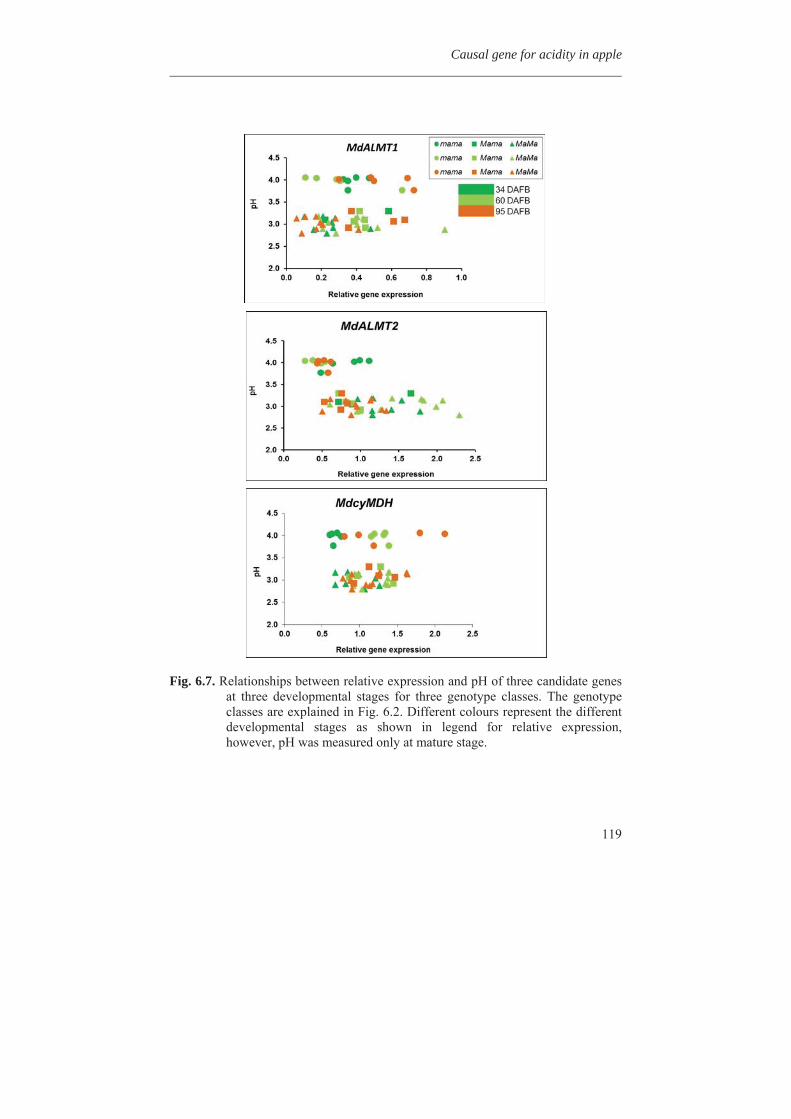
Causal gene for acidity in apple
119
Fig. 6.7. Relationships between relative expression and pH of three candidate genes at three developmental stages for three genotype classes. The genotype classes are explained in Fig. 6.2. Different colours represent the different developmental stages as shown in legend for relative expression, however, pH was measured only at mature stage.
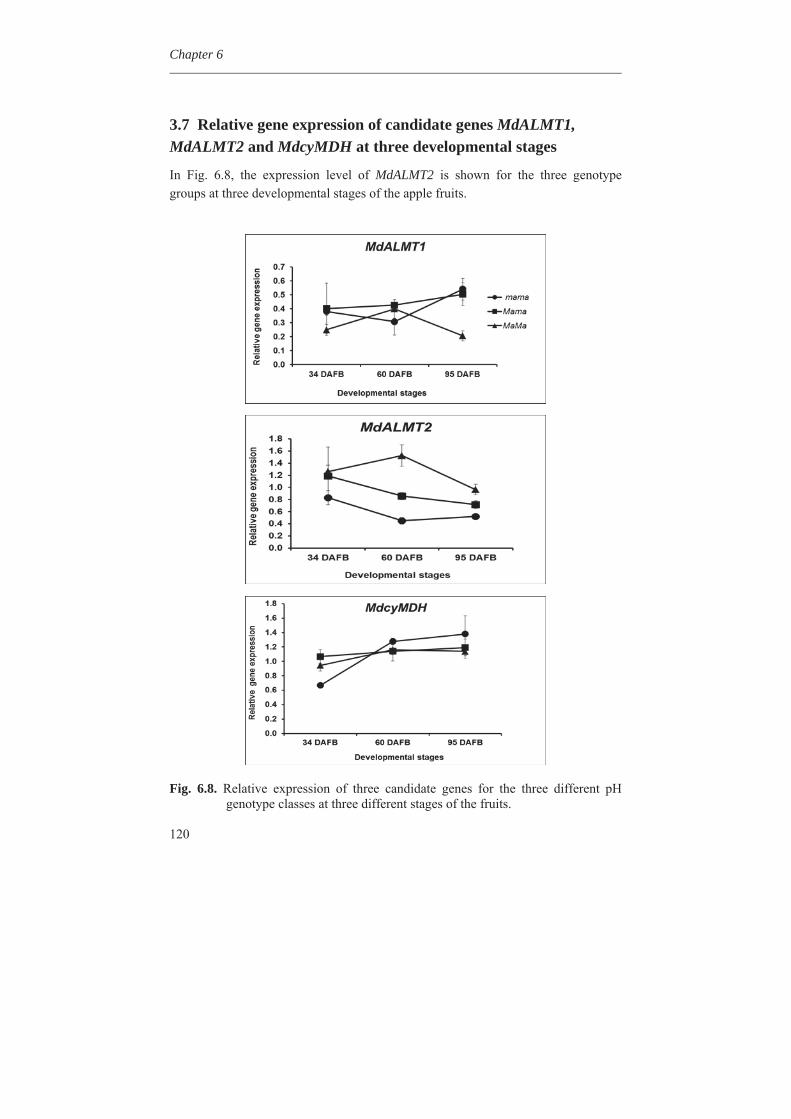
Chapter 6
120
3.7 Relative gene expression of candidate genes MdALMT1,MdALMT2 and MdcyMDH at three developmental stages
In Fig. 6.8, the expression level of MdALMT2 is shown for the three genotype groups at three developmental stages of the apple fruits.
Fig. 6.8. Relative expression of three candidate genes for the three different pH
genotype classes at three different stages of the fruits.
Causal gene for acidity in apple
121
The mama class showed lower expression during all three stages, compared to both the Mama and MaMa group. The expression of the MaMa group was in general the highest. For the other two genes i.e. MdALMT1 and MdcyMDH, no clear correlation was found between the relative expression and pH groups (Fig. 6.8). MdALMT1 showed strange expression pattern for one data point. At 95 DAFB the MaMa class showed a sharp decrease in the relative expression (Fig. 6.8).
4. Discussion
4.1 Genetic position of the pH gene
Maliepaard et al. (1998) mapped genetically the pH of mature apples, using the segregating F1 population of ‘Prima’ x ‘Fiesta’. We used the same F1 population. Since the paper of Maliepaard and co-workers, many other DNA markers were added to the genetic map of this population (Schouten et al., 2011). We used this denser genetic map, and added SSR-markers that are located near the pH locus on LG16 (Chapter 4). This allowed us to map the pH locus more precisely. We focused on the pH of mature fruits, as the mature stage is most relevant to eating quality. The pH appeared to segregate clearly (Fig. 6.2). The 2 tests for 1:1 and 3:1 segregation gave as P-values 0.000 and 0.21, which indicates that the segregation deviated significantly from a 1:1 segregation, and resembled a 3:1 segregation. The pH locus could be mapped as a monogenic trait at the top of LG16 (Maliepaard et al., 1998). Both parents appeared to be heterozygous for the dominant allele for high acidity and thus low pH.
Graphical genotyping was applied for setting the borders of the genetic interval in which the gene that is responsible for the segregation of the pH should reside (Fig. 6.4). As both parents are heterozygous for the dominant allele for high acidity, genetic windows could be made for both parents, using the pH values and genetic markers of the F1 population. The genetic windows appeared to overlap to a large extent (Fig. 6.4). As explained in the Materials and Methods section, only a part of the F1 population could be used for genetic mapping, due to the dominant inheritance in a 3:1 ratio.
Chapter 6
122
4.2 The dominant allele for acidity increased the malic acid content by a factor of three
The F1 population could be grouped into three classes, i.e. genotypes that were homozygous for the dominant allele for low pH (MaMa), the heterozygous group (Mama), and genotypes that lacked the dominant allele (mama), and had therefore a low acidity and high pH. From each of these three groups, trees were selected for picking of apples at different developmental stages. The apples were peeled off, and the malic acid content and other organic acids in the apple flesh were measured. The data confirmed the supposition from Maliepaard et al. (1998) that malic acid was the important organic acid that was responsible for the segregation in pH. Maliepaard and co-workers assumed that malic acid was the organic compound that was responsible for the clear differences in pH of the mature fruits, and therefore named this locus as Ma (Maliepaard et al., 1998). However, they did not measure the malic acid content of the progeny, but solely the pH.
The genotypes that had one or two copies of the dominant allele (Mama, MaMa), and a pH of approximately 3.0, had a three times higher malic acid content compared to the mama genotypes that had a pH of approximately 4.0. This is in agreement with several other investigations that indicate that malic acid is the major organic acid in apples (Yao et al., 2009; Zhang et al., 2010; Sweetman et al., 2009; Yao et al., 2007). This suggests that the gene that was responsible for the segregation in pH, was indeed a gene that raised the malic acid content strongly. The dominant allele of that gene, Ma, raised the malic acid content by a factor 3, compared to the recessive allele ma. The addition of a second copy of the dominant allele, slightly raised the malic acid content further, and therewith slightly lowered the pH, as can be seen in Fig. 6.5, when comparing the Mama group with the MaMa group.
4.3 Two putative malic acid transporter genes reside at the pH locus
Thanks to the published genome sequence of the apple cv. ‘Golden Delicious’ (Velasco et al., 2010), we could align the genetic markers at the locus on LG16 to the genome sequence, and could scan the genetic windows for genes that could be responsible for the differences in malic acid content, and therewith pH.
No structural genes for malic acid production or degradation were detected in these genetic windows. However, two putative malic acid transporter genes appeared to be present at the centres of the genetic windows for both parents (Fig. 6.4). These genes show homology to the malic acid transporter gene AtALMT1 in
Causal gene for acidity in apple
123
Arabidopsis (Fig. 6.1). In view of the sequence homology to AtALMT1, we named the putative malic acid transporter genes at the pH locus on LG16 as MdALMT1 and MdALMT2.
We looked in the cv. ‘Golden Delicious’ genome for genes similar to MdALMT2, and detected 27 other putative malic acid transporter genes, scattered among the chromosomes of apple. Fig. 6.1 shows that homologies to the Arabidopsis gene AtALMT1 did not allow yet to select one of these apple genes as the most likely candidate. There was no apple protein that was far more homologous to the Arabidopsis protein compared to the other apple proteins represented in Fig. 6.1. This indicates that in our research, genetic mapping was an important step for the reduction of the number of candidate malic acid transporter genes.
4.4 The expression of one of these malic acid transporter genes was the limiting factor in the acidity of the fruits
The expression of both candidate genes was measured in the three groups of genotypes. MdALMT1 did not show clear differential expression among the three groups, but MdALMT2 appeared to have a low transcript level in the mama group, a moderate expression in the Mama group and a high expression in the MaMa group (Fig. 6.8). This provides evidence that MdALMT2 is the gene responsible for the segregation for pH in the F1 progeny, shown in Fig. 6.1.
The recessive allele of MdALMT2 is expressed at a low level (Fig. 6.8), and led to a low level of malic acid (Fig. 6.5). The dominant allele is expressed more strongly (Fig. 6.8), which increased the malic acid content by a factor 3 (Fig. 6.5). Addition of a second copy of the dominant allele, further increased the transcript level (Fig. 6.8), but raised the malic acid content only slightly, and therewith reduced the pH to a low extent (Figs. 6.2, 6.5). This indicates that the expression level of MdALMT2 was the limiting factor in the acidity of the fruits, and that presence of one copy of the higher expressed allele Ma was sufficient to remove this limitation.
Chapter 6
124
4.5 Genes for synthesis of malic acid are not associated with pH
Malic acid is an intermediate in the citric acid cycle, also known as the tricarboxylic acid cycle or the Krebs cycle, which is of central importance in all living cells. In eukaryotic cells, the citric acid cycle occurs in the matrix of the mitochondrion. Yao et al. (2011) isolated and functionally analyzed the malate dehydrogenase gene (MdcyMDH) from apple. The enzyme cyMDH is crucial for malate synthesis in the cytosol. They localized the protein in the cytoplasm and plasma membrane. The expression level of MdcyMDH was positively correlated with Malate dehydrogenase (MDH) activity throughout fruit development, but not with malate content. We also found that MdcyMDH expression was not associated with malic acid content (Fig. 6.6). Further, this gene is not located at the pH locus on LG16, but on LG17, as detected by aligning the DNA sequence to the published sequence of cv. ‘Golden Delicious’.
Sweetman et al. (2009) have indicated that PEPC activity, while linked to the synthesis of malate in normal acid varieties, cannot explain the variation in malate levels seen in the low acid fruits, nor can NAD-MDH and NADP-ME activities. Berüter (2004) studied the carbohydrate metabolism in an apple variety and its mutant that differed in fruit acidity. The high-acid genotype had five times more malic acid compared to the low-acid genotype. However, Berüter (2004) detected no difference in the catalytic activity of enzymes involved in malate metabolism, such as PEP carboxylase, Malate dehydrogenase, and NADP malic enzyme. The rate of respiration and the rate of malate synthesis were similar in both genotypes. However, the uptake of 14C malate was significantly lower in excised tissue of lower acid fruit. These findings suggest that low malate content in these fruits was not the result of reduced ability to synthesize malate, but of a restricted ability to accumulate it in the vacuoles (Berüter, 2004). This is consistent with our findings, as we did not detect any gene for the malate biosynthesis at our genetic locus for pH, but detected there only putative malic acid transporter genes.
It is the storage of malic acid in plant cell vacuoles that causes the change in pH in apple (Berüter, 2004). Malate storage within the vacuole allows the plant to accumulate this metabolite to a very high concentration (up to >300 mM) and thus maintain the cytosolic concentration constant (Emmerlich et al., 2003). We have indicated here that the malic acid transporter MdALMT2 could perform this job, by transporting the malic acid from the cytoplasm into the vacuole.
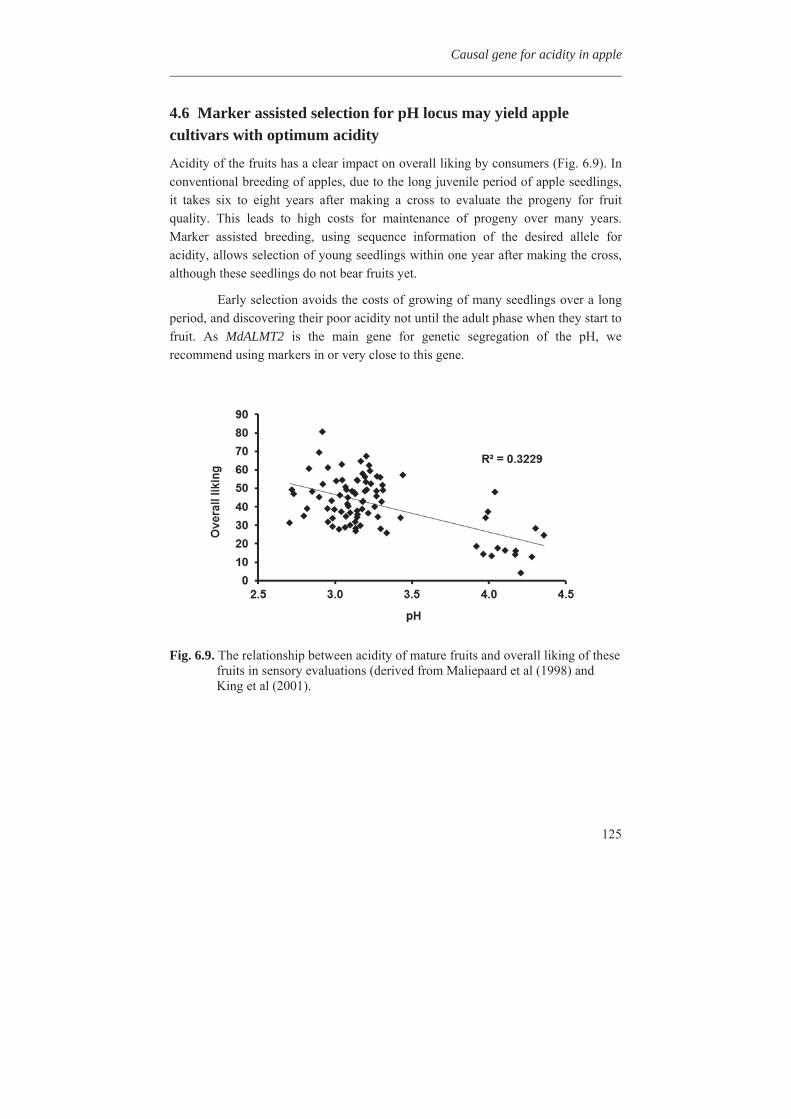
Causal gene for acidity in apple
125
4.6 Marker assisted selection for pH locus may yield apple cultivars with optimum acidity
Acidity of the fruits has a clear impact on overall liking by consumers (Fig. 6.9). In conventional breeding of apples, due to the long juvenile period of apple seedlings, it takes six to eight years after making a cross to evaluate the progeny for fruit quality. This leads to high costs for maintenance of progeny over many years. Marker assisted breeding, using sequence information of the desired allele for acidity, allows selection of young seedlings within one year after making the cross, although these seedlings do not bear fruits yet.
Early selection avoids the costs of growing of many seedlings over a long period, and discovering their poor acidity not until the adult phase when they start to fruit. As MdALMT2 is the main gene for genetic segregation of the pH, we recommend using markers in or very close to this gene.
Fig. 6.9. The relationship between acidity of mature fruits and overall liking of these
fruits in sensory evaluations (derived from Maliepaard et al (1998) and King et al (2001).
Chapter 6
126
5. Conclusions Evidence has been provided that in apple the expression level of a malic acid transporter gene is the limiting factor in malate accumulation in the vacuoles, and therewith the major determining factor for acidity of apple. This gene resides at the top of linkage group 16. The genetic inheritance of at least one dominant allele of this gene sufficed for an increased expression level that led to a three-fold increase of the malic acid concentration and a reduction of the pH from 4 to 3 in ripe apples, compared to inheritance of the recessive, lowly expressed allele only. To our knowledge, this gene has not been described before in association with pH of apples.
Acknowledgements This project was financially supported by PiDON, Inova Fruit B.V and the Higher Education Commission of Pakistan. We are thankful to Chris Maliepaard from Plant Breeding Department (Wageningen UR) for providing pH data and Aranka van der Burgh for helping in cDNA synthesis. We also thank Harry Jonker for technical assistance during the malic acid analysis.
Chapter 7
Anthocyanin production as a potential visual
selection marker during plant transformation
A. J. Kortstee1,2, S. A. Khan1, C. Helderman2, L. Trindade1, Y. Wu1, R. G. F. Visser1, C. Brendolise3, A. Allan3, H. J. Schouten1 and E. Jacobsen1
1Wageningen UR Plant Breeding, Wageningen University & Research Centre, P.O. Box 386, 6700 AJ Wageningen, the Netherlands. 2Inova Fruit B.V., Geldermalsen, The Netherlands. 3Plant & Food Research, Mt Albert Research Centre, Auckland 1025, New Zealand. *Corresponding Author: [email protected] Transgenic Res (2011) 20:1253–1264
Chapter 7
128
Abstract A mutant allele of the transcription factor gene MdMYB10 from apple induces anthocyanin production throughout the plant. This gene, including its upstream promoter, gene coding region and terminator sequence, was introduced into apple, strawberry and potato plants to determine whether it could be used as a visible selectable marker for plant transformation as an alternative to chemically selectable markers, such as kanamycin resistance. After transformation, red coloured calli, red shoots and red well-growing plants were scored. Red and green shoots were harvested from apple explants and examined for the presence of the MdMYB10 gene by PCR analysis. Red shoots of apple explants always contained the MdMYB10 gene but not all MdMYB10 containing shoots were red. Strawberry plants transformed with the MdMYB10 gene showed anthocyanin accumulation in leaves and roots. No visible accumulation of anthocyanin could be observed in potato plants grown in vitro, even the ones carrying the MdMYB10 gene. However, acid methanol extracts of potato shoots or roots carrying the MdMYB10 gene contained up to four times higher anthocyanin content than control plants. Therefore anthocyanin production as result of the apple MdMYB10 gene can be used as a selectable marker for apple, strawberry and potato transformation, replacing kanamycin resistance.
Keywords: anthocyanin, alternative selection marker, Malus x domestica, Solanum tuberosum, Fragaria ananassa.
Anthocyanin as a selection marker
129
1. Introduction Plant transformation methods rely on the delivery, integration and expression of defined genes in plant cells, which can be regenerated into plants. Selection is necessary to separate transformed cells from non-transformed ones because the efficiency of stable transformation is low. Selectable marker genes are used to confer positive or negative selection and ensure growth of only genetically modified cells. Selectable marker genes that are widely used encode for resistance against the antibiotics kanamycin and hygromycin and originate from bacteria. In response to the negative image of these markers in green biotechnology, scientists have developed alternative selection strategies to avoid the use of antibiotics, although the reason for this is political rather than scientific (Ramessar et al., 2007). Examples are the use of marker gene-free vectors (de Vetten et al., 2003) or removable marker gene systems like pMF-1 (Schaart et al., 2004). Alternative selection marker genes that result in the production of plant-based products, which are non-toxic and easy to score, have also been considered (Miki and McHugh, 2004). The red and purple coloured anthocyanins seem to be promising since they are visible by the human eye, do not require addition of substrate, are not essential for development and are non-toxic. Recent reports (Butelli et al., 2009) have even shown that consumption of anthocyanins can be beneficial for health, such as anti-cancer, which could make crops with increased anthocyanin content attractive from a consumer’s point of view.
This paper describes the replacement of resistance to the antibiotic kanamycin with anthocyanin formation as a selectable marker for plant transformation. Previous efforts in wheat and sugarcane with the anthocyanin regulatory genes C1 and B from maize failed due to the inability of the anthocyanin-producing cells to divide (Ludwig et al., 1990, Chawla et al., 1999) or for regenerating shoots to grow beyond a certain developmental stage (Bower et al., 1996). Recently, wheat embryo-specific expression of maize transcription factor genes for anthocyanin was described by Doshi et al. (2007). The PAP1/myb75 transcription factor gene from Arabidopsis was expressed in tobacco cell cultures and resulted in dark red cells (Zhou et al., 2008), and the maize Lc gene expressed in apple (Li et al., 2007) resulted in high anthocyanin accumulation in transgenic plants, showing the feasibility of obtaining plants transformed with these transcription factor genes. However, none of these reports showed the use of anthocyanin formation as selection criterion or the use of the promoter of the transcription factor gene itself to drive expression.
Espley et al. (2007) isolated an apple transcription factor gene, MdMYB10, responsible for skin colour of apple fruits. A mutant allele was found in the apple cultivar (cv) Red Field that results in purple-stained skin and flesh of fruits. The
Chapter 7
130
mutant allele contains an insertion/repeat in the promoter region that causes ectopic expression of anthocyanins (Espley et al., 2009). The apple plants of cv Red Field accumulate anthocyanin in the leaves, stems, flowers and fruits (Espley et al., 2007).
Here we describe the use of the mutant MdMYB10 allele from cultivar Red Field as a selectable marker gene. The MdMYB10 gene, under the control of its own promoter and terminator, was transformed into apple, strawberry (another member of the rosaceous family) and potato as model crop species. Regenerated shoots were harvested from explants without any antibiotic selection or on kanamycin selection. For comparison, a GUS reporter gene construct was transformed in parallel.
2. Materials and methods
2.1 Plasmids used for transformation
Two binary plasmids were used for transformation experiments. The T-DNA region of plasmid pART27-21 carries the apple MdMYB10 genomic region from cultivar Red Field, including 1.8 kb upstream of the translational start, the coding region and 2 kb after the translational stop codon in plasmid pART27 (Gleave, 1992) as well as the NPTII gene (Fraley et al., 1983) The plasmid pK2GW7.0 (Karimi et al., 2002) carries the GUS gene (Joersbo and Okkels, 1996) under the control of the 35S Cauliflower Mosaic Virus promoter (Odell et al., 1985) and the NPTII gene for resistance against kanamycin.
2.2 Plant material, transformation procedure and selection of transformed plants
Plant material of apple (cv Gala), strawberry (cv Calypso) and potato (cv Desiree) were obtained from established tissue cultures in the lab. For transformation purposes, these were micro-propagated on medium including macro- and micronutrients, vitamins (Murashige and Skoog, 1962) and 30 g/l sucrose unless stated otherwise. All plant material was placed in a climate chamber with a day/night cycle of 16/8 hours and set at 24 C at 15 E /m2/s unless stated otherwise. Agrobacterium tumefaciens strain AGL-0 (Lazo et al., 1991), with either binary plasmid pART27-21 or pK2GW7.0, was used for all transformation experiments.
For apple, leaf material of cultivar Gala was used for transformation, according to the method described by Yao et al. (1995). Leaf explants were cocultivated with the bacteria for 3 days and then placed on callus induction medium SIM (including MS salts with vitamins and 3% w/v sorbitol) and incubated in the dark at 24 C, either with or without kanamycin (50 mg/l). After 4 weeks, calli were harvested, put on fresh medium and placed in the light (day/night cycle of 16 hrs light, 8 hrs dark). Emerging shoots were placed on SEM medium (including MS
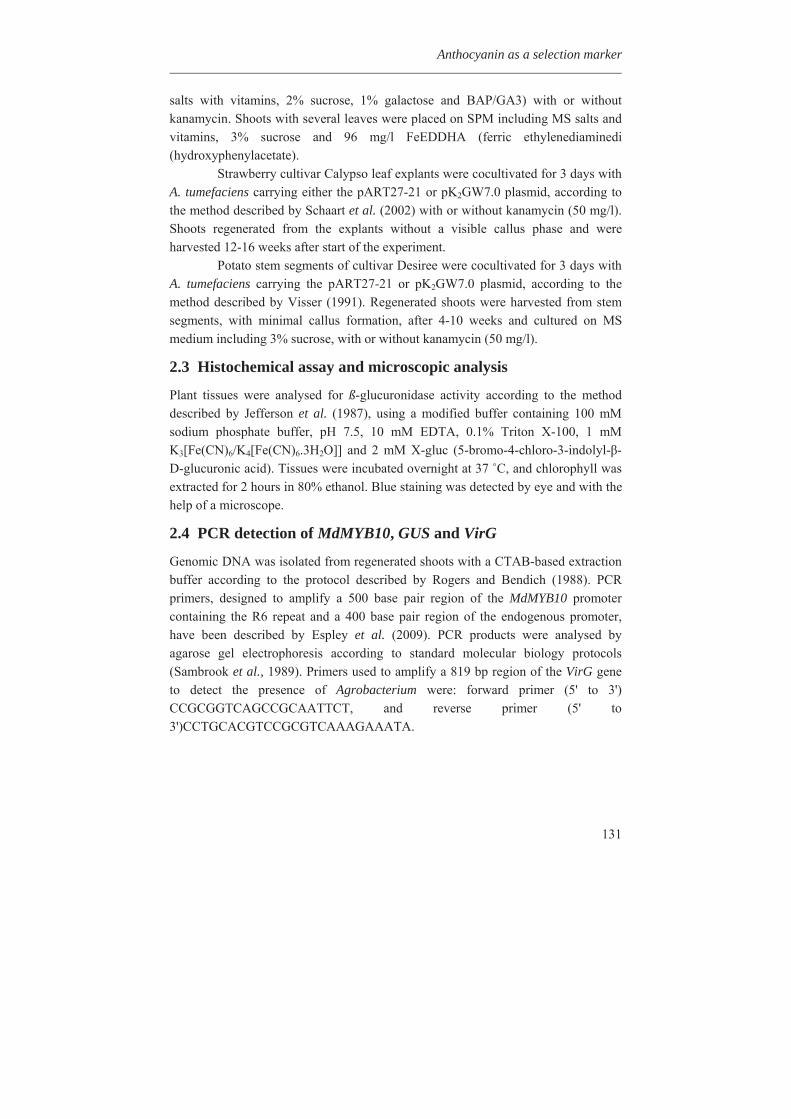
Anthocyanin as a selection marker
131
salts with vitamins, 2% sucrose, 1% galactose and BAP/GA3) with or without kanamycin. Shoots with several leaves were placed on SPM including MS salts and vitamins, 3% sucrose and 96 mg/l FeEDDHA (ferric ethylenediaminedi (hydroxyphenylacetate).
Strawberry cultivar Calypso leaf explants were cocultivated for 3 days with A. tumefaciens carrying either the pART27-21 or pK2GW7.0 plasmid, according to the method described by Schaart et al. (2002) with or without kanamycin (50 mg/l). Shoots regenerated from the explants without a visible callus phase and were harvested 12-16 weeks after start of the experiment.
Potato stem segments of cultivar Desiree were cocultivated for 3 days with A. tumefaciens carrying the pART27-21 or pK2GW7.0 plasmid, according to the method described by Visser (1991). Regenerated shoots were harvested from stem segments, with minimal callus formation, after 4-10 weeks and cultured on MS medium including 3% sucrose, with or without kanamycin (50 mg/l).
2.3 Histochemical assay and microscopic analysis
Plant tissues were analysed for ß-glucuronidase activity according to the method described by Jefferson et al. (1987), using a modified buffer containing 100 mM sodium phosphate buffer, pH 7.5, 10 mM EDTA, 0.1% Triton X-100, 1 mM K3[Fe(CN)6/K4[Fe(CN)6.3H2O]] and 2 mM X-gluc (5-bromo-4-chloro-3-indolyl- -D-glucuronic acid). Tissues were incubated overnight at 37 C, and chlorophyll was extracted for 2 hours in 80% ethanol. Blue staining was detected by eye and with the help of a microscope.
2.4 PCR detection of MdMYB10, GUS and VirG
Genomic DNA was isolated from regenerated shoots with a CTAB-based extraction buffer according to the protocol described by Rogers and Bendich (1988). PCR primers, designed to amplify a 500 base pair region of the MdMYB10 promoter containing the R6 repeat and a 400 base pair region of the endogenous promoter, have been described by Espley et al. (2009). PCR products were analysed by agarose gel electrophoresis according to standard molecular biology protocols (Sambrook et al., 1989). Primers used to amplify a 819 bp region of the VirG gene to detect the presence of Agrobacterium were: forward primer (5' to 3') CCGCGGTCAGCCGCAATTCT, and reverse primer (5' to 3')CCTGCACGTCCGCGTCAAAGAAATA.
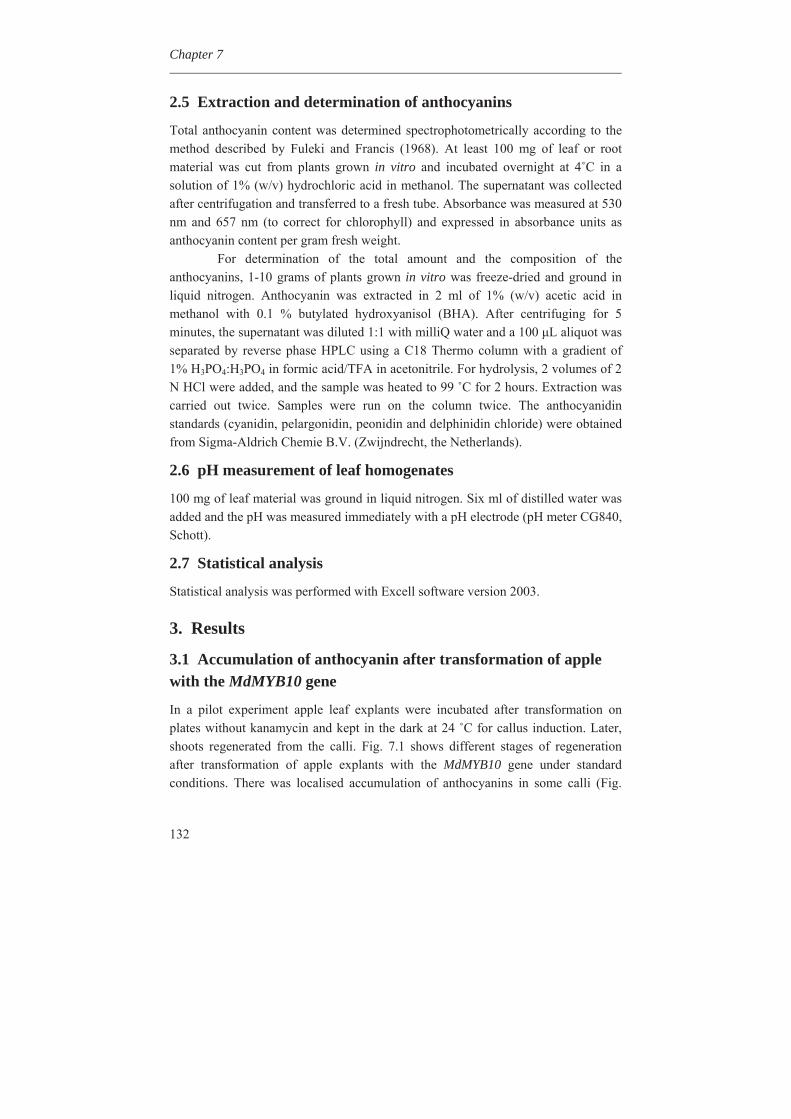
Chapter 7
132
2.5 Extraction and determination of anthocyanins
Total anthocyanin content was determined spectrophotometrically according to the method described by Fuleki and Francis (1968). At least 100 mg of leaf or root material was cut from plants grown in vitro and incubated overnight at 4 C in a solution of 1% (w/v) hydrochloric acid in methanol. The supernatant was collected after centrifugation and transferred to a fresh tube. Absorbance was measured at 530 nm and 657 nm (to correct for chlorophyll) and expressed in absorbance units as anthocyanin content per gram fresh weight.
For determination of the total amount and the composition of the anthocyanins, 1-10 grams of plants grown in vitro was freeze-dried and ground in liquid nitrogen. Anthocyanin was extracted in 2 ml of 1% (w/v) acetic acid in methanol with 0.1 % butylated hydroxyanisol (BHA). After centrifuging for 5 minutes, the supernatant was diluted 1:1 with milliQ water and a 100 L aliquot was separated by reverse phase HPLC using a C18 Thermo column with a gradient of 1% H3PO4:H3PO4 in formic acid/TFA in acetonitrile. For hydrolysis, 2 volumes of 2 N HCl were added, and the sample was heated to 99 C for 2 hours. Extraction was carried out twice. Samples were run on the column twice. The anthocyanidin standards (cyanidin, pelargonidin, peonidin and delphinidin chloride) were obtained from Sigma-Aldrich Chemie B.V. (Zwijndrecht, the Netherlands).
2.6 pH measurement of leaf homogenates
100 mg of leaf material was ground in liquid nitrogen. Six ml of distilled water was added and the pH was measured immediately with a pH electrode (pH meter CG840, Schott).
2.7 Statistical analysis
Statistical analysis was performed with Excell software version 2003.
3. Results
3.1 Accumulation of anthocyanin after transformation of apple with the MdMYB10 gene
In a pilot experiment apple leaf explants were incubated after transformation on plates without kanamycin and kept in the dark at 24 C for callus induction. Later, shoots regenerated from the calli. Fig. 7.1 shows different stages of regeneration after transformation of apple explants with the MdMYB10 gene under standard conditions. There was localised accumulation of anthocyanins in some calli (Fig.
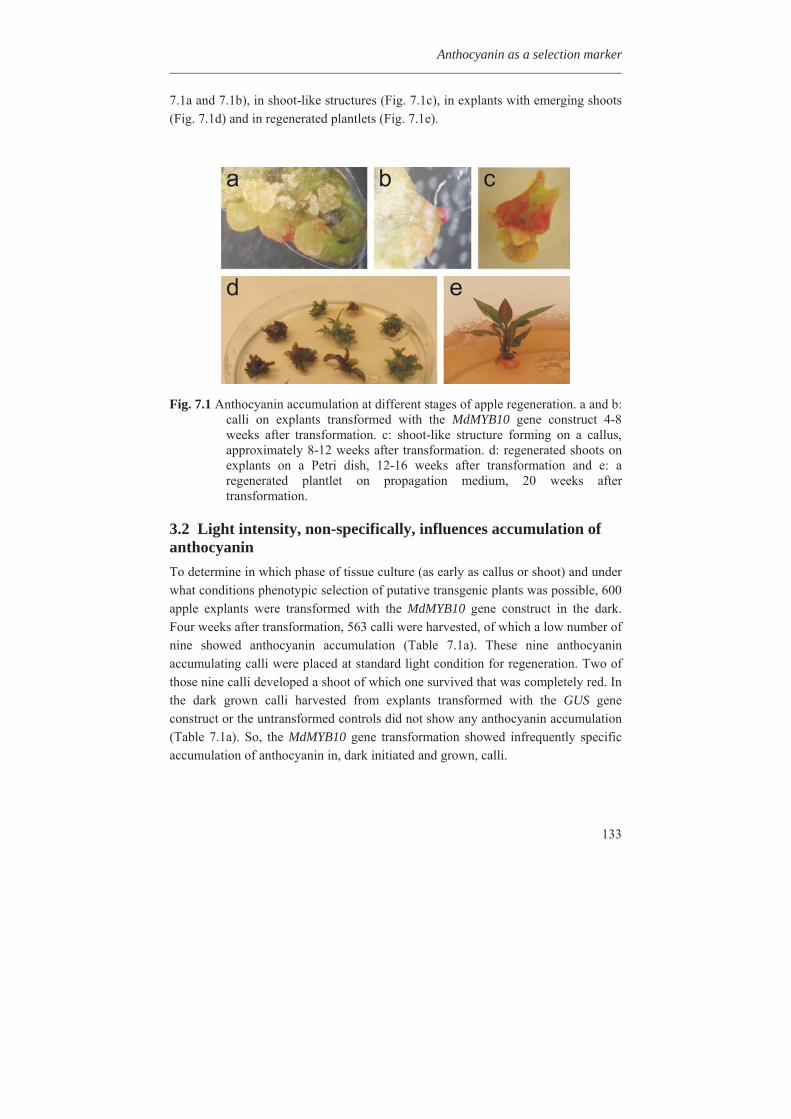
Anthocyanin as a selection marker
133
7.1a and 7.1b), in shoot-like structures (Fig. 7.1c), in explants with emerging shoots (Fig. 7.1d) and in regenerated plantlets (Fig. 7.1e).
Fig. 7.1 Anthocyanin accumulation at different stages of apple regeneration. a and b:
calli on explants transformed with the MdMYB10 gene construct 4-8 weeks after transformation. c: shoot-like structure forming on a callus, approximately 8-12 weeks after transformation. d: regenerated shoots on explants on a Petri dish, 12-16 weeks after transformation and e: a regenerated plantlet on propagation medium, 20 weeks after transformation.
3.2 Light intensity, non-specifically, influences accumulation of anthocyanin To determine in which phase of tissue culture (as early as callus or shoot) and under what conditions phenotypic selection of putative transgenic plants was possible, 600 apple explants were transformed with the MdMYB10 gene construct in the dark. Four weeks after transformation, 563 calli were harvested, of which a low number of nine showed anthocyanin accumulation (Table 7.1a). These nine anthocyanin accumulating calli were placed at standard light condition for regeneration. Two of those nine calli developed a shoot of which one survived that was completely red. In the dark grown calli harvested from explants transformed with the GUS gene construct or the untransformed controls did not show any anthocyanin accumulation (Table 7.1a). So, the MdMYB10 gene transformation showed infrequently specific accumulation of anthocyanin in, dark initiated and grown, calli.
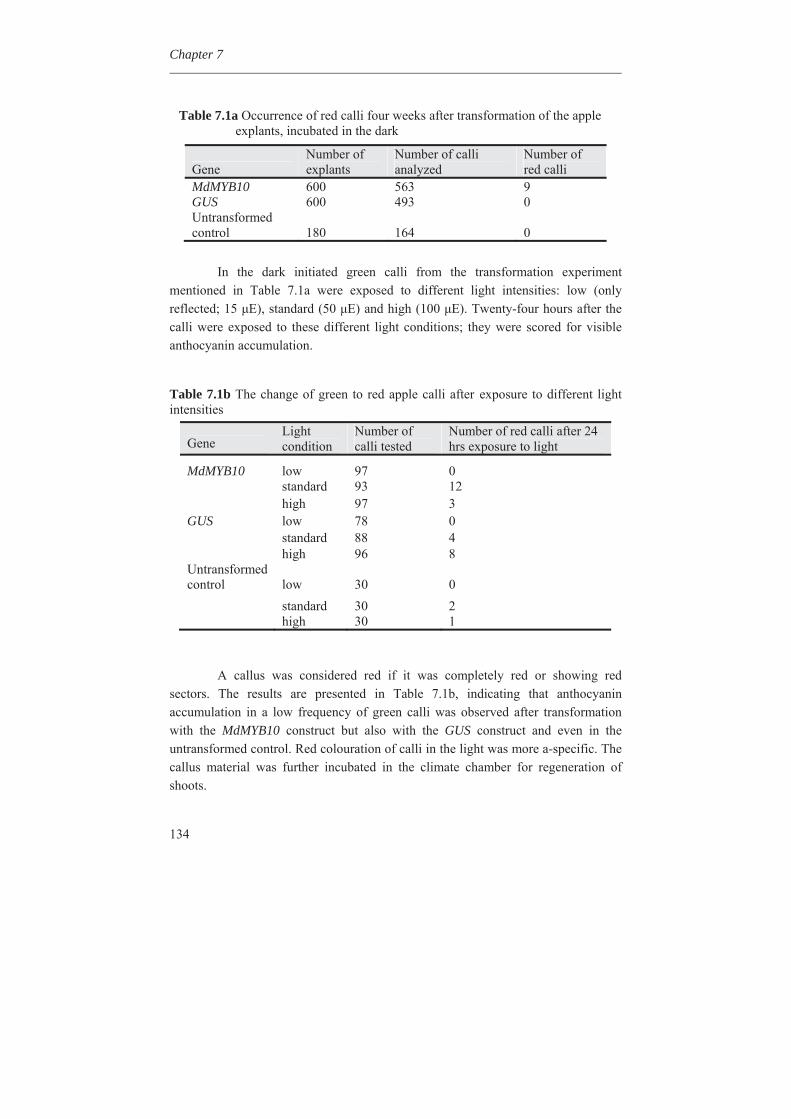
Chapter 7
134
Table 7.1a Occurrence of red calli four weeks after transformation of the apple
explants, incubated in the dark
In the dark initiated green calli from the transformation experiment
mentioned in Table 7.1a were exposed to different light intensities: low (only reflected; 15 E), standard (50 E) and high (100 E). Twenty-four hours after the calli were exposed to these different light conditions; they were scored for visible anthocyanin accumulation. Table 7.1b The change of green to red apple calli after exposure to different light intensities
A callus was considered red if it was completely red or showing red
sectors. The results are presented in Table 7.1b, indicating that anthocyanin accumulation in a low frequency of green calli was observed after transformation with the MdMYB10 construct but also with the GUS construct and even in the untransformed control. Red colouration of calli in the light was more a-specific. The callus material was further incubated in the climate chamber for regeneration of shoots.
Gene Number of explants
Number of calli analyzed
Number of red calli
MdMYB10 600 563 9 GUS 600 493 0 Untransformed control 180 164 0
Gene Light condition
Number of calli tested
Number of red calli after 24 hrs exposure to light
MdMYB10 low 97 0 standard 93 12 high 97 3 GUS low 78 0 standard 88 4 high 96 8 Untransformed control low 30 0 standard 30 2 high 30 1
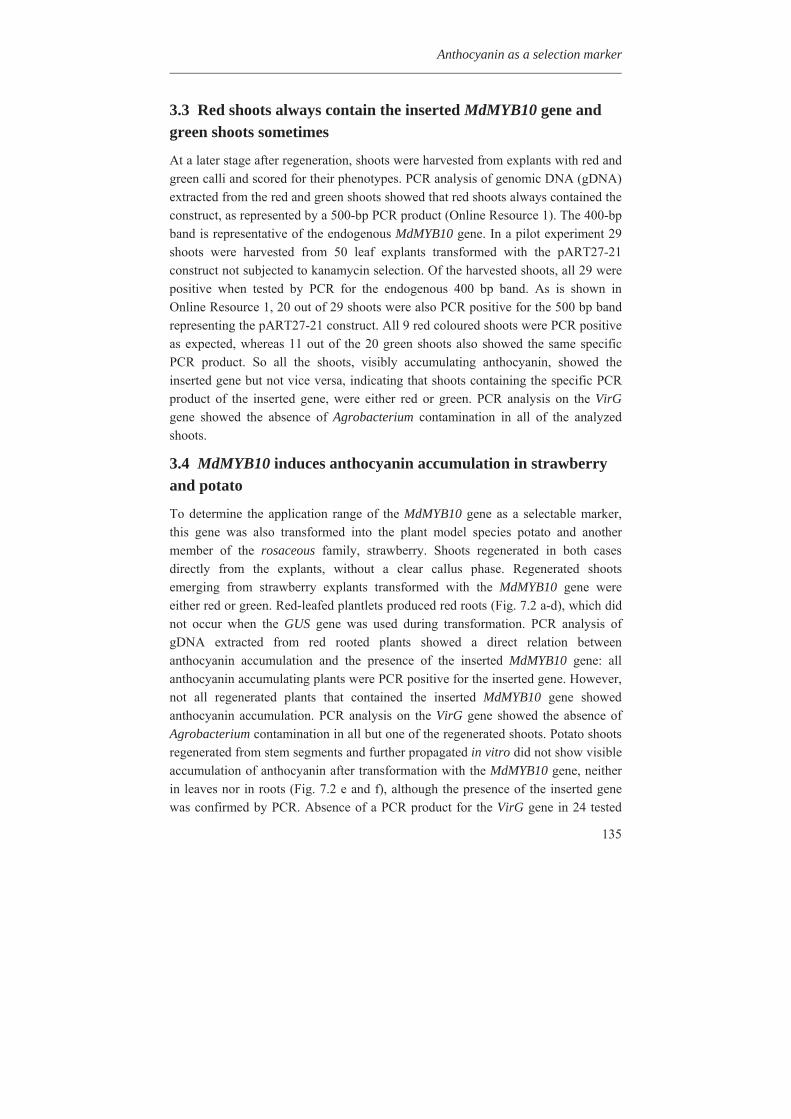
Anthocyanin as a selection marker
135
3.3 Red shoots always contain the inserted MdMYB10 gene and green shoots sometimes
At a later stage after regeneration, shoots were harvested from explants with red and green calli and scored for their phenotypes. PCR analysis of genomic DNA (gDNA) extracted from the red and green shoots showed that red shoots always contained the construct, as represented by a 500-bp PCR product (Online Resource 1). The 400-bp band is representative of the endogenous MdMYB10 gene. In a pilot experiment 29 shoots were harvested from 50 leaf explants transformed with the pART27-21 construct not subjected to kanamycin selection. Of the harvested shoots, all 29 were positive when tested by PCR for the endogenous 400 bp band. As is shown in Online Resource 1, 20 out of 29 shoots were also PCR positive for the 500 bp band representing the pART27-21 construct. All 9 red coloured shoots were PCR positive as expected, whereas 11 out of the 20 green shoots also showed the same specific PCR product. So all the shoots, visibly accumulating anthocyanin, showed the inserted gene but not vice versa, indicating that shoots containing the specific PCR product of the inserted gene, were either red or green. PCR analysis on the VirG gene showed the absence of Agrobacterium contamination in all of the analyzed shoots.
3.4 MdMYB10 induces anthocyanin accumulation in strawberry and potato
To determine the application range of the MdMYB10 gene as a selectable marker, this gene was also transformed into the plant model species potato and another member of the rosaceous family, strawberry. Shoots regenerated in both cases directly from the explants, without a clear callus phase. Regenerated shoots emerging from strawberry explants transformed with the MdMYB10 gene were either red or green. Red-leafed plantlets produced red roots (Fig. 7.2 a-d), which did not occur when the GUS gene was used during transformation. PCR analysis of gDNA extracted from red rooted plants showed a direct relation between anthocyanin accumulation and the presence of the inserted MdMYB10 gene: all anthocyanin accumulating plants were PCR positive for the inserted gene. However, not all regenerated plants that contained the inserted MdMYB10 gene showed anthocyanin accumulation. PCR analysis on the VirG gene showed the absence of Agrobacterium contamination in all but one of the regenerated shoots. Potato shoots regenerated from stem segments and further propagated in vitro did not show visible accumulation of anthocyanin after transformation with the MdMYB10 gene, neither in leaves nor in roots (Fig. 7.2 e and f), although the presence of the inserted gene was confirmed by PCR. Absence of a PCR product for the VirG gene in 24 tested
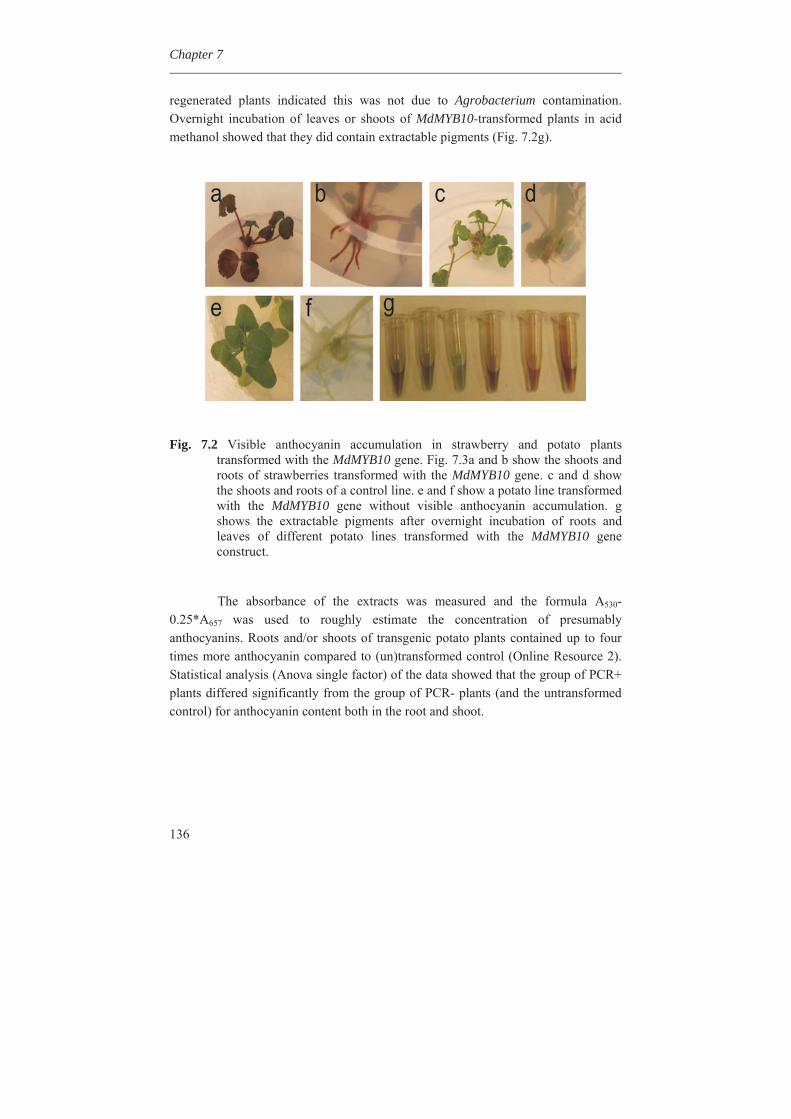
Chapter 7
136
regenerated plants indicated this was not due to Agrobacterium contamination. Overnight incubation of leaves or shoots of MdMYB10-transformed plants in acid methanol showed that they did contain extractable pigments (Fig. 7.2g).
Fig. 7.2 Visible anthocyanin accumulation in strawberry and potato plants transformed with the MdMYB10 gene. Fig. 7.3a and b show the shoots and roots of strawberries transformed with the MdMYB10 gene. c and d show the shoots and roots of a control line. e and f show a potato line transformed with the MdMYB10 gene without visible anthocyanin accumulation. g shows the extractable pigments after overnight incubation of roots and leaves of different potato lines transformed with the MdMYB10 gene construct.
The absorbance of the extracts was measured and the formula A530-0.25*A657 was used to roughly estimate the concentration of presumably anthocyanins. Roots and/or shoots of transgenic potato plants contained up to four times more anthocyanin compared to (un)transformed control (Online Resource 2). Statistical analysis (Anova single factor) of the data showed that the group of PCR+ plants differed significantly from the group of PCR- plants (and the untransformed control) for anthocyanin content both in the root and shoot.
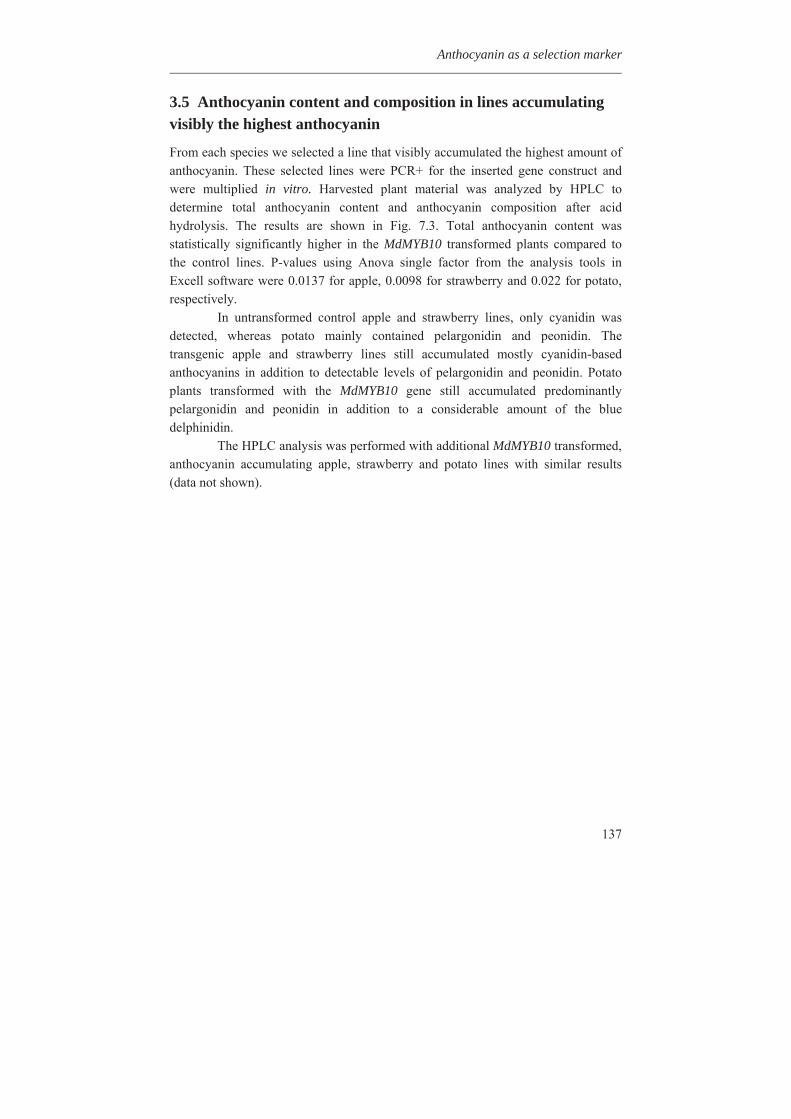
Anthocyanin as a selection marker
137
3.5 Anthocyanin content and composition in lines accumulating visibly the highest anthocyanin
From each species we selected a line that visibly accumulated the highest amount of anthocyanin. These selected lines were PCR+ for the inserted gene construct and were multiplied in vitro. Harvested plant material was analyzed by HPLC to determine total anthocyanin content and anthocyanin composition after acid hydrolysis. The results are shown in Fig. 7.3. Total anthocyanin content was statistically significantly higher in the MdMYB10 transformed plants compared to the control lines. P-values using Anova single factor from the analysis tools in Excell software were 0.0137 for apple, 0.0098 for strawberry and 0.022 for potato, respectively.
In untransformed control apple and strawberry lines, only cyanidin was detected, whereas potato mainly contained pelargonidin and peonidin. The transgenic apple and strawberry lines still accumulated mostly cyanidin-based anthocyanins in addition to detectable levels of pelargonidin and peonidin. Potato plants transformed with the MdMYB10 gene still accumulated predominantly pelargonidin and peonidin in addition to a considerable amount of the blue delphinidin.
The HPLC analysis was performed with additional MdMYB10 transformed, anthocyanin accumulating apple, strawberry and potato lines with similar results (data not shown).
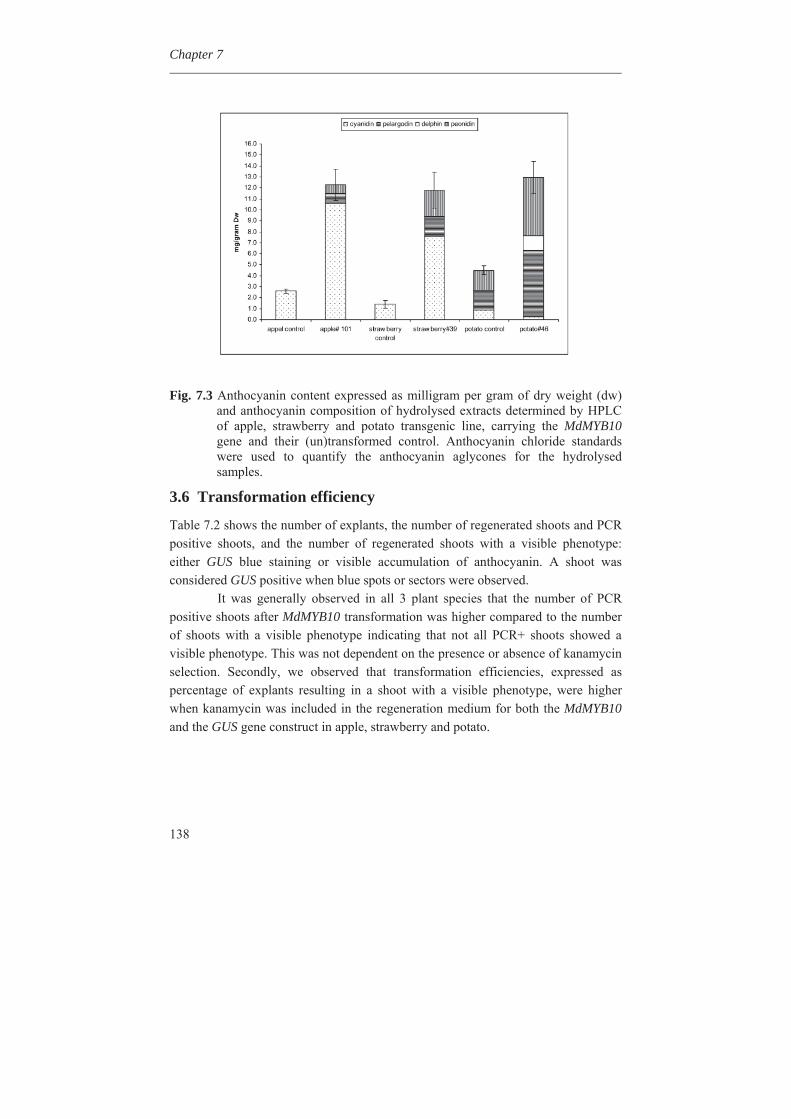
Chapter 7
138
Fig. 7.3 Anthocyanin content expressed as milligram per gram of dry weight (dw)
and anthocyanin composition of hydrolysed extracts determined by HPLC of apple, strawberry and potato transgenic line, carrying the MdMYB10 gene and their (un)transformed control. Anthocyanin chloride standards were used to quantify the anthocyanin aglycones for the hydrolysed samples.
3.6 Transformation efficiency
Table 7.2 shows the number of explants, the number of regenerated shoots and PCR positive shoots, and the number of regenerated shoots with a visible phenotype: either GUS blue staining or visible accumulation of anthocyanin. A shoot was considered GUS positive when blue spots or sectors were observed.
It was generally observed in all 3 plant species that the number of PCR positive shoots after MdMYB10 transformation was higher compared to the number of shoots with a visible phenotype indicating that not all PCR+ shoots showed a visible phenotype. This was not dependent on the presence or absence of kanamycin selection. Secondly, we observed that transformation efficiencies, expressed as percentage of explants resulting in a shoot with a visible phenotype, were higher when kanamycin was included in the regeneration medium for both the MdMYB10 and the GUS gene construct in apple, strawberry and potato.
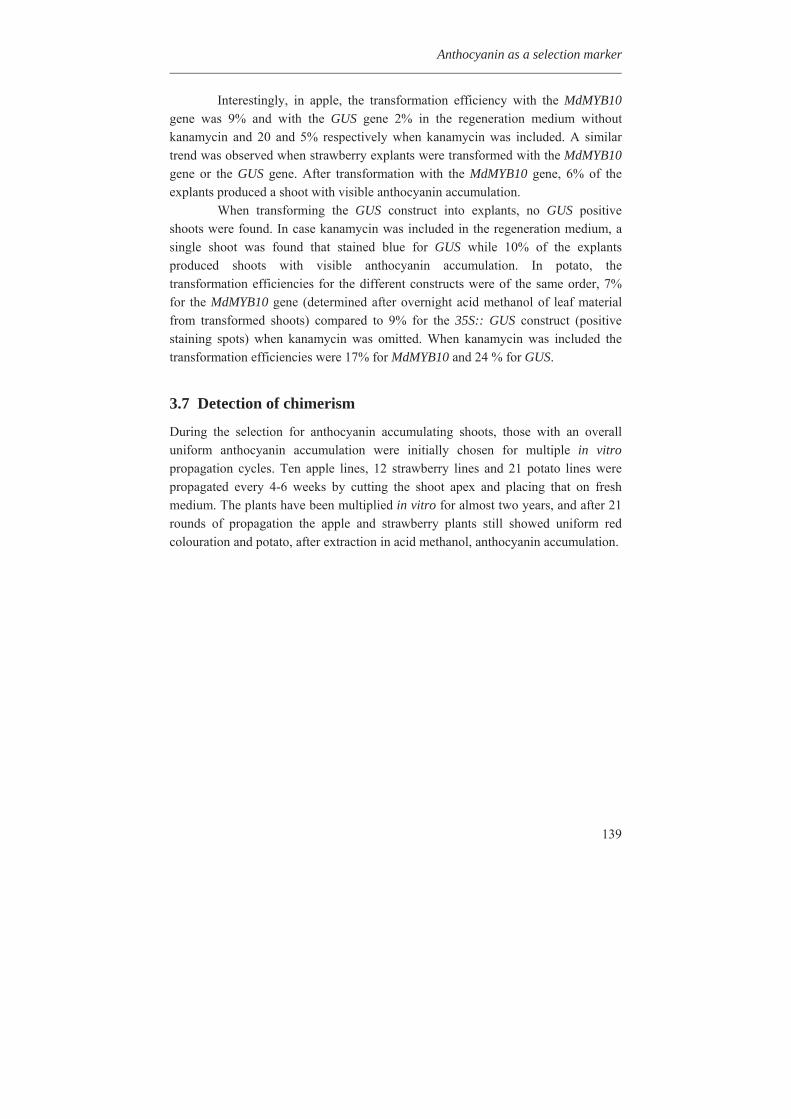
Anthocyanin as a selection marker
139
Interestingly, in apple, the transformation efficiency with the MdMYB10 gene was 9% and with the GUS gene 2% in the regeneration medium without kanamycin and 20 and 5% respectively when kanamycin was included. A similar trend was observed when strawberry explants were transformed with the MdMYB10 gene or the GUS gene. After transformation with the MdMYB10 gene, 6% of the explants produced a shoot with visible anthocyanin accumulation.
When transforming the GUS construct into explants, no GUS positive shoots were found. In case kanamycin was included in the regeneration medium, a single shoot was found that stained blue for GUS while 10% of the explants produced shoots with visible anthocyanin accumulation. In potato, the transformation efficiencies for the different constructs were of the same order, 7% for the MdMYB10 gene (determined after overnight acid methanol of leaf material from transformed shoots) compared to 9% for the 35S:: GUS construct (positive staining spots) when kanamycin was omitted. When kanamycin was included the transformation efficiencies were 17% for MdMYB10 and 24 % for GUS.
3.7 Detection of chimerism
During the selection for anthocyanin accumulating shoots, those with an overall uniform anthocyanin accumulation were initially chosen for multiple in vitro propagation cycles. Ten apple lines, 12 strawberry lines and 21 potato lines were propagated every 4-6 weeks by cutting the shoot apex and placing that on fresh medium. The plants have been multiplied in vitro for almost two years, and after 21 rounds of propagation the apple and strawberry plants still showed uniform red colouration and potato, after extraction in acid methanol, anthocyanin accumulation.
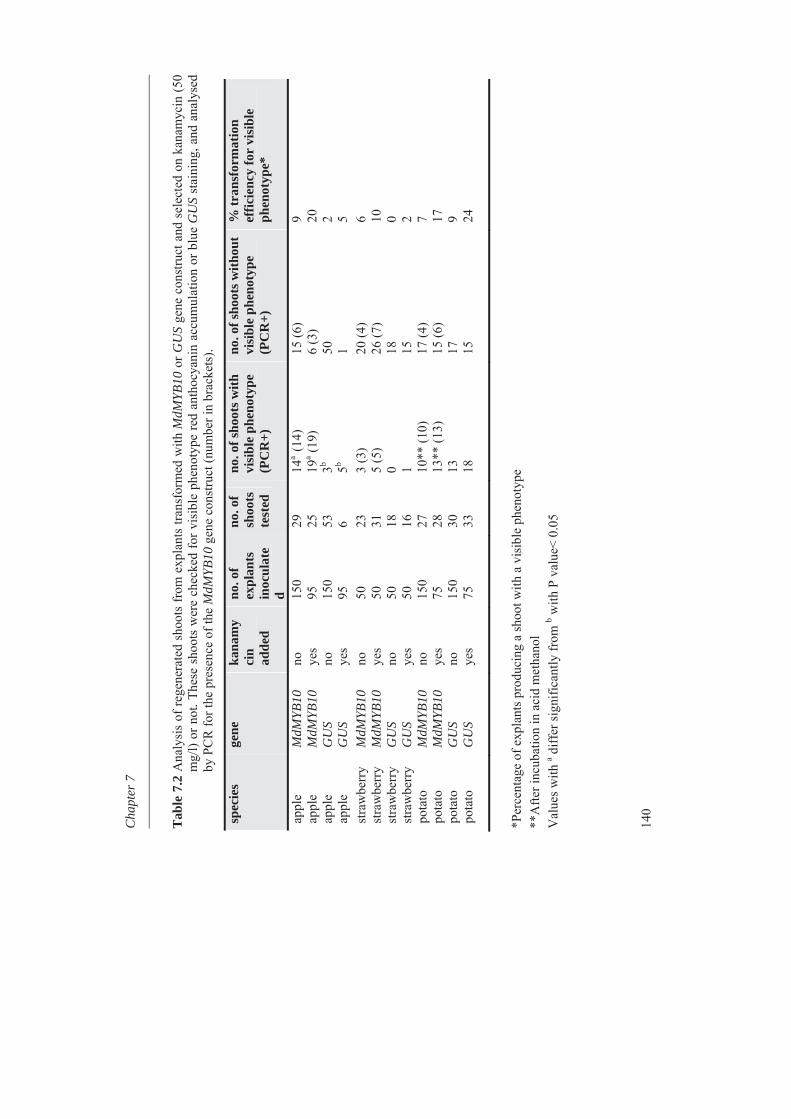
Cha
pter
7
140
Tab
le 7
.2 A
naly
sis
of re
gene
rate
d sh
oots
from
exp
lant
s tra
nsfo
rmed
with
MdM
YB10
or G
US
gene
con
stru
ct a
nd s
elec
ted
on k
anam
ycin
(50
mg/
l) or
not
. The
se s
hoot
s w
ere
chec
ked
for v
isib
le p
heno
type
red
anth
ocya
nin
accu
mul
atio
n or
blu
e G
US
stai
ning
, and
ana
lyse
d by
PC
R fo
r the
pre
senc
e of
the
MdM
YB10
gen
e co
nstru
ct (n
umbe
r in
brac
kets
).
*Per
cent
age
of e
xpla
nts p
rodu
cing
a sh
oot w
ith a
vis
ible
phe
noty
pe
**A
fter i
ncub
atio
n in
aci
d m
etha
nol
Val
ues w
ith a d
iffer
sign
ifica
ntly
from
b with
P v
alue
< 0.
05
spec
ies
gene
ka
nam
yci
n ad
ded
no. o
f ex
plan
ts
inoc
ulat
ed
no. o
f sh
oots
te
sted
no. o
f sho
ots w
ith
visi
ble
phen
otyp
e (P
CR
+)
no. o
f sho
ots w
ithou
t vi
sibl
e ph
enot
ype
(PC
R+)
% tr
ansf
orm
atio
n ef
ficie
ncy
for
visi
ble
phen
otyp
e*
appl
e M
dMYB
10
no
150
29
14a
(14)
15
(6)
9 ap
ple
MdM
YB10
ye
s 95
25
19
a (19)
6
(3)
20
appl
e G
US
no
150
53
3b
50
2
appl
e G
US
yes
95
6 5b
1
5 st
raw
berr
y M
dMYB
10
no
50
23
3 (3
) 20
(4)
6 st
raw
berr
y M
dMYB
10
yes
50
31
5 (5
) 26
(7)
10
stra
wbe
rry
GU
S no
50
18
0
18
0 st
raw
berr
y G
US
yes
50
16
1 15
2
pota
to
MdM
YB10
no
15
0 27
10
** (1
0)
17 (4
) 7
pota
to
MdM
YB10
ye
s 75
28
13
** (1
3)
15 (6
) 17
po
tato
G
US
no
150
30
13
17
9 po
tato
G
US
yes
75
33
18
15
24
Anthocyanin as a selection marker
141
4. Discussion
4.1 MdMYB10 can be used as a selectable marker gene in apple, strawberry and potato
The results presented in this manuscript show that it is possible to use the MdMYB10 gene from apple as a selectable marker gene for transformation of apple, strawberry and potato plants using standard transformation protocols. For apple and strawberry anthocyanin accumulation is directly visible in planta, for potato additional extraction in acid methanol is required in order to visualize increased anthocyanin synthesis by red colouration of the extract.
Red shoots, accumulating anthocyanin, always tested positive for the presence of the MdMYB10 construct. However, not all shoots that are PCR positive for the introduced MdMYB10 gene showed an anthocyanin accumulating phenotype. This type of variation among individual transgenic plants is often found in plant transformation experiments and can be explained by variation in expression of the introduced MdMYB10 gene caused by copy number, position of integration or silencing of the transgene (Butaye et al., 2005).
4.2 The possibility of chimerism
When the GUS construct was used for transformation, several plants with blue-staining sectors or spots were observed. This patchy GUS staining was observed in regenerating shoots both when kanamycin was omitted and when it was included in the medium (Online Resource 3). This non-uniform GUS staining can be attributed to the staining procedure, gene silencing, or chimerism of the regenerated shoot. Chimeras in apple have been reported in transformants of apple obtained without use of a selectable marker (Malnoy et al., 2010) at a low frequency. In two out of 26 transgenic apple lines that were initially selected on kanamycin but propagated for four years in vitro under non selective conditions (Flachowsky et al., 2008) chimerism was detected as well. Similarly, in tobacco transformation under non selective conditions, one third of the recovered shoots were shown to be chimeric (Li et al., 2009) as opposed to 6-7% when kanamycin was used as selection marker. So chimerism, not observed here in our experiments, is expected to occur occasionally. An additional phase after selecting the putative transgenic plants, such as re-regeneration could reduce the problem of chimerism.
In our study, 10 apple, 12 strawberry and 21 potato lines were multiplied for 21 rounds of propagation and the plants still showed uniform red colouration. On the basis of red colouration these are expected to be uniformly transformed, but the
Chapter 7
142
ultimate proof will include future experiments where several rounds of regeneration of transformed plants will be analysed for their possible chimerical nature.
4.3 Conditions for selecting putative transgenic plants
Our results showed that for apple a possible early phase for selecting putative transformants is callus initiated in the dark. Red calli were observed that produce a red shoot, although this happened at very low frequencies. Upon transformation of potato or strawberry there is a very short callus phase so the shoot stage is the earliest opportunity for testing.
Environmental factors, especially light and temperature are also able to induce the production of anthocyanins (Rabino and Mancinelly, 1986). Exposing regenerating plants to high light intensity usually was accompanied by an increased anthocyanin accumulation, even in control plants.
Selection for anthocyanin accumulating shoots in the dark would prevent light induction of endogenous anthocyanins but unfortunately also causes a decrease in shoot outgrowth (Predieri and Malavasi, 1989). Using our standard transformation conditions we were able to select transgenic plants when we selected for anthocyanin accumulating shoots after regeneration in the light.
Here, in apple and strawberry regenerating shoots with very high anthocyanin accumulation died. Apparently anthocyanin accumulation can be toxic-possibly by influencing the redox state of the cell or by sequestering all available carbon and nitrogen. Similar results were described by Bower et al., 1996, who described constitutive expression of the maize R and C1 gene to be lethal for regenerating sugarcane shoots beyond a certain developmental state. The differences between the experiments are in the promoter that was used to drive expression of the anthocyanin inducing transcription factor genes (35S CaMV versus MdMYB10), the origin of the coding part of the genes (maize versus apple) and the method to deliver the genes into the genome (particle gun bombardment versus Agrobacterium), and the host plant themselves (sugarcane versus apple/strawberry/potato).
In potato, visible accumulation of anthocyanins in intact plants transformed
with the MdMYB10 gene was observed after overnight incubation of leaf or root material in acid methanol. The total anthocyanin content of the transformed apple, potato and strawberry plants detected by HPLC was similar, around one percent of the total dry weight (Fig. 7.3) for the plants visually showing the highest anthocyanin accumulation. The structural composition of anthocyanidins from the different sources varied, apple and strawberry mainly contained cyanidin and potato mainly contained the red pelargonidin. In contrast to control plants, MdMYB10 transformed apple and strawberry accumulated detectable amounts of pelargonidin and peonidin. Potato
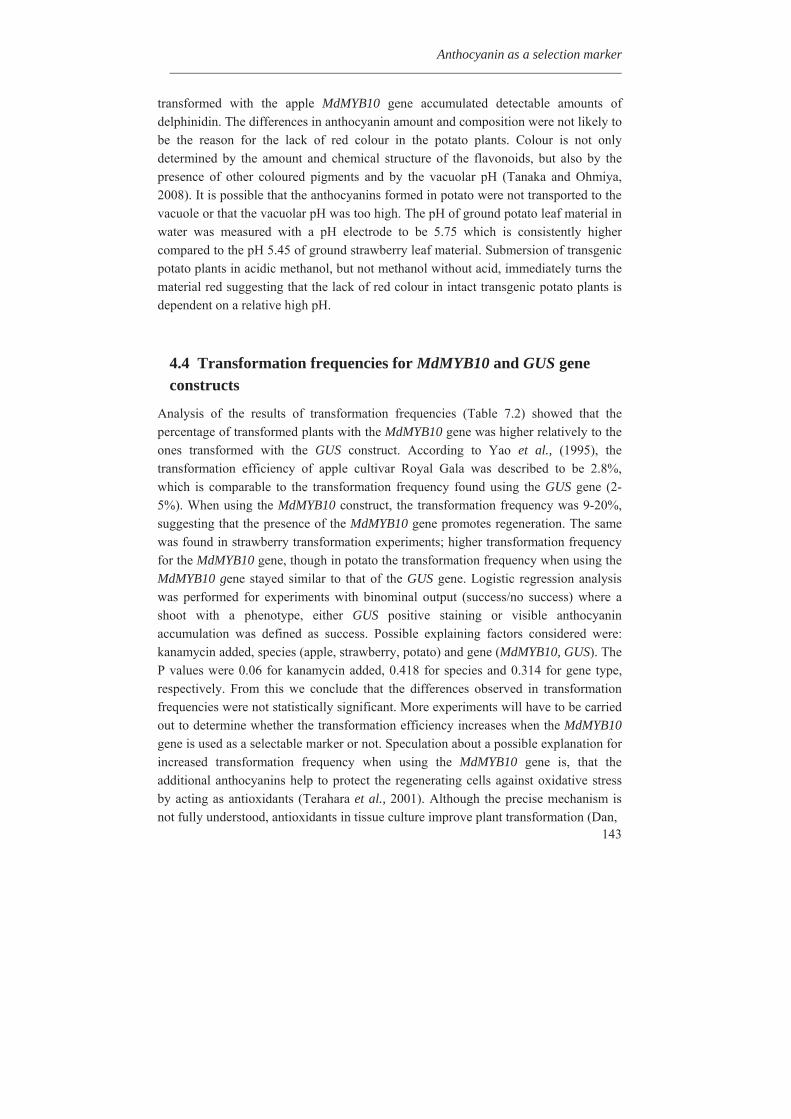
Anthocyanin as a selection marker
143
transformed with the apple MdMYB10 gene accumulated detectable amounts of delphinidin. The differences in anthocyanin amount and composition were not likely to be the reason for the lack of red colour in the potato plants. Colour is not only determined by the amount and chemical structure of the flavonoids, but also by the presence of other coloured pigments and by the vacuolar pH (Tanaka and Ohmiya, 2008). It is possible that the anthocyanins formed in potato were not transported to the vacuole or that the vacuolar pH was too high. The pH of ground potato leaf material in water was measured with a pH electrode to be 5.75 which is consistently higher compared to the pH 5.45 of ground strawberry leaf material. Submersion of transgenic potato plants in acidic methanol, but not methanol without acid, immediately turns the material red suggesting that the lack of red colour in intact transgenic potato plants is dependent on a relative high pH.
4.4 Transformation frequencies for MdMYB10 and GUS gene constructs
Analysis of the results of transformation frequencies (Table 7.2) showed that the percentage of transformed plants with the MdMYB10 gene was higher relatively to the ones transformed with the GUS construct. According to Yao et al., (1995), the transformation efficiency of apple cultivar Royal Gala was described to be 2.8%, which is comparable to the transformation frequency found using the GUS gene (2-5%). When using the MdMYB10 construct, the transformation frequency was 9-20%, suggesting that the presence of the MdMYB10 gene promotes regeneration. The same was found in strawberry transformation experiments; higher transformation frequency for the MdMYB10 gene, though in potato the transformation frequency when using the MdMYB10 gene stayed similar to that of the GUS gene. Logistic regression analysis was performed for experiments with binominal output (success/no success) where a shoot with a phenotype, either GUS positive staining or visible anthocyanin accumulation was defined as success. Possible explaining factors considered were: kanamycin added, species (apple, strawberry, potato) and gene (MdMYB10, GUS). The P values were 0.06 for kanamycin added, 0.418 for species and 0.314 for gene type, respectively. From this we conclude that the differences observed in transformation frequencies were not statistically significant. More experiments will have to be carried out to determine whether the transformation efficiency increases when the MdMYB10 gene is used as a selectable marker or not. Speculation about a possible explanation for increased transformation frequency when using the MdMYB10 gene is, that the additional anthocyanins help to protect the regenerating cells against oxidative stress by acting as antioxidants (Terahara et al., 2001). Although the precise mechanism is not fully understood, antioxidants in tissue culture improve plant transformation (Dan,
Chapter 7
144
2008) probably by protecting tissue against reactive oxygen species (ROS), which is the normal initial plant response after pathogen attack.
Another explanation for the differences between regeneration frequencies may lie in the structure of the vectors used, pART27 versus pK2GW7. To prove that anthocyanin accumulation is a result of expression of the MdMYB10 gene and not that the binary vector structure is primarily responsible for a higher transformation frequency, experiments will have to include the same binary vector for transformation.
4.5 MdMYB10 gene as a cisgenic or intragenic selectable marker
For apple, the MdMYB10 gene can even be used as what is referred to as a cisgenic selectable marker. Cisgenesis is a new emerging technology based on the use of natural genes that originate from the target plant itself (Schouten et al., 2006) or from crossable species that could be introgressed through sexual crossing. Similarly, intragenesis is a method based on using all native plant derived functional DNA from the same species or crossable wild species for transformation vectors (Rommens, 2004). Both, cisgenesis and intragenesis, combine the benefits of genetic modification while at the same time avoiding many of the societal issues about the expression of foreign genes and proteins in food crops. The application of cisgenic and intragenic technology requires that crop-specific selectable marker genes must be identified. Anthocyanin regulatory and biosynthetic genes seem to be ideal because the biosynthetic pathway is conserved among plant species and a large number of genes involved in the pathway have been identified. Natural mutants with colour phenotypes and altered anthocyanins have been identified in many species, such as grape, apple, pear, potato, maize and petunia (Winkel-Shirley, 2001 and references therein), and would be likely candidates to be used as selectable marker genes. Recently, the sweet potato IbMYB1 gene was evaluated for being used as a intragenic marker for sweet potato transformation (Kim et al., 2010), showing the potential application of visible marker genes in transformation of different plant species.
Acknowledgements
We would like to thank Dr. Geert Jan de Klerk and Dr. Frans Krens from Wageningen UR Plant Breeding for stimulating discussions, Christel Denneboom, Aranka van de Burgh and Luuk Groenestein for help with the analysis of the transgenic plants and tissue culture work.

Chapter 8
General Discussion
Chapter 8
146
In this thesis, the first steps in developing more targeted approaches for breeding apple with improved quality traits like taste and composition of potentially health promoting compounds were established. Apple (Malus x domestica Borkh) is an important fruit of the temperate regions. It is used mainly as a fresh fruit while a small part is processed into products such as apple juice and apple sauce.
8.1 Apple fruit and human health The famous saying ‘An apple a day keeps the doctor away’ has encouraged the researchers to find the magic ingredients that apple contains (Ridgway et al., 1997). It is a rich source of various secondary metabolites such as flavonoids. These metabolites have been found to be the major source of antioxidants (Wolfe et al., 2003). Several of these metabolites such as chlorogenic acid, quercetin, and phloridzin have been reported to have potential health benefits and are involved in the protection of many human diseases. For example, apple eating has been associated with the potential reduction of chances of becoming victim to cancer, particularly prostate, liver, colon, and lung cancers, and cardiovascular diseases (Eberhardt et al., 2000; Mcghie et al., 2005).
8.2 Metabolic diversity in apple Metabolic diversity in fruits of Malus germplasm (wild, advanced selections and a segregating F1 population) was evaluated as a part of this study (Chapter 3). Wild germplasm was compared to advanced selections and also to a segregating F1 population, including the crossing parents, to study the diversity of metabolites and their inheritance into individual offspring. The metabolic composition may be an important factor while producing apple cultivars, as many of these metabolites have potential health benefits (Leccese et al., 2009; Valavanidis et al., 2009).
Liquid chromatography-mass spectrometry (LC-MS) was used for metabolic profiling in this study. LC-MS is an analytical chemistry technique that combines the physical separation capabilities of liquid chromatography with the mass analysis capabilities of mass spectrometry. LC-MS can potentially measure hundreds to thousands of secondary metabolites in parallel and thus gives a wide range of metabolic profiles of various secondary metabolites. In this way, the metabolic profile for the available apple germplasm could be evaluated in a wider and much detailed pattern. It appeared in our study that the wild germplasm of apple contained a much higher amount of different metabolites than the advanced selections or the F1 segregating population and covers wide metabolic diversity (Chapter 3, Fig. 3.1, 3. 2). This was, however, not surprising as it is generally known that wild species cover a wider genetic and metabolic diversity than advanced
General Discussion
147
selections. This information, may be used in future to detect within wild or advanced selections, individuals with desirable metabolites.
One potential application of the selection for such species could be for their use as antioxidants (Leccese et al., 2009; Valavanidis et al., 2009) and their potential role as protective agents in various human diseases such as cancers, particularly prostate, liver, colon, and lung cancers (Xing et al., 2001), cardiovascular diseases (Hyson et al., 2000; Hertog et al., 1993; Hertog, 1992), coronary heart diseases, asthma, type-2 diabetes, thrombotic stroke, and ischemic heart disease (Mcghie et al., 2005). A limitation, however, in dealing such data would be the annotation of metabolites and their properties. At the moment it is not possible to annotate all the metabolites from LC-MS (Keurentjes, 2009). In this study, rather a small set of metabolites was annotated. Hopefully in near future it would be possible to annotate far more metabolites, which will give a much better understanding of the metabolic profile of apple or of any other commercially important crop. The metabolic profile could be used to locate genes on the genome that cause phenotypic differences in metabolic pathways such as phenylpropanoid pathway of plants.
During this study it was found that while crossing two cultivars, certain metabolites could be lost and certain other metabolites could be gained. One quarter of the progeny of the segregating F1 population showed this loss for about one quarter of the metabolites. On the other hand some metabolites were found to have significantly higher levels in some of the progeny than in both of the parents, this we called gain of metabolites. Therefore, in future it should be considered more generally that even normal crosses in plant breeding could be accompanied with loss and gain of metabolites.
8.3 QTL mapping of secondary metabolites A quantitative trait is defined as a characteristic whose value varies across individuals in degree rather than in category. The precise phenotype of such a trait is determined by polygenes and environmental effects, e.g., yield and yield-related traits, quality traits, resistance to diseases and insects, and abiotic stress tolerance (Zhang and Gai, 2009). In contrast to that we reported in this thesis that the metabolites are also quantitatively inherited, however, not polygenic but monogenic. This was showed in Chapter 4 and Chapter 5 where only one gene, called MdLAR1 caused the mQTLs for several metabolites. Another example of monogenetically regulated metabolites was found at one locus on LG8, it regulates the glycosylated forms of -glycols (Chapter 3).
A pre-requisite for QTL mapping is the availability of a dense and high quality genetic linkage map on the one hand and equally important a good phenotypic data set of the same segregating population used in genetic mapping on
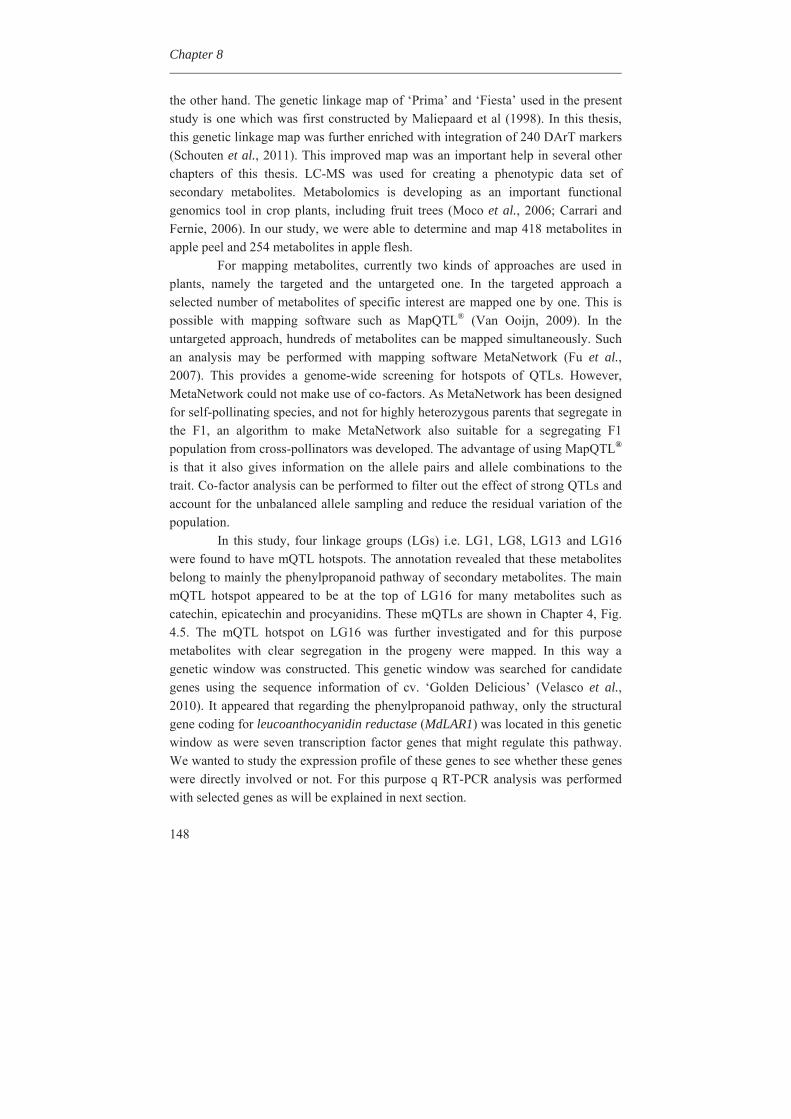
Chapter 8
148
the other hand. The genetic linkage map of ‘Prima’ and ‘Fiesta’ used in the present study is one which was first constructed by Maliepaard et al (1998). In this thesis, this genetic linkage map was further enriched with integration of 240 DArT markers (Schouten et al., 2011). This improved map was an important help in several other chapters of this thesis. LC-MS was used for creating a phenotypic data set of secondary metabolites. Metabolomics is developing as an important functional genomics tool in crop plants, including fruit trees (Moco et al., 2006; Carrari and Fernie, 2006). In our study, we were able to determine and map 418 metabolites in apple peel and 254 metabolites in apple flesh.
For mapping metabolites, currently two kinds of approaches are used in plants, namely the targeted and the untargeted one. In the targeted approach a selected number of metabolites of specific interest are mapped one by one. This is possible with mapping software such as MapQTL® (Van Ooijn, 2009). In the untargeted approach, hundreds of metabolites can be mapped simultaneously. Such an analysis may be performed with mapping software MetaNetwork (Fu et al., 2007). This provides a genome-wide screening for hotspots of QTLs. However, MetaNetwork could not make use of co-factors. As MetaNetwork has been designed for self-pollinating species, and not for highly heterozygous parents that segregate in the F1, an algorithm to make MetaNetwork also suitable for a segregating F1 population from cross-pollinators was developed. The advantage of using MapQTL® is that it also gives information on the allele pairs and allele combinations to the trait. Co-factor analysis can be performed to filter out the effect of strong QTLs and account for the unbalanced allele sampling and reduce the residual variation of the population.
In this study, four linkage groups (LGs) i.e. LG1, LG8, LG13 and LG16 were found to have mQTL hotspots. The annotation revealed that these metabolites belong to mainly the phenylpropanoid pathway of secondary metabolites. The main mQTL hotspot appeared to be at the top of LG16 for many metabolites such as catechin, epicatechin and procyanidins. These mQTLs are shown in Chapter 4, Fig. 4.5. The mQTL hotspot on LG16 was further investigated and for this purpose metabolites with clear segregation in the progeny were mapped. In this way a genetic window was constructed. This genetic window was searched for candidate genes using the sequence information of cv. ‘Golden Delicious’ (Velasco et al., 2010). It appeared that regarding the phenylpropanoid pathway, only the structural gene coding for leucoanthocyanidin reductase (MdLAR1) was located in this genetic window as were seven transcription factor genes that might regulate this pathway. We wanted to study the expression profile of these genes to see whether these genes were directly involved or not. For this purpose q RT-PCR analysis was performed with selected genes as will be explained in next section.
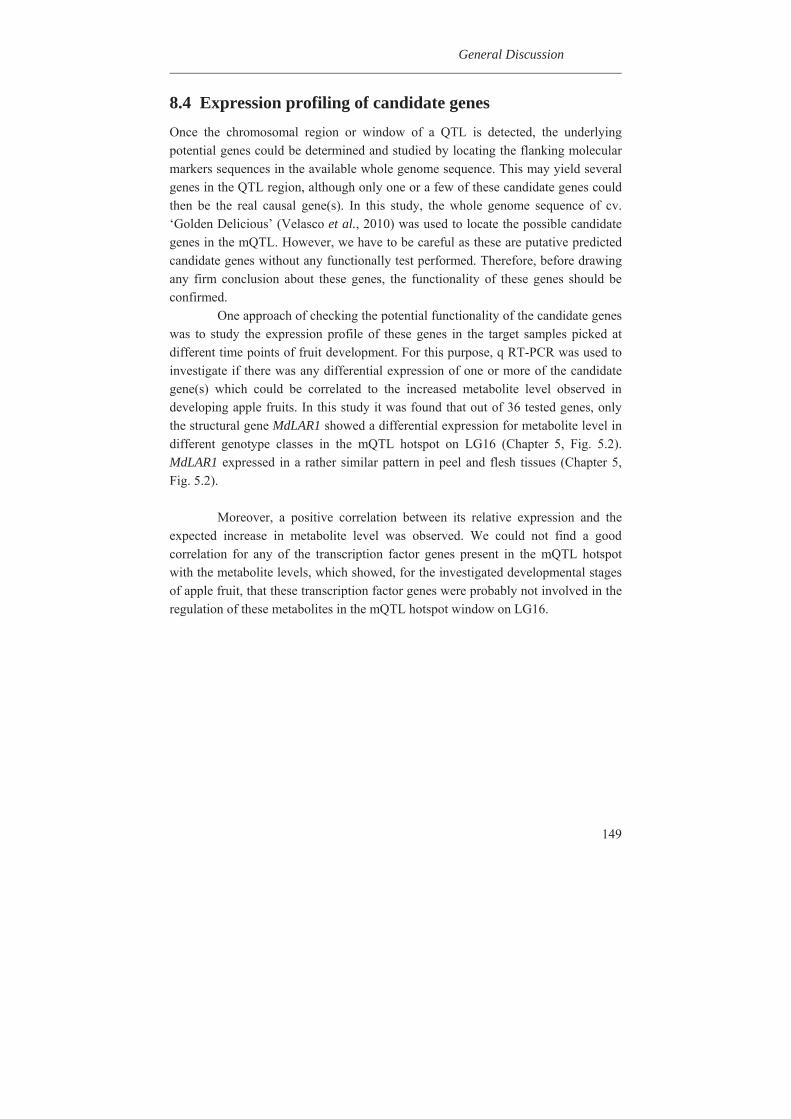
General Discussion
149
8.4 Expression profiling of candidate genes Once the chromosomal region or window of a QTL is detected, the underlying potential genes could be determined and studied by locating the flanking molecular markers sequences in the available whole genome sequence. This may yield several genes in the QTL region, although only one or a few of these candidate genes could then be the real causal gene(s). In this study, the whole genome sequence of cv. ‘Golden Delicious’ (Velasco et al., 2010) was used to locate the possible candidate genes in the mQTL. However, we have to be careful as these are putative predicted candidate genes without any functionally test performed. Therefore, before drawing any firm conclusion about these genes, the functionality of these genes should be confirmed.
One approach of checking the potential functionality of the candidate genes was to study the expression profile of these genes in the target samples picked at different time points of fruit development. For this purpose, q RT-PCR was used to investigate if there was any differential expression of one or more of the candidate gene(s) which could be correlated to the increased metabolite level observed in developing apple fruits. In this study it was found that out of 36 tested genes, only the structural gene MdLAR1 showed a differential expression for metabolite level in different genotype classes in the mQTL hotspot on LG16 (Chapter 5, Fig. 5.2). MdLAR1 expressed in a rather similar pattern in peel and flesh tissues (Chapter 5, Fig. 5.2).
Moreover, a positive correlation between its relative expression and the
expected increase in metabolite level was observed. We could not find a good correlation for any of the transcription factor genes present in the mQTL hotspot with the metabolite levels, which showed, for the investigated developmental stages of apple fruit, that these transcription factor genes were probably not involved in the regulation of these metabolites in the mQTL hotspot window on LG16.
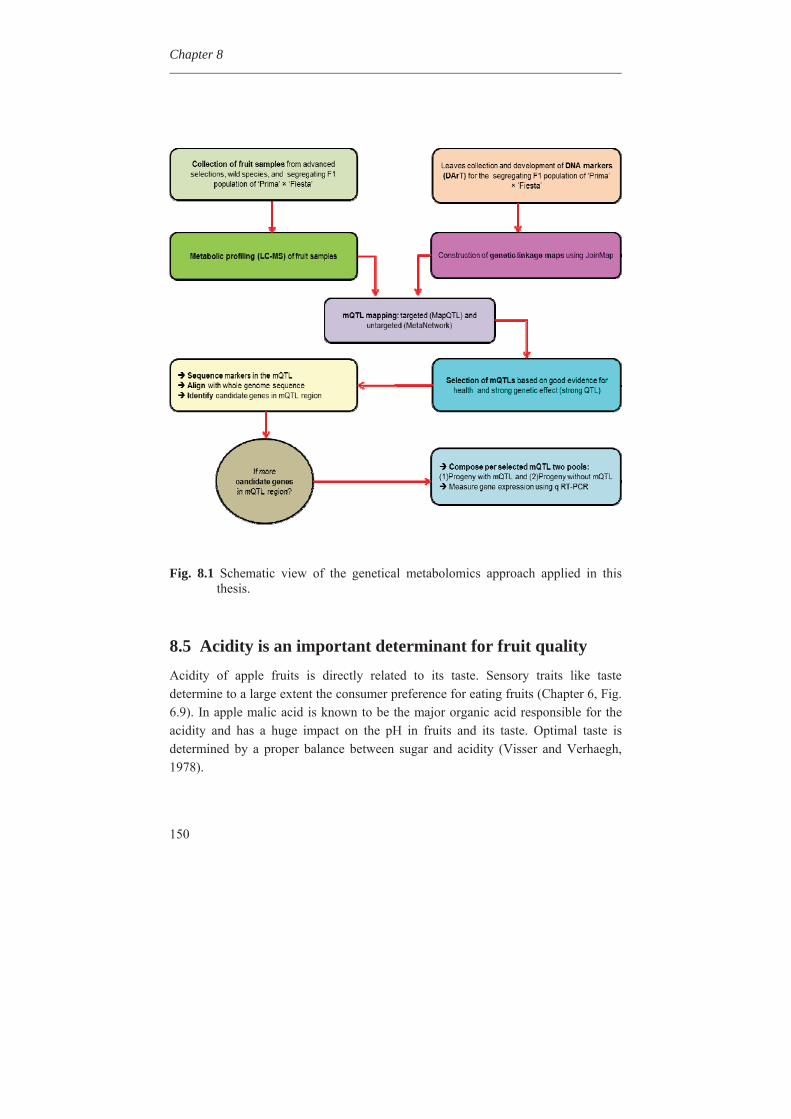
Chapter 8
150
Fig. 8.1 Schematic view of the genetical metabolomics approach applied in this
thesis.
8.5 Acidity is an important determinant for fruit quality Acidity of apple fruits is directly related to its taste. Sensory traits like taste determine to a large extent the consumer preference for eating fruits (Chapter 6, Fig. 6.9). In apple malic acid is known to be the major organic acid responsible for the acidity and has a huge impact on the pH in fruits and its taste. Optimal taste is determined by a proper balance between sugar and acidity (Visser and Verhaegh, 1978).
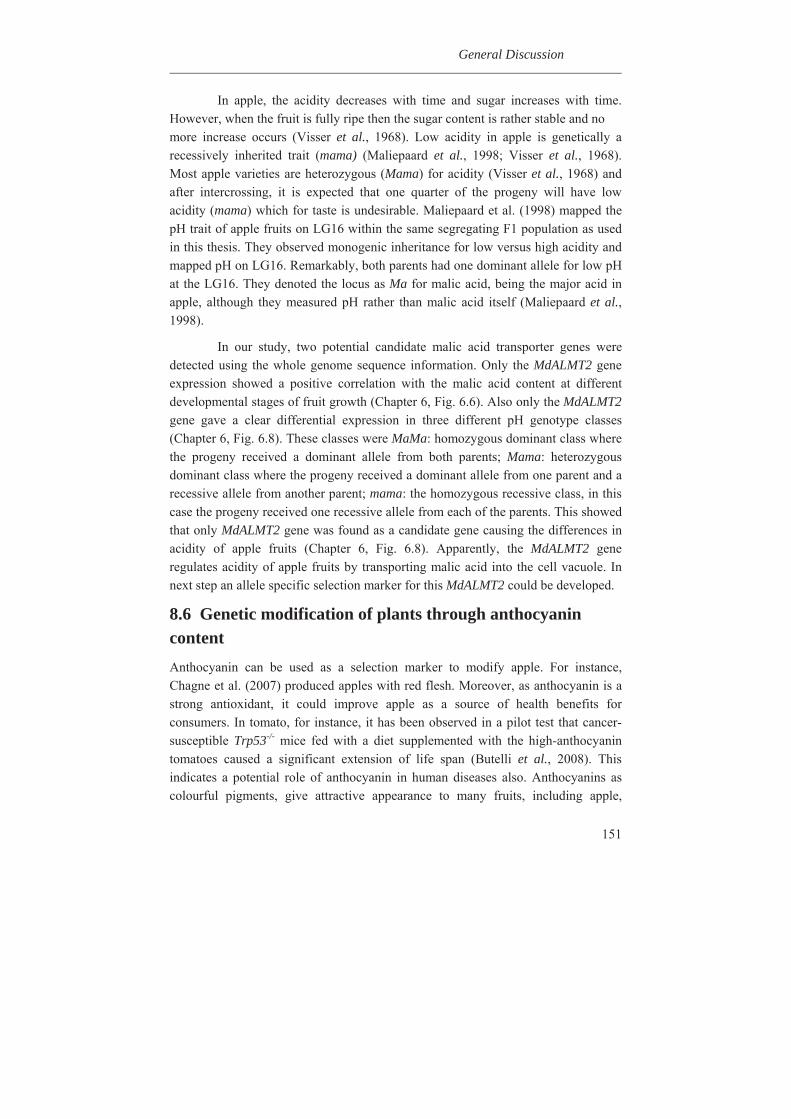
General Discussion
151
In apple, the acidity decreases with time and sugar increases with time. However, when the fruit is fully ripe then the sugar content is rather stable and no more increase occurs (Visser et al., 1968). Low acidity in apple is genetically a recessively inherited trait (mama) (Maliepaard et al., 1998; Visser et al., 1968). Most apple varieties are heterozygous (Mama) for acidity (Visser et al., 1968) and after intercrossing, it is expected that one quarter of the progeny will have low acidity (mama) which for taste is undesirable. Maliepaard et al. (1998) mapped the pH trait of apple fruits on LG16 within the same segregating F1 population as used in this thesis. They observed monogenic inheritance for low versus high acidity and mapped pH on LG16. Remarkably, both parents had one dominant allele for low pH at the LG16. They denoted the locus as Ma for malic acid, being the major acid in apple, although they measured pH rather than malic acid itself (Maliepaard et al., 1998).
In our study, two potential candidate malic acid transporter genes were detected using the whole genome sequence information. Only the MdALMT2 gene expression showed a positive correlation with the malic acid content at different developmental stages of fruit growth (Chapter 6, Fig. 6.6). Also only the MdALMT2 gene gave a clear differential expression in three different pH genotype classes (Chapter 6, Fig. 6.8). These classes were MaMa: homozygous dominant class where the progeny received a dominant allele from both parents; Mama: heterozygous dominant class where the progeny received a dominant allele from one parent and a recessive allele from another parent; mama: the homozygous recessive class, in this case the progeny received one recessive allele from each of the parents. This showed that only MdALMT2 gene was found as a candidate gene causing the differences in acidity of apple fruits (Chapter 6, Fig. 6.8). Apparently, the MdALMT2 gene regulates acidity of apple fruits by transporting malic acid into the cell vacuole. In next step an allele specific selection marker for this MdALMT2 could be developed.
8.6 Genetic modification of plants through anthocyanin content Anthocyanin can be used as a selection marker to modify apple. For instance, Chagne et al. (2007) produced apples with red flesh. Moreover, as anthocyanin is a strong antioxidant, it could improve apple as a source of health benefits for consumers. In tomato, for instance, it has been observed in a pilot test that cancer-susceptible Trp53-/- mice fed with a diet supplemented with the high-anthocyanin tomatoes caused a significant extension of life span (Butelli et al., 2008). This indicates a potential role of anthocyanin in human diseases also. Anthocyanins as colourful pigments, give attractive appearance to many fruits, including apple,
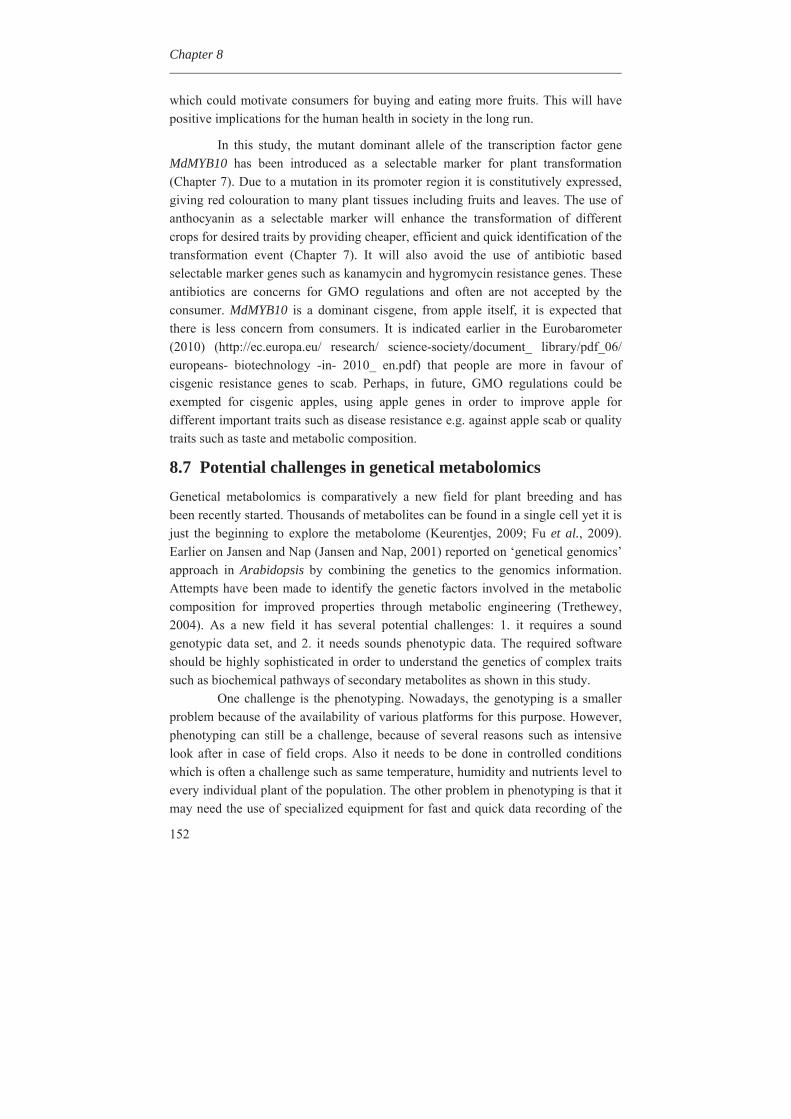
Chapter 8
152
which could motivate consumers for buying and eating more fruits. This will have positive implications for the human health in society in the long run.
In this study, the mutant dominant allele of the transcription factor gene MdMYB10 has been introduced as a selectable marker for plant transformation (Chapter 7). Due to a mutation in its promoter region it is constitutively expressed, giving red colouration to many plant tissues including fruits and leaves. The use of anthocyanin as a selectable marker will enhance the transformation of different crops for desired traits by providing cheaper, efficient and quick identification of the transformation event (Chapter 7). It will also avoid the use of antibiotic based selectable marker genes such as kanamycin and hygromycin resistance genes. These antibiotics are concerns for GMO regulations and often are not accepted by the consumer. MdMYB10 is a dominant cisgene, from apple itself, it is expected that there is less concern from consumers. It is indicated earlier in the Eurobarometer (2010) (http://ec.europa.eu/ research/ science-society/document_ library/pdf_06/ europeans- biotechnology -in- 2010_ en.pdf) that people are more in favour of cisgenic resistance genes to scab. Perhaps, in future, GMO regulations could be exempted for cisgenic apples, using apple genes in order to improve apple for different important traits such as disease resistance e.g. against apple scab or quality traits such as taste and metabolic composition.
8.7 Potential challenges in genetical metabolomics Genetical metabolomics is comparatively a new field for plant breeding and has been recently started. Thousands of metabolites can be found in a single cell yet it is just the beginning to explore the metabolome (Keurentjes, 2009; Fu et al., 2009). Earlier on Jansen and Nap (Jansen and Nap, 2001) reported on ‘genetical genomics’ approach in Arabidopsis by combining the genetics to the genomics information. Attempts have been made to identify the genetic factors involved in the metabolic composition for improved properties through metabolic engineering (Trethewey, 2004). As a new field it has several potential challenges: 1. it requires a sound genotypic data set, and 2. it needs sounds phenotypic data. The required software should be highly sophisticated in order to understand the genetics of complex traits such as biochemical pathways of secondary metabolites as shown in this study.
One challenge is the phenotyping. Nowadays, the genotyping is a smaller problem because of the availability of various platforms for this purpose. However, phenotyping can still be a challenge, because of several reasons such as intensive look after in case of field crops. Also it needs to be done in controlled conditions which is often a challenge such as same temperature, humidity and nutrients level to every individual plant of the population. The other problem in phenotyping is that it may need the use of specialized equipment for fast and quick data recording of the
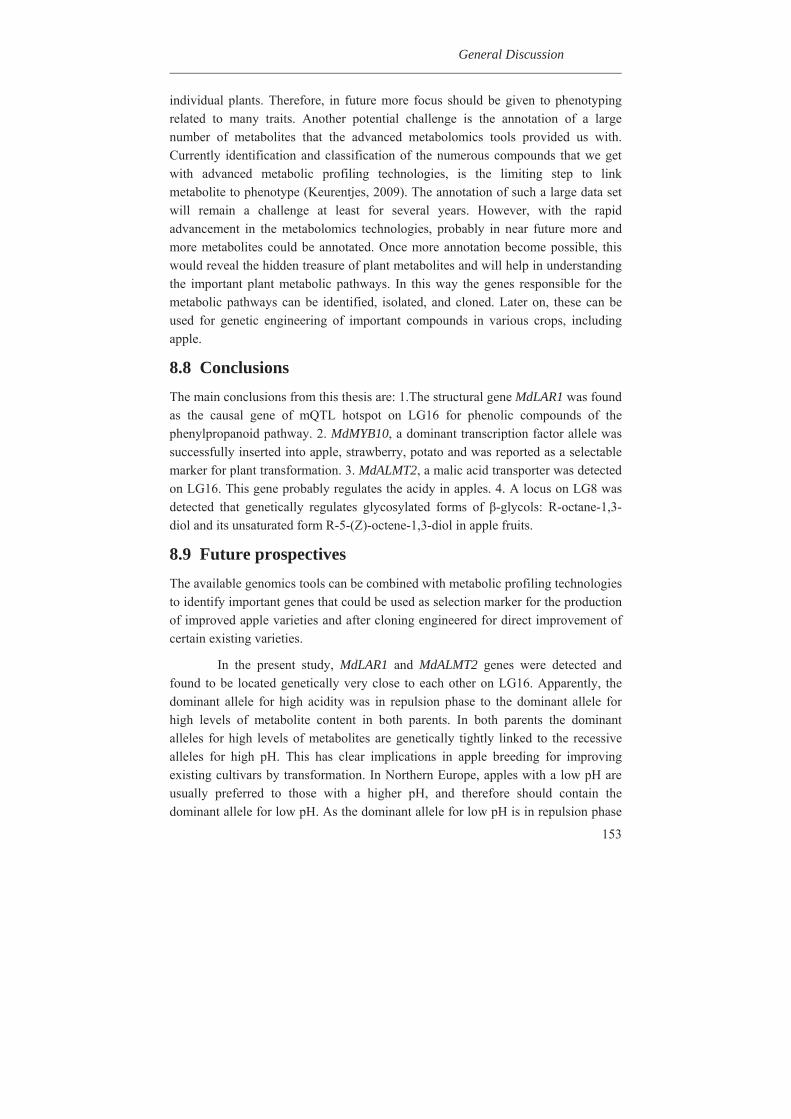
General Discussion
153
individual plants. Therefore, in future more focus should be given to phenotyping related to many traits. Another potential challenge is the annotation of a large number of metabolites that the advanced metabolomics tools provided us with. Currently identification and classification of the numerous compounds that we get with advanced metabolic profiling technologies, is the limiting step to link metabolite to phenotype (Keurentjes, 2009). The annotation of such a large data set will remain a challenge at least for several years. However, with the rapid advancement in the metabolomics technologies, probably in near future more and more metabolites could be annotated. Once more annotation become possible, this would reveal the hidden treasure of plant metabolites and will help in understanding the important plant metabolic pathways. In this way the genes responsible for the metabolic pathways can be identified, isolated, and cloned. Later on, these can be used for genetic engineering of important compounds in various crops, including apple.
8.8 Conclusions The main conclusions from this thesis are: 1.The structural gene MdLAR1 was found as the causal gene of mQTL hotspot on LG16 for phenolic compounds of the phenylpropanoid pathway. 2. MdMYB10, a dominant transcription factor allele was successfully inserted into apple, strawberry, potato and was reported as a selectable marker for plant transformation. 3. MdALMT2, a malic acid transporter was detected on LG16. This gene probably regulates the acidy in apples. 4. A locus on LG8 was detected that genetically regulates glycosylated forms of -glycols: R-octane-1,3-diol and its unsaturated form R-5-(Z)-octene-1,3-diol in apple fruits.
8.9 Future prospectives The available genomics tools can be combined with metabolic profiling technologies to identify important genes that could be used as selection marker for the production of improved apple varieties and after cloning engineered for direct improvement of certain existing varieties.
In the present study, MdLAR1 and MdALMT2 genes were detected and found to be located genetically very close to each other on LG16. Apparently, the dominant allele for high acidity was in repulsion phase to the dominant allele for high levels of metabolite content in both parents. In both parents the dominant alleles for high levels of metabolites are genetically tightly linked to the recessive alleles for high pH. This has clear implications in apple breeding for improving existing cultivars by transformation. In Northern Europe, apples with a low pH are usually preferred to those with a higher pH, and therefore should contain the dominant allele for low pH. As the dominant allele for low pH is in repulsion phase
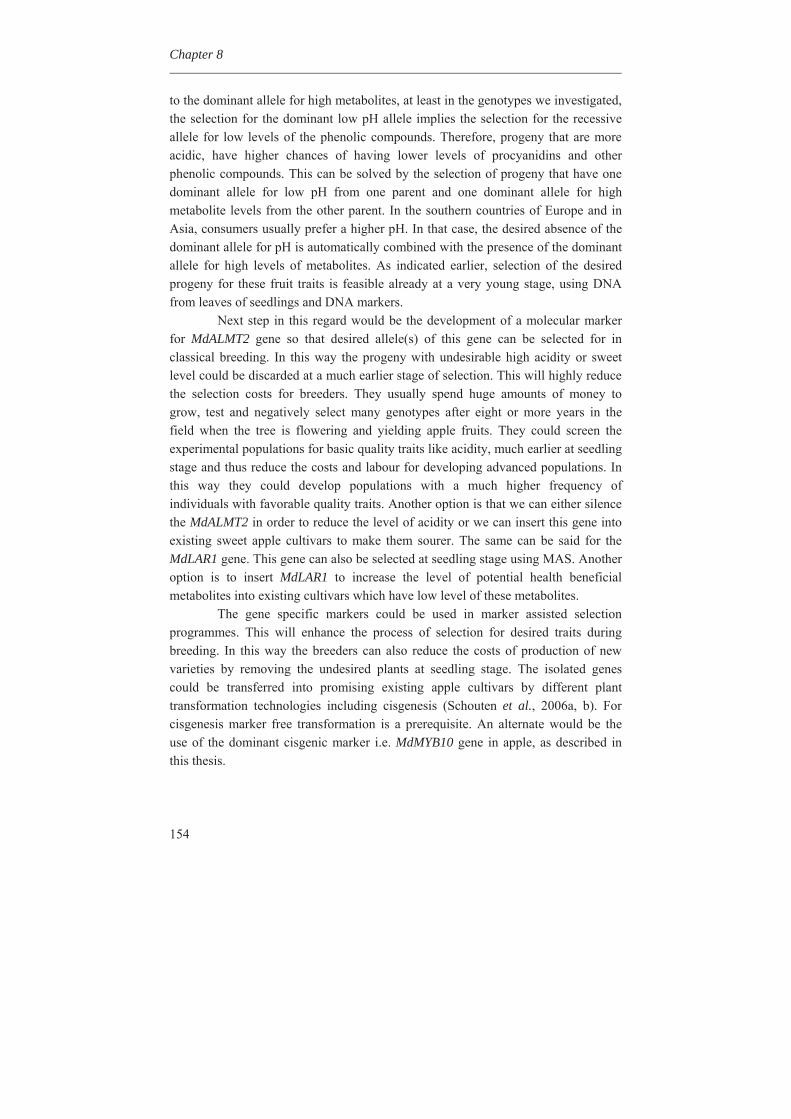
Chapter 8
154
to the dominant allele for high metabolites, at least in the genotypes we investigated, the selection for the dominant low pH allele implies the selection for the recessive allele for low levels of the phenolic compounds. Therefore, progeny that are more acidic, have higher chances of having lower levels of procyanidins and other phenolic compounds. This can be solved by the selection of progeny that have one dominant allele for low pH from one parent and one dominant allele for high metabolite levels from the other parent. In the southern countries of Europe and in Asia, consumers usually prefer a higher pH. In that case, the desired absence of the dominant allele for pH is automatically combined with the presence of the dominant allele for high levels of metabolites. As indicated earlier, selection of the desired progeny for these fruit traits is feasible already at a very young stage, using DNA from leaves of seedlings and DNA markers.
Next step in this regard would be the development of a molecular marker for MdALMT2 gene so that desired allele(s) of this gene can be selected for in classical breeding. In this way the progeny with undesirable high acidity or sweet level could be discarded at a much earlier stage of selection. This will highly reduce the selection costs for breeders. They usually spend huge amounts of money to grow, test and negatively select many genotypes after eight or more years in the field when the tree is flowering and yielding apple fruits. They could screen the experimental populations for basic quality traits like acidity, much earlier at seedling stage and thus reduce the costs and labour for developing advanced populations. In this way they could develop populations with a much higher frequency of individuals with favorable quality traits. Another option is that we can either silence the MdALMT2 in order to reduce the level of acidity or we can insert this gene into existing sweet apple cultivars to make them sourer. The same can be said for the MdLAR1 gene. This gene can also be selected at seedling stage using MAS. Another option is to insert MdLAR1 to increase the level of potential health beneficial metabolites into existing cultivars which have low level of these metabolites.
The gene specific markers could be used in marker assisted selection programmes. This will enhance the process of selection for desired traits during breeding. In this way the breeders can also reduce the costs of production of new varieties by removing the undesired plants at seedling stage. The isolated genes could be transferred into promising existing apple cultivars by different plant transformation technologies including cisgenesis (Schouten et al., 2006a, b). For cisgenesis marker free transformation is a prerequisite. An alternate would be the use of the dominant cisgenic marker i.e. MdMYB10 gene in apple, as described in this thesis.

References
156
Akbari M, Wenzl P, Caig V, Carling J, Xia L, Yang S, Uszynski G, Mohler V,
Lehmensiek A, Kuchel H, Hayden MJ, Howes N, Sharp P, Vaughan P, Rathmell B, Huttner E, Kilian A. 2006. Diversity arrays technology (DArT) for high-throughput profiling of the hexaploid wheat genome. Theor Appl Genet 113:1409-1420.
Aljanabi SN, Forget L, Dookun A. 1999. An improved and rapid protocol for the isolation of polysaccharide- and polyphenol-free sugarcane DNA. Plant Mol Biol Rep 17:1-8.
Almeida JRM, D'Amico E, Preuss A, Carbone F, de Vos CHR, Deiml B, Mourgues F, Perrotta G, Fischer TC, Bovy AG, Martens S, Rosati C. 2007. Characterization of major enzymes and genes involved in flavonoid and proanthocyanidin biosynthesis during fruit development in strawberry (Fragaria x ananassa). Archives of Biochemistry and Biophysics 465, 61-71.
Asif MH, Dhawan P, Nath P. 2000. A Simple Procedure for the Isolation of High Quality RNA from Ripening Banana Fruit. Plant Molecular Biology Reporter 18, 109-115.
Asins MJ. 2002. Present and future of quantitative trait locus analysis in plant breeding. Plant Breeding 121, 281-291.
Awad MA, De Jager A, Van Westing LM. 2000. Flavonoid and chlorogenic acid levels in apple fruit: Characterisation of variation. Scientia Horticulturae 83, 249-263.
Backes G, Hatz B, Jahoor A, Fischbeck G. 2003. RFLP diversity within and between major groups of barley in Europe. Plant Breeding 122, 291-299.
Ban Y, Honda C, Hatsuyama Y, Igarashi M, Bessho H, Moriguchi T. 2007. Isolation and functional analysis of a MYB transcription factor gene that is a key regulator for the development of red colouration in apple skin. Plant Cell Phys 48:958 -970.
Belfanti E, Silfverberg-Dilworth E, Tartarini S, Patocchi A, Barbieri M, Zhu J, Vinatzer BA, Gianfranceschi L, Gessler C, Sansavini S. 2004. The HcrVf2 gene from a wild apple confers scab resistance to a transgenic cultivated variety. Proceedings of the National Academy of Sciences of the United States of America 101, 886-890.
Beló A, Zheng P, Luck S, Shen B, Meyer DJ, Li B, Tingey S, Rafalski A. 2008. Whole genome scan detects an allelic variant of fad2 associated with increased oleic acid levels in maize. Molecular Genetics and Genomics 279, 1-10.
Bentsáth A, Rusznyák S, Szent-Györgyi A. 1936. Vitamin nature of flavones [1]. Nature 138, 798.
Berüter J. 2004. Carbohydrate metabolism in two apple genotypes that differ in malate accumulation. Journal of Plant Physiology 161, 1011-1029.
Beuerle T, Schwab W. 1999. Biosynthesis of R-(+)-octane-1,3-diol. Crucial role of -oxidation in the enantioselective generation of 1,3-diols in stored apples.
Lipids 34, 617-625. Bogs J, Downey MO, Harvey JS, Ashton AR, Tanner GJ, Robinson SP. 2005.
Proanthocyanidin synthesis and expression of genes encoding leucoanthocyanidin reductase and anthocyanidin reductase in developing grape berries and grapevine leaves. Plant Physiology 139, 652-663.
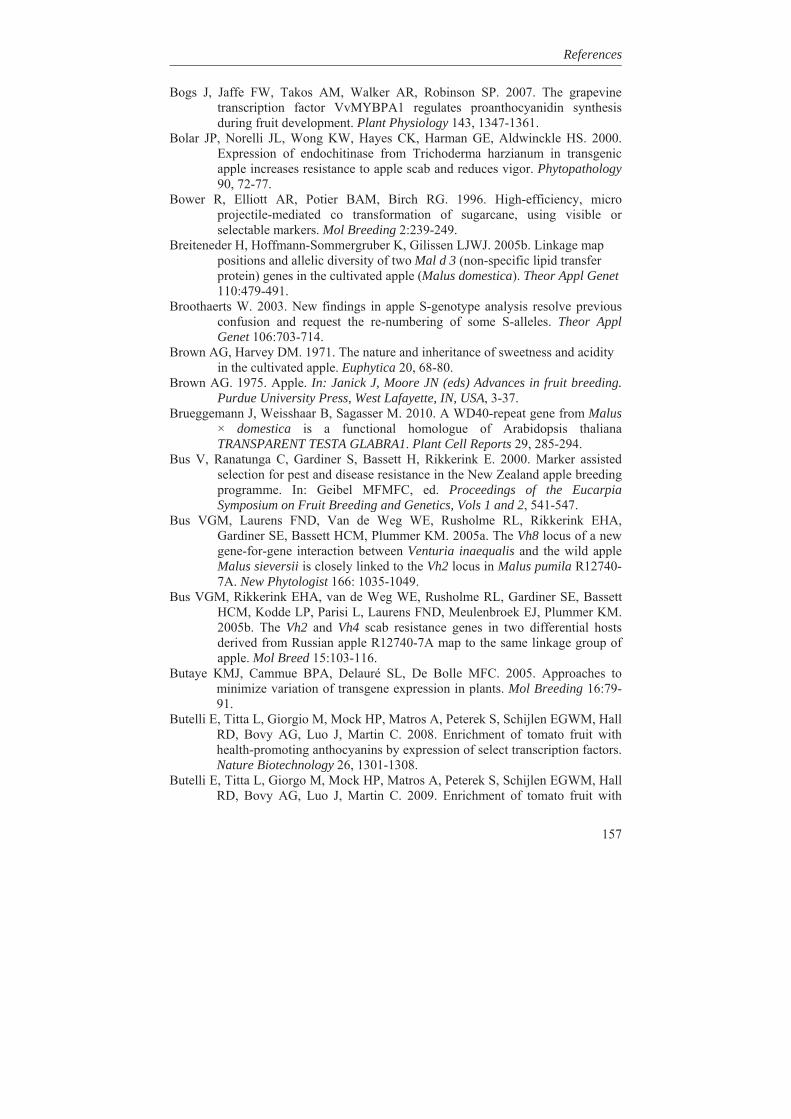
References
157
Bogs J, Jaffe FW, Takos AM, Walker AR, Robinson SP. 2007. The grapevine transcription factor VvMYBPA1 regulates proanthocyanidin synthesis during fruit development. Plant Physiology 143, 1347-1361.
Bolar JP, Norelli JL, Wong KW, Hayes CK, Harman GE, Aldwinckle HS. 2000. Expression of endochitinase from Trichoderma harzianum in transgenic apple increases resistance to apple scab and reduces vigor. Phytopathology 90, 72-77.
Bower R, Elliott AR, Potier BAM, Birch RG. 1996. High-efficiency, micro projectile-mediated co transformation of sugarcane, using visible or selectable markers. Mol Breeding 2:239-249.
Breiteneder H, Hoffmann-Sommergruber K, Gilissen LJWJ. 2005b. Linkage map positions and allelic diversity of two Mal d 3 (non-specific lipid transfer protein) genes in the cultivated apple (Malus domestica). Theor Appl Genet 110:479-491.
Broothaerts W. 2003. New findings in apple S-genotype analysis resolve previous confusion and request the re-numbering of some S-alleles. Theor Appl Genet 106:703-714.
Brown AG, Harvey DM. 1971. The nature and inheritance of sweetness and acidity in the cultivated apple. Euphytica 20, 68-80.
Brown AG. 1975. Apple. In: Janick J, Moore JN (eds) Advances in fruit breeding. Purdue University Press, West Lafayette, IN, USA, 3-37.
Brueggemann J, Weisshaar B, Sagasser M. 2010. A WD40-repeat gene from Malus × domestica is a functional homologue of Arabidopsis thaliana TRANSPARENT TESTA GLABRA1. Plant Cell Reports 29, 285-294.
Bus V, Ranatunga C, Gardiner S, Bassett H, Rikkerink E. 2000. Marker assisted selection for pest and disease resistance in the New Zealand apple breeding programme. In: Geibel MFMFC, ed. Proceedings of the Eucarpia Symposium on Fruit Breeding and Genetics, Vols 1 and 2, 541-547.
Bus VGM, Laurens FND, Van de Weg WE, Rusholme RL, Rikkerink EHA, Gardiner SE, Bassett HCM, Plummer KM. 2005a. The Vh8 locus of a new gene-for-gene interaction between Venturia inaequalis and the wild apple Malus sieversii is closely linked to the Vh2 locus in Malus pumila R12740-7A. New Phytologist 166: 1035-1049.
Bus VGM, Rikkerink EHA, van de Weg WE, Rusholme RL, Gardiner SE, Bassett HCM, Kodde LP, Parisi L, Laurens FND, Meulenbroek EJ, Plummer KM. 2005b. The Vh2 and Vh4 scab resistance genes in two differential hosts derived from Russian apple R12740-7A map to the same linkage group of apple. Mol Breed 15:103-116.
Butaye KMJ, Cammue BPA, Delauré SL, De Bolle MFC. 2005. Approaches to minimize variation of transgene expression in plants. Mol Breeding 16:79-91.
Butelli E, Titta L, Giorgio M, Mock HP, Matros A, Peterek S, Schijlen EGWM, Hall RD, Bovy AG, Luo J, Martin C. 2008. Enrichment of tomato fruit with health-promoting anthocyanins by expression of select transcription factors. Nature Biotechnology 26, 1301-1308.
Butelli E, Titta L, Giorgo M, Mock HP, Matros A, Peterek S, Schijlen EGWM, Hall RD, Bovy AG, Luo J, Martin C. 2009. Enrichment of tomato fruit with
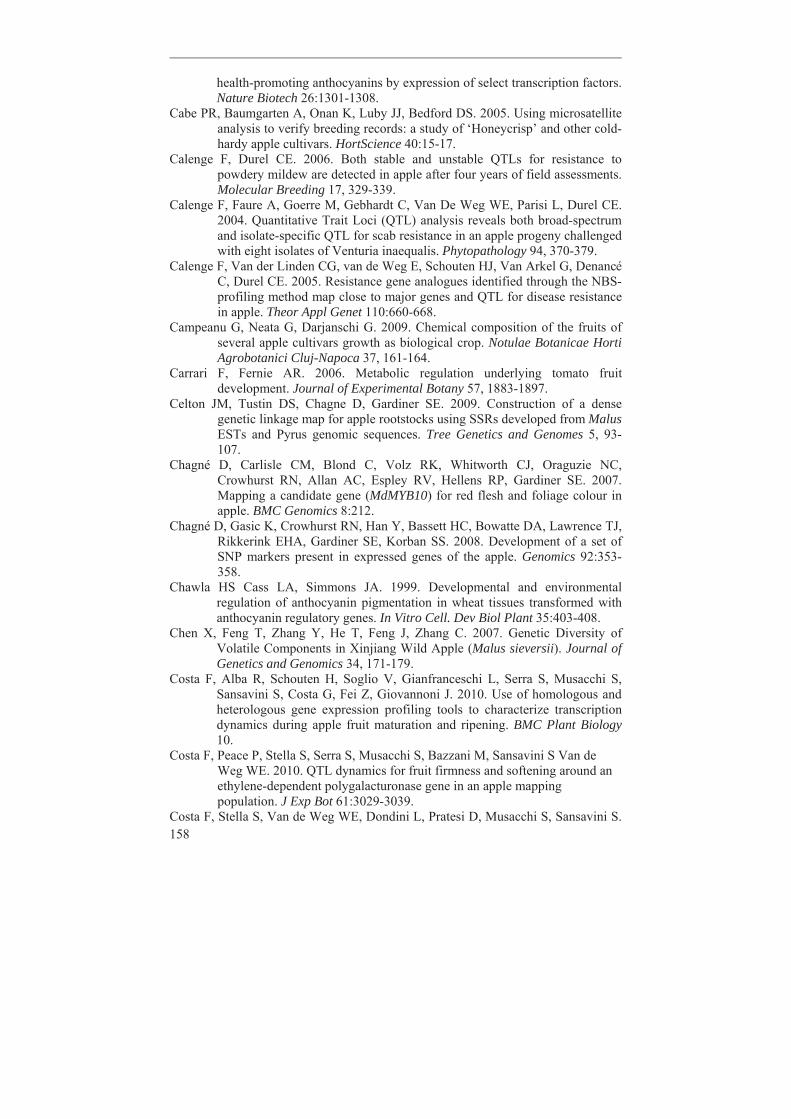
158
health-promoting anthocyanins by expression of select transcription factors. Nature Biotech 26:1301-1308.
Cabe PR, Baumgarten A, Onan K, Luby JJ, Bedford DS. 2005. Using microsatellite analysis to verify breeding records: a study of ‘Honeycrisp’ and other cold-hardy apple cultivars. HortScience 40:15-17.
Calenge F, Durel CE. 2006. Both stable and unstable QTLs for resistance to powdery mildew are detected in apple after four years of field assessments. Molecular Breeding 17, 329-339.
Calenge F, Faure A, Goerre M, Gebhardt C, Van De Weg WE, Parisi L, Durel CE. 2004. Quantitative Trait Loci (QTL) analysis reveals both broad-spectrum and isolate-specific QTL for scab resistance in an apple progeny challenged with eight isolates of Venturia inaequalis. Phytopathology 94, 370-379.
Calenge F, Van der Linden CG, van de Weg E, Schouten HJ, Van Arkel G, Denancé C, Durel CE. 2005. Resistance gene analogues identified through the NBS-profiling method map close to major genes and QTL for disease resistance in apple. Theor Appl Genet 110:660-668.
Campeanu G, Neata G, Darjanschi G. 2009. Chemical composition of the fruits of several apple cultivars growth as biological crop. Notulae Botanicae Horti Agrobotanici Cluj-Napoca 37, 161-164.
Carrari F, Fernie AR. 2006. Metabolic regulation underlying tomato fruit development. Journal of Experimental Botany 57, 1883-1897.
Celton JM, Tustin DS, Chagne D, Gardiner SE. 2009. Construction of a dense genetic linkage map for apple rootstocks using SSRs developed from Malus ESTs and Pyrus genomic sequences. Tree Genetics and Genomes 5, 93-107.
Chagné D, Carlisle CM, Blond C, Volz RK, Whitworth CJ, Oraguzie NC, Crowhurst RN, Allan AC, Espley RV, Hellens RP, Gardiner SE. 2007. Mapping a candidate gene (MdMYB10) for red flesh and foliage colour in apple. BMC Genomics 8:212.
Chagné D, Gasic K, Crowhurst RN, Han Y, Bassett HC, Bowatte DA, Lawrence TJ, Rikkerink EHA, Gardiner SE, Korban SS. 2008. Development of a set of SNP markers present in expressed genes of the apple. Genomics 92:353-358.
Chawla HS Cass LA, Simmons JA. 1999. Developmental and environmental regulation of anthocyanin pigmentation in wheat tissues transformed with anthocyanin regulatory genes. In Vitro Cell. Dev Biol Plant 35:403-408.
Chen X, Feng T, Zhang Y, He T, Feng J, Zhang C. 2007. Genetic Diversity of Volatile Components in Xinjiang Wild Apple (Malus sieversii). Journal of Genetics and Genomics 34, 171-179.
Costa F, Alba R, Schouten H, Soglio V, Gianfranceschi L, Serra S, Musacchi S, Sansavini S, Costa G, Fei Z, Giovannoni J. 2010. Use of homologous and heterologous gene expression profiling tools to characterize transcription dynamics during apple fruit maturation and ripening. BMC Plant Biology 10.
Costa F, Peace P, Stella S, Serra S, Musacchi S, Bazzani M, Sansavini S Van de Weg WE. 2010. QTL dynamics for fruit firmness and softening around an ethylene-dependent polygalacturonase gene in an apple mapping population. J Exp Bot 61:3029-3039.
Costa F, Stella S, Van de Weg WE, Dondini L, Pratesi D, Musacchi S, Sansavini S.
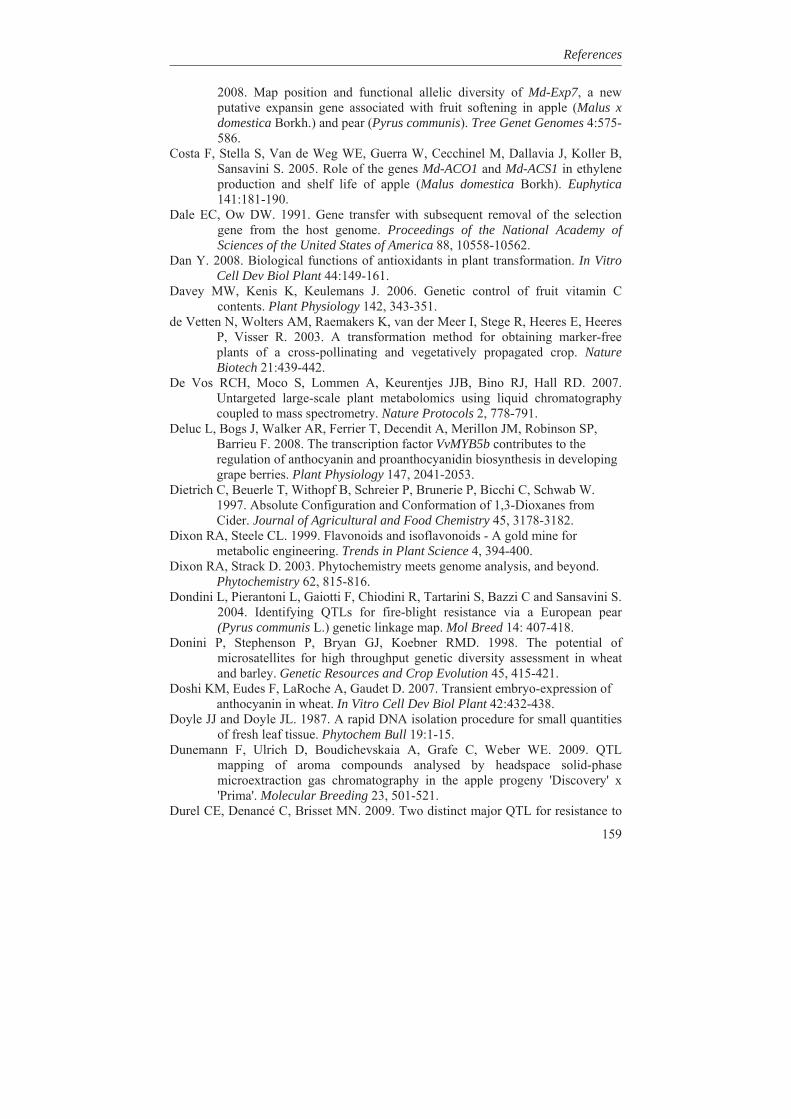
References
159
2008. Map position and functional allelic diversity of Md-Exp7, a new putative expansin gene associated with fruit softening in apple (Malus x domestica Borkh.) and pear (Pyrus communis). Tree Genet Genomes 4:575-586.
Costa F, Stella S, Van de Weg WE, Guerra W, Cecchinel M, Dallavia J, Koller B, Sansavini S. 2005. Role of the genes Md-ACO1 and Md-ACS1 in ethylene production and shelf life of apple (Malus domestica Borkh). Euphytica 141:181-190.
Dale EC, Ow DW. 1991. Gene transfer with subsequent removal of the selection gene from the host genome. Proceedings of the National Academy of Sciences of the United States of America 88, 10558-10562.
Dan Y. 2008. Biological functions of antioxidants in plant transformation. In Vitro Cell Dev Biol Plant 44:149-161.
Davey MW, Kenis K, Keulemans J. 2006. Genetic control of fruit vitamin C contents. Plant Physiology 142, 343-351.
de Vetten N, Wolters AM, Raemakers K, van der Meer I, Stege R, Heeres E, Heeres P, Visser R. 2003. A transformation method for obtaining marker-free plants of a cross-pollinating and vegetatively propagated crop. Nature Biotech 21:439-442.
De Vos RCH, Moco S, Lommen A, Keurentjes JJB, Bino RJ, Hall RD. 2007. Untargeted large-scale plant metabolomics using liquid chromatography coupled to mass spectrometry. Nature Protocols 2, 778-791.
Deluc L, Bogs J, Walker AR, Ferrier T, Decendit A, Merillon JM, Robinson SP, Barrieu F. 2008. The transcription factor VvMYB5b contributes to the regulation of anthocyanin and proanthocyanidin biosynthesis in developing grape berries. Plant Physiology 147, 2041-2053.
Dietrich C, Beuerle T, Withopf B, Schreier P, Brunerie P, Bicchi C, Schwab W. 1997. Absolute Configuration and Conformation of 1,3-Dioxanes from Cider. Journal of Agricultural and Food Chemistry 45, 3178-3182.
Dixon RA, Steele CL. 1999. Flavonoids and isoflavonoids - A gold mine for metabolic engineering. Trends in Plant Science 4, 394-400.
Dixon RA, Strack D. 2003. Phytochemistry meets genome analysis, and beyond. Phytochemistry 62, 815-816.
Dondini L, Pierantoni L, Gaiotti F, Chiodini R, Tartarini S, Bazzi C and Sansavini S. 2004. Identifying QTLs for fire-blight resistance via a European pear (Pyrus communis L.) genetic linkage map. Mol Breed 14: 407-418.
Donini P, Stephenson P, Bryan GJ, Koebner RMD. 1998. The potential of microsatellites for high throughput genetic diversity assessment in wheat and barley. Genetic Resources and Crop Evolution 45, 415-421.
Doshi KM, Eudes F, LaRoche A, Gaudet D. 2007. Transient embryo-expression of anthocyanin in wheat. In Vitro Cell Dev Biol Plant 42:432-438.
Doyle JJ and Doyle JL. 1987. A rapid DNA isolation procedure for small quantities of fresh leaf tissue. Phytochem Bull 19:1-15.
Dunemann F, Ulrich D, Boudichevskaia A, Grafe C, Weber WE. 2009. QTL mapping of aroma compounds analysed by headspace solid-phase microextraction gas chromatography in the apple progeny 'Discovery' x 'Prima'. Molecular Breeding 23, 501-521.
Durel CE, Denancé C, Brisset MN. 2009. Two distinct major QTL for resistance to
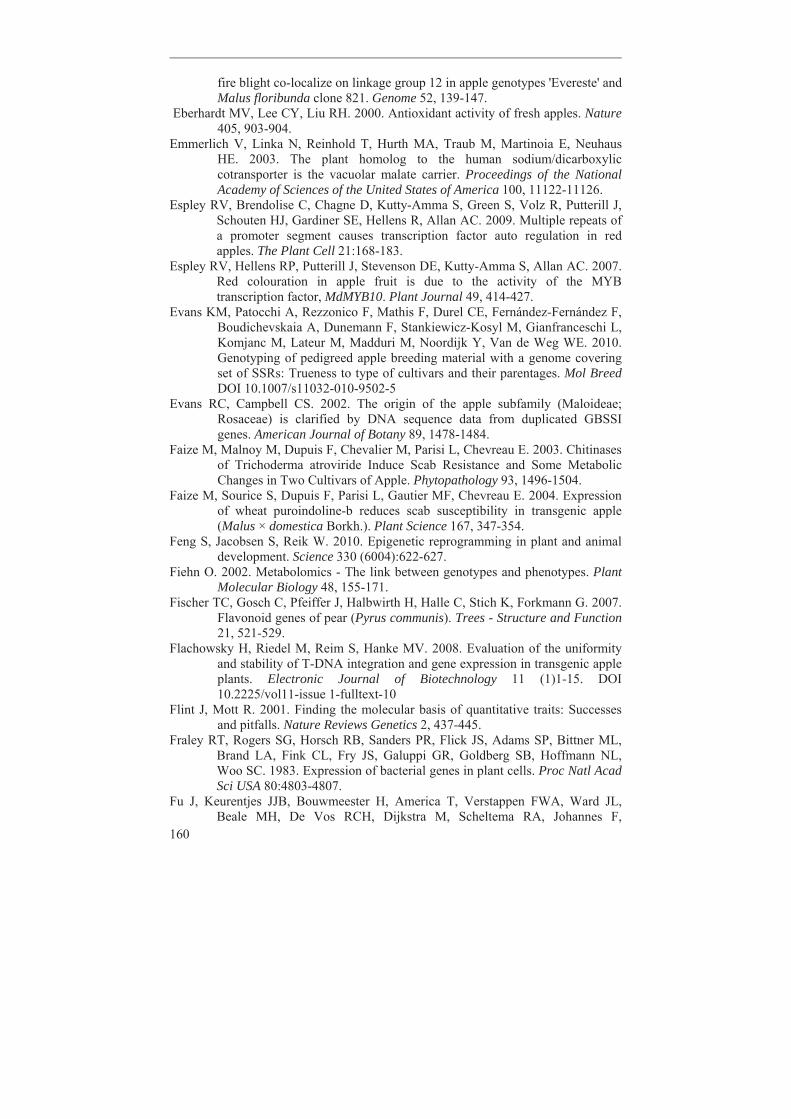
160
fire blight co-localize on linkage group 12 in apple genotypes 'Evereste' and Malus floribunda clone 821. Genome 52, 139-147.
Eberhardt MV, Lee CY, Liu RH. 2000. Antioxidant activity of fresh apples. Nature 405, 903-904.
Emmerlich V, Linka N, Reinhold T, Hurth MA, Traub M, Martinoia E, Neuhaus HE. 2003. The plant homolog to the human sodium/dicarboxylic cotransporter is the vacuolar malate carrier. Proceedings of the National Academy of Sciences of the United States of America 100, 11122-11126.
Espley RV, Brendolise C, Chagne D, Kutty-Amma S, Green S, Volz R, Putterill J, Schouten HJ, Gardiner SE, Hellens R, Allan AC. 2009. Multiple repeats of a promoter segment causes transcription factor auto regulation in red apples. The Plant Cell 21:168-183.
Espley RV, Hellens RP, Putterill J, Stevenson DE, Kutty-Amma S, Allan AC. 2007. Red colouration in apple fruit is due to the activity of the MYB transcription factor, MdMYB10. Plant Journal 49, 414-427.
Evans KM, Patocchi A, Rezzonico F, Mathis F, Durel CE, Fernández-Fernández F, Boudichevskaia A, Dunemann F, Stankiewicz-Kosyl M, Gianfranceschi L, Komjanc M, Lateur M, Madduri M, Noordijk Y, Van de Weg WE. 2010. Genotyping of pedigreed apple breeding material with a genome covering set of SSRs: Trueness to type of cultivars and their parentages. Mol Breed DOI 10.1007/s11032-010-9502-5
Evans RC, Campbell CS. 2002. The origin of the apple subfamily (Maloideae; Rosaceae) is clarified by DNA sequence data from duplicated GBSSI genes. American Journal of Botany 89, 1478-1484.
Faize M, Malnoy M, Dupuis F, Chevalier M, Parisi L, Chevreau E. 2003. Chitinases of Trichoderma atroviride Induce Scab Resistance and Some Metabolic Changes in Two Cultivars of Apple. Phytopathology 93, 1496-1504.
Faize M, Sourice S, Dupuis F, Parisi L, Gautier MF, Chevreau E. 2004. Expression of wheat puroindoline-b reduces scab susceptibility in transgenic apple (Malus × domestica Borkh.). Plant Science 167, 347-354.
Feng S, Jacobsen S, Reik W. 2010. Epigenetic reprogramming in plant and animal development. Science 330 (6004):622-627.
Fiehn O. 2002. Metabolomics - The link between genotypes and phenotypes. Plant Molecular Biology 48, 155-171.
Fischer TC, Gosch C, Pfeiffer J, Halbwirth H, Halle C, Stich K, Forkmann G. 2007. Flavonoid genes of pear (Pyrus communis). Trees - Structure and Function 21, 521-529.
Flachowsky H, Riedel M, Reim S, Hanke MV. 2008. Evaluation of the uniformity and stability of T-DNA integration and gene expression in transgenic apple plants. Electronic Journal of Biotechnology 11 (1)1-15. DOI 10.2225/vol11-issue 1-fulltext-10
Flint J, Mott R. 2001. Finding the molecular basis of quantitative traits: Successes and pitfalls. Nature Reviews Genetics 2, 437-445.
Fraley RT, Rogers SG, Horsch RB, Sanders PR, Flick JS, Adams SP, Bittner ML, Brand LA, Fink CL, Fry JS, Galuppi GR, Goldberg SB, Hoffmann NL, Woo SC. 1983. Expression of bacterial genes in plant cells. Proc Natl Acad Sci USA 80:4803-4807.
Fu J, Keurentjes JJB, Bouwmeester H, America T, Verstappen FWA, Ward JL, Beale MH, De Vos RCH, Dijkstra M, Scheltema RA, Johannes F,
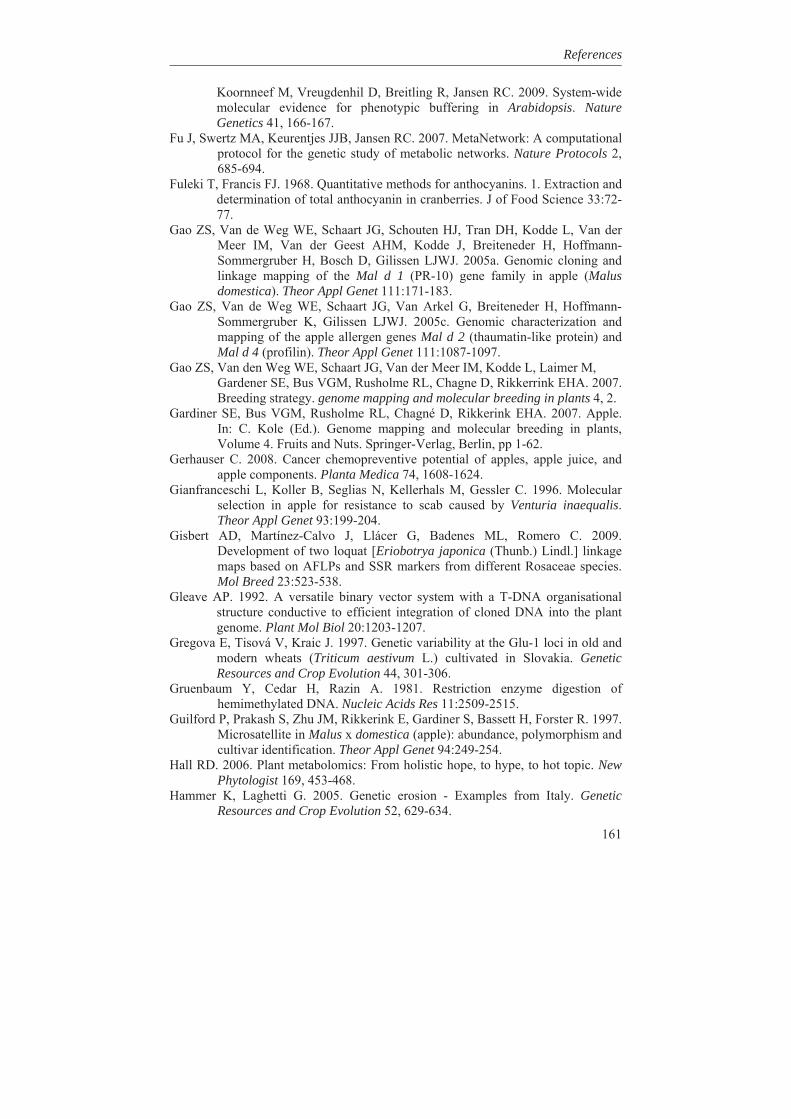
References
161
Koornneef M, Vreugdenhil D, Breitling R, Jansen RC. 2009. System-wide molecular evidence for phenotypic buffering in Arabidopsis. Nature Genetics 41, 166-167.
Fu J, Swertz MA, Keurentjes JJB, Jansen RC. 2007. MetaNetwork: A computational protocol for the genetic study of metabolic networks. Nature Protocols 2, 685-694.
Fuleki T, Francis FJ. 1968. Quantitative methods for anthocyanins. 1. Extraction and determination of total anthocyanin in cranberries. J of Food Science 33:72-77.
Gao ZS, Van de Weg WE, Schaart JG, Schouten HJ, Tran DH, Kodde L, Van der Meer IM, Van der Geest AHM, Kodde J, Breiteneder H, Hoffmann-Sommergruber H, Bosch D, Gilissen LJWJ. 2005a. Genomic cloning and linkage mapping of the Mal d 1 (PR-10) gene family in apple (Malus domestica). Theor Appl Genet 111:171-183.
Gao ZS, Van de Weg WE, Schaart JG, Van Arkel G, Breiteneder H, Hoffmann-Sommergruber K, Gilissen LJWJ. 2005c. Genomic characterization and mapping of the apple allergen genes Mal d 2 (thaumatin-like protein) and Mal d 4 (profilin). Theor Appl Genet 111:1087-1097.
Gao ZS, Van den Weg WE, Schaart JG, Van der Meer IM, Kodde L, Laimer M, Gardener SE, Bus VGM, Rusholme RL, Chagne D, Rikkerrink EHA. 2007. Breeding strategy. genome mapping and molecular breeding in plants 4, 2.
Gardiner SE, Bus VGM, Rusholme RL, Chagné D, Rikkerink EHA. 2007. Apple. In: C. Kole (Ed.). Genome mapping and molecular breeding in plants, Volume 4. Fruits and Nuts. Springer-Verlag, Berlin, pp 1-62.
Gerhauser C. 2008. Cancer chemopreventive potential of apples, apple juice, and apple components. Planta Medica 74, 1608-1624.
Gianfranceschi L, Koller B, Seglias N, Kellerhals M, Gessler C. 1996. Molecular selection in apple for resistance to scab caused by Venturia inaequalis. Theor Appl Genet 93:199-204.
Gisbert AD, Martínez-Calvo J, Llácer G, Badenes ML, Romero C. 2009. Development of two loquat [Eriobotrya japonica (Thunb.) Lindl.] linkage maps based on AFLPs and SSR markers from different Rosaceae species. Mol Breed 23:523-538.
Gleave AP. 1992. A versatile binary vector system with a T-DNA organisational structure conductive to efficient integration of cloned DNA into the plant genome. Plant Mol Biol 20:1203-1207.
Gregova E, Tisová V, Kraic J. 1997. Genetic variability at the Glu-1 loci in old and modern wheats (Triticum aestivum L.) cultivated in Slovakia. Genetic Resources and Crop Evolution 44, 301-306.
Gruenbaum Y, Cedar H, Razin A. 1981. Restriction enzyme digestion of hemimethylated DNA. Nucleic Acids Res 11:2509-2515.
Guilford P, Prakash S, Zhu JM, Rikkerink E, Gardiner S, Bassett H, Forster R. 1997. Microsatellite in Malus x domestica (apple): abundance, polymorphism and cultivar identification. Theor Appl Genet 94:249-254.
Hall RD. 2006. Plant metabolomics: From holistic hope, to hype, to hot topic. New Phytologist 169, 453-468.
Hammer K, Laghetti G. 2005. Genetic erosion - Examples from Italy. Genetic Resources and Crop Evolution 52, 629-634.
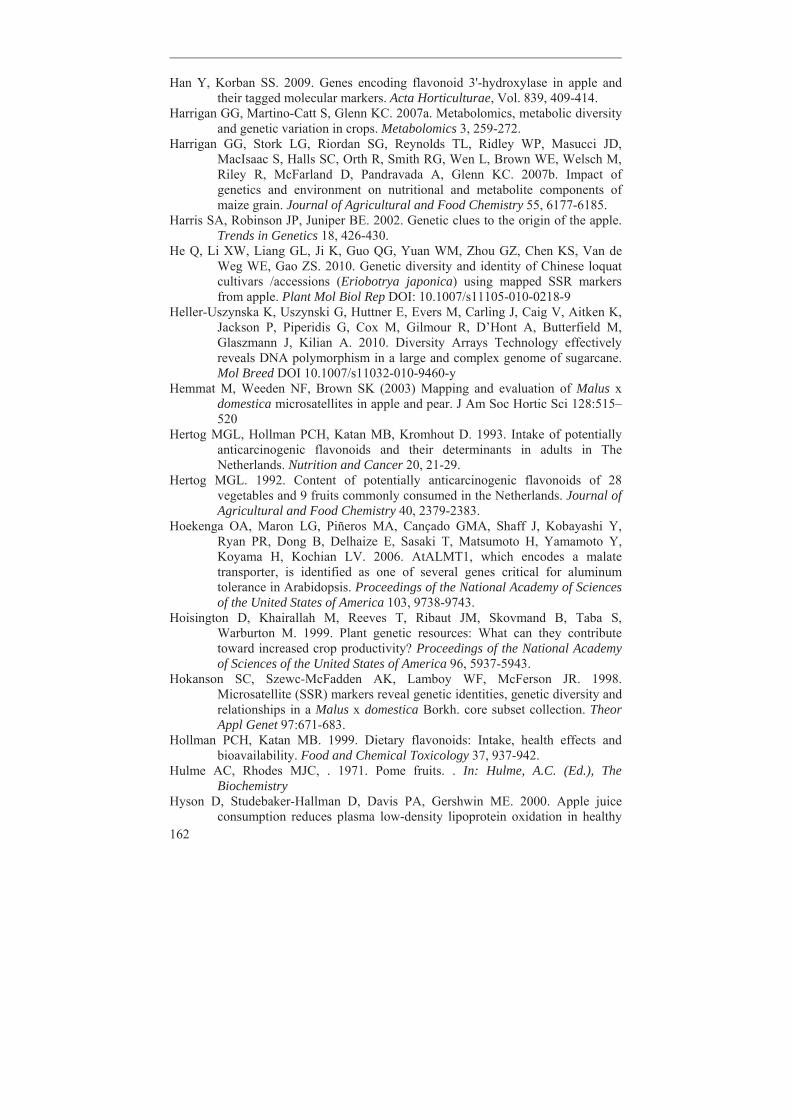
162
Han Y, Korban SS. 2009. Genes encoding flavonoid 3'-hydroxylase in apple and their tagged molecular markers. Acta Horticulturae, Vol. 839, 409-414.
Harrigan GG, Martino-Catt S, Glenn KC. 2007a. Metabolomics, metabolic diversity and genetic variation in crops. Metabolomics 3, 259-272.
Harrigan GG, Stork LG, Riordan SG, Reynolds TL, Ridley WP, Masucci JD, MacIsaac S, Halls SC, Orth R, Smith RG, Wen L, Brown WE, Welsch M, Riley R, McFarland D, Pandravada A, Glenn KC. 2007b. Impact of genetics and environment on nutritional and metabolite components of maize grain. Journal of Agricultural and Food Chemistry 55, 6177-6185.
Harris SA, Robinson JP, Juniper BE. 2002. Genetic clues to the origin of the apple. Trends in Genetics 18, 426-430.
He Q, Li XW, Liang GL, Ji K, Guo QG, Yuan WM, Zhou GZ, Chen KS, Van de Weg WE, Gao ZS. 2010. Genetic diversity and identity of Chinese loquat cultivars /accessions (Eriobotrya japonica) using mapped SSR markers from apple. Plant Mol Biol Rep DOI: 10.1007/s11105-010-0218-9
Heller-Uszynska K, Uszynski G, Huttner E, Evers M, Carling J, Caig V, Aitken K, Jackson P, Piperidis G, Cox M, Gilmour R, D’Hont A, Butterfield M, Glaszmann J, Kilian A. 2010. Diversity Arrays Technology effectively reveals DNA polymorphism in a large and complex genome of sugarcane. Mol Breed DOI 10.1007/s11032-010-9460-y
Hemmat M, Weeden NF, Brown SK (2003) Mapping and evaluation of Malus x domestica microsatellites in apple and pear. J Am Soc Hortic Sci 128:515–520
Hertog MGL, Hollman PCH, Katan MB, Kromhout D. 1993. Intake of potentially anticarcinogenic flavonoids and their determinants in adults in The Netherlands. Nutrition and Cancer 20, 21-29.
Hertog MGL. 1992. Content of potentially anticarcinogenic flavonoids of 28 vegetables and 9 fruits commonly consumed in the Netherlands. Journal of Agricultural and Food Chemistry 40, 2379-2383.
Hoekenga OA, Maron LG, Piñeros MA, Cançado GMA, Shaff J, Kobayashi Y, Ryan PR, Dong B, Delhaize E, Sasaki T, Matsumoto H, Yamamoto Y, Koyama H, Kochian LV. 2006. AtALMT1, which encodes a malate transporter, is identified as one of several genes critical for aluminum tolerance in Arabidopsis. Proceedings of the National Academy of Sciences of the United States of America 103, 9738-9743.
Hoisington D, Khairallah M, Reeves T, Ribaut JM, Skovmand B, Taba S, Warburton M. 1999. Plant genetic resources: What can they contribute toward increased crop productivity? Proceedings of the National Academy of Sciences of the United States of America 96, 5937-5943.
Hokanson SC, Szewc-McFadden AK, Lamboy WF, McFerson JR. 1998. Microsatellite (SSR) markers reveal genetic identities, genetic diversity and relationships in a Malus x domestica Borkh. core subset collection. Theor Appl Genet 97:671-683.
Hollman PCH, Katan MB. 1999. Dietary flavonoids: Intake, health effects and bioavailability. Food and Chemical Toxicology 37, 937-942.
Hulme AC, Rhodes MJC, . 1971. Pome fruits. . In: Hulme, A.C. (Ed.), The Biochemistry
Hyson D, Studebaker-Hallman D, Davis PA, Gershwin ME. 2000. Apple juice consumption reduces plasma low-density lipoprotein oxidation in healthy
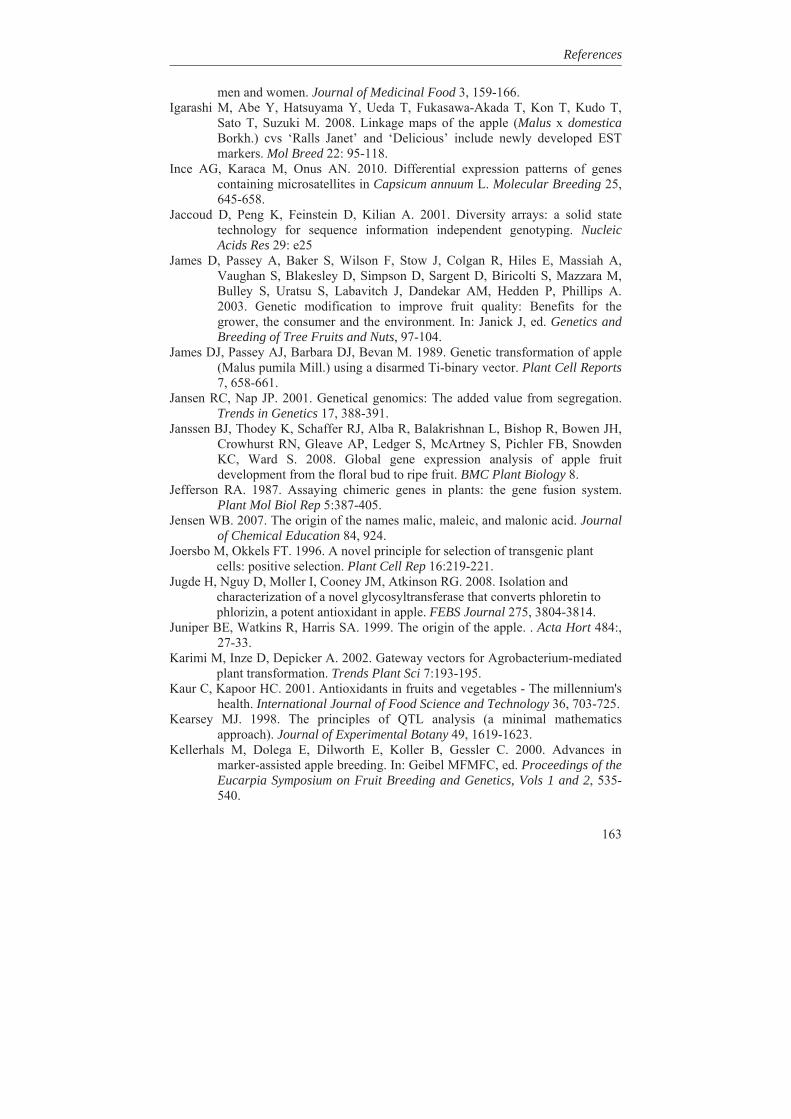
References
163
men and women. Journal of Medicinal Food 3, 159-166. Igarashi M, Abe Y, Hatsuyama Y, Ueda T, Fukasawa-Akada T, Kon T, Kudo T,
Sato T, Suzuki M. 2008. Linkage maps of the apple (Malus x domestica Borkh.) cvs ‘Ralls Janet’ and ‘Delicious’ include newly developed EST markers. Mol Breed 22: 95-118.
Ince AG, Karaca M, Onus AN. 2010. Differential expression patterns of genes containing microsatellites in Capsicum annuum L. Molecular Breeding 25, 645-658.
Jaccoud D, Peng K, Feinstein D, Kilian A. 2001. Diversity arrays: a solid state technology for sequence information independent genotyping. Nucleic Acids Res 29: e25
James D, Passey A, Baker S, Wilson F, Stow J, Colgan R, Hiles E, Massiah A, Vaughan S, Blakesley D, Simpson D, Sargent D, Biricolti S, Mazzara M, Bulley S, Uratsu S, Labavitch J, Dandekar AM, Hedden P, Phillips A. 2003. Genetic modification to improve fruit quality: Benefits for the grower, the consumer and the environment. In: Janick J, ed. Genetics and Breeding of Tree Fruits and Nuts, 97-104.
James DJ, Passey AJ, Barbara DJ, Bevan M. 1989. Genetic transformation of apple (Malus pumila Mill.) using a disarmed Ti-binary vector. Plant Cell Reports 7, 658-661.
Jansen RC, Nap JP. 2001. Genetical genomics: The added value from segregation. Trends in Genetics 17, 388-391.
Janssen BJ, Thodey K, Schaffer RJ, Alba R, Balakrishnan L, Bishop R, Bowen JH, Crowhurst RN, Gleave AP, Ledger S, McArtney S, Pichler FB, Snowden KC, Ward S. 2008. Global gene expression analysis of apple fruit development from the floral bud to ripe fruit. BMC Plant Biology 8.
Jefferson RA. 1987. Assaying chimeric genes in plants: the gene fusion system. Plant Mol Biol Rep 5:387-405.
Jensen WB. 2007. The origin of the names malic, maleic, and malonic acid. Journal of Chemical Education 84, 924.
Joersbo M, Okkels FT. 1996. A novel principle for selection of transgenic plant cells: positive selection. Plant Cell Rep 16:219-221.
Jugde H, Nguy D, Moller I, Cooney JM, Atkinson RG. 2008. Isolation and characterization of a novel glycosyltransferase that converts phloretin to phlorizin, a potent antioxidant in apple. FEBS Journal 275, 3804-3814.
Juniper BE, Watkins R, Harris SA. 1999. The origin of the apple. . Acta Hort 484:, 27-33.
Karimi M, Inze D, Depicker A. 2002. Gateway vectors for Agrobacterium-mediated plant transformation. Trends Plant Sci 7:193-195.
Kaur C, Kapoor HC. 2001. Antioxidants in fruits and vegetables - The millennium's health. International Journal of Food Science and Technology 36, 703-725.
Kearsey MJ. 1998. The principles of QTL analysis (a minimal mathematics approach). Journal of Experimental Botany 49, 1619-1623.
Kellerhals M, Dolega E, Dilworth E, Koller B, Gessler C. 2000. Advances in marker-assisted apple breeding. In: Geibel MFMFC, ed. Proceedings of the Eucarpia Symposium on Fruit Breeding and Genetics, Vols 1 and 2, 535-540.
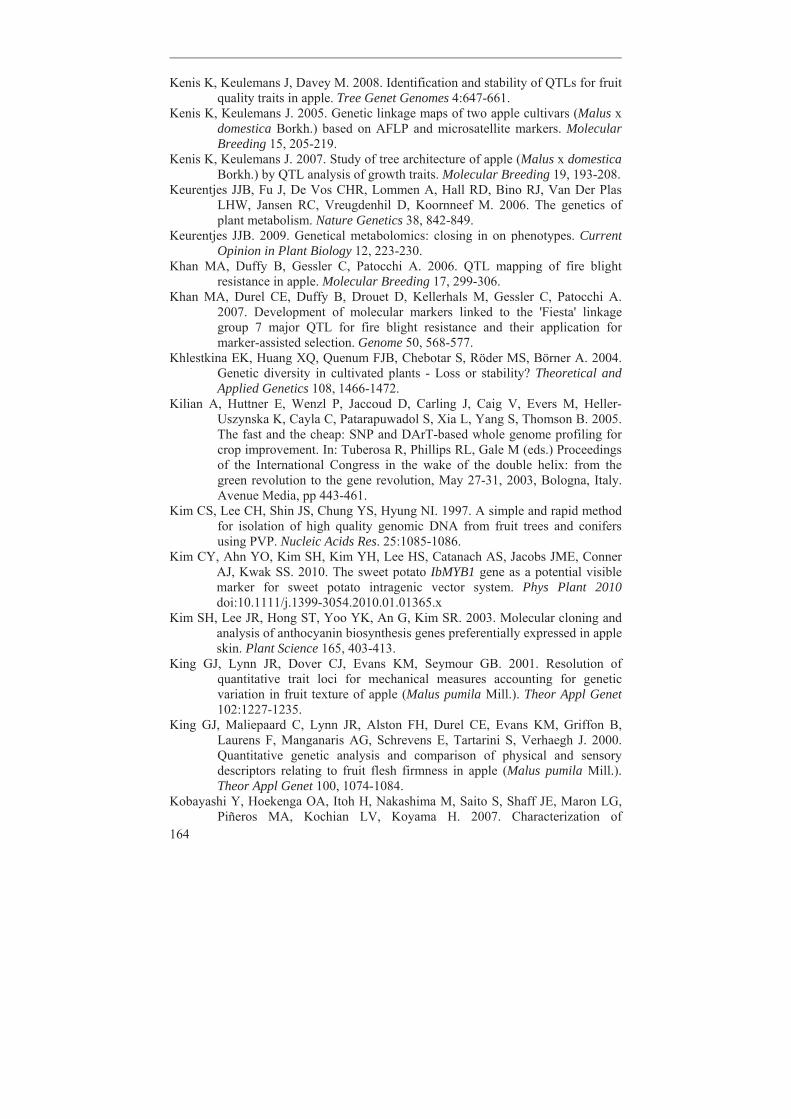
164
Kenis K, Keulemans J, Davey M. 2008. Identification and stability of QTLs for fruit quality traits in apple. Tree Genet Genomes 4:647-661.
Kenis K, Keulemans J. 2005. Genetic linkage maps of two apple cultivars (Malus x domestica Borkh.) based on AFLP and microsatellite markers. Molecular Breeding 15, 205-219.
Kenis K, Keulemans J. 2007. Study of tree architecture of apple (Malus x domestica Borkh.) by QTL analysis of growth traits. Molecular Breeding 19, 193-208.
Keurentjes JJB, Fu J, De Vos CHR, Lommen A, Hall RD, Bino RJ, Van Der Plas LHW, Jansen RC, Vreugdenhil D, Koornneef M. 2006. The genetics of plant metabolism. Nature Genetics 38, 842-849.
Keurentjes JJB. 2009. Genetical metabolomics: closing in on phenotypes. Current Opinion in Plant Biology 12, 223-230.
Khan MA, Duffy B, Gessler C, Patocchi A. 2006. QTL mapping of fire blight resistance in apple. Molecular Breeding 17, 299-306.
Khan MA, Durel CE, Duffy B, Drouet D, Kellerhals M, Gessler C, Patocchi A. 2007. Development of molecular markers linked to the 'Fiesta' linkage group 7 major QTL for fire blight resistance and their application for marker-assisted selection. Genome 50, 568-577.
Khlestkina EK, Huang XQ, Quenum FJB, Chebotar S, Röder MS, Börner A. 2004. Genetic diversity in cultivated plants - Loss or stability? Theoretical and Applied Genetics 108, 1466-1472.
Kilian A, Huttner E, Wenzl P, Jaccoud D, Carling J, Caig V, Evers M, Heller-Uszynska K, Cayla C, Patarapuwadol S, Xia L, Yang S, Thomson B. 2005. The fast and the cheap: SNP and DArT-based whole genome profiling for crop improvement. In: Tuberosa R, Phillips RL, Gale M (eds.) Proceedings of the International Congress in the wake of the double helix: from the green revolution to the gene revolution, May 27-31, 2003, Bologna, Italy. Avenue Media, pp 443-461.
Kim CS, Lee CH, Shin JS, Chung YS, Hyung NI. 1997. A simple and rapid method for isolation of high quality genomic DNA from fruit trees and conifers using PVP. Nucleic Acids Res. 25:1085-1086.
Kim CY, Ahn YO, Kim SH, Kim YH, Lee HS, Catanach AS, Jacobs JME, Conner AJ, Kwak SS. 2010. The sweet potato IbMYB1 gene as a potential visible marker for sweet potato intragenic vector system. Phys Plant 2010 doi:10.1111/j.1399-3054.2010.01.01365.x
Kim SH, Lee JR, Hong ST, Yoo YK, An G, Kim SR. 2003. Molecular cloning and analysis of anthocyanin biosynthesis genes preferentially expressed in apple skin. Plant Science 165, 403-413.
King GJ, Lynn JR, Dover CJ, Evans KM, Seymour GB. 2001. Resolution of quantitative trait loci for mechanical measures accounting for genetic variation in fruit texture of apple (Malus pumila Mill.). Theor Appl Genet 102:1227-1235.
King GJ, Maliepaard C, Lynn JR, Alston FH, Durel CE, Evans KM, Griffon B, Laurens F, Manganaris AG, Schrevens E, Tartarini S, Verhaegh J. 2000. Quantitative genetic analysis and comparison of physical and sensory descriptors relating to fruit flesh firmness in apple (Malus pumila Mill.). Theor Appl Genet 100, 1074-1084.
Kobayashi Y, Hoekenga OA, Itoh H, Nakashima M, Saito S, Shaff JE, Maron LG, Piñeros MA, Kochian LV, Koyama H. 2007. Characterization of
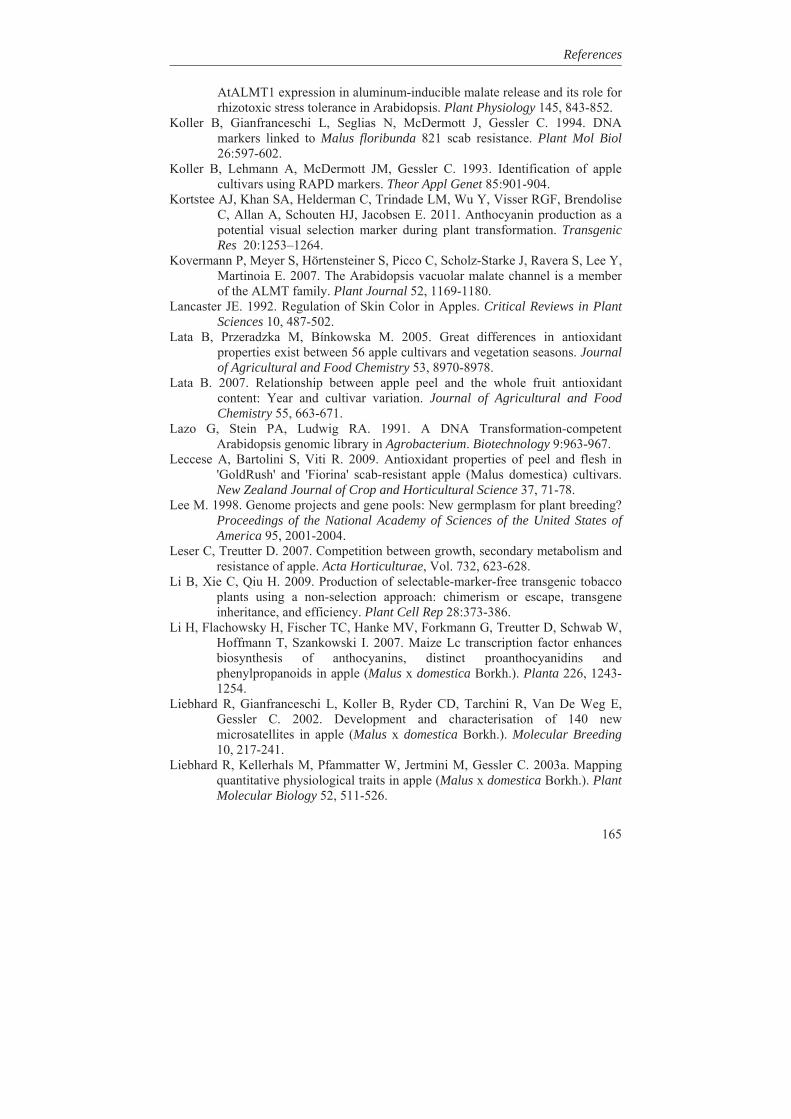
References
165
AtALMT1 expression in aluminum-inducible malate release and its role for rhizotoxic stress tolerance in Arabidopsis. Plant Physiology 145, 843-852.
Koller B, Gianfranceschi L, Seglias N, McDermott J, Gessler C. 1994. DNA markers linked to Malus floribunda 821 scab resistance. Plant Mol Biol 26:597-602.
Koller B, Lehmann A, McDermott JM, Gessler C. 1993. Identification of apple cultivars using RAPD markers. Theor Appl Genet 85:901-904.
Kortstee AJ, Khan SA, Helderman C, Trindade LM, Wu Y, Visser RGF, Brendolise C, Allan A, Schouten HJ, Jacobsen E. 2011. Anthocyanin production as a potential visual selection marker during plant transformation. Transgenic Res 20:1253–1264.
Kovermann P, Meyer S, Hörtensteiner S, Picco C, Scholz-Starke J, Ravera S, Lee Y, Martinoia E. 2007. The Arabidopsis vacuolar malate channel is a member of the ALMT family. Plant Journal 52, 1169-1180.
Lancaster JE. 1992. Regulation of Skin Color in Apples. Critical Reviews in Plant Sciences 10, 487-502.
Lata B, Przeradzka M, Bínkowska M. 2005. Great differences in antioxidant properties exist between 56 apple cultivars and vegetation seasons. Journal of Agricultural and Food Chemistry 53, 8970-8978.
Lata B. 2007. Relationship between apple peel and the whole fruit antioxidant content: Year and cultivar variation. Journal of Agricultural and Food Chemistry 55, 663-671.
Lazo G, Stein PA, Ludwig RA. 1991. A DNA Transformation-competent Arabidopsis genomic library in Agrobacterium. Biotechnology 9:963-967.
Leccese A, Bartolini S, Viti R. 2009. Antioxidant properties of peel and flesh in 'GoldRush' and 'Fiorina' scab-resistant apple (Malus domestica) cultivars. New Zealand Journal of Crop and Horticultural Science 37, 71-78.
Lee M. 1998. Genome projects and gene pools: New germplasm for plant breeding? Proceedings of the National Academy of Sciences of the United States of America 95, 2001-2004.
Leser C, Treutter D. 2007. Competition between growth, secondary metabolism and resistance of apple. Acta Horticulturae, Vol. 732, 623-628.
Li B, Xie C, Qiu H. 2009. Production of selectable-marker-free transgenic tobacco plants using a non-selection approach: chimerism or escape, transgene inheritance, and efficiency. Plant Cell Rep 28:373-386.
Li H, Flachowsky H, Fischer TC, Hanke MV, Forkmann G, Treutter D, Schwab W, Hoffmann T, Szankowski I. 2007. Maize Lc transcription factor enhances biosynthesis of anthocyanins, distinct proanthocyanidins and phenylpropanoids in apple (Malus x domestica Borkh.). Planta 226, 1243-1254.
Liebhard R, Gianfranceschi L, Koller B, Ryder CD, Tarchini R, Van De Weg E, Gessler C. 2002. Development and characterisation of 140 new microsatellites in apple (Malus x domestica Borkh.). Molecular Breeding 10, 217-241.
Liebhard R, Kellerhals M, Pfammatter W, Jertmini M, Gessler C. 2003a. Mapping quantitative physiological traits in apple (Malus x domestica Borkh.). Plant Molecular Biology 52, 511-526.
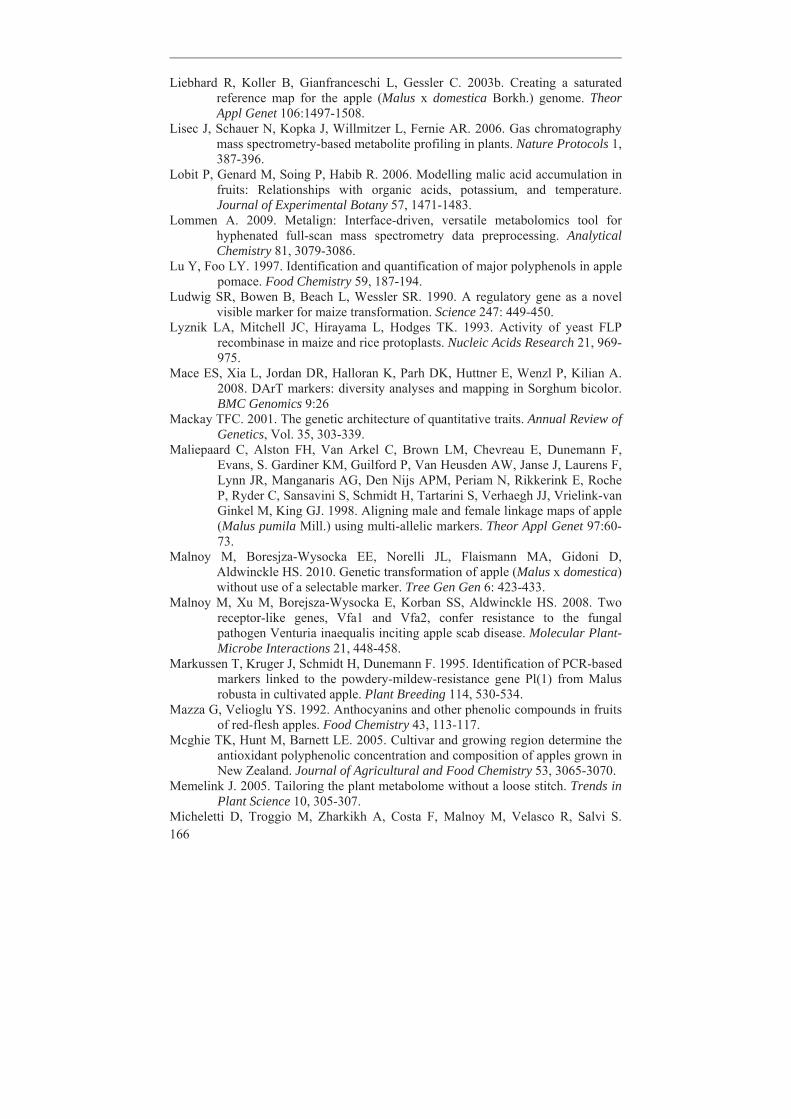
166
Liebhard R, Koller B, Gianfranceschi L, Gessler C. 2003b. Creating a saturated reference map for the apple (Malus x domestica Borkh.) genome. Theor Appl Genet 106:1497-1508.
Lisec J, Schauer N, Kopka J, Willmitzer L, Fernie AR. 2006. Gas chromatography mass spectrometry-based metabolite profiling in plants. Nature Protocols 1, 387-396.
Lobit P, Genard M, Soing P, Habib R. 2006. Modelling malic acid accumulation in fruits: Relationships with organic acids, potassium, and temperature. Journal of Experimental Botany 57, 1471-1483.
Lommen A. 2009. Metalign: Interface-driven, versatile metabolomics tool for hyphenated full-scan mass spectrometry data preprocessing. Analytical Chemistry 81, 3079-3086.
Lu Y, Foo LY. 1997. Identification and quantification of major polyphenols in apple pomace. Food Chemistry 59, 187-194.
Ludwig SR, Bowen B, Beach L, Wessler SR. 1990. A regulatory gene as a novel visible marker for maize transformation. Science 247: 449-450.
Lyznik LA, Mitchell JC, Hirayama L, Hodges TK. 1993. Activity of yeast FLP recombinase in maize and rice protoplasts. Nucleic Acids Research 21, 969-975.
Mace ES, Xia L, Jordan DR, Halloran K, Parh DK, Huttner E, Wenzl P, Kilian A. 2008. DArT markers: diversity analyses and mapping in Sorghum bicolor. BMC Genomics 9:26
Mackay TFC. 2001. The genetic architecture of quantitative traits. Annual Review of Genetics, Vol. 35, 303-339.
Maliepaard C, Alston FH, Van Arkel C, Brown LM, Chevreau E, Dunemann F, Evans, S. Gardiner KM, Guilford P, Van Heusden AW, Janse J, Laurens F, Lynn JR, Manganaris AG, Den Nijs APM, Periam N, Rikkerink E, Roche P, Ryder C, Sansavini S, Schmidt H, Tartarini S, Verhaegh JJ, Vrielink-van Ginkel M, King GJ. 1998. Aligning male and female linkage maps of apple (Malus pumila Mill.) using multi-allelic markers. Theor Appl Genet 97:60-73.
Malnoy M, Boresjza-Wysocka EE, Norelli JL, Flaismann MA, Gidoni D, Aldwinckle HS. 2010. Genetic transformation of apple (Malus x domestica) without use of a selectable marker. Tree Gen Gen 6: 423-433.
Malnoy M, Xu M, Borejsza-Wysocka E, Korban SS, Aldwinckle HS. 2008. Two receptor-like genes, Vfa1 and Vfa2, confer resistance to the fungal pathogen Venturia inaequalis inciting apple scab disease. Molecular Plant-Microbe Interactions 21, 448-458.
Markussen T, Kruger J, Schmidt H, Dunemann F. 1995. Identification of PCR-based markers linked to the powdery-mildew-resistance gene Pl(1) from Malus robusta in cultivated apple. Plant Breeding 114, 530-534.
Mazza G, Velioglu YS. 1992. Anthocyanins and other phenolic compounds in fruits of red-flesh apples. Food Chemistry 43, 113-117.
Mcghie TK, Hunt M, Barnett LE. 2005. Cultivar and growing region determine the antioxidant polyphenolic concentration and composition of apples grown in New Zealand. Journal of Agricultural and Food Chemistry 53, 3065-3070.
Memelink J. 2005. Tailoring the plant metabolome without a loose stitch. Trends in Plant Science 10, 305-307.
Micheletti D, Troggio M, Zharkikh A, Costa F, Malnoy M, Velasco R, Salvi S.
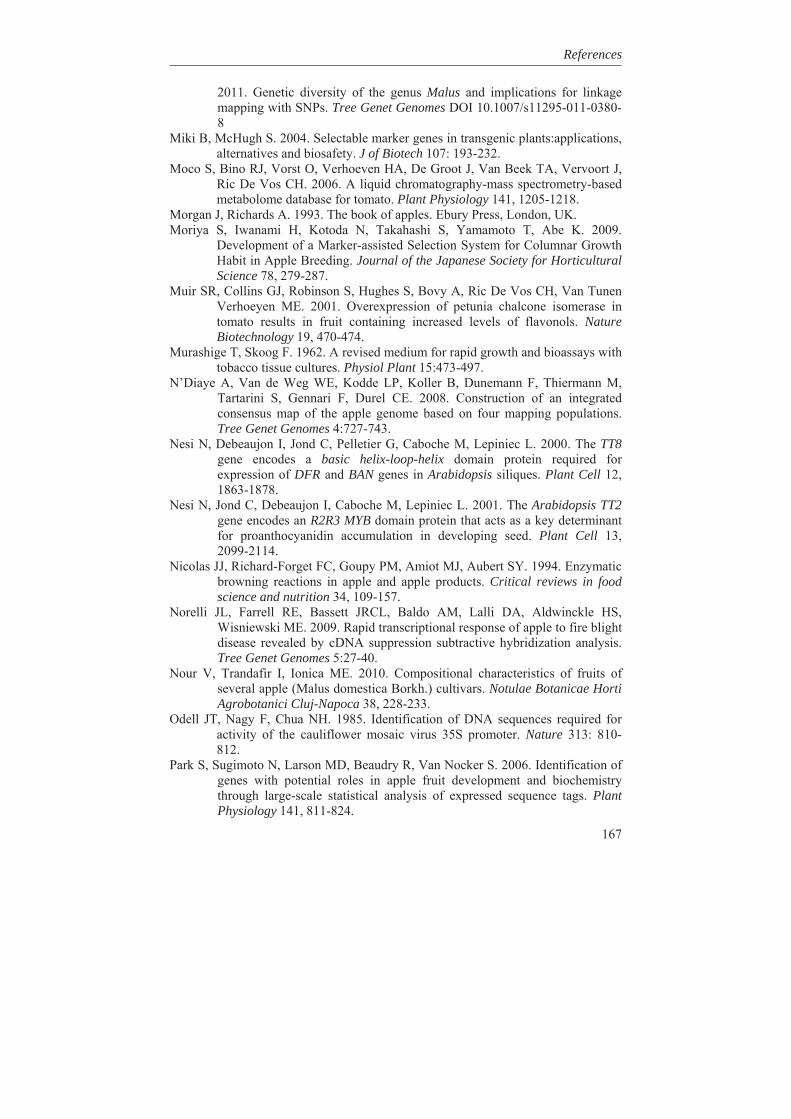
References
167
2011. Genetic diversity of the genus Malus and implications for linkage mapping with SNPs. Tree Genet Genomes DOI 10.1007/s11295-011-0380-8
Miki B, McHugh S. 2004. Selectable marker genes in transgenic plants:applications, alternatives and biosafety. J of Biotech 107: 193-232.
Moco S, Bino RJ, Vorst O, Verhoeven HA, De Groot J, Van Beek TA, Vervoort J, Ric De Vos CH. 2006. A liquid chromatography-mass spectrometry-based metabolome database for tomato. Plant Physiology 141, 1205-1218.
Morgan J, Richards A. 1993. The book of apples. Ebury Press, London, UK. Moriya S, Iwanami H, Kotoda N, Takahashi S, Yamamoto T, Abe K. 2009.
Development of a Marker-assisted Selection System for Columnar Growth Habit in Apple Breeding. Journal of the Japanese Society for Horticultural Science 78, 279-287.
Muir SR, Collins GJ, Robinson S, Hughes S, Bovy A, Ric De Vos CH, Van Tunen Verhoeyen ME. 2001. Overexpression of petunia chalcone isomerase in tomato results in fruit containing increased levels of flavonols. Nature Biotechnology 19, 470-474.
Murashige T, Skoog F. 1962. A revised medium for rapid growth and bioassays with tobacco tissue cultures. Physiol Plant 15:473-497.
N’Diaye A, Van de Weg WE, Kodde LP, Koller B, Dunemann F, Thiermann M, Tartarini S, Gennari F, Durel CE. 2008. Construction of an integrated consensus map of the apple genome based on four mapping populations. Tree Genet Genomes 4:727-743.
Nesi N, Debeaujon I, Jond C, Pelletier G, Caboche M, Lepiniec L. 2000. The TT8 gene encodes a basic helix-loop-helix domain protein required for expression of DFR and BAN genes in Arabidopsis siliques. Plant Cell 12, 1863-1878.
Nesi N, Jond C, Debeaujon I, Caboche M, Lepiniec L. 2001. The Arabidopsis TT2 gene encodes an R2R3 MYB domain protein that acts as a key determinant for proanthocyanidin accumulation in developing seed. Plant Cell 13, 2099-2114.
Nicolas JJ, Richard-Forget FC, Goupy PM, Amiot MJ, Aubert SY. 1994. Enzymatic browning reactions in apple and apple products. Critical reviews in food science and nutrition 34, 109-157.
Norelli JL, Farrell RE, Bassett JRCL, Baldo AM, Lalli DA, Aldwinckle HS, Wisniewski ME. 2009. Rapid transcriptional response of apple to fire blight disease revealed by cDNA suppression subtractive hybridization analysis. Tree Genet Genomes 5:27-40.
Nour V, Trandafir I, Ionica ME. 2010. Compositional characteristics of fruits of several apple (Malus domestica Borkh.) cultivars. Notulae Botanicae Horti Agrobotanici Cluj-Napoca 38, 228-233.
Odell JT, Nagy F, Chua NH. 1985. Identification of DNA sequences required for activity of the cauliflower mosaic virus 35S promoter. Nature 313: 810-812.
Park S, Sugimoto N, Larson MD, Beaudry R, Van Nocker S. 2006. Identification of genes with potential roles in apple fruit development and biochemistry through large-scale statistical analysis of expressed sequence tags. Plant Physiology 141, 811-824.
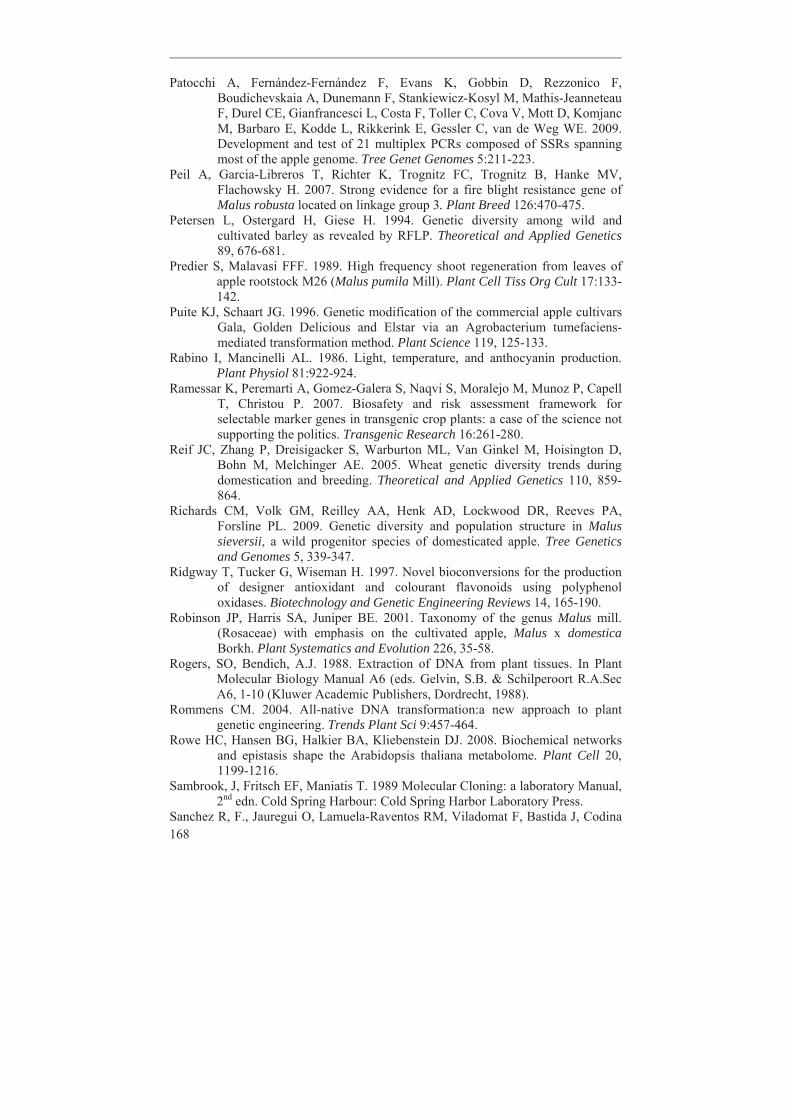
168
Patocchi A, Fernández-Fernández F, Evans K, Gobbin D, Rezzonico F, Boudichevskaia A, Dunemann F, Stankiewicz-Kosyl M, Mathis-Jeanneteau F, Durel CE, Gianfrancesci L, Costa F, Toller C, Cova V, Mott D, Komjanc M, Barbaro E, Kodde L, Rikkerink E, Gessler C, van de Weg WE. 2009. Development and test of 21 multiplex PCRs composed of SSRs spanning most of the apple genome. Tree Genet Genomes 5:211-223.
Peil A, Garcia-Libreros T, Richter K, Trognitz FC, Trognitz B, Hanke MV, Flachowsky H. 2007. Strong evidence for a fire blight resistance gene of Malus robusta located on linkage group 3. Plant Breed 126:470-475.
Petersen L, Ostergard H, Giese H. 1994. Genetic diversity among wild and cultivated barley as revealed by RFLP. Theoretical and Applied Genetics 89, 676-681.
Predier S, Malavasi FFF. 1989. High frequency shoot regeneration from leaves of apple rootstock M26 (Malus pumila Mill). Plant Cell Tiss Org Cult 17:133-142.
Puite KJ, Schaart JG. 1996. Genetic modification of the commercial apple cultivars Gala, Golden Delicious and Elstar via an Agrobacterium tumefaciens-mediated transformation method. Plant Science 119, 125-133.
Rabino I, Mancinelli AL. 1986. Light, temperature, and anthocyanin production. Plant Physiol 81:922-924.
Ramessar K, Peremarti A, Gomez-Galera S, Naqvi S, Moralejo M, Munoz P, Capell T, Christou P. 2007. Biosafety and risk assessment framework for selectable marker genes in transgenic crop plants: a case of the science not supporting the politics. Transgenic Research 16:261-280.
Reif JC, Zhang P, Dreisigacker S, Warburton ML, Van Ginkel M, Hoisington D, Bohn M, Melchinger AE. 2005. Wheat genetic diversity trends during domestication and breeding. Theoretical and Applied Genetics 110, 859-864.
Richards CM, Volk GM, Reilley AA, Henk AD, Lockwood DR, Reeves PA, Forsline PL. 2009. Genetic diversity and population structure in Malus sieversii, a wild progenitor species of domesticated apple. Tree Genetics and Genomes 5, 339-347.
Ridgway T, Tucker G, Wiseman H. 1997. Novel bioconversions for the production of designer antioxidant and colourant flavonoids using polyphenol oxidases. Biotechnology and Genetic Engineering Reviews 14, 165-190.
Robinson JP, Harris SA, Juniper BE. 2001. Taxonomy of the genus Malus mill. (Rosaceae) with emphasis on the cultivated apple, Malus x domestica Borkh. Plant Systematics and Evolution 226, 35-58.
Rogers, SO, Bendich, A.J. 1988. Extraction of DNA from plant tissues. In Plant Molecular Biology Manual A6 (eds. Gelvin, S.B. & Schilperoort R.A.Sec A6, 1-10 (Kluwer Academic Publishers, Dordrecht, 1988).
Rommens CM. 2004. All-native DNA transformation:a new approach to plant genetic engineering. Trends Plant Sci 9:457-464.
Rowe HC, Hansen BG, Halkier BA, Kliebenstein DJ. 2008. Biochemical networks and epistasis shape the Arabidopsis thaliana metabolome. Plant Cell 20, 1199-1216.
Sambrook, J, Fritsch EF, Maniatis T. 1989 Molecular Cloning: a laboratory Manual, 2nd edn. Cold Spring Harbour: Cold Spring Harbor Laboratory Press.
Sanchez R, F., Jauregui O, Lamuela-Raventos RM, Viladomat F, Bastida J, Codina
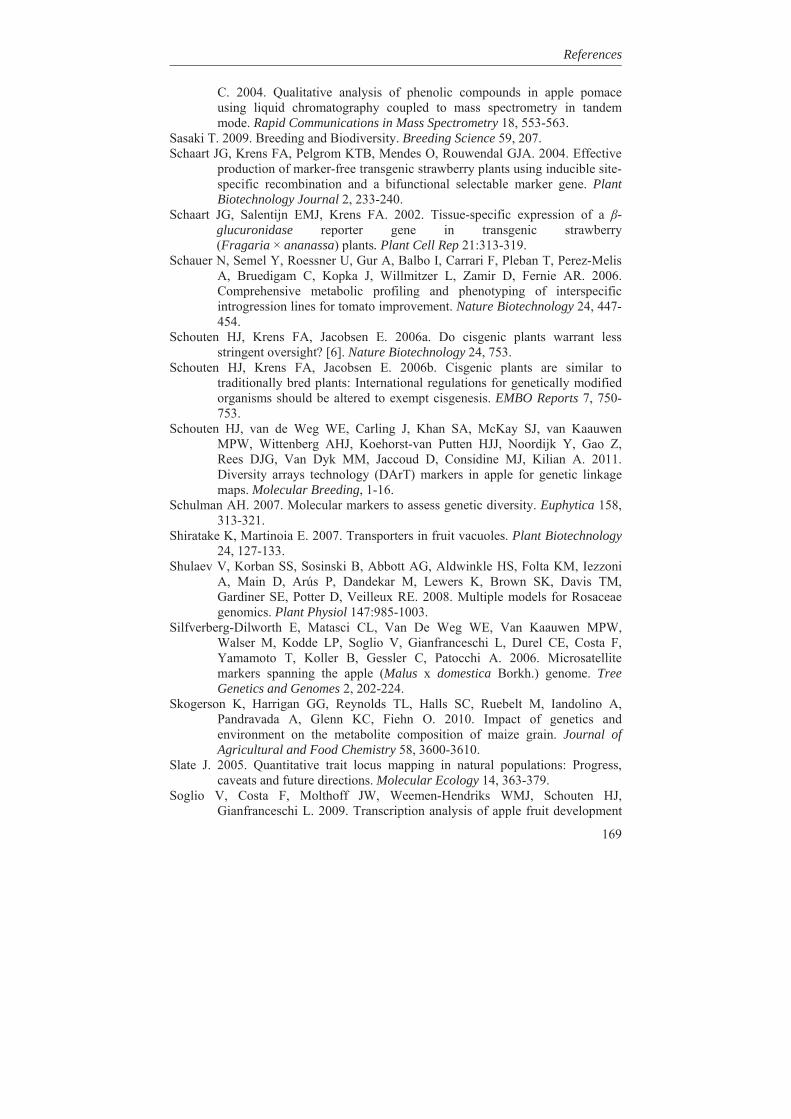
References
169
C. 2004. Qualitative analysis of phenolic compounds in apple pomace using liquid chromatography coupled to mass spectrometry in tandem mode. Rapid Communications in Mass Spectrometry 18, 553-563.
Sasaki T. 2009. Breeding and Biodiversity. Breeding Science 59, 207. Schaart JG, Krens FA, Pelgrom KTB, Mendes O, Rouwendal GJA. 2004. Effective
production of marker-free transgenic strawberry plants using inducible site-specific recombination and a bifunctional selectable marker gene. Plant Biotechnology Journal 2, 233-240.
Schaart JG, Salentijn EMJ, Krens FA. 2002. Tissue-specific expression of a -glucuronidase reporter gene in transgenic strawberry (Fragaria × ananassa) plants. Plant Cell Rep 21:313-319.
Schauer N, Semel Y, Roessner U, Gur A, Balbo I, Carrari F, Pleban T, Perez-Melis A, Bruedigam C, Kopka J, Willmitzer L, Zamir D, Fernie AR. 2006. Comprehensive metabolic profiling and phenotyping of interspecific introgression lines for tomato improvement. Nature Biotechnology 24, 447-454.
Schouten HJ, Krens FA, Jacobsen E. 2006a. Do cisgenic plants warrant less stringent oversight? [6]. Nature Biotechnology 24, 753.
Schouten HJ, Krens FA, Jacobsen E. 2006b. Cisgenic plants are similar to traditionally bred plants: International regulations for genetically modified organisms should be altered to exempt cisgenesis. EMBO Reports 7, 750-753.
Schouten HJ, van de Weg WE, Carling J, Khan SA, McKay SJ, van Kaauwen MPW, Wittenberg AHJ, Koehorst-van Putten HJJ, Noordijk Y, Gao Z, Rees DJG, Van Dyk MM, Jaccoud D, Considine MJ, Kilian A. 2011. Diversity arrays technology (DArT) markers in apple for genetic linkage maps. Molecular Breeding, 1-16.
Schulman AH. 2007. Molecular markers to assess genetic diversity. Euphytica 158, 313-321.
Shiratake K, Martinoia E. 2007. Transporters in fruit vacuoles. Plant Biotechnology 24, 127-133.
Shulaev V, Korban SS, Sosinski B, Abbott AG, Aldwinkle HS, Folta KM, Iezzoni A, Main D, Arús P, Dandekar M, Lewers K, Brown SK, Davis TM, Gardiner SE, Potter D, Veilleux RE. 2008. Multiple models for Rosaceae genomics. Plant Physiol 147:985-1003.
Silfverberg-Dilworth E, Matasci CL, Van De Weg WE, Van Kaauwen MPW, Walser M, Kodde LP, Soglio V, Gianfranceschi L, Durel CE, Costa F, Yamamoto T, Koller B, Gessler C, Patocchi A. 2006. Microsatellite markers spanning the apple (Malus x domestica Borkh.) genome. Tree Genetics and Genomes 2, 202-224.
Skogerson K, Harrigan GG, Reynolds TL, Halls SC, Ruebelt M, Iandolino A, Pandravada A, Glenn KC, Fiehn O. 2010. Impact of genetics and environment on the metabolite composition of maize grain. Journal of Agricultural and Food Chemistry 58, 3600-3610.
Slate J. 2005. Quantitative trait locus mapping in natural populations: Progress, caveats and future directions. Molecular Ecology 14, 363-379.
Soglio V, Costa F, Molthoff JW, Weemen-Hendriks WMJ, Schouten HJ, Gianfranceschi L. 2009. Transcription analysis of apple fruit development
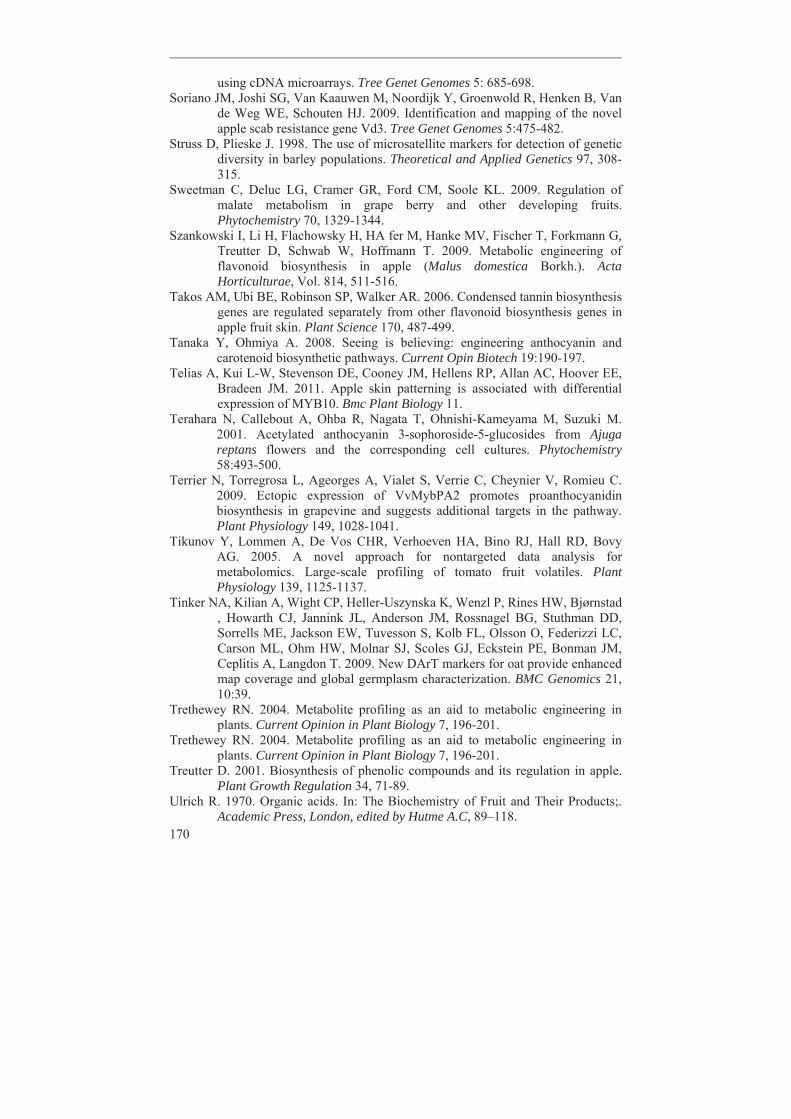
170
using cDNA microarrays. Tree Genet Genomes 5: 685-698. Soriano JM, Joshi SG, Van Kaauwen M, Noordijk Y, Groenwold R, Henken B, Van
de Weg WE, Schouten HJ. 2009. Identification and mapping of the novel apple scab resistance gene Vd3. Tree Genet Genomes 5:475-482.
Struss D, Plieske J. 1998. The use of microsatellite markers for detection of genetic diversity in barley populations. Theoretical and Applied Genetics 97, 308-315.
Sweetman C, Deluc LG, Cramer GR, Ford CM, Soole KL. 2009. Regulation of malate metabolism in grape berry and other developing fruits. Phytochemistry 70, 1329-1344.
Szankowski I, Li H, Flachowsky H, HA fer M, Hanke MV, Fischer T, Forkmann G, Treutter D, Schwab W, Hoffmann T. 2009. Metabolic engineering of flavonoid biosynthesis in apple (Malus domestica Borkh.). Acta Horticulturae, Vol. 814, 511-516.
Takos AM, Ubi BE, Robinson SP, Walker AR. 2006. Condensed tannin biosynthesis genes are regulated separately from other flavonoid biosynthesis genes in apple fruit skin. Plant Science 170, 487-499.
Tanaka Y, Ohmiya A. 2008. Seeing is believing: engineering anthocyanin and carotenoid biosynthetic pathways. Current Opin Biotech 19:190-197.
Telias A, Kui L-W, Stevenson DE, Cooney JM, Hellens RP, Allan AC, Hoover EE, Bradeen JM. 2011. Apple skin patterning is associated with differential expression of MYB10. Bmc Plant Biology 11.
Terahara N, Callebout A, Ohba R, Nagata T, Ohnishi-Kameyama M, Suzuki M. 2001. Acetylated anthocyanin 3-sophoroside-5-glucosides from Ajuga reptans flowers and the corresponding cell cultures. Phytochemistry 58:493-500.
Terrier N, Torregrosa L, Ageorges A, Vialet S, Verrie C, Cheynier V, Romieu C. 2009. Ectopic expression of VvMybPA2 promotes proanthocyanidin biosynthesis in grapevine and suggests additional targets in the pathway. Plant Physiology 149, 1028-1041.
Tikunov Y, Lommen A, De Vos CHR, Verhoeven HA, Bino RJ, Hall RD, Bovy AG. 2005. A novel approach for nontargeted data analysis for metabolomics. Large-scale profiling of tomato fruit volatiles. Plant Physiology 139, 1125-1137.
Tinker NA, Kilian A, Wight CP, Heller-Uszynska K, Wenzl P, Rines HW, Bjørnstad , Howarth CJ, Jannink JL, Anderson JM, Rossnagel BG, Stuthman DD, Sorrells ME, Jackson EW, Tuvesson S, Kolb FL, Olsson O, Federizzi LC, Carson ML, Ohm HW, Molnar SJ, Scoles GJ, Eckstein PE, Bonman JM, Ceplitis A, Langdon T. 2009. New DArT markers for oat provide enhanced map coverage and global germplasm characterization. BMC Genomics 21, 10:39.
Trethewey RN. 2004. Metabolite profiling as an aid to metabolic engineering in plants. Current Opinion in Plant Biology 7, 196-201.
Trethewey RN. 2004. Metabolite profiling as an aid to metabolic engineering in plants. Current Opinion in Plant Biology 7, 196-201.
Treutter D. 2001. Biosynthesis of phenolic compounds and its regulation in apple. Plant Growth Regulation 34, 71-89.
Ulrich R. 1970. Organic acids. In: The Biochemistry of Fruit and Their Products;. Academic Press, London, edited by Hutme A.C, 89–118.
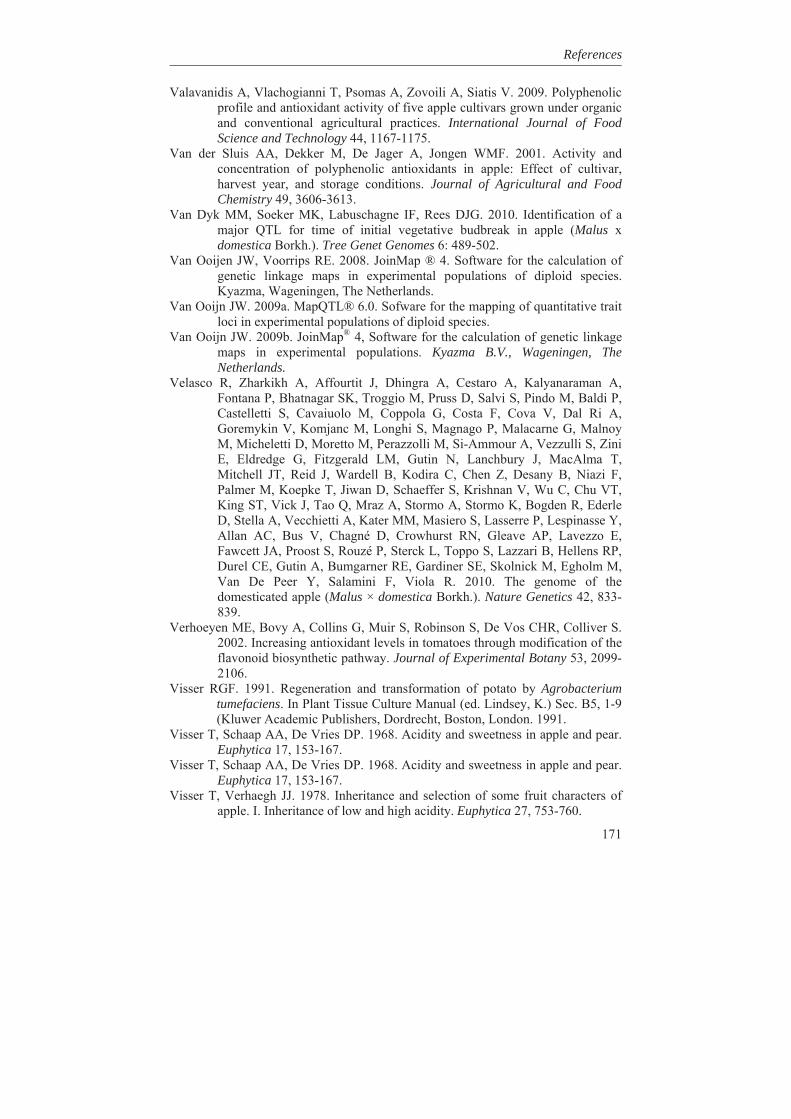
References
171
Valavanidis A, Vlachogianni T, Psomas A, Zovoili A, Siatis V. 2009. Polyphenolic profile and antioxidant activity of five apple cultivars grown under organic and conventional agricultural practices. International Journal of Food Science and Technology 44, 1167-1175.
Van der Sluis AA, Dekker M, De Jager A, Jongen WMF. 2001. Activity and concentration of polyphenolic antioxidants in apple: Effect of cultivar, harvest year, and storage conditions. Journal of Agricultural and Food Chemistry 49, 3606-3613.
Van Dyk MM, Soeker MK, Labuschagne IF, Rees DJG. 2010. Identification of a major QTL for time of initial vegetative budbreak in apple (Malus x domestica Borkh.). Tree Genet Genomes 6: 489-502.
Van Ooijen JW, Voorrips RE. 2008. JoinMap ® 4. Software for the calculation of genetic linkage maps in experimental populations of diploid species. Kyazma, Wageningen, The Netherlands.
Van Ooijn JW. 2009a. MapQTL® 6.0. Sofware for the mapping of quantitative trait loci in experimental populations of diploid species.
Van Ooijn JW. 2009b. JoinMap® 4, Software for the calculation of genetic linkage maps in experimental populations. Kyazma B.V., Wageningen, The Netherlands.
Velasco R, Zharkikh A, Affourtit J, Dhingra A, Cestaro A, Kalyanaraman A, Fontana P, Bhatnagar SK, Troggio M, Pruss D, Salvi S, Pindo M, Baldi P, Castelletti S, Cavaiuolo M, Coppola G, Costa F, Cova V, Dal Ri A, Goremykin V, Komjanc M, Longhi S, Magnago P, Malacarne G, Malnoy M, Micheletti D, Moretto M, Perazzolli M, Si-Ammour A, Vezzulli S, Zini E, Eldredge G, Fitzgerald LM, Gutin N, Lanchbury J, MacAlma T, Mitchell JT, Reid J, Wardell B, Kodira C, Chen Z, Desany B, Niazi F, Palmer M, Koepke T, Jiwan D, Schaeffer S, Krishnan V, Wu C, Chu VT, King ST, Vick J, Tao Q, Mraz A, Stormo A, Stormo K, Bogden R, Ederle D, Stella A, Vecchietti A, Kater MM, Masiero S, Lasserre P, Lespinasse Y, Allan AC, Bus V, Chagné D, Crowhurst RN, Gleave AP, Lavezzo E, Fawcett JA, Proost S, Rouzé P, Sterck L, Toppo S, Lazzari B, Hellens RP, Durel CE, Gutin A, Bumgarner RE, Gardiner SE, Skolnick M, Egholm M, Van De Peer Y, Salamini F, Viola R. 2010. The genome of the domesticated apple (Malus × domestica Borkh.). Nature Genetics 42, 833-839.
Verhoeyen ME, Bovy A, Collins G, Muir S, Robinson S, De Vos CHR, Colliver S. 2002. Increasing antioxidant levels in tomatoes through modification of the flavonoid biosynthetic pathway. Journal of Experimental Botany 53, 2099-2106.
Visser RGF. 1991. Regeneration and transformation of potato by Agrobacterium tumefaciens. In Plant Tissue Culture Manual (ed. Lindsey, K.) Sec. B5, 1-9 (Kluwer Academic Publishers, Dordrecht, Boston, London. 1991.
Visser T, Schaap AA, De Vries DP. 1968. Acidity and sweetness in apple and pear. Euphytica 17, 153-167.
Visser T, Schaap AA, De Vries DP. 1968. Acidity and sweetness in apple and pear. Euphytica 17, 153-167.
Visser T, Verhaegh JJ. 1978. Inheritance and selection of some fruit characters of apple. I. Inheritance of low and high acidity. Euphytica 27, 753-760.
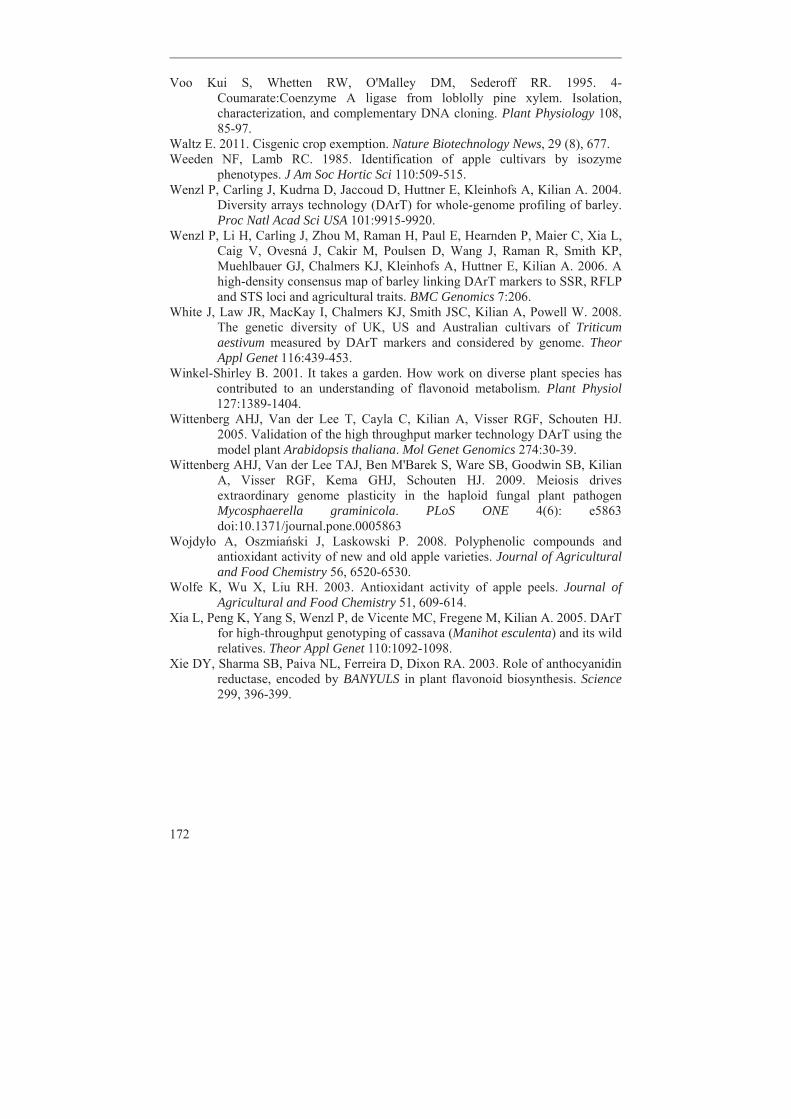
172
Voo Kui S, Whetten RW, O'Malley DM, Sederoff RR. 1995. 4-Coumarate:Coenzyme A ligase from loblolly pine xylem. Isolation, characterization, and complementary DNA cloning. Plant Physiology 108, 85-97.
Waltz E. 2011. Cisgenic crop exemption. Nature Biotechnology News, 29 (8), 677. Weeden NF, Lamb RC. 1985. Identification of apple cultivars by isozyme
phenotypes. J Am Soc Hortic Sci 110:509-515. Wenzl P, Carling J, Kudrna D, Jaccoud D, Huttner E, Kleinhofs A, Kilian A. 2004.
Diversity arrays technology (DArT) for whole-genome profiling of barley. Proc Natl Acad Sci USA 101:9915-9920.
Wenzl P, Li H, Carling J, Zhou M, Raman H, Paul E, Hearnden P, Maier C, Xia L, Caig V, Ovesná J, Cakir M, Poulsen D, Wang J, Raman R, Smith KP, Muehlbauer GJ, Chalmers KJ, Kleinhofs A, Huttner E, Kilian A. 2006. A high-density consensus map of barley linking DArT markers to SSR, RFLP and STS loci and agricultural traits. BMC Genomics 7:206.
White J, Law JR, MacKay I, Chalmers KJ, Smith JSC, Kilian A, Powell W. 2008. The genetic diversity of UK, US and Australian cultivars of Triticum aestivum measured by DArT markers and considered by genome. Theor Appl Genet 116:439-453.
Winkel-Shirley B. 2001. It takes a garden. How work on diverse plant species has contributed to an understanding of flavonoid metabolism. Plant Physiol 127:1389-1404.
Wittenberg AHJ, Van der Lee T, Cayla C, Kilian A, Visser RGF, Schouten HJ. 2005. Validation of the high throughput marker technology DArT using the model plant Arabidopsis thaliana. Mol Genet Genomics 274:30-39.
Wittenberg AHJ, Van der Lee TAJ, Ben M'Barek S, Ware SB, Goodwin SB, Kilian A, Visser RGF, Kema GHJ, Schouten HJ. 2009. Meiosis drives extraordinary genome plasticity in the haploid fungal plant pathogen Mycosphaerella graminicola. PLoS ONE 4(6): e5863 doi:10.1371/journal.pone.0005863
Wojdy o A, Oszmia ski J, Laskowski P. 2008. Polyphenolic compounds and antioxidant activity of new and old apple varieties. Journal of Agricultural and Food Chemistry 56, 6520-6530.
Wolfe K, Wu X, Liu RH. 2003. Antioxidant activity of apple peels. Journal of Agricultural and Food Chemistry 51, 609-614.
Xia L, Peng K, Yang S, Wenzl P, de Vicente MC, Fregene M, Kilian A. 2005. DArT for high-throughput genotyping of cassava (Manihot esculenta) and its wild relatives. Theor Appl Genet 110:1092-1098.
Xie DY, Sharma SB, Paiva NL, Ferreira D, Dixon RA. 2003. Role of anthocyanidin reductase, encoded by BANYULS in plant flavonoid biosynthesis. Science 299, 396-399.
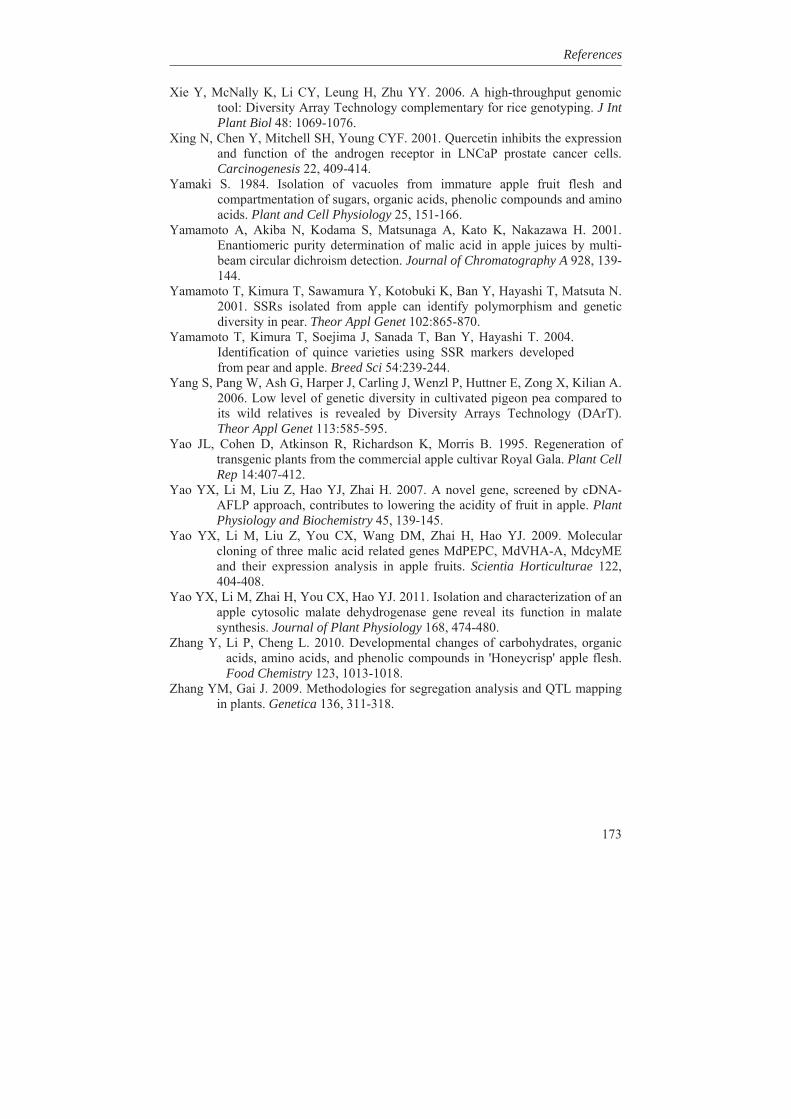
References
173
Xie Y, McNally K, Li CY, Leung H, Zhu YY. 2006. A high-throughput genomic tool: Diversity Array Technology complementary for rice genotyping. J Int Plant Biol 48: 1069-1076.
Xing N, Chen Y, Mitchell SH, Young CYF. 2001. Quercetin inhibits the expression and function of the androgen receptor in LNCaP prostate cancer cells. Carcinogenesis 22, 409-414.
Yamaki S. 1984. Isolation of vacuoles from immature apple fruit flesh and compartmentation of sugars, organic acids, phenolic compounds and amino acids. Plant and Cell Physiology 25, 151-166.
Yamamoto A, Akiba N, Kodama S, Matsunaga A, Kato K, Nakazawa H. 2001. Enantiomeric purity determination of malic acid in apple juices by multi-beam circular dichroism detection. Journal of Chromatography A 928, 139-144.
Yamamoto T, Kimura T, Sawamura Y, Kotobuki K, Ban Y, Hayashi T, Matsuta N. 2001. SSRs isolated from apple can identify polymorphism and genetic diversity in pear. Theor Appl Genet 102:865-870.
Yamamoto T, Kimura T, Soejima J, Sanada T, Ban Y, Hayashi T. 2004. Identification of quince varieties using SSR markers developed from pear and apple. Breed Sci 54:239-244.
Yang S, Pang W, Ash G, Harper J, Carling J, Wenzl P, Huttner E, Zong X, Kilian A. 2006. Low level of genetic diversity in cultivated pigeon pea compared to its wild relatives is revealed by Diversity Arrays Technology (DArT). Theor Appl Genet 113:585-595.
Yao JL, Cohen D, Atkinson R, Richardson K, Morris B. 1995. Regeneration of transgenic plants from the commercial apple cultivar Royal Gala. Plant Cell Rep 14:407-412.
Yao YX, Li M, Liu Z, Hao YJ, Zhai H. 2007. A novel gene, screened by cDNA-AFLP approach, contributes to lowering the acidity of fruit in apple. Plant Physiology and Biochemistry 45, 139-145.
Yao YX, Li M, Liu Z, You CX, Wang DM, Zhai H, Hao YJ. 2009. Molecular cloning of three malic acid related genes MdPEPC, MdVHA-A, MdcyME and their expression analysis in apple fruits. Scientia Horticulturae 122, 404-408.
Yao YX, Li M, Zhai H, You CX, Hao YJ. 2011. Isolation and characterization of an apple cytosolic malate dehydrogenase gene reveal its function in malate synthesis. Journal of Plant Physiology 168, 474-480.
Zhang Y, Li P, Cheng L. 2010. Developmental changes of carbohydrates, organic acids, amino acids, and phenolic compounds in 'Honeycrisp' apple flesh. Food Chemistry 123, 1013-1018.
Zhang YM, Gai J. 2009. Methodologies for segregation analysis and QTL mapping in plants. Genetica 136, 311-318.
174
Zhou LL, Zeng HN, Shi MZ, Xie DY. 2008. Development of tobacco callus cultures over expressing Arabidopsis PAP/MYB75 transcription factor and characterization of anthocyanin biosynthesis. Planta 229:37-51.
Zhu Y, Barrett BH. 2008. Md-ACS1 and Md-ACO1 genotyping of apple (Malus x domestica Borkh.) breeding parents and suitability for marker-assisted selection. Tree Genet Genomes 4:555-562.
Zhu Y, Evans K, Peace C. 2011. Utility testing of an apple skin color MdMYB1 marker in two progenies. Molecular Breeding 27, 525-532.
Zini E, Biasioli F, Gasperi F, Mott D, Aprea E, Märk TD, Patocchi A, Gessler C, Komjanc M. 2005. QTL mapping of volatile compounds in ripe apples detected by proton transfer reaction-mass spectrometry. Euphytica 145, 269-279.
175
Summary
The aim of this thesis was finding genes that control the production of potentially health beneficial metabolites in apple fruits. The approach was genetic mapping of secondary metabolites such as phenolic compounds in an F1 progeny, leading to the detection of genetic loci that controlled these metabolites. At these genetic loci candidate genes were identified, using the whole genome sequence of apple, and it was investigated whether the expression of these candidate genes in the F1 progeny correlated with the metabolite levels. The cultivated apple (Malus x domestica Borkh) is among the most diverse and ubiquitously cultivated fruit species. It belongs to the family of Rosaceae which includes many commercial fruit species such as pear, strawberry, cherry, peach, apricot, almond, black cherry, and crab apple. Apple has a haploid chromosome number of 17. It is a self-incompatible and highly heterozygous crop. The breeding is further hampered by the long juvenile period which makes breeding in this crop a very slow process.
The saying “An apple a day keeps the doctor away” has encouraged many researchers to search for the “magic” ingredients found in apple. Due to the beneficial role of apple phenolics, it is also called as a “new agrochemical crop”. Apple possesses many health beneficial properties for human beings as it is a rich source of phenolic compounds. It has been associated with reducing the risks of certain diseases such as cancers, particularly prostate, liver, colon, and lung cancers, cardiovascular diseases, coronary heart diseases, asthma, type-2 diabetes, thrombotic stroke, and ischemic heart disease.
The second chapter of this thesis describes the construction of genetic linkage maps of the parents of a segregating population derived from the cross between the cultivars ‘Prima’ and ‘Fiesta’. For this purpose the already available linkage maps, as described in this chapter, were made denser by inclusion of 240 Diversity Array Technology (DArT) markers. Thus the total number of markers for ‘Prima’ and ‘Fiesta’ integrated map reached to 820. DArT-markers are hybridization based dominant DNA-markers. DArT provides a high-throughput whole genome genotyping platform for the detection and scoring of hundreds of polymorphic loci without any need for prior sequence information. This is the first report on DArT in horticultural trees. Genetic mapping of DArT markers in two mapping populations and their integration with other marker types showed that DArT is a powerful high throughput method for obtaining accurate and reproducible marker data, at low cost per data point. This method appears to be suitable for aligning the genetic maps of different segregating populations. Sequencing of the marker clones showed that they are significantly enriched for low copy, gene rich regions.
176
Chapter 3 describes metabolic diversity of Malus. Wild germplasm was compared to advanced breeding selections and to the segregating F1 population from the cross between the cultivars ‘Prima’ and ‘Fiesta’. The metabolic profiles were analyzed by means of liquid chromatography-mass spectrometry (LC-MS). LC-MS is an analytical chemistry technique that combines the physical separation capabilities of liquid chromatography with the mass analysis capabilities of mass spectrometry. This resulted in the detection of 418 putative metabolites in the peel and 254 in the flesh. Fruits from 23 wild species, eight advanced selections and the segregating F1 population were analyzed. The data were subjected to Principle Components Analysis (PCA). Variance analysis of the first PC showed that genetic variation accounted for 96.6 % in peel and 97.4 % in flesh of the total metabolic variation. Technical variation accounted for 1.4 % and 0.8%, while environmental variation accounted for 2.0% and 1.8% in peel and flesh respectively. The genetic variation between wild genotypes was very large, compared to the advanced selections and the F1 progeny. Only 8 % of the genetic variation of the first principle component was captured by the advanced selections. This indicates strong genetic erosion during breeding. This genetic erosion was mainly caused by reduction of the levels of several flavonoids including catechin, epicatechin and procyanidins. PCA of the F1 progeny of the ‘Prima’ x ‘Fiesta’ cross showed a clear 3:1 Mendelian segregation of metabolites. These metabolites were 4.2 fold less in both peel and flesh in progeny that had inherited the recessive alleles of a gene at the top of Linkage Group 16 (LG16) from the heterozygous parents.
We found a separate group of 11 metabolites in peel and 12 in flesh. These metabolites were putatively identified as glycosylated forms of -glycols: R-octane-1, 3-diol and its unsaturated form R-5-(Z)-octene-1, 3-diol which have a potential role in controlling infection by microorganisms and influence the aroma of some ciders. The levels of these metabolites were up to 50 fold more abundant in some progeny compared to both parents. Genetic mapping showed that this strong increase was caused by one locus at the top of LG8, in progeny that had inherited only the recessive alleles of that locus from the heterozygous parents. This research illustrates not only the strong genetic erosion in apple breeding regarding metabolic diversity, and strong reduction of flavonoids in some progeny, but also shows that inbreeding can lead to a strong increase of metabolites that were present at much lower levels in both parents and advanced selections. This loss and gain of metabolites was especially observed in case of accumulation of recessive alleles during inbreeding.
The genetic factors controlling metabolite composition were studied in more detail in Chapter 4. We investigated the genetic factors of the quantitative variation of these potentially beneficial compounds (Chapter 3, 4), by combining the genetic maps (Chapter 2) with the LC-MS data for the segregating F1 population
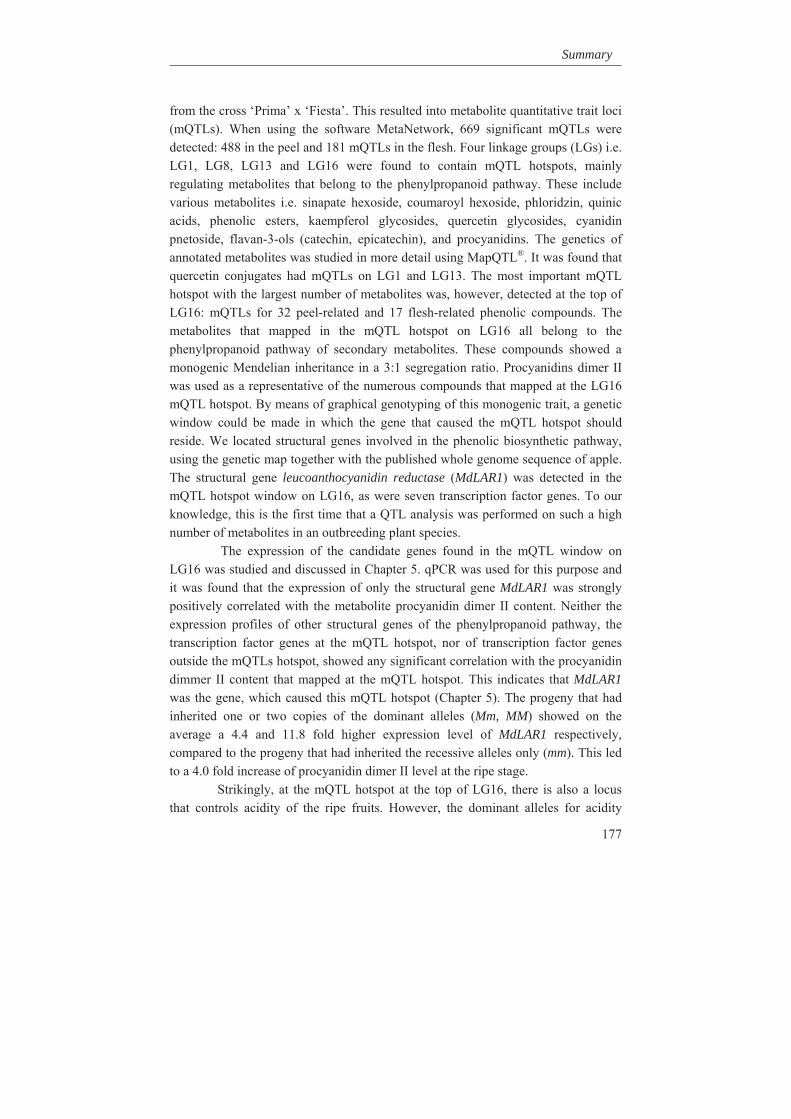
Summary
177
from the cross ‘Prima’ x ‘Fiesta’. This resulted into metabolite quantitative trait loci (mQTLs). When using the software MetaNetwork, 669 significant mQTLs were detected: 488 in the peel and 181 mQTLs in the flesh. Four linkage groups (LGs) i.e. LG1, LG8, LG13 and LG16 were found to contain mQTL hotspots, mainly regulating metabolites that belong to the phenylpropanoid pathway. These include various metabolites i.e. sinapate hexoside, coumaroyl hexoside, phloridzin, quinic acids, phenolic esters, kaempferol glycosides, quercetin glycosides, cyanidin pnetoside, flavan-3-ols (catechin, epicatechin), and procyanidins. The genetics of annotated metabolites was studied in more detail using MapQTL®. It was found that quercetin conjugates had mQTLs on LG1 and LG13. The most important mQTL hotspot with the largest number of metabolites was, however, detected at the top of LG16: mQTLs for 32 peel-related and 17 flesh-related phenolic compounds. The metabolites that mapped in the mQTL hotspot on LG16 all belong to the phenylpropanoid pathway of secondary metabolites. These compounds showed a monogenic Mendelian inheritance in a 3:1 segregation ratio. Procyanidins dimer II was used as a representative of the numerous compounds that mapped at the LG16 mQTL hotspot. By means of graphical genotyping of this monogenic trait, a genetic window could be made in which the gene that caused the mQTL hotspot should reside. We located structural genes involved in the phenolic biosynthetic pathway, using the genetic map together with the published whole genome sequence of apple. The structural gene leucoanthocyanidin reductase (MdLAR1) was detected in the mQTL hotspot window on LG16, as were seven transcription factor genes. To our knowledge, this is the first time that a QTL analysis was performed on such a high number of metabolites in an outbreeding plant species.
The expression of the candidate genes found in the mQTL window on LG16 was studied and discussed in Chapter 5. qPCR was used for this purpose and it was found that the expression of only the structural gene MdLAR1 was strongly positively correlated with the metabolite procyanidin dimer II content. Neither the expression profiles of other structural genes of the phenylpropanoid pathway, the transcription factor genes at the mQTL hotspot, nor of transcription factor genes outside the mQTLs hotspot, showed any significant correlation with the procyanidin dimmer II content that mapped at the mQTL hotspot. This indicates that MdLAR1 was the gene, which caused this mQTL hotspot (Chapter 5). The progeny that had inherited one or two copies of the dominant alleles (Mm, MM) showed on the average a 4.4 and 11.8 fold higher expression level of MdLAR1 respectively, compared to the progeny that had inherited the recessive alleles only (mm). This led to a 4.0 fold increase of procyanidin dimer II level at the ripe stage.
Strikingly, at the mQTL hotspot at the top of LG16, there is also a locus that controls acidity of the ripe fruits. However, the dominant alleles for acidity
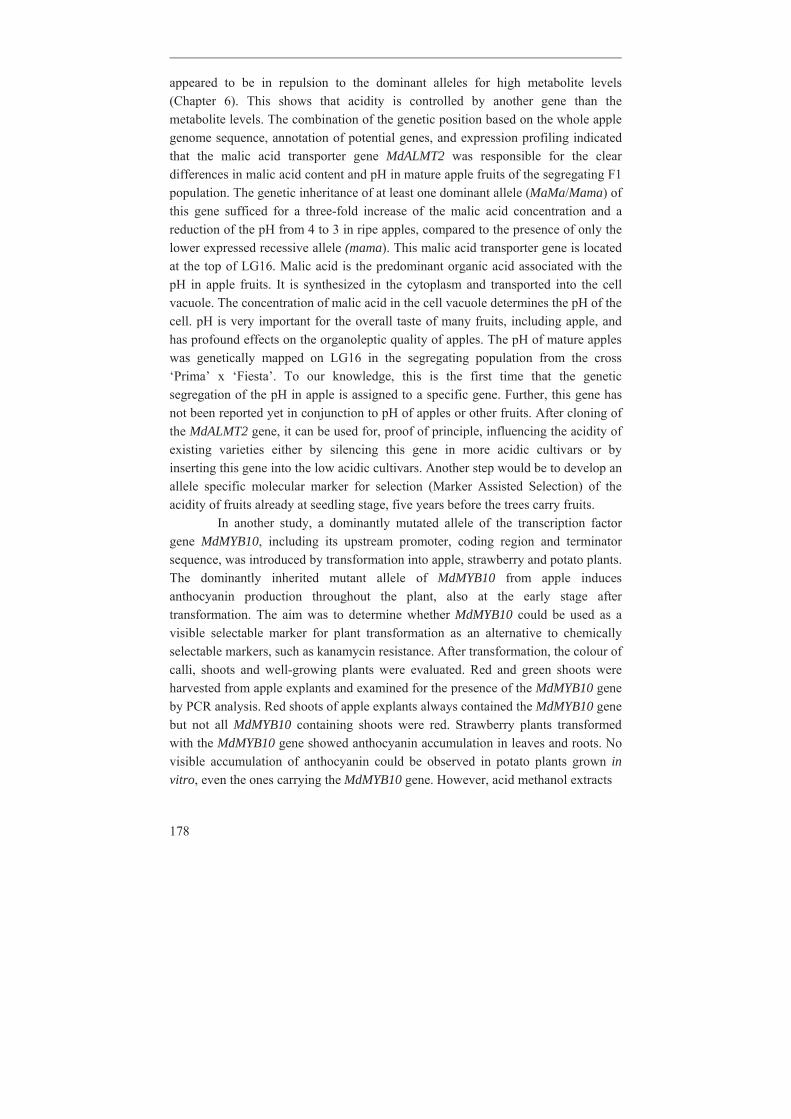
178
appeared to be in repulsion to the dominant alleles for high metabolite levels (Chapter 6). This shows that acidity is controlled by another gene than the metabolite levels. The combination of the genetic position based on the whole apple genome sequence, annotation of potential genes, and expression profiling indicated that the malic acid transporter gene MdALMT2 was responsible for the clear differences in malic acid content and pH in mature apple fruits of the segregating F1 population. The genetic inheritance of at least one dominant allele (MaMa/Mama) of this gene sufficed for a three-fold increase of the malic acid concentration and a reduction of the pH from 4 to 3 in ripe apples, compared to the presence of only the lower expressed recessive allele (mama). This malic acid transporter gene is located at the top of LG16. Malic acid is the predominant organic acid associated with the pH in apple fruits. It is synthesized in the cytoplasm and transported into the cell vacuole. The concentration of malic acid in the cell vacuole determines the pH of the cell. pH is very important for the overall taste of many fruits, including apple, and has profound effects on the organoleptic quality of apples. The pH of mature apples was genetically mapped on LG16 in the segregating population from the cross ‘Prima’ x ‘Fiesta’. To our knowledge, this is the first time that the genetic segregation of the pH in apple is assigned to a specific gene. Further, this gene has not been reported yet in conjunction to pH of apples or other fruits. After cloning of the MdALMT2 gene, it can be used for, proof of principle, influencing the acidity of existing varieties either by silencing this gene in more acidic cultivars or by inserting this gene into the low acidic cultivars. Another step would be to develop an allele specific molecular marker for selection (Marker Assisted Selection) of the acidity of fruits already at seedling stage, five years before the trees carry fruits. In another study, a dominantly mutated allele of the transcription factor gene MdMYB10, including its upstream promoter, coding region and terminator sequence, was introduced by transformation into apple, strawberry and potato plants. The dominantly inherited mutant allele of MdMYB10 from apple induces anthocyanin production throughout the plant, also at the early stage after transformation. The aim was to determine whether MdMYB10 could be used as a visible selectable marker for plant transformation as an alternative to chemically selectable markers, such as kanamycin resistance. After transformation, the colour of calli, shoots and well-growing plants were evaluated. Red and green shoots were harvested from apple explants and examined for the presence of the MdMYB10 gene by PCR analysis. Red shoots of apple explants always contained the MdMYB10 gene but not all MdMYB10 containing shoots were red. Strawberry plants transformed with the MdMYB10 gene showed anthocyanin accumulation in leaves and roots. No visible accumulation of anthocyanin could be observed in potato plants grown in vitro, even the ones carrying the MdMYB10 gene. However, acid methanol extracts
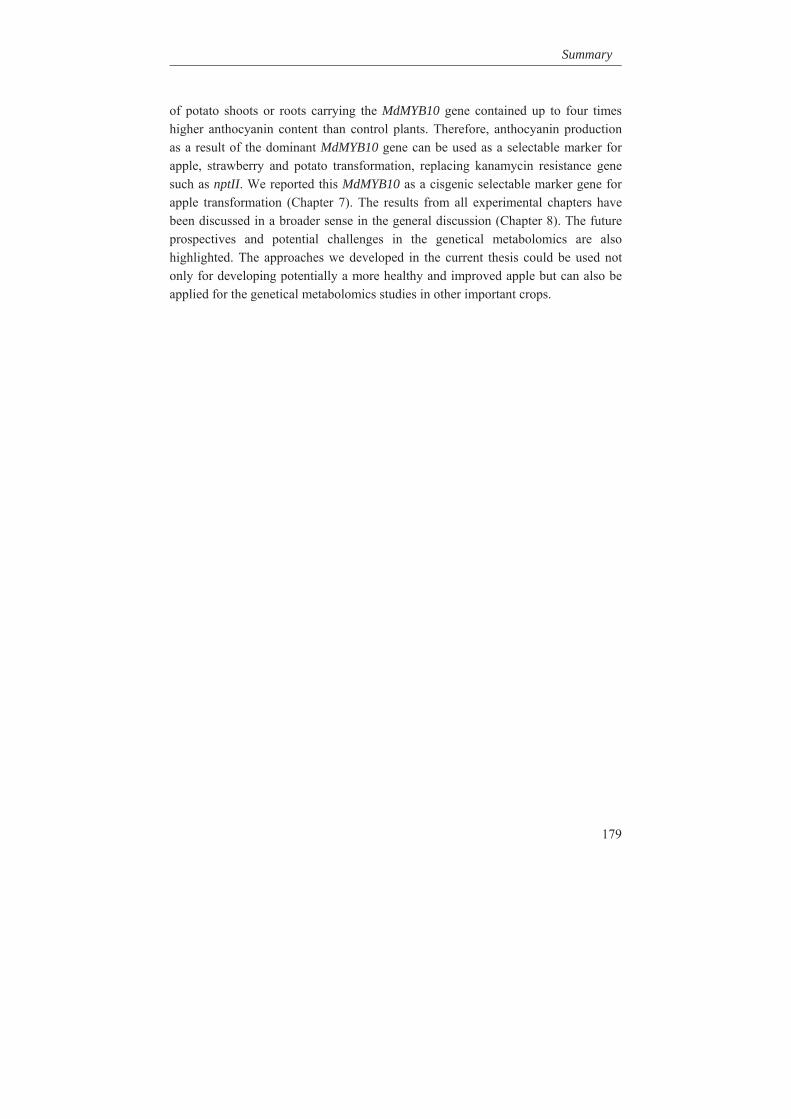
Summary
179
of potato shoots or roots carrying the MdMYB10 gene contained up to four times higher anthocyanin content than control plants. Therefore, anthocyanin production as a result of the dominant MdMYB10 gene can be used as a selectable marker for apple, strawberry and potato transformation, replacing kanamycin resistance gene such as nptII. We reported this MdMYB10 as a cisgenic selectable marker gene for apple transformation (Chapter 7). The results from all experimental chapters have been discussed in a broader sense in the general discussion (Chapter 8). The future prospectives and potential challenges in the genetical metabolomics are also highlighted. The approaches we developed in the current thesis could be used not only for developing potentially a more healthy and improved apple but can also be applied for the genetical metabolomics studies in other important crops.
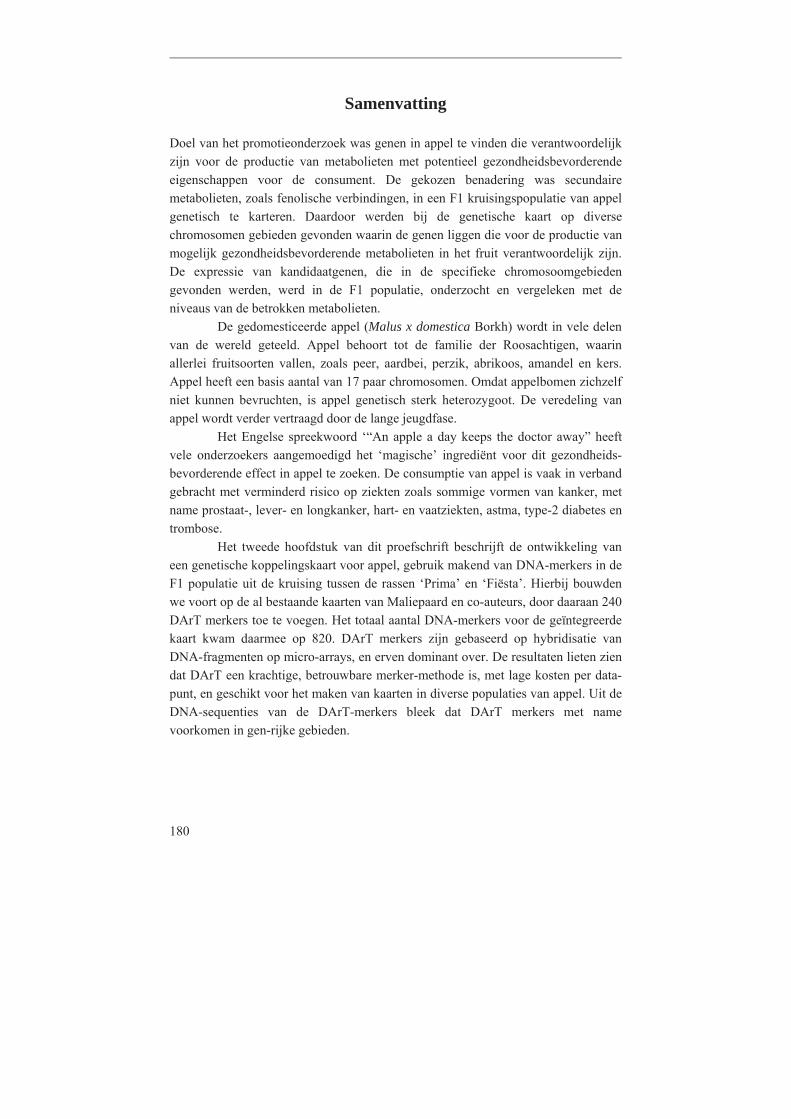
180
Samenvatting Doel van het promotieonderzoek was genen in appel te vinden die verantwoordelijk zijn voor de productie van metabolieten met potentieel gezondheidsbevorderende eigenschappen voor de consument. De gekozen benadering was secundaire metabolieten, zoals fenolische verbindingen, in een F1 kruisingspopulatie van appel genetisch te karteren. Daardoor werden bij de genetische kaart op diverse chromosomen gebieden gevonden waarin de genen liggen die voor de productie van mogelijk gezondheidsbevorderende metabolieten in het fruit verantwoordelijk zijn. De expressie van kandidaatgenen, die in de specifieke chromosoomgebieden gevonden werden, werd in de F1 populatie, onderzocht en vergeleken met de niveaus van de betrokken metabolieten.
De gedomesticeerde appel (Malus x domestica Borkh) wordt in vele delen van de wereld geteeld. Appel behoort tot de familie der Roosachtigen, waarin allerlei fruitsoorten vallen, zoals peer, aardbei, perzik, abrikoos, amandel en kers. Appel heeft een basis aantal van 17 paar chromosomen. Omdat appelbomen zichzelf niet kunnen bevruchten, is appel genetisch sterk heterozygoot. De veredeling van appel wordt verder vertraagd door de lange jeugdfase.
Het Engelse spreekwoord ‘“An apple a day keeps the doctor away” heeft vele onderzoekers aangemoedigd het ‘magische’ ingrediënt voor dit gezondheids-bevorderende effect in appel te zoeken. De consumptie van appel is vaak in verband gebracht met verminderd risico op ziekten zoals sommige vormen van kanker, met name prostaat-, lever- en longkanker, hart- en vaatziekten, astma, type-2 diabetes en trombose.
Het tweede hoofdstuk van dit proefschrift beschrijft de ontwikkeling van een genetische koppelingskaart voor appel, gebruik makend van DNA-merkers in de F1 populatie uit de kruising tussen de rassen ‘Prima’ en ‘Fiësta’. Hierbij bouwden we voort op de al bestaande kaarten van Maliepaard en co-auteurs, door daaraan 240 DArT merkers toe te voegen. Het totaal aantal DNA-merkers voor de geïntegreerde kaart kwam daarmee op 820. DArT merkers zijn gebaseerd op hybridisatie van DNA-fragmenten op micro-arrays, en erven dominant over. De resultaten lieten zien dat DArT een krachtige, betrouwbare merker-methode is, met lage kosten per data-punt, en geschikt voor het maken van kaarten in diverse populaties van appel. Uit de DNA-sequenties van de DArT-merkers bleek dat DArT merkers met name voorkomen in gen-rijke gebieden.
Samenvatting
181
Hoofdstuk 3 beschrijft de diversiteit van metabolieten in Malus. Wild materiaal werd vergeleken met elite veredelingsmateriaal en de F1 populatie van ‘Prima’ X ‘Fiësta’. De metabolietensamenstelling werd geanalyseerd met behulp van een combinatie van scheiding door chromatografie en massa spectometrie (LC- MS). Dit resulteerde in de detectie van 418 metabolieten in de schil en 254 in het vruchtvlees.
Appels van 23 wilde soorten, acht geavanceerde veredelingsselecties, en de F1 populatie werden geanalyseerd. De data werden geanalyseerd met Principale Componenten Analyse (PCA). Variantieanalyse van de eerste principale component liet zien dat de technische variatie zich beperkte tot 1,4 % en 0,8 % in respectievelijk schil en vruchtvlees. De milieuvariatie tussen bomen van hetzelfde genotype was 2 %. De resterende 97 % van de variatie in de eerste principale component kon verklaard worden door genetische verschillen tussen genotypen. Van deze genetische variatie was slechts 8 % aanwezig in de elite-selecties. Dit wijst erop dat er een sterke genetische verarming heeft plaats gevonden tijdens de veredeling. Deze genetische erosie bleek met name uit reductie van gehaltes van diverse flavonoïden, zoals catechine, epicatechine en procyanidine.
De PCA van de F1 populatie liet een duidelijke Mendeliaaanse 3:1 uitsplitsing zien voor een groep metabolieten. Deze metabolieten waren een factor 4.2 verlaagd in nakomelingen die alleen de recessieve allelen hadden geërfd van een gen dat bij de top van chromosoom 16 gelokaliseerd is.
Verder vonden we een andere groep van 11 metabolieten in de schil en 12 in het vruchtvlees, behorend tot geglycosyleerde vormen van vluchtige alcoholen: R-octaan-1, 3-diol en de onverzadigde vorm R-5-(Z)-octene-1, 3-diol. Deze stoffen spelen een rol bij afweer tegen micro-organismen, en bij het aroma van cider. De gehaltes van deze stoffen liep in sommige nakomelingen tot 50 keer zo hoog op ten opzichte van beide ouders. Genetische kartering liet zien dat een gen bovenin chromosoom 8 verantwoordelijk was voor deze stijging. De stijging trad op in nakomelingen die de recessieve allelen van beide ouders geërfd hadden.
Dit hoofdstuk laat zien dat er niet alleen een sterke genetische erosie heeft plaats gevonden in de appelveredeling, maar ook dat inteelt kan leiden tot een sterke afname of toename in metabolieten ten opzichte van beide ouders. Deze toename en afname trad vooral op als recessieve allelen accumuleerden.
De genetische factoren die verantwoordelijk waren voor de samenstelling van metabolieten, werden nader onderzocht, door de kwantitatieve variatie in metabolieten in de F1-populatie (Hoofdstuk 3) te combineren met de genetische merkerkaart van deze populatie (Hoofdstuk 2). Dit resulteerde in detectie van chromosoomgebieden die verantwoordelijk waren voor verschillen in metabolietgehaltes in de nakomelingen (mQTLs), zoals beschreven in Hoofdstuk 4. Met de software MetaNetwork werden 669 significante mQTLs gevonden: 488 in de
182
schil en 181 in het vruchtvlees. Voor zover wij weten is dit de eerste genetische studie aan zo’n hoog aantal metabolieten in kruisbestuivende plantensoorten. Vier chromosomen (chromosoom 1, 8, 13 en 16) bevatten gebieden met mQTL concentraties, met name voor fenolische verbindingen, zoals sinapoyl hexoside, coumaroyl hexoside, floridzine, kinine zuren, fenolische esters, kaempferol glycosiden, quercetine glycosides, cyanidine pentoside, flavan-3-olen (catechine, epicatechine) en procyanidines. De genetica werd in meer detail onderzocht met JoinMap. Quercetineconjugaten bleken op chromosoom 1 en 13 mQTLs te hebben. Het belangrijkste concentratiegebied van mQTLs lag echter bovenin chromosoom 16: mQTLs voor 32 metabolieten in de schil en 16 metabolieten in het vruchtvlees vielen samen in dit gebied. Deze metabolieten lieten een monogene Mendeliaanse uitsplitsing van 3:1 zien. Alle deze metabolieten bleken te behoren tot de fenylpropanoïde route. Een procyanidine dimeer werd gebruikt als representant van deze metabolieten, voor afbakening van het genetische gebied waarbinnen het oorzakelijke gen voor deze concentratie van mQTLs moet liggen. In dit gebied bleek het structurele gen coderend voor leucoanthocyanidine reductase (MdLAR1) te liggen, evenals zeven transcriptiefactoren.
In Hoofdstuk 5 wordt de expressie beschreven van kandidaatgenen voor de concentratie van mQTLs bovenin chromosoom 16. Procyanidine werd gebruikt als representant van de metabolieten die hier gekarteerd waren. Alleen de expressie van het structurele gen MdLAR1 bleek sterk positief gecorreleerd te zijn met het gehalte aan procyanidine. De expressie van geen enkel ander structureel gen van de fenylpropanoïde route bleek gecorreleerd te zijn met het gehalte aan procyanidine. Evenmin bleek de expressie van transcriptiefactorgenen, noch die binnen het mQTL-gebied, noch die buiten dit gebied, significant geassocieerd te zijn met procyanidine. Dit geeft aan dat MdLAR1 de concentratie van de vele mQTLs op chromosoom 16 heeft veroorzaakt. De nakomelingen met één of twee kopieën van het dominante allel van MdLAR1 (Mm, MM) lieten respectievelijk een 4,4 en 11,8 maal hogere expressie zien van MdLAR1, ten opzichte van de nakomelingen met alleen het recessieve allel (mm). Dit leidde tot een viervoudig hoger gehalte aan procyanidine in rijpe appels.
Opvallend was dat in het gebied van de mQTL concentratie op chromosoom 16 ook een locus werd gevonden voor zuur in rijpe appels. Echter, het dominante allel voor zuur bleek in afstotingsfase te verkeren ten opzichte van het dominante allel voor verhoogde gehaltes voor procyanidine (Hoofdstuk 6). Dit laat zien dat de zuurgraad door een ander gen wordt veroorzaakt dan die voor de hoge procyanidine-niveaus. De combinatie van de genetische positie, de gepubliceerde genoomsequentie van het appelras ‘Golden Delicious’, annotatie van potentiële genen en expressieprofielen van kandidaatgenen, wees erop dat het appelzuurtransportgen MdALMT2 verantwoordelijk was voor de duidelijke
Samenvatting
183
verschillen in appelzuurgehaltes en pH in appels in de F1 populatie. De erfenis van minimaal één dominant allel (MaMa, Mama) van dit gen, was voldoende voor een drievoudige toename van de appelzuurconcentratie en een verlaging van de pH van 4 naar 3 in rijpe appels, ten opzichte van de erfenis van alleen het recessieve allel (mama).
Appelzuur is het belangrijkste zuur in appels. Het wordt geproduceerd in het cytoplasma en wordt getransporteerd naar en opgeslagen in de vacuole. De concentratie van appelzuur beïnvloedt sterk de pH van appels. Verder heeft de pH een sterke invloed op de smaakbeleving van appels. Voor zover wij weten is dit de eerste keer dat de genetische uitsplitsing van de pH gekoppeld is aan een specifiek gen in appel. Verder is dit gen nog niet eerder gekoppeld aan pH van appels of ander fruit. Na kloneren van dit gen kan het worden gebruikt voor een functionele toets door het in rassen met een hoge pH te brengen, of door het gen stil te leggen in zure rassen. De kennis kan nu al toegepast worden door een allel-specifieke merker te ontwikkelen voor merkergestuurde selectie. Op basis van deze merkerinformatie zouden nakomelingen al in het zaailingstadium kunnen worden geselecteerd op zuurgraad van de appels, die pas vijf of meer jaren later aan de bomen zouden gaan groeien. Dit kan een forse tijdwinst opleveren in de selectie.
In een andere studie (Hoofdstuk 7) werd een dominant gemuteerd allel van het MdMYB10 gen uit appel met de eigen natuurlijke promoter, coderende sequentie en terminator in appel, aardbei en aardappel gebracht door middel van transformatie. Dit mutante allel induceert productie van de rode stof anthocyaan in de gehele plant bij appel, al vanaf de transformatie. Met dit experiment wilden we nagaan of MdMYB10 gebruikt kan worden als visuele selectiemerker voor getransformeerde regeneranten, als alternatief voor selectiemerkers zoals het kanamycine-resistentiegen. Na transformatie werd de kleur van het callus, de scheuten en groeiende planten beoordeeld. Rode en groene scheuten werden getoetst op aanwezigheid van het MdMYB10 gen met behulp van PCR analyse. Alle rode scheuten van appel hadden het MdMYB10 gen, maar niet in alle groene appelscheuten ontbrak dit gen. In aardbei bleek het MdMYB10 gen ook te leiden tot roodverkleuring, ondanks dat dit gen uit appel afkomstig was. In aardappel was geen roodverkleuring zichtbaar. Echter, extractie met zure methanol van aardappelscheuten en –wortels liet zien dat planten met het MdMYB10 gen een viermaal hoger anthocyaangehalte hadden dan de controleplanten van aardappel. Daarom kan worden geconcludeerd dat het MdMYB10-gen gebruikt kan worden als visuele selectiemerker in appel, aardbei en aardappel. In appel kan het dienen als cisgene selectiemerker.

184
De resultaten van de experimentele hoofdstukken worden in een breder kader besproken in de Algemene Discussie (Hoofdstuk 8). De perspectieven en uitdagingen van ‘genetical metabolomics’ worden er bediscussieerd. De benaderingen die in dit promotieonderzoek zijn ontwikkeld zijn niet alleen toepasbaar voor mogelijke ontwikkeling van nieuwe appelrassen of verhoging van gehaltes aan gezondsheidsbevorderende metabolieten in bestaande appelrassen, maar kunnen ook worden toegepast in ‘genetical metabolomics’ bij andere belangrijke gewassen.
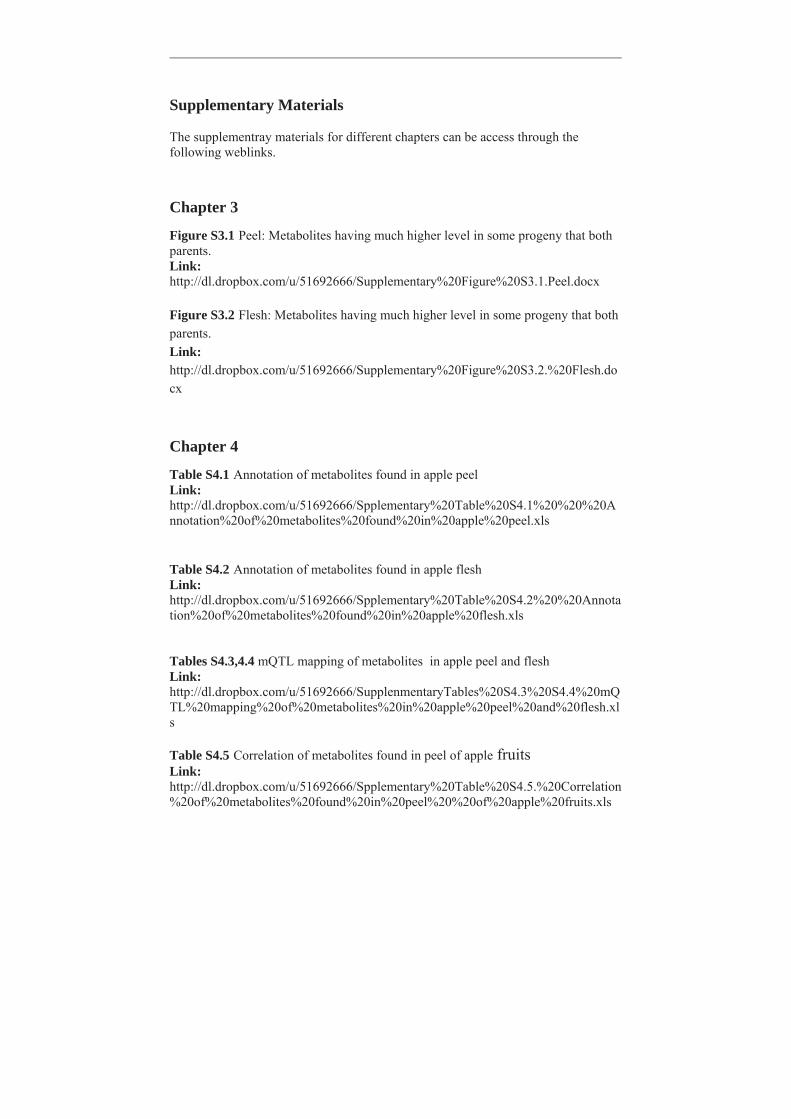
Supplementary Materials The supplementray materials for different chapters can be access through the following weblinks.
Chapter 3
Figure S3.1 Peel: Metabolites having much higher level in some progeny that both parents. Link: http://dl.dropbox.com/u/51692666/Supplementary%20Figure%20S3.1.Peel.docx Figure S3.2 Flesh: Metabolites having much higher level in some progeny that both parents. Link: http://dl.dropbox.com/u/51692666/Supplementary%20Figure%20S3.2.%20Flesh.docx
Chapter 4
Table S4.1 Annotation of metabolites found in apple peel Link: http://dl.dropbox.com/u/51692666/Spplementary%20Table%20S4.1%20%20%20Annotation%20of%20metabolites%20found%20in%20apple%20peel.xls Table S4.2 Annotation of metabolites found in apple flesh Link: http://dl.dropbox.com/u/51692666/Spplementary%20Table%20S4.2%20%20Annotation%20of%20metabolites%20found%20in%20apple%20flesh.xls Tables S4.3,4.4 mQTL mapping of metabolites in apple peel and flesh Link: http://dl.dropbox.com/u/51692666/SupplenmentaryTables%20S4.3%20S4.4%20mQTL%20mapping%20of%20metabolites%20in%20apple%20peel%20and%20flesh.xls Table S4.5 Correlation of metabolites found in peel of apple fruits Link: http://dl.dropbox.com/u/51692666/Spplementary%20Table%20S4.5.%20Correlation%20of%20metabolites%20found%20in%20peel%20%20of%20apple%20fruits.xls
Table S4.6 Correlation of metabolites found in flesh of apple fruits Link: http://dl.dropbox.com/u/51692666/Supplementary%20Table%20%20S4.6.%20Correlation%20of%20metabolites%20found%20in%20flesh%20of%20apple%20fruits.xls Table S4.7 Additional simple sequence repeats (SSR) loci tested for LG16 Link: http://dl.dropbox.com/u/51692666/Supplementary%20Table%20S4.7.%20Additional%20simple%20sequence%20repeats%20%28SSR%29%20loci%20tested%20for%20LG16.doc Chapter 5 Table S5.1 Genotypes used for measuring relative expression of phenylpropanoid pathway genes and the candidate genes in the mQTL hotspot. Average sizes of eight fruits per tree of genotype are also given at each stage. Link: http://dl.dropbox.com/u/51692666/Supplementary%20Table%20S5.1%20Genotypes%20used%20for%20measuring%20relative%20expression%20of%20phenylpropanoid%20pathway%20genes.docx Table S5.2 Correlations between the expression levels of the transcription factor genes that were detected in the mQTL hotspot Link: http://dl.dropbox.com/u/51692666/Table%20S5.2%20Correlation%20between%20relative%20expression%20of%20diffreent%20genes%20of%20the%20phenypropanoid%20pathway.xlsx Chapter 6 Table S6.1 Genotypes used for measuring malic acid content and expression of three candidate genes. Average sizes of eight fruits per tree of a genotype are given at each stage. The malic acid content has been normalized to ribitol. Link: http://dl.dropbox.com/u/51692666/Supplementary%20Table%20%20S6.1%20Genotypes%20used%20for%20measuring%20malic%20acid%20content%20and%20gene%20expression.docx
Acknowledgements
It was January, 2007, when I came to know that my utmost ambition and desire of doing PhD from an abroad well-known and advanced University in the form of Wageningen University can turn into reality. It is still very fresh in my memory when I received the PhD offer letter from Wageningen University and started my PhD on 19th October, 2007. Time flies like an arrow and it has been already now more than four years.
Many people however, have great contributions in fulfilling this dream of mine. I am very thankful to my supervisor Prof. Dr Evert Jacobsen for his all-time guidance. Dear Evert! you were the very first person who responded to my email mentioning I am interested in doing PhD in the Department of Plant Breeding. You forwarded that to Dr. Henk Schouten who was probably on holidays at that moment. Finally I received an offer letter from Henk that he is interested in my stay doing PhD in apple group. Thus the first official tie was made.
Dear Dr. Henk, my co-supervisor, I am very thankful for your support. I was very pleased when I received the first phone call from you but we could not properly communicate and then you sent me an email about my possible PhD in Wageningen. After all the official things done, I arrived in the Netherlands at the time when you were still sleeping. You were certainly surprised by my call. Thanks that you came and picked me up from the airport. You always encouraged me during my research and replied all my emails immediately. I am extremely thankful for all your technical guidance and support throughout my PhD. You also helped me in bringing my wife to Wageningen. Indeed I am thankful to you for that as well. I am also very thankful to my external supervisor Prof. Dr. Linus van der Plas for his useful discussions during my PhD research. I want to extend my acknowledgements and thanks to Prof. Dr. Richard Visser, head of the Department of Plant Breeding for giving me the opportunity to do PhD in his department. I always found it very convenient to talk to you and to settle any departmental issue. I am also very thankful to Dr. Rene Smulders, the group leader for research group of biodiversity and genetic variation, for his all times encouragement and the useful discussions during my PhD period. I enjoyed my time being part of this research group. Thanks to all the members of this group.
Many thanks to the secretariat of Plant Breeding consists of Annie, Letty, Janneke, Nicole and the former secretary Mariame Gada for their help in the administrative work. Special thanks to Annie for her help during my arrangements for conferences and courses.
I would like to thank all my colleagues in apple group namely, Dr. Frans Krens, Dr. Jan Schaart, Aranka, Iris, Jos, Miguel, Jaap Wolters, Dina, and Stefano. Dr. Jan and Dr. Frans!! I am really thankful to both of you for all those stimulating discussions and the encouragement that I got during our regular group meetings. I would also like to thank other colleagues who worked in the same group before namely Dr. Anne Kortstee, Carin, and Sameer Joshi. Dr. Anne! I am very thankful to you for your help during my first year of PhD.
Many thanks to people who were directly or indirectly involved in my work. They include Dr Eric van de Weg, Dr. Richard Finkers, Dr. Arnaud Bovy, Dr. Chris Maliepaard, Dr. Yury, Pierre, Dr. Jules Beekwilder, Dr. Ric de Vos, Dr. Ton de Nijs, Dr. Roland, and Remmelt. Many other persons who were not involved in my work but always encouraged me during my stay, they include Jaap van Tuyl, Geertjan de Klerk, Dirkjan Huigen, Jan de Boer and many others.
I found myself in a research conducive environment in the laboratory and had a good time with many lab technicians. They include Marian Ootwijn, Herma, Iris, Johan Bucher, Aranka, Yolanda, Linda, Fien, Irma, Harry, Marjan Bergervoet, Alex and Christel Denneboom.
I am thankful to my office mates Thijs van Dijk and Dr. Henk Schouten. Thanks to both of you for all your useful discussions and also for the humorous moments that I shared with you. Thijs!!! I found you always very patient and willing to discuss things, things related to research and things of general interest. Thanks to your famous dish ‘RATATOI’ that once you and your wife offered to us.
Thanks to all the collaborators namely INOVA Fruit B.V., people at IASMA in Italy, and Andy and Roger Hellens at Horticultural Research in New Zealand. Special thanks to Higher Education Commission (HEC) of Pakistan for my fellowship funding and Netherlands Organisation for International Cooperation in Higher Education (NUFFIC) for handling all the administrative and financial matters during my PhD period.
I enjoyed my time in a very internationalised community both in and outside the department. I am thankful to all international friends and colleagues such as Anitha, Madhuri, Sharmistha, Animesh, Paula, Cesar, Antoine, Ali Reza, Suxian, Vani, Nasim, Arwa, Reza Aghnoum, Yuni, Ram Kumar Basnat, Yusuf, Loius, Heba, Bjorn Klosterman, Bjorn Dhoop, Weicong, Xi, Jan Uitdewilligen, Maria, Xing Feng, Christos, Peter, Freddy, Manoj, Susana, and Junfei Gu.
Special thanks to Jos Brinkhuis and Madhuri Madduri for accepting my invitation to be my paranymphs during my Defence.
I really had a good time with my Pakistani friends who made my stay in Wageningen extremely easy and enjoyable. They include Nazir Ahmed Khan and family, Muhammad Sohail Khan, Noorullah Khan, Jamil Bhai and family, Farrakh Bhai and family, Sajid Bhai and family, Nadeem Khan, Sohail Cute, Saad, Sultan
Acknowledgements
Mahmood and family, Zeshan, Imtiaz, Mustafa, Ghulam Abbas, Masood Awan, Mazhar Ali, Mazhar Iqbal, Muhammad Mazhar, Hamid, Luqman, Muhammad Ali, Ghulam Ali, Mateen Sahib, Imran, Rashid, Kashif, Abid Maan, Akmal Nazir, Farooq, and Abbas Gul. I will remember for ever all the parties and the celebrations that I enjoyed with you all. I also would like to extend my thanks to all the Afghan friends, namely Dr. Fareed Uddin, Wasil, Habib, Ezzat Ullah, Rahat Ullah, Khalid, Kamran, Shakir and many others and also friends outside Wageningen including Dr. Irshad, Sohail Yousaf, Sadeeq, Hazrat Ali, Zia, Khursheed, Faraz, Zahid Butt and Faisal Nadeem.
I am also thankful to my friends outside the Netherlands who continuously helped and encouraged me throughout my PhD. They include Niamat Khan, Meraj Ali, Saeedullah, Zahid Usman, Hazrat Umar, Abdul Qayyum, Minhaj, Tariq, Fakhar ul Islam, Zahid Hanif, Younas, Sir Ijaz and Shakir Afridi.
I am extremely thankful to my family and relatives including my beloved parents, brothers, sisters, nephews, nieces, uncles, aunts and cousins for their continuous support and good wishes throughout my studies. Thanks to my eldest brother Farid Gul who took up the responsibility in the very earlier age and looked after me and my other brothers and sisters to the best of his efforts despite the limited resources. Special thanks to my parents who always take care of me and supported me in every sphere of life to the best that they can. My sweet MOTHER!!! I will always remember your words of encouragement. You always supported me and made everything apparently much easier for me. I enjoyed all the phone calls with you especially during my weekends. I am especially very thankful to my wife for her full support, patience, undersatnding and encouragement during my PhD study.
Last but not the least, I would like to extend my thankfulness to all those who have helped me in one way or the other and I forgot to mention them by name.
Finally thanks GOD for giving me the strength to complete my PhD studies in due time course and with good health. Sabaz Ali Khan
Wageningen University
12th January, 2012

About the author
Sabaz Ali Khan was born on 10th April, 1981 in Nowshera, Khyber-Pakhtunkhwa, Pakistan. He received his Bachelor degree in Agriculture from Khyber-Pakhtunkhwa Agricultural University Peshawar, Pakistan in 2004. He obtained his M.Phil. in Plant Physiology from Quaid-i-Azam University Islamabad, Pakistan in 2006. He worked as research officer from 2006-2007 in the Agricultural Biotechnology Institute (ABI), National Agricultural Research Centre (NARC), Islamabad, Pakistan. He started his PhD research in 2007 at the Department of Plant Breeding, Plant Research International (PRI), Wageningen University and Research Centre under the supervision of Prof. Dr. Ir. Evert Jacobsen and Dr. Ir. Henk J. Schouten. In his PhD he worked on “Genetical metabolomics in apples (Malus x domestica Borkh)” which resulted in the outcome of this thesis.
Publications A. J. Kortstee, S. A. Khan, C. Helderman, L. M. Trindade, Y. Wu, R. G. F. Visser, C. Brendolise , and A. Allan, H. J. Schouten and E. Jacobsen. Anthocyanin production as a potential visual selection marker during plant transformation. Transgenic Res (2011) 20:1253–1264. Henk J. Schouten, W. Eric van de Weg, Jason Carling, Sabaz Ali Khan, Steven J. McKay, Martijn P. W. van Kaauwen, Alexander H. J. Wittenberg, Herma J. J. Koehorst-van Putten, Yolanda Noordijk, Zhongshan Gao, D. Jasper G. Rees, Maria M. Van Dyk, Damian Jaccoud, Michael J. Considine and Andrzej Kilian. Diversity arrays technology (DArT) markers in apple for genetic linkage maps. Mol Breeding: DOI 10.1007/s11032-011-9579-5
Submitted Sabaz Ali Khan, Pierre-Yves Chibon, Ric C.H. de Vos, Bert A. Schipper, Evert Walraven, Jules Beekwilder, Thijs van Dijk, Richard Finkers, R.G.F Visser, Eric W. van de Weg, Arnaud Bovy, Alessandro Cestaro, Riccardo Velasco, Evert Jacobsen and Henk J. Schouten. Genetical metabolomics in apple indicates an mQTL hotspot for phenolic compounds on Linkage Group 16. Sabaz Ali Khan, Jules Beekwilder, Jan G. Schaart, Roland Mumm, Evert Jacobsen and Henk J. Schouten. Differences in acidity of mature apples are mainly caused by a malic acid transporter gene on LG16. In preparation Sabaz Ali Khan, Yury Tikunov, Pierre-Yves Chibon, Chris Maliepaard, Jules Beekwilder, Evert Jacobsen and Henk J. Schouten. Loss and gain of metabolites during apple breeding. Sabaz Ali Khan, Jan G. Schaart, Jules Beekwilder, Andrew C. Allan, Evert Jacobsen and Henk J. Schouten. The leucoanthocyanidin reductase gene causes an mQTL hotspot on LG16 for phenolic compounds in apple fruits.
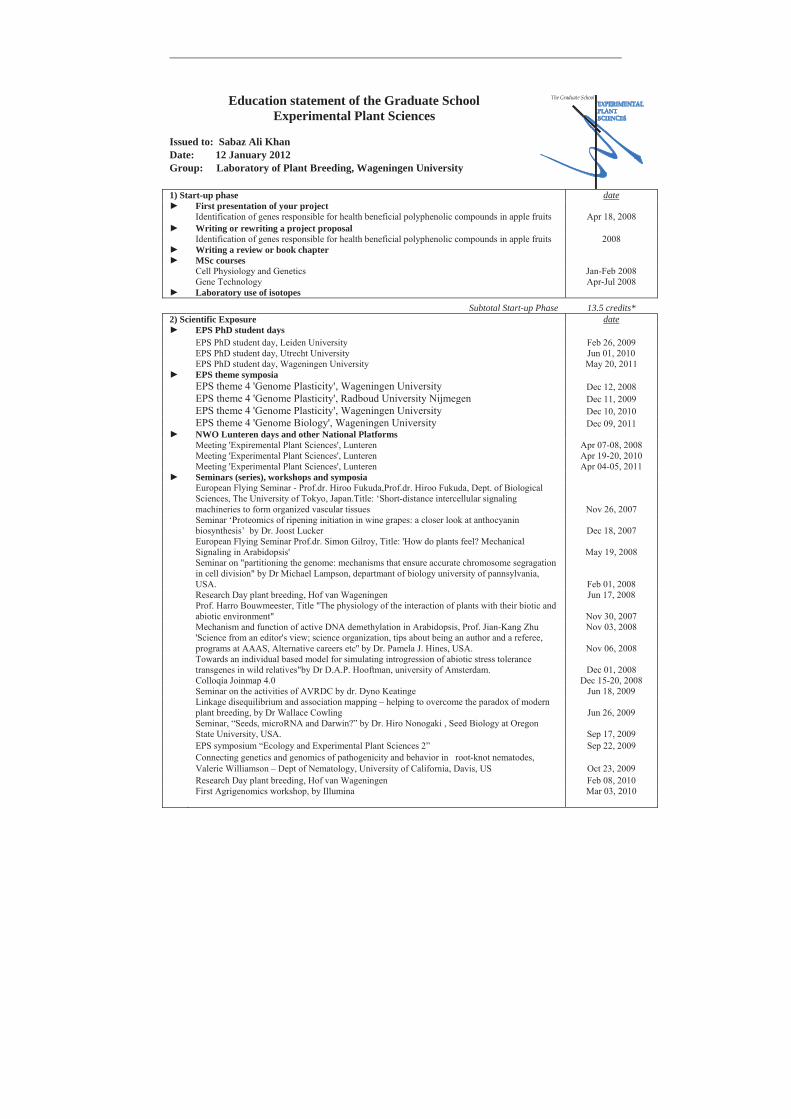
Education statement of the Graduate School Experimental Plant Sciences
Issued to: Sabaz Ali Khan
Date: 12 January 2012 Group: Laboratory of Plant Breeding, Wageningen University 1) Start-up phase date
First presentation of your project Identification of genes responsible for health beneficial polyphenolic compounds in apple fruits Apr 18, 2008
Writing or rewriting a project proposal Identification of genes responsible for health beneficial polyphenolic compounds in apple fruits 2008
Writing a review or book chapter MSc courses
Cell Physiology and Genetics Jan-Feb 2008 Gene Technology Apr-Jul 2008
Laboratory use of isotopes
Subtotal Start-up Phase 13.5 credits* 2) Scientific Exposure date
EPS PhD student days EPS PhD student day, Leiden University Feb 26, 2009 EPS PhD student day, Utrecht University Jun 01, 2010 EPS PhD student day, Wageningen University May 20, 2011
EPS theme symposia EPS theme 4 'Genome Plasticity', Wageningen University Dec 12, 2008 EPS theme 4 'Genome Plasticity', Radboud University Nijmegen Dec 11, 2009 EPS theme 4 'Genome Plasticity', Wageningen University Dec 10, 2010 EPS theme 4 'Genome Biology', Wageningen University Dec 09, 2011
NWO Lunteren days and other National Platforms Meeting 'Expiremental Plant Sciences', Lunteren Apr 07-08, 2008 Meeting 'Experimental Plant Sciences', Lunteren Apr 19-20, 2010 Meeting 'Experimental Plant Sciences', Lunteren Apr 04-05, 2011
Seminars (series), workshops and symposia
European Flying Seminar - Prof.dr. Hiroo Fukuda,Prof.dr. Hiroo Fukuda, Dept. of Biological Sciences, The University of Tokyo, Japan.Title: ‘Short-distance intercellular signaling machineries to form organized vascular tissues Nov 26, 2007
Seminar ‘Proteomics of ripening initiation in wine grapes: a closer look at anthocyanin biosynthesis’ by Dr. Joost Lucker Dec 18, 2007
European Flying Seminar Prof.dr. Simon Gilroy, Title: 'How do plants feel? Mechanical Signaling in Arabidopsis' May 19, 2008
Seminar on "partitioning the genome: mechanisms that ensure accurate chromosome segragation in cell division" by Dr Michael Lampson, departmant of biology university of pannsylvania, USA. Feb 01, 2008
Research Day plant breeding, Hof van Wageningen Jun 17, 2008
Prof. Harro Bouwmeester, Title "The physiology of the interaction of plants with their biotic and abiotic environment" Nov 30, 2007
Mechanism and function of active DNA demethylation in Arabidopsis, Prof. Jian-Kang Zhu Nov 03, 2008
'Science from an editor's view; science organization, tips about being an author and a referee, programs at AAAS, Alternative careers etc'' by Dr. Pamela J. Hines, USA. Nov 06, 2008
Towards an individual based model for simulating introgression of abiotic stress tolerance transgenes in wild relatives"by Dr D.A.P. Hooftman, university of Amsterdam. Dec 01, 2008
Colloqia Joinmap 4.0 Dec 15-20, 2008 Seminar on the activities of AVRDC by dr. Dyno Keatinge Jun 18, 2009
Linkage disequilibrium and association mapping – helping to overcome the paradox of modern plant breeding, by Dr Wallace Cowling Jun 26, 2009
Seminar, “Seeds, microRNA and Darwin?” by Dr. Hiro Nonogaki , Seed Biology at Oregon State University, USA. Sep 17, 2009
EPS symposium “Ecology and Experimental Plant Sciences 2” Sep 22, 2009
Connecting genetics and genomics of pathogenicity and behavior in root-knot nematodes, Valerie Williamson – Dept of Nematology, University of California, Davis, US
Oct 23, 2009
Research Day plant breeding, Hof van Wageningen Feb 08, 2010 First Agrigenomics workshop, by Illumina Mar 03, 2010
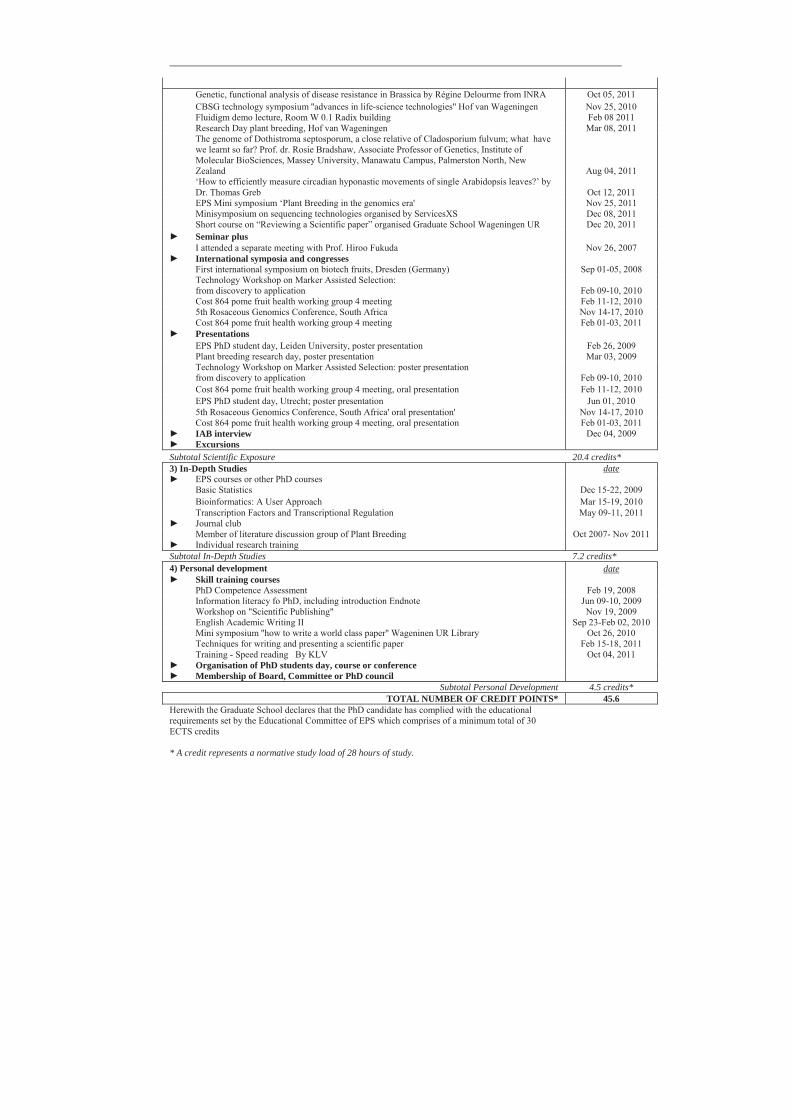
Genetic, functional analysis of disease resistance in Brassica by Régine Delourme from INRA Oct 05, 2011 CBSG technology symposium ''advances in life-science technologies'' Hof van Wageningen Nov 25, 2010 Fluidigm demo lecture, Room W 0.1 Radix building Feb 08 2011 Research Day plant breeding, Hof van Wageningen Mar 08, 2011
The genome of Dothistroma septosporum, a close relative of Cladosporium fulvum; what have we learnt so far? Prof. dr. Rosie Bradshaw, Associate Professor of Genetics, Institute of Molecular BioSciences, Massey University, Manawatu Campus, Palmerston North, New Zealand Aug 04, 2011
‘How to efficiently measure circadian hyponastic movements of single Arabidopsis leaves?’ by Dr. Thomas Greb Oct 12, 2011
EPS Mini symposium ‘Plant Breeding in the genomics era' Nov 25, 2011 Minisymposium on sequencing technologies organised by ServicesXS Dec 08, 2011 Short course on “Reviewing a Scientific paper” organised Graduate School Wageningen UR Dec 20, 2011
Seminar plus I attended a separate meeting with Prof. Hiroo Fukuda Nov 26, 2007
International symposia and congresses First international symposium on biotech fruits, Dresden (Germany) Sep 01-05, 2008
Technology Workshop on Marker Assisted Selection: from discovery to application Feb 09-10, 2010
Cost 864 pome fruit health working group 4 meeting Feb 11-12, 2010 5th Rosaceous Genomics Conference, South Africa Nov 14-17, 2010 Cost 864 pome fruit health working group 4 meeting Feb 01-03, 2011
Presentations EPS PhD student day, Leiden University, poster presentation Feb 26, 2009 Plant breeding research day, poster presentation Mar 03, 2009
Technology Workshop on Marker Assisted Selection: poster presentation from discovery to application Feb 09-10, 2010
Cost 864 pome fruit health working group 4 meeting, oral presentation Feb 11-12, 2010 EPS PhD student day, Utrecht; poster presentation Jun 01, 2010 5th Rosaceous Genomics Conference, South Africa' oral presentation' Nov 14-17, 2010 Cost 864 pome fruit health working group 4 meeting, oral presentation Feb 01-03, 2011
IAB interview Dec 04, 2009 Excursions
Subtotal Scientific Exposure 20.4 credits* 3) In-Depth Studies date
EPS courses or other PhD courses Basic Statistics Dec 15-22, 2009 Bioinformatics: A User Approach Mar 15-19, 2010 Transcription Factors and Transcriptional Regulation May 09-11, 2011
Journal club Member of literature discussion group of Plant Breeding Oct 2007- Nov 2011
Individual research training Subtotal In-Depth Studies 7.2 credits* 4) Personal development date
Skill training courses PhD Competence Assessment Feb 19, 2008 Information literacy fo PhD, including introduction Endnote Jun 09-10, 2009 Workshop on "Scientific Publishing" Nov 19, 2009 English Academic Writing II Sep 23-Feb 02, 2010 Mini symposium ''how to write a world class paper'' Wageninen UR Library Oct 26, 2010 Techniques for writing and presenting a scientific paper Feb 15-18, 2011 Training - Speed reading By KLV Oct 04, 2011
Organisation of PhD students day, course or conference Membership of Board, Committee or PhD council
Subtotal Personal Development 4.5 credits* TOTAL NUMBER OF CREDIT POINTS* 45.6
Herewith the Graduate School declares that the PhD candidate has complied with the educational requirements set by the Educational Committee of EPS which comprises of a minimum total of 30 ECTS credits * A credit represents a normative study load of 28 hours of study.
This research was carried out at the Department of Plant Breeding, Wageningen UR and was financially supported by Higher Education Commission (HEC) of Pakistan and INOVA Fruit B.V., the Netherlands. Printing of this thesis was made possible in part by a financial contribution of ‘ het Fonds BVL”. Thesis layout: by the author Thesis cover design: by Akmal Nazir and the author Printed by: Wöhrmann Print service, Zutphen, The Netherlands