Embed Size (px)
Citation preview

ORIGINAL PAPER
Construction of a dense genetic linkage map for applerootstocks using SSRs developed from Malus ESTs and Pyrusgenomic sequences
J.-M. Celton & D. S. Tustin & D. Chagné & S. E. Gardiner
Received: 17 October 2007 /Revised: 7 April 2008 /Accepted: 27 May 2008 / Published online: 2 August 2008# Springer-Verlag 2008
Abstract Marker-assisted selection (MAS) offers quickand reliable prediction of the phenotypes of seedlings inlarge populations and thus opens new approaches forselection to breeders of apple (Malus x domestica Borkh.).The development of framework maps enables the discoveryof genetic markers linked to desired traits. Although geneticmaps have been reported for apple scion cultivars, none haspreviously been constructed for apple rootstocks. We reportthe construction of framework genetic maps in a crossbetween ‘M.9’ (‘Malling 9’) and ‘R.5’ (‘Robusta 5’) applerootstocks. The maps comprise 224 simple sequence repeat(SSR) markers, 18 sequence-characterised amplifiedregions, 14 single nucleotide polymorphisms and 42random amplified polymorphic DNAs. A new set of 47polymorphic SSRs was developed from apple EST sequen-ces and used for construction of this rootstock map. All 17linkage groups have been identified and aligned to existingapple genetic maps. The maps span 1,175.7 cM (‘M.9’) and1,086.7 cM (‘R.5’). To improve the efficiency of mappingmarkers to this framework map, we developed a binmapping set. Applications of these new genetic mapsinclude the elucidation of the genetic basis of the dwarfingeffect of the apple rootstock ‘M.9’ and the analysis of
disease and insect resistance traits such as fire blight(Erwinia amylovora), apple scab (Venturia inaequalis) andwoolly apple aphid (Eriosoma lanigerum). Markers fortraits mapped in this population will be of direct use toapple breeders for MAS and for identification of causativegenes by map-based cloning.
Keywords Apple . Genetic map . SSR .Molecular markers .
EST
Introduction
The cultivated apple (Malus x domestica Borkh.) is fourthin the global fruit market with more than 62.4 millionmetric tonnes produced every year (FAO 2005) and can beconsidered as one of the most economically importanttemperate fruit crops. To maintain this position, the demandfor new apple rootstock cultivars that confer desirable traitssuch as specific architectural and physiological charactersfor ease of orchard management, superior fruit quality anddisease and pest resistances needs to be addressed.However, direct selection for the majority of these traitscannot be carried out before several years of growth aftergrafting, which results in a long generation time. If priorknowledge of linkage relationships between marker lociand these characteristics were available, undesirable indi-viduals could be eliminated from progeny populations byusing marker-assisted selection (MAS). High-qualitygenetic linkage maps that enable the study of wholegenome structure and the localisation of genes of interestand permit the detection and analysis of quantitative traitloci (QTLs; Tanksley et al. 1989) are an essential tool forbreeders who want to use MAS. Although several high-density linkage maps have been constructed for apple
Tree Genetics & Genomes (2009) 5:93–107DOI 10.1007/s11295-008-0171-z
Communicated by O. Savolainen
J.-M. Celton :D. Chagné : S. E. Gardiner (*)Horticulture and Food Research Institute of New Zealand Ltd,Palmerston North Research Center,Private Bag 11030,Palmerston North 4442, New Zealande-mail: [email protected]
D. S. TustinHorticulture and Food Research Institute of New Zealand Ltd,Hawkes Bay Research Center,Private Bag 1401,Havelock North 4157, New Zealand
(Maliepaard et al. 1998; Liebhard et al. 2003; Calenge et al.2005; Silfverberg-Dilworth et al. 2006; Kenis andKeulemans 2005), these have all been developed fromscion cultivars or selections. Despite the crucial influenceapple rootstocks have on tree architecture and physiology,fruit quality and disease resistance, no genetic map hasbeen developed for them until now.
One feature of published apple maps is the presence ofsimple sequence repeat (SSR) markers. In apple as in otherplants, SSRs are abundant and generally uniformly distrib-uted in the genome (Morgante et al. 2002). SSRs are verypolymorphic due to the high mutation rate affecting thenumber of repeats (Hemmat et al. 2003), and they are co-dominant. More than 300 SSR markers have already beendeveloped and mapped in apple (Guilford et al. 1997;Gianfranceschi et al. 1998; Liebhard et al. 2002; Silfverberg-Dilworth et al. 2006) as well as in other species of theRosaceae family, such as pear (Pyrus communis; Yamamotoet al. 2002a, b, c; Yamamoto 2007; Oddou-Muratorio et al.2001; Fernández-Fernández et al. 2006), peach (Prunuspersica; Dirlewanger et al. 2002; Sosinski et al. 2000;Testolin et al. 2000), cherry (Sosinski et al. 2000) andraspberry (Graham et al. 2004).
Because they are based on sequence-specific polymerasechain reaction (PCR) amplification, SSRs are transferablebetween genetic maps within the same species and can beused as orthologous markers between species. For instance,apple SSRs were successfully used as DNA markers in pear(Yamamoto et al. 2001; van Dyk et al. 2005). However,very few SSRs developed from pear have been mapped inapple (Silfverberg-Dilworth et al. 2006), and as thesespecies are closely related, pear SSRs represent a consid-erable potential source of markers that have not beenexploited for apple genetic studies.
In the past few years, several sequencing projects haveproduced more than 250,000 expressed sequence tags(ESTs) for apple (Newcomb et al. 2006; Naik et al. 2006).SSRs associated with these sequences constitute a largeresource of markers that have remained largely unexploited.Moreover, as EST-based SSRs are located in conservedcoding regions, they are often more transferable betweenspecies (Decroocq et al. 2003) than SSRs from genomicsequences.
The investment needed to construct a genetic map can beconsiderable, as it requires the analysis of hundreds ofmarkers over a relatively large number of plants and addingnew markers increases this development cost. In order toincorporate new markers onto an existing genetic map, withreduced genotyping costs but still keeping a high accuracy,a strategy named bin mapping, or selective mapping, wasdeveloped (Vision et al. 2000). This method is based on theselection of a specific set of highly informative seedlingschosen for the number and position of crossover sites. The
development of bin mapping requires the preliminaryconstruction of a framework map (Vision et al. 2000).Once this has been obtained, bin mapping can be used toadd new markers, such as has been done in peach (Howadet al. 2005), wheat (Johnson et al. 2007) and melon(Monforte et al. 2007). Despite the advantages of efficiencyand cost saving that this method conveys, it has notpreviously been reported in apple.
The purpose of our study was to generate genetic mapsfor the two apple rootstocks ‘Malling 9’ (‘M.9’) and‘Robusta 5’ (‘R.5’). ‘M.9’ rootstock, also known as ‘Jaunede Metz’, is the most commonly used rootstock throughoutthe world because of its exceptional physiological charac-teristics, such as its capacity to dwarf the scion (Websterand Wertheim 2003). The second parent, ‘Robusta 5’, is avigorous rootstock that is resistant to several pests anddiseases, such as woolly apple aphid (Eriosoma lanigerumHausm.; Bus et al. 2008) and fire blight [Erwiniaamylovora (Burrill)] (Aldwinckle and Beer 1979). Parentalmaps were constructed using published SSR markers fromapple and pear as well as newly developed SSR markersderived from apple ESTs. By comparing these maps withother apple and with pear maps, homologous linkagegroups were identified. Finally, a bin mapping set wasdeveloped to improve the efficiency of mapping newmarkers on the initial framework map.
Materials and methods
Plant material and DNA extraction
Ninety-four F1 individuals obtained from an interspecificcross between the dwarfing rootstock ‘M.9’ (Malus xdomestica) and the vigorous rootstock ‘R.5’ (Malus xrobusta) were used in this study. These 94 individuals wereselected from a progeny of 146 individuals developed in1999 at the Hawke’s Bay Research Centre of the Horticul-tural and Food Research Institute of New Zealand(HortResearch). Seedlings were grown on their own rootsfor their first year then used as rootstocks to evaluate theirdwarfing capacity. Plants from this cross were grown asstoolbeds. Leaf material was harvested from these stoolbedsand DNA was isolated according to Gardiner et al. (1999).
SSR markers developed in apple
A total of 185 published SSR markers were tested forsegregation across a set of six progeny plants and bothparents. These included 76 ‘CH’ SSRs (Liebhard et al.2002), 75 ‘Hi’ SSRs developed by the HiDRAS consortium(Silfverberg-Dilworth et al. 2006), 17 ‘GD’ SSRs withknown or unknown map position (Hemmat et al. 2003),
94 Tree Genetics & Genomes (2009) 5:93–107

four ‘MS’ SSRs (Liebhard et al. 2002), seven ‘NZ’ SSRs(Guilford et al. 1997), five ‘NZms’ SSRs (Chagné et al.2007; Bus et al. 2008) and the ‘Col’ SSR (Hemmat et al.1997). Twenty-seven SSRs developed from genomiclibraries at HortResearch (‘NZmsPal’, Erik Rikkerink) werealso tested for segregation. Primer sequences for ‘Pal’ SSRsmapped in this study are given in Table 1. All segregatingmarkers were then screened over a set of DNA from 94individuals. The SSR amplifications were performed asdescribed by Gianfranceschi et al. (1998) in a Hybaid MBSSatellite 0.5G Thermal Cycler (Thermo Electron, Waltham,MA, USA).
SSRs developed from apple ESTs
SSR motifs were detected in the HortResearch apple ESTdatabase using an automated bioinformatics tool as de-scribed by Newcomb et al. (2006). The selection for primerdesign was made on the basis of the type and length of therepeated motif in the sequence. Tri- and tetranucleotidewere favoured over dinucleotide repeats, and the length ofthe SSR motif was more than 12 bp. Primer pairs weredesigned for 130 SSRs using Primer3 (Rozen and Skaletsky2000). The theoretical melting temperature of the PCRprimers was approximately 60°C, and the amplification
Table 1 Names and primer sequences of NZmsPal SSR markers mapped in this study
Forward primer sequence Reverse primer sequence
NZmsPal8 GGCACAAGCACAAGGAAACA GTTTGAGCCAGTCCATTTTTCCCTATNZmsPal13 TCGATGAACAAGGCCCAAAG GTTTAGGGGGACGGAAGGAACAAGNZmsPal36 CCTCAACAAATATAAGACTCTCTC GTTTCTCCACTCTGTCCGTACATTNZmsPal45 AAAACCCAACACCACAGC GCTTCTTTGGATTCTGGATGNZmsPal51 GATTTTCTGATAATCCTGCC GTTTAAACAACTCCAGCTCTGCNZmsPal92 GTTTCTGGTTTCACTGGCATT GTTGCCACATTTTCACCATANZmsPal213rd CAACCTTTCTCTCATTCACTC GTTTCCTTTTATGTACCGGCTTNZmsPal443ird AAAAGCTCTCTCACTCCC GTTTATCTGCAAATCTGAGACC
Table 2 Name and primer sequences of the SCAR and SNP markers mapped in the ‘M.9’בR.5’ genetic map
Forward primer sequence Reverse primer sequence Reference
SCARsNZscOPL19 ACCTGCACTACAATCTTCACTAATC GACTCGTTTCCACTGAGGATATTTG Bus et al. 2002NZscOPC05 CCCAGTCACTAACATAATTGGCACA CCCAGTCACTGGCAAGAGAAATTAC Bus et al. 2008NZscOPC20 TCTCTAACTCAATAACTCCCAAGAC ACTTCGCCACCATTATCACTCCTGA Bus et al. 2008NZscAZ16AC15 GGCGAACTGGATGGCCAAAG ACGCTCCACCAAACCACACT Gardiner et al. 2003NZscAY17AB16 CACCAAGAATGCCAGGTGCAG TCGGGGTCGTRAAAATGTGATAT Gardiner et al. 2003AT20SCAR ATCAGCCCCACATGAATCTCATACC ACATCAGCCCTCAAAGATGAGAAGT Markussen et al. 1995CH01K08_SCAR GAACACTGGGCAAAGGAAAC TAAAAGCCACGTTCTCTCGC Gygax et al. 2004AD13SCAR GGTTCCTCTGTAAAGCTAG GGTTCCTCTGCCCAACAA Boudichevskaia et al. 2004NZscAE16 CTGGAGGTAGTGGTGGTGGATA AAGGGCAAGATAGAGAGGTCATTT Rusholme Pilcher et al. 2008NZscAI02 AGCCGTTCAGACCAGGAAAG AGCCGTTCAGTAGAATCACAG Rusholme Pilcher et al. 2008NZscEB108994 TGCTTCCTTCGTCTATTGGA TCACTTTCACTTGTTTCATACGC Rusholme Pilcher et al. 2008NZscCO901385 TGTTGGCATCGTATATTCCTCA CGACATTTCATATCCCTCAAGTAGCNZscEB114476 TTCAGACATACACCGAAACAAA ACCGAAAGTAGAAGGGCAGANZscSI GTTCACGGTTTGTGGCCTTC Rev 1-GACCTCAACCAATTCAGTC
Rev 2- GACCTCAACCAATTCAGTSNPsNZsnEG631316 GTTGGGTGAGCTAGAGATATTC GATACTGCTGGGAACGTCAGGA Chagné et al. 2007NZsnEB135547 CACCCGAACCCCAACGGCCA CTCTCCAGCTCCGCCACTG Chagné et al. 2007NZsnEB147206 CAAGGGCTAACGGAAAAACA TCTCCCCTAAATCCTCATGCNZsnEB39353 GGAAAGTGGCTCAAATGGTC CGTTCAAAACACCCTGGCTANZsnEB15133 TGTCAAGGAGGGAGACTACGA AACCAAGAGGCACAAGGAAANZsnCN943818 CGGGAAGAGGAAATGTGATT TGAACAGCTCATCGTCGGTANZsnEB120945 ATGTTTCTCCAGAGGCTTCA TCAATTTCACAAAGGGCAAANZsnDQ644205 TGATGCCATGAAGGAGTTTG GCCATAATTTACCGGCTTTCNZsnCN580831 GTCTTCCGGAAACAAAGCAA TCATGCTCGTGGGATTGTTANZsnCN946839 TCACCAAGTACGCTGGCC AGTCAGTTGCAACGGGAAATNZsnDR033889 CGAAGAATTTTCACTTTTTCTGAT GACTTCTCAGTGAGGCGTGA
Tree Genetics & Genomes (2009) 5:93–107 95

product length was kept between 100 and 400 bp. PCRamplifications were performed as described by Gianfrance-schi et al. (1998) with cycling modifications: an initialdenaturation step at 94°C for 2 min and 30 s was followedby four cycles of 94°C for 30 s, 60°C for 1 min, 72°C for 1min where the annealing temperatures was reduced by 1°Cper cycle, and then followed by 30 cycles of 94°C for 30 s,55°C for 1 min, 72°C for 1 min and a final 5-min 72°Cextension.
SSR markers from pear
A total of 117 SSRmarkers developed from pear (Yamamotoet al. 2002a, b, c; Yamamoto 2007; Oddou-Muratorio et al.2001; Fernández-Fernández et al. 2006) were tested forsegregation. PCR amplifications were performed as de-scribed above, but with an annealing temperature of 55°Cfor the first of the four touchdown cycles.
SSR analysis
All SSR markers screened over the ‘M.9’בR.5’ populationwere genotyped using a capillary electrophoresis system:the CePro 9600 TM (Combisep, Ames, IA, USA). Thiselectrophoresis system has an estimated sensitivity of twobases (although no study has been conducted to confirmthis sensitivity), and no sizing method was implemented tomeasure the size of the SSR alleles. PCR products weredesalted in 96-well microplate devices UNIFILTER®350 μl (Whatman®, Clifton, USA) using Sephadex™G-75 Superfine (Amersham, Uppsala, Sweden) beforeelectrophoresis. Multiplexing was performed when theamplification products differed in size.
SCARs, SNPs and RAPDs
A total of 82 sequence-characterised amplified region(SCAR) and 21 single nucleotide polymorphism (SNP)markers were tested for segregation. Primer sequences forSCAR and SNP markers mapped in this study are presentedin Table 2. PCR reactions for SCARs and SNPs werecarried out in a total volume of 16.5 μl containing: 1.5 ngDNA, 18 mM Tris–HCl pH 8.4, 46 mM KCl, 0.1 μM ofeach dNTP, 1.3 mM MgCl2, 0.08 μM each of forward andreverse primers and 0.44 U Platinum® Taq DNA polymer-ase (Invitrogen). Amplifications were performed in aHybaid MBS 0.5G PCR thermal cycler under the followingconditions: an initial denaturation at 94°C for 2 min 45 sfollowed by 40 cycles of 94°C for 55 s, the temperaturespecified for each marker for 55 s, 72°C for 1 min 39 s anda final 10-min 72°C extension was included. Forty of the 42polymorphic random amplified polymorphic DNA (RAPD;Operon Technologies) markers had previously been
screened over the ‘M.9’בR.5’ population in the course ofusing bulked segregant analysis to identify markers linkedto dwarfing of a grafted scion (Rusholme Pilcher et al.2008; Celton, unpublished). The RAPD marker S65 is fromConner et al. (1997). RAPD reactions were carried out asfor SCARs and SNPs except that 1% of formamide wasadded to the PCR mix, and the annealing temperature was37°C. All amplification products were separated on 0.9%agarose gels in 1× TAE buffer and stained with a solutionof ethidium bromide.
Map construction
Linkage analysis was performed using JoinMap version 3.0(Van Ooijen and Voorrips 2001) with a LOD score of 4 forgrouping. Genetic maps were constructed independently foreach parent using informative markers and based on a firstset of 93 individuals. In a few cases, a marker wasdiscarded during the mapping stage where its presencecaused inconsistencies in the map. Such markers wereidentified after integration of all markers of a linkage groupand confirmed by visual identification of double recombi-nants. Parental maps were aligned using fully informativemarkers, and the linkage group numbering was assignedbased on SSR markers in common with published maps(Maliepaard et al. 1998).
Table 3 SSR polymorphism in the ‘M.9’×’R.5’ population
SSR origin Markerstested
Markersmapped
Genomic (apple) CHa 76 56 (74%)Hib 65 37 (57%)GDc 17 12 (70%)NZd 7 2 (28%)MSa 4 1 (25%)Col SSRe 1 0NZmsPalf 27 8 (30%)Total 197 116 (59%)
EST-based(apple)
New EST-SSR 130 47 (36%)NZmsg 5 5 (100%)HiDRAS EST SSR 10 7 (70%)Total 145 59 (41%)
Transferred Pearh 117 49 (42%)Total 459 224 (49%)
a Liebhard et al. (2002)b Silfverberg-Dilworth et al. (2006)c Hemmat et al. (2003)d Guilford et al. (1997)e Hemmat et al. (1997)f E. Rikkerinkg Bus et al. (2008), Chagné et al. (2007)h Yamamoto et al. (2002a, b, c, 2007), Oddou-Muratorio et al. (2001),Fernández-Fernández et al. 2006
96 Tree Genetics & Genomes (2009) 5:93–107

Tab
le4
Nam
es,prim
ers,SSRmotif,origin
oftheEST,
type
ofmarkerandmap
positio
nof
thenew
setof
SSRmarkers
developed
GeneB
anknb
Forwardprim
ersequ
ence
Reverse
prim
ersequ
ence
Motifin
ESTdatabase
Originof
EST
Typ
eof
marker
Map
positio
n(linkage
grou
p)
‘Mallin
g9’
‘Rob
usta
5’
NZmsCN87
9773
CCCTCTGTTA
CTTTGACTCTTCTC
TGGTTTGGGTTGAAAATGGT
(AG) 11
‘Roy
alGala’
sloc
a1
1NZmsEB14
7493
aACACCCCCTCCCCAAACTT
GCACCCCTCTGATGTTGTG
(CCCT) 3
+(CT) 11
‘Roy
alGala’
mlocb
1NZmsEB14
9808
CGAGCCATGCTGATGATTC
TGTCCATCGATCCTCCAATG
(TC) 7(TATG) 8
‘Roy
alGala’
mloc
2NZmsEB15
3909
GTGGAGGGCACACACTCATA
AACAAAGAGGGAGGGAAGGA
(GAG) 4
+(TCA) 4
‘M.9’
sloc
2NZmsEB10
6592
CTCCCACTA
CTA
GCCAAACG
TTGGGATTTGAAGGACAGG
(TCC) 8
‘Roy
alGala’
sloc
2NZmsEB1194
05GCATGTCAAACCACTTGTCC
ATTCTCTCGCGGCAGTT
(CGT) 6
‘Roy
alGala’
sloc
2NZmsEB10
7305
AACTTCCAAACCCCATCTCC
AGAGCAACCTCACCATCTTCA
(TC) 7
+(TC) 9
‘Roy
alGala’
sloc
2NZmsEB17
7464
CTCCCACCCATCCCTCTA
AG
GCTCCTCTTCCCCTCCTCAT
(CT) 8
+(CT) 12
‘Roy
alGala’
sloc
3NZmsCN94
3818
CGGGAAGAGGAAATGTGATT
TGAACAGCTCATCGTCGGTA
(ATG) 4
‘Roy
alGala’
sloc
3NZmsDR99
9337
ACAGATTGGGATCTCGTGCT
CTTA
GCCTGTGTTGCACATTG
(GAA) 5(G
AT) 6
‘Red
Delicious’
sloc
4NZmsEB14
2980
CCAGTTGGTTA
TACAAATCGCAAAG
CCTGATCCTCAAAATTA
CAGCA
(AAAG) 3
‘Roy
alGala’
sloc
4NZmsEB15
5242
CCCCATCATCAAATCAGAAAC
GGAGGTGGTGTTGTCATTCTC
(TC) 9
‘Braeburn’
sloc
5NZmsEB13
4379
GATGGGATTA
TTA
CATGCATA
AGG
AGTGCGGCACGTA
GTGTTTT
(TTTA
) 6‘Roy
alGala’
sloc
55
NZmsEB13
2749
CTTTCCAGAGGAGGGCAGTT
GGTA
CACACTCTTTCCTCTTA
CATT
(AAAT) 8
‘Roy
alGala’
sloc
55
NZmsEB13
7770
TTGCTGGATCTGAAAACTA
GAGG
TCCATTTGCTCTCTCTTCCAA
(CT) 13+(CTT) 6
‘Roy
alGala’
sloc
5NZmsCN89
8349
GAGTTGGCAGAAAGAAACCA
CTGGGTGAAGACGAGATGCT
(TC) 19+(TTC) 6
‘M.9’
sloc
5NZmsCN86
2923
ATTTTCAAGTA
CCCCCAACC
CTTCTCCCTA
CAGCACAAGC
(ATC) 7
‘Roy
alGala’
sloc
5NZmsMDAJ168
1CCTGAGGTTA
TTGACCCAAAA
CACTCAGTTGGAAAACCCTACA
(CT) 25
GeneBank
sloc
66
NZmsEB13
2582
AGGCCACATCATA
CCTCCAC
CACCTTTGTTGTCGTTGTCG
(CAA) 6
‘Roy
alGala’
sloc
6NZmsCO75
4252
CTGCCCTCAAGGAGAATGTC
ACAGGTGCAGCAAAGGCTAT
(AG) 9
GeneBank
sloc
6NZmsEE66
3789
GGGGGACATA
AACCTTA
CCC
TAGTGGGGGCGTAGAAATTG
(AAC) 4
‘Roy
alGala’
sloc
7NZmsEB13
7749
ATCTCCTGCTGTGCTGGTCT
TCACCAAACACCAATCAACAA
(GA) 8
‘Roy
alGala’
sloc
7NZmsCN94
3067
AAATGGGGCACGCTA
TTA
TG
TGTGCCATTCAAGAGCTCAA
(TTC) 14
‘Roy
alGala’
sloc
7NZmsEB17
7006
AACCAATTCACCCGCCATA
CCTCTGCTGTGGCATGATT
(CCA) 4
‘Roy
alGala’
sloc
8NZmsCV88
0267
TGACCAAAAGAAAAGCAGGAG
AAATTGGCTGGAGGAGCTG
(CTT) 4
‘Roy
alGala’
sloc
88
NZmsCN90
0668
AGGCGTCAGCTGCTA
CTTTC
CTTTCCCACTTTCCTCACCA
(AG) 15
‘Sciros’
sloc
8NZmsEB1162
09AAAATCCCAATTCCAAAACC
TTGGAGCAGTGAAAGATTGG
(AGA) 10
‘Roy
alGala’
sloc
9NZmsCN94
3946
GGCGTGTTA
GGGATTCAAAC
TGGATCTCACCACAAAATGC
(ATTA
) 6‘Roy
alGala’
sloc
9NZmsCN89
2357
AGGTGAAGGTGGCTCAAAGA
AATTGTA
CGGCTCGGAACAG
(GA) 13
‘Roy
alGala’
mloc
9–11
NZmsCN89
9300
ACGAGCGCTCTCTCATCAC
TACGGGATTTTGTTGGTGCT
(TC) 15+(G
CA) 5
‘M.9’
sloc
10NZmsDR03
3893
CACTTA
GGGTGTA
TGGGTGTGA
TCATTTTGGGCAGGCACT
(AGT) 6
‘Roy
alGala’
sloc
11NZmsCN89
5337
GGCACCAACACATCCAAAC
CAGGAAGAGAACCACCGTACA
(CA) 6
‘Roy
alGala’
sloc
11NZmsEB15
3947
GGGAGAGTTA
GGGGAAAAGG
ACTGAGGCCTGCAACATA
CC
(ACC) 4
‘M.9’
sloc
11NZmsAB05
2994
TGCTA
TTA
GCTCCTCCTGAATTG
TTGTTGTTGCAGTGAAGGAA
(CT) 17
GeneBank
sloc
1212
NZmsEB1117
93TTGAGGGCTGCTTTCCAG
GGAGACATA
CAAGATTTCCAATGAG
(TC) 16
‘Roy
alGala’
sloc
1313
NZmsEB13
5714
CAAAGCCAGAACAGAGAGACAG
TGTTGGGATTGGAGTGATGA
(AGAC) 3
‘Roy
alGala’
mloc
13NZmsEB14
6613
AGAGTTCCGTTCCCCTCTCT
GTGGATTCGGAAATGCACTC
(TTCC) 8
‘Roy
alGala’
sloc
1414
NZmsCN91
4822
GACGATGATCAGGCCATTCT
TGTTCATGTCGGTGCTCAAT
(ACA) 6
+(A
GG) 4
‘Braeburn’
sloc
14
Tree Genetics & Genomes (2009) 5:93–107 97
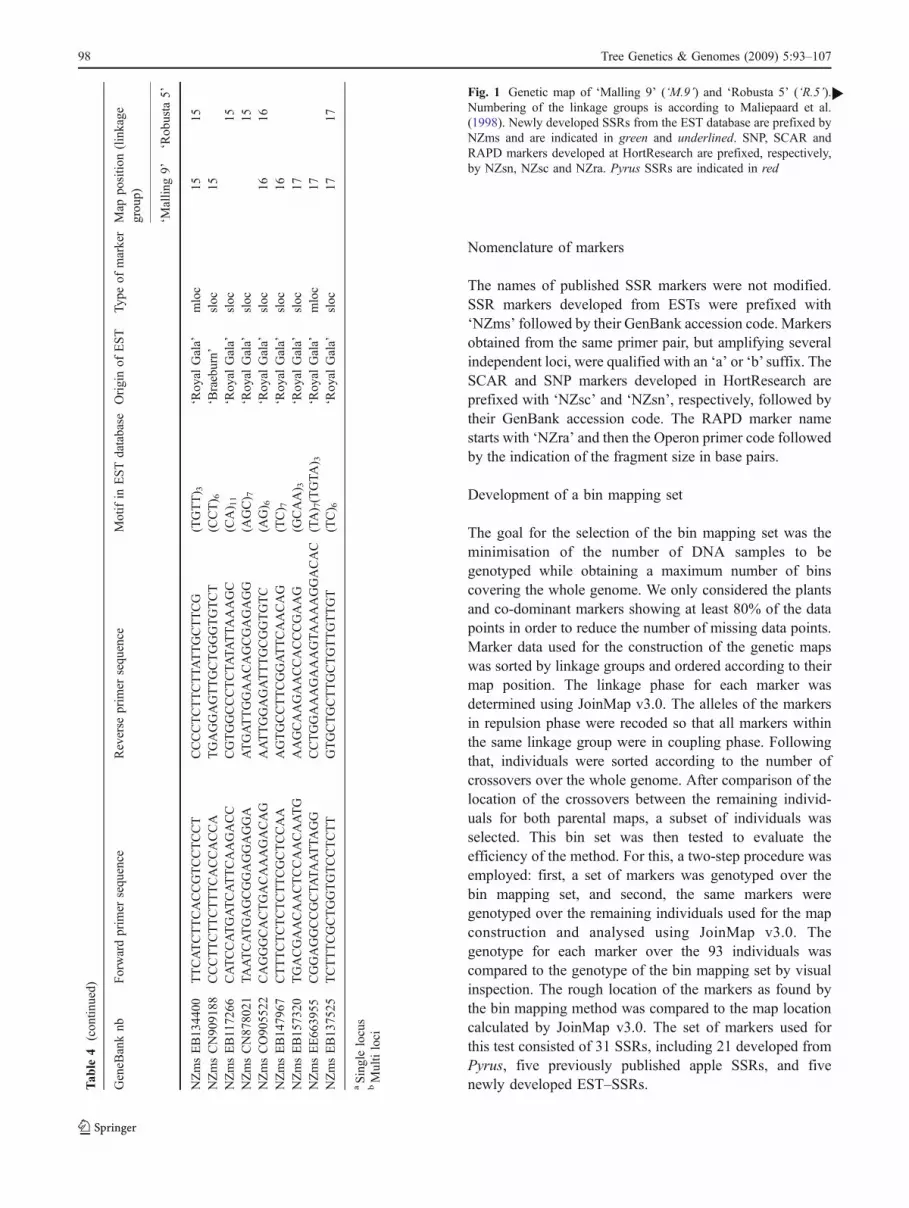
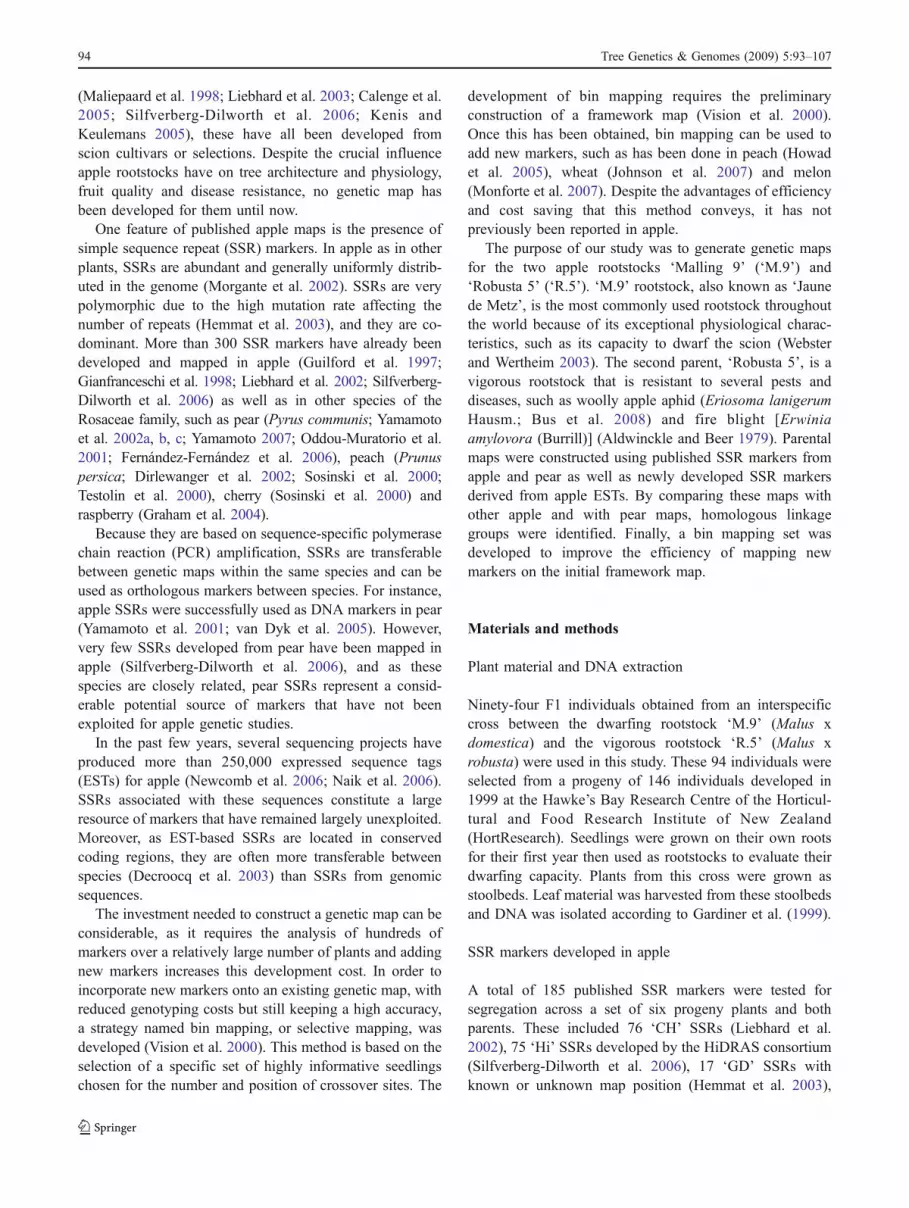
Nomenclature of markers
The names of published SSR markers were not modified.SSR markers developed from ESTs were prefixed with‘NZms’ followed by their GenBank accession code. Markersobtained from the same primer pair, but amplifying severalindependent loci, were qualified with an ‘a’ or ‘b’ suffix. TheSCAR and SNP markers developed in HortResearch areprefixed with ‘NZsc’ and ‘NZsn’, respectively, followed bytheir GenBank accession code. The RAPD marker namestarts with ‘NZra’ and then the Operon primer code followedby the indication of the fragment size in base pairs.
Development of a bin mapping set
The goal for the selection of the bin mapping set was theminimisation of the number of DNA samples to begenotyped while obtaining a maximum number of binscovering the whole genome. We only considered the plantsand co-dominant markers showing at least 80% of the datapoints in order to reduce the number of missing data points.Marker data used for the construction of the genetic mapswas sorted by linkage groups and ordered according to theirmap position. The linkage phase for each marker wasdetermined using JoinMap v3.0. The alleles of the markersin repulsion phase were recoded so that all markers withinthe same linkage group were in coupling phase. Followingthat, individuals were sorted according to the number ofcrossovers over the whole genome. After comparison of thelocation of the crossovers between the remaining individ-uals for both parental maps, a subset of individuals wasselected. This bin set was then tested to evaluate theefficiency of the method. For this, a two-step procedure wasemployed: first, a set of markers was genotyped over thebin mapping set, and second, the same markers weregenotyped over the remaining individuals used for the mapconstruction and analysed using JoinMap v3.0. Thegenotype for each marker over the 93 individuals wascompared to the genotype of the bin mapping set by visualinspection. The rough location of the markers as found bythe bin mapping method was compared to the map locationcalculated by JoinMap v3.0. The set of markers used forthis test consisted of 31 SSRs, including 21 developed fromPyrus, five previously published apple SSRs, and fivenewly developed EST–SSRs.
Fig. 1 Genetic map of ‘Malling 9’ (‘M.9’) and ‘Robusta 5’ (‘R.5’).Numbering of the linkage groups is according to Maliepaard et al.(1998). Newly developed SSRs from the EST database are prefixed byNZms and are indicated in green and underlined. SNP, SCAR andRAPD markers developed at HortResearch are prefixed, respectively,by NZsn, NZsc and NZra. Pyrus SSRs are indicated in red
bTab
le4
(con
tinued)
GeneB
anknb
Forwardprim
ersequ
ence
Reverse
prim
ersequ
ence
Motifin
ESTdatabase
Originof
EST
Type
ofmarker
Map
positio
n(linkage
grou
p)
‘Mallin
g9’
‘Rob
usta
5’
NZmsEB13
4400
TTCATCTTCACCGTCCTCCT
CCCCTCTTCTTA
TTGCTTCG
(TGTT) 3
‘Roy
alGala’
mloc
1515
NZmsCN90
9188
CCCTTCTTCTTTCACCACCA
TGAGGAGTTGCTGGGTGTCT
(CCT) 6
‘Braeburn’
sloc
15NZmsEB1172
66CATCCATGATCATTCAAGACC
CGTGGCCCTCTA
TATTA
AAGC
(CA) 11
‘Roy
alGala’
sloc
15NZmsCN87
8021
TAATCATGAGCGGAGGAGGA
ATGATTGGAACAGCGAGAGG
(AGC) 7
‘Roy
alGala’
sloc
15NZmsCO90
5522
CAGGGCACTGACAAAGACAG
AATTGGAGATTTGCGGTGTC
(AG) 6
‘Roy
alGala’
sloc
1616
NZmsEB14
7967
CTTTCTCTCTCTTCGCTCCAA
AGTGCCTTCGGATTCAACAG
(TC) 7
‘Roy
alGala’
sloc
16NZmsEB15
7320
TGACGAACAACTCCAACAATG
AAGCAAGAACCACCCGAAG
(GCAA) 3
‘Roy
alGala’
sloc
17NZmsEE66
3955
CGGAGGCCGCTA
TAATTA
GG
CCTGGAAAGAAAGTAAAAGGACAC
(TA) 7(TGTA
) 3‘Roy
alGala’
mloc
17NZmsEB13
7525
TCTTTCGCTGGTGTCCTCTT
GTGCTGCTTGCTGTTGTTGT
(TC) 6
‘Roy
alGala’
sloc
1717
aSinglelocus
bMultiloci
98 Tree Genetics & Genomes (2009) 5:93–107

NZmsEB147493a0.0NH010a_b2.8
Hi12c0225.9CHVf126.8
NZmsCN87977333.9
KA4b40.7
‘M.9’ LG1
Hi02c070.0NH010a_b1.7CH03g12_a3.8
NZraAD12(450)23.8CHVf124.8NZscEB12318527.3NZmsCN87977327.5NH010a_a33.1
‘R.5’ LG1
NB124b0.0
GD12610.3AD13SCAR10.4CN58149312.5NZsnEB14720613.9CN49313922.6NZmsPal9224.9Hi05g1228.9Hi24f0433.4NH010a_c37.7NH033b38.0
NZmsPal13nw50.9NZmsEB149808b56.0CH02b1057.4CH02a0458.4CH03d1058.7CH05e0360.6NZsnEB13935368.1NZscEB13853872.5NZmsEB15390973.3NZmsEB10730578.1NZscOPL1981.4CH01K08_SCAR84.8
‘M.9’ LG2
CN5814930.0NZsnEB1472064.3AD13SCAR9.4NZraMA2(650)18.7NZmsEB11940525.2NZmsPal9230.1NH212a38.4NH012a40.0NZmsPal13nw41.2NZmsEB10659241.6CH02b1045.8BGT23bCH03d10CH02a04
46.0
NZraAG07(900)46.1Hi08f0547.8CH05e0349.8CH01c0651.0Hi07d1251.3CH01K08_SCAR61.1NZraAR10(700)61.8
‘R.5’ LG2
CH03e030.0
CH03g0719.0NZsnEB15513323.2
Hi03d0655.3
Hi04c1060.2
GD1273.1
NZraAR02(700)85.4NH030a87.6NB109a90.3
CH03g12_b106.0
‘M.9’ LG3
NZmsCV8812510.0CH03e030.2
CH03g0714.4
Hi03d0618.9Hi07d0824.8NZraAJ03(1050)25.9NZmsEB17746428.6NZmsCN94381833.0NB109a34.6
NZsnCN94381843.4
CH03g12_b73.9
‘R.5’ LG3
NH209a0.0NH011b1.0CH02h11a_b4.7CH01d035.0GD6b9.2
NB141b20.3
Hi23d1129.6
‘M.9’ LG4GD1620.0
CH02h11a_b13.5CH01d0314.6GD6b15.7NZraAV11(1800)18.7Hi07b02b19.7CH02h11a_a24.0NZmsDR99933726.1
Hi01e10b35.9
Hi08e0445.2NZmsEB14298045.7
‘R.5’ LG4
NZraAV11(850)0.0Hi01c04a11.9Hi04a0812.0NB115b14.3NZraAM18(700)15.8CH03a0919.6NZraAP07(450)22.7NZscAE1623.3NZscAI0225.1CH05e0627.5CH04g0929.2NZmsEB13437933.2NH041aa35.2NZmsEB13274936.3NZraAE02(1200)39.8NZmsEB13777042.3NZscEB10899444.3CH05f0648.9NZraAR10(1200)50.7NZraAQ06(1000)55.1NZraAJ14(1300)56.8NZraAF07(500)58.8NZraAQ06(850)60.1NZraAR15(900)61.9CH04e0373.5
‘M.9’ LG5
NZmsEB1552420.0Hi01c04b7.0Hi01c04a9.1Hi09b0410.9Hi04a0811.8NB115b14.3
CH03a0922.3
CH05e0630.9CH04g0936.1NZmsEB13437937.7NZmsEB13274942.3
NZmsEB13777052.2NZraAD02(400)54.0GD103GD13654.4
NZmsCN89834954.9CN44559955.8CH05f0657.9CH04e0364.6NZmsCN86292369.2
‘R.5’ LG5
NZ23g040.0
CH03d1210.9
NZsnEB12094517.6
‘M.9’ LG6
NZraAT03(550)0.0
NH027a9.5Hi08g0310.4NZmsPal3610.8NZmsMDAJ168110.9CH03d0712.2NZ23g0417.7NZmsPal443ird19.5CH03d1224.3
NZmsCV65899039.1
Hi07b0659.4NZmsCO75425261.8
‘R.5’ LG6
CN4447940.0
Hi03a1017.1
NZmsEE66378932.1CH04e0534.6
NZmsEB13774955.0
Hi05b0966.1
‘M.9’ LG7
EMPc1170.0
CN44479410.5
NZmsCN94306721.4
EMPc11138.3
Hi05b0951.0
‘R.5’ LG7
CH01c060.0
NB114a19.4NZscOPC2021.4NZmsEB17700622.3
NZmsCV88026730.9NZraAF13(1600)35.3
NZraAE12(1200)46.8NZscEB11447649.1NZmsPal213rd50.2CH02g0950.3NZmsCN90066860.8NZraAK06(1250)60.9NZmsEB10675361.1NH005b66.5EMPc11968.0Hi22g0670.4
NH201a84.2
‘M.9’ LG8
NH036b0.0
NB114a5.9
NZmsCV88026726.8NZraAK06(1700)35.1NH005b37.1NZmsEB10675337.2NZscOP0537.6NZraAR02(400)40.9NH213a43.6
Hi22g0652.8NH201a56.8
‘R.5’ LG8NB125a0.0
NZmsCN9439469.8
GD14216.3NH029a19.0NB104a23.6
CH01f03b34.7NZmsEB11620936.4NZraAV19(1600)36.9NZscCO90138538.5BCA14438.7NB130b41.7Hi05e0742.4NZmsCN892357a53.1Hi04a0556.5
‘M.9’ LG9
NZraAB07(1250)0.0GD1422.2NH029a4.2NB125a6.3
CH05c0722.4
Hi05e0732.8NB130b33.7NB134a37.9
GD15844.9
S6559.5
‘R.5’ LG9
Tree Genetics & Genomes (2009) 5:93–107 99

CH02b070.0
AF571347.8CH02a089.4NZmsPal4511.1NH039a16.7CH02c1121.9NZraAQ06(1000)23.5
Hi01b0132.0
Hi08h1252.5Hi22a07NZmsCN899300a56.3
GD10056.6CH02b03b57.3
MS01a0369.7
‘M.9’ LG10
NH020a0.0
NH041ab18.8CH02b0720.3AF5713423.4NZraAP17(900)25.3NZraAP17(450)26.2CH02c1130.5
CH02b03b62.0
GD10067.3
MS01a0377.7
NZsnEG63131684.4
‘R.5’ LG10
NZmsAB1620400.0
CH04g0418.3CH05d1123.2CH05g0725.6NZsnEB135547(250)27.3NH207a28.5
CH01g1237.7CH04d02b40.6GD6a42.5
CH04d02a51.0
AT20SCAR61.1NZraA17(750)61.8
GD12776.9
‘M.9’ LG12
CH05d040.0
NZmsAB1620409.4
NZ28f0420.0NH207a20.7
NB104a30.3CH01d0931.8CH01g1232.7GD6a33.4Hi01e10a40.7CH01f0243.7CH04d02a46.7
NZmsCN899300b53.4
AT20SCAR60.8
GD12776.6
‘R.5’ LG12
CH05h050.0Hi04g053.6NZmsEB1386817.8
NZsnCN58083119.8
NH009b28.1
Hi03e0436.5NB133a_b40.7
CH05c0451.2CH03a0852.3
‘M.9’ LG13
Hi04g050.0
NZmsEB1386818.1NZraAY12(900)11.2
NZmsEB13571433.6NH009b38.3Hi03e0441.4NB133a_b44.8CH03a0847.5CH05c0449.2NZraAF13(400)52.2
‘R.5’ LG13
NZmsEB1466130.0
NH004a8.3
CH05e0525.6
NZmsPal44332.7
CH03a0239.0
NZmsPal5151.0
‘M.9’ LG14
CH05g070.0
NZmsCN9148225.7NZmsEB1466139.3
NH004a14.3NZraAW11(1200)16.6
NH035a31.0CH03a0233.9
NZmsPal5146.0
U7894852.1
NZmsCO86707058.0Hi03a0361.3NZsnCN90842065.2
‘R.5’ LG14
Hi02g060.0
NZmsEB13440017.6NZ02b0119.1
NH204a42.8
CH01d0860.6
NZmsEB11726680.6
NZmsCN90918886.9
NZsnEB135547(550)92.2NZraAD05(750)94.7
NB111a100.6
NZraAW11(650)115.3
CH03b10126.5
‘M.9’ LG15
Hi02g060.0
NZsnDR0338895.6
NZmsEB13440023.9
NZmsDT00192834.2
NH204a40.0
NZraAJ13(1200)56.1
NZraI14(550)62.2NZmsEB11726664.6NZscAY17AB1666.1
Hi07d1175.3
NB111a81.1
CH03b1093.5
‘R.5’ LG15
Hi22f060.0
NH007b11.4
CH05a0442.2
NZmsEB14796751.5
GD15458.7CH04f1062.8
‘M.9’ LG16
NH044b0.0CH02a035.4NH026a10.9Hi02h0811.8Hi22f0612.8CH05c0616.9NZmsCO90552218.1Hi15a1319.8
NH007b28.5
Hi01a0840.7Hi08f1242.2
CH04f1053.2
Hi04e0462.0NB133a_a65.4
‘R.5’ LG16
NZmsEB1573200.0Hi01d062.9
NZmsEE66395513.4AT00017414.3
CH04c0621.9
GD9635.5
NH013a_a45.1
Hi02f1252.6
NZscSI71.8
NZmsEB13752592.1
‘M.9’ LG17
GD960.0
NZmsEB1457648.4
GD15330.5CH02g0434.5
NH008b43.8
NZmsEB13752564.9
‘R.5’ LG17
Hi07d110.0
NZraAG02(500)13.0
NZraI14(200)22.5NZraAU15(900)25.7NZraAQ13(300)29.2NZmsCN892357b30.5CH02d0831.5CH04a1235.5NZraAZ13(400)39.2Hi02c0643.4
NB135a49.9
NZmsPal856.1
NZmsEB12806571.7
CH04d0779.4
NB105a86.4
‘M.9’ LG11
NZscAZ16AC150.0
NZmsDR03389319.2NZsnDQ64420520.1NZmsCN892357b29.0CH02d1230.6NZraAZ13(1150)31.5Hi02c0634.9NH013a_b36.2NZraAU14(2000)37.9Hi04g1138.5NH045a42.5NB135a44.8CH04g0750.6NB121a52.4NZmsCN89533756.8NZmsEB15394763.2NZmsEB12806564.5NB118a69.7CH04d0771.7
‘R.5’ LG11
Fig. 1 (continued)
100 Tree Genetics & Genomes (2009) 5:93–107

Results
Apple SSR polymorphism
Out of 342 SSRs developed from apple, 175 (52%) werepolymorphic in the ‘M.9’בR.5’ population (Table 3). Ofthe 197 markers designed from genomic sequences, 116(60%) were polymorphic, including 56 ‘CH’, 37 ‘Hi’, 12‘GD’, two ‘NZ’, one ‘MS’, and eight NZmsPal. Of the 130new SSR markers developed from the apple EST database(Table 3), 119 (91%) amplified a PCR product, and ofthese, 47 (39.5%) were polymorphic. In addition to that, 12previously published EST–SSRs segregated in the‘M.9’בR.5’ population.
Fourteen of the new polymorphic EST-SSRs are dinu-cleotide repeats, 14 trinucleotide, eight tetranucleotide, and11 are compound SSRs (Table 4). Overall, compound SSRswere the most polymorphic (50%), followed by tetra- anddinucleotide SSRs (44% and 43%, respectively), while only19% of the trinucleotide SSRs segregated in the population.
Transferability of SSR markers from pear
All 117 pear SSR markers amplified a PCR product whentested on apple, and 49 (42%) were polymorphic (Table 3).Four (8%) pear SSR markers amplified more than one locusin apple.
SCARs, SNPs and RAPDs
In total, 18 SCAR, 14 SNP and 42 RAPD markers werepolymorphic in the ‘M.9’בR.5’ progeny.
Genetic map construction
Two parental maps (Fig. 1) were constructed using a totalof 316 loci (amplified from 296 primer pairs) genotypedover 93 individuals. One individual was removed from thedataset because the SSR data suggested that it was notproduced from a ‘M.9’בR.5’ crossing. Each linkage mapconsisted of 17 linkage groups (LG; see Table 5 for details)that correspond to the number of chromosomes in the applehaploid genome. The maps span a total of 1,175.7 and1,086.7 cM for ‘M.9’ and ‘R.5’, respectively. The parentalmaps could be aligned, as they had 82 markers in common,including 76 fully informative SSRs, three SCARs, oneSNP and two RAPDs. Based on the SSR markers incommon with other published apple maps, conservation ofthe marker distance and order was observed for both ‘M.9’and ‘R.5’, except for a few discrepancies: (1) a secondlocus was amplified for CH01c06 and was mapped on LG2(‘R.5’); (2) Hi07d08 was mapped on LG3 (‘R.5’) instead ofLG1 (Fiesta); (3) Hi01d06 (LG11 and LG16 in ‘Fiesta’ and
‘Discovery’, respectively) was mapped on LG17 (‘M.9’);(4) Hi07d11 (LG11 and LG16 in ‘Fiesta’ and ‘Discovery’)was mapped to LG15 (‘R.5’); (5) a second locus wasamplified by Hi01c04 and was mapped 2.1 cM away fromits first locus on LG5 (‘R.5’). When compared with thereference map ‘Fiesta’בDiscovery’ (Silfverberg-Dilworthet al. 2006), the following discrepancies were also observedin marker order: (1) KA4b was mapped below CH-Vf1; (2)CH02b03 was mapped below Hi08h12; (3) Hi02g06 wasmapped above NZ02b01; and (4) AT000174 was mappedabove CH04c06.
Development and validation of a bin mapping set
The framework genetic maps of ‘M.9’ and ‘R.5’ weredivided into 113 and 106 bins (Table 5), with an averagebin length of 10.8 and 10.2 cM, respectively. A set of 14individuals, which will be hereafter termed the bin mappingset, was selected, each giving a single joint genotype. Thelongest bins identified were 39.5 and 32.5 cM for ‘M.9’LG17 and ‘R.5’ LG2, respectively (Table 5).
A total of 31 polymorphic markers, both SSRs andSNPs, were screened over the bin mapping set and theparents. Results of the comparison between the genotype ofthe new markers and the genotype of the frameworkmarkers flanking the bins are presented in Table 6.Twenty-three new markers exhibited a genotype thatcorresponded to one bin. Seven markers had a genotypethat did not correspond to any of the bins; however, theirrough location could be established by comparing adjacentbins and analysing the possibility of recombination betweenthem. Finally, the SSR marker Hi07d11, whose score didnot exactly match any of the pre-established bins, waspredicted to map at the top end of LG11 that was notcovered by the genetic map. All 31 markers were thengenotyped over the remaining 79 individuals from thepopulation, and their actual position in the genome wascalculated using JoinMap v 3.0. All the markers mappedclose to the location predicted using bin mapping (Table 6),including Hi07d11 mapping at the top of LG11.
Discussion
Development of a new set of EST-based SSR markersfor apple
A set of 47 new apple EST–SSRs was developed andmapped (Table 4). These markers were obtained bysearching for SSR motifs in an EST database, a processthat is less labour-intensive compared with time-consumingSSR development techniques based on the construction ofenriched libraries. A previous study reported the develop-
Tree Genetics & Genomes (2009) 5:93–107 101

ment of EST–SSRs in apple (Silfverberg-Dilworth et al.2006). Our study showed a lower dinucleotide SSR successrate than what they observed (36% compared to 61%). Thiscan be explained by (1) the lower sensitivity of the capillaryelectrophoresis system we used to separate our SSRs and(2) by the low selection criteria applied, as some of the di-and trinucleotide SSRs tested had as few as six repeatedunits. This low stringency selection was applied because anemphasis was put on gene function rather than the size of theSSR motif. Indeed, 24 of our new EST–SSRs are locatedwithin candidate genes coding for functions of interest, suchas resistance gene analogues (RGAs). For instance, five EST-SSRs developed from RGAs were mapped on LG2, which isknown to contain several disease resistance gene clusters(Bus et al. 2008). This shows that EST–SSRs are asignificant source of functional markers that can bedeveloped for candidate genes while still keeping theirquality as SSR markers (i.e. they are transferable betweendifferent genetic backgrounds and suitable for relativelyhigh throughput genotyping for MAS).
Overall, a higher polymorphism was observed for di-and tetranucleotide repeats compared to trinucleotiderepeats. Di- and tetranucleotide repeats are usually foundin higher frequency in 3′ and 5′ untranslated regions ofgenes, while trinucleotides are preferentially found intranslated regions (Morgante et al. 2002). This unevendistribution of SSR motifs may be a result of mutationpressure and positive selection for specific single aminoacid stretches. A mutation in a mono-, di- or tetranucleotideSSR in the open reading frames would result in a frameshiftthat could change the translated protein structure andfunction. It is interesting to note that in our study, thetrinucleotide types TTC/CTT/TCC displayed a lowerpolymorphism (12%) than the AAC/CCA type (57%).
The eight tetranucleotide SSRs developed during thisproject are the first of their class to be mapped in apple.
Four of them amplified more than two different alleles inthe progeny, indicating that they are highly polymorphic.Tetranucleotide SSRs could become markers of choice forfingerprinting studies in apple, as is already the case inhuman DNA (Guarino et al. 2006), because of the low‘stuttering’ and larger size difference between alleles thatmakes it easier to differentiate them. The future screeningof these newly developed SSRs over a set of cultivars orwild accessions will make it possible to estimate their truelevel of polymorphism, determine their allele size range andselect the most suitable markers for genetic diversity studiesand association genetics.
Development of a dense genetic map for the applerootstocks ‘M.9’ and ‘R.5’
We have constructed the first genetic maps for applerootstocks, including the most widely used rootstock in theworld (‘M.9’) and a rootstock possessing some resistances towidespread pest and diseases, ‘R.5’ (Bus et al. 2008;Aldwinckle and Beer 1979). The maps contain 316 lociand span 1,175.7 and 1,086.7 cM for ‘M.9’ and ‘R.5’,respectively, whose length is comparable to the mapdescribed for ‘Fiesta’בDiscovery’ (Silfverberg-Dilworth etal. 2006). The mapping of SSR markers in common makes itpossible to align the maps with published maps. With theexception of LG1, LG4 and LG6 for ‘M.9’ and LG1 andLG8 for ‘R.5’ (Fig. 1), the coverage of the linkage groups iscomparable to the reference map of ‘Fiesta’בDiscovery’.Very few SSR markers mapping to LG1 have been publishedso far. Here, we report the development of two new SSRs onLG1: NZmsEB147493 and NZmsCN879773. LG6 of ‘M.9’is the smallest group of all (17 cM). The coverage of LG4 of‘M.9’ and LG8 of ‘R.5’ is not complete, and an estimatedportion of 20 to 30 cM in length remains to be covered. Inorder to fill the gaps in our linkage map, SSR markers that
Table 5 Detailed analysis of the number and type of SSR markers, length, marker density and number of bins for each linkage group of the‘M.9’בR.5’ map
Marker type Linkage groups
M91 R51 M92 R52 M93 R53 M94 R54 M95 R55 M96 R56 M97 R57 M98 R58 M99
SSR Apple 4 4 11 12 6 8 4 10 10 18 2 10 6 3 8 3 7Pear 2 2 3 3 2 1 3 − 2 1 − 1 − 2 4 5 5
Total markers 6 8 20 21 10 11 7 11 25 20 3 12 6 5 17 11 14Length (cM) 40.7 33.1 84.8 61.8 106 73.9 29.6 45.7 72.5 69.2 17.6 61.8 66.1 51 84.2 56.8 56.5Marker density inmarkers/cM
0.15 0.24 0.24 0.34 0.09 0.16 0.24 0.24 0.34 0.29 0.17 0.19 0.09 0.1 0.2 0.19 0.25
Number of bins 3 4 10 6 7 5 4 4 14 8 2 6 5 5 6 7 6Average bin lengthin cM
13.5 8.3 8.5 10.3 15.1 14.8 7.4 11.4 5.2 8.6 8.8 10.3 13.2 10.2 14 8.1 9.4
Longest bin in cM 25.9 21.0 18.6 32.6 32.1 30.5 19.3 14.6 15.8 21.8 10.9 20.3 22.9 16.9 25.5 20.9 18.4
102 Tree Genetics & Genomes (2009) 5:93–107

were monomorphic in this population, but mapped in otherpopulations at positions where gaps are observed, could besequenced to identify SNPs in the alleles of ‘M.9’ or ‘R.5’that would map at the desired location
The ‘M.9’ and ‘R.5’ maps are mainly composed of SSRmarkers with relatively few markers of other types. Onlythe map ‘Fiesta’בDiscovery’ (Silfverberg-Dilworth et al.2006) contains more SSR markers (more than 300). We
Table 6 Comparison between the map location of SSR markers estimated using the bin mapping set (14 individuals) and JoinMap (93individuals)
Marker LG Closest marker (bin mapping) Location on map (93 individuals)
NH030a 3 NB109 2.7 cM from NB109NB141b 4 CH01d03 15.3 cM from CH01d03NH041aa 5 CH04g09 6.0 cM from CH04g09EMPc119 8 NZraAK06(1250) 7.1 cM from NZraAK06(1250)EMPc111 7 NZmsCN943067 16.9 cM from NZmsCN943067EMPc117 7 NZmsCN943067 21.4 cM from NZmsCN943067NB115b 5 NZraAM18(700) 1.5 cM from NZraAM18(700)BGT23b 2 CH02a04 0 cM from CH02a04NB109a 3 NZraAR02(700) 4.9 cM from NZraAR02(700)NH027a 6 CH03d07 2.8 cM from CH03d07NB114a 8 NZmsCV880267 11.5 cM from NZmsCV880267NH005b 8 NZraAK06(1700) 2.0 cM from NZraAK06(1700)BCA144 9 CH01f03b 4.0 cM from CH01f03bNB134a 9 CH05c07 15.4 cM from CH05c07NB135a 11 CH04g07 4.4 cM from CH04g07NB121a 11 CH04g07 1.9 cM from CH04g07NH207a 12 CH01g12 9.2 cM from CH01g12NH009b 13 NZsnCN580831 8.3 cM from NZsnCN580831NH004a 14 NZmsEB146613 8.3 cM from NZmsEB146613NB111a 15 NZraAW11(650) 14.7 cM from NZraAW11(650)NH007b 16 CH05c06 11.6 cM from CH05c06Hi03a10 7 NZmsEE663789 15 cM from NZmsEE663789Hi05e07 9 NZraAV19(1600) 5.4 cM from NZraAV19(1600)Hi07d11 11 NZraAG02(500) 13.0 cM from NZraAG02(500)Hi08e04 4 NZmsEB142180 0.5 cM from NZmsEB142180U78948 14 CH03a02 18.2 cM from CH03a02NZmsCN935411 15 NH204a 6.5 cM from NH204aNZmsCN944871 15 NH204a 0.8 cM from NH204aNZmsEB137861 16 Hi22f06 1.0 cM from Hi22f06NZmsCN879773 1 CHVf1 7.0 cM from CHVf1NZmsEB117266 15 NZmsCN909188 6.3 cM from NZmsCN909188
Table 5 (continued)
Linkage groups
R59 M910 R510 M911 R511 M912 R512 M913 R513 M914 R514 M915 R515 M916 R516 M917 R517
4 12 6 8 10 9 11 6 6 5 8 7 6 5 10 9 64 1 2 2 5 1 2 2 2 1 2 2 2 1 4 1 1
10 14 11 11 21 13 14 9 10 6 12 12 12 6 14 10 659.5 69.7 84.4 86.4 71.7 76.9 76.6 52.3 52.2 51 65.2 127 93.5 62.8 65.4 92.1 64.90.17 0.2 0.13 0.13 0.29 0.17 0.18 0.17 0.19 0.12 0.18 0.09 0.13 0.1 0.21 0.11 0.09
7 6 6 9 10 8 8 5 5 5 6 10 9 5 3 7 78.5 11.6 14.1 9.6 7.2 9.6 9.5 10.4 10.4 10.2 10.8 12.7 10.4 12.5 21.8 13.2 9.3
14.6 24.6 31.5 17.5 19.2 18.3 23.2 15.8 22.4 17.3 19.2 25.2 18.3 30.8 28.5 39.5 22.1
Tree Genetics & Genomes (2009) 5:93–107 103

have mapped 224 SSR markers in total on ‘M.9’ and ‘R.5’compared with 62 SSRs for ‘Discovery’× ‘TN10-8’(Calenge et al. 2004) and 20 SSRs for ‘Telamon’בBrae-burn’ (Kenis and Keulemans 2005). In addition, the‘M.9’בR.5’ map is one of the most functional mapsavailable, since it contains more than 50 SSR markers and12 SNPs derived from EST sequences.
The ‘M.9’בR.5’ genetic map has already permitted theidentification of a major gene conferring resistance towooly apple aphid (Er2) on ‘R.5’ LG17 (Bus et al. 2008)and the mapping of a major locus for dwarfing (Dw1) by‘M.9’ to LG05 (Rusholme Pilcher et al. 2008). The map hasalso enabled the mapping of a major QTL for resistance tofire blight on ‘R.5’ LG03 (Peil et al. 2008).
Duplication of SSR loci and confirmation of homoeologousregions in linkage groups
The mapping of a proportion of SSR markers to twodifferent linkage groups may indicate homoeologous pairsof chromosomes in the apple genome. Markers mapping toLG5 have already been found to amplify a second locus onLG10 (Maliepaard et al. 1998). This association of linkagegroups is confirmed by NH020a mapping on LG5 in pearand LG10 on ‘R.5’ (Table 7). The SSR marker CH03g12amplifies two loci mapping to the bottom of LG3 and to thetop of LG1 (Liebhard et al. 2002); the association between
Fig. 2 Map position of multi-locus SSR and RFLP markers revealduplication within the apple genome. Map positions are estimated forall the markers. The homoeologous chromosome segments areindicated by different filling patterns of bar segments. The format of
the lines linking the groups varies to allow for an easier reading of themap. Linkage groups are named and oriented according to Maliepaardet al. (1998)
Table 7 Pear SSRs mapping in different linkage groups in pear andapple
Apple map position(linkage group)
Pear map position(linkage group)
NB125a 9 17NB111a 15 11NH027a 6 15NH041a 5;10 7NH044b 16 13NH045a 11 10NH020a 10 5NH013a 17 1
104 Tree Genetics & Genomes (2009) 5:93–107

LG3 and LG1 is also indicated by Hi07d08 that maps onLG1 of ‘Fiesta’ (Silfverberg-Dilworth et al. 2006) and LG3of ‘R.5’.
We combined this information on multilocus SSR andrestriction fragment length polymorphism (RFLP) markersto construct a map representing homoeologous parts of theapple genome (Fig. 2). This map is based entirely on non-functional markers and includes supposed homoeologousregions linked to each other by only one genetic marker(LG2 and LG8: CH01c06; LG1 and LG15: Hi21g05; LG9and LG12: NB104a). Thus, additional markers (non-functional as well as functional) will be necessary toconfirm the association between these suggested homoeol-ogous regions. Knowledge of the structure of the applegenome will bring a better understanding of its evolutionand assist in locating members of multigene families.
Comparative genome mapping between apple and pear
Out of the 117 pear SSRs tested, 49 were located on theapple genetic maps in this study, including 46 that had notbeen mapped in apple before. All the pear SSRs mapped inthis study were derived genomic SSRs. Mapping of thisrelatively large number of pear SSRs on an apple map is astep towards the detailed study of synteny between thesetwo species. Generally, our results agreed with those of areciprocal study (Yamamoto et al. 2004), as 86% of the pearmarkers were located in homologous linkage groupsbetween apple and pear. Some of the pear SSRs did notmap to corresponding linkage groups in apple (Table 7).These markers may reveal possible differences in theorganisation of the pear genome compared to apple.However, more markers need to be developed in theseregions to confirm this hypothesis.
The overall conservation of synteny between apple andpear genomes opens new possibilities for development ofmarkers for traits in common between apple and pear.
Development of a bin mapping set
We have developed the first bin mapping set for apple. Bydemonstrating that a set of 31 markers could be placed on the‘M.9’בR.5’ maps using 14 individuals instead of 93, weachieved our objective of minimising the effort involved inthe mapping of new markers by carefully selecting a fewinformative individuals. This represents an 85% reduction ofthe cost of genotyping and makes it possible to envisage theuse of alternative methods for genotyping. For instance, withsuch a small number of individuals, it is now possible to usedirect sequencing as a method for both marker developmentand genotyping. Bin mapping in the highly polymorphic‘M.9’בR.5’ population will facilitate access by the Rosa-ceae scientific community to this reference mapping popu-
lation, enabling the mapping of new markers or genesthrough the exchange of a limited number of DNA samples(14 individuals plus the two parents). New markers are nowscreened routinely over this bin set, contributing to acontinuous enrichment of our genetic map. The incorpora-tion of new markers can also potentially increase the numberof bins, resulting in an increase of the accuracy of mapping.The development of a bin mapping set for apple will beparticularly useful for candidate gene mapping, as functionalstudies based on microarray experiments or bioinformaticsanalysis often generate large numbers of candidate genes tobe tested for co-location with QTL intervals.
Acknowledgements The authors thank Toshiya Yamamoto forproviding Pyrus SSR primer sequences prior to deposition in thepublic database. This work was partially supported by the NewZealand Foundation for Research, Science and Technology, contractno. CO6X0205.
References
Aldwinckle HS, Beer SV (1979) Fire blight and its control. HorticRev 1:425–476
Boudichevskaia A, Fischer C, Flachowsky H, Hanke V, DunemannF (2004) Development of molecular markers for (Vr1, a scabresistance factor from R12740-7A apple. Acta Hort 663:171–176
Bus V, White A, Gardiner S, Weskett R, Ranatunga C, Samy A, CookM, Rikkerink E (2002) An update on apple scab resistancebreeding in New Zealand. Acta Hort 595:43–47
Bus VGM, Chagné D, Bassett HCM, Bowatte D, Calenge F, CeltonJ-M, Durel CE, Malone MT, Patocchi A, Ranatunga AC, RikkerinkEHA, Tustin DS, Zhou J, Gardiner SE (2008) Genome mapping ofthree major resistance genes to woolly apple aphid (Eriosomalanigerum Hausm.). Tree Genetics and Genomes 4:233–236
Calenge F, Faure A, Goerre M, Gebhardt C, Van de Weg E, Parisi L,Durel C-E (2004) Quantitative trait loci (QTL) analysis revealsboth broad-spectrum and isolate-specific QTL for scab resistancein an apple progeny challenged with eight isolates of Venturiainaequalis. Phytopathology 94:370–379
Calenge F, Drouet D, Denancé C, Van de Weg WE, Brisset M-N,Paulin J-P, Durel C-E (2005) Identification of a major QTLtogether with several minor additive or epistatic QTLs forresistance to fire blight in apple in two related progenies. TheorAppl Genet 111:128–135
Chagné D, Carlisle CM, Blond C, Volz RK, Whitworth CJ, OraguzieNC, Crowhurst RN, Allan AC, Espley RV, Hellens RP, GardinerSE (2007) Mapping a candidate gene (MdMYB10) for red fleshand foliage colour in apple. BMC Genomics 8:212
Conner PJ, Brown SK, Weeden NF (1997) Randomly amplifiedpolymorphic DNA-based genetic linkage maps of three applecultivars. J Am Soc Hortic Sci 122:350–359
Decroocq V, Favé MG, Hagen L, Bordenave L, Decroocq S (2003)Development and transferability of apricot and grape EST micro-satellite markers across taxa. Theor Appl Genet 106:912–922
Dirlewanger E, Cosson P, Tavaud M, Aranzana M, Poizat C, ZanettoA, Arús P, Laigret F (2002) Development of microsatellitemarkers in peach [Prunus persica (L.) Batsch] and their use ingenetic diversity analysis in peach and sweet cherry (Prunusavium L.). Theor Appl Genet 105:127–138
Tree Genetics & Genomes (2009) 5:93–107 105

FAO (2005) FAOSTAT database 2000. http://www.apps.fao.org/(October 2007)
Fernández-Fernández F, Harvey NG, James CM (2006) Isolation andcharacterization of polymorphic microsatellite markers fromEuropean pear (Pyrus communis L.). Mol Ecol Notes 6:1039–1041
Gardiner S, Bus V, Bassett H, White A, Noiton D, Rikkerink E, BallR, Forester R (1999) An updated genetic map around the Vf genefor resistance to apple scab and marker assisted selection forresistance. Acta Hort 484:481–485
Gardiner S, Murdoch J, Meech S, Rusholme R, Bassett H, Cook M,Bus V, Rikkerink E, Gleave A, Crowhurst R, Ross G, WarringtonI (2003) Candidate resistance genes from an EST database provea rich source of markers for major genes conferring resistance toimportant apple pests and diseases. Acta Hort 622:141–151
Gianfranceschi L, Seglias N, Tarchini R, Komjanc M, Gessler C(1998) Simple sequence repeats for the genetic analysis of apple.Theor Appl Genet 96:1069–1076
Graham J, Smith K, MacKenzie K, Jorgenson L, Hackett C, Powell W(2004) The construction of a genetic linkage map of the redraspberry (Rubus idaeus subsp. idaeus) based on AFLPs,genomic-SSR and EST-SSR markers. Theor Appl Genet109:740–749
Guarino C, Santoro S, De Simone L, Lain O, Cipriani G, Testolin R(2006) Genetic diversity in a collection of ancient cultivars ofapple (Malus x domestica Borkh.) as revealed by SSR-basedfingerprinting. J Hortic Sci Biotechnol 81:39–44
Guilford P, Prakash S, Zhu JM, Rikkerink E, Gardiner S, Basset H,Forster R (1997) Microsatellites in Malus x domestica (apple):abundance, polymorphism and cultivar identification. Theor ApplGenet 94:249–254
Gygax M, Gianfranceschi L, Liebhard R, Kellerhals M, Gessler C,Patocchi A (2004) Molecular markers linked to the apple scabresistance gene Vbj derived from Malus baccata jackii. TheorAppl Genet 109:1702–1709
Hemmat M, Weeden NF, Conner PJ, Brown SK (1997) A DNAmarker for columnar growth habit in apple contains a simplesequence repeat. J Am Soc Hortic Sci 122:347–349
Hemmat M, Weeden NF, Brown SK (2003) Mapping and evaluationof Malus x domestica microsatellites in apple and pear. J Am SocHortic Sci 128:515–520
Howad W, Yamamoto T, Dirlewanger E, Testolin R, Cosson P, CiprianiG,Monforte AJ, Georgi L, Abbott A, Arús P (2005)Mappingwith afew plants: using selective mapping for microsatellite saturation ofthe Prunus reference map. Genetics 171:1305–1309
Johnson E, Leonard JM, Zemetra RS, Riera-Lizarazu O (2007)Mapping the Compactum (C) locus in wheat. Plant and AnimalGenome XIV Conference, San Diego, Poster 295
Kenis K, Keulemans J (2005) Genetic linkage maps of two applecultivars (Malus x domestica Borkh.) based on AFLP andmicrosatellite markers. Mol Breed 15:205–219
Liebhard R, Gianfranceschi L, Koller B, Ryder CD, Tarchini R, Vande Weg E, Gessler C (2002) Development and characterisation of140 new microsatellites in apple (Malus x domestica Borkh.).Mol Breed 10:217–241
Liebhard R, Koller B, Gianfranceschi L, Gessler C (2003) Creating asaturated reference map for the apple (Malus x domestica Borkh.)genome. Theor Appl Genet 106:1497–1508
Maliepaard C, Alston FH, van Arkel G, Brown LM, Chevreau E,Dunemann F, Evans KM, Gardiner S, Guilford P, van HeusdenAW, Janse J, Laurens F, Lynn JR, Manganaris AG, den NijsAPM, Periam N, Rikkerink E, Roche P, Ryder C, Sansavini S,Schmidt H, Tartarini S, Verhaegh JJ, Vrielink-van Ginkel M,King GJ (1998) Aligning male and female linkage maps of apple(Malus pumila Mill.) using multi-allelic markers. Theor ApplGenet 97:60–73
Markussen T, Krüger J, Schmidt H, Dunemann F (1995) Identificationof PCR-based markers linked to the powdery-mildew-resistancegene Pl1 from Malus robusta in cultivated apple. Plant Breed114:530–534
Monforte AJ, Arús P, Deleu W, González M, Fernández-Silva I,Moreno E, Puignomènech P, Blanca J, Nuez F, Picó B, Roig C,Garcia-MAS J (2007) Mapping melon ESTs by selective genotyp-ing. Plant and Animal Genome XIV Conference, San Diego,Poster W96
Morgante M, Hanafey M, Powell W (2002) Microsatellites arepreferentially associated with non repetitive DNA in plantgenomes. Nat Genet 30:194–200
Naik S, Hampson C, Gasic K, Bakkeren G, Korban SS (2006)Development and linkage mapping of E-STS and RGA markersfor functional gene homologs in apple. Genome 49:959–968
Newcomb RD, Crowhurst RN, Gleave AP, Rikkerink EHA, Allan AC,Beuning LL, Bowen JH, Gera E, Jamieson KR, Janssen BJ,Laing WA, McArtney S, Nain B, Ross GS, Snowden KC,Souleyre EJF, Walton EF, Yauk YK (2006) Analysis of expressedsequence tags from apple. Plant Physiol 141:147–166
Oddou-Muratorio S, Alignon C, Decroocq S, Plomion C, Lamant T,Mush-Demesure B (2001) Microsatellite primers for Sorbustorminalis and related species. Mol Ecol Notes 1:297–299
Peil A, Richter K, Garcia-Libreros T, Hanke M-V, Flachowsky H,Celton J-M, Horner M, Gardiner S, Bus V (2008) Confirmationof the fire blight QTL of Malus x robusta 5 on linkage group 3.Acta Horticulturae (in press)
Rozen S, Skaletsky HJ (2000) Primer3 on the WWW for general usersand for biologist programmers. In: Krawetz S, Misener S (eds)Bioinformatics methods and protocols: methods in molecularbiology. Humana, Totowa, NJ, pp 365–386
Rusholme Pilcher RL, Celton J-M, Gardiner SE, Tustin DS (2008)Genetic markers linked to the dwarfing trait of apple rootstock‘Malling 9’. J Am Soc Hortic Sci 133:100–106
Silfverberg-Dilworth E, Matasci CL, Van de Weg WE, Van KaauwenMPW, Walser M, Kodde LP, Soglio V, Gianfranceschi L, Durel CE,Costa F, Yamamoto T, Koller B, Gessler C, Patocchi A (2006)Microsatellite markers spanning the apple (Malus x domesticaBorkh.) genome. Tree Genetics and Genomes 2:202–224
Sosinski B, Gannavarapu M, Hager LD, Beck LE, King GJ, RyderCD, Rajapakse S, Baird WV, Ballard RE, Abbott AG (2000)Characterization of microsatellite markers in peach [Prunuspersica (L.) Batsch]. Theor Appl Genet 101:421–428
Tanksley SD, Young ND, Paterson AH, Bonierbale MW (1989) RFLPmapping in plant breeding: new tools for an old science.Biotechnology 7:257–264
Testolin R, Marrazzo T, Cipriani G, Quarta R, Verde I, Dettori MT,Pancaldi M, Sansavini S (2000) Microsatellite DNA in peach[Prunus persica (L.) Batsch] and its use in fingerprinting andtesting the genetic origin of cultivars. Genome 43:512–520
Van Dyk MM, Koning G, Simayi Z, Booi S, Maharaj R, Selada MC,Rees DJG (2005) Development of microsatellite markers formarker-assisted breeding in pears (Pyrus spp.). Acta Horticul-turae 671:307–313
Van Ooijen JW, Voorrips RE (2001) JoinMapR 3.0: software for thecalculation of genetic linkage maps. Wageningen, The Netherlands
Vision TJ, Brown DG, Shmoys DB, Durrett RT, Tanksley SD (2000)Selective mapping: a strategy for optimizing the construction ofhigh-density linkage maps. Genetics 155:407–420
Webster AD, Wertheim SJ (2003) Apple rootstocks. In: Ferree DC,Warrington IJ (eds) Apples: botany, production and uses. CABIPublishing, CAB International
Yamamoto T (2007) Marker information submitted via the DNA databank of Japan and NCBI
Yamamoto T, Kimura T, Sawamura Y, Kotobuki K, Ban Y, Hayashi T,Matsuta N (2001) SSRs isolated from apple can identify
106 Tree Genetics & Genomes (2009) 5:93–107

polymorphism and genetic diversity in pear. Theor Appl Genet102:865–870
Yamamoto T, Kimura T, Sawamura Y, Manabe T, Kotobuki K,Hayashi T, Ban Y, Matsuta N (2002a) Simple sequence repeatsfor genetic analysis in pear. Euphytica 124:129–137
Yamamoto T, Kimura T, Shoda M, Ban Y, Hayashi T, Matsuta N(2002b) Development of microsatellite markers in the Japanesepear (Pyrus pyrifolia Nakai). Mol Ecol Notes 2:14–16
Yamamoto T, Kimura T, Shoda M, Imai T, Saito T, Sawamura Y,Kotobuki K, Hayashi T, Matsuta N (2002c) Genetic linkage mapsconstructed by using an interspecific cross between Japanese andEuropean pears. Theor Appl Genet 106:9–18
Yamamoto T, Kimura T, Saito T, Kotobuki K, Matsuta N, Liebhard R,Gessler C, Van de Weg E, Hayashi T (2004) Genetic linkagemaps of Japanese and European pears aligned to the appleconsensus map. Acta Horticulturae 663:51–56
Tree Genetics & Genomes (2009) 5:93–107 107


