Embed Size (px)
Citation preview

Liu et al. BMC Genomics 2012, 13:700http://www.biomedcentral.com/1471-2164/13/700
RESEARCH ARTICLE Open Access
Transcriptomic analysis of ‘Suli’ pear (Pyrus pyrifoliawhite pear group) buds during the dormancy byRNA-SeqGuoqin Liu1,2, Wanshun Li3, Penghua Zheng1, Tong Xu3, Lijuan Chen3, Dongfeng Liu1, Sayed Hussain1
and Yuanwen Teng1*
Abstract
Background: Bud dormancy is a critical developmental process that allows perennial plants to survive unfavorableenvironmental conditions. Pear is one of the most important deciduous fruit trees in the world, but themechanisms regulating bud dormancy in this species are unknown. Because genomic information for pear iscurrently unavailable, transcriptome and digital gene expression data for this species would be valuable resourcesto better understand the molecular and biological mechanisms regulating its bud dormancy.
Results: We performed de novo transcriptome assembly and digital gene expression (DGE) profiling analyses of‘Suli’ pear (Pyrus pyrifolia white pear group) using the Illumina RNA-seq system. RNA-Seq generated approximately100 M high-quality reads that were assembled into 69,393 unigenes (mean length = 853 bp), including 14,531clusters and 34,194 singletons. A total of 51,448 (74.1%) unigenes were annotated using public protein databaseswith a cut-off E-value above 10-5. We mainly compared gene expression levels at four time-points during buddormancy. Between Nov. 15 and Dec. 15, Dec. 15 and Jan. 15, and Jan. 15 and Feb. 15, 1,978, 1,024, and 3,468genes were differentially expressed, respectively. Hierarchical clustering analysis arranged 190 significantlydifferentially-expressed genes into seven groups. Seven genes were randomly selected to confirm their expressionlevels using quantitative real-time PCR.
Conclusions: The new transcriptomes offer comprehensive sequence and DGE profiling data for a dynamic view oftranscriptomic variation during bud dormancy in pear. These data provided a basis for future studies of metabolismduring bud dormancy in non-model but economically-important perennial species.
Keywords: ‘Suli’ pear (Pyrus pyrifolia white pear group), Transcriptome, Bud dormancy, RNA-Seq
BackgroundDormancy is a complex phase of plant developmentthat is necessary for survival under unfavorable envir-onmental conditions. According to Lang [1], dormancyis a temporary suspension of visible growth of any plantstructures containing meristems and can be divided intofive well-defined phases: paradormancy, endodormancy,ecodormancy, and the two transitional phases betweenpara- and endodormancy and endo- and ecodormancy.Dormancy transitions are regulated by short photoperiods
* Correspondence: [email protected] of Horticulture, The State Agricultural Ministry’s Key Laboratoryof Horticultural Plant Growth, Development & Quality Improvement, ZhejiangUniversity, Hangzhou 310058, Zhejiang Province, ChinaFull list of author information is available at the end of the article
© 2012 Liu et al.; licensee BioMed Central Ltd.Commons Attribution License (http://creativecreproduction in any medium, provided the or
and/or chilling temperatures. In pear low temperatureshave been proven to control dormancy [2]. Severalexcellent studies have investigated the physiological andmolecular mechanisms of bud-dormancy transitions inperennial woody and herbaceous plants, including leafyspurge (Euphorbia esula Linn.) [3-5], poplar (Populusspp.) [6,7], peach (Prunus persica [L.] Batsch) [8-12],apple (Malus × domestica Borkh) [13,14], Japaneseapricot (Prunus mume Siebold Zucc.) [15,16], chestnut(Castanea sativa Mill.) [17-19], grape (Vitis viniferalinn.) [20,21], raspberry (Rubus idaeus Linn.) [22], kiwi-fruit (Actinidia spp.) [23,24], and blackcurrant (Ribesnigrum Linn.) [25]. These results suggested that buddormancy involves many biochemical pathways related
This is an Open Access article distributed under the terms of the Creativeommons.org/licenses/by/2.0), which permits unrestricted use, distribution, andiginal work is properly cited.
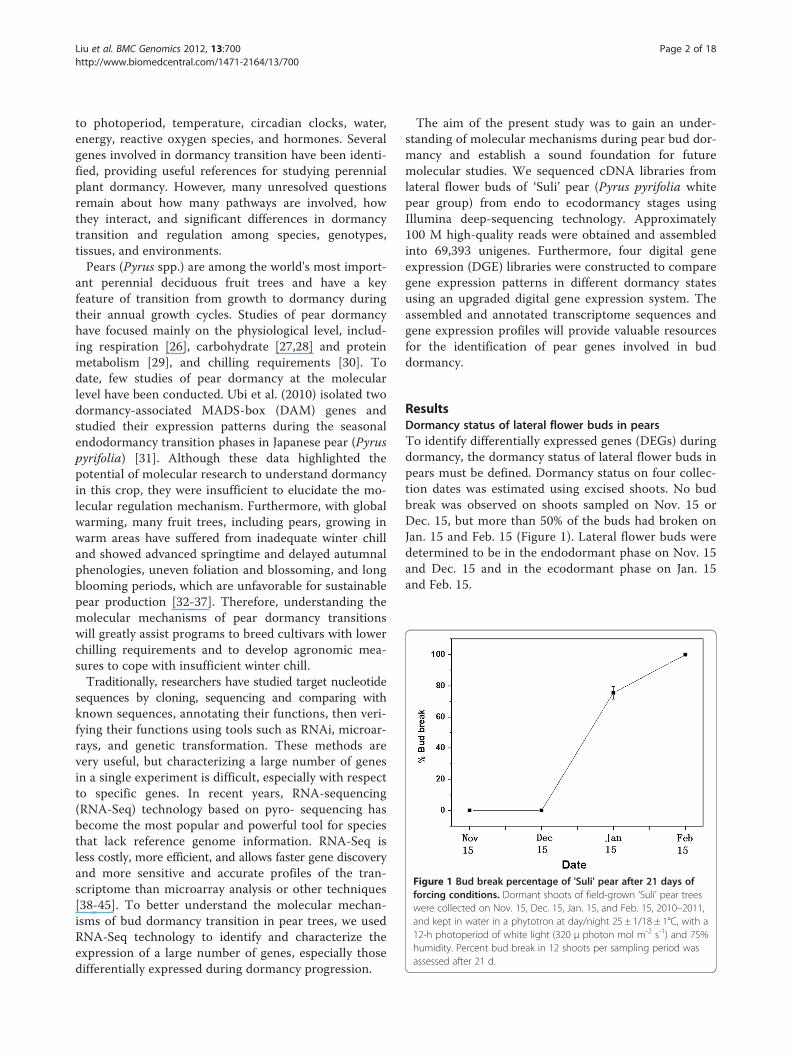
Figure 1 Bud break percentage of 'Suli' pear after 21 days offorcing conditions. Dormant shoots of field-grown ‘Suli’ pear treeswere collected on Nov. 15, Dec. 15, Jan. 15, and Feb. 15, 2010–2011,and kept in water in a phytotron at day/night 25 ± 1/18 ± 1°C, with a12-h photoperiod of white light (320 μ photon mol m-2 s-1) and 75%humidity. Percent bud break in 12 shoots per sampling period wasassessed after 21 d.
Liu et al. BMC Genomics 2012, 13:700 Page 2 of 18http://www.biomedcentral.com/1471-2164/13/700
to photoperiod, temperature, circadian clocks, water,energy, reactive oxygen species, and hormones. Severalgenes involved in dormancy transition have been identi-fied, providing useful references for studying perennialplant dormancy. However, many unresolved questionsremain about how many pathways are involved, howthey interact, and significant differences in dormancytransition and regulation among species, genotypes,tissues, and environments.Pears (Pyrus spp.) are among the world's most import-
ant perennial deciduous fruit trees and have a keyfeature of transition from growth to dormancy duringtheir annual growth cycles. Studies of pear dormancyhave focused mainly on the physiological level, includ-ing respiration [26], carbohydrate [27,28] and proteinmetabolism [29], and chilling requirements [30]. Todate, few studies of pear dormancy at the molecularlevel have been conducted. Ubi et al. (2010) isolated twodormancy-associated MADS-box (DAM) genes andstudied their expression patterns during the seasonalendodormancy transition phases in Japanese pear (Pyruspyrifolia) [31]. Although these data highlighted thepotential of molecular research to understand dormancyin this crop, they were insufficient to elucidate the mo-lecular regulation mechanism. Furthermore, with globalwarming, many fruit trees, including pears, growing inwarm areas have suffered from inadequate winter chilland showed advanced springtime and delayed autumnalphenologies, uneven foliation and blossoming, and longblooming periods, which are unfavorable for sustainablepear production [32-37]. Therefore, understanding themolecular mechanisms of pear dormancy transitionswill greatly assist programs to breed cultivars with lowerchilling requirements and to develop agronomic mea-sures to cope with insufficient winter chill.Traditionally, researchers have studied target nucleotide
sequences by cloning, sequencing and comparing withknown sequences, annotating their functions, then veri-fying their functions using tools such as RNAi, microar-rays, and genetic transformation. These methods arevery useful, but characterizing a large number of genesin a single experiment is difficult, especially with respectto specific genes. In recent years, RNA-sequencing(RNA-Seq) technology based on pyro- sequencing hasbecome the most popular and powerful tool for speciesthat lack reference genome information. RNA-Seq isless costly, more efficient, and allows faster gene discoveryand more sensitive and accurate profiles of the tran-scriptome than microarray analysis or other techniques[38-45]. To better understand the molecular mechan-isms of bud dormancy transition in pear trees, we usedRNA-Seq technology to identify and characterize theexpression of a large number of genes, especially thosedifferentially expressed during dormancy progression.
The aim of the present study was to gain an under-standing of molecular mechanisms during pear bud dor-mancy and establish a sound foundation for futuremolecular studies. We sequenced cDNA libraries fromlateral flower buds of ‘Suli’ pear (Pyrus pyrifolia whitepear group) from endo to ecodormancy stages usingIllumina deep-sequencing technology. Approximately100 M high-quality reads were obtained and assembledinto 69,393 unigenes. Furthermore, four digital geneexpression (DGE) libraries were constructed to comparegene expression patterns in different dormancy statesusing an upgraded digital gene expression system. Theassembled and annotated transcriptome sequences andgene expression profiles will provide valuable resourcesfor the identification of pear genes involved in buddormancy.
ResultsDormancy status of lateral flower buds in pearsTo identify differentially expressed genes (DEGs) duringdormancy, the dormancy status of lateral flower buds inpears must be defined. Dormancy status on four collec-tion dates was estimated using excised shoots. No budbreak was observed on shoots sampled on Nov. 15 orDec. 15, but more than 50% of the buds had broken onJan. 15 and Feb. 15 (Figure 1). Lateral flower buds weredetermined to be in the endodormant phase on Nov. 15and Dec. 15 and in the ecodormant phase on Jan. 15and Feb. 15.
Liu et al. BMC Genomics 2012, 13:700 Page 3 of 18http://www.biomedcentral.com/1471-2164/13/700
Illumina sequencing and de novo assemblyTo obtain an overview of the pear bud transcriptome dur-ing dormancy, a cDNA library was generated from RNAisolated from buds pooled from Nov. 2010 to Feb. 2011,then paired-end sequenced using the Illumina platform.After cleaning and quality checks, approximately 100 Mhigh-quality reads were assembled into 197,357 contigs(Table 1). The mean contig size was 272 bp. Usingpaired-end joining and gap-filling, these contigs werefurther assembled into 69,393 unique sequences with amean size of 853 bp, including 14,531 clusters and34,194 singletons. The size distributions of these contigsand unigenes are shown in Additional file 1. To evaluatethe quality of sequencing data, we randomly selected 8unigenes and designed 8 pairs of primers (Additionalfile 2) for RT-PCR amplification. Each primer pairresulted in a band of the expected size; the identity ofall PCR products was confirmed by Sanger sequencing.
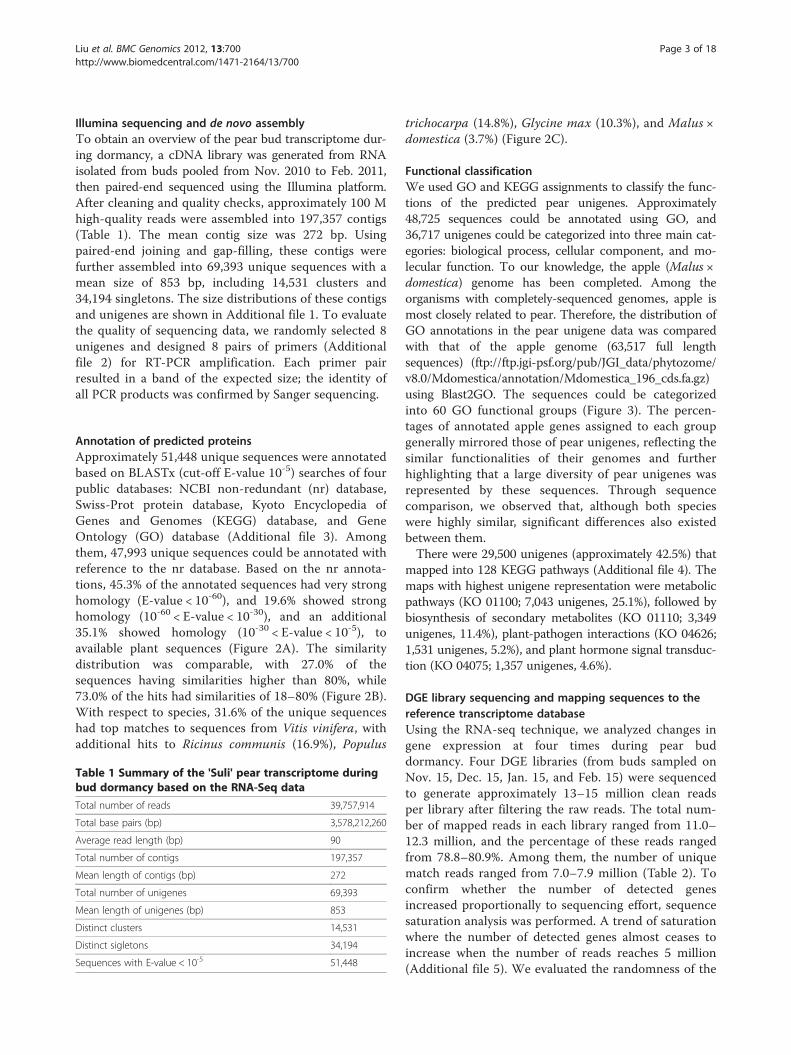
Annotation of predicted proteinsApproximately 51,448 unique sequences were annotatedbased on BLASTx (cut-off E-value 10-5) searches of fourpublic databases: NCBI non-redundant (nr) database,Swiss-Prot protein database, Kyoto Encyclopedia ofGenes and Genomes (KEGG) database, and GeneOntology (GO) database (Additional file 3). Amongthem, 47,993 unique sequences could be annotated withreference to the nr database. Based on the nr annota-tions, 45.3% of the annotated sequences had very stronghomology (E-value < 10-60), and 19.6% showed stronghomology (10-60 < E-value < 10-30), and an additional35.1% showed homology (10-30 < E-value < 10-5), toavailable plant sequences (Figure 2A). The similaritydistribution was comparable, with 27.0% of thesequences having similarities higher than 80%, while73.0% of the hits had similarities of 18–80% (Figure 2B).With respect to species, 31.6% of the unique sequenceshad top matches to sequences from Vitis vinifera, withadditional hits to Ricinus communis (16.9%), Populus
Table 1 Summary of the 'Suli' pear transcriptome duringbud dormancy based on the RNA-Seq data
Total number of reads 39,757,914
Total base pairs (bp) 3,578,212,260
Average read length (bp) 90
Total number of contigs 197,357
Mean length of contigs (bp) 272
Total number of unigenes 69,393
Mean length of unigenes (bp) 853
Distinct clusters 14,531
Distinct sigletons 34,194
Sequences with E-value < 10-5 51,448
trichocarpa (14.8%), Glycine max (10.3%), and Malus ×domestica (3.7%) (Figure 2C).
Functional classificationWe used GO and KEGG assignments to classify the func-tions of the predicted pear unigenes. Approximately48,725 sequences could be annotated using GO, and36,717 unigenes could be categorized into three main cat-egories: biological process, cellular component, and mo-lecular function. To our knowledge, the apple (Malus ×domestica) genome has been completed. Among theorganisms with completely-sequenced genomes, apple ismost closely related to pear. Therefore, the distribution ofGO annotations in the pear unigene data was comparedwith that of the apple genome (63,517 full lengthsequences) (ftp://ftp.jgi-psf.org/pub/JGI_data/phytozome/v8.0/Mdomestica/annotation/Mdomestica_196_cds.fa.gz)using Blast2GO. The sequences could be categorizedinto 60 GO functional groups (Figure 3). The percen-tages of annotated apple genes assigned to each groupgenerally mirrored those of pear unigenes, reflecting thesimilar functionalities of their genomes and furtherhighlighting that a large diversity of pear unigenes wasrepresented by these sequences. Through sequencecomparison, we observed that, although both specieswere highly similar, significant differences also existedbetween them.There were 29,500 unigenes (approximately 42.5%) that
mapped into 128 KEGG pathways (Additional file 4). Themaps with highest unigene representation were metabolicpathways (KO 01100; 7,043 unigenes, 25.1%), followed bybiosynthesis of secondary metabolites (KO 01110; 3,349unigenes, 11.4%), plant-pathogen interactions (KO 04626;1,531 unigenes, 5.2%), and plant hormone signal transduc-tion (KO 04075; 1,357 unigenes, 4.6%).
DGE library sequencing and mapping sequences to thereference transcriptome databaseUsing the RNA-seq technique, we analyzed changes ingene expression at four times during pear buddormancy. Four DGE libraries (from buds sampled onNov. 15, Dec. 15, Jan. 15, and Feb. 15) were sequencedto generate approximately 13–15 million clean readsper library after filtering the raw reads. The total num-ber of mapped reads in each library ranged from 11.0–12.3 million, and the percentage of these reads rangedfrom 78.8–80.9%. Among them, the number of uniquematch reads ranged from 7.0–7.9 million (Table 2). Toconfirm whether the number of detected genesincreased proportionally to sequencing effort, sequencesaturation analysis was performed. A trend of saturationwhere the number of detected genes almost ceases toincrease when the number of reads reaches 5 million(Additional file 5). We evaluated the randomness of the
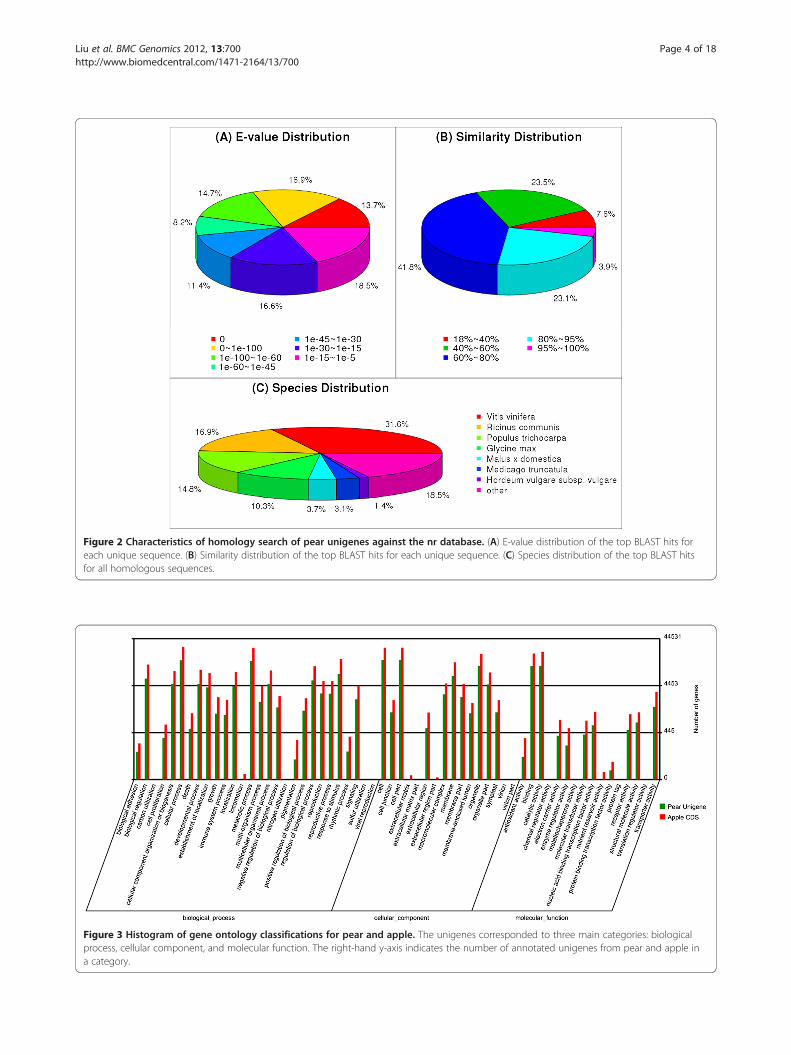
Figure 2 Characteristics of homology search of pear unigenes against the nr database. (A) E-value distribution of the top BLAST hits foreach unique sequence. (B) Similarity distribution of the top BLAST hits for each unique sequence. (C) Species distribution of the top BLAST hitsfor all homologous sequences.
Figure 3 Histogram of gene ontology classifications for pear and apple. The unigenes corresponded to three main categories: biologicalprocess, cellular component, and molecular function. The right-hand y-axis indicates the number of annotated unigenes from pear and apple ina category.
Liu et al. BMC Genomics 2012, 13:700 Page 4 of 18http://www.biomedcentral.com/1471-2164/13/700
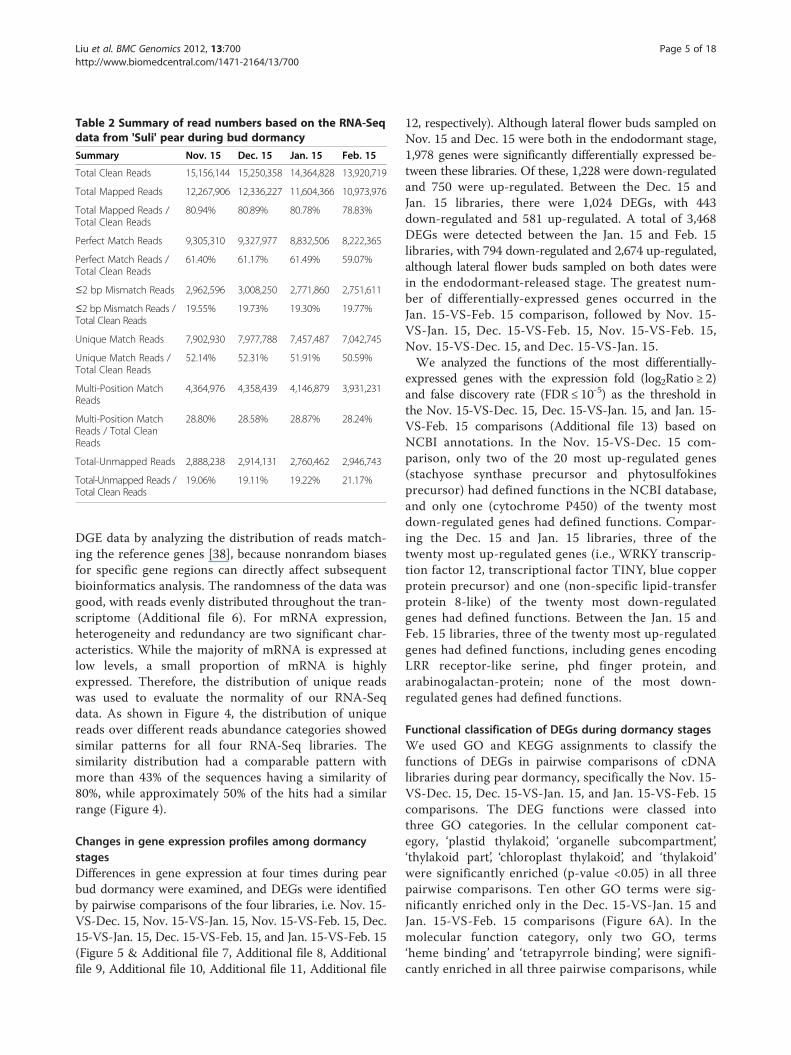
Table 2 Summary of read numbers based on the RNA-Seqdata from 'Suli' pear during bud dormancy
Summary Nov. 15 Dec. 15 Jan. 15 Feb. 15
Total Clean Reads 15,156,144 15,250,358 14,364,828 13,920,719
Total Mapped Reads 12,267,906 12,336,227 11,604,366 10,973,976
Total Mapped Reads /Total Clean Reads
80.94% 80.89% 80.78% 78.83%
Perfect Match Reads 9,305,310 9,327,977 8,832,506 8,222,365
Perfect Match Reads /Total Clean Reads
61.40% 61.17% 61.49% 59.07%
≤2 bp Mismatch Reads 2,962,596 3,008,250 2,771,860 2,751,611
≤2 bp Mismatch Reads /Total Clean Reads
19.55% 19.73% 19.30% 19.77%
Unique Match Reads 7,902,930 7,977,788 7,457,487 7,042,745
Unique Match Reads /Total Clean Reads
52.14% 52.31% 51.91% 50.59%
Multi-Position MatchReads
4,364,976 4,358,439 4,146,879 3,931,231
Multi-Position MatchReads / Total CleanReads
28.80% 28.58% 28.87% 28.24%
Total-Unmapped Reads 2,888,238 2,914,131 2,760,462 2,946,743
Total-Unmapped Reads /Total Clean Reads
19.06% 19.11% 19.22% 21.17%
Liu et al. BMC Genomics 2012, 13:700 Page 5 of 18http://www.biomedcentral.com/1471-2164/13/700
DGE data by analyzing the distribution of reads match-ing the reference genes [38], because nonrandom biasesfor specific gene regions can directly affect subsequentbioinformatics analysis. The randomness of the data wasgood, with reads evenly distributed throughout the tran-scriptome (Additional file 6). For mRNA expression,heterogeneity and redundancy are two significant char-acteristics. While the majority of mRNA is expressed atlow levels, a small proportion of mRNA is highlyexpressed. Therefore, the distribution of unique readswas used to evaluate the normality of our RNA-Seqdata. As shown in Figure 4, the distribution of uniquereads over different reads abundance categories showedsimilar patterns for all four RNA-Seq libraries. Thesimilarity distribution had a comparable pattern withmore than 43% of the sequences having a similarity of80%, while approximately 50% of the hits had a similarrange (Figure 4).
Changes in gene expression profiles among dormancystagesDifferences in gene expression at four times during pearbud dormancy were examined, and DEGs were identifiedby pairwise comparisons of the four libraries, i.e. Nov. 15-VS-Dec. 15, Nov. 15-VS-Jan. 15, Nov. 15-VS-Feb. 15, Dec.15-VS-Jan. 15, Dec. 15-VS-Feb. 15, and Jan. 15-VS-Feb. 15(Figure 5 & Additional file 7, Additional file 8, Additionalfile 9, Additional file 10, Additional file 11, Additional file
12, respectively). Although lateral flower buds sampled onNov. 15 and Dec. 15 were both in the endodormant stage,1,978 genes were significantly differentially expressed be-tween these libraries. Of these, 1,228 were down-regulatedand 750 were up-regulated. Between the Dec. 15 andJan. 15 libraries, there were 1,024 DEGs, with 443down-regulated and 581 up-regulated. A total of 3,468DEGs were detected between the Jan. 15 and Feb. 15libraries, with 794 down-regulated and 2,674 up-regulated,although lateral flower buds sampled on both dates werein the endodormant-released stage. The greatest num-ber of differentially-expressed genes occurred in theJan. 15-VS-Feb. 15 comparison, followed by Nov. 15-VS-Jan. 15, Dec. 15-VS-Feb. 15, Nov. 15-VS-Feb. 15,Nov. 15-VS-Dec. 15, and Dec. 15-VS-Jan. 15.We analyzed the functions of the most differentially-
expressed genes with the expression fold (log2Ratio ≥ 2)and false discovery rate (FDR ≤ 10-5) as the threshold inthe Nov. 15-VS-Dec. 15, Dec. 15-VS-Jan. 15, and Jan. 15-VS-Feb. 15 comparisons (Additional file 13) based onNCBI annotations. In the Nov. 15-VS-Dec. 15 com-parison, only two of the 20 most up-regulated genes(stachyose synthase precursor and phytosulfokinesprecursor) had defined functions in the NCBI database,and only one (cytochrome P450) of the twenty mostdown-regulated genes had defined functions. Compar-ing the Dec. 15 and Jan. 15 libraries, three of thetwenty most up-regulated genes (i.e., WRKY transcrip-tion factor 12, transcriptional factor TINY, blue copperprotein precursor) and one (non-specific lipid-transferprotein 8-like) of the twenty most down-regulatedgenes had defined functions. Between the Jan. 15 andFeb. 15 libraries, three of the twenty most up-regulatedgenes had defined functions, including genes encodingLRR receptor-like serine, phd finger protein, andarabinogalactan-protein; none of the most down-regulated genes had defined functions.
Functional classification of DEGs during dormancy stagesWe used GO and KEGG assignments to classify thefunctions of DEGs in pairwise comparisons of cDNAlibraries during pear dormancy, specifically the Nov. 15-VS-Dec. 15, Dec. 15-VS-Jan. 15, and Jan. 15-VS-Feb. 15comparisons. The DEG functions were classed intothree GO categories. In the cellular component cat-egory, ‘plastid thylakoid’, ‘organelle subcompartment’,‘thylakoid part’, ‘chloroplast thylakoid’, and ‘thylakoid’were significantly enriched (p-value <0.05) in all threepairwise comparisons. Ten other GO terms were sig-nificantly enriched only in the Dec. 15-VS-Jan. 15 andJan. 15-VS-Feb. 15 comparisons (Figure 6A). In themolecular function category, only two GO, terms‘heme binding’ and ‘tetrapyrrole binding’, were signifi-cantly enriched in all three pairwise comparisons, while
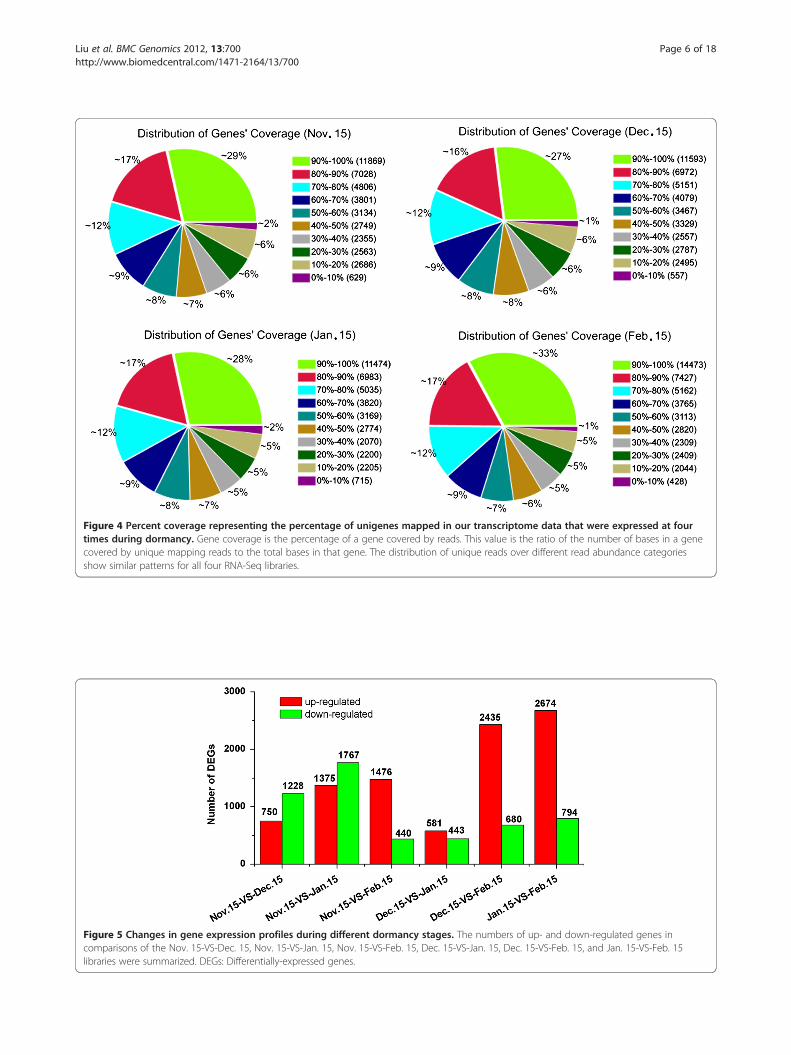
Figure 5 Changes in gene expression profiles during different dormancy stages. The numbers of up- and down-regulated genes incomparisons of the Nov. 15-VS-Dec. 15, Nov. 15-VS-Jan. 15, Nov. 15-VS-Feb. 15, Dec. 15-VS-Jan. 15, Dec. 15-VS-Feb. 15, and Jan. 15-VS-Feb. 15libraries were summarized. DEGs: Differentially-expressed genes.
Figure 4 Percent coverage representing the percentage of unigenes mapped in our transcriptome data that were expressed at fourtimes during dormancy. Gene coverage is the percentage of a gene covered by reads. This value is the ratio of the number of bases in a genecovered by unique mapping reads to the total bases in that gene. The distribution of unique reads over different read abundance categoriesshow similar patterns for all four RNA-Seq libraries.
Liu et al. BMC Genomics 2012, 13:700 Page 6 of 18http://www.biomedcentral.com/1471-2164/13/700
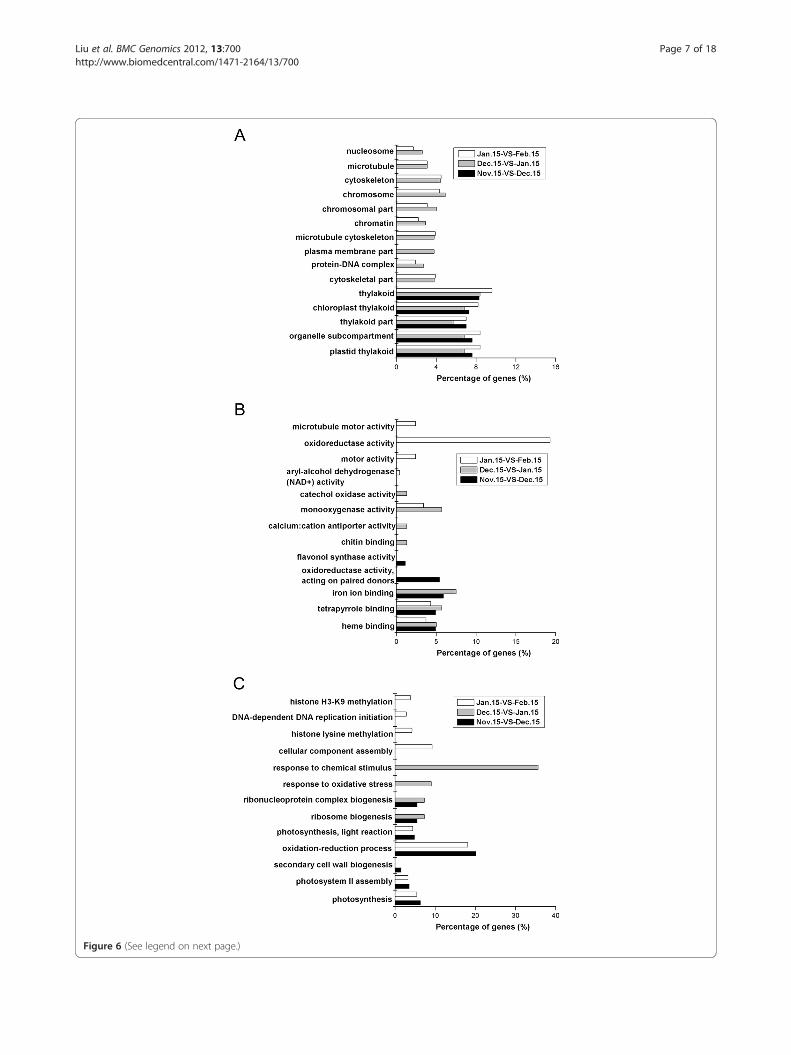
Figure 6 (See legend on next page.)
Liu et al. BMC Genomics 2012, 13:700 Page 7 of 18http://www.biomedcentral.com/1471-2164/13/700
(See figure on previous page.)Figure 6 Functional categories of differentially-expressed genes in the Gene Ontology. GO categories that were significantly enriched(p-value < 0.05) were analyzed in pairwise comparisons (Nov. 15-VS-Dec. 15, Dec. 15-VS-Jan. 15, and Jan. 15-VS-Feb. 15). Percentages are based onthe proportion of genes in each set. A: Cellular component; B: Molecular function; C: Biological process.
Liu et al. BMC Genomics 2012, 13:700 Page 8 of 18http://www.biomedcentral.com/1471-2164/13/700
‘monooxygenase activity’ was significantly enriched in theDec. 15-VS-Jan. 15 and Jan. 15-VS-Feb comparisons(Figure 6B). In the biological process category, no GOterms were significantly enriched in all three pairwisecomparisons, but ‘photosynthesis’, ‘photosystem II as-sembly’, ‘oxidation-reduction process’, and ‘photosyn-thesis, light reaction’ were significantly enriched in theNov. 15-VS-Dec. 15 and Jan. 15-VS-Feb. 15 comparisons,and ‘ribosome biogenesis’ and ‘ribonucleoprotein complexbiogenesis’ were enriched in the Nov. 15-VS-Dec. 15 andDec. 15-VS-Jan. 15 comparisons (Figure 6C).In the Nov. 15-VS-Dec. 15, Dec. 15-VS-Jan. 15, and
Jan. 15-VS-Feb. 15 comparisons, 666, 393, and 1,223 DEGsmapped to 104, 92, and 117 KEGG pathways, respectively.Of the 666 DEGs in the Nov. 15-VS-Dec. 15 comparison,599 (89.9%) mapped to 15 pathways (Additional file 14).Remarkably, specific enrichment of unigenes was observedfor 15 pathways involved in metabolic processes, such asphenylpropanoid biosynthesis, ether lipid metabolism,ribosome, cutin, suberine and wax biosynthesis, stilbenoid,diarylheptanoid and gingerol biosynthesis, endocytosis,glycerophospholipid metabolism, oxidative phosphoryl-ation, zeatin biosynthesis, flavonoid biosynthesis, starchand sucrose metabolism, fructose and mannose metabol-ism, other glycan degradation, and pentose and glucuron-ate interconversions. Comparing the Dec. 15 and Jan. 15libraries, 343 (87.3%) DEGs were identified in 6 pathways:ribosome, ether lipid metabolism, glycerophospholipidmetabolism, endocytosis, plant-pathogen interaction,and metabolic pathways (Additional file 14). In theJan. 15-VS-Feb. 15 comparison, 793 (64.8%) DEGswere significantly enriched in 15 pathways (Additionalfile 14).
Clustering analysis of DEGs during dormancy stagesGenes with similar expression patterns are usually func-tionally correlated. To understand the expression pat-terns of 190 genes that were significantly-differentiallyexpressed (Additional file 15) at different times in peardormancy, cluster analyses of gene expression patternsin the Nov. 15-VS-Dec. 15, Dec. 15-VS-Jan. 15, andJan. 15-VS-Feb. 15 comparisons were performed. Thesegenes were arranged into seven groups (Figure 7). Thelargest group (Group 2) comprised the 60 (31.6%) genes,from CL 12006 to unigene 21076, that were up-regulated from Nov. 15 to Dec. 15, down-regulatedbetween Dec. 15 and Jan. 15, then up-regulated againbetween Jan. 15 and Feb. 15. This group mainlyincluded genes encoding proteins associated with
ribosomes, such as 60S ribosomal protein, 40S riboso-mal protein, translation initiation factor eIF-5A, ATPbinding protein, and transaldolase.The second largest group (Group 4) contained 56
(29.5%) genes, from CL 12859 to CL 9922, that weredown-regulated from Nov. 15 to Jan. 15 then up-regulatedbetween Jan. 15 and Feb. 15. This group mainlyincluded genes encoding proteins associated withphotosynthesis metabolism, such as chlorophyll A/Bbinding protein, photosystem I reaction center subunitIII, photosystem I reaction center subunit IV A, plasto-cyanin A, chloroplast oxygen-evolving enhancer protein1, ribulose bisphosphate carboxylase, cytochrome P450,and magnesium-protoporphyrin IX monomethyl estercyclase. Additionally, zinc finger protein, SPL domainclass transcription factor, and basic helix-loop-helixdomain-containing protein were encoded.The third largest group (Group 5) contained 30
(15.8%) genes, from CL 10 to unigene 27694, that wereup-regulated from Nov. 15 to Jan. 15, then down-regulated between Jan. 15 and Feb. 15. This groupmainly included genes encoding proteins associatedwith oxidation-reduction reaction and resistance, suchas blue copper protein, 2-oxoglutarate-dependent diox-ygenase, cytochrome P450, heat shock protein, glycinerich protein, and dehydrin 1.In Group 6, 17 genes (8.9%), from CL 13025 to
unigene 26541, were up-regulated between Nov. 15 andDec. 15, but were down-regulated between Dec. 15 andJan. 15 and between Jan. 15 and Feb. 15. This groupmainly involved in genes encoding dehydration-responsive element-binding protein, galactinol synthase1, and GA2-oxidase.In Group 7, 18 genes (9.5%), from CL 1316 to unigene
12417, were down-regulated between Nov. 15 and Dec. 15and between Jan. 15 and Feb. 15 but were up-regulatedbetween Dec. 15 and Jan. 15. These genes encodedproteins including fructose-bisphosphate aldolase cyto-plasmic isozyme, tyrosine-protein phosphatase SIW14,glycerol-3-phosphate transporter, NAC domain classtranscription factor, WRKY domain class transcriptionfactor, and AP2 domain class transcription factor.In Group 3, seven genes were down-regulated from
Nov. 15 to Dec. 15, but were up-regulated betweenDec. 15 and Feb. 15. Finally, two genes (Group 1) wereup-regulated from Nov. 15 to Dec. 15, but were down-regulated between Jan. 15 and Feb. 15. Of these ninegenes, only 2-aminoethanethiol dioxygenase isoform 2and transferase were definitely annotated.
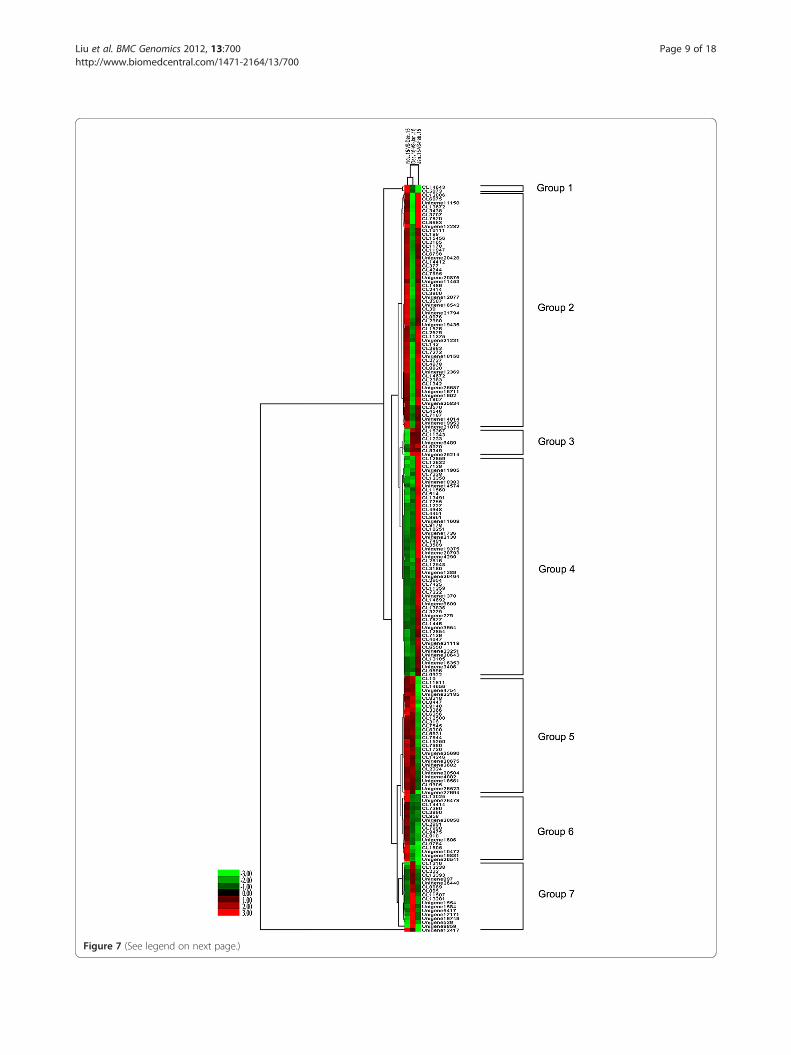
Figure 7 (See legend on next page.)
Liu et al. BMC Genomics 2012, 13:700 Page 9 of 18http://www.biomedcentral.com/1471-2164/13/700
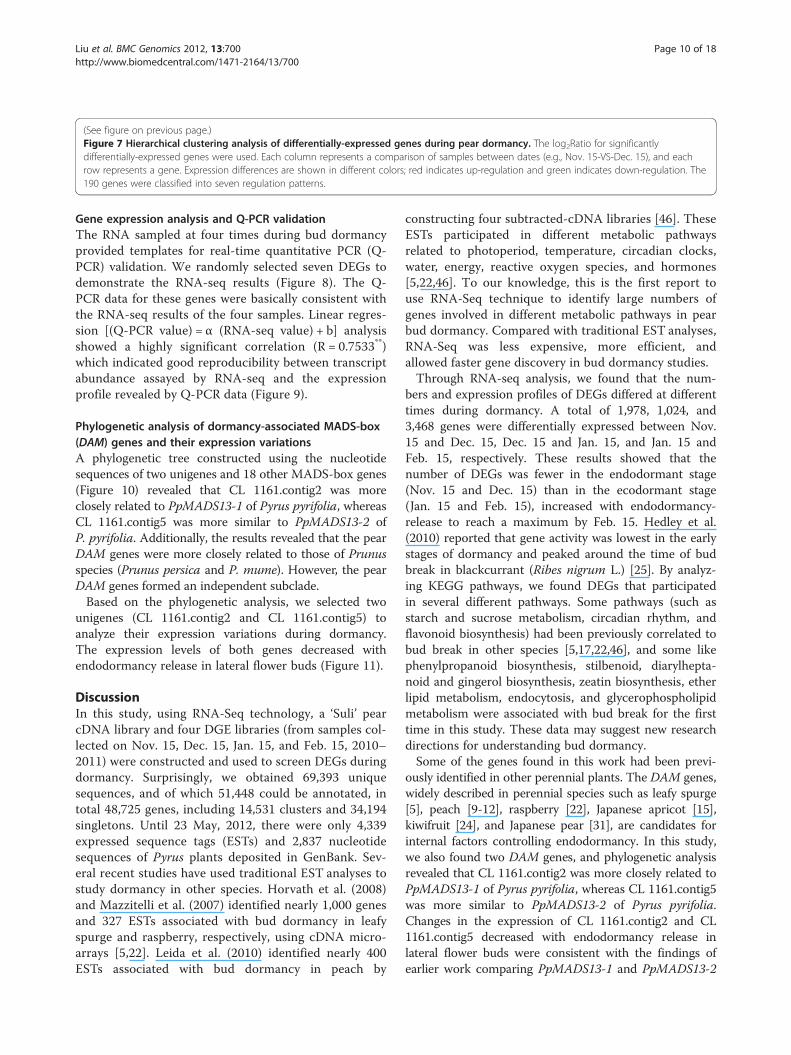
(See figure on previous page.)Figure 7 Hierarchical clustering analysis of differentially-expressed genes during pear dormancy. The log2Ratio for significantlydifferentially-expressed genes were used. Each column represents a comparison of samples between dates (e.g., Nov. 15-VS-Dec. 15), and eachrow represents a gene. Expression differences are shown in different colors; red indicates up-regulation and green indicates down-regulation. The190 genes were classified into seven regulation patterns.
Liu et al. BMC Genomics 2012, 13:700 Page 10 of 18http://www.biomedcentral.com/1471-2164/13/700
Gene expression analysis and Q-PCR validationThe RNA sampled at four times during bud dormancyprovided templates for real-time quantitative PCR (Q-PCR) validation. We randomly selected seven DEGs todemonstrate the RNA-seq results (Figure 8). The Q-PCR data for these genes were basically consistent withthe RNA-seq results of the four samples. Linear regres-sion [(Q-PCR value) = α (RNA-seq value) + b] analysisshowed a highly significant correlation (R = 0.7533**)which indicated good reproducibility between transcriptabundance assayed by RNA-seq and the expressionprofile revealed by Q-PCR data (Figure 9).
Phylogenetic analysis of dormancy-associated MADS-box(DAM) genes and their expression variationsA phylogenetic tree constructed using the nucleotidesequences of two unigenes and 18 other MADS-box genes(Figure 10) revealed that CL 1161.contig2 was moreclosely related to PpMADS13-1 of Pyrus pyrifolia, whereasCL 1161.contig5 was more similar to PpMADS13-2 ofP. pyrifolia. Additionally, the results revealed that the pearDAM genes were more closely related to those of Prunusspecies (Prunus persica and P. mume). However, the pearDAM genes formed an independent subclade.Based on the phylogenetic analysis, we selected two
unigenes (CL 1161.contig2 and CL 1161.contig5) toanalyze their expression variations during dormancy.The expression levels of both genes decreased withendodormancy release in lateral flower buds (Figure 11).
DiscussionIn this study, using RNA-Seq technology, a ‘Suli’ pearcDNA library and four DGE libraries (from samples col-lected on Nov. 15, Dec. 15, Jan. 15, and Feb. 15, 2010–2011) were constructed and used to screen DEGs duringdormancy. Surprisingly, we obtained 69,393 uniquesequences, and of which 51,448 could be annotated, intotal 48,725 genes, including 14,531 clusters and 34,194singletons. Until 23 May, 2012, there were only 4,339expressed sequence tags (ESTs) and 2,837 nucleotidesequences of Pyrus plants deposited in GenBank. Sev-eral recent studies have used traditional EST analyses tostudy dormancy in other species. Horvath et al. (2008)and Mazzitelli et al. (2007) identified nearly 1,000 genesand 327 ESTs associated with bud dormancy in leafyspurge and raspberry, respectively, using cDNA micro-arrays [5,22]. Leida et al. (2010) identified nearly 400ESTs associated with bud dormancy in peach by
constructing four subtracted-cDNA libraries [46]. TheseESTs participated in different metabolic pathwaysrelated to photoperiod, temperature, circadian clocks,water, energy, reactive oxygen species, and hormones[5,22,46]. To our knowledge, this is the first report touse RNA-Seq technique to identify large numbers ofgenes involved in different metabolic pathways in pearbud dormancy. Compared with traditional EST analyses,RNA-Seq was less expensive, more efficient, andallowed faster gene discovery in bud dormancy studies.Through RNA-seq analysis, we found that the num-
bers and expression profiles of DEGs differed at differenttimes during dormancy. A total of 1,978, 1,024, and3,468 genes were differentially expressed between Nov.15 and Dec. 15, Dec. 15 and Jan. 15, and Jan. 15 andFeb. 15, respectively. These results showed that thenumber of DEGs was fewer in the endodormant stage(Nov. 15 and Dec. 15) than in the ecodormant stage(Jan. 15 and Feb. 15), increased with endodormancy-release to reach a maximum by Feb. 15. Hedley et al.(2010) reported that gene activity was lowest in the earlystages of dormancy and peaked around the time of budbreak in blackcurrant (Ribes nigrum L.) [25]. By analyz-ing KEGG pathways, we found DEGs that participatedin several different pathways. Some pathways (such asstarch and sucrose metabolism, circadian rhythm, andflavonoid biosynthesis) had been previously correlated tobud break in other species [5,17,22,46], and some likephenylpropanoid biosynthesis, stilbenoid, diarylhepta-noid and gingerol biosynthesis, zeatin biosynthesis, etherlipid metabolism, endocytosis, and glycerophospholipidmetabolism were associated with bud break for the firsttime in this study. These data may suggest new researchdirections for understanding bud dormancy.Some of the genes found in this work had been previ-
ously identified in other perennial plants. The DAM genes,widely described in perennial species such as leafy spurge[5], peach [9-12], raspberry [22], Japanese apricot [15],kiwifruit [24], and Japanese pear [31], are candidates forinternal factors controlling endodormancy. In this study,we also found two DAM genes, and phylogenetic analysisrevealed that CL 1161.contig2 was more closely related toPpMADS13-1 of Pyrus pyrifolia, whereas CL 1161.contig5was more similar to PpMADS13-2 of Pyrus pyrifolia.Changes in the expression of CL 1161.contig2 and CL1161.contig5 decreased with endodormancy release inlateral flower buds were consistent with the findings ofearlier work comparing PpMADS13-1 and PpMADS13-2
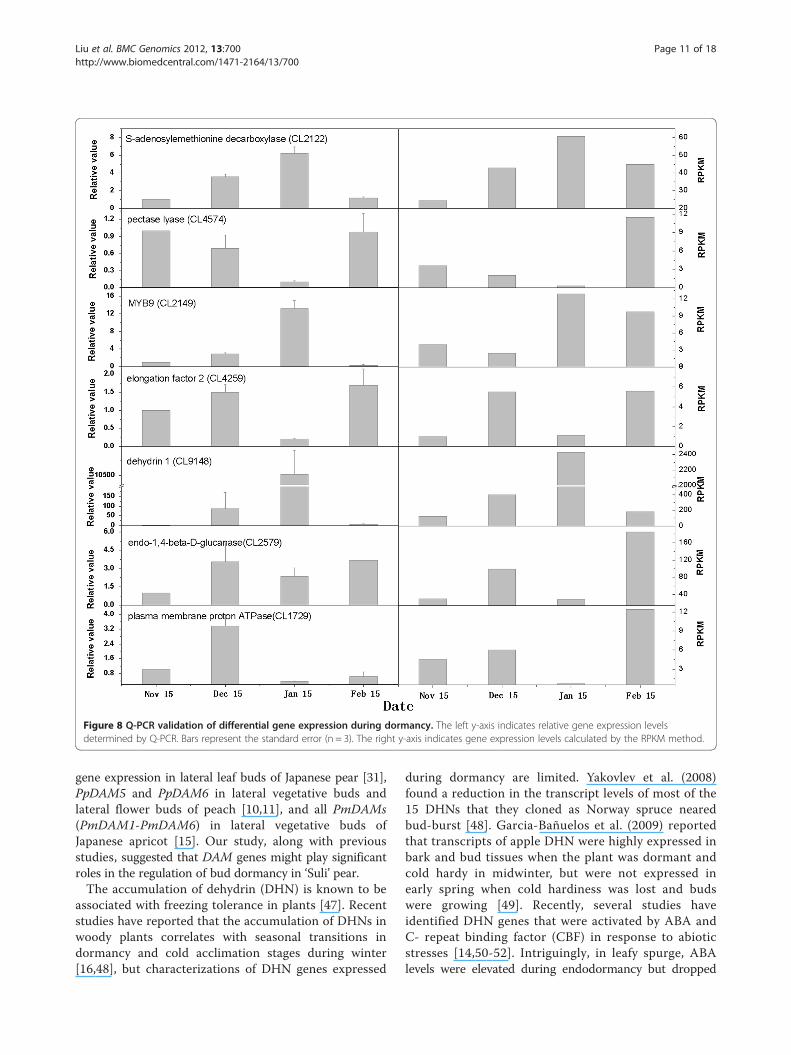
Figure 8 Q-PCR validation of differential gene expression during dormancy. The left y-axis indicates relative gene expression levelsdetermined by Q-PCR. Bars represent the standard error (n = 3). The right y-axis indicates gene expression levels calculated by the RPKM method.
Liu et al. BMC Genomics 2012, 13:700 Page 11 of 18http://www.biomedcentral.com/1471-2164/13/700
gene expression in lateral leaf buds of Japanese pear [31],PpDAM5 and PpDAM6 in lateral vegetative buds andlateral flower buds of peach [10,11], and all PmDAMs(PmDAM1-PmDAM6) in lateral vegetative buds ofJapanese apricot [15]. Our study, along with previousstudies, suggested that DAM genes might play significantroles in the regulation of bud dormancy in ‘Suli’ pear.The accumulation of dehydrin (DHN) is known to be
associated with freezing tolerance in plants [47]. Recentstudies have reported that the accumulation of DHNs inwoody plants correlates with seasonal transitions indormancy and cold acclimation stages during winter[16,48], but characterizations of DHN genes expressed
during dormancy are limited. Yakovlev et al. (2008)found a reduction in the transcript levels of most of the15 DHNs that they cloned as Norway spruce nearedbud-burst [48]. Garcia-Bañuelos et al. (2009) reportedthat transcripts of apple DHN were highly expressed inbark and bud tissues when the plant was dormant andcold hardy in midwinter, but were not expressed inearly spring when cold hardiness was lost and budswere growing [49]. Recently, several studies haveidentified DHN genes that were activated by ABA andC- repeat binding factor (CBF) in response to abioticstresses [14,50-52]. Intriguingly, in leafy spurge, ABAlevels were elevated during endodormancy but dropped
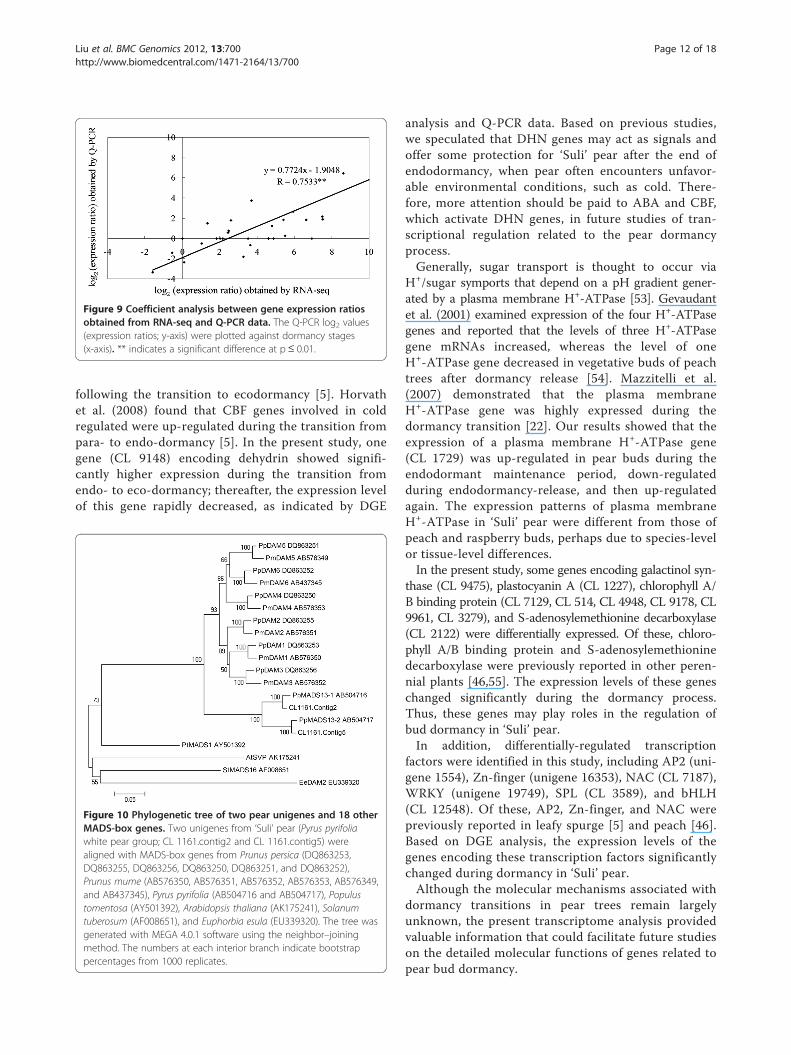
Figure 9 Coefficient analysis between gene expression ratiosobtained from RNA-seq and Q-PCR data. The Q-PCR log2 values(expression ratios; y-axis) were plotted against dormancy stages(x-axis). ** indicates a significant difference at p≤ 0.01.
Liu et al. BMC Genomics 2012, 13:700 Page 12 of 18http://www.biomedcentral.com/1471-2164/13/700
following the transition to ecodormancy [5]. Horvathet al. (2008) found that CBF genes involved in coldregulated were up-regulated during the transition frompara- to endo-dormancy [5]. In the present study, onegene (CL 9148) encoding dehydrin showed signifi-cantly higher expression during the transition fromendo- to eco-dormancy; thereafter, the expression levelof this gene rapidly decreased, as indicated by DGE
Figure 10 Phylogenetic tree of two pear unigenes and 18 otherMADS-box genes. Two unigenes from ‘Suli’ pear (Pyrus pyrifoliawhite pear group; CL 1161.contig2 and CL 1161.contig5) werealigned with MADS-box genes from Prunus persica (DQ863253,DQ863255, DQ863256, DQ863250, DQ863251, and DQ863252),Prunus mume (AB576350, AB576351, AB576352, AB576353, AB576349,and AB437345), Pyrus pyrifolia (AB504716 and AB504717), Populustomentosa (AY501392), Arabidopsis thaliana (AK175241), Solanumtuberosum (AF008651), and Euphorbia esula (EU339320). The tree wasgenerated with MEGA 4.0.1 software using the neighbor–joiningmethod. The numbers at each interior branch indicate bootstrappercentages from 1000 replicates.
analysis and Q-PCR data. Based on previous studies,we speculated that DHN genes may act as signals andoffer some protection for ‘Suli’ pear after the end ofendodormancy, when pear often encounters unfavor-able environmental conditions, such as cold. There-fore, more attention should be paid to ABA and CBF,which activate DHN genes, in future studies of tran-scriptional regulation related to the pear dormancyprocess.Generally, sugar transport is thought to occur via
H+/sugar symports that depend on a pH gradient gener-ated by a plasma membrane H+-ATPase [53]. Gevaudantet al. (2001) examined expression of the four H+-ATPasegenes and reported that the levels of three H+-ATPasegene mRNAs increased, whereas the level of oneH+-ATPase gene decreased in vegetative buds of peachtrees after dormancy release [54]. Mazzitelli et al.(2007) demonstrated that the plasma membraneH+-ATPase gene was highly expressed during thedormancy transition [22]. Our results showed that theexpression of a plasma membrane H+-ATPase gene(CL 1729) was up-regulated in pear buds during theendodormant maintenance period, down-regulatedduring endodormancy-release, and then up-regulatedagain. The expression patterns of plasma membraneH+-ATPase in ‘Suli’ pear were different from those ofpeach and raspberry buds, perhaps due to species-levelor tissue-level differences.In the present study, some genes encoding galactinol syn-
thase (CL 9475), plastocyanin A (CL 1227), chlorophyll A/B binding protein (CL 7129, CL 514, CL 4948, CL 9178, CL9961, CL 3279), and S-adenosylemethionine decarboxylase(CL 2122) were differentially expressed. Of these, chloro-phyll A/B binding protein and S-adenosylemethioninedecarboxylase were previously reported in other peren-nial plants [46,55]. The expression levels of these geneschanged significantly during the dormancy process.Thus, these genes may play roles in the regulation ofbud dormancy in ‘Suli’ pear.In addition, differentially-regulated transcription
factors were identified in this study, including AP2 (uni-gene 1554), Zn-finger (unigene 16353), NAC (CL 7187),WRKY (unigene 19749), SPL (CL 3589), and bHLH(CL 12548). Of these, AP2, Zn-finger, and NAC werepreviously reported in leafy spurge [5] and peach [46].Based on DGE analysis, the expression levels of thegenes encoding these transcription factors significantlychanged during dormancy in ‘Suli’ pear.Although the molecular mechanisms associated with
dormancy transitions in pear trees remain largelyunknown, the present transcriptome analysis providedvaluable information that could facilitate future studieson the detailed molecular functions of genes related topear bud dormancy.
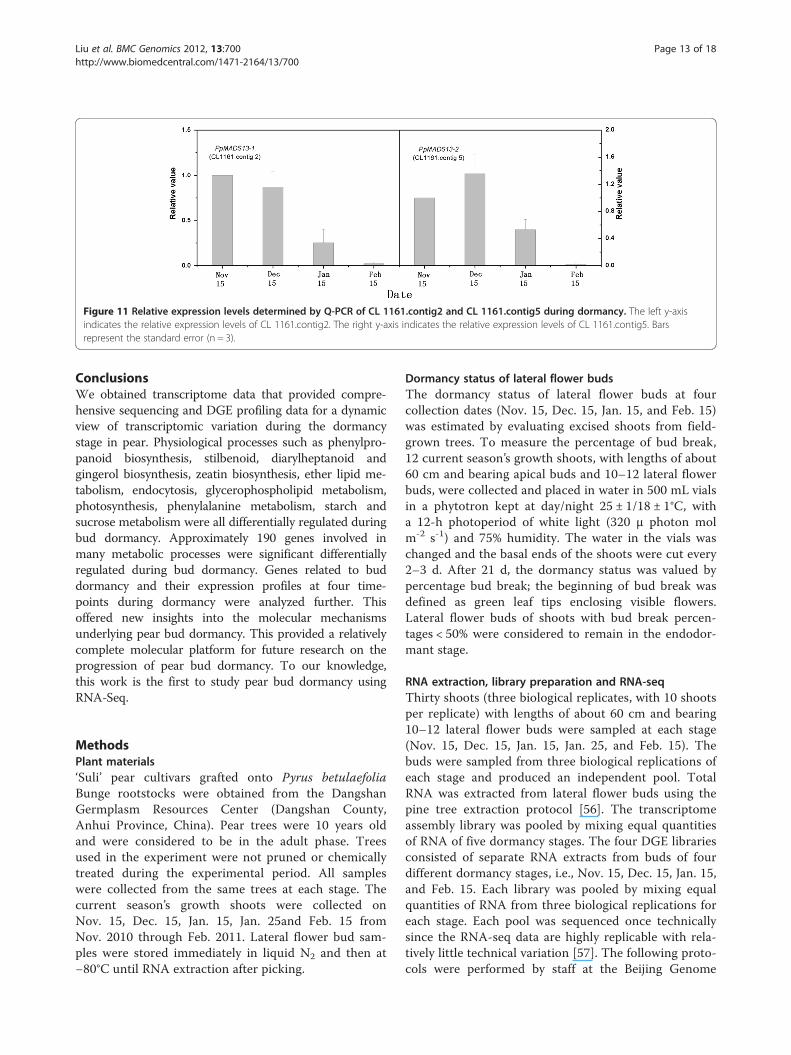
Figure 11 Relative expression levels determined by Q-PCR of CL 1161.contig2 and CL 1161.contig5 during dormancy. The left y-axisindicates the relative expression levels of CL 1161.contig2. The right y-axis indicates the relative expression levels of CL 1161.contig5. Barsrepresent the standard error (n = 3).
Liu et al. BMC Genomics 2012, 13:700 Page 13 of 18http://www.biomedcentral.com/1471-2164/13/700
ConclusionsWe obtained transcriptome data that provided compre-hensive sequencing and DGE profiling data for a dynamicview of transcriptomic variation during the dormancystage in pear. Physiological processes such as phenylpro-panoid biosynthesis, stilbenoid, diarylheptanoid andgingerol biosynthesis, zeatin biosynthesis, ether lipid me-tabolism, endocytosis, glycerophospholipid metabolism,photosynthesis, phenylalanine metabolism, starch andsucrose metabolism were all differentially regulated duringbud dormancy. Approximately 190 genes involved inmany metabolic processes were significant differentiallyregulated during bud dormancy. Genes related to buddormancy and their expression profiles at four time-points during dormancy were analyzed further. Thisoffered new insights into the molecular mechanismsunderlying pear bud dormancy. This provided a relativelycomplete molecular platform for future research on theprogression of pear bud dormancy. To our knowledge,this work is the first to study pear bud dormancy usingRNA-Seq.
MethodsPlant materials‘Suli’ pear cultivars grafted onto Pyrus betulaefoliaBunge rootstocks were obtained from the DangshanGermplasm Resources Center (Dangshan County,Anhui Province, China). Pear trees were 10 years oldand were considered to be in the adult phase. Treesused in the experiment were not pruned or chemicallytreated during the experimental period. All sampleswere collected from the same trees at each stage. Thecurrent season’s growth shoots were collected onNov. 15, Dec. 15, Jan. 15, Jan. 25and Feb. 15 fromNov. 2010 through Feb. 2011. Lateral flower bud sam-ples were stored immediately in liquid N2 and then at−80°C until RNA extraction after picking.
Dormancy status of lateral flower budsThe dormancy status of lateral flower buds at fourcollection dates (Nov. 15, Dec. 15, Jan. 15, and Feb. 15)was estimated by evaluating excised shoots from field-grown trees. To measure the percentage of bud break,12 current season’s growth shoots, with lengths of about60 cm and bearing apical buds and 10–12 lateral flowerbuds, were collected and placed in water in 500 mL vialsin a phytotron kept at day/night 25 ± 1/18 ± 1°C, witha 12-h photoperiod of white light (320 μ photon molm-2 s-1) and 75% humidity. The water in the vials waschanged and the basal ends of the shoots were cut every2–3 d. After 21 d, the dormancy status was valued bypercentage bud break; the beginning of bud break wasdefined as green leaf tips enclosing visible flowers.Lateral flower buds of shoots with bud break percen-tages < 50% were considered to remain in the endodor-mant stage.
RNA extraction, library preparation and RNA-seqThirty shoots (three biological replicates, with 10 shootsper replicate) with lengths of about 60 cm and bearing10–12 lateral flower buds were sampled at each stage(Nov. 15, Dec. 15, Jan. 15, Jan. 25, and Feb. 15). Thebuds were sampled from three biological replications ofeach stage and produced an independent pool. TotalRNA was extracted from lateral flower buds using thepine tree extraction protocol [56]. The transcriptomeassembly library was pooled by mixing equal quantitiesof RNA of five dormancy stages. The four DGE librariesconsisted of separate RNA extracts from buds of fourdifferent dormancy stages, i.e., Nov. 15, Dec. 15, Jan. 15,and Feb. 15. Each library was pooled by mixing equalquantities of RNA from three biological replications foreach stage. Each pool was sequenced once technicallysince the RNA-seq data are highly replicable with rela-tively little technical variation [57]. The following proto-cols were performed by staff at the Beijing Genome
Liu et al. BMC Genomics 2012, 13:700 Page 14 of 18http://www.biomedcentral.com/1471-2164/13/700
Institute (BGI; Shenzhen, China). RNA integrity was con-firmed with a 2100 Bioanalyzer (Agilent Technologies,Santa Clara, CA, USA). Oligo-(dT) magnetic beads wereused to isolate poly-(A) mRNA from total RNA, andmRNA was fragmented in fragmentation buffer. Usingthese short fragments (≈200 bp) as templates, randomhexamer-primers were used to synthesize first-strandcDNA. Second-strand cDNA was synthesized usingbuffer, dNTPs, RNaseH, and DNA polymerase I. Shortdouble-stranded cDNA fragments were purified withQiaQuick PCR extraction kit (Qiagen, Venlo, TheNetherlands), resolved with EB buffer for end reparationand adding poly (A), then ligated to sequencing adapters.After purification via agarose gel electrophoresis, suitablefragments were enriched by PCR amplification beforelibrary sequencing using Illumina HiSeq™ 2000 (SanDiego, CA, USA).
De novo assembly and function annotationRaw sequence data in fastq format were filtered to removereads containing adaptors, reads with more than 5% un-known nucleotides, and low-quality reads with more than20% bases of quality value ≤ 10. Only clean reads wereused in the following analysis. The sequences from theIllumina sequencing were deposited in the NCBI Se-quence Read Archive (Accession SRX147917). First, tran-scriptome de novo assembly was carried out by BGI usingthe short-read assembly program Trinity [58] with the fol-lowing parameters: min_contig_length = 100, min_glue =2, group_pairs_distance = 250, path_reinforcement_dis-tance = 75, bfly_opts = '-V 5 –edge-thr = 0.05 –stderr',min_kmer_cov = 2. Meanwhile, all reads of approxi-mately 100 M (i.e. transcriptome sequencing reads andRNA-Seq reads) were mapped back to the apple genomereference (ftp://ftp.jgi-psf.org/pub/JGI_data/phytozome/v8.0/Mdomestica/assembly/Mdomestica_196.fa.gz) toidentify continuous gene regions using SOAPsplice soft-ware (Release 1.9; http://soap.genomics.org.cn/soapsplice.html). Secondly, we realigned all the transcripts onto thereference genome. When more than one transcript wereplaced in one gene region and they each other had anoverlap less than 24 bp, we connected them into a longertranscript. A total of 31,727 transcripts assembled byTrinity were connected into 19,309 transcripts. Then theredundancy of unigenes was removed by TGICL (v.2.1)with options ‘-l 40 -v 25’. Finally based on gene familyclustering, the unigenes were divided into two classes:clusters and singletons. The former was prefixed with 'CL'and the latter with 'unigene'. The id number of eachunigene followed this prefix. In a cluster, the similaritybetween unigenes was more than 70%.Blastx alignment (E-value < 10-5) between unigenes
and protein databases such as nr, Swiss-Prot, KEGG,and GO was performed, and the best-aligning results
were used to determine the sequence direction of uni-genes. When different databases conflicted, the resultswere prioritized in the order: nr, Swiss-Prot, KEGG, andGO. When a unigene did not align to any of the data-bases, ESTScan [59] was used to decide its sequencedirection. GO annotation was analyzed by Blast2GO soft-ware (v.2.5.0). KEGG pathway annotation was performedusing Blastall software against the KEGG database. Theassembled sequences could be searched using the Gene-ID listed in Additional materials (Additional file 3).
Analysis and mapping of DGE readsRaw sequence data in fastq format were filtered toremove reads containing adaptors, reads with more than10% unknown nucleotides, and low-quality reads withmore than 50% bases of quality value ≤ 5. The sequencesfrom the DGE analysis were deposited in the NCBISequence Read Archive under accession numbersSRX148326 (Nov. 15), SRX148327 (Dec. 15), SRX148328(Jan. 15), and SRX148329 (Feb. 15). Clean reads weremapped to our transcriptome reference database usingthe short oligonucleotide analysis package SOAPaligner/soap2 [60], allowing mismatches of no more than twobases. The unique mapped reads were used in subse-quent analyses. For gene expression analysis, the numberof unique-match reads was calculated and then normal-ized to RPKM (reads per kb per million reads) [61]. TheRPKM method eliminates the influence of different genelengths and sequencing discrepancies on the calculationof gene expression, so that the calculated gene expres-sions can be directly compared among samples.
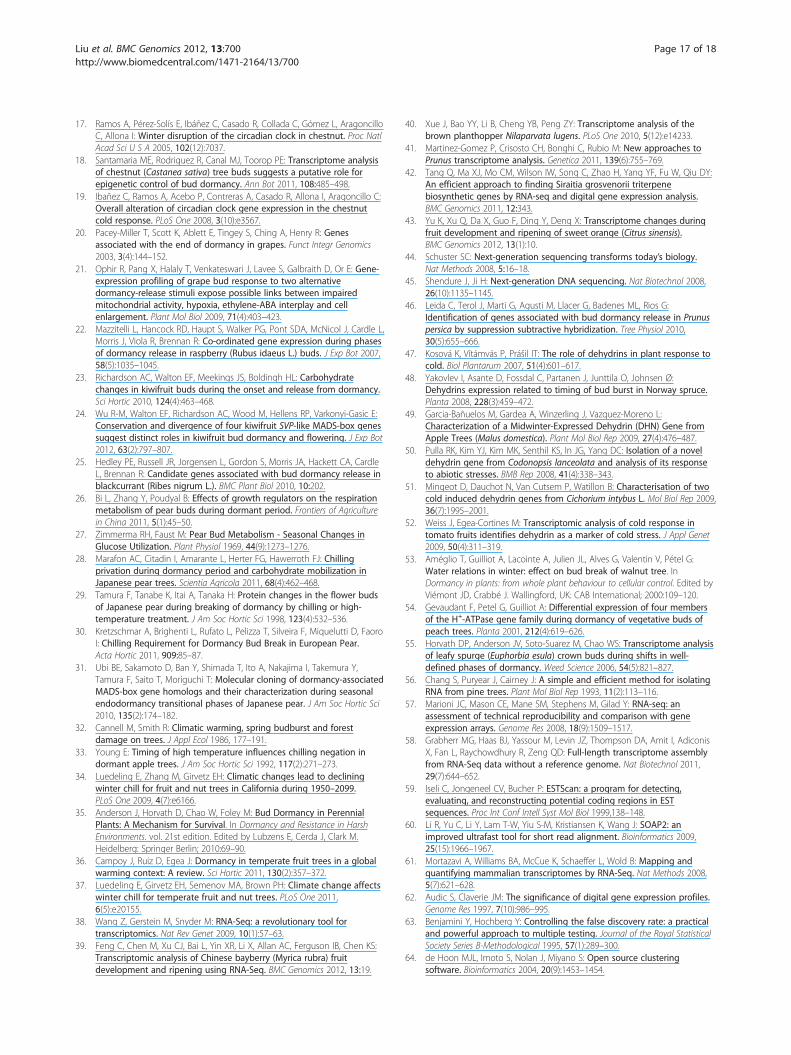
Evaluation of DGE librariesA statistical analysis of the frequency of each unique-match read in each DGE library was performed tocompare gene expression at different times in peardormancy using the method described by Audic et al.[62]. The P value was used to identify genes expresseddifferentially between each samples following theformula below, in which N1 and N2 represent the totalnumbers of unique-match reads in Samples 1 and 2, re-spectively, and gene A contained x and y unique-matchreads mapped to Samples 1 and 2, respectively. EnrichedP-values were calculated according to the hypergeo-metric test [62]:
2Xi¼y
i¼0
pðijxÞ ifXi¼y
i�0
pði xj Þ≤0:5!or
2� 1�
Xi¼y
i¼0
pði xj Þ!
ifXi¼y
i¼0
pði xj Þ > 0:5
!
� �y
Liu et al. BMC Genomics 2012, 13:700 Page 15 of 18http://www.biomedcentral.com/1471-2164/13/700
pðy xj Þ ¼ N2
N1
xþ yð Þ!x!y! 1þ N2
N1
� � xþyþ1ð Þ
The false discovery rate (FDR) was used to determinethe P-value threshold in multiple testing [63]. Briefly,assuming that R differentially expressed genes had beenselected, S genes of those were really shown differentialexpression, whereas the other V genes actually indicatedno difference which were false positive. If the error ratio(Q = V/R) was required to remain below a specifiedcutoff (0.01), the FDR value should not exceed 0.01.FDR-values were calculated according to the Benjaminiand Hochberg algorithm [63]:
FDR ¼ E Qð Þ ¼ E V= V þ Sð Þf g ¼ E V=Rð ÞWe used FDR ≤ 0.001, the absolute value of log2Ratio ≥
1, and the RPKM value of each gene for either sampleover 10 as the thresholds to judge the significance ofgene expression differences, where log2Ratio indicatesthe degree of differential expression between two sam-ples and was the ratio of RPKM values for the treatmentand control samples. This analysis found genes withsignificantly differential expression among samples priorto GO function and KEGG pathway analyses.
Clustering of gene expression profilesHierarchical cluster analysis of 190 gene expression pat-terns was performed with cluster [64] and Java Treeview[65] software. The log2Ratio for each gene was used forthe hierarchical clustering analysis.
Phylogenetic analysisA phylogenetic tree was constructed based on thenucleotide sequences of two unigenes and 18 additionalDAM genes. The tree was generated with MEGA (v. 4.0.1)[66] software, using the neighbor-joining method.
Real-time quantitative RT-PCR analysisTotal RNA used for Q-PCR analysis was extracted fromlateral flower buds of four different dormancy stages, i.e.,Nov. 15, Dec. 15, Jan. 15, and Feb. 15, using three bio-logical replicates of about 300 buds. Total RNA wasextracted as described above, genomic DNA was removedwith DNase I, and total RNA concentration was mea-sured. First-strand cDNA was synthesized from 4 μg ofDNA-free RNA using the Revert Aid™ First Strand cDNASynthesis Kit (Fermentas, Glen Burnie, MD, USA) accord-ing to the manufacturer’s instructions. The cDNA wasused as the template for Q-PCR. Primer sequences(designed using primer 3, http://frodo.wi.mit.edu/cgi-bin/primer3/primer3_www.cgi) are listed in Additional file 16.The Q-PCR mixture (20 μl total volume) contained 10 μl
of SYBR Premix ExTaq™ (Takara, Kyoto, Japan), 0.4 μl ofeach primer (10 μM), 2 μl of cDNA, and 7.2 μl of RNase-free water. The reactions were performed on a LightCycler1.5 instrument (Roche, Basel, Switzerland) according tothe manufacturer’s instructions. The two-step Q-PCRprogram began with 30 seconds at 95°C, followed by40 cycles of 95°C for 5 seconds and 60°C for 20 seconds.Template-less controls for each primer pair were includedin each run. The specificity of Q-PCR primers wasconfirmed by melting curve and sequencing of Q-PCRproducts. Expression was calculated as 2-Δ Δ Ct andnormalized to that of the actin gene (PpActin, JN684184)[67], and data were managed with the Data ProcessingSystem (DPS, v. 7.05, Zhejiang University, Hangzhou,China).
Additional files
Additional file 1: Overview of 'Suli' pear (Pyrus pyrifolia white peargroup) transcriptome sequencing and assembly. (A) Size distributionof Illumina sequencing contigs. (B) Size distribution of unigenes afterpaired-end and gap filling.
Additional file 2: Primers used in RT-PCR to evaluate the quality ofunigene sequencing data.
Additional file 3: Top BLAST hits from the four public database (nr,SwissProt, KEGG, and GO).
Additional file 4: The 29,500 unigenes assigned to 128 KEGGpathways.
Additional file 5: Sequencing saturation analysis of the fourlibraries. All libraries approached saturation as the number of readsapproached 5 million, as indicated by the decline in the number of newgenes detected.
Additional file 6: Distribution of reads on reference genes. Alllibraries showed good levels of randomness, with the number of readsevenly distributed throughout the transcriptomes.
Additional file 7: Differentially-expressed genes between the Nov.15 and Dec. 15 libraries. Genelength: length of all exon in gene.Expression: unique reads of aligned reads. RPKM: Reads Per Kb per Millionreads. log2 Ratio: log2 (Dec. 15-RPKM/Nov. 15-RPKM). Up-Down-Regulation (Dec. 15/Nov. 15): Dec. 15 is a up/down regulation relative toNov. 15. P-value: pvalue for hypothesis testing. FDR: false discovery rate.We used FDR ≤ 0.001 and the absolute value of log2 Ratio ≥ 1 as thethreshold to judge the significance of gene expression difference.
Additional file 8: Differentially-expressed genes between the Nov.15 and Jan. 15 libraries. Genelength: length of all exon in gene.Expression: unique reads of aligned reads. RPKM: Reads Per Kb per Millionreads. log2 Ratio: log2 (Jan. 15-RPKM/Nov. 15-RPKM). Up-Down-Regulation(Jan. 15/Nov. 15): Jan. 15 is a up/down regulation relative to Nov. 15.P-value: pvalue for hypothesis testing. FDR: false discovery rate. We usedFDR≤ 0.001 and the absolute value of log2 Ratio ≥ 1 as the threshold tojudge the significance of gene expression difference.
Additional file 9: Differentially-expressed genes between the Nov.15 and Feb. 15 libraries. Genelength: length of all exon in gene.Expression: unique reads of aligned reads. RPKM: Reads Per Kb per Millionreads. log2 Ratio: log2 (Feb. 15-RPKM/Nov. 15-RPKM). Up-Down-Regulation(Feb. 15/Nov. 15): Feb. 15 is a up/down regulation relative to Nov. 15.P-value: pvalue for hypothesis testing. FDR: false discovery rate. We usedFDR≤ 0.001 and the absolute value of log2 Ratio ≥ 1 as the threshold tojudge the significance of gene expression difference.
Additional file 10: Differentially-expressed genes between the Dec.15 and Jan. 15 libraries. Genelength: length of all exon in gene.Expression: unique reads of aligned reads. RPKM: Reads Per Kb per Million
Liu et al. BMC Genomics 2012, 13:700 Page 16 of 18http://www.biomedcentral.com/1471-2164/13/700
reads. log2 Ratio: log2 (Jan. 15-RPKM/Dec. 15-RPKM). Up-Down-Regulation(Jan. 15/Dec. 15): Jan. 15 is a up/down regulation relative to Dec. 15.P-value: pvalue for hypothesis testing. FDR: false discovery rate. We usedFDR≤ 0.001 and the absolute value of log2 Ratio ≥ 1 as the threshold tojudge the significance of gene expression difference.
Additional file 11: Differentially-expressed genes between the Dec.15 and Feb. 15 libraries. Genelength: length of all exon in gene.Expression: unique reads of aligned reads. RPKM: Reads Per Kb per Millionreads. log2 Ratio: log2 (Feb. 15-RPKM/Dec. 15-RPKM). Up-Down-Regulation(Feb. 15/Dec. 15): Feb. 15 is a up/down regulation relative to Dec. 15.P-value: pvalue for hypothesis testing. FDR: false discovery rate. We usedFDR≤ 0.001 and the absolute value of log2 Ratio ≥ 1 as the threshold tojudge the significance of gene expression difference.
Additional file 12: Differentially-expressed genes between the Jan.15 and Feb. 15 libraries. Genelength: length of all exon in gene.Expression: unique reads of aligned reads. RPKM: Reads Per Kb per Millionreads. log2 Ratio: log2 (Feb. 15-RPKM/Jan. 15-RPKM). Up-Down-Regulation(Feb. 15/Jan. 15): Feb. 15 is a up/down regulation relative to Jan. 15.P-value: pvalue for hypothesis testing. FDR: false discovery rate. We usedFDR≤ 0.001 and the absolute value of log2 Ratio ≥ 1 as the threshold tojudge the significance of gene expression difference.
Additional file 13: The top 20 most up-regulated and down-regulated DEGs between samples (Nov. 15-VS-Dec. 15, Dec. 15-VS-Jan. 15 and Jan. 15-VS-Feb. 15). RPKM: Reads Per Kb per Million reads.DEGs: Differentially-expressed genes with the expression fold(log2Ratio ≥ 2) and false discovery rate (FDR ≤ 10-5) as the threshold.
Additional file 14: KEGG pathways significantly enriched duringdormancy. KEGG pathways significantly enriched were defined aspathways with Q-value ≤ 0.05.
Additional file 15: 190 genes differentially expressed duringdormancy. In total, 190 genes were found that were significantlydifferentially-expressed genes between Nov. 15 and Dec. 15, betweenDec. 15 and Jan. 15, and between Jan. 15 and Feb. 15. 190 genes withannotations and their expression fold between Nov. 15 and Dec. 15,between Dec. 15 and Jan. 15, and between Jan. 15 and Feb. 15.
Additional file 16: Primers used in Q-PCR to validate differentialexpression during pear dormancy.
AbbreviationsBGI: Beijing Genome Institute; BLAST: Basic local alignment search tool;DAM: Dormancy-associated MADS-box; DEG: Differentially-expressed gene;DGE: Digital gene expression; DHN: Dehydrin; DPS: Data processing system;EST: Expressed sequence tag; FDR: False discovery rate; KEGG: The Kyotoencyclopedia of genes and genomes database; KO: KEGG Orthology ids;MEGA: Molecular evolutionary genetics analysis; nr: NCBI non-redundantdatabase; Q-PCR: Real-time quantitative PCR; RNA-Seq: RNA-sequencing;RPKM: Reads per kb per million reads; SOAP: Short oligonucleotide analysispackage.
Competing interestsThe authors declare that they have no competing interests.
Authors' contributionsGQL carried out the experiment, analyzed the data and drafted themanuscript. WSL carried out bioinformatics analysis. PHZ carried out theexperiment and participated in data analysis. TX participated in data analysis.LJC participated in data analysis. DFL carried out the experiment. HS helpedto draft the manuscript. YWT initiated and supervised the study. All authorsread and approved the final manuscript.
Acknowledgements and fundingThis research was financed by the earmarked fund for Modern Agro-industryTechnology Research System (nycytx-29).We acknowledge the Dangshan Germplasm Resources Center for providingmaterials.
Author details1Department of Horticulture, The State Agricultural Ministry’s Key Laboratoryof Horticultural Plant Growth, Development & Quality Improvement, ZhejiangUniversity, Hangzhou 310058, Zhejiang Province, China. 2College ofAgriculture, Guizhou University, Guiyang 550025, Guizhou Province, China.3BGI-tech, Shenzhen 518083, Guangdong Province, China.
Received: 20 June 2012 Accepted: 7 December 2012Published: 12 December 2012
References1. Lang G, Early J, Martin G, Darnell R: Endo-, para-, and ecodormancy:
physiological terminology and classification for dormancy research.Hortscience 1987, 22:371–377.
2. Heide O, Prestrud A: Low temperature, but not photoperiod, controlsgrowth cessation and dormancy induction and release in apple andpear. Tree Physiol 2005, 25(1):109–114.
3. Chao WS, Serpe MD, Anderson JV, Gesch RW, Horvath DP: Sugars,hormones, and environment affect the dormancy status in undergroundadventitious buds of leafy spurge (Euphorbia esula). Weed Science 2006,54(1):59–68.
4. Horvath DP, Chao WS, Anderson JV: Molecular analysis of signalscontrolling dormancy and growth in underground adventitious buds ofleafy spurge. Plant Physiol 2002, 128(4):1439–1446.
5. Horvath DP, Chao WS, Suttle JC, Thimmapuram J, Anderson JV:Transcriptome analysis identifies novel responses and potentialregulatory genes involved in seasonal dormancy transitions of leafyspurge (Euphorbia esula L.). BMC Genomics 2008, 9:536.
6. Bohlenius H, Huang T, Charbonnel-Campaa L, Brunner AM, Jansson S: CO/FTregulatory module controls timing of flowering and seasonal growthcessation in trees. Science 2006, 312(5776):1040.
7. Ruttink T, Arend M, Morreel K, Storme V, Rombauts S, Fromm J, Bhalerao RP,Boerjan W, Rohde A: A molecular timetable for apical bud formation anddormancy induction in poplar. Plant Cell 2007, 19(8):2370–2390.
8. Yooyongwech S, Sugaya S, Sekozawa Y, Gemma H: Differential adaptationof high- and low-chill dormant peaches in winter through aquaporingene expression and soluble sugar content. Plant Cell Rep 2009,28(11):1709–1715.
9. Leida C, Conesa A, Llácer G, Badenes ML, Ríos G: Histone modificationsand expression of DAM6 gene in peach are modulated during buddormancy release in a cultivar-dependent manner. New Phytol 2012,193(1):67–80.
10. Yamane H, Ooka T, Jotatsu H, Sasaki R, Tao R: Expression analysis ofPpDAM5 and PpDAM6 during flower bud development in peach(Prunus persica). Sci Hortic 2011, 129(4):844–848.
11. Yamane H, Ooka T, Jotatsu H, Hosaka Y, Sasaki R: Expressional regulation ofPpDAM5 and PpDAM6, peach (Prunus persica) dormancy-associatedMADS-box genes, by low temperature and dormancy-breaking reagenttreatment. J Exp Bot 2011, 62(10):3481–3488.
12. Bielenberg DG, Wang Y, Li ZG, Zhebentyayeva T, Fan SH, Reighard GL,Scorza R, Abbott AG: Sequencing and annotation of the evergrowinglocus in peach [Prunus persica (L.) Batsch] reveals a cluster of six MADS-box transcription factors as candidate genes for regulation of terminalbud formation. Tree Genetics & Genomes 2008, 4(3):495–507.
13. Brunel N, Leduc N, Poupard P, Simoneau P, Mauget JC, Viemont JD: KNAP2,a class I KN1-like gene is a negative marker of bud growth potential inapple trees (Malus domestica [L.] Borkh.). J Exp Bot 2002,53(378):2143–2149.
14. Wisniewski M, Norelli J, Bassett C, Artlip T, Macarisin D: Ectopic expressionof a novel peach (Prunus persica) CBF transcription factor in apple(Malus × domestica) results in short-day induced dormancy andincreased cold hardiness. Planta 2011, 233(5):971–983.
15. Sasaki R, Yamane H, Ooka T, Jotatsu H, Kitamura Y, Akagi T, Tao R:Functional and Expressional Analyses of PmDAM Genes Associatedwith Endodormancy in Japanese Apricot. Plant Physiol 2011,157(1):485–497.
16. Yamane H, Kashiwa Y, Kakehi E, Yonemori K, Mori H, Hayashi K, Iwamoto K,Tao R, Kataoka I: Differential expression of dehydrin in flower buds of twoJapanese apricot cultivars requiring different chilling requirements forbud break. Tree Physiol 2006, 26(12):1559–1563.
Liu et al. BMC Genomics 2012, 13:700 Page 17 of 18http://www.biomedcentral.com/1471-2164/13/700
17. Ramos A, Pérez-Solís E, Ibáñez C, Casado R, Collada C, Gómez L, AragoncilloC, Allona I: Winter disruption of the circadian clock in chestnut. Proc NatlAcad Sci U S A 2005, 102(12):7037.
18. Santamaria ME, Rodriguez R, Canal MJ, Toorop PE: Transcriptome analysisof chestnut (Castanea sativa) tree buds suggests a putative role forepigenetic control of bud dormancy. Ann Bot 2011, 108:485–498.
19. Ibañez C, Ramos A, Acebo P, Contreras A, Casado R, Allona I, Aragoncillo C:Overall alteration of circadian clock gene expression in the chestnutcold response. PLoS One 2008, 3(10):e3567.
20. Pacey-Miller T, Scott K, Ablett E, Tingey S, Ching A, Henry R: Genesassociated with the end of dormancy in grapes. Funct Integr Genomics2003, 3(4):144–152.
21. Ophir R, Pang X, Halaly T, Venkateswari J, Lavee S, Galbraith D, Or E: Gene-expression profiling of grape bud response to two alternativedormancy-release stimuli expose possible links between impairedmitochondrial activity, hypoxia, ethylene-ABA interplay and cellenlargement. Plant Mol Biol 2009, 71(4):403–423.
22. Mazzitelli L, Hancock RD, Haupt S, Walker PG, Pont SDA, McNicol J, Cardle L,Morris J, Viola R, Brennan R: Co-ordinated gene expression during phasesof dormancy release in raspberry (Rubus idaeus L.) buds. J Exp Bot 2007,58(5):1035–1045.
23. Richardson AC, Walton EF, Meekings JS, Boldingh HL: Carbohydratechanges in kiwifruit buds during the onset and release from dormancy.Sci Hortic 2010, 124(4):463–468.
24. Wu R-M, Walton EF, Richardson AC, Wood M, Hellens RP, Varkonyi-Gasic E:Conservation and divergence of four kiwifruit SVP-like MADS-box genessuggest distinct roles in kiwifruit bud dormancy and flowering. J Exp Bot2012, 63(2):797–807.
25. Hedley PE, Russell JR, Jorgensen L, Gordon S, Morris JA, Hackett CA, CardleL, Brennan R: Candidate genes associated with bud dormancy release inblackcurrant (Ribes nigrum L.). BMC Plant Biol 2010, 10:202.
26. Bi L, Zhang Y, Poudyal B: Effects of growth regulators on the respirationmetabolism of pear buds during dormant period. Frontiers of Agriculturein China 2011, 5(1):45–50.
27. Zimmerma RH, Faust M: Pear Bud Metabolism - Seasonal Changes inGlucose Utilization. Plant Physiol 1969, 44(9):1273–1276.
28. Marafon AC, Citadin I, Amarante L, Herter FG, Hawerroth FJ: Chillingprivation during dormancy period and carbohydrate mobilization inJapanese pear trees. Scientia Agricola 2011, 68(4):462–468.
29. Tamura F, Tanabe K, Itai A, Tanaka H: Protein changes in the flower budsof Japanese pear during breaking of dormancy by chilling or high-temperature treatment. J Am Soc Hortic Sci 1998, 123(4):532–536.
30. Kretzschmar A, Brighenti L, Rufato L, Pelizza T, Silveira F, Miquelutti D, FaoroI: Chilling Requirement for Dormancy Bud Break in European Pear.Acta Hortic 2011, 909:85–87.
31. Ubi BE, Sakamoto D, Ban Y, Shimada T, Ito A, Nakajima I, Takemura Y,Tamura F, Saito T, Moriguchi T: Molecular cloning of dormancy-associatedMADS-box gene homologs and their characterization during seasonalendodormancy transitional phases of Japanese pear. J Am Soc Hortic Sci2010, 135(2):174–182.
32. Cannell M, Smith R: Climatic warming, spring budburst and forestdamage on trees. J Appl Ecol 1986, 177–191.
33. Young E: Timing of high temperature influences chilling negation indormant apple trees. J Am Soc Hortic Sci 1992, 117(2):271–273.
34. Luedeling E, Zhang M, Girvetz EH: Climatic changes lead to decliningwinter chill for fruit and nut trees in California during 1950–2099.PLoS One 2009, 4(7):e6166.
35. Anderson J, Horvath D, Chao W, Foley M: Bud Dormancy in PerennialPlants: A Mechanism for Survival. In Dormancy and Resistance in HarshEnvironments. vol. 21st edition. Edited by Lubzens E, Cerda J, Clark M.Heidelberg: Springer Berlin; 2010:69–90.
36. Campoy J, Ruiz D, Egea J: Dormancy in temperate fruit trees in a globalwarming context: A review. Sci Hortic 2011, 130(2):357–372.
37. Luedeling E, Girvetz EH, Semenov MA, Brown PH: Climate change affectswinter chill for temperate fruit and nut trees. PLoS One 2011,6(5):e20155.
38. Wang Z, Gerstein M, Snyder M: RNA-Seq: a revolutionary tool fortranscriptomics. Nat Rev Genet 2009, 10(1):57–63.
39. Feng C, Chen M, Xu CJ, Bai L, Yin XR, Li X, Allan AC, Ferguson IB, Chen KS:Transcriptomic analysis of Chinese bayberry (Myrica rubra) fruitdevelopment and ripening using RNA-Seq. BMC Genomics 2012, 13:19.
40. Xue J, Bao YY, Li B, Cheng YB, Peng ZY: Transcriptome analysis of thebrown planthopper Nilaparvata lugens. PLoS One 2010, 5(12):e14233.
41. Martinez-Gomez P, Crisosto CH, Bonghi C, Rubio M: New approaches toPrunus transcriptome analysis. Genetica 2011, 139(6):755–769.
42. Tang Q, Ma XJ, Mo CM, Wilson IW, Song C, Zhao H, Yang YF, Fu W, Qiu DY:An efficient approach to finding Siraitia grosvenorii triterpenebiosynthetic genes by RNA-seq and digital gene expression analysis.BMC Genomics 2011, 12:343.
43. Yu K, Xu Q, Da X, Guo F, Ding Y, Deng X: Transcriptome changes duringfruit development and ripening of sweet orange (Citrus sinensis).BMC Genomics 2012, 13(1):10.
44. Schuster SC: Next-generation sequencing transforms today’s biology.Nat Methods 2008, 5:16–18.
45. Shendure J, Ji H: Next-generation DNA sequencing. Nat Biotechnol 2008,26(10):1135–1145.
46. Leida C, Terol J, Marti G, Agusti M, Llacer G, Badenes ML, Rios G:Identification of genes associated with bud dormancy release in Prunuspersica by suppression subtractive hybridization. Tree Physiol 2010,30(5):655–666.
47. Kosová K, Vítámvás P, Prášil IT: The role of dehydrins in plant response tocold. Biol Plantarum 2007, 51(4):601–617.
48. Yakovlev I, Asante D, Fossdal C, Partanen J, Junttila O, Johnsen Ø:Dehydrins expression related to timing of bud burst in Norway spruce.Planta 2008, 228(3):459–472.
49. Garcia-Bañuelos M, Gardea A, Winzerling J, Vazquez-Moreno L:Characterization of a Midwinter-Expressed Dehydrin (DHN) Gene fromApple Trees (Malus domestica). Plant Mol Biol Rep 2009, 27(4):476–487.
50. Pulla RK, Kim YJ, Kim MK, Senthil KS, In JG, Yang DC: Isolation of a noveldehydrin gene from Codonopsis lanceolata and analysis of its responseto abiotic stresses. BMB Rep 2008, 41(4):338–343.
51. Mingeot D, Dauchot N, Van Cutsem P, Watillon B: Characterisation of twocold induced dehydrin genes from Cichorium intybus L. Mol Biol Rep 2009,36(7):1995–2001.
52. Weiss J, Egea-Cortines M: Transcriptomic analysis of cold response intomato fruits identifies dehydrin as a marker of cold stress. J Appl Genet2009, 50(4):311–319.
53. Améglio T, Guilliot A, Lacointe A, Julien JL, Alves G, Valentin V, Pétel G:Water relations in winter: effect on bud break of walnut tree. InDormancy in plants: from whole plant behaviour to cellular control. Edited byViémont JD, Crabbé J. Wallingford, UK: CAB International; 2000:109–120.
54. Gevaudant F, Petel G, Guilliot A: Differential expression of four membersof the H+-ATPase gene family during dormancy of vegetative buds ofpeach trees. Planta 2001, 212(4):619–626.
55. Horvath DP, Anderson JV, Soto-Suarez M, Chao WS: Transcriptome analysisof leafy spurge (Euphorbia esula) crown buds during shifts in well-defined phases of dormancy. Weed Science 2006, 54(5):821–827.
56. Chang S, Puryear J, Cairney J: A simple and efficient method for isolatingRNA from pine trees. Plant Mol Biol Rep 1993, 11(2):113–116.
57. Marioni JC, Mason CE, Mane SM, Stephens M, Gilad Y: RNA-seq: anassessment of technical reproducibility and comparison with geneexpression arrays. Genome Res 2008, 18(9):1509–1517.
58. Grabherr MG, Haas BJ, Yassour M, Levin JZ, Thompson DA, Amit I, AdiconisX, Fan L, Raychowdhury R, Zeng QD: Full-length transcriptome assemblyfrom RNA-Seq data without a reference genome. Nat Biotechnol 2011,29(7):644–652.
59. Iseli C, Jongeneel CV, Bucher P: ESTScan: a program for detecting,evaluating, and reconstructing potential coding regions in ESTsequences. Proc Int Conf Intell Syst Mol Biol 1999,138–148.
60. Li R, Yu C, Li Y, Lam T-W, Yiu S-M, Kristiansen K, Wang J: SOAP2: animproved ultrafast tool for short read alignment. Bioinformatics 2009,25(15):1966–1967.
61. Mortazavi A, Williams BA, McCue K, Schaeffer L, Wold B: Mapping andquantifying mammalian transcriptomes by RNA-Seq. Nat Methods 2008,5(7):621–628.
62. Audic S, Claverie JM: The significance of digital gene expression profiles.Genome Res 1997, 7(10):986–995.
63. Benjamini Y, Hochberg Y: Controlling the false discovery rate: a practicaland powerful approach to multiple testing. Journal of the Royal StatisticalSociety Series B-Methodological 1995, 57(1):289–300.
64. de Hoon MJL, Imoto S, Nolan J, Miyano S: Open source clusteringsoftware. Bioinformatics 2004, 20(9):1453–1454.
Liu et al. BMC Genomics 2012, 13:700 Page 18 of 18http://www.biomedcentral.com/1471-2164/13/700
65. Saldanha AJ: Java Treeview—extensible visualization of microarray data.Bioinformatics 2004, 20(17):3246–3248.
66. Tamura K, Dudley J, Nei M, Kumar S: MEGA4: molecular evolutionarygenetics analysis (MEGA) software version 4.0. Mol Biol Evol 2007,24(8):1596–1599.
67. Zhang D, Yu B, Bai J, Qian M, Shu Q, Su J, Teng Y: Effects of hightemperatures on UV-B/visible irradiation induced postharvestanthocyanin accumulation in ‘Yunhongli No. 1’ (Pyrus pyrifolia Nakai)pears. Sci Hortic 2012, 134:53–59.
doi:10.1186/1471-2164-13-700Cite this article as: Liu et al.: Transcriptomic analysis of ‘Suli’ pear (Pyruspyrifolia white pear group) buds during the dormancy by RNA-Seq. BMCGenomics 2012 13:700.
Submit your next manuscript to BioMed Centraland take full advantage of:
• Convenient online submission
• Thorough peer review
• No space constraints or color figure charges
• Immediate publication on acceptance
• Inclusion in PubMed, CAS, Scopus and Google Scholar
• Research which is freely available for redistribution
Submit your manuscript at www.biomedcentral.com/submit


