Embed Size (px)
Citation preview
Antanaviciute et al. BMC Genomics 2012, 13:203http://www.biomedcentral.com/1471-2164/13/203
RESEARCH ARTICLE Open Access
Development of a dense SNP-based linkage mapof an apple rootstock progeny using the MalusInfinium whole genome genotyping arrayLaima Antanaviciute1, Felicidad Fernández-Fernández1, Johannes Jansen2, Elisa Banchi3, Katherine M Evans4,Roberto Viola3, Riccardo Velasco3, Jim M Dunwell5, Michela Troggio3 and Daniel J Sargent3*
Abstract
Background: A whole-genome genotyping array has previously been developed for Malus using SNP data from 28Malus genotypes. This array offers the prospect of high throughput genotyping and linkage map development forany given Malus progeny. To test the applicability of the array for mapping in diverse Malus genotypes, we appliedthe array to the construction of a SNP-based linkage map of an apple rootstock progeny.
Results: Of the 7,867 Malus SNP markers on the array, 1,823 (23.2%) were heterozygous in one of the two parentsof the progeny, 1,007 (12.8%) were heterozygous in both parental genotypes, whilst just 2.8% of the 921 Pyrus SNPswere heterozygous. A linkage map spanning 1,282.2 cM was produced comprising 2,272 SNP markers, 306 SSRmarkers and the S-locus. The length of the M432 linkage map was increased by 52.7 cM with the addition of theSNP markers, whilst marker density increased from 3.8 cM/marker to 0.5 cM/marker. Just three regions in excess of10 cM remain where no markers were mapped. We compared the positions of the mapped SNP markers on theM432 map with their predicted positions on the ‘Golden Delicious’ genome sequence. A total of 311 markers(13.7% of all mapped markers) mapped to positions that conflicted with their predicted positions on the ‘GoldenDelicious’ pseudo-chromosomes, indicating the presence of paralogous genomic regions or mis-assignments ofgenome sequence contigs during the assembly and anchoring of the genome sequence.
Conclusions: We incorporated data for the 2,272 SNP markers onto the map of the M432 progeny and havepresented the most complete and saturated map of the full 17 linkage groups of M. pumila to date. The data weregenerated rapidly in a high-throughput semi-automated pipeline, permitting significant savings in time and costover linkage map construction using microsatellites. The application of the array will permit linkage maps to bedeveloped for QTL analyses in a cost-effective manner, and the identification of SNPs that have been assignederroneous positions on the ‘Golden Delicious’ reference sequence will assist in the continued improvement of thegenome sequence assembly for that variety.
Keywords: Infinium, Golden Gate, Breeding, Selection, Genome sequence, Marker
BackgroundThe cultivated apple, Malus pumila Mill. (2n= 2x= 34),is a member of the Spireaoideae subfamily of Rosaceae,and is the fourth most economically-important fruitcrop worldwide. As a consequence of the long juvenilityphase of apple trees and of relatively high husbandry
* Correspondence: [email protected] Agrario San Michele all’Adige, Via E. Mach 1, 38010 San Micheleall'Adige, ItalyFull list of author information is available at the end of the article
© 2012 Antanaviciute et al.; licensee BioMed CCreative Commons Attribution License (http:/distribution, and reproduction in any medium
costs, the breeding and selection of novel apple root-stocks and scions is a time-consuming and costly pro-cedure. Marker assisted selection (MAS) has thepotential to increase the precision of apple breeding andan essential prerequisite to MAS is the production ofhigh quality saturated genetic linkage maps to enablemarker-trait associations to be made.The genome of the apple scion cultivar ‘Golden
Delicious’ was recently sequenced and assembled into 17pseudo-chromosomes by an international consortium [1]
entral Ltd. This is an Open Access article distributed under the terms of the/creativecommons.org/licenses/by/2.0), which permits unrestricted use,, provided the original work is properly cited.
Antanaviciute et al. BMC Genomics 2012, 13:203 Page 2 of 10http://www.biomedcentral.com/1471-2164/13/203
using predominantly second generation 454 sequencingtechnology. Despite the inherent difficulties associatedwith contig assembly and gene-prediction in complexheterozygous genomes [2], the ‘Golden Delicious’ genomecovers 598.3 Mbp, an estimated 71.2% of the Malusgenome and almost complete coverage of the gene-spaceof the variety [1], with an average depth of sequencing16.9×. Thus, the sequence provides a solid foundation fora wealth of downstream research activities includingmarker development, linkage map construction andmarker-trait association.The availability of data relating to single nucleotide
polymorphisms (SNPs) from early in the development ofthe ‘Golden Delicious’ genome sequence meant thatassays have been developed for screening segregatingSNPs in apple mapping populations at relativelyhigh throughput using the SNPlex and Golden Gategenotyping platforms [3,4], permitting not only the rapiddevelopment of linkage maps for Malus progenies, butthe high resolution anchoring orientation of thescaffolded sequence data to a reference linkage map [1].The degree of transferability of heterozygous SNPsbetween Malus varieties and species, and between Malusand Pyrus has recently been assessed [5], and estimateshave been made about the number of SNPs required toallow the construction of a saturated linkage map in anygiven Malus progeny. In the study of Micheletti et al.[5], SNPs identified from the ‘Golden Delicious’ genomesequence were validated and tested for heterozygoustransferability (TSNP) in a diverse selection of Malusgermplasm. The investigation showed that SNPs identi-fied within the ‘Golden Delicious’ sequence had anaverage transferability rate of 40.9% to Malus cultivars,with the lowest TSNP to the cultivar ‘Wagner’ (25.7%)from those tested. The transferability rate in rootstockgermplasm was between 29.9% and 39.7%, whilst to anaccession of Pyrus pyrifolia, the TSNP value was just1.8%, demonstrating low cross-genera SNP transferabilityof the SNPs tested [5].Through international collaboration, led by the
RosBREED initiative in the USA [6], the Malus researchcommunity has developed an InfiniumW II WGG geno-typing array (referred to hereafter as the InternationalRosBREED SNP Consortium array; IRSC array) forMalus and Pyrus using data from the re-sequencing of27 Malus genotypes along with data from the ‘GoldenDelicious’ genome sequence. The IRSC array contains atotal of 7,867 Malus SNPs [7] in addition to 921 PyrusSNPs. The development of this array represents a mile-stone in the development of molecular genetics and gen-omics resources for Malus and offers the promise ofrapid, low-cost, high-throughput genotyping for the pur-poses of linkage map construction and the genotyping ofgermplasm collections, that will facilitate future QTL
and genome-wide association studies. However, reportsare yet to emerge of the efficacy of such arrays for geno-typing germplasm and mapping populations from diver-gent sources or from species related to those for whichthey were originally designed.The M432 mapping progeny [8,9] has been raised for
the study of genes controlling traits of relevance to root-stock breeding, with the long-term aim of developingrobust markers for MAS. Since the progeny is derivedfrom parental rootstock varieties, the genetic basis of theseedlings that comprise the population represents adeparture from the well-characterised scion genotypesthat were used to identify SNPs for the construction ofthe IRSC array [7]. The progeny has been previouslycharacterised with S-locus-specific markers, and 323(306 co-dominant, and 17 dominant) SSR markers [9]distributed throughout the Malus genome. A compre-hensive consensus linkage map of the progeny has beendeveloped spanning 17 linkage groups (LGs), with anaverage marker density of one marker every 3.79 cM.The linkage map was partially anchored to the ‘GoldenDelicious’ genome sequence, and a total of 47% of thesequence that was contained in metacontigs could beassigned positions on the M432 map.The aim of this investigation was to test the IRSC array
in the M432 rootstock mapping progeny to determine itsutility to genome-wide saturated map construction.Additionally, we aimed to increase the percentage of theMalus genome sequence that could be directly related toregions of the M432 linkage map for the purposes of can-didate gene identification and marker development follow-ing QTL analysis. We evaluated the SNP-based linkagemap produced against the previously-published SSR-basedlinkage map of the population developed by Fernández-Fernández et al. [9]. We compared the positions of SNPmarkers on the M432 linkage map with their predictedpositions on the ‘Golden Delicious’ genome sequence andassessed the accuracy of the genomic placement of theheterozygous SNP markers in relation to the genetic posi-tions of the markers on the M432 map. An evaluation wasmade of the ease at which the IRSC array could be imple-mented in the mapping progeny in relation to previousSSR assays performed for linkage map construction in thisprogeny.
ResultsSNP heterozygosity in the M432 mapping progenyGenTrain scores for all SNPs scored in the M432progeny ranged from 0.043 to 0.961, with an average of0.723. Cluster separation ranged from 0.004 to 1 with anaverage of 0.814. Of the 8,788 SNP markers containedon the IRSC array (7,867 Malus SNPs and 921 PyrusSNPs), 664 markers failed in both parental genotypes, 44failed in the ‘M.27’ genotype and a further 51 markers

Antanaviciute et al. BMC Genomics 2012, 13:203 Page 3 of 10http://www.biomedcentral.com/1471-2164/13/203
failed in the ‘M.116’ genotype. A total of 5,078 markerswere homozygous in both parental genotypes of theM432 progeny, and 95 revealed unexpected genotypes inthe progeny given the parental genotypes. Of theremaining 2,856 markers 1,007 were heterozygous inboth parents, 976 markers were heterozygous only inthe ‘M.27’ parental genotype, and 873 markers wereheterozygous only in ‘M.116’.
SNP and SSR co-segregation analysis and linkage mapconstructionGenTrain scores for the markers considered for mappingranged from 0.4 to 0.961, with an average of 0.713. Clusterseparation scores ranged from 0.347 to 1, with an averageof 0.848. A total of 854 SNPs heterozygous in the ‘M.27’parental genotype, 751 SNPs heterozygous in the ‘M.116’parental genotype, and a further 665 SNPs heterozygousin both parental genotypes of the M432 progeny coalescedinto the 17 expected LGs for a consensus genetic linkagemap. Thus, a total of 586 putatively segregating loci werenot located to LGs on the M432 map. Close visual inspec-tion of these loci in GenomeStudio (Illumina) revealedthat the majority had poor cluster separation scores anddid not cluster as expected despite having high GenTrainscores. In many cases, the clusters that were producedwere composed of a number of smaller sub-clusters andof individual genotype calls that did not cluster tightly orthat did not cluster in the expected region of thegraph space and were shifted from either the 0 or the1 axis (Figure 1). As such, cluster patterns at theseloci were either unsuitable for genotypic analysis dueto mis-assignation of sub-clusters, or it was not pos-sible to reliably determine the heterozygosity status of
Figure 1 SNP genotype clusters revealed following analysis by Genomanalysis using GenomeStudio generated from the M432 mapping progenyclusters for markers with the parental genotype conformation i) AA ×AB, ii)sub-clusters possibly as a result of hybridisation to paralogous loci. (c). Cluspossible mis-assignation of genotype in the i) AB × BB, and ii) AA×AB mark
the parental genotypes, and thus the loci were notconsidered for further analyses.In addition to the 2272 SNPs, the 306 codominant
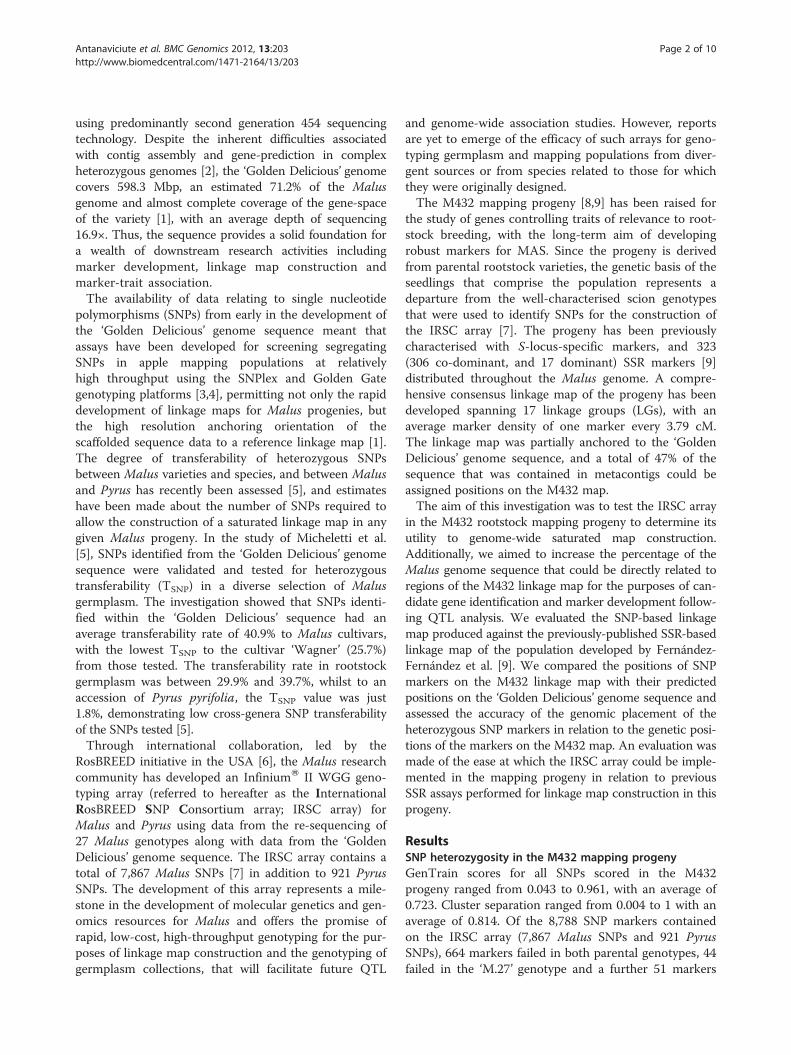
SSR markers and the S-locus that were previouslymapped by Fernández-Fernández et al. [9] were locatedto the 17 LGs. Previously mapped dominant SSRmarkers segregating A�×A� were not considered formapping in this investigation. The consensus linkagemap of the M432 progeny is presented in Figure 2 andTable 1 summarises the marker composition and lengthsof the 17 M432 LGs. The map spanned a total of1,282.2 cM and contained a total of 2,579 molecularmarkers. LG 14 was the shortest LG on the map, span-ning 56.1 cM, whilst LG15 was the longest, spanning132.4 cM. The highest number of markers mapped to asingle LG was 221 on LG2; the smallest number of mar-kers on a single LG was 69 on LG4. The map had anaverage marker density of one marker every 0.5 cM. Thelinkage map contained a total of three regions in excessof 10 cM that contained no mapped molecular markers.The largest region to which no markers were mapped
was 26.6 cM on LG4 which was defined by four SSRmarkers that had been previously mapped by Fernández-Fernández et al. [9]. Similarly, a region at the distal endof LG16 spanning 26.5 cM containing no markers wasdefined by a single SSR marker previously mapped byFernández-Fernández et al. [9]. Upon closer inspection,the segregation of these SSR loci were distorted towardsan excess of an allele from ‘M.27’ parental genotypewhich could have potentially led to an overestimation ofthe genetic distance between these markers and theirclosest flanking markers along the LG. The markerswere tentatively included on the linkage map presented
eStudio. Examples of SNP genotype clusters revealed followingusing the IRCS genoptying array. (a). Expected patterns of genotypeAB×AB and iii) AB × BB. (b). Genotype clusters displaying evidence ofters not locating to the expected region of graph space, leading toer types.
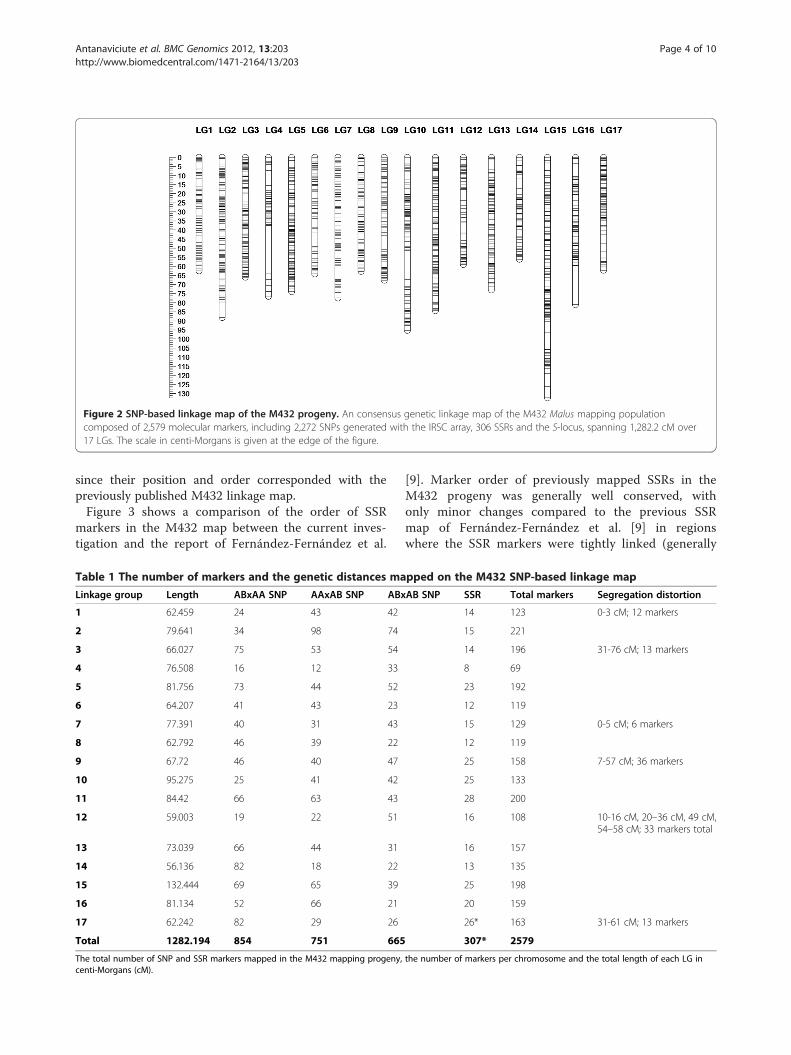
Figure 2 SNP-based linkage map of the M432 progeny. An consensus genetic linkage map of the M432 Malus mapping populationcomposed of 2,579 molecular markers, including 2,272 SNPs generated with the IRSC array, 306 SSRs and the S-locus, spanning 1,282.2 cM over17 LGs. The scale in centi-Morgans is given at the edge of the figure.
Antanaviciute et al. BMC Genomics 2012, 13:203 Page 4 of 10http://www.biomedcentral.com/1471-2164/13/203
since their position and order corresponded with thepreviously published M432 linkage map.Figure 3 shows a comparison of the order of SSR
markers in the M432 map between the current inves-tigation and the report of Fernández-Fernández et al.
Table 1 The number of markers and the genetic distances ma
Linkage group Length ABxAA SNP AAxAB SNP ABx
1 62.459 24 43 42
2 79.641 34 98 74
3 66.027 75 53 54
4 76.508 16 12 33
5 81.756 73 44 52
6 64.207 41 43 23
7 77.391 40 31 43
8 62.792 46 39 22
9 67.72 46 40 47
10 95.275 25 41 42
11 84.42 66 63 43
12 59.003 19 22 51
13 73.039 66 44 31
14 56.136 82 18 22
15 132.444 69 65 39
16 81.134 52 66 21
17 62.242 82 29 26
Total 1282.194 854 751 665
The total number of SNP and SSR markers mapped in the M432 mapping progeny,centi-Morgans (cM).
[9]. Marker order of previously mapped SSRs in theM432 progeny was generally well conserved, withonly minor changes compared to the previous SSRmap of Fernández-Fernández et al. [9] in regionswhere the SSR markers were tightly linked (generally
pped on the M432 SNP-based linkage map
AB SNP SSR Total markers Segregation distortion
14 123 0-3 cM; 12 markers
15 221
14 196 31-76 cM; 13 markers
8 69
23 192
12 119
15 129 0-5 cM; 6 markers
12 119
25 158 7-57 cM; 36 markers
25 133
28 200
16 108 10-16 cM, 20–36 cM, 49 cM,54–58 cM; 33 markers total
16 157
13 135
25 198
20 159
26* 163 31-61 cM; 13 markers
307* 2579
the number of markers per chromosome and the total length of each LG in
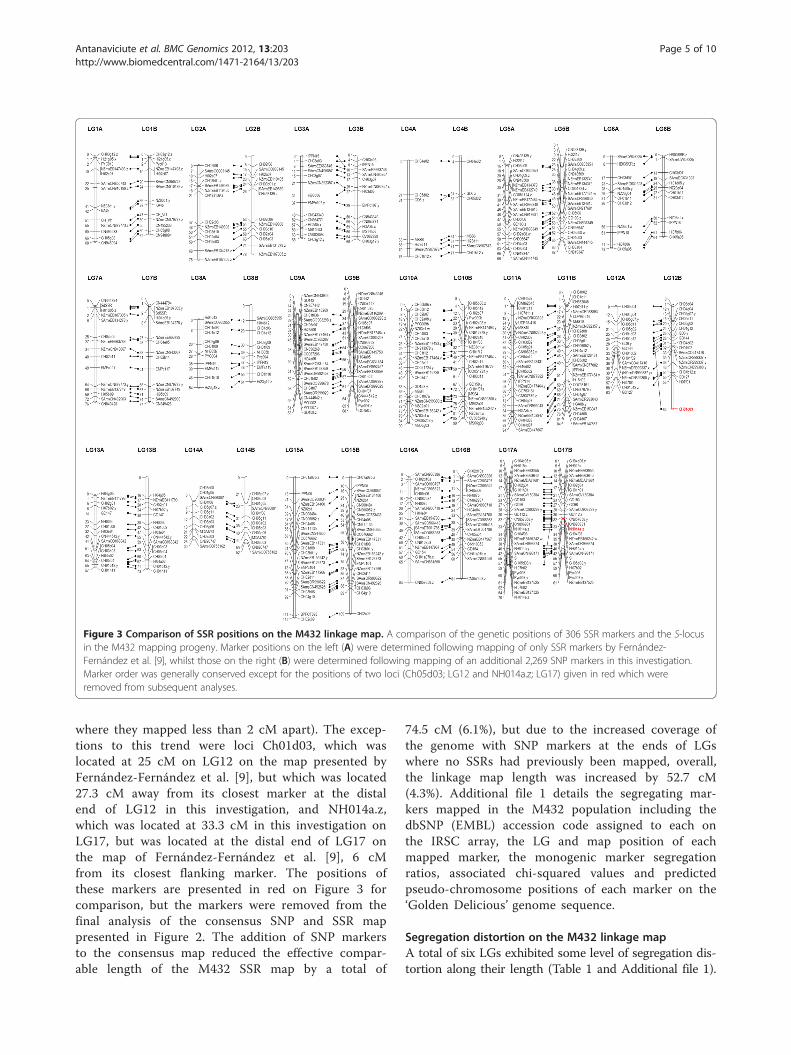
Figure 3 Comparison of SSR positions on the M432 linkage map. A comparison of the genetic positions of 306 SSR markers and the S-locusin the M432 mapping progeny. Marker positions on the left (A) were determined following mapping of only SSR markers by Fernández-Fernández et al. [9], whilst those on the right (B) were determined following mapping of an additional 2,269 SNP markers in this investigation.Marker order was generally conserved except for the positions of two loci (Ch05d03; LG12 and NH014a.z; LG17) given in red which wereremoved from subsequent analyses.
Antanaviciute et al. BMC Genomics 2012, 13:203 Page 5 of 10http://www.biomedcentral.com/1471-2164/13/203
where they mapped less than 2 cM apart). The excep-tions to this trend were loci Ch01d03, which waslocated at 25 cM on LG12 on the map presented byFernández-Fernández et al. [9], but which was located27.3 cM away from its closest marker at the distalend of LG12 in this investigation, and NH014a.z,which was located at 33.3 cM in this investigation onLG17, but was located at the distal end of LG17 onthe map of Fernández-Fernández et al. [9], 6 cMfrom its closest flanking marker. The positions ofthese markers are presented in red on Figure 3 forcomparison, but the markers were removed from thefinal analysis of the consensus SNP and SSR mappresented in Figure 2. The addition of SNP markersto the consensus map reduced the effective compar-able length of the M432 SSR map by a total of
74.5 cM (6.1%), but due to the increased coverage ofthe genome with SNP markers at the ends of LGswhere no SSRs had previously been mapped, overall,the linkage map length was increased by 52.7 cM(4.3%). Additional file 1 details the segregating mar-kers mapped in the M432 population including thedbSNP (EMBL) accession code assigned to each onthe IRSC array, the LG and map position of eachmapped marker, the monogenic marker segregationratios, associated chi-squared values and predictedpseudo-chromosome positions of each marker on the‘Golden Delicious’ genome sequence.
Segregation distortion on the M432 linkage mapA total of six LGs exhibited some level of segregation dis-tortion along their length (Table 1 and Additional file 1).

Antanaviciute et al. BMC Genomics 2012, 13:203 Page 6 of 10http://www.biomedcentral.com/1471-2164/13/203
Of these, two (LG1 and LG7) displayed segregation distor-tion for a short region at their proximal end, whilst thedistortion observed on the other four groups (LG3, LG9,LG12 and LG17) was more extensive, the most significantdistortion present on LG12 and on LG17 in the region ofthe S-locus.
Comparison of genetic and physical positions of the IRSCarray SNP markersFigure 4 depicts the physical distances of the mappedSNP markers on the ‘Golden Delicious’ genome se-quence plotted against their genetic positions on theM432 map. In general, the within LG genetic positionsof the SNP markers that mapped to the M432 LGs wereconsistent with their positions on the ‘Golden Delicious’genome sequence and in some cases (LG3, LG6, LG7,LG11 and LG14) distinct domains signifying high andlow recombination along the LG/pseudochromosomecould be observed . However, each of the 17 LGs con-tained a small number of markers from more than one
Figure 4 Comparison of genetic and physical positions of the mappemaps. Plots for each of the SNPs mapped in the M432 mapping progenygenome sequence. Each plot (LG1-LG17) represents one of the 17 LGs of t‘Golden Delicious’ genome sequence.
‘Golden Delicious’ pseudo-chromosome, indicating theerroneous placement of genome sequence contigs in the‘Golden Delicious’ pseudo-chromosomes or the presenceof undetected gene paralogues within the Malus genome.A total of 311 Malus SNP markers mapped to positionson the M432 LGs that did not agree with their physicalpositions on the ‘Golden Delicious’ genome sequence. Themarkers were distributed throughout the 17 Maluspseudo-chromosomes and represent 13.7% of all markersmapped in the M432 mapping progeny. Marker geneticand physical positions are given in Additional file 1.
DiscussionWe have extended the previously published M432genetic linkage map using SNP markers generated usingthe IRSC array, and increased marker saturation on themap from an average of one marker every 3.8 cM to onemarker every 0.5 cM. Of the 7,867 Malus SNP markerscontained on the array, 1,841 (23.4%) were heterozygousin one of the two parents of the progeny, and a further
d IRSC SNPs on the M432 genetic and ‘Golden Delicious’ physicalas a function of their physical positions on the ‘Golden Delicious’he M432 map and one of the pseudo-chromosomes (1–17) of the
Antanaviciute et al. BMC Genomics 2012, 13:203 Page 7 of 10http://www.biomedcentral.com/1471-2164/13/203
998 (12.6%) were heterozygous in both parental geno-types. A total of 26 heterozygous SNPs were derivedfrom the 921 Pyrus SNPs on the array, indicating a TSNP
value of 2.82% transferability to Malus, which is withinthe range of values previously obtained by Michelettiet al. [5] of between 1.2 and 3% transferability of SNPsfrom Malus to Pyrus. The total percentage of heterozy-gous Malus SNPs (36%) was within the TSNP value rangereported for the transferability of ‘Golden Delicious’SNPs to rootstock varieties [5], indicating that previouslyreported TSNP values for Malus cultivars should bebroadly applicable to the number of SNPs expected tosegregate in a given Malus genotype on the IRSC array.
SNP marker heterozygosity and GenomeStudio genotypeclusteringOur investigation revealed a large number of SNPs puta-tively heterozygous and thus segregating in the M432 pro-geny, but for which genotype calls using GenomeStudio(Illumina) resulted in segregation patterns that could notbe assigned a position on one of the 17 LGs of the M432consensus map. A closer inspection of the genotype data inGenomeStudio (Illumina) revealed low cluster separationcalls for all SNPs and a number of different causes for thediscrepancies in these data, including many loci for whichdata were grouped into more than one sub-cluster in eachgenotype. Sub-clusters are most likely caused by probesdetecting more than one locus, one of which contained anSNP or indel, or the detection of more than one allele con-taining SNPs within the probe sequence [4], leading tonon-uniform clustering of the detected genotypes. Suchvariation has been detected using oligonucleotide arrays inhumans, where it is attributed to copy-number variation(CNV) [10]. Sanzol [11] investigated duplicated genes inMalus using EST data and concluded that the datasupported a model of continuous small-scale duplicationevents, in addition to the recent whole genome duplicationevent in the lineage of the genus [1,12]. We suggest thatthe apparently large number of loci for which segregationdata was generated using the IRSC array, but which couldnot be located to the M432 linkage map (20%) is a result ofa combination of factors, including detection of paralogousloci generated through whole genome duplication andCNV, and the mis-assignation of genotypes scored inGenomeStudio (Illumina) due to the lack of a well definedcluster file for the analysis of Malus.
SNP and SSR co-segregation analysis and linkage mapconstructionTo our knowledge, this is the most extensive linkagemap of a Malus mapping progeny published to date.Previously, the IRSC array had been used to genotypethe progeny derived from the cross ‘Royal Gala’× ‘Granny Smith’ (RG×GS) which was reported by Chagné
et al. [7], although in the report, data from only a singleLG (LG1) was presented. The number of SNP markersheterozygous in the M432 population was 2,856 (32.5%of the total number of SNPs on the array), almost identi-cal to the 2,810 (32% of the total number of SNPs onthe array) reported to be heterozygous in RG×GS byChagné et al. [7]. Of those markers heterozygous in theM432 progeny, 2,272 markers could be assigned reliablepositions on the linkage map presented. Since only oneLG was presented in the report of Chagné et al. [7], itwas not possible to determine if all 2,810 markers werelocated to the RG×GS linkage map. Additionally as onlymarkers segregating in a ‘pseudo test-cross’ configurationwere presented on the RG×GS LG1 parental linkagemaps and the M432 progeny is derived from a back-cross between ‘M.27’ and its semi-vigourous seedling‘M.116’ (‘M.27’× ‘M.M.106’), direct comparison betweenthe number of markers mapped in both investigationswas not possible. However, the average distance betweenmarkers on the RG×GS linkage map was reported to be0.88 and 0.91 for the ‘Royal Gala’ and ‘Granny Smith’linkage maps respectively. These distances are comparableto the average genetic distances between the same markertypes in this investigation (data not shown) and thus weconclude that, given the diverse pedigrees of these twomapping progenies, the IRSC array should be an invaluabletool for linkage map development and saturation in anygiven M. pumila mapping progeny.We identified a number of regions of the M432 map
where segregation distortion was widespread and exten-sive. The most extreme example was at the bottom ofLG17 where the self-incompatibility is located [13,14].The M432 progeny was derived from a semi-compatiblecross between ‘M.27’ and its semi-vigourous seedling‘M.116’ (‘M.27’× ‘M.M.106’), and thus fertilisation couldnot occur in homozygous genotype combinationsaround the S-locus, leading to the observed segregationdistortion. Two other regions of distortion are probablythe result of genes associated with the dwarfing pheno-type in the cross, since some seedlings of the progenydisplayed lethal and sub-lethal dwarf phenotypes. Effortsare on-going to characterise the M432 progeny andidentify QTL associated with the dwarfing phenotype aswell as a number of other traits including water-useefficiency.
Genome heterozygosity, SNP marker genome coverageand a comparison of genetic and physical SNP positionsWhen the genetic positions of the 2,272 Malus SNPmarkers mapped in the M432 progeny were compared totheir physical positions on the ‘Golden Delicious’ genomesequence a high degree of colinearity was observed.Additionally, distinct regions of high and low recombin-ation could be observed in a number of cases along the

Antanaviciute et al. BMC Genomics 2012, 13:203 Page 8 of 10http://www.biomedcentral.com/1471-2164/13/203
LGs/pseudochromosomes. The anchored portion of the‘Golden Delicious’ genome from which the physicalpositions of the SNPs mapped in the M432 progeny werederived covers an estimated 71.2% of the ‘GoldenDelicious’ genome and represents the majority of thegene-rich portion of the apple genome sequence [1]. Sincethe un-sequenced and un-anchored portions of thegenome have been predicted to be largely repetitivesequence, and the SNPs positioned on the IRSC arraywere derived almost exclusively from exonic sequence [7],it was expected that plots of genetic and physical positionsof the SNPs mapped in the M432 progeny would reveal alargely linear relationship for each chromosome due to theabsence of markers mapped to the largely repetitivecentromeric and telomeric regions of the chromosomes.However, many of the plots revealed non-linear relation-ships, with clear regions of high recombination represent-ing chromosome arms, and centres of low recombinationrepresenting putative centromeric regions, as have beenobserved in similar plots of other organisms such asCaenorhabditis elegans [15] and Oryza sativa [16]. Regionsof effectively zero recombination at the LG ends whichwould indicate the presence of telomeric regions werelargely undetected in this investigation. However, at leastone region of zero recombination was observed on plots ofLG/pseudochromosomes LG1, LG6, LG7 and LG12.A total of 311 SNP markers (13.7% of all mapped SNP
markers) were located to positions on LGs that conflictedwith the predicted positions of the SNPs on the ‘GoldenDelicious’ pseudo-chromosomes [1]. Upon closer inspec-tion of the predicted positions of these SNP markers, 47(15%) mapped to regions in the M432 mapping progenythat were homeologous to those predicted, whilst theremaining 264 (85%) were located in non-homeologousregions of the genome, indicating the presence of paralo-gous genomic regions, or possible mis-assignment ofgenome sequence contigs during the assembly andanchoring of the ‘Golden Delicious’ genome sequence.Human and animal genetics employ genetic informa-
tion gained from individuals who are members ofextended pedigrees for the identification of loci control-ling complex genetic traits [17,18]. One of the aims ofthe IRSC was to produce a genotyping tool to enable thedetermination of SNP haplotypes for apple varietiesrelated through well-defined pedigrees [7], leading to theidentification of genes controlling important agronomictraits using a pedigree-based analysis. The advantages ofsuch analyses are that the full variation associated with atrait of interest can be sampled within a gene pool;however, it is essential that markers included in eachhaplotype are derived from physically associated loca-tions on the Malus genome. If the 13.7% of the markersmapped in the M432 progeny in this investigation thatwere identified as misplaced on the ‘Golden Delicious’
genome sequence of Velasco et al. [1], had been used tocreate haplotypes for pedigree-based association studies,they would have exhibited recombination at higher fre-quencies than linked markers within the haplotype, makinggenetic data within the pedigree difficult or impossible tointerpret. In total, 2,272 (25.8%) of the SNP markers con-tained on the IRSC array were mapped in the M432 pro-geny. If the markers mapped in the M432 progeny arerepresentative of all SNPs contained on the array, there arepotentially a further 767 SNPs for which the genetic andpredicted genomic positions may disagree, potentially lead-ing to the creation of false haplotypes for Malus cultivars.
ConclusionsWe have employed the IRSC Malus array to extend andsaturate the SSR linkage map of the M432 mapping pro-geny. The use of the array enabled us to locate a total of2,270 SNPs to the consensus linkage map at a fraction ofthe time and cost of developing a similar map usingother experimental approaches, and to develop the mostcomprehensive saturated complete linkage map for aMalus mapping progeny to date. The mapping of theSNPs enabled us to assess the relative coverage andaccuracy of the ‘Golden Delicious’ genome sequence andto identify a significant proportion (13.7%) of SNPs thathad been erroneously located to the ‘Golden Delicious’pseudochromosomes. Further mapping in additionalprogenies will help to characterise regions of the ‘GoldenDelicious’ sequence that are incorrectly placed in thecurrent assembly version, and assist in the continuedimprovement of the reference sequence for Malus.
MethodsPlant material and DNA extractionThe M432 rootstock progeny used in this investigationwas first described by Evans et al. [8]. It was derivedfrom the cross ‘M.27’× ‘M.116’ (‘M.M.106’× ‘M.27’) andcomprises 140 seedlings. DNA from the seedlings of theM432 progeny was used to generate SNP data using theIRSC array, and subsequently to construct SNP-basedlinkage maps of the parental genomes. DNA was freshlyisolated from young leaf tissue of ‘M.27’, ‘M.116’ and the140 seedlings of the M432 progeny using the DNeasyplant miniprep kit (Qiagen) according to the manufac-turer’s protocol immediately prior to genotyping. It wasthen quantified using PicoGreen (Invitrogen) against a λstandard DNA dilution series using a Synergy 2 fluorimeter(BioTek). DNA from all seedlings was diluted to 50 ng/ulfor genotyping using the IRSC array.
Malus InfiniumW II whole genome genotyping arrayThe IRSC array, employing exclusively Illumina InfiniumW
II design probes and dual colour channel assays (InfiniumHD Assay Ultra, Illumina), that was described previously
Antanaviciute et al. BMC Genomics 2012, 13:203 Page 9 of 10http://www.biomedcentral.com/1471-2164/13/203
by Chagné et al. [7] was used for genotyping the progenyof the M432 apple mapping population. The IRSC beadchips contained a total of 7,867 possible Malus, and 921possible Pyrus SNPs. Progeny DNA was assayed followingthe manufacturer’s recommendations. Briefly, a wholegenome amplification reaction was performed, followedby denaturation and hybridization to the IRSC BeadChips(Illumina). Un-hybridized and non-specifically hybridizedDNA was removed through washing, following which asingle base extension reaction was performed to incorpor-ate differentially labeled nucleotides at the SNP sites ofeach of the 8,788 probes of the BeadChip for each M432genotype. BeadChips were then imaged and data werecollected using the HiScan detection platform (Illumina)following Illumina-published standard operating proce-dures (http://www.illumina.com).
Data scoring and SNP nomenclatureData generated for the 8,788 SNPs in the 140 seedlings andthe two parents of the M432 progeny were scored usingGenomeStudio (Illumina) using a GenCall threshold of0.15. Data were then exported into Excel (Microsoft Inc.)for post scoring processing before data analysis. Prior tolinkage analysis markers with a GenTrain score below 0.4were excluded from the dataset. Following initial linkageanalyses, all markers not mapping to one of the expected17 LGs were visually inspected for accuracy, to determinedata quality, and to resolve any errors created by automaticallele calling in GenomeStudio (Illumina). Data for allSNPs showing putative segregation were discarded prior tomapping if one or both of the parental genotypes failed toamplify in the assay or if segregation data contained geno-types not expected from the parental genotypes.
Data analysis and M432 linkage map constructionMarkers were re-coded using genotype codes for linkageanalysis using JOINMAP 4.0 (Kyasma, Wageningen, NL),according to their segregation type; AB×AA or AB×BB(segregating in the female ‘M.27’ genotype) were codedlm×ll and AA×AB or BB×AB (segregating in the male‘M.116’ genotype) were coded nn×np. Markers segregatingAB×AB (in both parental genotyes) were recoded hk×hk.SNP nomenclature in this investigation followed the dbSNP(EMBL) accession codes for each SNP on the array that hasbeen deposited in the Genome Database for Rosaceae [19].Linkage mapping was performed with all SNP data
and the SSR data of Fernández-Fernández et al. [9]. Datafor SSR markers with parental genotypes A�×A� (andthus segregating in a 3:1 Mendelian ratio) were not con-sidered in this analysis. Segregation data for SNPs wereanalysed and consensus genetic linkage maps wereobtained using a two-step procedure. Initially SNPmarkers were ordered using the QMAP procedure ofGenstat 14 [20]. For outbreeders QMAP employs
the method of Jansen [21] for ordering markers, in com-bination with the EM algorithm using a hidden Markovmodel for obtaining multipoint maximum likelihoodestimates of recombination frequencies [22]. SNPmarker orders were then fixed and SSRs were added tothe consensus SNP linkage map using JOINMAP 4.0(Kyazma, NL); marker placement was determined using aminimum LOD score threshold of 3.0, a recombinationfraction threshold of 0.35, ripple value of 1.0, jump thresh-old of 3.0 and a triplet threshold of 5.0, and mappingdistances were calculated using the Kosambi mappingfunction. Linked markers were only considered as consti-tuting a LG if more than six markers coalesced into asingle group. Any markers that remained ‘unlinked’following co-segregation analysis or that were containedin groups of fewer than six markers were visuallyinspected in GenomeStudio (Illumina). All linkage mapspresented were plotted using MAPCHART 2.2 forWindows [23] and LG nomenclature for M432 follows thenumbering reported previously for this progeny byFernández-Fernández et al. [9].
Comparison of genetic locations and physical positionson the ‘Golden Delicious’ genome sequencePhysical positions of all SNP markers were derived fromtheir predicted positions on the ‘Golden Delicious’ genomesequence and were plotted as a function of genetic dis-tances on the M432 consensus map. Mareymaps for eachindividual chromosome were produced using Excel(Microsoft Inc.).
Additional file
Additional file 1: Segregation data for the 2,579 markers segregatingin the M432 progeny. The 2,272 segregating IRSC array SNP markersmapped in the M432 population along with the 307 previously mapped SSRand S-locus markers, including the SNP name, the dbSNP (EMBL) accessioncode assigned to each on the IRSC array, the LG and map position of eachmapped marker, the monogenic marker segregation ratios, associatedchi-squared values and the predicted pseudo-chromosome positions of eachmarker on the ‘Golden Delicious’ genome sequence. Markers for whichgenetic and physical positions conflicted are highlighted in red.
Competing interestsThe authors declare that they have no competing financial interests.
AcknowledgementsMalus genetics and genomics are sponsored at East Malling Research by theDepartment for Environment Food and Rural Affairs. Malus genetics andgenomics are funded at FEM-IASMA by the Autonomous Province of Trento(Italy). J. Jansen acknowledges support by the USDA National Institute ofFood and Agriculture-Speciality Crop Research Initiative RosBREED (2009-51181-05808) and the FruitBreedomics project funded by the Commission ofthe European Communities (Contract FP7-KBBE-2010-265582).
Author details1East Malling Research (EMR), New Road, East Malling, Kent ME19 6BJ, UK.2Biometris, Wageningen University and Research Centre, P.O. Box 100,6700 AC Wageningen, the Netherlands. 3Istituto Agrario San Micheleall’Adige, Via E. Mach 1, 38010 San Michele all'Adige, Italy. 4WSU Tree Fruit
Antanaviciute et al. BMC Genomics 2012, 13:203 Page 10 of 10http://www.biomedcentral.com/1471-2164/13/203
Research & Extension Center, 1100 N. Western Ave., Wenatchee, WA 98801-1230 USA. 5School of Biological Sciences, University of Reading, Reading RG66AH, UK.
Authors’ contributionsLA carried out the experiments, analysed the data and co-authored themanuscript. FFF conceived the experiments, managed the populations andco-authored the manuscript. JJ analysed the data. EB carried out theexperiments. KME conceived the experiments and critically evaluated themanuscript. RVio advised on the experiments. RVel managed theexperiments. JMD advised on the experiments and critically evaluated themanuscript. MT conceived the experiments, managed the experiments,analysed the data and co-authored the manuscript. DJS conceived theexperiments, managed the experiments, analysed the data and authored themanuscript. All authors read and approved the final manuscript
Received: 9 January 2012 Accepted: 25 May 2012Published: 25 May 2012
References1. Velasco R, Zharkikh A, Affourtit J, Dhingra A, Cestaro A, Kalyanaraman A,
Fontana P, Bhatnagar SK, Troggio M, Pruss D, et al: The genome of thedomesticated apple (Malus x domestica Borkh.). Nat Genet 2010, 42:833–839.
2. Zharkikh A, Troggio M, Pruss D, Cestaro A, Eldrdge G, Pindo M, Mitchell JT,Vezzulli S, Bhatnagar S, Fontana P, et al: Sequencing and assembly ofhighly heterozygous genome of Vitis vinifera L. cv Pinot Noir: Problemsand solutions. J Biotechnol 2008, 136:38–43.
3. Huo NX, Garvin DF, You FM, McMahon S, Luo MC, Gu YQ, Lazo GR, Vogel JP:Comparison of a high-density genetic linkage map to genome features in themodel grass Brachypodium distachyon. Theor Appl Genet 2011, 123:455–464.
4. Pindo M, Vezzulli S, Coppola G, Cartwright DA, Zharkikh A, Velasco R,Troggio M: SNP high-throughput screening in grapevine using theSNPlex (TM) genotyping system. BMC Plant Biol 2008, 8:12.
5. Micheletti D, Troggio M, Zharkikh A, Costa F, Malnoy M, Velasco R, Salvi S:Genetic diversity of the genus Malus and implications for linkagemapping with SNPs. Tree Genet Genomes 2011, 7:857–868.
6. Iezzoni A, Weebadde C, Luby J, Yue CY, Weg Evd, Fazio G, Main D, Peace CP,Bassil NV, McFerson J: RosBREED: Enabling marker-assisted breeding inRosaceae. In Acta Horticulturae. Edited by Bassil NV, Martin R. 2010:389–394.
7. Chagné D, Crowhurst R, Troggio M, Davey MW, Gilmore B, Lawley C,Vanderzande S, Hellens RP, Kumar S, Cestaro A, Velasco R, Main D, Rees DJG,Iezzoni A, Mockler T, Wilhelm L, Van de Weg E, Gardiner SE, Bassil N, PeaceC: Genome-wide SNP detection, validation, and development of an 8 KSNP array for apple. PLoS One 2012, 7:e31745.
8. Evans KM, Fernandez-Fernandez F, Govan CL, Clarke JB, Tobutt KR:Development of a new apple rootstock framework map. In ActaHorticulturae. Edited by Robinson TL.: ; 2011:69–74.
9. Fernández-Fernández F, Antanaviciute L, van Dyk MM, Tobutt KR, Evans KM,Rees DJG, Dunwell JM, Sargent DJ: A genetic linkage map of an applerootstock progeny anchored to the Malus genome sequence. Tree GenetGenomes (online first) 2012, doi:10.1007/s11295-012-0478-7.
10. Franke L, de Kovel CGE, Aulchenko YS, Trynka G, Zhernakova A, Hunt KA, BlauwHM, van den Berg LH, Ophoff R, Deloukas P, van Heel DA, Wijmenga C:Detection, imputation, and association analysis of small deletions and nullalleles on oligonucleotide arrays. Am J Hum Genet 2008, 82:1316–1333.
11. Sanzol J: Dating and functional characterization of duplicated genes inthe apple (Malus domestica Borkh.) by analyzing EST data. BMC Plant Biol2010, 10:87.
12. Jung S, Cestaro A, Troggio M, Main D, Zheng P, Cho I, Folta KM, Sosinski B,Abbott AG, Celton JM, Arús P, Shulaev V, Verde I, Morgante M, Rokhsar DS,Velasco R, Sargent DJ: Whole genome comparisons of Fragaria, Prunusand Malus reveal different modes of evolution between Rosaceoussubfamilies. BMC Genomics 2012, 13:129.
13. Bošković R, Tobutt KR: Correlation of stylar ribonuclease isoenzymes withincompatibility alleles in apple. Euphytica 1999, 107:29–43.
14. Maliepaard C, Alston FH, van Arkel G, Brown LM, Chevreau E, Dunemann F,Evans KM, Gardiner S, Guilford P, van Heusden AW, et al: Aligning male andfemale linkage maps of apple (Malus pumila Mill.) using multi-allelicmarkers. Theor Appl Genet 1998, 97:60–73.
15. Rockman MV, Kruglyak L: Recombinational landscape and populationgenomics of Caenorhabditis elegans. PLoS Genet 2009, 5:e1000419.
16. Tian ZX, Rizzon C, Du JC, Zhu LC, Bennetzen JL, Jackson SA, Gaut BS, Ma JX:Do genetic recombination and gene density shape the pattern of DNAelimination in rice long terminal repeat retrotransposons? Genome Res2009, 19:2221–2230.
17. Barendse W, Armitage SM, Kossarek LM, Shalom A, Kirkpatrick BW, Ryan AM,Clayton D, Li L, Neibergs HL, Zhang N, et al: A genetic-linkage map of thebovine genome. Nat Genet 1994, 6:227–235.
18. Wegmann D, Kessner DE, Veeramah KR, Mathias RA, Nicolae DL, Yanek LR,Sun YV, Torgerson DG, Rafaels N, Mosley T, et al: Recombination rates inadmixed individuals identified by ancestry-based inference. Nat Genet2011, 43:847–853.
19. Jung S, Staton M, Lee T, Blenda A, Svancara R, Abbott A, Main D: GDR(Genome Database for Rosaceae): integrated web-database for Rosaceaegenomics and genetics data. Nucleic Acids Res 2008, 36(Database issue):D1034–D1040.
20. Payne RW, Harding SA, Murray DA, Soutar DM, Baird DB, Glaser AI, WelhamSJ, Gilmour AR, Thompson R, Webster R: GenStatW Release 14 ReferenceManual. Hemel Hempstead, UK: VSN International; 2012.
21. Jansen J: Construction of linkage maps in full-sib families of diploidoutbreeding species by minimizing the number of recombinations inhidden inheritance vectors. Genetics 2005, 170:2013–2025.
22. Lander ES, Green P: Construction of multilocus genetic linkage maps inhumans. Proc Natl Acad Sci U S A 1987, 84:2363–2367.
23. Voorrips RE: MapChart: Software for the graphical presentation of linkagemaps and QTLs. J Hered 2002, 93:77–78.
doi:10.1186/1471-2164-13-203Cite this article as: Antanaviciute et al.: Development of a dense SNP-based linkage map of an apple rootstock progeny using the MalusInfinium whole genome genotyping array. BMC Genomics 2012 13:203.
Submit your next manuscript to BioMed Centraland take full advantage of:
• Convenient online submission
• Thorough peer review
• No space constraints or color figure charges
• Immediate publication on acceptance
• Inclusion in PubMed, CAS, Scopus and Google Scholar
• Research which is freely available for redistribution
Submit your manuscript at www.biomedcentral.com/submit