Embed Size (px)
Citation preview

Journal of Experimental Botanydoi:10.1093/jxb/erv274This paper is available online free of all access charges (see http://jxb.oxfordjournals.org/open_access.html for further details)
RESEARCH PAPER
Comprehensive transcript profiling of two grapevine rootstock genotypes contrasting in drought susceptibility links the phenylpropanoid pathway to enhanced tolerance
Massimiliano Corso1,2,*,†, Alessandro Vannozzi1,2,*, Elie Maza3, Nicola Vitulo4, Franco Meggio1,2, Andrea Pitacco1,2, Andrea Telatin4, Michela D’Angelo4, Erika Feltrin4, Alfredo Simone Negri5, Bhakti Prinsi5, Giorgio Valle4, Angelo Ramina1,2, Mondher Bouzayen3, Claudio Bonghi1,2,‡ and Margherita Lucchin1,2
1 Department of Agronomy, Food, Natural resources, Animals and Environment (DAFNAE), University of Padova Agripolis, 35020 Legnaro, Italy2 Centro Interdipartimentale per la Ricerca in Viticoltura ed Enologia (CIRVE), Via XXVIII Aprile, 14-31015 Conegliano (TV), Italy3 Genomics and Biotechnology of Fruit (GBF) Laboratory, Institut National Polytechnique de Toulouse, Avenue de l’Agrobiopole, F-31326 Castanet-Tolosan Cedex (Toulouse), France4 CRIBI, University of Padova, viale G. Colombo 3, 35121 Padova, Italy.5 Department of Agricultural and Environmental Sciences-Production, Landscape, Agroenergy (DiSAA), University of Milano, Milano 20133, Italy
* These authors contributed equally to this work.† Present address: Laboratoire de Physiologie et de Génétique Moléculaire des Plantes, Campus–Plaine ULB, Bd du Triomphe, Brussels, Belgium.‡ To whom correspondence should be addressed. E-mail: [email protected]
Received 20 January 2015; Revised 27 April 2015; Accepted 5 May 2015
Editor: Ian Dodd
Abstract
In light of ongoing climate changes in wine-growing regions, the selection of drought-tolerant rootstocks is becom-ing a crucial factor for developing a sustainable viticulture. In this study, M4, a new rootstock genotype that shows tolerance to drought, was compared from a genomic and transcriptomic point of view with the less drought-toler-ant genotype 101.14. The root and leaf transcriptome of both 101.14 and the M4 rootstock genotype was analysed, following exposure to progressive drought conditions. Multifactorial analyses indicated that stress treatment rep-resents the main factor driving differential gene expression in roots, whereas in leaves the genotype is the promi-nent factor. Upon stress, M4 roots and leaves showed a higher induction of resveratrol and flavonoid biosynthetic genes, respectively. The higher expression of VvSTS genes in M4, confirmed by the accumulation of higher levels of resveratrol in M4 roots compared with 101.14, was coupled to an up-regulation of several VvWRKY transcription factors. Interestingly, VvSTS promoter analyses performed on both the resequenced genomes highlighted a sig-nificantly higher number of W-BOX elements in the tolerant genotype. It is proposed that the elevated synthesis of resveratrol in M4 roots upon water stress could enhance the plant’s ability to cope with the oxidative stress usually associated with water deficit.
Key words: Flavonoids, genome re-sequencing, mRNA-Seq, stilbenes, Vitis, water stress.
This is an Open Access article distributed under the terms of the Creative Commons Attribution License (http://creativecommons.org/licenses/by/3.0/), which permits unrestricted reuse, distribution, and reproduction in any medium, provided the original work is properly cited.
© The Author 2015. Published by Oxford University Press on behalf of the Society for Experimental Biology.
Journal of Experimental Botany Advance Access published June 2, 2015 at U
niversita Degli Studi D
i Padova on June 3, 2015http://jxb.oxfordjournals.org/
Dow
nloaded from

Page 2 of 14 | Corso et al.
Introduction
Modern viticulture is almost exclusively based on the use of scions grafted onto interspecific rootstocks. This widespread agronomical practice is based on the fact that grapevine root-stocks are not only able to confer resistance to various root pathogens, but also impart a large range of advantages by altering numerous physiological processes at the scion level, such as biomass accumulation (Gregory et al., 2013), fruit quality (Walker et al., 2002), and the ability to respond to many abiotic stresses (Fisarakis et al., 2001; Marguerit et al., 2012; Covarrubias and Rombolà, 2013; Meggio et al., 2014). All of these characteristics make the use of rootstocks and the development of new rootstock genotypes of crucial importance in contemporary viticulture.
Water availability is one of the major environmental fac-tors limiting viticultural production (Chaves et al., 2010). Most wine-producing regions in the world are subjected to seasonal drought, and, based on the global climate models predicting an increase in aridity in the future, water deficit is likely to become the major limiting factor in wine production and quality. Generally, drought is associated with many mor-phological and physiological changes in plants over a range of spatial and temporal scales (Chaves et al., 2002), includ-ing reduced expansion of aerial organs (Cramer et al., 2007), decrease in transpiration and photosynthesis (Chaves et al., 2009, 2010), accumulation of osmotic compounds and ions (Cramer et al., 2007), activation of detoxifying processes, and, in parallel, the transcriptional regulation of a large num-ber of genes (Cramer et al., 2007; Tillett et al., 2011). Also root development is negatively influenced by drought stress, although to a lesser extent than that of the shoot. The dif-ferent sensitivity to water scarcity shown by the two organs results in a decrease in the shoot:root mass ratio, as observed in many plants upon water stress (WS) (Blum et al., 1996).
Grapevines are well adapted to semi-arid climates such as that of Mediterranean regions and are generally considered to be relatively tolerant to water deficit. Their large and deep root systems, together with physiological drought avoidance mechanisms, such as stomatal control of transpiration, xylem embolism, and the ability to adjust osmotically, mean that these plants are able to remain productive under subopti-mal water regimes (Lovisolo et al., 2002). However, with a large proportion of vineyards located in regions where sea-sonal drought coincides with the grapevine growing season, the combined effects of soil water deficit, air temperature, and high evaporative demand are known to limit yield and delay the vintage date (Chaves et al., 2009, 2010; Flexas et al., 2009), with a negative effect on the berries and, consequently, wine quality.
The grapevine photosynthetic process is reasonably resist-ant to WS (De Souza et al., 2003; Chaves et al., 2009). However, as the stress becomes severe, net CO2 assimilation and other metabolic processes operating in the mesophyll are inhibited, and water use efficiency declines. The imbalance between light capture and its utilization results in changes in the photochemistry of chloroplasts with the generation of reactive oxygen species (ROS), such as H2O2, O2
–, –OH, and
RO2, and nitric oxide (NO) responsible for most of the oxida-tive damage in biological systems and cellular components (Apel and Hirt, 2004; Kar, 2011).
Phytohormones play a central role in the ability of plants to adapt to abiotic stresses by mediating a wide range of responses (Santner and Estelle, 2009). Amongst these, absci-sic acid (ABA) is probably the most studied stress-responsive hormone in plants, because of its central role in regulating the plant response to water deficit (Fujita et al., 2011; Qin et al., 2011). ABA synthesis and accumulation is one of the earli-est plant responses to abiotic stress, triggering ABA-induced gene expression and inducing stomatal closure to reduce water loss, and eventually limiting cellular growth (Peleg and Blumwald, 2011; Lata and Prasad, 2011). Although ABA is the most comprehensively studied hormone involved in the plant response to drought, a growing number of studies have revealed that many other hormones, including auxins, ethyl-ene, jasmonates (JAs), gibberellins (GAs), salicylic acid (SA), and brassinosteroids (BRs), are also involved in response to stress (Peleg and Blumwald, 2011). Thus, the adaptation of plants to water-limiting conditions involves the concerted action of all of these hormones through fine-tuned cross-talk (Kohli et al., 2013). Phytohormones also appear to cross-talk with ROS, which probably act as secondary messengers of these regulators (Kar, 2011). It is well known that H2O2 regulates ABA-mediated stomatal closure by acting on Ca2+ levels and inactivating protein phosphatase 2C (Meinhard et al., 2002). Stomatal closure is also mediated by ethylene via ETR1, one of its receptors, which is involved in H2O2 sens-ing (Desikan et al., 2005). Lastly, Joo et al. (2001) reported that ROS may function as a downstream component in the auxin-mediated signal in gravistimulated or auxin-treated maize roots.
A biochemical and physiological study of a novel gen-otype proposed to be used as rootstock in grapevine pro-duction was recently performed by Meggio et al. (2014). This genotype, named M4 [(Vitis vinifera×V. berlandieri)×V. berlandieri×cv Resseguier n. 1], was selected for its high tolerance to water deficit (WS) and salt exposure [salt stress (SS)]. When compared with the commercial geno-type 101.14 (V. riparia×V. rupestris), M4 ungrafted plants showed a greater capacity to tolerate WS and SS, maintain-ing photosynthetic activity while under severe stress con-ditions. Here a large-scale whole-transcriptome analyses performed on leaf and root tissues of both M4 and 101.14 genotypes under the same WS experimental conditions as described previously by Meggio et al. (2014) is reported It is important to note that in contrast to previous drought studies in which plants were subjected to an immediate reduction in water availability, in the present experiment, water deprivation was accomplished gradually, mimick-ing conditions occurring in the field. Another innovative aspect of this study relies on the transcriptome compara-tive approach between a drought-tolerant and susceptible genotype with regard to WS, which has not been explored to date in the Vitis genus.
at Universita D
egli Studi Di Padova on June 3, 2015
http://jxb.oxfordjournals.org/D
ownloaded from

Drought tolerance in grapevine rootstock genotypes | Page 3 of 14
Materials and methods
Rootstock genotypes and genome resequencingGrapevine rootstocks used in this study were the common drought-susceptible genotype 101.14 (V. riparia×V. rupestris) and the drought-tolerant genotype M4 [(V. vinifera×V. berlandieri)×V. ber-landieri cv. Resseguier n. 1], recently described and physiologically characterized by Meggio et al. (2014). As both of these rootstocks are interspecific hybrids, genome resequencing was carried out as a preliminary step critical for further analyses, in order to describe the variability amongst single nucleotide polymorphisms (SNPs) and gene predictions between 101.14, M1, and the reference PN40024 genome (Jaillon et al., 2007). Briefly, genomic DNA was isolated from young leaves, and for each genotype a mate-pair DNA library was constructed, which was sequenced using the SOLiD 5500×l plat-form (Life Technologies), following the manufacturer’s instructions. Alignments of the 101.14 and M4 DNA sequences onto PN40024 were performed with PASS v. 2.0 software (Campagna et al., 2009) using auto-optimized parameters for trimming and 80% identity. The same platform was used for SNP calling. De novo assembly of unaligned reads was obtained with an optimized script of the Velvet 1.2 package (VelvetOptimize; Zerbino and Birney, 2008) fixing a k-mer size of 27. Results are available at the http://genomes.cribi.unipd.it/grape/serres/ website.
Experimental designFor each genotype, 72 two-year-old plants were glasshouse grown in 3 litre pots filled with sand–peat mixture (7:3 v/v) with a water content maintained to 80% of soil field capacity calculated gravi-metrically by the difference in weight between the wet and the dry soil. Plants were divided into two groups: plants grown under well-watered (WW) conditions (control) and plants grown under water stress (WS) conditions. The WS was gradually imposed by decreas-ing the water availability in pots from 80% to 30% of field capacity, whereas WW plants, used as control, were maintained to 80% of field capacity (Supplementary Fig. S1 available at JXB online). The whole experiment lasted 10 d, during which four samplings, desig-nated as T1–T4 and corresponding to 2, 4, 7, and 10 days after stress imposition (DASI), were performed for both leaves and roots.
Leaf physiology measurementsDuring the experimental period, the leaf transpiration rate (E, mmol H2O m–2 s–1) was measured (between 11:00 h and 14:00 h solar time) on two fully expanded leaves per plant using a LI-6400 port-able photosynthesis system (Li-Cor Inc., Lincoln, NE, USA) under a constant saturating photosynthetic photon flux density (PPFD) of 600 μmol of photons m–2 s–1, CO2 concentration of 380 μmol mol−1, block temperature of 25 °C, and relative humidity between 60% and 70% allowing ~1.5 kPa of vapour pressure deficit (VPD) inside the leaf chamber.
mRNA-Seq and metabolite analysesLeaves and roots of both 101.14 and M4 genotypes grown upon WW and WS conditions were collected from three plants at T1, T2, and T3 and from six plants at T4 and pooled as previously described in Meggio et al. (2014). For both genotypes, the zero time samples (T0) were collected from six plants of each genotype grown under WW conditions. The whole experiment was performed on two sepa-rate biological replicates for a total of 36 samples from leaves and 36 samples from roots [2 genotypes×2 treatments×4 time points (T1–T4)+2 genotypes in WW conditions (T0)=18 samples×2 repli-cates] (Supplementary Fig. S1 at JXB online). Methods for whole-transcriptome analysis are reported in Supplementary Methods S1. The mRNA sequencing (mRNA-Seq) data obtained in this study have been deposited at the NCBI Short Read Archive (http://
www.ncbi.nlm.nih.gov/Traces/sra/sra.cgi) under accession number SRA110531.
ABA was extracted from leaf tissues using a modified protocol based on Zhang et al. (2008) (Supplementary Methods S2 at JXB online). For stilbene quantification, root samples were powdered in liquid N2 and extracted in 3 vols of 90% (v/v) methanol, 0.1% (v/v) formic acid (FA). After shaking at 4 °C for 10 min, samples were centrifuged at 10 000 g for 10 min at 4 °C, filtered by Millipore Millex HV cartridges (0.45 μm), and dried in a Speed-Vac at room temperature for 90 min. The pellets were then solubilized in 4% (v/v) methanol, 0.1% (v/v) formic acid. Liquid chromatography-elecrospray ionization-mass spectrometry (LC-ESI-MS) analyses were conducted using an Agilent Technologies 1200 Series capillary pump coupled with a dual ESI source on a 6520 Q-TOF mass spec-trometer. Briefly, LC runs were performed on an XDB-C18 column (2.1 × 50 mm, 1.8 μm, Agilent Technologies) applying a 20 min non-linear gradient of 0.1% (v/v) FA/acetonitrile, from 5% to 30%, with a flow rate of 200 μl min–1. The ESI source was set at 350 °C, drying gas (N2) at 5 l min–1, 3000 V (positive mode), fragmentor at 75 V, and the data acquisition range was 100–600 m/z at 2.03 scans s–1. The compound identification was conducted by extraction of the EIC for [MH+] (resveratrol, 229.09 m/z; piceid, 391.14 m/z) accepting a mass error of ±20 mDa and referring to calibration curves.
Multifactorial and pairwise statistical analysesStatistical analyses for discovering differentially expressed genes (DEGs) were performed with the DEseq R package (http://www.r-project.org/) (Maza et al., 2013). In order to evaluate the individual effects of the genotype (101.14 and M4), treatment (WW and WS), and time point (T1–T4) on gene expression, a multifactorial analysis was conducted using the multifactor designs method of the DEseq R package (Anders and Huber, 2010; http://bioconductor.org/pack-ages/release/bioc/html/DESeq.html). This method evaluates the weight of each factor considered in the analysis and its impact on DEGs, according to a false discovery rate (FDR)-adjusted P-value <0.05. The genotype effect (101.14 and M4) is indicated as ‘G’, the type of treatment imposed indicated as ‘T’ (WW and WS plants), and the time point considered within the stress treatment indicated as ‘P’ (T1, T2, T3, T4).
Ontology and differential clustering analysis (DCA)In order to classify those genes affected by WS treatment function-ally, those DEGs that, based on the multifactorial analysis, were affected by all components (common DEGs between G, T, and P) and by the genotype and treatment (common DEGs between G and T), were associated with their Gene Ontology (GO) terms, imported in Blast2GO software v 2.5.0 and grouped into enriched GO catego-ries (Götz et al., 2008). Within the most represented GO categories, those DEGs associated with GO terms related to plant hormones, secondary metabolism, sugars, stresses, cell wall, and transcription factors were selected for a DCA. This approach, previously applied by Ihmels et al. (2005), was further improved to better capture dif-ferential expression patterns and systematically characterize both similarities and differences in the fine structure of co-regulation pat-terns. The modified version of the original DCA method and the R script are described in Supplementary Methods S3 at JXB online.
Results
The M4 genotype maintains higher transpiration rate compared with 101.14 upon drought
The response of the two rootstock genotypes used in this study (101.14 and M4) to WS in terms of net CO2 assimi-lation rate, stomatal conductance, leaf water potential, and
at Universita D
egli Studi Di Padova on June 3, 2015
http://jxb.oxfordjournals.org/D
ownloaded from

Page 4 of 14 | Corso et al.
tissue osmolality was previously reported by Meggio et al. (2014). As an additional physiological indicator of WS, the transpiration rate (E) was also measured (Fig. 1). Under WW conditions, E-values were not statistically different and equal to 2.7 ± 0.3 and 2.4 ± 0.2 mmol H2O m–2 s–1 in M4 and 101.14 genotypes, respectively, and remained relatively con-stant throughout the treatment period. On the other hand, upon application of the WS treatment, which led to a reduc-tion in the proportion of field capacity to ~30% at 6 DASI, 101.14 plants dropped to extremely low E-values, whereas M4 plants maintained values of ~20% with respect to the control (Fig. 1a). In order to ascertain whether typical signals induced by drought were already present at the early phases of stress and, therefore, if the rootstock genotypes behaved similarly in terms of the perception of water deprivation, the leaf ABA content was analysed throughout the treat-ment period. (Fig. 1b). In the leaves of water-stressed 101.14 plants, the ABA content was significantly higher than in the control plants (WW) at T1 (fold change=1.58), whereas in water-stressed M4 plants no differences in ABA content were noted until T2. At T2, both genotypes accumulated a con-spicuous amount of ABA, although 101.14 reached higher values compared with M4. The ABA level remained almost constant in water-stressed 101.14 plants between T2 and T4, while it continued to increase in water-stressed M4 plants.
PN400024 is a suitable reference for mapping both the 101.14 and M4 transcriptome
The interspecific hybrids M4 and 101.14 were obtained by crossing selected North American wild grapevine species (V. riparia, V. rupestris, and V. berlandieri) with the European cultivated species (V. vinifera). This raised the question of whether potential differences between the sequence of pre-dicted genes in the PN40024 reference genome (Jaillon et al., 2007) and orthologous sequences in the 101.14 and M4 genomes may impair the mapping of mRNA reads to the ref-erence genome and compromise the robustness of the data. To address this issue, the resequencing of the M4 and 101.14 genomes was performed. On average, only one variant every 200 bases was found both in M4 and in 101.14, suggesting that the PN40024 genome should be a suitable reference for read mapping (Supplementary Results S1 at JXB online). The genome reference was corrected according to the SNPs and small indels (In/Dels) identified in both resequenced genomes, and the resulting sequences are available at http://genomes.cribi.unipd.it/grape/serres/. Furthermore, when the mRNA-Seq reads were mapped on their corresponding corrected genomes, only a negligible increase of alignments (~1%) was obtained as compared with the mapping onto PN40024. Based on these results, all RNA-Seq reads were mapped on the PN40024 reference genome, thus making the comparison of the different samples more manageable. A further question was whether the reference PN40024 genes are present in both the genotypes. To investigate this point, the genomic reads of M4 and 101.14 were mapped independently on the PN40024 reference genome, allowing multiple mapping, with the same stringency used for RNA-Seq mapping. The results indicated
that all the genes of the reference genome were covered both by the M4 and by the 101.14 reads; the only exception being a single gene of unknown function (VIT_00s1914g00010) that seemed to be absent in both the 101.14 and M4 genotypes.
In order to obtain a snapshot of changes in the transcrip-tome of the two rootstock genotypes over the entire stress period, an mRNA-Seq analysis was performed on all 72 samples as described in the Materials and methods. This produced ~4.8 billion paired-end reads (75 and 35 nucleo-tides in length for forward and reverse reads, respectively),
Fig. 1. (A) Effect of water stress (WS) on leaf transpiration rate (E) of M4 (open circles) and 101.14 (filled circles) grapevine rootstocks. Average ±SE values of E are expressed as a proportion of the control (i.e. E values of 2.7 ± 0.3 and 2.4 ± 0.2 mmol H2O m–2 s–1 for M4 and 101.14 genotypes, respectively, at T0). Well-watered (WW) plants were maintained at 80% of soil field capacity. WS was induced by progressively reducing the soil water content down to 30% of field capacity. A field capacity of 30% by weight was obtained gravimetrically by the difference in weight between the wet and the dry soil. T1–T4 represent sampling times throughout the experimental period after control (T0). Significant differences amongst genotypes within a given time point are indicated as **(P< 0.01) and *(P<0.05) according to the Student’s t-test. (B) Leaf ABA content in 101.14 and M4 plants in both WW (empty bars) and WS conditions (solid bars). Measurements were carried out at T1, T2, and T4, corresponding to 2, 4, and 10 days after stress imposition (DASI), respectively. Letters indicate statistical differences in (two-tailed unpaired) Student’s t–test at P<0.01.
at Universita D
egli Studi Di Padova on June 3, 2015
http://jxb.oxfordjournals.org/D
ownloaded from
Drought tolerance in grapevine rootstock genotypes | Page 5 of 14
with the total number of reads produced for each time point ranging from 29 to 82 million paired-end reads and a median of 45 million reads (Supplementary Table S1 at JXB online). On average, 90% of the reads passed the qual-ity control test (filtered based on read length after trimming the low quality bases) and were mapped to the PN40024 12X v1 grape reference genome (http://genomes.cribi.unipd.it/grape/), producing between 10 and 37 million unique map-ping reads depending on the sample (Supplementary Tables S1, S2).
Drought is the main factor driving differential gene expression in roots but not in leaves
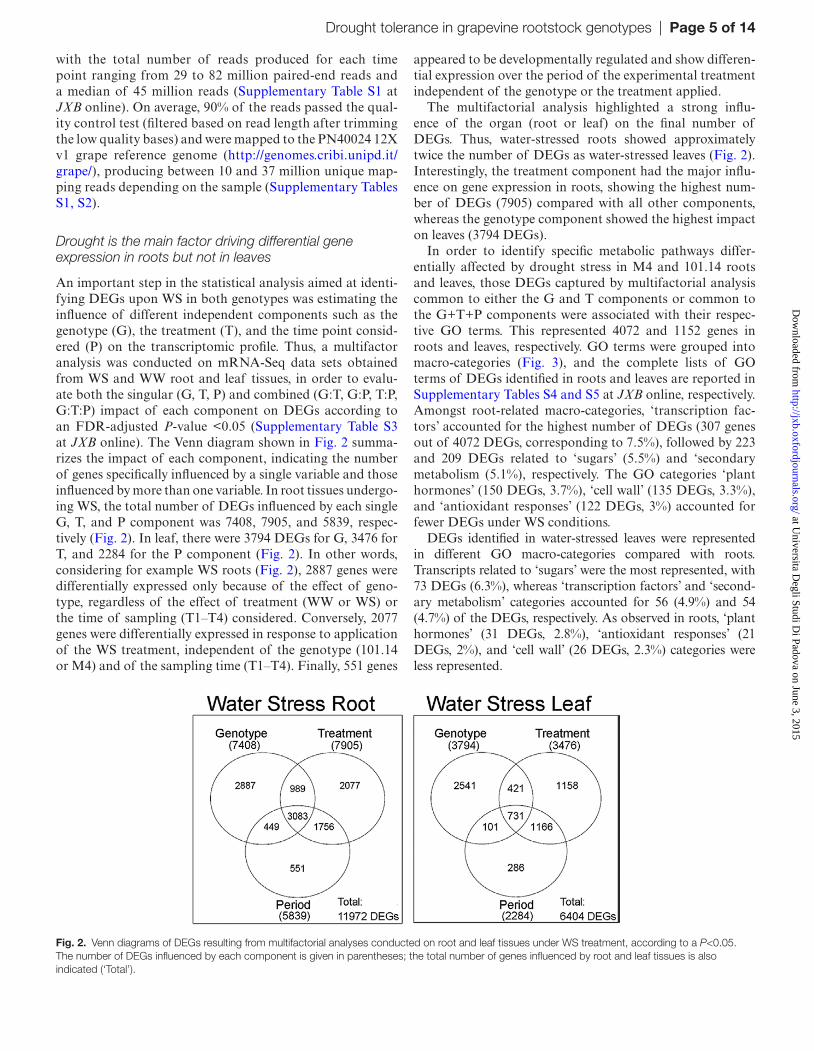
An important step in the statistical analysis aimed at identi-fying DEGs upon WS in both genotypes was estimating the influence of different independent components such as the genotype (G), the treatment (T), and the time point consid-ered (P) on the transcriptomic profile. Thus, a multifactor analysis was conducted on mRNA-Seq data sets obtained from WS and WW root and leaf tissues, in order to evalu-ate both the singular (G, T, P) and combined (G:T, G:P, T:P, G:T:P) impact of each component on DEGs according to an FDR-adjusted P-value <0.05 (Supplementary Table S3 at JXB online). The Venn diagram shown in Fig. 2 summa-rizes the impact of each component, indicating the number of genes specifically influenced by a single variable and those influenced by more than one variable. In root tissues undergo-ing WS, the total number of DEGs influenced by each single G, T, and P component was 7408, 7905, and 5839, respec-tively (Fig. 2). In leaf, there were 3794 DEGs for G, 3476 for T, and 2284 for the P component (Fig. 2). In other words, considering for example WS roots (Fig. 2), 2887 genes were differentially expressed only because of the effect of geno-type, regardless of the effect of treatment (WW or WS) or the time of sampling (T1–T4) considered. Conversely, 2077 genes were differentially expressed in response to application of the WS treatment, independent of the genotype (101.14 or M4) and of the sampling time (T1–T4). Finally, 551 genes
appeared to be developmentally regulated and show differen-tial expression over the period of the experimental treatment independent of the genotype or the treatment applied.
The multifactorial analysis highlighted a strong influ-ence of the organ (root or leaf) on the final number of DEGs. Thus, water-stressed roots showed approximately twice the number of DEGs as water-stressed leaves (Fig. 2). Interestingly, the treatment component had the major influ-ence on gene expression in roots, showing the highest num-ber of DEGs (7905) compared with all other components, whereas the genotype component showed the highest impact on leaves (3794 DEGs).
In order to identify specific metabolic pathways differ-entially affected by drought stress in M4 and 101.14 roots and leaves, those DEGs captured by multifactorial analysis common to either the G and T components or common to the G+T+P components were associated with their respec-tive GO terms. This represented 4072 and 1152 genes in roots and leaves, respectively. GO terms were grouped into macro-categories (Fig. 3), and the complete lists of GO terms of DEGs identified in roots and leaves are reported in Supplementary Tables S4 and S5 at JXB online, respectively. Amongst root-related macro-categories, ‘transcription fac-tors’ accounted for the highest number of DEGs (307 genes out of 4072 DEGs, corresponding to 7.5%), followed by 223 and 209 DEGs related to ‘sugars’ (5.5%) and ‘secondary metabolism (5.1%), respectively. The GO categories ‘plant hormones’ (150 DEGs, 3.7%), ‘cell wall’ (135 DEGs, 3.3%), and ‘antioxidant responses’ (122 DEGs, 3%) accounted for fewer DEGs under WS conditions.
DEGs identified in water-stressed leaves were represented in different GO macro-categories compared with roots. Transcripts related to ‘sugars’ were the most represented, with 73 DEGs (6.3%), whereas ‘transcription factors’ and ‘second-ary metabolism’ categories accounted for 56 (4.9%) and 54 (4.7%) of the DEGs, respectively. As observed in roots, ‘plant hormones’ (31 DEGs, 2.8%), ‘antioxidant responses’ (21 DEGs, 2%), and ‘cell wall’ (26 DEGs, 2.3%) categories were less represented.
Fig. 2. Venn diagrams of DEGs resulting from multifactorial analyses conducted on root and leaf tissues under WS treatment, according to a P<0.05. The number of DEGs influenced by each component is given in parentheses; the total number of genes influenced by root and leaf tissues is also indicated (‘Total’).
at Universita D
egli Studi Di Padova on June 3, 2015
http://jxb.oxfordjournals.org/D
ownloaded from

Page 6 of 14 | Corso et al.
Drought differentially affects stilbene and flavonoid metabolism in M4 and 101.14 plants
In order to better capture differential expression patterns between 101.14 and M4 genotypes, and to characterize the conservation or divergence of co-expression between genes with a related function, a recently developed approach, termed DCA, was implemented (Ihmels et al., 2005; Lelandais et al., 2008; Cohen et al. 2010). This approach allows the identifi-cation of co-expression clusters within a given gene set and to assign each of these clusters to one of four correlation categories defined on the basis of the level of conservation between two genotypes: ‘full’, ‘partial’, ‘split’, or ‘absent’.
Basically, the DCA method allows both similarities and differences in the fine structure of co-regulation patterns between two genotypes to be systematically characterized and assigned to one out of four conservation categories: full, partial, split, or no conservation of co-expression. In a ‘full’ conservation class, a cluster of genes, which are cor-related together in one of two genotypes, also correlate in the other. In a ‘partial’ conservation class, only a subset of those genes which appear to correlate in one genotype also correlate in the other. A ‘split’ conservation class describes a condition in which genes which are grouped in a single correlation cluster in one genotype, are divided into two (or more) correlation subclusters in the other. Finally in case of ‘absent’ or ‘no correlation’, only one genotype shows cor-relation between a given group of genes whereas the other does not (for further details, see Supplementary Method S3 at JXB online). For this approach only those G–T and G–T–P common DEGs sharing membership of the same GO categories as previously identified were considered and they were associated with their expression values provided as log2 WS/WW tissues (Supplementary Table S6). Clusters showing the most interesting features in both root and leaf tissues are reported in Figs 4 and 5. Again, the data confirmed that dif-ferent organs display different responses to stress at the gene expression level. In fact, while changes in expression related to ‘transcription factors’ and ‘secondary metabolism’ ontolo-gies were common features both for roots (Fig. 4a, b) and for leaves (Fig. 5a, b), the ‘plant hormones’ category (Fig. 4c)
was significantly modulated only in roots, whereas the ‘sug-ars’ category (Fig. 5c) was affected exclusively in leaves.
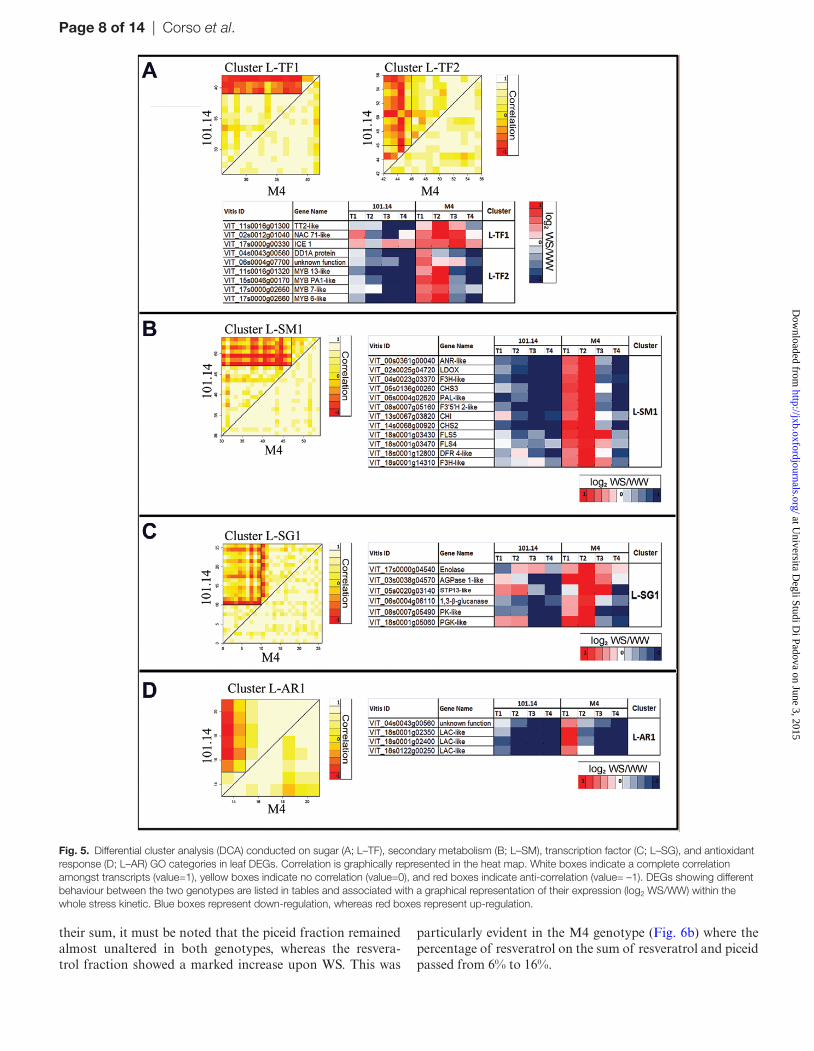
Within the transcription factors (TFs) category (Fig. 4a), DEGs in roots were subdivided into three clusters that high-light different expression kinetics: root (R)–TF1 (reference 101.14), R–TF2, and R–TF3 (reference M4) (Supplementary Methods S3 at JXB online). Genes belonging to these cat-egories were uniformly co-expressed in the reference geno-type. In contrast, in the target genotype, they were split into two distinct secondary clusters, one of which was similar in both 101.14 and M4, with the other one showing different behaviour for several genes, indicating a ‘partial’ conserva-tion. Genes of particular interest within these clusters were those belonging to the WRKY (R–TF1, ‘split’), MYB (R–TF2, ‘split’), and NAC (R–TF3, ‘partial’) families. WRKY TFs showed a different behaviour between the two genotypes, being strongly up-regulated at T2 only in M4 (Fig. 4a). Five MYBs and three NAC TFs were induced at T1 in M4 under WS, but were significantly down-regulated in 101.14 (Fig. 4a). In leaves, amongst TFs [leaf (L)–TF], MYBs were the most represented gene family showing opposite expression kinetics in M4 and 101.14 genotypes. In the L–TF2 cluster (Fig. 5a), four MYB TFs were induced at T1 and T2 only in M4 upon WS. In contrast, these TFs showed a lower expression in 101.14 WS leaves than in WW leaves (Fig. 5a).
Another GO category giving interesting results in the DCA analysis was ‘secondary metabolism’ (SM) (Figs 4b, 5b). In roots, most of the transcripts belonging to this ontol-ogy encoded glutathione S-transferases (GSTs) and stilbene synthases (STSs) (clusters R–SM1, 2, and 3). Based on the nomenclature proposed by Vannozzi et al. (2012), eight VvSTS transcripts (VvSTS12, 13, 16, 17, 18, 24, 27, and 29) were found to be significantly up-regulated in M4 stressed roots at T2, whereas they were generally down-regulated in 101.14 (Fig. 4b) for both R–SM1 (no conservation) and R–SM3 (partial conservation) clusters. Based on the differences observed in VvSTS transcript abundance, the concentration of free and conjugated forms of stilbenes was measured in the roots of the two genotypes. As a general observation, looking at the sum of resveratrol and piceid concentration, the results indicated that 101.14 roots accumulate more stilbenes than
Fig. 3. Analysis of ontology categories of genes differentially expressed in M4 and 101.14 roots and leaves under drought conditions related to plant hormone-, antioxidant response-, sugar-, cell wall-, secondary metabolism-, and transcription factor-related GO terms. The number and percentage of DEGs (resulting from multifactorial analysis) belonging to each category are provided.
at Universita D
egli Studi Di Padova on June 3, 2015
http://jxb.oxfordjournals.org/D
ownloaded from

Drought tolerance in grapevine rootstock genotypes | Page 7 of 14
M4 in both control and stress conditions. Moreover, water stress did not appear to affect the sum of resveratrol and piceid significantly in either genotype (Fig. 6a). Only a slight
decrease was registered, mainly due to a decline in piceid content. Looking more in detail and considering singularly both the fraction of resveratrol and piceid with respect to
Fig. 4. Differential cluster analysis (DCA) conducted on transcription factor (A; R–TF), secondary metabolism (B; R–SM), and plant hormone (C; R–PH) GO categories enriched in root DEGs. Correlation is graphically represented in the heat map. White boxes indicate a complete correlation amongst transcripts (value=1), yellow boxes indicate no correlation (value=0), and red boxes indicate anti-correlation (value= –1). DEGs showing different behaviour between the two genotypes are listed in tables and associated with a graphical representation of their expression (log2 WS/WW) within the whole stress kinetic. Blue boxes represent down-regulation, whereas red boxes represent up-regulation.
at Universita D
egli Studi Di Padova on June 3, 2015
http://jxb.oxfordjournals.org/D
ownloaded from
Page 8 of 14 | Corso et al.
their sum, it must be noted that the piceid fraction remained almost unaltered in both genotypes, whereas the resvera-trol fraction showed a marked increase upon WS. This was
particularly evident in the M4 genotype (Fig. 6b) where the percentage of resveratrol on the sum of resveratrol and piceid passed from 6% to 16%.
Fig. 5. Differential cluster analysis (DCA) conducted on sugar (A; L–TF), secondary metabolism (B; L–SM), transcription factor (C; L–SG), and antioxidant response (D; L–AR) GO categories in leaf DEGs. Correlation is graphically represented in the heat map. White boxes indicate a complete correlation amongst transcripts (value=1), yellow boxes indicate no correlation (value=0), and red boxes indicate anti-correlation (value= –1). DEGs showing different behaviour between the two genotypes are listed in tables and associated with a graphical representation of their expression (log2 WS/WW) within the whole stress kinetic. Blue boxes represent down-regulation, whereas red boxes represent up-regulation.
at Universita D
egli Studi Di Padova on June 3, 2015
http://jxb.oxfordjournals.org/D
ownloaded from

Drought tolerance in grapevine rootstock genotypes | Page 9 of 14
The observation that VvSTSs genes appear to be co-expressed with a number of WRKY TFs (Fig. 4a) raised the question of whether these TFs might be involved in the tran-scriptional regulation of VvSTS genes. An in silico search for putative cis-elements in the promoter regions of VvSTS genes that were identified to be up-regulated at T2 further supported this hypothesis. Random motifs of 4–7 mers were retrieved from 10 000 independent promoter sequences of PN40024, M4, and 101.14 genotypes. Amongst these, only those cis-elements classified as W-BOX were considered for statistical analysis (Supplementary Fig. S2 at JXB online). A t-test was done com-paring the frequencies of W-BOXs in the promoter of VvSTS genes and in another 10 000 randomly chosen promoters in each genotype. A significant difference (P<0.05) was only found in M4, where almost all VvSTS promoters (with the exception of VvSTS12, VIT_16s0100g00800) exhibited a higher number of W-BOX elements compared with 101.14. The number of W-BOX elements was significantly correlated to the expression levels of VvSTS genes (R2=0.76), with members characterized by a higher number of W-BOX elements in the promoter also showing a higher expression (Supplementary Fig. S2).
Regarding the L–SM clusters, these included 12 genes related to the flavonoid metabolic pathway, all induced at T1 and strongly expressed at T2 in M4 water-stressed leaves (Fig. 5b). Amongst these were: (i) phenylalanine-ammonia-lyase (PAL), chalcone synthase (CHS), and chalcone isomer-ase (CHI) genes, which catalyse the early steps of the general phenylpropanoid pathway; (ii) flavonoid 3-hydroxylase-related genes (F3’5’H 2-like and two F3H-like); (iii) flavonol synthase 4 (FLS4) and FLS5, which lead to flavonol biosyn-thesis; and (iv) dihydroflavonol 4-reductase (DFR 4-like), leu-coanthocyanidin dioxygenase (LDOX), and anthocyanidin reductase (ANR), which lead to anthocyanin biosynthesis.
The ‘plant hormones’ (PH) category also showed an inter-esting pattern of expression in roots (Fig. 4c). Amongst expres-sion clusters identified through the DCA analysis within this GO category, one cluster, namely R–PH1, belonged to the ‘no conservation’ class whereas the R–PH2 primary cluster dis-plays a ‘split conservation’. Cluster R–PH1 is composed exclu-sively of transcripts up-regulated in M4 at T1 and involved in auxin transport (PIN1), auxin signal transduction (SAUR-like), JA biosynthesis (JAOMe-like), and GA signal transduc-tion (GAI1 and, RGL1). In contrast, R–PH2 contained genes induced exclusively in 101.14 at later time points (T2, T3, and T4) and included two ABA 8’-hydroxylase-related genes, encoding enzymes involved in ABA catabolism. It is worth noting that the opposite behaviour of these genes in the two rootstock genotypes (induced by WS in 101.14 and repressed in M4) was not observed for genes involved in ABA biosyn-thesis and signalling (Supplementary Fig. S3 at JXB online).
The ‘sugars’ category (L–SG) was found to be the most highly represented in terms of DEGs in leaf tissue (Fig. 3). Six tran-scripts belonging to the L–SG1 cluster (Fig. 5c) showed an induc-tion in water-stressed M4 plants, although with different patterns of expression. In contrast, these genes were all down-regulated in water-stressed 101.14 plants across the whole stress treatment. The leaf ‘antioxidant responses’ (L–AR) category showed split conservation between 101.14 and M4 genotypes, with three genes belonging to the laccase (LAC) family displaying an induction limited to M4 leaves at the early stage of WS (T1) (Fig. 5d).
Discussion
The study provides a genome-wide description of the tran-scriptional response induced by WS in two grapevine root-stock genotypes, M4 and 101.14, which display contrasting
Fig. 6. (A) Quantification of trans-resveratrol and trans-piceid in 101.14 and M4 roots at T4 in well-watered (WW) and water stress (WS) conditions. (B) Percentage of resveratrol and piceid fraction with respect to their sum in WW (withe bars) and WS (black bars) conditions. Values are calculated as the mean (n=4). Vertical bars indicate the standard error (SE). Letters indicate statistical differences in (two-tailed unpaired) Student’s t-test at P<0.01.
at Universita D
egli Studi Di Padova on June 3, 2015
http://jxb.oxfordjournals.org/D
ownloaded from

Page 10 of 14 | Corso et al.
tolerance to drought. This study not only compares the tran-scriptomic responses of drought-susceptible and drought-tolerant genotypes, but also provides a comparative characterization of the WS responses of the underground (roots) and aerial (leaves) parts of the plant. To replicate as accurately as possible changing conditions normally found in the field and thus capture the adaptive response to drought, WS was progressively imposed on the plants by gradually reducing water availability to reduce field capacity from 80% to 30% over a 10 d period (Supplementary Fig. S1 at JXB online). In this regard, the experimental design employed here is markedly different from that used in previous stud-ies (Cramer et al., 2007), where water supply was completely halted from the beginning of the stress experiment.
In both 101.14 and M4 WS plants, the reduction of E was accompanied by a significant increase in leaf ABA. However, although ABA levels at severe stress (T4) were almost similar in the two rootstock genotypes, the pattern of accumulation observed was different, with 101.14 starting to increase the concentration of hormone from the first stages of water dep-rivation (T1), reaching a plateau already at T2. The fast and high accumulation of ABA is in accord with the most marked decline of stomatal conductance observed, under the same experimental conditions, in 101.14 in comparison with M4 by Meggio et al. (2014). All these pieces of evidence (in the present study and in Meggio et al., 2014) suggest that 101.14 adopts a more conservative strategy to cope with WS com-pared with M4, which maintains a higher transpiration rate (Fig. 1) also upon severe WS.
To obtain a more comprehensive understanding of physi-ological responses to drought a whole-transcriptome analysis was performed in both water-stressed and unstressed plants. Taking into account that M4 and 101.14 are interspecific hybrids, as a first step their genomes were resequenced to verify if PN40024 was a suitable reference for mapping the mRNA-Seq reads from the hybrids. Resequencing revealed that (i) both the genotypes have a low and comparable fre-quency of SNPs (Supplementary Results S1 at JXB online) as already observed by Myles et al. (2010) amongst different Vitis species and (ii) compared with PN40024 gene annota-tion, genotype gene content is quite similar. Taken together, these findings indicated that PN40024 is a suitable reference for performing gene expression analysis. However, it is also worth noting that the technology used in this study does not allow exclusion of gene families that have been expanded or condensed in the different genotypes.
Multifactorial analyses (Fig. 2) on whole leaf and root transcriptome data sets enabled better definition of the spe-cific influence of the genotype and stress treatment on the transcriptome, and allowed those DEGs whose expression is only linked to the contribution of a single component to be filtered out. In other words, it was possible to exclude those genes whose differential expression was caused just by the ‘genotype’ or ‘treatment’ and consider those affected by the contribution of both variables (McCarthy et al., 2012).
The comparison of leaf and root expression data obtained by multifactorial analyses (Fig. 2; Supplementary Table S3 at JXB online) indicated that in roots (Fig. 2) the ‘treat-ment’ factor is the main variable explaining differential gene expression, whereas in leaves (Fig. 2) the ‘genotype’ appears to be the predominant factor. This observation is not surprising, given that the root system is the first organ to perceive water deprivation and actively respond to this stress (Frensch et al., 1997), and thus the type of treatment represents the main variable influencing gene expression in this organ. The opposite is true in the aerial part of the plant, where the ‘genotype’ factor appears to have a major effect when compared with the other components. A possi-ble explanation for this observation relies on the fact that, if roots mediate the early perception of the stress, the sec-ondary signals, which are produced by these organs and are transmitted to leaves, are strictly related to the modality by
Fig. 7. Hypothetical model summarizing the events occurring in leaves and roots of M4 and 101.14 upon WS. Grey and red boxes list molecular responses to WS that are common to both genotypes and M4 specific, respectively. White boxes report physiological events associated with WS occurring in root (lateral roots growth and water suction from soil) and leaves (transpiration, E; net-assimilation, An; photosynthesis) of both genotypes. Dashed lines indicate the lower impact of WS on the physiological events in roots and leaves observed in M4.
at Universita D
egli Studi Di Padova on June 3, 2015
http://jxb.oxfordjournals.org/D
ownloaded from

Drought tolerance in grapevine rootstock genotypes | Page 11 of 14
which the apical part of the plant responds to these pertur-bations and this is mainly conditioned by the genotype. The role of roots in the initial perception of WS is indicated by the high expression of genes involved in ABA biosynthe-sis and signalling in both genotypes compared with leaves (Supplementary Fig. S3). Similar results were also reported in Cabernet Sauvignon vines grafted on Ramsey, where the expression of two main genes associated with ABA synthe-sis, NCED1 and NCED2, was found to be more pronounced in roots compared with leaves and to be inversely correlated to water supply (Speirs et al., 2013). Since ABA has been claimed to play a major role in root to shoot signalling upon WS (Dood, 2005), it is possible that the increase in its con-centration observed in both 101.14 and M4 leaves (Fig. 1b) is mainly due to its transportation from roots rather than its biosynthesis at the leaf site, as already reported by Speirs et al. (2013). In this context, the observation that ABA con-tent in 101.14 leaves reached a plateau at T2–T4 whereas it continued to increase in M4 leaves (Fig. 1b), although ABA biosynthetic genes were similarly induced in both rootstock genotypes (Supplementary Fig. S3), could be a possible consequence of the different behaviour observed in ABA catabolism at the root level. This may indicate the existence of a different control of ABA homeostasis within the two genotypes under study. In fact the results indicated that two orthologues of the Arabidopsis CYP706 and CYP707 genes, which encode the major enzyme involved in ABA catabo-lism during dehydration (Speirs et al., 2013; Liu et al., 2014), were induced in response to water-stressed 101.14 roots at all time points following T2, whereas they were maintained constantly down-regulated in M4 compared with the control (Fig. 4; Supplementary Fig. S3). Differences in the behaviour of genes involved in hormone homeostasis observed between the two rootstocks were not limited to genes related to ABA, but also included other hormones. For example, WS induced the expression of JA- and GA-related genes only in M4 water-stressed roots (Fig. 4c), whereas these transcripts were down-regulated in stressed roots of 101.14. Methyljasmonate (MeJA) mediates many developmental processes and defence responses to biotic and abiotic stresses in plants (Ismail et al., 2012). A positive correlation between drought and MeJA biosynthesis was also observed in rice and chickpea, stressing the putative role of this hormone in WS-induced responses (Kim et al., 2009; De Domenico et al., 2012).
DCA analysis on genes belonging to the ‘sugar’ cate-gory highlighted the existence of a gene orthologous to an Arabidopsis sugar transporter protein (AtSTP13/MSS1) which showed a higher induction in M4 stressed leaves compared with 101.14. Although the role of AtSTP13 has not been fully characterized, this gene seems to be drought responsive and, similarly to many other sucrose transport-ers, it codes for a Suc/H+ symporter which could be poten-tially involved in the phloem loading and in the long-distance transport of soluble sugars from source organs to sinks such as roots (Kühn and Grof, 2010). This hypothesis is congruent with the observation that M4 WS roots accumulate a higher level of soluble sugars with respect to 101.14 (Meggio et al. 2014).
In both roots and leaves, a significant number of DEGs belonged to the ‘secondary metabolism’ category, although being involved in different metabolic pathways. In leaves, M4 stressed plants showed an induction of many structural genes involved in the flavonoid pathway (Fig. 5b). Conversely, in roots, plants accumulated both transcripts (Fig. 4b) and pro-teins (Luca Espen, personal communication) corresponding to stilbene synthases (VvSTS), responsible for the biosynthesis of the 3-hydroxy-trans-stilbene, better known as resveratrol. Although in 101.14 the sum of resveratrol and its glycosylated form (piceid) reached values always higher than in M4 both in WW and in WS conditions, WS significantly affected the balance between resveratrol in its free and glycosylated form, particularly in M4 (Fig. 6b). This observations seems to sug-gest that upon WS, M4 stilbene metabolism is addressed pref-erentially towards the accumulation of resveratrol in its free form. Based on previous studies, trans-resveratrol appears to have a higher impact in scavenging the oxidative stress related to various stresses with respect to other compounds including its glycosides (Waffo-Teguo et al., 1998).
The observed co-expression between a number of VvWRKY transcription factors (VvWRKY24/28/29/37/41) and VvSTS genes in M4 (Fig. 4a, b) raises the question of a possible role for WRKYs in the regulation of VvSTS gene expression in Vitis species (Wang et al., 2014). This hypothesis is further supported by the presence of W-BOX cis-regulatory elements in the promoter region of VvSTS genes in M4 and 101.14 (Supplementary Fig. S3 at JXB online) and by the fact that the higher expression of VvSTS genes under WS in M4 cor-relates well with the significantly higher frequency of W-BOX elements in their promoter regions compared with 101.14 and PN40024 (Supplementary Fig. S2). A recent study by Gao et al. (2013) also demonstrated a strict association between the expression level of certain genes and the cis-regulatory number of domains within their promoter sequences.
In the aerial part of M4 WS plants, the up-regulation of genes involved in flavonoid biosynthesis, such as CHS2, CHS3, F3H, FLS1, and LDOX, was paralleled by an induc-tion of specific R2R3-MYB TFs (Fig. 5a, b). Although a relationship between R2R3-MYB TFs and flavonoid bio-synthetic genes is well documented (Czemmel et al., 2012; Ambawat et al., 2013), it was not possible to detect any dif-ference in MYB-related cis-element content within the pro-moter sequences of these genes in the two genotypes (data not shown).
Stilbenes and flavonoids have ROS-scavenging activity that protects against oxidative damage and controls ROS levels, which is mandatory for plant survival in the presence of abiotic stresses (Brunetti et al., 2013; Höll et al., 2013). Stilbenoids (resveratrol in particular) are powerful defence antioxidant molecules found in several species, and their accumulation is particularly high in grapevine (Jeandet et al., 2010, 2013; Vannozzi et al., 2012; Höll et al., 2013; Stuart and Robb, 2013). It has been suggested that flavonoids, whose biosynthetic genes are induced in M4 leaves under WS, act as antioxidants in plant response to oxidative stresses (Ramakrishna and Ravishankar, 2011; Brunetti et al., 2013). Flavonoids may also reduce the activity of ‘primary’ ROS
at Universita D
egli Studi Di Padova on June 3, 2015
http://jxb.oxfordjournals.org/D
ownloaded from

Page 12 of 14 | Corso et al.
scavenger enzymes (i.e. superoxide dismutase and catalase) in the chloroplast (Mullineaux and Karpinski, 2002; Brunetti et al., 2013). In addition, flavonoids are capable of quenching H2O2 and other free radicals, thus protecting the chloroplast membrane from oxidative damage by stabilizing membranes containing non-bilayer lipids (Agati et al., 2012).
The present data suggest that in addition to the activation of ‘primary mechanisms’ of ROS scavenging, the drought-tolerant M4 rootstock genotype may also induce ‘secondary mechanisms’ leading to the biosynthesis of other types of sec-ondary compounds in roots and leaves.
In conclusion, this study provides a comprehensive descrip-tion of the transcriptomic responses to drought in roots and leaves of two grapevine genotypes with different tolerances to WS. In contrast to previous studies (Cramer et al., 2007; Tattersall et al., 2007; Tillett et al., 2011), responses to WS that are common to susceptible and tolerant plants were not considered, but rather the focus was on genes whose expres-sion is strictly related to the tolerant genotype. On this basis, it is proposed that the drought tolerance displayed by the M4 genotype could be associated with an enhanced capacity to scavenge ROS produced under stress conditions and that this may be mainly conferred by structural variations in the pro-moter of genes involved in stilbene biosynthesis (Fig. 7). In water-stressed M4 plants, the higher ROS detoxification abil-ity could allow lateral root growth to be maintained, resulting in higher water uptake capacity from the soil, as previously observed by Tsukagoshi (2012). Likewise, at the leaf level, a higher E in the drought-tolerant genotype would promote active plant growth and photosynthesis. In contrast, in 101.14, where the oxidative stress is not efficiently counteracted, the functionality of roots and leaves is strongly impaired (Fig. 7).
The candidate genes identified in this study to be putative factors underlying the better adaptation of the M4 genotype to WS will be further validated using an association genetics approach. The expression of selected candidate genes will be evaluated on a large range of genotypes exhibiting differen-tial responses to WS in order to assess whether the drought tolerance strategies operating in M4 are conserved in other genotypes and, if so, to use the identified genes as functional markers (Poczai et al., 2013) for the selection of WS-tolerant grapevine rootstocks.
Supplementary data
Supplementary data are available at JXB online.Figure S1. Schematic representation of the
experimental plan.Figure S2. W-BOX cis-elements in six VvSTS promoters.Figure S3. Heat maps showing ABA-related genes in roots
and leaves of M4 and 101.14 genotypes.Table S1. Summary of mRNA-Seq read number.Table S2. Summary of read number after pairing (F3+F5).Table S3. List of DEGs identified by multifactor analysis in
root and leaf tissues.Table S4. GO terms associated with DEGs identified by
multifactor analysis in roots.
Table S5. GO terms associated with DEGs identified by multifactor analysis in leaves.
Table S6. Pairwise comparisons of leaf and root tissues of both 101.14 and M4 rootstocks upon water stress
Supplementary Results S1. M4 and 101.14 genome resequencing.
Supplementary Methods S1. mRNA sample preparation and sequencing.
Supplementary Methods S2. ABA and stilbene quantification.
Supplementary Methods S3. Differential cluster analysis (DCA).
AcknowledgementsThis article is dedicated to the memory of our friend and colleague Angelo Ramina. We miss his constructive criticisms and suggestions. The authors would like to thank Dr Ian B. Dry for his indispensable help in the process of manuscript revision. This work was supported by the AGER ‘SERRES’ Project, [grant no. 2010–2105]. MC, AV, and FM performed the research. CB, AR, and ML designed the research. MC, AV, EM, FM, AP, AT, MDA, ASN, PB, and RS helped with specific physiological, metabolic, molecular, and bioinformatics analysies. MC, AV, NV, GV, and CB analysed the data. The manuscript was written by MC, AV, NV, GV, MB, ML, and CB, and approved by all other authors.
ReferencesAgati G, Azzarello E, Pollastri S, Tattini M. 2012. Flavonoids as antioxidants in plants: location and functional significance. Plant Science 196, 67–76.
Ambawat S, Sharma P, Yadav N, Yadav R. 2013. MYB transcription factor genes as regulators for plant responses: an overview. Physiology and Molecular Biology of Plants 19, 307–321.
Anders S, Huber W. 2010. Differential expression analysis for sequence count data. Genome Biology 11, R106.
Apel K, Hirt H. 2004. Reactive oxygen species: metabolism, oxidative stress, and signal transduction. Annual Review of Plant Biology 55, 373–399.
Blum A. 1996 Crop responses to drought and the interpretation of adaptation. Plant Growth Regulation 20, 135–148.
Brunetti C, Di Ferdinando M, Fini A, Pollastri S, Tattini M. 2013. Flavonoids as antioxidants and developmental regulators: relative significance in plants and humans. International Journal of Molecular Sciences 14, 3540–3555.
Campagna D, Albiero A, Bilardi A, Caniato E, Forcato C, Manavski S, Vitulo N, Valle G. 2009. PASS: a program to align short sequences. Bioinformatics 25, 967–968.
Chaves MM, Flexas J, Pinheiro C. 2009. Photosynthesis under drought and salt stress: regulation mechanisms from whole plant to cell. Annals of Botany 103, 551–560.
Chaves MM, Pereira JS, Maroco J, Rodrigues ML, Ricardo CPP, Osòrio ML, Carvalho I, Faria T, Pinheiro C. 2002. How plants cope with water stress in the field? Photosynthesis and growth. Annals of Botany 89, 907–916.
Chaves MM, Zarrouk O, Francisco R, Costa JM, Santos T, Regalado AP, Rodrigues ML, Lopes CM. 2010. Grapevine under deficit irrigation: hints from physiological and molecular data. Annals of Botany 105, 661–676.
Cohen D, Bogeat-Triboulot M-B, Tisserant E, et al. 2010. Comparative transcriptomics of drought responses in Populus: a meta-analysis of genome-wide expression profiling in mature leaves and root apices across two genotypes. BMC Genomics 11, 630.
Covarrubias J, Rombolà A. 2013. Physiological and biochemical responses of the iron chlorosis tolerant grapevine rootstock 140 Ruggeri to iron deficiency and bicarbonate. Plant and Soil 370, 305–315.
at Universita D
egli Studi Di Padova on June 3, 2015
http://jxb.oxfordjournals.org/D
ownloaded from

Drought tolerance in grapevine rootstock genotypes | Page 13 of 14
Cramer G, Ergül A, Grimplet J, Tillett R, et al. 2007. Water and salinity stress in grapevines: early and late changes in transcript and metabolite profiles. Functional and Integrative Genomics 7, 111–134.
Czemmel S, Heppel S, Bogs J. 2012. R2R3 MYB transcription factors: key regulators of the flavonoid biosynthetic pathway in grapevine. Protoplasma 249, 109–118.
De Domenico S, Bonsegna S, Horres R, et al. 2012. Transcriptomic analysis of oxylipin biosynthesis genes and chemical profiling reveal an early induction of jasmonates in chickpea roots under drought stress. Plant Physiology and Biochemistry 61, 115–122.
De Souza CR, Maroco JP, Santos TP, M. Rodrigues ML, Lopes CM, Pereira JS, Chaves MM. 2003. Partial rootzone drying: regulation of stomatal aperture and carbon assimilation in field-grown grapevines. Vitis vinifera cv. Moscatel. Functional Plant Biology 30, 653–662.
Desikan R, Hancock JT, Bright J, Harrison J, Weir I, Hooley R, Neill SJ. 2005. A role for ETR1 in hydrogen peroxide signaling in stomatal guard cells. Plant Physiology 137, 831–834.
Dodd IC. 2005. Root-to-shoot signalling: assessing the roles of ‘up’ in the up and down world of long-distance signalling in planta. Plant and Soil 274, 251–270.
Fisarakis I, Chartzoulakis K, Stavrakas D. 2001. Response of Sultana vines, V. vinifera L., on six rootstocks to NaCl salinity exposure and recovery. Agricultural Water Management 51, 13–27.
Flexas J, Barón M, Bota J, et al., 2009. Photosynthesis limitations during water stress acclimation and recovery in the drought-adapted Vitis hybrid Richter-110. V. berlandieri×V. rupestris. Journal of Experimental Botany 60, 2361–2377.
Frensch J. 1997. Primary responses of root and leaf elongation to water deficits in the atmosphere and soil solution. Journal of Experimental Botany 48, 985–999.
Fujita Y, Fujita M, Shinozaki K, Yamaguchi-Shinozaki K. 2011. ABA-mediated transcriptional regulation in response to osmotic stress in plants. Journal of Plant Research 124, 509–525.
Gao Z, Zhao R, Ruan J. 2013. A genome-wide cis-regulatory element discovery method based on promoter sequences and gene co-expression networks. BMC Genomics 14, S4.
Götz S, García-Gómez JM, Terol J, Williams TD, Nagaraj SH, Nueda MJ, Robles M, Talón M, Dopazo J, Conesa A. 2008. High-throughput functional annotation and data mining with the Blast2GO suite. Nucleic Acids Research 36, 3420–3435.
Gregory PJ, Atkinson CJ, Bengough AG, Else MA, Fernández–Fernández F, Harrison RJ, Schmidt S. 2013. Contributions of roots and rootstocks to sustainable, intensified crop production. Journal of Experimental Botany 64, 1209–1222.
Höll J, Vannozzi A, Czemmel S, D’Onofrio C, Walker AR, Rausch T, Lucchin M, Boss PK, Dry IB, Bogs J. 2013. The R2R3-MYB transcription factors MYB14 and MYB15 regulate stilbene biosynthesis in Vitis vinifera. The Plant Cell 25, 4135–4149.
Ihmels J, Bergmann S, Berman J, Barkai N. 2005. Comparative gene expression analysis by differential clustering approach: application to the Candida albicans transcription program. PLoS Genetics 1, e39.
Ismail A, Riemann M, Nick P. 2012. The jasmonate pathway mediates salt tolerance in grapevines. Journal of Experimental Botany 63, 2127–2139.
Jaillon O, Aury JM, Noel B, et al. 2007. The grapevine genome sequence suggests ancestral hexaploidization in major angiosperm phyla. Nature 449, 463–467.
Jeandet P, Delaunois B, Conreux A, Donnez D, Nuzzo V, Cordelier S, Clément C Courot E. 2010. Biosynthesis, metabolism, molecular engineering and biological functions of stilbene phytoalexins in plants. BioFactors 36, 331–341
Jeandet P, Clément C, Courot E, Cordelier S. 2013. Modulation of phytoalexin biosynthesis in engineered plants for disease resistance. International Journal of Molecular Sciences 14, 14136–14170
Joo JH, Bae YS, Lee JS. 2001. Role of auxin-induced reactive oxygen species in root gravitropism. Plant Physiology 126, 1055–1060.
Kar RK. 2011. Plant responses to water stress: role of reactive oxygen species. Plant Signaling and Behavior 6, 1741–1745.
Kim EH, Kim YS, Park SH, Koo YJ, Choi YD, Chung YY, Lee IJ, Kim JK. 2009. Methyl jasmonate reduces grain yield by mediating
stress signals to alter spikelet development in rice. Plant Physiology 149, 1751–1760.
Kohli A, Sreenivasulu N, Lakshmanan P, Kumar P. 2013. The phytohormone crosstalk paradigm takes center stage in understanding how plants respond to abiotic stresses. Plant Cell Reports 32, 945–957.
Kühn C, Grof CPL. 2010. Sucrose transporters of higher plants. Current Opinion in Plant Biology 13, 287–297.
Lata C, Prasad M. 2011. Role of DREBs in regulation of abiotic stress responses in plants. Journal of Experimental Botany 62, 4731–4748.
Lelandais G, Tanty V, Geneix C, Etchebest C, Jacq C, Devaux F. 2008. Genome adaptation to chemical stress: clues from comparative transcriptomics in Saccharomyces cerevisiae and Candida glabrata. Genome Biology 9, R164.
Liu S, Lv Y, Wan XR, Li LM, Hu B, Li L. 2014. Cloning and expression analysis of cDNAs encoding ABA 8’-hydroxylase in peanut plants in response to osmotic stress. PLoS One 9, e97025.
Lovisolo C, Schubert A, Sorce C. 2002. Are xylem radial development and hydraulic conductivity in downwardly-growing grapevine shoots influenced by perturbed auxin metabolism? New Phytologist 156, 65–74.
Marguerit E, Brendel O, Lebon E, Van Leeuwen C, Ollat N. 2012. Rootstock control of scion transpiration and its acclimation to water deficit are controlled by different genes. New Phytologist 194, 416–429.
Maza E, Frasse P, Senin P, Bouzayen M, Zouine M. 2013. Comparison of normalization methods for differential gene expression analysis in RNA-Seq experiments: a matter of relative size of studied transcriptomes. Communicative and Integrative Biology 6, e25849.
McCarthy DJ, Chen Y, Smyth GK. 2012. Differential expression analysis of multifactor RNA-Seq experiments with respect to biological variation. Nucleic Acids Research 40, 4288–4297.
Meggio F, Prinsi B, Negri, AS, Di Lorenzo GS, Lucchini G, Pitacco P, Failla O, Scienza A, Cocucci C, Espen L. 2014. Biochemical and physiological responses of two grapevine rootstock genotypes to drought and salt treatments. Australian Journal of Grape and Wine Research 20, 310–323.
Meinhard M, Rodriguez P, Grill E. 2002. The sensitivity of ABI2 to hydrogen peroxide links the abscisic acid-response regulator to redox signalling. Planta 214, 775–782.
Mullineaux P, Karpinski S. 2002. Signal transduction in response to excess light: getting out of the chloroplast. Current Opinion in Plant Biology 5, 43–48.
Myles S, Chia JM, Hurwitz B, Simon C, Zhong GY, Buckler E, Ware D. 2010. Rapid genomic characterization of the genus Vitis. PLoS One 5, 1–9.
Peleg Z, Blumwald E. 2011. Hormone balance and abiotic stress tolerance in crop plants. Current Opinion in Plant Biology 14, 290–295.
Poczai P, Varga I, Laos M, Cseh A, Bell N, Valkonen J, Hyvonen J. 2013. Advances in plant gene-targeted and functional markers: a review. Plant Methods 9, 6.
Qin F, Shinozaki K, Yamaguchi-Shinozaki K. 2011. Achievements and challenges in understanding plant abiotic stress responses and tolerance. Plant and Cell Physiology 52, 1569–1582.
Ramakrishna A, Ravishankar GA. 2011. Influence of abiotic stress signals on secondary metabolites in plants. Plant Signaling and Behavior 6, 1720–1731.
Santner A, Estelle M. 2009. Recent advances and emerging trends in plant hormone signalling. Nature 459, 1071–1078.
Speirs J, Binney A, Collins M, Edwards E, Loveys B. 2013. Expression of ABA synthesis and metabolism genes under different irrigation strategies and atmospheric VPDs is associated with stomatal conductance in grapevine (Vitis vinifera L. cv Cabernet Sauvignon). Journal of Experimental Botany 64, 1907–1916.
Stuart J, Robb E. 2013. Resveratrol and its derivatives as phytoalexins. In: Bioactive polyphenols from wine grapes . New York: Springer, 1–8.
Tattersall ER, Grimplet J, Deluc L, et al. 2007. Transcript abundance profiles reveal larger and more complex responses of grapevine to chilling compared to osmotic and salinity stress. Functional and Integrative Genomics 7, 317–333.
Tillett R, Ergul A, Albion R, Schlauch K, Cramer G, Cushman J. 2011. Identification of tissue-specific, abiotic stress-responsive gene
at Universita D
egli Studi Di Padova on June 3, 2015
http://jxb.oxfordjournals.org/D
ownloaded from

Page 14 of 14 | Corso et al.
expression patterns in wine grape. Vitis vinifera L.. based on curation and mining of large-scale EST data sets. BMC Plant Biology 11, 86.
Tsukagoshi H. 2012. Defective root growth triggered by oxidative stress is controlled through the expression of cell cycle-related genes. Plant Science 197, 30–39.
Vannozzi A, Dry I, Fasoli M, Zenoni S, Lucchin M. 2012. Genome-wide analysis of the grapevine stilbene synthase multigenic family: genomic organization and expression profiles upon biotic and abiotic stresses. BMC Plant Biology 12, 130.
Waffo Teguo P, Fauconneau B, Deffieux G, Huguet F, Vercauteren J, Merillon JM. 1998. Isolation, identification, and antioxidant activity of three stilbene glucosides newly extracted from Vitis vinifera cell cultures. Journal of Natural Products 6, 655–657.
Walker RR, Blackmore DH, Clingeleffer PR, Correll RL. 2002. Rootstock effects on salt tolerance of irrigated field-grown grapevines. Vitis vinifera L. cv. Sultana: 1. Yield and vigour inter-relationships. Australian Journal of Grape and Wine Research 8, 3–14.
Wang M, Vannozzi A, Wang G, Liang YH, Tornielli GB, Zenoni S, Cavallini E, Pezzotti M, Zong–Ming. C. 2014. Genome and transcriptome analysis of the grapevine. Vitis vinifera L. WRKY gene family. Horticulture Research 1, 16.
Zerbino DR, Birney E. 2008. Velvet: algorithms for de novo short read assembly using de Bruijn graphs. Genome Research 18, 821–829.
Zhang FJ, Jin YJ, Xu XY, Lu RC, Chen HJ. 2008. Study on the extraction, purification and quantification of jasmonic acid, abscisic acid and indole-3-acetic acid in plants. Phytochemical Analysis 19, 6 560–567.
at Universita D
egli Studi Di Padova on June 3, 2015
http://jxb.oxfordjournals.org/D
ownloaded from


