Embed Size (px)
Citation preview
ORIGINAL RESEARCHpublished: 21 October 2021
doi: 10.3389/fpls.2021.727667
Frontiers in Plant Science | www.frontiersin.org 1 October 2021 | Volume 12 | Article 727667
Edited by:
Kevin Davies,
The New Zealand Institute for Plant
and Food Research Ltd., New Zealand
Reviewed by:
Alexander Vainstein,
Hebrew University of Jerusalem, Israel
Xiaohua Li,
Wuhan Polytechnic University, China
Jan de Vries,
University of Göttingen, Germany
*Correspondence:
Francesco Paolocci
†These authors have contributed
equally to this work and share first
authorship
‡These authors have contributed
equally to this work and share last
authorship
Specialty section:
This article was submitted to
Plant Metabolism and Chemodiversity,
a section of the journal
Frontiers in Plant Science
Received: 19 June 2021
Accepted: 16 September 2021
Published: 21 October 2021
Citation:
Costarelli A, Cannavò S, Cerri M,
Pellegrino RM, Reale L, Paolocci F
and Pasqualini S (2021) Light and
Temperature Shape the
Phenylpropanoid Profile of Azolla
filiculoides Fronds.
Front. Plant Sci. 12:727667.
doi: 10.3389/fpls.2021.727667
Light and Temperature Shape thePhenylpropanoid Profile of Azollafiliculoides FrondsAlma Costarelli 1†, Sara Cannavò 1†, Martina Cerri 2, Roberto Maria Pellegrino 1,
Lara Reale 2, Francesco Paolocci 3*‡ and Stefania Pasqualini 1‡
1Department of Chemistry, Biology and Biotechnology, University of Perugia, Perugia, Italy, 2Department of Agricultural,
Food and Environmental Sciences, University of Perugia, Perugia, Italy, 3 Institute of Bioscience and Bioresources (IBBR),
National Research Council (CNR), Perugia, Italy
Azolla is a genus of floating freshwater ferns. By their high growth and N2 fixation
rates, Azolla species have been exploited for centuries by populations of South-east
Asia as biofertilizers in rice paddies. The use of Azolla species as a sustainable plant
material for diverse applications, such as feeding, biofuel production, and bioremediation,
has encountered a growing interest over the last few years. However, high levels
of feed deterrent flavonoids in their fronds have discouraged the use of these ferns
as a sustainable protein source for animal consumption. Additionally, information
on how and to what extent environmental determinants affect the accumulation
of secondary metabolites in these organisms remains poorly understood. Moving
from these considerations, here, we investigated by an untargeted metabolomics
approach the profiles of phenylpropanoid compounds in the fronds of Azolla filiculoides
sampled under control and pigment-inducing stress conditions. In parallel, we assayed
the expression of essential structural genes of the phenylpropanoid pathway by
quantitative RT-PCR. This study provides novel information concerning A. filiculoides
phenylpropanoid compounds and their temporal profiling in response to environmental
stimuli. In particular, we show that besides the already known 3-deoxyanthocyanidins,
anthocyanidins, and proanthocyanidins, this fern can accumulate additional secondary
metabolites of outstanding importance, such as chemoattractants, defense compounds,
and reactive oxygen species (ROS) scavengers, and crucial as dietary components
for humans, such as dihydrochalcones, stilbenes, isoflavones, and phlobaphenes. The
findings of this study open an opportunity for future research studies to unveil the
interplay between genetic and environmental determinants underlying the elicitation of
the secondary metabolites in ferns and exploit these organisms as sustainable sources
of beneficial metabolites for human health.
Keywords: Azolla filiculoides, cold stress, gene expression, liquid chromatography coupled with high resolution
mass spectrometry (LC/HRMS), metabolic profile, polyphenols
INTRODUCTION
Azolla is a genus of floating freshwater ferns that encompasses seven species, distributed fromtropical to temperate zones in the world (Wagner, 1997). Thanks to the symbiosis with Trichormusazollae, a nitrogen-fixing species of bacteria and, likely, several other helpful microorganismscolonizing their leaf cavities, these species can double their biomass in a short period of time. The
Costarelli et al. Secondary Metabolites in Azolla filiculoides
Azolla/Trichormus azollae symbiosis likely arose 90 million yearsago (Metzgar et al., 2007), before legume/rhizobia symbioses that,in contrast, evolved about 64 million years ago (Herendeen et al.,1999). However, when compared with other plant prokaryoticsymbioses, the Azolla/Trichormus azollae symbiosis is not onlythe one to persist throughout the reproductive cycle of a hostplant, being the bacterium transmitted vertically during the lifecycle of ferns, but also among the most efficient ones in terms ofN2 fixation ability (Ran et al., 2010). By their high growth andN2 fixation rates, Azolla spp. has been exploited for centuriesby populations of Southeast Asia as biofertilizers in rice paddies(Lumpkin and Plucknett, 1980). Recent research has highlightedtheir potential to source proteins for animal nutrition (Brouweret al., 2018). In this context, outstanding features, such as aminoacid profiles of their proteins, close to that of soybean, the cropthat most largely contributes to feeding livestock, coupled to low-to-null input-demanding farming systems, have sparked interestin these species (Brouwer et al., 2017).
Notwithstanding, the digestibility and bioassimilability of fernforage can be seriously compromised by the qualitative andquantitative profiles of secondary metabolites accumulated bythese species because of changing environmental conditions.Although 3-deoxyanthocyanins have been long regarded as thesole flavonoids made by Azolla spp. (Ishikura, 1982; Cohen et al.,2002a,b), new evidence suggests that proanthocyanidins (PAs)are the flavonoids that most likely prominently affect Azolla spp.palatability (Brouwer et al., 2018). The presence, composition,and extent of polymerization are well-documented features thatcontrol the ability of PAs to bind forage proteins and, hence,dictate forage palatability and the extent to which plant proteinsare converted into animal proteins by livestock (Mueller-Harveyet al., 2019).
Flavonoids are derived from the phenylpropanoid pathwayand are among the most abundant groups of secondaryplant metabolites. These metabolites exert several beneficialproperties in plants spanning from communication withhelpful (micro)organisms down to defense against bioticand abiotic stress (Dixon and Paiva, 1995; Hernández et al.,2009; Petrussa et al., 2013; Davies et al., 2018). Albeit witha few exceptions, major classes of flavonoid biosynthesishave been well-characterized in major crops and plantmodel spp. The process starts from phenylalanine viareactions catalyzed by phenylalanine ammonia-lyase (PAL),cinnamate 4-hydroxylase (C4H), 4-coumarate: CoA ligase(4CL), chalcone synthase (CHS), and chalcone isomerase(CHI) to produce flavanones. In turn, flavanones are substratesfor the biosynthesis of various classes of flavonoids, namely,flavones, flavonols, isoflavanols, anthocyanins, flavan-4-ols,3-deoxyanthocyaininds, phlobaphenes, flavan-3-ols, andPAs. From flavanones, the pathways of blue-red pigmentanthocyanins and those of colorless flavan-3-ols diverge frombrick-red pigment 3-deoxyanthocyanins (Hipskin et al., 1996).For the biosynthesis of the first two classes of pigments,flavanones are catalyzed by flavanone-3-hydroxylase (F3H) todihydroflavonols, which are then converted to anthocyaninsand/or proanthocyanidins by a series of enzymatic activities,the first of which is catalyzed by dihydroflavonol 4-reductase
(DFR). Conversely, 3-deoxyanthocyanins likely derive fromthe direct reduction of flavanones by DFR or the DFR-likeenzyme flavanone 4-reductase (FNR) to give the criticalintermediate flavan-4-ols, apiforol and luteoforol (Whartonand Nicholson, 2000; Chopra et al., 2002), which are thendehydrogenated/dehydroxylated by the action of an ANS-likeenzyme (Liu et al., 2010). The biosynthesis of phlobaphenes,polymers of flavan-4-ols that accumulate in several plantspecies, such as maize and sorghum, remains uncharacterizedas well.
If the high accumulation of flavonoids represents thedetrimental issue that prevents the use of Azolla species asa sustainable source of proteins for animal consumption, itmight represent an opportunity to be pursued to isolate andexploit beneficial metabolites for human diets from theseorganisms. To the best of our knowledge, this avenue remainsto be followed. Several studies have addressed the metabolicchanges triggered by stresses in these species (Dai et al.,2012; Brouwer et al., 2017; Nham Tran et al., 2020; Güngöret al., 2021). However, information on how and to whatextent environmental determinants affect the accumulation ofsecondary metabolites in ferns remain scanty and fragmented.To this end, here, we embarked on a study addressed to shedmore light on the role of temperature and light in shaping theoverall accumulation of phenylpropanoids, and flavonoids inparticular, in Azolla filiculoides. To reach this goal, we initiallyperformed a targeted expression profile analysis by qRT-PCR ofthe phenylpropanoid pathway’s candidate key structural genes.Simultaneously, we performed an untargeted high-throughputmetabolomics analysis through LC/HRMS on reddish Azollaharvested inWinter at the Botanical garden of Perugia Universityand upon its acclimatization in a climatic chamber. Under thelatter condition, Azolla displayed a green color. This approachgave us an overview of the secondary metabolites accumulatedby this organism under two different environmental conditions.Then, metabolic and molecular changes were monitored in thesame specimen over 20 days of treatment under moderate lightintensity- and cold-controlled conditions.
This study provides novel information concerning A.filiculoides phenylpropanoid compounds and their temporalprofiling in response to environmental stimuli. The plasticityand vast array of secondary metabolites detected here, coupledto its amenability to grow under limiting conditions, and theavailability of its complete genome (Li et al., 2018), make A.filiculoides a potentially innovative source of useful secondarymetabolites and model among ferns to unearth their regulation.
MATERIALS AND METHODS
Plant Materials and Growing ConditionsPlant MaterialsThe specimens of Azolla employed in this study werecollected in February 2020 from a small pond of thebotanical garden of the University of Perugia–Italy [latitude43◦05
′
52′′
N, longitude 12◦23′
49′′
E (maximum, minimum, andmean monthly temperatures of this location are given inSupplementary Figure S1) and day length of about 10.5 h].
Frontiers in Plant Science | www.frontiersin.org 2 October 2021 | Volume 12 | Article 727667
Costarelli et al. Secondary Metabolites in Azolla filiculoides
Sampling was performed in six replicates from different sites ofthe pond by collecting ferns from about 10 cm2 of pond areaper replicate. All the samples (BG samples thereafter) showeda reddish phenotype. At sampling, part of the fresh materialwas moved to a controlled growing condition as reportedbelow, part was used for microscopic examination and partwas frozen in liquid nitrogen and then stored at −80◦C forsubsequent biochemical and molecular analyses. The samplingof material was always performed between 9:30 and 10:30 a.m.(i.e., 1.5–2.5 h into the 10-h light photoperiod for samplesgrown under controlled conditions) to minimize bias due to dieltranscriptomic changes.
Seasonal Temperature and Light Intensity at
Sampling SiteThe data of seasonal temperature changes in Perugia duringthe period October 2019–February were provided by theHydrographic Service of the Regione Umbria (https://www.regione.umbria.it/ambiente/servizio-idrografico). The monthlymeans of global solar radiation during the same period wereprovided by the ARPA Umbria (http://www.arpa.umbria.it).
Growing Conditions of Azolla Specimen in Climatic
ChamberThe BG samples were moved to a climatic chamber witha 10-h photoperiod, 25/20◦C day/night temperature, and aphotosynthetic photon flux density (PPFD) of 220 µmoles m−2
s−1 provided by fluorescent tubes, and grown in 50-cm (length)× 33-cm (width) × 11-cm (depth) tanks filled with a 6-Lnitrogen-free nutrient medium (Watanabe et al., 1992). Thesamples grown in the climatic chamber under the conditionsabove from now on will be referred to as CC. The nutrientmedium was changed every week, senescent plant material wasremoved manually, and fresh cultures made up of young plantswere established every 2–4 weeks for each of the six samplesoriginally collected from the pond. After further 9 months ofcultivation as described above, Azolla specimens were employedto test for environmental conditions that might trigger thereddish color of the fronds. To this end, three tanks, set up asabove, were filled withAzolla plants, each with young plants froma different batch, and the temperature and PPFD were changedto 5◦C and 700, respectively. The sampling of plants was carriedout at the onset of the experiment (T0) and after 24 (T1d), 48(T2d), and 72h (T3d), and 20 days (T20d) of cold treatment. Theentire experimental set was repeated twice. The ferns sampled atdifferent time points under stress-induced conditions, as well asthe CC samples, were washed, their roots were removed, and thefronds were frozen in liquid N2 and stored at −80◦C for furtherbiochemical and molecular analyses.
Morphological and Molecular Analyses ofAzolla SpecimenLight Microscopy and PA StainingThe Azolla fronds were fixed in 3% (w/v) glutaraldehydein 0.075-M phosphate buffer, pH 7.2, for 24 h. Each of thesamples were then washed three times for 7min in the 0.075-Mphosphate buffer, pH 7.2, and post-fixed in 1% (w/v) OsO4
for 1.5 h. The samples were then dehydrated in increasingethanol concentrations and embedded in resin (Epon, 2-dodecenylsuccinic anhydride, and methylnadic anhydridemixture). Semi-thin sections (1–2µm) were cut with anultramicrotome (OmU2; Reichert, Heidelberg, Germany)equipped with a glass blade, stained with toluidine blue, andobserved using a light microscope (BX53; Olympus, Tokyo,Japan) (Reale et al., 2017). Red Azolla fronds taken fromthe botanical garden were free-hand sectioned using a razorblade. They were then mounted on slide glasses with a dropof distilled water and examined in a bright field using thelight microscope. The staining of flavan-3-ols and PAs with 4-dimethylaminocinnamaldehyde (DMACA) (Merck Life Science,Milan, Italy) was basically performed as reported in Abeynayakeet al. (2011).
DNA Isolation, Amplification, and Sequencing of PCR
ProductsDeoxribonucleic acid was isolated from the Azolla frondsaccording to Doyle and Doyle (1987). Internal transcribedspacer (ITS) sequences of nuclear ribosomal DNA (nrDNA)of Azolla spp. were downloaded from Genbank and Fernbase(https://www.fernbase.org). The latter database reports thewhole genome of Azolla filiculoides. Sequence alignmentwas carried out using BioEdit (version 7.2.5) and, bytaking into account most conserved ITS regions, a forwardprimer on the 3
′
end of the small rDNA subunit (5′
-cctgcggaaggatcattgacacac); forward (5
′
-gaattccgcgaatcatcgagt)and reverse (5
′
-cgttcttcatcgttgcaagagcc) primers on the 5.8Sgene and a reverse (5
′
-tctcgcctgatctgaggtccgtt) primer onthe 5
′
end of the large rDNA subunit of Azolla spp. weredesigned using OligoExpress (version 2.0) (Applied Biosystems,Waltham, MA, USA). These primers were employed in differentcombinations to amplify Azolla DNA using the polymerasePhusion High-Fidelity DNA (Thermo Fisher Scientific, Milan,Italy) in a 9700 GeneAmp (Applied Biosystems, Waltham, MA,USA) apparatus. PCR products were visualized on 1% agarosegels stained with ethidium bromide, purified, and double-strand sequenced using gene-specific primers and the Big DyeTerminator Cycle Sequencing Kit according to the instructionsof the supplier. The sequencing reactions were run on an ABIPrism 310 Sequence Analyzer (Applied Biosystems, WalthamMA, USA).
Isolation and Quantification of PhenolicCompounds in Azolla filiculoides FrondsSpectrophotometric AnalysisAnthocyanidins and deoxyanthocyanidins were extracted asdescribed by Dong et al. (2001), with slight modifications.One hundred mg of Azolla fronds were extracted with liquidnitrogen in 1.5ml of 1% (v/v) HCl in methanol and left at4◦C for overnight agitation. The extract was then centrifuged at13,000 rpm at 4◦C for 10min, and 1ml of distilled water wasadded to the supernatant. Chlorophyll was separated by backextraction with 1.5ml of chloroform. The anthocyanidins werequantified using A530 for cyanidin 3-glucoside (ε = 26,900 L
Frontiers in Plant Science | www.frontiersin.org 3 October 2021 | Volume 12 | Article 727667
Costarelli et al. Secondary Metabolites in Azolla filiculoides
m−1mol−1). For deoxyantocyanidin quantification, the extractobtained as above was read at 479 nm for apigeninidin (ε =
38,000 L m−1mol−1) and 496 nm for luteolinidin-5-O-glucoside,as reported in Cohen et al. (2002a).
Spectrophotometric determination of phenolic acids andflavonols was carried out following Cassani et al. (2017), withslight modifications. Fifteen mg of Azolla fronds was first boiledwith 200 µl of distilled water for 30min and then left at 4◦Cfor overnight agitation with 1.5ml of an extraction solution (1%HCl, 95% ethanol). The extract was then centrifuged at 13,000rpm at 4◦C for 10min, and the supernatant was read at 350 nmfor flavonols and at 280 nm for phenolic acids. The amountof flavonols was calculated as quercetin 3-glucoside equivalents(ε = 21,877 L m−1mol−1, MW 464.82) and the amount ofphenolics was calculated as ferulic acid equivalents (ε = 14,700 Lm−1mol−1MW 194.18).
Phlobaphenes were extracted from 100mg of Azolla frondswith 200 µl of concentrated HCl and 800 µl of dimethylsulfoxide (DMSO) added sequentially with vigorous vortexingafter each addition. Extracts were then centrifuged at 14,000 rpmat 4◦C for 45min, and cleared supernatants were diluted withmethanol (20% final concentration). Phlobaphene concentrationwas expressed as absorbance value at their λmax (510 nm) per 1 gof fresh weight, as Landoni et al. (2020) reported.
For the quantification of both soluble and insoluble Pas,100mg of Azolla fronds were extracted and quantified, asreported in Li et al. (1996).
Liquid Chromatography Coupled With
High-Resolution Mass Spectrometry
(LC/HRMSLC/HRMS) AnalysisThe total phenolic compounds were extracted as reported byJiang et al. (2013), with minor modifications. A 100mg samplewas ground in liquid nitrogen and extracted with a 1mlextraction solution (80% methanol:1% HCl) using mortar andpestle. After centrifugation at 4,000 g for 15min, the residueswere re-extracted twice as described above, and the supernatantswere filtered through a 0.22µmmembrane.
The extracts were analyzed by liquid Chromatographycoupled with high resolution mass spectrometry (LC/HRMS). Inthis regard, the instrumental conditions for analyzing phenoliccompounds were optimized previously (Qian et al., 2020). Briefly,a UHPLC analysis was performed using an Agilent 1260 UHPLC(Agilent Technology, Santa Clara, CA, USA) system equippedwith an autosampler with a thermostated column compartmentand a quaternary pump.
A chromatographic separation was performed on anInfinityLab Poposhell 120 EC-C8 column (2.1mm × 100mm,1.9µm; Agilent Technology, Santa Clara, CA, USA). The mobilephase consisted of water (A) and acetonitrile (B), with bothcontaining 0.1% of acetic acid, and was delivered at a flow rate of0.30 ml/min under the following gradient procedure: 0–7min,5–40% B; 7–8min, 40–98% B; Column temperature was 50◦C,and injection volume was 3 µl. All the samples were kept at 20◦Cduring the analysis.
An MS detection was performed on an Agilent 6530 (AgilentTechnology, Santa Clara, CA, USA) accurate mass quadrupole
time of flight (QTOF) system equippedwith anAgilent Jet Stream(Agilent Technology, Santa Clara, CA, USA) source. The sourceoperated in both polarities as follows: ion spray voltage, 3,500V;gas temp and sheath gas temp were set at 250 and 300 ◦C,respectively; nebulizer (N2) 35 psi; sheath gas flow 12 L/min.Data-dependent acquisition was used in the mass range of 50–17,00 m/z both for MS and MS/MS analyses. Raw data wereprocessed with MS-DIAL (Tsugawa et al., 2015) to perform peakdetection, integration, alignment, and metabolite annotation.The annotation was based on a comparison of spectrometricdata with those from the NIST2020 tandem mass library. Validscores >0% and mass differences <15 ppm were considered.Then, the annotation list provided by the library was curatedmanually to select, among the proposed isobaric metabolites, themost likely ones according to our experience and literature. Thetwo sets of data obtained, one for each polarity, were mergedinto a single table for subsequent statistical and chemometricanalyses. Among the metabolites present in both polarities,those with a larger mean area were selected for the analysis.The annotation data of the selected metabolites are given inSupplementary Table S1.
Gene Expression AnalysisRNA Isolation and cDNA SynthesisRibonucleic acid was isolated from 50mg of Azolla fronds withthe Spectrum Plant Total RNA Kit (Sigma–Aldrich, Milan, Italy)applying protocol B, and then treated with DNase (Sigma–Aldrich, Milan, Italy) according to the instructions of thesupplier. The null PCR amplification in the presence of Azolla-specific ITS primers reported above verified the absence of anyDNA contaminating the RNA preparations. According to theinstructions of the supplier, 3 µg of RNA was reverse-transcribedin the presence of Maxima H Minus Reverse Transcriptase(Thermo Fisher Scientific, Milan, Italy) and 100 pmol of randomhexamers (Euroclone, Milan, Italy).
Identification of Candidate Genes of
Phenylpropanoid Pathway and Quantitative RT-PCRKey structural genes of the phenylpropanoid pathway in A.filiculoides were searched in the Azolla filiculoides proteinv1.1. database using the sequences of experimentally validatedenzymes from model and crop plant species as a query in BLASTP. Once retrieved, the sequences of candidate genes were alignedto those of reference enzymes and phylogenetic trees built withMEGA -X using default parameters. At the same time, a studywas in progress (Güngör et al., 2021), and Piatkowski et al. (2020)produced a list of candidate A. filoculoides phenylpropanoidgenes; thus, the genes identified here were named according tothe two previous studies. Gene-specific and/or family-specificprimer pairs were then designed for qRT-PCR analyses with thehelp of OligoExpress Software (Applied Biosystems, Whaltham,MA, USA). The genes considered in this study and their relativeprimer pairs are given in Supplementary Table S2. An aliquot,which was made using the BlasTaq 2X qPCR Mater Mix (ABM,Richmond, Canada), of 3µl of 1:10 diluted cDNAwas used in thePCR and run into an ABI PRISM 7300 SDS apparatus (AppliedBiosystems, Waltham, MA, USA) using the following cycling
Frontiers in Plant Science | www.frontiersin.org 4 October 2021 | Volume 12 | Article 727667
Costarelli et al. Secondary Metabolites in Azolla filiculoides
parameters: an initial step at 95◦C for 3min, then 40 cycles eachincluding a step at 95◦C for 15 s and a step at 60◦C for 1min.A melting curve was added after each run. For each gene, fourtechnical replicates were amplified. The efficiency of PCR foreach primer pair was tested as reported in Escaray et al. (2017)before the (2−1Ct) gene expression quantification method wasapplied based on the differences between the relative expressionof the target genes and the reference EF-1a gene to comparethe relative expression profiles among genes and treatments asreported in Bizzarri et al. (2020). Four biological replicates foreach treatment were analyzed; the significance of the expressionvalues was analyzed by a two-way ANOVA (p < 0.05) procedureembedded in the R statistical package.
Statistical AnalysisThe different experiments were repeated twice with threereplicates each. Statistical analyses were carried out inMetaboAnalyst 5.0 (Pang et al., 2021) and/or R Studio (version3.5.3). To determine significant differences between thetreatments, the data were subjected to an unpaired two-sampleStudent’s t-test (P < 0.05, FDR = 0.05) or ANOVA (P < 0.001,FDR= 0.001) followed by post-hoc comparison [Tukey’s honestlysignificant difference (HSD), P < 0.05].
Multivariate statistics allowed for the computation of heatmaps and PCAs after data normalization by median and Pareto-scaling (mean-centered and divided by the square root of thestandard deviation of each variable).
RESULTS
Features and Identification of AzollaSpecimen Grown in the Botanic Garden ofPerugia UniversityThe BG samples collected in February 2020 showed a bright redcolor (Supplementary Figure S2A). Light microphotographs ofhand-made cross-sections revealed epidermal cells completelyfilled with red pigments (Supplementary Figure S2B). Inkeeping with the observation that leaf pigmentation is mainlyinfluenced by low temperatures (Hughes et al., 2005), theminimum temperatures recorded at the collection site duringthe period October 2019–February 2020 ranged from 4 to13◦C (Supplementary Figure S1A). At the time of collection,the global solar radiation in the area was around 600 PPFD(Supplementary Figure S1B). The observation that areas ofthe pond shaded by the vegetation above the fronds weregreen or greenish (Supplementary Figure S3) prompted us tospeculate that the red pigmentation of Azolla leaves requiresboth low temperatures and full sunlight. By this, <30 daysof acclimation to climatic chamber conditions (temperaturesof 25/20◦C day/night, 10-/14-h light/dark, 220 PPFD) weresufficient to make the color of the ferns return to bright green(Supplementary Figure S2C).
The morphology of leaf trichomes, features of glochidia, andperine structure of the megaspore are likely the most reliablemorphological traits to type among Azolla spp. (Perkins et al.,1985; Zimmerman et al., 1989). The trichomes on the surface
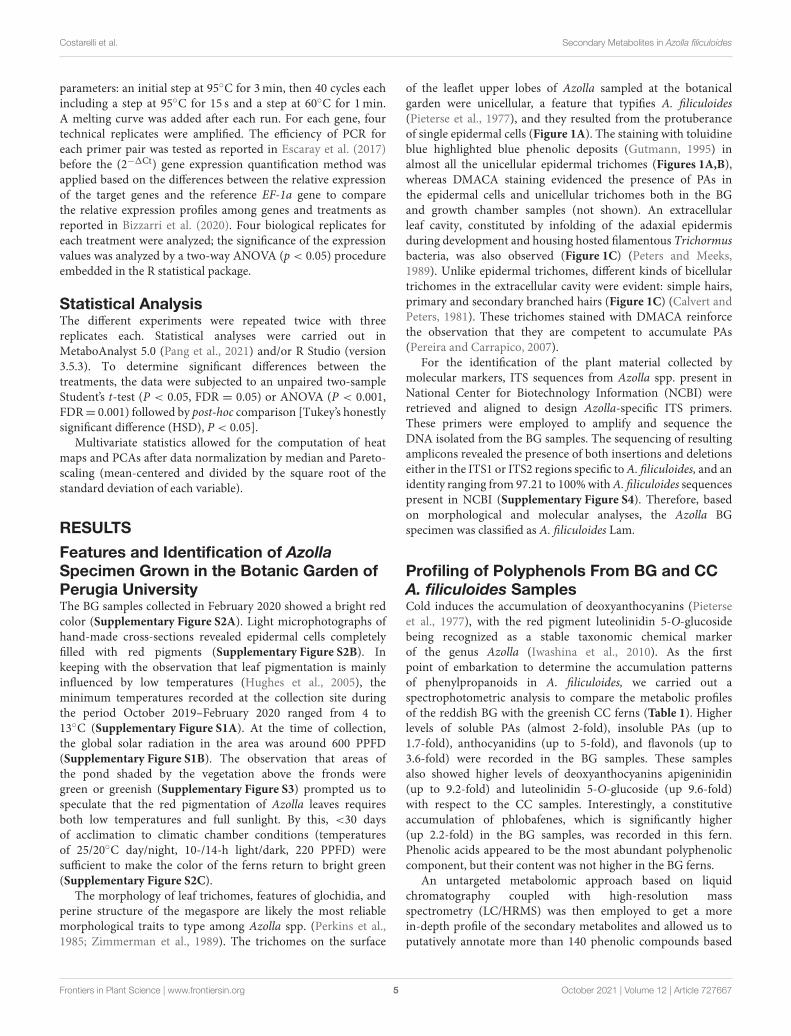
of the leaflet upper lobes of Azolla sampled at the botanicalgarden were unicellular, a feature that typifies A. filiculoides(Pieterse et al., 1977), and they resulted from the protuberanceof single epidermal cells (Figure 1A). The staining with toluidineblue highlighted blue phenolic deposits (Gutmann, 1995) inalmost all the unicellular epidermal trichomes (Figures 1A,B),whereas DMACA staining evidenced the presence of PAs inthe epidermal cells and unicellular trichomes both in the BGand growth chamber samples (not shown). An extracellularleaf cavity, constituted by infolding of the adaxial epidermisduring development and housing hosted filamentous Trichormusbacteria, was also observed (Figure 1C) (Peters and Meeks,1989). Unlike epidermal trichomes, different kinds of bicellulartrichomes in the extracellular cavity were evident: simple hairs,primary and secondary branched hairs (Figure 1C) (Calvert andPeters, 1981). These trichomes stained with DMACA reinforcethe observation that they are competent to accumulate PAs(Pereira and Carrapico, 2007).
For the identification of the plant material collected bymolecular markers, ITS sequences from Azolla spp. present inNational Center for Biotechnology Information (NCBI) wereretrieved and aligned to design Azolla-specific ITS primers.These primers were employed to amplify and sequence theDNA isolated from the BG samples. The sequencing of resultingamplicons revealed the presence of both insertions and deletionseither in the ITS1 or ITS2 regions specific toA. filiculoides, and anidentity ranging from 97.21 to 100%withA. filiculoides sequencespresent in NCBI (Supplementary Figure S4). Therefore, basedon morphological and molecular analyses, the Azolla BGspecimen was classified as A. filiculoides Lam.
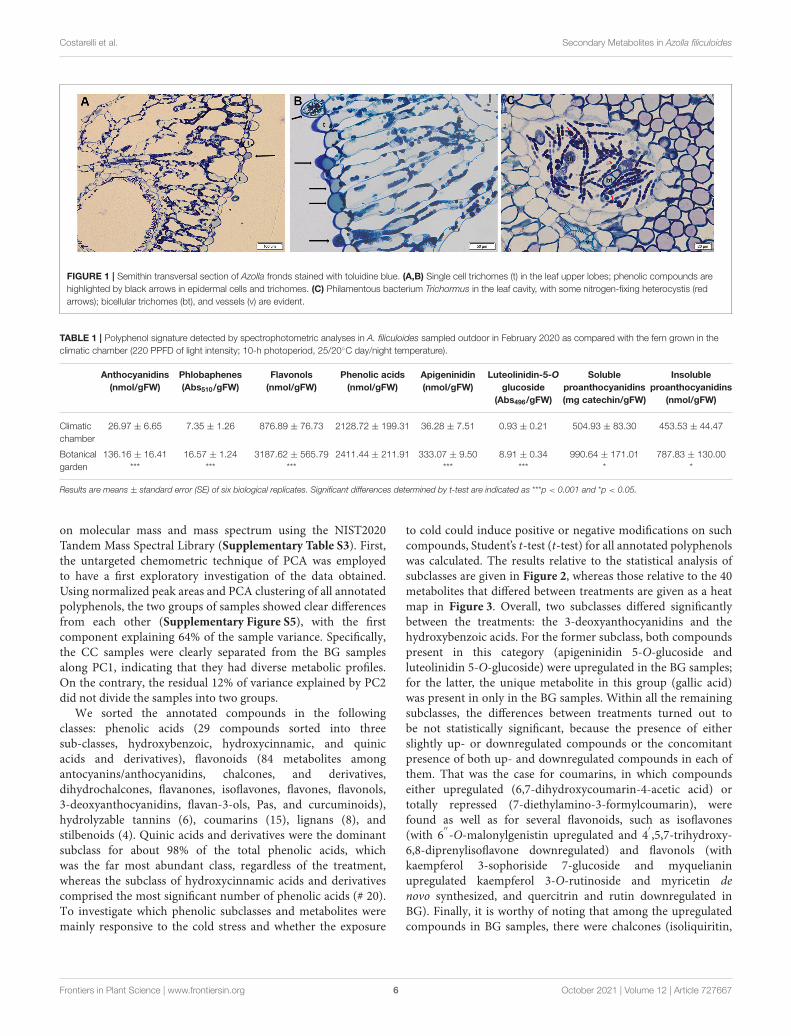
Profiling of Polyphenols From BG and CCA. filiculoides SamplesCold induces the accumulation of deoxyanthocyanins (Pieterseet al., 1977), with the red pigment luteolinidin 5-O-glucosidebeing recognized as a stable taxonomic chemical markerof the genus Azolla (Iwashina et al., 2010). As the firstpoint of embarkation to determine the accumulation patternsof phenylpropanoids in A. filiculoides, we carried out aspectrophotometric analysis to compare the metabolic profilesof the reddish BG with the greenish CC ferns (Table 1). Higherlevels of soluble PAs (almost 2-fold), insoluble PAs (up to1.7-fold), anthocyanidins (up to 5-fold), and flavonols (up to3.6-fold) were recorded in the BG samples. These samplesalso showed higher levels of deoxyanthocyanins apigeninidin(up to 9.2-fold) and luteolinidin 5-O-glucoside (up 9.6-fold)with respect to the CC samples. Interestingly, a constitutiveaccumulation of phlobafenes, which is significantly higher(up 2.2-fold) in the BG samples, was recorded in this fern.Phenolic acids appeared to be the most abundant polyphenoliccomponent, but their content was not higher in the BG ferns.
An untargeted metabolomic approach based on liquidchromatography coupled with high-resolution massspectrometry (LC/HRMS) was then employed to get a morein-depth profile of the secondary metabolites and allowed us toputatively annotate more than 140 phenolic compounds based
Frontiers in Plant Science | www.frontiersin.org 5 October 2021 | Volume 12 | Article 727667
Costarelli et al. Secondary Metabolites in Azolla filiculoides
FIGURE 1 | Semithin transversal section of Azolla fronds stained with toluidine blue. (A,B) Single cell trichomes (t) in the leaf upper lobes; phenolic compounds are
highlighted by black arrows in epidermal cells and trichomes. (C) Philamentous bacterium Trichormus in the leaf cavity, with some nitrogen-fixing heterocystis (red
arrows); bicellular trichomes (bt), and vessels (v) are evident.
TABLE 1 | Polyphenol signature detected by spectrophotometric analyses in A. filiculoides sampled outdoor in February 2020 as compared with the fern grown in the
climatic chamber (220 PPFD of light intensity; 10-h photoperiod, 25/20◦C day/night temperature).
Anthocyanidins
(nmol/gFW)
Phlobaphenes
(Abs510/gFW)
Flavonols
(nmol/gFW)
Phenolic acids
(nmol/gFW)
Apigeninidin
(nmol/gFW)
Luteolinidin-5-O
glucoside
(Abs496/gFW)
Soluble
proanthocyanidins
(mg catechin/gFW)
Insoluble
proanthocyanidins
(nmol/gFW)
Climatic
chamber
26.97 ± 6.65 7.35 ± 1.26 876.89 ± 76.73 2128.72 ± 199.31 36.28 ± 7.51 0.93 ± 0.21 504.93 ± 83.30 453.53 ± 44.47
Botanical
garden
136.16 ± 16.41
***
16.57 ± 1.24
***
3187.62 ± 565.79
***
2411.44 ± 211.91 333.07 ± 9.50
***
8.91 ± 0.34
***
990.64 ± 171.01
*
787.83 ± 130.00
*
Results are means ± standard error (SE) of six biological replicates. Significant differences determined by t-test are indicated as ***p < 0.001 and *p < 0.05.
on molecular mass and mass spectrum using the NIST2020Tandem Mass Spectral Library (Supplementary Table S3). First,the untargeted chemometric technique of PCA was employedto have a first exploratory investigation of the data obtained.Using normalized peak areas and PCA clustering of all annotatedpolyphenols, the two groups of samples showed clear differencesfrom each other (Supplementary Figure S5), with the firstcomponent explaining 64% of the sample variance. Specifically,the CC samples were clearly separated from the BG samplesalong PC1, indicating that they had diverse metabolic profiles.On the contrary, the residual 12% of variance explained by PC2did not divide the samples into two groups.
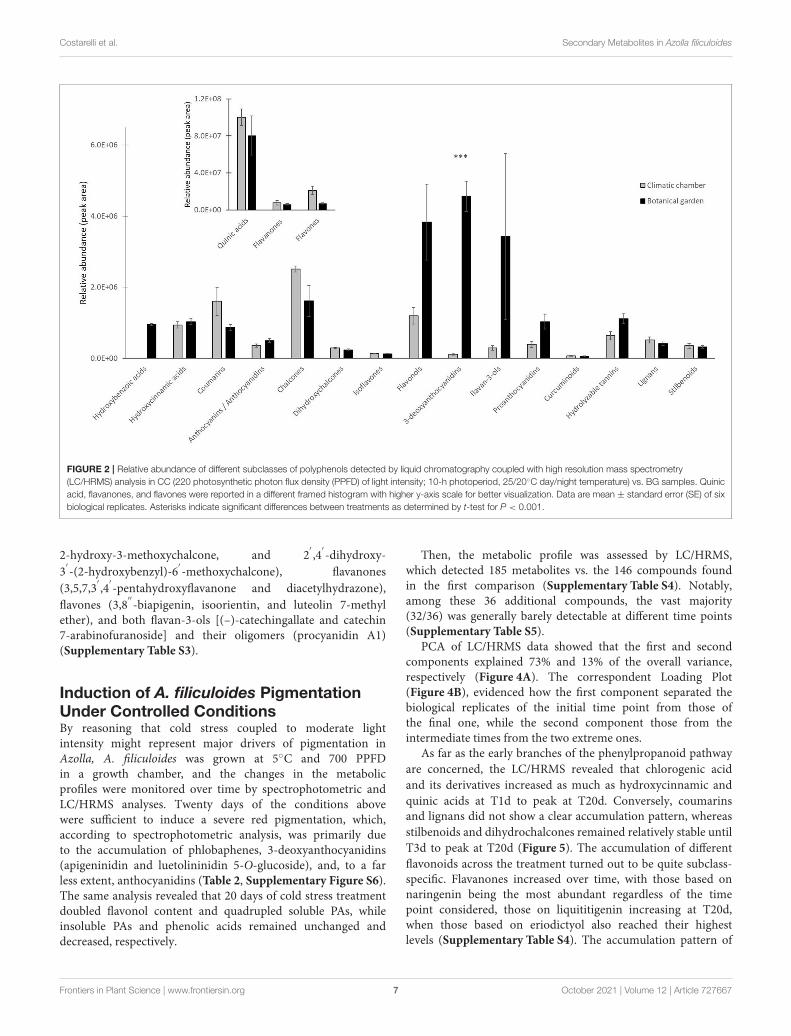
We sorted the annotated compounds in the followingclasses: phenolic acids (29 compounds sorted into threesub-classes, hydroxybenzoic, hydroxycinnamic, and quinicacids and derivatives), flavonoids (84 metabolites amongantocyanins/anthocyanidins, chalcones, and derivatives,dihydrochalcones, flavanones, isoflavones, flavones, flavonols,3-deoxyanthocyanidins, flavan-3-ols, Pas, and curcuminoids),hydrolyzable tannins (6), coumarins (15), lignans (8), andstilbenoids (4). Quinic acids and derivatives were the dominantsubclass for about 98% of the total phenolic acids, whichwas the far most abundant class, regardless of the treatment,whereas the subclass of hydroxycinnamic acids and derivativescomprised the most significant number of phenolic acids (# 20).To investigate which phenolic subclasses and metabolites weremainly responsive to the cold stress and whether the exposure
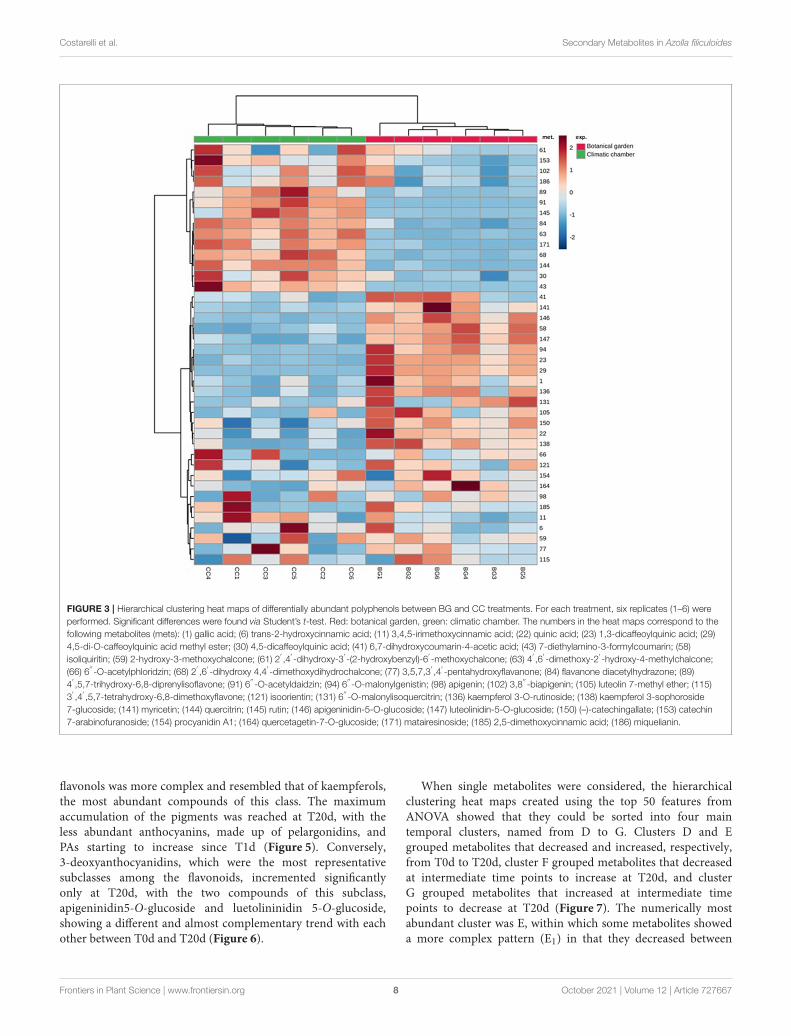
to cold could induce positive or negative modifications on suchcompounds, Student’s t-test (t-test) for all annotated polyphenolswas calculated. The results relative to the statistical analysis ofsubclasses are given in Figure 2, whereas those relative to the 40metabolites that differed between treatments are given as a heatmap in Figure 3. Overall, two subclasses differed significantlybetween the treatments: the 3-deoxyanthocyanidins and thehydroxybenzoic acids. For the former subclass, both compoundspresent in this category (apigeninidin 5-O-glucoside andluteolinidin 5-O-glucoside) were upregulated in the BG samples;for the latter, the unique metabolite in this group (gallic acid)was present in only in the BG samples. Within all the remainingsubclasses, the differences between treatments turned out tobe not statistically significant, because the presence of eitherslightly up- or downregulated compounds or the concomitantpresence of both up- and downregulated compounds in each ofthem. That was the case for coumarins, in which compoundseither upregulated (6,7-dihydroxycoumarin-4-acetic acid) ortotally repressed (7-diethylamino-3-formylcoumarin), werefound as well as for several flavonoids, such as isoflavones(with 6
′′
-O-malonylgenistin upregulated and 4′
,5,7-trihydroxy-6,8-diprenylisoflavone downregulated) and flavonols (withkaempferol 3-sophoriside 7-glucoside and myquelianinupregulated kaempferol 3-O-rutinoside and myricetin denovo synthesized, and quercitrin and rutin downregulated inBG). Finally, it is worthy of noting that among the upregulatedcompounds in BG samples, there were chalcones (isoliquiritin,
Frontiers in Plant Science | www.frontiersin.org 6 October 2021 | Volume 12 | Article 727667
Costarelli et al. Secondary Metabolites in Azolla filiculoides
FIGURE 2 | Relative abundance of different subclasses of polyphenols detected by liquid chromatography coupled with high resolution mass spectrometry
(LC/HRMS) analysis in CC (220 photosynthetic photon flux density (PPFD) of light intensity; 10-h photoperiod, 25/20◦C day/night temperature) vs. BG samples. Quinic
acid, flavanones, and flavones were reported in a different framed histogram with higher y-axis scale for better visualization. Data are mean ± standard error (SE) of six
biological replicates. Asterisks indicate significant differences between treatments as determined by t-test for P < 0.001.
2-hydroxy-3-methoxychalcone, and 2′
,4′
-dihydroxy-3′
-(2-hydroxybenzyl)-6′
-methoxychalcone), flavanones(3,5,7,3
′
,4′
-pentahydroxyflavanone and diacetylhydrazone),flavones (3,8
′′
-biapigenin, isoorientin, and luteolin 7-methylether), and both flavan-3-ols [(–)-catechingallate and catechin7-arabinofuranoside] and their oligomers (procyanidin A1)(Supplementary Table S3).
Induction of A. filiculoides PigmentationUnder Controlled ConditionsBy reasoning that cold stress coupled to moderate lightintensity might represent major drivers of pigmentation inAzolla, A. filiculoides was grown at 5◦C and 700 PPFDin a growth chamber, and the changes in the metabolicprofiles were monitored over time by spectrophotometric andLC/HRMS analyses. Twenty days of the conditions abovewere sufficient to induce a severe red pigmentation, which,according to spectrophotometric analysis, was primarily dueto the accumulation of phlobaphenes, 3-deoxyanthocyanidins(apigeninidin and luetolininidin 5-O-glucoside), and, to a farless extent, anthocyanidins (Table 2, Supplementary Figure S6).The same analysis revealed that 20 days of cold stress treatmentdoubled flavonol content and quadrupled soluble PAs, whileinsoluble PAs and phenolic acids remained unchanged anddecreased, respectively.
Then, the metabolic profile was assessed by LC/HRMS,which detected 185 metabolites vs. the 146 compounds foundin the first comparison (Supplementary Table S4). Notably,among these 36 additional compounds, the vast majority(32/36) was generally barely detectable at different time points(Supplementary Table S5).
PCA of LC/HRMS data showed that the first and secondcomponents explained 73% and 13% of the overall variance,respectively (Figure 4A). The correspondent Loading Plot(Figure 4B), evidenced how the first component separated thebiological replicates of the initial time point from those ofthe final one, while the second component those from theintermediate times from the two extreme ones.
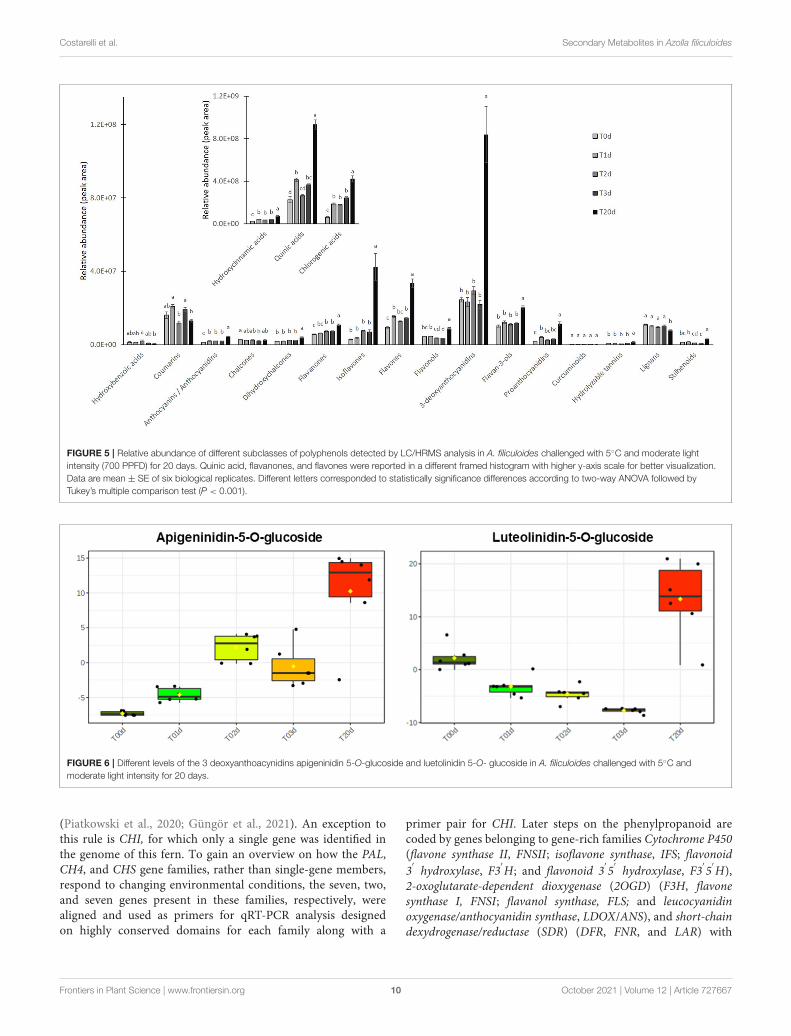
As far as the early branches of the phenylpropanoid pathwayare concerned, the LC/HRMS revealed that chlorogenic acidand its derivatives increased as much as hydroxycinnamic andquinic acids at T1d to peak at T20d. Conversely, coumarinsand lignans did not show a clear accumulation pattern, whereasstilbenoids and dihydrochalcones remained relatively stable untilT3d to peak at T20d (Figure 5). The accumulation of differentflavonoids across the treatment turned out to be quite subclass-specific. Flavanones increased over time, with those based onnaringenin being the most abundant regardless of the timepoint considered, those on liquititigenin increasing at T20d,when those based on eriodictyol also reached their highestlevels (Supplementary Table S4). The accumulation pattern of
Frontiers in Plant Science | www.frontiersin.org 7 October 2021 | Volume 12 | Article 727667
Costarelli et al. Secondary Metabolites in Azolla filiculoides
FIGURE 3 | Hierarchical clustering heat maps of differentially abundant polyphenols between BG and CC treatments. For each treatment, six replicates (1–6) were
performed. Significant differences were found via Student’s t-test. Red: botanical garden, green: climatic chamber. The numbers in the heat maps correspond to the
following metabolites (mets): (1) gallic acid; (6) trans-2-hydroxycinnamic acid; (11) 3,4,5-irimethoxycinnamic acid; (22) quinic acid; (23) 1,3-dicaffeoylquinic acid; (29)
4,5-di-O-caffeoylquinic acid methyl ester; (30) 4,5-dicaffeoylquinic acid; (41) 6,7-dihydroxycoumarin-4-acetic acid; (43) 7-diethylamino-3-formylcoumarin; (58)
isoliquiritin; (59) 2-hydroxy-3-methoxychalcone; (61) 2′
,4′
-dihydroxy-3′
-(2-hydroxybenzyl)-6′
-methoxychalcone; (63) 4′
,6′
-dimethoxy-2′
-hydroxy-4-methylchalcone;
(66) 6′′
-O-acetylphloridzin; (68) 2′
,6′
-dihydroxy 4,4′
-dimethoxydihydrochalcone; (77) 3,5,7,3′
,4′
-pentahydroxyflavanone; (84) flavanone diacetylhydrazone; (89)
4′
,5,7-trihydroxy-6,8-diprenylisoflavone; (91) 6′′
-O-acetyldaidzin; (94) 6′′
-O-malonylgenistin; (98) apigenin; (102) 3,8′′
-biapigenin; (105) luteolin 7-methyl ether; (115)
3′
,4′
,5,7-tetrahydroxy-6,8-dimethoxyflavone; (121) isoorientin; (131) 6′′
-O-malonylisoquercitrin; (136) kaempferol 3-O-rutinoside; (138) kaempferol 3-sophoroside
7-glucoside; (141) myricetin; (144) quercitrin; (145) rutin; (146) apigeninidin-5-O-glucoside; (147) luteolinidin-5-O-glucoside; (150) (–)-catechingallate; (153) catechin
7-arabinofuranoside; (154) procyanidin A1; (164) quercetagetin-7-O-glucoside; (171) matairesinoside; (185) 2,5-dimethoxycinnamic acid; (186) miquelianin.
flavonols was more complex and resembled that of kaempferols,the most abundant compounds of this class. The maximumaccumulation of the pigments was reached at T20d, with theless abundant anthocyanins, made up of pelargonidins, andPAs starting to increase since T1d (Figure 5). Conversely,3-deoxyanthocyanidins, which were the most representativesubclasses among the flavonoids, incremented significantlyonly at T20d, with the two compounds of this subclass,apigeninidin5-O-glucoside and luetolininidin 5-O-glucoside,showing a different and almost complementary trend with eachother between T0d and T20d (Figure 6).
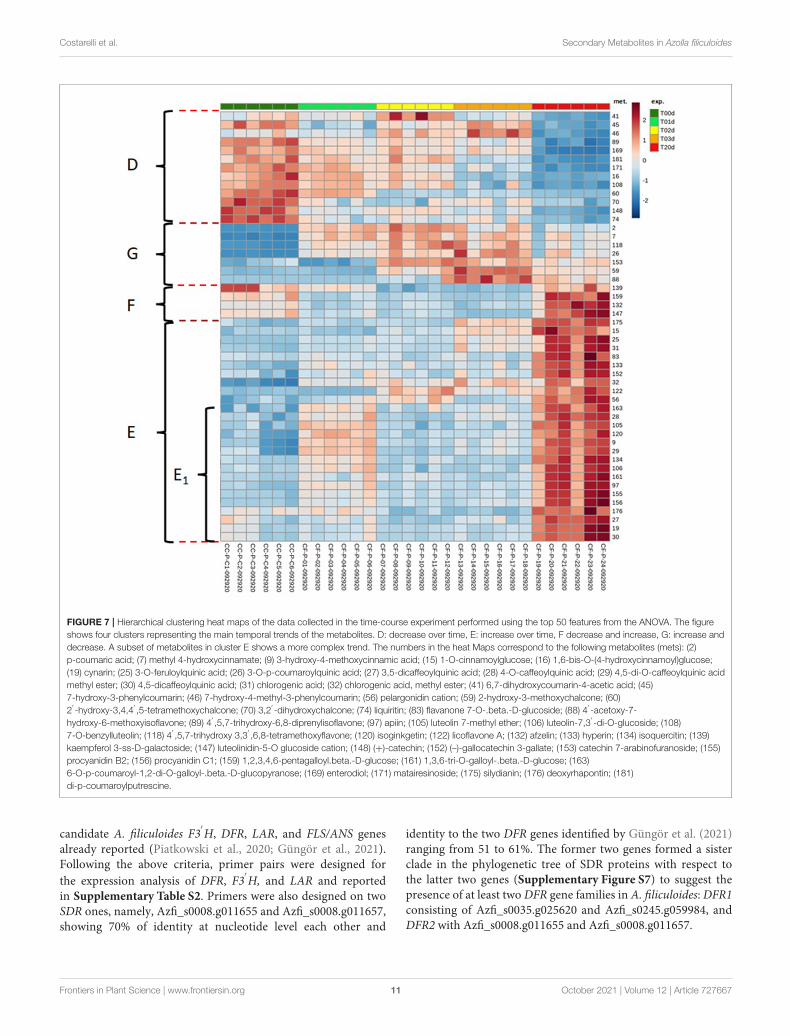
When single metabolites were considered, the hierarchicalclustering heat maps created using the top 50 features fromANOVA showed that they could be sorted into four maintemporal clusters, named from D to G. Clusters D and Egrouped metabolites that decreased and increased, respectively,from T0d to T20d, cluster F grouped metabolites that decreasedat intermediate time points to increase at T20d, and clusterG grouped metabolites that increased at intermediate timepoints to decrease at T20d (Figure 7). The numerically mostabundant cluster was E, within which some metabolites showeda more complex pattern (E1) in that they decreased between
Frontiers in Plant Science | www.frontiersin.org 8 October 2021 | Volume 12 | Article 727667
Costarelli et al. Secondary Metabolites in Azolla filiculoides
TABLE 2 | Polyphenols signature detected by spectrophotometric analyses in A. filiculoides challenged with 5◦C and moderate light intensity (700 PPFD) for 20 days.
Anthocyanidins
(nmol/gFW)
Phlobaphenes
(Abs510/gFW)
Flavonols
(nmol/gFW)
Phenolicacids
(nmol/gFW)
Apigeninidin
(nmol/gFW)
Luteolinidin-5-O
glucoside
(Abs496/gFW)
Soluble
proanthocyanidins
(mg catechin/gFW)
Insoluble
proanthocyanidins
(nmol/gFW)
0 d 37.03 ± 15.85 a 2.78 ± 0.13 a 911.58 ± 71.27 a 2883.30 ± 148.29 a 63.53 ± 22.56 a 1.31 ± 0.48 a 616.76 ± 91.19 a 435.85 ± 55.04 a
1 d 34.52 ± 6.72 a 2.82 ± 0.54 a 736.92 ± 67.38 a 1633.20 ± 330.12 ab 29.45 ± 5.36 a 0.61 ± 0.08 a 604.64 ± 62.20 a 436.41 ± 58.01 a
2 d 39.06 ± 9.38 a 3.10 ± 0.65 a 677.17 ± 10.19 a 1387.52 ± 169.42 b 37.90 ± 6.48 a 0.70 ± 0.12 a 501.07 ± 57.19 a 368.26 ± 41.47 a
3 d 58.70 ± 11.71 a 4.12 ± 0.70 a 800.52 ± 73.21 a 1537.85 ± 169.47 ab 111.39 ± 26.82 a 2.14 ± 0.52 a 703.65 ± 65.14 a 357.12 ± 26.68 a
20 d 246.22 ± 23.23 b 22.36 ± 5.52 b 1739.51 ± 134.53 b 1368.71 ± 209.21 b 627.72 ± 65.99 b 13.34 ± 1.20 b 2442.47 ± 132.88 b 514.96 ± 76.84 a
Results are means ± SE of six biological replicates. Significant differences determined by analysis of variance (ANOVA) followed by Tukey’s multiple comparison test (P < 0.05 for both)
are indicated by different letters.
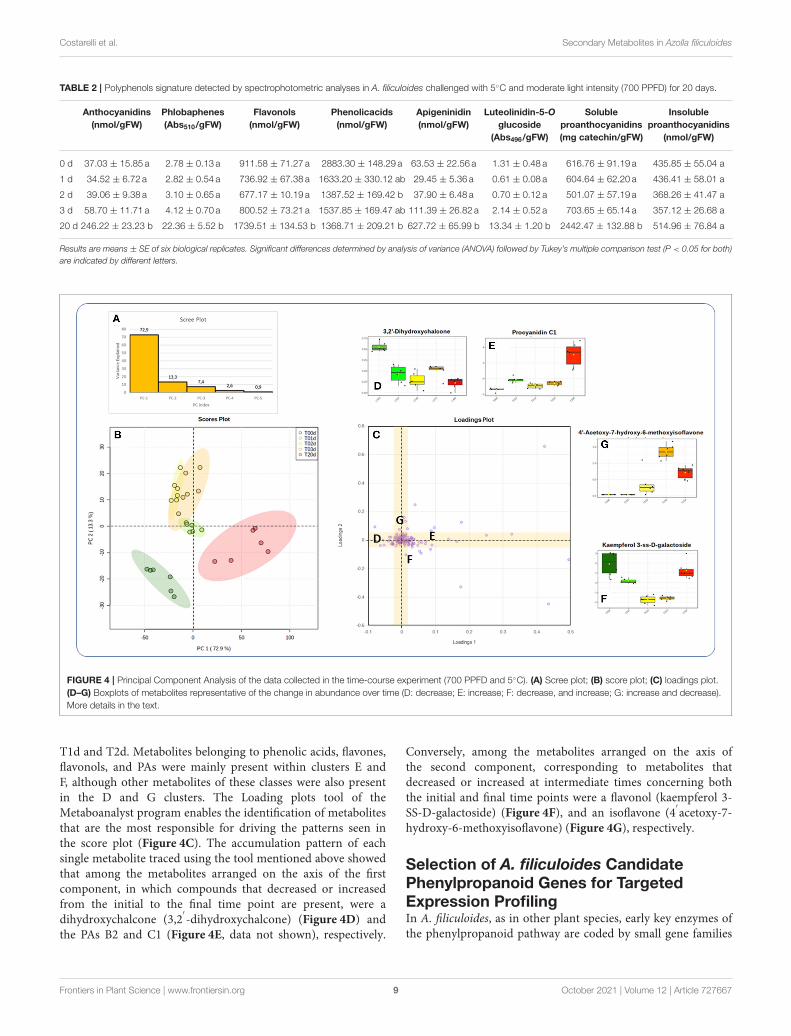
FIGURE 4 | Principal Component Analysis of the data collected in the time-course experiment (700 PPFD and 5◦C). (A) Scree plot; (B) score plot; (C) loadings plot.
(D–G) Boxplots of metabolites representative of the change in abundance over time (D: decrease; E: increase; F: decrease, and increase; G: increase and decrease).
More details in the text.
T1d and T2d. Metabolites belonging to phenolic acids, flavones,flavonols, and PAs were mainly present within clusters E andF, although other metabolites of these classes were also presentin the D and G clusters. The Loading plots tool of theMetaboanalyst program enables the identification of metabolitesthat are the most responsible for driving the patterns seen inthe score plot (Figure 4C). The accumulation pattern of eachsingle metabolite traced using the tool mentioned above showedthat among the metabolites arranged on the axis of the firstcomponent, in which compounds that decreased or increasedfrom the initial to the final time point are present, were adihydroxychalcone (3,2
′
-dihydroxychalcone) (Figure 4D) andthe PAs B2 and C1 (Figure 4E, data not shown), respectively.
Conversely, among the metabolites arranged on the axis ofthe second component, corresponding to metabolites thatdecreased or increased at intermediate times concerning boththe initial and final time points were a flavonol (kaempferol 3-SS-D-galactoside) (Figure 4F), and an isoflavone (4
′
acetoxy-7-hydroxy-6-methoxyisoflavone) (Figure 4G), respectively.
Selection of A. filiculoides CandidatePhenylpropanoid Genes for TargetedExpression ProfilingIn A. filiculoides, as in other plant species, early key enzymes ofthe phenylpropanoid pathway are coded by small gene families
Frontiers in Plant Science | www.frontiersin.org 9 October 2021 | Volume 12 | Article 727667
Costarelli et al. Secondary Metabolites in Azolla filiculoides
FIGURE 5 | Relative abundance of different subclasses of polyphenols detected by LC/HRMS analysis in A. filiculoides challenged with 5◦C and moderate light
intensity (700 PPFD) for 20 days. Quinic acid, flavanones, and flavones were reported in a different framed histogram with higher y-axis scale for better visualization.
Data are mean ± SE of six biological replicates. Different letters corresponded to statistically significance differences according to two-way ANOVA followed by
Tukey’s multiple comparison test (P < 0.001).
FIGURE 6 | Different levels of the 3 deoxyanthoacynidins apigeninidin 5-O-glucoside and luetolinidin 5-O- glucoside in A. filiculoides challenged with 5◦C and
moderate light intensity for 20 days.
(Piatkowski et al., 2020; Güngör et al., 2021). An exception tothis rule is CHI, for which only a single gene was identified inthe genome of this fern. To gain an overview on how the PAL,CH4, and CHS gene families, rather than single-gene members,respond to changing environmental conditions, the seven, two,and seven genes present in these families, respectively, werealigned and used as primers for qRT-PCR analysis designedon highly conserved domains for each family along with a
primer pair for CHI. Later steps on the phenylpropanoid arecoded by genes belonging to gene-rich families Cytochrome P450(flavone synthase II, FNSII; isoflavone synthase, IFS; flavonoid3′
hydroxylase, F3′
H; and flavonoid 3′
5′
hydroxylase, F3′
5′
H),2-oxoglutarate-dependent dioxygenase (2OGD) (F3H, flavonesynthase I, FNSI; flavanol synthase, FLS; and leucocyanidinoxygenase/anthocyanidin synthase, LDOX/ANS), and short-chaindexydrogenase/reductase (SDR) (DFR, FNR, and LAR) with
Frontiers in Plant Science | www.frontiersin.org 10 October 2021 | Volume 12 | Article 727667
Costarelli et al. Secondary Metabolites in Azolla filiculoides
FIGURE 7 | Hierarchical clustering heat maps of the data collected in the time-course experiment performed using the top 50 features from the ANOVA. The figure
shows four clusters representing the main temporal trends of the metabolites. D: decrease over time, E: increase over time, F decrease and increase, G: increase and
decrease. A subset of metabolites in cluster E shows a more complex trend. The numbers in the heat Maps correspond to the following metabolites (mets): (2)
p-coumaric acid; (7) methyl 4-hydroxycinnamate; (9) 3-hydroxy-4-methoxycinnamic acid; (15) 1-O-cinnamoylglucose; (16) 1,6-bis-O-(4-hydroxycinnamoyl)glucose;
(19) cynarin; (25) 3-O-feruloylquinic acid; (26) 3-O-p-coumaroylquinic acid; (27) 3,5-dicaffeoylquinic acid; (28) 4-O-caffeoylquinic acid; (29) 4,5-di-O-caffeoylquinic acid
methyl ester; (30) 4,5-dicaffeoylquinic acid; (31) chlorogenic acid; (32) chlorogenic acid, methyl ester; (41) 6,7-dihydroxycoumarin-4-acetic acid; (45)
7-hydroxy-3-phenylcoumarin; (46) 7-hydroxy-4-methyl-3-phenylcoumarin; (56) pelargonidin cation; (59) 2-hydroxy-3-methoxychalcone; (60)
2′
-hydroxy-3,4,4′
,5-tetramethoxychalcone; (70) 3,2′
-dihydroxychalcone; (74) liquiritin; (83) flavanone 7-O-.beta.-D-glucoside; (88) 4′
-acetoxy-7-
hydroxy-6-methoxyisoflavone; (89) 4′
,5,7-trihydroxy-6,8-diprenylisoflavone; (97) apiin; (105) luteolin 7-methyl ether; (106) luteolin-7,3′
-di-O-glucoside; (108)
7-O-benzylluteolin; (118) 4′
,5,7-trihydroxy 3,3′
,6,8-tetramethoxyflavone; (120) isoginkgetin; (122) licoflavone A; (132) afzelin; (133) hyperin; (134) isoquercitin; (139)
kaempferol 3-ss-D-galactoside; (147) luteolinidin-5-O glucoside cation; (148) (+)-catechin; (152) (–)-gallocatechin 3-gallate; (153) catechin 7-arabinofuranoside; (155)
procyanidin B2; (156) procyanidin C1; (159) 1,2,3,4,6-pentagalloyl.beta.-D-glucose; (161) 1,3,6-tri-O-galloyl-.beta.-D-glucose; (163)
6-O-p-coumaroyl-1,2-di-O-galloyl-.beta.-D-glucopyranose; (169) enterodiol; (171) matairesinoside; (175) silydianin; (176) deoxyrhapontin; (181)
di-p-coumaroylputrescine.
candidate A. filiculoides F3′
H, DFR, LAR, and FLS/ANS genesalready reported (Piatkowski et al., 2020; Güngör et al., 2021).Following the above criteria, primer pairs were designed forthe expression analysis of DFR, F3
′
H, and LAR and reportedin Supplementary Table S2. Primers were also designed on twoSDR ones, namely, Azfi_s0008.g011655 and Azfi_s0008.g011657,showing 70% of identity at nucleotide level each other and
identity to the two DFR genes identified by Güngör et al. (2021)ranging from 51 to 61%. The former two genes formed a sisterclade in the phylogenetic tree of SDR proteins with respect tothe latter two genes (Supplementary Figure S7) to suggest thepresence of at least twoDFR gene families in A. filiculoides:DFR1consisting of Azfi_s0035.g025620 and Azfi_s0245.g059984, andDFR2 with Azfi_s0008.g011655 and Azfi_s0008.g011657.
Frontiers in Plant Science | www.frontiersin.org 11 October 2021 | Volume 12 | Article 727667
Costarelli et al. Secondary Metabolites in Azolla filiculoides
Finally, primers were designed on the following 2OGD genes:Azfi_s0335.g065519, Azfi_s0076.g037942, Azfi_s0039.g026462,and Azfi_s0076.g037826. The first two genes were reportedby Güngör et al. (2021) as F3H-like. If our phylogeneticanalysis supported, albeit, with low boostraps, the relatednessof Azfi_s0076.g037942 to an F3H gene from Arabidopsis(NP_190692), it did not work for Azfi_s0335.g065519. Thislast entry conversely shared 44% identity at amino acidic levelwith Azfi_s0039.g026462, and both were in a clade next to thatgrouping FLS and some ANS from higher plants, but differentfrom that of Azfi_s0076.g037826, an FLS/ANS-like according toGüngör et al. (2021) (data not shown).
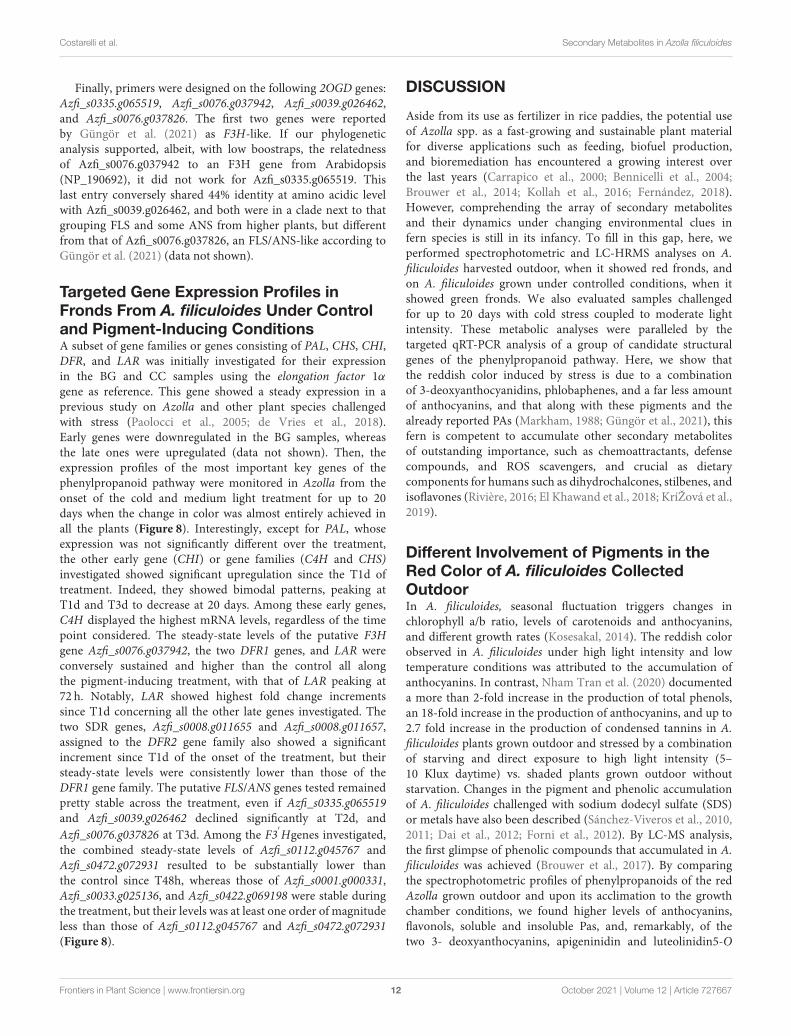
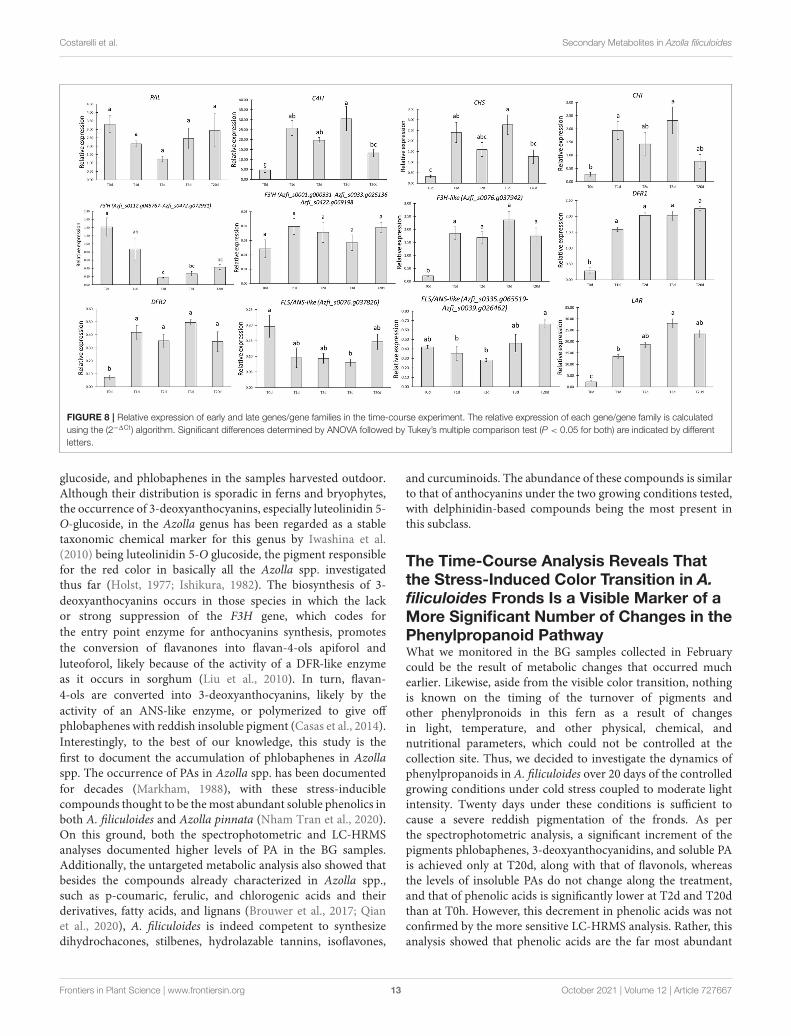
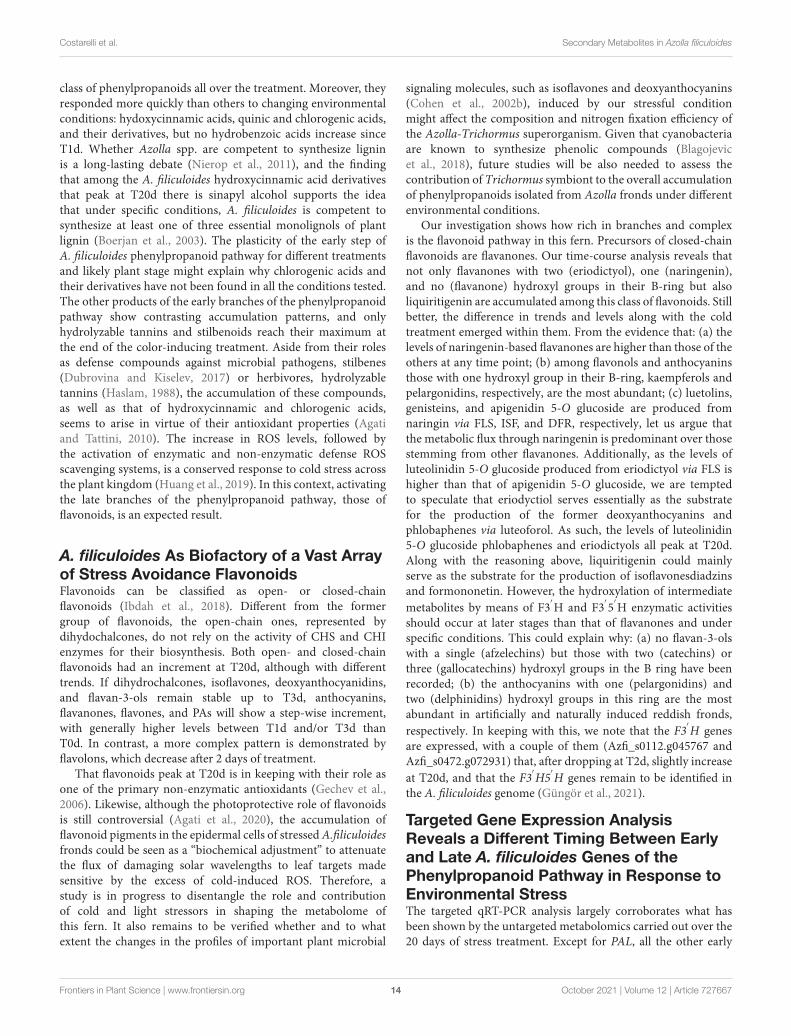
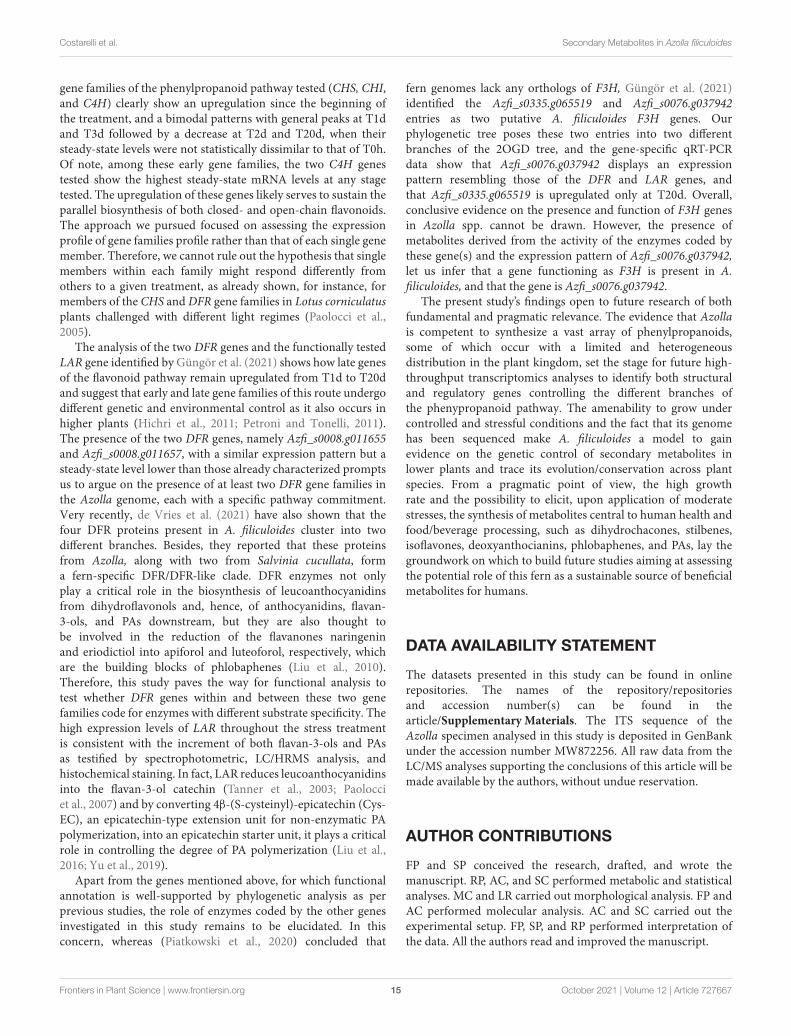
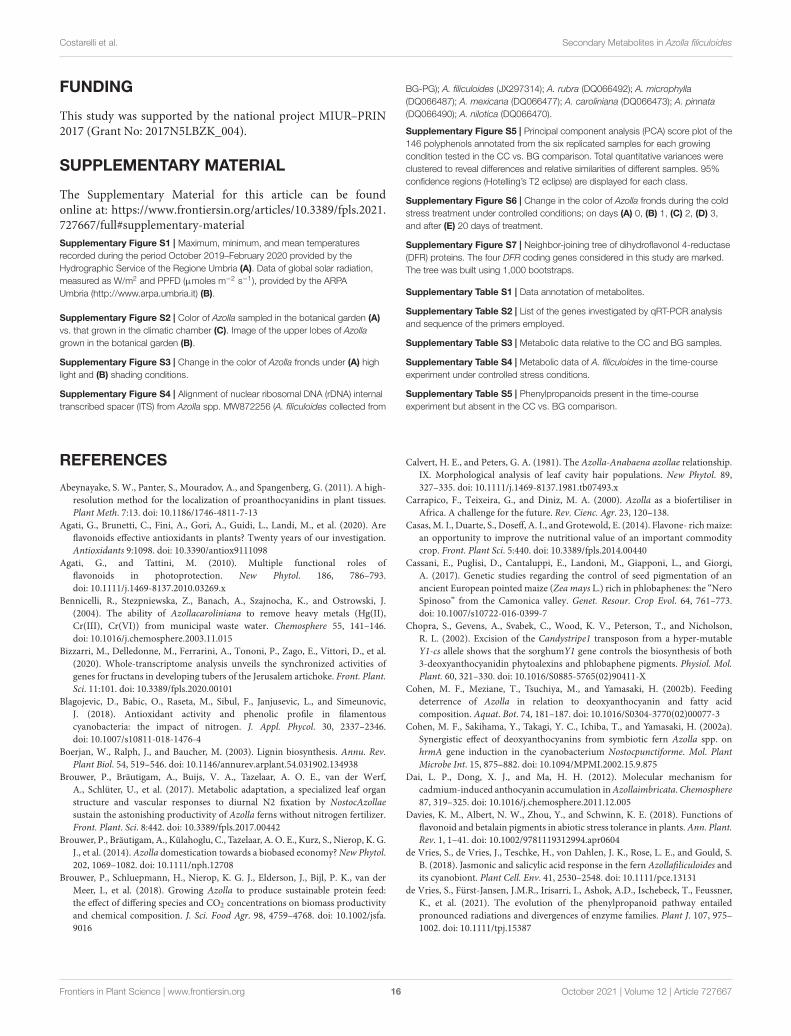
Targeted Gene Expression Profiles inFronds From A. filiculoides Under Controland Pigment-Inducing ConditionsA subset of gene families or genes consisting of PAL, CHS, CHI,DFR, and LAR was initially investigated for their expressionin the BG and CC samples using the elongation factor 1αgene as reference. This gene showed a steady expression in aprevious study on Azolla and other plant species challengedwith stress (Paolocci et al., 2005; de Vries et al., 2018).Early genes were downregulated in the BG samples, whereasthe late ones were upregulated (data not shown). Then, theexpression profiles of the most important key genes of thephenylpropanoid pathway were monitored in Azolla from theonset of the cold and medium light treatment for up to 20days when the change in color was almost entirely achieved inall the plants (Figure 8). Interestingly, except for PAL, whoseexpression was not significantly different over the treatment,the other early gene (CHI) or gene families (C4H and CHS)investigated showed significant upregulation since the T1d oftreatment. Indeed, they showed bimodal patterns, peaking atT1d and T3d to decrease at 20 days. Among these early genes,C4H displayed the highest mRNA levels, regardless of the timepoint considered. The steady-state levels of the putative F3Hgene Azfi_s0076.g037942, the two DFR1 genes, and LAR wereconversely sustained and higher than the control all alongthe pigment-inducing treatment, with that of LAR peaking at72 h. Notably, LAR showed highest fold change incrementssince T1d concerning all the other late genes investigated. Thetwo SDR genes, Azfi_s0008.g011655 and Azfi_s0008.g011657,assigned to the DFR2 gene family also showed a significantincrement since T1d of the onset of the treatment, but theirsteady-state levels were consistently lower than those of theDFR1 gene family. The putative FLS/ANS genes tested remainedpretty stable across the treatment, even if Azfi_s0335.g065519and Azfi_s0039.g026462 declined significantly at T2d, andAzfi_s0076.g037826 at T3d. Among the F3
′
Hgenes investigated,the combined steady-state levels of Azfi_s0112.g045767 andAzfi_s0472.g072931 resulted to be substantially lower thanthe control since T48h, whereas those of Azfi_s0001.g000331,Azfi_s0033.g025136, and Azfi_s0422.g069198 were stable duringthe treatment, but their levels was at least one order of magnitudeless than those of Azfi_s0112.g045767 and Azfi_s0472.g072931(Figure 8).
DISCUSSION
Aside from its use as fertilizer in rice paddies, the potential useof Azolla spp. as a fast-growing and sustainable plant materialfor diverse applications such as feeding, biofuel production,and bioremediation has encountered a growing interest overthe last years (Carrapico et al., 2000; Bennicelli et al., 2004;Brouwer et al., 2014; Kollah et al., 2016; Fernández, 2018).However, comprehending the array of secondary metabolitesand their dynamics under changing environmental clues infern species is still in its infancy. To fill in this gap, here, weperformed spectrophotometric and LC-HRMS analyses on A.filiculoides harvested outdoor, when it showed red fronds, andon A. filiculoides grown under controlled conditions, when itshowed green fronds. We also evaluated samples challengedfor up to 20 days with cold stress coupled to moderate lightintensity. These metabolic analyses were paralleled by thetargeted qRT-PCR analysis of a group of candidate structuralgenes of the phenylpropanoid pathway. Here, we show thatthe reddish color induced by stress is due to a combinationof 3-deoxyanthocyanidins, phlobaphenes, and a far less amountof anthocyanins, and that along with these pigments and thealready reported PAs (Markham, 1988; Güngör et al., 2021), thisfern is competent to accumulate other secondary metabolitesof outstanding importance, such as chemoattractants, defensecompounds, and ROS scavengers, and crucial as dietarycomponents for humans such as dihydrochalcones, stilbenes, andisoflavones (Rivière, 2016; El Khawand et al., 2018; KríŽová et al.,2019).
Different Involvement of Pigments in theRed Color of A. filiculoides CollectedOutdoorIn A. filiculoides, seasonal fluctuation triggers changes inchlorophyll a/b ratio, levels of carotenoids and anthocyanins,and different growth rates (Kosesakal, 2014). The reddish colorobserved in A. filiculoides under high light intensity and lowtemperature conditions was attributed to the accumulation ofanthocyanins. In contrast, Nham Tran et al. (2020) documenteda more than 2-fold increase in the production of total phenols,an 18-fold increase in the production of anthocyanins, and up to2.7 fold increase in the production of condensed tannins in A.filiculoides plants grown outdoor and stressed by a combinationof starving and direct exposure to high light intensity (5–10 Klux daytime) vs. shaded plants grown outdoor withoutstarvation. Changes in the pigment and phenolic accumulationof A. filiculoides challenged with sodium dodecyl sulfate (SDS)or metals have also been described (Sánchez-Viveros et al., 2010,2011; Dai et al., 2012; Forni et al., 2012). By LC-MS analysis,the first glimpse of phenolic compounds that accumulated in A.filiculoides was achieved (Brouwer et al., 2017). By comparingthe spectrophotometric profiles of phenylpropanoids of the redAzolla grown outdoor and upon its acclimation to the growthchamber conditions, we found higher levels of anthocyanins,flavonols, soluble and insoluble Pas, and, remarkably, of thetwo 3- deoxyanthocyanins, apigeninidin and luteolinidin5-O
Frontiers in Plant Science | www.frontiersin.org 12 October 2021 | Volume 12 | Article 727667
Costarelli et al. Secondary Metabolites in Azolla filiculoides
FIGURE 8 | Relative expression of early and late genes/gene families in the time-course experiment. The relative expression of each gene/gene family is calculated
using the (2−1Ct) algorithm. Significant differences determined by ANOVA followed by Tukey’s multiple comparison test (P < 0.05 for both) are indicated by different
letters.
glucoside, and phlobaphenes in the samples harvested outdoor.Although their distribution is sporadic in ferns and bryophytes,the occurrence of 3-deoxyanthocyanins, especially luteolinidin 5-O-glucoside, in the Azolla genus has been regarded as a stabletaxonomic chemical marker for this genus by Iwashina et al.(2010) being luteolinidin 5-O glucoside, the pigment responsiblefor the red color in basically all the Azolla spp. investigatedthus far (Holst, 1977; Ishikura, 1982). The biosynthesis of 3-deoxyanthocyanins occurs in those species in which the lackor strong suppression of the F3H gene, which codes forthe entry point enzyme for anthocyanins synthesis, promotesthe conversion of flavanones into flavan-4-ols apiforol andluteoforol, likely because of the activity of a DFR-like enzymeas it occurs in sorghum (Liu et al., 2010). In turn, flavan-4-ols are converted into 3-deoxyanthocyanins, likely by theactivity of an ANS-like enzyme, or polymerized to give offphlobaphenes with reddish insoluble pigment (Casas et al., 2014).Interestingly, to the best of our knowledge, this study is thefirst to document the accumulation of phlobaphenes in Azollaspp. The occurrence of PAs in Azolla spp. has been documentedfor decades (Markham, 1988), with these stress-induciblecompounds thought to be themost abundant soluble phenolics inboth A. filiculoides and Azolla pinnata (Nham Tran et al., 2020).On this ground, both the spectrophotometric and LC-HRMSanalyses documented higher levels of PA in the BG samples.Additionally, the untargeted metabolic analysis also showed thatbesides the compounds already characterized in Azolla spp.,such as p-coumaric, ferulic, and chlorogenic acids and theirderivatives, fatty acids, and lignans (Brouwer et al., 2017; Qianet al., 2020), A. filiculoides is indeed competent to synthesizedihydrochacones, stilbenes, hydrolazable tannins, isoflavones,
and curcuminoids. The abundance of these compounds is similarto that of anthocyanins under the two growing conditions tested,with delphinidin-based compounds being the most present inthis subclass.
The Time-Course Analysis Reveals Thatthe Stress-Induced Color Transition in A.
filiculoides Fronds Is a Visible Marker of aMore Significant Number of Changes in thePhenylpropanoid PathwayWhat we monitored in the BG samples collected in Februarycould be the result of metabolic changes that occurred muchearlier. Likewise, aside from the visible color transition, nothingis known on the timing of the turnover of pigments andother phenylpronoids in this fern as a result of changesin light, temperature, and other physical, chemical, andnutritional parameters, which could not be controlled at thecollection site. Thus, we decided to investigate the dynamics ofphenylpropanoids in A. filiculoides over 20 days of the controlledgrowing conditions under cold stress coupled to moderate lightintensity. Twenty days under these conditions is sufficient tocause a severe reddish pigmentation of the fronds. As perthe spectrophotometric analysis, a significant increment of thepigments phlobaphenes, 3-deoxyanthocyanidins, and soluble PAis achieved only at T20d, along with that of flavonols, whereasthe levels of insoluble PAs do not change along the treatment,and that of phenolic acids is significantly lower at T2d and T20dthan at T0h. However, this decrement in phenolic acids was notconfirmed by the more sensitive LC-HRMS analysis. Rather, thisanalysis showed that phenolic acids are the far most abundant
Frontiers in Plant Science | www.frontiersin.org 13 October 2021 | Volume 12 | Article 727667
Costarelli et al. Secondary Metabolites in Azolla filiculoides
class of phenylpropanoids all over the treatment. Moreover, theyresponded more quickly than others to changing environmentalconditions: hydoxycinnamic acids, quinic and chlorogenic acids,and their derivatives, but no hydrobenzoic acids increase sinceT1d. Whether Azolla spp. are competent to synthesize ligninis a long-lasting debate (Nierop et al., 2011), and the findingthat among the A. filiculoides hydroxycinnamic acid derivativesthat peak at T20d there is sinapyl alcohol supports the ideathat under specific conditions, A. filiculoides is competent tosynthesize at least one of three essential monolignols of plantlignin (Boerjan et al., 2003). The plasticity of the early step ofA. filiculoides phenylpropanoid pathway for different treatmentsand likely plant stage might explain why chlorogenic acids andtheir derivatives have not been found in all the conditions tested.The other products of the early branches of the phenylpropanoidpathway show contrasting accumulation patterns, and onlyhydrolyzable tannins and stilbenoids reach their maximum atthe end of the color-inducing treatment. Aside from their rolesas defense compounds against microbial pathogens, stilbenes(Dubrovina and Kiselev, 2017) or herbivores, hydrolyzabletannins (Haslam, 1988), the accumulation of these compounds,as well as that of hydroxycinnamic and chlorogenic acids,seems to arise in virtue of their antioxidant properties (Agatiand Tattini, 2010). The increase in ROS levels, followed bythe activation of enzymatic and non-enzymatic defense ROSscavenging systems, is a conserved response to cold stress acrossthe plant kingdom (Huang et al., 2019). In this context, activatingthe late branches of the phenylpropanoid pathway, those offlavonoids, is an expected result.
A. filiculoides As Biofactory of a Vast Arrayof Stress Avoidance FlavonoidsFlavonoids can be classified as open- or closed-chainflavonoids (Ibdah et al., 2018). Different from the formergroup of flavonoids, the open-chain ones, represented bydihydochalcones, do not rely on the activity of CHS and CHIenzymes for their biosynthesis. Both open- and closed-chainflavonoids had an increment at T20d, although with differenttrends. If dihydrochalcones, isoflavones, deoxyanthocyanidins,and flavan-3-ols remain stable up to T3d, anthocyanins,flavanones, flavones, and PAs will show a step-wise increment,with generally higher levels between T1d and/or T3d thanT0d. In contrast, a more complex pattern is demonstrated byflavolons, which decrease after 2 days of treatment.
That flavonoids peak at T20d is in keeping with their role asone of the primary non-enzymatic antioxidants (Gechev et al.,2006). Likewise, although the photoprotective role of flavonoidsis still controversial (Agati et al., 2020), the accumulation offlavonoid pigments in the epidermal cells of stressedA.filiculoidesfronds could be seen as a “biochemical adjustment” to attenuatethe flux of damaging solar wavelengths to leaf targets madesensitive by the excess of cold-induced ROS. Therefore, astudy is in progress to disentangle the role and contributionof cold and light stressors in shaping the metabolome ofthis fern. It also remains to be verified whether and to whatextent the changes in the profiles of important plant microbial
signaling molecules, such as isoflavones and deoxyanthocyanins(Cohen et al., 2002b), induced by our stressful conditionmight affect the composition and nitrogen fixation efficiency ofthe Azolla-Trichormus superorganism. Given that cyanobacteriaare known to synthesize phenolic compounds (Blagojevicet al., 2018), future studies will be also needed to assess thecontribution of Trichormus symbiont to the overall accumulationof phenylpropanoids isolated from Azolla fronds under differentenvironmental conditions.
Our investigation shows how rich in branches and complexis the flavonoid pathway in this fern. Precursors of closed-chainflavonoids are flavanones. Our time-course analysis reveals thatnot only flavanones with two (eriodictyol), one (naringenin),and no (flavanone) hydroxyl groups in their B-ring but alsoliquiritigenin are accumulated among this class of flavonoids. Stillbetter, the difference in trends and levels along with the coldtreatment emerged within them. From the evidence that: (a) thelevels of naringenin-based flavanones are higher than those of theothers at any time point; (b) among flavonols and anthocyaninsthose with one hydroxyl group in their B-ring, kaempferols andpelargonidins, respectively, are the most abundant; (c) luetolins,genisteins, and apigenidin 5-O glucoside are produced fromnaringin via FLS, ISF, and DFR, respectively, let us argue thatthe metabolic flux through naringenin is predominant over thosestemming from other flavanones. Additionally, as the levels ofluteolinidin 5-O glucoside produced from eriodictyol via FLS ishigher than that of apigenidin 5-O glucoside, we are temptedto speculate that eriodyctiol serves essentially as the substratefor the production of the former deoxyanthocyanins andphlobaphenes via luteoforol. As such, the levels of luteolinidin5-O glucoside phlobaphenes and eriodictyols all peak at T20d.Along with the reasoning above, liquiritigenin could mainlyserve as the substrate for the production of isoflavonesdiadzinsand formononetin. However, the hydroxylation of intermediatemetabolites by means of F3
′
H and F3′
5′
H enzymatic activitiesshould occur at later stages than that of flavanones and underspecific conditions. This could explain why: (a) no flavan-3-olswith a single (afzelechins) but those with two (catechins) orthree (gallocatechins) hydroxyl groups in the B ring have beenrecorded; (b) the anthocyanins with one (pelargonidins) andtwo (delphinidins) hydroxyl groups in this ring are the mostabundant in artificially and naturally induced reddish fronds,respectively. In keeping with this, we note that the F3
′
H genesare expressed, with a couple of them (Azfi_s0112.g045767 andAzfi_s0472.g072931) that, after dropping at T2d, slightly increaseat T20d, and that the F3
′
H5′
H genes remain to be identified inthe A. filiculoides genome (Güngör et al., 2021).
Targeted Gene Expression AnalysisReveals a Different Timing Between Earlyand Late A. filiculoides Genes of thePhenylpropanoid Pathway in Response toEnvironmental StressThe targeted qRT-PCR analysis largely corroborates what hasbeen shown by the untargeted metabolomics carried out over the20 days of stress treatment. Except for PAL, all the other early
Frontiers in Plant Science | www.frontiersin.org 14 October 2021 | Volume 12 | Article 727667
Costarelli et al. Secondary Metabolites in Azolla filiculoides
gene families of the phenylpropanoid pathway tested (CHS, CHI,and C4H) clearly show an upregulation since the beginning ofthe treatment, and a bimodal patterns with general peaks at T1dand T3d followed by a decrease at T2d and T20d, when theirsteady-state levels were not statistically dissimilar to that of T0h.Of note, among these early gene families, the two C4H genestested show the highest steady-state mRNA levels at any stagetested. The upregulation of these genes likely serves to sustain theparallel biosynthesis of both closed- and open-chain flavonoids.The approach we pursued focused on assessing the expressionprofile of gene families profile rather than that of each single genemember. Therefore, we cannot rule out the hypothesis that singlemembers within each family might respond differently fromothers to a given treatment, as already shown, for instance, formembers of the CHS andDFR gene families in Lotus corniculatusplants challenged with different light regimes (Paolocci et al.,2005).
The analysis of the two DFR genes and the functionally testedLAR gene identified by Güngör et al. (2021) shows how late genesof the flavonoid pathway remain upregulated from T1d to T20dand suggest that early and late gene families of this route undergodifferent genetic and environmental control as it also occurs inhigher plants (Hichri et al., 2011; Petroni and Tonelli, 2011).The presence of the two DFR genes, namely Azfi_s0008.g011655and Azfi_s0008.g011657, with a similar expression pattern but asteady-state level lower than those already characterized promptsus to argue on the presence of at least two DFR gene families inthe Azolla genome, each with a specific pathway commitment.Very recently, de Vries et al. (2021) have also shown that thefour DFR proteins present in A. filiculoides cluster into twodifferent branches. Besides, they reported that these proteinsfrom Azolla, along with two from Salvinia cucullata, forma fern-specific DFR/DFR-like clade. DFR enzymes not onlyplay a critical role in the biosynthesis of leucoanthocyanidinsfrom dihydroflavonols and, hence, of anthocyanidins, flavan-3-ols, and PAs downstream, but they are also thought tobe involved in the reduction of the flavanones naringeninand eriodictiol into apiforol and luteoforol, respectively, whichare the building blocks of phlobaphenes (Liu et al., 2010).Therefore, this study paves the way for functional analysis totest whether DFR genes within and between these two genefamilies code for enzymes with different substrate specificity. Thehigh expression levels of LAR throughout the stress treatmentis consistent with the increment of both flavan-3-ols and PAsas testified by spectrophotometric, LC/HRMS analysis, andhistochemical staining. In fact, LAR reduces leucoanthocyanidinsinto the flavan-3-ol catechin (Tanner et al., 2003; Paolocciet al., 2007) and by converting 4β-(S-cysteinyl)-epicatechin (Cys-EC), an epicatechin-type extension unit for non-enzymatic PApolymerization, into an epicatechin starter unit, it plays a criticalrole in controlling the degree of PA polymerization (Liu et al.,2016; Yu et al., 2019).
Apart from the genes mentioned above, for which functionalannotation is well-supported by phylogenetic analysis as perprevious studies, the role of enzymes coded by the other genesinvestigated in this study remains to be elucidated. In thisconcern, whereas (Piatkowski et al., 2020) concluded that
fern genomes lack any orthologs of F3H, Güngör et al. (2021)identified the Azfi_s0335.g065519 and Azfi_s0076.g037942entries as two putative A. filiculoides F3H genes. Ourphylogenetic tree poses these two entries into two differentbranches of the 2OGD tree, and the gene-specific qRT-PCRdata show that Azfi_s0076.g037942 displays an expressionpattern resembling those of the DFR and LAR genes, andthat Azfi_s0335.g065519 is upregulated only at T20d. Overall,conclusive evidence on the presence and function of F3H genesin Azolla spp. cannot be drawn. However, the presence ofmetabolites derived from the activity of the enzymes coded bythese gene(s) and the expression pattern of Azfi_s0076.g037942,let us infer that a gene functioning as F3H is present in A.filiculoides, and that the gene is Azfi_s0076.g037942.
The present study’s findings open to future research of bothfundamental and pragmatic relevance. The evidence that Azollais competent to synthesize a vast array of phenylpropanoids,some of which occur with a limited and heterogeneousdistribution in the plant kingdom, set the stage for future high-throughput transcriptomics analyses to identify both structuraland regulatory genes controlling the different branches ofthe phenypropanoid pathway. The amenability to grow undercontrolled and stressful conditions and the fact that its genomehas been sequenced make A. filiculoides a model to gainevidence on the genetic control of secondary metabolites inlower plants and trace its evolution/conservation across plantspecies. From a pragmatic point of view, the high growthrate and the possibility to elicit, upon application of moderatestresses, the synthesis of metabolites central to human health andfood/beverage processing, such as dihydrochacones, stilbenes,isoflavones, deoxyanthocianins, phlobaphenes, and PAs, lay thegroundwork on which to build future studies aiming at assessingthe potential role of this fern as a sustainable source of beneficialmetabolites for humans.
DATA AVAILABILITY STATEMENT
The datasets presented in this study can be found in onlinerepositories. The names of the repository/repositoriesand accession number(s) can be found in thearticle/Supplementary Materials. The ITS sequence of theAzolla specimen analysed in this study is deposited in GenBankunder the accession number MW872256. All raw data from theLC/MS analyses supporting the conclusions of this article will bemade available by the authors, without undue reservation.
AUTHOR CONTRIBUTIONS
FP and SP conceived the research, drafted, and wrote themanuscript. RP, AC, and SC performed metabolic and statisticalanalyses. MC and LR carried out morphological analysis. FP andAC performed molecular analysis. AC and SC carried out theexperimental setup. FP, SP, and RP performed interpretation ofthe data. All the authors read and improved the manuscript.
Frontiers in Plant Science | www.frontiersin.org 15 October 2021 | Volume 12 | Article 727667
Costarelli et al. Secondary Metabolites in Azolla filiculoides
FUNDING
This study was supported by the national project MIUR–PRIN2017 (Grant No: 2017N5LBZK_004).
SUPPLEMENTARY MATERIAL
The Supplementary Material for this article can be foundonline at: https://www.frontiersin.org/articles/10.3389/fpls.2021.727667/full#supplementary-material
Supplementary Figure S1 | Maximum, minimum, and mean temperatures
recorded during the period October 2019–February 2020 provided by the
Hydrographic Service of the Regione Umbria (A). Data of global solar radiation,
measured as W/m2 and PPFD (µmoles m−2 s−1), provided by the ARPA
Umbria (http://www.arpa.umbria.it) (B).
Supplementary Figure S2 | Color of Azolla sampled in the botanical garden (A)
vs. that grown in the climatic chamber (C). Image of the upper lobes of Azolla
grown in the botanical garden (B).
Supplementary Figure S3 | Change in the color of Azolla fronds under (A) high
light and (B) shading conditions.
Supplementary Figure S4 | Alignment of nuclear ribosomal DNA (rDNA) internal
transcribed spacer (ITS) from Azolla spp. MW872256 (A. filiculoides collected from
BG-PG); A. filiculoides (JX297314); A. rubra (DQ066492); A. microphylla
(DQ066487); A. mexicana (DQ066477); A. caroliniana (DQ066473); A. pinnata
(DQ066490); A. nilotica (DQ066470).
Supplementary Figure S5 | Principal component analysis (PCA) score plot of the
146 polyphenols annotated from the six replicated samples for each growing
condition tested in the CC vs. BG comparison. Total quantitative variances were
clustered to reveal differences and relative similarities of different samples. 95%
confidence regions (Hotelling’s T2 eclipse) are displayed for each class.
Supplementary Figure S6 | Change in the color of Azolla fronds during the cold
stress treatment under controlled conditions; on days (A) 0, (B) 1, (C) 2, (D) 3,
and after (E) 20 days of treatment.
Supplementary Figure S7 | Neighbor-joining tree of dihydroflavonol 4-reductase
(DFR) proteins. The four DFR coding genes considered in this study are marked.
The tree was built using 1,000 bootstraps.
Supplementary Table S1 | Data annotation of metabolites.
Supplementary Table S2 | List of the genes investigated by qRT-PCR analysis
and sequence of the primers employed.
Supplementary Table S3 | Metabolic data relative to the CC and BG samples.
Supplementary Table S4 | Metabolic data of A. filiculoides in the time-course
experiment under controlled stress conditions.
Supplementary Table S5 | Phenylpropanoids present in the time-course
experiment but absent in the CC vs. BG comparison.
REFERENCES
Abeynayake, S. W., Panter, S., Mouradov, A., and Spangenberg, G. (2011). A high-resolution method for the localization of proanthocyanidins in plant tissues.Plant Meth. 7:13. doi: 10.1186/1746-4811-7-13
Agati, G., Brunetti, C., Fini, A., Gori, A., Guidi, L., Landi, M., et al. (2020). Areflavonoids effective antioxidants in plants? Twenty years of our investigation.Antioxidants 9:1098. doi: 10.3390/antiox9111098
Agati, G., and Tattini, M. (2010). Multiple functional roles offlavonoids in photoprotection. New Phytol. 186, 786–793.doi: 10.1111/j.1469-8137.2010.03269.x
Bennicelli, R., Stezpniewska, Z., Banach, A., Szajnocha, K., and Ostrowski, J.(2004). The ability of Azollacaroliniana to remove heavy metals (Hg(II),Cr(III), Cr(VI)) from municipal waste water. Chemosphere 55, 141–146.doi: 10.1016/j.chemosphere.2003.11.015
Bizzarri, M., Delledonne, M., Ferrarini, A., Tononi, P., Zago, E., Vittori, D., et al.(2020). Whole-transcriptome analysis unveils the synchronized activities ofgenes for fructans in developing tubers of the Jerusalem artichoke. Front. Plant.Sci. 11:101. doi: 10.3389/fpls.2020.00101
Blagojevic, D., Babic, O., Raseta, M., Sibul, F., Janjusevic, L., and Simeunovic,J. (2018). Antioxidant activity and phenolic profile in filamentouscyanobacteria: the impact of nitrogen. J. Appl. Phycol. 30, 2337–2346.doi: 10.1007/s10811-018-1476-4
Boerjan, W., Ralph, J., and Baucher, M. (2003). Lignin biosynthesis. Annu. Rev.Plant Biol. 54, 519–546. doi: 10.1146/annurev.arplant.54.031902.134938
Brouwer, P., Bräutigam, A., Buijs, V. A., Tazelaar, A. O. E., van der Werf,A., Schlüter, U., et al. (2017). Metabolic adaptation, a specialized leaf organstructure and vascular responses to diurnal N2 fixation by NostocAzollae
sustain the astonishing productivity of Azolla ferns without nitrogen fertilizer.Front. Plant. Sci. 8:442. doi: 10.3389/fpls.2017.00442
Brouwer, P., Bräutigam, A., Külahoglu, C., Tazelaar, A. O. E., Kurz, S., Nierop, K. G.J., et al. (2014).Azolla domestication towards a biobased economy?New Phytol.202, 1069–1082. doi: 10.1111/nph.12708
Brouwer, P., Schluepmann, H., Nierop, K. G. J., Elderson, J., Bijl, P. K., van derMeer, I., et al. (2018). Growing Azolla to produce sustainable protein feed:the effect of differing species and CO2 concentrations on biomass productivityand chemical composition. J. Sci. Food Agr. 98, 4759–4768. doi: 10.1002/jsfa.9016
Calvert, H. E., and Peters, G. A. (1981). The Azolla-Anabaena azollae relationship.IX. Morphological analysis of leaf cavity hair populations. New Phytol. 89,327–335. doi: 10.1111/j.1469-8137.1981.tb07493.x
Carrapico, F., Teixeira, G., and Diniz, M. A. (2000). Azolla as a biofertiliser inAfrica. A challenge for the future. Rev. Cienc. Agr. 23, 120–138.
Casas, M. I., Duarte, S., Doseff, A. I., and Grotewold, E. (2014). Flavone- richmaize:an opportunity to improve the nutritional value of an important commoditycrop. Front. Plant Sci. 5:440. doi: 10.3389/fpls.2014.00440
Cassani, E., Puglisi, D., Cantaluppi, E., Landoni, M., Giapponi, L., and Giorgi,A. (2017). Genetic studies regarding the control of seed pigmentation of anancient European pointed maize (Zea mays L.) rich in phlobaphenes: the “NeroSpinoso” from the Camonica valley. Genet. Resour. Crop Evol. 64, 761–773.doi: 10.1007/s10722-016-0399-7
Chopra, S., Gevens, A., Svabek, C., Wood, K. V., Peterson, T., and Nicholson,R. L. (2002). Excision of the Candystripe1 transposon from a hyper-mutableY1-cs allele shows that the sorghumY1 gene controls the biosynthesis of both3-deoxyanthocyanidin phytoalexins and phlobaphene pigments. Physiol. Mol.
Plant. 60, 321–330. doi: 10.1016/S0885-5765(02)90411-XCohen, M. F., Meziane, T., Tsuchiya, M., and Yamasaki, H. (2002b). Feeding
deterrence of Azolla in relation to deoxyanthocyanin and fatty acidcomposition. Aquat. Bot. 74, 181–187. doi: 10.1016/S0304-3770(02)00077-3
Cohen, M. F., Sakihama, Y., Takagi, Y. C., Ichiba, T., and Yamasaki, H. (2002a).Synergistic effect of deoxyanthocyanins from symbiotic fern Azolla spp. onhrmA gene induction in the cyanobacterium Nostocpunctiforme. Mol. PlantMicrobe Int. 15, 875–882. doi: 10.1094/MPMI.2002.15.9.875
Dai, L. P., Dong, X. J., and Ma, H. H. (2012). Molecular mechanism forcadmium-induced anthocyanin accumulation inAzollaimbricata.Chemosphere
87, 319–325. doi: 10.1016/j.chemosphere.2011.12.005Davies, K. M., Albert, N. W., Zhou, Y., and Schwinn, K. E. (2018). Functions of
flavonoid and betalain pigments in abiotic stress tolerance in plants.Ann. Plant.Rev. 1, 1–41. doi: 10.1002/9781119312994.apr0604
de Vries, S., de Vries, J., Teschke, H., von Dahlen, J. K., Rose, L. E., and Gould, S.B. (2018). Jasmonic and salicylic acid response in the fern Azollafiliculoides andits cyanobiont. Plant Cell. Env. 41, 2530–2548. doi: 10.1111/pce.13131
de Vries, S., Fürst-Jansen, J.M.R., Irisarri, I., Ashok, A.D., Ischebeck, T., Feussner,K., et al. (2021). The evolution of the phenylpropanoid pathway entailedpronounced radiations and divergences of enzyme families. Plant J. 107, 975–1002. doi: 10.1111/tpj.15387
Frontiers in Plant Science | www.frontiersin.org 16 October 2021 | Volume 12 | Article 727667
Costarelli et al. Secondary Metabolites in Azolla filiculoides
Dixon, R. A., and Paiva, N. L. (1995). Stress-induced phenylpropanoidmetabolism.Plant Cell 7, 1085–1097. doi: 10.2307/3870059
Dong, X., Braun, E. L., and Grotewold, E. (2001). Functional conservationof plant secondary metabolic enzymes revealed by complementation ofArabidopsis flavonoids mutants with maize genus. Plant Physiol. 127, 46–56.doi: 10.1104/pp.127.1.46
Doyle, J. J., and Doyle, J. L. (1987). A rapid DNA isolation procedure for smallquantities of fresh leaf tissue. Phytochem. Bull. 19, 11–15.
Dubrovina, A. S., and Kiselev, K. V. (2017). Regulation of stilbene biosynthesis inplants. Planta 246, 597–623. doi: 10.1007/s00425-017-2730-8
El Khawand, T., Courtois, A., Valls, J., Richard, T., and Krisa, S. (2018). A reviewof dietary stilbenes: sources and bioavailability. Phytochem. Rev. 17, 1007–1029.doi: 10.1007/s11101-018-9578-9
Escaray, F. J., Passeri, V., Perea-García, A., Antonelli, C. J., Damiani, F., and Ruiz,O. A. (2017). The R2R3-MYB TT2b and the bHLH TT8 genes are the majorregulators of proanthocyanidin biosynthesis in the leaves of Lotus species.Planta 246, 243–261. doi: 10.1007/s00425-017-2696-6
Fernández, H. (2018). Current Advances in Fern Research. Cham: Springer.Forni, C., Braglia, R., Harren, F. J. M., and Cristescu, S. M. (2012). Stress
responses of duckweed (Lemna minor L.) and water velvet (AzollafiliculoidesLam.) to anionic surfactant sodium-dodecyl-sulphate (SDS). Aquat. Toxicol.110–111, 107–113. doi: 10.1016/j.aquatox.2011.12.017
Gechev, T. S., Van Breusegem, F., Stone, J. M., Denev, I., and Laloi, C. (2006).Reactive oxygen species as signals that modulate plant stress responses andprogrammed cell death. Bioessays 28, 1091–1101. doi: 10.1002/bies.20493
Güngör, E., Brouwer, P., Dijkhuizen, L. W., Shaffar, D. C., Nierop, K. G. J., deVos, R. C. H., et al. (2021). Azolla ferns testify: seed plants and ferns share acommon ancestor for leucoanthocyanidin reductase enzymes.New Phytol. 229,1118–1132. doi: 10.1111/nph.16896
Gutmann, M. (1995). Improved staining procedures for photographicdocumentation of phenolic deposits in semithin sections of plant tissue.J. Microsc. 79, 277–281. doi: 10.1111/j.1365-2818.1995.tb03642.x
Haslam, E. (1988). Plant polyphenols (syn. vegetable tannins) and chemical defense- a reappraisal. J. Chem. Ecol. 14, 1789–1805. doi: 10.1007/BF01013477
Herendeen, P. S., Magallon-Puebla, S., Lupia, R., Crane, P. R., and Kobylinska, J.(1999). A Preliminary conspectus of the Allon flora from the late Cretaceous(late Santonian) of central Georgia, U.S.A. Ann. Mo. Bot. Gard. 86, 407–471.doi: 10.2307/2666182
Hernández, I., Alegre, L., Van Breusegem, F., and Munné-Bosch, S. (2009). Howrelevant are flavonoids as antioxidants in plants? Trends Plant Sci. 14, 125–132.doi: 10.1016/j.tplants.2008.12.003
Hichri, I., Barrieu, F., Bogs, J., Kappel, C., Delrot, S., and Lauvergeat, V. (2011).Recent advances in the transcriptional regulation of the flavonoid biosyntheticpathway. J. Exp. Bot. 62, 2465–2483. doi: 10.1093/jxb/erq442
Hipskin, J. D., Goldsbrough, P. B., Urmeev, F., and Nicholson, R. L. (1996).Synthesis of 3-deoxyanthocyanidin phytoalexins in sorghum does not occurvia the same pathway as 3-hydroxylated anthocyanidins and phlobaphenes.Maydica 41, 155–166.
Holst, R. W. (1977). Anthocyanins of Azolla. Am. Fern J. 67, 99–100.doi: 10.2307/1546678
Huang, H., Ullah, F., Zhou, D., Yi, M., Zhao, Y., and Terzaghi, W. B. (2019).Mechanisms of ROS regulation of plant development and stress responses.Front. Plant Sci. 10:800. doi: 10.3389/fpls.2019.00800
Hughes, N. M., Neufeld, H. S., and Burkey, K. O. (2005). Functional role ofanthocyanins in highlight winter leaves of the evergreen herb Galusureolata.New Phytol. 168, 575–587. doi: 10.1111/j.1469-8137.2005.01546.x
Ibdah, M., Martens, S., and Gang, D. R. (2018). Biosynthetic pathway andmetabolic engineering of plant dihydrochalcones. J. Agr. Food Chem. 66,2273–2280. doi: 10.1021/acs.jafc.7b04445
Ishikura, N. (1982). 3-Desoxyanthocyanin and other phenolics in the water fernAzolla. Bot. Mag. Tokyo 95, 303–308. doi: 10.1007/BF02488541
Iwashina, T., Kitajima, J., and Matsumoto, S. (2010). Luteolinidin 5- O -glucosidefrom Azolla as a stable taxonomic marker. B. Natl. Mus. Nature Sci. 36, 61–64.
Jiang, X., Liu, Y., Li, W., Zhao, L., Meng, F., Wang, Y., et al.(2013). Tissue-specific, development-dependent phenolic compoundsaccumulation profile and gene expression pattern in tea plant(Camellia sinensis). PLoS ONE. 8:e62315. doi: 10.1371/journal.pone.0062315
Kollah, B., Patra, A. K., and Mohanty, S. R. (2016). Aquatic microphyllaAzolla:a perspective paradigm for sustainable agriculture, environmentand global climate change. Env. Sci. Pollut. R 23, 4358–4369.doi: 10.1007/s11356-015-5857-9
Kosesakal, T. (2014). Effects of seasonal changes on pigment composition ofAzollafiliculoides Lam.Am. Fern J. 104, 58–66. doi: 10.1640/0002-8444-104.2.58
KríŽová, L., Dadáková, K., Kašparovská, J., and Kašparovský, T. (2019).Isoflavones.Molecules 24:1076. doi: 10.3390/molecules24061076
Landoni, M., Puglisi, D., Cassani, E., Borlini, G., Brunoldi, G., and Comaschi, C.(2020). Phlobaphenes modify pericarp thickness in maize and accumulation ofthe fumonisin mycotoxins. Sci. Rep. 10:1417. doi: 10.1038/s41598-020-58341-8
Li, F. W., Brouwer, P., Carretero-Paulet, L., Cheng, S., De Vries, J., Delaux, P. M.,et al. (2018). Fern genomes elucidate land plant evolution and cyanobacterialsymbioses. Nat. Plants 4, 460–472. doi: 10.1038/s41477-018-0188-8
Li, Y. G., Tanner, G., and Larkin, P. (1996). The DMACA-HCl protocol and the threshold proanthocyanidin contentfor bloat safety in forage legumes. J. Sci. Agric. 70, 89–101.doi: 10.1002/(SICI)1097-0010(199601)70:1<89::AID-JSFA470>3.0.CO;2-N
Liu, C., Wang, X., Shulaev, V., and Dixon, R. A. (2016). A role forleucoanthocyanidin reductase in the extension of proanthocyanidins. Nat.Plants 2:16182. doi: 10.1038/nplants.2016.182
Liu, H., Du, Y., Chu, H., Shih, C. H., Wong, Y. W., Wang, M., et al.(2010). Molecular dissection of the pathogen-inducible 3-deoxyanthocyanidinbiosynthesis pathway in sorghum. Plant Cell Physiol. 51, 1173–1185.doi: 10.1093/pcp/pcq080
Lumpkin, T. A., and Plucknett, D. L. (1980). Azolla: botany, physiology, and use asa green manure. Econ. Bot. 34, 111–153. doi: 10.1007/BF02858627
Markham, K. R. (1988). “Distribution of flavonoids in the lower plants and itsevolutionary significance,” in The Flavonoids: Advances in Research, ed J. B.Harborne (London: Chapman and Hall), 427–468.
Metzgar, J. S., Schneider, H., and Pryer, K. M. (2007). Phylogeny and divergencetime estimates for the fern genus Azolla (Salviniaceae). Int. J. Plant. Sci. 168,1045–1053. doi: 10.1086/519007
Mueller-Harvey, I., Bee, G., Dohme-Meier, F., Hoste, H., Karonen, M., Kölliker, R.,et al. (2019). Benefits of condensed tannins in forage legumes fed to ruminants:importance of structure, concentration, and diet composition. Crop Sci. 59,861–885. doi: 10.2135/cropsci2017.06.0369
Nham Tran, T. L., Miranda, A. F., WeerakoonAbeynayake, S., and Mouradov, A.(2020). Differential production of phenolics, lipids, carbohydrates and proteinsin stressed and unstressed aquatic plants, Azollafiliculoides and Azollapinnata.Biology 9:342. doi: 10.3390/biology9100342
Nierop, K. G. J., Speelman, E. N., de Leeuw, J. W., and Reichart, G. J.(2011). The omnipresent water fern Azollacaroliniana does not containlignin. Org. Geochem. 42, 846–850. doi: 10.1016/j.orggeochem.2011.05.001
Pang, Z., Chong, J., Zhou, G., Anderson de Lima Morais, D., Chang, L,Barrette, M., Gauthier, C., et al. (2021). MetaboAnalyst 5.0: narrowing the gapbetween raw spectra and functional insights. Nucl. Acids Res. 49, W388–W396.doi: 10.1093/nar/gkab382
Paolocci, F., Bovone, T., Tosti, N., Arcioni, S., and Damiani, F. (2005). Light andan exogenous transcription factor qualitatively and quantitatively affect thebiosynthetic pathway of condensed tannins in Lotus corniculatus leaves. J. Exp.Bot. 56, 1093–1103. doi: 10.1093/jxb/eri101
Paolocci, F., Robbins, M. P., Madeo, L., Arcioni, S., Martens, S., andDamiani, F. (2007). Ectopic expression of a basic helix-loop-helix genetransactivates parallel pathways of proanthocyanidin biosynthesis. Structure,expression analysis, and genetic control of leucoanthocyanidin 4-reductase
and anthocyanidin reductase genes in Lotus corniculatus. Plant Physiol. 143,504–516. doi: 10.1104/pp.106.090886
Pereira, A. L., and Carrapico, F. (2007). Histochemistry of simple hairsfrom the foliar cavities of Azollafiliculoides. Plant Biosyst. 141, 323–328.doi: 10.1080/11263500701627588
Perkins, S. K., Peters, G. A., Lumpkin, T. A., and Calvert, K. E. (1985).Scanning electron microscopy of perine architecture as a taxonomic tool in thegenusAzolla Lamarck. Scanning Microscopy 4, 1719–1734.
Peters, G. A., and Meeks, J. C. (1989). The Azolla-Anabaena symbiosis:basic biology. Annu. Rev. Plant Physiol. Plant Mol. Biol. 40, 193–210.doi: 10.1146/annurev.pp.40.060189.001205
Frontiers in Plant Science | www.frontiersin.org 17 October 2021 | Volume 12 | Article 727667
Costarelli et al. Secondary Metabolites in Azolla filiculoides
Petroni, K., and Tonelli, C. (2011). Recent advances on the regulation ofanthocyanin synthesis in reproductive organs. Plant Sci. 181, 219–229.doi: 10.1016/j.plantsci.2011.05.009
Petrussa, E., Braidot, E., Zancani, M., Peresson, C., Bertolini, A., Patui, S.,et al. (2013). Plant flavonoids-biosynthesis, transport and involvement instress responses. Int. J. Mol. Sci. 14, 14950–14973. doi: 10.3390/ijms140714950
Piatkowski, B. T., Imwattana, K., Tripp, E. A., Weston, D. J., Healey,A., Schmutz, J., et al. (2020). Phylogenomics reveals convergentevolution of red-violet coloration in land plants and the origins ofthe anthocyanin biosynthetic pathway. Mol. Phylogenet. Evol. 151:106904. doi: 10.1016/j.ympev.2020.106904
Pieterse, A. H., de Lange, L., and van Vliet, J. P. (1977). A comparativestudy of Azolla in the Netherlands. Acta Bot. Neerl. 26, 433–449.doi: 10.1111/j.1438-8677.1977.tb01137.x
Qian, W., Wu, W., Kang, Y., Wang, Y., Yang, P., Deng, Y., et al. (2020).Comprehensive identification of minor components and bioassay-guidedisolation of an unusual antioxidant from Azollaimbricata using ultra-highperformance liquid chromatography-quadrupole time-of-flight massspectrometry combined with multicomponent knockout and bioactivityevaluation. J. Chromatogr. A. 1609:460435. doi: 10.1016/j.chroma.2019.460435
Ran, L., Larsson, J., Vigil-Stenman, T., Nylander, J. A. A., Ininbergs, K.,Zheng, W. W., et al. (2010). Genome erosion in a nitrogen-fixing verticallytransmitted endosymbiotic multicellular cyanobacterium. PLoS ONE. 5:e11486.doi: 10.1371/journal.pone.0011486
Reale, L., Rosati, A., Tedeschini, E., Ferri, V., Cerri, M., Ghitarrini, S., et al. (2017).Ovary size in wheat (Triticumaestivum L.) is related to cell number. Crop Sci.57, 914–925. doi: 10.2135/cropsci2016.06.0511
Rivière, C. (2016). “Dihydrochalcones: occurrence in the plant kingdom, chemistryand biological activities,” in Studies in Natural Products Chemistry, ed F. R. S.Atta-urRahman (Karachi: Elsevier), 253–381.
Sánchez-Viveros, G., Ferrera-Cerrato, R., and Alarcón, A. (2011). Short-term effects of arsenate-induced toxicity on growth, chlorophyll andcarotenoid contents, and total content of phenolic compounds of Azolla
filiculoides. Water Air Soil Poll. 217, 455–462. doi: 10.1007/s11270-010-0600-0
Sánchez-Viveros, G., González-Mendoza, D., Alarcón, A., and Ferrera-Cerrato, R.(2010). Copper effects on photosynthetic activity and membrane leakage ofAzolla filiculoides and A. caroliniana. Int. J. Agr. Biol. 12, 365–368.
Tanner, G. J., Francki, K. T., Abrahams, S., Watson, J. M., Larkin, P. J., andAshton, A. R. (2003). Proanthocyanidin biosynthesis in plants: purification oflegume leucoanthocyanidin reductase and molecular cloning of its cDNA. J.Biol. Chem. 278, 31647–31656. doi: 10.1074/jbc.M302783200
Tsugawa, H., Cajka, T., Kind, T., Ma, Y., Higgins, B., Ikeda, K., et al.(2015). MS-DIAL: data-independentMS/MS deconvolution for comprehensivemetabolome analysis. Nat. Methods 12, 523–526. doi: 10.1038/nmeth.3393
Wagner, G. M. (1997). Azolla: a review of its biology and utilization. Bot. Rev. 63,1–26. doi: 10.1007/BF02857915
Watanabe, I., Roger, P. A., Ladha, J. K., and Van Hove, C. (1992). BiofertilizerGermplasm Collection at IRRI. Manila: IRRI.
Wharton, P. S., and Nicholson, R. L. (2000). Temporal synthesis andradiolabelling of the sorghum 3-deoxyanthocyanidin phytoalexins and theanthocyanin, cyanidin 3-dimalonyl glucoside. New Phytol. 145, 457–469.doi: 10.1046/j.1469-8137.2000.00600.x
Yu, K., Jun, J. H., Duan, C., and Dixon, R. A. (2019). VvLAR1 and VvLAR2 arebifunctional enzymes for proanthocyanidin biosynthesis in grapevine. PlantPhysiol. 180, 1362–1374. doi: 10.1104/pp.19.00447
Zimmerman, W. J., Lumpkin, T. A., and Watanabe, I. (1989). Isozymedifferentiation of Azolla Lam. Euphytica 42, 163–170. doi: 10.1007/BF00042628
Conflict of Interest: The authors declare that the research was conducted in theabsence of any commercial or financial relationships that could be construed as apotential conflict of interest.
Publisher’s Note: All claims expressed in this article are solely those of the authors
and do not necessarily represent those of their affiliated organizations, or those of
the publisher, the editors and the reviewers. Any product that may be evaluated in
this article, or claim that may be made by its manufacturer, is not guaranteed or
endorsed by the publisher.
Copyright © 2021 Costarelli, Cannavò, Cerri, Pellegrino, Reale, Paolocci and
Pasqualini. This is an open-access article distributed under the terms of the Creative
Commons Attribution License (CC BY). The use, distribution or reproduction in
other forums is permitted, provided the original author(s) and the copyright owner(s)
are credited and that the original publication in this journal is cited, in accordance
with accepted academic practice. No use, distribution or reproduction is permitted
which does not comply with these terms.
Frontiers in Plant Science | www.frontiersin.org 18 October 2021 | Volume 12 | Article 727667


