Embed Size (px)
Citation preview

Give to AgEcon Search
The World’s Largest Open Access Agricultural & Applied Economics Digital Library
This document is discoverable and free to researchers across the globe due to the work of AgEcon Search.
Help ensure our sustainability.
AgEcon Search http://ageconsearch.umn.edu
Papers downloaded from AgEcon Search may be used for non-commercial purposes and personal study only. No other use, including posting to another Internet site, is permitted without permission from the copyright owner (not AgEcon Search), or as allowed under the provisions of Fair Use, U.S. Copyright Act, Title 17 U.S.C.

Agricultural Economics Research Review 2021, 34 (1), 51-67DOI: 10.5958/0974-0279.2021.00004.5
Sustainable food security index: planning tool for district-levelagricultural development in Uttar Pradesh
Priyanka Singh1*, Mini Goyal, Bishwa Bhaskar Choudhary2*, and Amit GuleriaDepartment of Economics and Sociology, PAU Ludhiana-141004
1ICAR-Central Agroforestry Research Institute, Jhansi 284 003, Uttar Pradesh2ICAR-Indian Grassland and Fodder Research Institute, Jhansi 284 003, Uttar Pradesh
*Corresponding author: [email protected], [email protected]
Abstract This paper assesses the districts in Uttar Pradesh on the relative sustainability of their foodsecurity. It uses the indexing approach and principal component analysis to assign weights to eachdimension of food security and construct a sustainable food security index. The food security of thestate’s eastern districts (Ballia, Deoria, Mau) and western districts (Saharanpur, Baghpat, Meerut) issustainable, but many districts rank along the moderate range of the index. To ensure that food security issustainable, improving the access to food and the capacity for utilization is more important than ensuringthe availability of food.
Keywords Sustainability of food security, sustainable food security index (SFSI), Uttar Pradesh, principalcomponent analysis (PCA), food access
JEL codes Q18, Q56, R58
India produces enough food for its population, andeconomic growth has been impressive, but 14.5% ofthe world’s hungry and malnourished live here (FAO2019). India ranked 103 out of 119 qualifying nationson the Global Hunger Index, 2018; its report found theseverity of food insecurity the country ‘serious’(Grebmer et al. 2018). The status of food security varieswidely by state in national-level studies; it was highestin Punjab, Himachal Pradesh, and Kerala and lowestin Bihar, Uttar Pradesh, Madhya Pradesh, and Odisha(Vepa et al. 2003; Menon et al. 2008).
Several studies assess food security at the national level(Kumar and Ayappan 2014; Pandey 2015) and at theregional level (Sahu et al. 2017; Kumar et al. 2020),but these largely ignore the sustainability aspect. Butsustainability is crucial for ensuring long-term foodsecurity; if it is not explicitly integrated as a dimensionof food security, today’s policies and programmes could
become the very cause of heightened food insecurityin the future (Berry et al. 2015).
Indian agricultural development policy has centred onfood security since the mid-1960s. To feed the growingpopulation, food is being produced at the cost of criticalnatural resources—as evidenced by the degradation ofsoil, lowering of water tables, clearing of forests(Pimentel et al. 1997; Richardson 2010)—and posinga threat for food security in the future. Planning in Indiais centralized, and planners design programmes froma national, or state-level, perspective, but foodinsecurity is a regional phenomenon; to design foodpolicy that makes production sustainable, planners needto consider regional factors.
This paper constructs a district-wise sustainable foodsecurity index (SFSI) of Uttar Pradesh for the year2015-–16. We chose the state for the study area becauseit has many food-insecure households despite havingthe largest area and production share of food crops inNote This paper is based on the PhD thesis of the first author.

52 Singh P, Goyal M, Choudhary B B, Guleria A
the country. The index characterizes the districts bythe relative sustainability of their food security; it alsoidentifies the dimensions that will help policymakersorient development programmes towards ensuring foodsecurity for future generations.
Material and methodsThe major approaches used in the previous studies toassess the sustainability of a system in a particularregion include the computation of composite indicescovering varied dimensions of sustainability (Chandand Sirohi 2012) and Response-Inducing SustainabilityEvaluation (RISE) (Hani et al. 2003). Both thetechniques have their own utility, but we follow theindex-based approach, because it is more practical, andit indicates the set of interventions required to addressthe problem areas that impede sustainability. FollowingVepa et al. (2004), we conceptualize SFSI as a functionof sustainable food availability, sustainable food access,and food utilization.
Selection of indicators
Since the choice of indicators is subjective, we reliedon theoretical insights drawn from the literature inselecting indicators to minimize the subjectivity. In all,29 indicators were taken (Table 1).
Sustainable food availability is built on 13 indicatorsof the agricultural production system. Croppingintensity, food grain production per capita, irrigationintensity, fertilizer consumption, and milk productivitydo not call for inclusion in that dimension. Change inthe net sown area is directly related with productionoutcome and included in the dimension of present foodavailability. In an agriculture-based economy like India,the population poses a threat to the natural resources,sustainable development of agriculture, and the forestryand livestock sectors; therefore, we hypothesize thatpopulation density will inversely affect foodavailability.
Forests sustain and improve the productivity of land.We considered the per capita measurement of forestarea in the dimension of future sustainability becauseit is an ideal indicator of demographic anddevelopmental pressure on forest land. The availabilityof food is considered more sustainable in districts wherethe unexploited reserve of groundwater is greater, andthe food security is considered greater in these districts
for the future. Degraded land consists of barren andun-culturable land and culturable wasteland; therefore,a higher proportion of degraded area to geographicalarea would negatively influence the sustainability offood production. Legume crops deliver multipleservices in line with the principles of sustainableagriculture and have a high potential for conservationagriculture; therefore, the sustainability and securityof food is likely to be higher in districts that have alarger area under legumes. Temperatures and rainfallvariability are rising in most tropical regions, andstudies indicate that agricultural production is likelyto fall (Choudhary and Sirohi 2020). Therefore, weincorporated the rate of change in annual meantemperature, and the coefficient of variation of themonthly mean rainfall—for the period between 1980and 2009—to indicate if the availability of food issustainable.
Access to food is sustainable if everyone has access tofood that is sufficient to sustain a healthy, productivelife and where the food originates from efficient,effective, low-cost food systems compatible with thesustainable use of natural resources. If people haveaccess to a means of livelihood, they would in generalhave access to food. Therefore, we included the factorsof present access of food and livelihood in thedimension of present security of access to food.
Those without access to productive livelihoods are thepopulations of non-workers, small and marginalfarmers, and those below the poverty line. The largerpopulation of non-workers and the number of the poor,the lower would be their access to food and highertheir food insecurity. Income from non-farm sourcesis critical to bridge the inequality gap (Choudhary andSingh 2019). A higher proportion of non-agriculturalworkers to total workers, therefore, was hypothesizedto have a positive effect on food access. The crucialrole of dairying in alleviating poverty in rural areas iswell established (Saxena et al. 2017, 2019); therefore,the number and proportion of productive dairy breeds(crossbred and buffaloes) would have positiveinfluence on food and livelihood access.
The indicators of the sustainability of food accessattempt to capture the natural endowments that impactlong-term livelihood access, on the one hand, and thepressure of human population and livestock on land—which also reduces the access to livelihoods—on the

Sustainable food security index 53
Table 1 Indicators and their functional relationship with sustainable food security
Component Sub Indicators Unit Relation Data sourcecomponent with (Year)
sustainablefood
security
Sustainable Food Cropping intensity % Positive Directorate of Economicsfood availability Change in net sown area$ % Positive and Statistics, (2014-15)availability security Change in net sown area$ % Positive Governmentof India (GoI)
Food grain production per capita kgs/person/year PositiveIrrigation Intensity % PositiveFertilizer consumption (NPK) Tonnes/ha Positive Fertilizer Association
of India (2014-15)Population density Person/km2 Negative Census of India (2011)Milk Productivity MT/milch Positive NDDB (2014-15)
animal*/yearFood Per capita forest cover Hectare (ha) Positive Directorate of Economicsavailability Degraded area to geographical area % Negative and Statistics (GoI)sustenance Leguminous crops in gross cropped area % Positive (2014-15)
Unexploited ground water for future Hectare Positive Ministry of Water Resources,metre (ham) River Development &
Ganga Rejuvenation,GoI (2014)
Rate of change in annual mean 0C / year Negative India Meteorologicaltemperature Department (IMD),Coefficient of variation of monthly % Negative Pune# (1980-2009)mean rainfall
Sustainable Food access Below poverty line population % Negative Statistical abstract offood access security Uttar Pradesh (2014-15)
Non agricultural workers to total workers % Positive Census of India (2011)Non worker population % NegativeNumber of milch animals per 000’ population No. Positive 19th livestock census,Cross bred adoption rate % Positive Department of AnimalBuffalo : Indigenous Cattle ratio % Positive Husbandry and Dairying,
GoI (2012)Small and marginal farmers per 000’ No. Negative Agricultural Census,population GoI (2014-15)
Food access Average size of holding Hectare (ha) Positivesustenance Livestock density No./km2 Negative 19th livestock census,
Department of AnimalHusbandry and Dairying,
GoI (2012)Non crop agricultural workers % Positive Economic Census of
the state (2014)Landless labour households to total households % Positive Socioeconomic &
Caste census, GoI (2011)Instability in cereal production§ % Negative Directorate of Economics
and Statistics,(GoI)(2014-15)
Food Food Safe drinking water % Positive Census of India (2011)utilization utilization Infant Mortality Rate % Negative
security Health infrastructure No. PositiveFemale literacy rate % Positive
Note $ Change represents period of 10 years; # High spatial resolution daily gridded temperature (0.5°X0.5°) and rainfall (0.25°X0.25°) datawere sourced from IMD, Pune (India) for the period 1980-2009; *Milch animals consist of indigenous cows, cross bred cows and buffaloes.§Following Sihmar (2014), Instability in cereal production has been measured by Cuddy Della Valle Index (CDVI) for a period of 10 years.
where, CV is coefficient of variation and is adjusted coefficient of determination.

54 Singh P, Goyal M, Choudhary B B, Guleria A
other. As the population grows, small landholdingscannot provide an adequate livelihood without furtherintensive depletion of the natural resources and landfertility. Therefore, larger the size of the holding, higherthe sustainability of access to food and livelihood.
Higher livestock density indicates higher pressure onland for feed, fodder, and grazing. A higher percentageof non-crop agricultural workers and landless labourhouseholds to total households indicates diversificationtowards allied activities and, therefore, reduces thepressure on land and natural resources. Instability incereal production leads to frequent loss of livelihoodsduring periods of crop failure, and it is considered asan indicator of the sustainability of food access.
Food utilization (absorption) primarily depends uponthe state of health and education of the individual, safewater supply, environmental sanitation, and hygiene.Therefore, districts with higher female literacy rate,better access to safe drinking water, significant healthinfrastructural development and low infant mortalityrate are hypothesized to be in much better condition inthe context of absorption of food.
Normalization of indicators
We used a variety of units and scales to measure theindicators. It was necessary to convert them intostandard units through normalization to avoid scalebias. The literature suggests methods like ranking,standardization, and min-max; each has merits anddemerits, though the choice is not a value-free decision.We use the min-max technique, following the approachof the Human Development Index (HDI) (UNDP1990).
…(1) when indicator has a
positive association with the component
…(2) when indicator has a
negative association with the component
where,
Xijk = value of ith indicator representing jth componentof SFSI of kth district.
Assigning weights to indicators and construction ofSFSI
The PCA is considered in the literature to be the mostreliable method for assigning weights to indicators(Solaroli 2015; Choudhary 2017). We consider the useof multi-dimensional data and assign weights byperforming PCA under the following functional form.
Xt = Λt Ft + et …(3)
where, Xt is the N dimensional vector of variables;
Λt is r x 1 common factor; Ft is the factor loading and
et is the associated idiosyncratic error-term of order Nx 1.
Then weights from PCA were calculated as:
Wi = Σ | Lij | Ej …(4)
where, Wi represents the weight of the variable,
Ej indicates the Eigen value of the factor, and
Lij is the loading value of the variable on factor.
We used this procedure to develop an index of eachcomponent of sustainable food security: foodavailability security index (FAI), food availabilitysustainability index (FSI), food access security index(FASI), food access sustainability index (FASUI), andfood utilization index (FUI). We computed thecomposite sustainable food availability index (SFAI)and sustainable food access index (SFAcI) as theweighted mean of their respective components:
SFAI = FAI*0.55 + FSI*0.45 …(5)
SFAcI = FASI*0.60 + FASUI*0.40 …(6)
where we assigned the weights (0.55, 0.45, 0.60, 0.40)depending on their share in total indicators consideredfor the respective composite index (Vepa 2004).
Finally, the SFSI for each district (k) was calculated asweighted mean of the three indices.
…(7)
where Wi is the weights apportioned to respectivecomponents of SFSI, since SFSI is composite in natureand the relative magnitude of its components variesacross regions. Wi is calculated as the ratio of inverse

Sustainable food security index 55
of the proportional contribution of SFAI, SFAcI, andFUI to the sum of all the three inverse proportions forthe three components for each region and for eachcomponent across the regions (Chand and Sirohi 2012).Thus, it gives more weight to weaker components in aregion, rather than equal weights. A higher value ofthe SFSI indicates higher security and sustainabilityof a region.
Results and discussionThe discussion on the indices of the components ofsustainable food security precedes the results ofsustainable food security index of the study area, whichhas been delineated into four economic regions(Appendix Table A1).
Index of food availability security (FAI)
The first principal component explained around 90%variation in the state (Appendix Table A2). Table 2shows the weights obtained from the PCA of theindicators of the security of food availability. Theweights show that the most important contributors tothe security of food availability were irrigation intensityand population density. Food availability was securein most of the districts in the western region—likeKasganj, Sambhal, etc.—but it was low to medium inthe Bundelkhand (Chitrakoot, Hamirpur, etc.), central(Kanpur Nagar), and eastern (Sonbhadra, Varanasi etc.)regions (Map 1 a). The lowest percentage of netirrigated area to the net sown area in Sonbhadra (29%)and Chitrakoot (43%) pushed these districts to thebottom in food availability security status.
Table 2 Weights for the indicators of SFSI
Component Indicators Weight
Food availability security Cropping intensity (%) 0.3222Change in net sown area (%) 0.2790Food grain per capita (kgs/person/year) 0.2765Irrigation intensity (%) 0.5854Fertilizer consumption (tonnes/ha) 0.2403Population density (person/Km2) 0.5677Milk productivity (MT/milch animal/year) 0.1388
Food availability sustenance Per capita forest cover (ha) 0.0479Unexploited ground water for future (ham) 0.1610Degraded area to geographical area (%) 0.5519Leguminous crop in gross cropped area (%) 0.0979Rate of change in annual mean temperature (°C/year) 0.6754Coefficient of variation of monthly mean rainfall (%) 0.4488
Food access security Below poverty line population (%) 0.4978Non agricultural workers to total workers (%) 0.3054Number of milch animal per 000' population (No.) 0.3107Cross bred adoption rate (%) 0.2828Small & marginal farmers per 000' population (No.) 0.5888Non worker population (%) 0.3282Buffalo to Indigenous cattle ratio (%) 0.1676
Food access sustenance Avg. size of holding (ha) 0.3017Livestock density (No./km2) 0.5874Non crop agricultural workers (%) 0.1841Landless labour household to total households (%) 0.4242Instability in cereal production (%) 0.5917
Food utilization Safe drinking water (%) 0.6108Infant Mortality Rate (%) 0.4879Health infrastructure (No.) 0.3649Female literacy rate (%) 0.5056

56 Singh P, Goyal M, Choudhary B B, Guleria A
Index of food availability sustainability (FSI)
The FSI ranged from 0.413 in Hamirpur to 0.823 inChandauli. The first principal component explainedaround 90% variation; and the weights obtained foreach indicator from PCA is given in Table 2. The rateof change in annual mean temperature gained primeimportance in influencing sustainability of foodavailability. Other factors of high influence wereproportion of degraded area to geographical area andcoefficient of variation of monthly mean rainfall.Interestingly, the climatic parameters, the considerationof which has been completely neglected in earlierliteratures in constructing index at national (Vepa etal. 2004) and regional level (Nasir et al. 2014), gainedimportance in influencing the sustainability of foodavailability in the present study area.
Map 1 b shows that the districts in the eastern regionranked higher on the FSI, and most districts in thewestern region lay along the moderate range of theindex. The districts which ranked lower on thesustainability of food availability were in the
Bundelkhand region (Hamirpur, Jhansi, etc.), centralregion (Kanpur Nagar, Rae Bareli, etc.), and westernregion (Baghpat, Etawah, Auraiya), because degradedland makes up a large percentage of the geographicalarea, and because of their coefficient of variation ofmean monthly rainfall. The rate of change in annualmean temperature was highest in Hamirpur, and itranked lowest on the sustainability of food availability.
Sustainable food availability index (SFAI)
The district-wise index value, along with their ranking,is given in Appendix Table A3. Almost all the districtslying in the Bundelkhand region, and a few districts inthe central region (Kanpur Nagar, Lucknow, etc.) andin the eastern region (Sonbhadra, Mirzapur, Allahabad,Varanasi), ranked low on the SFAI. The sustainabilityof food availability and of food security was low inthe districts of Baghpat and Ghaziabad (in the westernregion), and these districts ranked low on the SFAI. Afew districts in the north-west (Pilibhit, Rampur,Bareilly) and north-east (Maharajganj, Deoria,Kushinagar) ranked high on the SFAI (Map 1c).
Map 1 District wise food availability map
(a) Food availability security (b) Food availability sustenance
(c) Sustainable food availability

Sustainable food security index 57
Index of food access security (FASI)
The weights obtained by the PCA revealed that thenumber of small and marginal farmers is the mostimportant indicator of food access security in UttarPradesh (Table 2). The other indicators are the below-poverty-line population, percentage of non-workerpopulation, and the number of milch animals. Mostdistricts in the central and eastern regions, and a fewin the west (Shahjahanpur, Mainpuri, Budaun, Pilibhit,Etawah) ranked low on the FASI (Map 2a) because oftheir large below-the-poverty-line population and non-working population and small number of milchanimals. The districts in the Bundelkhand region rankedalong the moderate range (0.4113–0.5456) of the FASI,as did some of the districts in the east (Sonbhadra,Varanasi, Allahabad, Gorakhpur, Deoria) and in thewest (Bijnor, Etah, Moradabad, Sambhal, Bareilly).
Index of food access sustainability (FASUI)
The first principal component explained about 88%variation in the state; and the weights obtained for each
indicator from the PCA are given in Table 2. The resultsrevealed that livestock density, percentage of landlesslabour households, and instability in cereal productionwere the top three indicators of the sustainability offood access. The districts in the north (Pilibhit, Kheri,etc.) and north-west (Saharanpur, Bijnor, etc.) rankedrelatively high on the FASUI, and many central andeastern districts ranked along the moderate range(0.5056–0.6005). About 28% of the districts, thoughsparsely populated, ranked towards the bottom of theFASUI (Map 2b).
Sustainable food access index (SFAcI)
The district-wise value of the SFAcI, and thecorresponding ranking, is given in Appendix Table 4.Most central and eastern districts that ranked relativelylow on the FASI also ranked low on the SFAcI, butsome western districts (Muzaffarnagar, Saharanpur,etc.) ranked higher on the SFAcI. All the other districtsin the Bundelkhand (Lalitpur, Jhansi, etc.) and in theeast (Sonbhadra, Ballia, etc.) lay along the moderaterange (Map 2 c).
Map 2 District wise food access map
(a) Food access security (b) Food access sustenance
(c) Sustainable food access

58 Singh P, Goyal M, Choudhary B B, Guleria A
Table 3 Number of districts in different sustainable food security class in U.P.
Region Total districts Sustainable food security classHigh Moderate Low
Uttar Pradesh 75 23(31) 46(61) 6(8)
Note Figures in parentheses are per cent of districts in different sustainable food security class
Map 3 District wise food utilization map
Food utilization index (FUI)
Around 91% of the variation was explained by the firstprincipal component (Appendix Table A2), and weightsby PCA revealed that access to safe drinking waterwas the most important indicator. The other importantindicators were female literacy rate and infant mortalityrate (Table 2). The availability of health infrastructuregot the lowest weight.
The northern and north-eastern districts ranked mediumto low on the FUI, and a few southern districts (Lalitpur,Mahoba, Chitrakoot and Kaushambi) ranked along thebottom (Map 3). Good access of safe drinking waterin the eastern districts (Ballia, Azamgarh etc.) and fewdistricts in the western part (Agra, Etawah, etc.) of thestate were the prime reason behind their higher indexvalue of food utilization.
Sustainable food security index (SFSI)
The district wise index values along with their rankingare given in Appendix Table 5. Districts lying inextreme Western (Saharanpur, Baghpat etc.) andEastern (Ballia, Deoria etc.) parts of the state werehighly sustainable in terms of overall food securitywhile a large number of districts (61%) fell into themoderate range of SFSI (Map 4). Only 8% of thedistricts ranked at the bottom (Table 3).
Map 4 District wise sustainable food security map
The rank correlation coefficient among the SFSI andits components was calculated (Table 4) and analysedto understand the relative importance of thecomponents of the sustainability of food security. Allthe three components were positively related with thesustainable food security as per a priori expectations.The correlation between sustainable food availabilityand food utilization is significant and negative; and itshows that the districts where physical availability tofood is better rank lower on food utilization. Thecorrelation with sustainable food security was highestfor food utilization (r = 0.615) and food access (r =0.372), indicating that utilization and access are moredetrimental for the sustainability of food security statusin the districts of Uttar Pradesh.
Table 5 shows that the districts where the sustainabilityof food security is low (Kaushambi, Bahraich, andShravasti) rank low on the relative status of sustainablefood access, and food utilization. These findingsconfirm the expectations based on the findings of Table4. The access to food is moderate in a few districts(Maharajganj, Sant Ravidas Nagar and Balrampur)where utilization is very poor; the sustainability of theirfood security is low. The sustainability of foodavailability is high in Maharajganj district, but the

Sustainable food security index 59
Table 4 Rank correlation coefficient among sustainable food security and its components across the study region
Sustainable Sustainable Food Sustainablefood food utilization food
availability access security
Sustainable food availability 1.000Sustainable food access -0.087 1.000
(0.272)Food utilization -0.153** 0.076 1.000
(0.052) (0.337)Sustainable food security 0.041 0.372* 0.615* 1.000
(0.602) (0.000) (0.000)
*Significant @ 1%, **Significant @ 5 %, *** Significant @ 10 %Note Figures in parentheses indicates p value
Table 5 Relative status of components of sustainable food security in low sustainable food secure districts
Study area Sustainable food Districts Sustainable food Sustainable food Food utilizationsecurity level availability level access level level
Uttar Pradesh Low Maharajganj High Moderate LowSant Ravidas Nagar Low Moderate LowKaushambi Low Low LowBalrampur Moderate Moderate LowBahraich Moderate Low LowShravasti Moderate Low Low
sustainability of its food security is low. Therefore,policymakers should seek to improve the sustainabilityof food security in districts where access and utilizationare low or poor.
ConclusionsThe district-wise assessment of sustainable foodsecurity status of the state brought out that bringingmore area under irrigation in the Bundelkhand regionand in the Sonbhadra district of Eastern region isparticularly important for improving the presentsecurity of food availability. As these regions aredrought-prone (Gupta et al. 2014), investment to createon-farm structures for harvesting, storage anddistribution of rainwater would be more policyimperative. The climatic variations and degraded landin the state are looming threats for the sustainability offood availability, especially in Bundelkhand, where thevariability in climatic parameters is higher than in otherparts of the state. Policymakers must develop regionalclimate change adaptation and resilience enhancement
strategies, including a strict land use strategy andefficient watershed management practices.
Food access security in the eastern and central regionsmay be improved by reducing the rural poverty ratioand improving the milch herd population; policymeasures are needed to create more off-farmemployment opportunities and promotion of sex sementechnology.
Besides, in the regions where food utilization is low,all stakeholders should enact measures to improvefemale literacy rate and access of safe drinking waterfor ensuring overall sustainable food security of thestudy regions.
The study establishes that improving food access andutilization capacity is more important than foodavailability in ensuring the sustainability of foodsecurity, and its findings will help decision-makers atall levels in targeting the districts where appropriatemeasures are to be taken up for strengthening the foodaccess and utilization.

60 Singh P, Goyal M, Choudhary B B, Guleria A
ReferencesBerry, E M, S Dernini, B Burlingame, A Meybeck, and P
Conforti. 2015. Food security and sustainability: Canone exist without the other? Public Health Nutrition18 (13): 2293–2302. https://dx.doi.org/10.1017/S136898001500021X
Chand, P and S Sirohi. 2012. District level sustainablelivestock production index: tool for livestockdevelopment planning in Rajasthan. Indian Journal ofAgricultural Economics 67 (2): 199–212. https://ageconsearch.umn.edu/record/204806/files/02-Prem%20Chand.pdf
Choudhary, B B and S Sirohi. 2020. Modelling climatesensitivity of agriculture in trans- and upper Gangeticplains of India. Theoretical and Applied Climatology142 (1/2): 381–391. https://doi.org/10.1007/s00704-020-03297-y
Choudhary, B B. 2017. Climate sensitivity of agriculturein trans- and upper Gangetic plains of India: potentialeconomic impact and vulnerability. PhD thesis, ICAR-National Dairy Research Institute, Karnal, Haryana(published).
Choudhary, B B and P Singh. 2019. How unequal is ruralPunjab? empirical evidence from spatial incomedistribution. Current Science 117 (11): 1855–1862.h t t p s : / / d o i . o r g / 1 0 . 1 8 5 2 0 /cs%2Fv117%2Fi11%2F1855-1862
Food and Agriculture Organization (FAO). 2019. 2019, thestate of food security and nutrition in the world:safeguarding against economic slowdowns anddownturns. United Nations, Rome. https://www.fao.org/3/ca5162en/ca5162en.pdf
Government of Uttar Pradesh, Department of LandDevelopment and Water Resources. 2009. Integratedwatershed management programme (IWMP) in UttarPradesh: perspective and strategic plan 2009–2027.h t t p s : / / d o l r . g o v . i n / s i t e s / d e f a u l t / f i l e s /SPSP_Uttar%20Pradesh.pdf
Grebmer, K V, J Bernstein, L Hammond, F Patterson, ASonntag, L Klaus, J Fahlbusch, O Towey, C Foley, SGitter, K Ekstrom, and H Fritschel. 2018. 2018 GlobalHunger Index: forced migration and hunger. Bonn andDublin: Welthungerhilfe and Concern Worldwide.https://www.globalhungerindex.org/pdf/en/2018.pdf
Gupta, A K, S S Nair, O Ghosh, A Singh, and S Dey. 2014.Bundelkhand drought: a retrospective analysis and wayahead. National Institute of Disaster Management,New Delhi. https://nidm.gov.in/PDF/pubs/Bundelkhand%20Drought%202014.pdf
Häni, F, F Braga, A Stämpfli, T Keller, M Fischer, and HPorsche. 2003. RISE, a tool for holistic sustainabilityassessment at the farm level. International Food andAgribusiness Management Review 6 (4): 78–90. https://www.ifama.org/resources/Documents/v6i4/Hani-Braga-Stampfhi-Keller-Fischer-Porsche.pdf
Kumar, A and S Ayappan. 2014. Food security and publicdistribution system in India. Agricultural Research 3(3): 271–277. https://dx.doi.org/10.1007/s40003-014-0115-9
Kumar, A, A K Mishra, S Saroj, V K Sonkar, G Thapa, andP K Joshi. 2020. Food safety measures and foodsecurity of smallholder dairy farmers: empiricalevidence from Bihar, India. Agribusiness 36 (3): 363–384. https://dx.doi.org/10.1002/agr.21643
Menon, P, A B Deolalikar, and A Bhaskar. 2008. India statehunger index: comparisons of hunger across states.Welthungerhilfe, International Food Policy ResearchInstitute (IFPRI), Washington, DC, and University ofCalifornia, Riverside. https://www.ifpri.org/publication/comparisons-hunger-across-states
Nasir, A, M S Toor, and K Vatta. 2014. Composite indexfor measuring sustainability of food systems in Punjab.Current Science 106 (2): 170–175. https://www.currentscience.ac.in/Volumes/106/02/0170.pdf
Pandey, A. 2015. Food security in India and states: keychallenges and policy option. Journal of AgriculturalEconomics and Rural Development 2 (1): 12–21. https:// m p r a . u b . u n i - m u e n c h e n . d e / 6 4 2 3 7 / 1 /MPRA_paper_64237.pdf
Pimentel, D, M McNair, L Buck, M Pimentel, and J Kamil.1997. The value of forests to world food security.Human Ecology 25 (1): 91–120. https://dx.doi.org/10.1023/A:1021987920278
Richardson, R B. 2010. Ecosystem services and foodsecurity: economic perspectives on environmentalsustainability. Sustainability 2 (11): 3520–3548. https://dx.doi.org/10.3390/su2113520
Sahu, A K, Z Chüzho, and S Das. 2017. Measuringhousehold food security index for high hill tribalcommunity of Nagaland, India. Journal of FoodSecurity 5: 155–161. https://dx.doi.org/10.12691/jfs-5-5-1
Saxena, R, B B Choudhary, and D Joshi. 2019. Enhancingfarmers’ incomes from livestock in eastern India withspecial emphasis on dairying: major drivers andstrategies. Indian Journal of Dairy Science 72 (6): 659–667. https://dx.doi.org/10.33785/IJDS.2019.v72i06.012

Sustainable food security index 61
Saxena, R, N P Singh, B B Choudhary, S J Balaji, R KPaul, U Ahuja, D Joshi, R Kumar, and M A Khan. 2017.Can livestock sector be the game changer in enhancingthe farmers’ income? reinvesting thrust with specialfocus on dairy sector. Agricultural Economics ResearchReview 30 (conference issue): 59–76. https://dx.doi.org/10.5958/0974-0279.2017.00022.2
Solaroli, L. 2015. Assessing food security in selectedMediterranean countries. African Journal of FoodSecurity 5 (2) 176-–185. https://www.internationalscholarsjournals.com/articles/assessing-food-security-in-selected-mediterranean-countries.pdf
United Nations Development Programme (UNDP). 1990.Human development report 1990. Oxford University
Press, New York. https://hdr.undp.org/sites/default/files/reports/219/hdr_1990_en_complete_nostats.pdf
Vepa, S S, D Varma, G S G Prasad, G Anuradha, RManghnani, G Sagarika, K Anantram, B Anandakumar,S Chandrakala, M Mathew, and D Bhattacharyya.2004. Atlas of the sustainability of food security inIndia. M S Swaminathan Research Foundation andWorld Food Programme, Chennai, India.
Vepa, S S, R B Bhavani, S Mitra, G Anuradha, R M JVadekel, and B Anandakumar. 2003. Food insecurityatlas of rural India. M S Swaminathan ResearchFoundation and World Food Programme, Chennai,India. https://documents.wfp.org/stellent/groups/public/documents/ena/wfp076968.pdf?iframe
Received: 31 January 2020 Accepted: 30 December 2020
AppendixTable A1 Economic Region of U.P.
Region Districts
1. Western Agra, Mainpuri, Firozabad, Aligarh, Kasganj, Bareilly, Badaun, Bulandshahr, Etah, Etawah,Farrukhabad, Mathura, Meerut, Ghaziabad, Muradabad, Pilibhit, Rampur, Muzaffarnagar,Saharanpur, Bijnor, Shahjahanpur, Baghpat, Gautam Buddha Nagar, Hathras, Amroha,Kannauj, Auriya
2. Central Bara Banki, Fatehpur, Hardoi, Kanpur Nagar, Kanpur Dehat, Kheri, Lucknow, Raebareli,Sitapur, Unnao
3. Eastern Allahabad, Kaushambi, Azamgarh, Mau, Ballia, Bahraich, Basti. Siddharth Nagar, Deoria,Faizabad, Ghazipur, Gonda, Gorakhpur, Maharajganj, Jaunpur, Mirzapur, Sonbhadra,Pratapgarh, Sultanpur, Varanasi, Balrampur, Shravasti, Chandauli, Sant Ravidas Nagar, KushiNagar, Sant Kabir Nagar, Ambedkar Nagar
4. Bundelkhand Jhansi, Jalaun, Hamirpur, Mohaba, Banda, Chitrakoot, Lalitpur
Source Government of Uttar Pradesh, 2009
Table A2 First principal component of different dimensions of sustainable food security
Dimensions of sustainable food security Uttar PradeshEigen value Proportion
Food availability security 152.04 0.9190Food availability sustenance 126.46 0.9068Food access security 101.27 0.8354Food access sustenance 104.90 0.8840Food utilization 94.16 0.9140

62 Singh P, Goyal M, Choudhary B B, Guleria A
Table A3 Districts wise rank and indices of sustainable food availability and its components in U.P.
District Index of food availability Index of food availability Sustainable food availabilitysecurity sustenance index
Index value Rank Index value Rank Index value Rank
Kasganj 0.8439 1 0.6017 53 0.7349 1Chandauli 0.6390 20 0.8228 1 0.7217 2Maharajganj 0.6510 17 0.8005 5 0.7183 3Sambhal 0.7097 3 0.7156 19 0.7123 4Kheri 0.6398 19 0.7911 6 0.7079 5Pilibhit 0.7096 4 0.6885 26 0.7001 6Budaun 0.6572 16 0.7416 15 0.6952 7Siddharth Nagar 0.5973 38 0.8085 3 0.6923 8Bareilly 0.6133 28 0.7472 13 0.6736 9Kushi Nagar 0.5657 52 0.8046 4 0.6732 10Shahjahanpur 0.6843 6 0.6594 35 0.6731 11Hathras 0.6652 12 0.6745 32 0.6694 12Deoria 0.5916 41 0.7567 12 0.6659 13Etah 0.6686 10 0.6606 34 0.6650 14Rampur 0.6618 15 0.6671 33 0.6641 15Hapur 0.6646 13 0.6579 36 0.6616 16Sant Kabir Nagar 0.5767 51 0.7626 9 0.6603 17Ambedkar Nagar 0.6244 25 0.6992 24 0.6581 18Gonda 0.6104 31 0.7104 22 0.6554 19Azamgarh 0.6078 32 0.7119 20 0.6546 20Mau 0.5943 40 0.7282 17 0.6546 21Mainpuri 0.7061 5 0.5901 55 0.6539 22Amroha 0.6053 34 0.7112 21 0.6529 23Bulandshahr 0.6708 9 0.6282 44 0.6516 24Amethi 0.6280 23 0.6788 28 0.6508 25Ballia 0.5594 54 0.7586 11 0.6490 26Bahraich 0.5359 55 0.7866 7 0.6487 27Bijnor 0.6038 35 0.7027 23 0.6483 28Sitapur 0.6012 36 0.6984 25 0.6450 29Shravasti 0.5055 61 0.8104 2 0.6427 30Moradabad 0.6074 33 0.6835 27 0.6416 31Gorakhpur 0.5227 58 0.7863 8 0.6413 32Ghazipur 0.5790 49 0.7172 18 0.6412 33Bara Banki 0.6767 7 0.5960 54 0.6404 34Shamli 0.6746 8 0.5891 56 0.6362 35Lalitpur 0.7398 2 0.5066 68 0.6349 36Meerut 0.5980 37 0.6766 30 0.6334 37Muzaffarnagar 0.6426 18 0.6134 50 0.6295 38Hardoi 0.6322 22 0.6253 47 0.6291 39Sultanpur 0.5840 45 0.6750 31 0.6250 40Jaunpur 0.5911 42 0.6551 37 0.6199 41Faizabad 0.6111 30 0.6278 45 0.6186 42
Contd...
Sustainable food security index 63
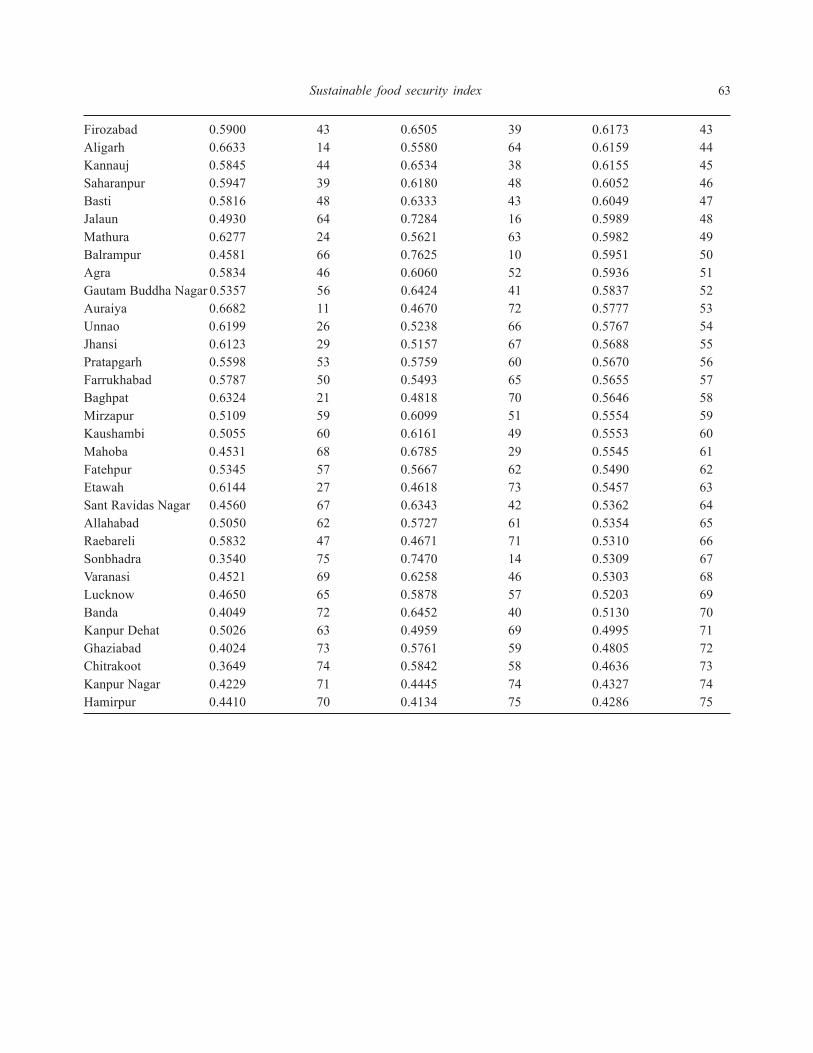
Firozabad 0.5900 43 0.6505 39 0.6173 43Aligarh 0.6633 14 0.5580 64 0.6159 44Kannauj 0.5845 44 0.6534 38 0.6155 45Saharanpur 0.5947 39 0.6180 48 0.6052 46Basti 0.5816 48 0.6333 43 0.6049 47Jalaun 0.4930 64 0.7284 16 0.5989 48Mathura 0.6277 24 0.5621 63 0.5982 49Balrampur 0.4581 66 0.7625 10 0.5951 50Agra 0.5834 46 0.6060 52 0.5936 51Gautam Buddha Nagar 0.5357 56 0.6424 41 0.5837 52Auraiya 0.6682 11 0.4670 72 0.5777 53Unnao 0.6199 26 0.5238 66 0.5767 54Jhansi 0.6123 29 0.5157 67 0.5688 55Pratapgarh 0.5598 53 0.5759 60 0.5670 56Farrukhabad 0.5787 50 0.5493 65 0.5655 57Baghpat 0.6324 21 0.4818 70 0.5646 58Mirzapur 0.5109 59 0.6099 51 0.5554 59Kaushambi 0.5055 60 0.6161 49 0.5553 60Mahoba 0.4531 68 0.6785 29 0.5545 61Fatehpur 0.5345 57 0.5667 62 0.5490 62Etawah 0.6144 27 0.4618 73 0.5457 63Sant Ravidas Nagar 0.4560 67 0.6343 42 0.5362 64Allahabad 0.5050 62 0.5727 61 0.5354 65Raebareli 0.5832 47 0.4671 71 0.5310 66Sonbhadra 0.3540 75 0.7470 14 0.5309 67Varanasi 0.4521 69 0.6258 46 0.5303 68Lucknow 0.4650 65 0.5878 57 0.5203 69Banda 0.4049 72 0.6452 40 0.5130 70Kanpur Dehat 0.5026 63 0.4959 69 0.4995 71Ghaziabad 0.4024 73 0.5761 59 0.4805 72Chitrakoot 0.3649 74 0.5842 58 0.4636 73Kanpur Nagar 0.4229 71 0.4445 74 0.4327 74Hamirpur 0.4410 70 0.4134 75 0.4286 75

64 Singh P, Goyal M, Choudhary B B, Guleria A
Table A4 Districts wise rank and indices of sustainable food access and its components in U.P.
District Index of food access Index of food access Sustainable foodsecurity sustenance access index
Index value Rank Index value Rank Index value Rank
Meerut 0.7602 2 0.6587 10 0.7196 1Baghpat 0.7703 1 0.5006 56 0.6624 2Bulandshahr 0.7107 5 0.5897 28 0.6623 3Muzaffarnagar 0.6602 6 0.6500 11 0.6561 4Ghaziabad 0.7425 3 0.4933 59 0.6428 5Mathura 0.6346 8 0.6393 14 0.6365 6Saharanpur 0.5942 11 0.6780 7 0.6277 7Gautam Buddha Nagar 0.7123 4 0.4894 61 0.6232 8Aligarh 0.6377 7 0.5878 30 0.6177 9Hathras 0.5793 13 0.6442 12 0.6052 10Agra 0.6282 9 0.5432 42 0.5942 11Firozabad 0.5829 12 0.5760 33 0.5801 12Bijnor 0.5065 23 0.6793 6 0.5756 13Lalitpur 0.5142 18 0.6327 17 0.5616 14Chandauli 0.4561 32 0.7113 2 0.5582 15Moradabad 0.5103 20 0.6263 22 0.5567 16Amroha 0.5690 15 0.4763 66 0.5319 17Allahabad 0.5292 17 0.5181 53 0.5248 18Banda 0.4463 35 0.6392 15 0.5235 19Shamli 0.5710 14 0.4512 69 0.5231 20Mahoba 0.5085 21 0.5327 46 0.5182 21Sonbhadra 0.4160 39 0.6701 9 0.5176 22Hamirpur 0.4358 38 0.6396 13 0.5173 23Mirzapur 0.3896 46 0.7051 3 0.5158 24Gorakhpur 0.4587 31 0.5981 26 0.5145 25Bareilly 0.4456 36 0.6103 23 0.5115 26Rampur 0.4825 27 0.5539 38 0.5110 27Sant Ravidas Nagar 0.5081 22 0.5099 54 0.5088 28Lucknow 0.4673 29 0.5709 34 0.5087 29Pilibhit 0.3607 59 0.7303 1 0.5085 30Varanasi 0.5456 16 0.4353 70 0.5015 31Raebareli 0.3822 50 0.6795 5 0.5011 32Deoria 0.4890 25 0.4946 58 0.4913 33Kanpur Nagar 0.4865 26 0.4957 57 0.4902 34Fatehpur 0.4467 34 0.5498 39 0.4880 35Ballia 0.3910 45 0.6319 18 0.4873 36Maharajganj 0.4475 33 0.5455 41 0.4867 37Chitrakoot 0.4368 37 0.5613 37 0.4866 38Farukkhabad 0.4113 40 0.5972 27 0.4856 39Kasganj 0.5140 19 0.4318 71 0.4811 40Balrampur 0.3742 52 0.6286 20 0.4759 41Jhansi 0.5042 24 0.4257 73 0.4728 42
Contd...

Sustainable food security index 65
Sant Kabir Nagar 0.3568 61 0.6292 19 0.4658 43Hapur 0.6041 10 0.2488 75 0.4620 44Barabanki 0.3757 51 0.5887 29 0.4609 45Sambhal 0.4618 30 0.4588 68 0.4606 46Sitapur 0.3472 62 0.6272 21 0.4592 47Gonda 0.3832 48 0.5679 35 0.4571 48Sultanpur 0.3697 56 0.5858 31 0.4561 49Kheri 0.3097 70 0.6717 8 0.4545 50Shahjahanpur 0.2947 71 0.6800 4 0.4489 51Budaun 0.3978 44 0.5220 51 0.4475 52Jalaun 0.3890 47 0.5345 45 0.4472 53Kushi Nagar 0.4078 41 0.5055 55 0.4469 54Etah 0.4698 28 0.3990 74 0.4415 55Mau 0.3825 49 0.5219 52 0.4382 56Basti 0.3741 53 0.5299 47 0.4364 57Ghazipur 0.3985 43 0.4915 60 0.4357 58Azamgarh 0.4022 42 0.4776 65 0.4324 59Jaunpur 0.3711 54 0.5234 50 0.4320 60Pratapgarh 0.3663 57 0.5282 48 0.4311 61Ambedkar Nagar 0.3316 65 0.5780 32 0.4302 62Siddharth Nagar 0.3144 68 0.6005 25 0.4289 63Auraiya 0.3371 64 0.5637 36 0.4278 64Shravasti 0.2808 72 0.6356 16 0.4227 65Mainpuri 0.3232 66 0.5486 40 0.4134 66Etawah 0.3619 58 0.4880 62 0.4123 67Faizabad 0.3603 60 0.4878 63 0.4113 68Unnao 0.3131 69 0.5402 43 0.4039 69Kanpur Dehat 0.3188 67 0.5276 49 0.4023 70Kaushambi 0.3443 63 0.4872 64 0.4014 71Kannauj 0.3702 55 0.4303 72 0.3942 72Bahraich 0.2450 74 0.6095 24 0.3908 73Hardoi 0.2392 75 0.5365 44 0.3581 74Amethi 0.2606 73 0.4746 67 0.3462 75

66 Singh P, Goyal M, Choudhary B B, Guleria A
Table A5 Districts wise rank and indices of sustainable food security and its components in U.P.
District Sustainable food Sustainable food Food utilization Sustainable foodavailability index access index index security index
Index value Rank Index value Rank Index value Rank Index value Rank
Meerut 0.6334 37 0.7196 1 0.7434 7 0.6954 1Bulandshahr 0.6516 24 0.6623 3 0.6295 23 0.6475 2Muzaffarnagar 0.6295 38 0.6561 4 0.6435 22 0.6429 3Hathras 0.6694 12 0.6052 10 0.6524 21 0.6412 4Saharanpur 0.6052 46 0.6277 7 0.6587 19 0.6298 5Agra 0.5936 51 0.5942 11 0.7139 9 0.6291 6Gautam Buddha Nagar 0.5837 52 0.6232 8 0.6715 15 0.6241 7Deoria 0.6659 13 0.4913 33 0.7840 4 0.6233 8Aligarh 0.6159 44 0.6177 9 0.6175 27 0.6170 9Chandauli 0.7217 2 0.5582 15 0.5910 33 0.6161 10Ballia 0.6490 26 0.4873 36 0.7830 5 0.6160 11Gorakhpur 0.6413 32 0.5145 25 0.7308 8 0.6158 12Baghpat 0.5646 58 0.6624 2 0.6199 26 0.6130 13Firozabad 0.6173 43 0.5801 12 0.6163 28 0.6041 14Azamgarh 0.6546 20 0.4324 59 0.8632 1 0.6001 15Ghaziabad 0.4805 72 0.6428 5 0.6968 12 0.5915 16Bijnor 0.6483 28 0.5756 13 0.5562 38 0.5909 17Lucknow 0.5203 69 0.5087 29 0.8368 3 0.5902 18Jalaun 0.5989 48 0.4472 53 0.7749 6 0.5773 19Mau 0.6546 21 0.4382 56 0.7103 10 0.5750 20Shamli 0.6362 35 0.5231 20 0.5602 37 0.5694 21Ghazipur 0.6412 33 0.4357 58 0.6921 13 0.5661 22Varanasi 0.5303 68 0.5015 31 0.6920 14 0.5634 23Jhansi 0.5688 55 0.4728 42 0.6659 17 0.5582 24Hapur 0.6616 16 0.4620 44 0.5809 34 0.5558 25Jaunpur 0.6199 41 0.4320 60 0.6688 16 0.5532 26Farrukhabad 0.5655 57 0.4856 39 0.6143 29 0.5499 27Moradabad 0.6416 31 0.5567 16 0.4727 53 0.5484 28Ambedkar Nagar 0.6581 18 0.4302 62 0.6027 32 0.5451 29Kanpur Nagar 0.4327 74 0.4902 34 0.8587 2 0.5439 30Mathura 0.5982 49 0.6365 6 0.4380 58 0.5429 31Etah 0.6650 14 0.4415 55 0.5644 36 0.5414 32Bareilly 0.6736 9 0.5115 26 0.4693 54 0.5386 33Amroha 0.6529 23 0.5319 17 0.4625 55 0.5383 34Auraiya 0.5777 53 0.4278 64 0.6598 18 0.5372 35Mainpuri 0.6539 22 0.4134 66 0.6086 30 0.5365 36Sant Kabir Nagar 0.6603 17 0.4658 43 0.5176 41 0.5364 37Kannauj 0.6155 45 0.3942 72 0.6558 20 0.5276 38Etawah 0.5457 63 0.4123 67 0.6992 11 0.5275 39Banda 0.5130 70 0.5235 19 0.5433 39 0.5263 40Faizabad 0.6186 42 0.4113 68 0.6046 31 0.5262 41Sultanpur 0.6250 40 0.4561 49 0.5215 40 0.5254 42
Contd...

Sustainable food security index 67
Allahabad 0.5354 65 0.5248 18 0.5113 44 0.5237 43Pilibhit 0.7001 6 0.5085 30 0.4258 60 0.5224 44Sambhal 0.7123 4 0.4606 46 0.4568 56 0.5205 45Kushi Nagar 0.6732 10 0.4469 54 0.4895 48 0.5203 46Shahjahanpur 0.6731 11 0.4489 51 0.4830 51 0.5187 47Gonda 0.6554 19 0.4571 48 0.4810 52 0.5179 48Bara Banki 0.6404 34 0.4609 45 0.4849 50 0.5178 49Fatehpur 0.5490 62 0.4880 35 0.5085 46 0.5139 50Rampur 0.6641 15 0.5110 27 0.4199 62 0.5134 51Kheri 0.7079 5 0.4545 50 0.4451 57 0.5120 52Hamirpur 0.4286 75 0.5173 23 0.6211 25 0.5105 53Basti 0.6049 47 0.4364 57 0.5114 43 0.5085 54Kasganj 0.7349 1 0.4811 40 0.4034 64 0.5069 55Raebareli 0.5310 66 0.5011 32 0.4862 49 0.5054 56Unnao 0.5767 54 0.4039 69 0.5755 35 0.5044 57Budaun 0.6952 7 0.4475 52 0.4266 59 0.4986 58Pratapgarh 0.5670 56 0.4311 61 0.5096 45 0.4962 59Lalitpur 0.6349 36 0.5616 14 0.3716 67 0.4962 60Kanpur Dehat 0.4995 71 0.4023 70 0.6268 24 0.4932 61Sitapur 0.6450 29 0.4592 47 0.4214 61 0.4917 62Mahoba 0.5545 61 0.5182 21 0.3960 65 0.4793 63Mirzapur 0.5554 59 0.5158 24 0.3903 66 0.4761 64Hardoi 0.6291 39 0.3581 74 0.5063 47 0.4719 65Amethi 0.6508 25 0.3462 75 0.5162 42 0.4716 66Siddharth Nagar 0.6923 8 0.4289 63 0.3639 68 0.4598 67Chitrakoot 0.4636 73 0.4866 38 0.4132 63 0.4523 68Sonbhadra 0.5309 67 0.5176 22 0.3530 69 0.4512 69Maharajganj 0.7183 3 0.4867 37 0.2681 74 0.4180 70Sant Ravidas Nagar 0.5362 64 0.5088 28 0.2859 71 0.4094 71Kaushambi 0.5553 60 0.4014 71 0.3201 70 0.4045 72Balrampur 0.5951 50 0.4759 41 0.2687 73 0.3999 73Bahraich 0.6487 27 0.3908 73 0.2816 72 0.3921 74Shravasti 0.6427 30 0.4227 65 0.0677 75 0.1604 75