Embed Size (px)
Citation preview
f , nited States ~ epartment of , griculture
Agricultural cooperative Servi
ACS \ ~~:,earch Report ~~er8
Farmers' SupplyPurchasing Practices
Abstract Farmers' purchasing characteristics, reasons for choosing suppliers, and
purchasing strategies were different for fertilizer, fuel, feed, and pesticide purchases of 100 commercial sized farmers. With fuel, few price discounts were re- " ceived and few supplier changes made. More price adjustments and supplier changes occurred with fertilizer and pesticide purchases. Distribution systems influenced feed purchases. Fertilizer and pesticide purchases with quantity di'scounts or supplier negotiations were twice as large. Large farmers have more purchasing options. Cooperatives were valued as business organizations. Farmer purchasing strategies affect cooperatives and other supply organizations.
KEYWORDS: Purchasing practices, farm supplies, buying strategies, price discounts, cooperatives.
FARMERS' SUPPLY PURCHASING PRACTICES Rpger A. Wissman Cooperative Management Division Agricultural Cooperative Service U.S. Department of Agriculture
ACS Research Report 8 June 198,
Preface This study examines the reasons, procedures, and strategies commercial
sized farmers use in their purchasing decisions for farm supply products.
This study did not develop a I)lueprint for the future but attempted to identify characteristics and relationships that will help farmers, farm supply dealers, and others understand the operation of the farm supply distri~ution system.
A personal interview survey of 100 farmers' purchasing practices was made late in 1975. Twenty-five farmers were interviewed in each of four areas: A grainpeanut production area in southern Virginia, a vegetable-grain-dairy area in Delaware, a dairy area in central Kentucky, and a grain area in western Kentucky. These represent a range of agricultural production but are close enough geographically to share common elements of structure and organization and to be economically surveyed.
The four areas were also served by a similar farm supply distribution system. A regional farm supply cooperative had outlets in all four, and other farm supply ffirms also sl erved
l moredthhan
d <;>ne. Howevder'feacfh area was I' served by its own local I, !
arm supp y out ets an a Its own nee s or arm supp les. ,
The farmers included in this survey were selected from lists developed from local sources. In Kentucky, a list of farmers participating in a farm records system was used; only farms with over $50,000 gross sales were used for the sample list. In Delaware and Virginia, local agricultural leaders prepared lists of farmers that were representative of the agriculture of the area and included a range of the larger farms.
Farmers' suppliers-and the farmers interviewed-were concerned with the supply of fuel and fertilizer. Since the survey was conducted, availability has changed several times. A farmer's purchasing methods reflect attitudes, operations, and conditions existing in the farm supply market.
The results in this survey year or any other year will be influenced by the existing situation, but the basic function of obtaining adequate quality and quantity of supplies remains the same. The farmers' operations, the farm supply distribution system, and the farmers' experiences have all developed over time and provide common elements that carryover from year to year. A farmer's purchasing practices adjust to conditions, but a farmer's basic approach to obtaining supplies is not expected to radically change from year to year. The approaches and adjustments observed in this survey year will apply to other years.
iii
Contents Page
Highlights ................................................................... vii
Differences Among Supply ProduGts ....................................... 1
Purchase Characteristics ................................................ 1
Reasons for Choosing a Supplier ........................................ 1
Purchasing Strategies .................................................... 3
Fuel ................... .................................................... 4
Fertilizer .................................................................. 5
Feed ...................................................................... 6
Pesticides ................................................................ 7
Purchasing Ar'rangements . . . . . . . . . . . . . . . . . . . . . . . . . . . . . . . . . . . . . . . . . . . . . . . 9
Price Discounts and Negotiations .......................................... 10
Feed ...................................................................... 10
Fuel....................................................................... 10
Fertilizer and Pesticides ................................................. 10
Factors Affecting Purchasing Decisions ................................... 13
Impact of Size ............................................................ 13
Need for Supply Services ................................................ 14
Technology ............................................................... 15
Farm Enterprise Growth .................................................. 15
Strategy Changes ........................................................ 17
General Attitudes About Farm Supply System ............................. 17
Implications for Cooperatives ............................................... 18
Impact of Purchasing Strategies ......................................... 18
Need for Flexibility
• 19
v
I I
I:
p
Highlights . Major differences existed in farmers' purchasing characteristics, reasons for
choosing suppliers, and pu rchasi ng strateg ies for ferti I izer, feed, fuel, and pesticides. Supply handling methods, services provided by suppliers, and arrangements initiated by purchasers all contributed to these differences. Interviews with 100 commercial-sized farmers in Kentucky, Virginia, and Delaware were the basis for this study. Information covered the farmers' purchases for their 1975 crop.
Price was the most often mentioned reason for choos(ng a supplier. But with feed purchases, dealer service was listed slightly more often, and with fuel purchases price was only the fourth place reason. Farmers placed the characteristics of the supplier as the second most important reason in making that choice.
In the survey year, farmers showed concern about the supply of fuel, fertilizer, and to a lesser extent, pesticides. The importance of supply availability depends on the current situation and expectations. When a shortage occurs, availability rapidly gains in importance. If conditions change, a farmer's reasons for purchasing also would be expected to change. Availability, product quality, service, and price all can become the dominant reason in farmers' decisions.
Each farmer has an individual way of operating a farm and purchasing supplies. However, several distinct approaches to farm supply purchasing were observed and were classified into four strategies. A few farmers had direct ownership in supply outlets. Another small group bypassed farm supply dealers and were contacting product manufacturers directly. However, most of the farmers interviewed either continued to buy from the same dealer or annually compared available sources and chose according to price.
Ninety-seven percent of the fuel purchasers used a continuing patronage strategy with their supplier. The other 3 percent purchased direct. With fertilizer, about 60 percent used the continuing patronage strategy, about 30 percent made price comparisons, and the remainder either had direct ownership in a supply outlet or purchased directly from manufacturers. Pesticide purchases were about evenly divided between the continuing patronage and the price comparison strategies, with only a few using direct purchase and direct ownership.
Use of supplier services was associated with the continuing patronage strategy. For example, with fuel, all farmers received delivery services and most continued to use the same supplier. With pesticides purchases, only 38 percent had their pesticides delivered or applied by their supplier, and many pesticide purchasers switched suppliers.
The differences in purchasing practices raise important considerations for cooperatives. For example, a farm supply cooperative may find its financing and member control characteristics fit best with products for which farmers follow the continuing patronage strategy. A supplier that stresses its services to patrons might be concerned about marketing a product that many farmers tend to buy on the basis of yearly price comparisons.
Farmers in this survey purchased a large proportion of each product from a single supplier and used additional suppliers for supplemental purchases. This was true for all sizes of purchasers. Larger farmers did not spread their purchases among suppliers to any greater extent than smaller farmers.
With fertilizer and pesticide purchases, farmers reporting lower prices because of their volume, usually were not aware of the supplier's specific criteria for granting discounts. Preseason and quantity discounts were often associated.
vii
I ! I
viii
Group purchasing, and suppliers' bidding or matching other suppliers' offers were examples of situations other than a simple supplier-to-farmer transaction. Farmers also reported that the suppliers' willingness to offer discounts or to negotiate price depended on the supply situation. The average yearly purchases of farmers who reported either a quantity discount or negotiations with their supplier was about twice as large as farmers reporting neither. Fertilizer purchases with either quantity discounts or negotiations averaged $15,800 a year, and purchases without discounts or negotiations averaged about $8,800 a year. For pesticides, farmers' purchases with discounts or negotiations averaged about $11 ,800, and those without averaged $6,300. Few quantity discounts were reported with fuel purchases, and the price of feed depended on its form and the delivery method used.
Farmers with large supply needs had more purchasing options available than farmers with smaller needs. However, these options were not spread in front of farmers for their choosing. For example, a farmer who wants to buy direct from wholesalers or manufacturers may have to invest in equipment and facilities or adjust operations. A smaller farmer would have a more difficult time purchasing directly, but group actions are possible. Being a part of the distribution system moves the farmer into a new area with new problems and uncertainties. Opportunities exist, but they carry specific requirements and risks.
A farm enterprise can expand in various ways. As experience and resources grow, opportunities outside the farming operation may become attractive and easier to accomplish than further expansion of the farm enterprise. In this survey, some farmers had followed this type of development. The land, labor, equipment, and capital available-combined with the interest and skills of the farmer-determined the direction of the enterprise.
The variety of supply distribution methods, farmers' goals and their purchasing strategies suggests that (1) a cooperative or any supplier should match its capabilities to the farmers' needs it can best serve; and (2) suppliers should realize that a range of organizations and farmer purchasing arrangements will probably develop in the local farm supply distribution system.
rFarmers' Supply Purchasing Practices Roger A. Wissman Agricultural Ecollomist
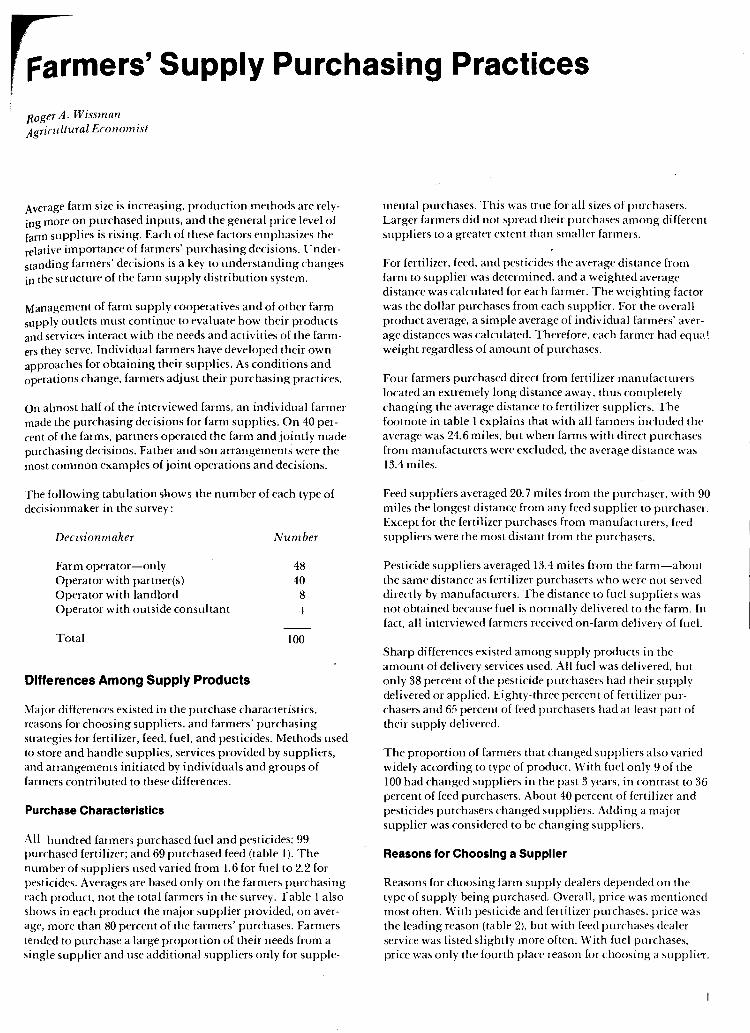
Average farm size is increasing. production methods are relying more on purchased inputs. and the general price level of farm supplies is rising. Each of these factors emphasizes the relative importance of farmers' purchasing decisions. l T nderstanding farmers' decisions is a key to understanding changes in the structure of the farm supply distribution system.
Management of farm supply cooperatives and of other farm supply outlets must continue to evaluate how their products and services interact with the needs and activities of the farmers they serve. Individual farmers have developed their own approaches for obtaining their supplies. As conditions and operations change. farmers adjust their purchasing practices.
On almost half of the interviewed farms. an individual farmer made the purchasing decisions for farm supplies. On 40 percent of the farms. partners operated the farm and jointly made purchasing decisions. Father and son arrangements were the most common examples of joint operations and decisions.
The following tabulation shows the number of each type of decisionmaker in the survey:
Decisionmaker
Farm operator-only Operator with partner(s) Operator with landlord Operator with outside consultant
Total
Differences Among Supply Products
Number
48 40
8 I
100
Major differences existed in the purchase characteristics. reasons for choosing suppliers. and farmers' purchasing strategies for fertilizer, feed. fuel. and pesticides. Methods used to store and handle supplies, services provided by suppliers, and arrangements initiated by individuals and groups of farmers contributed to these differences.
Purchase Characteristics
All hundred farmers purchased fuel and pesticides; 99 purchased fertilizer; and 69 purchased feed (table 1). The number of suppliers used varied from 1.6 for fuel to 2.2 for pesticides. Averages are based only on the farmers purchasing each product, not the total farmers in the survey. Table 1 also shows in each product the major supplier provided, on average, more than 80 percent of the farmers' purchases. Farmers tended to purchase a large proportion of their needs from a single supplier and use additional suppliers only for supple-
mental purchases. This was true for all sizes of purchasers. Larger fanners did not spread their purchases among different suppliers to a greater extent than smaller farmers.
For fertilizer, feed, and pesticides the average distance from farm to supplier was determined. and a weighted average distance was calculated for each farmer. The weighting factor was the dollar purchases from each supplier. For the overall product average. a simple average of individual farmers' average distances was calculated. Therefore. each farmer had equi,.1 weight regardless of amount of purchases.
Four farmers purchased direct from fertilizer manufacturers located an extremely long distance away. thus completely changing the average distance to fertilizer suppliers. The footnote in table 1 explains that with a\l farmers included the average was 24.6 miles. but when farms with direct purchases from manufacturers were excl uded, the average distance was 13.4 miles.
Feed suppliers averaged 20.7 miles from the purchaser. with 90 miles the longest distance from any feed supplier to purchaser. Except for the fertilizer purchases from manufacturers, feed suppliers were the most distant from the purchasers.
Pesticide suppliers averaged 13.4 miles from the farm-about the same distance as fertilizer purchasers who were not served directly by manufacturers. The distance to fuel suppliers was not obtained because fuel is normally delivered to the farm. In fact. all interviewed farmers received on-farm delivery of fuel.
Sharp differences existed among supply products in the amount of delivery services used. All fuel was delivered. but only 38 percent of the pesticide purchasers had their supply delivered or applied. Eighty-three percent of fertilizer purchasers and 65 percent of feed purchasers had at least pan of their supply delivered.
The proportion of farmers that changed suppliers also varied widely according to type of product. With fuel only 9 of the 100 had changed suppliers in the past 3 years. in contrast to 36 percent of feed purchasers. About 40 percent of fertilizer and pesticides purchasers changed suppliers. Adding a major supplier was considered to be changing suppliers.
Reasons for Choosing a Supplier
Reasons for choosing farm supply dealers depended on the type of supply being purchased. Overall. price was mentioned most often. With pesticide and fertilizer purchases. price was the leading reason (table 2). but with feed purchases dealer service was listed slightly more often. With fuel purchases, price was only the fourth place reason for choosing a supplier.
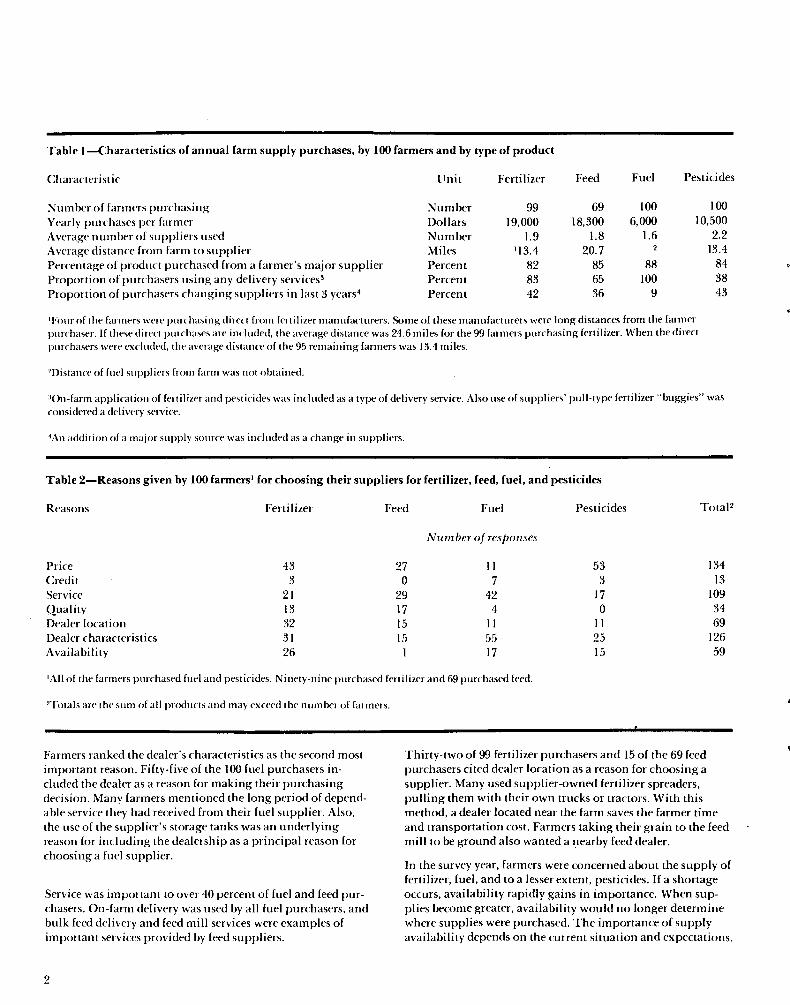
Table I-Characteristics of annual farm supply purchases, by 100 farmers and by type of product
Characteristic
Number of fanners purchasing Yearly purchases per fanner Average number of suppliers used Average distance from farm to supplier Percentage of product purchased from a farmer's major supplier Proportion of purchasers using any delivery services3
Proportion of purchasers changing suppliers in last 3 years4
Unit
Number Dollars Number Miles Percent Percent Percent
Fertilizer
99 19,000
1.9 113.4
82 83 42
Feed Fuel Pesticides
69 100 100
18,300 6,000 10,500 1.8 1.6 2.2
20.7 13.4 85 88 84 65 100 38 36 9 43
'Four of Ihe fanners were purchasing direct from fertilizer manufacturers. Some of these manufacturers were long distances from the farmer pUIThaser. If these direct purchases are included, the average distance was 24.6 miles for the 99 farmers purchasing fertilizer. When the direct purchasers were excluded, the average distance of the 95 remaining farmers was 13.4 miles.
2Distance of fuel suppliers from farm was not obtained.
30n-farm application of fertilizer and pesticides was included as a type of delivery service. Also use of suppliers' pull-type fertilizer "buggies" was considered a delivery service.
'An addition of a major supply source was included as a change in suppliers.
Table 2-Reasons given by 100 farmers' for choosing their suppliers for fertilizer, feed, fuel, and pesticides
Reasons Fertilizer Feed Fuel Pesticides TotaF
Number of responses
Price 43 27 II 53 134 Credit 3 0 7 3 13 Service 21 29 42 17 109 Quality 13 17 4 0 34 Dealer location 32 15 II II 69 Dealer characteristics 31 15 55 25 126 Availability 26 I 17 15 59
'All of the farmers purchased fuel and pesticides. Ninety-nine purchased fertilizer and 69 purchased feed.
2Totals are the sum of all products and may exceed the number of farmers.
Farmers ranked the dealer's characteristics as the second most important reason. Fifty-five of the 100 fuel purchasers included the dealer as a reason for making their purchasing decision. Many farmers mentioned the long period of dependable service they had received from their fuel supplier. Also, the use of the supplier's storage tanks was an underlying reason for including the dealership as a principal reason for choosing a fuel supplier.
Service was important to over 40 percent of fuel and feed purchasers. On-farm delivery was used by all fuel purchasers, and bulk feed delivery and feed mill services were examples of important services provided by feed suppliers.
2
Thirty-two of 99 fertilizer purchasers and 15 of the 69 feed purchasers cited dealer location as a reason for choosing a supplier. Many used supplier-owned fertilizer spreaders, pulling them with their own trucks or tractors. With this method, a dealer located near the farm saves the farmer time and transportation cost. Farmers taking their grain to the feed mill to be ground also wanted a nearby feed dealer.
In the survey year, farmers were concerned about the supply of fertilizer, fuel, and to a lesser extent, pesticides. If a shortage occurs, availability rapidly gains in importance. When supplies become greater, availability would no longer determine where supplies were purchased. The importance of supply availability depends on the current situation and expectations.
r Almost one-fourth of the farmers purchasing feed included product quality as a reason for choosing their feed supplier. With the other three products, few farmers included quality as a reason. With fuel, pesticides, and fertilizer, the initial manufacturing process occurs at a different level in the system and a standardized product is distributed to local suppliers. However, with feed, farmers deal with the suppliers who prepare the feed and are responsible for quality. Since local suppliers of complete feed control the quality of the product, differences in quality between feed suppliers would indeed be a logical reason to select a supplier.
In summary, different but practical reasons were given for choosing each type of supply product. Reasons changed as local conditions changed For example, availability, product quality, service, and price all can become the dominant reason in the farmers' decision. The current situation determines which reason becomes the most important.
Purchasing Strategies
Each farmer has an individual way of operating a farm and purchasing supplies. However, the purchasing methods of the interviewed farmers could be classified into broad groups.
Four general approaches to purchasing supplies were observed. A few farmers had direct ownership in supply outlets.
The business operations of these farmers included both farming and selling farm supplies. Another small group had bypassed local farm supply dealers and were contacting product manufacturers directly. However, most of the interviewed farmers either maintained a continuing patronage relationship with a particular dealer or compared the available supply sources yearly and chose their supplier according to price.
Purchasing of each supply was classified into a strategy. For example, a farmer's purchasing of fuel could be classified as following one strategy, and fertilizer classified as a different strategy.
Strategy classifications were based on (I) changes in suppliers in the last 3 years, (2) reasons for changing suppliers or remaining with a supplier, (3) use of purchasing groups and bidding procedures, (4) number of suppliers used, and (5) ownership of supply outlets or direct contact with manufacturers. A description of the four strategies follows.
Strategy 1. Continuing Patronage Farmers using this strategy valued dealing with the same supplier. They were willing to remain with a supplier as long as they felt adequate prices, quality, and service were maintained. Location and type of product also were important.
Farmers who had not changed their major supplier in the last 3 years were included in this classification. Farmers who had added a supplier or had changed because of needed services
-
also were included as long as price was not the reason for the change in suppliers. Product availability or credit services offered by a particular supplier were reasons given for the limited number of changes by farmers with this strategy. If conditions remain the same, the farmer and the supplier expect to do business together the next year.
Strategy 2. Seasonal Price Comparisons Farmers using this strategy examined suppliers' prices and were willing to change sources of supply. Price was the chief reason used for choosing a supplier. No longrun understanding nor strong relationship with any particular dealer existed. Farmers and suppliers dealt with each other on a transactionby-transaction basis.
Farmers who switched product suppliers because of price were placed in this strategy. Also included were farmers who normally used several suppliers and adjusted between suppliers according to price. All farmers in group purchasing arrangements and farmers asking suppliers for price bids were placed in this strategy.
Strategy 3. Direct Purchase From Manufacturer Farmers following this strategy are operating at tbe same level as farm supply dealers and are taking on some farm supply outlet functions. Storage, transportation, and financing, for example, might be necessary. The farmer probably must take
the initiative with a manufacturer and must be flexible and able to coordinate the details of the transaction.
The type of supplier used, of course, determined the farmers placed in this strategy. Descriptions of these arrangements are included in the discussions of each supply product.
Strategy 4. Direct Investment in Farm Supply Outlets Farmers with direct ownership in a farm supply outlet were placed in this strategy. In some cases, a son was mainly responsible for the farming operation, and the farm supply operation had become a full-time job for the father.
In other cases, the farm supply operation was not extensive and was not a year-round operation. Seasonal needs of fertilizer, for example, were supplied to a limited number of customers. One farmer had an ownership interest in the supply outlet, but it was completely separate from the farming operation. The farmer did not take part in the management.
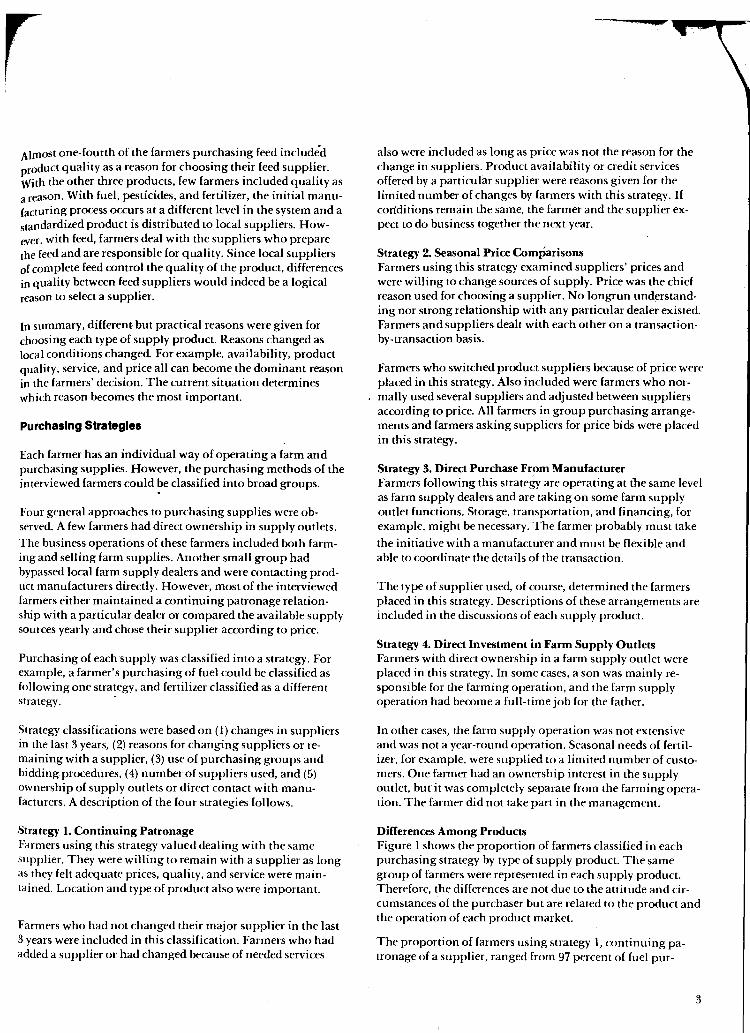
Differences Among Products Figure I shows the proportion of farmers classified in each purchasing strategy by type of supply product. The same group of farmers were represented in each supply product. Therefore, the differences are not due to the attitude and circumstances of the purchaser but are related to the product and the operation of each product market.
The proportion of farmers using strategy I, continuing patronage of a supplier, ranged from 97 percent of fuel pur-
3
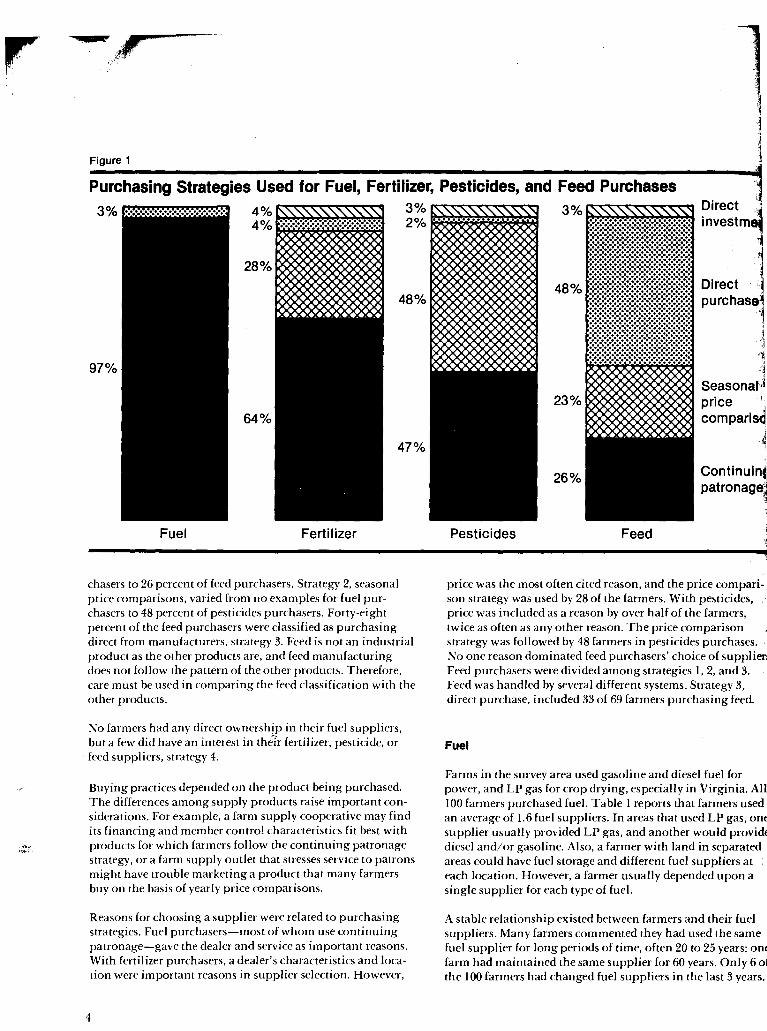
Figure 1
Purchasing Strategies Used for Fuel, Fertilizer, Pesticides, and Feed Purchases 4%
28%
64%
Fuel
~""""'~ ~ ~.~.·.·.·.·.·.·.·.·.·.·.·4 ·.·.·.·.·.·.·.·.·.·.·.·.·4 ·.·.·.·.·.·.·.·.·.·.·.·.·4 .•..•.........•...••.... , ...•.................... , ...............••......• , ·.·.·.·.·.·.·.·.·.·.·.·.·4 ..•...............•...•. , .................•...... , ................•...•... , .-.-._.-._._ •.•...•...•..
Fertilizer
~ : .
chasers to 26 percent of feed purchasers. Strategy 2, seasonal price comparisons, varied from no examples for fuel purchasers to 48 percent of pesticides purchasers. Forty-eight percent of the feed purchasers were classified as purchasing direct from manufacturers, strategy 3. Feed is not an industrial product as the other products are, and feed manufacturing does not follow the pattern of the other products. Therefore, care must be used in comparing the feed classification with the other products.
No farmers had any direct ownership in their fuel suppliers, but a few did have an interest in th~Tr fertilizer, pesticide, or
. feed suppliers, strategy 4.
Buying practices depended on the product being purchased. The differences among supply products raise important considerations. For example, a farm supply cooperative may find its financing and member control characteristics fit best with products for which farmers follow the continuing patronage strategy, or a farm supply outlet that stresses service to patrons might have trouble marketing a product that many farmers buy on the basis of yearly price comparisons.
Reasons for choosing a supplier were related to purchasing strategies. Fuel purchasers-most of whom use continuing patronage-gave the dealer and service as important reasons. With fertilizer purchasers, a dealer's characteristics and location were important reasons in supplier selection. However,
4
~"""""""""~ ~ ~": ... ": •.......... ": •.... ": .. ~ ......•....•.•.......•• ~ , ..•...•...••..•...••.. ~ ~ ..•........•..•...•...• ~ ~ •....••..........•••..• ~ ~ •...•......•.•...••..•• ~ ~ ........•..••..••..•••• ~ ~ .•...•...•....•....•...• ~ .......................• ~ .......•...••...•....•.• ~ ......................... . ~ ...........•...........• , ..•...................• ~ ........................ . , ..........•...........• ~ ...................... . ~ .....................• ................................. ~
Pesticides
23%~lI 26%
Feed
Direct I,
investm;
i Direct. purchase~
'1 ~ 'I
·4 SeasonaH price \ comparls~
J
Continuin. patronage~
J
1
price was the most often cited reason, and the price compari- I son strategy was used by 28 of the farmers. With pesticides, price was included as a reason by over half of the farmers, twice as often as any other reason. The price comparison strategy was followed by 48 farmers in pesticides purchases. No one reason dominated feed purchasers' choice of suppliers Feed purchasers were divided among strategies 1,2, and 3. Feed was handled by several different systems. Strategy 3, direct purchase, included 33 of 69 farmers purchasing feed.
Fuel
Farms in the survey area used gasoline and diesel fuel for power, and LP gas for crop drying, especially in Virginia. All 100 farmers purchased fuel. Table I reports that farmers used an average of 1.6 fuel suppliers. In areas that used LP gas, one supplier usually provided LP gas, and another would provide diesel and/or gasoline. Also, a farmer with land in separated areas could have fuel storage and different fuel suppliers at each location. However, a farmer usually depended upon a single supplier for each type of fuel.
A stable relationship existed between farmers and their fuel suppliers. Many farmers commented they had used the same fuel supplier for long periods of time, often 20 to 25 years; one farm had maintained the same supplier for 60 years. Only 6 of the 100 farmers had changed fuel suppliers in the last 3 years.
, In recent years fuel prices have increased rapidly as supplies tightened up. Supply problems with accompanying allocation programs have definitely caused farmers to use great care in changing fuel suppliers. However, this is not a new attitude; the current concern over supply simply reinforces the existing situation.
The services provided by petroleum suppliers were important. All farms in the study received on-farm delivery (table I). In addition, 91 were provided with fuel tanks and/or pumps by their supplier. Some farmers believed suppliers were becoming more restrictive in supplying tanks and pumps. Farmers that changed suppliers recently had difficulty in obtaining or were not supplied tanks and pumps by their new suppliers.
The supplying of fuel storage tanks and pumps was a strong tie between farmers and fuel suppliers. One farmer explained it very clearly by saying, "You can't put one supplier's gas in another one's tanks."
As shown in table 2, the reasons given for choosing fuel suppliers were substantially different from the reasons for the other types of supplies. Dealer characteristics and services were the most common reasons g.i.ven for choosing a particular fuel dealer. "Long time supplier" or "dependable dealer" were representative comments. Price was mentioned by 11 farmers and quality was included by only 4.
None of the other product suppliers approached fuel suppliers in the uniformity of services provided. The strong tie between continuing patronage and supplier-furnished equipment, delivery, and automatic tank refill was a dominant feature of the petroleum fuel supply system.
Ninety-seven of the 100 farmers were classified as using strategy I, continuing patronage, and their yearly fuel purchases averaged $5,500. Over 90 percent of strategy I farmers had tanks or pumps supplied by their dealer, and over 75 percent had an automatic refill agreement with their fuel dealer. These farmers continued purchasing from a supplier as long as supply and service were satisfactory. Higher prices were not necessarily a reason to drop a supplier. Twenty-four percent of the farmers using strategy I did believe a lower fuel price was available from another supplier. The current uncertainty of fuel supplies made changing suppliers difficult, but the length of time farmers had continued with their fuel suppliers shows that in the past when supplier changes were easier, farmers still tended to stay with the same supplier.
Three farmers were classified as using the direct purchase strategy and averaged fuel. purchases of over $20,000 per year. These farmers received on-farm delivery, but deliveries were made in much larger quantities than the usual farm delivery. These farmers provided their own on-farm storage. Two of three had changed suppliers in the last 3 years.
Fertilizer
Fertilizer was available in a wider variety of forms than the other supply products. Dry fertilizer products were used in all areas. Anhydrous ammonia was used extensively in the western Kentucky area, and liquid fertilizer was common in Virginia and Delaware.
Application methods also varied. Suppliers offered field application of all forms of fertilizer. Many farmers used a spreader-trailer provided by the supplier. Farmers also used their own equipment. The equipment and storage they owned influenced the methods available to them.
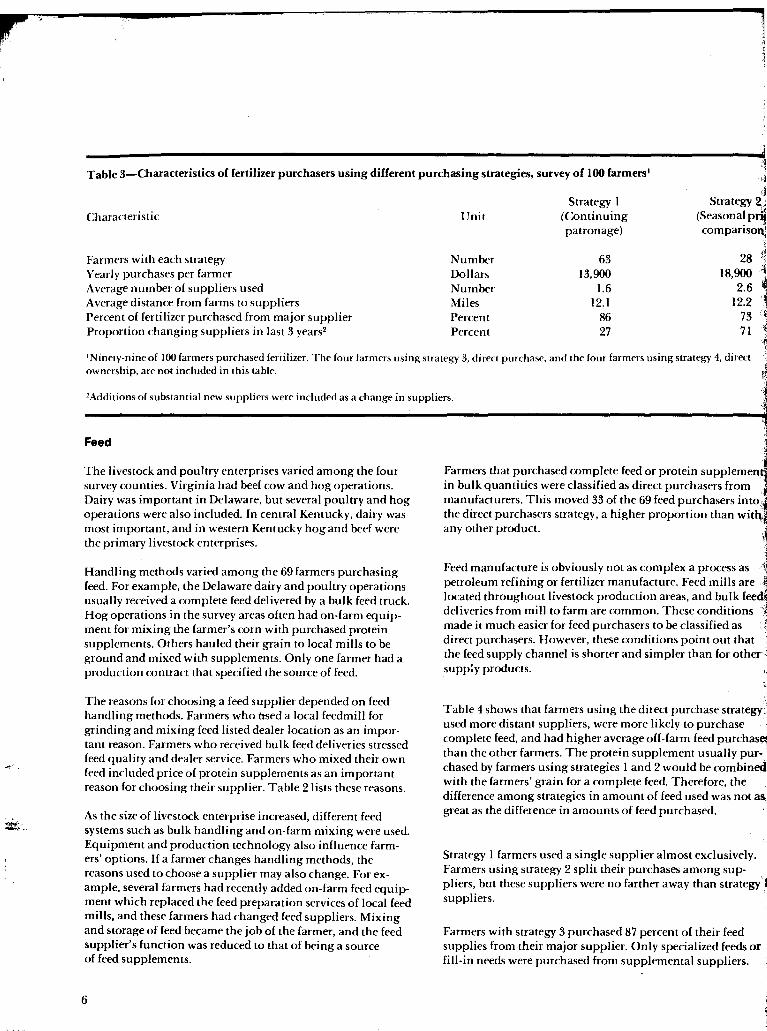
Sixty-three farmers were classified as using strategy I, continuing patronage, for fertilizer purchases. Twenty-eight farmers were using strategy 2, seasonal price comparison. The average distance from farm to fertilizer supplier and the proportion of fertilizer purchased from the principal supplier were similar for both strategy I and 2 (table 3). The number of suppliers used and the proportion changing suppliers were characteristics used for classifying into strategies.
The proportion of farmers using any delivery services was similar between strategy I and strategy 2 farmers. However, strategy I farms used more application services. Over half, 33 of 63, of the strategy I farmers had at least part of their fertilizer applied by their suppliers. Less than a third, 9 of 28, of strategy 2 farmers had fertilizer applied by their suppliers. Strategy I farmers also made greater use of application equipment available from fertilizer dealers.
Suppliers' location and farmers' experience with suppliers were the most frequently mentioned reasons strategy I farmers gave for choosing their suppliers. Price was the most important reason for strategy 2 farmers.
Only four farmers were purchasing direct from fertilizer manufacturers (strategy 3), and only four had direct ownership in a fertilizer supplier (strategy 4). Both of these types had average fertilizer purchases several times larger than the other purchasers.
Farmers with direct ownership had their businesses located near their farming operations. In some cases the farmer was sole owner of the fertilizer outlet, and in other cases control was shared with partners. In all four cases the farm operation had been developed before the fertilizer operations.
Direct purchase from fertilizer manufacturers usually involved receiving rail shipments from a long distance. Farmers need to add storage and make other adjustments in their operations to handle such shipments. All four farmers making direct purchases had changed suppliers in the 3 years prior to the survey.
5
,i 1
Table 3-Characteristics of fertilizer purchasers using different purchasing strategies. survey of 100 farmers I .'~
i.j
Characteristic
Farmers with each strategy Yearly purchases per farmer A verage number of suppliers used Average distance from farms to suppliers Percent of fertilizer purchased from major supplier Proportion changing suppliers in last 3 years2
Unit
Number Dollars Number Miles Percent Percent
Strategy I (Continuing patronage)
63 13,900
1.6 12.1
86 27
d Strategy 2'.i
(Seasonal pr~ comparisoql
.,
28 11 18,900 1
2.6 ~ 12.2 'l ,
73 .~ 71
INinety-nineof 100 farmers purchased fertilizer. The four farmers using strategy 3, direct purchase. and the four farmers using strategy 4, direct ownership, are not included in this table.
2Additions of substantial new suppliers were included as a change in suppliers.
Feed
The livestock and poultry enterprises varied among the four survey counties. Virginia had beef cow and hog operations. Dairy was important in Delaware, but several poultry and hog operations were also included. In central Kentucky, dairy was most important, and in western Kentucky hog and beef were the primary livestock enterprises.
Handling methods varied among the 69 farmers purchasing feed. For example, the Delaware dairy and poultry operations usually received a complete feed delivered by a bulk feed truck. Hog operations in the survey areas often had on-farm equipment for mixing the farmer's corn with purchased protein supplements. Others hauled their grain to local mills to be ground and mixed with supplements. Only one farmer had a production contract that specified the source of feed.
The reasons for choosing a feed supplier depended on feed handling methods. Farmers who Used a local feedmill for grinding and mixing feed listed dealer location as an important reason. Farmers who received bulk feed deliveries stressed feed quality and dealer service. Farmers who mixed their own feed included price of protein supplements as an important reason for choosing their supplier. Table 2 lists these reasons.
As the size of livestock enterprise increased, different feed systems such as bulk handling and on-farm mixing were used. Equipment and production technology also influence farmers' options. If a farmer changes handling methods, the reasons used to choose a supplier may also change. For example, several farmers had recently added on-farm feed equipment which replaced the feed preparation services of local feed mills, and these farmers had changed feed suppliers. Mixing and storage of feed became the job of the farmer, and the feed supplier's function was reduced to that of being a source of feed supplements.
6
Farmers that purchased complete feed or protein supplemen ' in bulk quantities were classified as direct purchasers from manufacturers. This moved 33 of the 69 feed purchasers into the direct purchasers strategy, a higher proportion than with,:' any other product.
Feed manufacture is obviously not as complex a process as 1, petroleum refining or fertilizer manufacture. Feed mills are .~. located throughout livestock production areas, and bulk feed',. deliveries from mill to farm are common. These conditions \ made it much easier for feed purchasers to be classified asj' direct purchasers. However, these conditions point out that .~. the feed supply channel is shorter and simpler than for other':l supply products. "1
:j
Table 4 shows that farmers using the direct purchase strategy) used more distant suppliers, were more likely to purchase I complete feed, and had higher average off-farm feed PurChas~ than the other farmers. The protein supplement usually pur- , chased by farmers using strategies I and 2 would be combined, with the farmers' grain for a complete feed. Therefore, the difference among strategies in amount of feed used was not as,: great as the difference in amounts of feed purchased.
Strategy I farmers used a single supplier almost exclusively. Farmers using strategy 2 split their purchases among suppliers, but these suppliers were no farther away than strategy suppliers.
Farmers with strategy 3 purchased 87 percent of their feed supplies from their major supplier. Only specialized feeds or fill-in needs were purchased from supplemental suppliers.
....
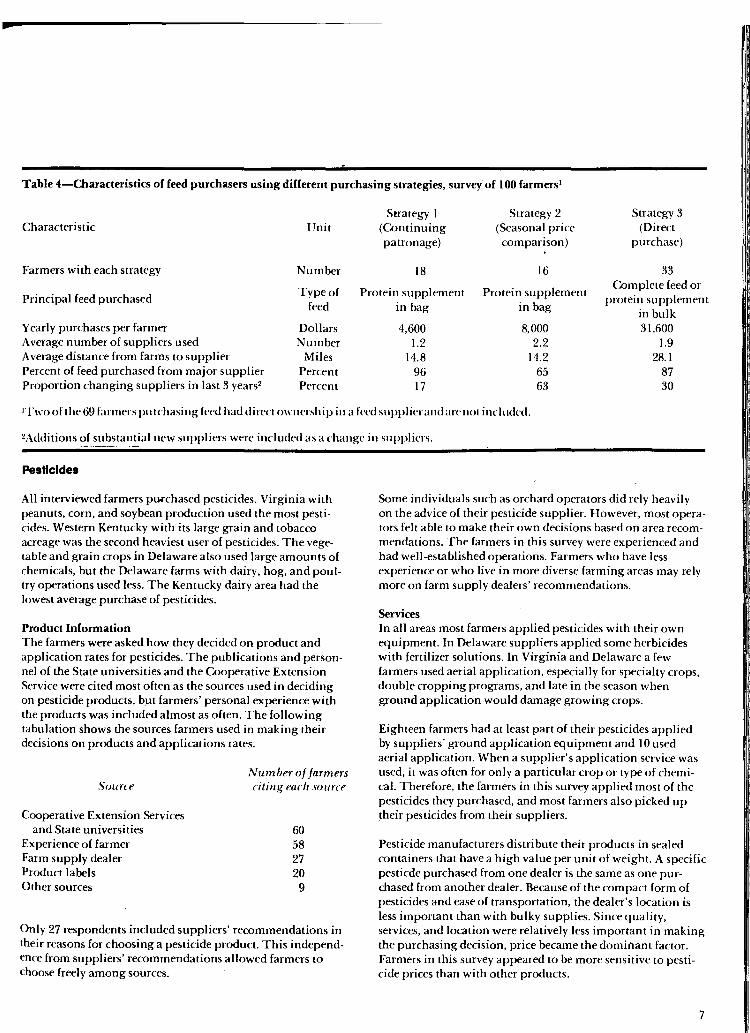
Table 4-Characteristics of feed purchasers using different purchasing strategies, survey of 100 farmers·
Strategy I Strategy 2 Strategy 3 Characteristic Unit (Continuing (Seasonal price (Direct
patronage) comparison) purchase) ,
Farmers with each strategy Number 18 16 33
Type of Protein supplement Protein supplement Complete feed or
Principal feed purchased protein supplement feed in bag in bag
in bulk Yearly purchases per farmer Dollars 4,600 8,000 31,600 Average number of suppliers used Number 1.2 2.2 1.9 Average distance from farms to supplier Miles 14.8 14.2 28.1 Percent of feed purchased from major supplier Percent 96 65 87 Proportion changing suppliers in last 3 years2 Percent 17 63 30
ITwo of the 69 fanners purchasing feed had direct ownership in a feed supplier and arc not incl uded.
2AdditiollS of substantial new suppliers were included as a change in suppliers.
Pesticides
All interviewed farmers plH'chased pesticides. Virginia with peanuts, corn, and soybean production used the most pesticides. Western Kentucky with its large grain and tobacco acreage was the second heaviest user of pesticides. The vegetable and grain crops in Delaware also used large amounts of chemicals, but the Delaware farms with dairy, hog, and poultry operations used less. The Kentucky dairy area had the lowest average purchase of pesticides.
Product Information The farmers were asked how they decided on product and application rates for pesticides. The publications and personnel of the State universities and the Cooperative Extension Service were cited most often as the sources used in deciding on pesticide products, bJlt farmers' personal experience with the products was included almost as often. The following tabulation shows the sources farmers used in making their decisions on products and applications rates.
Source
Cooperative Extension Services and State universities
Experience of farmer Farm supply dealer Product labels Other sources
Number of farmers citillg Facli source
60 58 27 20 9
Only 27 respondents included suppliers' recommendations in their reasons for choosing a pesticide product. This independence from suppliers' recommendations allowed farmers to choose freely among sources.
Some individuals such as orchard operators did rely heavily on the advice of their pesticide supplier. However, most operators felt able to make their own decisions based on area recommendations. The farmers in this survey were experienced and had well-established operations. Farmers who have less experience or who live in more diverse farming areas may rely more on farm supply dealers' recommendations.
Services In all areas most farmers applied pesticides with their own equipment. In Delaware suppliers applied some herbicides with fertilizer solutions. In Virginia and Delaware a few farmers used aerial application, especially for specialty crops, double cropping programs, and late in the season when ground application would damage growing crops.
Eighteen farmers had at least part of their pesticides applied by suppliers' ground application equipment and lOused aerial application. When a supplier's application service was used, it was often for only a particular crop or type of chemical. Therefore, the farmers in this survey applied most of the pesticides they purchased, and most farmers also picked up their pesticides from their suppliers.
Pesticide manufacturers distribute their products in sealed containers that have a high value per unit of weight. A specific pesticde purchased from one dealer is the same as one purchased from another dealer. Because of the compact form of pesticides and ease of transportation, the dealer's location is less important than with bulky supplies. Since quality, services, and location were relatively less important in making the purchasing decision, price became the dominant factor. Farmers in this survey appeared to be more sensitive to pesticide prices than with other products.
7
'.j~4~~~--------______ """"""""""".
~~" ".F
Fe
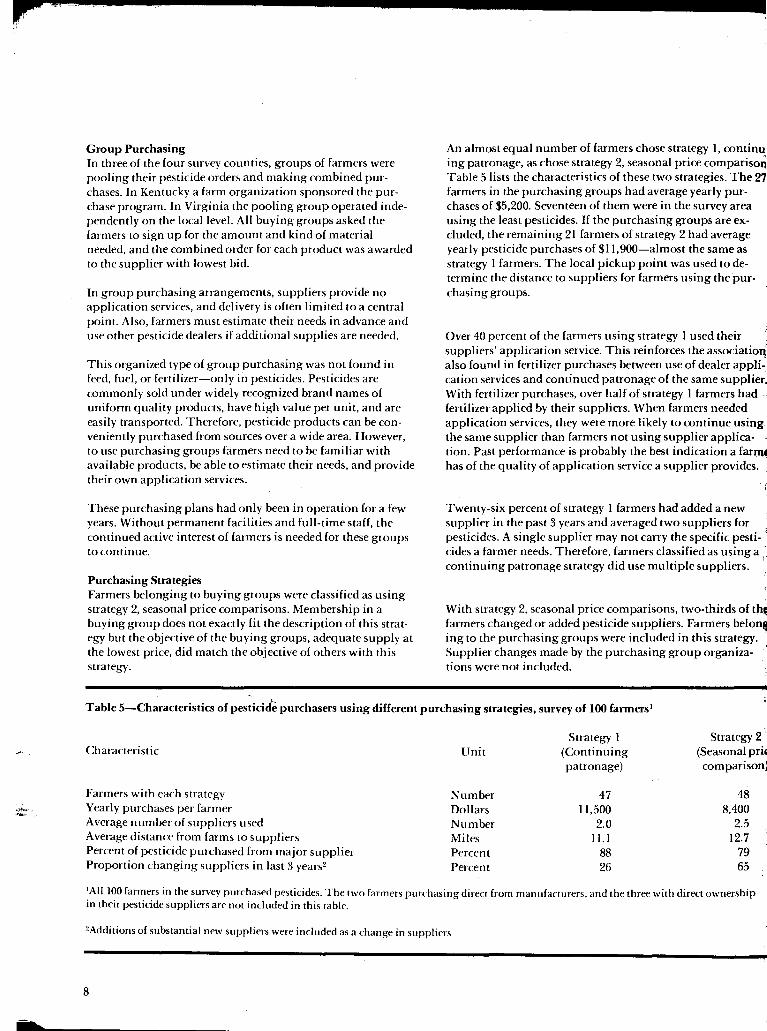
Group Purchasing In three of the four survey counties, groups of farmers were pooling their pesticide orders and making combined purchases. In Kentucky a farm organization sponsored the purchase program. In Virginia the pooling group operated independently on the local level. All buying groups asked the farmers to sign up for the amount and kind of material needed, and the combined order for each product was awarded to the supplier with lowest bid.
In group purchasing arrangements, suppliers provide no application services, and delivery is often limited to a central point. Also, farmers must estimate their needs in advance and use other pesticide dealers if additional supplies are needed.
This organized type of group purchasing was not found in feed, fuel, or fertilizer-only in pesticides. Pesticides are commonly sold under widely recognized brand names of uniform quality products, have high value per unit, and are easily transported. Therefore, pesticide products can be conveniently purchased from sources over a wide area. However, to use purchasing groups farmers need to be familiar with available products, be able to estimate their needs, and provide their own application services.
These purchasing plans had only been in operation for a few years. Without permanent facilities and full-time staff, the continued active interest of farmers is needed for these groups to continue.
Purchasing Strategies Farmers belonging to buying groups were classified as using strategy 2, seasonal price comparisons. Membership in a buying group does not exactly fit the description of this strategy but the objective of the buying groups, adequate supply at the lowest price, did match the objective of others with this strategy.
An almost equal number of farmers chose strategy I, continu ing patronage, as chose strategy 2, seasonal price comparison Table 5 lists the characteristics of these two strategies. The z7 farmers in the purchasing groups had average yearly purchases of $5,200. Seventeen of them were in the survey area using the least pesticides. If the purchasing groups are excluded, the remaining 21 farmers of strategy 2 had average yearly pesticide purchases of $11,900-almost the same as strategy I farmers. The local pickup point was used to determine the distance to suppliers for farmers using the purchasing groups.
Over 40 percent of the farmers using strategy I used their suppliers' application service. This reinforces the associatio~ also found in fertilizer purchases between use of dealer application services and continued patronage of the same supplier. With fertilizer purchases, over half of strategy I farmers had fertilizer applied by their suppliers. When farmers needed application services, they were more likely to continue using the same supplier than farmers not using supplier application. Past performance is probably the best indication a far~ has of the quality of application service a supplier provides.
Twenty-six percent of strategy I farmers had added a new supplier in the past 3 years and averaged two suppliers for pesticides. A single supplier may not carry the specific pesti- j
cides a farmer needs. Therefore, farmers classified as using a continuing patronage strategy did use multiple suppliers. .
With strategy 2, seasonal price comparisons, two-thirds of th~ farmers changed or added pesticide suppliers. Farmers belon~ ing to the purchasing groups were included in this strategy. Supplier changes made by the purchasing group organizations were not included.
Table 5-Characteristics of pesticid~ purchasers using different purchasing strategies, survey of 100 farmers!
Strategy I Strategy 2 Characteristic Unit (Continuing (Seasonal pric
patronage) comparison)
Farmers with each strategy Number 47 48 Yearly purchases per farmer Dollars 11,500 8,400 Average number of suppliers used Number 2.0 2.5 .. Average distance from farms to suppliers Miles Il.l 12.7
, !
Percent of pesticide purchased from major supplier Percent 88 79 Proportion changing suppliers in last 3 years2 Percent 26 65
, I
lAIl 100 farmers in the survey purchased pesticides. The two farmers purchasing direct from manufacturers, and the three with direct ownership in their pesticide suppliers are not included in this table.
2Additions of substantial new suppliers were included as a change in suppliers
•
8
p
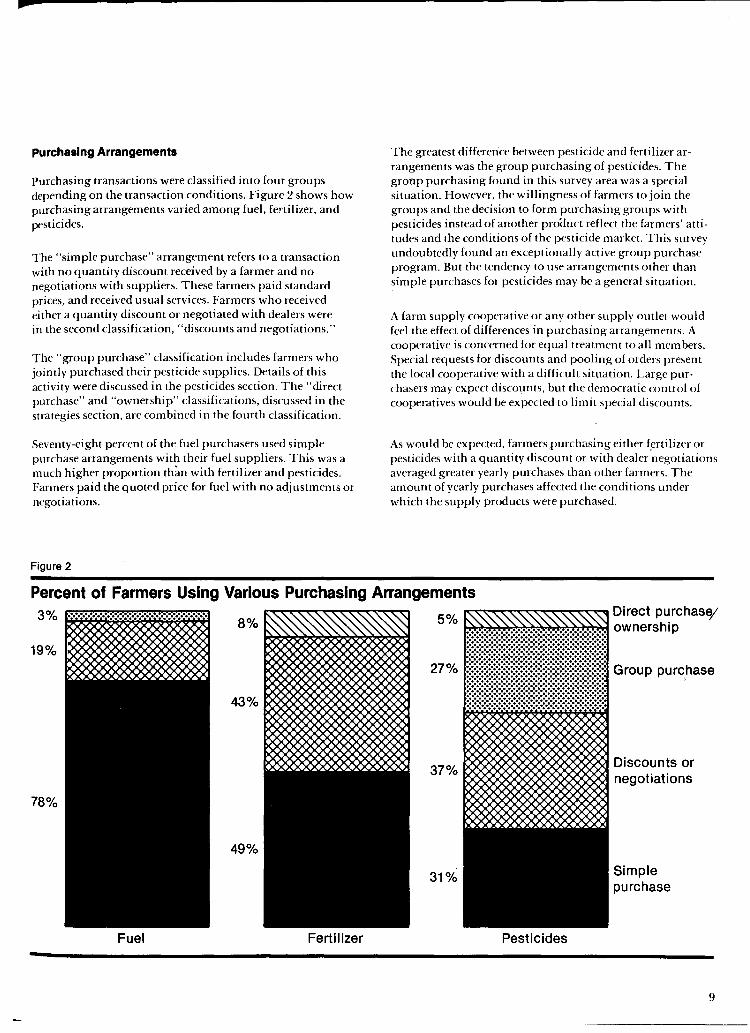
purchasing Arrangements
Purchasing transactions were classified into four groups depending on the transaction conditions. Figure 2 shows how purchasing arrangements varied among fuel, fertilizer, and pesticides.
The "simple purchase" arrangement refers to a transaction with no quantity discount received by a farmer and no negotiations with suppliers. These farmers paid standard prices, and received usual services. Farmers who received either a quantity discount or negotiated with dealers were in the second classification, "discounts and negotiations."
The "group purchase" classification includes farmers who jointly purchased their pesticide supplies. Details of this activity were discussed in the pesticides section. The "direct purchase" and "ownership" classifications, discussed in the strategies section, are combined in the fourth classification.
Seventy-eight percent of the fuel purchasers used simple purchase arrangements with their fuel suppliers. This was a much higher proportion th;:m with fertilizer and pesticides. Farmers paid the quoted price for fuel with no adjustments or negotiations.
Figure 2
The greatest difference between pesticide and fertilizer arrangements was the group purchasing of pesticides. The gronp purchasing found in this survey area was a special situation. However, the willingness of farmers to join the groups and the decision to form purchasing groups with pesticides instead of another proauct reflect the farmers' attitudes and the conditions of the pesticide market. This survey undoubtedly found an exceptionally active group purchase program. But the tendency to use arrangements other than simple purchases for pesticides may be a general situation.
A farm supply cooperative or any other supply outlet would feel the effect of differences in purchasing arrangements. A cooperative is concerned for equal treatment to all members. Special requests for discounts and pooling of orders present the local cooperative with a difficult situation. Large purchasers may expect discounts, but the democratic control of cooperatives would be expected to limit special discounts.
As would be expected, farmers purchasing either (ertilizer or pesticides with a quantity discount or with dealer negotiations averaged greater yearly purchases than other farmers. The amount of yearly purchases affected the conditions under which the supply products were purchased.
Percent of Farmers Using Various Purchasing Arrangements 3%
8% 5%
19% 27%
43%
37%
78%
49%
31%
Fuel Fertilizer Pesticides
Direct purchase; ownership
Group purchase ,
Discounts or
Simple purchase
9
Price Discounts and Negotiations
Farmers in this study were asked about price discounts received from suppliers and conditions for them. They were also asked if suppliers would negotiate terms of sale.
For cash and preseason discounts, purchase conditions could be identified, but the size of purchase needed for a quantity discount and the amount of the discount were not easily identified. Many farmers reporting discounts did not describe the price they received as a discount from a base price. They believed they had paid a lower price because of their volume but were not aware of suppliers' criteria for granting discounts. A larger survey of more standardized purchases would be needed to estimate the difference in price due to the amount purchased. Variations in product, time of purchase, and services provided all affect the price offered farmers.
This study examined how a group of farmers viewed the importance of volume in purchasing supplies. No attempt was made to quantify the amounts of discounts received. Therefore, only representative discounts are cited.
Feed
Almost half the feed purchasers received bulk feed deliveries. Compared to bag feed service, bulk deliveries normally are larger and usually are for complete feed rather than protein supplement. The differences in form between types of feed service prevent a simple comparison. Farmers using a bulk system receive a lower price, but this may be more of a form than a quantity discount.
Feed grains and protein supplements have active commodity markets. Feed prices change frequently as these feed ingredient prices change. This makes it harder to separate price adjustments, such as quantity discounts, from price fluctuations. For example, one farmer reported his supplier would notify him before a price increase took effect. This type of service was not a clear discount, but it did repre~nt part of the exchange between customer and supplier.
Almost a third of the feed purchasers indicated their supplier would negotiate with them. Farmers believed their suppliers' willingness to negotiate varied throughout the year because of the changing market conditions of feed ingredients.
In summary, in purchasing feed the form and amount purchased were part of the pricing structure. A bulk price was available when at least the minimum purchase requirement was met. Bagged feed in ton lots was cheaper than smaller amounts. These prices reflected savings in handling costs. Most farmers in this survey were purchasing feed in amounts that included these handling discounts. In addition, feed suppliers exhibited some flexibility, especially in sales effort. The uealers' interest in negotiating and promoting sales was influenced by changes in the feed ingredient markets.
10
Fuel
Quantity discounts and dealer negotiations were limited in , fuel purchases. As mentioned, three farmers purchasd truck', loads direct from fuel distributors. These farmers were not supplied with storage tanks and they purchased large quanti~ ties at one time. The prices paid reflected the fewer services ' supplied and the quantity purchased. Of the remaining 97 farmers, 10 reported that quantity discounts were received I,
from their local fuel suppliers on their purchases of gasoline' and diesel fuel. The most common quoted discount was I to cents a gallon. Five farmers reported discounts on LP gas fOT" crop drying. These were slightly higher than gasoline and diesel discounts.
The farmers reporting quantity discounts were not aware of the quantity needed for the discount. Since the farmers in thi survey tended to use the same fuel suppliers year after year, supplier would know the farmer's past fuel purchases and expected needs.
The three farmers purchasing their fuel supplies direct from~\' distributors asked for bids or negotiated the purchase terms. The other farmers negotiated very little with their suppliers. i Only five had any negotiations, and these were over payment!:; terms or the supply of storage tanks rather than price.
Fertilizer and Pesticides
The use of fertilizer and pesticides is not spread throughout the year like the use of feed and fuel. For the farmers in this survey, supplier services were not as important as price in fertilizer and pesticide purchases. More price discounts occurred with purchases of these two products.
"
The four farmers with direct ownership in a fertilizer suPPlierl and the four farmers purchasing directly from manufacturers ) were not included in the fertilizer discount discussion. Neither.i were the two farmers that purchased pesticides direct and the three with direct ownership in their pesticide supplier. Responses concerning price discounts from these arrangements would not be comparable to responses from farmers dealing independently with local suppliers.
Group purchasing arrangements try to obtain lower prices for • their members. Combining orders and centralizing deliveries may reduce suppliers' distribution costs. If the group is successful, these savings and quantity discounts obtained from suppliers are reflected in the prices to the group's members. Because the group's representatives deal with the product suppliers, the purchasing arrangements were considered to be substantially different from dealings between individual farmers and product suppliers. Therefore, in the discussions of quantity discounts and supplier negotiations, the 27 pesticide purchasers who were members of purchasing groups were not included.
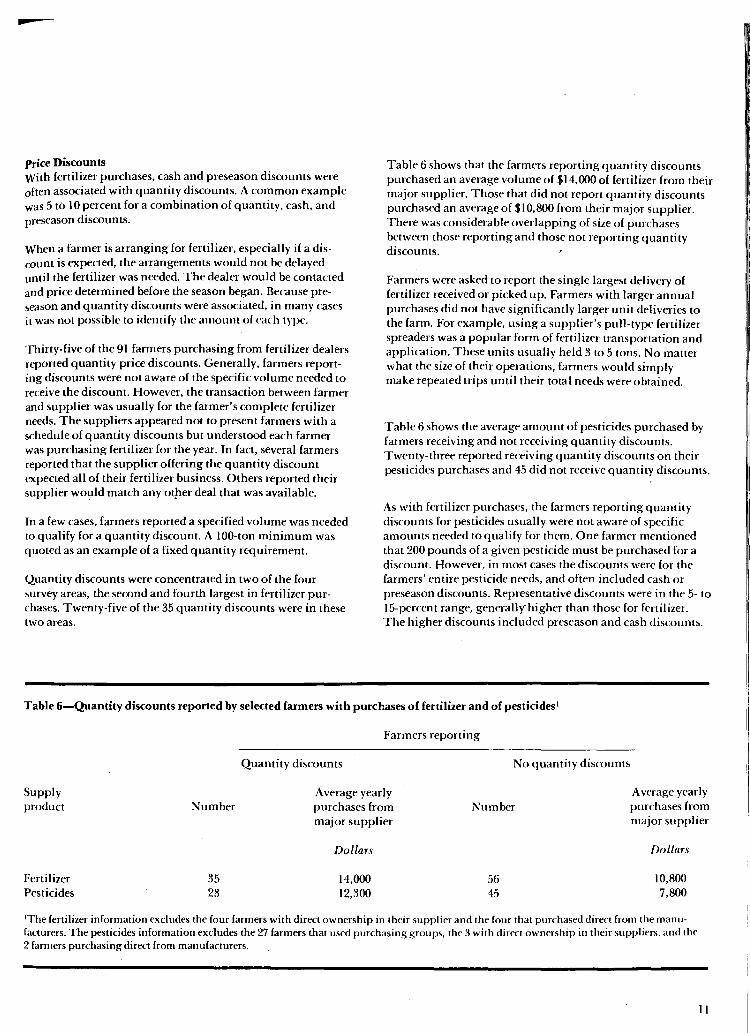
Price Discounts With fertilizel purchases, cash and preseason discounts were often associated with quantity discounts. A common example was 5 tb 10 percent for a combination of quantity, cash, and preseason discounts.
When a farmer is arranging for fertilizer, especially if a discount is expected, the arrangements would not be delayed until the fertilizer was needed. The dealer would be contacted and price determined before the season began. Because preseason and quantity discounts were associated, in many cases it was not possible to identify the amount of each type.
Thirty-five of the 91 farmers purchasing from fertilizer dealers reported quantity price discounts. Generally, farmers reporting discounts were not aware of the specific volume needed to receive the discount. However, the transaction between farmer and supplier was usually for the farmer's complete fertilizer needs. The suppliers appeared not to present farmers with a schedule of quantity discounts but understood each farmer was purchasing fertilizer for the year. In fact, several farmers reported that the supplier offering the quantity discount expected all of their fertilizer business. Others reported their supplier would match any otper deal that was available.
In a few cases, farmers reported a specified volume was needed to qualify for a quantity discount. A 100-ton minimum was quoted as an example of a fixed quantity requirement.
Quantity discounts were concentrated in two of the four survey areas, the second and fourth largest in fertilizer purchases. Twenty-five of the 35 quantity discounts were in these two areas.
Table 6 shows that the farmers reporting quantity discounts purchased an average volume of .$14,000 of fertilizer from their major supplier. Those that did not report quantity discounts purchased an average of .$10,800 from their major supplier. There was considerable overlapping of size of purchases between those reporting and those not reporting quantity discounts.
Farmers were asked to report the single largest delivery of fertilizer received or picked up. Farmers with larger annual purchases did not have significantly larger unit deliveries to the farm. For example, using a supplier's pull-type fertilizer spreaders was a popular form of fertilizer transportation and application. These units usually held 3 to 5 tons. No matter what the size of their operations, farmers would simply make repeated trips until their total needs were obtained.
Table 6 shows the average amount of pesticides purchased by farmers receiving and not receiving quantity discounts. Twenty-three reported receiving quantity discounts on their pesticides purchases and 45 did not receive quantity discounts.
As with fertilizer purchases, the farmers reporting quantity discounts for pesticides usually were not aware of specific amounts needed to qualify for them. One farmer mentioned that 200 pounds of a given pesticide must be purchased for a discount. However, in most cases the discounts were for the farmers' entire pesticide needs, and often included cash or preseason discounts. Representative discounts were in the 5- to 15-percent range, generally-higher than those for fertilizer. The higher discounts included preseason and cash discounts.
Table 6-Quantity discounts reported by selected farmers with purchases of fertilizer and of pesticides I
Supply product
Fertilizer Pesticides
Number
35 23
Farmers reporting
Quantity discounts
Average yearly purchases from major supplier
Dollars
14,000 12,300
No quantity discounts
Number
56 45
A verage yearly purchases from major supplier
Dollars
10,800 7,800
IThe fertilizer information excludes the four farmers with direct ownership in their supplier and the four that purchased direct from the manufacturers. The pesticides information excludes the 27 farmers that used purchasing groups. the 3 with direct ownership in their suppliers, and the 2 farmers purchasing direct from manufacturers.
II
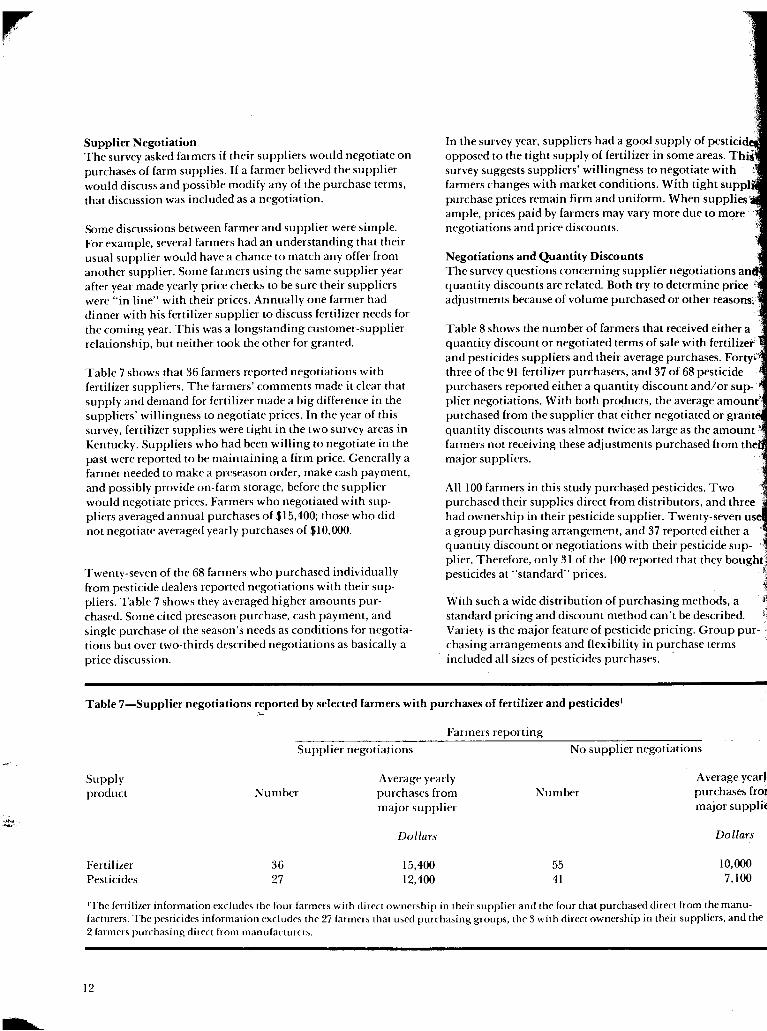
Supplier Negotiation The survey asked farmers if their suppliers would negotiate on purchases of farm supplies. If a farmer believed the supplier would discuss and possible modify any of the purchase terms, that discussion was included as a negotiation.
Some discussions between farmer and supplier were simple. For example, several farmers had an understanding that their usual supplier would have a chance to match any offer from another supplier. Some farmers using the same supplier year after year made yearly price checks to be sure their suppliers were "in line" with their prices. Annually one farmer had dinner with his fertilizer supplier to discuss fertilizer needs for the coming year. This was a longstanding customer-supplier relationship, but neither took the other for granted.
Table 7 shows that 36 farmers reported negotiations with fertilizer suppliers. The farmers' comments made it clear that supply and demand for fertilizer made a big difference in the suppliers' willingness to negotiate prices. In the year of this survey, fertilizer supplies were tight in the two survey areas in Kentucky. Suppliers who had been willing to negotiate in the past were reported to be maintaining a firm price. Generally a farmer needed to make a preseason order, make cash payment, and possibly provide on-farm storage, before the supplier would negotiate prices. Farmers who negotiated with suppliers averaged annual purchases of $15,400; those who did not negotiate averaged yearly purchases of $10,000.
Twenty-seven of the 68 farmers who purchased individually from pesticide dealers reported negotiations with their suppliers. Table 7 shows they averaged higher amounts purchased. Some cited preseason purchase, cash payment, and single purchase of the season's needs as conditions for negotiations but over two-thirds described negotiations as basically a price discussion.
In the survey year, suppliers had a good supply of pesticid opposed to the tight supply of fertilizer in some areas. Thi" survey suggests suppliers' willingness to negotiate with farmers changes with market conditions. With tight suppl' purchase prices remain firm and uniform. When supplies' ample, prices paid by farmers may vary more due to more negotiations and price discounts.
Negotiations and Quantity Discounts The survey questions concerning supplier negotiations an quantity discounts are related. Both try to determine price' ' adjustments because of volume purchased or other reasons/.
Table 8 shows the number of farmers that received either a quantity discount or negotiated terms of sale wi th fertilizer" and pesticides suppliers and their average purchases. Forty. three of the 91 fertilizer purchasers, and 37 of 68 pesticide purchasers reported either a quantity discount and/or supplier negotiations. With both products, the average amount' purchased from the supplier that either negotiated or grant quantity discounts was almost twice as large as the amount', farmers not receiving these adjustments purchased from the major suppliers.
All 100 farmers in this study purchased pesticides. Two purchased their supplies direct from distributors, and three had ownership in their pesticide supplier. Twenty-seven us a group purchasing arrangement, and 37 reported either a quantity discount or negotiations with their pesticide sup- ) plier. Therefore, only 31 of the 100 reported that they bought! pesticides at "standard" prices. ~,
~ I
With such a wide distribution of purchasing methods, a I! standard pricing and discount method can't be described. \; Variety is the major feature of pesticide pricing. Group purchasing arrangements and flexibility in purchase terms included all sizes of pesticides purchases. .
Table 7-Supplier negotiations reported by selected farmers with purchases of fertilizer and pesticides l
Supply product
Fertilizer Pesticides
.c..
Farmers reporting
Supplier negotiations
Number
36 27
Average yearly purchases from major supplier
Dollars
15,400 12,400
No supplier negotiations
Number
55 41
A verage year! purchases fror major supplit
Dollars
10,000 7,100
lThe fertilizer information excludes the four farmers with direct ownership in their supplier and the four that purchased direct from the manufacturers. The pesticides information excludes the 27 farmers that used purchasing groups, the 3 with direct ownership in their suppliers, and the 2 farmers purchasing direct from manufacturers.
12
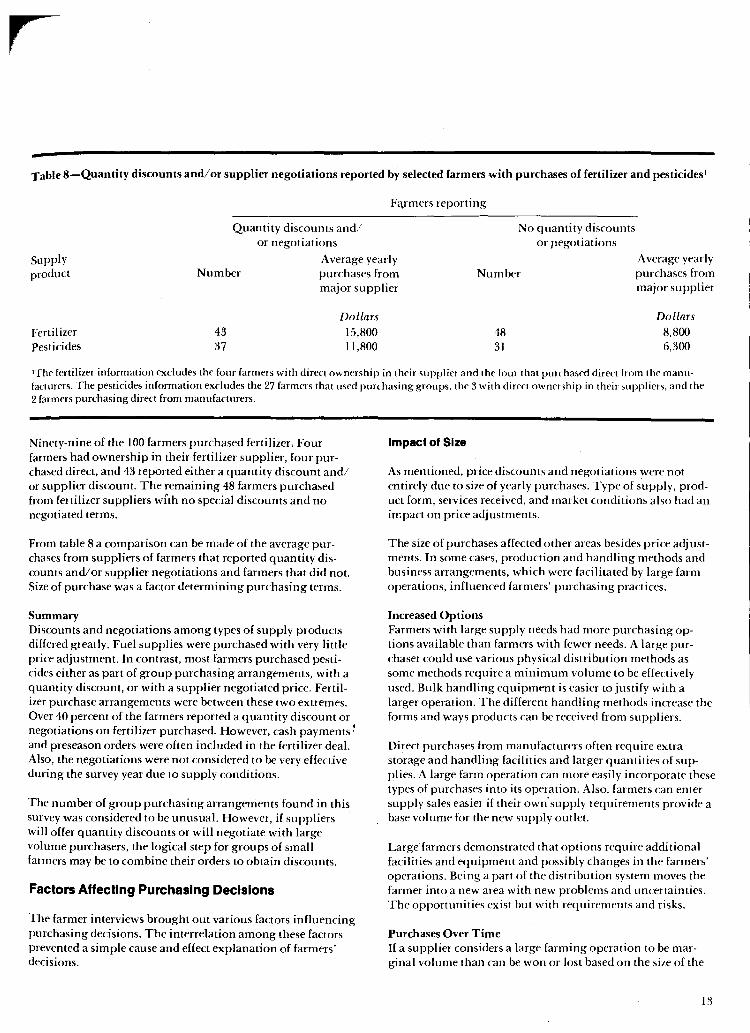
-Table 8-Quantity discounts and/ or supplier negotiations reported by selected farmers with purchases of fertilizer and pesticides '
Quantity discounts and/ or negotiations
Fa.rmers reporting
No quantity discounts or J1egotiations
Supply product
Average yearly A verage year Iy purchases from major supplier
Number purchases from major supplier
Number
Fertilizer Pesticides
43 37
Dollars 15,800 11,800
48 31
Dollars 8,800 6,300
'The fertilizer information excludes the four farmers with direct ownership in their supplier and the four that purchased direct from the manufacturers. The pesticides information excludes the 27 farmers that used purchasing groups, the 3 with direct ownenhip in their suppliers, and the 2 farmers purchasing direct from manufacturers.
Ninety-nine of the 100 farmers purchased fertilizer. Four farmers had ownership in their fertilizer supplier, four purchased direct, and 43 reported either a quantity discount and/ or supplier discount. The remaining 48 farmers purchased from fertilizer suppliers wi'th no special discounts and no negotiated terms.
From table 8 a comparison can be made of the average purchases from suppliers of farmers that reported quantity discounts and/or supplier negotiations and farmers that did not. Size of purchase was a factor determining purchasing terms.
Summary Discounts and negotiations among types of supply products differed greatly. Fuel supplies were purchased with very little price adjustment. In contrast, most farmers purchased pesticides either as part of group purchasing arrangements, with a quantity discount, or with a supplier negotiated price. Fertilizer purchase arrangements were between these two extremes. Over 40 percent of the farmers reported a quantity discount or negotiations on fertilizer purchased. However, cash payments ~ and preseason orders were often included in the fertilizer deal. Also, the negotiations were not considered to be very effective during the survey year due to supply conditions.
The number of group purchasing arrangements found in this survey was considered to be unusual. However, if suppliers will offer quantity discounts or will negotiate with large volume purchasers, the logical step for groups of small farmers may be to combine their orders to obtain discounts.
Factors Affecting Purchasing Decisions
The farmer interviews brought out various factors influencing purchasing decisions. The interrelation among these factors prevented a simple cause and effect explanation of farmers' decisions.
Impact of Size
As mentioned, price discounts and negotiations ~ere not entirely due to size of yearly purchases. Type of supply, product form, services received, and market conditions also had an impact on price adjustments.
The size of purchases affected other areas besides price adj ustments. In some cases, production and handling methods and business arrangements, which were facilitated by large farm operations, influenced farmers' purchasing practices.
Increased Options Farmers with large supply needs had more purchasing options available than farmers with fewer needs. A large purchaser could use various physical distribution methods as some methods require a minimum volume to be effectively used. Bulk handling equipment is easier to justify with a larger operation. The different handling methods increase the forms and ways products can be received from suppliers.
Direct purchases from manufacturers often require extra storage and handling facilities and larger quantities of supplies. A large farm operation can more easily incorporate these types of purchases into its operation. Also, farmers can enter supply sales easier if their own'supply requirements provide a base volume for the new supply outlet.
Large farmers demonstrated that options require additional facilities and equipment and possibly changes in the farmers' operations. Being a part of the distribution system moves the farmer into a new area with new problems and uncertainties. The opportunities exist but with requirements and risks.
Purchases Over Time If a supplier considers a large farming operation to be marginal volume than can be won or lost based on the size of the
13
r quantity discount, a farm supply dealer may see discounts to large purchasers as necessary. However, a number of considerations, including legal concerns, complicate the suppliers'decision.
The earlier discussion of purchasing strategies pointed out most surveyed farmers did not change suppliers each year. The probability of continued purchases increases the importance of a current patron. When purchases over time are considered, a small farmer with a growing operation becomes an attractive prospect. Considering the volume of a farmer's purchases beyond a yearly basis changes the focus of the analysis.
Purchase transactions can be classified as either consumer or industrial-type. Price and quality are important in both. However, in a consumer-type transaction availability of product is assumed, purchase decisions can be made quickly, and physical transfer is simple. In an industrial-type transaction, availability or at least scheduling of delivery is a problem, and purchase decisions must be made in advance; physical transfer requires coordination. With consumer-type purchases, changing suppliers is easy and can be done annually or more frequently. With industrial-type purchases, changing suppliers can be difficult, thus often the same ones continue to be used.
Some agricultural supply products such as protein supplements in bags and pesticides in sealed containers fit the consumer product classification. Other products such as petroleum fuel and bulk feed purchases fit the industrial product classification. Bulk deliveries require coordination of delivery schedules, compatibility of equipment, and familiarity of both parties with the requirements of the other.
The classifications of industrial and consumer-type products center on the characteristics of the product being purchased. These characteristics should determine the length of time used in evaluating purchases. Shorter periods of time can be used to analyze purchasers' and suppliers' decisions for consumertype products than for industrial-type products.
_c.
If volume discounts are available, t'specially for consumertype products, combined orders from small groups of farmt'rs may be expected. Farm supply dealers may expect farmers to
ust' individual and group efforts to obtain supplies in a manner that is in the farmers' best interest.
Shortages of supply products radically changed farmers and suppliers outlook. Quantity discounts apparently were mort' prevalent when large supplies existed and were stopped or reduced during times of tight supply. The importance to a supplier of a single large purchase must be considerable in the light of product availability and continued patronage.
Distance to Supplier As a farmer's purchases increase, both the farmer and supplier may increase the time and effort devoted to purchasing sup-
14
plies. A farmer might consider a larger range of supply sources, including more distant suppliers. Likewise, a plier emphasizing service to large accounts also would be expected to extend its service area. When amount was compared with distance to supplier, a number of ta<:torSJII complicated a simple comparison. Distance to supplier wa$ not a valid measure of a farmer's purchasing effort.
In purchasing groups individual farmers do not select supplier, and distances to the groups' pickup points were great. However, joining a purchasing group can be LUIIIMUClI1IIII
a proxy for a farmer's comparison of a large number of suppliers. The distance to a group's pickup point does not measure the purchasing effort of farmers operating a purchasing group.
The farmers with direct ownership in farm supply outlets were large volume purchasers using suppliers located very near to their farms. The distance traveled was not the rellevanfCl measure of the time and effort devoted by these farmers to
obtain farm supplies. The basic motivation for ownership farm supply distributor may be the same as traveling farther. for supplies, i.e., to obtain supplies at a lower price or of a
higher quality. '1'
In fertilizer the use of bulk pull-type spreaders owned by the ' fertilizer supplier was popular. The farmer moved the equipment from supplier to farm. Each load of fertilizer required .1 another round trip by the farmer, thus distance to the supplitllj became important. Farmers using this type of equipment we~ more likely to patronize suppliers closer to their farm than ,~
farmers not using this equipment. .'
~ The method of feed handling had a major impact on distance: to supplier. Bulk feed suppliers serve large areas and on the I
average were much farther from their customers. When farm- . ers decided to use bulk feed handling, they bought from a smaller number of suppliers.
The purchasing groups, the ownership in farm supply outlets, and the relationship of distance to handling system used precluded a comparison of volume purchased and distance from farm to supplier. With a larger survey, farmers could be divided into groups with similar operations, and comparisons of volume and distance made for each group.
Need for Supply Services
The type of farming enterprise influenced farmers' need for supply services. Dairy farms are an example of a laborintensive enterprise with high demand for supply services. Dairy farms in the survey were typically single-family operations and often used application and delivery services from their suppliers. One dairy farmer described his farm supply dealer as an important part of his business. For many years he had relied on the dealer's services for application of pesticides and fenil izer.
Cash grain farmers in this survey needed fewer services from heir suppliers. They often had equipment and labor for their
t wn on-farm application. Trucks used in grain marketing o ere used to transport fertilizer to the farm. The key element :as labor requirements relative to labor available. A farming
peration with several full-time family members or partners ~uld be a very large production unit and still have labor resources to do many supply and marketing tasks.
Technology
In each survey area technological developments in products, in production methods, and in application and handling equipment had an important impact on the way supplies were obtained. Some developments mainly benefited large-scale operations, but others were directly applicable to moderatesized farms. For example, the pull-type bulk fertilizer spreaders provided by suppliers had a capacity well suited to moderate-sized farms.
In the Delaware survey area, some fertilizer suppliers were applying certain pesticides and fertilizer solutions in 'one operation. This procedure combined the fertilizer and pesti cide purchasing decisions for farmers. Farmers purchasing fertilizer solutions CQuid easily use the same supplier for supplying and applying pesticides. The decision to use fertilizer solutions as opposed to another form of fertilizer could be influenced by the ability to combine the applications.
Aerial spraying usually operated independently of the general farm supply dealers. The introduction of this application method resulted in additional pesticide suppliers serving the area. Greater use of aerial spraying would change the composition of local pesticide dealers or local suppliers would add aerial service.
Different feed handling methods affect the structure of feed dealers. In the survey area local feed mills were being challenged both by more on-farm feed mixing and by bulk feed distribution systems. Farmers traveling to the feed mill for grinding and mixing services preferred a nearby location, and found trips to the mill a convenient time for purchasing other supplies. A farmer that switches to on-farm mixing no longer relies on the services of the feed mill. Supplier's services become less important than price.
When a farmer uses bulk feed deliveries to the farm, services again become important. The bulk truck must arrive on schedule with type and quantity of feed requested. The farmer judges the bulk supplier on service, product quality, and price. With bulk deliveries, feed purchases are not associated with other purchases as they have been with local feed mills. The amount of feed purchased influences the feed handling method used. On-farm feed preparation and bulk feed deliveries we : both used by the large feed users in the survey area.
In summary, the feed systems directly affect the type and location of feed suppliers. When farmers use a local feed mill
for feed preparation, local multi-product stores develop. When farmers change to bulk feed deliveries, a specialized system of regional feed mills occurs. When farmers prepare feed with on-farm mills, they can buy feed ingredients from a wide ~ange of different suppliers.
Regulation by different governmental units reflects the complexity and interaction of agricultural production technology with other parts of society. Changes in product regulation can have major impacts on farmers' purchasing. For example, if requirements for applying regulated pesticides become very complex, some pesticide users will move from self-application of pesticides to greater use of custom application and supplier services. On-farm feed preparation and storage of chemicals are other examples where regulations could affect farmers' decisions on the form of product purchased and supplier sevices used. .
Future technological developments will continue to change the way farmers use and purchase supplies, and alter the role of the farmer, supplier, and supply manufacturer in many ways. Technological differences have created an array of interrelated distribution systems for each supply product. It is difficult to compare prices for a product when the alternative sources differ technologically.
Supply dealers must decide what system or systems they will offer their patrons. If a dealer offers a limited range of products and services, a substantial proportion of potential patrons will not be served. But if a supplier attempts to use all available forms of distribution, the farm supply outlet likely will find itself unable to adequately or efficiently serve its patrons.
Farm Enterprise Growth
A farm enterprise can expand in various ways. A young farmer may use his energies to achieve greater production on more acres. Later this same farmer may see ways to profitably perform more marketing and supply functions and increase the scope of operations. Finally, as experience and resources grow, opportunities outside the farming operation may become attractive and easier to accomplish than further expansion of the farm enterprise. This survey found examples of farming enterprises that had followed this type of development. The land, labor, equipment, and capitalavailable-combined with the interest and skills of the farmer-determined the direction of the enterprise.
The accompanying diagram demonstrates the ways a farm enterprise may expand. The basic agricultural production unit is in the center, with on-farm and off-farm activities extending out from the center.
On-farm Growth One farmer may decide to invest all available time and resources in a larger physical production unit and rely on the supplier for application, transportation, and other services.
15
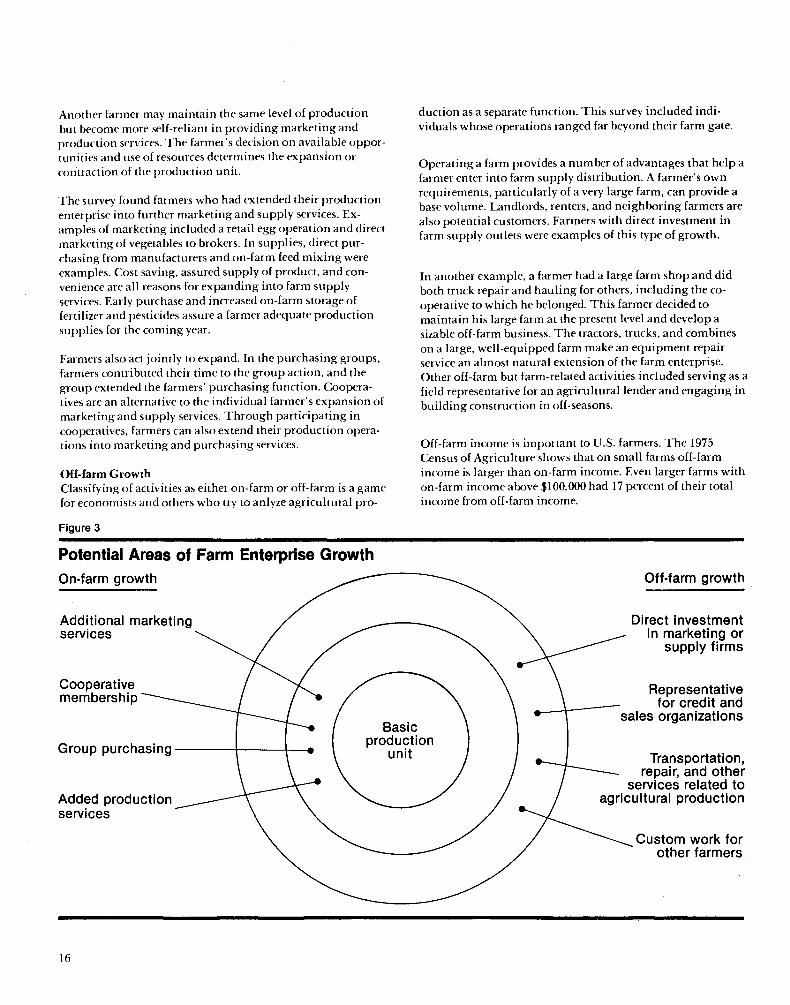
Another farmer may maintain the same level of production but become more self-reliant in providing marketing and production services. The farmer's decision on available opportunities and use of resources determines the expansion or contraction of the production unit.
The survey found farmers who had extended their production enterprise into further marketing and supply services. Examples of marketing included a retail egg operation and direct marketing of vegetables to brokers. In supplies, direct purchasing from manufacturers and on-farm feed mixing were examples. Cost saving, assured supply of product, and convenience are all reasons for expanding into farm supply services. Early purchase and increased on-farm storage of fertilizer and pesticides assure a farmer adequate production supplies for the coming year.
Farmers also act jointly to expand. In the purchasing groups, farmers contributed their time to the group action, and the group extended the farmers' purchasing function. Cooperatives are an alternative to the individual farmer's expansion of marketing and supply services. Through participating in cooperatives, farmers can also extend their production operations into marketing and purchasing services.
Off-farm Growth Classifying of activities as either on-farm or off-farm is a game for economists and others who try to anlyze agricultural pro-
Figure 3
Potential Areas of Farm Enterprise Growth On-farm growth
Additional marketing services
Cooperative membership
duct ion as a separate function. This survey included individuals whose operations ranged far beyond their farm gate.
Operating a farm provides a number of advantages that help a farmer enter into farm supply distribution. A farmer's own requirements, particularly of a very large farm, can provide a base volume. Landlords, renters, and neighboring farmers are also potential customers. Farmers with direct investment in farm supply outlets were examples of this type of growth.
In another example, a farmer had a large farm shop and did both truck repair and hauling for others, including the cooperative to which he belonged. This farmer decided to maintain his large farm at the present level and develop a sizable off-farm business. The tractors, trucks, and combines on a large, well-equipped farm make an equipment repair service an almost natural extension of the farm enterprise. Other off-farm but farm-related activities included serving as a field representative for an agricultural lender and engaging in building construction in off-seasons.
Off-farm income is important to U.S. farmers. The 1975 Census of Agriculture shows that on small farms off-farm income is larger than on-farm income. Even larger farms with on-farm income above $100,000 had 17 percent of their total income from off-farm income.
Off-farm growth
Direct investment in marketing or
supply firms
Group purchasing ----+---4-_
Basic production
unit
Representative for credit and
sales organizations
Transportation, repair, and other
services related to agricultural production Added production
services
16
Custom work for other farmers
strategy Changes
j\comparison was made to determine if individual farmers oded to use the same purchasing strategy in purchasing both
~:rtilizer and pesticides. Feed purchases were not included in his analysis because of the number of farmers that did not ~urchase feed, and fuel purchases were not included because almost all farmers had the same strategy for fuel purchases.
Of the 99 farmers that purchased both fertilizer and pesticides, 57 farmers used the same strategy for purchasing both products. The strongest association between fertilizer and pesticide purchasing strategies existed in Delaware, the weakest in areas with group purchasing of pesticides.
Thirty-five used strategy I, continuing patronage, for purchases of both products. Eighteen farmers used strategy 2, yearly comparisons, for both fertilizer and pesticide purchases. Three farmers purchased both products from a supplier in which they had a financial interest, and one farmer purchased both fertilizer and pesticides directly from a manufacturer.
Total annual purchase for farmers using strategy I for both fertilizer and pesticides averaged $23,900 for both products combined. Farmers using strategy 2 averaged $27,800, and farmers that switched between strategies I and 2 averaged $22,400. The small differences among the groups suggest size of purchases did not appear to be a factor in determining purchasing strategies for fertilizer and pesticides.
General Attitudes About Farm Supply System
The farmers were asked a series of questions about their general attitude toward the farm supply system, especially in meeting their needs for feed, fuel, fertilizer, and pesticides.
The farmers were concerned about prices and availability of fuel and fertilizer, but this was a general concern and was not directed toward their farm suppliers. Although they suggested few changes in the overall system, farmers were planning changes in their farming operation that would influence their purchasing of supplies. Most of the changes would reduce their reliance on suppliers' services. There was a hint that farmers would like more control over the supply of production inputs to remove some of the uncertainty they now feel. A few were considering buying a supply outlet. But the general mood was one of satisfaction with the current performance of their suppliers, and no great changes were expected.
About three-fourths of the farmers rated the services of their fertilizer, pesticide, and feed suppliers as good or excellent. Eighty-five percent rated their petroleum suppliers' services as good or excellent. Suppliers' services for general supplies such as parts, tools, and hardware items were rated good or higher by 65 percent. Out-of-stock items was the chief complaint against the general suppliers.
This survey also asked if local suppliers were competitive in prices and services. Local fuel suppliers were rated as being the most satisfactory. One of 10 farmers thought local fuel price,.s were higher than prices outside the local area, but fuel availability and service were judged to be almost the same in the local area as outside.
One of the five reported local suppliers did not have the needed fertilizer supplies. The same proportion of farmers faulted local fertilizer prices. The services available locally were less of a problem.
Price was the chief fault found with local pesticide suppliers. Twenty farmers considered local prices not competitive with those outside the area. Some farmers, especially vegetable and fruit growers, could not obtain some pesticides they needed. Obtaining services locally was no problem.
One of five feed purchasers thought local prices were higher, and over 10 percent thought local services were not competitive with those of other suppliers. More feed purchasers were concerned about the quality of local services than for any other supply product. Feed availability was no problem. With general supplies both price and availability were considered to be a problem.
In general, farmers felt higher prices were the problem with local farm supply outlets. Farmers appreciated the convenience of local suppliers, and traveling costs and travel time were weighed against lower price that might be available outside the local area. Local pride or willingness to support a local business were not mentioned as reasons for buying locally.
Obviously this question includes subjective elements. The farmer's definition of local supplier was used. Also, economic reasons such as price and travel time came quickly to mind and were easy to express. But underlying willingness to support local businesses may not be included in the answers to
this type questionnaire.
Survey respondents were asked how important it was that their suppliers were cooperatives. All respondents knew which firms were cooperatives. Only a few commented very negatively about cooperatives. Two farmers reported they had received unsatisfactory treatment from cooperatives and did not like the way their cooperatives had operated. Another farmer was opposed in general to the idea of cooperatives. Forty of the 100 farmers indicated that it made no difference to them if a business was a cooperative or not. The remaining 57 farmers saw cooperatives as being important to them in various ways.
Twenty-two of the 57 positive responses concerned the services and products of the cooperatives they patronized. They considered these cooperatives valuable because of their current business performance. Fifteen of the 57 believed cooperatives
17
were important because of the competition they added to the farm supply system. Fourteen other farmers mentioned the "cooperative's nature or the cooperative way of doing business" as important to them. The remaining replies mentioned patronage refunds or gave opinions with no explanations.
In summary, cooperatives were accepted as part of the farm supply system by the survey group of farmers. However, a sizable group saw no special advantage in dealing with cooperatives. The current business performance of cooperatives serving this area was appreciated as being helpful and as being an important competitive factor. The farmers did not stress operating as a cooperative as being important. None mentioned farmer control as a possible reason for choosing a cooperative.
Two-thirds of the 100 survey farmers indicated they would consider advanced contracting for a major part of their supplies. The two survey areas in Kentucky were more willing to
consider contracting than those in Virginia and Delaware. More than 80 percent of the Kentucky farmers and about half of the Delaware fanners would consider contracting.
\;Vhen this survey was taken, the Kentucky farmers were having more difficulty in obtaining fuel and fertilizer so they cited assured supply as a reason for contracting. Supply was rarely mentioned in the other areas. Many farmers induded price discounts as a condition for signing a contract.
In Virginia and Delaware, the principal reason for not considering contracting was the uncertainty of supply prices. If prices dropped, the farmer who had contracted at a higher price would suffer a loss. Other reasons for not contracting were no benefits and difficulty in estimating needs.
Farmers had not signed advanced contracts for fuel purchases. But because of the supplier equipment furnished the farmer, the automatic refill service, and the allocation system in periods of tight supply, farmers and suppliers had established stable arrangements characteristic of a contract. The supplier knew who would be customers, and farmers knew who would supply their fuel.
Implications for Cooperatives
All types of outlets selling farm supplies must rely on farmers' needs to survive. A cooperative has a special dependence on the farmers who are its member-patrons, although it may serve others. But as this service to nonmembers grows, the cooperative nature of the enterprise begins to suffer, especially if no steps are taken to re<Tuit lIIelllbers fro III eligible nonlllelllbers.
Impact of Purchasing Strategies
Farm supply cooperatives are affected by the different buying strategies of farmers.
18
Strategy 1. Continuing Patronage Farmers who use the same suppliers on a continuing basis have purchasing practices that are very compatible with membership in a cooperative. Member participation in financing and controlling the cooperative rely on membership and patronage over time. Most cooperatives obtain their equity financing by retaining patronage refunds allocated to members. If patronage is constant, individuals using the cooperative will be similar to individuals supplying the equity. However, with rapidly changing membership, this match between patronage and equity capital breaks down. The same type of argument applies to membership control of a cooperative. A period of time is needed for a member to develop the knowledge and background necessary to serve on a board of directors. An individual who is not a steady customer of the cooperative may not be as willing or able to participate in organizational activities.
As mentioned, fuel purchasers tended to patronize the same suppliers year after year. With other supplies, users of supplier services usually stayed with the same supplier. In theory, handling fuel and providing services with product sales would be the most appropriate lines of business for cooperatives. However, a farm supply cooperative must be an economically successful unit, and it is foolish to push a service or product simply because it theoretically fits into the cooperative mold. The needs of the farmers should always determine the products and services provided.
A cooperative is set up to serve its members, not one-time users. A cooperative may serve a wide range of customers, but the membership core with its continued patronage gives meaning to the cooperative method. Cooperatives need the products, services, and types of farmers that encourage continued patronage.
Strategy 2. Seasonal Price Comparisons Farmers purchasing supplies based on seasonal price comparisons are willing to buy supplies from a variety of sources. Dealer location and services are not of prime importance. A number of farm supply firms will probably be considered. Farmers and suppliers both understand that each sale stands on its own, and the other will try to deal at the most advantageous price next year.
The lack of year-to-year continuity of this strategy interferes with cooperative financing and member participation. Also, cooperatives have non price characteristics that do not lend themselves to direct price comparison. Mem ber control of the organization is an example. Cooperatives rely on year-end patronage refunds for price adjustments to the farmer. The possibility of a patronage refund makes a direct price comparison difficult at the time of purchase.
A cooperative, however, must face price comparisons. Farmers in this survey valued the competition added by cooperatives
and their perfo~man~e. However,.survey responde~ts did not tronize a busmess Just because It was a cooperatIve. All
~pplY outlets were judged competitively. A pricing policy ~at reflects the costs of services offered and allows discounted
rices when services are not used may make the local sup-p. . H If' plier's pnces more attractive. owever, on y costs 0 periph-eral services may be easily separated. As the farmer is willing to do more basic functions allocating costs becomes more difficult and more subjective.
A cooperative organization might be developed at a level different than the local service level. For example, a regional COOperative serving local cooperatives could establish a special distribution system for farmers who performed supply functions for themselves. A separate system could use more straightforward cost accounting methods, with more freedom in pricing.
However, a separate system would conflict with local cooperatives. Also, shifting volume from the normal distribution channel to another system may cause the normal channel to become less efficient. All businesses have a legal requirement to charge similar customers similar prices. In addition, a cooperative is concerned with treating all members fairly. Prices should be based on \Vellundnstood criteria.
Strategy 3. Direct Purchase Farmers purchasing farm supplies direct from manufacturers or regional distributors are challenging local cooperatives and all other local supply outlets. If the range of services, including product availability, does not offset the differences between local prices and direct prices in the farmer's mind, the farmer will not use the local outlet.
Farm operators who decide their time, efforts, equipment, and facilities can be most profitably used in obtaining supplies in a more direct manner may expand their operation to include these functions.
The board of directors and management of a cooperative should strive to operate an efficient business organization with flexibility to meet the needs of a range of farmers. The total farm supply system must have segments to serve various types of farmers. A single organization may find it impossible to serve all farmers in an area.
Strategy 4. Direct Investment in Farm Supply System Direct investment by a farmer in the supply system expresses the same basic concept as the formation of a farm supply cooperative. Both are saying that farmers will be better off by gaining greater participation in the distribution system for farm supplies.
The previous discussion of the impact of farmers' direct purchases on cooperatives also applies to farmers' direct investment in the supply distribution system. Experienced farmers
have an excellent background for evaluating the products and services the farm supply system offers and choosing the strategies they believe will serve them best. A large farmer's supply volume can assist the farmer's own supply outlet, but if prices and products are not competitive, the farm production unit will not be helped.
Need for Flexibility
The more efficient and flexible a local farm supply cooperative is, the fewer the farmers who will choose to purchase direct from manufacturers or set up their own supply operations. However, the potential for both activities is always there, and a number of the larger farmers are always considering these options.
Cooperatives have the potential for considerable organizational flexibility, especially involving other cooperatives. Changes usually can occur, provided they do not jeopardize members' interests and will probably improve services. The broad ownership of cooperatives does require consulting and convincing members. This slows the decision process, but with good planning and leadership, the cooperative form of operation can adapt to changing circumstances.
Patron control of cooperatives should allow acceptance of a wide range of products and services. A manufacturing firm searches for markets that can best use its products. A cooperative focuses on its patrons and searches for the products and services they can best use. Theoretically, cooperatives should be less tied to a particular product line and freer to adopt new products and services.
A cooperative owned by farmer-members does have the ability to rethink and reshape itself into a structure that can better serve farmers. If the organization does not appear to have the strength and resources to develop the best supply system to serve farmers, the farmer-members could decide to develop a new cooperative structure. Merger with a similar cooperative in an adjacent area may create an organization with expanded opportunities.
19
U.S. Department of Agriculture Agricultural Cooperative Service
Agricultural Cooperative Service provides research, management. and educational assistance to cooperatives to strengthen the economic position of farmers and other rural residents. It works directly with cooperative leaders and Federal and State agencies to improve organization, leadership, and operation of cooperatives and to give guidance to further development.
The agency (1) helps farmers and other rural residents obtain supplies and services at lower costs and to get better prices for products they sell; (2) advises rural residents on developing existing resources through cooperative action to enhance rural living; (3) helps cooperatives improve services and operating efficiency; (4) informs members, directors, employees, and the public on how cooperatives work and benefit their members and their communities; and (5) encourages international cooperative programs.
The agency publishes research and educational materials, and issues Farmer Cooperatives. All programs and activities are conducted on a nondiscriminatory basis, without regard to race, creed, color, sex, or national origin.
{rU.S. GOVERNMENT PRll\1TING OFFICE: 1981 - 729-349/2047