Embed Size (px)
Citation preview
Informing the Financing of Universal Energy Access: An Assessment of Current Flows
NOTA DILAVORO56.2011
By Morgan Bazilian and Patrick Nussbaumer, United Nations Industrial Development Organization , Vienna, Austria Giorgio Gualberti, Technical University of Lisbon, Lisbon, Portugal Erik Haites, Margaree Consultants Inc., Toronto, Canada Michael Levi, Council on Foreign Relations, New York, USA Judy Siegel, Energy and Security Group, Reston, Virginia, USA Daniel M. Kammen, The World Bank, Washington DC, USA Joergen Fenhann, UNEP Risoe Centre, Technical University of Denmark
The opinions expressed in this paper do not necessarily reflect the position of Fondazione Eni Enrico Mattei
Corso Magenta, 63, 20123 Milano (I), web site: www.feem.it, e-mail: [email protected]
Energy: Resources and Markets Editor: Giuseppe Sammarco
Informing the Financing of Universal Energy Access: An Assessment of Current Flows By Morgan Bazilian, United Nations Industrial Development Organization, Vienna, Austria Patrick Nussbaumer, United Nations Industrial Development Organization , Vienna, Austria Giorgio Gualberti, Technical University of Lisbon, Lisbon, Portugal Erik Haites, Margaree Consultants Inc., Toronto, Canada Michael Levi, Council on Foreign Relations, New York, USA Judy Siegel, Energy and Security Group, Reston, Virginia, USA Daniel M. Kammen, The World Bank, Washington DC, USA Joergen Fenhann, UNEP Risoe Centre, Technical University of Denmark Summary Energy poverty is widely recognized as a major obstacle to economic and social development and poverty alleviation. To help inform the design of appropriate and effective policies to reduce energy poverty, we present a brief analysis of the current macro financial flows in the electricity and gas distribution sectors in developing countries. We build on the methodology used to quantify the flows of investment in the climate change area. This methodology relies on national gross fixed capital formation, overseas development assistance, and foreign direct investment. These high-level and aggregated investment figures provide a sense of scale to policy-makers, but are only a small part of the information required to design financial vehicles. In addition, these figures tend to mask numerous variations between sectors and countries, as well as trends and other temporal fluctuations. Nonetheless, for the poorest countries, one can conclude that the current flows are considerably short (at least five times) of what will be required to provide a basic level of access to clean, modern energy services to the “energy poor”. Keywords: Energy Access, Energy Finance, Financial flows JEL Classification: Q4 Address for correspondence: Morgan Bazilian United Nations Industrial Development Organization Wagramerstr 5 P.O. Box 300 A-1400 Vienna Austria E-mail: [email protected]

Disclaimer
This document represents work in progress and is intended to generate comment and discussion. The views expressed herein are those of the author(s) and do not necessarily reflect the views of the United Nations Industrial Development Organization. This document has been produced without formal United Nations editing. The designations employed and the presentation of the material in this document do not imply the expression of any opinion whatsoever on the part of the Secretariat of the United Nations Industrial Development Organization concerning the legal status of any country, territory, city or area or of its authorities, or concerning the delimitation of its frontiers or boundaries, or its economic system or degree of development. Designations such as “developed”, “industrialized” and “developing” are intended for statistical convenience and do not necessarily express a judgment about the stage reached by a particular country or area in the development process.
Abstract: Energy poverty is widely recognized as a major obstacle to economic and social development and poverty alleviation. To help inform the design of appropriate and effective policies to reduce energy poverty, we present a brief analysis of the current macro financial flows in the electricity and gas distribution sectors in developing countries. We build on the methodology used to quantify the flows of investment in the climate change area. This methodology relies on national gross fixed capital formation, overseas development assistance, and foreign direct investment. These high-level and aggregated investment figures provide a sense of scale to policy-makers, but are only a small part of the information required to design financial vehicles. In addition, these figures tend to mask numerous variations between sectors and countries, as well as trends and other temporal fluctuations. Nonetheless, for the poorest countries, one can conclude that the current flows are considerably short (at least five times) of what will be required to provide a basic level of access to clean, modern energy services to the “energy poor”.
1. Introduction
Large investments will be required to address the massive expected energy demand growth in developing countries while also providing full access to energy services. To inform the design of policy tools to incentivize greater financial flows into expanding access, we focus on the macro financial flows in the energy sector (primarily infrastructure investment in the power and gas distribution sectors) in developing countries. We then briefly consider the relationship of these flows to the issue of energy poverty (see IEA, 2010; Bazilian et al., 2010). We find that the financial flows related to the energy sector in developing countries are significant, but still inadequate to the task of delivering energy access to those who lack it. Ultimately, this research is presented to inform future more detailed analysis.
We build on the methodology devised to quantify the flows of investment in the climate change area (UNFCCC, 2007). This methodology relies on national gross fixed capital formation, overseas development assistance, and foreign direct investment. We begin by providing a sense of scale by considering recent and ‘iconic’ investment figures in the policy realm in section 2. We describe the methodology applied to estimate the financial flows in the energy sector in Section 3. In section 4, we present past trends. We then discuss some links with energy poverty in section 5. Section 6 outlines further work required to advance this research agenda.
2. ‘Beautiful Numbers’
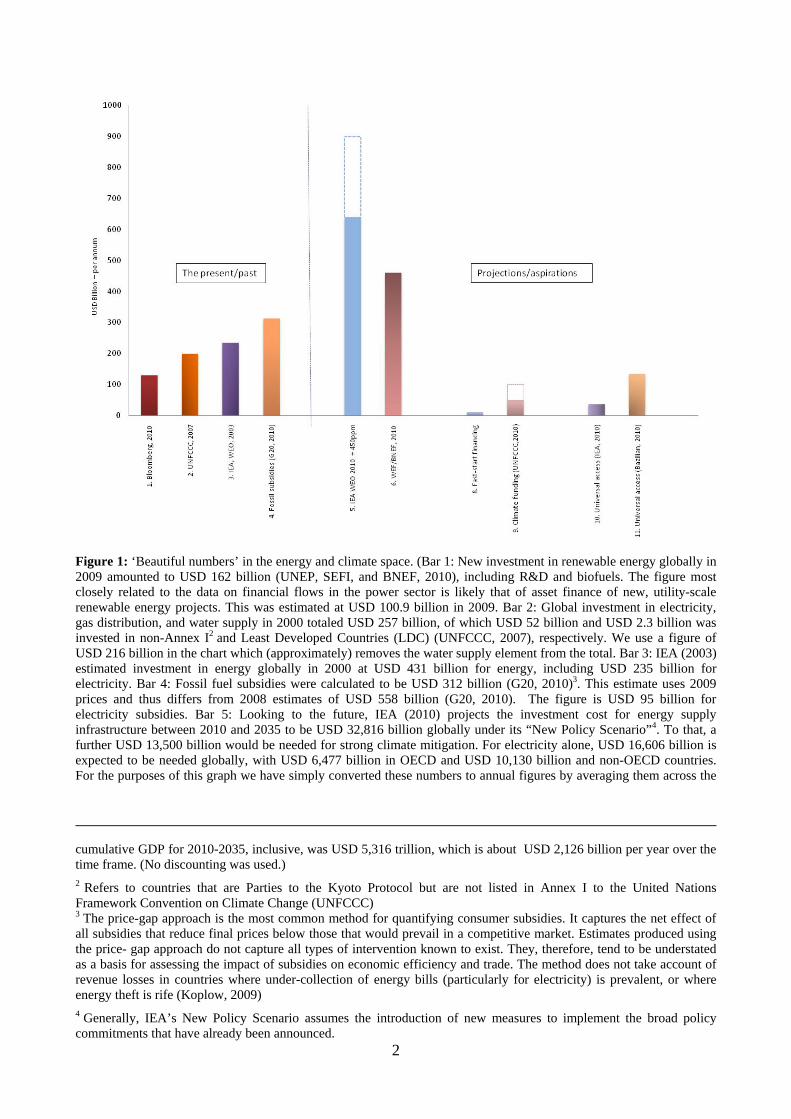
Several iconic investment figures are informing policy decisions related to international energy and climate change policy. High-level aggregated figures like these are important to provide a general sense of scale. However, these ‘beautiful numbers’ are difficult to compare and thus often confuse ongoing discussions. Figure 1 depicts ten such global investment figures, ranging from present energy investments (on the left), to projections of future energy infrastructure investment, to estimates of the cost of delivering universal energy access and of meeting global climate change goals. We briefly consider these figures in order to provide additional transparency and clarity, and to help frame our financial flows analysis. The figure presents the power sector aspect of each analysis as this sector is closest to the data sets that we explore for financial flows1.
1 To provide a climate perspective, The Stern Review (2006) estimated that approximately one percent of global GDP will be needed to limit atmospheric CO2 concentrations to 500-550PPM through 2050. We used IMF calculations for GDP growth to 2016 using current US dollars and extrapolated through 2035 to match IEA and other data; the
2
Figure 1: ‘Beautiful numbers’ in the energy and climate space. (Bar 1: New investment in renewable energy globally in 2009 amounted to USD 162 billion (UNEP, SEFI, and BNEF, 2010), including R&D and biofuels. The figure most closely related to the data on financial flows in the power sector is likely that of asset finance of new, utility-scale renewable energy projects. This was estimated at USD 100.9 billion in 2009. Bar 2: Global investment in electricity, gas distribution, and water supply in 2000 totaled USD 257 billion, of which USD 52 billion and USD 2.3 billion was invested in non-Annex I2 and Least Developed Countries (LDC) (UNFCCC, 2007), respectively. We use a figure of USD 216 billion in the chart which (approximately) removes the water supply element from the total. Bar 3: IEA (2003) estimated investment in energy globally in 2000 at USD 431 billion for energy, including USD 235 billion for electricity. Bar 4: Fossil fuel subsidies were calculated to be USD 312 billion (G20, 2010)3. This estimate uses 2009 prices and thus differs from 2008 estimates of USD 558 billion (G20, 2010). The figure is USD 95 billion for electricity subsidies. Bar 5: Looking to the future, IEA (2010) projects the investment cost for energy supply infrastructure between 2010 and 2035 to be USD 32,816 billion globally under its “New Policy Scenario”4. To that, a further USD 13,500 billion would be needed for strong climate mitigation. For electricity alone, USD 16,606 billion is expected to be needed globally, with USD 6,477 billion in OECD and USD 10,130 billion and non-OECD countries. For the purposes of this graph we have simply converted these numbers to annual figures by averaging them across the
cumulative GDP for 2010-2035, inclusive, was USD 5,316 trillion, which is about USD 2,126 billion per year over the time frame. (No discounting was used.) 2 Refers to countries that are Parties to the Kyoto Protocol but are not listed in Annex I to the United Nations Framework Convention on Climate Change (UNFCCC) 3 The price-gap approach is the most common method for quantifying consumer subsidies. It captures the net effect of all subsidies that reduce final prices below those that would prevail in a competitive market. Estimates produced using the price- gap approach do not capture all types of intervention known to exist. They, therefore, tend to be understated as a basis for assessing the impact of subsidies on economic efficiency and trade. The method does not take account of revenue losses in countries where under-collection of energy bills (particularly for electricity) is prevalent, or where energy theft is rife (Koplow, 2009) 4 Generally, IEA’s New Policy Scenario assumes the introduction of new measures to implement the broad policy commitments that have already been announced.
3
time period5. Bar 6: The WEF/BNEF figures reflect future projections to 2030 for clean energy minus the projections for biofuels (See WEF, 2010 – Figure 4). Bars 7 and 8: The promised fast-start financing under the Copenhagen Accord represents USD 10 billion annually between 2010 and 2012. Further, developed country Parties committed to a goal of mobilizing jointly USD 100 billion per year by 2020 to address the needs of developing countries. (Roughly half that amount would go to adaptation). Bars 9 and 10: IEA, UNDP, and UNIDO (2010) estimate the cost of universal energy access at USD 756 billion between 2010 and 2035, whereas Bazilian et al. (2010) find a cumulative USD 1,500 billion to 2030 in their ‘high’ scenario. Again, both figures are averaged over the period to present annual figures.
These figures, as valuable as they might be, are difficult to interpret and compare for a number of reasons, including:
• different methodologies employed • different country coverage • different definitions for investments or flows • different sectors covered • different end years for analysis • averages vs. individual years • actual vs. projections
What is clear, however, is that current estimates of the investments required to provide universal access to energy services are considerably lower than projected investments in the energy sector in general or the estimated need for additional investment in ambitious climate change mitigation scenarios.
3. Methodology
There is an extensive literature on international financial flows to developing countries, mostly going beyond the core of this analysis (see e.g., Albuquerque, 2003; Asiedu, 2002; Bahmani-Oskooee, 1986; Barnett, 1993; Bird, 1981; Claessens and Schmukler, 2007; Fung, 2009; Gelos, Sahay, and Sandleris, 2011; Kasuga, 2007; Kim, 2000; Kinda, 2010; Knight, 1998; Laureti and Postiglione, 2005; McGillivray, 1989; Mishkin, 2009; Mody and Murshid, 2005; Munduch and Weinberg, 1979; Noorbakhsh, Paloni, and Youssef, 2001; Odedokun, 1996; Rao, 1997; Sadik and Bolbol, 2001; Singh and Zammit, 2000; Steel et al., 1997).
Data on current financial flows to the energy sector generally stem from either aggregated global or regional estimates, or scattered and un-processed datasets (Olbrisch et al., 2011). The principal obstacle in this analysis stems from data paucity, particularly in the case of developing and least developed countries (LDC). In particular, there is no comprehensive assessment of the current financial flows to address energy poverty. We utilise various sources to help address this analytical gap.
We focus on electricity production and gas distribution, which represents one of the dozen or so other sectors detailed in financial flow data sets6. Still, resource-rich developing countries are also the target of growing investments in the upstream energy sector of oil, coal and gas extraction and processing (see Section 3.2.1)7. These investments are targeted mainly to the export sector and are not directly linked with the energy access infrastructure, thus they are not considered in this analysis8.
5 This is a highly simplistic way to come to such average figures, but often the presentation of the figures precludes other methods. 6 The sub-sectors vary by dataset. They typically include, agriculture, hunting, forestry, fishing; mining and quarrying; manufacturing; electricity, gas and water supply; construction; transport, storage and communication; financial intermediation, real estate, renting and business activities; wholesale retail trade, repair of motor vehicles, motorcycles, etc, hotels and restaurants; public administration and defence, compulsory social security; education, health and social work, other community, social and personal services; and dwellings 7 There is a wide literature on the relation between extractive industries and poverty reduction with a particular relevance of the Extractive Industries Review process of the World Bank (Salim, 2003; World Bank, 2004; Pegg, 2006). 8 On the specific topic of energy poverty in resource-rich countries, the WEO 2008 analyses ten Sub-Saharan oil exporting countries and concludes that the total additional cost of universal access to electricity and clean cooking stoves would be just 0.4% of the oil intake by the governments from 2006 to 2030 (IEA, 2008).
4
We draw heavily on the precedent created to evaluate the investment and financial flows in the climate change space, notably the methodology applied in UNFCCC (2007). We complement the existing literature by:
• Increasing the granularity in terms of geographical coverage and providing data at the national level for energy investments
• Refining existing estimates with additional information from various complementary sources
• Providing an update on the existing figures by using the most recent available datasets
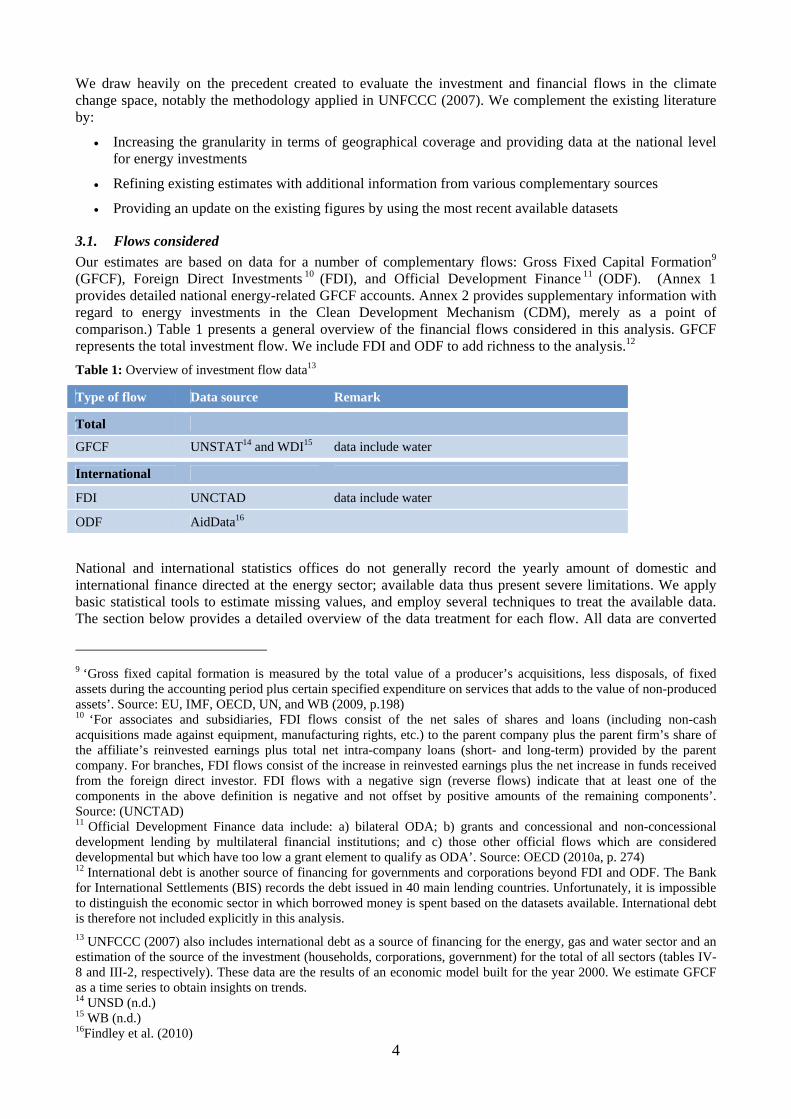
3.1. Flows considered Our estimates are based on data for a number of complementary flows: Gross Fixed Capital Formation9 (GFCF), Foreign Direct Investments 10 (FDI), and Official Development Finance 11 (ODF). (Annex 1 provides detailed national energy-related GFCF accounts. Annex 2 provides supplementary information with regard to energy investments in the Clean Development Mechanism (CDM), merely as a point of comparison.) Table 1 presents a general overview of the financial flows considered in this analysis. GFCF represents the total investment flow. We include FDI and ODF to add richness to the analysis.12 Table 1: Overview of investment flow data13
Type of flow Data source Remark
Total
GFCF UNSTAT14 and WDI15 data include water
International
FDI UNCTAD data include water
ODF AidData16
National and international statistics offices do not generally record the yearly amount of domestic and international finance directed at the energy sector; available data thus present severe limitations. We apply basic statistical tools to estimate missing values, and employ several techniques to treat the available data. The section below provides a detailed overview of the data treatment for each flow. All data are converted
9 ‘Gross fixed capital formation is measured by the total value of a producer’s acquisitions, less disposals, of fixed assets during the accounting period plus certain specified expenditure on services that adds to the value of non-produced assets’. Source: EU, IMF, OECD, UN, and WB (2009, p.198) 10 ‘For associates and subsidiaries, FDI flows consist of the net sales of shares and loans (including non-cash acquisitions made against equipment, manufacturing rights, etc.) to the parent company plus the parent firm’s share of the affiliate’s reinvested earnings plus total net intra-company loans (short- and long-term) provided by the parent company. For branches, FDI flows consist of the increase in reinvested earnings plus the net increase in funds received from the foreign direct investor. FDI flows with a negative sign (reverse flows) indicate that at least one of the components in the above definition is negative and not offset by positive amounts of the remaining components’. Source: (UNCTAD) 11 Official Development Finance data include: a) bilateral ODA; b) grants and concessional and non-concessional development lending by multilateral financial institutions; and c) those other official flows which are considered developmental but which have too low a grant element to qualify as ODA’. Source: OECD (2010a, p. 274) 12 International debt is another source of financing for governments and corporations beyond FDI and ODF. The Bank for International Settlements (BIS) records the debt issued in 40 main lending countries. Unfortunately, it is impossible to distinguish the economic sector in which borrowed money is spent based on the datasets available. International debt is therefore not included explicitly in this analysis. 13 UNFCCC (2007) also includes international debt as a source of financing for the energy, gas and water sector and an estimation of the source of the investment (households, corporations, government) for the total of all sectors (tables IV-8 and III-2, respectively). These data are the results of an economic model built for the year 2000. We estimate GFCF as a time series to obtain insights on trends. 14 UNSD (n.d.) 15 WB (n.d.) 16Findley et al. (2010)
5
into USD 2000 using GDP deflators and exchange rates17. We focus on the timeframe 2000-2009, and utilise data from project level databases (ODF and Private Participation in Infrastructure database18 (PPI)) and data from National Accounts (GFCF and FDI). We recognize that investment decisions in the project level database may not reflect immediately in the national accounts, or may generate multi-year flows.
3.1.1. GFCF GFCF data are aggregated for specific sectors and/or for the entire economy. Here we are interested in the electricity, gas distribution and water supply, for which data are available only for selected countries19. For the countries with incomplete time series for this sector, we use the average national share from the years for which data is available and compute the missing ones based on the total GFCF for years where it is not. Where sector-specific data are missing altogether, we use a weighted average share of GFCF for electricity, gas distribution and water supply over the total (3.8% and 8.1% for OECD and non-OECD, respectively) and compute it as a best approximation for the missing national data20. It is important to note that that GFCF data are based on national accounts’ definitions of sectors, and therefore electricity, gas distribution and water are included in the same sector. Comprehensive datasets distinguishing the water component from electricity and gas distribution do not exist. We exclude the water component by subtracting it from the total based on the ratios21 available in UNFCCC (2007), which are based on OECD data.
Various investments in coal, oil and gas production, processing and transportation facilities are spread across other sectors in the national accounts - mining and quarrying, industry, and transportation etc - which also include other facilities. Therefore, compiling data on investment in coal, oil, and gas supply from national accounts is challenging. Also, the extractive sectors are often export-oriented, and the link with national energy access is therefore weaker. Nonetheless, cumulative investment in coal, oil and gas is roughly equivalent to power sector investment (see e.g., IEA, 2010). Finally, we have excluded a number of countries or sub-national entities22 from the analysis for various reasons (e.g. statistical anomalies, lack of data).
3.1.2. FDI FDI data are available in aggregate and by sector, including for electricity, gas distribution and water. We only consider FDI inflows, as our interest lies in the investments in particular countries23. In general, the datasets are relatively ‘patchy’. Rather than trying to extrapolate the figures based on bold assumptions to
17 Data source: (WB) 18 Although the PPI database presents many project level details for the investments with private participation from international and domestic investors, the data do not precisely match the definition of Foreign Direct Investments, even if accounting only for the international part of the investments as we did. In particular, dis-investments, reinvested earnings (or repatriation of profits) and intra-company loans (positives or negatives) are not recorded and PPI, despite the obvious overlap with FDI data, cannot substitute it. The PPI data has been therefore used only to compare the share of water investments on the total energy plus water investment, a detail that is not included in the FDI statistics. The overall value of foreign investments recorded by the PPI for the period 2000-2008 for developing countries is 72% of the value recorded by FDI statistics. National shares may vary. 19 Armenia, Australia, Austria, Azerbaijan, Belarus, Belgium, Botswana, Canada, Cyprus, Czech Republic, Denmark, Egypt, Estonia, Finland, France, Germany, Greece, Hungary, Iceland, India, Iraq, Ireland, Israel, Italy, Jordan, Kenya, Republic of Korea, Kuwait, Kyrgyzstan, Latvia, Lithuania, Luxembourg, Macao SAR, Macedonia, Malta, Mauritius, Namibia, Netherlands, Netherlands Antilles, New Zealand, Niger, Norway, Pakistan, Poland, Portugal, Qatar, Slovakia, Slovenia, South Africa, Spain, Sudan, Sweden, Syrian Arab Republic, Trinidad and Tobago, Tunisia, Ukraine, United Arab Emirates, United States, and Yemen. 20 In a few cases and for selected years (Andorra, Bermuda, Burundi, Channel Islands, Greenland, Guinea-Bissau, Haiti, Isle of Man, Kiribati, Liechtenstein, Maldives, Marshall Islands, Micronesia, Monaco, Palau, Samoa, San Marino, Solomon Island, Suriname, Tanzania, Timor-Leste, Netherland Antilles, West Bank and Gaza) where the total GFCF data is missing, we estimate it using a weighted share of GFCF for electricity, gas distribution and water over GDP (0.8% and 2.5% for OECD and non-OECD, respectively). 21 Electricity: 77%; Gas distribution: 7%; and Water: 16% 22 Afghanistan, American Samoa, Cayman Islands, Democratic Republic of Korea, Faeroe Islands, Gibraltar, Guam, Mayotte, Myanmar, Northern Mariana Islands, Puerto Rico, Sao Tome and Principe, Somalia, Turks and Caicos Islands, Tuvalu, Sudan, and Virgin Islands (U.S.). 23 FDI is an important factor for growth in developing countries as it brings about skills, know-how and market access (UNIDO, 2007).

6
cover for the missing data, we focus our analysis on a subset of countries for which the data is available24. Thus we do not present an aggregated time-series, as we do for GFCF and ODF.
We use a complementary database, the Private Participation in Infrastructure Database25 which collects data separately for projects in the energy and water sectors, to evaluate the proportion of investment in each of energy and water, which we then apply to isolate the water component. We find that at the global level, between 2000 and 2008, the investment in the water sector was approximately 10% of the total, although national shares can differ significantly. Unfortunately, UNCTAD does not differentiate between ‘greenfield’ and mergers and acquisitions flows; in other words, there is no means to distinguish between investments in new projects and financial transactions not leading to additional assets.
3.1.3. ODF Official Development Finance data is available for the energy sector and its sub-components, including energy policy, renewable sources, non-renewable sources, and others. The source used, AidData (Findley et al., 2010), contains all the data included in the Creditor Reporting System (CRS) database of the OECD and adds greater coverage of multilateral organizations and of non-OECD donors26. We include only projects related to the energy sector, following the methodology applied in OECD (2010)27, and exclude refinancing loans. It must be noted that ODF (or ODA) are commitments proclaimed by the donors, not actual flows.28
4. Financing energy: past trends
Financing for the energy sector is obviously contingent on trends in overall capital flows. The recent financial crisis affected developing countries in a number of ways. Notably, it hurt export revenues, caused remittances to decline, and ODA is likely to further suffer from the retrenchment of donor countries (UN 2011). While we focus on GFCF, Foreign Direct Investment, and Official Development Finance, other capital flows, in particular portfolio investments (debt and equity) and short and long-term private bank lending will provide additional finance to the energy sector.
4.1. Gross Fixed Capital Formation To provide a sense of scale, it is useful to consider energy-related investment in relation to global investment. The share of GFCF for energy represented 2.8% of the total in 2000, with the largest shares being wholesale retail trade (34%), manufacturing (17%), and construction (11%)29.
Global GFCF for electricity and gas distribution has been rising steadily throughout the past decade, with the notable exception of 2009 (Table 2). At the regional level, the trends are similar, although not quite as clear-cut. GFCF for electricity and gas distribution in the OECD was stagnant or decreasing between 2000 and 2005, before picking up sharply. In the LDCs, GFCF in electricity and gas distribution has doubled in a decade, although the absolute value remains low.
24 It is likely that some GFCF will occur every year in the electricity, gas distribution and water sector in a country, so estimating data for years with missing data using data for the other years appears as a reasonable assumption. However, when extrapolating figures for FDI, no inward FDI in the electricity, gas distribution and water sector is possible. Thus, estimating values for the years with zero inward FDI from data for the other years could then be incorrect and misleading. 25 WB (n.d.) 26 The average yearly sum of ODF commitments for the energy sector of LDCs recorded in the CRS database is 2.1% inferior of the same data selection in AidData.org database. If we consider all recipients, CRS present on average a yearly total 22.8% lower than AidData. 27 ODF data is coded under CRS purpose codes. We have included in our analysis the following sub sectors and codes: 23010 Energy policy and administrative management; 23020 Power generation, non-renewable sources; 23050 Gas distribution; 23061 Oil-fired power plants; 23062 Gas-fired power plants; 23063 Coal-fired power plants; 23030 Power generation/renewable sources; 23040 Electrical transmission/distribution; 23065 Hydro-electric power plants; 23066 Geothermal energy; 23067 Solar energy; 23068 Wind owe; 23069 Ocean power; 23070 Biomass; 23064 Nuclear power plants; 23081 Energy education/training; 23082 Energy research. 28 Disbursements are recorded only for a part (around half) of the records. For the projects for which both data exist, recorded disbursements are in average 30% inferior to commitments. 29 Data from UNFCCC (2007, p. 33)

7
Table 2: Overview of GFCF for electricity and gas distribution (USD billion) constant 2000 prices
2000 2001 2002 2003 2004 2005 2006 2007 2008 200930
OECD 179.1 183.0 175.1 174.3 168.3 173.3 191.8 211.6 222.7 172.2
Non-OECD31 53.5 58.3 60.1 71.2 77.0 84.8 98.1 123.4 153.4 144.5
LDC 1.3 1.4 1.6 1.6 1.7 1.9 2.0 2.3 2.5 2.6
Global 232.6 241.3 235.2 245.5 245.3 258.1 289.9 335.0 376.1 316.6
By means of comparison, IEA (2003) estimated the world investment in electricity and gas32 in 2000 at USD 315 billion. UNFCCC (2007) estimated, based on UNCTAD and OECD data, the investment in electricity and gas distribution reaching USD 216 billion in 2000. Eberhard et al. (2011) also provide very useful analysis on investment in 24 countries of sub-Saharan Africa (SSA)33.
Figure 2 shows the relative evolution in energy-related GFCF in selected34 developing countries. The country datasets are normalized in 2000 to reveal the trends in the recent years. The curves for Namibia and, to a lesser extent, Armenia, urge for caution in interpreting the data, since the flows are subject to significant fluctuations, particularly if they are relatively small in absolute terms. Also, wide variations urge for caution in the interpretation of the datasets.
0
100
200
300
400
500
600
700
800
900
2000 2001 2002 2003 2004 2005 2006 2007 2008 2009
Nor
mal
ised
ene
rgy-
rela
ted
GFC
F
ArmeniaBotswanaIndiaNamibiaNigerSouth Africa
Figure 2: Relative trend in energy-related GFCF in selected developing countries [constant 2000 USD]
30 Incomplete; the sharp decrease is due to the economic crisis as well as to the fact that the dataset is incomplete at the date of writing 31 This row includes the LDC figures 32 Includes not only distribution, but also exploration and development, liquefied natural gas facilities, transmission pipelines, and underground storage facilities. 33 Table A7.1 of Eberard et al. (2011) estimate a yearly average capital expenditure of 2.2 billion (USD current, for the period 2001-2005, excluding Nigeria). As a comparison, for the same years and countries our estimation is 2.1 billion (USD 2000 constant) with the water sector, and 1.8 billion excluding it. 34 The countries highlighted in Figures 2 and 3 were selected to provide illustrative examples of various trends, they are not necessarily a representative sample.
8
This notwithstanding, the analysis indicates a clear positive trend overall. That being noted, the rate of increase varies greatly between the countries (+60% and +160% for Botswana and India, respectively, over 10 years). Interestingly, the trend is in some cases negative, like in the instance of Niger. Noteworthy is also the case of South Africa, where energy-related GFCF increased exponentially in recent years. Incidentally, South Africa is one of the often-quoted success stories with regard to rapidly increasing the rate of access to electricity.
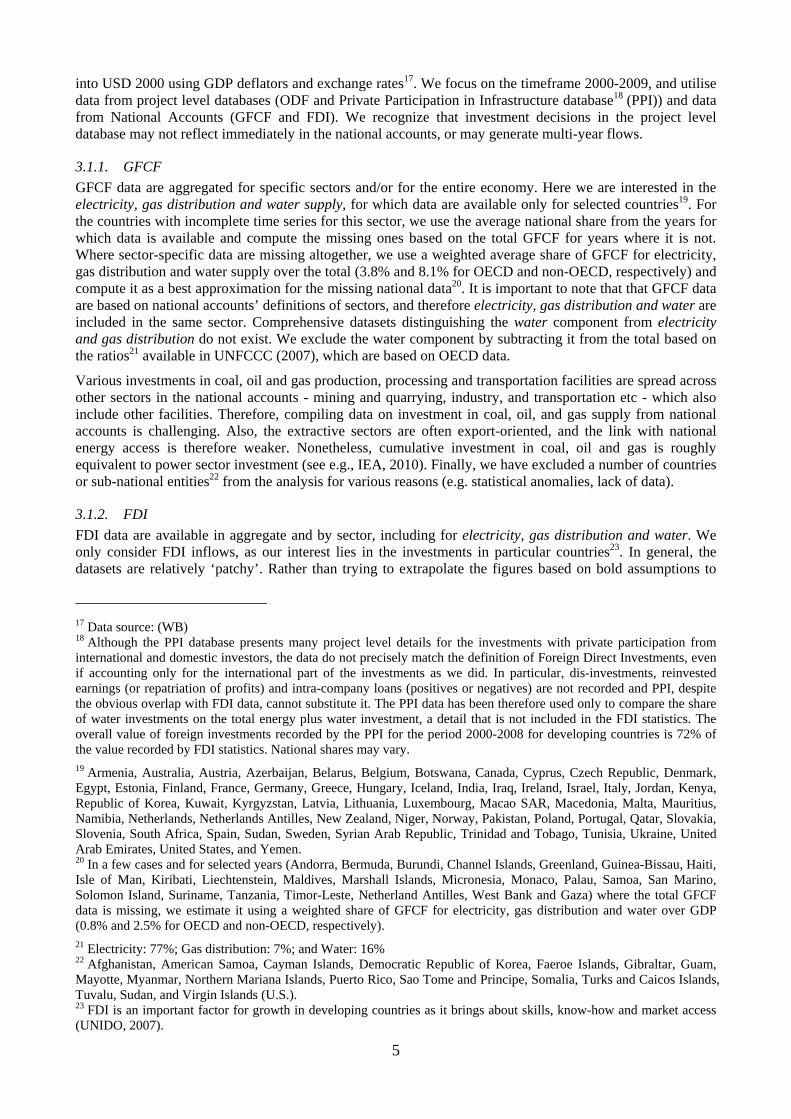
4.2. Foreign Direct Investment Electricity, gas and water represents one of 15 sub-sectors in FDI data sets, including, inter alia, financial intermediation; paper and paper products; food beverage and tobacco. As noted, because of the difficulty in the robustness of the FDI data sets, we do not present a time-series of aggregated figures. However, as an example, we estimated the total 2000 flows to be 30 USD billion35. Foreign direct investment grew steadily for developed and developing economies over recent years until the global financial crisis of 2008. The effect of the crisis on FDI was evident in 2009, and was more pronounced in richer nations than for developing economies. About half of global FDI inflows now go to developing countries and transition economies (UNCTAD, 2010). While the overall trends for FDI inflows in LDCs have been on the rise for the last decade (UNCTAD, 2011), our analysis shows a downward tendency for energy-related36 FDI inflows in those countries (see Figure 3 for several examples).
0
20
40
60
80
100
120
140
160
180
2000 2001 2002 2003 2004 2005 2006 2007 2008 2009 2010
Ener
gy-r
elat
ed in
war
d FD
I flo
ws
[mill
ion
USD
]
0
200
400
600
800
1000
1200
1400
Tota
l inw
ard
FDI f
low
s [m
illio
n U
SD]
BangladeshMadagascarMozambiqueTanzania
Figure 3: Energy-related (plain lines) and total (doted lines) inward FDI flows for selected LDC countries (constant 2000 USD)
Providing insights on trends by region over time is challenging given the data paucity; no clear pattern can be derived from an analysis across developing countries, as the energy-related FDI inflows vary widely between the years. Indeed, the flows have little “inertia” and are strongly influenced by individual projects.
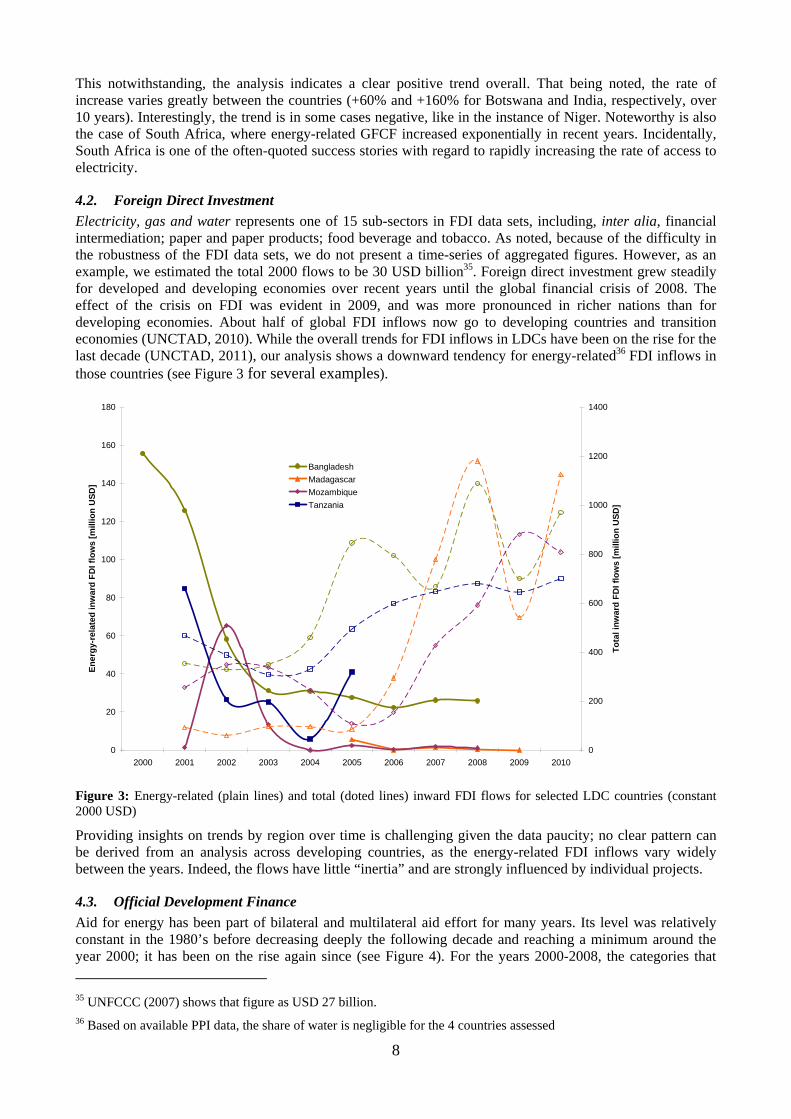
4.3. Official Development Finance Aid for energy has been part of bilateral and multilateral aid effort for many years. Its level was relatively constant in the 1980’s before decreasing deeply the following decade and reaching a minimum around the year 2000; it has been on the rise again since (see Figure 4). For the years 2000-2008, the categories that 35 UNFCCC (2007) shows that figure as USD 27 billion. 36 Based on available PPI data, the share of water is negligible for the 4 countries assessed
9
received the bulk of the energy related development finance were Energy Policy37 (35%), followed by Electrical Transmission (26%), and non-Renewable Energy (17%).
Figure 4: Development Finance for the Energy Sector by purpose; commitments, 1980-2008, using 3-year moving averages [constant 2000 USD].
There has been an almost continuous increase in electricity-related ODF in non-OECD countries during recent years. However, ODF to LDCs has varied widely over the years; it is nonetheless also on an increasing trend (Table 3). Table 3: Overview of ODF for energy generation and supply (USD billion, constant 2000)
2000 2001 2002 2003 2004 2005 2006 2007 2008
LDC 0.74 1.11 0.87 0.88 0.81 1.34 0.72 1.84 1.56
Other non-OECD 5.63 7.60 7.33 7.51 8.43 8.58 10.02 12.15 9.07
Global 6.44 7.80 7.48 7.56 8.69 8.72 10.73 12.40 9.67
4.4. Relationship between GFCF, FDI, and ODA/F A number of scholars have looked into the relationship between ODA/F, FDI and GFCF. Obviously, the effect of FDI on capital formation largely depends on whether FDI is directed to ‘greenfield’ projects as opposed to cross-border Mergers and Acquisitions. Several authors have investigated the relation between FDIs and Official Development Assistance. UNCTAD notes that, especially in Least Developed Countries, FDIs tend to concentrate on the primary sector (mining) until a sufficient level of capability and infrastructure are built. In this context LDCs could leverage ODA for improving the conditions in their respective economies to attract more FDI and enhance their impact (UNCTAD 2010, 62).
37 Includes: Energy sector policy, planning and programmes; aid to energy ministries; institution capacity building and advice; unspecified energy activities including energy conservation
10
While empirically examining FDI and GFCF for the economies in transition, Krkoska (2001) found that a 1% increase in FDI flows translated into 0.7% increase of GFCF in the recipient country. FDI represented an average 15% of the Gross Fixed Capital Formation (UNCTAD, 2010), but its share can be higher for some developing countries (the average for African countries is above 20%). The relationship between ODA/F and gross fixed capital formation is much more ambiguous. First, ODA/F can finance a variety of activities that do not necessarily translate into any increase of fixed assets. Secondly, ODA/F statistics measure the declarations of the donor countries rather than actual flows (both for commitments and for disbursements). During the last couple of decades, FDI increased whilst ODA decreased in 13 LDCs (UNCTAD, 2011).
While still below the level of ODA flows, FDI inflows for energy appear to have represented the major external private capital flows for LDCs in the past decade (UNCTAD, 2011). Our analysis suggests that more than one third of the energy-related investment in LDCs stems from foreign sources, mainly from ODF. Although that share is high, the flow in absolute terms remains low (about 1/10th with respect to other non-OECD countries, or 4% of the estimated world total) compared to other groups of countries.
5. Energy Poverty
Our interest in exploring macro financial flows is to set a context for finance for energy access. Energy poverty, the lack of access to modern, reliable and affordable energy services, affects billions of people. More than a fifth of the world’s population does not benefit from access to electricity. It is well recognized that energy is a necessary ingredient for human development and the achievement of the Millennium Development Goals (Modi et al., 2005). Projections indicate that these issues will persist or worsen in the foreseeable future without dedicated action (IEA, UNDP and UNIDO, 2010).
In 2010 the UN Secretary General’s Advisory Group on Energy and Climate Change (AGECC) suggested two bold, yet achievable global objectives, one of which urges the international community to work towards achieving universal energy access by 2030 (AGECC, 2010). While, at the regional, national, and local levels, significant efforts are underway to address the lack of energy access, the issue of “unlocking” the requisite financing is paramount.
5.1. Energy inequality Poor data make it extremely difficult to determine the fraction of energy-related investment that goes to expanding access rather than to, say, increasing generation. One approach to better understanding the relationship between overall investment in expansion of access is to develop Lorenz curves and Gini coefficients, which are widely used in economics to estimate income inequality (Gastwirth and Glauberman, 1976). These metrics can help to estimate distributions of energy consumption. The Lorenz curve is a ranked distribution of the cumulative percentage of the population of recipients plotted against the cumulative percentage of the resource distributed. The Gini coefficient is a numeric measure of inequality that reveals the difference between a uniform distribution and the actual distribution of a resource38.
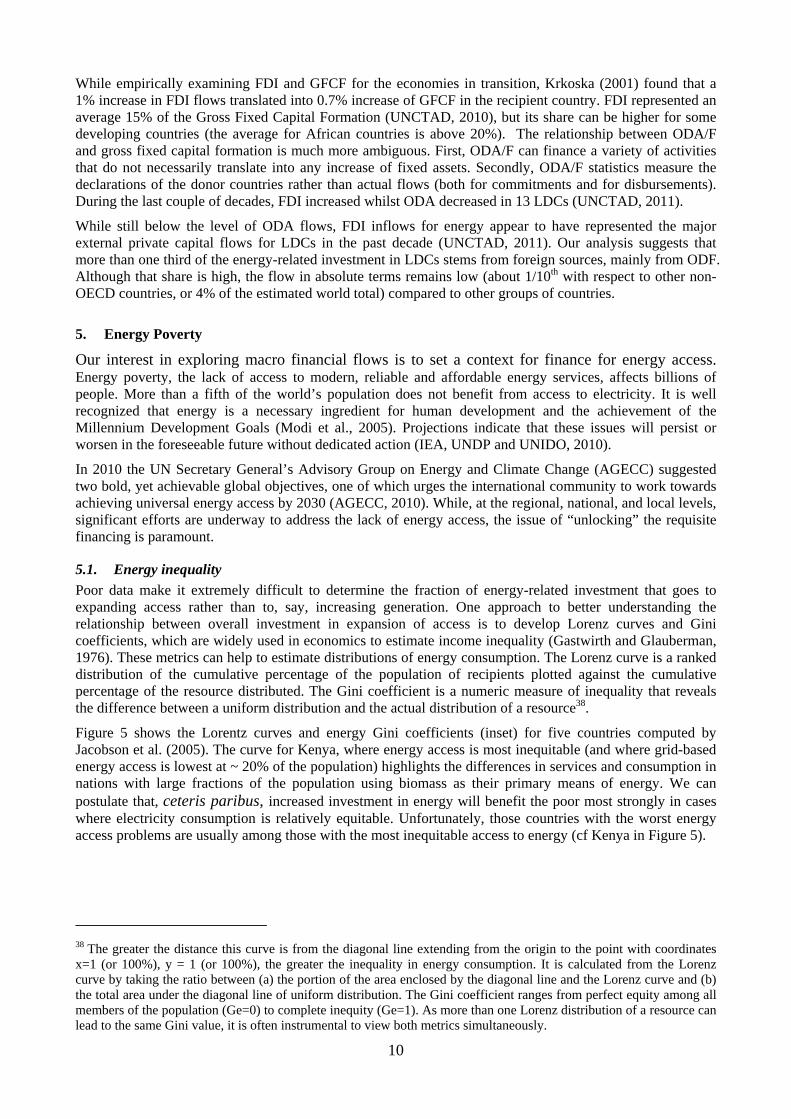
Figure 5 shows the Lorentz curves and energy Gini coefficients (inset) for five countries computed by Jacobson et al. (2005). The curve for Kenya, where energy access is most inequitable (and where grid-based energy access is lowest at ~ 20% of the population) highlights the differences in services and consumption in nations with large fractions of the population using biomass as their primary means of energy. We can postulate that, ceteris paribus, increased investment in energy will benefit the poor most strongly in cases where electricity consumption is relatively equitable. Unfortunately, those countries with the worst energy access problems are usually among those with the most inequitable access to energy (cf Kenya in Figure 5).
38 The greater the distance this curve is from the diagonal line extending from the origin to the point with coordinates x=1 (or 100%), y = 1 (or 100%), the greater the inequality in energy consumption. It is calculated from the Lorenz curve by taking the ratio between (a) the portion of the area enclosed by the diagonal line and the Lorenz curve and (b) the total area under the diagonal line of uniform distribution. The Gini coefficient ranges from perfect equity among all members of the population (Ge=0) to complete inequity (Ge=1). As more than one Lorenz distribution of a resource can lead to the same Gini value, it is often instrumental to view both metrics simultaneously.
11
0
20
40
60
80
100
0 20 40 60 80 100
Norway (0.19)USA (0.37)El Salvador (0.60)Thailand (0.61)Kenya (0.87)
Cum
ulat
ive
Elec
tric
ity C
onsu
mpt
ion
(%)
Cumulative Population (%)
Figure 5: Lorenz curves for residential electricity in five countries. The Gini coefficients for residential electricity consumption presented in the legend of the graph (in parenthesis) provide a single quantitative measure of the distribution of consumption across the population for the respective countries (Jacobson et al., 2005).
An important aspect of any energy access program is thus to examine, address, and plan for the differences in not only total funding needed, but also in approaches for populations that have and do not readily have access to on-grid energy. In the case of Kenya, for example, grid extension, mini-grids, and off grid lighting options are all important technologies to examine, which in turn changes the funding needs to provide modern energy services. Further work in this area is now underway.
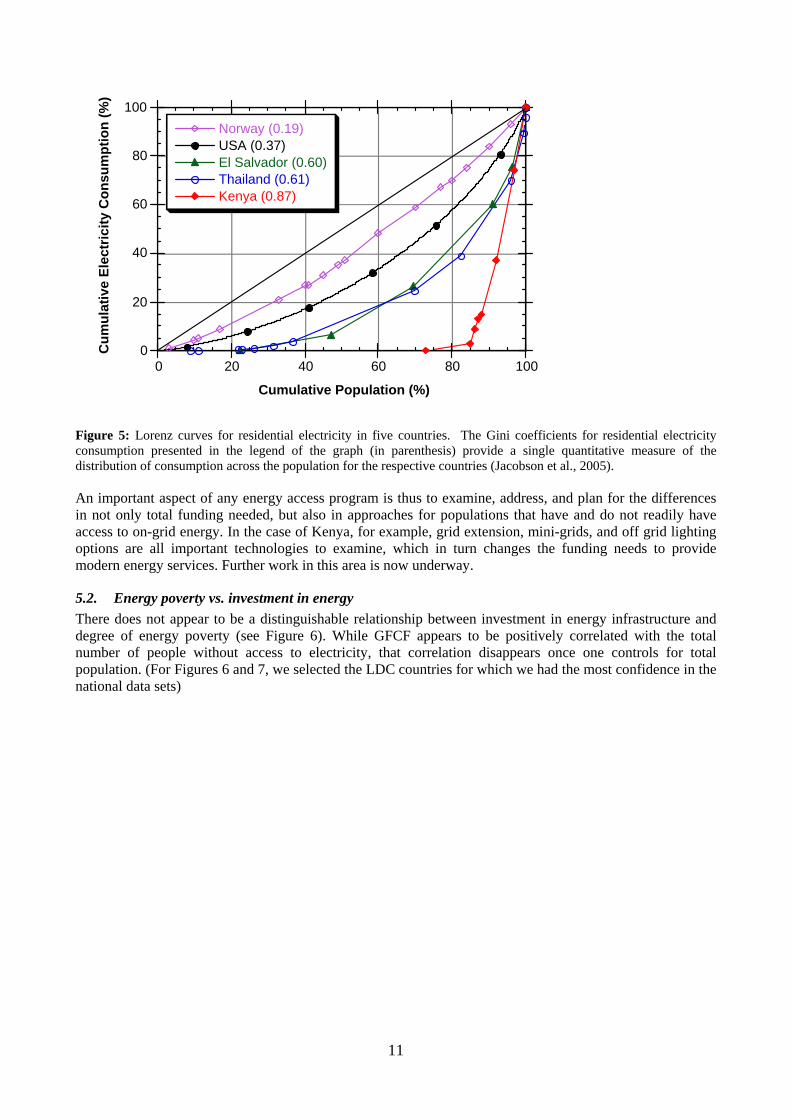
5.2. Energy poverty vs. investment in energy There does not appear to be a distinguishable relationship between investment in energy infrastructure and degree of energy poverty (see Figure 6). While GFCF appears to be positively correlated with the total number of people without access to electricity, that correlation disappears once one controls for total population. (For Figures 6 and 7, we selected the LDC countries for which we had the most confidence in the national data sets)
12
1
10
100
1000
10000
Erit
rea
Togo
Leso
tho
Mal
awi
Ben
in
Burk
ina
Faso
Con
go, D
em. R
ep.
Zam
bia
Lao
PDR
Hai
ti
Moz
ambi
que
Cam
bodi
a
Nep
al
Mad
agas
car
Sene
gal
Uga
nda
Eth
iopi
a
Ang
ola
Tanz
ania
Bang
lade
sh
GFC
F fo
r ene
rgy
[mill
ion
USD
]
1
10
100
Num
ber o
f peo
ple
with
out e
lect
ricity
[mill
ion]
InvestmentEnergy Poverty
Figure 6: Magnitude of the financial flow in 2008 (primary ordinate axis) [USD 2000] compared to the number of people without access to electricity (2nd ordinate axis) sorted by investment (note: both axes in log scale) for selected LDCs.
Still, it is clear that existing country-specific investment flows in the energy sector are generally not sufficient to meet the needs of providing electricity services to those 1.4 billion people who currently lack any access– even if all investment was directed toward expanding access. In practice, of course, much of any investment will be directed toward increasing supplies (and quality) to those who already have some access.
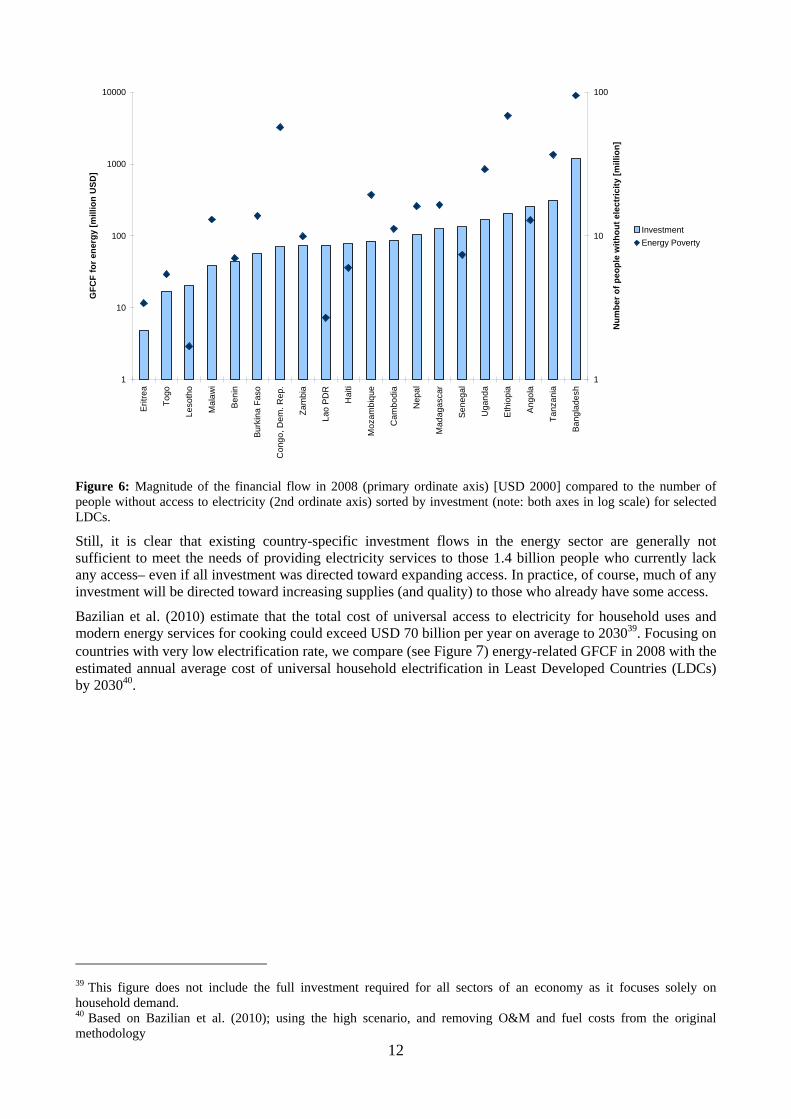
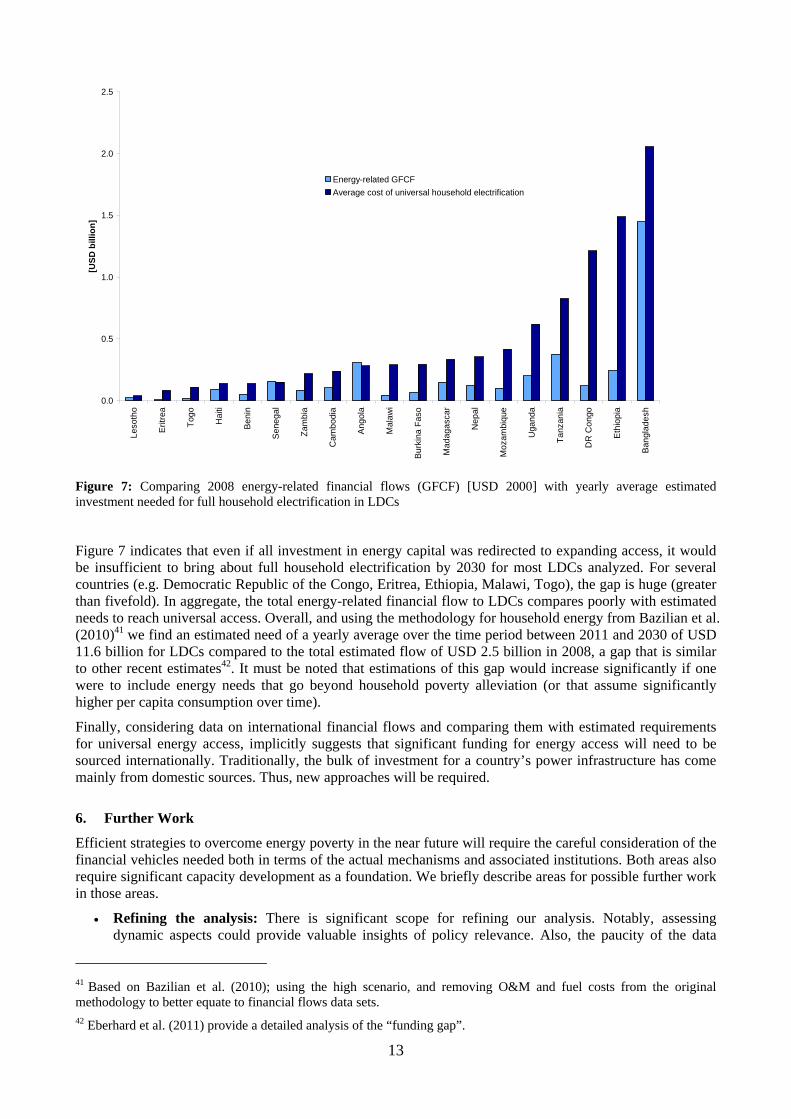
Bazilian et al. (2010) estimate that the total cost of universal access to electricity for household uses and modern energy services for cooking could exceed USD 70 billion per year on average to 203039. Focusing on countries with very low electrification rate, we compare (see Figure 7) energy-related GFCF in 2008 with the estimated annual average cost of universal household electrification in Least Developed Countries (LDCs) by 203040.
39 This figure does not include the full investment required for all sectors of an economy as it focuses solely on household demand. 40 Based on Bazilian et al. (2010); using the high scenario, and removing O&M and fuel costs from the original methodology
13
0.0
0.5
1.0
1.5
2.0
2.5
Leso
tho
Erit
rea
Togo
Hai
ti
Beni
n
Sen
egal
Zam
bia
Cam
bodi
a
Ang
ola
Mal
awi
Burk
ina
Faso
Mad
agas
car
Nep
al
Moz
ambi
que
Uga
nda
Tanz
ania
DR
Con
go
Eth
iopi
a
Bang
lade
sh
[USD
bill
ion]
Energy-related GFCFAverage cost of universal household electrification
Figure 7: Comparing 2008 energy-related financial flows (GFCF) [USD 2000] with yearly average estimated investment needed for full household electrification in LDCs
Figure 7 indicates that even if all investment in energy capital was redirected to expanding access, it would be insufficient to bring about full household electrification by 2030 for most LDCs analyzed. For several countries (e.g. Democratic Republic of the Congo, Eritrea, Ethiopia, Malawi, Togo), the gap is huge (greater than fivefold). In aggregate, the total energy-related financial flow to LDCs compares poorly with estimated needs to reach universal access. Overall, and using the methodology for household energy from Bazilian et al. (2010)41 we find an estimated need of a yearly average over the time period between 2011 and 2030 of USD 11.6 billion for LDCs compared to the total estimated flow of USD 2.5 billion in 2008, a gap that is similar to other recent estimates42. It must be noted that estimations of this gap would increase significantly if one were to include energy needs that go beyond household poverty alleviation (or that assume significantly higher per capita consumption over time).
Finally, considering data on international financial flows and comparing them with estimated requirements for universal energy access, implicitly suggests that significant funding for energy access will need to be sourced internationally. Traditionally, the bulk of investment for a country’s power infrastructure has come mainly from domestic sources. Thus, new approaches will be required.
6. Further Work
Efficient strategies to overcome energy poverty in the near future will require the careful consideration of the financial vehicles needed both in terms of the actual mechanisms and associated institutions. Both areas also require significant capacity development as a foundation. We briefly describe areas for possible further work in those areas.
• Refining the analysis: There is significant scope for refining our analysis. Notably, assessing dynamic aspects could provide valuable insights of policy relevance. Also, the paucity of the data
41 Based on Bazilian et al. (2010); using the high scenario, and removing O&M and fuel costs from the original methodology to better equate to financial flows data sets. 42 Eberhard et al. (2011) provide a detailed analysis of the “funding gap”.
14
represents a significant hindrance – especially in relation to providing insights about the relationship between macro financial flows and energy access issues. Therefore, improving the information base, both in terms of quantity and quality of the data, is crucial.
• Delivery mechanisms: This paper demonstrates that the gap between current and required flows is enormous in several cases. Securing political commitment and putting in place effective policy and regulatory frameworks are crucial elements to improve the investment climate for energy access. These include policies that are technology or sector specific, remove existing market distortions (e.g., fossil fuel subsidies), and work across sectors (education, health, water, agriculture, industry), as well as financing mechanisms to increase funding along the project spectrum (e.g. pre-feasibility studies, feasibility studies, seed capital, debt, equity, and insurance). There is a growing literature in this area, such as: UNDP, 2009; UN-Energy/Africa, undated; Kammen and Kirubi, 2008; Prasad, 2008; Moner-Girona, 2009; Solano-Peralta et al., 2009; Williams and Ghanadan, 2006; DB, 2010; Arc Finance, 2009; Bloomberg New Energy Finance, 2010; UNEP, 2009; Laan et al., 2010; MacLean and Siegel, 2007; Morris et al., 2007; Practical Action, undated; SELCO, undated.
• Actors and institutional mapping: Financial flows for the energy sector are of various types, origin and destination, and vary from multi-million dollar projects for large infrastructure to the few dollars necessary for an improved cookstove or for a solar panel. Significant experience has been gathered from decades of successful and less successful initiatives to address energy poverty at various levels. The lessons should be distilled and fed into new strategies. The literature reports on some of those issues (e.g., Casillas and Kammen, 2010; Howells et al., 2010; Morris and Kirubi, 2009).
• Sources of financing: The additional financial resources required to achieve goals like that of universal energy access will stem from various sources. A useful area of further investigation would be to improve the understanding related to the share of those “catalytic” investments that is expected to be provided by the public sector. This is the kind of information that government policy can be built upon.
7. Conclusion
We have provided an updated and refined estimate of macro financial flows to the energy (power) sector in developing countries using several data sets and analytical techniques. The results are primarily ‘high-level’ aggregates which provide a sense of scale. Of the 2008 total GFCF, LDCs comprise approximately 0.7%. We then compared those flows to national investment needs and to electrification rates. The “funding gap” is, at a minimum, a factor of five less than that required for universal household access to electricity. Data paucity remains a significant obstacle to further, more refined analysis. This small contribution was presented to improve understanding of the “decision space” of energy poverty and help inform policy design.
Acknowledgments: We would like to thank Masataka Fujita, Lucas Assunção and Lizanne Martinez (UNCTAD) for kindly providing data and information with regard to FDI, and Brooke A. Russell (AidData) for his support on Development Finance Data. We are grateful to colleagues for providing useful comments on earlier versions of this paper including, Tom Canyon (WB), Manuel Albaladejo, Augusto Luis Alcorta, and Stefan Kratzsch (UNIDO). Our appreciation also goes to colleagues who provided crucial input and critical reviews of earlier drafts of this paper.
15
References
AGECC. 2010. Energy for a Sustainable Future. New York: The Secretary-General’s Advisory Group on Energy and
Climate Change. http://www.unido.org/fileadmin/user_media/Services/Energy_and_Climate_Change/EPP/Publications/AGECC_Report.pdf.
Albuquerque, Rui. 2003. “The composition of international capital flows: risk sharing through foreign direct investment.” Journal of International Economics 61 (2): 353 - 383. doi:DOI: 10.1016/S0022-1996(03)00013-8.
Arc Finance. 2009. Financing Sustainable Energy through Remittance Flows in Haiti and the Dominican Republic. Arc Finance, Basel Agency for Sustainable Energy (BASE). http://www.energy-base.org/fileadmin/template/BASE/Reports/IDB_Remittances_Final_Report.pdf.
Asiedu, Elizabeth. 2002. “On the Determinants of Foreign Direct Investment to Developing Countries: Is Africa Different?” World Development 30 (1): 107 - 119. doi:DOI: 10.1016/S0305-750X(01)00100-0.
Bahmani-Oskooee, Mohsen. 1986. “Determinants of international trade flows�: The Case of Developing Countries.” Journal of Development Economics 20 (1): 107 - 123. doi:DOI: 10.1016/0304-3878(86)90007-6.
Barnett, Andrew. 1993. “Aid donor policies and power sector performance in developing countries.” Energy Policy 21 (2): 100 - 113. doi:DOI: 10.1016/0301-4215(93)90132-Y.
Bazilian, Morgan, Patrick Nussbaumer, Erik Haites, Michael Levi, Mark Howells, and Kandeh Yumkella. 2010. “Understanding the Scale of Investment for Universal Energy Access.” Geopolitics of Energy 32 (10-11): 19-40.
Bazilian, Morgan, Ambuj Sagar, Reid Detchon, and Kandeh Yumkella. 2010. “More heat and light.” Energy Policy 38 (10) (October): 5409-5412. doi:10.1016/j.enpol.2010.06.007.
Bird, Graham. 1981. “Developing country finances, present and future.” Futures 13 (3): 191 - 205. doi:DOI: 10.1016/0016-3287(81)90086-0.
Bloomberg New Energy Finance. 2010. Crossing the Valley of Death - Solutions to the next generation clean energy project financing gap. White Paper. http://bnef.com/DownloadDt3/download/UserFiles/File/WhitePapers/BNEF_2010-06-21_valleyofdeath_.pdf.
Casillas, C. E, and D. M Kammen. 2010. “The Energy-Poverty-Climate Nexus.” Science 330 (6008): 1181.
Claessens, Stijn, and Sergio L. Schmukler. 2007. “International financial integration through equity markets: Which firms from which countries go global?” Journal of International Money and Finance 26 (5): 788 - 813. doi:DOI: 10.1016/j.jimonfin.2007.04.002.
DB. 2010. GET FiT Program - Global Energy Transfer Feed-in Tariffs for Developing Countries. Green Paper. DB Climate Change Advisors, Deutsche Bank Group. https://www.dws-investments.com/EN/docs/insight/GET_FIT_Program.pdf.
Eberhard, A., Rosnes, O., Shkaratan, M., Vennemo, H. 2011. Africa’s Power Infrastructure. The World Bank.
EU, IMF, OECD, UN, and WB. 2009. System of National Accounts 2008. New York. http://unstats.un.org/unsd/nationalaccount/sna2008.asp.
Fenhann, Joergen, Frederik Staun. 2010. “An analysis of key issues in the Clean Development Mechanism based on the UNEP Risoe Clean Development Mechanism pipeline”. Carbon Management (2010) 1(1), 65–77
Fenhann, Joergen. 2011. The UNEP Risoe CDM Pipeline of 1st May 2011. www.cdmpipeline.org
Findley, Michael G., Darren Hawkins, Robert L. Hicks, Daniel L. Nielson, Bradley C. Parks, Ryan M. Powers, J. Timmons Roberts, Michael J. Tierney, and Sven Wilson. AidData: Tracking Development Finance. In Aid Transparency and Development Finance: Lessons and Insights from AidData, 22-25 March 2010. Oxford, U.K. http://www.aiddata.org.
Fung, Michael K. 2009. “Financial development and economic growth: Convergence or divergence?” Journal of International Money and Finance 28 (1): 56 - 67. doi:DOI: 10.1016/j.jimonfin.2008.08.001.
G20. 2010. The Scope of Fossil Fuel Subsidies. Korea.
Gastwirth, J. L. and M. Glauberman, Econometrica, 44, 479 (1976).
Gelos, R. Gaston, Ratna Sahay, and Guido Sandleris. 2011. “Sovereign borrowing by developing countries: What determines market access?” Journal of International Economics 83 (2): 243 - 254. doi:DOI: 10.1016/j.jinteco.2010.11.007.
16
Howells, Mark I., Sandra Jonsson, Emilia Käck, Philip Lloyd, Kevin Bennett, Tony Leiman, and Beatrice Conradie. 2010. “Calabashes for kilowatt-hours: Rural energy and market failure.” Energy Policy 38 (6) (June): 2729-2738. doi:10.1016/j.enpol.2009.11.063.
IEA. 2003. World Energy Investment Outlook 2003. Paris: International Energy Agency.
______.2008. World energy outlook 2008. Ch. 15. p. 353-374. Paris.
———. 2010. World Energy Outlook 2010. Paris: International Energy Agency.
———. 2011. Energy for all: Financing access for the poor presented at the Expert Meeting on Energy Access for the WEO 2011, May 13, Paris.
IEA, UNDP, and UNIDO. 2010. Energy Poverty - How to make modern energy access universal? Special early excerpt of the World Energy Outlook 2010 for the UN General Assembly on the Millennium Development Goals. Paris: International Energy Agency. http://www.worldenergyoutlook.org/docs/weo2010/weo2010_poverty.pdf.
Jacobson, A., Milman, A. D. and Kammen, D. M. (2005) “Letting the (Energy) Gini out of the Bottle: Lorentz Curves of Cumulative Electricity Consumption and Gini Coefficients as Metrics of Energy Distribution and Equity, Energy Policy, 33 (14), 1825-1832.
Kammen, Daniel M., and Charles Kirubi. 2008. “Poverty, Energy, and Resource Use in Developing Countries - Focus on Africa.” Annals of the New York Academy of Sciences 1136 (1) (June): 348-357.
Kasuga, Hidefumi. 2007. “Evaluating the impacts of foreign direct investment, aid and saving in developing countries.” Journal of International Money and Finance 26 (2): 213 - 228. doi:DOI: 10.1016/j.jimonfin.2006.11.002.
Kim, Yoonbai. 2000. “Causes of capital flows in developing countries.” Journal of International Money and Finance 19 (2): 235 - 253. doi:DOI: 10.1016/S0261-5606(00)00001-2.
Kinda, Tidiane. 2010. “Investment Climate and FDI in Developing Countries: Firm-Level Evidence.” World Development 38 (4): 498 - 513. doi:DOI: 10.1016/j.worlddev.2009.12.001.
Knight, Malcolm. 1998. “Developing countries and the globalization of financial markets.” World Development 26 (7): 1185 - 1200. doi:DOI: 10.1016/S0305-750X(98)00038-2.
Koplow, D. (2009), Measuring Energy Subsidies Using the Price-Gap Approach: What Does it Leave Out?, International Institute for Sustainable Development, Winnipeg.
Krkoska, L. 2001. “Foreign direct investment financing of capital formation in central and eastern Europe.” Working Papers.
Laan, Tara, Christopher Beaton, and Bertille Presta. 2010. Strategies for Reforming Fossil-Fuel Subsidies: Practical lessons from Ghana, France and Senegal. The Global Subsidies Initiative, International Institute for Sustainable Development. http://www.globalsubsidies.org/files/assets/strategies_ffs.pdf.
Laureti, Lucio, and Paolo Postiglione. 2005. “The effects of capital inflows on the economic growth in the Med Area.” Journal of Policy Modeling 27 (7): 839 - 851. doi:DOI: 10.1016/j.jpolmod.2005.05.003.
Lütken, S. and Michaelowa, A. 2008. Corporate Strategies and the Clean Development Mechanism: Developing country financing for developed country commitments. Edgar Elgar.
MacLean, John C., and Judith M. Siegel. 2007. Financing Mechanisms and Public/Private Risk Sharing Instruments for Financing Small Scale Renewable Energy Equipment and Projects. The Global Environment Facility (GEF) and The United Nations Environment Programme (UNEP). http://sefi.unep.org/fileadmin/media/sefi/docs/publications/SSRE_UNEP_Report_August07.pdf.
McGillivray, Mark. 1989. “The allocation of aid among developing countries: A multi-donor analysis using a per capita aid index.” World Development 17 (4): 561 - 568. doi:DOI: 10.1016/0305-750X(89)90262-3.
Mishkin, Frederic S. 2009. “Globalization and financial development.” Journal of Development Economics 89 (2): 164 - 169. doi:DOI: 10.1016/j.jdeveco.2007.11.004.
Modi, Vijay, Susan McDade, Dominique Lallement, and Jamal Saghir. 2005. Energy Services for the Millennium Development Goals. Energy Sector Management Assistance Programme, United Nations Development Programme, UN Millennium Project, and World Bank. http://www.unmillenniumproject.org/documents/MP_Energy_Low_Res.pdf.
Mody, Ashoka, and Antu Panini Murshid. 2005. “Growing up with capital flows.” Journal of International Economics 65 (1): 249 - 266. doi:DOI: 10.1016/j.jinteco.2004.02.003.
Moner-Girona, Magda. 2009. “A new tailored scheme for the support of renewable energies in developing countries.” Energy Policy 37 (5) (May): 2037-2041. doi:10.1016/j.enpol.2008.11.024.
17
Morris, Ellen, and Gathu Kirubi. 2009. Bringing Small-Scale Finance to the Poor for Modern Energy Services: What is the role of government? United Nations Development Programme. http://content.undp.org/go/newsroom/publications/environment-energy/www-ee-library/sustainable-energy/bringing-small-scale-finance-to-the-poor-for-modern-energy-services.en.
Morris, Ellen, Jacob Winiecki, Sonali Chowdhary, and Kristen Cortiglia. 2007. Using Microfinance to Expand Access to Energy Services. The SEEP Network. http://www.arcfinance.org/pdfs/pubs/Energy_Summary_FINAL.pdf.
Munduch, Gerhard, and Carl B. Weinberg. 1979. “Aspects of a new world development strategy I: Financial transfers from developed to developing nations.” Journal of Policy Modeling 1 (3): 343 - 357. doi:DOI: 10.1016/0161-8938(79)90002-4.
Noorbakhsh, Farhad, Alberto Paloni, and Ali Youssef. 2001. “Human Capital and FDI Inflows to Developing Countries: New Empirical Evidence.” World Development 29 (9): 1593 - 1610. doi:DOI: 10.1016/S0305-750X(01)00054-7.
Nussbaumer, Patrick, Morgan Bazilian, Vijay Modi, and Kandeh Yumkella , 2011. Measuring Energy Poverty: Focusing on What Matters, Oxford Poverty & Human Development Initiative, University of Oxford. Available at: http://www.ophi.org.uk/measuring-energy-poverty-focusing-on-what-matters/.
Odedokun, M. O. 1996. “International evidence on the effects of directed credit programmes on efficiency of resource allocation in developing countries: The case of development bank lendings.” Journal of Development Economics 48 (2): 449 - 460. doi:DOI: 10.1016/0304-3878(95)00044-5.
OECD. 2010a. Development Co-operation Report 2010. Organisation for Economic Co-operation and Development.
———. 2010b. Measuring Aid for Energy. April. www.oecd.org/dataoecd/32/57/45066235.pdf.
Olbrisch, Susanne, Erik Haites, Matthew Savage, Pradeep Dadhich and Shrivastava Manish Kumar. 2011 “Estimates of Incremental Investment for and Cost of Mitigation Measures in Developing Countries,” Climate Policy, vol. 11, in press.
Pegg, S. (2006). Mining and poverty reduction: Transforming rhetoric into reality. Journal of Cleaner Production, 14(3-4), 376-387.
Practical Action. undated. Bridging the funding gap to ensure energy access for the poor. http://practicalactionconsulting.org/docs/advocacy/financing_energy_for_the_poor_csd2007.pdf.
Prasad, Gisela. 2008. “Energy sector reform, energy transitions and the poor in Africa.” Energy Policy 36 (8) (August): 2806-2811. doi:10.1016/j.enpol.2008.02.042.
Rao, J. Mohan. 1997. “Ranking foreign donors: An index combining the scale and equity of aid giving.” World Development 25 (6): 947 - 961. doi:DOI: 10.1016/S0305-750X(97)00001-6.
Sadik, Ali T., and Ali A. Bolbol. 2001. “Capital Flows, FDI, and Technology Spillovers: Evidence from Arab Countries.” World Development 29 (12): 2111 - 2125. doi:DOI: 10.1016/S0305-750X(01)00083-3.
Salim (2003). Striking a better balance: The World Bank Group and extractive industries. Final report on the extractive industries review. Jakarta, Washington.
SELCO. undated. Access to Sustainable Energy Services via Innovative Financing. In collaboration with: Renewable Energy and Energy Efficiency Partnership (REEEP). http://www.reeep.org/file_upload/5272_tmpphpyAdECr.pdf.
Singh, Ajit, and Ann Zammit. 2000. “International Capital Flows: Identifying the Gender Dimension.” World Development 28 (7): 1249 - 1268. doi:DOI: 10.1016/S0305-750X(00)00026-7.
Solano-Peralta, Mauricio, Magda Moner-Girona, Wilfried G.J.H.M. van Sark, and Xavier Vallvè. 2009. “‘Tropicalisation’ of Feed-in Tariffs: A custom-made support scheme for hybrid PV/diesel systems in isolated regions.” Renewable and Sustainable Energy Reviews 13 (9) (December): 2279-2294. doi:10.1016/j.rser.2009.06.022.
Steel, William F., Ernest Aryeetey, Hemamala Hettige, and Machiko Nissanke. 1997. “Informal financial markets under liberalization in four African countries.” World Development 25 (5): 817 - 830. doi:DOI: 10.1016/S0305-750X(96)00133-7.
Stern, N., S. Peters, V. Bakhshi, A. Bowen, C. Cameron, S. Catovsky, D. Crane, S. Cruickshank, S. Dietz, N. Edmonson, S.-L. Garbett, L. Hamid, G. Hoffman, D. Ingram, B. Jones, N. Patmore, H. Radcliffe, R. Sathiyarajah, M. Stock, C. Taylor, T. Vernon, H. Wanjie, D. Zenghelis (2006) Stern Review: The Economics of Climate Change, HM Treasury, London.
UN. 2011. World Economic Situation and Prospects 2011. New York: United Nations. http://www.un.org/en/development/desa/policy/wesp/wesp_current/2011wesp.pdf.
UNCTAD. 2010. World Investment Report 2010 - Investing in a low-carbon economy. United Nations Conference on Trade and Development. http://www.unctad.org/en/docs/wir2010_en.pdf.
18
———. 2011. Foreign Direct Investment in LDCs: Lessons Learned from the Decade 2001-2010 and the Way Forward. United Nations Conference on Trade and Development. www.unctad.org/en/docs/diaeia2011d1_en.pdf.
———. Glossay. http://www.unctad.org/Templates/Page.asp?intItemID=3163&lang=1.
UNDP. 2009. Energy in National Decentralization Policies - A review focusing on least developed countries and sub-Saharan Africa. United Nations Development Programme. http://www.undp.org/energy/docs/Energy_Decentralization_r8.pdf.
UN-Energy/Africa. undated. Energy for Sustainable Development: policy Options for Africa. http://www.uneca.org/eca_resources/publications/unea-publication-tocsd15.pdf.
UNEP, SEFI, and BNEF. 2010. Global Trends in Sustainable Energy Investment. http://sefi.unep.org/english/globaltrends2010.html.
UNFCCC. 2007. Investment and Financial Flows to Address Climate Change. Background Paper. United Nations Framework Convention on Climate Change. http://unfccc.int/files/cooperation_and_support/financial_mechanism/application/pdf/background_paper.pdf.
UNIDO. 2007. Africa Foreign Investor Survey 2005. http://www.unido.org/fileadmin/import/59260_Africa_FDI_2005.pdf
UNSD. UN data. http://data.un.org/.
World Bank (2004). The World Bank Group and extractive industries: World Bank Group management response . World Bank. World Development Indicators. http://data.worldbank.org/data-catalog/world-development-indicators.
———. Private Participation in Infrastructure (PPI) Project Database. http://ppi.worldbank.org/.
Williams, J.H., and R. Ghanadan. 2006. “Electricity reform in developing and transition countries: A reappraisal.” Energy 31 (6-7) (June): 815-844. doi:10.1016/j.energy.2005.02.008.
World Economic Forum. 2010. Green Investing 2010. Geneva.
19
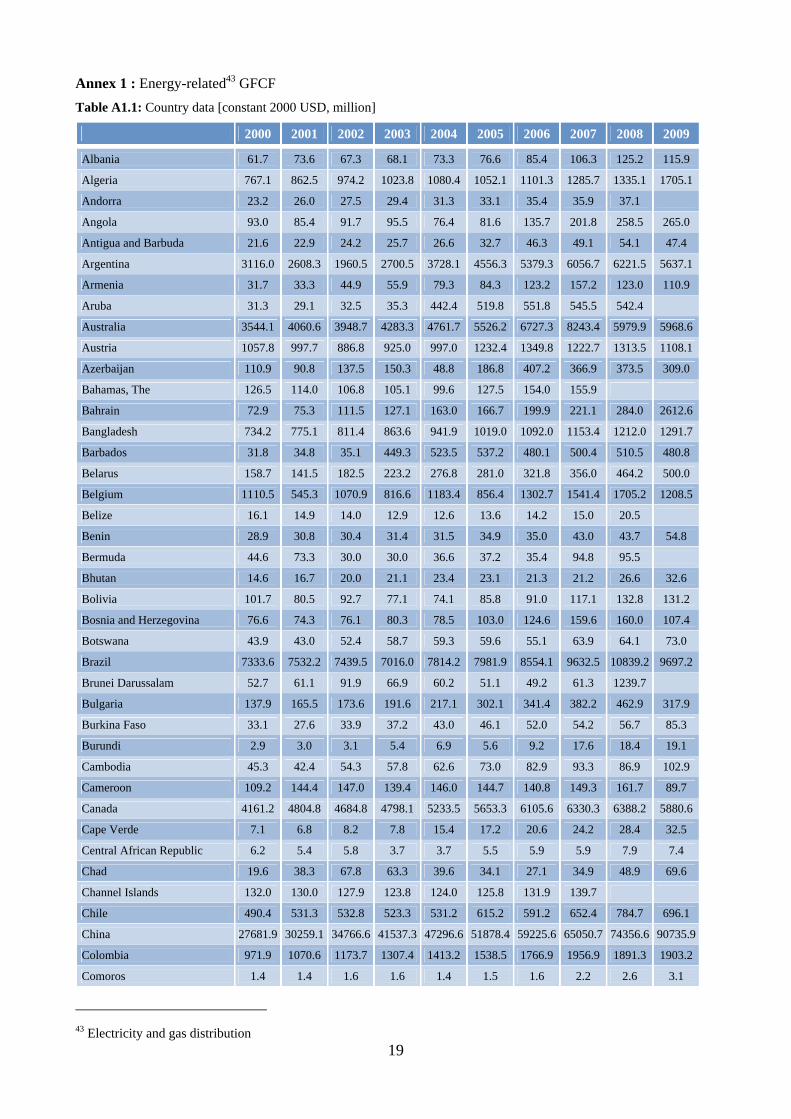
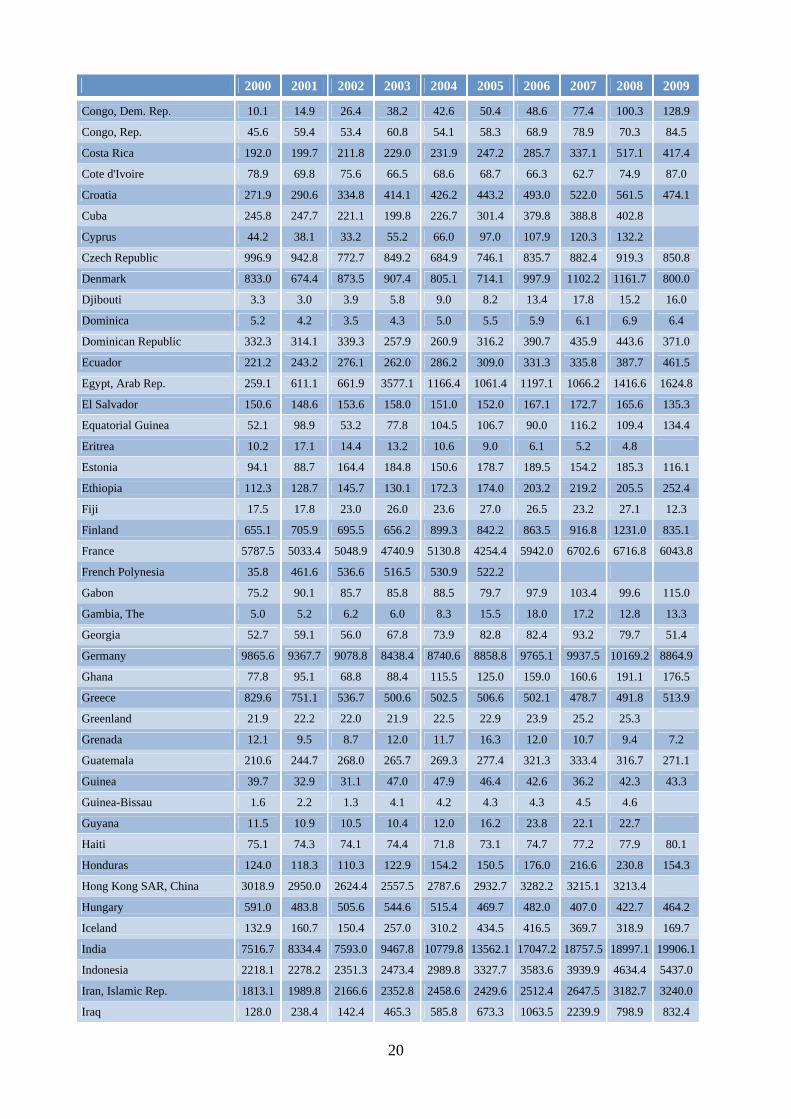
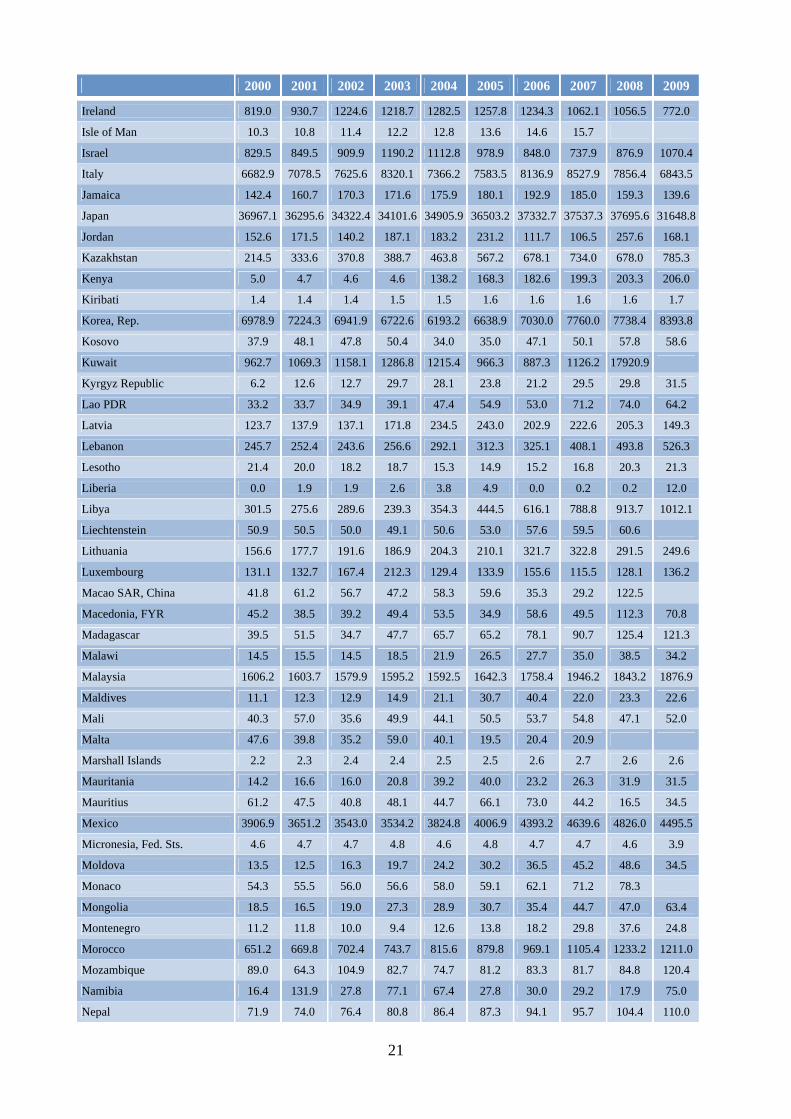
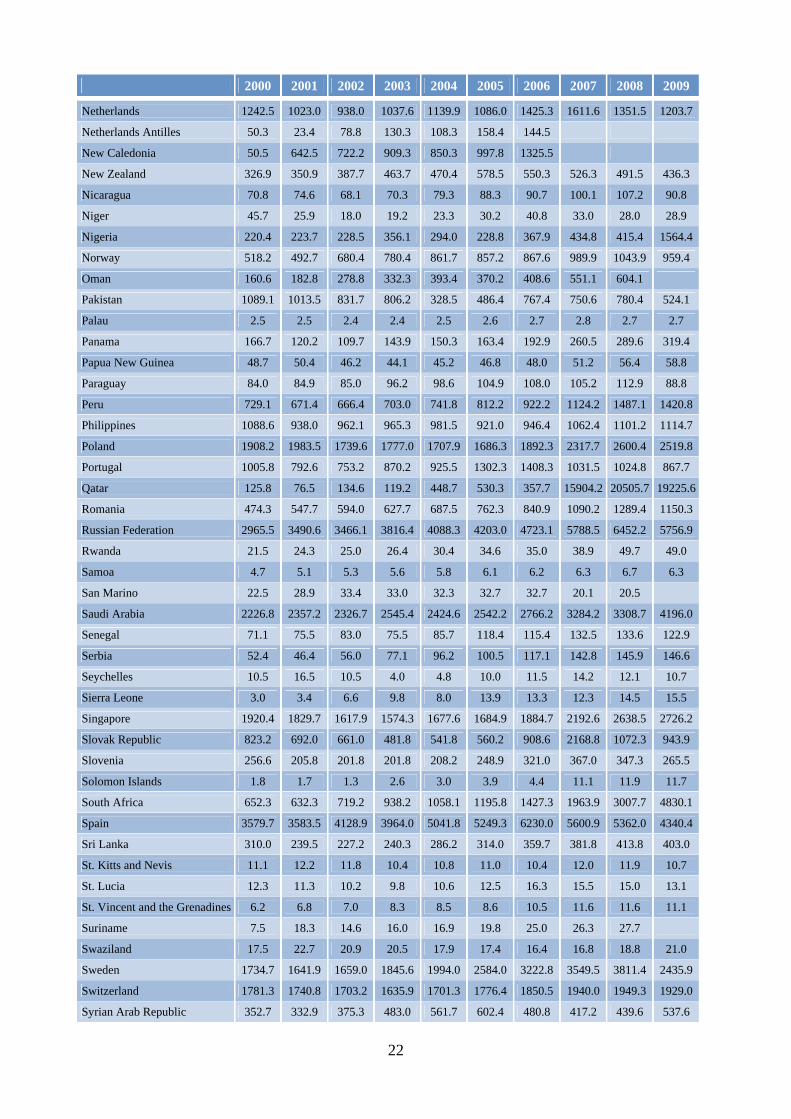
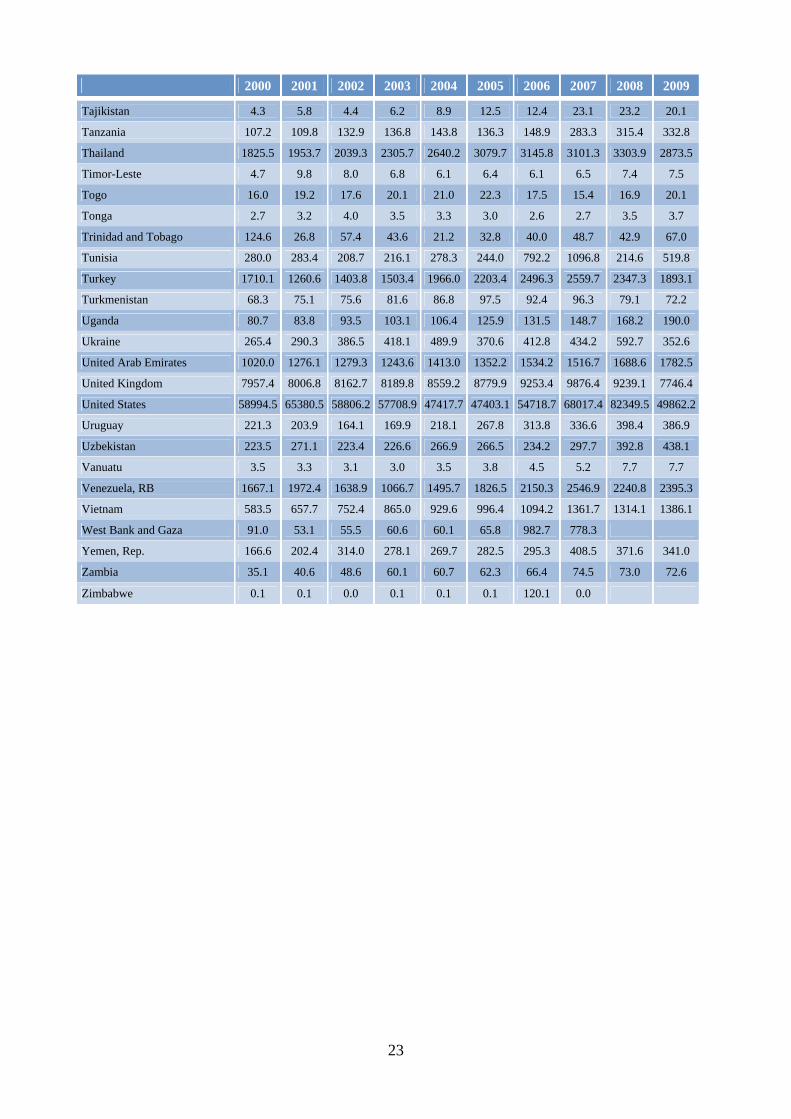
Annex 1 : Energy-related43 GFCF Table A1.1: Country data [constant 2000 USD, million]
2000 2001 2002 2003 2004 2005 2006 2007 2008 2009
Albania 61.7 73.6 67.3 68.1 73.3 76.6 85.4 106.3 125.2 115.9
Algeria 767.1 862.5 974.2 1023.8 1080.4 1052.1 1101.3 1285.7 1335.1 1705.1
Andorra 23.2 26.0 27.5 29.4 31.3 33.1 35.4 35.9 37.1
Angola 93.0 85.4 91.7 95.5 76.4 81.6 135.7 201.8 258.5 265.0
Antigua and Barbuda 21.6 22.9 24.2 25.7 26.6 32.7 46.3 49.1 54.1 47.4
Argentina 3116.0 2608.3 1960.5 2700.5 3728.1 4556.3 5379.3 6056.7 6221.5 5637.1
Armenia 31.7 33.3 44.9 55.9 79.3 84.3 123.2 157.2 123.0 110.9
Aruba 31.3 29.1 32.5 35.3 442.4 519.8 551.8 545.5 542.4
Australia 3544.1 4060.6 3948.7 4283.3 4761.7 5526.2 6727.3 8243.4 5979.9 5968.6
Austria 1057.8 997.7 886.8 925.0 997.0 1232.4 1349.8 1222.7 1313.5 1108.1
Azerbaijan 110.9 90.8 137.5 150.3 48.8 186.8 407.2 366.9 373.5 309.0
Bahamas, The 126.5 114.0 106.8 105.1 99.6 127.5 154.0 155.9
Bahrain 72.9 75.3 111.5 127.1 163.0 166.7 199.9 221.1 284.0 2612.6
Bangladesh 734.2 775.1 811.4 863.6 941.9 1019.0 1092.0 1153.4 1212.0 1291.7
Barbados 31.8 34.8 35.1 449.3 523.5 537.2 480.1 500.4 510.5 480.8
Belarus 158.7 141.5 182.5 223.2 276.8 281.0 321.8 356.0 464.2 500.0
Belgium 1110.5 545.3 1070.9 816.6 1183.4 856.4 1302.7 1541.4 1705.2 1208.5
Belize 16.1 14.9 14.0 12.9 12.6 13.6 14.2 15.0 20.5
Benin 28.9 30.8 30.4 31.4 31.5 34.9 35.0 43.0 43.7 54.8
Bermuda 44.6 73.3 30.0 30.0 36.6 37.2 35.4 94.8 95.5
Bhutan 14.6 16.7 20.0 21.1 23.4 23.1 21.3 21.2 26.6 32.6
Bolivia 101.7 80.5 92.7 77.1 74.1 85.8 91.0 117.1 132.8 131.2
Bosnia and Herzegovina 76.6 74.3 76.1 80.3 78.5 103.0 124.6 159.6 160.0 107.4
Botswana 43.9 43.0 52.4 58.7 59.3 59.6 55.1 63.9 64.1 73.0
Brazil 7333.6 7532.2 7439.5 7016.0 7814.2 7981.9 8554.1 9632.5 10839.2 9697.2
Brunei Darussalam 52.7 61.1 91.9 66.9 60.2 51.1 49.2 61.3 1239.7
Bulgaria 137.9 165.5 173.6 191.6 217.1 302.1 341.4 382.2 462.9 317.9
Burkina Faso 33.1 27.6 33.9 37.2 43.0 46.1 52.0 54.2 56.7 85.3
Burundi 2.9 3.0 3.1 5.4 6.9 5.6 9.2 17.6 18.4 19.1
Cambodia 45.3 42.4 54.3 57.8 62.6 73.0 82.9 93.3 86.9 102.9
Cameroon 109.2 144.4 147.0 139.4 146.0 144.7 140.8 149.3 161.7 89.7
Canada 4161.2 4804.8 4684.8 4798.1 5233.5 5653.3 6105.6 6330.3 6388.2 5880.6
Cape Verde 7.1 6.8 8.2 7.8 15.4 17.2 20.6 24.2 28.4 32.5
Central African Republic 6.2 5.4 5.8 3.7 3.7 5.5 5.9 5.9 7.9 7.4
Chad 19.6 38.3 67.8 63.3 39.6 34.1 27.1 34.9 48.9 69.6
Channel Islands 132.0 130.0 127.9 123.8 124.0 125.8 131.9 139.7
Chile 490.4 531.3 532.8 523.3 531.2 615.2 591.2 652.4 784.7 696.1
China 27681.9 30259.1 34766.6 41537.3 47296.6 51878.4 59225.6 65050.7 74356.6 90735.9
Colombia 971.9 1070.6 1173.7 1307.4 1413.2 1538.5 1766.9 1956.9 1891.3 1903.2
Comoros 1.4 1.4 1.6 1.6 1.4 1.5 1.6 2.2 2.6 3.1
43 Electricity and gas distribution
20
2000 2001 2002 2003 2004 2005 2006 2007 2008 2009
Congo, Dem. Rep. 10.1 14.9 26.4 38.2 42.6 50.4 48.6 77.4 100.3 128.9
Congo, Rep. 45.6 59.4 53.4 60.8 54.1 58.3 68.9 78.9 70.3 84.5
Costa Rica 192.0 199.7 211.8 229.0 231.9 247.2 285.7 337.1 517.1 417.4
Cote d'Ivoire 78.9 69.8 75.6 66.5 68.6 68.7 66.3 62.7 74.9 87.0
Croatia 271.9 290.6 334.8 414.1 426.2 443.2 493.0 522.0 561.5 474.1
Cuba 245.8 247.7 221.1 199.8 226.7 301.4 379.8 388.8 402.8
Cyprus 44.2 38.1 33.2 55.2 66.0 97.0 107.9 120.3 132.2
Czech Republic 996.9 942.8 772.7 849.2 684.9 746.1 835.7 882.4 919.3 850.8
Denmark 833.0 674.4 873.5 907.4 805.1 714.1 997.9 1102.2 1161.7 800.0
Djibouti 3.3 3.0 3.9 5.8 9.0 8.2 13.4 17.8 15.2 16.0
Dominica 5.2 4.2 3.5 4.3 5.0 5.5 5.9 6.1 6.9 6.4
Dominican Republic 332.3 314.1 339.3 257.9 260.9 316.2 390.7 435.9 443.6 371.0
Ecuador 221.2 243.2 276.1 262.0 286.2 309.0 331.3 335.8 387.7 461.5
Egypt, Arab Rep. 259.1 611.1 661.9 3577.1 1166.4 1061.4 1197.1 1066.2 1416.6 1624.8
El Salvador 150.6 148.6 153.6 158.0 151.0 152.0 167.1 172.7 165.6 135.3
Equatorial Guinea 52.1 98.9 53.2 77.8 104.5 106.7 90.0 116.2 109.4 134.4
Eritrea 10.2 17.1 14.4 13.2 10.6 9.0 6.1 5.2 4.8
Estonia 94.1 88.7 164.4 184.8 150.6 178.7 189.5 154.2 185.3 116.1
Ethiopia 112.3 128.7 145.7 130.1 172.3 174.0 203.2 219.2 205.5 252.4
Fiji 17.5 17.8 23.0 26.0 23.6 27.0 26.5 23.2 27.1 12.3
Finland 655.1 705.9 695.5 656.2 899.3 842.2 863.5 916.8 1231.0 835.1
France 5787.5 5033.4 5048.9 4740.9 5130.8 4254.4 5942.0 6702.6 6716.8 6043.8
French Polynesia 35.8 461.6 536.6 516.5 530.9 522.2
Gabon 75.2 90.1 85.7 85.8 88.5 79.7 97.9 103.4 99.6 115.0
Gambia, The 5.0 5.2 6.2 6.0 8.3 15.5 18.0 17.2 12.8 13.3
Georgia 52.7 59.1 56.0 67.8 73.9 82.8 82.4 93.2 79.7 51.4
Germany 9865.6 9367.7 9078.8 8438.4 8740.6 8858.8 9765.1 9937.5 10169.2 8864.9
Ghana 77.8 95.1 68.8 88.4 115.5 125.0 159.0 160.6 191.1 176.5
Greece 829.6 751.1 536.7 500.6 502.5 506.6 502.1 478.7 491.8 513.9
Greenland 21.9 22.2 22.0 21.9 22.5 22.9 23.9 25.2 25.3
Grenada 12.1 9.5 8.7 12.0 11.7 16.3 12.0 10.7 9.4 7.2
Guatemala 210.6 244.7 268.0 265.7 269.3 277.4 321.3 333.4 316.7 271.1
Guinea 39.7 32.9 31.1 47.0 47.9 46.4 42.6 36.2 42.3 43.3
Guinea-Bissau 1.6 2.2 1.3 4.1 4.2 4.3 4.3 4.5 4.6
Guyana 11.5 10.9 10.5 10.4 12.0 16.2 23.8 22.1 22.7
Haiti 75.1 74.3 74.1 74.4 71.8 73.1 74.7 77.2 77.9 80.1
Honduras 124.0 118.3 110.3 122.9 154.2 150.5 176.0 216.6 230.8 154.3
Hong Kong SAR, China 3018.9 2950.0 2624.4 2557.5 2787.6 2932.7 3282.2 3215.1 3213.4
Hungary 591.0 483.8 505.6 544.6 515.4 469.7 482.0 407.0 422.7 464.2
Iceland 132.9 160.7 150.4 257.0 310.2 434.5 416.5 369.7 318.9 169.7
India 7516.7 8334.4 7593.0 9467.8 10779.8 13562.1 17047.2 18757.5 18997.1 19906.1
Indonesia 2218.1 2278.2 2351.3 2473.4 2989.8 3327.7 3583.6 3939.9 4634.4 5437.0
Iran, Islamic Rep. 1813.1 1989.8 2166.6 2352.8 2458.6 2429.6 2512.4 2647.5 3182.7 3240.0
Iraq 128.0 238.4 142.4 465.3 585.8 673.3 1063.5 2239.9 798.9 832.4
21
2000 2001 2002 2003 2004 2005 2006 2007 2008 2009
Ireland 819.0 930.7 1224.6 1218.7 1282.5 1257.8 1234.3 1062.1 1056.5 772.0
Isle of Man 10.3 10.8 11.4 12.2 12.8 13.6 14.6 15.7
Israel 829.5 849.5 909.9 1190.2 1112.8 978.9 848.0 737.9 876.9 1070.4
Italy 6682.9 7078.5 7625.6 8320.1 7366.2 7583.5 8136.9 8527.9 7856.4 6843.5
Jamaica 142.4 160.7 170.3 171.6 175.9 180.1 192.9 185.0 159.3 139.6
Japan 36967.1 36295.6 34322.4 34101.6 34905.9 36503.2 37332.7 37537.3 37695.6 31648.8
Jordan 152.6 171.5 140.2 187.1 183.2 231.2 111.7 106.5 257.6 168.1
Kazakhstan 214.5 333.6 370.8 388.7 463.8 567.2 678.1 734.0 678.0 785.3
Kenya 5.0 4.7 4.6 4.6 138.2 168.3 182.6 199.3 203.3 206.0
Kiribati 1.4 1.4 1.4 1.5 1.5 1.6 1.6 1.6 1.6 1.7
Korea, Rep. 6978.9 7224.3 6941.9 6722.6 6193.2 6638.9 7030.0 7760.0 7738.4 8393.8
Kosovo 37.9 48.1 47.8 50.4 34.0 35.0 47.1 50.1 57.8 58.6
Kuwait 962.7 1069.3 1158.1 1286.8 1215.4 966.3 887.3 1126.2 17920.9
Kyrgyz Republic 6.2 12.6 12.7 29.7 28.1 23.8 21.2 29.5 29.8 31.5
Lao PDR 33.2 33.7 34.9 39.1 47.4 54.9 53.0 71.2 74.0 64.2
Latvia 123.7 137.9 137.1 171.8 234.5 243.0 202.9 222.6 205.3 149.3
Lebanon 245.7 252.4 243.6 256.6 292.1 312.3 325.1 408.1 493.8 526.3
Lesotho 21.4 20.0 18.2 18.7 15.3 14.9 15.2 16.8 20.3 21.3
Liberia 0.0 1.9 1.9 2.6 3.8 4.9 0.0 0.2 0.2 12.0
Libya 301.5 275.6 289.6 239.3 354.3 444.5 616.1 788.8 913.7 1012.1
Liechtenstein 50.9 50.5 50.0 49.1 50.6 53.0 57.6 59.5 60.6
Lithuania 156.6 177.7 191.6 186.9 204.3 210.1 321.7 322.8 291.5 249.6
Luxembourg 131.1 132.7 167.4 212.3 129.4 133.9 155.6 115.5 128.1 136.2
Macao SAR, China 41.8 61.2 56.7 47.2 58.3 59.6 35.3 29.2 122.5
Macedonia, FYR 45.2 38.5 39.2 49.4 53.5 34.9 58.6 49.5 112.3 70.8
Madagascar 39.5 51.5 34.7 47.7 65.7 65.2 78.1 90.7 125.4 121.3
Malawi 14.5 15.5 14.5 18.5 21.9 26.5 27.7 35.0 38.5 34.2
Malaysia 1606.2 1603.7 1579.9 1595.2 1592.5 1642.3 1758.4 1946.2 1843.2 1876.9
Maldives 11.1 12.3 12.9 14.9 21.1 30.7 40.4 22.0 23.3 22.6
Mali 40.3 57.0 35.6 49.9 44.1 50.5 53.7 54.8 47.1 52.0
Malta 47.6 39.8 35.2 59.0 40.1 19.5 20.4 20.9
Marshall Islands 2.2 2.3 2.4 2.4 2.5 2.5 2.6 2.7 2.6 2.6
Mauritania 14.2 16.6 16.0 20.8 39.2 40.0 23.2 26.3 31.9 31.5
Mauritius 61.2 47.5 40.8 48.1 44.7 66.1 73.0 44.2 16.5 34.5
Mexico 3906.9 3651.2 3543.0 3534.2 3824.8 4006.9 4393.2 4639.6 4826.0 4495.5
Micronesia, Fed. Sts. 4.6 4.7 4.7 4.8 4.6 4.8 4.7 4.7 4.6 3.9
Moldova 13.5 12.5 16.3 19.7 24.2 30.2 36.5 45.2 48.6 34.5
Monaco 54.3 55.5 56.0 56.6 58.0 59.1 62.1 71.2 78.3
Mongolia 18.5 16.5 19.0 27.3 28.9 30.7 35.4 44.7 47.0 63.4
Montenegro 11.2 11.8 10.0 9.4 12.6 13.8 18.2 29.8 37.6 24.8
Morocco 651.2 669.8 702.4 743.7 815.6 879.8 969.1 1105.4 1233.2 1211.0
Mozambique 89.0 64.3 104.9 82.7 74.7 81.2 83.3 81.7 84.8 120.4
Namibia 16.4 131.9 27.8 77.1 67.4 27.8 30.0 29.2 17.9 75.0
Nepal 71.9 74.0 76.4 80.8 86.4 87.3 94.1 95.7 104.4 110.0
22
2000 2001 2002 2003 2004 2005 2006 2007 2008 2009
Netherlands 1242.5 1023.0 938.0 1037.6 1139.9 1086.0 1425.3 1611.6 1351.5 1203.7
Netherlands Antilles 50.3 23.4 78.8 130.3 108.3 158.4 144.5
New Caledonia 50.5 642.5 722.2 909.3 850.3 997.8 1325.5
New Zealand 326.9 350.9 387.7 463.7 470.4 578.5 550.3 526.3 491.5 436.3
Nicaragua 70.8 74.6 68.1 70.3 79.3 88.3 90.7 100.1 107.2 90.8
Niger 45.7 25.9 18.0 19.2 23.3 30.2 40.8 33.0 28.0 28.9
Nigeria 220.4 223.7 228.5 356.1 294.0 228.8 367.9 434.8 415.4 1564.4
Norway 518.2 492.7 680.4 780.4 861.7 857.2 867.6 989.9 1043.9 959.4
Oman 160.6 182.8 278.8 332.3 393.4 370.2 408.6 551.1 604.1
Pakistan 1089.1 1013.5 831.7 806.2 328.5 486.4 767.4 750.6 780.4 524.1
Palau 2.5 2.5 2.4 2.4 2.5 2.6 2.7 2.8 2.7 2.7
Panama 166.7 120.2 109.7 143.9 150.3 163.4 192.9 260.5 289.6 319.4
Papua New Guinea 48.7 50.4 46.2 44.1 45.2 46.8 48.0 51.2 56.4 58.8
Paraguay 84.0 84.9 85.0 96.2 98.6 104.9 108.0 105.2 112.9 88.8
Peru 729.1 671.4 666.4 703.0 741.8 812.2 922.2 1124.2 1487.1 1420.8
Philippines 1088.6 938.0 962.1 965.3 981.5 921.0 946.4 1062.4 1101.2 1114.7
Poland 1908.2 1983.5 1739.6 1777.0 1707.9 1686.3 1892.3 2317.7 2600.4 2519.8
Portugal 1005.8 792.6 753.2 870.2 925.5 1302.3 1408.3 1031.5 1024.8 867.7
Qatar 125.8 76.5 134.6 119.2 448.7 530.3 357.7 15904.2 20505.7 19225.6
Romania 474.3 547.7 594.0 627.7 687.5 762.3 840.9 1090.2 1289.4 1150.3
Russian Federation 2965.5 3490.6 3466.1 3816.4 4088.3 4203.0 4723.1 5788.5 6452.2 5756.9
Rwanda 21.5 24.3 25.0 26.4 30.4 34.6 35.0 38.9 49.7 49.0
Samoa 4.7 5.1 5.3 5.6 5.8 6.1 6.2 6.3 6.7 6.3
San Marino 22.5 28.9 33.4 33.0 32.3 32.7 32.7 20.1 20.5
Saudi Arabia 2226.8 2357.2 2326.7 2545.4 2424.6 2542.2 2766.2 3284.2 3308.7 4196.0
Senegal 71.1 75.5 83.0 75.5 85.7 118.4 115.4 132.5 133.6 122.9
Serbia 52.4 46.4 56.0 77.1 96.2 100.5 117.1 142.8 145.9 146.6
Seychelles 10.5 16.5 10.5 4.0 4.8 10.0 11.5 14.2 12.1 10.7
Sierra Leone 3.0 3.4 6.6 9.8 8.0 13.9 13.3 12.3 14.5 15.5
Singapore 1920.4 1829.7 1617.9 1574.3 1677.6 1684.9 1884.7 2192.6 2638.5 2726.2
Slovak Republic 823.2 692.0 661.0 481.8 541.8 560.2 908.6 2168.8 1072.3 943.9
Slovenia 256.6 205.8 201.8 201.8 208.2 248.9 321.0 367.0 347.3 265.5
Solomon Islands 1.8 1.7 1.3 2.6 3.0 3.9 4.4 11.1 11.9 11.7
South Africa 652.3 632.3 719.2 938.2 1058.1 1195.8 1427.3 1963.9 3007.7 4830.1
Spain 3579.7 3583.5 4128.9 3964.0 5041.8 5249.3 6230.0 5600.9 5362.0 4340.4
Sri Lanka 310.0 239.5 227.2 240.3 286.2 314.0 359.7 381.8 413.8 403.0
St. Kitts and Nevis 11.1 12.2 11.8 10.4 10.8 11.0 10.4 12.0 11.9 10.7
St. Lucia 12.3 11.3 10.2 9.8 10.6 12.5 16.3 15.5 15.0 13.1
St. Vincent and the Grenadines 6.2 6.8 7.0 8.3 8.5 8.6 10.5 11.6 11.6 11.1
Suriname 7.5 18.3 14.6 16.0 16.9 19.8 25.0 26.3 27.7
Swaziland 17.5 22.7 20.9 20.5 17.9 17.4 16.4 16.8 18.8 21.0
Sweden 1734.7 1641.9 1659.0 1845.6 1994.0 2584.0 3222.8 3549.5 3811.4 2435.9
Switzerland 1781.3 1740.8 1703.2 1635.9 1701.3 1776.4 1850.5 1940.0 1949.3 1929.0
Syrian Arab Republic 352.7 332.9 375.3 483.0 561.7 602.4 480.8 417.2 439.6 537.6
23
2000 2001 2002 2003 2004 2005 2006 2007 2008 2009
Tajikistan 4.3 5.8 4.4 6.2 8.9 12.5 12.4 23.1 23.2 20.1
Tanzania 107.2 109.8 132.9 136.8 143.8 136.3 148.9 283.3 315.4 332.8
Thailand 1825.5 1953.7 2039.3 2305.7 2640.2 3079.7 3145.8 3101.3 3303.9 2873.5
Timor-Leste 4.7 9.8 8.0 6.8 6.1 6.4 6.1 6.5 7.4 7.5
Togo 16.0 19.2 17.6 20.1 21.0 22.3 17.5 15.4 16.9 20.1
Tonga 2.7 3.2 4.0 3.5 3.3 3.0 2.6 2.7 3.5 3.7
Trinidad and Tobago 124.6 26.8 57.4 43.6 21.2 32.8 40.0 48.7 42.9 67.0
Tunisia 280.0 283.4 208.7 216.1 278.3 244.0 792.2 1096.8 214.6 519.8
Turkey 1710.1 1260.6 1403.8 1503.4 1966.0 2203.4 2496.3 2559.7 2347.3 1893.1
Turkmenistan 68.3 75.1 75.6 81.6 86.8 97.5 92.4 96.3 79.1 72.2
Uganda 80.7 83.8 93.5 103.1 106.4 125.9 131.5 148.7 168.2 190.0
Ukraine 265.4 290.3 386.5 418.1 489.9 370.6 412.8 434.2 592.7 352.6
United Arab Emirates 1020.0 1276.1 1279.3 1243.6 1413.0 1352.2 1534.2 1516.7 1688.6 1782.5
United Kingdom 7957.4 8006.8 8162.7 8189.8 8559.2 8779.9 9253.4 9876.4 9239.1 7746.4
United States 58994.5 65380.5 58806.2 57708.9 47417.7 47403.1 54718.7 68017.4 82349.5 49862.2
Uruguay 221.3 203.9 164.1 169.9 218.1 267.8 313.8 336.6 398.4 386.9
Uzbekistan 223.5 271.1 223.4 226.6 266.9 266.5 234.2 297.7 392.8 438.1
Vanuatu 3.5 3.3 3.1 3.0 3.5 3.8 4.5 5.2 7.7 7.7
Venezuela, RB 1667.1 1972.4 1638.9 1066.7 1495.7 1826.5 2150.3 2546.9 2240.8 2395.3
Vietnam 583.5 657.7 752.4 865.0 929.6 996.4 1094.2 1361.7 1314.1 1386.1
West Bank and Gaza 91.0 53.1 55.5 60.6 60.1 65.8 982.7 778.3
Yemen, Rep. 166.6 202.4 314.0 278.1 269.7 282.5 295.3 408.5 371.6 341.0
Zambia 35.1 40.6 48.6 60.1 60.7 62.3 66.4 74.5 73.0 72.6
Zimbabwe 0.1 0.1 0.0 0.1 0.1 0.1 120.1 0.0
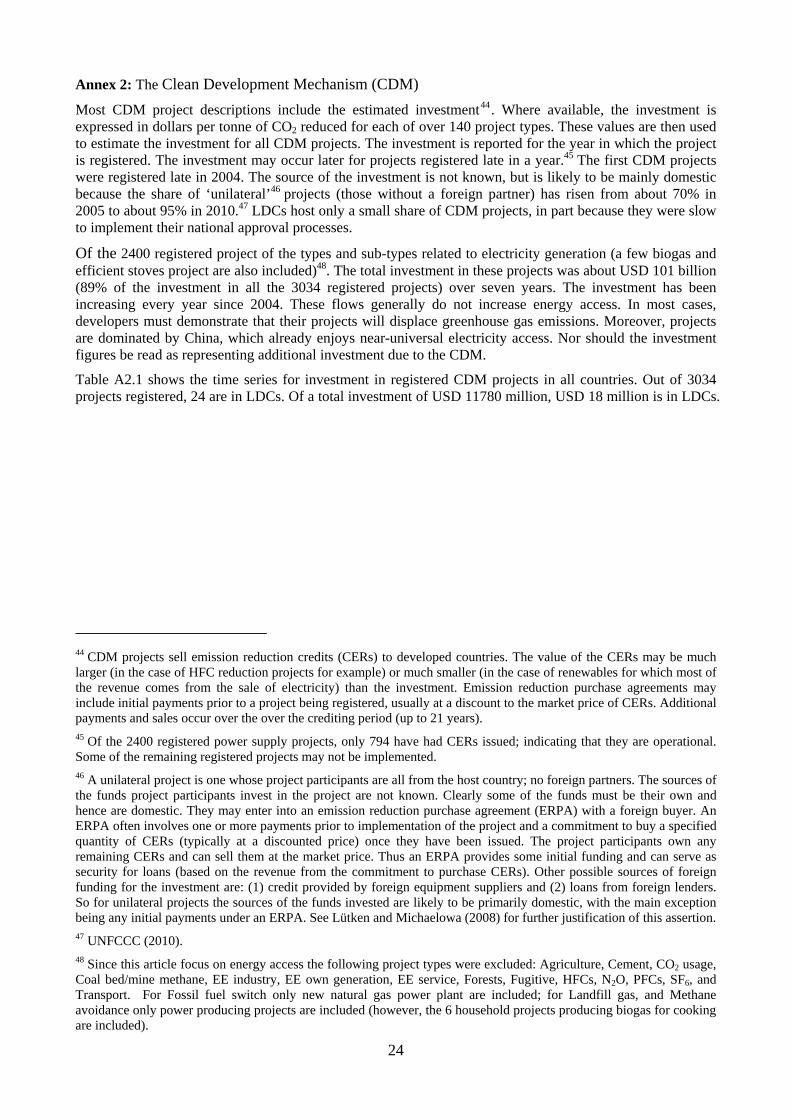
24
Annex 2: The Clean Development Mechanism (CDM) Most CDM project descriptions include the estimated investment44. Where available, the investment is expressed in dollars per tonne of CO2 reduced for each of over 140 project types. These values are then used to estimate the investment for all CDM projects. The investment is reported for the year in which the project is registered. The investment may occur later for projects registered late in a year.45 The first CDM projects were registered late in 2004. The source of the investment is not known, but is likely to be mainly domestic because the share of ‘unilateral’46 projects (those without a foreign partner) has risen from about 70% in 2005 to about 95% in 2010.47 LDCs host only a small share of CDM projects, in part because they were slow to implement their national approval processes.
Of the 2400 registered project of the types and sub-types related to electricity generation (a few biogas and efficient stoves project are also included)48. The total investment in these projects was about USD 101 billion (89% of the investment in all the 3034 registered projects) over seven years. The investment has been increasing every year since 2004. These flows generally do not increase energy access. In most cases, developers must demonstrate that their projects will displace greenhouse gas emissions. Moreover, projects are dominated by China, which already enjoys near-universal electricity access. Nor should the investment figures be read as representing additional investment due to the CDM.
Table A2.1 shows the time series for investment in registered CDM projects in all countries. Out of 3034 projects registered, 24 are in LDCs. Of a total investment of USD 11780 million, USD 18 million is in LDCs.
44 CDM projects sell emission reduction credits (CERs) to developed countries. The value of the CERs may be much larger (in the case of HFC reduction projects for example) or much smaller (in the case of renewables for which most of the revenue comes from the sale of electricity) than the investment. Emission reduction purchase agreements may include initial payments prior to a project being registered, usually at a discount to the market price of CERs. Additional payments and sales occur over the over the crediting period (up to 21 years). 45 Of the 2400 registered power supply projects, only 794 have had CERs issued; indicating that they are operational. Some of the remaining registered projects may not be implemented. 46 A unilateral project is one whose project participants are all from the host country; no foreign partners. The sources of the funds project participants invest in the project are not known. Clearly some of the funds must be their own and hence are domestic. They may enter into an emission reduction purchase agreement (ERPA) with a foreign buyer. An ERPA often involves one or more payments prior to implementation of the project and a commitment to buy a specified quantity of CERs (typically at a discounted price) once they have been issued. The project participants own any remaining CERs and can sell them at the market price. Thus an ERPA provides some initial funding and can serve as security for loans (based on the revenue from the commitment to purchase CERs). Other possible sources of foreign funding for the investment are: (1) credit provided by foreign equipment suppliers and (2) loans from foreign lenders. So for unilateral projects the sources of the funds invested are likely to be primarily domestic, with the main exception being any initial payments under an ERPA. See Lütken and Michaelowa (2008) for further justification of this assertion. 47 UNFCCC (2010). 48 Since this article focus on energy access the following project types were excluded: Agriculture, Cement, CO2 usage, Coal bed/mine methane, EE industry, EE own generation, EE service, Forests, Fugitive, HFCs, N2O, PFCs, SF6, and Transport. For Fossil fuel switch only new natural gas power plant are included; for Landfill gas, and Methane avoidance only power producing projects are included (however, the 6 household projects producing biogas for cooking are included).
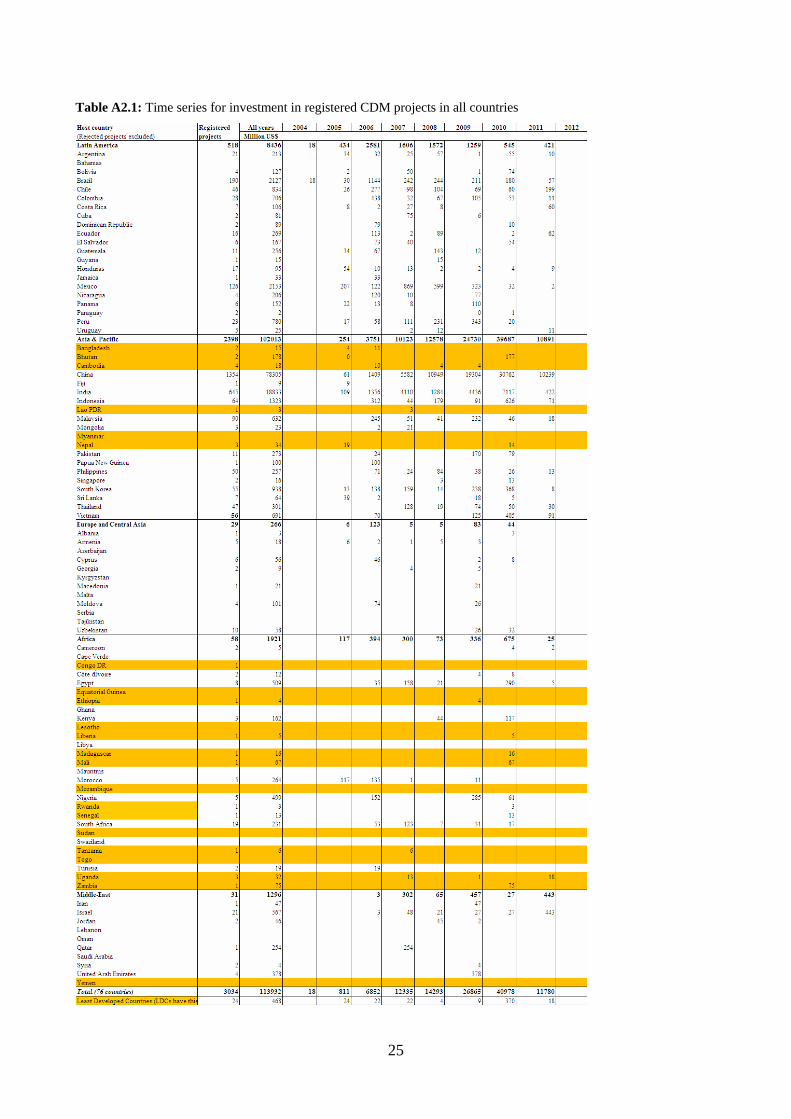
25
Table A2.1: Time series for investment in registered CDM projects in all countries
NOTE DI LAVORO DELLA FONDAZIONE ENI ENRICO MATTEI
Fondazione Eni Enrico Mattei Working Paper Series
Our Note di Lavoro are available on the Internet at the following addresses: http://www.feem.it/getpage.aspx?id=73&sez=Publications&padre=20&tab=1
http://papers.ssrn.com/sol3/JELJOUR_Results.cfm?form_name=journalbrowse&journal_id=266659 http://ideas.repec.org/s/fem/femwpa.html
http://www.econis.eu/LNG=EN/FAM?PPN=505954494 http://ageconsearch.umn.edu/handle/35978
http://www.bepress.com/feem/
NOTE DI LAVORO PUBLISHED IN 2011 SD 1.2011 Anna Alberini, Will Gans and Daniel Velez-Lopez: Residential Consumption of Gas and Electricity in the U.S.:
The Role of Prices and Income SD 2.2011 Alexander Golub, Daiju Narita and Matthias G.W. Schmidt: Uncertainty in Integrated Assessment Models of
Climate Change: Alternative Analytical Approaches SD 3.2010 Reyer Gerlagh and Nicole A. Mathys: Energy Abundance, Trade and Industry Location SD 4.2010 Melania Michetti and Renato Nunes Rosa: Afforestation and Timber Management Compliance Strategies in
Climate Policy. A Computable General Equilibrium Analysis SD 5.2011 Hassan Benchekroun and Amrita Ray Chaudhuri: “The Voracity Effect” and Climate Change: The Impact of
Clean Technologies IM 6.2011 Sergio Mariotti, Marco Mutinelli, Marcella Nicolini and Lucia Piscitello: Productivity Spillovers from Foreign
MNEs on Domestic Manufacturing Firms: Is Co-location Always a Plus? GC 7.2011 Marco Percoco: The Fight Against Geography: Malaria and Economic Development in Italian Regions GC 8.2011 Bin Dong and Benno Torgler: Democracy, Property Rights, Income Equality, and Corruption GC 9.2011 Bin Dong and Benno Torgler: Corruption and Social Interaction: Evidence from China SD 10.2011 Elisa Lanzi, Elena Verdolini and Ivan Haščič: Efficiency Improving Fossil Fuel Technologies for Electricity
Generation: Data Selection and Trends SD 11.2011 Stergios Athanassoglou: Efficient Random Assignment under a Combination of Ordinal and Cardinal
Information on Preferences SD 12.2011 Robin Cross, Andrew J. Plantinga and Robert N. Stavins: The Value of Terroir: Hedonic Estimation of
Vineyard Sale Prices SD 13.2011 Charles F. Mason and Andrew J. Plantinga: Contracting for Impure Public Goods: Carbon Offsets and
Additionality SD 14.2011 Alain Ayong Le Kama, Aude Pommeret and Fabien Prieur: Optimal Emission Policy under the Risk of
Irreversible Pollution SD 15.2011 Philippe Quirion, Julie Rozenberg, Olivier Sassi and Adrien Vogt-Schilb: How CO2 Capture and Storage Can
Mitigate Carbon Leakage SD 16.2011 Carlo Carraro and Emanuele Massetti: Energy and Climate Change in China SD 17.2011 ZhongXiang Zhang: Effective Environmental Protection in the Context of Government Decentralization SD 18.2011 Stergios Athanassoglou and Anastasios Xepapadeas: Pollution Control: When, and How, to be Precautious SD 19.2011 Jūratė Jaraitė and Corrado Di Maria: Efficiency, Productivity and Environmental Policy: A Case Study of
Power Generation in the EU SD 20.2011 Giulio Cainelli, Massimiliano Mozzanti and Sandro Montresor: Environmental Innovations, Local Networks
and Internationalization SD 21.2011 Gérard Mondello: Hazardous Activities and Civil Strict Liability: The Regulator’s Dilemma SD 22.2011 Haiyan Xu and ZhongXiang Zhang: A Trend Deduction Model of Fluctuating Oil Prices SD 23.2011 Athanasios Lapatinas, Anastasia Litina and Eftichios S. Sartzetakis: Corruption and Environmental Policy:
An Alternative Perspective SD 24.2011 Emanuele Massetti: A Tale of Two Countries:Emissions Scenarios for China and India SD 25.2011 Xavier Pautrel: Abatement Technology and the Environment-Growth Nexus with Education SD 26.2011 Dionysis Latinopoulos and Eftichios Sartzetakis: Optimal Exploitation of Groundwater and the Potential for
a Tradable Permit System in Irrigated Agriculture SD 27.2011 Benno Torgler and Marco Piatti. A Century of American Economic Review SD 28.2011 Stergios Athanassoglou, Glenn Sheriff, Tobias Siegfried and Woonghee Tim Huh: Optimal Mechanisms for
Heterogeneous Multi-cell Aquifers SD 29.2011 Libo Wu, Jing Li and ZhongXiang Zhang: Inflationary Effect of Oil-Price Shocks in an Imperfect Market: A
Partial Transmission Input-output Analysis SD 30.2011 Junko Mochizuki and ZhongXiang Zhang: Environmental Security and its Implications for China’s Foreign
Relations SD 31.2011 Teng Fei, He Jiankun, Pan Xunzhang and Zhang Chi: How to Measure Carbon Equity: Carbon Gini Index
Based on Historical Cumulative Emission Per Capita SD 32.2011 Dirk Rübbelke and Pia Weiss: Environmental Regulations, Market Structure and Technological Progress in
Renewable Energy Technology — A Panel Data Study on Wind Turbines SD 33.2011 Nicola Doni and Giorgio Ricchiuti: Market Equilibrium in the Presence of Green Consumers and Responsible
Firms: a Comparative Statics Analysis
SD 34.2011 Gérard Mondello: Civil Liability, Safety and Nuclear Parks: Is Concentrated Management Better? SD 35.2011 Walid Marrouch and Amrita Ray Chaudhuri: International Environmental Agreements in the Presence of
Adaptation ERM 36.2011 Will Gans, Anna Alberini and Alberto Longo: Smart Meter Devices and The Effect of Feedback on Residential
Electricity Consumption: Evidence from a Natural Experiment in Northern Ireland ERM 37.2011 William K. Jaeger and Thorsten M. Egelkraut: Biofuel Economics in a Setting of Multiple Objectives &
Unintended Consequences CCSD 38.2011 Kyriaki Remoundou, Fikret Adaman, Phoebe Koundouri and Paulo A.L.D. Nunes: Are Preferences for
Environmental Quality Sensitive to Financial Funding Schemes? Evidence from a Marine Restoration Programme in the Black Sea
CCSD 39.2011 Andrea Ghermanti and Paulo A.L.D. Nunes: A Global Map of Costal Recreation Values: Results From a Spatially Explicit Based Meta-Analysis
CCSD 40.2011 Andries Richter, Anne Maria Eikeset, Daan van Soest, and Nils Chr. Stenseth: Towards the Optimal Management of the Northeast Arctic Cod Fishery
CCSD 41.2011 Florian M. Biermann: A Measure to Compare Matchings in Marriage Markets CCSD 42.2011 Timo Hiller: Alliance Formation and Coercion in Networks CCSD 43.2011 Sunghoon Hong: Strategic Network Interdiction CCSD 44.2011 Arnold Polanski and Emiliya A. Lazarova: Dynamic Multilateral Markets CCSD 45.2011 Marco Mantovani, Georg Kirchsteiger, Ana Mauleon and Vincent Vannetelbosch: Myopic or Farsighted? An
Experiment on Network Formation CCSD 46.2011 Rémy Oddou: The Effect of Spillovers and Congestion on the Segregative Properties of Endogenous
Jurisdiction Structure Formation CCSD 47.2011 Emanuele Massetti and Elena Claire Ricci: Super-Grids and Concentrated Solar Power: A Scenario Analysis
with the WITCH Model ERM 48.2011 Matthias Kalkuhl, Ottmar Edenhofer and Kai Lessmann: Renewable Energy Subsidies: Second-Best Policy or
Fatal Aberration for Mitigation? CCSD 49.2011 ZhongXiang Zhang: Breaking the Impasse in International Climate Negotiations: A New Direction for
Currently Flawed Negotiations and a Roadmap for China to 2050 CCSD 50.2011 Emanuele Massetti and Robert Mendelsohn: Estimating Ricardian Models With Panel Data CCSD 51.2011 Y. Hossein Farzin and Kelly A. Grogan: Socioeconomic Factors and Water Quality in California CCSD 52.2011 Dinko Dimitrov and Shao Chin Sung: Size Monotonicity and Stability of the Core in Hedonic Games ES 53.2011 Giovanni Mastrobuoni and Paolo Pinotti: Migration Restrictions and Criminal Behavior: Evidence from a
Natural Experiment ERM 54.2011 Alessandro Cologni and Matteo Manera: On the Economic Determinants of Oil Production. Theoretical
Analysis and Empirical Evidence for Small Exporting Countries ERM 55.2011 Alessandro Cologni and Matteo Manera: Exogenous Oil Shocks, Fiscal Policy and Sector Reallocations in Oil
Producing Countries ERM 56.2011 Morgan Bazilian, Patrick Nussbaumer, Giorgio Gualberti, Erik Haites, Michael Levi, Judy Siegel, Daniel M.
Kammen and Joergen Fenhann: Informing the Financing of Universal Energy Access: An Assessment of Current Flows