Embed Size (px)
Citation preview
Making Access Possible 2020
Malawi Financial Inclusion Refresh
The cover symbol and artworkThrough the MAP programme, we hope to effect real change at country level and see the impact of financial inclusion on broader national growth and development. The cover graphic features a Lotus (Nelumbo nucifera), the national flower of Malawi. The flower symbolises growth and development while the circle represents inclusive growth. Each flower is an example of the successful growth in a unique environment.
Making Access PossibleMaking Access Possible (MAP) is a multi-country initiative to support financial inclusion through a process of evidence-based analysis feeding into a financial inclusion roadmap jointly implemented by a
range of local stakeholders. Through its design, MAP seeks to strengthen and focus the domestic development dialogue on financial inclusion. In each country, MAP brings together a broad range of
stakeholders from within government, the private sector and the donor community to create a set of practical actions aimed at extending financial inclusion tailored to that country.
This report was prepared by Acacia Economics lead by Ryan Hawthorne, Sha’ista Goga, Nasong Park & Nicola Wills, with management and oversight from the FinMark Trust team lead by Brendan Pearce and Nikki Kettles, Damola Owolade for overall management and technical guidance and Innocent Njati for local coordination work in country.
From Ministry of Finance:Mr Alfred Kutengule, Director, Pensions and Financial Sector Policy DivisionMrs Nancy Mpita, Deputy Director, Pensions and Financial Sector Policy DivisionMr Felix Nkhoma, Economist, Pensions and Financial Sector Policy DivisionReserve Bank of Malawi:Mrs Madalitso Chamba, Chief Examiner, Financial Inclusion and Consumer Protection, Financial Sector Regulation DepartmentForeign, Commonwealth and Development Office(FCDO): Mr Martin Chiocha
MAP Series Editor: Kameshnee Naidoo Technical review and oversight: Christiaan LootsEditor: Jacquie WithersLayout and Design: Hybrid Active
Working together to support implementation of Agenda 2030
Countries are seeking new ways to address complex and interconnected
challenges. Fulfilling the promise of the UN Sustainable Development Goals
(SDGs) requires multisectoral approaches that bring together expertise from a
range of perspectives. By harnessing our comparative advantage and working
within the context of our respective mandates, we can collectively make significant
progress towards realising the vision of the SDGs.
Financial inclusion is increasingly positioned as an enabler of broader development goals, in support of the SDGs. More and more countries are including an inclusive financial sector as a key objective in their national development plans, and this tendency is further underpinned by the G20 leadership of financial inclusion, which highlights the ongoing relevance of the SDGs and nationally led financial inclusion efforts. Furthermore, financial markets play a vital role in creating a sustainable future. Access to finance for individuals, SMEs and governments is important to a number of the SDGs, helping to facilitate secure payments, including for basic services and trade; smooth cash flows; offer financial protection; and improve allocation of capital while also enabling investments in many areas.
This MAP refresh, in supporting country efforts, increases the focus on inclusive growth (especially through SMEs and agriculture), access to basic services (energy, health and education), and improving household resilience, as well as gender equality. Increased reliance on technological innovation and digital financial services will help to improve the scale and efficiency of financial inclusion interventions.
This refresh was undertaken by the United Nations Capital Development Fund (UNCDF) to jointly address UNDP’s Signature Solution 1, which seeks to work with countries to keep people out of poverty, relating directly to SDG 1: eradicate all forms of poverty, wherever it exists.
The core focus of Signature Solution 1 is helping people get out of – and stay out of – poverty; and hence the analysis and interventions identified help eradicate poverty, such as by creating decent jobs and livelihoods, providing social safety nets, and ensuring access to services such as water, energy, healthcare, credit and financing support for investment in productive assets.
Partnering for a common purposeBy combining inspiration, ideas, knowledge and resources with
our partners, we become more than the sum of our parts.
We are committed to empowering investors—public and private alike—with the clarity, insights and tools they need to optimise the positive impact of their investments, closing the gap between high-level principles and financial performance to make a positive contribution to society.
MAP was initiated by the UNCDF and developed in partnership with FinMark Trust. In the SADC region, FinMark Trust is a MAP implementing partner.
FinMark Trust is an independent non-profit trust whose purpose is ‘Making financial markets work for the poor, by promoting financial inclusion and regional financial integration’. The Trust works to unlock real economic sector development through financial inclusion, by gathering and systematically analysing financial services consumer data to provide in-depth insights, and following through with systematic financial sector inclusion implementation actions to overcome market-level barriers hampering the effective provision of services.
Note on the use of household dataWithin this document (unless otherwise referenced), demographic, income and financial usage data is obtained from the 2014 FinScope Consumer Survey and the 2019 FinScope MSME survey undertaken in Malawi. A summary report and presentation of FinScope is available as a separate deliverable, and the FinScope dataset is available for future research at https://uncdfmapdata.org.
Our technical responseCreate a pervasive infrastructure through partnerships to enhance the quality and
depth of financial inclusion in Malawi, laying out a vision for the enhancement
of financial inclusion in Malawi, in order to support national objectives through
employment creation, human capital development and improved household welfare.
This vision was set out in 2015, when the UNCDF assisted the Government of Malawi with the preparation of a National Strategy for Financial Inclusion. It called for a MAP study on Malawi, which follows an approach adopted in a range of countries, including Botswana, Democratic Republic of Congo, Lao PDR, Lesotho, Mozambique, Myanmar, Nepal and Thailand. The 2015 MAP diagnostic report for Malawi considered the country context, demand and supply for financial services, and the regulation of these services. The report identified practical recommendations for overcoming barriers to greater financial inclusion, including (i) expanding the reach of payments, (ii) leveraging village savings and loan associations (VSLAs) to enable savings, (iii) targeted finance for MSMEs and farmers, (iv) niche insurance opportunities to reduce vulnerabilities and (v) effective consumer empowerment and education.
In this updated MAP report (MAP refresh), we review the implementation of the 2015 MAP diagnostic and consider key market changes and identify financial inclusion interventions that can grow the economy and benefit society. This MAP refresh accompanies a 2019 MAP report on micro, small and medium enterprises (MSMEs) in Malawi, and draws on that research.
2019-2020Malawi at a glance
2019-2020Malawi at a glance
7
Fin
anci
al in
clu
sion
an
d a
cces
s to
fin
ance
Financial inclusion and access to finance
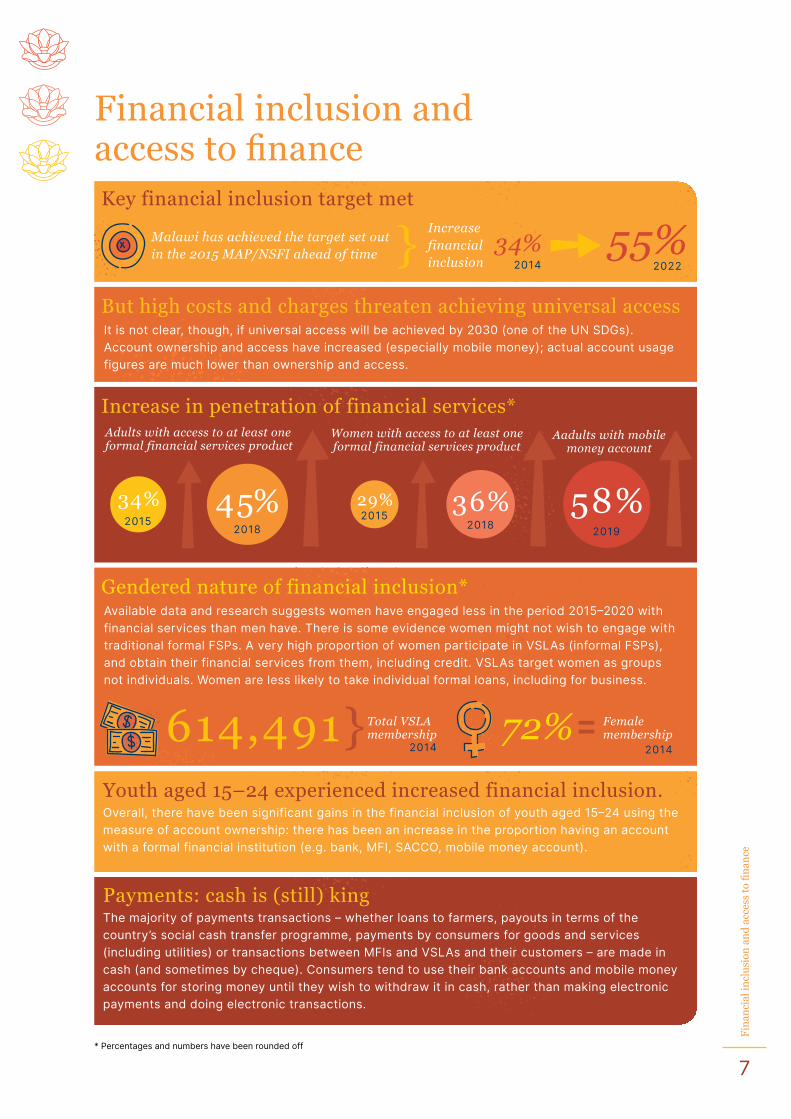
Malawi has achieved the target set out in the 2015 MAP/NSFI ahead of time 55%34%
Increase financial inclusion
Key financial inclusion target met
614,491} Total VSLA membership
Female membership72%
2014
}2014 2022
2014
But high costs and charges threaten achieving universal access It is not clear, though, if universal access will be achieved by 2030 (one of the UN SDGs). Account ownership and access have increased (especially mobile money); actual account usage figures are much lower than ownership and access.
Gendered nature of financial inclusion*Available data and research suggests women have engaged less in the period 2015–2020 with financial services than men have. There is some evidence women might not wish to engage with traditional formal FSPs. A very high proportion of women participate in VSLAs (informal FSPs), and obtain their financial services from them, including credit. VSLAs target women as groups not individuals. Women are less likely to take individual formal loans, including for business.
2018
45%2015
34%2018
36%2019
58%201529%
Adults with access to at least one formal financial services product
Women with access to at least one formal financial services product
Aadults with mobile money account
Increase in penetration of financial services*
Youth aged 15–24 experienced increased financial inclusion. Overall, there have been significant gains in the financial inclusion of youth aged 15–24 using the measure of account ownership: there has been an increase in the proportion having an account with a formal financial institution (e.g. bank, MFI, SACCO, mobile money account).
Payments: cash is (still) kingThe majority of payments transactions – whether loans to farmers, payouts in terms of the country’s social cash transfer programme, payments by consumers for goods and services (including utilities) or transactions between MFIs and VSLAs and their customers – are made in cash (and sometimes by cheque). Consumers tend to use their bank accounts and mobile money accounts for storing money until they wish to withdraw it in cash, rather than making electronic payments and doing electronic transactions.
* Percentages and numbers have been rounded off
8
Fin
anci
al in
clu
sion
an
d a
cces
s to
fin
ance
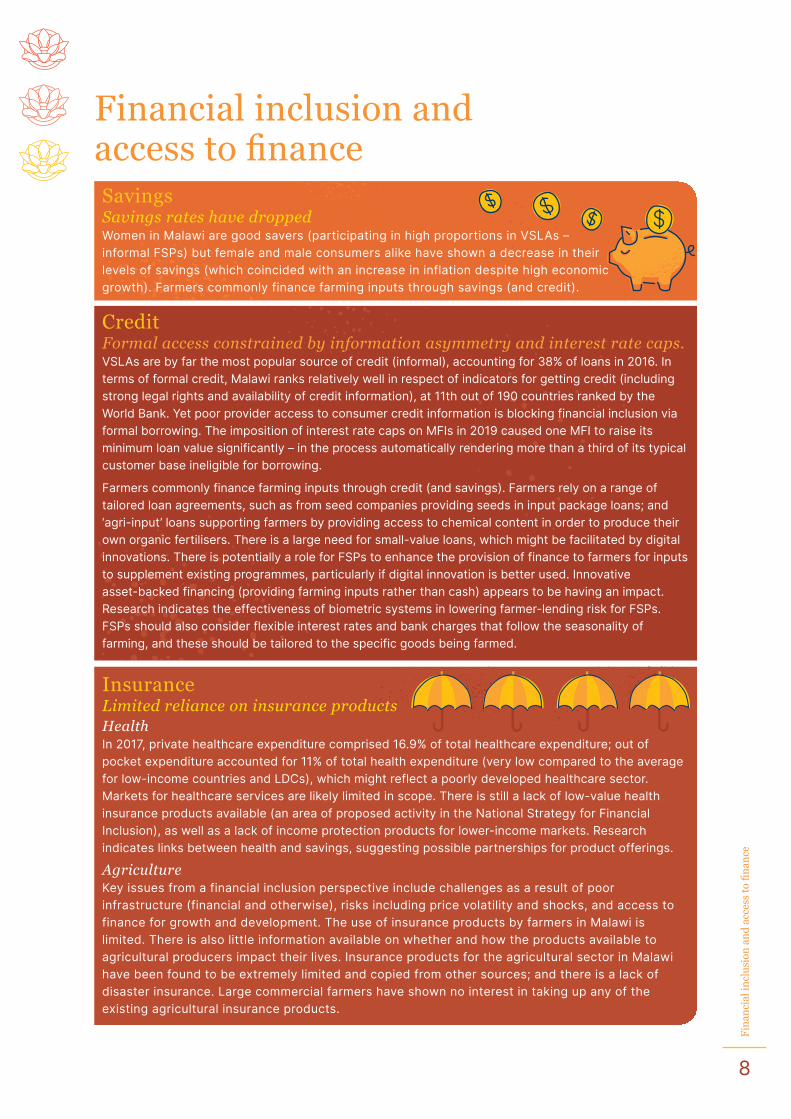
SavingsSavings rates have dropped Women in Malawi are good savers (participating in high proportions in VSLAs – informal FSPs) but female and male consumers alike have shown a decrease in their levels of savings (which coincided with an increase in inflation despite high economic growth). Farmers commonly finance farming inputs through savings (and credit).
CreditFormal access constrained by information asymmetry and interest rate caps. VSLAs are by far the most popular source of credit (informal), accounting for 38% of loans in 2016. In terms of formal credit, Malawi ranks relatively well in respect of indicators for getting credit (including strong legal rights and availability of credit information), at 11th out of 190 countries ranked by the World Bank. Yet poor provider access to consumer credit information is blocking financial inclusion via formal borrowing. The imposition of interest rate caps on MFIs in 2019 caused one MFI to raise its minimum loan value significantly – in the process automatically rendering more than a third of its typical customer base ineligible for borrowing.
Farmers commonly finance farming inputs through credit (and savings). Farmers rely on a range of tailored loan agreements, such as from seed companies providing seeds in input package loans; and ‘agri-input’ loans supporting farmers by providing access to chemical content in order to produce their own organic fertilisers. There is a large need for small-value loans, which might be facilitated by digital innovations. There is potentially a role for FSPs to enhance the provision of finance to farmers for inputs to supplement existing programmes, particularly if digital innovation is better used. Innovative asset-backed financing (providing farming inputs rather than cash) appears to be having an impact. Research indicates the effectiveness of biometric systems in lowering farmer-lending risk for FSPs. FSPs should also consider flexible interest rates and bank charges that follow the seasonality of farming, and these should be tailored to the specific goods being farmed.
InsuranceLimited reliance on insurance productsHealthIn 2017, private healthcare expenditure comprised 16.9% of total healthcare expenditure; out of pocket expenditure accounted for 11% of total health expenditure (very low compared to the average for low-income countries and LDCs), which might reflect a poorly developed healthcare sector. Markets for healthcare services are likely limited in scope. There is still a lack of low-value health insurance products available (an area of proposed activity in the National Strategy for Financial Inclusion), as well as a lack of income protection products for lower-income markets. Research indicates links between health and savings, suggesting possible partnerships for product offerings.
AgricultureKey issues from a financial inclusion perspective include challenges as a result of poor infrastructure (financial and otherwise), risks including price volatility and shocks, and access to finance for growth and development. The use of insurance products by farmers in Malawi is limited. There is also little information available on whether and how the products available to agricultural producers impact their lives. Insurance products for the agricultural sector in Malawi have been found to be extremely limited and copied from other sources; and there is a lack of disaster insurance. Large commercial farmers have shown no interest in taking up any of the existing agricultural insurance products.
Financial inclusion and access to finance
A changing landscape1
10
A c
han
gin
g la
nd
scap
e
Economy, population and growth
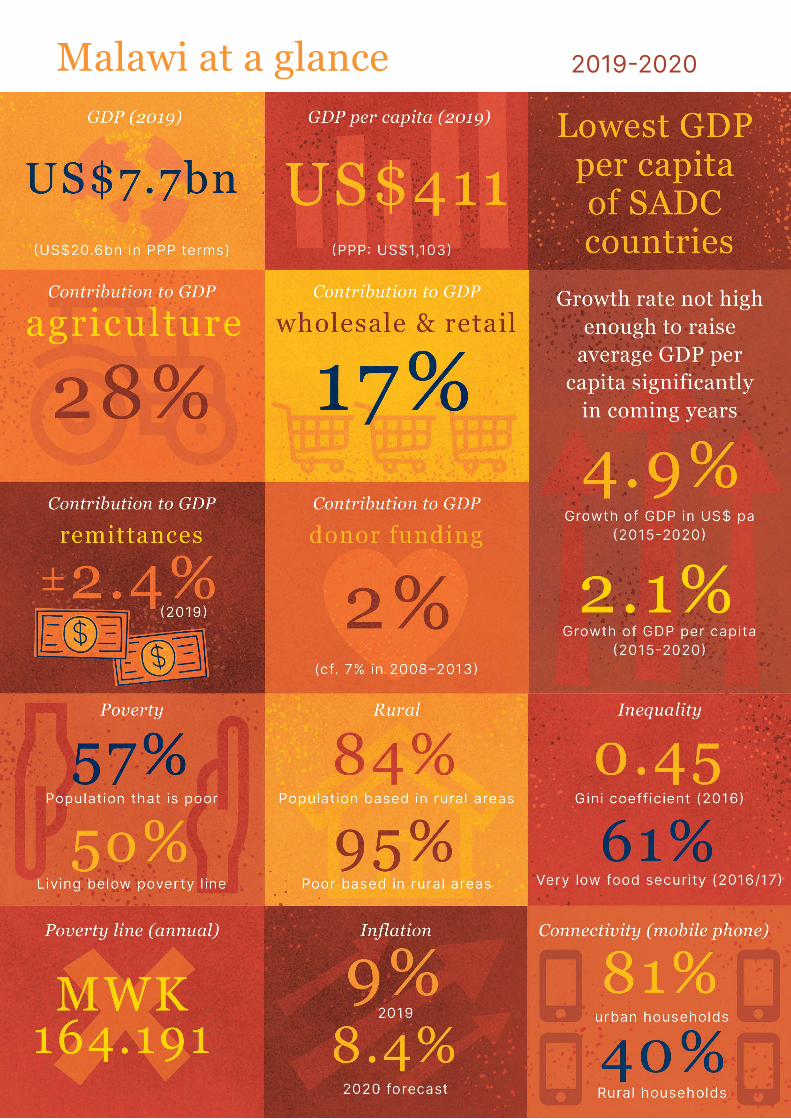
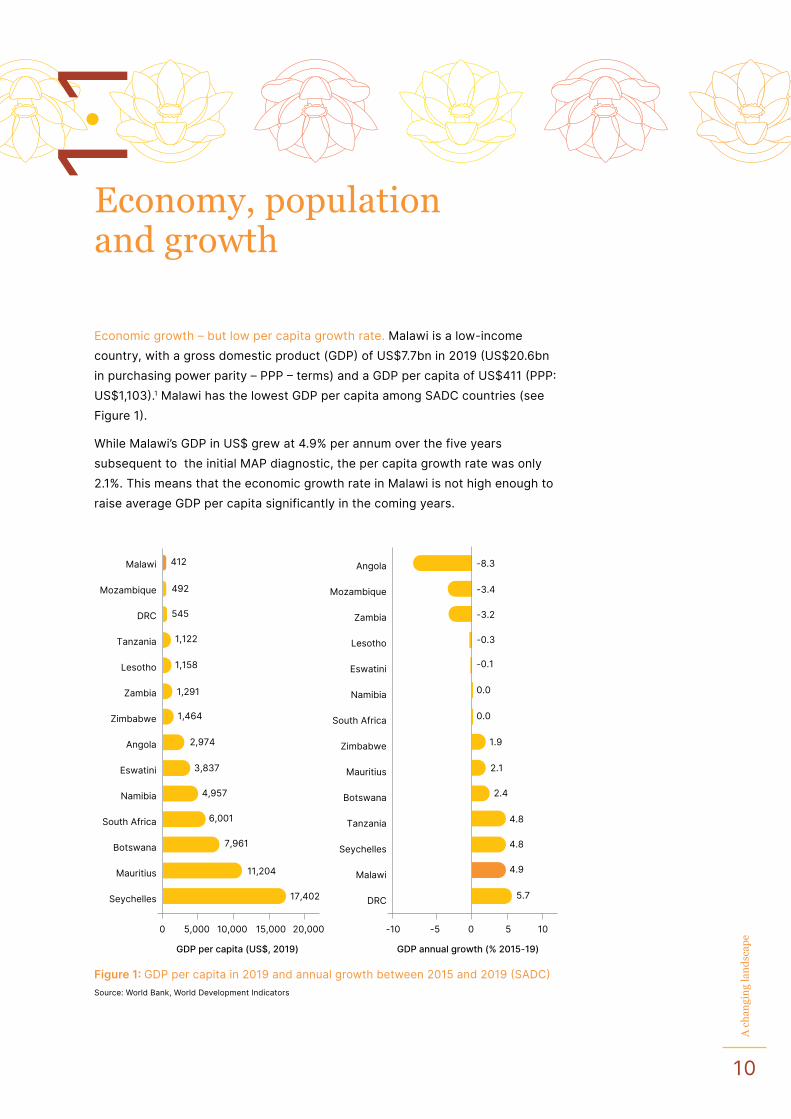
Economic growth – but low per capita growth rate. Malawi is a low-income country, with a gross domestic product (GDP) of US$7.7bn in 2019 (US$20.6bn in purchasing power parity – PPP – terms) and a GDP per capita of US$411 (PPP: US$1,103).1 Malawi has the lowest GDP per capita among SADC countries (see Figure 1).
While Malawi’s GDP in US$ grew at 4.9% per annum over the five years subsequent to the initial MAP diagnostic, the per capita growth rate was only 2.1%. This means that the economic growth rate in Malawi is not high enough to raise average GDP per capita significantly in the coming years.
Malawi
Mozambique
DRC
Tanzania
Lesotho
Zambia
Zimbabwe
Angola
Eswatini
Namibia
South Africa
Botswana
Mauritius
Seychelles
Malawi
Mozambique
DRC
Tanzania
Lesotho
Zambia
Zimbabwe
Angola
Eswatini
Namibia
South Africa
Botswana
Mauritius
Seychelles
0 0 5 10-5-105,000 10,000
GDP per capita (US$, 2019) GDP annual growth (% 2015-19)
15,000 20,000
17,402
11,204
3,837
2,974
1,464
1,291
1,158
1,122
545
492
412 -8.3
-3.4
-3.2
-0.3
-0.1
0.0
0.0
1.9
2.1
2.4
4.8
4.8
4.9
5.7
6,001
7,961
4,957
Figure 1: GDP per capita in 2019 and annual growth between 2015 and 2019 (SADC)Source: World Bank, World Development Indicators
1.1
11
A c
han
gin
g la
nd
scap
e
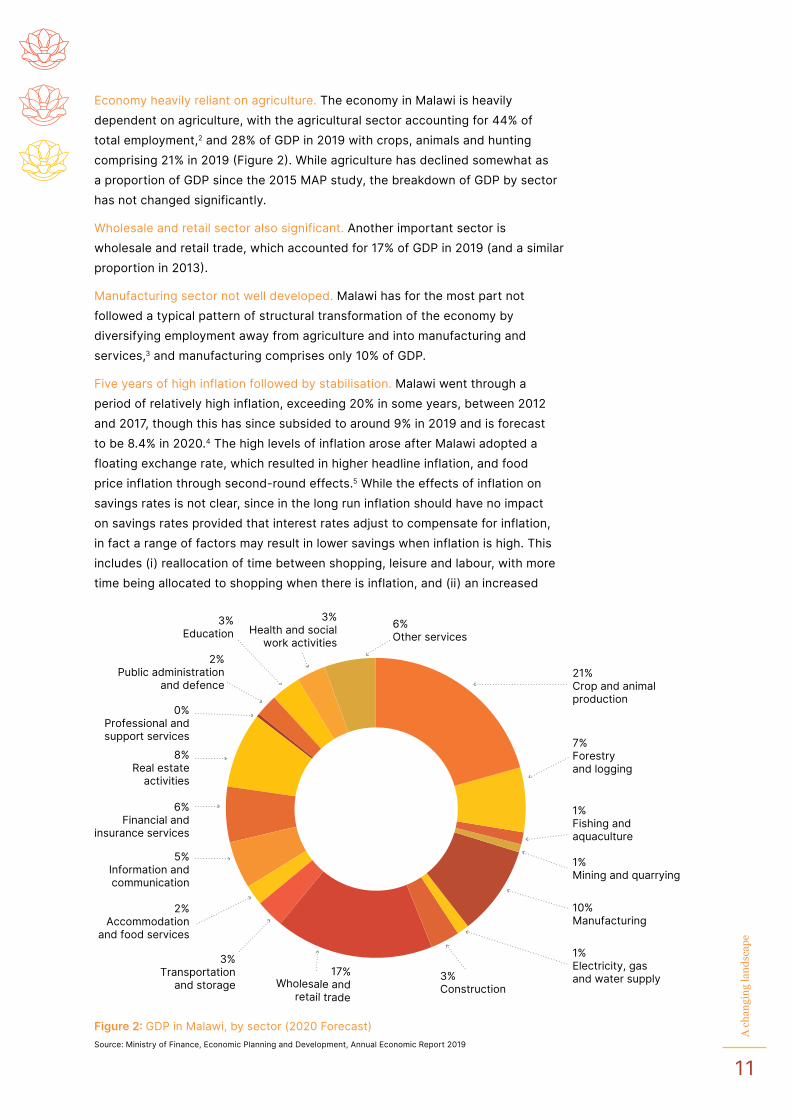
Economy heavily reliant on agriculture. The economy in Malawi is heavily dependent on agriculture, with the agricultural sector accounting for 44% of total employment,2 and 28% of GDP in 2019 with crops, animals and hunting comprising 21% in 2019 (Figure 2). While agriculture has declined somewhat as a proportion of GDP since the 2015 MAP study, the breakdown of GDP by sector has not changed significantly.
Wholesale and retail sector also significant. Another important sector is wholesale and retail trade, which accounted for 17% of GDP in 2019 (and a similar proportion in 2013).
Manufacturing sector not well developed. Malawi has for the most part not followed a typical pattern of structural transformation of the economy by diversifying employment away from agriculture and into manufacturing and services,3 and manufacturing comprises only 10% of GDP.
Five years of high inflation followed by stabilisation. Malawi went through a period of relatively high inflation, exceeding 20% in some years, between 2012 and 2017, though this has since subsided to around 9% in 2019 and is forecast to be 8.4% in 2020.4 The high levels of inflation arose after Malawi adopted a floating exchange rate, which resulted in higher headline inflation, and food price inflation through second-round effects.5 While the effects of inflation on savings rates is not clear, since in the long run inflation should have no impact on savings rates provided that interest rates adjust to compensate for inflation, in fact a range of factors may result in lower savings when inflation is high. This includes (i) reallocation of time between shopping, leisure and labour, with more time being allocated to shopping when there is inflation, and (ii) an increased
6%Other services
3%Health and social
work activities
3%Education
2%Public administration
and defence
0%Professional andsupport services
8%Real estate
activities
6%Financial and
insurance services
5%Information andcommunication
2%Accommodation
and food services
3%Transportation
and storage17%
Wholesale andretail trade
3%Construction
1%Electricity, gasand water supply
10%Manufacturing
1%Fishing andaquaculture
1%Mining and quarrying
7%Forestryand logging
21%Crop and animalproduction
Figure 2: GDP in Malawi, by sector (2020 Forecast)Source: Ministry of Finance, Economic Planning and Development, Annual Economic Report 2019
12
A c
han
gin
g la
nd
scap
e
tax burden during inflation if the tax system uses nominal (and not real) values.6 Therefore, the higher rates of inflation may be linked to the lower rates of saving over this period (discussed in Section 4.1).
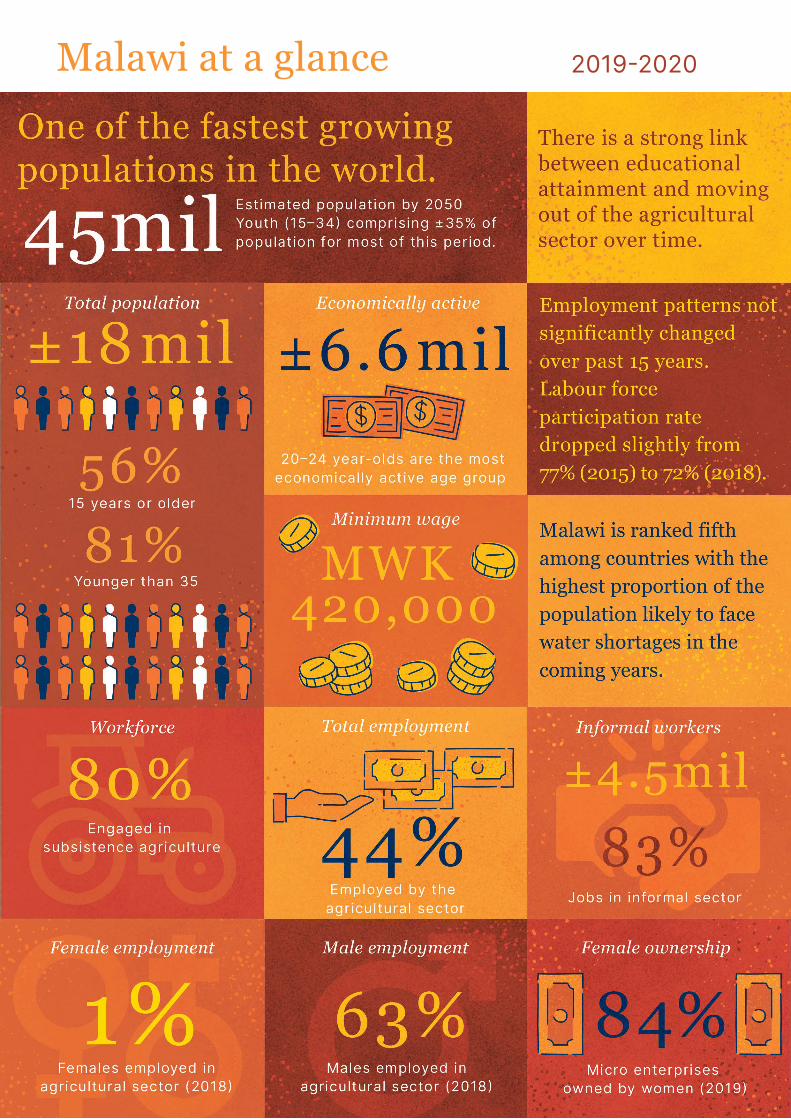
Well over half of the population are youth.Malawi has a population of approximately 18m (up from 16.7m in 2015), 56% of whom (9.2m) are aged 15 years or older (only slightly up from 55% in 2015).7 This means that the population is overwhelmingly young, with 44% of the population thus being younger than 15 years.
Labour force participation rate has dropped. Of the population aged 15 years and older, approximately 6.6m (72%) were economically active in 2018 (discussed in Section 3.3.1). This is slightly lower than the labour force participation rate during the previous MAP refresh (approximately 77%).8
Majority of population is located rurally. Malawi is administered in three regions (Southern, Central and Northern), with 28 districts and four cities. Lilongwe City, with a population of 1m, is the largest of the four cities.9 The Lilongwe district in the Central region (which excludes Lilongwe City) is by far the most populous, with 1.6m inhabitants. The population overwhelmingly lives in rural areas (84%).10
Heavily donor-funding reliant. Malawi relies heavily on (volatile) donor funding, which accounts for approximately 2% of GDP in recent years, having declined from over 7% between 2008 and 2013.11 While in 2011 donor spending comprised little more than half of government spending, in 2017, for example, donor spending exceeded government spending.12 In the current fiscal year (2020/2021), donor grant funding is projected to be US$148mn, comprising US$88mn for projects and US$60mn in dedicated funding with no funding going directly to the government budget.13 It is important to take into account that different donors adopt very different approaches to managing their relationship with the government. For example, while the World Bank and IMF have played a significant role in applying pressure on other donors to force the government of Malawi to adhere to loan conditions, this has not been the case with Chinese donors.14 This is important from a financial inclusion perspective because donors play an important role in the financial sector (the World Bank, for instance, financed the upgrade of the payments system and implementation of financial consumer empowerment and education initiatives over the past years),15 and at the nexus between financial inclusion and real economy outcomes, such as the payment of social grants.16
The donor landscape, which is a complex one, therefore has a significant impact on economic outcomes; and donors will likely play an important role in financial inclusion in the coming years in Malawi.
Malawi relies
heavily on (volatile)
donor funding,
which accounts for
approximately
2% of GDP in recent
years, having
declined from
over 7% between
2008 and 2013.
13
A c
han
gin
g la
nd
scap
e
Policy and regulation
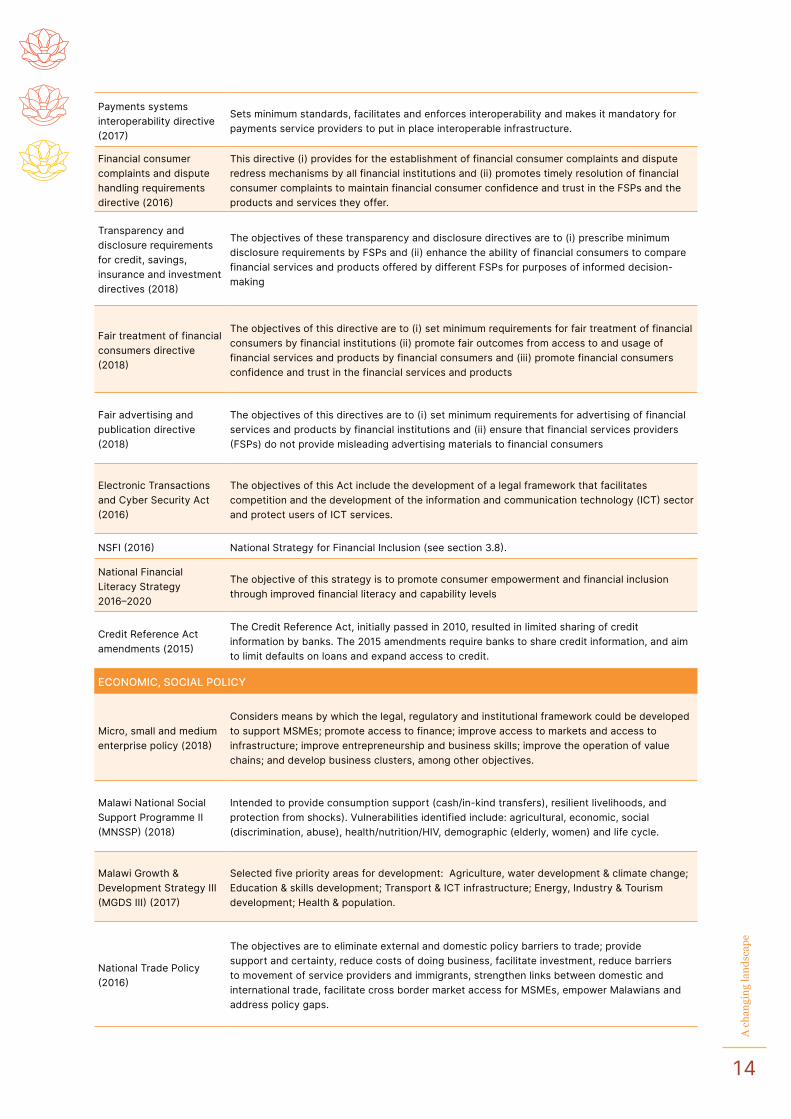
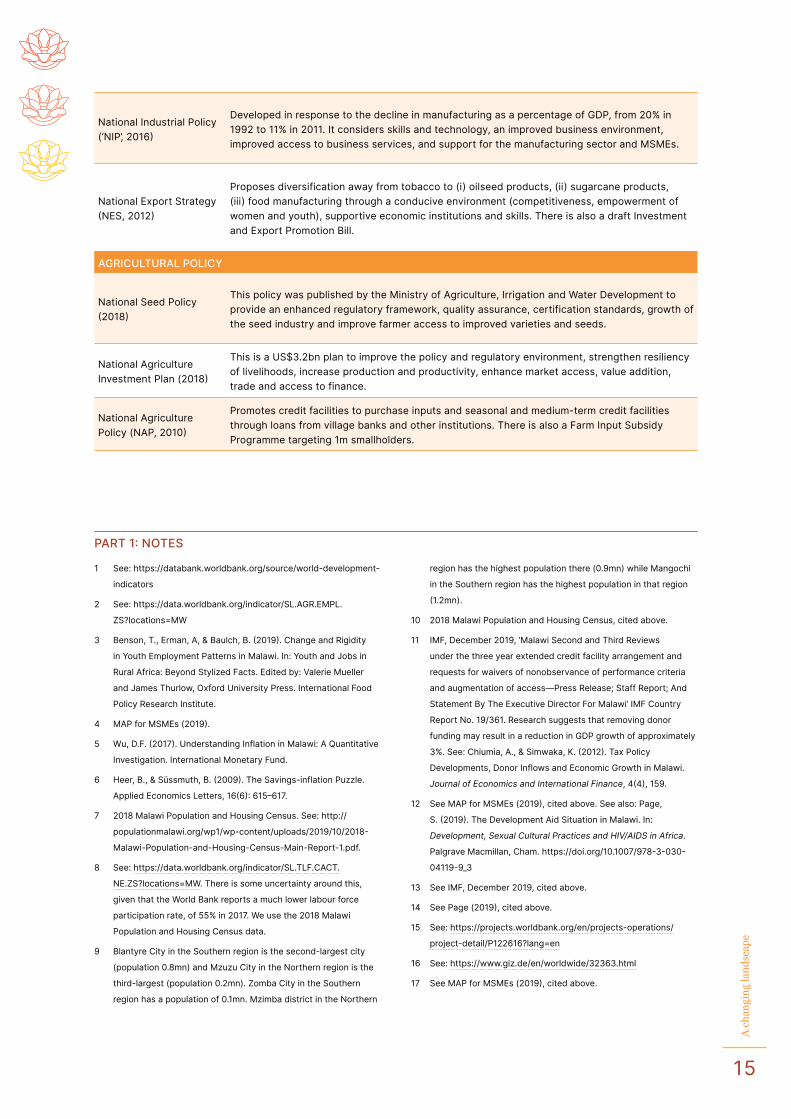
Extensive policy reform subsequent to the initial MAP. The policy and regulatory situation in Malawi is in flux, and a range of laws and policies have been introduced to expand access to and usage of financial services (see Table 1).17 This is particularly evident from the raft of mobile money and payments system reforms that have resulted in a very large expansion in mobile financial services following the initial MAP and NSFI (discussed in more detail in Section 4.1).
A dedicated financial inclusion governance structure. A governance structure was set up to coordinate financial inclusion, and included the Ministry of Finance, Economic Planning, and Development (MoFEPD), the Reserve Bank of Malawi (RBM), the World Bank and other donors undertaking projects in this area.
Table 1: Key policies and regulations in Malawi
POLICY/REGULATION OVERVIEW
FINANCIAL SERVICES
Licensing of community banks directive, 2019
This directive (i) establishes the licencing requirements for a community bank, (ii) specifies information required by the Registrar of Financial Institutions, and (iii) ensures that applications are objectively and consistently evaluated. The aim was to expand the reach of financial services to underserved locations.
Inclusive insurance directive (2019)
Provides minimum standards for the conduct of inclusive insurance business, imposes duties on inclusive insurance providers, establishes general features of products, promotes consumer protection and facilitates financial inclusion.
e-Money regulations (2019)
Provides for a notification process for agent registration, transaction (MWK 750k per day) and balance (MWK 1m) limits, data collection by the RBM, consumer protection (including tariff disclosure), and a requirement to distribute 95% of interest earned on trust accounts held by mobile money service providers to users. The aim was to expand the reach of financial inclusion through branchless banking.
Agency banking regulations (2018)
Published under the Financial Services Act, these regulations allow banks to offer services via agents, and impose a 10-day deadline for the Registrar of Financial Institutions to approve agents. They provide for the types of businesses that may be agents and make banks responsible for monitoring agents.
Medical Schemes Bill (2017)
Aims to expand access to healthcare insurance beyond the current 1.4% penetration, improve service delivery and increase confidence in medical insurance products.
Warehouse Receipt Act (2017)
Sets out the rights and obligations of the users of warehouse receipts, including warehouse operators. This was intended to facilitate increased access to credit.
1.2
The policy and
regulatory situation
in Malawi is in flux,
and a range of laws
and policies have
been introduced
to expand access
to and usage of
financial services.
14
A c
han
gin
g la
nd
scap
e
Payments systems interoperability directive (2017)
Sets minimum standards, facilitates and enforces interoperability and makes it mandatory for payments service providers to put in place interoperable infrastructure.
Financial consumer complaints and dispute handling requirements directive (2016)
This directive (i) provides for the establishment of financial consumer complaints and dispute redress mechanisms by all financial institutions and (ii) promotes timely resolution of financial consumer complaints to maintain financial consumer confidence and trust in the FSPs and the products and services they offer.
Transparency and disclosure requirements for credit, savings, insurance and investment directives (2018)
The objectives of these transparency and disclosure directives are to (i) prescribe minimum disclosure requirements by FSPs and (ii) enhance the ability of financial consumers to compare financial services and products offered by different FSPs for purposes of informed decision-making
Fair treatment of financial consumers directive (2018)
The objectives of this directive are to (i) set minimum requirements for fair treatment of financial consumers by financial institutions (ii) promote fair outcomes from access to and usage of financial services and products by financial consumers and (iii) promote financial consumers confidence and trust in the financial services and products
Fair advertising and publication directive (2018)
The objectives of this directives are to (i) set minimum requirements for advertising of financial services and products by financial institutions and (ii) ensure that financial services providers (FSPs) do not provide misleading advertising materials to financial consumers
Electronic Transactions and Cyber Security Act (2016)
The objectives of this Act include the development of a legal framework that facilitates competition and the development of the information and communication technology (ICT) sector and protect users of ICT services.
NSFI (2016) National Strategy for Financial Inclusion (see section 3.8).
National Financial Literacy Strategy 2016–2020
The objective of this strategy is to promote consumer empowerment and financial inclusion through improved financial literacy and capability levels
Credit Reference Act amendments (2015)
The Credit Reference Act, initially passed in 2010, resulted in limited sharing of credit information by banks. The 2015 amendments require banks to share credit information, and aim to limit defaults on loans and expand access to credit.
ECONOMIC, SOCIAL POLICY
Micro, small and medium enterprise policy (2018)
Considers means by which the legal, regulatory and institutional framework could be developed to support MSMEs; promote access to finance; improve access to markets and access to infrastructure; improve entrepreneurship and business skills; improve the operation of value chains; and develop business clusters, among other objectives.
Malawi National Social Support Programme II (MNSSP) (2018)
Intended to provide consumption support (cash/in-kind transfers), resilient livelihoods, and protection from shocks). Vulnerabilities identified include: agricultural, economic, social (discrimination, abuse), health/nutrition/HIV, demographic (elderly, women) and life cycle.
Malawi Growth & Development Strategy III (MGDS III) (2017)
Selected five priority areas for development: Agriculture, water development & climate change; Education & skills development; Transport & ICT infrastructure; Energy, Industry & Tourism development; Health & population.
National Trade Policy (2016)
The objectives are to eliminate external and domestic policy barriers to trade; provide support and certainty, reduce costs of doing business, facilitate investment, reduce barriers to movement of service providers and immigrants, strengthen links between domestic and international trade, facilitate cross border market access for MSMEs, empower Malawians and address policy gaps.
15
A c
han
gin
g la
nd
scap
e
National Industrial Policy (‘NIP’, 2016)
Developed in response to the decline in manufacturing as a percentage of GDP, from 20% in 1992 to 11% in 2011. It considers skills and technology, an improved business environment, improved access to business services, and support for the manufacturing sector and MSMEs.
National Export Strategy (NES, 2012)
Proposes diversification away from tobacco to (i) oilseed products, (ii) sugarcane products, (iii) food manufacturing through a conducive environment (competitiveness, empowerment of women and youth), supportive economic institutions and skills. There is also a draft Investment and Export Promotion Bill.
AGRICULTURAL POLICY
National Seed Policy (2018)
This policy was published by the Ministry of Agriculture, Irrigation and Water Development to provide an enhanced regulatory framework, quality assurance, certification standards, growth of the seed industry and improve farmer access to improved varieties and seeds.
National Agriculture Investment Plan (2018)
This is a US$3.2bn plan to improve the policy and regulatory environment, strengthen resiliency of livelihoods, increase production and productivity, enhance market access, value addition, trade and access to finance.
National Agriculture Policy (NAP, 2010)
Promotes credit facilities to purchase inputs and seasonal and medium-term credit facilities through loans from village banks and other institutions. There is also a Farm Input Subsidy Programme targeting 1m smallholders.
PART 1: NOTES
1 See: https://databank.worldbank.org/source/world-development-
indicators
2 See: https://data.worldbank.org/indicator/SL.AGR.EMPL.
ZS?locations=MW
3 Benson, T., Erman, A, & Baulch, B. (2019). Change and Rigidity
in Youth Employment Patterns in Malawi. In: Youth and Jobs in
Rural Africa: Beyond Stylized Facts. Edited by: Valerie Mueller
and James Thurlow, Oxford University Press. International Food
Policy Research Institute.
4 MAP for MSMEs (2019).
5 Wu, D.F. (2017). Understanding Inflation in Malawi: A Quantitative
Investigation. International Monetary Fund.
6 Heer, B., & Süssmuth, B. (2009). The Savings-inflation Puzzle.
Applied Economics Letters, 16(6): 615–617.
7 2018 Malawi Population and Housing Census. See: http://
populationmalawi.org/wp1/wp-content/uploads/2019/10/2018-
Malawi-Population-and-Housing-Census-Main-Report-1.pdf.
8 See: https://data.worldbank.org/indicator/SL.TLF.CACT.
NE.ZS?locations=MW. There is some uncertainty around this,
given that the World Bank reports a much lower labour force
participation rate, of 55% in 2017. We use the 2018 Malawi
Population and Housing Census data.
9 Blantyre City in the Southern region is the second-largest city
(population 0.8mn) and Mzuzu City in the Northern region is the
third-largest (population 0.2mn). Zomba City in the Southern
region has a population of 0.1mn. Mzimba district in the Northern
region has the highest population there (0.9mn) while Mangochi
in the Southern region has the highest population in that region
(1.2mn).
10 2018 Malawi Population and Housing Census, cited above.
11 IMF, December 2019, ‘Malawi Second and Third Reviews
under the three year extended credit facility arrangement and
requests for waivers of nonobservance of performance criteria
and augmentation of access—Press Release; Staff Report; And
Statement By The Executive Director For Malawi’ IMF Country
Report No. 19/361. Research suggests that removing donor
funding may result in a reduction in GDP growth of approximately
3%. See: Chiumia, A., & Simwaka, K. (2012). Tax Policy
Developments, Donor Inflows and Economic Growth in Malawi.
Journal of Economics and International Finance, 4(4), 159.
12 See MAP for MSMEs (2019), cited above. See also: Page,
S. (2019). The Development Aid Situation in Malawi. In:
Development, Sexual Cultural Practices and HIV/AIDS in Africa.
Palgrave Macmillan, Cham. https://doi.org/10.1007/978-3-030-
04119-9_3
13 See IMF, December 2019, cited above.
14 See Page (2019), cited above.
15 See: https://projects.worldbank.org/en/projects-operations/
project-detail/P122616?lang=en
16 See: https://www.giz.de/en/worldwide/32363.html
17 See MAP for MSMEs (2019), cited above.
Financial inclusion and it’s links to social and economic questions
2
17
Fin
anci
al in
clu
sion
an
d it
’s li
nks
to
soci
al a
nd
eco
nom
ic q
ues
tion
s
2.1
Introduction
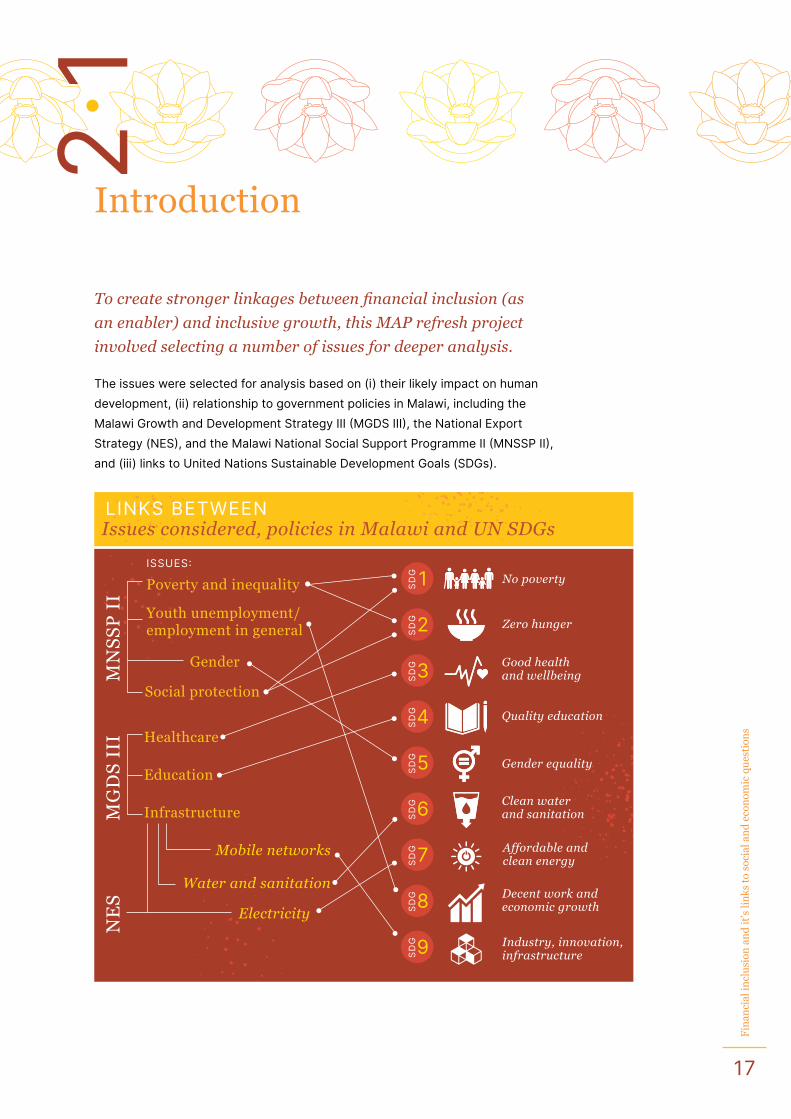
To create stronger linkages between financial inclusion (as
an enabler) and inclusive growth, this MAP refresh project
involved selecting a number of issues for deeper analysis.
The issues were selected for analysis based on (i) their likely impact on human development, (ii) relationship to government policies in Malawi, including the Malawi Growth and Development Strategy III (MGDS III), the National Export Strategy (NES), and the Malawi National Social Support Programme II (MNSSP II), and (iii) links to United Nations Sustainable Development Goals (SDGs).
Issues considered, policies in Malawi and UN SDGsLINKS BETWEEN
ISSUES:
Poverty and inequality SD
G 1
SD
G2
SD
G3
SD
G4
SD
G5
SD
G6
SD
G 7
SD
G8
SD
G9
MN
SS
P I
I
Youth unemployment/ employment in general
Gender
Social protection
Healthcare
Education
InfrastructureMG
DS
III
NE
S
Mobile networks
Water and sanitation
Electricity
Decent work and economic growth
No poverty
Zero hunger
Good health and wellbeing
Quality education
Clean water and sanitation
Affordable and clean energy
Gender equality
Industry, innovation, infrastructure
18
Fin
anci
al in
clu
sion
an
d it
’s li
nks
to
soci
al a
nd
eco
nom
ic q
ues
tion
s
Poverty and inequality
High levels of poverty and vulnerability to shock. Households in Malawi are characterised by high levels of poverty, single sources of income and employment, and a low capacity to address basic needs or withstand seasonal fluctuations or moderate shocks.
Of the total population, 57% are poor. More than 80% of the workforce is engaged in subsistence agriculture,1 which is a low-productivity activity. More than half of the total population live below the poverty line. The poverty rate, based on the international poverty line of US$1.90 per person per day (at 2011 international prices), increased from 64% in 1997 to 71% in 2010.2 Although still extremely high, the poverty rate decreased slightly, to 70.3%, in 2016.3 Poverty in Malawi is predominantly rural: while 84% of the country’s population is rurally based, approximately 95% of the poor reside in rural areas.4
Substantial inequality. There is substantial inequality in Malawi, with a Gini coefficient measuring 0.45 in 2016 (more or less unchanged since 2010).5 Given the variation in population segments residing in urban areas, by place of residence the extent of inequality is higher in urban areas (0.5) than in rural areas (0.19), where the majority of people live below the poverty line.6
Many households experience food insecurity. The high levels of poverty are evidenced by the high proportion of households in Malawi that experience challenges in food security.7 According to the Fourth Integrated Household Survey (IHS4) in Malawi (2017), 64% of 12,447 households responded that they felt they had inadequate food consumption, which had worsened since the previous household survey, and households relied on borrowing or savings to meet their daily needs.8 Furthermore, the proportion of the population that experienced very low food security9 had increased from 32% (IHS3 in 2010/11) to 61% in 2016/17.
This means that, despite the relatively high levels of economic growth in Malawi, this is not inclusive growth: most people have become worse off over time.
The poverty-combating role of an inclusive financial sector. Economic evidence suggests that financial sector development can play a role in poverty reduction. An inclusive financial sector has both an indirect and a direct impact on poverty alleviation, with links between financial sector development and more equitable (inclusive) growth, on the one hand, and broadening access to finance and opportunities – especially for the poor, rural communities and women – on the other.10 An inclusive financial sector contributes to increased equality and equity in society, with more equitable consumption patterns. Specific aspects of this are discussed in the sections that follow.
2.2
Of the total
population, 57%
are poor. More
than 80% of the
workforce is engaged
in subsistence
agriculture, which is
a low-productivity
activity. More than
half of the total
population live below
the poverty line.
19
Fin
anci
al in
clu
sion
an
d it
’s li
nks
to
soci
al a
nd
eco
nom
ic q
ues
tion
s
Employment
1. Labour forceLabour force comprises more women than men. According to the Malawi Population and Housing Census Main Report (2018), a total labour force of approximately 6.6m was recorded in 2018: 3.2m were males and 3.4m were females.11
Most economically active age group is 20–24-year-olds. For males and females alike, the age group 20–24 had the most individuals that were economically active.
Given that the majority of the population is rurally based, the labour force is overwhelmingly rurally based. Of the total labour force, 1.2m (17%) were located in urban areas and 5.5m (83%) in rural areas. In rural areas, more females than males were employed; by the same token, in urban areas, more males than females were employed. In addition, in rural areas unemployment figures were also higher for females than for males.
Informal employment is the norm. Informal employment is acknowledged to be a major component of employment in Malawi. According to a report by the International Labour Organization (ILO), the proportion of informal employment
2.3
Household qctivitiesas employers
Other
Human healthand social work
Education
Construction
Manufacturing
Agriculture,forestry andfishing
Financialand insurance
Information andcommunication
Storage
Wholesaleand retail trade
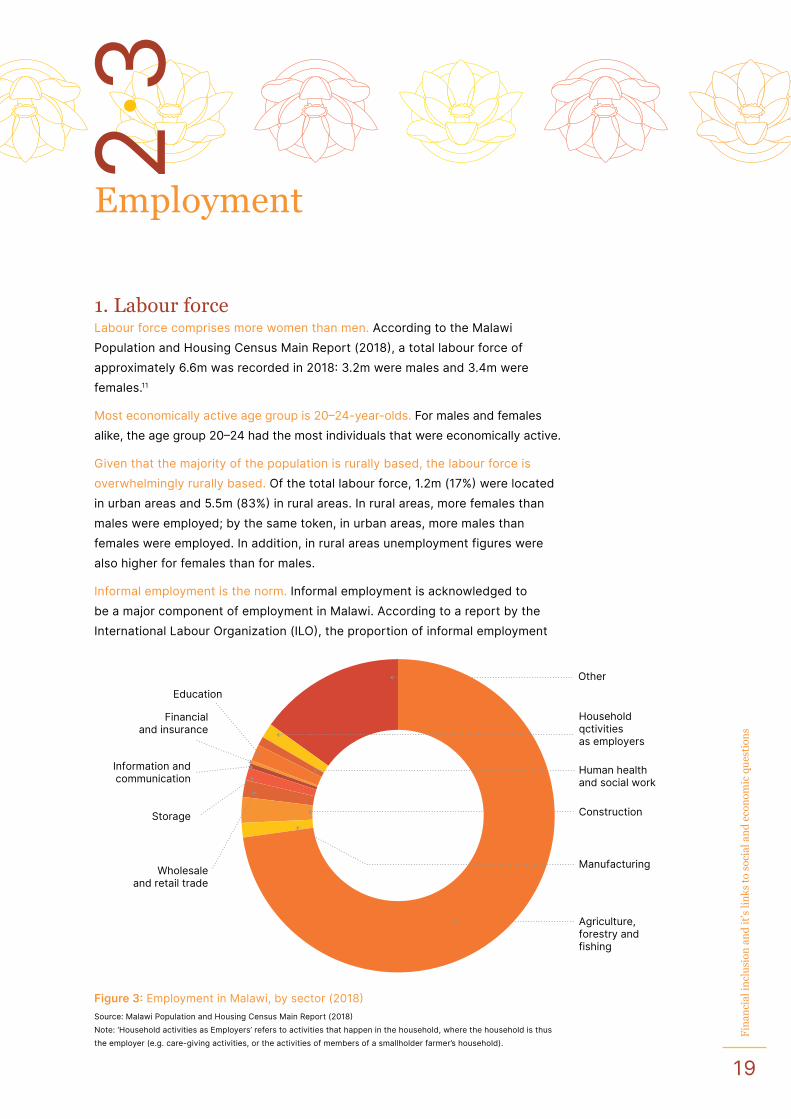
Figure 3: Employment in Malawi, by sector (2018)Source: Malawi Population and Housing Census Main Report (2018)Note: ‘Household activities as Employers’ refers to activities that happen in the household, where the household is thus the employer (e.g. care-giving activities, or the activities of members of a smallholder farmer’s household).
20
Fin
anci
al in
clu
sion
an
d it
’s li
nks
to
soci
al a
nd
eco
nom
ic q
ues
tion
s
amounts to 83% of total employment; this implies an estimated 4.5m informal workers in Malawi.12
Most jobs are in the agricultural sector. By sector, the bulk of the population is involved in agriculture, forestry and fishing, with significantly lower employment in the construction, wholesale and retail trade and industrial sectors.13 All sectors were male dominated – with the exception of agriculture, forestry and fishing, where more females (2.2m) were employed than males (1.7m).
2. Employment trendsLow unemployment – but also low incomes. According to the 2018 Population and Housing Census, 81.5% out of a labour force of approximately 6.6m in Malawi were employed.14 Labour force participation was 72%, with a slightly higher level of participation in rural areas than urban areas (which have 69% participation). However, as discussed above, 83% of jobs in Malawi are in the informal sector, and so while there is a relatively low unemployment rate, incomes are very low.
Employment patterns are largely unchanged (despite reforms). Employment patterns have not changed significantly in Malawi over the past 15 years, with the bulk of the workforce employed in the agricultural sector.15 (As already mentioned, at this point Malawi has for the most part not followed a typical pattern of structural transformation of the economy by diversifying employment away from agriculture and into manufacturing and services.16)
It is worth noting that the extensive reforms post-MAP 2015 have also not produced much noticeable change in employment patterns.
Literacy levels improved but educational attainment generally low. The proportion of the population over the age of 15 that is literate was at 73% in 2016/17, which had increased from 65% in 2010/11 (IHS3).17 At the national level, 70% of the population aged 15 years and older did not have any qualification.18
Economic growth leading to skilled jobs would likely stimulate education and skills attainment. There is a strong link between educational attainment and moving out of the agricultural sector over time (discussed in more detail below). Overall, average years of education grew by 1.2 years between the 1998 and 2008 censuses. However, there are currently relatively few job opportunities in the economy requiring specific skills or education that would be able to absorb more educated and highly trained workers.19 As skilled jobs typically stem from the development of businesses that may require capital investment, foreign direct investment could play a role in the creation of more skilled employment. Furthermore, given that skilled employment is generally located in urban areas,20 if structural transformation occurs with further expansion of the services and industrial sectors, there likely will be a greater need for energy and transport infrastructure in urban areas.21
Financial inclusion interventions that can support these sectors (viz. services, industrial, energy, transport) will therefore be important for development and could set up virtuous cycles of economic growth and access to increased opportunity. (This is discussed in more detail in Section 3.8.)
Employment
patterns have
not changed
significantly in
Malawi over the
past 15 years,
with the bulk of
the workforce
employed in the
agricultural sector.
21
Fin
anci
al in
clu
sion
an
d it
’s li
nks
to
soci
al a
nd
eco
nom
ic q
ues
tion
s
3. Youth unemploymentYouth unemployment levels very high. The United Nations has a range of interventions targeted at young people between the ages of 15 and 24, and the youth is therefore an important focus area for development.22 Overall, Malawi has a very youthful population, with 81% of the total population being younger than 35.23 Youth unemployment has been roughly the same over recent years, with a very small decline from 7.9% in 2012 to 7.5% in 2019, though, as discussed above, it should be borne in mind that 83% of employed persons in Malawi work in the informal sector.24
Economic growth rate failing to match population growth rate is a huge risk for the country. Malawi has one of the fastest-growing populations in the world, with the population anticipated to increase from approximately 18m currently to 45m by 2050; the youth aged 15–34 are anticipated to comprise approximately 35% of the population for much of this period. This means that the economy needs to grow rapidly in order to absorb these new members of the labour force, and for average incomes to rise.
However, the economy failed to grow as quickly as the population in 6 of the past 15 years; which means there is a strong likelihood and risk of the economy not being able to absorb the number of additional workers in coming years.
Education/skills levels have increased but most jobs are lower skilled. While a key reform in Malawi in the past few years has been free primary education, and the average number of years of education has increased by 1.2 years as a result of this, it is not clear that this is a sufficient improvement in skills overall in Malawi. At the same time, the Malawi economy is not at present sufficiently able to absorb higher-skilled workers, given the country’s limited infrastructure.
High numbers of job seekers, low levels of formal education. The 20–24-year-old age group accounts for a significant proportion of the labour force as well as the highest number of those seeking work. This is followed by the 15–19 age cohort (‘younger youth’) who make up the next highest cohort of both the total labour force and those seeking work.25 Note that average years of education in Malawi is only 4.6, which explains why such a large proportion of young people seek work rather than attend school or university (discussed in Section 3.7).
Education alone insufficient to move youth away from farm employment. Youth who are not students mainly find employment in agriculture rather than in the services or industrial sectors, which is consistent with agriculture being the most significant sector in Malawi.26 This is seen largely as a result of younger youth remaining dependent on parents while engaging in agricultural activities, as well as the observation that working in non-farm sectors generally occurs at a stage when an individual has better financial capital, experience and social networks. Education alone is generally insufficient to enable non-agricultural employment for youth.
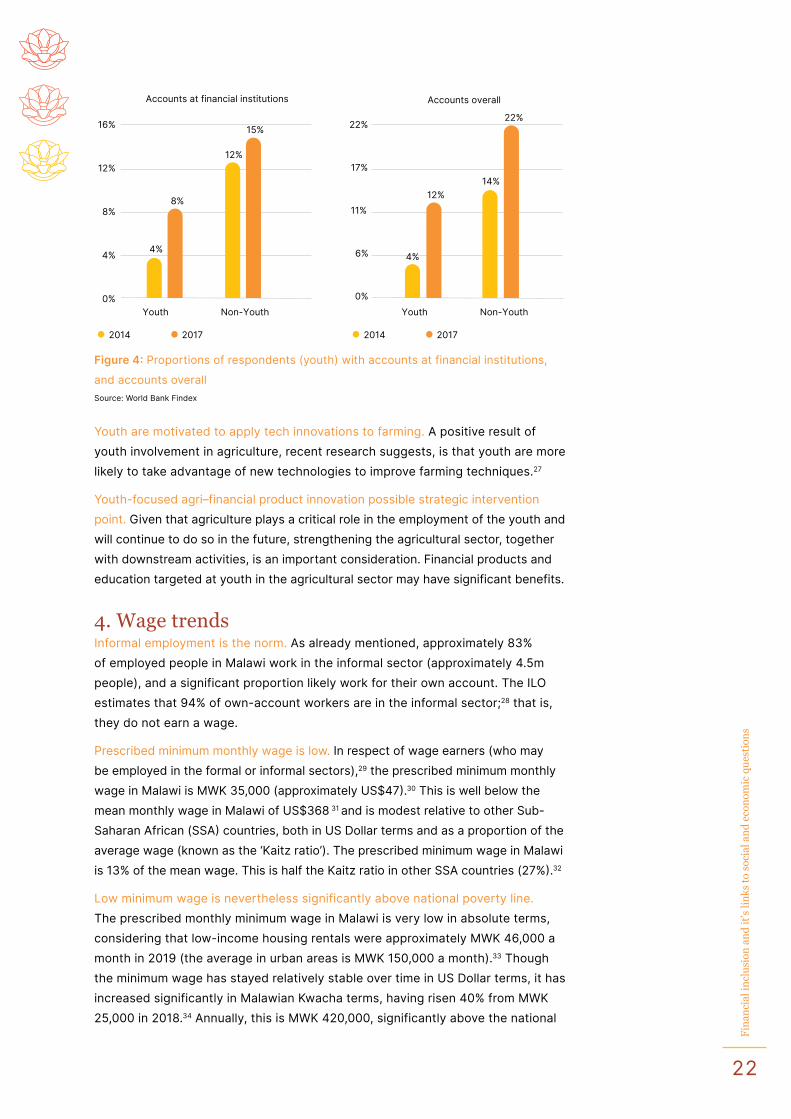
Youth aged 15–24 have experienced increased financial inclusion. Overall, there have been significant gains in the financial inclusion of youth aged 15–24 as is shown by an increase in the proportion that have accounts at financial institutions (such as a bank, MFI or SACCO) and accounts overall (at financial institutions and with mobile money providers) since the first MAP diagnostic (see Figure 4).
Education alone
is generally
insufficient to enable
non-agricultural
employment
for youth.
22
Fin
anci
al in
clu
sion
an
d it
’s li
nks
to
soci
al a
nd
eco
nom
ic q
ues
tion
s
Youth are motivated to apply tech innovations to farming. A positive result of youth involvement in agriculture, recent research suggests, is that youth are more likely to take advantage of new technologies to improve farming techniques.27
Youth-focused agri–financial product innovation possible strategic intervention point. Given that agriculture plays a critical role in the employment of the youth and will continue to do so in the future, strengthening the agricultural sector, together with downstream activities, is an important consideration. Financial products and education targeted at youth in the agricultural sector may have significant benefits.
4. Wage trendsInformal employment is the norm. As already mentioned, approximately 83% of employed people in Malawi work in the informal sector (approximately 4.5m people), and a significant proportion likely work for their own account. The ILO estimates that 94% of own-account workers are in the informal sector;28 that is, they do not earn a wage.
Prescribed minimum monthly wage is low. In respect of wage earners (who may be employed in the formal or informal sectors),29 the prescribed minimum monthly wage in Malawi is MWK 35,000 (approximately US$47).30 This is well below the mean monthly wage in Malawi of US$368 31 and is modest relative to other Sub-Saharan African (SSA) countries, both in US Dollar terms and as a proportion of the average wage (known as the ‘Kaitz ratio’). The prescribed minimum wage in Malawi is 13% of the mean wage. This is half the Kaitz ratio in other SSA countries (27%).32
Low minimum wage is nevertheless significantly above national poverty line. The prescribed monthly minimum wage in Malawi is very low in absolute terms, considering that low-income housing rentals were approximately MWK 46,000 a month in 2019 (the average in urban areas is MWK 150,000 a month).33 Though the minimum wage has stayed relatively stable over time in US Dollar terms, it has increased significantly in Malawian Kwacha terms, having risen 40% from MWK 25,000 in 2018.34 Annually, this is MWK 420,000, significantly above the national
Accounts at financial institutions
Youth Non-Youth Youth Non-Youth
15%
8%
12%
4%
Accounts overall
22%
12%14%
4%
0%
4%
8%
12%
16%
0%
6%
11%
17%
22%
2014 2017 2014 2017
Figure 4: Proportions of respondents (youth) with accounts at financial institutions,
and accounts overallSource: World Bank Findex
23
Fin
anci
al in
clu
sion
an
d it
’s li
nks
to
soci
al a
nd
eco
nom
ic q
ues
tion
s
poverty line of MWK 164,191 (annually).35 The fact that approximately 51.5% of the population live below this poverty line in Malawi reflects the very limited role the formal sector plays in absorbing the economically active population, and thus the limited role played by wage earners (and minimum wages) in Malawi, with the majority of people working for their own account in the country’s informal sector.
Given inelastic labour supply, reducing minimum wage could increase jobs and alleviate poverty. Counterintuitively, perhaps, a reduction in the already-low minimum wage might provide employers with scope to increase employment at lower wages, thereby reducing the proportion of the population living below the poverty line. This is especially important given that research suggests the supply of labour in Malawi is very inelastic (the probability of working does not respond significantly to changes in wages offered), at 0.15–0.16, meaning that people are willing to work even at very low wages, particularly during the dry season.36 This result does not change based on a range of observable characteristics, including gender.
Need for better data to inform policies around minimum wage. Better data is needed for studying the proposition, in particular, of reducing the minimum wage: for instance, data from mobile network operators (MNOs) on business-to-person and government-to-person payments reflecting average incomes, or on person-to-business payments reflecting consumption through mobile money payments.
5. Labour migrationRemittances an important contribution to GDP. Cross-border labour migration is an important feature of society in Malawi, with remittance amounts estimated at equivalent to 2.4% of national GDP being sent back home in 201937 (as discussed in Section 4.2.3). One of the key migrant paths involves circular migration from Malawi to South Africa. A reported prepared for the FinMark Trust suggests that (estimated as of 2019) there are 216,515 migrants from Malawi in South Africa, more than a third of whom remit money to Malawi38 (South Africa–Malawi remittances are discussed in Section 4.2.3).
Remittances important for human capital development. A 2016 paper39 determines the historic long-run impact of circular migration40 from Malawi to South African mines based on a fixed two-year contract through a Wenela (a recruitment scheme that operated in the 1970s),41 contrasted with the alternative of agricultural work back home in Malawi.42 Although the scheme was stopped and the number of operating mines in South Africa is decreasing, resulting remittances from previous mine work had improved the total amount of human capital with long-lasting effects. This emphasises the importance of migrant worker remittances in supporting such communities.
Remittances significant market for product/service innovation. Remittances are likely a significant market segment for growth by FSPs (discussed in the section on remittances).
Counterintuitively,
perhaps, a reduction
in the already-low
minimum wage
might provide
employers with
scope to increase
employment at
lower wages.
24
Fin
anci
al in
clu
sion
an
d it
’s li
nks
to
soci
al a
nd
eco
nom
ic q
ues
tion
s
Gender-related disparities
Women bear more of the burden of household poverty. Survey evidence suggests there are significant gender-related disparities in Malawi, and differences between men and women persist over time. In terms of poverty, analysis of results of the 2004–2005 Integrated Household Survey suggests there are more households with poor women than there are with poor men, and the poverty rate of men decreases as the household size increases – while the poverty rate of women and children increases with an increase in household size.43
Geography-based disparity in poverty levels of men and women. In terms of geographical locations, the northern regions of Malawi are associated with low levels of poverty for men and high levels of poverty for women and children. In contrast, in the southern and central regions of Malawi, men are associated with higher levels of poverty and relatively similarly incidences for women and children in comparison to the North. This suggests considerable regional differences between men and women where poverty is concerned in Malawi.
Men consume disproportionate amount of resources. There are gendered differences in consumption. A 2013 paper considered how household resources were divided among household members (measured using clothing as a proxy), and showed that resources are not evenly spread across women and men, with men consuming a disproportionate amount of resources.44
Female-headed households more vulnerable to food insecurity. Recent (2016–2017) survey evidence suggests women-headed households are more likely to experience inadequate food (71%) compared to make-headed households (61%).45 In the same survey, while 58% of male-headed households reported very low food security status, 69% of female-headed households did so.
There are also large differences in educational outcomes for women (discussed in Section 3.7).
Overall, the population aged 15–64 in Malawi includes more females (4.8m) than males (4.4m). The total economically active population is 6.6m, including 3.2m males and 3.4m females. However, the number of employed females and males is roughly equal, at 2.7m – though females have a higher unemployment rate, at 21%, compared to males, at 16%.46
Women more likely than men to be self-employed, working in agricultural micro enterprises in rural areas. The bulk of women were employed in rural areas (2.3m, or 85%). Note that, as discussed above, while the overall level of employment
2.4
There are significant
gender-related
disparities in
Malawi, and
differences between
men and women
persist over time.
25
Fin
anci
al in
clu
sion
an
d it
’s li
nks
to
soci
al a
nd
eco
nom
ic q
ues
tion
s
may be high, 83% of workers are employed in the informal sector, which means that much of the employment in Malawi is not wage-earning. For example, of the 2.7m women who work, only 0.9% were employers (2% of working males are employers) and 7.4% were employees (19% of working males were employees), while 73% were self-employed (males: 59%) and 16% were engaged in unpaid family work (similar proportion for men in unpaid family work). Overall, females are significantly more likely to be self-employed than males. It is also important to note that 81% of employed females were found in the agricultural sector in 2018 (compared to 63% for males).
Women own 84% of micro enterprises. Evidence suggests women are active in business; for example, the MAP for MSMEs (2019) refresh report revealed that 84% of micro enterprises (which comprise 74% of MSMEs) are owned by women. As noted in that report, micro enterprises are overwhelmingly survivalist (rather than aspirational) business enterprises.
Women engage less with financial services. Despite the high levels of female engagement with business, there are several gender disparities evident. The available data and research suggests women have engaged less with financial services. Key considerations relating to gender are set out below.
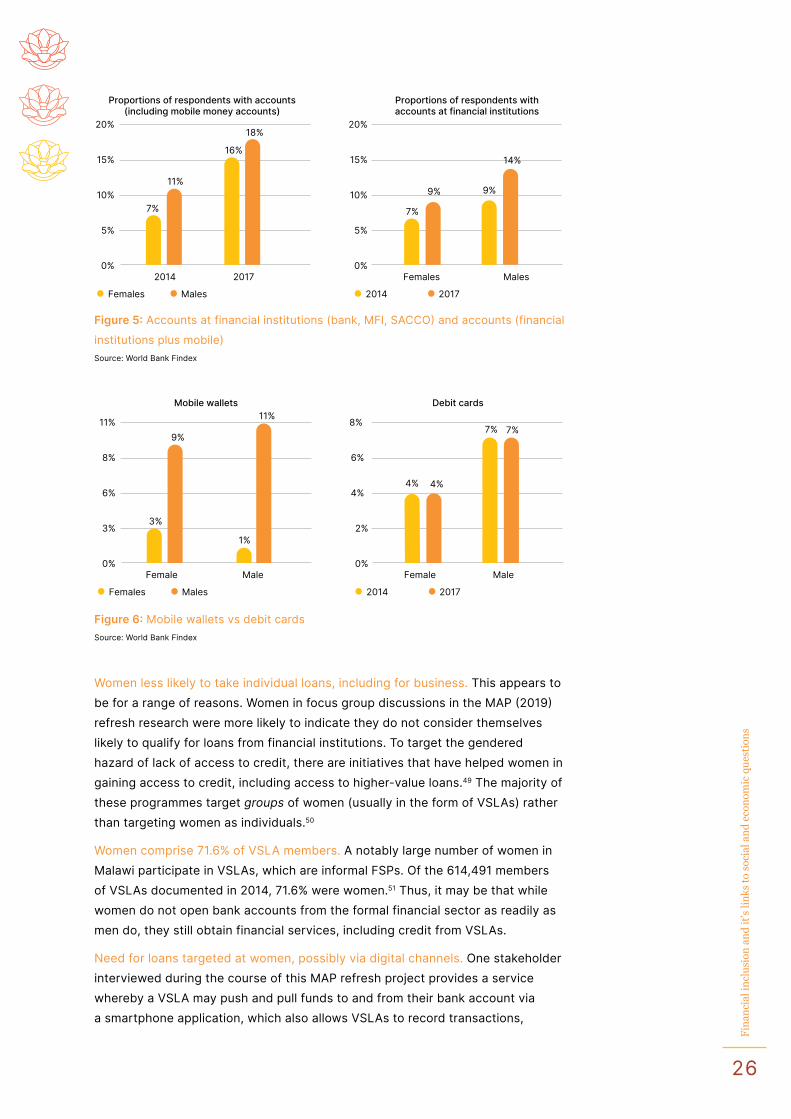
Fewer women than men have opened bank accounts. Despite comprising a significant part of the workforce, overall, a significantly lower proportion of women have opened a bank, MFI or SACCO account (around 9% in 2017, see Figure 5, second panel), compared to men (around 14%). This is especially interesting because women and men do unpaid work in similar proportions.
Engagement with mobile money likely driving financial services engagement.The gap between women and men in terms of opening an account seems to be closing over time (see the first panel in Figure 5). This is likely driven by mobile money accounts (see Figure 6). This correlates with other evidence that women may not wish to engage with traditional formal FSPs (discussed in more detail below in relation to the 2019 MAP for MSMEs report).
Despite disproportionately owning MSMEs, women less likely than men to hold or act as agents for mobile money accounts. Data from the Reserve Bank of Malawi (RBM) shows that only 36% of mobile money account holders are women (note that the RBM data is based on number of accounts, and is therefore different to the World Bank Findex survey data shown on Figure 5 and Figure 6).47 Furthermore, the proportion of mobile money agents that are women was only 38% in 2018.48 This is a surprising outcome given that women disproportionately own micro, small and medium enterprises (MSMEs) in Malawi.
Recommendation for further investigation. The question of why women-owned MSMEs do not take up mobile financial services, or act as agents to offer mobile financial services, needs to be considered and investigated further; there may be opportunities for donors to encourage women to take up and offer mobile financial services.
Overall, females
are significantly
more likely to be
self-employed
than males. 81% of
employed females
were found in the
agricultural sector
in 2018, compared
to 63% for males.
26
Fin
anci
al in
clu
sion
an
d it
’s li
nks
to
soci
al a
nd
eco
nom
ic q
ues
tion
s
Women less likely to take individual loans, including for business. This appears to be for a range of reasons. Women in focus group discussions in the MAP (2019) refresh research were more likely to indicate they do not consider themselves likely to qualify for loans from financial institutions. To target the gendered hazard of lack of access to credit, there are initiatives that have helped women in gaining access to credit, including access to higher-value loans.49 The majority of these programmes target groups of women (usually in the form of VSLAs) rather than targeting women as individuals.50
Women comprise 71.6% of VSLA members. A notably large number of women in Malawi participate in VSLAs, which are informal FSPs. Of the 614,491 members of VSLAs documented in 2014, 71.6% were women.51 Thus, it may be that while women do not open bank accounts from the formal financial sector as readily as men do, they still obtain financial services, including credit from VSLAs.
Need for loans targeted at women, possibly via digital channels. One stakeholder interviewed during the course of this MAP refresh project provides a service whereby a VSLA may push and pull funds to and from their bank account via a smartphone application, which also allows VSLAs to record transactions,
0%
5%
10%
15%
20%
0%
5%
10%
15%
20%
2014 2017
18%
11%
16%
7%
Females Males
14%
9% 9%
7%
Proportions of respondents with accounts (including mobile money accounts)
Proportions of respondents with accounts at financial institutions
2014 2017Females Males
0%
3%
6%
8%
11%
0%
2%
4%
6%
8%
Female MaleFemale Male
Mobile wallets11%
9%
1%
3%
Debit cards
7%
4%
7%
4%
2014 2017Females Males
Figure 5: Accounts at financial institutions (bank, MFI, SACCO) and accounts (financial
institutions plus mobile)Source: World Bank Findex
Figure 6: Mobile wallets vs debit cardsSource: World Bank Findex
27
Fin
anci
al in
clu
sion
an
d it
’s li
nks
to
soci
al a
nd
eco
nom
ic q
ues
tion
s
track savings and loans etc. These kinds of innovations may be an important means of supporting access to finance among women; and there may be further opportunities to develop financial services and products targeted at women, both through VSLAs and directly. Loans targeted at women, including through innovative digital FSPs, that specifically encourage women to apply may help to overcome any misconceptions about their ability to apply for loans.
Need for tailored credit products/services inclusive of women’s priorities and needs. Research has found that women often lack knowledge, resources, experience, and confidence to move from group loan programmes to individual loans.52 Thus, it is imperative that there is not only an increase in access to credit for women, but that FSPs provide knowledge on financial services, specifically to and for women.53
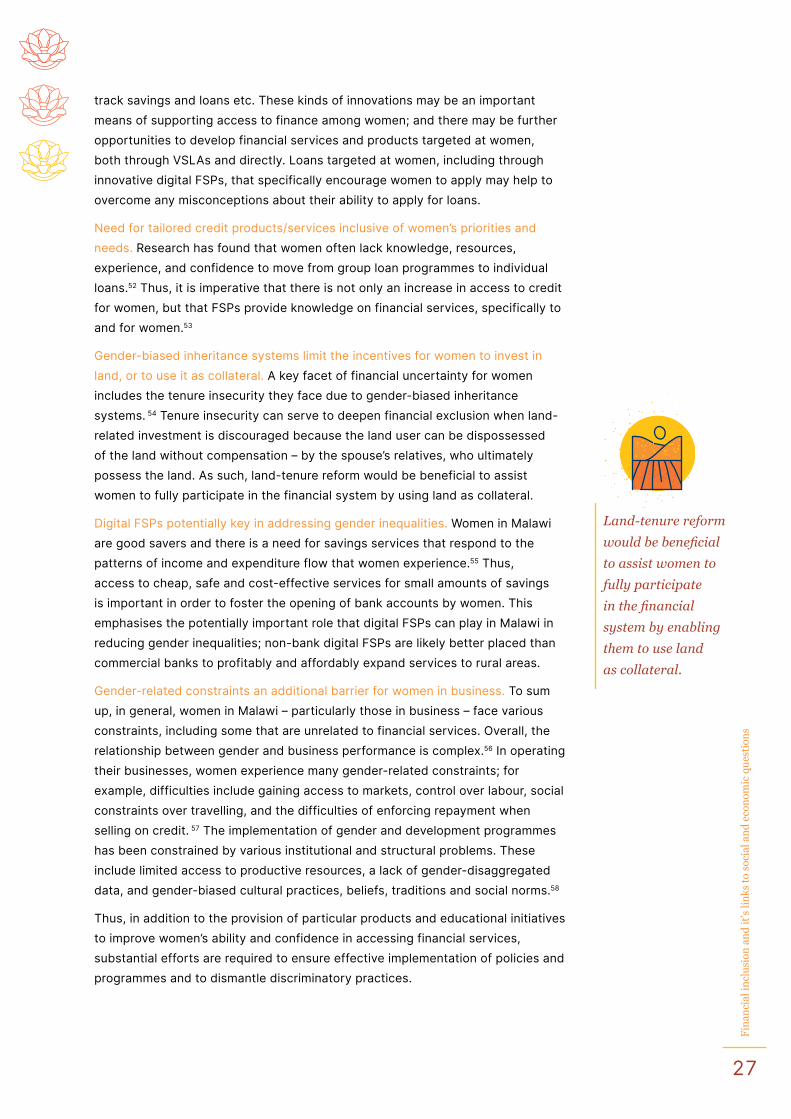
Gender-biased inheritance systems limit the incentives for women to invest in land, or to use it as collateral. A key facet of financial uncertainty for women includes the tenure insecurity they face due to gender-biased inheritance systems. 54 Tenure insecurity can serve to deepen financial exclusion when land-related investment is discouraged because the land user can be dispossessed of the land without compensation – by the spouse’s relatives, who ultimately possess the land. As such, land-tenure reform would be beneficial to assist women to fully participate in the financial system by using land as collateral.
Digital FSPs potentially key in addressing gender inequalities. Women in Malawi are good savers and there is a need for savings services that respond to the patterns of income and expenditure flow that women experience.55 Thus, access to cheap, safe and cost-effective services for small amounts of savings is important in order to foster the opening of bank accounts by women. This emphasises the potentially important role that digital FSPs can play in Malawi in reducing gender inequalities; non-bank digital FSPs are likely better placed than commercial banks to profitably and affordably expand services to rural areas.
Gender-related constraints an additional barrier for women in business. To sum up, in general, women in Malawi – particularly those in business – face various constraints, including some that are unrelated to financial services. Overall, the relationship between gender and business performance is complex.56 In operating their businesses, women experience many gender-related constraints; for example, difficulties include gaining access to markets, control over labour, social constraints over travelling, and the difficulties of enforcing repayment when selling on credit. 57 The implementation of gender and development programmes has been constrained by various institutional and structural problems. These include limited access to productive resources, a lack of gender-disaggregated data, and gender-biased cultural practices, beliefs, traditions and social norms.58
Thus, in addition to the provision of particular products and educational initiatives to improve women’s ability and confidence in accessing financial services, substantial efforts are required to ensure effective implementation of policies and programmes and to dismantle discriminatory practices.
Land-tenure reform
would be beneficial
to assist women to
fully participate
in the financial
system by enabling
them to use land
as collateral.
28
Fin
anci
al in
clu
sion
an
d it
’s li
nks
to
soci
al a
nd
eco
nom
ic q
ues
tion
s
Social protection
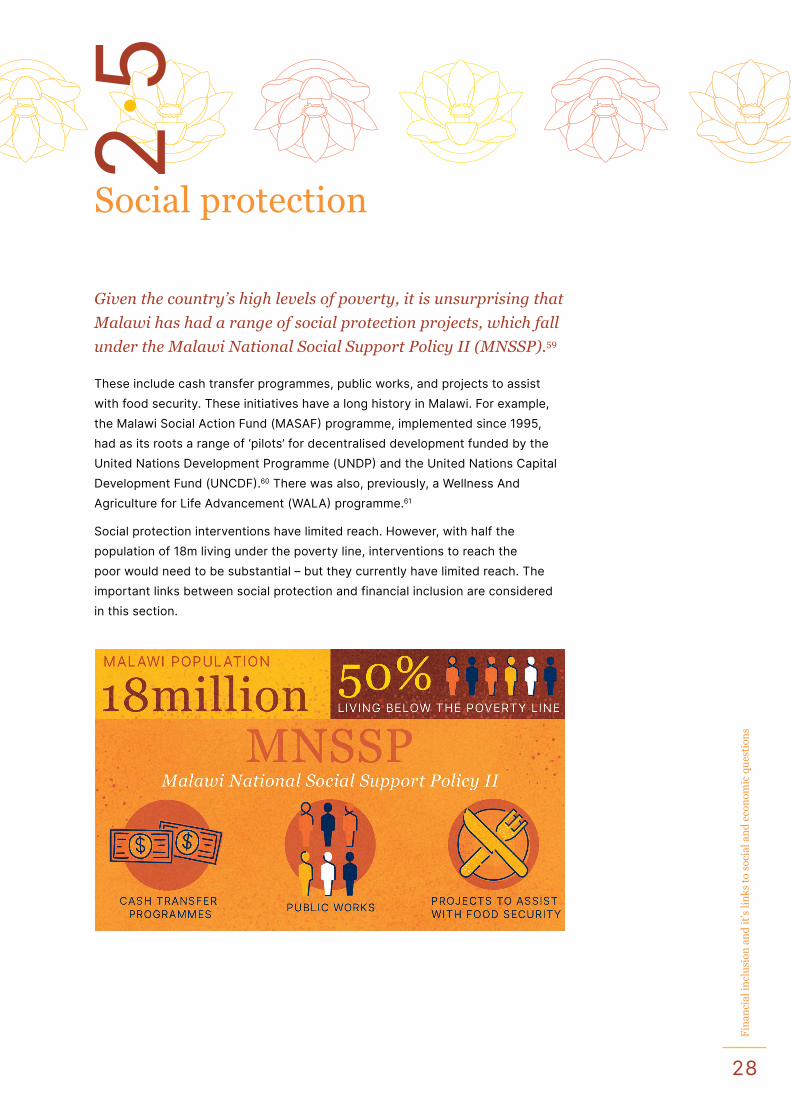
Given the country’s high levels of poverty, it is unsurprising that
Malawi has had a range of social protection projects, which fall
under the Malawi National Social Support Policy II (MNSSP).59
These include cash transfer programmes, public works, and projects to assist with food security. These initiatives have a long history in Malawi. For example, the Malawi Social Action Fund (MASAF) programme, implemented since 1995, had as its roots a range of ‘pilots’ for decentralised development funded by the United Nations Development Programme (UNDP) and the United Nations Capital Development Fund (UNCDF).60 There was also, previously, a Wellness And Agriculture for Life Advancement (WALA) programme.61
Social protection interventions have limited reach. However, with half the population of 18m living under the poverty line, interventions to reach the poor would need to be substantial – but they currently have limited reach. The important links between social protection and financial inclusion are considered in this section.
2.5
29
Fin
anci
al in
clu
sion
an
d it
’s li
nks
to
soci
al a
nd
eco
nom
ic q
ues
tion
s
1. Social cash transfer programme (SCTP)Main programme, ‘Mtukula Pakhomo’ (SCTP), has limited reach. The main social protection intervention currently in place is known as ‘Mtukula Pakhomo’, or the Malawi social cash transfer programme (SCTP). This is an unconditional cash transfer programme targeted at ultra-poor, labour-constrained households.62 The programme began in Mchinji district in 2006, and by 2009 had expanded to reach 18 out of the 28 districts in Malawi. The SCTP experienced significant growth between 2012 and 2015, by which time the programme was reaching more than 163,000 beneficiary households. However, it should be noted that, with half the population below the poverty line, in reality the programme is impacting upon relatively few households.
Programme beneficial, with positive impact on beneficiary farming practices. There is strong evidence that the social cash transfer programme has been successful. Research indicates significant impacts on beneficiary households, with these impacts found to be higher among the poorest households, indicating that the transfer is of very high value and importance.63 In addition, an increase in ownership of agricultural tools and utilisation of inputs was observed.64
Recommendation to increase inclusivity, clarify and communicate beneficiary rights. At the same time, in order to improve the programme, the targeting criteria could be improved to prevent certain households from being excluded and lastly, programme rules and expectations should be clearly provided and stated to beneficiaries to ensure they understand their rights.65
Recommendation to consider central role of digital to expedite social transfers. There is potential for digital processes to assist with improving the efficacy of social transfers. Digital means of targeting can be used to supplement existing methods; for example, using satellite imagery such as vegetation maps and indices for Malawi, which can be a proxy for income. Data on household expenditure, which is needed in order to more effectively design social cash transfer programmes, could potentially be gathered from digital service providers, together with reliance on high-frequency telephonic surveys, to assess impact etc. Furthermore, there may be ways of communicating with beneficiaries by digital means that make benefits easier to understand.
Economies of scale from shifting to digital/mobile money could reduce provider costs. Given the likely growth in the social cash transfer programme building on its successes, it is imperative that the costs of cash transfers be reduced by using electronic means, including mobile money. The government might use this as an opportunity to put pressure on the MNOs and banks to reduce their prices based on significantly larger economies of scale arising from shifting social cash transfers to digital means or mobile money.
There is strong
evidence that the
social cash transfer
programme has
been successful.
Research indicates
significant impacts
on beneficiary
households, with
these impacts
found to be higher
among the poorest
households.
30
Fin
anci
al in
clu
sion
an
d it
’s li
nks
to
soci
al a
nd
eco
nom
ic q
ues
tion
s
2. Other social protection programmesRecommendation to improve beneficiary targeting – once again aided by digital means. The already mentioned Malawi Social Action Fund (MASAF) is a public works programme to supplement the incomes of poor households and improve infrastructure. However, research suggests the interventions implemented did not improve welfare measures such as food security66 or improve use of farming inputs.67 Research was limited by the difficulty in ‘tracking the cash’ used by households through their household surveys.68 In addition, there appear to have been problems in targeting of vulnerable groups. While the programme was offered to 15% of households, uptake was higher in more food-secure locations and the processes used did not result in pro-poor targeting of households. This emphasises the need to improve methods of identifying vulnerable groups. As discussed above, identification can be supplemented by digital means.
Long-term financing bolsters community resilience – but short-term interventions likely still needed to mitigate shocks. Another programme, the ‘Wellness And Agriculture for Life Advancement’ (WALA), invested in better water management. It had some positive effects, in that 9 out of the 24 WALA communities did not need supporting during the 2015/2016 El Niño. However, certain WALA-assisted communities needed food assistance since the impact of a severe drought on resulting crop failures was unavoidable.69 This intervention shows how longer-term financing, such as financing of better water management, can result in more resilient communities, while short-term interventions are still needed.
Water shortages are currently a source of shock for Malawi’s population – and will continue to be. This is especially important since Malawi is ranked fifth among countries with the highest proportion of the population likely to face water shortages in the coming years.70
3. Social protection from food insecurityEconomic growth rate not high enough to improve individual, household well-being. As mentioned previously, people in Malawi are subject to extremely high levels of food insecurity; and, despite relatively high levels of economic growth, have become worse off over time. The 2017 Integrated Household Survey found that 61% of the population experienced ‘very low food security’, which means:71
Challenges of food insecurity and nutrition insecurity. The high proportion of the population experiencing very low food security in 2017 was an increase from 2010–2011, when 32% of the population experienced very low food security. (The worsened food security situation was possibly related to natural disaster decreasing agricultural output and increasing food price inflation.) An analysis of household survey data from 2010–2011 suggests that 36.7% of rural Malawian
31
Fin
anci
al in
clu
sion
an
d it
’s li
nks
to
soci
al a
nd
eco
nom
ic q
ues
tion
s
households fail to consume sufficient calories.72 Households reported that the main barriers to accessing higher quantities and diverse, nutrient-rich foods (such as vegetables) link not only to lack of availability but more to the lack of income to access different foods. The high prices of nutrient-rich foods compared to those of energy-rich staples means that even where food security (access to calories) improves, nutrition security (access to nutrients) is getting worse.73
Households relying on savings, or family and friends’ help, to keep food on the table. Additionally, households used their savings or obtained assistance from family and friends in order to mitigate various shocks that affect food output (e.g. droughts, erratic rains, floods and waterlogging), which were the causes of food deficiencies in 35% of households.
Initiatives to reduce food insecurity have had decreasing participation. There are various initiatives directly focused on reducing food vulnerability. In particular, 21% of the population in Malawi benefited from the free maize distribution programmes, 16% from free food (other than maize) programmes, 14% from school feeding programmes and less than 1% from supplementary feeding. Children under the age of 5 (2.25m children in 2016)74 could benefit from nutritional programmes, but the participation rate decreased from 14% in 2010 to 10% in 2016. Data indicates that participation decreases as the child gets older. While reasons for the decrease in participation rates are not clear, studies suggest that the distance to the clinic may have a significant impact. Additionally, the duration of various social safety nets may have had an effect as most of the programmes lasted anywhere from three to eight months.
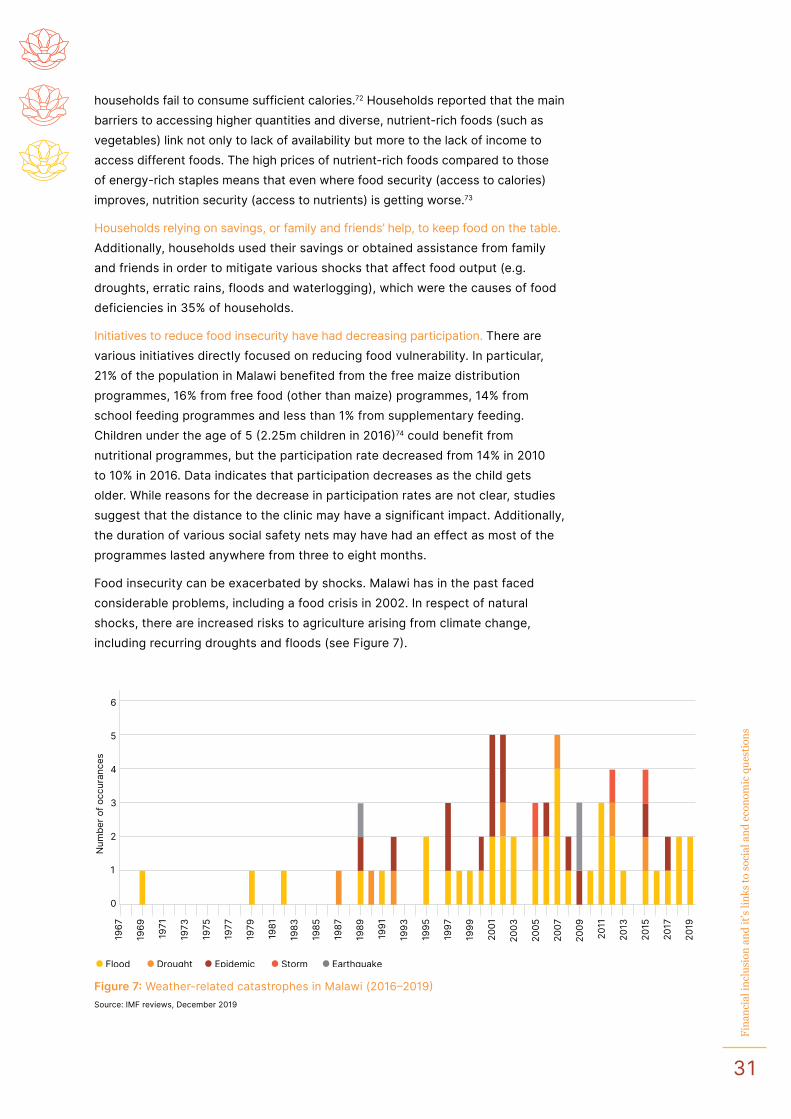
Food insecurity can be exacerbated by shocks. Malawi has in the past faced considerable problems, including a food crisis in 2002. In respect of natural shocks, there are increased risks to agriculture arising from climate change, including recurring droughts and floods (see Figure 7).
Flood Drought
1967
1969
1971
1973
1975
1977
1979
1983
1981
1985
1987
1989
1991
1993
1995
1997
1999
2001
2003
2005
2007
2009
2011
2013
2015
2017
2019
Epidemic Earthquake
Num
ber o
f occ
uran
ces
Storm
0
1
2
3
4
5
6
Figure 7: Weather-related catastrophes in Malawi (2016–2019)Source: IMF reviews, December 2019
32
Fin
anci
al in
clu
sion
an
d it
’s li
nks
to
soci
al a
nd
eco
nom
ic q
ues
tion
s
Climate-change/natural disaster shocks, food price inflation and food insecurity. Floods in Southern Malawi in 2014/2015 inundated 35,000 hectares of cropland and displaced around 174,000 people.75 The flood in April 2017 that occurred in Northern Malawi (Karonga district) displaced more than 5,000 people.76 Other natural disasters include heavy rainstorms (affecting 23,123 households) and strong winds (harming 2,636 households), between 2016 and 2017.77 More recently (2019), one of the worst natural disasters, Cyclone Idai, displaced approximately 86,976 people.78 After the cyclone, there was an increase in consumer price inflation (CPI) which may be related to the decrease in agricultural output. This suggests that food price inflation may be reducing food security in Malawi.
Recommendation to study the causes of food price inflation in Malawi. If it is the case that there are barriers to the importing of food, there may be financial inclusion interventions that could reduce such barriers to trade in food, including in respect of the financing of food imports by traders and the funding of transport and logistics companies. Cash transfer programmes, such as Malawi’s participation in the African Risk Capacity (ARC)79 programme, can also play an integral role during times of crisis.
KULIMA programme demonstrates food security–agricultural sector interrelationship. A noteworthy intervention in respect of improving food security is the KULIMA programme, which promotes sustainable agricultural growth to increase employment, incomes and food security in Malawi in the context of a changing climate. Furthermore, the project aims to address various challenges that arise from an integrated value chain approach in the agricultural sector, with a special focus on women and youth.80 The project provided training to more than 30,000 farmers on how to integrate into agricultural value chains in Malawi, including by the Agricultural Commodity Exchange (ACE) for Africa Marketing School; this shows how food security and the farming sector are inextricably linked in Malawi.
There may be important links between financial inclusion interventions in relation to the commodity exchanges (discussed, in Section 5.2) and donor-funded projects such as KULIMA that are already being developed and might be further supported.
Data collection and digitalisation might extend the reach and sustainability of existing food-security programmes. However, it can be noted that while many of these projects have benefits, they are extremely limited in reach at this stage – and are likely inadequate in terms of reaching all those households and individuals that require assistance. More widespread and sustainable intervention is therefore required. Understanding food prices is also important for assessing changes in food security and vulnerability. It might be possible to use digital means to improve data collection methods in Malawi, including on food price inflation. This is linked, more broadly, to the process of digitalisation in Malawi. The NSO, for example, might identify opportunities to collect data by electronic means from retailers on food prices, in the interests of improving dissemination of data on food price inflation trends and hazards.
Floods in
Southern Malawi in
2014/2015 inundated
35,000 hectares
of cropland and
displaced around
174,000 people.
33
Fin
anci
al in
clu
sion
an
d it
’s li
nks
to
soci
al a
nd
eco
nom
ic q
ues
tion
s
Healthcare
Healthcare is one of the ‘four crucial needs’ MAP has identified
as being a priority for consumers, including low-income
population segments.
Poor healthcare outcomes, though improving over time. Life expectancy at birth in 2017 was only 67 years for women and 61 years for men; this was, nonetheless, a substantial increase from 57 for women, and 51 for men, in 2009.81 While Malawi has made gains in child health, with reductions in both the under-5 and neonatal mortality rates, the under-5 mortality rate is still 2.5 times the UN Sustainable Development Goal (SDG) target of 25 deaths per 1,000 live births, and the neonatal mortality rate is 2.3 times the SDG target of 12 deaths per 1,000 live births.82 Furthermore, Malawi has a high burden of communicable diseases, including high levels of HIV and AIDS, malaria, diarrhoeal disease and perinatal conditions, and non-communicable diseases, with 32% of Malawians hypertensive and 5.8% diabetic.83 The government budget in 2019/20 was MWK 1.7trn, of which MWK 101bn was allocated to the health sector. Of this, MWK 10.9bn was earmarked for procurement of drugs in the central hospitals and MWK 16bn for drugs in the rural areas.84
Heavy reliance on donor funding. Healthcare in Malawi relies on a significant amount of donor funding, with 90% of the cost of medicines covered by foreign aid in 2011.85 This can be problematic as this funding could potentially be withdrawn where donors are not satisfied with the government.
Recommendation to improve information on aid effectiveness in Malawi’s healthcare sector. This might be made possible with the introduction of digitalisation of patient record systems, for example, where the costs of treatment, and patient outcomes, can be better measured.
Government hospital care free – but related financial considerations often still impede access to healthcare. Healthcare in Malawi is free at the point of use in public hospitals, and there is limited health insurance. Nonetheless, private healthcare expenditure comprised 16.9% of healthcare expenditure in 2017. In the same year, out of pocket (OOP) expenditure accounted for 11% of all health expenditure.86 This is very low compared to the average for countries defined as low-income countries, which had an average of 41% OOP, and LDCs, which had an average of 52%. This may reflect a poorly developed healthcare sector. OOP expenditure is even lower on a per capita basis at 3.4% of healthcare expenditure, though this has risen from 1.5% in 2000. While the incidence of OOP expenditure in health is limited, it can be catastrophic and is estimated to contribute to the
2.6
Malawi has a
high burden of
communicable
diseases, including
high levels of HIV
and AIDS, malaria,
diarrhoeal disease
and perinatal
conditions, and
non-communicable
diseases, with
32% of Malawians
hypertensive and
5.8% diabetic.
34
Fin
anci
al in
clu
sion
an
d it
’s li
nks
to
soci
al a
nd
eco
nom
ic q
ues
tion
s
impoverishment of up to approximately 1% of households.87 In addition, the costs of indirect expenditure and loss of income can be a significant shock. A study that modelled the probability of catastrophic shock as a result of surgery supported the idea that a portion of surgical patients in Malawi faced catastrophic costs exceeding their income (despite the fact that government-owned hospitals were free), due to a lack/loss of income and indirect costs, raising concerns that certain households would forgo required surgery, for financial reasons.88
Data on healthcare consumer price inflation suggests that health price increases may not be a significant concern in Malawi.89 At the same time, markets for healthcare services are likely limited in scope, and so the data on relatively benign healthcare price increases may reflect only a limited range of services that are widely available.
Lack of low-value health insurance products, despite NSFI commitment. Medical aid schemes legislation was drafted in 2017, and provides for more inclusive insurance, and targets improvements in health insurance penetration.90 While there is therefore some progress in respect of health insurance in Malawi,91 it is important to highlight that low-value health insurance products, an area of proposed activity in the NSFI, have not yet been developed on a significant scale.92 There should be more emphasis on the development of health insurance products in the next NSFI, as this remains an important gap in the social protection fabric in Malawi.
Consumer financial behaviour offers lessons for FSPs. There is an important link between health insurance and related services. This works in two ways. Firstly, certain financial services and better savings can have a strong positive impact on healthcare, as households are able to invest in health-promoting and preventive health interventions, and have a reduced vulnerability to healthcare shocks.93 Secondly, better healthcare incentivises individuals to save.
‘Mental accounting’ and ‘commitment mechanisms’ possibly useful to emulate in savings products. In relation to saving for health events, a study by Stanford University in rural Kenya found that mechanisms for healthcare savings, including a simple locked box and group savings, assisted in creating a structure and commitment mechanism to save. This was due to (i) mental accounting, which separated the healthcare savings from other income and (ii) the commitment mechanism (particularly from group savings structures).94 FSPs can create health savings products that provide a simple commitment mechanism for healthcare savings to smooth consumption. In addition, the research suggests there is potentially a need for health insurance or income protection products aimed at a lower-income market.
Study links better health with saving. A 2018 study found a link between proximity to an ART facility and increased levels of savings for HIV-positive and HIV-negative respondents alike. This was found to be mainly due to respondents’ reduced perception of mortality risk linked to ART availability.95 Overall, a one-year increase in life expectancy was associated with a 0.2 percentage point increase in savings,96 with the positive effects being even more striking in the case of younger participants. The positive impact on savings behaviour was also shown for HIV-negative participants.
Recommendation for further investigation into financial provider–healthcare provider partnership. Given the strong relationship indicated between health and savings, FSPs might link up with health facilities providers in order to provide lower-cost life insurance and savings products to nearby consumers.
35
Fin
anci
al in
clu
sion
an
d it
’s li
nks
to
soci
al a
nd
eco
nom
ic q
ues
tion
s
Education
Education is one of the ‘four crucial needs’ MAP has identified
as being a priority for consumers, including low-income
population segments.
Education outcomes are improving. The education system has improved significantly over time in Malawi, with free primary education having been introduced in 1994, resulting in a steady primary school enrolment rate of 120%97 (enrolment rates can exceed 100% as they include older students repeating years).98 As a result, education outcomes are improving in Malawi, with the literacy rate having increased from 8% in 2010/2011 to 73% in 2019.
Levels of secondary school attainment low, likely due to financial constraints. However, there is a significant problem in secondary school enrolment, which takes place after the first eight years of primary education in Malawi. Secondary schools were only able to absorb 53% of primary school graduates in 2016.99 Low secondary school enrolment may also be because fees were charged at secondary schools (including public schools) until 2018 (unlike at primary-school level).100
Formal qualifications in short supply. Overall, only 30% of the population aged 15 years and older have acquired any form of educational qualification (ranging from primary school-leaving certificate to tertiary education qualifications).101
Many members of the population have never attended school. Furthermore, the proportion that never attended school is high, rising from 10% of 15–19-year-olds to 48% of those over 55.102
Levels of financial illiteracy high. A large portion of the population is likely also financially illiterate, which has additional, related implications, such as farmers not achieving reasonable prices for agricultural produce (discussed below in Section 5.2.2).
Mean years of schooling lower for females. There is also a significant gender bias in relation to education in Malawi, with males receiving approximately five years of schooling on average and females receiving closer to four years (Figure 8).103 For this reason, any initiatives that consider the financing of education in Malawi need to take into account the availability of education for women.
2.7
There is a significant
problem in
secondary school
enrolment, which
takes place after the
first eight years of
primary education in
Malawi. Secondary
schools were only
able to absorb 53%
of primary school
graduates in 2016.
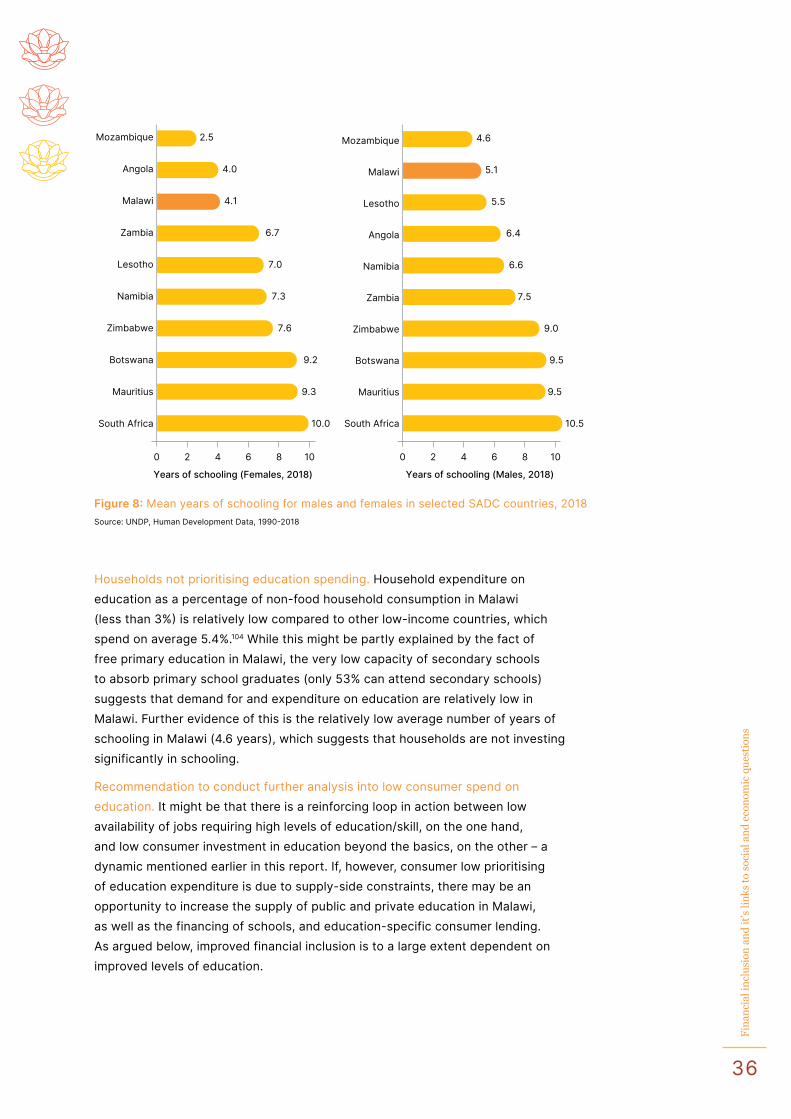
36
Fin
anci
al in
clu
sion
an
d it
’s li
nks
to
soci
al a
nd
eco
nom
ic q
ues
tion
s
Households not prioritising education spending. Household expenditure on education as a percentage of non-food household consumption in Malawi (less than 3%) is relatively low compared to other low-income countries, which spend on average 5.4%.104 While this might be partly explained by the fact of free primary education in Malawi, the very low capacity of secondary schools to absorb primary school graduates (only 53% can attend secondary schools) suggests that demand for and expenditure on education are relatively low in Malawi. Further evidence of this is the relatively low average number of years of schooling in Malawi (4.6 years), which suggests that households are not investing significantly in schooling.
Recommendation to conduct further analysis into low consumer spend on education. It might be that there is a reinforcing loop in action between low availability of jobs requiring high levels of education/skill, on the one hand, and low consumer investment in education beyond the basics, on the other – a dynamic mentioned earlier in this report. If, however, consumer low prioritising of education expenditure is due to supply-side constraints, there may be an opportunity to increase the supply of public and private education in Malawi, as well as the financing of schools, and education-specific consumer lending. As argued below, improved financial inclusion is to a large extent dependent on improved levels of education.
Malawi
Mozambique
Lesotho
Zambia
Zimbabwe
Angola
Namibia
South Africa
Botswana
Mauritius
0 2 4
Years of schooling (Females, 2018) Years of schooling (Males, 2018)
2.5
6.7
7.6
7.3
9.3
4.1
7.0
9.2
10.0
4.0
6 8 10
Malawi
Mozambique
Lesotho
Zambia
Zimbabwe
Angola
Namibia
South Africa
Botswana
Mauritius
0 2 4 6 8 10
4.6
6.4
9.0
7.5
9.5
5.5
6.6
9.5
5.1
10.5
Figure 8: Mean years of schooling for males and females in selected SADC countries, 2018Source: UNDP, Human Development Data, 1990-2018
37
Fin
anci
al in
clu
sion
an
d it
’s li
nks
to
soci
al a
nd
eco
nom
ic q
ues
tion
s
Relatively low levels of education inflation. The consumer price inflation for education appears to be lower than the all items inflation, from June 2018.105 Education tends to follow the upward trend of the all items CPI, but the upward trend is not constant, unlike the all items CPI. The CPI for education increased by 11.5% between January 2018 and February 2020, while the CPI for all items increased by 27.9%. The relatively low levels of inflation for education suggest that consumers do not need to draw from savings or seek emergency funds for this as there are relatively low price increase shocks in comparison to other items.
Financial inclusion crucially linked to education levels in general, and education for women in particular. Research has shown that the most important characteristic of people without bank accounts is that they tend to be in the very low-income bracket and have low levels of education.106 If financial inclusion is to succeed, and its benefits to be realised by the Malawian economy, there is clearly a need for increased education. Crucially too, education plays an important role in the success of women-owned enterprises in Malawi,107 and so there is a need to promote education for females, particularly given their lower average number of years of schooling.
If financial inclusion
is to succeed, and its
benefits to be realised
by the Malawian
economy, there is
clearly a need for
increased education.
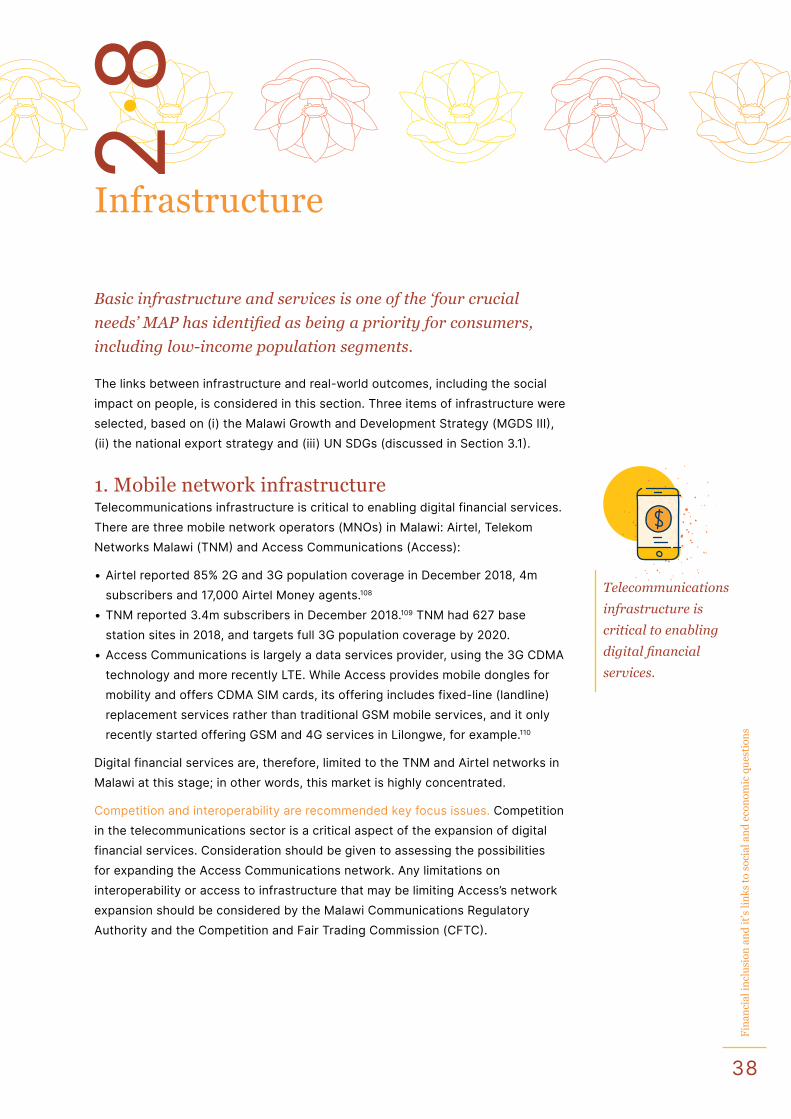
38
Fin
anci
al in
clu
sion
an
d it
’s li
nks
to
soci
al a
nd
eco
nom
ic q
ues
tion
s
Infrastructure
Basic infrastructure and services is one of the ‘four crucial
needs’ MAP has identified as being a priority for consumers,
including low-income population segments.
The links between infrastructure and real-world outcomes, including the social impact on people, is considered in this section. Three items of infrastructure were selected, based on (i) the Malawi Growth and Development Strategy (MGDS III), (ii) the national export strategy and (iii) UN SDGs (discussed in Section 3.1).
1. Mobile network infrastructure Telecommunications infrastructure is critical to enabling digital financial services. There are three mobile network operators (MNOs) in Malawi: Airtel, Telekom Networks Malawi (TNM) and Access Communications (Access):
• Airtel reported 85% 2G and 3G population coverage in December 2018, 4m subscribers and 17,000 Airtel Money agents.108
• TNM reported 3.4m subscribers in December 2018.109 TNM had 627 base station sites in 2018, and targets full 3G population coverage by 2020.
• Access Communications is largely a data services provider, using the 3G CDMA technology and more recently LTE. While Access provides mobile dongles for mobility and offers CDMA SIM cards, its offering includes fixed-line (landline) replacement services rather than traditional GSM mobile services, and it only recently started offering GSM and 4G services in Lilongwe, for example.110
Digital financial services are, therefore, limited to the TNM and Airtel networks in Malawi at this stage; in other words, this market is highly concentrated.
Competition and interoperability are recommended key focus issues. Competition in the telecommunications sector is a critical aspect of the expansion of digital financial services. Consideration should be given to assessing the possibilities for expanding the Access Communications network. Any limitations on interoperability or access to infrastructure that may be limiting Access’s network expansion should be considered by the Malawi Communications Regulatory Authority and the Competition and Fair Trading Commission (CFTC).
2.8
Telecommunications
infrastructure is
critical to enabling
digital financial
services.
39
Fin
anci
al in
clu
sion
an
d it
’s li
nks
to
soci
al a
nd
eco
nom
ic q
ues
tion
s
Despite risk of monopoly, price increases not excessive. At the same time, consumer inflation for communications is observed to be low and very stable in comparison to the CPI for all items; the CPI for communications increased by 6.2% from January 2018 to February 2020.111 This suggests that, while the market is highly concentrated, price increases are relatively modest relative to overall inflation.
48% of households have a mobile phone. According to the Fourth Integrated Household Survey, there were more households with mobile phones than with landlines, following the same trend in many developing countries. Of Malawi households, 48% reported having a mobile phone, while less than 1% of households reported having a landline. Additionally, there was a drop in the number of households with landlines from 0.6% 2010/2011 to 0.2% in 2016/2017, while the proportion of the population with mobile phones increased from 36% in 2010/2011 to 48% 2016/17.
Mobile phone access affected by geographic location. Urban areas had a significantly higher proportion of households (81%) with mobile phones than rural areas (40%).
Mobile phone access is gendered. Interestingly, more male-headed households had mobile phones (53%) than female-headed households did (34%).112
Lack of Internet access and frequent network downtime constraints on financial service innovation and uptake. Despite the healthy growth in mobile penetration, there are concerns among a range of stakeholders that Internet access is not widely enough available in Malawi.113 This has an impact on FSPs wishing to offer services via smartphones, for example. At least one bank offers remote account opening via a smartphone (i.e. without the need for a visit to a bank branch) but explained in its submission to the MAP refresh project team that this product had met with only limited success due to the lack of Internet access in Malawi. Network downtime has also been documented in previous UNCDF research as a significant problem for agents and customers in Malawi.114
Recommendation to resolve considerable problems in ICT sector in support of financial inclusion. Consideration should be given to financing the expansion of mobile infrastructure and competition, particularly in rural areas. For example, MACRA (the Medicare Access and CHIP Reauthorization Act of 2015) might consider reverse auctions (least-cost auctions) to build infrastructure in underserviced areas, and development finance institutions (DFIs) might be approached for funding.
2. Water and sanitationAs already mentioned, Malawi ranks fifth in the world in respect of the proportion of the population susceptible to water shortages.
Increased household access to water – from piped into dwelling, to wells, boreholes and tanker trucks. Access to basic infrastructure in Malawi is limited, including in respect of formal housing, water and sanitation, and electricity. According to the Fourth Integrated Household Survey (IHS4, 2016/2017), ‘A household is considered to have access to safe drinking water if the source
Despite the healthy
growth in mobile
penetration, there
are concerns
among a range of
stakeholders that
Internet access is
not widely enough
available in Malawi.
40
Fin
anci
al in
clu
sion
an
d it
’s li
nks
to
soci
al a
nd
eco
nom
ic q
ues
tion
s
of water is piped into the dwelling, piped into the yard or plot, a communal standpipe, a protected well in yard or plot, protected public well, borehole only in rural areas, tanker truck or bowser and bottled water’.
Approximately, 87% of the households in Malawi had access to an improved water source by the time the IHS4 survey was carried out. This was an increase from 79% in 2010/2011.115
The proportion of urban households with access to improved water sources (93%) was higher than that of rural households (86%). But both urban and rural areas experienced an increase from 79% in 2010/11.116
In 2010/2011, a greater proportion of female headed households than male-headed households (82% vs 78%)117 had access to water; but by 2016 there was no difference observed between female-headed households and male-headed households in this regard.118
Household access to sanitation worsened. In respect of sanitation, 72% of households in Malawi had improved toilet facilities in 2010/2011, according to the Third Integrated Household Survey (IHS3), but this decreased slightly to 71% in 2016/2017.119
Reports indicate that households have access to a flush toilet, a latrine or a traditional latrine with a roof. The proportion was higher in urban areas (81%) than in rural areas (68%). In this regard, urban areas experienced a decrease from 87%, while rural areas experienced a decrease from 70% in 2010/11.120
In 2010/11, 75% of male-headed households had improved toilet sanitation facilities; by 2016/17 this had decreased to 73%. The proportion of female-headed households with improved toilet sanitation facilities remained constant at 64% between the two household surveys (2010/2011 and 2016/2017).121
In terms of variation by geographic location, the Northern region had the highest proportion of households with improved toilet sanitation at 77% (previously 76% in 2010/2011),122 followed by the Central region at 71% (previously 76% in 2010/2011)123 and the Southern region at 69% (previously 67% in 2010/2011).124
It is important to note that 9% of households in Malawi did not have any type of toilet facility: 11% of rural households did not have access to any type of toilet facility, compared to only 2% of urban households.
Furthermore, 14% of female-headed households did not have a toilet facility, while only 7% of male-headed households did not have a toilet facility.122
Recommendation to research and analyse worsening sanitation statistics, consider payments mechanisms as factor in improving services. While it appears there have been significant improvements in access to water, the reverse has been observed with regard to sanitation. This needs to be studied in further detail and opportunities for improving access should be considered, including by investing in utility infrastructure and considering mechanisms for improving payments for these services.
It is important
to note that 9%
of households in
Malawi did not have
any type of toilet
facility: 11% of rural
households did not
have access to any
type of toilet facility,
compared to only 2%
of urban households.
41
Fin
anci
al in
clu
sion
an
d it
’s li
nks
to
soci
al a
nd
eco
nom
ic q
ues
tion
s
3. ElectricityElectricity infrastructure is underdeveloped in Malawi. While economic research suggests that a shortage of electricity production does not affect growth in the agricultural sector in Malawi (the largest contributor to GDP), as the country develops the role of electricity infrastructure will likely become more important.125 In fact, the same research reports that economic growth and electricity consumption are related in the long run (the long-run elasticity of electricity consumption–GDP growth is 0.25).
Improving access to electricity a crucial area for financial inclusion interventions.Electricity is especially important for the development of financial services. For instance, mobile financial services depend on reliable electricity supplied to mobile networks, as does more traditional banking infrastructure.
Access to electricity differs substantially according to geographical location (urban/rural). In respect of access to electricity, more is needed in urban and rural areas, though there are substantial differences in access; according to the Fourth Integrated Household Survey (2016/2017), 42% of households in urban areas had access to electricity, versus only 3% in rural areas. Furthermore, while the main form of lighting in rural areas was reported to be torches (85%), in urban areas only 35% of lighting was in the form of torches. In terms of regions, the Central region had the highest proportion of households using torches for lighting (80%), followed by the North (73%) and the South (71%).
Innovative funding models needed for expanding access to electricity in Malawi. Financing models that are in use are funding for micro-grids in villages, funding for solar in more remote areas, and funding for groups of businesses to acquire energy-generation capacity in urban areas. These initiatives are gradually being rolled out, such as by ZuwaEnergy, which provides small-scale solar solutions on a monthly-repayment basis to households.126
Frequent power outages are debilitating, especially for businesses. Being connected to the grid does not, however, solve people’s power challenges. Research from 2017 highlights the very high frequency of power outages; the average small business in urban Malawi experiences power outages on 67% of working days, lasting approximately 6.6 hours during business operating times (the findings are based on a high-frequency telephonic survey of 400 small businesses in Blantyre in 2017).127 For ‘electricity-intensive’ businesses, income was found to decrease by 25% as a result of the blackouts.
Focusing on the availability of electricity can have important effects on businesses. The researchers suggest that businesses in a market could cooperate to purchase a generator to mitigate the effects of blackouts. A further suggestion is that ESCOM (the electricity utility) should communicate better with customers (including via mobile rather than print newspaper) so that the public can plan for outages.
Electricity
infrastructure is
underdeveloped
in Malawi. As the
country develops
the role of electricity
infrastructure
will likely become
more important.
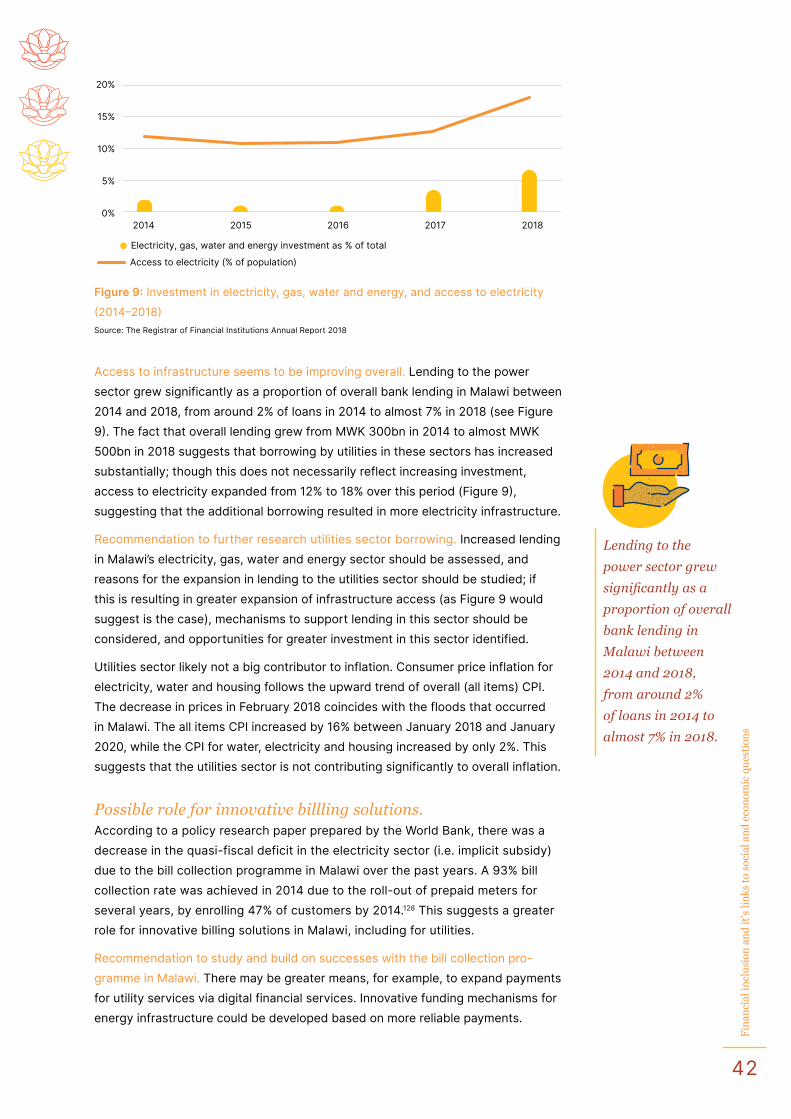
42
Fin
anci
al in
clu
sion
an
d it
’s li
nks
to
soci
al a
nd
eco
nom
ic q
ues
tion
s
Access to infrastructure seems to be improving overall. Lending to the power sector grew significantly as a proportion of overall bank lending in Malawi between 2014 and 2018, from around 2% of loans in 2014 to almost 7% in 2018 (see Figure 9). The fact that overall lending grew from MWK 300bn in 2014 to almost MWK 500bn in 2018 suggests that borrowing by utilities in these sectors has increased substantially; though this does not necessarily reflect increasing investment, access to electricity expanded from 12% to 18% over this period (Figure 9), suggesting that the additional borrowing resulted in more electricity infrastructure.
Recommendation to further research utilities sector borrowing. Increased lending in Malawi’s electricity, gas, water and energy sector should be assessed, and reasons for the expansion in lending to the utilities sector should be studied; if this is resulting in greater expansion of infrastructure access (as Figure 9 would suggest is the case), mechanisms to support lending in this sector should be considered, and opportunities for greater investment in this sector identified.
Utilities sector likely not a big contributor to inflation. Consumer price inflation for electricity, water and housing follows the upward trend of overall (all items) CPI. The decrease in prices in February 2018 coincides with the floods that occurred in Malawi. The all items CPI increased by 16% between January 2018 and January 2020, while the CPI for water, electricity and housing increased by only 2%. This suggests that the utilities sector is not contributing significantly to overall inflation.
Possible role for innovative billling solutions. According to a policy research paper prepared by the World Bank, there was a decrease in the quasi-fiscal deficit in the electricity sector (i.e. implicit subsidy) due to the bill collection programme in Malawi over the past years. A 93% bill collection rate was achieved in 2014 due to the roll-out of prepaid meters for several years, by enrolling 47% of customers by 2014.128 This suggests a greater role for innovative billing solutions in Malawi, including for utilities.
Recommendation to study and build on successes with the bill collection pro-gramme in Malawi. There may be greater means, for example, to expand payments for utility services via digital financial services. Innovative funding mechanisms for energy infrastructure could be developed based on more reliable payments.
2014 2015 2016 2017 2018
Electricity, gas, water and energy investment as % of total
Access to electricity (% of population)
0%
5%
10%
15%
20%
Figure 9: Investment in electricity, gas, water and energy, and access to electricity
(2014–2018)Source: The Registrar of Financial Institutions Annual Report 2018
Lending to the
power sector grew
significantly as a
proportion of overall
bank lending in
Malawi between
2014 and 2018,
from around 2%
of loans in 2014 to
almost 7% in 2018.
43
Fin
anci
al in
clu
sion
an
d it
’s li
nks
to
soci
al a
nd
eco
nom
ic q
ues
tion
s
Summary
A number of key problem areas arise from the analysis in this
MAP refresh, including the very high levels of poverty, low
levels of formal-sector employment, and significant gender
disparities.
There are a number of initiatives under way to mitigate these problems, first and foremost among which is the social cash transfer programme. However, there are also important gaps, such as in respect of land tenure reform for women, and education outcomes among women. Even the social cash transfer programme could be improved by expanding the number of beneficiary households, and using better data to target beneficiaries.
There are also important impediments to economic development, including in respect of healthcare and education, and limited infrastructure available to provide electricity, communications and water and sanitation services. These factors will become more important as the population becomes more urbanised in the coming years.
There are ways in which greater financial inclusion can support the development of Malawi in these areas, including in relation to electronic payments via branchless banking and mobile money services, saving, lending and insurance for healthcare and education services, land tenure reform in favour of women, better payments facilitation and financing for innovative solutions for electricity, and funding for better communications and water and sanitation services.
2.9
44
Fin
anci
al in
clu
sion
an
d it
’s li
nks
to
soci
al a
nd
eco
nom
ic q
ues
tion
s
PART 3: NOTES1 The United Nations Development Assistance Framework Malawi:
2019–2023.
2 International Monetary Fund. (2017). Malawi: Economic Development Document.
3 World Bank Data. See: https://data.worldbank.org/indicator/SI.POV.DDAY?locations=MW
4 World Bank. (2018). Malawi Systematic Country Diagnostic: Breaking the Cycle of Low Growth and Slow Poverty Reduction.
5 The World Bank Gini index.
6 Government of Malawi. (2018). Malawi Poverty Report 2018.
7 This is defined as a situation in which ‘a person has permanent physical and economic access to sufficient, safe and nutritious food to meet his dietary needs and food preferences for an active and healthy life’.
8 See: http://www.nsomalawi.mw/images/stories/data_on_line/economics/ihs/IHS4/IHS4%20REPORT.pdf
9 This is defined as: Households experience multiple indications of disrupted eating patterns and reduced food intake. They report reduction in food quality, variety, quantity and frequency of food consumed. Consumption by adults could have been restricted in order for small children to eat and could also depend on food assistance from relatives or friends.
10 Majanga. B. (2016). The Journey to Financial Inclusion in Malawi. What Does the Future Hold? International Journal of Economics and Financial Research, 2(7): 169–175.
11 The World Bank.
12 International Labour Organization (ILO). (2019). Interactions between Workers’ Organizations and Workers in the Informal Economy: A Compendium of Practice.
13 2018 Malawi Population and Housing Census, cited above.
14 2018 Malawi Population and Housing Census, cited above.
15 Benson, Erman & Baulch (2019), cited above.
16 Benson, Erman & Baulch (2019), cited above.
17 National Statistics Office. (2017). Fourth Integrated Household Survey: Household Socio-Economic Characteristics Report.
18 National Statistics Office. (2017). Fourth Integrated Household Survey: Household Socio-Economic Characteristics Report.
19 Benson, Erman & Baulch (2019), cited above.
20 Benson, Erman & Baulch (2019), cited above.
21 Benson, Erman & Baulch (2019), cited above.
22 See: https://www.un.org/development/desa/youth/what-we-do/faq.html.
23 MAP for MSMEs (2019).
24 According to World Bank Data: https://data.worldbank.org/indicator/SL.UEM.1524.ZS?locations=MW. The definition for this is: ‘Youth unemployment refers to the share of the labor force ages 15–24 without work but available for and seeking employment’.
25 2018 Malawi Population and Housing Census, cited above.
26 Benson, Erman & Baulch (2019), cited above.
27 Benson, Erman & Baulch (2019), cited above.
28 See ILO (2019), cited above.
29 See ILO (2019), cited above.
30 See: https://times.mw/minimum-wage-shocks-mctu/.
31 Bhorat, H., Kanbur, R., & Stanwix, B. (2017). Minimum Wages in Sub-Saharan Africa: A Primer. The World Bank Research Observer, 32(1): 21–74.
32 Comparing the average prescribed minimum wage of US$188
against average wages of US$687, and a level of US$145 compared to US$467 if we use the median wage.
33 This is the price for the cheapest, newly built house by a formal developer or contractor in an urban area. See: http://housingfinanceafrica.org/app/uploads/V16-malawi-2310.pdf
34 For example, the minimum wage was approximately US$49 in 2017.
35 See: http://massp.ifpri.info/files/2019/06/Poster-on-Poverty-in-Malawi-2016-2017.pdf.
36 Goldberg, J. (2016). Kwacha Gonna Do? Experimental Evidence about Labour Supply in Rural Malawi. American Economic Journal: Applied Economics, 8(1):129–149.
37 See: World Bank: https://data.worldbank.org/indicator/BX.TRF.PWKR.DT.GD.ZS?locations=MW
38 FinMark Trust (2020). South Africa to the Rest of SADC Remittance Pricing Report, available at: http://finmark.org.za/sa-to-rest-of-sadc-remittance-pricing/
39 Dinkleman, T., & Mariotti, M. (2016). The Long-Run Effects of Labour Migration on Human Capital Formation in Communities of Origin. American Economic Journal: Applied Economics, 8(4):1–35.
40 Refers to fixed-term contracts that can be reinstated but only after a certain period.
41 Recruiting stations for South African mining sectors.
42 Shows importance of agriculture as the main source of income in Malawi.
43 Dunbar R.G., Lewbel, A., & Pendakur, K. (2013). Children’s Resources in Collective Households: Identification, Estimation, and an Application to Child Poverty in Malawi. American Economic Review: 103(1): 438–471.
44 Dunbar, Lewbel & Pendakur (2013), cited above.
45 Integrated Household Survey, 2016–2017, National Statistics Office.
46 2018 Malawi Population and Housing Census, cited above.
47 National Payment System Report, 4th Quarter 2019. RBM.
48 FinMark Trust (2019). Measuring Progress: Financial Inclusion in SADC – 2019 Report.
49 According to an NGO, their programme has helped 3,600 women obtain loans ranging from MWK 5,000 to MWK 50,000 and they plan to increase the target number to 7,500 women. The programme comes in the form of capital injection (technology, drip irrigation, inoculants etc.) to VSLAs in order to increase smallholder farming productivity.
50 According to an MFI, there are group loans being offered to marginalised women; the MFI has stated it is exploring different loan products for individuals, but keeping the focus on women.
51 MoFEPD and CARE Malawi (2014). Village Savings and Loans Program Mapping Report.
52 Johnson, S. (2005). Gender Relations, Empowerment and Microcredit: Moving on from a Lost Decade. The European Journal of Development Research, 17(2): 224–248, doi: 10.1080/09578810500130831.
53 According to an NGO, one of their sectors attempts to provide technical support to VSLAs: business management and financial literacy to women.
54 Lovo, S. (2016). Tenure Insecurity and Investment in Soil Conservation. Evidence from Malawi. World Development, 78: 219–229.
55 Johnson, S. (2005), cited above.
56 Chiwra, E.W. (2008). Effects of Gender on the Performance of
45
Fin
anci
al in
clu
sion
an
d it
’s li
nks
to
soci
al a
nd
eco
nom
ic q
ues
tion
s
Micro and Small Enterprises in Malawi. Development Southern Africa, 25(3): 347–362, doi: 10.1080/03768350802212139.
57 Johnson, S. (2005), cited above.
58 Gender, Equity and Rural Employment Division of FAO. (2011). Malawi Country Profile.
59 See: https://www.ungm.org/unuser/documents/downloadpublicdocument?docid=698807.
60 Ndegwa, S., & Levy, B. (2004). The Politics of Decentralization in Africa: A Comparative Analysis. Building State Capacity in Africa: New Approaches, Emerging lessons, 283–322. Washington, DC: World Bank.
61 See: https://www.crs.org/sites/default/files/tools-research/wala_assessment.pdf.
62 According to the report, ‘ultra-poor’ was defined as: ‘unable to meet the most basic urgent needs (including food and essential non-food items such as soap and clothing) and labour-constrained (defined as having a ratio of “not fit to work” to “fit to work” of more than three’.
63 The University of South Carolina reported on the impact of the Malawi social cash transfer programme, analysing data from a sample of 1,678 households from 14 village clusters (VCs) in the treatment group, and 1,853 households from 15 VCs in the control group. The study consisted of a Baseline (June–August 2013), Midline (November 2014–January 2015), and an End-line (October–November 2015). See: https://www.unicef.org/evaldatabase/files/Malawi_Social_Cash_Transfer_Programme_Endline_Impact_Evaluation_Report_Malawi_2016-005.pdf.
64 According to the Malawi social cash transfer programme by the University of South Carolina, cited above.
65 An impact evaluation report on the Malawi social cash transfer programme by the University of South Carolina suggested a number of means of improving social protection programmes in Malawi. See: https://www.unicef.org/evaldatabase/files/Malawi_Social_Cash_Transfer_Programme_Endline_Impact_Evaluation_Report_Malawi_2016-005.pdf According to the report: ‘… while the criteria used of ultra-poor and labour constrained households created a profile of beneficiaries that were primarily households with elderly people caring for orphans, this could be improved further, for example by the better targeting of households (for example, targeting those with pre-school children).’ In addition, according to the report by the University of South Carolina: ‘… many beneficiaries believe there are conditions associated with the cash transfer …’. Furthermore, ‘an independent review board could be appointed to periodically review the value of the transfer against inflation and provide recommendations for increases to ensure future programmes continue to meet objectives’.
66 Beegle, K., Galasso, E., & Goldberg, J. (2017). Direct and Indirect Effects of Malawi’s Public Works Program on Food Security. Journal of Development Economics, 128: 1–23.
67 As beneficiary households did not use more fertiliser (a means of improving agricultural yields).
68 Going forward, given that an important aspect of impact assessment of social protection programmes is gathering information on the uses of funds provided by the state, it might be important to require, for example, expenditure via mobile money services; and then require that mobile operators provide statements of monies spent in order to track funds, provided that beneficiaries opt in.
69 See https://www.crs.org/sites/default/files/tools-research/wala_assessment.pdf.
70 See World Bank, 2018, Systematic Country Diagnostic, cited above.
71 Integrated Household Survey, 2016–2017. See also International
Food Policy Research Unit. (2018). Agriculture, Food Security, and Nutrition in Malawi: Leveraging the Link. Washington, DC.
72 International Food Policy Research Unit. (2018). Agriculture, Food Security, and Nutrition in Malawi: Leveraging the Link. Washington, DC.
73 International Food Policy Research Unit (2018), cited above. According to this report, people are consuming fewer vegetables because prices are relatively higher than for calorie-rich foods.
74 The total population reported in the 2017 IHS4 for 2016 was 16,141,307, 13.9% of which were reported to be aged 0–4.
75 See: http://www.fao.org/emergencies/countries/detail/en/c/161513.
76 See Malawi Humanitarian Situation Report, April 2017. UNICEF, available at: https://www.unicef.org/appeals/files/UNICEF_Malawi_Humanitarian_SitRep_30_April_2017.pdf
77 Malawi Humanitarian Situation Report, April 2017, UNICEF, cited above.
78 Malawi Humanitarian Situation Report, 6 May 2019. UNICEF.
79 See: https://www.africanriskcapacity.org/
80 The project was commissioned by the German Ministry for Economic Cooperation and Development (BMZ) and the European Union. See: https://www.giz.de/en/downloads/giz2018_en_KULIMA%20MIERA_programme%20updated%20factsheet.pdf. Additionally, the programme has two other co-financers: the Food and Agriculture Organisation (FAO) and the German Cooperation (GIZ). See: https://www.naosupportmw.org/index.php/programmes/agriculture/kulima. The programme has been designed to strategically contribute to the 2030 Agenda for Sustainable Development and aligned to the Malawi Growth and Development Strategy (MGDS) III, the overarching medium-term development strategy and the National Agriculture Policy on sustainable agriculture production and productivity. KULIMA. (2020). https://kulimamalawi.org/.
81 World Bank Data.
82 UNICEF (2019). 2018/19 Health Budget Brief: Towards Universal Health Coverage, Achieving SDG 3 in Malawi.
83 Makwero, M. (2018). Delivery of Primary Health Care in Malawi. Afr J Prim Health Care Fam Med. 2018; 10(1): 1799.
84 See 2019/2020 National Budget.
85 See Page (2019), cited above.
86 World Health Organization Global Health Expenditure database (2017).
87 Mchenga, M., Chirwa, G.C., & Chiwaula, L.S. (2017). Impoverishing Effects of Catastrophic Health Expenditures in Malawi. International Journal for Equity in Health, 16(1): 25.
88 Bijlmakers, L., Wientjes, M., Mwapasa, G., Cornelissen, D., Borgstein, E., Broekhuizen, H., & Gajewski, J. (2019). Out-of-pocket Payments and Catastrophic Household Expenditure to Access Essential Surgery in Malawi – A Cross-sectional Patient Survey. Annals of Medicine and Surgery, 43: 85–90.
89 National Statistics Office CPI data.
90 See: https://mwnation.com/rbm-to-boost-medical-insurance-uptake/.
91 For example, Smile Life has developed a hospital cash-back product.
92 See: MoFEPD Progress Report on the implementation of the NFSI, February 2020, cited above.
93 For instance, Finscope 2014 data shows that medical expenses are a key reason for savings (13%) and borrowing (12%).
94 Dupas, P. & Robinson, J. (2013). Why Don’t the Poor Save More? Evidence from Health SavingsEexperiments. American Economic Review, 103(4): 1138–1171.
46
Fin
anci
al in
clu
sion
an
d it
’s li
nks
to
soci
al a
nd
eco
nom
ic q
ues
tion
s
95 Baranov, V., & Kohler, H. (2018). The Impact of AIDS Treatment on Savings and Human Capital Investment in Malawi. American Economic Journal: Applied Economics, 10(1): 266–306. This effect was possibly associated with improvements in mental health (less stress and anxiety and thus increased productivity).
96 Possibly through the motivation to save.
97 World Bank. (2018). Systematic Country Diagnostic: Breaking the Cycle of Low Growth and Slow Poverty Reduction.
98 To understand why enrolment rates can exceed 100%, see: https://datahelpdesk.worldbank.org/knowledgebase/articles/114955-how-can-gross-school-enrollment-ratios-be-over-100
99 These included public and private secondary schools. See: World Bank (2018), cited above.
100 Nyasa Times (2018), ‘Malawi abolishes secondary school tuition fees: “full free education by Jan 2019”’, available at https://www.nyasatimes.com/malawi-abolishes-secondary-school-tuition-fees-full-free-education-by-jan-2019/
101 Majanga. B. (2016). The Journey to Financial Inclusion in Malawi. What Does the Future Hold? International Journal of Economics and Financial Research, 2(7): 169–175.
102 2018 Malawi Population and Housing Census, cited above.
103 African Development Bank (2020). African Economic Outlook 2020: Developing Africa’s Workforce for the Future.
104 African Development Bank (2020), cited above.
105 National Statistics Office.
106 United Nations Development Assistance Framework Malawi: 2019–2023.
107 Chirwa, E.W. (2004). Gender and Performance of Micro and Small Enterprises in Malawi.
108 See Airtel pre-listing statement issued on 20 December 2019, available at: https://www.airtel.mw/assets/pdf/investor/Airtel-Malawi-Final-Prelisting-Statement-2019.pdf.
109 See TNM annual report (2018), available at: https://apps.tnm.co.mw/timatere-api/public/storage/109/TNM-2018-Annual-Report.pdf.
110 See: https://www.facebook.com/accessmw/
111 National Statistics Office.
112 See: http://www.nsomalawi.mw/images/stories/data_on_line/economics/ihs/IHS4/IHS4%20REPORT.pdf
113 Stakeholder interviews, and stakeholder submissions to the MAP refresh.
114 See UNCDF (2017). ‘Digital Financial Services Price Transparency and Awareness in Malawi’. Available at: https://www.uncdf.org/article/2942/digital-financial-services-price-transparency-and-awareness-in-malawi
115 According to the 3rd Integrated Household Survey Report.
116 According to the 3rd Integrated Household Survey Report.
117 According to the 3rd Integrated Household Survey Report.
118 See: http://www.nsomalawi.mw/images/stories/data_on_line/economics/ihs/IHS4/IHS4%20REPORT.pdf
119 According to the 4th Integrated Household Survey Report.
120 According to the 3rd Integrated Household Survey Report.
121 According to the 3rd and 4th Integrated Household Survey Reports.
122 According to the 3rd Integrated Household Survey Report.
123 According to the 3rd Integrated Household Survey Report.
124 According to the 3rd Integrated Household Survey Report.
125 Jumbe, C.B. (2004). Cointegration and Causality between Electricity Consumption and GDP: Empirical Evidence from Malawi. Energy economics, 26(1): 61–68.
126 See: https://www.facebook.com/zuwaenergy/
127 The survey was conducted twice per week over a period of two months, beginning in September 2017. See: Brailovskaya, V. (2018). Unreliable Electricity: Effects of Power Outages on Small Businesses in Urban Malawi.
128 Trimble, C., Kojima M., Arroyo, I.P. & Mohammadzadeh, F. (2016). Financial Viability of Electricity Sectors in Sub-Saharan Africa. Policy Research Working Paper 7788, World Bank.
National financial inclusion strategy achievements3
It is important to reflect on progress against
the 2015 MAP project and 2016–2020 National
Strategy for Financial Inclusion (NSFI), in order
to identify remaining gaps and inform how to
prioritise future interventions. There are a number
of ways in which the financial services sector is
now much better positioned to expand financial
inclusion, particularly by means of low-cost,
branchless banking and mobile money services.
At the same time, there are a number of areas of
more limited progress, especially where regulatory
approvals are concerned (discussed in Section 4.2).
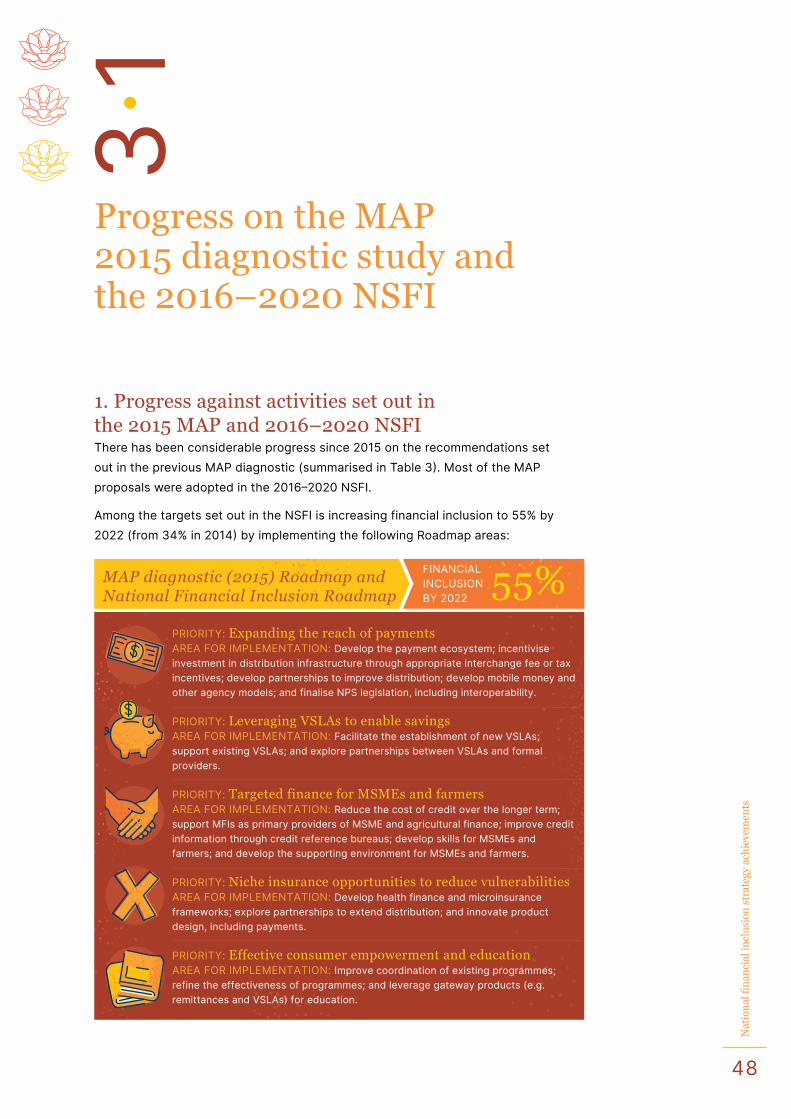
48
Nat
ion
al fi
nan
cial
incl
usi
on s
trat
egy
ach
ieve
men
ts
Progress on the MAP 2015 diagnostic study and the 2016–2020 NSFI
1. Progress against activities set out in the 2015 MAP and 2016–2020 NSFIThere has been considerable progress since 2015 on the recommendations set out in the previous MAP diagnostic (summarised in Table 3). Most of the MAP proposals were adopted in the 2016–2020 NSFI.
Among the targets set out in the NSFI is increasing financial inclusion to 55% by 2022 (from 34% in 2014) by implementing the following Roadmap areas:
3.1
MAP diagnostic (2015) Roadmap and National Financial Inclusion Roadmap 55%
PRIORITY: Expanding the reach of paymentsAREA FOR IMPLEMENTATION: Develop the payment ecosystem; incentivise investment in distribution infrastructure through appropriate interchange fee or tax incentives; develop partnerships to improve distribution; develop mobile money and other agency models; and finalise NPS legislation, including interoperability.
PRIORITY: Leveraging VSLAs to enable savingsAREA FOR IMPLEMENTATION: Facilitate the establishment of new VSLAs; support existing VSLAs; and explore partnerships between VSLAs and formal providers.
PRIORITY: Targeted finance for MSMEs and farmersAREA FOR IMPLEMENTATION: Reduce the cost of credit over the longer term; support MFIs as primary providers of MSME and agricultural finance; improve credit information through credit reference bureaus; develop skills for MSMEs and farmers; and develop the supporting environment for MSMEs and farmers.
PRIORITY: Niche insurance opportunities to reduce vulnerabilitiesAREA FOR IMPLEMENTATION: Develop health finance and microinsurance frameworks; explore partnerships to extend distribution; and innovate product design, including payments.
PRIORITY: Effective consumer empowerment and educationAREA FOR IMPLEMENTATION: Improve coordination of existing programmes; refine the effectiveness of programmes; and leverage gateway products (e.g. remittances and VSLAs) for education.
FINANCIAL INCLUSION BY 2022
49
Nat
ion
al fi
nan
cial
incl
usi
on s
trat
egy
ach
ieve
men
ts
An additional priority in the NSFI that was not in the MAP recommendations was ‘National coordination of financial inclusion’. This resulted in a greater emphasis on financial inclusion within the MoFEPD, as the Financial Sector Policy Unit (FSPU) was merged with the Pension Division in 2016 to become the Pension and Financial Sector Policy Division, with dedicated staff.1 However, this has not achieved the level of coordination desired during the 2015 MAP diagnostic, as meetings of the financial sector working group have been intermittent.
Despite these shortcomings, the 2015 MAP diagnostic and 2016–2020 NSFI resulted in a raft of new policies, as set out in Section 2.2.
Highlights from the outcomes of these policies are discussed on Table 4 (below), adapted from the February 2020 progress report on the implementation of the NSFI, prepared by the MoFEPD.
Of the 93 activities identified in the first MAP and the NSFI, only 20 have clearly been completed. In some instances, there has been progress but the desired outcome has not been clearly realised.
Some of the key achievements are explained in more detail in Sections 4.1.1–4.1.4.
Approximately 30 of the activities not completed are important and have been identified as priorities for the current MAP refresh (discussed in Section 6.3).
Table 2: Key MAP diagnostic (2015) and NSFI 2016–2020 progress highlights and challenges
MAP (NFIS) GOAL PROGRESS HIGHLIGHTS AND CHALLENGES (ACTIVITIES CLEARLY ACHIEVED ARE IN BOLD)
EXPA
ND
ING
TH
E RE
ACH
OF
PAYM
ENTS
(5/2
4 AC
TIV
ITIE
S C
LEA
RLY
ACH
IEV
ED)
• e-Money regulations were published in 2019, replacing guidelines for mobile payments systems (2011). This is important as mobile money agents are access points for payments, including person-to-person and cash distribution. While 90-day active users of digital financial services increased from 1.1m in 2015 to 3.5m in 2019 (target: 3m), 30-day active users are significantly less than this. Banks are also partnering with MNOs to do cash-out on ATMs (in other words, there is payments interoperability) and are in discussions with MNOs to provide free data services for mobile apps.
• Banks have become super-agents to mobile money providers. While agency banking regulations were published in 2018, agency-based banking remains a challenge, however, with only 1,000 agents having been rolled out. Banks have partnered with merchants to roll out POS services and agent banking services (e.g. NBM Fastserve). Bank access points (ATMs, POS devices, branches, bank agents) per 100,000 adults have increased from 12.5 in 2015 to 48.43 in 2019 (target: 25). At the same time, rural provision of banking services remains limited.
• Simplified customer due diligence (CDD) regulations were issued and, in 2018, guidance notes on a risk-based approach to lending were issued. At least one bank (FDH Bank) has launched a digital account (named ‘Ufulu’) that allows for remote opening. Remote CDD is made possible by the fact that, as at July 2018, 93% of the population had a National ID (identity) card. However, more banks need to be connected to the National Registration Bureau, and the high cost of accessing it needs to be revised.
• The World Bank funded the Financial Sector Technical Assistance Project (FSTAP) between 2011 and 2018, which resulted in an MFI and SACCO processing hub – referred to as ‘the National Switch’ – and improvements in institutional capacity. Airtel and TNM (MNOs) have been integrated with the National Switch effective from November 2018. The payments systems interoperability directive was published in 2017. All banks are already integrated with Airtel Money and TNM Mpamba on push and pull for funds in e-wallets (in other words, there is interoperability).
• RBM approved international remittances providers Mukuru (integrated with TNM) and Hello Paisa. Exclusivity clauses between remittances providers and local money transfer were removed. RBM also worked with the SADC-RTGS and COMESA REPSS user groups to enhance coordination and collaboration on cross-border payments.
Of the 93 activities
identified in the first
MAP and the NSFI,
only 20 have clearly
been completed.
50
Nat
ion
al fi
nan
cial
incl
usi
on s
trat
egy
ach
ieve
men
ts
MAP (NFIS) GOAL PROGRESS HIGHLIGHTS AND CHALLENGES (ACTIVITIES CLEARLY ACHIEVED ARE IN BOLD)
LEV
ERAG
ING
VSL
AS
TO E
NA
BLE
SAV
ING
S
(3/1
2 AC
TIV
ITIE
S C
LEA
RLY
ACH
IEV
ED)
• A number of international and local organisations continue to extend the reach of VSLAs, including linking some to the formal financial sector – especially banks. From the government side, the RBM- and IFAD-funded FARMSE programme has specific interventions to support linkages of savings and loan groups with formal FSPs as one of its key objectives. However, there are important limits on these connections, particularly in respect of third-party digital FSPs.
• A decision was taken not to regulate savings groups (the MAP goal was to take a policy decision as to what to do with savings groups).
• TNM partnered with Old Mutual Investment Group to provide an investment product called ‘Mpamba Fesa’ to facilitate small-value investments through collective investment vehicles. New products such as Mpamba Fesa have been developed and others are in the process of being developed (e.g. by Airtel).
TARG
ETED
FIN
AN
CE
FOR
MSM
ES A
ND
FA
RMER
S
(1/2
4 AC
TIV
ITIE
S C
LEA
RLY
ACH
IEV
ED)
• Payroll lending against payslips has been implemented by SACCOs and MFIs.
• One farmers’ SACCO, BNC SACCO, in the Blantyre, Chikwawa and Nsanje districts, has been licensed by the Registrar of Financial Institutions. In addition, capacity is being built in farmers’ SACCOs in Mchinji, Dowa, Ntchisi and Phalombe in readiness of their licensing. However, there is limited progress on this (see discussion in Section 4.2.3).
• National Bank of Malawi (NBM) has a suite of products tailored to farmers at different levels and tiers of the Farmers segments right through to the smallest farmer with the Mlimi account. The reach of banks in rural areas is extremely limited, however.
• Some banks (such as NBM) are providing agri-value chain financing to farmers and MSMEs, including in partnership with investors such as the European Investment Bank (NBM’s partner) and OPIC. This is linked to the development of the Warehouse Receipt Act. Some of the banks have partnered with different shareholders (e.g. European Investment Bank and OPIC) on agri-storage and value chains to facilitate and provide finance and support to the commodity exchange. Nonetheless, this system has limitations and financing across the value chain needs to be carefully considered.
• Credit reference bureau legislative amendments were passed in 2015. Two credit reference bureaus (CRBs) are now in place and all banks share credit information. The CRBs share information on individuals and businesses. However, this system is expensive and not really viable for use for small-sized loans.
• Government in partnership with CDH Investment Bank provides venture capital through MAICC. Overall, however, venture capital funding in Malawi is very limited and little progress has been made on this front.
NIC
HE
INSU
RAN
CE
OPP
ORT
UN
ITIE
S TO
RE
DU
CE
VU
LNER
ABI
LITI
ES
(6/1
2 AC
TIV
ITIE
S C
LEA
RLY
ACH
IEV
ED –
TH
E FI
RST
POIN
T IN
CLU
DES
TH
REE
ACTI
VIT
IES) • The inclusive insurance directive was put in place in 2019, and AML/CFT guidelines for low-value
insurance were developed in 2018. Statutory returns (e.g. claims ratios) are electronically submitted to registrar.
• NICO General, Old Mutual Life and Smne Life collect premiums through Airtel Money and TNM Mpamba. The insurers are therefore capable of expanding the reach of insurance products to consumers who do not have bank accounts.
• All eight general insurers offer agricultural insurance, which comprised 2.5% of the total gross premium in June 2018. Some insurance companies implemented credit life and funeral products in 2018 tailored for farmers through rural-based MFIs such as Comsip and CUMO. NICO Life offers embedded credit life and funeral benefit on weather insurance for farmers borrowing from banks. There have also been pilot tests of insurance against drought for subsistence farmers. Insurers have developed and rolled out family funeral insurance cover for VSLA members. However, more work is needed for robust agricultural insurance products.
• Government is also participating in the African Risk Capacity (ARC) programme, a sovereign drought insurance scheme.
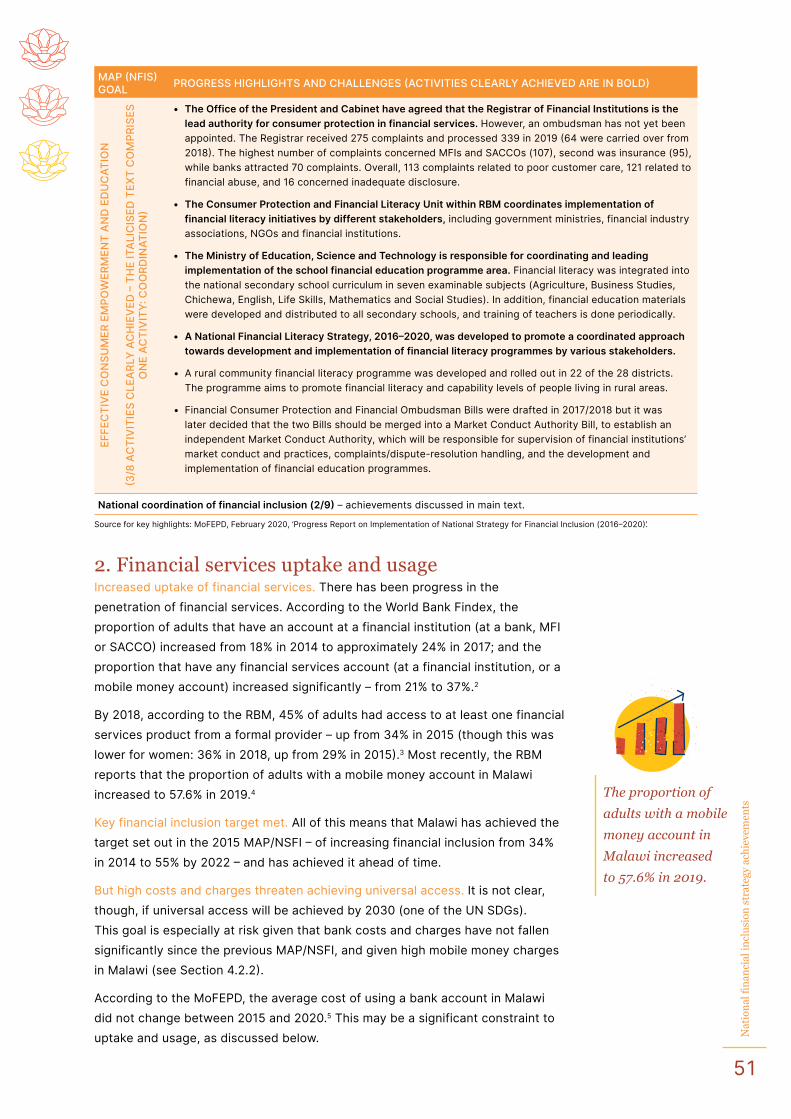
51
Nat
ion
al fi
nan
cial
incl
usi
on s
trat
egy
ach
ieve
men
ts
MAP (NFIS) GOAL PROGRESS HIGHLIGHTS AND CHALLENGES (ACTIVITIES CLEARLY ACHIEVED ARE IN BOLD)
EFFE
CTI
VE
CO
NSU
MER
EM
POW
ERM
ENT
AN
D E
DU
CAT
ION
(3/8
AC
TIV
ITIE
S C
LEA
RLY
ACH
IEV
ED –
TH
E IT
ALI
CIS
ED T
EXT
CO
MPR
ISES
O
NE
ACTI
VIT
Y: C
OO
RDIN
ATIO
N)
• The Office of the President and Cabinet have agreed that the Registrar of Financial Institutions is the lead authority for consumer protection in financial services. However, an ombudsman has not yet been appointed. The Registrar received 275 complaints and processed 339 in 2019 (64 were carried over from 2018). The highest number of complaints concerned MFIs and SACCOs (107), second was insurance (95), while banks attracted 70 complaints. Overall, 113 complaints related to poor customer care, 121 related to financial abuse, and 16 concerned inadequate disclosure.
• The Consumer Protection and Financial Literacy Unit within RBM coordinates implementation of financial literacy initiatives by different stakeholders, including government ministries, financial industry associations, NGOs and financial institutions.
• The Ministry of Education, Science and Technology is responsible for coordinating and leading implementation of the school financial education programme area. Financial literacy was integrated into the national secondary school curriculum in seven examinable subjects (Agriculture, Business Studies, Chichewa, English, Life Skills, Mathematics and Social Studies). In addition, financial education materials were developed and distributed to all secondary schools, and training of teachers is done periodically.
• A National Financial Literacy Strategy, 2016–2020, was developed to promote a coordinated approach towards development and implementation of financial literacy programmes by various stakeholders.
• A rural community financial literacy programme was developed and rolled out in 22 of the 28 districts. The programme aims to promote financial literacy and capability levels of people living in rural areas.
• Financial Consumer Protection and Financial Ombudsman Bills were drafted in 2017/2018 but it was later decided that the two Bills should be merged into a Market Conduct Authority Bill, to establish an independent Market Conduct Authority, which will be responsible for supervision of financial institutions’ market conduct and practices, complaints/dispute-resolution handling, and the development and implementation of financial education programmes.
National coordination of financial inclusion (2/9) – achievements discussed in main text.
Source for key highlights: MoFEPD, February 2020, ‘Progress Report on Implementation of National Strategy for Financial Inclusion (2016–2020)’.
2. Financial services uptake and usage Increased uptake of financial services. There has been progress in the penetration of financial services. According to the World Bank Findex, the proportion of adults that have an account at a financial institution (at a bank, MFI or SACCO) increased from 18% in 2014 to approximately 24% in 2017; and the proportion that have any financial services account (at a financial institution, or a mobile money account) increased significantly – from 21% to 37%.2
By 2018, according to the RBM, 45% of adults had access to at least one financial services product from a formal provider – up from 34% in 2015 (though this was lower for women: 36% in 2018, up from 29% in 2015).3 Most recently, the RBM reports that the proportion of adults with a mobile money account in Malawi increased to 57.6% in 2019.4
Key financial inclusion target met. All of this means that Malawi has achieved the target set out in the 2015 MAP/NSFI – of increasing financial inclusion from 34% in 2014 to 55% by 2022 – and has achieved it ahead of time.
But high costs and charges threaten achieving universal access. It is not clear, though, if universal access will be achieved by 2030 (one of the UN SDGs). This goal is especially at risk given that bank costs and charges have not fallen significantly since the previous MAP/NSFI, and given high mobile money charges in Malawi (see Section 4.2.2).
According to the MoFEPD, the average cost of using a bank account in Malawi did not change between 2015 and 2020.5 This may be a significant constraint to uptake and usage, as discussed below.
The proportion of
adults with a mobile
money account in
Malawi increased
to 57.6% in 2019.
LINKS BETWEEN BANK CHARGES AND CONSUMER UPTAKE AND USAGE
Punitive banking fees a disincentive for the unbanked. Recent research considered the impact of expanding access to basic bank accounts in countries at different stages of development by the removal of account opening fees and minimum balance requirements while providing relief to consumers with regard to non-pecuniary opening costs. Results from follow-up surveys suggest that 69% of respondents in Malawi opened accounts, 41% of them used the account once and 10% of them became active users. Among active users, the usage of accounts was extremely high (12 deposits in 2 years). The study suggests that the fees associated with opening accounts and maintaining them make accounts unaffordable for the majority of the unbanked respondents.
Rates of deposit and withdrawal similar. This suggests that account balances do not change and that respondents use the accounts for transactions on a regular basis. But according to bank administrative data, transactions are not made directly with the bank (e.g. in the form of electronic transfers that would reduce reliance on cash); rather, accounts were used for safekeeping money and saving for long-term goals, while amounts were also withdrawn on a regular basis by the users for attending to their frequent needs.
The higher the bank balance, the greater the rewards. For these reasons, FSPs should consider rewarding customers that maintain a specified bank balance, for as long as they manage to do that, with lower banking charges, or increase the interest earned on their balances. This should have the effect of encouraging savings.
Important to consider real costs of banking – beyond fees. An important determinant of usage of an account is distance to the bank. Deposits should be able to warrant a trip (although withdrawals occur when the need arises); 33% said that deposits are not worth the trip as they would have to withdraw again soon to finance consumption. This result underlines the importance of bringing banking closer to customers, including via agents. Again, it is important therefore to allow agents to open accounts and to transact values higher than MWK 50,000, and crucial too to improve agent-approval processes (including by supporting increased formal business registration).
In short: ‘Years of education’ and ‘asset-holding better-off households’ have more income to allocate to savings. Additionally, baseline poverty, transaction costs and distance to the bank were an issue. Furthermore, monthly deposits were found to be negatively correlated with inflation. It is worth mentioning that trust issues with banks were found not to be a concern in Malawi.
Despite encouragements to close accounts at the end of the study period (since interest on balances could not cover fees) the majority of study participants kept the accounts open in the hope that they would be able to save enough in the future; this indicates an option value for holding a bank account, and that monthly fees were relatively small in comparison to opening costs.
In addition, it is not yet clear if individuals who did not open accounts did not do so because they were too poor to save or because the bank accounts were not tailored to their needs.
Furthermore, the study suggests there is an unmet demand for saving instruments, although simply increasing access and the variety of products on offer will not necessarily increase financial inclusion and alleviate poverty.
53
Nat
ion
al fi
nan
cial
incl
usi
on s
trat
egy
ach
ieve
men
ts
3. Regulatory taxes and interest rate capsMalawi has successfully avoided potentially destructive policies in not implementing a proposed 1% mobile money transaction tax6 and in rejecting a Private Members Bill on capping interest rates.7 However, interest rate caps were imposed on at least MFIs in 2019, causing one MFI to raise its minimum loan value significantly – in the process automatically rendering more than 37% of its typical customer base ineligible for borrowing.8 By contrast (as reported later in the report in the focus on MFIs and savings and credit cooperative societies, or SACCOs), VSLAs – by far the most popular sources of credit (informal) in Malawi – have not been subject to interest rate caps, and charge monthly interest as high as 20%–30%.
Recommendation to review interest rate caps. Interest rate caps implemented in Malawi should be reviewed to assess their impact on borrowers and on FSPs.
4. Improved interoperabilityInteroperability improved, likely due to reforms. In 2017, the Governor of the RBM issued a Payment Systems (Interoperability of Retail Payment Systems) Directive. This directive sets out objectives and time frames to facilitate and enforce interoperability among payment service providers that supply any form of electronic payment channels authorised by the RBM. The most recent progress on this directive suggests that two mobile money service providers are connected to all banks through bilateral arrangements – though not through the National Switch as ordered by the directive. Nonetheless, these bilateral arrangements have resulted in significant progress on interoperability.
Malawi has
successfully
avoided potentially
destructive policies in
not implementing a
proposed 1% mobile
money transaction
tax and in rejecting
a Private Members
Bill on capping
interest rates.
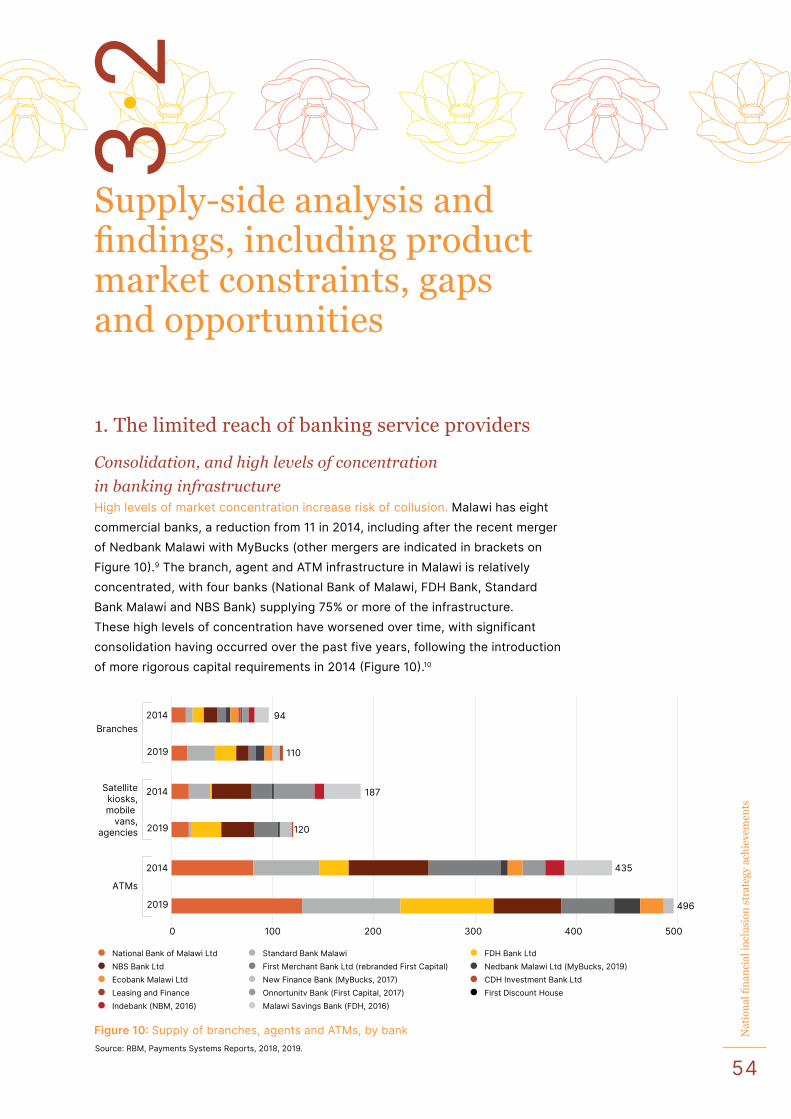
54
Nat
ion
al fi
nan
cial
incl
usi
on s
trat
egy
ach
ieve
men
ts
Supply-side analysis and findings, including product market constraints, gaps and opportunities
1. The limited reach of banking service providers
Consolidation, and high levels of concentration
in banking infrastructureHigh levels of market concentration increase risk of collusion. Malawi has eight commercial banks, a reduction from 11 in 2014, including after the recent merger of Nedbank Malawi with MyBucks (other mergers are indicated in brackets on Figure 10).9 The branch, agent and ATM infrastructure in Malawi is relatively concentrated, with four banks (National Bank of Malawi, FDH Bank, Standard Bank Malawi and NBS Bank) supplying 75% or more of the infrastructure. These high levels of concentration have worsened over time, with significant consolidation having occurred over the past five years, following the introduction of more rigorous capital requirements in 2014 (Figure 10).10
3.2
Branches2014
2019
2014
2019
2014
2019
ATMs
Satellitekiosks,mobile
vans,agencies
National Bank of Malawi Ltd Standard Bank Malawi FDH Bank LtdNBS Bank Ltd First Merchant Bank Ltd (rebranded First Capital) Nedbank Malawi Ltd (MyBucks, 2019)Ecobank Malawi Ltd New Finance Bank (MyBucks, 2017) CDH Investment Bank LtdLeasing and Finance Onnortunitv Bank (First Capital, 2017) First Discount HouseIndebank (NBM, 2016) Malawi Savings Bank (FDH, 2016)
0 100 200 300 400 500
94
110
187
120
435
496
Figure 10: Supply of branches, agents and ATMs, by bank Source: RBM, Payments Systems Reports, 2018, 2019.
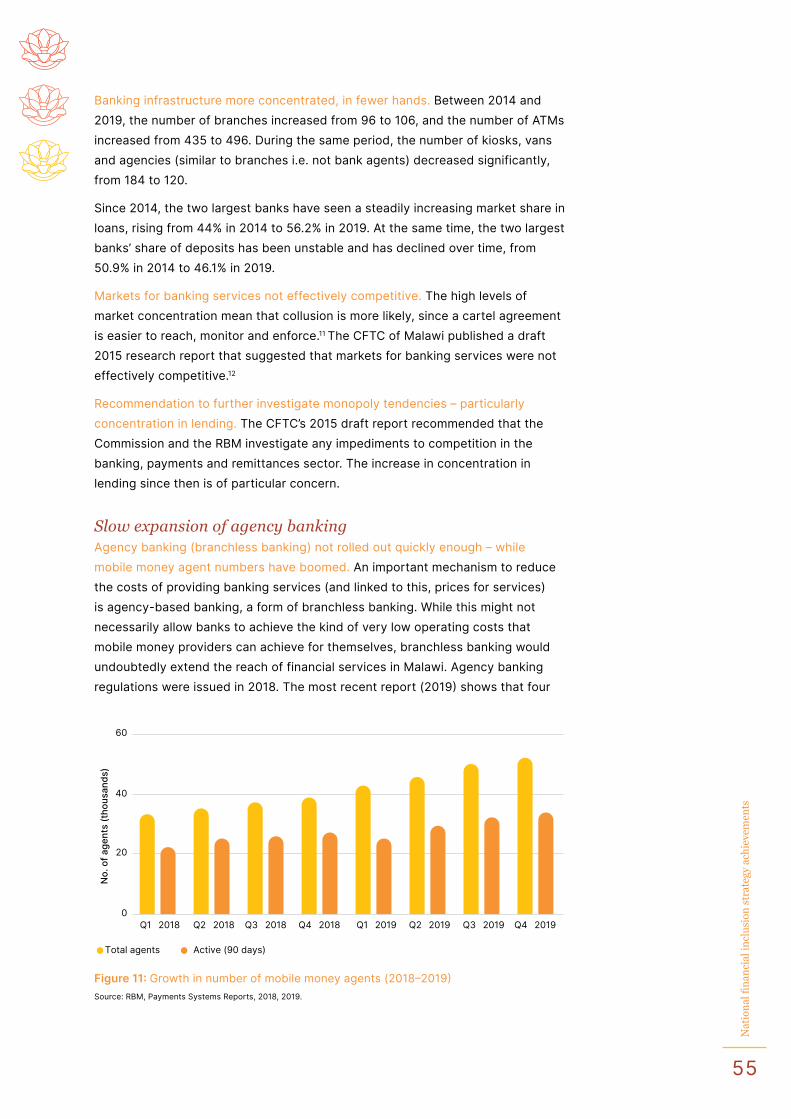
55
Nat
ion
al fi
nan
cial
incl
usi
on s
trat
egy
ach
ieve
men
ts
Banking infrastructure more concentrated, in fewer hands. Between 2014 and 2019, the number of branches increased from 96 to 106, and the number of ATMs increased from 435 to 496. During the same period, the number of kiosks, vans and agencies (similar to branches i.e. not bank agents) decreased significantly, from 184 to 120.
Since 2014, the two largest banks have seen a steadily increasing market share in loans, rising from 44% in 2014 to 56.2% in 2019. At the same time, the two largest banks’ share of deposits has been unstable and has declined over time, from 50.9% in 2014 to 46.1% in 2019.
Markets for banking services not effectively competitive. The high levels of market concentration mean that collusion is more likely, since a cartel agreement is easier to reach, monitor and enforce.11 The CFTC of Malawi published a draft 2015 research report that suggested that markets for banking services were not effectively competitive.12
Recommendation to further investigate monopoly tendencies – particularly concentration in lending. The CFTC’s 2015 draft report recommended that the Commission and the RBM investigate any impediments to competition in the banking, payments and remittances sector. The increase in concentration in lending since then is of particular concern.
Slow expansion of agency bankingAgency banking (branchless banking) not rolled out quickly enough – while mobile money agent numbers have boomed. An important mechanism to reduce the costs of providing banking services (and linked to this, prices for services) is agency-based banking, a form of branchless banking. While this might not necessarily allow banks to achieve the kind of very low operating costs that mobile money providers can achieve for themselves, branchless banking would undoubtedly extend the reach of financial services in Malawi. Agency banking regulations were issued in 2018. The most recent report (2019) shows that four
2018Q1 2018Q2 2018Q3 2018Q4 2019Q1 2019Q2 2019Q3 2019Q4
Total agents Active (90 days)
No.
of a
gent
s (t
hous
ands
)
0
20
40
60
Figure 11: Growth in number of mobile money agents (2018–2019)Source: RBM, Payments Systems Reports, 2018, 2019.
56
Nat
ion
al fi
nan
cial
incl
usi
on s
trat
egy
ach
ieve
men
ts
of the banks offer banking via agents; and, as at 30 April 2019, there were 1,040 banking agents in total, a relatively small increase since their launch during the first MAP.13 This is especially slow growth relative to the number of mobile money agents, which has grown significantly over time, reaching almost 40,000 active agents by 2019 (see Figure 11).
Range of sound reasons for delay in rolling out agency banking. Considered more closely, the delay in expansion of agency banking can be attributed to a number of debilitating controls.
Slow approval processes. As raised in an interview during the course of this MAP refresh project, there are delays in regulatory approval processes for new agents.
Cannot open a bank account. Bank agents are not permitted to offer consumers the service of opening bank accounts.14
Transactions value limit. Transactions with agencies are subject to a MWK 50,000 limit. Even where agency-based banking has expanded, the limit on transaction value impedes the uptake of these services and mutes their impact. According to research conducted in 2017, most MFI loan products are between MWK 50,000 and MWK 500,000.15 For instance, an MFI interviewed during the MAP refresh stated that its repayment amounts range from MWK 52,750 to MWK 1,023,750 (averaging MWK 232,355). These values all lie above the bank agent limit.
Similarly, there are indications that average remittance values to Malawi far exceed MWK 50,000. The fact that remittance recipients would not be able to draw their funds via agents limits banks’ competitiveness in markets for remittances using agents.16
Recommendation for further, in-depth research on impediments to agency growth. In general, the slow growth in the number of bank agents needs to be investigated further. It may be that the registration requirements are too onerous (only formal businesses may be agents); the agent approval process could be revised or removed to allow banks to be accountable for agent approval.
It may be that maximum transaction values are too low to warrant becoming a bank agent – in other words, that potential agents are electing not to put themselves forward; the very low bank agent transaction limit should be revised upwards, at least on a trial basis, in order to study the impact of this, including in relation to money-laundering risks.
The RBM might consider allowing agents to open new bank accounts for customers, especially in circumstances where remote account opening is permitted.
Payments system in need of reformEFTs are expensive. Bank-to-bank electronic fund transfer (EFT) charges are exceedingly high in Malawi, at between MWK 500 and MWK 1,000 per transaction, depending on the bank. For business customers such as MFIs, EFTs to customers are even higher, at MWK 1,500. This means (at least according to
The slow growth
in the number of
bank agents needs
to be investigated
further. It may be
that the registration
requirements are
too onerous.
57
Nat
ion
al fi
nan
cial
incl
usi
on s
trat
egy
ach
ieve
men
ts
MFI submissions to this MAP refresh) that customers rarely use bank-to-bank electronic transfers to repay loans. Note that this is not only due to the limited reach of banking services; in 2017, for example, 70% of MFI loans were made via bank cheque, likely due to the high charges and poor quality (slow transfer times) of EFTs.17
Recommendation that RBM and CFTC investigate drivers of high prices. High retail charges for bank-to-bank transfers are likely due, at least in part, to high interchange charges. The RBM and CFTC need to collaborate on investigating whether interchange fees are too high, driving high retail prices for interbank transfers. As the government migrates its social cash transfer payments to EFT, there may be an opportunity to reduce bank charges (possibly including interchange rates).
EFTs are high-cost, low-quality service. While prices for EFTs are high, quality appears to be poor, with significant delays in payment processing. As explained by a bank during the course of this MAP refresh project, there are no bank-to-bank electronic transfers over weekends or public holidays and these are only processed on the next working day. In addition, settlement times are 10h00, 12h55 and 15h30, and any transfers made after that are processed on the next working day. There is, therefore, no real-time clearing between banks.
Delays seriously inconvenience consumers. These delays may have a significant impact, for example, on beneficiaries dependent on social cash transfers or other sources of support, such as remittances. While government (or donor agency) to person payments are on a trial basis currently and remittances are largely via mobile money, these limitations of the payments system mean that banks are less able to compete effectively with digital remittance and payments providers for these services. The turnaround times are in stark contrast to the real-time clearing between banks and mobile wallets, which are instant and typically cost MWK 500 for a transfer from a bank to a mobile wallet, and 2.5% of the transaction value from a mobile wallet to a bank.18 There are also delays in relation to the release of incoming cross-border EFTs, which typically take three days to clear and are also costly at a minimum of US$50 (approximately MWK 36,744).19
The high costs of EFTs and lengthy processing times are particularly of concern given that government plans to migrate payments to EFTs, having committed to a pilot project to do so in March 2020.20
Recommendation to study viability for Malawi of real-time clearing for bank-to-bank transactions. This would benefit not only people dependent on social cash transfers but also those that rely on remittances and other sources of income. This could also have the effect of boosting banks’ capability to compete with mobile money operators, who differentiate themselves based on instant transfers (and proof thereof).
The high costs of
EFTs and lengthy
processing times
are particularly
of concern given
that government
plans to migrate
payments to EFTs.
58
Nat
ion
al fi
nan
cial
incl
usi
on s
trat
egy
ach
ieve
men
ts
Need for expanded reliance on credit history and National IDUrgent need to streamline provider credit assessment, approval. Credit history is actively used in Malawi to assist in making decisions on loans, and approximately 40% of adults are covered by the credit bureaus.21 In fact, Malawi ranks relatively well in respect of indicators for getting credit (including strong legal rights and availability of credit information), at 11th out of 190 countries ranked by the World Bank.
Flawed data, reluctance to share data, high access charges. In practice, however, the information provided by the credit bureaus is imperfect, presented in summary form without detailed transaction history.22 Although FSPs, with the permission of the customer, are able to request additional transaction history from other entities, there is often a reluctance among institutions to share information.23
Furthermore, credit reference bureau charges are considered to be high for certain financial cooperatives and MFIs.24
Finally, there are concerns that, when credit data is shared, it is incorrect or outdated, though there are signs of improvement over time.25
The poor quality of data from the credit bureau, and the insufficient sharing of information, is limiting financial inclusion and reducing the efficiency with which credit decisions are being made.
APIs as a consequence of digitalisation could be enabling. There might may be an opportunity to introduce open application programming interfaces (APIs) into the banking and broader FSP ecosystem as the process of digitalisation unfolds.
National ID key to enabling credit access. The National ID system in Malawi is a significant achievement and could be used for remote onboarding of customers, if FSPs were able to access the National Registration Bureau (NRB) system to verify identification information. It is also an enabler for access to credit. Current KYC/CDD rules require that FSPs verify identities by means of a valid National ID.26 However, FSPs report that they are unable to access the database at the NRB due to the high associated costs.27
Recommendation for ongoing monitoring of improvements in provider access to NRB. The RBM, FSPs and the NRB are currently in discussions to reduce these costs. This will be a key area to monitor in the coming years, including in respect of uptake and assessing whether remote onboarding is successful.
Impediments to FSPs leveraging National ID system for financial inclusion. A further, related problem is that mobile money accounts may not be opened by anyone under the age of 18. This also means that a significant proportion of youths cannot be served, making it difficult for child headed-households to access financial services, for example.28 Furthermore, this issue raises questions with regard to the payment of funeral insurance cover and social cash transfers, as beneficiaries may be children with no national form of identification.29 These
The poor quality of
data from the credit
bureau, and the
insufficient sharing
of information, is
limiting financial
inclusion and
reducing the
efficiency with which
credit decisions
are being made.
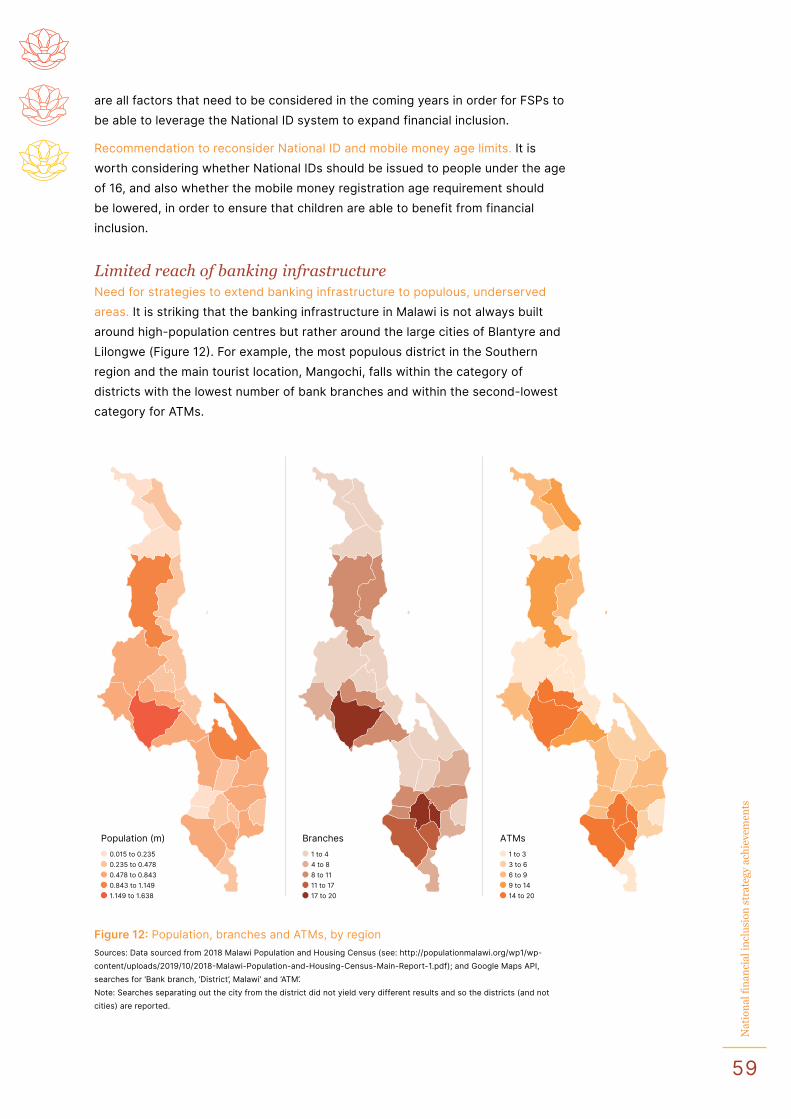
59
Nat
ion
al fi
nan
cial
incl
usi
on s
trat
egy
ach
ieve
men
ts
are all factors that need to be considered in the coming years in order for FSPs to be able to leverage the National ID system to expand financial inclusion.
Recommendation to reconsider National ID and mobile money age limits. It is worth considering whether National IDs should be issued to people under the age of 16, and also whether the mobile money registration age requirement should be lowered, in order to ensure that children are able to benefit from financial inclusion.
Limited reach of banking infrastructureNeed for strategies to extend banking infrastructure to populous, underserved areas. It is striking that the banking infrastructure in Malawi is not always built around high-population centres but rather around the large cities of Blantyre and Lilongwe (Figure 12). For example, the most populous district in the Southern region and the main tourist location, Mangochi, falls within the category of districts with the lowest number of bank branches and within the second-lowest category for ATMs.
Population (m)0.015 to 0.2350.235 to 0.4780.478 to 0.8430.843 to 1.1491.149 to 1.638
Branches1 to 44 to 88 to 1111 to 1717 to 20
ATMs1 to 33 to 66 to 99 to 1414 to 20
Figure 12: Population, branches and ATMs, by regionSources: Data sourced from 2018 Malawi Population and Housing Census (see: http://populationmalawi.org/wp1/wp-content/uploads/2019/10/2018-Malawi-Population-and-Housing-Census-Main-Report-1.pdf); and Google Maps API, searches for ‘Bank branch, ‘District’, Malawi’ and ‘ATM’. Note: Searches separating out the city from the district did not yield very different results and so the districts (and not cities) are reported.
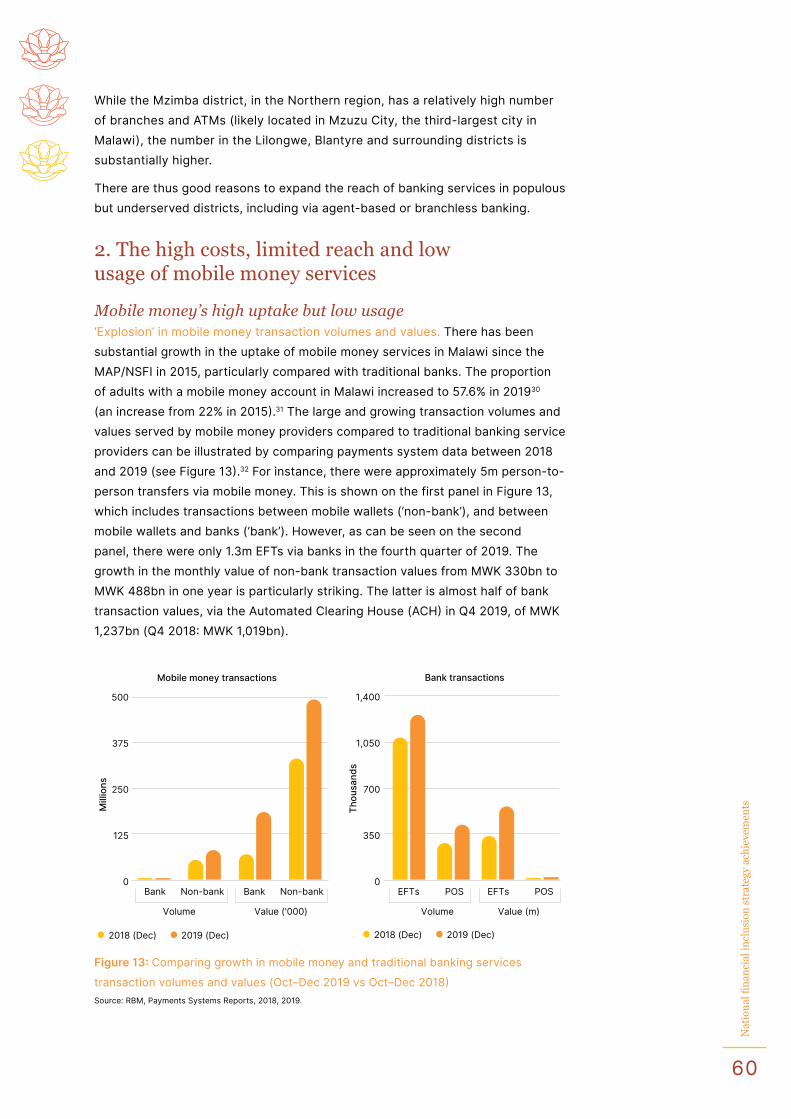
60
Nat
ion
al fi
nan
cial
incl
usi
on s
trat
egy
ach
ieve
men
ts
While the Mzimba district, in the Northern region, has a relatively high number of branches and ATMs (likely located in Mzuzu City, the third-largest city in Malawi), the number in the Lilongwe, Blantyre and surrounding districts is substantially higher.
There are thus good reasons to expand the reach of banking services in populous but underserved districts, including via agent-based or branchless banking.
2. The high costs, limited reach and low usage of mobile money services
Mobile money’s high uptake but low usage ‘Explosion’ in mobile money transaction volumes and values. There has been substantial growth in the uptake of mobile money services in Malawi since the MAP/NSFI in 2015, particularly compared with traditional banks. The proportion of adults with a mobile money account in Malawi increased to 57.6% in 201930 (an increase from 22% in 2015).31 The large and growing transaction volumes and values served by mobile money providers compared to traditional banking service providers can be illustrated by comparing payments system data between 2018 and 2019 (see Figure 13).32 For instance, there were approximately 5m person-to-person transfers via mobile money. This is shown on the first panel in Figure 13, which includes transactions between mobile wallets (‘non-bank’), and between mobile wallets and banks (‘bank’). However, as can be seen on the second panel, there were only 1.3m EFTs via banks in the fourth quarter of 2019. The growth in the monthly value of non-bank transaction values from MWK 330bn to MWK 488bn in one year is particularly striking. The latter is almost half of bank transaction values, via the Automated Clearing House (ACH) in Q4 2019, of MWK 1,237bn (Q4 2018: MWK 1,019bn).
2018 (Dec) 2019 (Dec) 2018 (Dec) 2019 (Dec)
Mobile money transactions
Mill
ions
0
125
250
375
500
Volume Value ('000)
Bank transactions
Thou
sand
s
0
350
700
1,050
1,400
Volume Value (m)
Bank Non-bank Bank Non-bank EFTs POS EFTs POS
Figure 13: Comparing growth in mobile money and traditional banking services
transaction volumes and values (Oct–Dec 2019 vs Oct–Dec 2018)Source: RBM, Payments Systems Reports, 2018, 2019.
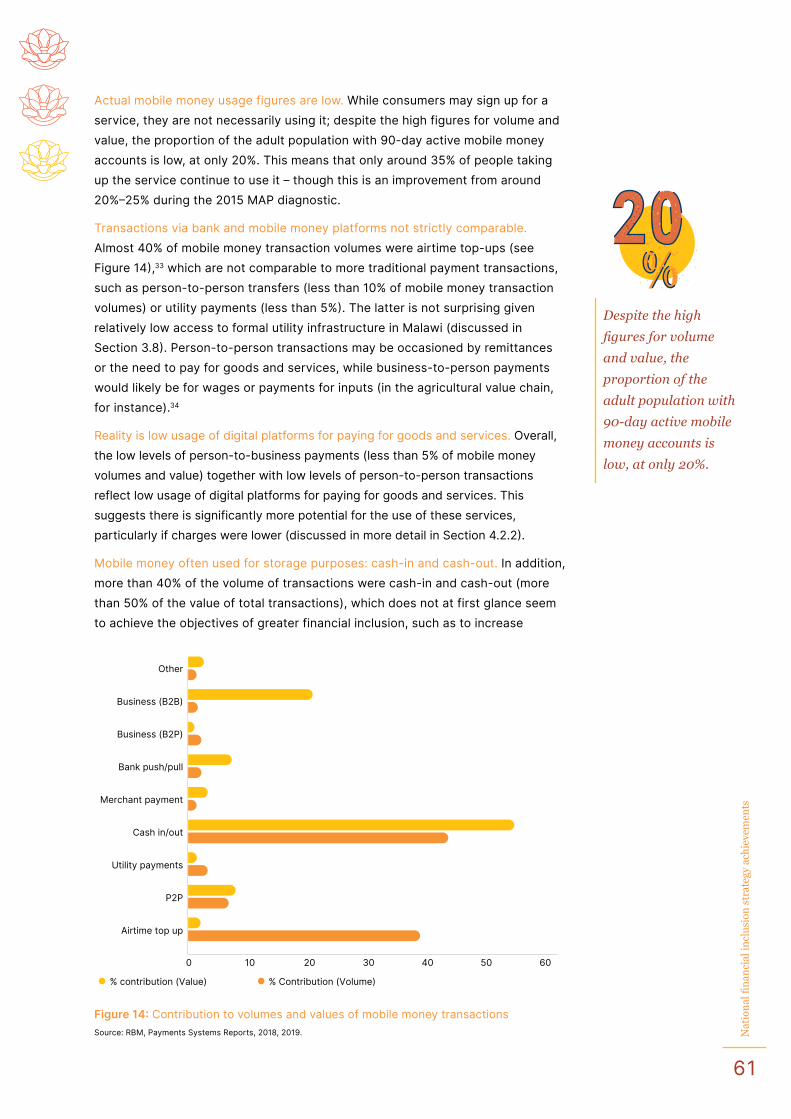
61
Nat
ion
al fi
nan
cial
incl
usi
on s
trat
egy
ach
ieve
men
ts
Actual mobile money usage figures are low. While consumers may sign up for a service, they are not necessarily using it; despite the high figures for volume and value, the proportion of the adult population with 90-day active mobile money accounts is low, at only 20%. This means that only around 35% of people taking up the service continue to use it – though this is an improvement from around 20%–25% during the 2015 MAP diagnostic.
Transactions via bank and mobile money platforms not strictly comparable. Almost 40% of mobile money transaction volumes were airtime top-ups (see Figure 14),33 which are not comparable to more traditional payment transactions, such as person-to-person transfers (less than 10% of mobile money transaction volumes) or utility payments (less than 5%). The latter is not surprising given relatively low access to formal utility infrastructure in Malawi (discussed in Section 3.8). Person-to-person transactions may be occasioned by remittances or the need to pay for goods and services, while business-to-person payments would likely be for wages or payments for inputs (in the agricultural value chain, for instance).34
Reality is low usage of digital platforms for paying for goods and services. Overall, the low levels of person-to-business payments (less than 5% of mobile money volumes and value) together with low levels of person-to-person transactions reflect low usage of digital platforms for paying for goods and services. This suggests there is significantly more potential for the use of these services, particularly if charges were lower (discussed in more detail in Section 4.2.2).
Mobile money often used for storage purposes: cash-in and cash-out. In addition, more than 40% of the volume of transactions were cash-in and cash-out (more than 50% of the value of total transactions), which does not at first glance seem to achieve the objectives of greater financial inclusion, such as to increase
% contribution (Value) % Contribution (Volume)
0 10 20 30 6040 50
Other
Merchant payment
Bank push/pull
Business (B2B)
Business (B2P)
Cash in/out
Utility payments
P2P
Airtime top up
Figure 14: Contribution to volumes and values of mobile money transactionsSource: RBM, Payments Systems Reports, 2018, 2019.
Despite the high
figures for volume
and value, the
proportion of the
adult population with
90-day active mobile
money accounts is
low, at only 20%.
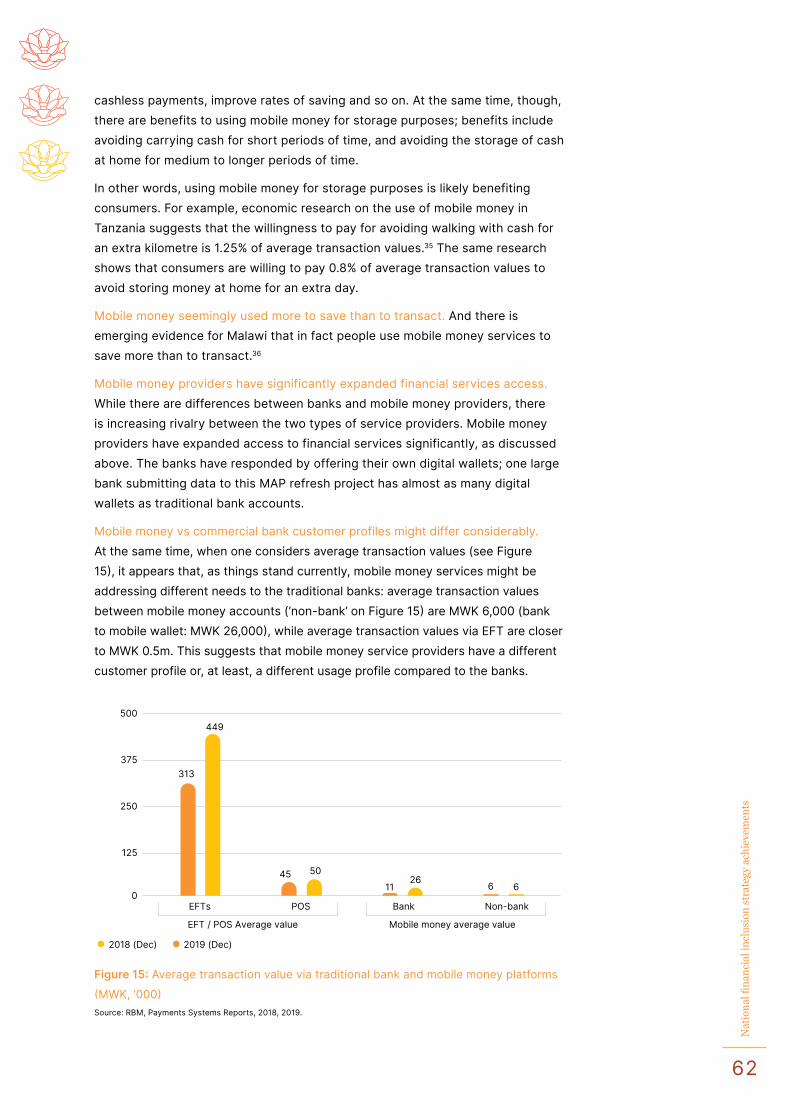
62
Nat
ion
al fi
nan
cial
incl
usi
on s
trat
egy
ach
ieve
men
ts
cashless payments, improve rates of saving and so on. At the same time, though, there are benefits to using mobile money for storage purposes; benefits include avoiding carrying cash for short periods of time, and avoiding the storage of cash at home for medium to longer periods of time.
In other words, using mobile money for storage purposes is likely benefiting consumers. For example, economic research on the use of mobile money in Tanzania suggests that the willingness to pay for avoiding walking with cash for an extra kilometre is 1.25% of average transaction values.35 The same research shows that consumers are willing to pay 0.8% of average transaction values to avoid storing money at home for an extra day.
Mobile money seemingly used more to save than to transact. And there is emerging evidence for Malawi that in fact people use mobile money services to save more than to transact.36
Mobile money providers have significantly expanded financial services access. While there are differences between banks and mobile money providers, there is increasing rivalry between the two types of service providers. Mobile money providers have expanded access to financial services significantly, as discussed above. The banks have responded by offering their own digital wallets; one large bank submitting data to this MAP refresh project has almost as many digital wallets as traditional bank accounts.
Mobile money vs commercial bank customer profiles might differ considerably. At the same time, when one considers average transaction values (see Figure 15), it appears that, as things stand currently, mobile money services might be addressing different needs to the traditional banks: average transaction values between mobile money accounts (‘non-bank’ on Figure 15) are MWK 6,000 (bank to mobile wallet: MWK 26,000), while average transaction values via EFT are closer to MWK 0.5m. This suggests that mobile money service providers have a different customer profile or, at least, a different usage profile compared to the banks.
2018 (Dec) 2019 (Dec)
0
125
250
375
500
EFT / POS Average value Mobile money average value
626
50
449
61145
313
EFTs POS Bank Non-bank
Figure 15: Average transaction value via traditional bank and mobile money platforms
(MWK, ‘000)Source: RBM, Payments Systems Reports, 2018, 2019.
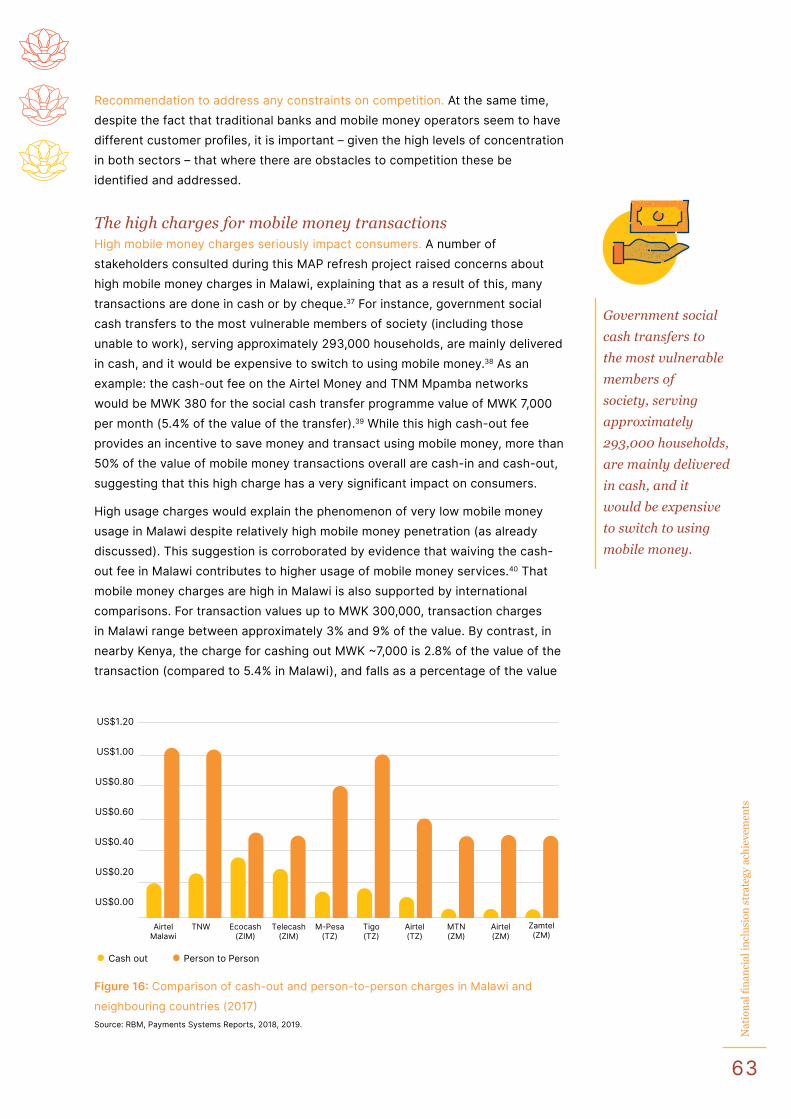
63
Nat
ion
al fi
nan
cial
incl
usi
on s
trat
egy
ach
ieve
men
ts
Recommendation to address any constraints on competition. At the same time, despite the fact that traditional banks and mobile money operators seem to have different customer profiles, it is important – given the high levels of concentration in both sectors – that where there are obstacles to competition these be identified and addressed.
The high charges for mobile money transactionsHigh mobile money charges seriously impact consumers. A number of stakeholders consulted during this MAP refresh project raised concerns about high mobile money charges in Malawi, explaining that as a result of this, many transactions are done in cash or by cheque.37 For instance, government social cash transfers to the most vulnerable members of society (including those unable to work), serving approximately 293,000 households, are mainly delivered in cash, and it would be expensive to switch to using mobile money.38 As an example: the cash-out fee on the Airtel Money and TNM Mpamba networks would be MWK 380 for the social cash transfer programme value of MWK 7,000 per month (5.4% of the value of the transfer).39 While this high cash-out fee provides an incentive to save money and transact using mobile money, more than 50% of the value of mobile money transactions overall are cash-in and cash-out, suggesting that this high charge has a very significant impact on consumers.
High usage charges would explain the phenomenon of very low mobile money usage in Malawi despite relatively high mobile money penetration (as already discussed). This suggestion is corroborated by evidence that waiving the cash-out fee in Malawi contributes to higher usage of mobile money services.40 That mobile money charges are high in Malawi is also supported by international comparisons. For transaction values up to MWK 300,000, transaction charges in Malawi range between approximately 3% and 9% of the value. By contrast, in nearby Kenya, the charge for cashing out MWK ~7,000 is 2.8% of the value of the transaction (compared to 5.4% in Malawi), and falls as a percentage of the value
AirtelMalawi
Ecocash(ZIM)
Telecash(ZIM)
M-Pesa(TZ)
Tigo(TZ)
MTN(ZM)
Airtel(TZ)
Airtel(ZM)
Zamtel(ZM)
US$1.20
US$1.00
US$0.80
US$0.60
US$0.40
US$0.20
US$0.00
TNW
Cash out Person to Person
Figure 16: Comparison of cash-out and person-to-person charges in Malawi and
neighbouring countries (2017)Source: RBM, Payments Systems Reports, 2018, 2019.
Government social
cash transfers to
the most vulnerable
members of
society, serving
approximately
293,000 households,
are mainly delivered
in cash, and it
would be expensive
to switch to using
mobile money.
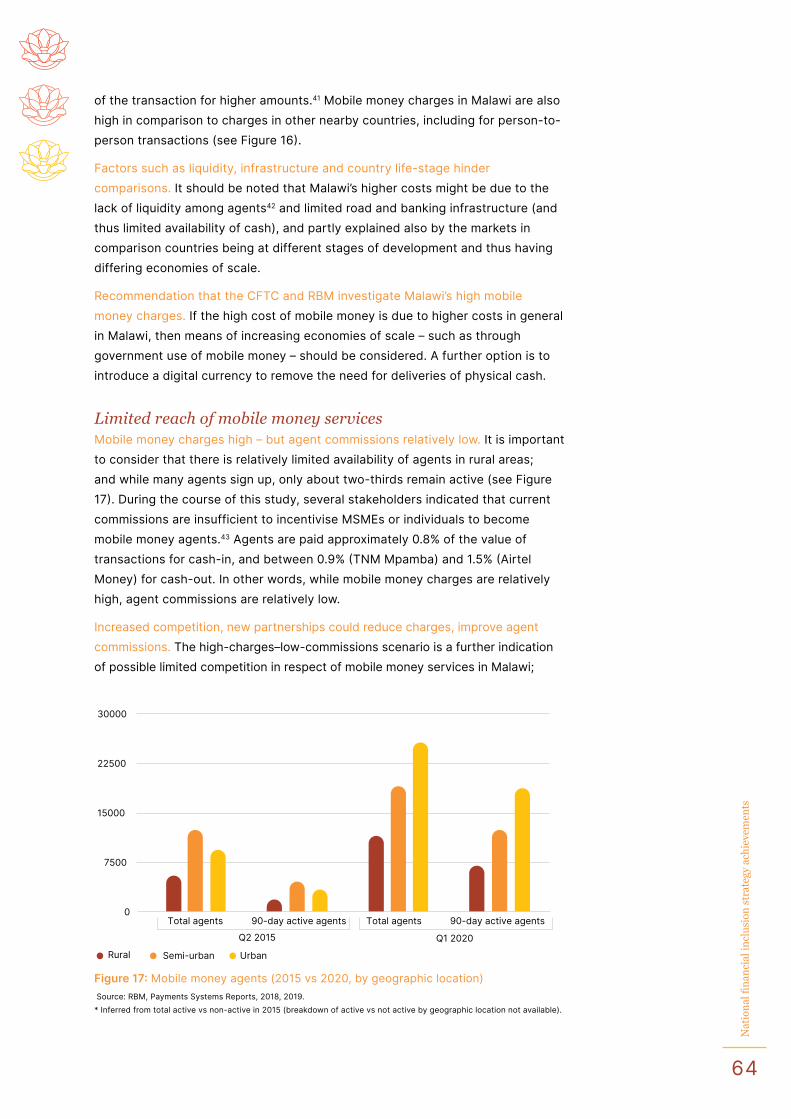
64
Nat
ion
al fi
nan
cial
incl
usi
on s
trat
egy
ach
ieve
men
ts
of the transaction for higher amounts.41 Mobile money charges in Malawi are also high in comparison to charges in other nearby countries, including for person-to-person transactions (see Figure 16).
Factors such as liquidity, infrastructure and country life-stage hinder comparisons. It should be noted that Malawi’s higher costs might be due to the lack of liquidity among agents42 and limited road and banking infrastructure (and thus limited availability of cash), and partly explained also by the markets in comparison countries being at different stages of development and thus having differing economies of scale.
Recommendation that the CFTC and RBM investigate Malawi’s high mobile money charges. If the high cost of mobile money is due to higher costs in general in Malawi, then means of increasing economies of scale – such as through government use of mobile money – should be considered. A further option is to introduce a digital currency to remove the need for deliveries of physical cash.
Limited reach of mobile money servicesMobile money charges high – but agent commissions relatively low. It is important to consider that there is relatively limited availability of agents in rural areas; and while many agents sign up, only about two-thirds remain active (see Figure 17). During the course of this study, several stakeholders indicated that current commissions are insufficient to incentivise MSMEs or individuals to become mobile money agents.43 Agents are paid approximately 0.8% of the value of transactions for cash-in, and between 0.9% (TNM Mpamba) and 1.5% (Airtel Money) for cash-out. In other words, while mobile money charges are relatively high, agent commissions are relatively low.
Increased competition, new partnerships could reduce charges, improve agent commissions. The high-charges–low-commissions scenario is a further indication of possible limited competition in respect of mobile money services in Malawi;
0
7500
15000
22500
30000
Q2 2015Total agents 90-day active agents Total agents 90-day active agents
Q1 2020Rural Semi-urban Urban
Figure 17: Mobile money agents (2015 vs 2020, by geographic location) Source: RBM, Payments Systems Reports, 2018, 2019.* Inferred from total active vs non-active in 2015 (breakdown of active vs not active by geographic location not available).
65
Nat
ion
al fi
nan
cial
incl
usi
on s
trat
egy
ach
ieve
men
ts
increased levels of healthy rivalry among MNOs for agents would bid up agent commissions; while, in principle, increased competition should lead to decreased mark-ups by the mobile money providers. In this regard, it is important to note that the RBM is currently considering applications from three or so potential new mobile money/digital financial services entrants. Their approval would surely help to reduce retail charges and increase agent commissions, ultimately supporting the development of mobile money in Malawi. In addition, constraints on mobile money agents in rural areas need to be investigated; for example, partnerships with banks or other super-agents could improve availability of cash floats in rural areas.
3. The growth in cross-border remittances, likely due to reformsRemittances – non-bank digital providers show substantial growth. Cross-border remittances play an important role in the Malawi economy. For example, the World Bank estimates that remittances equivalent to 2.4% of national GDP were sent to Malawi in 2019.44 An important trend in Malawi is the substantial growth in formal remittances to Malawi via non-bank digital FSPs.
South Africa–Malawi remittance corridor values grow by 180%. The FinMark Trust reports that the South Africa–Malawi remittance corridor saw the highest growth, among SADC countries, in values remitted via formal channels between 2016 and 2018, of almost 180%.45 Overall, by value Malawi is the second largest destination (i.e. after Zimbabwe) for remittances from South Africa. This is linked to regulatory changes in South Africa (permitting non-bank remittance providers) and increasing acceptance of formal providers in Malawi. There is, therefore, increasing competition in important areas of digital financial services in Malawi, or at least with regard to the South Africa–Malawi remittance corridor.
Total remittances value in Malawi growing slowly, and bank costs high. It is of concern that the costs of low-value cross-border remittances via banks in Malawi have declined only slowly over time (see Figure 18, Panel 1). For the period 2016–2019, the cost of remittances in Malawi made up between 15% and 20% of the value of low-value remittances (i.e. between US$200 and US$500), while the SADC average was lower in almost all years (Figure 18, panel 1). The total value of remittances in Malawi has also been growing relatively slowly compared to the growth in other SADC countries (see Figure 18, panel 2), though for the South Africa–Malawi remittances corridor this growth has been more significant.
Recommendation to investigate relatively high cost of bank remittances to Malawi and slow growth in overall remittances value. There might be (i) regulatory barriers to entry for remittances providers, and/or (ii) competition problems (e.g. collusion in respect of interchange rates, or exclusion through payments system rules).
There might be opportunities to achieve improvements through SADC, by studying exchange control regulations in South Africa and considering the fact that South African banks do not accept relationship management arrangements (RMAS).46 The RBM is engaging at the SADC-RTGS User Group level to resolve this problem. Additional support for the RBM may be needed to address problems
Cross-border
remittances play
an important role
in the Malawi
economy. The World
Bank estimates
that remittances
equivalent to
2.4% of national
GDP were sent to
Malawi in 2019.
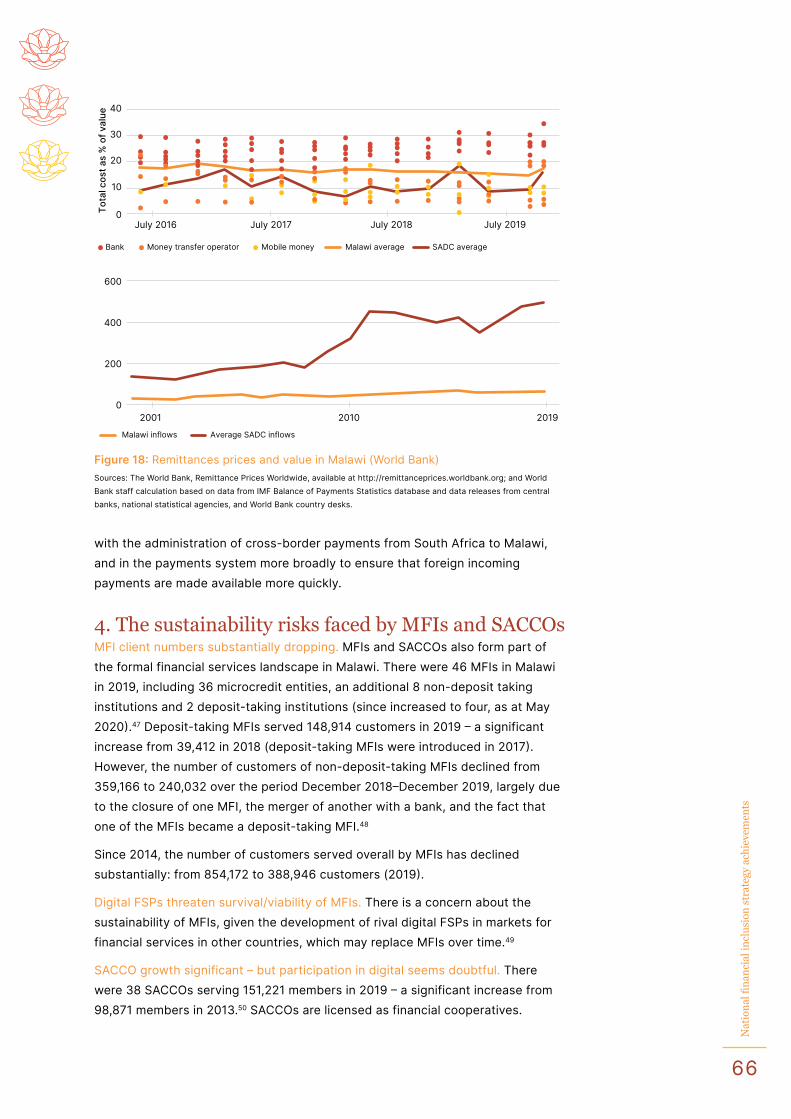
66
Nat
ion
al fi
nan
cial
incl
usi
on s
trat
egy
ach
ieve
men
ts
with the administration of cross-border payments from South Africa to Malawi, and in the payments system more broadly to ensure that foreign incoming payments are made available more quickly.
4. The sustainability risks faced by MFIs and SACCOsMFI client numbers substantially dropping. MFIs and SACCOs also form part of the formal financial services landscape in Malawi. There were 46 MFIs in Malawi in 2019, including 36 microcredit entities, an additional 8 non-deposit taking institutions and 2 deposit-taking institutions (since increased to four, as at May 2020).47 Deposit-taking MFIs served 148,914 customers in 2019 – a significant increase from 39,412 in 2018 (deposit-taking MFIs were introduced in 2017). However, the number of customers of non-deposit-taking MFIs declined from 359,166 to 240,032 over the period December 2018–December 2019, largely due to the closure of one MFI, the merger of another with a bank, and the fact that one of the MFIs became a deposit-taking MFI.48
Since 2014, the number of customers served overall by MFIs has declined substantially: from 854,172 to 388,946 customers (2019).
Digital FSPs threaten survival/viability of MFIs. There is a concern about the sustainability of MFIs, given the development of rival digital FSPs in markets for financial services in other countries, which may replace MFIs over time.49
SACCO growth significant – but participation in digital seems doubtful. There were 38 SACCOs serving 151,221 members in 2019 – a significant increase from 98,871 members in 2013.50 SACCOs are licensed as financial cooperatives.
Tota
l cos
t as
% o
f val
ue
0
0
10
20
200
40
400
600
30
July 2016 July 2017
Bank Money transfer operator Mobile money Malawi average
July 2018 July 2019
201920102001
SADC average
Malawi inflows Average SADC inflows
Figure 18: Remittances prices and value in Malawi (World Bank)Sources: The World Bank, Remittance Prices Worldwide, available at http://remittanceprices.worldbank.org; and World Bank staff calculation based on data from IMF Balance of Payments Statistics database and data releases from central banks, national statistical agencies, and World Bank country desks.
67
Nat
ion
al fi
nan
cial
incl
usi
on s
trat
egy
ach
ieve
men
ts
Of the 38 SACCOs, 32 are employer based and 6 are community based.51 While there has been significant growth in SACCO membership, concerns have been raised over their limited ability to participate in the digital financial services value chain.52 For instance, low commissions prevent SACCOs from being mobile money agents, and SACCOs are unable to offer small-value loans to members due to the high costs of using the credit reference bureaus.
MFI-SACCO processing hub an opportunity to modernise but not affordable for all. At the same time, there is an opportunity to modernise MFIs and SACCOs. For example, during the period 2011–2018, the World Bank financed the development of a processing hub (‘the National Switch’) for MFIs and SACCOs.53 (This is also linked to an activity identified in the 2015 MAP/NSFI – see Table 4 in Section 4.1.1.) MFIs have been directed to join the processing hub, at a cost of 0.75% of the value of disbursements. This is a substantial cost, however, compared to the costs of alternative platforms; in the case of one MFI, the alternative platform cost less than a tenth of the National Switch amount.54
Smaller-scale MFIs, SACCOs struggle to compete, at severe disadvantage on many fronts. Some of the MFIs that submitted data to this MAP refresh project are clearly very small, and MFIs and SACCOs have raised concerns about being sub-scale or not having reached the point of being sustainable. This means they are unable to build a business case to integrate into the mobile money or bank payment systems, nor into the credit reference bureaus or the NRB for remote onboarding, for example.55
Survival of MFIs and SACCOs will be determined in context of digital FSPs. In general, the future of MFIs and SACCOs needs to be considered in the context of the entry of innovative digital FSPs. There may be an opportunity to expand more MFIs to be deposit-taking institutions, and to digitalise MFI operations.
Recommendation to consider strategies for increasing viability of MFIs, SACCOs. The costs of implementing changes to bolster the sustainability of MFIs and SACCOs need to be carefully considered, along with the option to reduce MFI charges and/or adopt a permissive approach to consolidation.
Expanding financial service offerings could be lifeline for SACCOs, MFIs. The SACCOs are increasingly selling services that target MSMEs in rural areas, and are cross-selling insurance products. The Malawi Union of Savings and Credit Cooperatives (MUSSCO) has established an insurance entity to sell funeral cover, savings cover, loan protection and crop insurance (using weather indexing).56 This suggests that the SACCO business model is evolving towards an expanded financial services offering.
The MAP refresh study found that at least one MFI was also offering weather-index insurance, in collaboration with the World Food Programme (WFP) and NICO General;57 due to the lack of good data on weather patterns, however, this has been suspended, though the entities involved are currently in talks with the PROSPER Project Consortium, funded by the UK Department for International Development, to reinvigorate these offerings.
Some of the MFIs
that submitted data
to this MAP refresh
project are clearly
very small, and
MFIs and SACCOs
have raised concerns
about being sub-
scale or not having
reached the point of
being sustainable.
68
Nat
ion
al fi
nan
cial
incl
usi
on s
trat
egy
ach
ieve
men
ts
SACCOs and MFIs subjected to a range of constraints. There have been some delays in licensing rural SACCOs and in approving SACCOs as insurance agents, which impedes their ability to compete in these areas.58 There have also been complaints among MFIs about delays in regulatory approvals, for changes such as opening a new branch, expanding into a new geographical location or changing a director.59 Certain regulatory costs (e.g. the requirement to publish information on all products at all branches in physical rather than digital format) also increase the costs of doing business.60 In addition, as already mentioned, in 2019 interest rate caps were imposed on MFIs; this caused one MFI to raise its minimum loan value significantly, and had the effect of automatically rendering approximately 37% of its typical customer base ineligible for borrowing.61 Also as already flagged, this policy decision seems inconsistent with the decision taken not to regulate VSLAs, whose monthly interest rates are as high as 20%–30%. VSLAs are by far the greatest sources of loans in Malawi, accounting for 38% of loans in 2016.62
Recommendation to engage with challenges facing MFIs and SACCOS in the coming years to ensure ongoing relevance. It is necessary to review processes to approve insurance agents, expansion of MFIs into new territories and approvals of new directors and branches, given the complaints about delays in these processes by stakeholders. Other regulatory requirements, such as the requirements around publishing information about the business, may need to be reconsidered. In addition, the RBM could consider studying the possibility of allowing new SACCOs an incubation period, possibly allowing industry bodies to regulate them.
5. Declining rates of savingSavings rate relatively low. World Bank data suggests a worrying trend in the form of declining savings in Malawi (see Figure 19), though there does appear to be an increase in the savings rate since 2016.63 This trend is consistent across both genders. While the datasets on the two graphs are distinct (one is micro-level survey data, and the other is a macroeconomic computation), the trends point in the same direction.
Recommendation for RBM, CFTC and MACRA to investigate the relatively low savings rate. It might be that interest rates on deposits in mobile wallets are not sufficiently high. There might be a link between higher inflation and lower savings rates in Malawi over this period, though this relationship is not clear, since in the long run inflation should have no impact on savings rates, if interest rates are high enough to compensate for inflation (see also Section 2.1).64
Recommendation to consider ways to encourage consumer saving behaviour. In order to mitigate this trend towards lower savings rates, there is emerging evidence that enabling consumers to have separate, labelled savings facilities (e.g. naming a bank account with a specific savings goal) can significantly increase saving and improve downstream outcomes for consumers.65
World Bank data
suggests a worrying
trend in the form of
declining savings
in Malawi, though
there does appear
to be an increase
in the savings
rate since 2016.
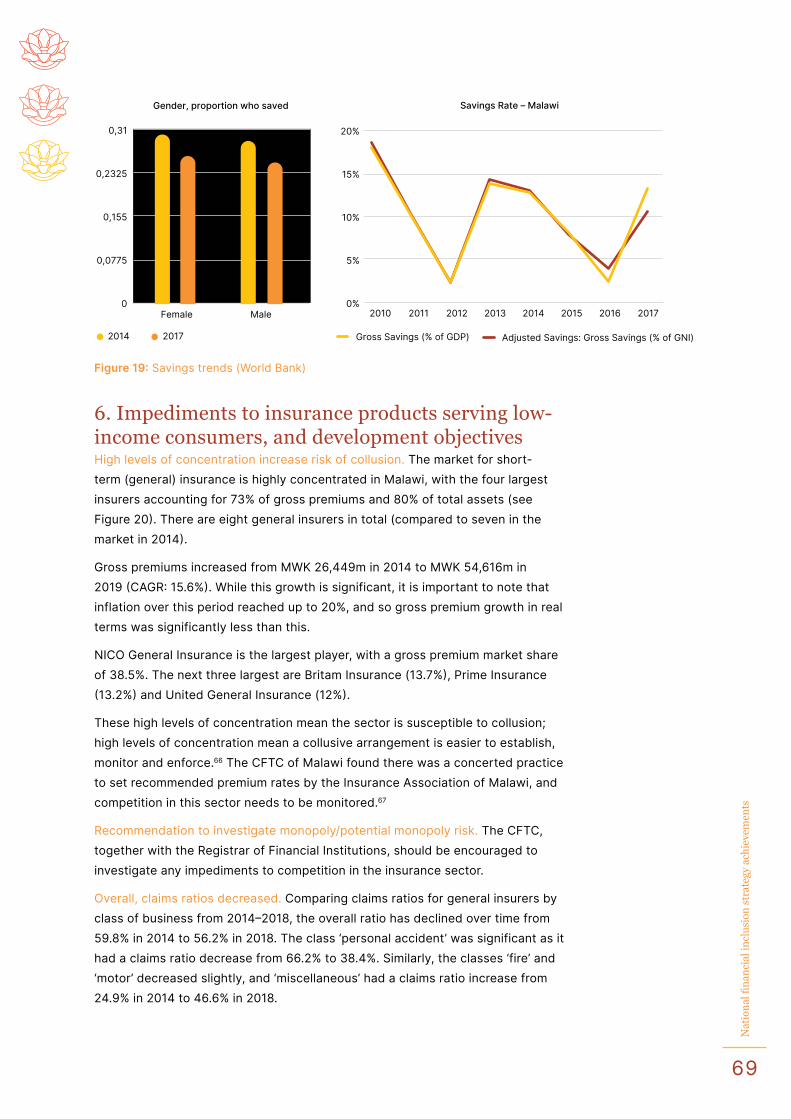
69
Nat
ion
al fi
nan
cial
incl
usi
on s
trat
egy
ach
ieve
men
ts
6. Impediments to insurance products serving low-income consumers, and development objectivesHigh levels of concentration increase risk of collusion. The market for short-term (general) insurance is highly concentrated in Malawi, with the four largest insurers accounting for 73% of gross premiums and 80% of total assets (see Figure 20). There are eight general insurers in total (compared to seven in the market in 2014).
Gross premiums increased from MWK 26,449m in 2014 to MWK 54,616m in 2019 (CAGR: 15.6%). While this growth is significant, it is important to note that inflation over this period reached up to 20%, and so gross premium growth in real terms was significantly less than this.
NICO General Insurance is the largest player, with a gross premium market share of 38.5%. The next three largest are Britam Insurance (13.7%), Prime Insurance (13.2%) and United General Insurance (12%).
These high levels of concentration mean the sector is susceptible to collusion; high levels of concentration mean a collusive arrangement is easier to establish, monitor and enforce.66 The CFTC of Malawi found there was a concerted practice to set recommended premium rates by the Insurance Association of Malawi, and competition in this sector needs to be monitored.67
Recommendation to investigate monopoly/potential monopoly risk. The CFTC, together with the Registrar of Financial Institutions, should be encouraged to investigate any impediments to competition in the insurance sector.
Overall, claims ratios decreased. Comparing claims ratios for general insurers by class of business from 2014–2018, the overall ratio has declined over time from 59.8% in 2014 to 56.2% in 2018. The class ‘personal accident’ was significant as it had a claims ratio decrease from 66.2% to 38.4%. Similarly, the classes ‘fire’ and ‘motor’ decreased slightly, and ‘miscellaneous’ had a claims ratio increase from 24.9% in 2014 to 46.6% in 2018.
Gender, proportion who saved
0
0,0775
0,155
0,2325
0,31
Savings Rate – Malawi
0%
5%
10%
15%
20%
Female Male 2010 2011 2012 2013 2014 2015 2016 2017
Gross Savings (% of GDP) Adjusted Savings: Gross Savings (% of GNI)2014 2017
Figure 19: Savings trends (World Bank)
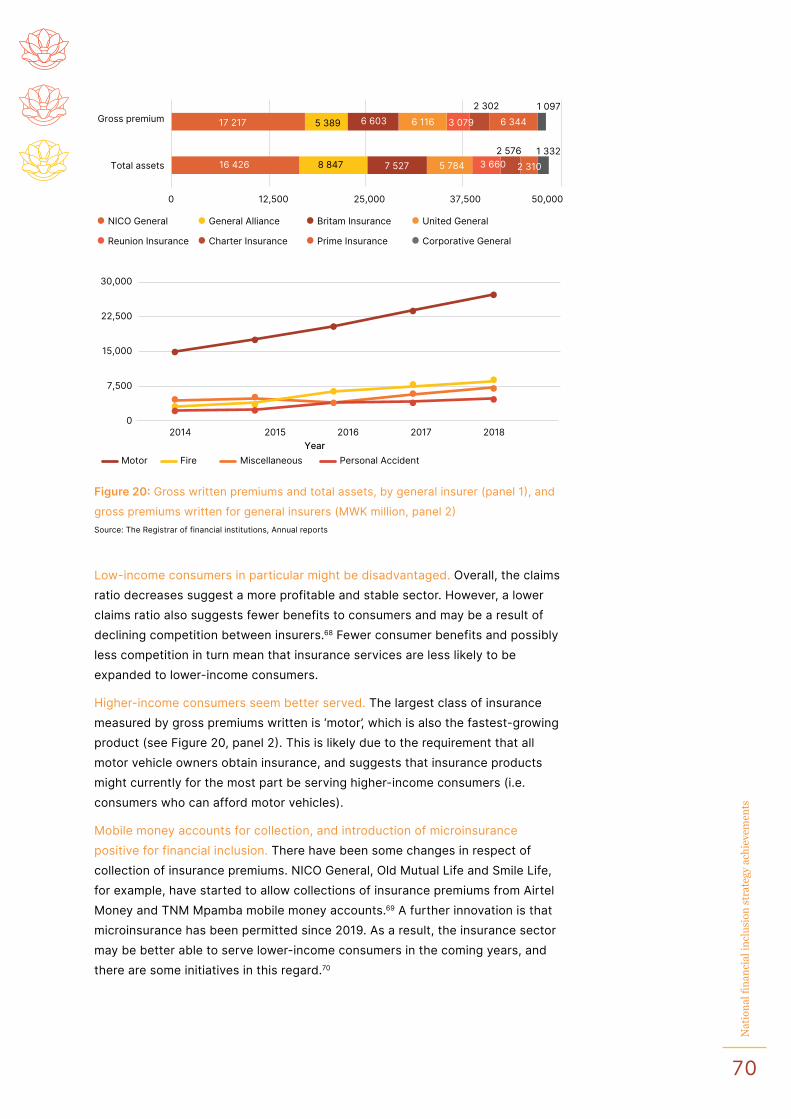
70
Nat
ion
al fi
nan
cial
incl
usi
on s
trat
egy
ach
ieve
men
ts
Low-income consumers in particular might be disadvantaged. Overall, the claims ratio decreases suggest a more profitable and stable sector. However, a lower claims ratio also suggests fewer benefits to consumers and may be a result of declining competition between insurers.68 Fewer consumer benefits and possibly less competition in turn mean that insurance services are less likely to be expanded to lower-income consumers.
Higher-income consumers seem better served. The largest class of insurance measured by gross premiums written is ‘motor’, which is also the fastest-growing product (see Figure 20, panel 2). This is likely due to the requirement that all motor vehicle owners obtain insurance, and suggests that insurance products might currently for the most part be serving higher-income consumers (i.e. consumers who can afford motor vehicles).
Mobile money accounts for collection, and introduction of microinsurance positive for financial inclusion. There have been some changes in respect of collection of insurance premiums. NICO General, Old Mutual Life and Smile Life, for example, have started to allow collections of insurance premiums from Airtel Money and TNM Mpamba mobile money accounts.69 A further innovation is that microinsurance has been permitted since 2019. As a result, the insurance sector may be better able to serve lower-income consumers in the coming years, and there are some initiatives in this regard.70
0 12,500 25,000 37,500 50,000
Gross premium
Total assets1 332
1 097
2 310
6 344
2 576
2 302
3 660
3 079
5 784
6 116
7 527
6 603
8 847
5 389
16 426
17 217
0
7,500
15,000
22,500
30,000
Year2014 2015 2016 2017 2018
Corporative General Prime InsuranceCharter InsuranceReunion Insurance
United General Britam InsuranceGeneral AllianceNICO General
Motor Miscellaneous Personal AccidentFire
Figure 20: Gross written premiums and total assets, by general insurer (panel 1), and
gross premiums written for general insurers (MWK million, panel 2)Source: The Registrar of financial institutions, Annual reports
71
Nat
ion
al fi
nan
cial
incl
usi
on s
trat
egy
ach
ieve
men
ts
Recommendation to monitor product innovations for expanding lower-income consumer markets. New product introductions should be monitored to assess their impact and consider whether there are any further impediments that might be relaxed to expand markets.
Recommendation to review new-agent and new-product delays. In addition to regulatory delays with the approval of insurance agents (discussed earlier in the report), new insurance products too can take months to be approved by the regulator.71 This slows down insurers’ ability to innovate and respond to market dynamics. It is thus necessary to review the processes followed for approving new insurance products.
Recommendation to consider insurer collaboration on fraud register. Insurers currently share information on fraud with one another, at least to some extent. However, one stakeholder interviewed in this MAP refresh project indicated that fraudulent claims can be as high as 30% of the value of claims; and so there may be insufficient cooperation among insurers in relation to fraud. It may be necessary to consider the introduction of a fraud register, on which insurers will collaborate more fully to reduce fraud.
Need for steps to expand insurance sector in Malawi. In sum, while there have been a number of areas of progress in relation to insurance, the sector continues to be relatively small in Malawi; more emphasis is needed on its expansion in the coming years.
Fraudulent claims
can be as high as
30% of the value of
claims. It may be
necessary to consider
the introduction of
a fraud register, on
which insurers will
collaborate more
fully to reduce fraud.
72
Nat
ion
al fi
nan
cial
incl
usi
on s
trat
egy
ach
ieve
men
ts
Summary
Penetration of formal financial services has increased in Malawi
i.e. account ownership and access to a financial service/product.
Thus the country has ahead of time achieved its 2015 MAP/NSFI
objective of increasing financial inclusion from 34% in 2014 to
55% by 2022.
Actual account uptake and usage figures, however, are lower than account ownership figures. For example, there has been an ‘explosion’ in mobile money transaction volumes and value – yet in reality actual usage figures are low, especially for paying for goods and services (e.g. utilities). Given factors such as high bank and mobile money charges as well as reduced banking infrastructure footprint and slow roll-out of agency banking, the country also does not seem on track to achieve the SDG of universal access by 2030.
Monopolistic and collusion tendencies arising from lack of competition between the commercial banks, which potentially discourages the provision of affordable, convenient and appropriate services to consumers, warrant CFTC and RBM attention. Slowness in roll-out of agency banking is attributable to a range of undeniable constraints that need serious attention if the objectives of extending the reach of FSPs and banking infrastructure are to be realised.
The need for increased competition also arises with regard to mobile money services and MNOs; increased competition should serve to reduce providers’ high mark-ups (which seriously impact consumers) while helping bid up agent commissions, which are extremely low.
The insurance industry, too, is in danger of compromising consumer service through collusion among the small number of big players. In terms of facilitating the extension of insurance products to increased numbers of consumers, digitisation of insurance information and development of a fraud register for access by insurers would be helpful. The fact that some insurers have started permitting consumers to pay their insurance premiums from their mobile money accounts (i.e. insurer–MNO partnerships) and the introduction of microinsurance are trends that bode well for improved consumer service in the insurance sector.
3.3
73
Nat
ion
al fi
nan
cial
incl
usi
on s
trat
egy
ach
ieve
men
ts
As government migrates its social cash transfer payments to EFT, the lack of real-time clearing resulting in delays to customers receiving their money plus the problem of high costs of EFTs to banks (due to high interchange fees) and consumers alike can hopefully be addressed.
High fees charged by the country’s credit bureaus to access consumer credit data plus the low quality of such data serve as impediments to FSPs serving consumer credit needs.
Furthermore, while the National ID system in Malawi is a significant achievement, it merits further refinement; it has potential applicability in reducing information asymmetry in assessing credit applications but currently the NRB fees charged to FSPs are high, discouraging provider usage.
Ongoing processes to integrate the NRB and Social Cash Transfer beneficiary register promise improved service to consumers. Given that National IDs can only be issued to citizens aged 16 or more, the age limit might be lowered in order to include children in financial inclusion targets, considering that some households are child-headed. Somewhat related to this, the legislation prohibiting those younger than 18 from opening mobile money accounts also financially excludes a significant proportion of youth and for this reason merits further consideration.
The country’s MFIs and SACCOs face threats to their sustainability, with hefty declines in MFI customer numbers from 2014–2019, although from 2013–2019 SACCO member numbers increased significantly. While these providers are subject to a range of regulatory constraints, they are also in competition with rival digital FSPs. Research suggests the SACCO business model is evolving towards an expanded financial services offering. The viability of MFIs and SACCOs will need to be monitored and weighed up in the coming years to assess whether they are a good fit in terms of affordably, conveniently and appropriately meeting consumer needs.
74
Nat
ion
al fi
nan
cial
incl
usi
on s
trat
egy
ach
ieve
men
ts
PART 3: NOTES1 In addition, the MoFEPD PFSPD has chaired the Access to
Finance, Input and Information TWG under the Trade and Industry Sector Working Group.
2 Authors’ analysis of World Bank Findex.
3 Source: RBM (2018), Financial Literacy and Capability Survey, discussed in MoFEPD, February 2020, ‘Progress Report on Implementation of National Strategy for Financial Inclusion (2016–2020)’.
4 National Payments report, 2019 4th Quarter, RBM.
5 MoFEPD, February 2020, ‘Progress Report on Implementation of National Strategy for Financial Inclusion’.
6 See: https://dfsobservatory.com/content/malawi-government-drops-plans-mobile-money-tax.
7 See: https://www.imf.org/~/media/Files/Publications/CR/2019/1MWIEA2019001.ashx.
8 MFI submission to MAP refresh project.
9 The Registrar of Financial Institutions, Annual Reports for 2014 and 2019.
10 See: https://www.mwnation.com/malawi-banks-in-consolidation-drive/
11 See, for example, Motta, M. (2004). Competition Policy: Theory and Practice. Cambridge University Press.
12 See: https://www.cftc.mw/index.php/2013-12-16-13-35-12/reports/market-inquiry-reports.html
13 The 2015 MAP report explains that bank agents had only recently been launched. See also ‘Progress Report on Implementation of National Strategy for Financial Inclusion (2016–2020)’, MoFEPD, February 2020.
14 Submission to MAP refresh project by a bank.
15 Report prepared by C12 consultants for MoFEPD and GIZ, titled Mapping of Microfinance Services in Malawi, and dated June 2017.
16 FinMark Trust (2020). South Africa to the Rest of SADC Remittance Pricing Report, available at: http://finmark.org.za/wp-content/uploads/2020/05/FMT_SADC_pricing_report_CB4_10052020.pdf.
17 See report prepared by C12 consultants for MoFEPD and GIZ, cited above.
18 Submission to MAP refresh project by a bank.
19 Submission to MAP refresh project by an MFI.
20 IMF, December 2019, ‘Malawi Second and third Reviews under the three year extended credit facility arrangement and requests for waivers of nonobservance of performance criteria and augmentation of access—Press Release; Staff Report; and statement by the Executive Director For Malawi’ IMF Country Report No. 19/361.
21 World Bank (2020). ‘Doing Business 2020, Economy profile: Malawi’, available at: https://www.doingbusiness.org/content/dam/doingBusiness/country/m/malawi/MWI.pdf
22 Submission to MAP refresh project by an MFI.
23 Submission to MAP refresh project by an MFI.
24 According to a financial cooperative and various MFIs.
25 Submission to MAP refresh project by an MFI and a bank.
26 Submission to MAP refresh project by an MFI.
27 According to the bankers’ association.
28 Submission to MAP refresh project by an MFI. There are approximately 12,000 child-headed households in Malawi, see: https://www.unicef.org/malawi/media/1156/file/Children’s%20Corner%20Review%20Report%202018.pdf
29 According to an MFI, the relaxation of KYC for ‘lower cadres’ has helped a number of Malawians to be banked, as a letter from the chief used to be one of the requirements.
30 National Payments report, 2019 4th Quarter, RBM.
31 The National Payments report, August 2015, reports that in July 2015, there were 2m mobile money users. According to World Bank World Development Indicators, 55% of the 16.7m in Malawi in 2015 were aged 15 or older, or 9.2m; 2m mobile money users divided by 9.2m people 15 years or older results in a mobile money penetration rate of 22% in 2015.
32 This is sourced from the RBM. There appear to have been changes in definitions prior to 2018, since the values do not appear to be comparable between the 2018/2019 and prior periods.
33 The very high levels of airtime top-up transactions are reflective of an important driver for mobile operators to offer mobile money, and that is to reduce the cost of commissions to airtime resellers.
34 See: https://www.gsma.com/sotir/wp-content/uploads/2020/03/GSMA-State-of-the-Industry-Report-on-Mobile-Money-2019-Full-Report.pdf
35 Economides, N., & Jeziorski, P. (2017). Mobile money in Tanzania. Marketing Science, 36(6), 815–837.
36 Aggarwal, S., Brailovskaya, V., & Robinson, J. (2020). Cashing In (and Out): Experimental Evidence on the Effects of Mobile Money in Malawi. Forthcoming, AEA Papers and Proceedings.
37 See also: https://socialprotection.org/discover/blog/manual-digital-first-hand-insight-malawi%E2%80%99s-social-cash-transfer
38 Interview with government stakeholder.
39 See: https://www.airtel.mw/airtelmoney/transaction_fees and TNM Mpamba customer fees.
40 Aggarwal, S., Brailovskaya, V., & Robinson, J. (2020). Cashing In (and Out): Experimental Evidence on the Effects of Mobile Money in Malawi. Forthcoming, AEA Papers and Proceedings.
41 See: https://www.safaricom.co.ke/personal/m-pesa/getting-started/m-pesa-rates
42 This was documented, for instance, in a UNCDF report: UNCDF (2017). Digital Financial Services Price Transparency and Awareness in Malawi. Available at: https://www.uncdf.org/article/2942/digital-financial-services-price-transparency-and-awareness-in-malawi
43 See, for example, the written submission from MUSSCO to the MAP refresh.
44 See: World Bank: https://data.worldbank.org/indicator/BX.TRF.PWKR.DT.GD.ZS?locations=MW
45 FinMark Trust (2020). South Africa to the Rest of SADC Remittance Pricing Report, available at: http://finmark.org.za/wp-content/uploads/2020/05/FMT_SADC_pricing_report_CB4_10052020.pdf.
46 See MoFEPD NSFI Progress Report, cited above.
47 See RBM, Financial Institutions Supervision Report 2019, available at: https://www.rbm.mw/
48 See RBM, Financial Institutions Supervision Report 2019, available at: https://www.rbm.mw/
49 Interview with an MFI.
50 Statistics provided by an industry association.
51 See RBM, Financial Institutions Supervision Report 2019, available at: https://www.rbm.mw/
52 MUSSCO submission to MAP refresh project.
75
Nat
ion
al fi
nan
cial
incl
usi
on s
trat
egy
ach
ieve
men
ts
53 See World Bank (2019). Implementation Completion and Results Report (Ida-48970) on a Credit in the Amount of Sdr 18.1 Million (US$28.2 Million Equivalent) to the Republic Of Malawi Ministry of Finance, Economy and Development for the Malawi - Financial Sector Technical Assistance Project (P122616). Available at: http://documents.worldbank.org/curated/en/608041560195381124/pdf/Malawi-Financial-Sector-Technical-Assistance-Project.pdf
54 MFI submission to MAP refresh project.
55 MFI submissions to MAP refresh project, and submission by an industry body.
56 MUSSCO submission to MAP refresh project.
57 MFI submission to MAP refresh project.
58 MUSSCO submission to MAP refresh project.
59 Submissions to MAP refresh project by MFIs.
60 MFI submission to MAP refresh project.
61 MFI submission to MAP refresh project.
62 Integrated Household Survey 2016–2017 (National Statistics Office). The IHS refers to a ‘Village Bank’, which we consider means VSLA.
63 According to the World Bank: Gross savings are calculated as gross national income less total consumption, plus net transfers. Gross savings represent the difference between disposable income and consumption and replace gross domestic savings,
a concept used by the World Bank and included in World Development Indicators editions before 2006. The change was made in order to conform to SNA concepts and definitions. See: https://data.worldbank.org/indicator/NY.GNS.ICTR.ZS?locations=MW
64 Heer, B., & Süssmuth, B. (2009). The Savings-inflation Puzzle. Applied Economics Letters, 16(6): 615–617.
65 Aggarwal, S., Brailovskaya, V., & Robinson, J. (2020). Saving for Multiple Financial Needs: Evidence from Lockboxes and Mobile Money in Malawi (No. w27035). National Bureau of Economic Research.
66 See, for example, Motta, M. (2004). Competition Policy: Theory and Practice. Cambridge University Press.
67 See: https://www.cftc.mw/index.php/2013-12-16-09-56-37/board-decisions-over-cases/anti-competitive-business-conduct/139-alleged-price-fixing-by-the-insurance-association-of-malawi.html
68 Everything else being equal, more competition would result in lower premiums for the same level of benefits (claims), which should result in a higher claims ratio.
69 See MoFEPD NSFI implementation update, February 2020, cited above.
70 See, for example, https://www.imcworldwide.com/wp-content/uploads/2018/11/Micro-Insurance-MOST-Programme.pdf
71 Submission to MAP refresh project by an insurer.
Economic sectors that can drive growth and employment
4
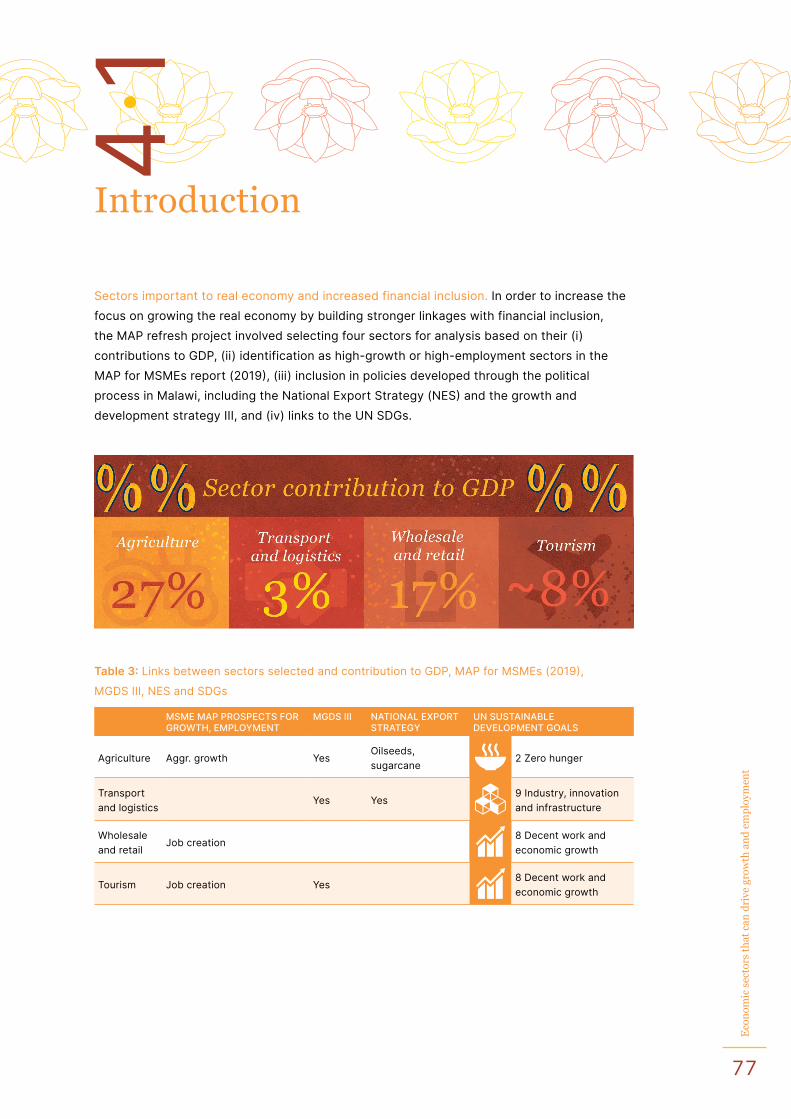
77
Eco
nom
ic s
ecto
rs t
hat
can
dri
ve g
row
th a
nd
em
plo
ymen
t
Introduction
Sectors important to real economy and increased financial inclusion. In order to increase the focus on growing the real economy by building stronger linkages with financial inclusion, the MAP refresh project involved selecting four sectors for analysis based on their (i) contributions to GDP, (ii) identification as high-growth or high-employment sectors in the MAP for MSMEs report (2019), (iii) inclusion in policies developed through the political process in Malawi, including the National Export Strategy (NES) and the growth and development strategy III, and (iv) links to the UN SDGs.
Table 3: Links between sectors selected and contribution to GDP, MAP for MSMEs (2019),
MGDS III, NES and SDGs
MSME MAP PROSPECTS FOR GROWTH, EMPLOYMENT
MGDS III NATIONAL EXPORT STRATEGY
UN SUSTAINABLE DEVELOPMENT GOALS
Agriculture Aggr. growth YesOilseeds, sugarcane
2 Zero hunger
Transport and logistics
Yes Yes9 Industry, innovation and infrastructure
Wholesale and retail
Job creation 8 Decent work and economic growth
Tourism Job creation Yes8 Decent work and economic growth
4.1
78
Eco
nom
ic s
ecto
rs t
hat
can
dri
ve g
row
th a
nd
em
plo
ymen
t
Agriculture
1. BackgroundAgricultural sector is key. Agriculture plays an important role in the economy of Malawi, accounting for approximately 27% of GDP (see Figure 2, in section 2.1), 65% of employment and 63% of export earnings in 2015.1 Donors to Malawi have invested significantly in agricultural productivity, though with limited results.2
Cash-crop tobacco industry – not diversified food crops – dominates sector. Crop production makes up approximately 80% of agricultural production value, with livestock and fisheries making up 10% and 4% respectively. Crop production can be divided into two key categories: food crops and cash crops. Food crops are dominated by maize, which accounts for 50% of the planted area, as well as cassava, potato, rice, beans and vegetables. Cash crops include tobacco, sugarcane, cotton tea, coffee, soybeans and oilseeds.
The Malawian economy relies heavily on the tobacco industry, which dominates the agricultural sector. Thus, a large proportion of land and labour supply are directed toward the tobacco industry, instead of diversified agricultural food crops that could play a role in decreasing nutrition insecurity.3
Focus on agricultural value chain development is key to increasing financial inclusion. In terms of market structure, Malawi has two types of farming sub-sectors: smallholders that farm on communal land, and estates farming on leasehold and freehold land.4
It is important to note the significant levels of donor activity and numerous donor-funded programmes in Malawi targeted at agriculture; this is an additional area of dynamics to be taken into account in assessment of the sector and future agricultural sector interventions to increase financial inclusion. For example, in terms of agricultural commodity inputs, there are various initiatives and programmes aimed at providing aid to farmers through physical inputs,5 financial means,6 training and/or education.7
The development of the agricultural value chain is an important focus area in this MAP refresh, and there are a number of areas in which financial inclusion can play a role (discussed in more detail in Section 6).
4.2
The Malawian
economy relies
heavily on the
tobacco industry,
which dominates
the agricultural
sector. Thus, a large
proportion of land
and labour supply
are directed toward
the tobacco industry.
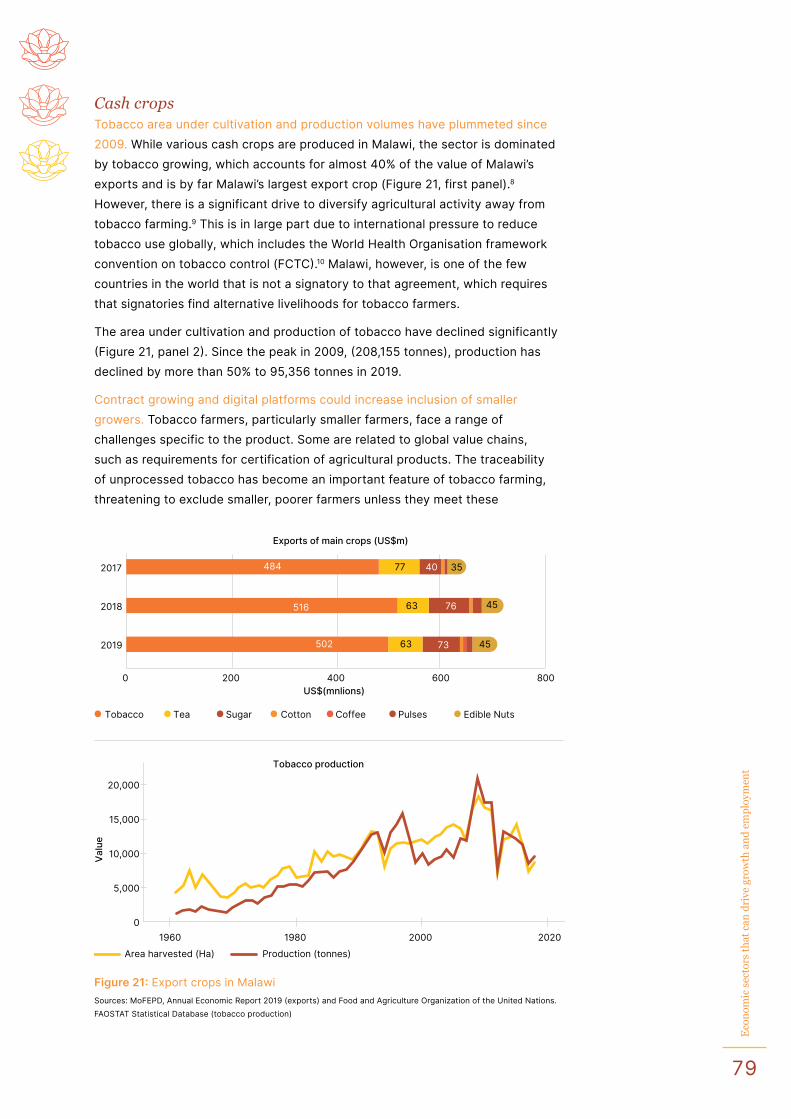
79
Eco
nom
ic s
ecto
rs t
hat
can
dri
ve g
row
th a
nd
em
plo
ymen
t
Cash cropsTobacco area under cultivation and production volumes have plummeted since 2009. While various cash crops are produced in Malawi, the sector is dominated by tobacco growing, which accounts for almost 40% of the value of Malawi’s exports and is by far Malawi’s largest export crop (Figure 21, first panel).8 However, there is a significant drive to diversify agricultural activity away from tobacco farming.9 This is in large part due to international pressure to reduce tobacco use globally, which includes the World Health Organisation framework convention on tobacco control (FCTC).10 Malawi, however, is one of the few countries in the world that is not a signatory to that agreement, which requires that signatories find alternative livelihoods for tobacco farmers.
The area under cultivation and production of tobacco have declined significantly (Figure 21, panel 2). Since the peak in 2009, (208,155 tonnes), production has declined by more than 50% to 95,356 tonnes in 2019.
Contract growing and digital platforms could increase inclusion of smaller growers. Tobacco farmers, particularly smaller farmers, face a range of challenges specific to the product. Some are related to global value chains, such as requirements for certification of agricultural products. The traceability of unprocessed tobacco has become an important feature of tobacco farming, threatening to exclude smaller, poorer farmers unless they meet these
Exports of main crops (US$m)
Tobacco production
Valu
e
US$(mnlions)0 200 400 600 800
2017
2018
2019
5,000
1960 1980Area harvested (Ha) Production (tonnes)
2000 20200
10,000
15,000
20,000
457363502
457663516
354077484
Tobacco Tea Sugar Cotton Coffee Pulses Edible Nuts
Figure 21: Export crops in MalawiSources: MoFEPD, Annual Economic Report 2019 (exports) and Food and Agriculture Organization of the United Nations. FAOSTAT Statistical Database (tobacco production)
80
Eco
nom
ic s
ecto
rs t
hat
can
dri
ve g
row
th a
nd
em
plo
ymen
t
requirements. One of the means of inclusion is through contract growing.11 Contract growing could be further improved upon by providing greater transparency to farmers (such as in respect of interest rates on loans for inputs etc.) via digital platforms or marketplaces.
Opening up buying and processing stages of value chain to more players could improve competition, improve profitability. An additional challenge is to some extent linked to competition concerns in downstream processing of agricultural commodities.12 Two tobacco leaf companies in Malawi, Alliance One Tobacco and Limbe Leaf Tobacco, accounted for between 60% and 70% of leaf purchases in Malawi at least in the 2012 period.13 Historically, a cartel operated in the buying of unprocessed tobacco.14 To the extent that buying of tobacco is not competitive, prices (and potentially incomes) received by farmers are likely to be lower.
Recommendation for investors to consider sponsoring entry. Thus, there may be a role for investors to consider sponsoring entry into the downstream components of the agricultural value chain in Malawi, including in respect of the buying and processing of agricultural commodities.
Developing alternative crop supply chains could improve farmer livelihoods. Tobacco farmers believe that tobacco farming is a lucrative enterprise. However, in reality, the costs of production are very high due to the high intensity of labour required in the production process. A significant proportion of tobacco farmers grow tobacco because they think it is the only viable crop. At the same time, farmers report not being satisfied with the prices they received on the auction floors. 15 There is, therefore, a need to develop the supply chains of crops that have high potential to provide alternative livelihoods for tobacco farmers, such as soybean and birds’ eye chillies. 16
Recommendation to consider funding of agricultural diversification. The funding of interventions, particularly commercial interventions to assist tobacco growers to diversify into alternative crops, should be considered. For example, Alliance One, through its subsidiary, Pyxus Agriculture, as well as Limbe Leaf, are supporting the growing of groundnuts by their tobacco farmers.
Financing key to agricultural diversification. From a policy perspective, Malawi has been focused on diversification of export products or cash crops. For example, Malawi’s export promotion strategy considers the main agriculture opportunities in oilseeds, nuts, tea and sugarcane, with an emphasis of promoting value addition through agro-processing.17 MSME financing in this sector may play an important role in the development of this value chain.
Participation in regional value chains has potential for financial innovation and farmer benefits. A further opportunity that exists may be linked to regional value chains in agricultural production. For instance, there are no tariffs on products such as edible oils between COMESA countries, including Malawi, which may assist to bring about greater food security.18 There may be an opportunity to extend these gains through the African Continental Free Trade Area (AfCFTA) treaty, which entered into force on 30 May 2019 and provides for the elimination
There is a need
to develop the
supply chains of
crops that have
high potential to
provide alternative
livelihoods for
tobacco farmers,
such as soybean and
birds’ eye chillies.
81
Eco
nom
ic s
ecto
rs t
hat
can
dri
ve g
row
th a
nd
em
plo
ymen
t
of tariffs on 90% of tariff lines in respect of trade between countries participating in the agreement. The reduction in regional trade barriers may help support the development of regional agricultural and food value chains. There are regional value chain bodies that Malawi may wish to participate in, including a private sector body called the Southern African Grain Network (SAGNET), and the Regional Network of Agricultural Policy Research Institutes (ReNAPRI). Participation in these bodies may help support Malawi’s integration with regional agricultural value chains and the development of innovative financial solutions for farmers in Malawi.
Recommendation to consider opportunities to promote agricultural diversification and digitalise value chains. Thus, there may be opportunities, including through donor funding, to facilitate the promotion of the diversification away from tobacco products, for example, by providing loans to farmers to switch to new commodities by digitalising value chains.
Food cropsStrong dependence on maize growing has dietary and profitability implications. Food crops play an integral role in Malawi in ensuring food security. Crops produced include maize, cassava, potato, peas, beans, groundnuts and bananas, among others. The key issue identified with farming for food crops in Malawi is a strong dependence on maize, which makes up 50% of planted area. There is strong support for maize farming but there are also concerns that this has led to limited dietary diversity. A further concern is a high level of monocropping, which reduces agricultural productivity and increases farmer risk. Smallholder farmers have been shown to all more or less farm the same crops, which tends to cause saturation in the markets in their locality and depress prices during harvesting season, thereby preventing full recovery of farmers’ productions costs.19 20
2. Challenges facing farmersKey farmer challenges are worsening financial exclusion. Farmers in Malawi face a range of challenges. However, key issues from a financial inclusion perspective include challenges as a result of poor infrastructure (financial and otherwise), risks including price volatility and shocks, and access to finance for growth and development, each of which is assessed below.
Food price volatility and price dispersionPoor storage and trade options likely exacerbate price volatility. Food price volatility is an important consideration for farmers (see Figure 22).21 There are significant seasonal variations in prices, which are to be expected. However, the substantial price increases for different commodities, such as for cassava in the first quarter of 2015 and groundnuts in 2016, suggest there may be important market frictions that prevent storage and trade to smooth price increases.
The key issue
identified with
farming for food
crops in Malawi is a
strong dependence
on maize, which
makes up 50% of
planted area.
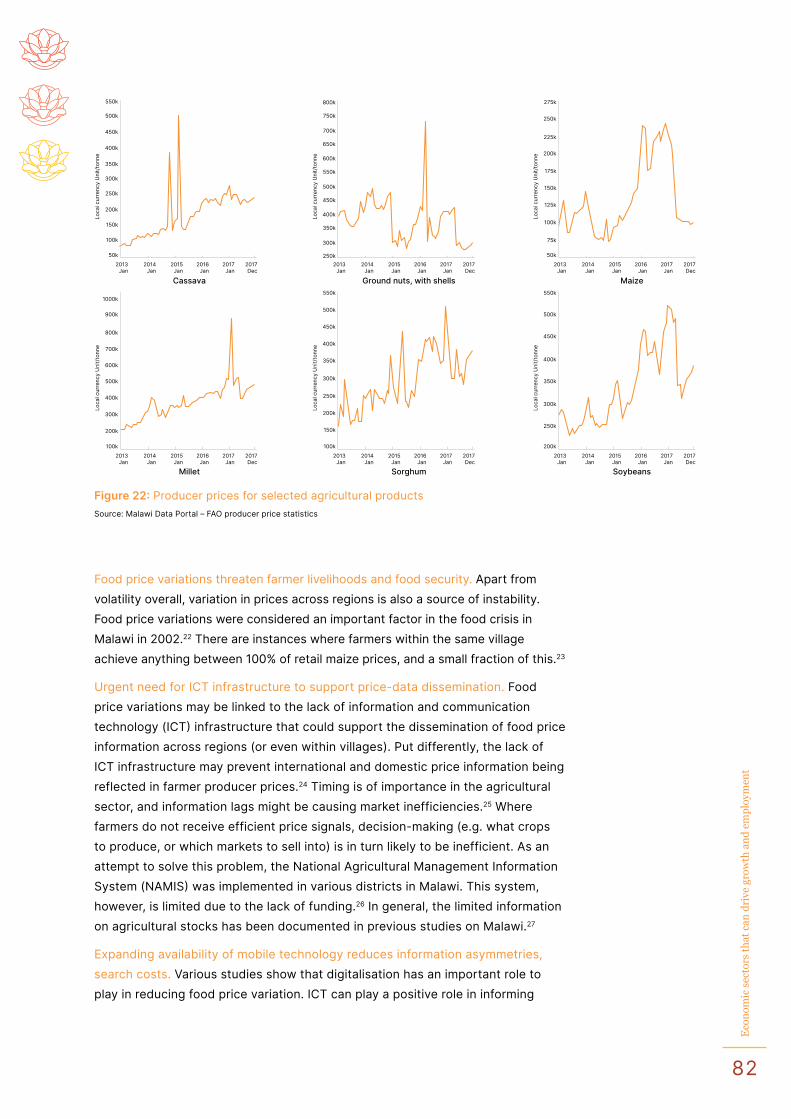
82
Eco
nom
ic s
ecto
rs t
hat
can
dri
ve g
row
th a
nd
em
plo
ymen
t
Food price variations threaten farmer livelihoods and food security. Apart from volatility overall, variation in prices across regions is also a source of instability. Food price variations were considered an important factor in the food crisis in Malawi in 2002.22 There are instances where farmers within the same village achieve anything between 100% of retail maize prices, and a small fraction of this.23
Urgent need for ICT infrastructure to support price-data dissemination. Food price variations may be linked to the lack of information and communication technology (ICT) infrastructure that could support the dissemination of food price information across regions (or even within villages). Put differently, the lack of ICT infrastructure may prevent international and domestic price information being reflected in farmer producer prices.24 Timing is of importance in the agricultural sector, and information lags might be causing market inefficiencies.25 Where farmers do not receive efficient price signals, decision-making (e.g. what crops to produce, or which markets to sell into) is in turn likely to be inefficient. As an attempt to solve this problem, the National Agricultural Management Information System (NAMIS) was implemented in various districts in Malawi. This system, however, is limited due to the lack of funding.26 In general, the limited information on agricultural stocks has been documented in previous studies on Malawi.27
Expanding availability of mobile technology reduces information asymmetries, search costs. Various studies show that digitalisation has an important role to play in reducing food price variation. ICT can play a positive role in informing
2013Jan
50k
75k
100k
125k
Loca
l cur
renc
y U
nit/
tonn
e
175k
150k
200k
225k
250k
275k
2014Jan
2015Jan
2016Jan
2017Jan
2017Dec
2013Jan
250k
300k
350k
Loca
l cur
renc
y U
nit/
tonn
e
400k
450k
500k
550k
600k
650k
700k
750k
800k
2014Jan
2015Jan
2016Jan
2017Jan
2017Dec
2013Jan
50k
100k
150k
200k
Loca
l cur
renc
y U
nit/
tonn
e
250k
300k
350k
400k
450k
500k
550k
2014Jan
2015Jan
2016Jan
2017Jan
2017Dec
2013Jan
200k
250k
300k
350k
Loca
l cur
renc
y U
nit/
tonn
e
400k
450k
500k
550k
2014Jan
2015Jan
2016Jan
2017Jan
2017Dec
2013Jan
100k
150k
200k
250k
Loca
l cur
renc
y U
nit/
tonn
e
300k
350k
500k
550k
400k
450k
2014Jan
2015Jan
2016Jan
2017Jan
2017Dec
2013Jan
100k
200k
300k
500k
Loca
l cur
renc
y U
nit/
tonn
e
400k
600k
900k
800k
700k
1000k
2014Jan
2015Jan
2016Jan
2017Jan
2017Dec
Cassava Ground nuts, with shells Maize
Millet Sorghum Soybeans
Figure 22: Producer prices for selected agricultural productsSource: Malawi Data Portal – FAO producer price statistics
83
Eco
nom
ic s
ecto
rs t
hat
can
dri
ve g
row
th a
nd
em
plo
ymen
t
farmers and buyers on what crops to produce and what markets to sell into or buy from by reducing information asymmetries (i.e. making information available to all market participants) and reducing search costs (the costs involved in visiting different regions to find market information, such as on prices).
For example, Aker (2010) shows that the introduction of mobile phones in Niger resulted in a reduction in food price dispersion (or variation between food prices) of between 10% and 16% between 2001 and 2006.28 This effect is stronger where higher transport costs increase the costs of gathering information on which market to sell into or buy from in the absence of real-time digital information (since the alternative would by physical travel with resultant costs).
More widely available mobile technology especially supportive for fresh produce producers. Jensen (2007) similarly found substantial reductions in price dispersion as a result of increased mobile coverage in markets for fish in the state of Kerala in India.29 The study showed that producers and consumers alike benefit from greater mobile coverage, particularly for fresh produce such as fish. Making mobile technology available more widely assists producers of fresh products in particular.
Recommendation to evaluate impact of warehousing, capital markets legislation, consider digital alternatives. Commodity exchanges are another means of smoothing price volatility. In this regard, there are two commodity exchanges in Malawi: the Agricultural Commodity Exchange (ACE) and the Auction Holdings Commodity Exchange (AHCE). The latter is mainly supported by government while the former is donor-funded. The long-term sustainability of both are in question.30
Furthermore, it would seem to make sense to evaluate the impact of interventions such as the Warehouse Receipts Act and the Capital Markets Development Act, to ascertain whether warehousing and commodity exchanges are working well to support agricultural markets, including by reducing price volatility. Alternative digital marketplaces may be needed (similar to M-Farm in Kenya or M-Lamu in Senegal).
Recommendation for development of digital products/platforms, marketplaces, services for farmers. Clearly, making mobile technology available more widely improves food security and benefits farmers. MNOs and FSPs could consider developing products or platforms that focus on supplying information on fresh produce in particular, such as fish, or information such as agricultural input prices. They could also consider collaborating to provide microcredit, credit for inputs and so on. Entirely digital marketplaces could even be developed.31
Poor infrastructure Poor physical and banking infrastructure exacerbate price volatility. Farmers are limited by poor road and banking infrastructure, especially in rural areas.32 The poor existing infrastructure delays the delivery of resources to farmers in rural areas, while preventing improvements and developments for parties in
Producers and
consumers alike
benefit from greater
mobile coverage,
particularly for fresh
produce such as
fish. Making mobile
technology available
more widely
assists producers
of fresh products.
84
Eco
nom
ic s
ecto
rs t
hat
can
dri
ve g
row
th a
nd
em
plo
ymen
t
agricultural value chains. Given these challenges, it is difficult for institutions and organisations to connect with farmers in deep rural areas. Furthermore, poor infrastructure makes it difficult and costly to set up warehouses and to safely store commodities for future transactions and trade, as it is challenging to find a location that is not only accessible but within reasonable proximity to the farmers. This also exacerbates price volatility.
Poor physical and banking infrastructure also blocking uptake of mobile money. In addition, poor infrastructure may be preventing the availability and uptake of mobile money because liquidity and technical assistance, if required, cannot be provided in a timely manner. The majority of the transactions involved in supporting farmers are made via cash or cheques, with very little transacted through mobile money; this arises from the issue of limited liquidity, minimum incentives to digitalise transactions and poor connectivity issues experienced by farmers and residents in the rural areas.33
Financing of farming inputs Loans, savings most common. Farming inputs can be financed through various means, the most common of which are loans or savings. In Malawi, some financing also occurs through subsidies or structured programmes.
FISP is key intervention in the sector – but with limited success. The Farm Input Subsidy Programme (FISP) in Malawi, which started in 2005, has an emphasis on maize and food products and provides assistance to farmers in purchasing input products such as fertiliser and seeds.34 In the 2018/2019 growing season, the FISP targeted a total of 1m farmers. The FISP is an important means of support to smaller farmers in particular. However, there are questions as to whether it could be more effective. A review of this programme in 2017 identified that better beneficiary targeting could increase maize production and food expenditure, albeit marginally.35 FISP input vouchers also go disproportionately to districts in Malawi where there is less efficient production. Furthermore, increasing the availability of support for maize production results in an increase in monocropping,36 resulting in greater risk for farmers (though support is being adapted to also provide other seeds). According to a recent IMF report on Malawi, reforms are being implemented to better target beneficiaries in Malawi.37
Recommendation to improve agricultural sector data in general, and on FISP beneficiaries in particular. Thus, better targeting of FISP recipients is needed while being supported by better data. This further reinforces the need for better data in the agricultural sector, whether it be in relation to crop estimates or beneficiary targeting (including using spatial data on ecological zones).
Farmer education needed on integrated production contracts with buyers. There are gaps in respect of support for agricultural inputs left by the government’s support of food crops such as maize, legumes and groundnuts in circumstances where Malawi’s main export crops include tobacco, tea and sugar. However, for tobacco at least, the Integrated Production System (IPS), which involves agreements between producers and leaf buyers, now includes most smallholder
Increasing the
availability of
support for maize
production results
in an increase in
monocropping,
resulting in greater
risk for farmers.
85
Eco
nom
ic s
ecto
rs t
hat
can
dri
ve g
row
th a
nd
em
plo
ymen
t
farmers, who are able to borrow in order to fund inputs.38 However, there is a need for greater understanding among growers as to how these contracts work in practice.
Farmer illiteracy levels impede uptake of financial products to point of commercial viability. There are also important links between farming inputs, loan financing39 40 and trading platforms where commodities are sold, with commodity exchanges nonetheless linked to agriculture finance initiatives. For instance, the MOST programme in Malawi introduced a pilot project to provide Incentive Based Contract Farming (ICBF), which allowed farmers with a track record of selling on ACE to obtain input packages that are repaid by selling their harvests on ACE.41 However, the programme was not yet self-sustaining as at 2018. Overall, high levels of illiteracy makes it challenging for financial products to be commercially viable.42
Given ubiquity of agri-support programmes, FSPs might piggyback on, supplement existing financing. There is potentially a role for FSPs to enhance the provision of finance to farmers for inputs to supplement existing programmes, particularly if digital innovation is better used, as discussed below.
The role of digital innovationRecommended role for credit reference bureaus in product innovation, including digital. There is a concern overall in Malawi that it is difficult to obtain credit risk information on smaller borrowers, including smaller farmers, not least because information from the credit reference bureaus is costly.43 In order to remedy this, the credit reference bureaus could consider developing products targeted at small loan amounts, enabling good-quality risk reports but at a lower, entry-level price. In addition, digital innovations may provide a solution for some of these concerns. There are a number of digital innovations that have been used in other countries to address this.44
Recommendation that FSPs try emulating success of asset-based financing solutions. In Malawi, the One Acre Fund launched its asset-based financing solution in 2017. This service lends agricultural inputs to farmers and allows repayments on any schedule selected by the farmer, provided that the loan is repaid by harvest time. The One Acre Fund estimates that its services have resulted in double the yields of participants.45 Thus, innovative asset-backed financing (providing farming inputs rather than cash) appears to be having an impact, and this success may be replicated by other FSPs.
Fingerprinting/other digital biometric system (e.g. voice imprint) potentially smart strategy for credit-risk reduction. Digital innovation may provide other means of reducing credit risk. Economic research from 2012 considers how the use of fingerprints could affect farmer-borrowers’ behaviour in relation to credit.46
While the introduction of fingerprinting was found not to have an effect on the rate of loan approval or actual take-ups of loans, where fingerprints were taken the riskiest borrowers’ repayment rates improved dramatically, due to voluntarily choosing smaller loan amounts (or not taking out a loan at all) as well as devoting
There is potentially
a role for FSPs
to enhance the
provision of
finance to farmers
for inputs to
supplement existing
programmes,
particularly if
digital innovation
is better used.
86
Eco
nom
ic s
ecto
rs t
hat
can
dri
ve g
row
th a
nd
em
plo
ymen
t
more of the loan to agricultural inputs – and thus to the crops,47 income from which was used for repayments to ensure future access to credits. Borrowers with the highest probability of crop success took out higher loans but never diverted inputs.48 The introduction of fingerprints increased the repayment rates as farmers wanted to maintain the possibility of future credits. Results indicated that fingerprinted borrowers had lower outstanding balances, higher fractions paid, and were more likely to fully pay on time.
Recommendation to consider investing in borrower biometric verification. By reducing risk for lenders, biometric verification can also reduce interest rates for borrowers. Results of the 2012 study suggest adopting fingerprinting helped improve the functioning of the credit market (reducing information asymmetry; a cost-benefit analysis suggests it is worthwhile implementing the fingerprinting or other biometric system.49 The 2012 experiment indicates a possible strategy for simultaneously increasing levels of financial inclusion and benefiting credit providers.
FSPs should consider means of encouraging repeat borrowers. Strategies could include, for example, offering products where there is no penalty on early loan repayments, or if a larger amount is repaid on the monthly repayments. This can encourage many to finish repaying an existing loan in order to get a loan in the future.
Recommendation that FSPs consider flexible rates and charges tailored to farming seasonality, based on changing crop and weather data. Additionally, FSPs should consider flexible interest rates and bank charges that follow the seasonality of farming – e.g. lower interest rates during the dry season or during floods – and these should be tailored to the specific goods being farmed (where there is good data showing a higher probability of crop success, interest rates can be lower).
Decline in savings for agricultureDrop in rate of saving among women, non-youths (2014–2017). Savings are another potential source of financing agricultural purchases. But there was a decrease in the proportion of women and non-youths (aged 25+) saving for agricultural or business purposes between 2014 and 2017 (see Figure 23). This is despite the fact that the number of women working in the agricultural industry is just less than double the number of men.50 This decline in savings for business activities is in line with the decline overall in savings in Malawi (discussed in Section 3.8).
Given the level and range of efforts to improve livelihoods in the agricultural sector, the overall decline in savings is surprising. At the same time, as mentioned above, the key intervention in this sector (the FISP) has met with only limited success. While the RBM has sought to license additional FSPs in this sector, including community SACCOs, progress has been slow, and a potential intervention here is to allow a greater degree of self-regulation and mentorship by industry associations in order to develop this area (as discussed in Section 4.2.4). This may in part explain the lack of savings for agricultural businesses overall.
The introduction
of fingerprints
increased the
repayment rates
as farmers wanted
to maintain the
possibility of
future credits.
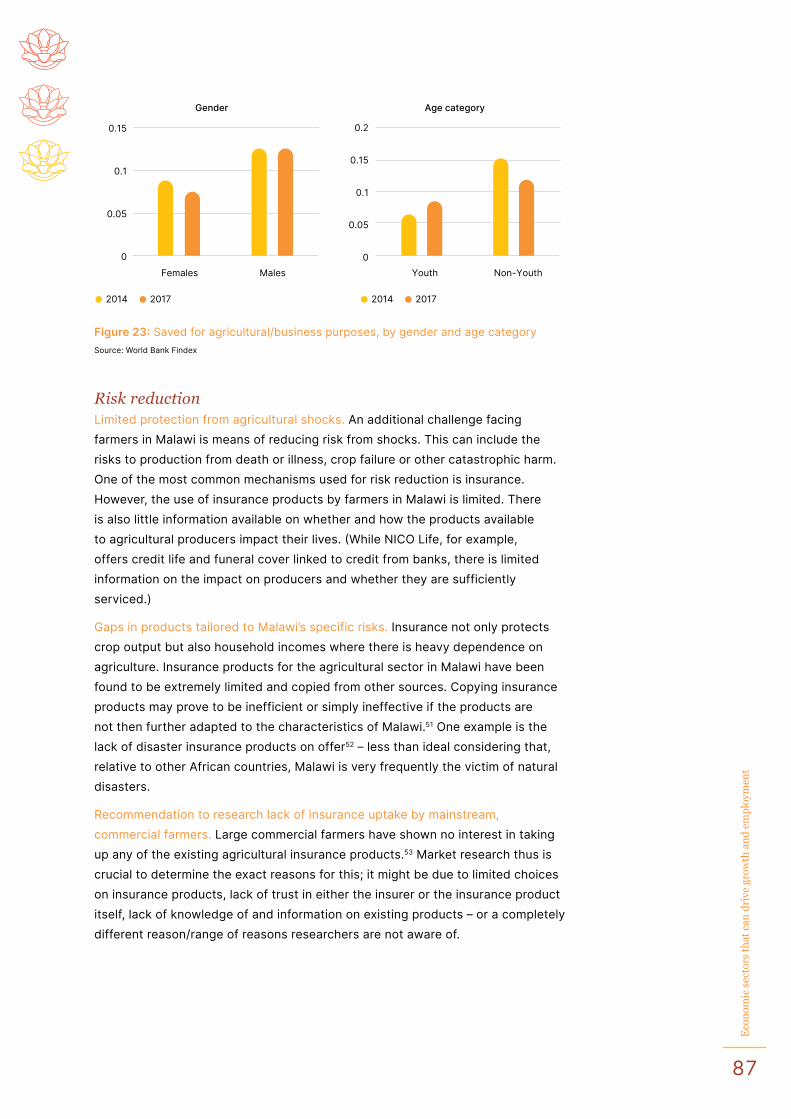
87
Eco
nom
ic s
ecto
rs t
hat
can
dri
ve g
row
th a
nd
em
plo
ymen
t
Risk reductionLimited protection from agricultural shocks. An additional challenge facing farmers in Malawi is means of reducing risk from shocks. This can include the risks to production from death or illness, crop failure or other catastrophic harm. One of the most common mechanisms used for risk reduction is insurance. However, the use of insurance products by farmers in Malawi is limited. There is also little information available on whether and how the products available to agricultural producers impact their lives. (While NICO Life, for example, offers credit life and funeral cover linked to credit from banks, there is limited information on the impact on producers and whether they are sufficiently serviced.)
Gaps in products tailored to Malawi’s specific risks. Insurance not only protects crop output but also household incomes where there is heavy dependence on agriculture. Insurance products for the agricultural sector in Malawi have been found to be extremely limited and copied from other sources. Copying insurance products may prove to be inefficient or simply ineffective if the products are not then further adapted to the characteristics of Malawi.51 One example is the lack of disaster insurance products on offer52 – less than ideal considering that, relative to other African countries, Malawi is very frequently the victim of natural disasters.
Recommendation to research lack of insurance uptake by mainstream, commercial farmers. Large commercial farmers have shown no interest in taking up any of the existing agricultural insurance products.53 Market research thus is crucial to determine the exact reasons for this; it might be due to limited choices on insurance products, lack of trust in either the insurer or the insurance product itself, lack of knowledge of and information on existing products – or a completely different reason/range of reasons researchers are not aware of.
Gender
0
0.05
0.1
0.15
Females Males
Age category
0
0.05
0.1
0.15
0.2
Youth Non-Youth
2014 2017 2014 2017
Figure 23: Saved for agricultural/business purposes, by gender and age category Source: World Bank Findex
88
Eco
nom
ic s
ecto
rs t
hat
can
dri
ve g
row
th a
nd
em
plo
ymen
t
Agri-specific cover does exist – yet roll-out held up by red tape. Various insurance products (e.g. weather insurance, weather index insurance, germination insurance)54 that are specifically targeted at the agricultural sector do exist – but the distributing institutions are encountering problems in the process of registration,55 as well as problems meeting the compliance requirements associated with various regulations.56
Agricultural, crop insurance fraught with risk for providers. Although institutions are in the process of working with banks and MFIs57 in order to mitigate risk and make a larger variety of insurance products for crops possible and available,58 submissions to this MAP refresh project suggest there is hesitance in offering crop or agricultural insurance due to the high levels of risk;59
agricultural insurance requires reinsurance support from various institutions and organisations, and accompanied with existing difficulties, as mentioned above, it is proving to be difficult for institutions to form partnerships.60
Pressing need for high-quality market research, weather instruments and agricultural data. It may be challenging to find the acceptable premiums and pay-outs in the case of Malawi, particularly for agriculture, given that it is difficult to accurately evaluate risks and impacts – especially without the aid of effective and extensive market research, crop data, weather data and so on, which requires large amounts of funding and financial support. In the absence of adequate weather instruments that determine weather conditions correctly,61 determining the impact of a natural disaster – or any climate change or event – on crops becomes very tricky. As already mentioned, better data on crop estimates, rainfall and the like is needed in Malawi, possibly supplemented by the analysis of satellite image data, in order to provide a better understanding of risks and inform the development of relevant insurance products. Technology for providing more nuanced insurance products is evolving, and it may be possible, for example, to further innovate using satellite image data for vegetation.
Insurance market and penetration constrained by low levels of consumer knowledge. It is difficult for providers to offer products when the targeted consumer base does not have the relevant information or knowledge on them.62
Opportunity exists for range of products targeted at the agricultural sector. This includes digital marketplaces, insurance products to reduce risk, and credit products to allow for input purchases. Digitalisation can be used to reduce risk and volatility, although digitalisation is dependent on improvements in terms of road and ICT infrastructure.
Technology for
providing more
nuanced insurance
products is evolving,
and it may be
possible to further
innovate using
satellite image data
for vegetation.
89
Eco
nom
ic s
ecto
rs t
hat
can
dri
ve g
row
th a
nd
em
plo
ymen
t
Transport and logistics
Innovation in logistics, transport alternatives could offer immense benefits. The transport and logistics sector plays an important role in Malawi, in supporting trade in agricultural goods, for instance. Transportation options available to consumers are changing in many parts of the world, including through the expansion of public transport and on-demand transport modes that can be shared. This has been facilitated by the development of technologies in this area, including mobile communications technologies.63 Malawi, equally, has seen a considerable expansion of mobile data coverage, and technologies that facilitate digital payments for transport services, and so there may be immense benefits from innovation around more information being made available to the public and providing transport alternatives at different locations and at different points in time, given traffic modes and patterns.
Need to improve capital markets to encourage more risky lending. An example of an intervention in respect of offering finance for innovations in the logistics sector (in addition to the agricultural and manufacturing sectors) is the UNDP’s Malawi Innovation Challenge Fund (MICF).64 The MICF launched an Innovative Finance Window in July 2019 in terms of which financial institutions are encouraged to make risky loans to SMEs; but this programme has so far experienced challenges due to the lack of risk-taking by financial institutions.65 This is an issue worth exploring in more detail in order to understand how best capital markets may be improved in Malawi to allow for greater risk-taking by financiers. Regulators and financial institutions should consider how best to encourage more risky lending (appropriately priced) in order to expand investment in new technologies, including in the transport sector.
Certification of agricultural products needs attention. There are concerns in relation to the cross-border trade of agricultural and food products, and certification of agricultural products more broadly (as explained in Section 5.2). For instance, certain oils may be incorrectly (even fraudulently) classified as crude when they are in fact refined oil, threatening oil refiners in Malawi.66 Improvements in this area may help to expand agricultural output in Malawi.
Low-cost digitalisation (e.g. RFID, QR codes) could revolutionise value chains. Additionally, there may be opportunities to digitalise value chains at low cost in order to develop the agricultural sector in Malawi. This includes smart warehousing and logistics, where radio frequency identification (RFID) and quick response (QR) codes can be used to track food from the farm to consumers.67
Investments in innovations in the transport and logistics sector may therefore have an important role to play in Malawi.
4.3
Malawi has seen
a considerable
expansion of mobile
data coverage, and
technologies that
facilitate digital
payments for
transport services.
90
Eco
nom
ic s
ecto
rs t
hat
can
dri
ve g
row
th a
nd
em
plo
ymen
t
Wholesale & retail trade
Integral relationship between wholesale & retail and agricultural sectors. Wholesale and retail trade is not only an important economic sector in Malawi, accounting for 17% of GDP (see Figure 2 in section 2.1), but is considered to be extensively linked to the agricultural sector and has the potential to grow employment.68 A substantial proportion of MSMEs are found in the wholesale and retail trade sector (64%).69 Traders in this sector focus on the sale of agricultural products and are mostly located in rural areas.
Lack of access to electricity, piped water and financial services characterise workers in this sector. The sector employs almost 1.7m workers, 1m of which are worker-proprietors. More than 80% of employees are males. Only 24% of wholesale and retail traders have access to piped water, and only 28% have access to electricity; only 21% are banked, and only 3% have access to credit. Lack of access to electricity and piped water are, therefore, key constraints in the wholesale and retail sector, as well as access to financial services directly. Thus, products that finance access to electricity (such as pay-as-you-use solar) and access to piped water (municipal infrastructure finance) would benefit the wholesale and retail sector. At the same time, access to financial services directly may support growth, including access to mobile savings and loans.
Increasing links between formal FSPs and wholesale and retail businesses could boost development of the sector. An important aspect of the conduct of retail business is obtaining the formal permits to do so. In order to study the impact of the formal registration of predominantly retail businesses in Blantyre (70% of the sample were involved in retail), four follow-up surveys were conducted of firms that had benefited from formalisation interventions in 2012.70 The most recent follow-up survey was conducted in 2015. The businesses were treated in three ways in 2012: (i) assistance with registering the business, (ii) assistance with business and tax registration and (iii) costless business registration together with a banking information session and offer to open a business bank account. The researchers found that 75% of businesses received registration certificates. However, the treatment did not result in an expanded tax base or improved trust in state institutions. While registration of the business had no impact on business outcomes, the banking information session was associated with a 20% increase in sales and a 15% increase in profits. The reason for the increases were more access to formal financial services. Thus, there may be an opportunity for banks and other financial institutions to offer free registration services for businesses applying for a formal bank account. Increased links between formal FSPs and businesses operating in the wholesale and retail trade may help, therefore, to further the development of this sector. This may offer other benefits too, including wholesale and retail traders becoming bank agents, since bank agents must be registered businesses.
4.4
Products that
finance access
to electricity
and access to
piped water
would benefit the
wholesale and
retail sector.
91
Eco
nom
ic s
ecto
rs t
hat
can
dri
ve g
row
th a
nd
em
plo
ymen
t
Tourism
High levels of access to financial services. Tourism has been identified as a high-growth sector and has high potential for rural job creation.71 There are approximately 4,392 tourism businesses in Malawi, and these are predominantly small businesses (86%). Nonetheless, the tourism sector employs a large number of people (32,235), only a small number of which are working proprietors (280). The tourism sector, overall, has among the highest levels of access to financial services: 73% of firms in the tourism sector have access to credit, for example, and 90% are banked.
Financing access to piped water and electricity would boost tourism sector. While tourism businesses largely have access to water (82%), only 40% have access to piped water. A very small proportion (6%) have access to electricity. Lack of access to electricity and piped water are, therefore, key constraints in the tourism sector. Thus, products that finance access to electricity (such as pay-as-you-use solar) and access to piped water (municipal infrastructure finance) would benefit the tourism sector.
Need for roll-out of formal financial services infrastructure in tourism (rural) locations. The main tourism destination in Malawi is Lake Malawi/Nyasa,72 where Mangochi district is one of the most popular places to visit, hosting the Lake Malawi National Park and offering a variety of accommodation.73 However, there is very little banking infrastructure in Mangochi, with a large bank in Malawi reporting to this MAP refresh project only 1 branch, 3 ATMs and 10 agents, though offering 50 POS devices there. A key feature of the tourism sector in Malawi is that its most attractive locations are rural.74 This means that low-cost financial services solutions are needed, including bank agents, insurance agents and mobile money agents, given the high costs of servicing rural areas by traditional means. Thus, agent and geographic expansion approval process recommendations described above (in Section 4.2.1) are equally applicable to supporting the growth of the tourism sector in Malawi.
4.5
There are
approximately 4,392
tourism businesses
in Malawi, and
86% of these are
small businesses.
92
Eco
nom
ic s
ecto
rs t
hat
can
dri
ve g
row
th a
nd
em
plo
ymen
t
Summary
The agricultural sector plays a key role in the economy of
Malawi and is the primary candidate for emphasis in a financial
inclusion roadmap (as was the case in the 2015 MAP/NSFI).
There are important aspects of the sector that may benefit from financial inclusion, including greater digitalisation of the value chain in order to reduce price volatility, addressing financing for farming inputs, developing institutional aspects of the value chain including the warehouse receipt system and commodity exchanges, and reducing risks through innovative insurance products, which in turn rely on better data and infrastructure for the sector.
As Malawi develops and the population moves to urban areas, there are interventions in the transport and logistics sector, and wholesale and retail trade, that will also benefit from greater digitalisation, including of payments.
Finally, the tourism sector too presents opportunities in Malawi, and in this respect expanding formal financial services infrastructure (including branchless banking and mobile money agents) to tourist areas could play a role in supporting its development.
4.6
93
Eco
nom
ic s
ecto
rs t
hat
can
dri
ve g
row
th a
nd
em
plo
ymen
t
PART 4: NOTES1 Government of Malawi, National Agricultural Investment Plan.
2 See: https://www.businesslive.co.za/bd/opinion/2019-09-12-sa-agriculture-has-some-valuable-lessons-for-struggling-malawi/.
3 Centre for Agricultural Research and Development (CARD). (2016). The Economics of Tobacco Farming in Malawi. Lilongwe University of Agriculture and Natural Resources (LUANAR).
4 Government of Malawi, National Agricultural Investment Plan.
5 Physical inputs include, but are not limited to, irrigation systems, filtration, lab testing, solar irrigation pumps, fertilisers, infrastructure.
6 Financial means include, but are not limited to, company grants, loans for specific purchases of agricultural inputs or related products, cash loans to improve productivity.
7 This includes, but is not limited to, assistance in developing businesses from a commercial perspective, developing innovative business ideas, developing business plans, skills development, digitalising entrepreneurship training.
8 MoFEPD, Annual Economic Report 2019.
9 For example, according to an NGO, there is a programme that works on the value chain of various crops, to further diversify the agricultural commodities being exported but to also increase the export levels and, thus, GDP. Crop commodities in this programme range from rice, soya and cassava to macadamia and sunflower.
10 Makoka, D., Appau, A., Lencucha, R., & Drope, J. (2016). Farm-level Economics of Tobacco Production in Malawi. Lilongwe, Malawi: Centre for Agricultural Research and Development, American Cancer Society.
11 Moyer-Lee, J., & Prowse, M. (2012). How Traceability is Restructuring Malawi’s Tobacco Industry. Institute of Development Policy and Management Working Paper 2012.05. Antwerpen, Belgium.
12 Gourichon, H., Cameron, A., & Pernechele, V. (2017). Assessing the Policy Environment for Cash Crops in Malawi: What Could Hinder the Achievement of the National Export Strategy objectives? Food and Agriculture Organization of the United States (FAO).
13 Moyer-Lee & Prowse (2012), cited above.
14 Moyer-Lee & Prowse (2012), cited above.
15 Centre for Agricultural Research and Development (CARD). (2016), cited above.
16 Centre for Agricultural Research and Development (CARD). (2016), cited above.
17 Malawi National Export Strategy, 2013–2018.
18 Markowitz, C. (2018). Linking Soybean Producers to Markets: An Analysis of Interventions in Malawi and Zambia. SAIIA Occasional Paper No 291, December 2018.
19 According to an interview with an NGO.
20 According to an NGO, there is an initiative to support a dairy chain through funding in order to increase dairy farmers’ productive capacity.
21 National Agricultural Investment Plan (NAIP), January 2018.
22 Dorward, A., & Kydd, J. (2004). The Malawi 2002 Food Crisis: The Rural Development Challenge. Journal of Modern African Studies, 343–361.
23 Sitko, N.J., & Jayne, T.S. (2014). Exploitative Briefcase Businessmen, Parasites, and Other Myths and Legends: Assembly traders and the Performance of Maize Markets in Eastern and Southern Africa. World Development, 54, 56–67.
24 Gourichon, H., Cameron, A., & Pernechele, V. (2017), cited above.
25 According to a NGO, the quality of data and the timing of processing data is causing information to arrive too late.
26 According to an interview with a NGO.
27 Markowitz (2018), cited above.
28 Aker, J.C. (2010). Information from Markets Near and Far: Mobile Phones and Agricultural Markets in Niger. American Economic Journal: Applied Economics, 2(3): 46–59.
29 Jensen, R. (2007). The Digital Provide: Information (Technology), Market Performance, and Welfare in the South Indian Fisheries Sector. The Quarterly Journal of Economics, 122(3): 879–924.
30 Markowitz (2018), cited above.
31 Krishnan, A., Banga, K., & Mendez-Parra, M. (2020). Disruptive Technologies in Agricultural Value Chains: Insights from East Africa. ODI Working and Discussion Papers March 2020.
32 The majority of the institutions and organisations interviewed have claimed that it is very difficult to reach deep rural areas due to the lack of infrastructure.
33 According to an NGO, costs could be reduced if mobile money was used.
34 Asfaw, S., Cattaneo, A., Pallante, G., & Palma, A. (2017). Impacts of Modifying Malawi’s Farm Input Subsidy Programme Targeting. FAO Agricultural Development Economics Working Paper 17-05. Rome, FAO.
35 Asfaw et al. (2017), cited above.
36 Asfaw et al. (2017), cited above.
37 IMF, December 2019, ‘Malawi Second and third Reviews under the three year extended credit facility arrangement and requests for waivers of nonobservance of performance criteria and augmentation of access—Press Release; Staff Report; And Statement By The Executive Director For Malawi’ IMF Country Report No. 19/361.
38 Makoka, Appau, Lencucha & Drope (2016), cited above.
39 For example, according to an NGO, they have partnered with a seed company to provide seeds in input package loans.
40 According to an NGO, ‘agri-input’ loans support farmers by providing access to chemical content in order to produce their own organic fertilisers.
41 Markowitz (2018), cited above.
42 According to an NGO’s response to our questionnaire.
43 Submission to the MAP refresh project by an MFI.
44 Annan, K., Conway, S.G., & Dryden, S. (2016). African Farmers in the Digital Age. Foreign Affairs, Special Issue (February). Retrieved from https://files. foreignaffairs. com/pdf/sponsoredanthology/2016/african_farmers_in_the_digital_age_final. pdf.
45 See: https://oneacrefund.org/impact/country-detail/
46 Gine, X., Goldberg, J., & Yang, D. (2012). Credit Market Consequences of Improved Personal Identification: Field Experimental Evidence from Malawi. American Economic Review: 102(6): 2923–2954.
47 In this study, paprika was used.
48 Reduction in ex-ante moral hazard may encourage better loan repayments by improving farm outputs so that farmers have higher incomes with which to make loan repayments.
49 Calculated portrayed a benefit-cost ratio of 2.34.
50 2018 Malawi Population and Housing Census.
51 According to an MFI, institutions copy insurance products due to limited capacity to conduct market research and limited funding for training and capacity building. Additionally, consumers do not
94
Eco
nom
ic s
ecto
rs t
hat
can
dri
ve g
row
th a
nd
em
plo
ymen
t
have the knowledge or information to take on an insurance product.
52 According to an interview with an MFI.
53 According to an interview with an insurer.
54 According to an insurer, when seeds fail to germinate they are given back to be replanted.
55 According to an MFI, there are delays in getting approvals.
56 According to an MFI, all agricultural loans were insured before having to register as an insurance company as the funds used to pay premiums grew.
57 According to an insurer, they offer a loan product that aids with payments being made towards their insurance.
58 According to an insurer, they are in the process of establishing partnerships with banks and the RBM to open up the insurance market for the agricultural sector.
59 For example, the success rate of germination is heavily influenced by rainfall.
60 According to an MFI, a weather insurance cannot be fully implemented as partnerships required for monitoring weather patterns in the villages disintegrated.
61 According to an insurer, high demands by international companies that provide reinsurance have forced monitoring weather patterns remotely.
62 According to an insurer, the lack of education and knowledge on insurance products is not only stunting the insurance market but also impeding insurance penetration.
63 See, for example, the various reforms mooted
for the Matutus in Kenya, and innovative solutions being introduced: https://edition.cnn.com/2020/01/28/business/data-integrated-kenya-intl/index.html
64 See: https://www.micf.mw/
65 MAP refresh project stakeholder submission.
66 Markowitz (2018), cited above.
67 Krishnan, Banga, & Mendez-Parra (2020), cited above.
68 FinScope Micro, Small and Medium Enterprise Survey Malawi 2019 Report, referred to as the ‘MSME Finscope’ in this report.
69 MSME Finscope (2019).
70 Campos, F., Goldstein, M., & McKenzie, D. (2015). Short-term Impacts of Formalization Assistance and a Bank Information Session on Business Registration and Access to Finance in Malawi. The World Bank.
71 MSME Finscope (2019), cited above.
72 Kandaya, H. (2019). Identification of Tourism Developmental Success Factors: Benchmarking the Malawi Tourism Industry. Unpublished MPhil thesis.
73 The African Development Bank, for example, plans to target Mangochi as one of its key locations for interventions in the tourism sector. See: African Development Bank, Malawi, Promoting Investment and Competitiveness in Tourism Sector (Picts) Project, Appraisal Report, prepared in December 2017.
74 African Development Bank, Malawi, December 2017, cited above.
Conclusions and recommendations5
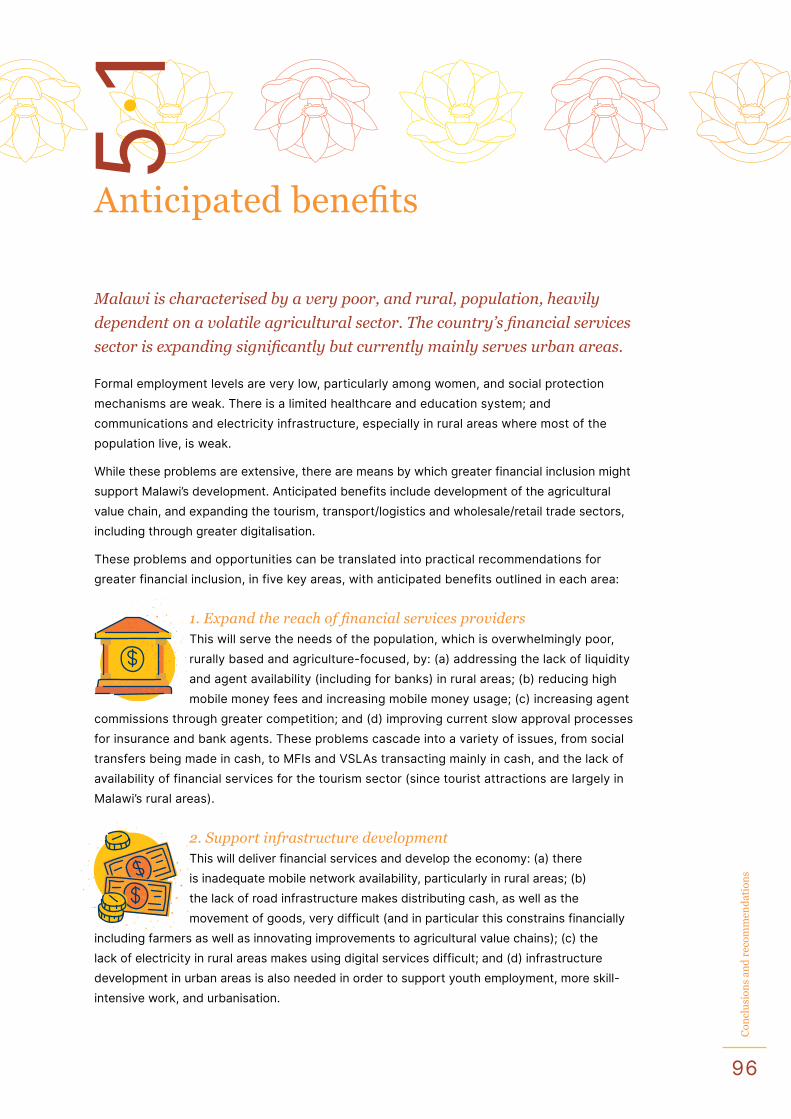
96
Con
clu
sion
s an
d r
ecom
men
dat
ion
s
Anticipated benefits
Malawi is characterised by a very poor, and rural, population, heavily
dependent on a volatile agricultural sector. The country’s financial services
sector is expanding significantly but currently mainly serves urban areas.
Formal employment levels are very low, particularly among women, and social protection mechanisms are weak. There is a limited healthcare and education system; and communications and electricity infrastructure, especially in rural areas where most of the population live, is weak.
While these problems are extensive, there are means by which greater financial inclusion might support Malawi’s development. Anticipated benefits include development of the agricultural value chain, and expanding the tourism, transport/logistics and wholesale/retail trade sectors, including through greater digitalisation.
These problems and opportunities can be translated into practical recommendations for greater financial inclusion, in five key areas, with anticipated benefits outlined in each area:
1. Expand the reach of financial services providers This will serve the needs of the population, which is overwhelmingly poor, rurally based and agriculture-focused, by: (a) addressing the lack of liquidity and agent availability (including for banks) in rural areas; (b) reducing high mobile money fees and increasing mobile money usage; (c) increasing agent
commissions through greater competition; and (d) improving current slow approval processes for insurance and bank agents. These problems cascade into a variety of issues, from social transfers being made in cash, to MFIs and VSLAs transacting mainly in cash, and the lack of availability of financial services for the tourism sector (since tourist attractions are largely in Malawi’s rural areas).
2. Support infrastructure development This will deliver financial services and develop the economy: (a) there is inadequate mobile network availability, particularly in rural areas; (b) the lack of road infrastructure makes distributing cash, as well as the movement of goods, very difficult (and in particular this constrains financially
including farmers as well as innovating improvements to agricultural value chains); (c) the lack of electricity in rural areas makes using digital services difficult; and (d) infrastructure development in urban areas is also needed in order to support youth employment, more skill-intensive work, and urbanisation.
5.1
97
Con
clu
sion
s an
d r
ecom
men
dat
ion
s
3. Develop the agricultural value chain, in order to address this critical aspect of Malawi’s economy(a) there is a lack of good data on agriculture production, weather patterns and other agricultural indicators; (b) there are embryonic but limited credit and insurance products; (c) warehousing receipt and commodity exchange
initiatives have experienced only limited success; (d) there may be competition problems in respect of buyers of agricultural products, given high levels of concentration; and (e) the benefits of land tenure reform in favour of women need to be studied.
4. Advance digitalisation, to facilitate a range of initiatives in respect of financial inclusion but also to support the agricultural sector, transport and logistics, wholesale and retail trade(a) NRB identification verification charges are exceedingly high, resulting in a lack of remote account opening and integration (and biometric information
seems to be limited); (b) there is a great need for digitalisation of insurance information, including a fraud register; and (c) there are ongoing processes to integrate the NRB and social cash transfer beneficiary register, which should be supported, including with better means of identifying beneficiaries.
5. Expand the payments ecosystemThere is limited non-bank participation in the payments system in Malawi; cross-border bank remittances appear to be expensive; and domestic EFTs are expensive. There are also only limited settlement times and days for bank-to-bank transfers, limiting the utility of banking services. This matters,
particularly in order to integrate informal providers such as VSLAs – the largest source of loans for individuals in Malawi – with formal providers.
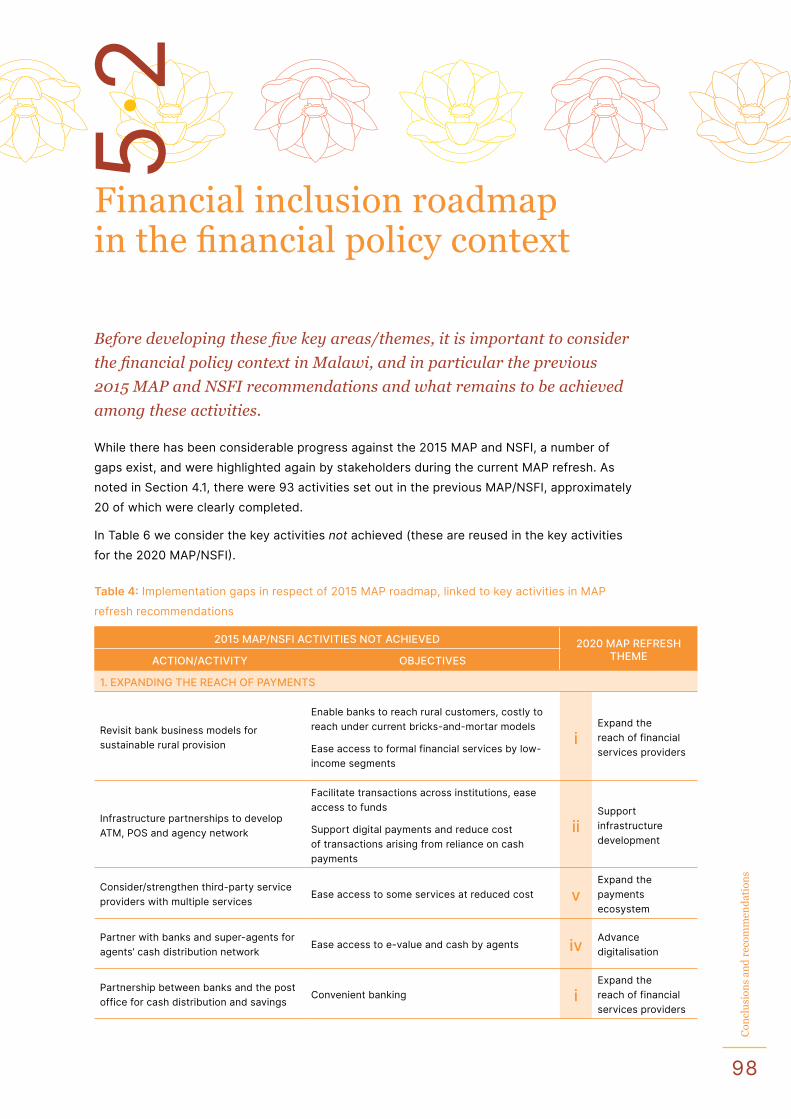
98
Con
clu
sion
s an
d r
ecom
men
dat
ion
s
Financial inclusion roadmap in the financial policy context
Before developing these five key areas/themes, it is important to consider
the financial policy context in Malawi, and in particular the previous
2015 MAP and NSFI recommendations and what remains to be achieved
among these activities.
While there has been considerable progress against the 2015 MAP and NSFI, a number of gaps exist, and were highlighted again by stakeholders during the current MAP refresh. As noted in Section 4.1, there were 93 activities set out in the previous MAP/NSFI, approximately 20 of which were clearly completed.
In Table 6 we consider the key activities not achieved (these are reused in the key activities for the 2020 MAP/NSFI).
Table 4: Implementation gaps in respect of 2015 MAP roadmap, linked to key activities in MAP
refresh recommendations
2015 MAP/NSFI ACTIVITIES NOT ACHIEVED 2020 MAP REFRESHTHEMEACTION/ACTIVITY OBJECTIVES
1. EXPANDING THE REACH OF PAYMENTS
Revisit bank business models for sustainable rural provision
Enable banks to reach rural customers, costly to reach under current bricks-and-mortar models
Ease access to formal financial services by low-income segments
iExpand the reach of financial services providers
Infrastructure partnerships to develop ATM, POS and agency network
Facilitate transactions across institutions, ease access to funds
Support digital payments and reduce cost of transactions arising from reliance on cash payments
iiSupport infrastructure development
Consider/strengthen third-party service providers with multiple services
Ease access to some services at reduced cost vExpand the payments ecosystem
Partner with banks and super-agents for agents’ cash distribution network
Ease access to e-value and cash by agents iv Advance digitalisation
Partnership between banks and the post office for cash distribution and savings
Convenient banking iExpand the reach of financial services providers
5.2
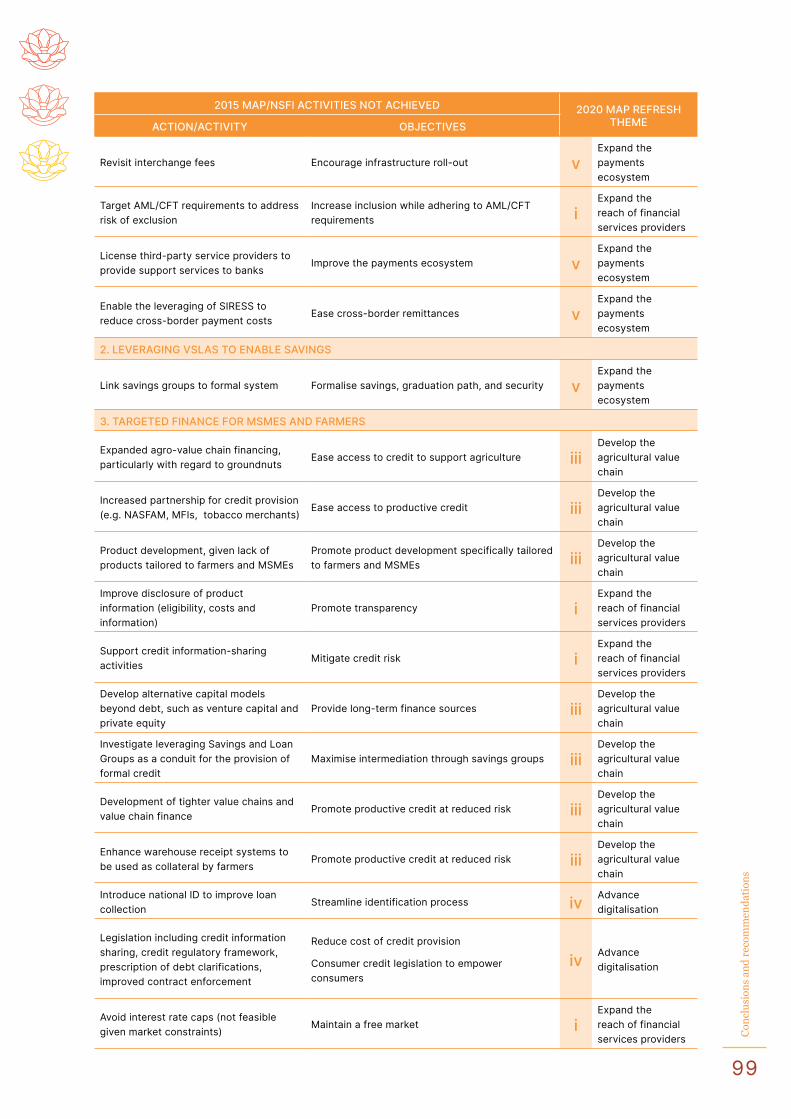
99
Con
clu
sion
s an
d r
ecom
men
dat
ion
s
2015 MAP/NSFI ACTIVITIES NOT ACHIEVED 2020 MAP REFRESHTHEMEACTION/ACTIVITY OBJECTIVES
Revisit interchange fees Encourage infrastructure roll-out vExpand the payments ecosystem
Target AML/CFT requirements to address risk of exclusion
Increase inclusion while adhering to AML/CFT requirements i
Expand the reach of financial services providers
License third-party service providers to provide support services to banks
Improve the payments ecosystem vExpand the payments ecosystem
Enable the leveraging of SIRESS to reduce cross-border payment costs
Ease cross-border remittances vExpand the payments ecosystem
2. LEVERAGING VSLAS TO ENABLE SAVINGS
Link savings groups to formal system Formalise savings, graduation path, and security vExpand the payments ecosystem
3. TARGETED FINANCE FOR MSMES AND FARMERS
Expanded agro-value chain financing, particularly with regard to groundnuts
Ease access to credit to support agriculture iiiDevelop the agricultural value chain
Increased partnership for credit provision (e.g. NASFAM, MFIs, tobacco merchants)
Ease access to productive credit iiiDevelop the agricultural value chain
Product development, given lack of products tailored to farmers and MSMEs
Promote product development specifically tailored to farmers and MSMEs iii
Develop the agricultural value chain
Improve disclosure of product information (eligibility, costs and information)
Promote transparency iExpand the reach of financial services providers
Support credit information-sharing activities
Mitigate credit risk iExpand the reach of financial services providers
Develop alternative capital models beyond debt, such as venture capital and private equity
Provide long-term finance sources iiiDevelop the agricultural value chain
Investigate leveraging Savings and Loan Groups as a conduit for the provision of formal credit
Maximise intermediation through savings groups iiiDevelop the agricultural value chain
Development of tighter value chains and value chain finance
Promote productive credit at reduced risk iiiDevelop the agricultural value chain
Enhance warehouse receipt systems to be used as collateral by farmers
Promote productive credit at reduced risk iiiDevelop the agricultural value chain
Introduce national ID to improve loan collection
Streamline identification process iv Advance digitalisation
Legislation including credit information sharing, credit regulatory framework, prescription of debt clarifications, improved contract enforcement
Reduce cost of credit provision
Consumer credit legislation to empower consumers
iv Advance digitalisation
Avoid interest rate caps (not feasible given market constraints)
Maintain a free market iExpand the reach of financial services providers
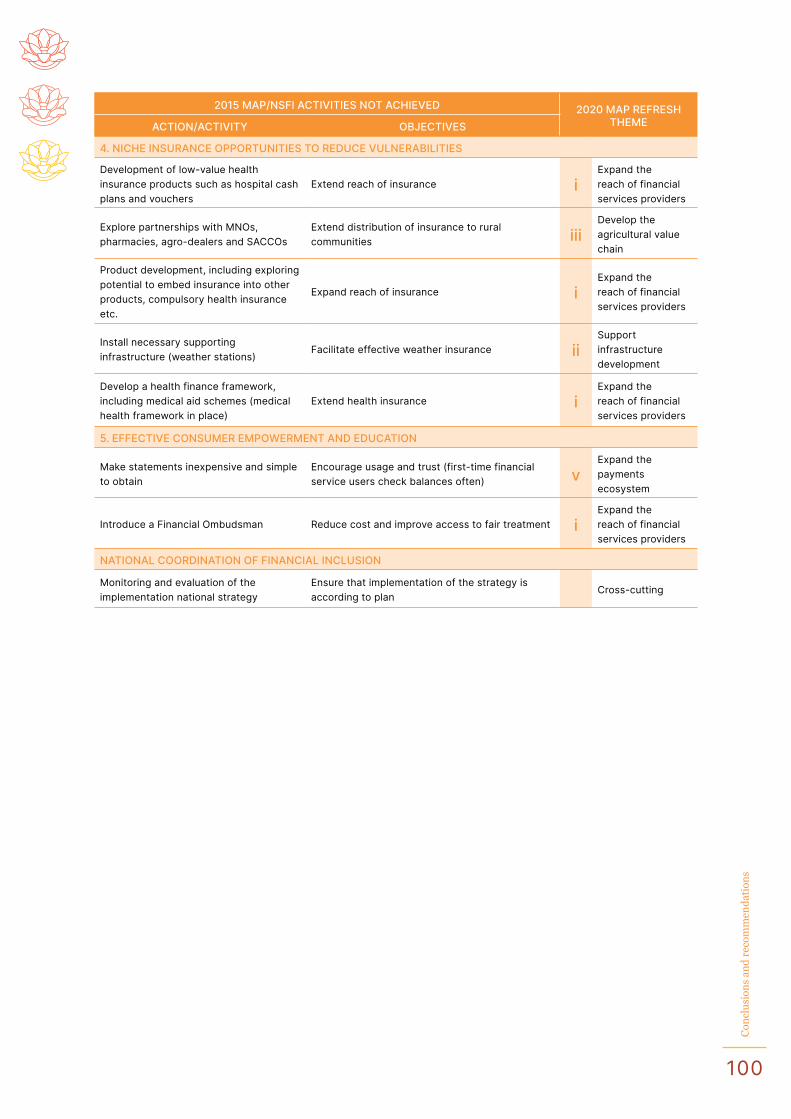
100
Con
clu
sion
s an
d r
ecom
men
dat
ion
s
2015 MAP/NSFI ACTIVITIES NOT ACHIEVED 2020 MAP REFRESHTHEMEACTION/ACTIVITY OBJECTIVES
4. NICHE INSURANCE OPPORTUNITIES TO REDUCE VULNERABILITIES
Development of low-value health insurance products such as hospital cash plans and vouchers
Extend reach of insurance iExpand the reach of financial services providers
Explore partnerships with MNOs, pharmacies, agro-dealers and SACCOs
Extend distribution of insurance to rural communities iii
Develop the agricultural value chain
Product development, including exploring potential to embed insurance into other products, compulsory health insurance etc.
Expand reach of insurance iExpand the reach of financial services providers
Install necessary supporting infrastructure (weather stations)
Facilitate effective weather insurance iiSupport infrastructure development
Develop a health finance framework, including medical aid schemes (medical health framework in place)
Extend health insurance iExpand the reach of financial services providers
5. EFFECTIVE CONSUMER EMPOWERMENT AND EDUCATION
Make statements inexpensive and simple to obtain
Encourage usage and trust (first-time financial service users check balances often) v
Expand the payments ecosystem
Introduce a Financial Ombudsman Reduce cost and improve access to fair treatment iExpand the reach of financial services providers
NATIONAL COORDINATION OF FINANCIAL INCLUSION
Monitoring and evaluation of the implementation national strategy
Ensure that implementation of the strategy is according to plan
Cross-cutting
101
Con
clu
sion
s an
d r
ecom
men
dat
ion
s
Implementation and evaluation
The five key areas/themes in terms of which practical recommendations
for greater financial inclusion in Malawi are made are listed below,
along with the main suggested reforms.
1. Expand the reach of financial services providers (see discussion in Section 4)Consider means by which requirements for bank agent approvals, the prohibition on bank agents opening customer accounts, and transaction value limits, might be relaxed. For instance, if formal business registration is
a requirement to be a bank agent, efforts should be made to ensure that businesses may be registered remotely by digital means. Furthermore, the MWK 50,000 transaction value limit is too low for bank agents to have a meaningful impact, including in respect of loan collections.
The prohibition on bank agents opening customer accounts needs to be reconsidered since remote CDD/KYC is permitted for remote onboarding of bank customers. There may be competition concerns that limit the development of mobile money in Malawi, with mobile operators potentially not offering access to their networks via USSD, for example, which need to be considered by the CFTC and RBM. At the same time, there may be limited economies of scale in Malawi and higher costs, which should also be assessed by the CFTC and RBM, and reforms introduced to lower costs (such as considering issuing digital currency in parallel to specie).
Approval processes for new FSPs, branches and agents, including bank and insurance agents and new insurance products, should be reviewed in order to ensure that approvals or rejections are provided as quickly as possible or removing the requirements altogether, delegating responsibility for at least agent approval to the banks, MFIs and insurers. It is not clear, for instance, why approval for expansion through a new branch or entry in a new area is required, since this form of competition and expansion should always be welcome. There may also be other regulatory impediments that need to be studied, such as the interest rate cap on MFI loans. Encouraging competition between service providers, rather than focusing on price regulation, should be the strategy for reducing margins, r. In this regard, the CFTC should be encouraged to finalise its report on competition in the banking industry. As the reach of financial services grows, it will be important to also consider consumer education and protection, and facilitate ongoing development of institutions in this area.
5.3
102
Con
clu
sion
s an
d r
ecom
men
dat
ion
s
2. Support infrastructure development: Infrastructure financeThis is an important component of the expansion of access to financial services, including mobile networks, roads and energy (as discussed in Section 3.8 but also mentioned in relation to youth employment, and rural–urban migration). Innovative means of financing such infrastructure,
including using pay-as-you-use solar or micro-grid solutions, should be emphasised. Means by which roads might be built by leveraging private sector (e.g. commercial farmer) resources might be considered. DFIs should consider loans to mobile operators, and telecommunications operators more broadly, in order to expand this critical infrastructure.
3. Develop the agricultural value chainThe agricultural value chain is critical for the development of the economy in Malawi, as explained in some detail in Section 5.2. This includes gathering and disseminating data on agricultural production and weather, and supporting the development of insurance-linked credit products and
technology. Furthermore, the commodity exchanges and the warehouse receipt system need to be assessed and improved, possibly by developing digital marketplaces (such as M-Lamu in Senegal or M-Farm in Kenya), and considering linkages with donor-funded projects such as KULIMA (relating to food security). There may also be a greater role for MSME finance, particularly in value-added agro-processing (part of the Export Promotion Strategy). The CFTC should consider a high-level review of competition among buyers of farming produce and assess whether there are any impediments to the development of the value chain from an agricultural finance perspective. In addition, delays in the approval of rural community-based SACCOs might be reduced, including by allowing an incubation period under the supervision of an industry body. Furthermore, asset-backed products need to be considered (i.e. financing and supplying inputs rather than lending cash), given the recent success of this in Malawi. Finally, land tenure reform, to provide greater access to productive assets to women, should be studied.
4. Advance digitalisationThe process of digitalisation is under way in Malawi and needs to be supported. National registration bureau costs and fees need to be studied (there are numerous complaints that costs are too high for the service to be used), and the minimum age to obtain a national ID might be reduced
from 16 years (since this impedes youth employment, and child-headed households from receiving cash transfers; see Section 4.2.1). Furthermore, insurance information needs to be digitised (including a fraud register), and better means of targeting social cash transfer or farming input subsidy beneficiaries need to be devised through better collection of data (e.g. by analysis of vegetation satellite imagery, using granular mobile money data etc. – see Section 3.5; this is linked to the development of the agricultural value chain, discussed above). In addition, there is evidence that the collection of biometric information (e.g. fingerprints) makes for more reliable loan repayments, which suggests that the NRB should consider introducing this and making biometric verification possible for FSPs. It is important to exploit links between formalisation of businesses and opening business bank accounts and becoming bank agents. Banks, MFIs, SACCOs and digital FSPs might be permitted, for example, to register businesses formally with tax and registration authorities. In order to reduce the need for liquidity in rural areas, the RBM could investigate the possibility
103
Con
clu
sion
s an
d r
ecom
men
dat
ion
s
of introducing a digital currency in Malawi.1 Furthermore, there is a need to continue to modernise MFIs and SACCOs in Malawi, by leveraging the processing hub (‘the National Switch’) put into place recently in partnership with the World Bank and possibly reconsidering its charges, and mandating the publication of information by FSPs digitally rather than physically in branches (see, in general, Section 4.2.4). This needs to be considered in the context of consumer protection and education initiatives in Malawi, including as part of the development of legislation in this area.
1 China, for example, may be the first country to put a digital currency into limited use. See: https://www.economist.com/fi-nance-and-economics/2020/04/23/china-aims-to-launch-the-worlds-first-official-digital-currency
2 Following, for example, the rules put in place in the European Union. See: https://eur-lex.europa.eu/legal-content/EN/TXT/HT-ML/?uri=LEGISSUM:2404020302_1. See also CGAP, 2020, ‘Technology Building Blocks for an Open API Strategy’: https://www.cgap.org/sites/default/files/publications/slidedeck/2020_04_Slidedeck_Technology_Building_Blocks_API_1.pdf
5. Expand the payments ecosystemDeveloping an ecosystem of digital FSPs is an important feature of financial sector development. Means should be considered by which digital FSPs should be able to view or introduce funds transfers in the ecosystem or
produce records of stored value and loans (such as for VSLAs, which are important for the development of women in particular; see Section 3.4). In this regard, the RBM might consider studying the possibility of introducing application programming interface (API) requirements into the payments system.2 Overall, the RBM, together with the CFTC, might consider means of collaborating to ensure that features of the payments system, including access terms and interchange rates (which seem to be driving high retail prices for bank-to-bank transfers), are scrutinised to ensure that a competitive ecosystem is developed. Furthermore, there is a need to study the possibility of real-time clearing in the payments system, so as to enable beneficiaries dependent on social grants and remittances to receive their cash instantly but also so as to bring about greater competition between banks and digital FSPs (the latter benefit from being able to instantly notify customers that funds have been paid and received). There are also reforms that may be needed in order to integrate Malawi with the SADC-RTGS to facilitate lower-cost remittances.
The activities carried over from the previous MAP/NSFI (30 in total) and additional activities arising from the current MAP refresh are shown on Table 7. Several of the recommendations concern interventions that involve donors, who have an important role to play in Malawi’s development and whose inputs have been considered in this MAP diagnostic report. Furthermore, a number of recommendations involve greater study by regulators and policymakers in Malawi, which in turn will rely heavily on data and a flexible approach to trial and error in relation to new products and other innovations (i.e. ‘sandboxing’). While this approach carries some risk, there exist significant opportunities for building on the successes that have been achieved over the five years since the first MAP research process.
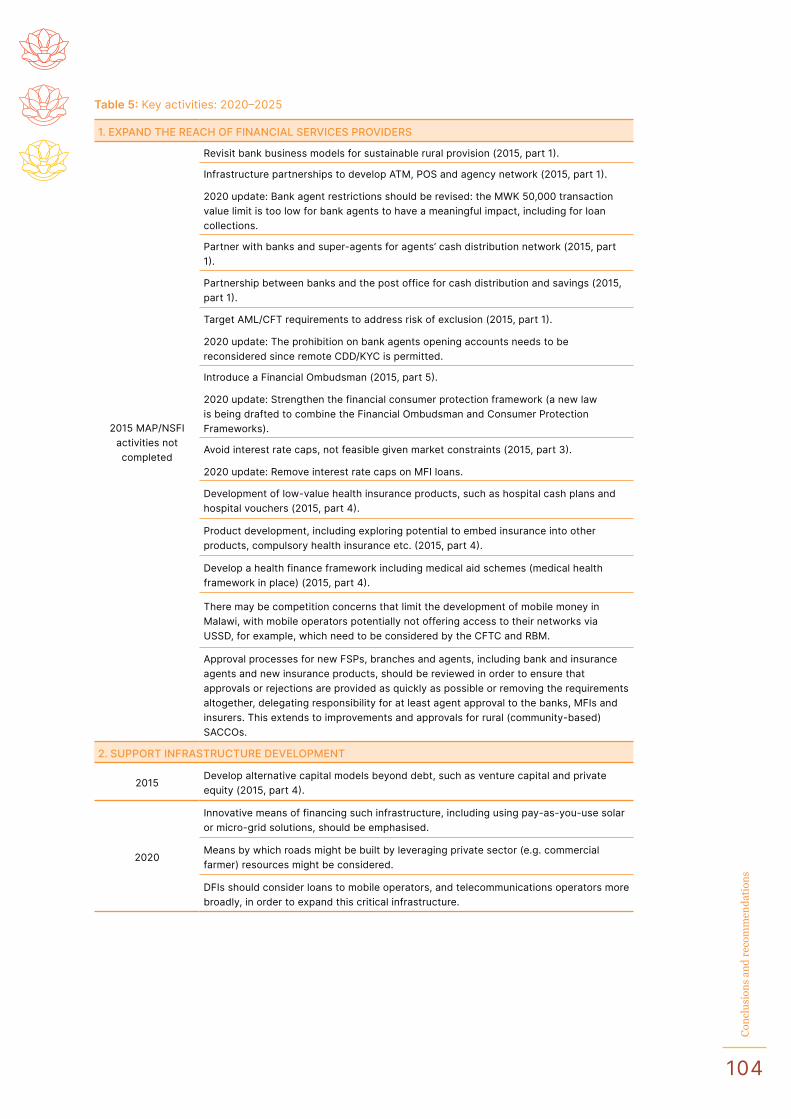
104
Con
clu
sion
s an
d r
ecom
men
dat
ion
s
Table 5: Key activities: 2020–2025
1. EXPAND THE REACH OF FINANCIAL SERVICES PROVIDERS
2015 MAP/NSFI activities not completed
Revisit bank business models for sustainable rural provision (2015, part 1).
Infrastructure partnerships to develop ATM, POS and agency network (2015, part 1).
2020 update: Bank agent restrictions should be revised: the MWK 50,000 transaction value limit is too low for bank agents to have a meaningful impact, including for loan collections.
Partner with banks and super-agents for agents’ cash distribution network (2015, part 1).
Partnership between banks and the post office for cash distribution and savings (2015, part 1).
Target AML/CFT requirements to address risk of exclusion (2015, part 1).
2020 update: The prohibition on bank agents opening accounts needs to be reconsidered since remote CDD/KYC is permitted.
Introduce a Financial Ombudsman (2015, part 5).
2020 update: Strengthen the financial consumer protection framework (a new law is being drafted to combine the Financial Ombudsman and Consumer Protection Frameworks).
Avoid interest rate caps, not feasible given market constraints (2015, part 3).
2020 update: Remove interest rate caps on MFI loans.
Development of low-value health insurance products, such as hospital cash plans and hospital vouchers (2015, part 4).
Product development, including exploring potential to embed insurance into other products, compulsory health insurance etc. (2015, part 4).
Develop a health finance framework including medical aid schemes (medical health framework in place) (2015, part 4).
There may be competition concerns that limit the development of mobile money in Malawi, with mobile operators potentially not offering access to their networks via USSD, for example, which need to be considered by the CFTC and RBM.
Approval processes for new FSPs, branches and agents, including bank and insurance agents and new insurance products, should be reviewed in order to ensure that approvals or rejections are provided as quickly as possible or removing the requirements altogether, delegating responsibility for at least agent approval to the banks, MFIs and insurers. This extends to improvements and approvals for rural (community-based) SACCOs.
2. SUPPORT INFRASTRUCTURE DEVELOPMENT
2015Develop alternative capital models beyond debt, such as venture capital and private equity (2015, part 4).
2020
Innovative means of financing such infrastructure, including using pay-as-you-use solar or micro-grid solutions, should be emphasised.
Means by which roads might be built by leveraging private sector (e.g. commercial farmer) resources might be considered.
DFIs should consider loans to mobile operators, and telecommunications operators more broadly, in order to expand this critical infrastructure.
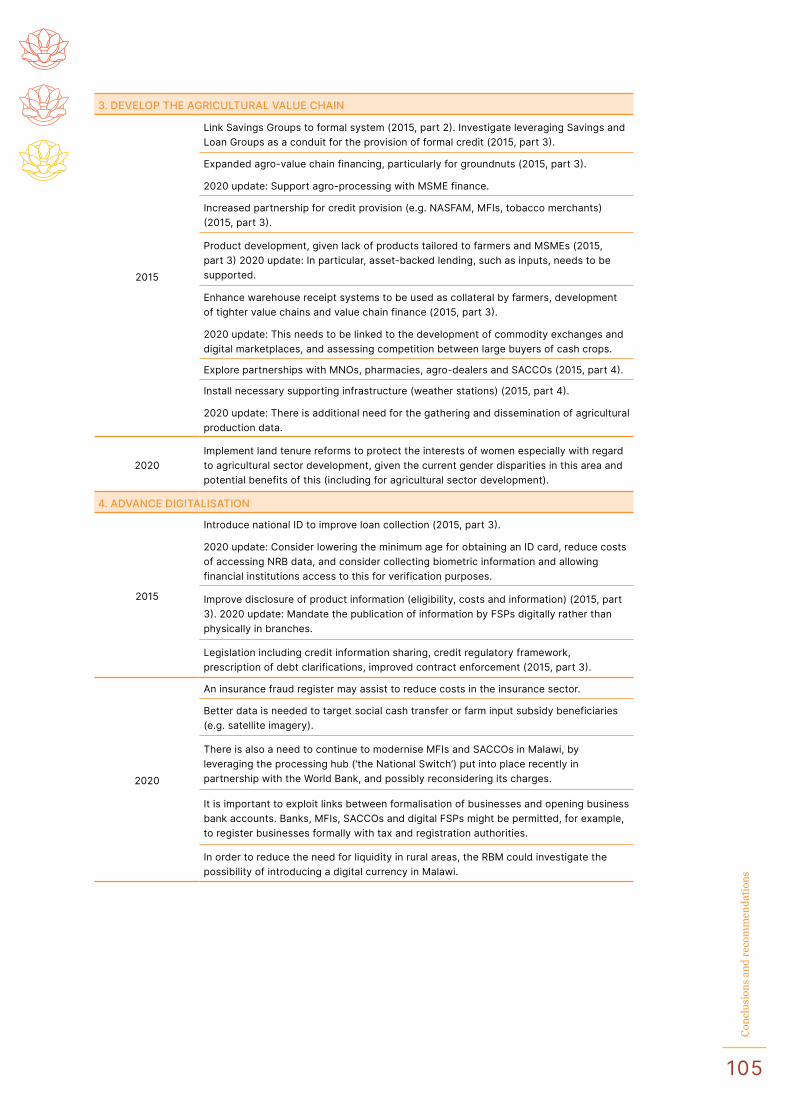
105
Con
clu
sion
s an
d r
ecom
men
dat
ion
s
3. DEVELOP THE AGRICULTURAL VALUE CHAIN
2015
Link Savings Groups to formal system (2015, part 2). Investigate leveraging Savings and Loan Groups as a conduit for the provision of formal credit (2015, part 3).
Expanded agro-value chain financing, particularly for groundnuts (2015, part 3).
2020 update: Support agro-processing with MSME finance.
Increased partnership for credit provision (e.g. NASFAM, MFIs, tobacco merchants) (2015, part 3).
Product development, given lack of products tailored to farmers and MSMEs (2015, part 3) 2020 update: In particular, asset-backed lending, such as inputs, needs to be supported.
Enhance warehouse receipt systems to be used as collateral by farmers, development of tighter value chains and value chain finance (2015, part 3).
2020 update: This needs to be linked to the development of commodity exchanges and digital marketplaces, and assessing competition between large buyers of cash crops.
Explore partnerships with MNOs, pharmacies, agro-dealers and SACCOs (2015, part 4).
Install necessary supporting infrastructure (weather stations) (2015, part 4).
2020 update: There is additional need for the gathering and dissemination of agricultural production data.
2020Implement land tenure reforms to protect the interests of women especially with regard to agricultural sector development, given the current gender disparities in this area and potential benefits of this (including for agricultural sector development).
4. ADVANCE DIGITALISATION
2015
Introduce national ID to improve loan collection (2015, part 3).
2020 update: Consider lowering the minimum age for obtaining an ID card, reduce costs of accessing NRB data, and consider collecting biometric information and allowing financial institutions access to this for verification purposes.
Improve disclosure of product information (eligibility, costs and information) (2015, part 3). 2020 update: Mandate the publication of information by FSPs digitally rather than physically in branches.
Legislation including credit information sharing, credit regulatory framework, prescription of debt clarifications, improved contract enforcement (2015, part 3).
2020
An insurance fraud register may assist to reduce costs in the insurance sector.
Better data is needed to target social cash transfer or farm input subsidy beneficiaries (e.g. satellite imagery).
There is also a need to continue to modernise MFIs and SACCOs in Malawi, by leveraging the processing hub (‘the National Switch’) put into place recently in partnership with the World Bank, and possibly reconsidering its charges.
It is important to exploit links between formalisation of businesses and opening business bank accounts. Banks, MFIs, SACCOs and digital FSPs might be permitted, for example, to register businesses formally with tax and registration authorities.
In order to reduce the need for liquidity in rural areas, the RBM could investigate the possibility of introducing a digital currency in Malawi.
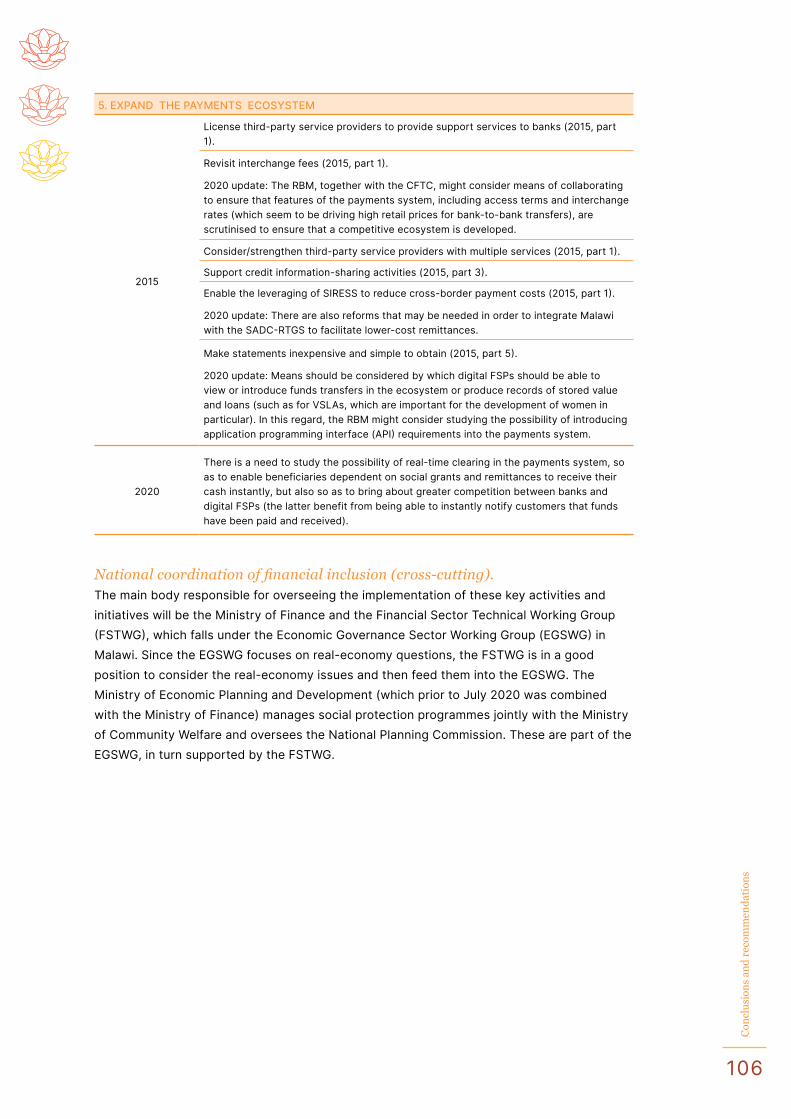
106
Con
clu
sion
s an
d r
ecom
men
dat
ion
s
5. EXPAND THE PAYMENTS ECOSYSTEM
2015
License third-party service providers to provide support services to banks (2015, part 1).
Revisit interchange fees (2015, part 1).
2020 update: The RBM, together with the CFTC, might consider means of collaborating to ensure that features of the payments system, including access terms and interchange rates (which seem to be driving high retail prices for bank-to-bank transfers), are scrutinised to ensure that a competitive ecosystem is developed.
Consider/strengthen third-party service providers with multiple services (2015, part 1).
Support credit information-sharing activities (2015, part 3).
Enable the leveraging of SIRESS to reduce cross-border payment costs (2015, part 1).
2020 update: There are also reforms that may be needed in order to integrate Malawi with the SADC-RTGS to facilitate lower-cost remittances.
Make statements inexpensive and simple to obtain (2015, part 5).
2020 update: Means should be considered by which digital FSPs should be able to view or introduce funds transfers in the ecosystem or produce records of stored value and loans (such as for VSLAs, which are important for the development of women in particular). In this regard, the RBM might consider studying the possibility of introducing application programming interface (API) requirements into the payments system.
2020
There is a need to study the possibility of real-time clearing in the payments system, so as to enable beneficiaries dependent on social grants and remittances to receive their cash instantly, but also so as to bring about greater competition between banks and digital FSPs (the latter benefit from being able to instantly notify customers that funds have been paid and received).
National coordination of financial inclusion (cross-cutting). The main body responsible for overseeing the implementation of these key activities and initiatives will be the Ministry of Finance and the Financial Sector Technical Working Group (FSTWG), which falls under the Economic Governance Sector Working Group (EGSWG) in Malawi. Since the EGSWG focuses on real-economy questions, the FSTWG is in a good position to consider the real-economy issues and then feed them into the EGSWG. The Ministry of Economic Planning and Development (which prior to July 2020 was combined with the Ministry of Finance) manages social protection programmes jointly with the Ministry of Community Welfare and oversees the National Planning Commission. These are part of the EGSWG, in turn supported by the FSTWG.
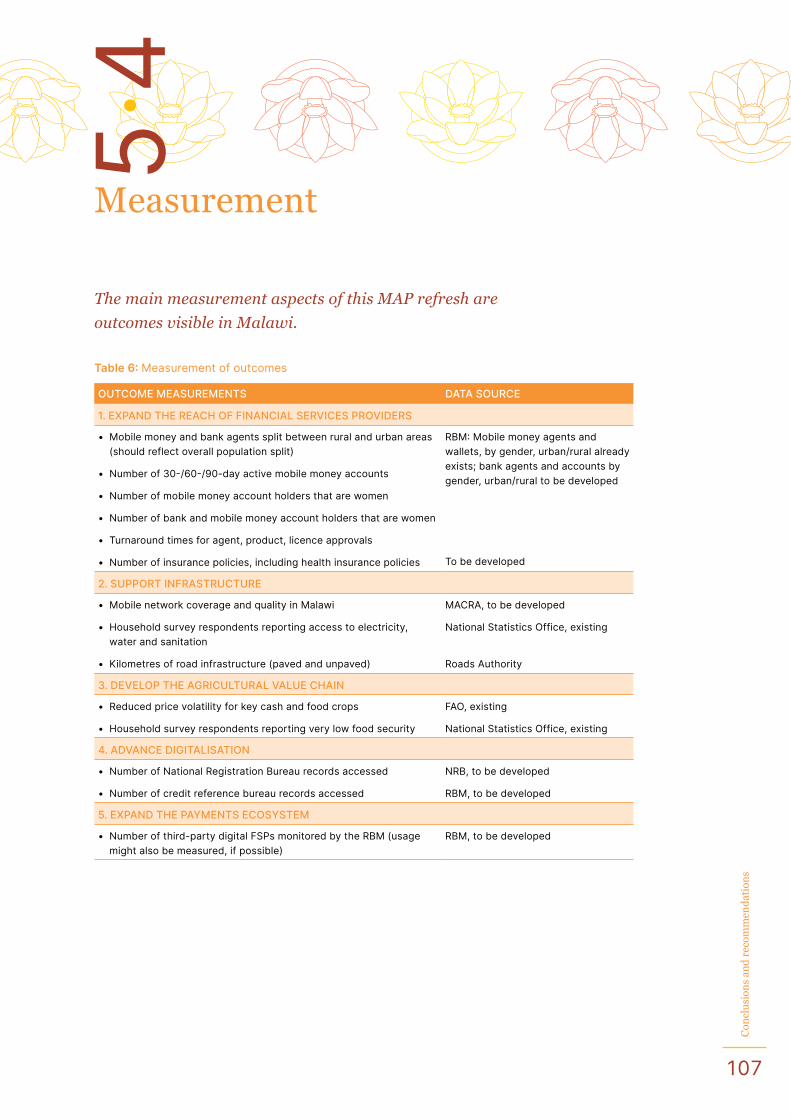
107
Con
clu
sion
s an
d r
ecom
men
dat
ion
s
Measurement
The main measurement aspects of this MAP refresh are
outcomes visible in Malawi.
Table 6: Measurement of outcomes
OUTCOME MEASUREMENTS DATA SOURCE
1. EXPAND THE REACH OF FINANCIAL SERVICES PROVIDERS
• Mobile money and bank agents split between rural and urban areas (should reflect overall population split)
• Number of 30-/60-/90-day active mobile money accounts
• Number of mobile money account holders that are women
• Number of bank and mobile money account holders that are women
• Turnaround times for agent, product, licence approvals
• Number of insurance policies, including health insurance policies
RBM: Mobile money agents and wallets, by gender, urban/rural already exists; bank agents and accounts by gender, urban/rural to be developed
To be developed
2. SUPPORT INFRASTRUCTURE
• Mobile network coverage and quality in Malawi
• Household survey respondents reporting access to electricity, water and sanitation
• Kilometres of road infrastructure (paved and unpaved)
MACRA, to be developed
National Statistics Office, existing
Roads Authority
3. DEVELOP THE AGRICULTURAL VALUE CHAIN
• Reduced price volatility for key cash and food crops
• Household survey respondents reporting very low food security
FAO, existing
National Statistics Office, existing
4. ADVANCE DIGITALISATION
• Number of National Registration Bureau records accessed
• Number of credit reference bureau records accessed
NRB, to be developed
RBM, to be developed
5. EXPAND THE PAYMENTS ECOSYSTEM
• Number of third-party digital FSPs monitored by the RBM (usage might also be measured, if possible)
RBM, to be developed
5.4
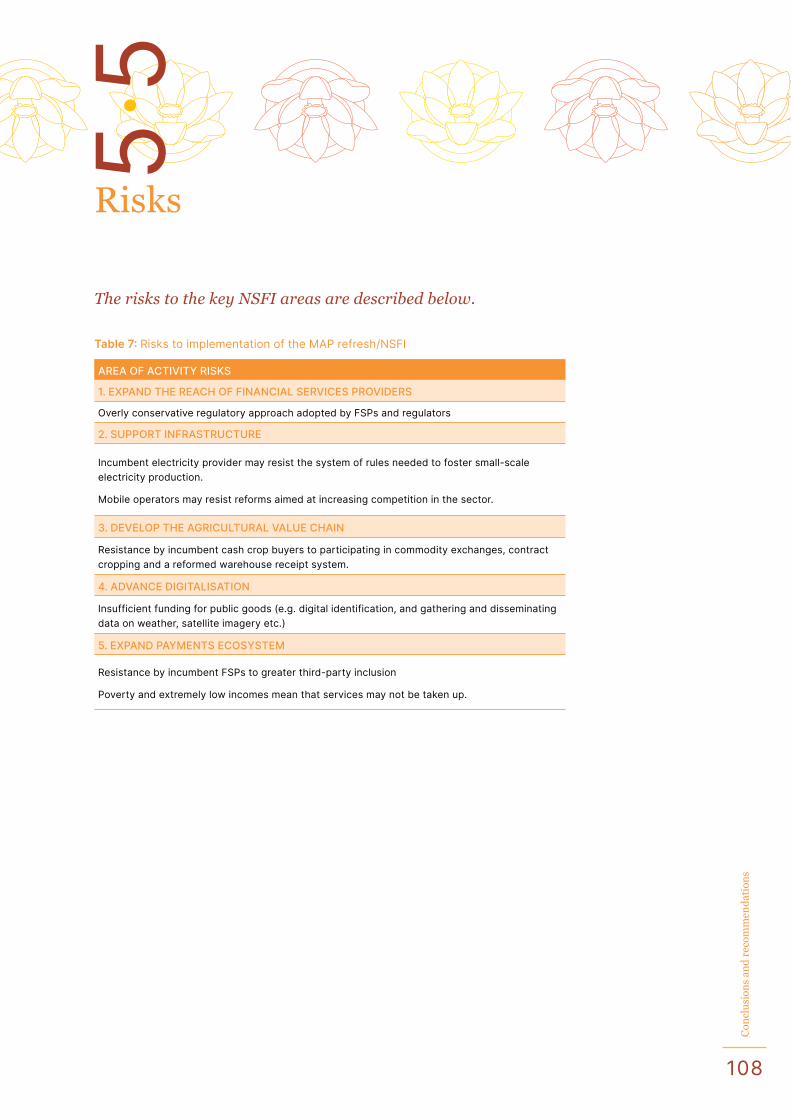
108
Con
clu
sion
s an
d r
ecom
men
dat
ion
s
Risks
The risks to the key NSFI areas are described below.
Table 7: Risks to implementation of the MAP refresh/NSFI
AREA OF ACTIVITY RISKS
1. EXPAND THE REACH OF FINANCIAL SERVICES PROVIDERS
Overly conservative regulatory approach adopted by FSPs and regulators
2. SUPPORT INFRASTRUCTURE
Incumbent electricity provider may resist the system of rules needed to foster small-scale electricity production.
Mobile operators may resist reforms aimed at increasing competition in the sector.
3. DEVELOP THE AGRICULTURAL VALUE CHAIN
Resistance by incumbent cash crop buyers to participating in commodity exchanges, contract cropping and a reformed warehouse receipt system.
4. ADVANCE DIGITALISATION
Insufficient funding for public goods (e.g. digital identification, and gathering and disseminating data on weather, satellite imagery etc.)
5. EXPAND PAYMENTS ECOSYSTEM
Resistance by incumbent FSPs to greater third-party inclusion
Poverty and extremely low incomes mean that services may not be taken up.
5.5