Embed Size (px)
Citation preview
European Financial Management, 2011doi: 10.1111/j.1468-036X.2011.00604.x
International Capital Flows into theEuropean Private Equity Market
Gael Imad’EddineUniversite Lille Nord de France – SKEMA Business School, 2 rue de Mulhouse, 59020 Lille (France)E-mail: [email protected]
Armin SchwienbacherUniversite Lille Nord de France – SKEMA Business School, 2 rue de Mulhouse, 59020 Lille, FranceE-mail: [email protected]
Abstract
In this paper, we explore the relationship between institutional investors and fundsmanagers, a relatively little studied field in private equity. We study this relationshipwithin the context of international investment flows. We address the followingquestion: When building risk-return exposure to European private companies,which US limited partners (LPs) are more likely to invest in US funds investing inEuropean targets as opposed to in European funds investing locally? We build ourresearch using a two-level analysis. We first look at which US LPs are more likelyto invest in funds focusing on Europe (regardless of whether a US or Europeanfund) to identify the active global players. And second, using only the subsample ofLPs investing in Europe-focused funds, we study which types of LPs are more likelyto provide capital to European funds investing locally as opposed to US funds witha European focus. We find that financial institutions with facilities in Europe, suchas banks and insurance companies, are more prone to invest directly in Europeanfunds. This is consistent with the transaction cost hypothesis whereby LPs maybenefit from lower costs to access valuable information to screen European funds.The presence of local facilities may further capture size effects. We also find thatpension funds often invest directly in European funds although those funds do not
We would like to thank Yasuhiro Arikawa, Jean-Gabriel Cousin, Douglas Cumming,Eric De Bodt, Michel Levasseur, Hideaki Miyajima, Mark Kamstra, Piet Sercu, LaurentVilanova, Peter Wirtz and the anonymous referee for their comments, as well as participantsof the European Financial Management Symposium 2010 Entrepreneurial Finance &Venture Capital Markets and the seminar and conference participants of the Lille Schoolof Management Research Center, the KUL-LSM Finance Workshop, the Waseda UniversityFinance and the University of Lyon. All remaining errors are our responsibility.
C© 2011 Blackwell Publishing Ltd
2 Gael Imad’Eddine and Armin Schwienbacher
possess local facilities in Europe. This may be due to their larger size that drivesthem to invest abroad or their increased experience in investing in private equity.
Keywords: private equity, international capital flows, fund management
JEL classification: F21, F3, G23, G24
1. Introduction
In September 2007, CalPers, the giant Californian pension fund, and Standard LifeInvestment Private Equity (SLIPE), a UK based investment firm, announced that CalPerswas committing €400 million into European private equity. ‘We are delighted to havebeen selected for this mandate by CalPers, the largest public pension fund in the US.This is testimony to the expertise and professionalism of our private equity team andour strong track record in the European private equity market. This is our fourth majorsegregated mandate from a North American client. Over 50% of our assets undermanagement are now from North America’,1 declared David Currie, Chief ExecutiveOfficer of SLIPE. This is just one of many other examples of partnerships between USinstitutional investors and European fund managers. The private equity2 (PE) markethas evolved into a truly global market in the last two decades, creating important capitalflows around the world.
On the one hand, such flows have been witnessed through the internationalisation ofinvestment activities of funds themselves (Megginson, 2004), investing more and moreglobally in companies outside their own national borders and continent. On the otherhand, this globalisation trend is also observed at the fundraising level of PE funds thatnow raise capital internationally. Institutional investors have become increasingly activein investing directly into PE funds outside their home country, making countries withlarge institutional investors exporters of PE capital and thus important fund providers forventure capital (VC) and buyout funds worldwide. The European market has benefitedfrom the flow of capital from US limited partners (LPs), who are major contributors tothe international PE market. PEREP Analytics, a new data provider for the EuropeanPE industry, indicates that over 25% of the capital supplied to European PE funds stemsfrom North America. Therefore, developing capabilities and reputation to attract capitalcommitments from US LPs are a key element of successful fundraising for Europeanfund managers active in private equity. This in turn can be beneficial to Europeancompanies (namely, for startups receiving venture capital as well as mature companiesfor buyout capital) as it facilitates their access to more competitive PE capital throughincreased supply of capital.
This paper aims at contributing to this gap in the literature by providing a betterunderstanding about which European-focused funds (either US or European funds) aremost capable of attracting US commitments, and which US LPs are more willing toinvest directly in European funds rather than US funds with a European focus. Morespecifically, our analysis examines how US investors provide financing to European
1 This information is available on both the CalPers and SLIPE websites: http://uk.standardlifeinvestments.com/content/press/press_releases/calpers_commits_400_million_euro_to_european_private_equity.html2 ‘Private equity’ includes both venture capital and buyout.
C© 2011 Blackwell Publishing Ltd

International Capital Flows into the European Private Equity Market 3
companies that aim at attracting VC or buyout capital, either by receiving capital fromUS funds with a European investment focus or European funds with a local investmentfocus.
This research question provides insights into the access of US investors to marketsoutside their home country. Since the US market has become more mature andcompetitive, investors have been seeking new opportunities worldwide (Megginson,2004). Understanding what affects global PE capital commitments is important fromthe LP perspective, given the potential difficulties in investing in less mature markets.Investing outside the US leads to additional costs related to differences in the legalenvironment, culture and geographical distance. While US capital also flows to Asiaand (other) emerging markets, the European market is characterised by smaller legal andcultural differences with the US.
This research question also has important policy implications. While US and Europeanfunds with a European focus ultimately fuel European firms, the two strategies arepotentially very different in nature and may have different consequences. The importanceof geographical proximity between the funds and the investee on the value-addingcapacity has been well documented, especially for the venture capital segment (Makelaand Maula, 2008; Bengtsson and Ravid, 2009; Tykvova and Schertler, 2010). A betterunderstanding of what enables European funds to attract large international (especiallyUS) LPs contributes to promoting the development of a more active buyout and venturecapital market in Europe. Several studies have addressed this policy issue from theinvestment perspective (for instance, Diller and Kaserer, 2009) but rarely from thefundraising perspective. Our paper aims at identifying drivers of the development of anactive European market from the fundraising perspective.
Given our specific research question, we focus only on direct investments made byLPs into limited partnership funds in the USA and Europe.3 The distinction betweenfund origin (i.e., whether the fund is from the USA or Europe) and geographical focus(i.e., where the fund invests its capital) is important here, and is, therefore, at the heart ofour analysis. In the context of an LP perspective, the geographical risk-return exposureis indeed better measured by examining the geographical focus rather than fund origin.
Our analysis provides several key results. Since our study is centered on US LPsinvesting in funds with a European focus, we first identify the LPs that are considered asactive ‘global players’ and thus fuel the European PE market, regardless of the countryof origin of the funds. We find that insurance companies, banks and pension funds arethe main providers of US money to European PE target companies, with pension fundsclearly being the largest providers. As predicted by the transaction costs hypothesis, wealso find that financial LPs (i.e., banks and insurance companies) are more likely toinvest in European funds as opposed to US funds. Moreover, LPs with local facilitiesin Europe have a greater propensity to invest directly in European funds, rather thanthrough US based vehicles with a European focus. This means that European fundmanagers (so-called general partners [GPs]) are more likely to get funding from US LPsif LPs have direct facilities in Europe in the form of branch offices. This gives thembetter access to information. This is particularly the case for insurance companies and
3 As robustness, we tried to extend the analysis to Asia, but faced severe lack of observations.LP investments in Asian funds are highly underrepresented in the database we used(VentureXpert). Therefore, we provide here an analysis for US and Europe only, wheredata is more available and, thus, more reliable.
C© 2011 Blackwell Publishing Ltd
4 Gael Imad’Eddine and Armin Schwienbacher
banks. An alternative reason may be that the presence of local facilities proxies for sizeof the LP. Our results are consistent with both stories, although we find no support forcorporate LPs (which favours the former story). Further, we find no significant impacton performance, suggesting that owning local facilities may lead to lower screening costsbut not to selecting better performing European funds.
Pension funds are also more prone to invest in European funds with a local focus ratherthan US funds with a European focus, although they typically do not have facilities inEurope. However, our analysis suggests that the size of capital under pension fundmanagement may allow pension funds to lower average costs of collecting information(i.e., relative of their capital under management). Moreover, they may benefit fromextensive experience. Further investigations provided in the paper point out a possiblereason for this conjecture: when investing in Europe, pension funds predominantlyinvest in less established funds where asymmetric information is relatively more severebut where deal conditions are potentially better.
Our work spans several strands of literature. The first relates to studies on theEuropean VC and buyout market, given our particular focus on this market (see, e.g.,Cumming, 2002; Da Rin et al., 2006; Hege et al., 2009). These studies, however, focuson investments by funds into companies and not capital commitments of LPs into PEfunds. General trends in the globalisation of venture capital are discussed by Megginson(2004), evidencing that cross-border investments by VC funds have become increasinglyimportant. Our study particularly focuses on drivers of cross-border investments fromthe US to Europe.
We further rely on studies focusing on the functioning of the fundraising process forPE funds and LP contracts (e.g., Gompers and Lerner, 1996, 1998; Jeng and Wells,2000; Mayer et al., 2005; Litvak, 2004). Within this strand of research, the paper that isclosest to ours is that by Lerner et al. (2007) that analyses the capital supply by differentinstitutional investors in the USA to PE funds and the associated returns. However, theiranalysis abstracts from geographical focus of investments made. Jeng and Wells (2000)and Mayer et al. (2005) offer an analysis of VC supply for (primarily) Europe, evidencingwhich macroeconomic variables foster the most the supply of capital into the market. Incontrast, Gompers and Lerner (1998) examine what has driven the overall fundraisingactivities in the US market and to what extent its past surges were driven by regulatoryand taxation changes that made private equity more attractive as an alternative asset class.LP agreements are examined in Gompers and Lerner (1996), Lerner and Schoar (2004)and Litvak (2004). We contribute to this strand by examining the source of these funds,in particular the means by which US capital is being allocated to European companies.
Finally, our study relates to the very large literature on international capital flows andits diversification impact on alternative asset classes such as private equity (see, e.g.,Froot et al., 2001; Froot and Teo, 2004). These studies treat private equity as a singleasset class; our study instead focuses on investment funds. Other studies have focused onthis topic in relation to the investment behaviour of style investments (see, e.g., Wermer,2002; Barberis and Shleifer, 2003). The importance of styles within the PE segmenthas been examined by Cumming et al. (2009). Our contribution here is to study thespecific investment strategy adopted by LPs to achieve exposure to the European PEmarket.
The remainder of our paper is structured as follows. The next section provides atheoretical discussion of why different types of LP may affect the choice of investmentstrategy. Section 3 details the source of our data, the sample considered and theconstruction of our variables. Section 4 provides a general overview of capital flows
C© 2011 Blackwell Publishing Ltd

International Capital Flows into the European Private Equity Market 5
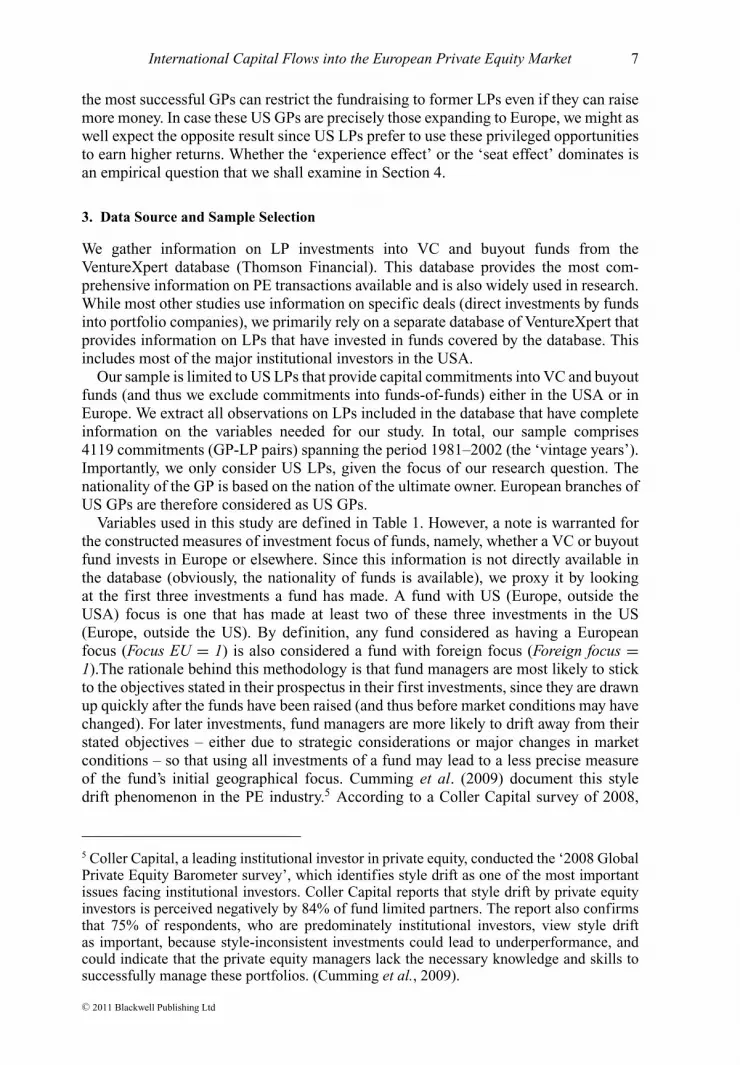
Fig. 1. US LPs global players choice of investment.
This figure presents the structure of investment strategy of US LPs for investing in European privatecompanies: the US limited partners can either choose a European private equity fund (with a Europeanfocus) or a US private equity fund with a European focus.
into Europe by relying on summary statistics of our sample. Section 5 presents our mainfindings. Section 6 concludes.
2. Theory
In this section, we develop hypotheses that provide possible explanations as to whydifferent types of fund providers (LPs) may differ in their propensity to invest directlyin European funds with a local focus as opposed to investing in US funds targetingEuropean companies. This is depicted in Figure 1.
2.1. The ‘local facilities’ hypothesis
Investments in private equity are illiquid for many years. Once the money is invested, theLP has to wait up to a decade before getting the investment back. The only way an LPcan penalise a bad GP is to refuse to add money into a new fund. Therefore, acquiringinformation to screen competent GPs is a critical step for an LP prior to making acommitment. The process of reducing information asymmetries, however, bears somecosts that lead to transaction costs for the LP. It seems logical that on average thesecosts would be higher for European funds than for US funds from the perspective of USLPs. We cite as an example the screening costs and the anticipated ex-post verificationcosts, which are aggravated by geographical distance. Another issue is the unfamiliarityof the legal environment; contracting with a partner outside the US legal system incursadditional costs to properly secure the deal because the LP must invest resources to learnabout rights and obligations.
Therefore, we conjecture that transaction costs can be a barrier for US LPs to investdirectly in European funds. We identify two ways to acquire information and therebyovercome these transaction costs. First, LPs with suitable branch offices in Europe are
C© 2011 Blackwell Publishing Ltd

6 Gael Imad’Eddine and Armin Schwienbacher
more likely to invest directly in European PE funds with a local focus, while LPs withoutown facilities in Europe prefer diversifying their portfolio towards European companiesthrough US funds with a European focus. In contrast, US GPs are more likely to beknown by US LPs. Financial institutions such as banks and insurance companies arelikely to have appropriate facilities in Europe to support the direct investment of capitalinto local funds. It is important to note that the branch network is an exogenous factorfrom the perspective of PE investments: it is the legacy from the history of the consideredinstitutions. PE investments are generally a smaller part of the overall activities of LPs.Instead, the extent of the branch network of banks and insurance companies is largelydriven by retail services offered in different countries. However, the existence of thoselocal branches can provide access to local information at lower cost, which may alsopromote capital commitments to local PE funds. This leads us to conjecture that USLPs with local facilities in Europe will be more associated with direct investments intoEuropean funds as opposed to US funds with a European focus.
Another way to acquire information is derived from the financial capacity of the LP.Since screening costs are typically fixed, large players should find it less costly (perdollar invested) to spend money on screening experienced GPs. The financial means ofa university endowment are likely to be smaller than a pension fund. When they decide toinvest abroad, LPs can pay for advice. The quality of this advice depends on the amountspent. Thus, if the LPs do not have local facilities there is always the possibility ofpurchasing the expertise. These fixed costs do not represent the same burden relative tothe size of the overall investment activity. Larger LPs may benefits from scale economies.It is recognised that the largest LPs in the US are pension funds (Lerner et al., 2007).
Note however that local facilities could be also simply capture a size effect.4 Largerinstitutions acting as LPs are more likely to invest directly in European funds for at leasttwo reasons: first, they can reach economies of scale by lowering the research costsper dollar invested; second, they might have exhausted their most valuable investmentopportunities in their home market (here the US market) in terms of talented GPs, giventhe significant amount of capital under management. In both cases, it creates incentivesto invest abroad such as into European funds. In the empirical analysis, we will addressthis alternative explanation in order to disentangle the possible size effect from thepostulated informational effect from local facilities.
2.2. Established participants hypothesis
This second hypothesis builds on the findings of Lerner et al. (2007), namely, that fundproviders that have supplied capital to the VC and buyout markets for a long time havebuilt up significant knowledge that enables them to select and at times participate inthe fundraising of the most promising funds. This avoids that these same fund providersbear the same level of asymmetric information as institutional investors who have onlyrecently started to invest in private equity through direct commitments into individualfunds. Therefore, we expect LPs with significant prior experience in selecting GPs tobe more likely to maintain their European exposure through direct investments intoEuropean local funds as opposed to with US funds with a European focus.
Lerner et al. (2007) document the fact that established LPs have a ‘seat at the table’ attheir US funds; i.e., US GPs may reward their LPs for their earlier contributions so that
4 We thank the anonymous reviewer for pointing this out.
C© 2011 Blackwell Publishing Ltd
International Capital Flows into the European Private Equity Market 7
the most successful GPs can restrict the fundraising to former LPs even if they can raisemore money. In case these US GPs are precisely those expanding to Europe, we might aswell expect the opposite result since US LPs prefer to use these privileged opportunitiesto earn higher returns. Whether the ‘experience effect’ or the ‘seat effect’ dominates isan empirical question that we shall examine in Section 4.
3. Data Source and Sample Selection
We gather information on LP investments into VC and buyout funds from theVentureXpert database (Thomson Financial). This database provides the most com-prehensive information on PE transactions available and is also widely used in research.While most other studies use information on specific deals (direct investments by fundsinto portfolio companies), we primarily rely on a separate database of VentureXpert thatprovides information on LPs that have invested in funds covered by the database. Thisincludes most of the major institutional investors in the USA.
Our sample is limited to US LPs that provide capital commitments into VC and buyoutfunds (and thus we exclude commitments into funds-of-funds) either in the USA or inEurope. We extract all observations on LPs included in the database that have completeinformation on the variables needed for our study. In total, our sample comprises4119 commitments (GP-LP pairs) spanning the period 1981–2002 (the ‘vintage years’).Importantly, we only consider US LPs, given the focus of our research question. Thenationality of the GP is based on the nation of the ultimate owner. European branches ofUS GPs are therefore considered as US GPs.
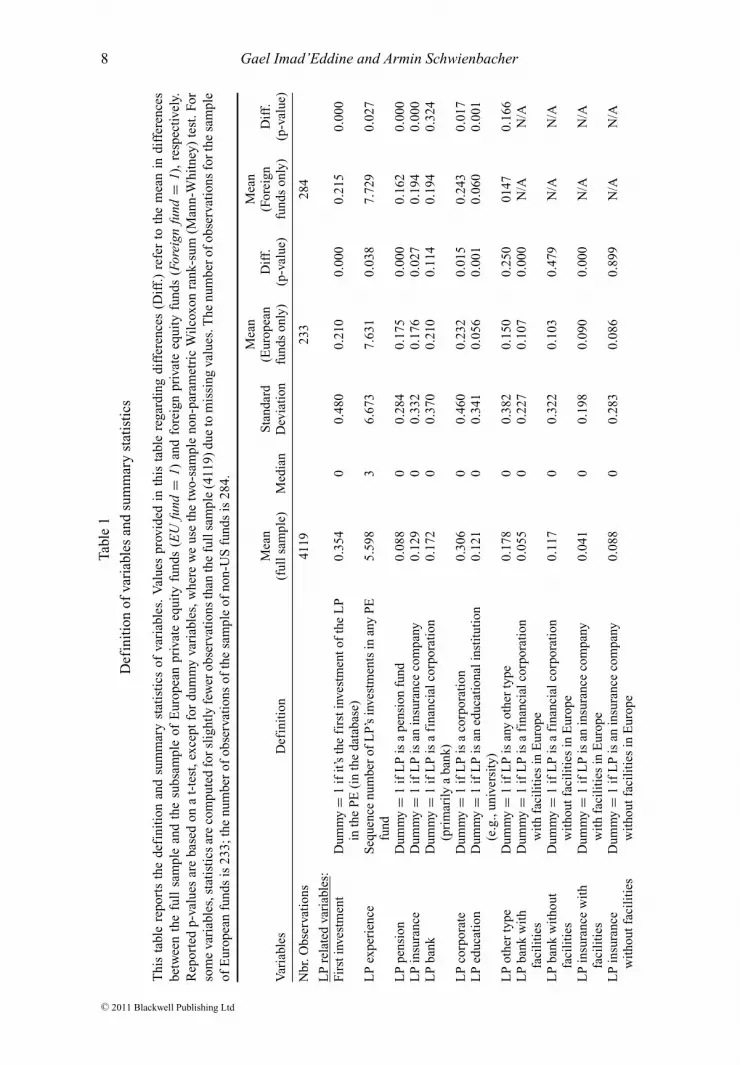
Variables used in this study are defined in Table 1. However, a note is warranted forthe constructed measures of investment focus of funds, namely, whether a VC or buyoutfund invests in Europe or elsewhere. Since this information is not directly available inthe database (obviously, the nationality of funds is available), we proxy it by lookingat the first three investments a fund has made. A fund with US (Europe, outside theUSA) focus is one that has made at least two of these three investments in the US(Europe, outside the US). By definition, any fund considered as having a Europeanfocus (Focus EU = 1) is also considered a fund with foreign focus (Foreign focus =1).The rationale behind this methodology is that fund managers are most likely to stickto the objectives stated in their prospectus in their first investments, since they are drawnup quickly after the funds have been raised (and thus before market conditions may havechanged). For later investments, fund managers are more likely to drift away from theirstated objectives – either due to strategic considerations or major changes in marketconditions – so that using all investments of a fund may lead to a less precise measureof the fund’s initial geographical focus. Cumming et al. (2009) document this styledrift phenomenon in the PE industry.5 According to a Coller Capital survey of 2008,
5 Coller Capital, a leading institutional investor in private equity, conducted the ‘2008 GlobalPrivate Equity Barometer survey’, which identifies style drift as one of the most importantissues facing institutional investors. Coller Capital reports that style drift by private equityinvestors is perceived negatively by 84% of fund limited partners. The report also confirmsthat 75% of respondents, who are predominately institutional investors, view style driftas important, because style-inconsistent investments could lead to underperformance, andcould indicate that the private equity managers lack the necessary knowledge and skills tosuccessfully manage these portfolios. (Cumming et al., 2009).
C© 2011 Blackwell Publishing Ltd
8 Gael Imad’Eddine and Armin Schwienbacher
Tabl
e1
Def
init
ion
ofva
riab
les
and
sum
mar
yst
atis
tics
Thi
sta
ble
repo
rts
the
defi
niti
onan
dsu
mm
ary
stat
isti
csof
vari
able
s.V
alue
spr
ovid
edin
this
tabl
ere
gard
ing
diff
eren
ces
(Dif
f.)
refe
rto
the
mea
nin
diff
eren
ces
betw
een
the
full
sam
ple
and
the
subs
ampl
eof
Eur
opea
npr
ivat
eeq
uity
fund
s(E
Ufu
nd=
1)an
dfo
reig
npr
ivat
eeq
uity
fund
s(F
orei
gnfu
nd=
1),
resp
ectiv
ely.
Rep
orte
dp-
valu
esar
eba
sed
ona
t-te
st,e
xcep
tfo
rdu
mm
yva
riab
les,
whe
rew
eus
eth
etw
o-sa
mpl
eno
n-pa
ram
etri
cW
ilco
xon
rank
-sum
(Man
n-W
hitn
ey)
test
.For
som
eva
riab
les,
stat
isti
csar
eco
mpu
ted
for
slig
htly
few
erob
serv
atio
nsth
anth
efu
llsa
mpl
e(4
119)
due
tom
issi
ngva
lues
.The
num
ber
ofob
serv
atio
nsfo
rth
esa
mpl
eof
Eur
opea
nfu
nds
is23
3;th
enu
mbe
rof
obse
rvat
ions
ofth
esa
mpl
eof
non-
US
fund
sis
284.
Mea
nM
ean
Mea
nS
tand
ard
(Eur
opea
nD
iff.
(For
eign
Dif
f.V
aria
bles
Def
init
ion
(ful
lsam
ple)
Med
ian
Dev
iati
onfu
nds
only
)(p
-val
ue)
fund
son
ly)
(p-v
alue
)
Nbr
.Obs
erva
tion
s41
1923
328
4
LP
rela
ted
vari
able
s:Fi
rsti
nves
tmen
tD
umm
y=
1if
it’s
the
firs
tinv
estm
ento
fth
eL
Pin
the
PE
(in
the
data
base
)0.
354
00.
480
0.21
00.
000
0.21
50.
000
LP
expe
rien
ceS
eque
nce
num
ber
ofL
P’s
inve
stm
ents
inan
yP
Efu
nd5.
598
36.
673
7.63
10.
038
7.72
90.
027
LP
pens
ion
Dum
my
=1
ifL
Pis
ape
nsio
nfu
nd0.
088
00.
284
0.17
50.
000
0.16
20.
000
LP
insu
ranc
eD
umm
y=
1if
LP
isan
insu
ranc
eco
mpa
ny0.
129
00.
332
0.17
60.
027
0.19
40.
000
LP
bank
Dum
my
=1
ifL
Pis
afi
nanc
ialc
orpo
rati
on(p
rim
arily
aba
nk)
0.17
20
0.37
00.
210
0.11
40.
194
0.32
4
LP
corp
orat
eD
umm
y=
1if
LP
isa
corp
orat
ion
0.30
60
0.46
00.
232
0.01
50.
243
0.01
7L
Ped
ucat
ion
Dum
my
=1
ifL
Pis
aned
ucat
iona
lins
titu
tion
(e.g
.,un
iver
sity
)0.
121
00.
341
0.05
60.
001
0.06
00.
001
LP
othe
rty
peD
umm
y=
1if
LP
isan
yot
her
type
0.17
80
0.38
20.
150
0.25
001
470.
166
LP
bank
wit
hfa
cili
ties
Dum
my
=1
ifL
Pis
afi
nanc
ialc
orpo
rati
onw
ith
faci
liti
esin
Eur
ope
0.05
50
0.22
70.
107
0.00
0N
/AN
/A
LP
bank
wit
hout
faci
liti
esD
umm
y=
1if
LP
isa
fina
ncia
lcor
pora
tion
wit
hout
faci
liti
esin
Eur
ope
0.11
70
0.32
20.
103
0.47
9N
/AN
/A
LP
insu
ranc
ew
ith
faci
liti
esD
umm
y=
1if
LP
isan
insu
ranc
eco
mpa
nyw
ith
faci
liti
esin
Eur
ope
0.04
10
0.19
80.
090
0.00
0N
/AN
/A
LP
insu
ranc
ew
itho
utfa
cili
ties
Dum
my
=1
ifL
Pis
anin
sura
nce
com
pany
wit
hout
faci
liti
esin
Eur
ope
0.08
80
0.28
30.
086
0.89
9N
/AN
/A
C© 2011 Blackwell Publishing Ltd

International Capital Flows into the European Private Equity Market 9
LP
corp
orat
ew
ith
faci
liti
esD
umm
y=
1if
LP
isa
corp
orat
ion
wit
hfa
cili
ties
inE
urop
e0.
145
00.
123
0.15
00.
814
N/A
N/A
LP
corp
orat
ew
itho
utfa
cili
ties
Dum
my
=1
ifL
Pis
aco
rpor
atio
nw
itho
utfa
cili
ties
inE
urop
e0.
160
00.
367
0.08
10.
000
N/A
N/A
LP
fina
ncia
lwit
hfa
cili
ties
Dum
my
=1
ifL
Pis
afi
nanc
ialL
P(i
nsur
ance
orba
nk)
wit
ha
Eur
opea
nfa
cili
ty0.
096
00.
294
0.19
70.
000
N/A
N/A
LP
fina
ncia
lw
itho
utfa
cili
ties
Dum
my
=1
ifL
Pis
afi
nanc
ialL
P(i
nsur
ance
orba
nk)
wit
hout
aE
urop
ean
faci
lity
0.20
60
0.40
40.
189
0.50
8N
/AN
/A
GP
&fu
ndre
late
dva
riab
les:
Fun
dse
quen
ceS
eque
nce
num
ber
ofth
efu
ndat
the
tim
eof
the
deal
5.83
34
5.37
75.
163
0.20
54.
777
0.28
5
Fun
dsi
zeF
und
size
inm
illi
ons
ofU
SD
799.
138
8.5
1092
.711
34.6
0.00
198
2.4
0.09
9V
Cfu
ndD
umm
y=
1if
fund
’sin
vest
men
tfoc
usis
vent
ure
capi
tal
0.43
30
0.49
10.
253
0.00
00.
292
0.00
0
Buy
outf
und
Dum
my
=1
iffu
nd’s
inve
stm
entf
ocus
isbu
yout
0.42
40
0.49
40.
712
0.00
00.
676
0.00
0O
ther
fund
Dum
my
=1
iffu
nd’s
inve
stm
entf
ocus
isne
ithe
rV
Cor
buyo
ut0.
143
00.
350.
035
0.00
00.
032
0.00
0
US
fund
Dum
my
=1
iffu
ndis
from
the
US
0.93
11
0.24
80.
000
0.00
00.
000
0.00
0E
Ufu
ndD
umm
y=
1if
fund
isfr
omE
urop
e0.
057
00.
227
1.00
00.
000
0.82
00.
000
Fore
ign
fund
Dum
my
=1
iffu
ndis
notf
rom
the
US
0.06
90
0.24
81.
000
0.00
01.
000
0.00
0Fo
cus
US
Dum
my
=1
iffu
ndfo
cuse
son
US
inve
stm
ents
0.84
00
0.36
70.
077
0.00
00.
116
0.00
0Fo
cus
EU
Dum
my
=1
iffu
ndfo
cuse
son
Eur
opea
nin
vest
men
ts0.
096
00.
294
0.82
80.
000
0.68
00.
000
Focu
sfo
reig
nD
umm
y=
1if
fund
focu
ses
onno
n-U
Sin
vest
men
ts(i
ncl.
Eur
ope)
0.16
00
0.36
60.
914
0.00
00.
877
0.00
0
EU
Fun
dE
UD
umm
y=
1if
EU
fund
=1
and
Focu
sE
U=
10.
044
00.
205
0.83
70.
000
0.69
00.
000
Mar
ketc
ondi
tion
vari
able
:F
undr
aisi
ngN
atur
allo
gari
thm
ofth
ede
flat
edto
tala
mou
ntra
ised
byth
eP
Ein
dust
ryin
the
cons
ider
edye
ar
10.1
4510
.249
0.92
910
.336
0.06
210
.311
0.01
7
C© 2011 Blackwell Publishing Ltd

10 Gael Imad’Eddine and Armin Schwienbacher
the style drift practice is generally perceived negatively. Therefore, it is unlikely thatthe first investments would deviate from the objectives stated in the prospectus. Theseobjectives were assessed by the LPs to determine their exposure to certain asset classesand geographical diversification. Nevertheless, style drifts exists in private equity andcan occur later in the life cycle of funds based on economic reasons such as majorchanges in market potentials and opportunities.
It is important to note that we only include direct investments by LPs into funds butdo not consider investments made by LPs in private equity through the intermediation offunds-of-funds, who may also offer LPs an exposure to PE investments. This limitationstems from the data available in VentureXpert. To our knowledge, there is no separatedatabase available that would allow us to consider this alternative investment option.This leads to an important limitation of our study that inevitably affects the scope ofour analysis and conclusions. But it should be noted that investments in funds-of-fundsis an even more ‘distant’ way to make investments. As we are concerned with whichLPs are better able to make more direct investments, those opting for funds-of-fundsare even less able to overcome the information asymmetry issue of distant geographicalexposure.
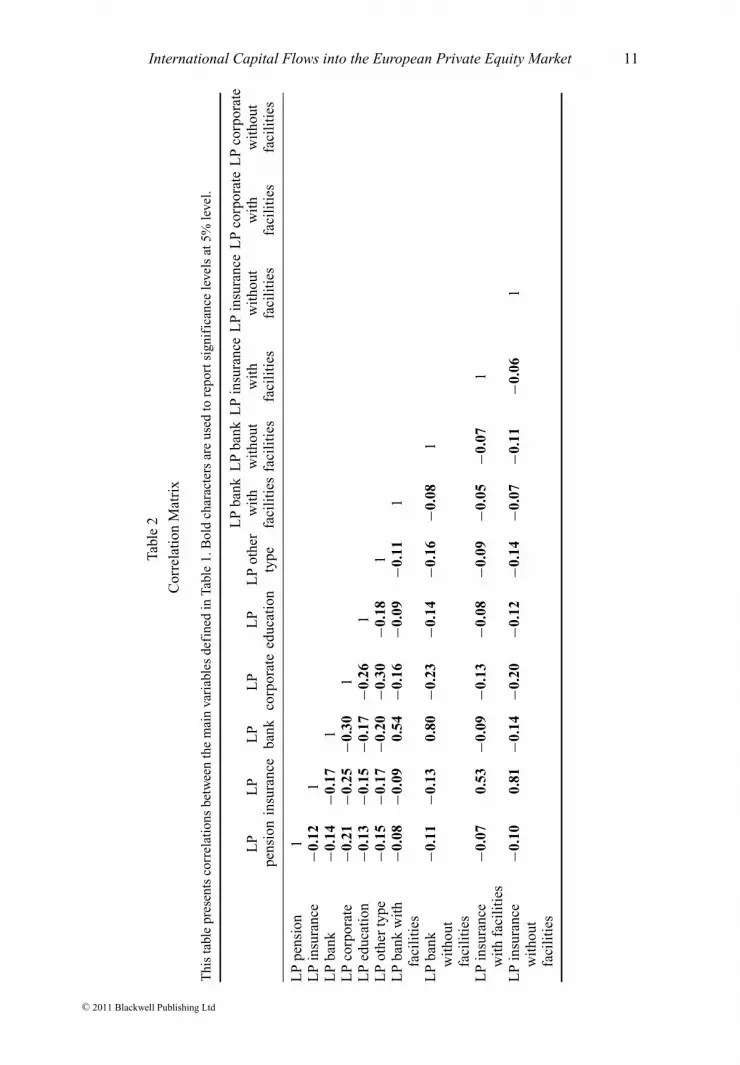
We use several dummies to identify the LP types: insurance companies (LP insurance),banks (LP bank), corporations (LP corporate), educational institutions and endowments(LP education), pension funds (LP pension) and one dummy for all other types (LPother). We also include a VC/buyout dummy in some regressions to allow us to identifythe type of funds. Our database is composed of VC funds, pure buyout funds andsome others funds. We use two definitions of the LP experience: the age of the LP atthe time of the investment (LP experience); and the ‘first investment’ dummy (Firstinvestment). We also include market condition variables. Throughout the analysis, weuse a measure of aggregate PE fundraising (the variable Fundraising).6 Year dummiesare always included unless stated otherwise. Other regression results are available uponrequest from the authors. Apart these three market condition variables, our variablesdo not show any correlation issue in the multivariate analysis. A complete correlationmatrix is provided in Table 2.
Lastly, in order to establish whether an LP owns local facilities in Europe we use theORBIS database provided by Bureau Van Dyck and complement the information bysearching the Internet when necessary. The database offers information on the existenceof subsidiaries and whether it is a sister company (in which case we can also obtaininformation on the parent company). Our variable that captures the existence of localfacilities in Europe takes the value of one if the LP has a subsidiary or a sister firm inEurope at the time of the commitment, and zero otherwise. This variable gives usefulinformation about the presence of the LP in Europe through a subsidiary (or a sistercompany). Our asymmetric information hypothesis would lead us to predict a positiveeffect for financial institutions with local facilities, but not necessarily for pension funds.Local facilities is unlikely to impact corporate LPs either, since these are essentiallyoperational facilities that provide little gains in terms of access to financial investments.
6 As robustness, we considered other market variables that are based on the MSCI IndexEurope and that control for the post-1997 period. These measures are essentially exchangeablein our estimation with our variable Fundraising. Thus, we only include Fundraising to controlfor market conditions. The other coefficients are not affected by the choice of any one ofthese alternative measures.
C© 2011 Blackwell Publishing Ltd
International Capital Flows into the European Private Equity Market 11
Tabl
e2
Cor
rela
tion
Mat
rix
Thi
sta
ble
pres
ents
corr
elat
ions
betw
een
the
mai
nva
riab
les
defi
ned
inTa
ble
1.B
old
char
acte
rsar
eus
edto
repo
rtsi
gnif
ican
cele
vels
at5%
leve
l.
LP
bank
LP
bank
LP
insu
ranc
eL
Pin
sura
nce
LP
corp
orat
eL
Pco
rpor
ate
LP
LP
LP
LP
LP
LP
othe
rw
ith
wit
hout
wit
hw
itho
utw
ith
wit
hout
pens
ion
insu
ranc
eba
nkco
rpor
ate
educ
atio
nty
pefa
cili
ties
faci
liti
esfa
cili
ties
faci
liti
esfa
cili
ties
faci
liti
es
LP
pens
ion
1L
Pin
sura
nce
−0.1
21
LP
bank
−0.1
4−0
.17
1L
Pco
rpor
ate
−0.2
1−0
.25
−0.3
01
LP
educ
atio
n−0
.13
−0.1
5−0
.17
−0.2
61
LP
othe
rty
pe−0
.15
−0.1
7−0
.20
−0.3
0−0
.18
1L
Pba
nkw
ith
faci
liti
es−0
.08
−0.0
90.
54−0
.16
−0.0
9−0
.11
1
LP
bank
wit
hout
faci
liti
es
−0.1
1−0
.13
0.80
−0.2
3−0
.14
−0.1
6−0
.08
1
LP
insu
ranc
ew
ith
faci
liti
es−0
.07
0.53
−0.0
9−0
.13
−0.0
8−0
.09
−0.0
5−0
.07
1
LP
insu
ranc
ew
itho
utfa
cili
ties
−0.1
00.
81−0
.14
−0.2
0−0
.12
−0.1
4− 0
.07
−0.1
1−0
.06
1
C© 2011 Blackwell Publishing Ltd

12 Gael Imad’Eddine and Armin Schwienbacher
Tab
le2
Con
tinu
ed.
LP
bank
LP
bank
LP
insu
ranc
eL
Pin
sura
nce
LP
corp
orat
eL
Pco
rpor
ate
LP
LP
LP
LP
LP
LP
othe
rw
ith
wit
hout
wit
hw
itho
utw
ith
wit
hout
pens
ion
insu
ranc
eba
nkco
rpor
ate
educ
atio
nty
pefa
cili
ties
faci
liti
esfa
cili
ties
faci
liti
esfa
cili
ties
faci
liti
es
LP
corp
orat
ew
ith
faci
liti
es−0
.14
−0.1
6−0
.18
0.63
−0.1
6−0
.19
−0.1
0−0
.15
−0.0
8−0
.13
1
LP
corp
orat
ew
itho
utfa
cili
ties
−0.1
4−0
.16
−0.1
90.
65−0
.17
−0.2
0−0
.10
−0.1
5−0
.09
−0.1
3−0
.18
1
Firs
tinv
estm
ent
−0.1
5−0
.13
0.16
0.19
−0.0
6−0
.09
−0.0
40.
21−0
.09
−0.0
9−0
.06
0.30
LP
expe
rien
ce0.
150.
16−0
.14
−0.1
50.
060.
000.
05−0
.20
0.09
0.12
0.04
−0.2
2V
Cfu
nd−0
.06
−0.0
00.
060.
10−0
.08
−0.0
5−0
.02
0.08
−0.0
20.
01−0
.02
0.14
Buy
outf
und
0.01
0.01
0.02
−0.0
5−0
.01
0.04
0.05
−0.0
10.
03− 0
.01
−0.0
1−0
.06
Oth
erfu
nd0.
06−0
.00
−0.0
9−0
.05
0.10
0.02
−0.0
3−0
.09
−0.0
0−0
.00
0.03
−0.1
0F
undr
aisi
ng0.
17−0
.05
−0.0
4−0
.20
0.08
0.13
0.05
−0.0
90.
01−0
.06
−0.0
4−0
.22
Firs
tinv
estm
ent
LP
expe
rien
ceV
Cfu
ndB
uyou
tfun
dO
ther
fund
Firs
tinv
estm
ent
1L
Pex
peri
ence
−0.6
41
VC
fund
0.19
−0.0
91
Buy
outf
und
−0.1
50.
10−0
.66
1O
ther
fund
−0.0
5−0
.01
−0.4
1−0
.41
1F
undr
aisi
ng−0
.46
0.43
−0.2
00.
22−0
.01
C© 2011 Blackwell Publishing Ltd
International Capital Flows into the European Private Equity Market 13
4. International Capital Flows to European Companies through Private Equity
In this section, we document some observations with regards to capital flows based onLP capital commitments into the European PE market.
4.1. Analysis of how geographical focus has evolved over time
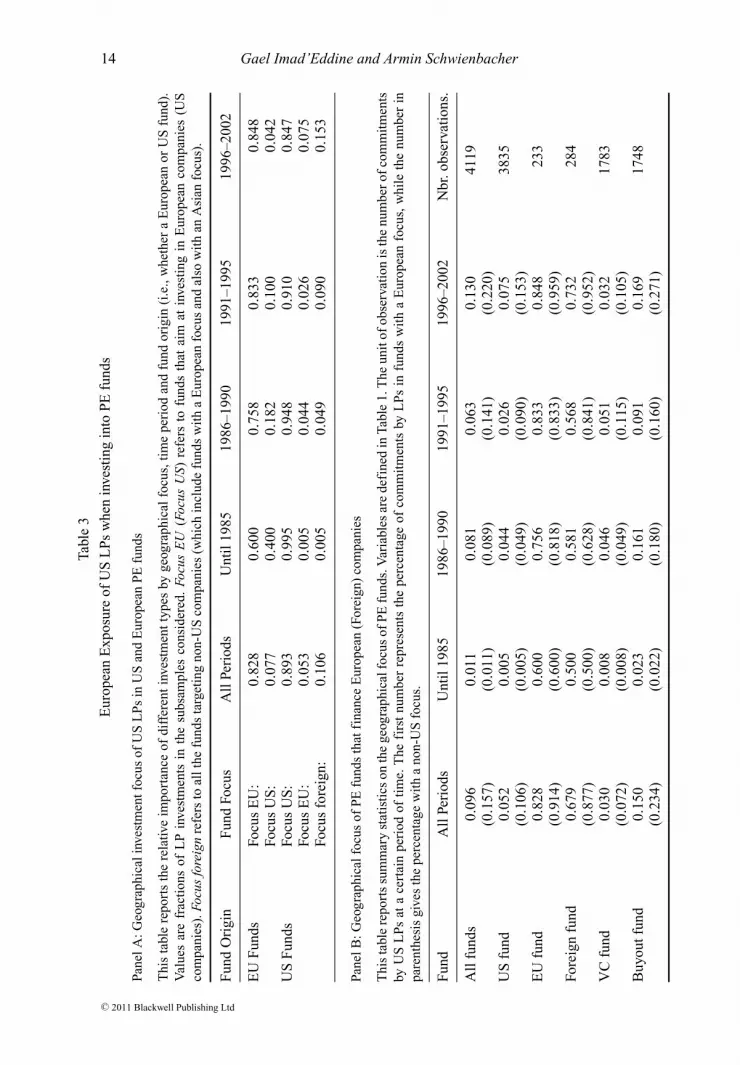
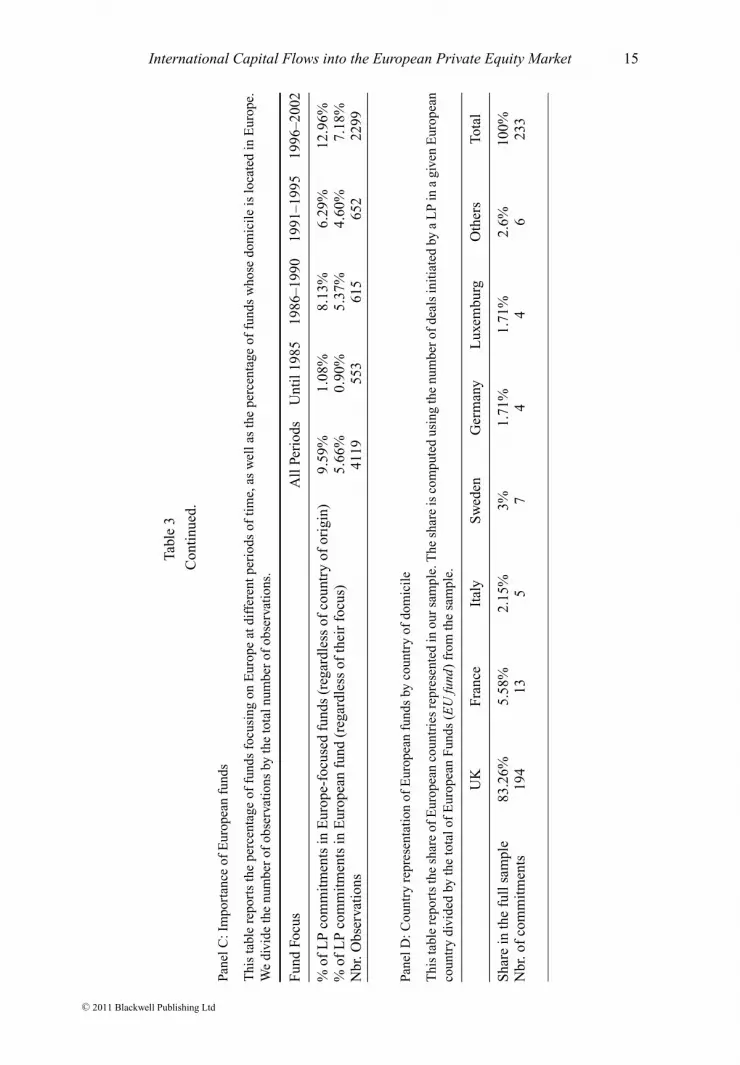
The interest by US LPs for Europe-focused funds has increased over time. Panel A inTable 3 shows that European funds have increased their deals with US LPs over time,especially in the latest period of our sample (1996–2002). The geographical focuson European targets by US funds has increased, reaching 7.5% of the LP capitalcommitments in the most recent period of 1996–2002. This is impressive growthcompared to before 1985, where Europe accounts for only 0.5% of LP commitments inUS funds. When looking at all the funds (Table 3, Panel C), we see that the Europeanprivate corporate market has increased in importance significantly over time. Before1985, it represented only 0.9% of US LP commitments, while 7.2% in the last period. Thisgrowth is due to increased interest of US funds focusing on European private companies,and also to the development of European PE funds investing on the European continent.When looking at funds focusing on Europe (either US funds or European funds), thepercentage value grows from 1% before 1985, to 12.9% in the last period of 1996–2002.This shows that the overall growth of the European PE market is due to both Europeanfunds attracting US LPs, as well as increase of European interest by US funds.
A closer look at the composition of the European funds (Table 3, Panel D) showsthat the vast majority of capital commitments by US LPs goes to UK funds (83.26%).The UK has a well developed PE market – primarily buyout – and large institutionalinvestors capable of channeling capital to the market. Other countries, including Franceand Germany, attract US LPs to a much lower magnitude.7
4.2. Analysis of how LP types differ from each other
Table 1 provides summary statistics on the relative importance of the different LP types.Overall, the bulk of the commitments to PE funds is by financial institutions (banks).In our sample, 30.6% of the deals are by corporate-affiliated LPs. This fraction has,however, been decreasing over time. Since 1985, the share has been decreasing steadilyfrom 50.8% down to 21.5% (values not reported in Table 1). The second largest providersof funds are financial institutions with 17.2%, followed by insurance companies with12.9%. Put together they represent 30% of the capital commitments into funds. Again,these shares have evolved over our sample period. Financial LPs started at around 26.8%,then dropped to 15.2%. Insurance companies contributed 12.3% of commitments until1985, about 17% from 1986 to 1995, but then only 10.7% in the most recent period
7 Assessing the representativeness of our sample is extremely difficult, since there areno alternative data available from other studies or general statistics from professionalassociations. The only data we could find are from PEREP’s 2007 survey available onthe European Private Equity and Venture Capital Association (EVCA) website. Our data arefor a longer time period than just 2007, which makes comparison difficult. At first sight, itis unclear whether the survey excludes investments in funds-of-funds, but we see that thetrends remain similar. According to the survey, the UK share is decreasing while increasingin the rest of Europe.
C© 2011 Blackwell Publishing Ltd
14 Gael Imad’Eddine and Armin Schwienbacher
Tabl
e3
Eur
opea
nE
xpos
ure
ofU
SL
Ps
whe
nin
vest
ing
into
PE
fund
s
Pane
lA:G
eogr
aphi
cali
nves
tmen
tfoc
usof
US
LP
sin
US
and
Eur
opea
nP
Efu
nds
Thi
sta
ble
repo
rts
the
rela
tive
impo
rtan
ceof
diff
eren
tin
vest
men
tty
pes
byge
ogra
phic
alfo
cus,
tim
epe
riod
and
fund
orig
in(i
.e.,
whe
ther
aE
urop
ean
orU
Sfu
nd).
Val
ues
are
frac
tion
sof
LP
inve
stm
ents
inth
esu
bsam
ples
cons
ider
ed.
Focu
sE
U(F
ocus
US)
refe
rsto
fund
sth
atai
mat
inve
stin
gin
Eur
opea
nco
mpa
nies
(US
com
pani
es).
Focu
sfo
reig
nre
fers
toal
lthe
fund
sta
rget
ing
non-
US
com
pani
es(w
hich
incl
ude
fund
sw
ith
aE
urop
ean
focu
san
dal
sow
ith
anA
sian
focu
s).
Fun
dO
rigi
nF
und
Focu
sA
llPe
riod
sU
ntil
1985
1986
–199
019
91–1
995
1996
–200
2
EU
Fun
dsFo
cus
EU
:0.
828
0.60
00.
758
0.83
30.
848
Focu
sU
S:
0.07
70.
400
0.18
20.
100
0.04
2U
SF
unds
Focu
sU
S:
0.89
30.
995
0.94
80.
910
0.84
7Fo
cus
EU
:0.
053
0.00
50.
044
0.02
60.
075
Focu
sfo
reig
n:0.
106
0.00
50.
049
0.09
00.
153
Pane
lB:G
eogr
aphi
calf
ocus
ofP
Efu
nds
that
fina
nce
Eur
opea
n(F
orei
gn)
com
pani
es
Thi
sta
ble
repo
rts
sum
mar
yst
atis
tics
onth
ege
ogra
phic
alfo
cus
ofP
Efu
nds.
Var
iabl
esar
ede
fine
din
Tabl
e1.
The
unit
ofob
serv
atio
nis
the
num
ber
ofco
mm
itm
ents
byU
SL
Ps
ata
cert
ain
peri
odof
tim
e.T
hefi
rst
num
ber
repr
esen
tsth
epe
rcen
tage
ofco
mm
itm
ents
byL
Ps
infu
nds
wit
ha
Eur
opea
nfo
cus,
whi
leth
enu
mbe
rin
pare
nthe
sis
give
sth
epe
rcen
tage
wit
ha
non-
US
focu
s.
Fun
dA
llPe
riod
sU
ntil
1985
1986
–199
019
91–1
995
1996
–200
2N
br.o
bser
vati
ons.
All
fund
s0.
096
0.01
10.
081
0.06
30.
130
4119
(0.1
57)
(0.0
11)
(0.0
89)
(0.1
41)
(0.2
20)
US
fund
0.05
20.
005
0.04
40.
026
0.07
538
35(0
.106
)(0
.005
)(0
.049
)(0
.090
)(0
.153
)E
Ufu
nd0.
828
0.60
00.
756
0.83
30.
848
233
(0.9
14)
(0.6
00)
(0.8
18)
(0.8
33)
(0.9
59)
Fore
ign
fund
0.67
90.
500
0.58
10.
568
0.73
228
4(0
.877
)(0
.500
)(0
.628
)(0
.841
)(0
.952
)V
Cfu
nd0.
030
0.00
80.
046
0.05
10.
032
1783
(0. 0
72)
(0.0
08)
(0.0
49)
(0.1
15)
(0.1
05)
Buy
outf
und
0.15
00.
023
0.16
10.
091
0.16
917
48(0
.234
)(0
.022
)(0
.180
)(0
.160
)(0
.271
)
C© 2011 Blackwell Publishing Ltd
International Capital Flows into the European Private Equity Market 15
Tabl
e3
Con
tinu
ed.
Pane
lC:I
mpo
rtan
ceof
Eur
opea
nfu
nds
Thi
sta
ble
repo
rts
the
perc
enta
geof
fund
sfo
cusi
ngon
Eur
ope
atdi
ffer
entp
erio
dsof
tim
e,as
wel
las
the
perc
enta
geof
fund
sw
hose
dom
icil
eis
loca
ted
inE
urop
e.W
edi
vide
the
num
ber
ofob
serv
atio
nsby
the
tota
lnum
ber
ofob
serv
atio
ns.
Fun
dFo
cus
All
Peri
ods
Unt
il19
8519
86–1
990
1991
–199
519
96–2
002
%of
LP
com
mit
men
tsin
Eur
ope-
focu
sed
fund
s(r
egar
dles
sof
coun
try
ofor
igin
)9.
59%
1.08
%8.
13%
6.29
%12
.96%
%of
LP
com
mit
men
tsin
Eur
opea
nfu
nd(r
egar
dles
sof
thei
rfo
cus)
5.66
%0.
90%
5.37
%4.
60%
7.18
%N
br.O
bser
vati
ons
4119
553
615
652
2299
Pane
lD:C
ount
ryre
pres
enta
tion
ofE
urop
ean
fund
sby
coun
try
ofdo
mic
ile
Thi
sta
ble
repo
rts
the
shar
eof
Eur
opea
nco
untr
ies
repr
esen
ted
inou
rsa
mpl
e.T
hesh
are
isco
mpu
ted
usin
gth
enu
mbe
rof
deal
sin
itia
ted
bya
LP
ina
give
nE
urop
ean
coun
try
divi
ded
byth
eto
talo
fE
urop
ean
Fun
ds(E
Ufu
nd)
from
the
sam
ple.
UK
Fran
ceIt
aly
Sw
eden
Ger
man
yL
uxem
burg
Oth
ers
Tota
l
Sha
rein
the
full
sam
ple
83.2
6%5.
58%
2.15
%3%
1.71
%1.
71%
2.6%
100%
Nbr
.of
com
mit
men
ts19
413
57
44
623
3
C© 2011 Blackwell Publishing Ltd

16 Gael Imad’Eddine and Armin Schwienbacher
(1996–2002). Educational institutions and endowments have instead increased theirshare during the sample period from 4.9% to 13.8% in the last time period considered.
5. Empirical Analysis
In this section, we present empirical results on the investment behaviour of US LPsinvesting in VC and buyout funds. We focus on LP capital commitments targetingfunds with Europe as a geographical focus — i.e., those who aim at ultimately providingfinance to European mature corporations (through buyouts) and startups (through venturecapital). In Section 5.1, we investigate which US LPs invest in funds with Europe as ageographical focus. Since such a focus can be achieved either by investing in US fundstargeting European investments or in European funds investing locally, we rely for ourdependent variable on a dummy variable that captures whether a fund (US or European)takes such a geographical focus. This allows us to investigate which US LP types areglobal players (i.e., seeking international exposure into PE assets) as opposed to thoseinvesting only in US focused funds. For each LP type not all LPs are global investors.However, we aim to identify LP type has a higher propensity to be global players. InSection 5.2, we then focus on this ‘global player’ subsample, to investigate which of thetwo strategies presented in Figure 1 is preferred. This will allow us to test the empiricalpredictions developed in Section 2.
5.1. Which US fund providers have a European focus?
To investigate which US institutional investors are more likely to invest in fundswith a European focus, we regress the geographical focus of funds (Focus EU) onLP characteristics and several control variables. In all our regressions we use logisticregression models with standard errors robust to clustering at the fund level.8 Our mainvariables of interest are the ones related to the specific LP type. This regression allows usto identify the types most prone to be global players targeting the European PE market.
Results are provided in Table 4, Panels A and B. Panel A shows results for the LP typewithout taking into account the existence of European facilities. Panel B shows resultsincluding these European facilities.
Regressions (1)–(2) are based on the full sample, while regressions (3) & (4) areon investments in VC and buyout funds subsamples respectively. We use the group ofLP corporate as reference group to analyse the effect of the different LP types. Theyshow some interesting findings. For the full sample (i.e., regardless of fund type), onlypension funds are most likely to invest in funds with a geographical focus on Europe,regardless of whether through US funds or European funds. Pension funds seem to putthe most effort into achieving European exposure through direct investments into USand/or European funds.9 However, from an absolute magnitude perspective, pension
8 This may be due to the fact that a GP can attract more than one LP.9 Since some funds may be present more than once in our database (whenever they attractedmore than one LP reported in the database), we checked for clustered effects in the regressionanalysis. Our results are robust to any clustering effect at the fund level. Without usingthe clustered robust methodology, these regressions show that pension funds, insurancecompanies and bank-related LPs are all significant. The significance of banks and pensionfunds is largely reduced due to controlling for the clustering effect in residuals.
C© 2011 Blackwell Publishing Ltd

International Capital Flows into the European Private Equity Market 17Ta
ble
4
Reg
ress
ion
anal
ysis
ofth
eE
urop
ean
focu
sby
US
LP
s
Pane
lA:S
elec
tion
offu
nds
wit
ha
Eur
opea
nfo
cus:
byL
Pty
pe.
Thi
sta
ble
repo
rts
the
logi
stic
regr
essi
ons
iden
tify
ing
the
glob
alpl
ayer
s.T
hede
pend
entv
aria
ble
take
sth
eva
lue
ofon
ew
hen
the
LP
has
afo
cus
tow
ard
Eur
ope,
and
zero
othe
rwis
e(t
heva
riab
leFo
cus
EU
).W
eus
ea
set
ofdu
mm
ies
toid
enti
fyth
eL
Pty
pes
(def
ined
inTa
ble
1)an
dso
me
othe
rco
ntro
lva
riab
les.
Reg
ress
ions
(1)
and
(2)
are
base
don
the
full
sam
ple.
Reg
ress
ions
(3)
and
(4)
are
run
onth
esu
bsam
ple
ofre
spec
tivel
yth
eV
Csu
bsam
ple
and
the
buyo
utsu
bsam
ple.
Our
robu
stst
anda
rdde
viat
ions
are
clus
tere
dat
the
fund
leve
l.S
igni
fica
nce
leve
lsar
ere
port
edaf
ter
the
stan
dard
erro
rs,w
ith,
resp
ectiv
ely,
*fo
r10
%si
gnif
ican
ce,*
*fo
r5%
sign
ific
ance
and
***
for
1%si
gnif
ican
ce.D
ueto
drop
ped
obse
rvat
ions
inth
ees
tim
atio
ns,t
hesu
mof
the
VC
sam
ple
and
the
buyo
utsa
mpl
eis
low
erth
anth
eto
tal
sam
ple.
(1)
(2)
(3)
(4)
. .F
ullS
ampl
eV
CS
ampl
eB
uyou
tSam
ple
Con
stan
t−8
.269
−4.2
36−4
.036
−9.0
55(4
.943
)∗(5
.008
)(3
.896
)(6
.085
)L
Ppe
nsio
n0.
596
0.55
11.
015
0.80
8(0
.228
)∗∗∗
(0.2
52)∗∗
(0.5
75)∗
(0.2
99)∗∗
∗L
Pin
sura
nce
0.27
60.
247
0.64
30.
0621
(0.2
26)
(0.2
35)
(0.5
67)
(0.3
02)
LP
bank
0.31
10.
230
−0.0
738
0.40
7(0
.213
)(0
.215
)(0
.625
)(0
.243
)∗L
Ped
ucat
ion
0.07
16−0
.014
8−0
.179
0.10
2(0
.290
)(0
.288
)(0
.643
)(0
.430
)L
Pot
her
type
0.00
906
−0.0
142
−0.3
430.
122
(0.2
20)
(0.2
19)
(0.5
24)
(0.3
00)
Firs
tinv
estm
ent
−0.6
03−0
.485
−0.9
65−0
.310
(0.2
75)∗∗
(0.2
47)∗∗
(0.4
64)∗∗
(0.3
04)
VC
fund
.−1
.390
(0.4
53)∗∗
∗O
ther
fund
.0.
0289
(0.6
78)
Fun
drai
sing
0.56
40.
220
0.16
60.
832
(0.4
90)
(0.4
99)
(0.3
75)
(0.5
68)
Obs
erva
tion
s37
1737
1716
5115
32P
seud
oR
–squ
ared
0.12
80.
164
0.11
90.
124
Wal
dch
i280
.13
81.5
250
.71
51.3
8P
rob
>ch
i20
00
0Y
ear
dum
mie
sY
esY
esY
esY
es
C© 2011 Blackwell Publishing Ltd
18 Gael Imad’Eddine and Armin Schwienbacher
Tabl
e4
Con
tinu
ed.
Pane
lB:S
elec
tion
offu
nds
wit
ha
Eur
opea
nfo
cus:
LP
wit
hor
wit
hout
faci
liti
es
Thi
sta
ble
repo
rts
exte
nded
logi
stic
regr
essi
ons
iden
tify
ing
the
glob
alpl
ayer
s.T
hede
pend
entv
aria
ble
take
sth
eva
lue
ofon
ew
hen
the
LP
has
afo
cus
tow
ard
Eur
ope,
and
zero
othe
rwis
e(t
heva
riab
leFo
cus
EU
).W
eus
ea
set
ofdu
mm
ies
toid
enti
fyth
eL
Pty
pes
(def
ined
inTa
ble
1)an
dso
me
othe
rco
ntro
lva
riab
les.
Reg
ress
ions
(5)
and
(6)
are
base
don
the
full
sam
ple.
Reg
ress
ions
(7an
d(8
)ar
eru
non
the
VC
subs
ampl
ean
dth
ere
gres
sion
s(9
)an
d(1
0)on
the
buyo
utsu
bsam
ple.
Our
robu
stst
anda
rdde
viat
ions
are
clus
tere
dat
the
fund
leve
l.S
igni
fica
nce
leve
lsar
ere
port
edaf
ter
the
stan
dard
erro
rs,w
ith,
resp
ectiv
ely,
∗fo
r10
%si
gnif
ican
ce,∗∗
for
5%si
gnif
ican
cean
d∗∗
∗fo
r1%
sign
ific
ance
.Due
todr
oppe
dob
serv
atio
nsin
the
esti
mat
ions
,the
sum
ofth
eV
Csa
mpl
ean
dth
ebu
yout
sam
ple
islo
wer
than
the
tota
lsa
mpl
e.
(5)
(6)
(7)
(8)
(9)
(10)
. .F
ullS
ampl
eV
CS
ampl
eB
OS
ampl
e
Con
stan
t−4
.243
−4.2
31−5
.061
−4.7
00−9
.363
−9.3
70(4
.931
)(4
.928
)(3
.696
)(3
.621
)(5
.917
)(6
.001
)L
Ppe
nsio
n0.
841
0.84
01.
585
1.49
91.
239
1.24
0(0
.333
)∗∗(0
.332
)∗∗(0
.852
)∗(0
.863
)∗(0
.438
)∗∗∗
(0.4
37)∗∗
∗L
Pba
nkw
ith
faci
liti
es0.
758
.1.
662
.0.
745
(0.3
65)∗∗
(0.8
87)∗
(0.4
51)∗
LP
bank
wit
hout
faci
liti
es0.
359
.−0
.522
.0.
850
(0.2
73)
(0.9
99)
(0.3
43)∗∗
LP
insu
ranc
ew
ith
faci
liti
es0.
845
.1.
262
.0.
927
(0.4
10)∗∗
(1.0
02)
(0.5
95)
LP
insu
ranc
ew
itho
utfa
cili
ties
0.38
9.
1.19
8.
0.25
4(0
.373
)(0
.802
)(0
.558
)L
Pfi
nanc
ialw
ith
faci
liti
es.
0.79
7.
1.37
00.
831
(0.3
37)∗∗
(0.8
47)
(0.4
49)∗
LP
fina
ncia
lwit
hout
faci
liti
es.
0.37
3.
0.55
10.
600
(0.2
72)
(0.7
88)
(0.3
64)∗
C© 2011 Blackwell Publishing Ltd
International Capital Flows into the European Private Equity Market 19
LP
corp
orat
ew
ith
faci
liti
es0.
457
0.45
60.
944
0.87
60.
682
0.69
5(0
.337
)(0
.333
)(0
.649
)(0
.649
)(0
.494
)(0
.485
)L
Ped
ucat
ion
0.27
30.
272
0.41
50.
316
0.53
10.
535
(0.4
00)
(0.3
97)
(0.8
61)
(0.8
64)
(0.6
50)
(0.6
47)
LP
othe
rty
pe0.
268
0.26
70.
225
0.13
80.
542
0.54
4(0
.349
)(0
.347
)(0
.707
)(0
.706
)(0
.540
)(0
.537
)Fi
rsti
nves
tmen
t−0
.410
−0.4
15−0
.726
−0.9
67−0
.224
−0.1
87(0
.235
)∗(0
.247
)∗(0
.426
)∗(0
.453
)∗∗(0
.285
)(0
.292
)V
Cfu
nd−1
.381
−1.3
80.
.
(0.4
54)∗∗
∗(0
.455
)∗∗∗
Oth
erfu
nd0.
0221
0.02
28.
.
(0.6
82)
(0.6
84)
Fun
drai
sing
0.19
60.
195
0.20
70.
183
0.82
20.
821
(0.4
95)
(0.4
95)
(0.3
61)
(0.3
55)
(0.5
60)
(0.5
68)
Obs
erva
tion
s37
1737
1716
5116
5115
3215
32P
seud
oR
-squ
ared
0.16
70.
167
0.14
00.
126
0.12
90.
127
Wal
dch
i258
.65
85.1
67.6
460
.36
64.2
358
.65
Pro
b>
chi2
00
00
00
Yea
rdu
mm
ies
Yes
Yes
Yes
Yes
Yes
Yes
C© 2011 Blackwell Publishing Ltd
20 Gael Imad’Eddine and Armin Schwienbacher
funds, insurance companies and banks all appear to be global players, although onlypension funds have a statistically significant coefficient.
In unreported analysis, we grouped the three LP types (pension fund, insurancecompany and bank) into one dummy variable and ran again the regressions robustto clustering at the fund level. The coefficient of this aggregate variable is significantboth at the 5% and 10% levels depending on the specification (primarily inclusionor exclusion of the VC and buyout fund dummy). This therefore provides reinforcingevidence for these LP types to be a distinct group.
In these regressions, we do not separate US funds from European funds. The coefficienttells us about the probability to invest in a fund that eventually focuses on Europeantargets. On average in our sample, Europe-focused funds are statistically larger than thosefocusing on the US. This is explained by the fact that US LPs, especially pension funds,primarily invest in buyout funds when investing in European funds.10 Lerner et al. (2007)present pension funds as smart investors able to screen for successful GPs. Their sizeand skills allow them to invest in funds focusing on Europe to achieve diversification.
Moreover, further results suggest that less experienced institutional investors are lesslikely to diversify towards Europe, especially if it is their very first direct investmentinto a PE fund (First investment). This result is intuitive. If it is the first investment,LPs have little knowledge of competent GPs. So it is even harder for them to assess thequality of GPs when it comes to investing in funds with foreign focus. These LPs have ahigher probability of choosing a fund focusing on the US market, for which novice LPsmay more easily assess the risk and return profile.
Given that the level of activities in the PE market is highly cyclical and stronglycorrelated with conditions in public markets, we include a fundraising variable whichexpresses the annual level of deflated fundraising worldwide. The amount raised canimpact investment strategy since if this amount rises dramatically, LPs might want todiversify internationally, keeping domestic opportunities constant.
In Regression (2), we include a VC dummy and find a significant negative impact(since we also include the Other fund dummy, the reference group here is the buyoutsub-sample). This is intuitive, as Europe-focused funds raising capital from US investorsare predominantly buyout funds (see Section 4). The recent development of EuropeanPE is mainly due to buyout opportunities. EVCA and several studies reveal weak returnsfrom VC investments in Europe. Hege et al. (2009) report that even US VC funds sufferfrom weak returns when investing in European companies. Caselli et al. (2009) showthat VC investments in Italy have little impact on innovation in the ventures they investin.
When we split the sample between VC investments and buyout investments, we areable to go a step further in the analysis than just adding a dummy variable. Interestingly,there are some differences between VC and buyout funds as shown by regressions (3)& (4). LP past experience seems to matter in the VC subsample. Indeed, if it is thefirst investment the LP tends to shy away from European-focused funds. Pension fundsremain main providers of capital for both European focused VC and buyout funds; bankshave a marginal interest in European buyout funds.
10 As such, our European sample is not representative of the average European fund but rathera distinct sample of GPs capable of attracting US capital. This is also due to the fact that thebulk of capital commitments made in European focused funds is made in the buyout sector,where funds are typically larger.
C© 2011 Blackwell Publishing Ltd
International Capital Flows into the European Private Equity Market 21
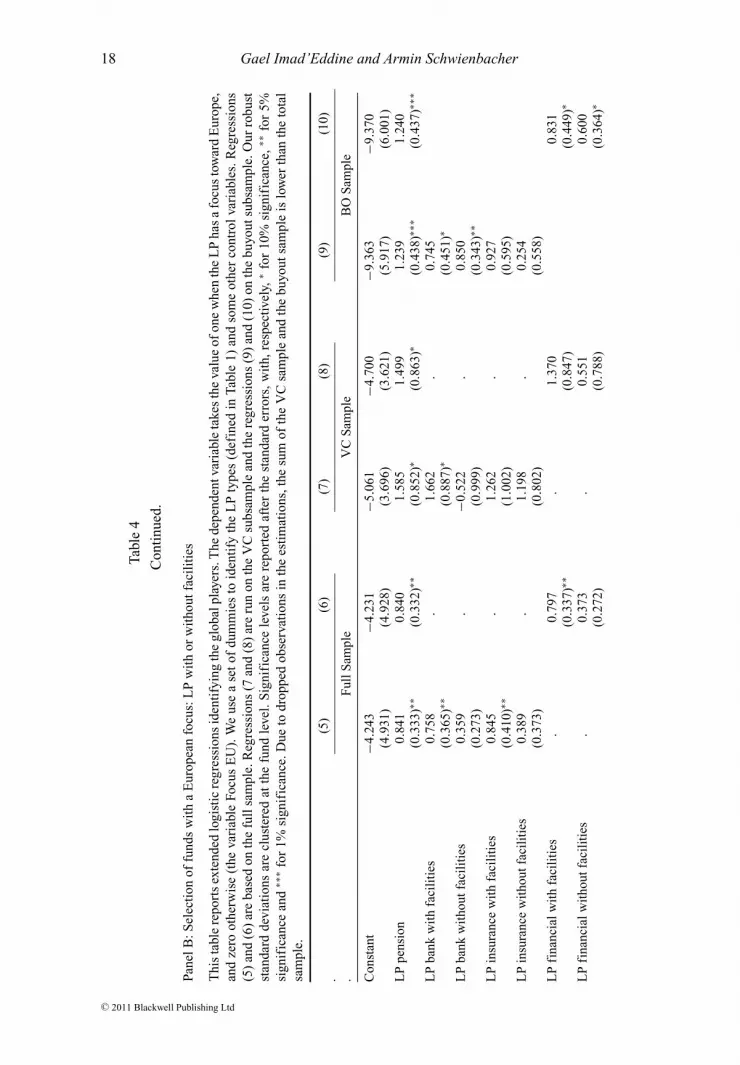
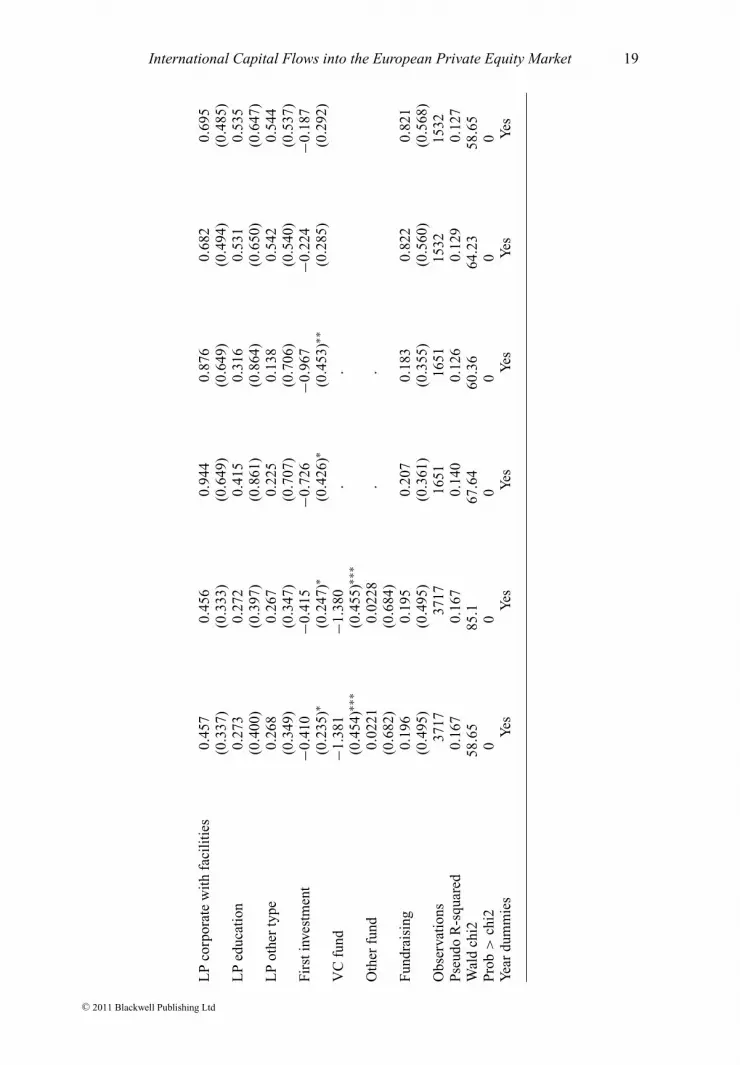
Regressions (5) to (10) use a finer definition of LPs by dividing each type intotwo subgroups: those with facilities in Europe and those without. The existence oflocal facilities in Europe may proxy for better familiarity with and access to localinvestment opportunities. Odd regressions (5, 7 & 9) split all LP types into two subgroups(with/without facilities). Pension funds, educational institutions and the category ofother LPs (LP other type) are not divided because we found either no or only veryfew observations with facilities in Europe. For the even regressions (6, 8 & 10), LPbank and LP insurance are put together as financial LPs and then again divided into LPfinancial with facilities and LP financial without facilities. The reference group for allthese regressions is LP corporate without facilities. Our result for LP pension remainsunaffected. For the full sample banks and insurance companies are more prone to beinternational players only when they hold local facilities. Corporate LPs with facilitiesdo not significantly differ from the corporate LPs without facilities. This confirms thespecificity for financial LPs, next to pension funds.
When we look at the two subsamples separately, results are then less clear for thefinancial LPs (and there is still no effect for LP corporate). LP bank with facilitieshas a positive and significant effect for both subsamples (10% level); for the buyoutsubsample, we find that the coefficient of LP bank without facilities is also significantand positive (5% level). This indicates that the effect found on the financial LPs is mainlydriven by banks. The existence of facilities does not seem to matter however for buyoutinvestments.
In this section we identified one group of investors that is more likely to be globalplayers, namely, pension funds (LP pension). Insurance companies and banks have asimilar impact economically speaking, albeit not significant statistically. These resultsare, however, drawn from the full sample. When we look at the effect of fund type (VCor buyout), the results give a less clear picture. It appears that the results are largelydriven by commitments to VC funds where LP characteristics matter rather than buyoutfunds. The existence of facilities in Europe has an impact especially for financial LPs.In particular, the effect is strongest for banks.11
5.2. Which investment strategies do US LPs use to target the European PE market?
We now examine our main hypotheses regarding the choice of strategy. Indeed, a naturalfollow-up question is: Which strategy is adopted by US fund providers that invest infunds with a European focus? Do they choose US funds with a European focus orEuropean funds with a local focus? To shed light on this question, we investigate moreclosely the subsample of funds that had an explicit focus on the European corporatemarket (i.e., Focus EU = 1). The investigation of this research question will enable usto draw conclusions on the different hypotheses developed in Section 2. The dependentvariable is a dummy variable equal to one if the fund is a European fund and zero if it isa US fund.
11 In unreported results we tried to disentangle between the size effect and the informationadvantage effect by using the LP type dummies from the regressions (1) to (4) and includea Facilities dummy that takes the value of one if the LP has at least one facility in Europe.The Facilities dummy was not significant and did not affect the explanatory power of theregression.
C© 2011 Blackwell Publishing Ltd

22 Gael Imad’Eddine and Armin Schwienbacher
We examine here the full sample and the buyout subsample only, given the reducedsize of the VC subsample here. However in full sample, we include the dummy variableVC fund to assess the difference between the two asset classes.12
Table 5 shows our results. Odd regressions (1, 3 & 5) show the results for the fullsample, even regressions (2, 4 & 6) the results for the buyout subsample.
As evidenced earlier in this study, most of the investments in European funds by USLPs are in buyout funds and only a few in VC funds. To test the information asymmetryhypothesis we examine the LP fund selection strategy in three steps. First we look atthe effect of LP types without taking into account the fact that they may have facilitiesin Europe. Second, we group insurance companies and banks again into one category,namely LP financial. We then use this dummy variable that identifies LP financial withfacilities as defined previously, as well as LP financial without facilities. Pension funds,educational institutions and other LP types were kept as a separated LP type since noneof them have any local facilities and because they display specificities that cannot allowus to blend them with banks and insurance companies. The third set of regressionsdivides each relevant LP group into two sub-groups taking into account the existenceof facilities in Europe. To improve the relevance of the reference group, we choosenot to divide corporate LPs into these two subgroups, since unreported tests show nodistinction between the subgroups.
For the full sample, we find that those investing directly into European funds areprimarily financial institutions with local facilities and pension funds. A closer lookat the financial LPs shows that the results are driven by insurance companies. Theseresults give support to the information asymmetry hypothesis. Financial institutionswith local facilities have better access to information regarding the European marketgiven the broad international scope of their other activities. The rationale behind thisis that these fund providers suffer less from asymmetric information problems due totheir local business facilities in Europe or their possible links with local investors. Morespecifically, local branch offices in Europe help collect relevant information. This givesthem a cost advantage over other LP types.
However, the local facilities’ explanation is unlikely to apply to pension funds, thoughthey are also more prone to selecting European funds. The advantage of pension fundsis less obvious in this context, as they typically do not have facilities in Europe. This isconfirmed by discussions with practitioners as well as through extensive check of manyof the pension funds profiles. While we know that pension funds have no local personnelin Europe,13 they commit some funds in partnership agreements with European fundmanagers. We must rely on Lerner et al. (2007) to find support as to why pension fundsare actively investing in European funds. In their study, pension funds, and educationalinstitutions and endowments are ‘smart and sophisticated’ investors (see also Phalippouand Gottschalg, 2009). This finding backs our own finding regarding pension funds, butnot educational institutions and endowments. In Section 5.3, we investigate further the
12 Another possible channel could be currency risks and taxes if limited partners with localfacilities do not face the same currency risks and taxes when investing in European fundsas limited partners without these facilities. This was not explored here, largely due to a lackof meaningful measures and the ambiguous effect of this alternative channel. More researchmay be warranted however on this particular issue.13 We checked the information provided on the website of several US pension funds and alsoobtained some information by directly asking some of the larger ones, including CalPers.
C© 2011 Blackwell Publishing Ltd

International Capital Flows into the European Private Equity Market 23Ta
ble
5
US
LP
inve
stm
ents
trat
egie
sw
hen
targ
etin
gth
eE
urop
ean
PE
mar
ket
Thi
sta
ble
repo
rts
the
logi
stic
regr
essi
ons
iden
tify
ing
whi
chU
SL
Ps
are
mor
epr
one
toin
vest
dire
ctly
into
Eur
ope-
base
dfu
nds
(as
oppo
sed
toU
S-b
ased
fund
sw
ith
aE
urop
ean
focu
s).T
hede
pend
entv
aria
ble
isE
UF
und
EU
(aE
urop
ean
fund
wit
ha
Eur
opea
nfo
cus)
ona
rest
rict
edsa
mpl
e:w
eke
epon
lyfu
nds
focu
sing
onE
urop
e(F
ocus
EU
=1)
.The
depe
nden
tvar
iabl
eta
kes
the
valu
eof
one
whe
nth
eL
Pha
sin
vest
edin
aE
urop
ean
fund
(EU
fund
)di
rect
ly,z
ero
othe
rwis
e(i
na
US
fund
wit
ha
Eur
opea
nfo
cus)
.The
cons
tant
isno
tre
port
ed.O
urro
bust
stan
dard
devi
atio
nsar
ecl
uste
red
atth
efu
ndle
vel.
Sig
nifi
canc
ele
vels
are
repo
rted
afte
rth
est
anda
rder
rors
,wit
h,re
spec
tivel
y,*
for
10%
sign
ific
ance
,**
for
5%si
gnif
ican
cean
d**
*fo
r1%
sign
ific
ance
.
(1)
(2)
.(3
)(4
).
(5)
(6)
Ful
lB
uyou
tF
ull
Buy
out
Ful
lB
uyou
t.
Sam
ple
Sam
ple
.S
ampl
eS
ampl
e.
Sam
ple
Sam
ple
LP
pens
ion
1.33
51.
503
LP
pens
ion
1.32
81.
540
LP
pens
ion
1.32
71.
583
(0.5
75)∗∗
(1.1
28)
(0.5
74)∗∗
(1.1
59)
(0.5
73)∗∗
(1.1
86)
LP
insu
ranc
e0.
661
1.27
1L
Pfi
nanc
ialw
ith
faci
liti
es1.
139
1.54
3L
Pba
nkw
ith
faci
liti
es0.
722
0.57
5(0
.428
)(0
.586
)∗∗(0
.494
)∗∗(0
.666
)∗∗(0
.574
)(0
.902
)L
Pba
nk0.
262
0.11
7L
Pfi
nanc
ialw
itho
utfa
cili
ties
0.08
220.
235
LP
bank
wit
hout
faci
liti
es−0
.010
4−0
.066
3(0
.357
)(0
.429
)(0
.357
)(0
.504
)(0
.361
)(0
.404
)L
Pin
sura
nce
wit
hfa
cili
ties
1.70
62.
920
(0.9
49)∗
(0.9
39)∗∗
∗L
Pin
sura
nce
wit
hout
faci
liti
es0.
179
0.58
9(0
.467
)(0
.646
)L
Ped
ucat
ion
−0.9
99−0
.865
LP
educ
atio
n−0
.992
−0.8
19L
Ped
ucat
ion
−0.9
90−0
.789
(0.5
02)∗∗
(0.8
17)
(0.5
00)∗∗
(0.8
17)
(0.4
98)∗∗
(0.8
14)
LP
othe
rty
pe−0
.333
−0.5
70L
Pot
her
type
−0.3
33−0
.534
LP
othe
rty
pe−0
.333
−0.5
04(0
.461
)(0
.710
)(0
.464
)(0
.742
)(0
.462
)(0
.731
)L
Pex
peri
ence
−0.0
456
−0.0
285
LP
expe
rien
ce−0
.049
9−0
.027
3L
Pex
peri
ence
−0.0
503
−0.0
374
(0.0
285)
(0.0
389)
(0.0
279)
∗(0
.041
6)(0
.029
1)∗
(0.0
459)
VC
fund
−0.4
14V
Cfu
nd−0
.432
VC
fund
−0.4
27(1
.091
)(1
.091
)(1
.110
)O
ther
fund
−4.2
46O
ther
fund
−4.1
93O
ther
fund
−4.2
20(2
.504
)∗(2
.477
)∗(2
.459
)∗F
undr
aisi
ng−0
.328
−0.2
86F
undr
aisi
ng−0
.331
−0.3
64F
undr
aisi
ng−0
.309
−0.2
73(0
.718
)(0
.741
)(0
.714
)(0
.719
)(0
.720
)(0
.720
)O
bser
vati
ons
372
245
Obs
erva
tion
s37
224
5O
bser
vati
ons
372
245
Pse
udo
R-s
quar
ed0.
327
0.22
0P
seud
oR
-squ
ared
0.33
30.
223
Pse
udo
R-s
quar
ed0.
335
0.24
1W
ald
chi2
69.7
774
.28
Wal
dch
i271
.59
69.4
8W
ald
chi2
73.0
213
7.41
Pro
b>
chi2
00
Pro
b>
chi2
00
Pro
b>
chi2
00
Yea
rdu
mm
ies
Yes
Yes
Yea
rdu
mm
ies
Yes
Yes
Yea
rdu
mm
ies
Yes
Yes
C© 2011 Blackwell Publishing Ltd

24 Gael Imad’Eddine and Armin Schwienbacher
case of pension funds. Another hint that could back our hypothesis is drawn from theunderstanding from practitioners that pension funds manage huge amounts of money andthus can ‘buy’ access to information. Their size allows them to get economies of scalewhen getting information about European players. This is what we presented as a secondchannel to acquire information. Moreover, we find in Section 5.1 that pension funds aremore likely to be global players, which gives them a higher likelihood of selecting localfunds, since they might have more experience in international investments. However,these suggestions are only speculations so far.
The variable LP experience (years of experience before the investment) is significantat the 10% level in regressions (3) and (5) but has a negative sign. More experiencedLPs tend to avoid European funds to the advantage of US funds with a European focus.This can also be interpreted as the fact that new LPs are more likely to invest directly inEuropean based funds, since they have no ‘seat at the tables’ of successful US GPs – inline with the findings of Lerner et al. (2007), on the behaviour of US LPs investing in theUS. They need to invest in the growing European market to get investment opportunities.The fact that half of the deals of our sample are done between 1996 and 2002 and that thisis also the period when the European PE market was developing substantially (exceptfor the UK that already had a more developed market at that time), might explain thisfinding. Part of the European PE market growth appears to be fueled by newcomersfrom US LPs.14
The dynamics of the PE market is strongly led by the buyout industry that has attractedmost of the US LPs. The VC fund dummy is not significant at all. Perhaps this is relatedto the fact that in Europe the buyout industry is more active than the VC industryand therefore more able to attract US investors. Hege et al. (2009) and EVCA reportspoint out that returns are too low in Europe for venture capital. This makes capitalcommitments by US LPs (as well as European LPs) less likely.
We ran robustness checks for possible selection bias using a Heckman correctionmodel (as well as an alternate model treatment regression), since the European focussample is a subsample of the whole. One can argue that the European focused sampleis a censored sample, where funds with other focuses have been taken out. We do notfind any substantial differences in the results. Pension funds and LPs with facilities stillhave positive and significant signs. Since First investment is more relevant to determinewhether an LP will be a global player, we include this variable in the first stage ofthe selection model while the LP experience is used in the second stage. Results arequalitatively similar: the marginal effects are lower, but significance levels are similar.
14 Another possible reason why limited partners may decide to invest with a certain generalpartner is that they have invested in another (domestic) fund managed by the same generalpartner. To test this hypothesis we built another variable that relates to specific LP-GPmatches. We built dummies to identify whether the specific commitment was the first,second, third, fourth, fifth or sixth commitment in our complete database. We then createda dummy variable that takes the value of one if the deal is not the very first one (i.e., it iseither second, third, fourth. . .). We also constructed another dummy variable that takes thevalue of one if the deal is between a US LP and a US GP. Unreported results show thatthese variables cannot explain the choice of LP’s investment strategy. We therefore find nosubstantial evidence for this hypothesis.
C© 2011 Blackwell Publishing Ltd
International Capital Flows into the European Private Equity Market 25
5.3. The pension fund puzzle
According to the asymmetric information hypothesis based on the presence of ‘suitablefacilities’ located in Europe, pension funds should not invest directly in European fundsas much as financial institutions and insurance companies. Indeed, a close examinationof Internet websites of major pension funds revealed that pension funds usually do nothave branch offices in Europe. We, therefore, face a puzzle, given the results obtainedin Section 5.2 on the fact that pension funds are also directly investing quite extensivelyinto European funds when seeking European exposure. We provided some potentialexplanations earlier. The most likely explanation is the size of pension funds. Thereare huge players in the industry as a whole. Their size should explain that they areable to invest beyond the US border and directly into foreign funds in general, sincethey manage significant capital under management. In this sub-section, we investigatewhether there is support also for our alternative channel that build on informationgathering.
To offer a possible explanation to this seemingly puzzling question, we explore severalcharacteristics of US pension funds. First, one possibility is that pension funds investingin European PE funds may target the largest ones. It is possible that LPs with moreresources may have better access to the largest PE funds, assuming that pension fundsindeed are larger capital providers than the other LP types. The size of a fund is also animportant factor to take into account since a large fund can offer increased diversificationwith less administration costs than investing in many smaller funds. To see whether thisis true, we calculate the average size of the funds targeted by pension funds and comparethem with other LP types. Panel A in Table 6 shows that on average, pension funds investin larger funds than insurance, financial and corporate related LPs. These results arestatistically significant. However, we fail to find any significance in the mean differencebetween pension funds, and educational institutions and endowments. In Panel B, wefind that when focusing on European funds, there is no statistical difference betweenthe funds chosen by LPs. Only insurance companies are associated with smaller funds.Moreover, we note in Panel C that the mean size of a European fund (and a Europe-focused fund) is statistically larger than a US fund (and a US-focused fund). It appearsthat funds investing in Europe (either European or American) are on average larger thanUS funds. This is likely to be due to the heavy investments into buyout funds in Europe.Since the results might be biased by the size of buyout funds, we test the difference afterdividing the sample into two subsamples: venture capital and buyout (Table 6, PanelD). There is no statistical difference between pension fund LPs and other LPs when itcomes to investing in buyout funds, but we find a positive difference in the case of theVC funds: pension fund LPs choose larger VC funds on average.
However, the fund size cannot shed credible light on our puzzle. We should alsobe aware of how the database is built. We collected all the commitments made byUS investors. That means that we ought to have many US GPs, but we have only theEuropean GPs (and other foreign GPs) which have been able to attract US LPs. We haveno European GPs in our sample that have not attracted US money. This suggests that thepopulation of European GPs considered here may actually be the largest one. But thisdifference only shows that US LPs will invest more predominantly in established andlarger European GPs, with less asymmetric information.15
15 There is no clear evidence that our sample is biased within the subsample of European GPshaving received capital commitments from US LPs.
C© 2011 Blackwell Publishing Ltd

26 Gael Imad’Eddine and Armin Schwienbacher
Table 6
US LP choice of fund size
Panel A: US LP choice of fund size (full sample)
This table reports summary statistics on fund size by LP type. The p-value refers to the mean differencetest between the given LP type and the full sample. P-value z reports the two-sample non-parametricWilcoxon rank-sum (Mann-Whitney) test. The last column (p-value z LP pension) shows the p-valuesfor the test of difference using the LP pension against each other LP types. Because of missingobservations on the Fund size variable, the total sample is 4072 instead of the 4119.
Fund Size Nbr. p-value p-value zby LP Type Observations Median Mean z Std Dev LP pension
LP pension 373 545.1 1077.28 0.00% 1095.39LP insurance 525 319 613.15 0.01% 893.33 0.00%LP bank 709 335 770.30 1.09% 1143.88 0.00%LP corporate 1252 229.1 605.86 0.00% 946.86 0.00%LP education 485 530.2 1128.49 0.00% 1314.51 51.08%LP other 728 455 931.76 0.00% 1176.75 5.20%
Full sample 4072 388.5 799.13 – 1122.44 –
Panel B: US LP choice of fund size (European funds sub-sample)
This table reports how Fund size varies with LP type. Unlike in Panel A, we focus here on the subsampleof European funds only (EU fund = 1). The p-value z refers to the mean difference test between theconsidered LP type and the sample of European funds (215 in total). We report the two-sample non-parametric Wilcoxon rank-sum (Mann-Whitney) test values. The last column (p-value z LP pension)shows the p-values for the test of difference using the LP pension against each other LP types.
Fund Size Nbr.p-
value p-value zby LP Type Observations Median Mean z Std Dev LP pension
LP pension 37 840 1405.48 4.93% 1383.18 –LP insurance 38 284.5 427.50 0.06% 587.34 0.02%LP bank 48 730.5 1428.75 34.52% 1462.11 51.02%LP corporate 50 574.9 1100.14 41.48% 1315.09 8.06%LP education 11 840 1390.54 41.11% 1327.06 100%LP other 31 1187.15 33.06% 1241.80 54.63%
EU fund sample 215 548.6 1134.57 – 1292.435 –
Next, in Table 7, we take a closer look at the effect of LP experience to determinewhether there is a distinctive behavior of pension funds. Young LPs could be pushedaway from US investment opportunities by experienced LPs that have a ‘seat at thetable’ of the best GPs (Lerner et al., 2007). Alternatively, experienced LPs could usetheir previous investment knowledge to invest in European funds. However, both groupsare not statistically different from each other when it comes to investing in Europe.Therefore, the experience of the pension funds does not seem to be a critical factor inexplaining the choice of investing directly in Europe for achieving European exposure.
In line with the ‘the seat at the table’ argument, another point worth investigatingis the possibility that pension funds have privileged access to the most established
C© 2011 Blackwell Publishing Ltd

International Capital Flows into the European Private Equity Market 27
Table 6
Continued.
Panel C: Fund size test of difference between US and Europe
This table reports tests of the mean difference for the size of funds. We first do this on the basis of thefund origin (Europe versus US) followed by fund focus (again, Europe versus US). Note that missingvalues reduce the sample size. In the upper part the foreign funds are not included. In the lower partthe focus outside Europe and the US is not included in the analysis. Hence the drop in the numberof observations. p-value z (last column) reports the two-sample Wilcoxon rank-sum (Mann-Whitney)test.
Fund Size by Fund Origin Nbr. Observations Mean Std Dev p-value z
EU fund 215 1134.57 1292.43US fund 3807 786.37 1115.00Full sample 4022 0.001
Fund size by focus
Focus EU 395 1219.42 1183.75Focus US 3432 699.46 960.97Full sample 3827 0.000
Panel D: Fund size test of difference for pension fund LPs
This table reports the test of the mean difference for Fund size. We split the sample into two groups, theVC fund group and the Buyout fund group. We only show results for commitments made in Europeanfunds focusing on Europe; i.e., where EU fund EU = 1. p-value z (last column) reports the two-sampleWilcoxon rank-sum (Mann-Whitney) test.
Buyout Fund Deals Nbr. Observations Mean Std Dev p-value z
LP pension 27 1817.35 1409.67All other LPs 127 1445.86 1333.24Total 154 0.148
VC Fund Deals
LP pension 7 192.51 65.10All other LPs 26 91.61 111.07Total 33 0.011
PE funds when investing in Europe. In our database, the earliest investments by USLPs in European funds were done by insurance companies. But as Table 8 shows, theinterest toward Europe from pension funds is also old. Before 1985, pension funds andinsurance companies were the two LP types that allocated a large share toward Europe(respectively, 5.26% and 11.4%). In the next period, pension funds became first andremained the most active supplier of capital commitments (in relative terms) until 2004with a share of 9.09% in the period 1986–1995 and 10.09% in the period 1996–2002.
As pointed out earlier, the existence of local facilities could rather pick up a size effect.In a similar vein as done before (see Footnote 11), we include a Facility dummy in theregression. Unreported results show that this variable is never significant. While this is
C© 2011 Blackwell Publishing Ltd
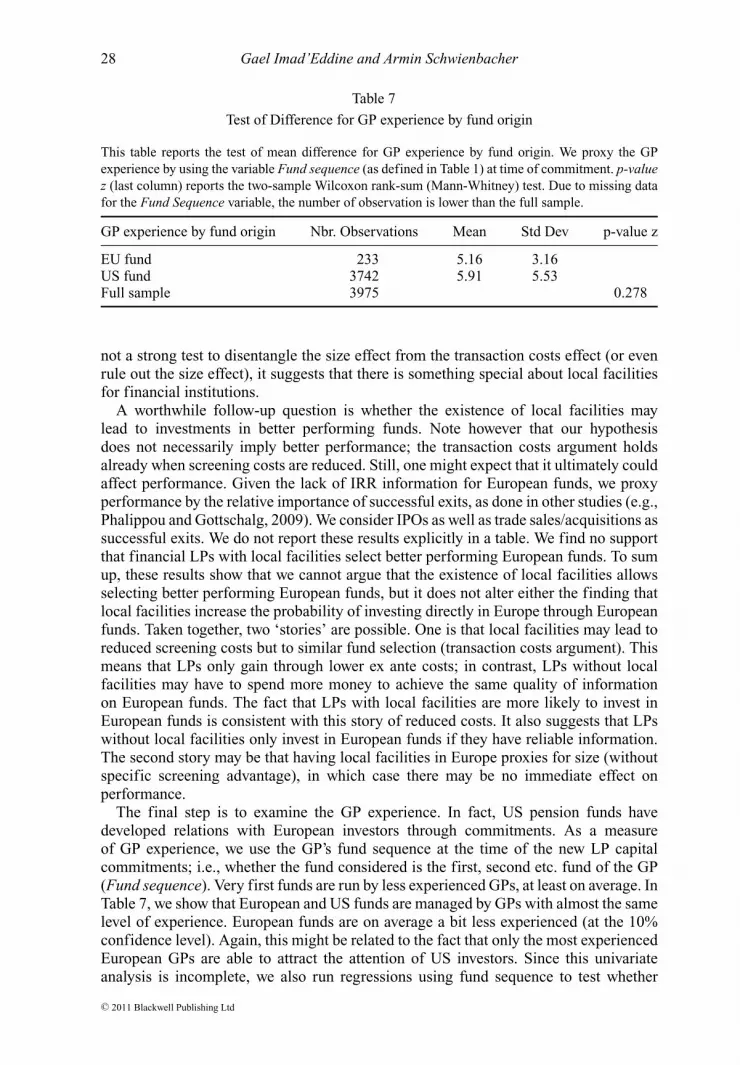
28 Gael Imad’Eddine and Armin Schwienbacher
Table 7
Test of Difference for GP experience by fund origin
This table reports the test of mean difference for GP experience by fund origin. We proxy the GPexperience by using the variable Fund sequence (as defined in Table 1) at time of commitment. p-valuez (last column) reports the two-sample Wilcoxon rank-sum (Mann-Whitney) test. Due to missing datafor the Fund Sequence variable, the number of observation is lower than the full sample.
GP experience by fund origin Nbr. Observations Mean Std Dev p-value z
EU fund 233 5.16 3.16US fund 3742 5.91 5.53Full sample 3975 0.278
not a strong test to disentangle the size effect from the transaction costs effect (or evenrule out the size effect), it suggests that there is something special about local facilitiesfor financial institutions.
A worthwhile follow-up question is whether the existence of local facilities maylead to investments in better performing funds. Note however that our hypothesisdoes not necessarily imply better performance; the transaction costs argument holdsalready when screening costs are reduced. Still, one might expect that it ultimately couldaffect performance. Given the lack of IRR information for European funds, we proxyperformance by the relative importance of successful exits, as done in other studies (e.g.,Phalippou and Gottschalg, 2009). We consider IPOs as well as trade sales/acquisitions assuccessful exits. We do not report these results explicitly in a table. We find no supportthat financial LPs with local facilities select better performing European funds. To sumup, these results show that we cannot argue that the existence of local facilities allowsselecting better performing European funds, but it does not alter either the finding thatlocal facilities increase the probability of investing directly in Europe through Europeanfunds. Taken together, two ‘stories’ are possible. One is that local facilities may lead toreduced screening costs but to similar fund selection (transaction costs argument). Thismeans that LPs only gain through lower ex ante costs; in contrast, LPs without localfacilities may have to spend more money to achieve the same quality of informationon European funds. The fact that LPs with local facilities are more likely to invest inEuropean funds is consistent with this story of reduced costs. It also suggests that LPswithout local facilities only invest in European funds if they have reliable information.The second story may be that having local facilities in Europe proxies for size (withoutspecific screening advantage), in which case there may be no immediate effect onperformance.
The final step is to examine the GP experience. In fact, US pension funds havedeveloped relations with European investors through commitments. As a measureof GP experience, we use the GP’s fund sequence at the time of the new LP capitalcommitments; i.e., whether the fund considered is the first, second etc. fund of the GP(Fund sequence). Very first funds are run by less experienced GPs, at least on average. InTable 7, we show that European and US funds are managed by GPs with almost the samelevel of experience. European funds are on average a bit less experienced (at the 10%confidence level). Again, this might be related to the fact that only the most experiencedEuropean GPs are able to attract the attention of US investors. Since this univariateanalysis is incomplete, we also run regressions using fund sequence to test whether
C© 2011 Blackwell Publishing Ltd
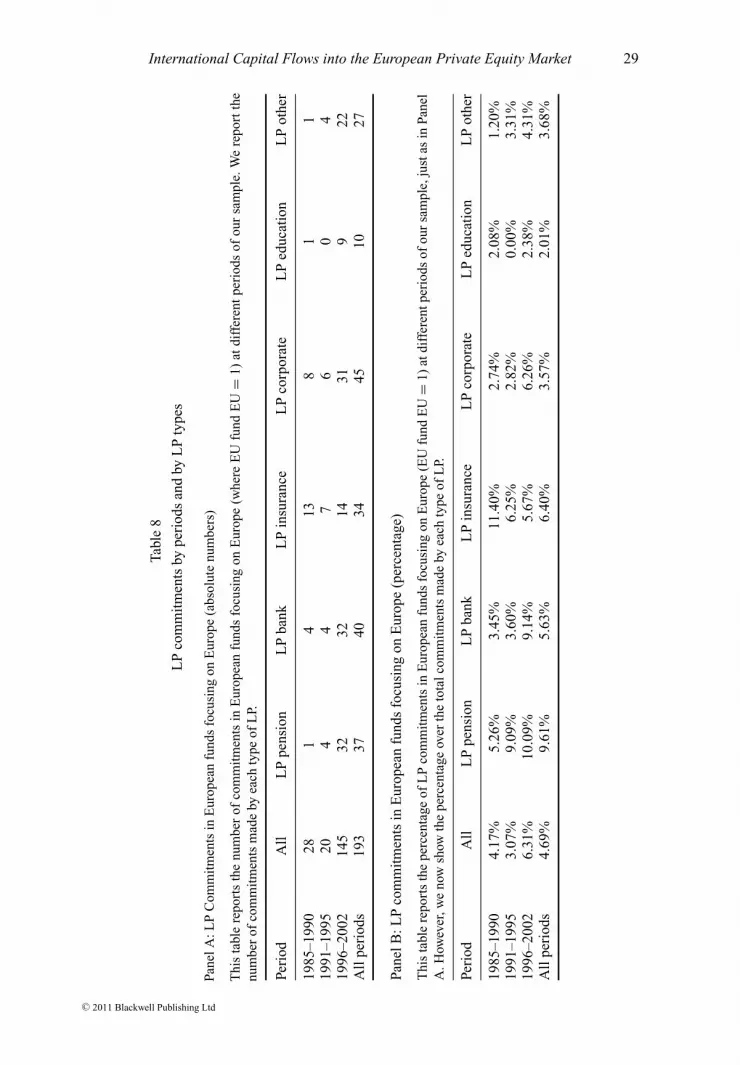
International Capital Flows into the European Private Equity Market 29
Tabl
e8
LP
com
mit
men
tsby
peri
ods
and
byL
Pty
pes
Pane
lA:L
PC
omm
itm
ents
inE
urop
ean
fund
sfo
cusi
ngon
Eur
ope
(abs
olut
enu
mbe
rs)
Thi
sta
ble
repo
rts
the
num
ber
ofco
mm
itm
ents
inE
urop
ean
fund
sfo
cusi
ngon
Eur
ope
(whe
reE
Ufu
ndE
U=
1)at
diff
eren
tpe
riod
sof
our
sam
ple.
We
repo
rtth
enu
mbe
rof
com
mit
men
tsm
ade
byea
chty
peof
LP.
Peri
odA
llL
Ppe
nsio
nL
Pba
nkL
Pin
sura
nce
LP
corp
orat
eL
Ped
ucat
ion
LP
othe
r
1985
–199
028
14
138
11
1991
–199
520
44
76
04
1996
–200
214
532
3214
319
22A
llpe
riod
s19
337
4034
4510
27
Pane
lB:L
Pco
mm
itm
ents
inE
urop
ean
fund
sfo
cusi
ngon
Eur
ope
(per
cent
age)
Thi
sta
ble
repo
rts
the
perc
enta
geof
LP
com
mit
men
tsin
Eur
opea
nfu
nds
focu
sing
onE
urop
e(E
Ufu
ndE
U=
1)at
diff
eren
tper
iods
ofou
rsa
mpl
e,ju
stas
inPa
nel
A.H
owev
er,w
eno
wsh
owth
epe
rcen
tage
over
the
tota
lcom
mit
men
tsm
ade
byea
chty
peof
LP.
Peri
odA
llL
Ppe
nsio
nL
Pba
nkL
Pin
sura
nce
LP
corp
orat
eL
Ped
ucat
ion
LP
othe
r
1985
–199
04.
17%
5.26
%3.
45%
11.4
0%2.
74%
2.08
%1.
20%
1991
–199
53.
07%
9.09
%3.
60%
6.25
%2.
82%
0.00
%3.
31%
1996
–200
26.
31%
10.0
9%9.
14%
5.67
%6.
26%
2.38
%4.
31%
All
peri
ods
4.69
%9.
61%
5.63
%6.
40%
3.57
%2.
01%
3.68
%
C© 2011 Blackwell Publishing Ltd

30 Gael Imad’Eddine and Armin Schwienbacher
the pension funds were selecting more experienced GPs. We therefore separate oursample into two groups: one that includes less established PE funds and one that includesthe more established ones. We use different cut-off levels, as shown in Table 9. Usingthe same specification as in Table 5, we run the regressions for each group separately.
Compared to other LP types, pension funds are more prone to invest in Europeanfunds that are less established. Pension funds are those investing in the less experiencedGPs. For investments in well established GPs, pension funds do not behave significantlydifferently from any other LP type. This suggests that when investing in Europeanfunds, pension funds indeed may have better access to the less reputable GPs. Followingthe study by Lerner et al. (2007), established GPs might be able to refuse capitalcommitments from new LPs. In our sample, only pension funds are significantlyassociated with the least experienced GPs. And when choosing a European exposure,they tend to select local young GPs.16
Banks show a different pattern (regressions (1) & (2) in Table 9): a negative coefficientfor less established GPs (3 or less) and a positive coefficient for experienced GPs (4or more). However, this pattern is not robust to alternative thresholds for the definitionof GPs, as shown in regressions (3) & (4). Educational institutions (LP education)significantly shy away from young GPs (3 or less, or 4 or less). Without proper localfacilities or screening abilities, it is easier to select funds whose GPs have an establishedreputation, since they are less costly to evaluate.
6. Concluding Remarks
In this paper, we investigated the investment strategy of US LPs and the internationalisa-tion of their investments. We focused on Europe for the choice of investment strategy toachieve exposure to European private company targets. First, we investigated which LPshave a greater probability to seek European exposure to identify the global players. Wefind that only pension fund affiliated LPs are more prone to investing in funds (either USor European funds) with Europe as geographical investment objective. We, therefore,label them as global players. Other LPs, namely, insurance companies and banks, havesimilar impact but we find no statistical significance.
Second, we analysed investment strategy. When LPs invest in a fund focusing onEurope, is it through a US fund with a European Focus, or through a European fundwith a local focus? We find that LPs with generally local facilities in Europe (banks andinsurance companies) are more likely to invest directly into European funds rather thanin US funds with a European focus. A possible rationale behind this is that they may facelower screening costs due to their facilities in Europe and their links with local investors.This helps the collection of information. Alternatively, the existence of local facilitiesmay proxy for their size. However, we also find that pension funds are important capitalsuppliers to European funds too, although they lack local branch offices in Europe.We also find that pension funds acting as LP will more likely invest in less establishedEuropean GPs. One possible explanation is that due to their size, pension funds maymore likely be driven to invest outside the US to find new investment opportunities.
16 In unreported analysis, we find no evidence that European funds that received capitalfrom US pension funds achieved better performance. Alternatively, pension funds may havereceived better terms. However there is no way for us to verify whether this in indeed thecase.
C© 2011 Blackwell Publishing Ltd
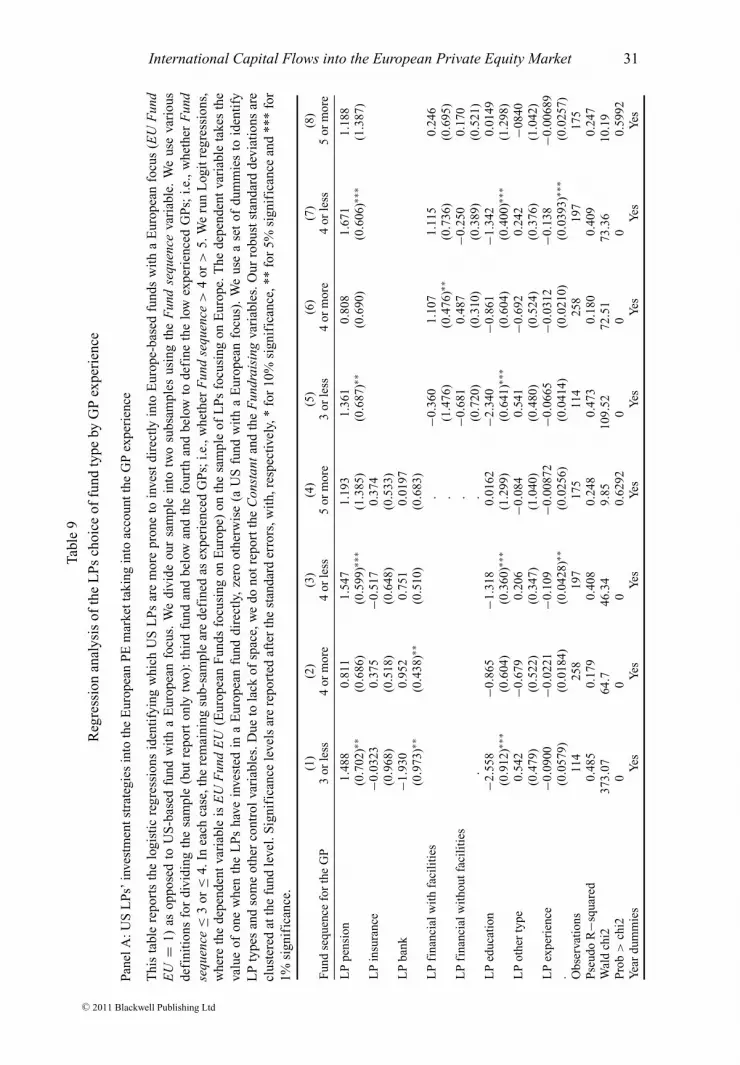
International Capital Flows into the European Private Equity Market 31Ta
ble
9
Reg
ress
ion
anal
ysis
ofth
eL
Ps
choi
ceof
fund
type
byG
Pex
peri
ence
Pane
lA:U
SL
Ps’
inve
stm
ents
trat
egie
sin
toth
eE
urop
ean
PE
mar
kett
akin
gin
toac
coun
tthe
GP
expe
rien
ce
Thi
sta
ble
repo
rts
the
logi
stic
regr
essi
ons
iden
tify
ing
whi
chU
SL
Ps
are
mor
epr
one
toin
vest
dire
ctly
into
Eur
ope-
base
dfu
nds
wit
ha
Eur
opea
nfo
cus
(EU
Fun
dE
U=
1)as
oppo
sed
toU
S-b
ased
fund
wit
ha
Eur
opea
nfo
cus.
We
divi
deou
rsa
mpl
ein
totw
osu
bsam
ples
usin
gth
eF
und
sequ
ence
vari
able
.W
eus
eva
riou
sde
fini
tion
sfo
rdi
vidi
ngth
esa
mpl
e(b
utre
port
only
two)
:th
ird
fund
and
belo
wan
dth
efo
urth
and
belo
wto
defi
neth
elo
wex
peri
ence
dG
Ps;
i.e.,
whe
ther
Fun
dse
quen
ce≤
3or
≤4.
Inea
chca
se,t
here
mai
ning
sub-
sam
ple
are
defi
ned
asex
peri
ence
dG
Ps;
i.e.,
whe
ther
Fun
dse
quen
ce>
4or
>5.
We
run
Log
itre
gres
sion
s,w
here
the
depe
nden
tva
riab
leis
EU
Fun
dE
U(E
urop
ean
Fun
dsfo
cusi
ngon
Eur
ope)
onth
esa
mpl
eof
LP
sfo
cusi
ngon
Eur
ope.
The
depe
nden
tva
riab
leta
kes
the
valu
eof
one
whe
nth
eL
Ps
have
inve
sted
ina
Eur
opea
nfu
nddi
rect
ly,
zero
othe
rwis
e(a
US
fund
wit
ha
Eur
opea
nfo
cus)
.W
eus
ea
set
ofdu
mm
ies
toid
enti
fyL
Pty
pes
and
som
eot
her
cont
rol
vari
able
s.D
ueto
lack
ofsp
ace,
we
dono
tre
port
the
Con
stan
tan
dth
eF
undr
aisi
ngva
riab
les.
Our
robu
stst
anda
rdde
viat
ions
are
clus
tere
dat
the
fund
leve
l.S
igni
fica
nce
leve
lsar
ere
port
edaf
ter
the
stan
dard
erro
rs,w
ith,
resp
ectiv
ely,
*fo
r10
%si
gnif
ican
ce,*
*fo
r5%
sign
ific
ance
and
***
for
1%si
gnif
ican
ce.
(1)
(2)
(3)
(4)
(5)
(6)
(7)
(8)
Fun
dse
quen
cefo
rth
eG
P3
orle
ss4
orm
ore
4or
less
5or
mor
e3
orle
ss4
orm
ore
4or
less
5or
mor
e
LP
pens
ion
1.48
80.
811
1.54
71.
193
1.36
10.
808
1.67
11.
188
(0.7
02)∗∗
(0.6
86)
(0.5
99)∗∗
∗(1
.385
)(0
.687
)∗∗(0
.690
)(0
.606
)∗∗∗
(1.3
87)
LP
insu
ranc
e−0
.032
30.
375
−0.5
170.
374
(0.9
68)
(0.5
18)
(0.6
48)
(0.5
33)
LP
bank
−1.9
300.
952
0.75
10.
0197
(0.9
73)∗∗
(0.4
38)∗∗
(0.5
10)
(0.6
83)
LP
fina
ncia
lwit
hfa
cili
ties
.−0
.360
1.10
71.
115
0.24
6.
(1.4
76)
(0.4
76)∗∗
(0.7
36)
(0.6
95)
LP
fina
ncia
lwit
hout
faci
liti
es.
−0.6
810.
487
−0.2
500.
170
..
(0.7
20)
(0.3
10)
(0.3
89)
(0.5
21)
LP
educ
atio
n−2
.558
−0.8
65−1
.318
0.01
62−2
.340
−0.8
61−1
.342
0.01
49(0
.912
)∗∗∗
(0.6
04)
(0.3
60)∗∗
∗(1
.299
)(0
.641
)∗∗∗
(0.6
04)
(0.4
00)∗∗
∗(1
.298
)L
Pot
her
type
0.54
2−0
.679
0.20
6−0
.084
0.54
1−0
.692
0.24
2−0
840
(0.4
79)
(0.5
22)
(0.3
47)
(1.0
40)
(0.4
80)
(0.5
24)
(0.3
76)
(1.0
42)
LP
expe
rien
ce−0
.090
0−0
.022
1−0
.109
−0.0
0872
−0.0
665
−0.0
312
−0.1
38−0
.006
89.
(0.0
579)
(0.0
184)
(0.0
428)
∗∗(0
.025
6)(0
.041
4)(0
.021
0)(0
.039
3)∗∗
∗(0
.025
7)O
bser
vati
ons
114
258
197
175
114
258
197
175
Pse
udo
R−s
quar
ed0.
485
0.17
90.
408
0.24
80.
473
0.18
00.
409
0.24
7W
ald
chi2
373.
0764
.746
.34
9.85
109.
5272
.51
73.3
610
.19
Pro
b>
chi2
00
00.
6292
00
00.
5992
Yea
rdu
mm
ies
Yes
Yes
Yes
Yes
Yes
Yes
Yes
Yes
C© 2011 Blackwell Publishing Ltd

32 Gael Imad’Eddine and Armin SchwienbacherTa
ble
9
Con
tinu
ed.
Pane
lB:U
SL
Ps’
inve
stm
ents
trat
egie
sin
toth
eE
urop
ean
PE
mar
kett
akin
gin
toac
coun
tthe
GP
expe
rien
ce
Thi
sta
ble
repo
rts
the
logi
stic
regr
essi
ons
iden
tify
ing
whi
chU
SL
Ps
are
mor
epr
one
toin
vest
dire
ctly
into
Eur
ope-
base
dfu
nds
wit
ha
Eur
opea
nfo
cus
(EU
Fun
dE
U=
1)as
oppo
sed
toU
S-b
ased
fund
wit
ha
Eur
opea
nfo
cus.
We
divi
deou
rsa
mpl
ein
totw
osu
bsam
ples
usin
gth
eF
und
sequ
ence
vari
able
.W
eus
eva
riou
sde
fini
tion
sfo
rdi
vidi
ngth
esa
mpl
e(b
utre
port
only
two)
:th
ird
fund
and
belo
wan
dth
efo
urth
and
belo
wto
defi
neth
elo
wex
peri
ence
dG
Ps;
i.e.,
whe
ther
Fun
dse
quen
ce≤
3or
≤4.
Inea
chca
se,t
here
mai
ning
sub-
sam
ple
are
defi
ned
asex
peri
ence
dG
Ps;
i.e.,
whe
ther
Fun
dse
quen
ce>
4or
>5.
We
run
Log
itre
gres
sion
s,w
here
the
depe
nden
tva
riab
leis
EU
Fun
dE
U(E
urop
ean
Fun
dsfo
cusi
ngon
Eur
ope)
onth
esa
mpl
eof
LP
sfo
cusi
ngon
Eur
ope.
The
depe
nden
tva
riab
leta
kes
the
valu
eof
one
whe
nth
eL
Ps
have
inve
sted
ina
Eur
opea
nfu
nddi
rect
ly,z
ero
othe
rwis
e(a
US
fund
wit
ha
Eur
opea
nfo
cus)
.We
use
ase
tof
dum
mie
sto
iden
tify
LP
type
san
dso
me
othe
rco
ntro
lva
riab
les.
Due
tola
ckof
spac
e,w
edo
not
repo
rtth
eC
onst
ant,
and
the
Fun
drai
sing
vari
able
s.O
urro
bust
stan
dard
devi
atio
nsar
ecl
uste
red
atth
efu
ndle
vel.
Sig
nifi
canc
ele
vels
are
repo
rted
afte
rth
est
anda
rder
rors
,wit
h,re
spec
tivel
y,*
for
10%
sign
ific
ance
,**
for
5%si
gnif
ican
cean
d**
*fo
r1%
sign
ific
ance
.
(9)
(10)
(11)
(12)
Fun
dse
quen
cefo
rth
eG
P3
orle
ss4
orm
ore
4or
less
5or
mor
e
LP
pens
ion
3.30
80.
599
2.11
82.
118
(1.7
20)∗
(0.9
37)
(0.7
57)∗∗
∗(2
.253
)L
Pba
nkw
ith
faci
liti
es−0
.531
0.58
41.
953
0.03
83(0
.942
)(0
.768
)(0
.827
)∗∗(1
.945
)L
Pba
nkw
itho
utfa
cili
ties
−0.3
440.
903
0.65
61.
450
(0.4
97)
(0.6
27)
(0.5
61)
(1.5
93)
LP
insu
ranc
ew
ith
faci
liti
es2.
560
1.25
20.
938
1.82
7(4
.109
)(0
.866
)(1
.923
)(1
.605
)L
Pin
sura
nce
wit
hout
faci
liti
es1.
706
−0.6
55−0
.176
0.58
2(1
.712
)(0
.878
)(0
.923
)(1
.228
)L
Pco
rpor
ate
wit
hfa
cili
ties
2.41
6−0
.347
0.92
01.
188
(1.3
75)∗
(0.6
49)
(0.4
43)∗∗
(1.4
84)
LP
educ
atio
n−1
.020
−1.0
67−0
.828
0.92
5(0
.273
)∗∗∗
(0.8
94)
(0.2
75)∗∗
∗(2
.162
)L
Pot
her
type
2.30
3−0
.866
0.74
30.
813
(1.3
26)
(0.8
16)
(0.4
75)
(1.8
89)
LP
expe
rien
ce−0
.110
−0.0
138
−0.1
35−0
.001
40.
(0.0
644)
∗(0
.019
2)(0
.046
9)∗∗
∗(0
.028
5)O
bser
vati
ons
9823
717
815
0P
seud
oR
-squ
ared
0.50
30.
193
0.41
80.
269
Wal
dch
i226
670
137.
9769
15.4
6P
rob
>ch
i20
00
0.41
9Y
ear
dum
mie
sY
esY
esY
esY
es
C© 2011 Blackwell Publishing Ltd

International Capital Flows into the European Private Equity Market 33
References
Barberis, N. and Shleifer, A., ‘Style investing’, Journal of Financial Economics, Vol. 68, 2003,pp. 161–99.
Bengtsson, O. and Ravid, S. A., ‘The importance of geographical location and distance on venturecapital contracts’, SSRN: http://ssrn.com/abstract=1331574, 2009
Caselli, S., Gatti, S. and Perrini, F., ‘Are venture capitalists a catalyst for innovation?’, EuropeanFinancial Management, Vol. 15 (1), 2009, pp. 92–111.
Cochrane, J., ‘The risk and return of venture capital’, Journal of Financial Economics, Vol. 75 (1),2005, pp. 3–52.
Cumming, D.J., ‘Contracts and exits in venture capital finance’, Working Paper, Available at SSRN:http://ssrn.com/abstract=302695, 2002.
Cumming, D.J., Fleming, G. and Schwienbacher, A., ‘Style drift in private equity’, Journal of BusinessFinance and Accounting, Vol. 36, 5–6, 2009, pp. 645–78.
Cumming, D.J., Fleming, G. and Schwienbacher, A., ‘The structure of venture capital funds’, inHandbook of Research on Venture Capital, Edward Elgar, pp. 155–176.
Da Rin, M., Nicodano, G. and Sembenilli, A., ‘Public policy and the creation of active venture capitalmarkets’, Journal of Public Economics, Vol. 80 (8–9), 2006, pp. 1699–1723.
Diller, C. and Kaserer, C., ‘What drives private equity returns? Fund inflows, skilled GPs, and/or risk?’European Financial Management, Vol. 15 (3), 2009, pp. 643–75.
Froot, K., O’Connell, P. and Seasholes, M., ‘The portfolio flows of international investors’, Journal ofFinancial Economics, Vol. 59, 2001, pp. 151–93.
Froot, K. and Teo, M., ‘Equity style returns and institutional investor flows’, NBER Working Paper10355, (2004).
Gompers, P.A. and Lerner, J., ‘The use of covenants: an empirical analysis of venture capital partnershipagreements’, Journal of Law and Economics, Vol. 39, 1996, pp. 463–98.
Gompers, P.A. and Lerner, J., ‘What drives venture fundraising?’, Brookings Proceedings on EconomicActivity – Microeconomics,149–192, National Bureau of Research Working Paper 6906 (1998).
Hege, U., Palomino, F. and Schwienbacher, A., ‘Venture capital performance in Europe and the UnitedStates: a comparative analysis’, Revue Finance 30 (1), 2009, pp. 7–50.
Jeng, L.A. and Wells, P.C., ‘The determinants of venture capital fundraising: evidence across countries’,Journal of Corporate Finance, Vol. 6, 2000, pp. 241–89.
Kaplan, S. and Schoar, A., ‘Private equity performance: returns, persistence, and capital flows’, Journalof Finance, Vol. 60, 2005, pp. 1791–1823.
Lerner, J. and Schoar, A., ‘The illiquidity puzzle: theory and evidence from private equity’, Journal ofFinancial Economics, Vol. 72, 2004, pp. 3–40.
Lerner, J., Schoar, A. and Wong, W.X, ‘Smart institutions, foolish choices?: The limited partnerperformance puzzle’, Journal of Finance, Vol. 62(2), 2007, pp. 731–64.
Litvak, K., ‘Venture capital limited partnership agreements: understanding compensation arrange-ments’, Working Paper (University of Texas Law School, 2004).
Makela, M.M. and Maula M.V.J., ‘Attracting cross-border venture capital: the role of a local investor’,Entrepreneurship and Regional Development, 20(3), 2008, pp. 237–57.
Mayer, C., Schoors, K. and Yafeh, Y., ‘Sources of funds and investment strategies of VC funds: evidencefrom Germany, Israel, Japan and the UK’, Journal of Corporate Finance, Vol. 11, 2005, pp. 586–608.
Megginson, W.L., ‘Towards a global model of venture capital?’, Journal of Applied Corporate Finance,Vol. 16, 2004, pp. 8–26.
Phalippou, L. and Gottschalg, O., ‘The performance of private equity funds’, Review of FinancialStudies, Vol. 22, 2009, pp. 1747–76.
Schwienbacher, A., ‘International capital flows into private equity funds’, Maandblad voor Accoun-tancy en Bedrijfseconomie, 7/8, 2007, pp. 335–43.
Tykvova, T. and Schertler, A., ‘Overcoming distances via syndication with local friends: the case ofventure capital’, http://www.fma.org/Hamburg/Papers/dist_30Nov09.pdf, 2010.
Wermers, R., ‘A matter of style: the causes and consequences of style drift in institutional portfolios’,Working Paper (Robert H. Smith School of Business, University of Maryland at College Park, 2002).
C© 2011 Blackwell Publishing Ltd