Embed Size (px)
Citation preview

1
DETERMINANTS OF PRIVATE EQUITY BUYOUTS OPERATING PERFORMANCE: AN EMPIRICAL INVESTIGATION IN PORTUGAL
Paulo Jorge Costa da Silva
Internship report
Master’s in finance
Supervised by Professor Miguel Augusto Sousa, PhD
2019

i
Acknowledgements
To Rita, for enduring the absences, for the support, patience, comfort and loving care,
without her presence this journey would not be the same.
To my family, who always support me during my academic journey, I am deeply grateful
for their eternal care.
To my friends and professors, who I had the pleasure to meet and contributed to this
step of my academic life, without you this work would not be possible.
To my coleagues and friends at Inter-Risco, Isabel Coelho, João Amaro, Rui
Branquinho, Isabel Martins, José Leite, Ana Verde, Sílvia Almeida and Isabel Ferreira, for the
amazing opportunity and experience.
Last, but not least, to Professor Miguel Sousa, for all the support, invaluable ideas and
suggestions, availability and quickness in replying to my doubts. Thank you, Professor Miguel,
for guiding me through this process.
ii
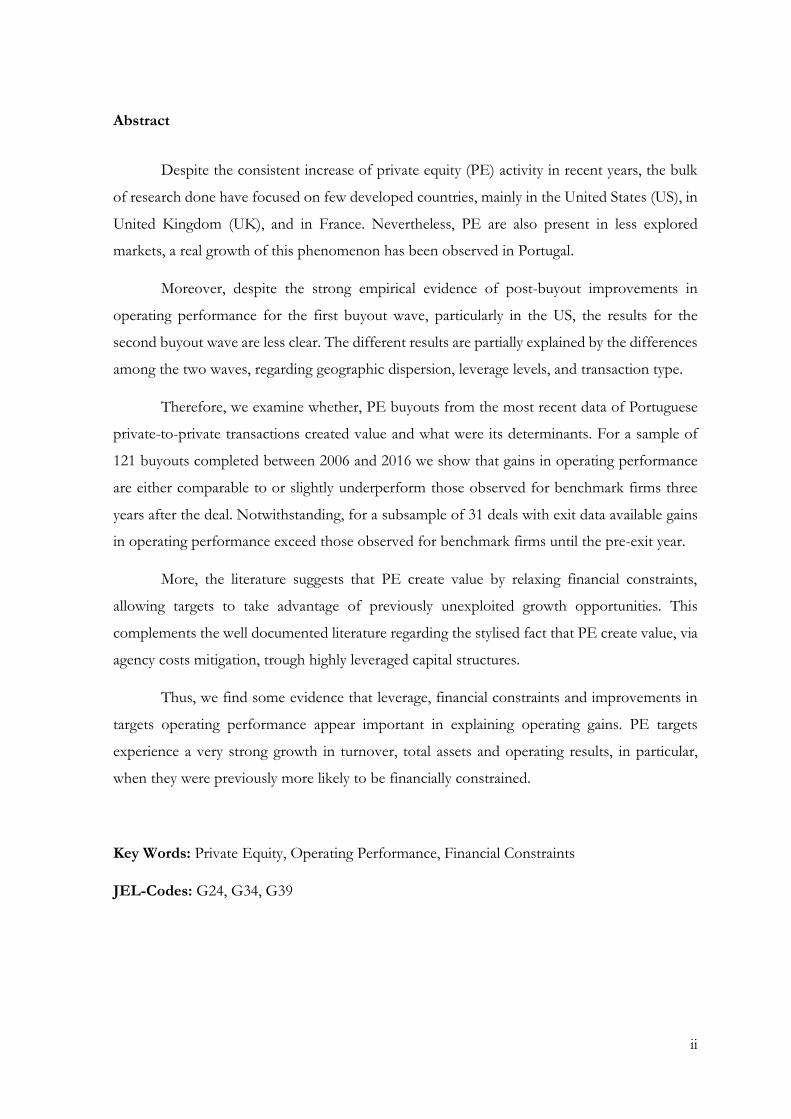
Abstract
Despite the consistent increase of private equity (PE) activity in recent years, the bulk
of research done have focused on few developed countries, mainly in the United States (US), in
United Kingdom (UK), and in France. Nevertheless, PE are also present in less explored
markets, a real growth of this phenomenon has been observed in Portugal.
Moreover, despite the strong empirical evidence of post-buyout improvements in
operating performance for the first buyout wave, particularly in the US, the results for the
second buyout wave are less clear. The different results are partially explained by the differences
among the two waves, regarding geographic dispersion, leverage levels, and transaction type.
Therefore, we examine whether, PE buyouts from the most recent data of Portuguese
private-to-private transactions created value and what were its determinants. For a sample of
121 buyouts completed between 2006 and 2016 we show that gains in operating performance
are either comparable to or slightly underperform those observed for benchmark firms three
years after the deal. Notwithstanding, for a subsample of 31 deals with exit data available gains
in operating performance exceed those observed for benchmark firms until the pre-exit year.
More, the literature suggests that PE create value by relaxing financial constraints,
allowing targets to take advantage of previously unexploited growth opportunities. This
complements the well documented literature regarding the stylised fact that PE create value, via
agency costs mitigation, trough highly leveraged capital structures.
Thus, we find some evidence that leverage, financial constraints and improvements in
targets operating performance appear important in explaining operating gains. PE targets
experience a very strong growth in turnover, total assets and operating results, in particular,
when they were previously more likely to be financially constrained.
Key Words: Private Equity, Operating Performance, Financial Constraints
JEL-Codes: G24, G34, G39

iii
Resumo
Apesar do aumento consistente da atividade de Private Equity (PE) nos últimos anos, a
maior parte dos estudos realizados focou-se em poucos países desenvolvidos, principalmente
nos Estados Unidos (EUA), no Reino Unido e na França. Contudo, PE também estão presentes
em mercados menos explorados, observando-se um crescimento da sua atividade em Portugal.
Apesar da evidência empírica de melhorias pós-aquisição no desempenho operacional
para a primeira onda de aquisições, particularmente nos EUA, os resultados para a segunda onda
de aquisições são menos claros. Os diferentes resultados são parcialmente explicados pelas
diferenças entre as ondas, em termos de dispersão geográfica, alavancagem e tipo de transação.
Portanto, examinamos se as aquisições levadas a cabo por PE, usando os dados mais
recentes das transações entre empresas privadas portuguesas, criaram valor e os seus respetivos
determinantes. Para uma amostra de 121 aquisições concluídas entre 2006 e 2016 mostramos
que os ganhos no desempenho operacional são comparáveis ou levemente abaixo dos resultados
observados para empresas comparáveis três anos após a transação. Não obstante, para uma
subamostra de 31 transações com dados de saída, os ganhos em termos de desempenho
operacional excedem os observados para as empresas comparáveis até ao ano anterior á saída.
Mais, a literatura sugere que os PE criam valor ao mitigar as restrições financeiras,
permitindo que os alvos aproveitem oportunidades de crescimento anteriormente inexploradas.
Isto complementa a literatura bem documentada sobre o facto estilizado de que os PE criam
valor através da mitigação de custos de agência, via estruturas de capital altamente alavancadas.
Assim, encontramos alguma evidência de que a alavancagem, restrições financeiras e
melhorias no desempenho operacional têm poder explicativo sobre os ganhos operacionais. As
participadas dos PE apresentam um forte crescimento no volume de negócios, no total de ativos
e nos resultados operacionais, em particular, quando antes eram mais propensas a apresentaram
restrições financeiras.
Palavras-Chave: Private Equity, Desempenho Operacional, Restrições Financeiras
JEL-Códigos: G24, G34, G39
iv
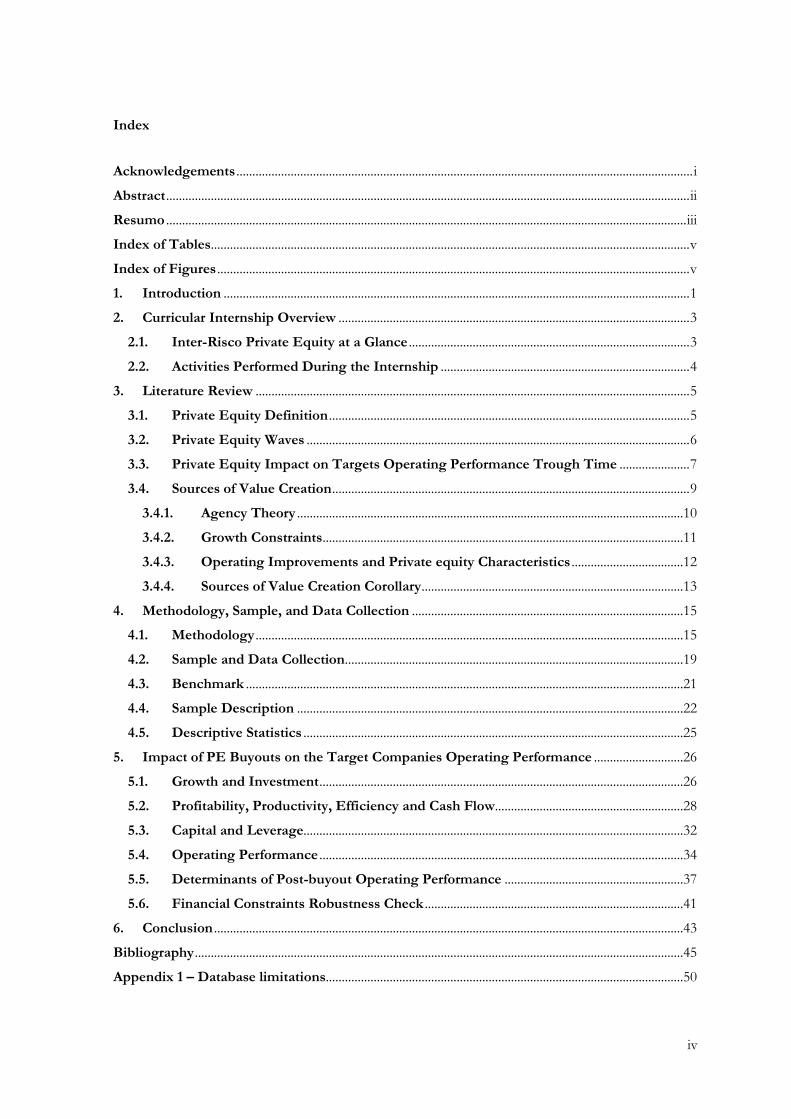
Index
Acknowledgements ............................................................................................................................................... i
Abstract .................................................................................................................................................................... ii
Resumo ................................................................................................................................................................... iii
Index of Tables ...................................................................................................................................................... v
Index of Figures .................................................................................................................................................... v
1. Introduction .................................................................................................................................................. 1
2. Curricular Internship Overview .............................................................................................................. 3
2.1. Inter-Risco Private Equity at a Glance ........................................................................................ 3
2.2. Activities Performed During the Internship .............................................................................. 4
3. Literature Review ........................................................................................................................................ 5
3.1. Private Equity Definition ................................................................................................................. 5
3.2. Private Equity Waves ........................................................................................................................ 6
3.3. Private Equity Impact on Targets Operating Performance Trough Time ...................... 7
3.4. Sources of Value Creation ................................................................................................................ 9
3.4.1. Agency Theory .........................................................................................................................10
3.4.2. Growth Constraints .................................................................................................................11
3.4.3. Operating Improvements and Private equity Characteristics ...................................12
3.4.4. Sources of Value Creation Corollary ..................................................................................13
4. Methodology, Sample, and Data Collection .....................................................................................15
4.1. Methodology ......................................................................................................................................15
4.2. Sample and Data Collection ..........................................................................................................19
4.3. Benchmark .........................................................................................................................................21
4.4. Sample Description .........................................................................................................................22
4.5. Descriptive Statistics .......................................................................................................................25
5. Impact of PE Buyouts on the Target Companies Operating Performance ............................26
5.1. Growth and Investment ..................................................................................................................26
5.2. Profitability, Productivity, Efficiency and Cash Flow ...........................................................28
5.3. Capital and Leverage.......................................................................................................................32
5.4. Operating Performance ..................................................................................................................34
5.5. Determinants of Post-buyout Operating Performance ........................................................37
5.6. Financial Constraints Robustness Check .................................................................................41
6. Conclusion ...................................................................................................................................................43
Bibliography .........................................................................................................................................................45
Appendix 1 – Database limitations................................................................................................................50

v
Index of Tables
Table 1 - Data Collection Process ................................................................................................. 21
Table 2 - Sector Breakdown ............................................................................................................ 18
Table 3 - Transaction by PE Country .......................................................................................... 23
Table 4 - Deal Distribution by PE Firm ...................................................................................... 23
Table 5 - Exit strategies and Average Holding Period ........................................................... 20
Table 6 - Descriptive Statistics ....................................................................................................... 21
Table 7 - Growth and Investment Change After the PE Entry ............................................. 26
Table 8 - Operating Efficiency Change After Entry ................................................................ 30
Table 9 - ROC, Cash Flow and Financial Dependence Change After Entry ................... 31
Table 10 - Leverage Change After Entry ..................................................................................... 33
Table 11 - Operating Performance Regressions ........................................................................ 35
Table 12 - Determinants of PE Buyouts Operating Performance ....................................... 38
Table 13 - Investment Cash Flow Sensitivity Regressions ..................................................... 42
Index of Figures
Figure 1 - Inter-Risco Current Portfolio Companies ................................................................. 3
Figure 2 - PE Deals per Year .......................................................................................................... 22
Figure 3 - PE Exits per Year ........................................................................................................... 24

1
1. Introduction
This report was developed based on a six months curricular internship at Inter-Risco
Private Equity, which took place from September 2018 to March 2019. Inter-Risco is a reference
PE firm operating in the Portuguese market since 1988. Two of the key projects of the curricular
internship were pipeline development and targets identifications for add-on acquisitions to be
pursued by portfolio companies.
Accordingly, the purpose of this report is to extend the research on PE by studying the
determinants of PE buyouts operating performance in Portugal, i.e. to understand which are
the characteristics ex-ante that justify higher improvements in the targets operating performance
after the entry and, therefore, higher value creation, via a multivariate analysis. Target selection
is a key problematic of PE firms, hence, understanding the determinants of post-buyout
operating performance is a key issue for the curricular internship host entity.
PE are playing an important role in financial markets, and they have attracted academic
attention since the 80s (e.g. Jenson, 1986; Kaplan, 1989). Despite the consistent increase of PE
backed transactions worldwide in recent years (McKinsey and Company, 2018), the bulk of
research done have focused on few developed countries, mainly in the US (Guo, Hotchkiss, and
Song, 2011; Kaplan and Strömberg, 2008), and Europe, in particular in the UK (Jelic and Wright,
2011; Wilson, Wright, Siegel, and Scholes, 2012), and in France (Boucly, Sraer, and Thesmar,
2011).
Nevertheless, PE are also present in less explored markets. In particular, a real growth
of this phenomenon has been observed in Portugal, where the funds under PE management
reached €4.5 Billion in 2017, totalizing 2.3% of the Portuguese GDP, up from approximately
€1.2 Billion in 2008 (CMVM, 2017). This growth is particularly relevant once the Portuguese
market is dominated by private Small and Medium-sized Enterprises (SME), representing 56.8%
of total value added in 2016 (European Commission, 2017), a segment fostered by material
financial constraints all over Europe (Borbás, 2013), which limits investments and mitigates
growth prospects in sales, assets and employment (Boucly et al., 2011).
In fact, the literature suggests that on average PE lessen targets financial constraints and
firms present a strong growth in sales and assets (Boucly et al., 2011), with the effect on
employment being more diffuse (Wilson et al., 2012). Moreover, PE backed companies benefit

2
from improvements in terms of operating profitability, cash flow generation (Guo et al., 2011),
productivity (Kaplan and Strömberg, 2008), and working capital management, even when
compare to non-backed PE companies (Wilson et al., 2012).
Furthermore, most value creation in PE portfolio companies is accomplished by
operating improvements (Heel and Kehoe, 2005; Acharya, Gottschalg, Hahn, and Kehoe, 2013).
In effect, the increased volatility and uncertainty that followed the Global Financial Crisis are
expected to lead PE firms to focus more on the things that they can influence rather than relying
on market sentiment (Plagborg-Møller and Morten, 2017).
Accordingly, to examine drivers of buyouts operating performance we build on the
recent literature that suggests that buyout targets characteristics are important determinants of
value creation (Sannajust, Arouri, and Chevalier, 2014). Additionally, despite some studies
explore the impact of PE buyouts operating performance in Portugal (e.g., Almeida, 2018), the
researchers limited their studies to an univariate analysis, therefore our study intends to build
on this past research by applying a multivariate analysis. Moreover, despite several studies have
examined the effects of PE on the operating performance of portfolio companies, little research
has identified the key operating levers that PE firms influence to improve performance
(Gompers, Kaplan, and Mukharlyamov, 2016). Most studies focus only on the effects of PE
buyouts on operating performance, not considering what were the characteristics ex-ante
associated with higher improvements in the operating performance ex-post. Thus, our research
contributes to the literature in two ways: 1) by proposing a general framework to investigate
determinants of performance in Portugal from 2007 to 2016; 2) developing the literature on the
value drivers that PE influence in order to deploy operating performance improvements.
The remainder of this report is organised as follows. Section 2 presents Inter-Risco, the
main activities performed during the internship and its connection with the research developed.
Section 3 presents the literature review, defining PE, documenting the historical evolution of
PE deal activity, analysing the PE impact on targets operating performance, and discussing the
sources of value creation in PE buyouts. Section 4 explains the methodology, the data collection
process, and presents the sample description. Section 5 reports, analysis and discusses the results
achieved, and section 6 concludes the report.

3
2. Curricular Internship Overview
One of the main motivations for this research was the curricular internship performed at
Inter-Risco Private Equity and its connection with two key projects developed during the six
months internship, pipeline development and identification of targets for portfolio company’s
add-on acquisitions. Thus, this intermediary section briefly presents the identification and
description of the activities performed and their context within the institution where the
internship was carried out.
2.1. Inter-Risco Private Equity at a Glance
Founded in 1988, Inter-Risco is a reference PE on the Portuguese market, headquartered in
Porto, with approximately €130.0 Million of assets under management. Inter-Risco targets the
fragmented SME segment, having invested over €200.0 Million in more than 100 Iberian firms.
The PE firm focuses on expansion investment, through internationalization, build-up
investments, and buyouts developed in fragmented, regulated or growth markets, with the aim
of creating leading players in its respective industries. Inter-Risco pursues a generalist sector
approach, with a preference for traditional industries with liquid M&A markets, in order to
ensure a successful exit strategy and mitigate the overall investment risk.
Inter-Risco obtains majority or significant minority equity stakes within the range of €5.0 to
20.0 Million in medium-sized companies with a maximum turnover of €100.0 Million. In order
to create value Inter-Risco follows a strategy of hands-on involvement in all its portfolio
companies, from strategy definition to day-to-day considerations. Key areas of intervention
include strategic planning and implementation, professionalization and post-deal integration,
business plan execution, networking and deal-flow opportunities, and operational upgrade.
Source: Inter-Risco.
Figure 1 - Inter-Risco Current Portfolio Companies

4
2.2. Activities Performed During the Internship
The curricular internship was developed at Inter-Risco Investment Management
department, with the main objective of developing thorough sector analysis on the optic of a
PE firm, culminating on an investment recommendation to the Inter-Risco Board.
Consistently, one of the key projects of the curricular internship included pipeline
development, where a long list of targets was elaborated based on market, industry and company
specifics evaluation. Another of the key projects included targets identification for add-on
acquisitions to be pursued by companies currently in Inter-Risco portfolio, after an in-depth
analysis of the industry’s current dynamics.
Therefore, associated with the described activities it was concluded that a study about the
determinants of PE buyouts operating performance in Portugal was an appropriate and relevant
research to conduct, considering that the investment decision is a core competence and a critical
factor of success in the PE industry. Hence, understanding the determinants of post-buyout
operating performance at firm level is a key issue for the curricular internship host entity.
Consequently, the main objectives of this study are: 1) understand if PE backed companies
present a superior operating performance than a sample of match firms; 2) identify the pre-
buyout determinants of post-buyout improvements in PE targets operating performance.
The following sections include a theoretical framework that duly justifies the pertinence of
the performed research, through an adequate review of the literature. The identification,
foundation and description of the methodologies used to provide an answer to the presented
objectives, the application of the methodologies and the respective analysis of the results.

5
3. Literature Review
3.1. Private Equity Definition
In a leveraged buyout (LBO) a company is acquired by a specialized investment firm using
relatively more debt than equity financing. “The LBO investment firms today refer to
themselves (and are generally referred to) as private equity firms” (Kaplan and Strömberg, 2008).
PE are at the same time an asset class and an alternative source of financing to companies
(Santos, 2013). In a traditional LBO transaction, the PE firm acquires a dominant stake in an
existing mature firm. This resumes the distinction from venture capital (VC) firms that typically
invest in young or emerging companies, and most of the times do not obtain majority control
(Kaplan and Strömberg, 2008). More precisely PE include investments such as LBO,
management buyouts (MBO), management buy-ins (MBI), expansion and replacement capital,
and turnaround investments (Mendes and Sousa, 2013).
Legally the PE firm is organized as a partnership or limited liability corporation. The PE
firm raises equity capital through a PE fund, of which the majority are “closed-end” vehicles in
which investors [limited partners (LP)] commit a certain amount of money to pay for
investments in companies and management fees to the PE firm. The LP typically include
institutional investors and high net worth individuals. The PE firm serves as the fund’s general
partner (GP), being expected for the GP to provide 1% of the total capital. Traditionally, the
fund has a fixed life, usually ten years, but can be extended for up to three additional years. The
PE firm typically has up to five years to invest the capital in the fund into companies (if the
capital is not invested, it must be returned to LP), and then has an additional five to eight years
to return the capital to its investors (Kaplan and Strömberg, 2008), putting the average fund
maturity between 10 and 13 years.
On top of the equity raised, the remaining portion of the capital used by PE in buyouts is
provided from financial debt, typically bank debt, but can also compress other forms of debt,
such as junk bonds, mezzanine debt, paid-in-kind debt, among others (Kolev, Haleblian, and
McNamara, 2012). After the fund hits the dotation, GP are in position to deploy the PE funds,
if the basic covenants of the fund agreement are followed, examples include deals leverage
restrictions and on how much fund capital can invest in a single company (Kaplan and
Strömberg, 2008), and capital calls begin as soon as good investment opportunities appear.

6
Traditionally, the PE firm and GP are compensated in three ways. First, the GP earns an
annual management fee, a percentage of capital committed, and as investments are realized, a
percentage of capital employed. Second, the general partner earns a share of the profits of the
fund, that generally equals 20%, called carried interest. Third, some GP charge deal fees and
monitoring fees to portfolio companies (Kaplan and Strömberg, 2008). PE funds are generally
designed to generate capital profits from the sale of investments complementing income from
dividends, fees and interest payments (Gilligan and Wright, 2014).
Jensen (1989) predicted that PE have the potential to become the dominant corporate
organizational form. His rationale was based on PE portfolio companies concentrated
ownership, strong incentives to PE professionals, and lean and efficient business model that
minimizes overheads. This combined with active governance applied to portfolio companies,
high leverage capital structures and balanced performance-based managerial compensation,
provided the hedge against public companies. The following section proves that Jensen was not
much fare way from the empirically evidence, almost 30 years after is prediction.
3.2. Private Equity Waves
The LBO wave of the 80s was a significant event well studied by academics and
professionals, particularly in the US (Guo et al., 2011). This LBO wave was transversal across
geographies, but the majority of deal volume was limited to the US market (Kaplan and
Strömberg, 2008). The wave was driven by favourable economic conditions, increased
deregulation, and financial innovations, like junk bonds (Kolev et al., 2012). Large increases in
both the number and average size of LBOs contributed to growth, raising the share of LBOs in
all M&A volume from 4% to 27%, between 1981 and 1986 (Lichtenberg and Siegel, 1990). This
wave was characterized by the breakup of many major conglomerates by corporate raiders,
mainly PE, using hostile takeovers (Kolev et al., 2012), hence it became known as the
“Entrenchment Era”. The boom ended with the recession of the early 90s, as many of the LBO
deals from later in that period defaulted, due to excessive leverage (Guo et al., 2011).
Nearly fifteen years later, the pace of LBO activity reached new record levels, hitting a new
maximum in 2007 (McKinsey and Company, 2018). Low interest rates, as consequence of
expansionary macroeconomic policies implemented by Central Banks, instigated PE to use
LBOs to acquire firms and divest them as soon as the market pushed the value of the firm,
7
while benefiting of a favourable environment characterized by low inflation and steady real
economic growth (Gilligan and Wright, 2014). Albeit, the leverage used was significantly less
(Guo et al., 2011). PE did not remain confined to the US, spreading to Western Europe and
UK, as opposed to the previous wave when the US concentrated the bulk of transactions
(Kaplan and Strömberg, 2008). By 2007, cheap debt was no longer available and equity investors
became harder to get, a consequence of the 2007/08 Financial Crisis and resultant economic
recession, ending the wave perpetuation (Gaughan, 2011).
In the last eleven years, Central Banks lowered interest rates and financial markets were
flooded by liquidity as a consequence of Quantitative Easing programs, putting downward
pressure on the cost of capital, driving PE deal activity (PricewaterhouseCoopers, 2018) and
contributing to robust corporate cash balances. Indeed, the resilience of the M&A market is
particularly remarkable in the face of increasing valuation multiples (Boston Consulting Group,
2018). These factors contributed to a consistent increase of PE buyouts in recent years.
3.3. Private Equity Impact on Targets Operating Performance Trough Time
A considerable part of empirical work based on LBO transactions from the 80s supports
the notion that PE transactions create value, via large gains in operating performance (Guo et
al., 2011). During the 80s wave, Lichtenberg and Siegel (1990) studied 12,000 US manufacturer
plants and documented that LBO (particularly MBO) that occurred from 1983 to 1986 had a
strong positive effect on productivity. Kaplan (1989) for a sample of 76 MBO of public
companies completed between 1980 and 1986, concluded that these companies experienced
increases in operating income (before depreciation), decreases in capital expenditures and
increases in net cash flow. Documenting that the improvement on operating performance was
followed by an increase in market value. A year after, Smith (1990) studied changes in operating
performance after 58 MBO of public companies between 1977 and 1986 in the US. Operating
returns increase significantly from the year before to the year after buyouts, measured by
operating cash flows (before interest and taxes) per employee and per dollar of operating assets.
Despite the strong empirical evidence of ex-post LBO improvements in operating
performance for the first buyout wave, there are mixed results for the second buyout wave
(Ayash and Schütt, 2016). Guo et al. (2011) analysed a sample of 94 public-to-private US
transactions between 1990 and 2006. They found that gains in operating performance were not

8
statistically different from those observed for benchmark firms. In a recent study, Ayash and
Schütt (2016) using financial statements for 183 US public-to-private LBO, reproduced the
results of previous studies, once proxies were modified to account for the LBO process, and
find no robust evidence of post-buyout improvements in public-to-private LBO, regardless of
the period studied. Wilson et al. (2011) studied a large sample of UK buyouts from 1995 to 2010
and found that PE backed firms achieved superior performance in the period before and during
the global recession of 2008, relative to comparable firms that did not experience such
transactions. Harris, Siegel and Wright (2005) studied the productivity of UK manufacturing
plants subject to MBO. Such plants experienced substantial increases in productivity, the ex-
post improvements were higher than those reported in the US by Lichtenberg and Siegel (1990).
While the former studies focused on public-to-private transactions, Chung (2011) analysed
1,009 private-to-private PE transactions in the UK from 1998 to 2007, concluding that the main
motive for this type of deals is the elimination of inefficiency and mitigation of investment
constraints. Scellato and Ughetto (2012) analysed 241 private-to-private buyouts involving
European companies between 1997 and 2004. Their results indicate a positive impact of
buyouts on the growth of total assets and of employment in target firms in the short medium
term. An equivalent clear pattern cannot be identified for profitability, while PE backed firms
present lower operating profitability with respect to the control group three years after a deal is
made. Albeit, restricting the analysis to the sub-sample of buyout companies, the authors found
that generalist funds negatively and significantly impact the mean ex-post operating profitability
of PE-backed firms, while turnaround specialists positively impact operating profitability.
Consistent with Cressy, Munari, and Malipiero (2007) that concluded that PE specialization is
positively related with value creation.
Continuing with private-to-private transactions, Boucly et al., 2011 using a dataset of 839
French deals over 1994-2004 concluded that targets become more profitable, grow faster than
the benchmark, issue additional debt, and increase capital expenditures, particularly those that
were financial constrained ex-ante. Bergstrom, Grubb, and Jonsson (2007) studied Swedish
buyout companies exited between 1998 and 2006, concluding that buyouts have a significant
positive impact on the companies' operating performance. In Portugal, Almeida (2018) using a
sample of 100 firms over 2007-2015 concluded that the operating performance of PE backed
companies deteriorates, despite the growth of the asset base, revenues and employment. These
results were consistent with Mendes and Sousa (2013) findings.

9
Nonetheless, despite regional and temporal idiosyncrasies, the overall evidence suggests a
“general consensus across different methodologies, measures, and time periods regarding a key
stylized fact: LBOs and especially MBOs enhance performance” even when compared to non-
backed PE firms (Cumming, Siegel, and Wright, 2007). This leads to our first hypothesis:
H1: Private equity investment improves the operating performance of target firms after the buyout.
3.4. Sources of Value Creation
Kaplan and Strömberg (2009) categorise three sources of value creation: financial
engineering, governance engineering, and operating engineering. These levers are not mutually
exclusive, but certain PE firms likely focus more in ones than others (Gompers et al., 2016). In
financial engineering, PE firms provide strong equity incentives to the management teams of
their investees. Cumulatively, leverage has a disciplinary role over management, reducing
discretionary power of managers, and generates a tax shield, other common source of value
creation pointed by the literature (e.g., Kaplan, 1989; Guo et al., 2011). In governance
engineering, PE firms control the boards of their portfolio companies, being actively and
accurately involved in governance and key strategic and operating decisions. In operating
engineering, PE firm’s industry and operating expertise adds value to their portfolio companies
(Kaplan and Strömberg, 2009; Gompers et al., 2016). These facts combined result in higher
value creation, with most value creation in PE backed firms being obtained by operating
improvements (Heel and Kehoe, 2005; Acharya, et al., 2013).
In this research we focus on two of the three levels of value creation, given data limitations.
On the financial engineering side, we will concentrate our analysis on the agency theory,
specifically in the disciplinary role of debt, and on the operating engineering side, in the value
drivers that PE pull in order to deploy higher improvements in operating performance.
Researchers identify the effects of buyouts on firm’s performance based on a diversity of
accounting-based measures, including sales and employment growth (Wilson et al., 2011;
Scellato and Ughetto, 2012; Mendes and Sousa, 2013), operating profitability1 (Kaplan, 1989;
1 Commonly, operating profitability, scaled by sales or total assets, has been adopted as a measure of operating
performance in previous studies (e.g. Kaplan, 1989; Guo et al., 2011).

10
Guo et al., 2011; Wilson et al., 2011), cash flow (Smith, 1990; Scellato and Ughetto, 2012;
Almeida, 2018) and productivity (Lichtenberg and Siegel, 1990; Harris et al., 2005). Generally,
relatively more leveraged deals and firms with a good operating performance ex-ante are
associated with better ex-post operating performance (Guo et al., 2011).
3.4.1. Agency Theory
Prior research has relied on agency theory as the theoretical base to explain ex-post
performance of PE portfolio companies. The lack of a perfect alignment of interest between
ownership and management originates agency costs. Agency costs are incurred by shareholders,
as a result of the separation of ownership and control (Jensen and Meckling, 1976). Corporate
governance mechanisms can mitigate agency costs (Jensen, 1986). There are two main categories
of governance mechanism, internal and external. Internal mechanisms can be split into
monitoring and incentive-related (Sannajust et al., 2014). Monitoring mechanisms refer to board
structures (Fama and Jensen, 1983), external shareholdings unaffiliated with management
(Shivdasani, 1993) and debt (Jensen, 1986). The main external corporate governance mechanism
is the market for corporate control (Jensen, 1986; Shivdasani, 1993), acting as the last resort
mechanism if the internal mechanisms fail (Sannajust et al., 2014). Therefore, the problematic
becomes one of explaining how PE buyouts mitigate agency costs.
The main explanation is related with cash generation and become known as the Free Cash
Flow theory perpetuated by Jensen (1986). Agency costs are incurred because free cash flow is
spent on projects that do not generate the required return (Jensen, 1986). These firms exhibit
low growth opportunities and large free cash flows, with strong cash balances the discretionary
power of managers increase, increasing the propensity of value expropriation from
shareholders. Those firms may become a buyout target. Usually debt levels increase with
buyouts. The disciplining role of debt prevents managers from wasting resources. Additionally,
PE firms are actively and accurately involved in governance and key strategic and operating
decisions. It follows that agency theory contends that buyouts result in a superior governance
model (Scellato and Ughetto, 2012).
Using agency theory as theoretical foundation, several empirical studies find an
improvement in the operating performance of PE targets following a buyout. Most of these
studies focused the first wave of PE deals in the 80s and mainly focus on public-to-private
11
transactions, specifically in the US (e.g., Kaplan, 1989; Smith, 1990; Lichtenberg and Siegel,
1990). These studies commonly assess the performance of target companies after the buyout
with respect to the industry average or simply compare the firms’ ex-ante and ex-post
performance. More recent studies associated with the second wave of buyout transactions,
which occurred between the 90s and 2009, put additional effort in comparing buyout firms to
other relevant benchmarks, after the contribution of Barber and Lion (1995) that provided a
theoretical framework for the accounting based proxies and benchmark methods, and more
evidence other than that from US has appeared (e.g., Bergstrom et al., 2007; Wilson et al., 2011).
Traditionally, in this type of studies the literature proxy’s agency issues via leverage ratios,
cash holdings, or ownership dispersion (e.g. Kaplan and Strömberg, 2009; Guo et al., 2011;
Sannajust et al., 2014). PE targets presenting pre-deal relatively low leverage ratios, high cash
holdings and dispersed ownership translates into higher agency costs, under the form of
relatively lower operating profitability, thus being more prone to operating improvements.
However, the agency view cannot fully explain the LBO of private firms (Wright et al. 2000)
because it is less likely that private firms suffer from agency problems due to their concentrated
ownership structure (Chung, 2011) and due to its family owned and managed base. Accordingly,
while for the first wave the mitigation of agency conflicts is well documented, more recent
studies like Guo et al. (2011), in US for public-to-private deals, or in the case of private-to-
private transactions Scellato and Ughetto (2012) in European, or Chung (2011) in UK, do not
find clear evidence in favour of Jensen's hypotheses.
3.4.2. Growth Constraints
A relatively recent stream of literature suggests that PE create value by relaxing financial
constraints, allowing targets to take advantage of unexploited growth opportunities. This driver
has special relevance in Portugal, since it is a country with many family managed businesses and
where the credit and stock markets are less developed than those of the US and the UK.
Boucly et al. (2011) analysing a sample of PE French deals find solid evidence in private-to-
private transactions, particular in industries with strong reliance in external finance, that PE
targets become more profitable, grow much faster than the benchmark, issue additional debt,
and increase capital expenditures. Engel and Stiebale (2013) analyse a sample of firms in the UK

12
and France. In both countries, they find that portfolio firms are characterized by higher
investment levels and fewer financial constraints after buyouts. In fact, in the UK, PE backed
buyouts outperform non-PE backed firms in terms of both indicators. Bertoni, Feerer, and
Martí (2013) argue that thanks to PE and VC ability in overcoming information asymmetries,
they will entail a reduction in the financial constraints which tampered the growth of portfolio
companies. The authors predict, a greater dependency of investments to cash flow for PE-
backed firms, driven by the renewed interest for growth of their management combined with
higher leverage, confirming the hypothesis on a large panel of small Spanish private firms.
In fact, while the Free Cash Flow theory of Jensen (1986) implies an overinvestment in the
pre-buyout phase, the asymmetric information hypothesis and elimination of growth constraints
(Bertoni et al., 2013) predicts an underinvestment in the pre-buyout phase. Indeed, financial
constraints ex-ante are associated with higher post-buyout operating performance. Bertoni et al.
(2013) findings, gains in operating performance supported by higher investment levels, indicate
that targeting firms which are financial constrained matters, since the authors find the most
pronounced and statistically significant effects for SME, also Engel and Stiebale (2013) achieve
the same conclusion for UK and French SME, while Boucly et al. (2011) find that the impact
on growth is also more pronounced among family owned French SME and industries with
higher financial dependence.
Growth constraints are proxied by ex-ante sales or assets growth (Boucly et al., 2011; Engel
and Stiebale, 2013), while financial constraints are proxied via financial dependence ratios [e.g.
(CAPEX - Gross cash flow)/CAPEX (Rajan and Sinagales, 1998)]. Other studies proxy financial
constraints via Investment Cash Flow (ICF) sensitivity (Bertoni et al., 2013).
3.4.3. Operating Improvements and Private equity Characteristics
Most value creation in PE backed firms is obtained by operating outperformance (Heel and
Kehoe, 2005). PE investors expect to add value via greater focus on increasing growth than on
reducing costs (Gompers et al., 2016). Albeit, both revenue enhancement (e.g. Gompers et al.,
2016), via clients and markets diversification, and cost control (Chung, 2011), economies of
scale and/or scope and focus on efficiency gains, are common strategies. Consistent with this
stream of literature, recent studies found reliable results regarding the positive and statistically
significant relation among PE specialization and improvements in buyouts operating
13
performance. The rationale is based on the fact that stage or industry specialized investors face
fewer information asymmetries and uncertainty due to better knowledge of the firms within that
specific stage of development or industry (Ughetto, 2010).
Cressy et al. (2007) tested if investment specialisation by industry or stage provides the PE
firm with a competitive advantage (advantages-to-specialization hypotheses). Using data from
122 UK buyouts from 1995 to 2002 and a matched sample of non-PE backed UK they found
that over the first three post-buyout years: (i) operating profitability of PE-backed companies is
greater than the benchmark, consistently with the Free Cash Flow theory; (ii) industry
specialization of PE firms adds extra improvements to operating performance, consistently with
the industry-specialization hypothesis; (iii) stage (buyout) specialization does not impact
profitability but may improve growth. More recent studies, like Scellato and Ughetto (2012),
analysed a sample of 241 private-to-private buyouts involving European companies between
1997 and 2004, the authors found that generalist funds negatively and significantly impact the
mean ex-post operating profitability of PE-backed firms, while turnaround specialists are
positively associated with operating profitability. The bulk of this studies use binary variables to
group PE into specialists and generalists’ firms, via qualitative assessment of PE portfolio firms.
Nevertheless, PE firms differ widely in terms of age and size of funds under management,
and not only in stage and industry focus (Cressy et al. 2007), thus all these variables should be
considered. Accordingly, Acharya et al. (2012), studied 395 deals closed from 1991 to 2007 in
Western Europe by 37 large, mature PE, concluding that the bulk of value creation arises from
improvements in operating performance, leverage and exposure to the specific sector. They also
found that ownership by large, mature PE firms has a positive impact on the operating
performance of investees, when compared to the sector. However, because PE cannot control
its experience or size, and these variables do not relate directly with the purpose of this study
we did not consider them in our analysis.
3.4.4. Sources of Value Creation Corollary
Given these general evidences, suggesting that PE firms develop different strategies to
create value, and the fact that the increased volatility and uncertainty that followed the Global
Financial Crisis are expected to lead PE firms to focus more on the things they can influence

14
rather than relying on market sentiment (Plagborg-Møller and Morten, 2017), like operating
performance improvements, we advance the following hypothesis:
H2: Target firms present certain ex-ante characteristics that justify higher operating improvements ex-post.
In particular, firms with low growth ex-ante (both in terms of sales and assets), high agency
conflicts (e.g. proxied by low leverage ratios), and firms that had underperform the industry in
the recent past (benefiting from PE experience either because of its track record or industry/
stage – specialization) are those more prone to ex-post operating improvements.

15
4. Methodology, Sample, and Data Collection
In the previous section we concluded that, despite the strong empirical evidence of post-
buyout improvements in operating performance for the first buyout wave, there are mixed
results for the second wave (Ayash and Schütt, 2016). The different results found in the two
waves are partially explained by the differences among them: i) while the bulk of deals in the
first wave remained confined to the US, the second wave spread across the UK and continental
Europe (Kaplan and Strömberg, 2009); ii) the debt load on an average deal was significantly less
in the second buyout wave than in the first wave (Guo et al., 2011); iii) the majority of research
in the first wave was focused on public-to-private transactions, while in the second wave there
were a lot more studies focused on private-to-private transactions.
In Portugal no consistent evidence was found regarding improvements in PE backed
companies after the buyout when compared to the appropriate benchmark (Mendes and Sousa,
2013; Almeida, 2018), which goes against our first hypothesis.
However, given standard sources of value creation pointed in the literature, and based on
the general evidence discussed in the previous sections we theorize that firms that before the
buyout present a certain type of characteristics are those more prone to operating improvement
in the post-buyout phase. Therefore, this section defines the sample and explains the
methodology used.
4.1. Methodology
In this study a set of variables are used to assess the evolution of a company before and
after the buyout. Book value of total assets (turnover) are used as proxy for size (growth). Capital
expenditures (CAPEX2) translates the investment activity by the company. EBITDA3 and
EBIT4 are used as proxies to operating cash flow generated by the companies, before and after
maintenance investment, respectively. Net cash flow is analysed in order to proxy the cash
2 CAPEX defined as Fixed Assetst - Fixed Assetst-1 + Depreciations and Amortizationst. Fixed assets defined as
the sum of tangible assets, intangible assets, investment properties, financial investments, and goodwill.
3 Earnings before interest, tax, depreciations and amortizations.
4 Earnings Before Interest and Tax.

16
generation of a firm after its investment activity, being defined as EBITDA after CAPEX.
Return on capital (ROC) is used as a measure of economic performance at company level. By
using this last indicator, we can separate the variation of the ROC into operating profitability
expansion (contraction), through EBIT margin, or productivity improvements (decreases), via
assets turnover. Therefore, profitability and productivity measures are calculated by deflating
the EBIT by the end-of period turnover and turnover by the end-of-period capital. Capital is
defined as the sum of equity and net debt. These ratios aim to measure the ability of the company
to improve or maintain its operating efficiency and the efficiency in the use of its assets. These
indicators have been extensively used5 in past studies (for example Kaplan, 1989; Guo et al.
2011) and partially adapted to control for acquisitions and divestures after the buyout. All
variables are presented before interest and taxes, therefore controlling for effects resulting from
capital structure and tax brackets. All the ratios are winsorised between 0.05 and 0.95 percentiles,
and the results presented as the median values similar to other studies (e.g. Guo et al., 2011) in
order to control for outliers.
To answer our first research question, we follow Healy et al. (1992), that employed a simple
linear regression to estimate improvements in post-buyout performance. The model consists in
an OLS regression (i=1, . . .n) where n is sample size:
Median 𝑅𝑂𝐶𝑖𝑎𝑑𝑗𝑒𝑥−𝑝𝑜𝑠𝑡 = α + 𝛽𝑖 Median 𝑅𝑂𝐶𝑖𝑎𝑑𝑗
𝑒𝑥−𝑎𝑛𝑡𝑒 + 𝑒𝑖
Median 𝑅𝑂𝐶𝑖𝑎𝑑𝑗𝑒𝑥−𝑝𝑜𝑠𝑡
is computed as the median yearly ROC of each target firm in the
years [t=+1, +2, +3] following the buyout date less the median yearly ROC of each control firm
in the same period. Median 𝑅𝑂𝐶𝑖𝑎𝑑𝑗𝑒𝑥−𝑎𝑛𝑡𝑒
is the median yearly ROC of each target firm in the
years [t=-3, -2, -1] less the median yearly ROC of each control company in the same period. An
additional subsample is analysed, encompassing all the years from the buyout to the exit. The
5 Generally, the literature uses return on assets (ROA), defined as EBITDA over year-end or year-beginning total
assets (e.g. Kaplan, 1989). Nonetheless, other authors, in more recent studies use alternative measures, such as
EBITDA over year-end equity plus debt minus trade payables (e.g. Boucly et al., 2011). We decided to use EBIT
in the numerator, similar to Sannajust et al. (2015), since it is a better proxy for cash flow than EBITDA, for a
detailed discussion please see Stumpp, Marshella, Rowan, McCreary, and Coppola (2000).
(4.1.)
17
coefficients (𝛽𝑖) can be interpreted as the relation between pre- and post-buyout performance,
while the intercept α is an estimate of the mean amount of post-buyout performance left
unexplained by exogeneous effects, like positive industry or economic momentum, or business
cycle phase and must be, by definition, attributed to the PE skill.
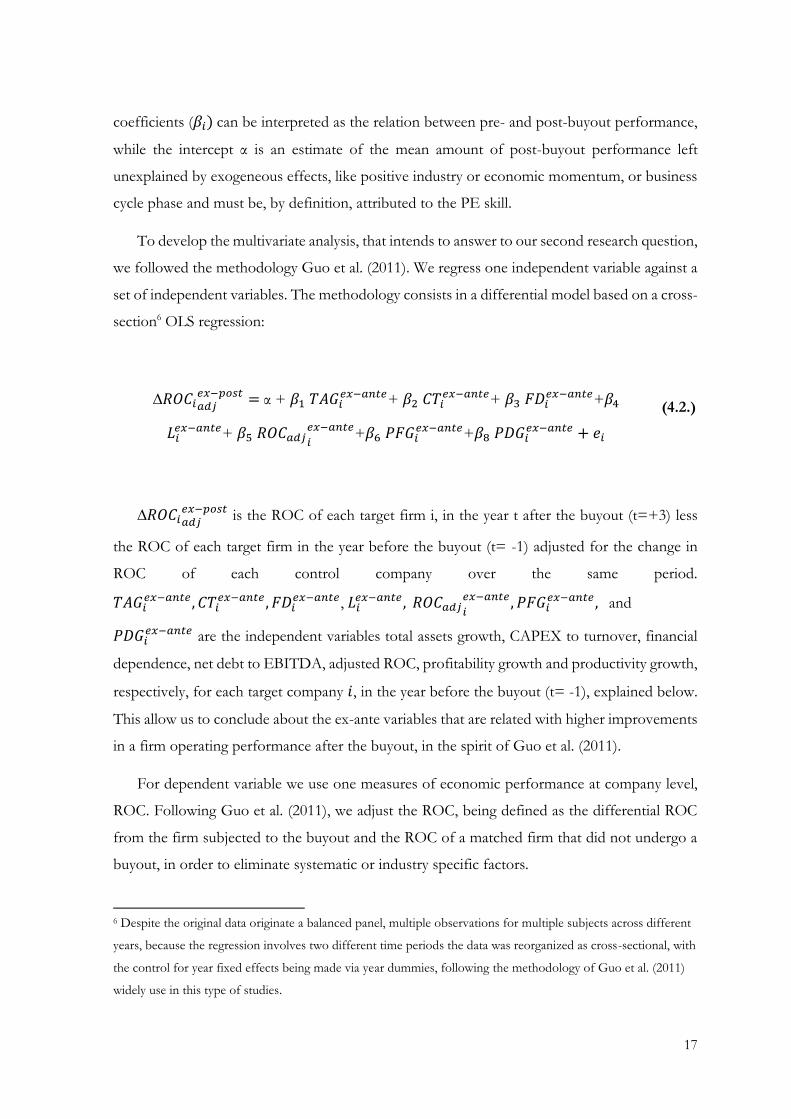
To develop the multivariate analysis, that intends to answer to our second research question,
we followed the methodology Guo et al. (2011). We regress one independent variable against a
set of independent variables. The methodology consists in a differential model based on a cross-
section6 OLS regression:
∆𝑅𝑂𝐶𝑖𝑎𝑑𝑗𝑒𝑥−𝑝𝑜𝑠𝑡 = α + 𝛽1 𝑇𝐴𝐺𝑖
𝑒𝑥−𝑎𝑛𝑡𝑒+ 𝛽2 𝐶𝑇𝑖𝑒𝑥−𝑎𝑛𝑡𝑒+ 𝛽3 𝐹𝐷𝑖
𝑒𝑥−𝑎𝑛𝑡𝑒+𝛽4
𝐿𝑖𝑒𝑥−𝑎𝑛𝑡𝑒+ 𝛽5 𝑅𝑂𝐶𝑎𝑑𝑗𝑖
𝑒𝑥−𝑎𝑛𝑡𝑒+𝛽6 𝑃𝐹𝐺𝑖
𝑒𝑥−𝑎𝑛𝑡𝑒+𝛽8 𝑃𝐷𝐺𝑖𝑒𝑥−𝑎𝑛𝑡𝑒 + 𝑒𝑖
∆𝑅𝑂𝐶𝑖𝑎𝑑𝑗𝑒𝑥−𝑝𝑜𝑠𝑡
is the ROC of each target firm i, in the year t after the buyout (t=+3) less
the ROC of each target firm in the year before the buyout (t= -1) adjusted for the change in
ROC of each control company over the same period.
𝑇𝐴𝐺𝑖𝑒𝑥−𝑎𝑛𝑡𝑒 , 𝐶𝑇𝑖
𝑒𝑥−𝑎𝑛𝑡𝑒 , 𝐹𝐷𝑖𝑒𝑥−𝑎𝑛𝑡𝑒, 𝐿𝑖
𝑒𝑥−𝑎𝑛𝑡𝑒 , 𝑅𝑂𝐶𝑎𝑑𝑗𝑖
𝑒𝑥−𝑎𝑛𝑡𝑒 , 𝑃𝐹𝐺𝑖𝑒𝑥−𝑎𝑛𝑡𝑒 , and
𝑃𝐷𝐺𝑖𝑒𝑥−𝑎𝑛𝑡𝑒 are the independent variables total assets growth, CAPEX to turnover, financial
dependence, net debt to EBITDA, adjusted ROC, profitability growth and productivity growth,
respectively, for each target company 𝑖, in the year before the buyout (t= -1), explained below.
This allow us to conclude about the ex-ante variables that are related with higher improvements
in a firm operating performance after the buyout, in the spirit of Guo et al. (2011).
For dependent variable we use one measures of economic performance at company level,
ROC. Following Guo et al. (2011), we adjust the ROC, being defined as the differential ROC
from the firm subjected to the buyout and the ROC of a matched firm that did not undergo a
buyout, in order to eliminate systematic or industry specific factors.
6 Despite the original data originate a balanced panel, multiple observations for multiple subjects across different
years, because the regression involves two different time periods the data was reorganized as cross-sectional, with
the control for year fixed effects being made via year dummies, following the methodology of Guo et al. (2011)
widely use in this type of studies.
(4.2.)
18
For independent variables, given the purpose of our study, we use turnover (assets) growth
and CAPEX over turnover to proxy for growth and investments constraints, based on the
literature that suggests that financial constrained targets become more profitable and grow faster
than the benchmark (Boucly et al., 2011; Engel and Stiebale, 2013). A measure of financial
dependence is used, to directly proxy financial constraints, in the spirit of Rajan and Zingales
(1998), for each firm, we calculate the difference between CAPEX and EBITDA, normalized
by CAPEX. This ratio measures the fraction of investment that is financed externally, with
higher values indicating financial constraints, since the firms as a lower auto financing ability
being more dependent on external financing, which because of asymmetric information is more
expensive and not always available.
Additionally, based on the empirical evidence that firms with higher ex-ante agency conflicts
are those more prone to improvements in operating performance ex-post (Kaplan and
Strömberg, 2009; Sannajust et al., 2014), we proxied agency conflicts, as the leverage ratio of net
debt over EBITDA, similarly to Cressy et al. (2007) and Boucly et al. (2011). This ratio allows
us not only to assess the absolute level of debt, but also the ability of a firm to generate operating
cash flow to face its debt service.
Lastly, to build on the literature that suggests that most PE investors expect to add value
to their portfolio companies, via optimizing strategic and operating decisions, as a consequence
of GP extensive experience (Acharya et al., 2012), we control for ex-ante performance by
inserting in the equation the ex-ante level of adjusted ROC, following other authors such as
Guo et al. (2011) and Sannajust et al. (2014). Profitability (EBIT margin) and productivity (asset
turnover) growth are used to understand the trend of each business regarding margins and
efficiency in the use of its assets.
Following previous studies (Cressy et al., 2007; Sannajust et al., 2014), we considered a time
window extending from one year before to three years after a deal was made. Basically, we have
a three-year period after the transaction (year +1 to year +3) compared to the last fiscal year
before the transaction (year -1). Additionally, for deals with a known outcome in terms of exit,
we extend our analysis to the last year before the exit, similar to Guo et al. (2011).
Complementary, we used the difference-in-difference approach to support our multivariate
analysis, by measuring the median changes of the absolute variables and the ratios used in a
three-year period after the transaction (year +1 to year +3) and until the pre-exit year, in relation
19
to the last fiscal year before the transaction (year -1). For the pre-transaction period, an
analogous analysis is made but with reference to 2 years before the buyout (year -2). Generally,
in this type of studies, the fiscal year of the transaction (year 0) is not considered since it is
difficult to separate the pre and post-transaction performance within the year.
Accordingly, to assess the median change in the relative variables we use the following
formula 𝑉𝑖𝑡+𝑗
− 𝑉𝑖𝑡−1 to analyse the post-transaction period, and 𝑉𝑖
𝑡−1 − 𝑉𝑖𝑡−2 to analyse the
pre-buyout period, which give the percentage change of each ratio. To evaluate the median
change of the absolute variables we use the following formula 𝑉𝑖
𝑡+𝑗− 𝑉𝑖
𝑡−1
𝑉𝑖𝑡−1 , for the post-buyout
period, and 𝑉𝑖
𝑡−1− 𝑉𝑖𝑡−2
𝑉𝑖𝑡−2 for the pre-buyout period which provide the percentual change of each
absolute variable. Although, in the absolute variables we have two problems every time that a
variable can take positive and negative values: i) if a change of signal occurs; and ii) if an
absolute value is negative and becomes less negative. Therefore, a common solution for these
problems is to use the so-called absolute method, hence in our univariate analysis the
denominator is always the absolute number. In the abovementioned formulas, 𝑉 represents the
relative or absolute variable in analysis, for each company 𝑖, 𝑡 the fiscal year of the transaction
and 𝑗 the fiscal year under analysis.
Additionally, analogous to the multivariate analysis, we adjust the results to the control
sample. Thus, the adjusted sample is obtained by subtracting from the changes in relative and
absolute variables of sample companies (raw sample) the control sample changes in the same
variables and ratios for the same period.
4.2. Sample and Data Collection
We analyse a sample of Portuguese firms that underwent buyouts from 2007 to 2016. Data
on buyouts are derived from two different commercial databases: Sabi2 and Zephyr7, both
commercialized by Bureau Van Djick. The latter provides information about the M&A deals,
7 Zephyr and Sabi description and potential biases on sample selection are discussed in detail in the Appendix 2.

20
including the portfolio company name, acquisition date and the buyers/investors. Sabi was used
to collect the historical financials relative to the PE backed companies.
Following Cressy et al. (2007) deal screening strategy, to a transaction be included in the
sample three cumulative requirements need to be fulfilled: i) the target must be headquartered
in Portugal; ii) there must be a clearly identifiable PE sponsor(s); iii) the sponsor(s) must not be
directly or indirectly managed/owned by the government or other public entities.
The first requirement is necessary since the aim of this research is to examine the operating
performance of Portuguese targets. The nationality of the PE firm is irrelevant considering the
purpose of this study, thus both Portuguese and foreign PE firms are included in the sample.
The second requirement is related with the fact that for a PE sponsor to be considered valid,
the PE firm should focus on acquisitions of mature companies. Therefore, we include
investments such as LBO, MBO, MBI, expansion and replacement capital and turnaround
investments, which excludes most VC investments.
The third requirement is needed since public entities may pursue other purposes than wealth
maximizing objectives. These entities may have a broader set of public policy goals, including
not only value-creation, but also innovation, competition (Brander, Egan, and Hellmann, 2008),
territory development, or employment growth (Cumming and Macintosh, 2006).
Lastly, in the case of secondary or stage buyouts only the first transaction, i.e. when the
portfolio company became PE backed for the first time, was included in the data, given the
idiosyncratic characteristics and motivations for PE sponsors to undertake this exit strategy
extensively discussed in a report of Saints Capital Services (2010).
From the initial sample of 197 deals, 20 transactions were excluded since those transactions
were secondary or stage buyouts. This resulted in a reduction from 197 to 177 companies. Via
Sabi database we looked at each firm which had received PE sponsorship and the outcome was
137 companies from the previous list provided by Zephyr database, since data was not available
or was not reliable8 for 40 PE backed companies. Financial firms are not comparable to other
non-financial firms, thus fall out of this study scope, and regarding “Head Offices” or
“Holding” activities it is commonly accepted that these companies are difficult to analyse on a
8 For instance, the financial statements were not available for certain sample years, the firms were in liquidation, or without operating activity, among others.

21
non-case study basis, therefore another 16 companies were retrieved from the initial sample,
with the final sample encompassing 121 firms. Table 1 summarizes the data collection.
Lastly, in a first regarding the Portuguese PE market research, an additional hand collected
subsample was created in order to identify all sample firms that already have been exited by PE
sponsors. From this analysis a subsample of 31 exited firms emerged.
This table reports the data collection process, from the initial 206 transactions identified in Zephyr to the final 121
companies.
4.3. Benchmark
The assessment of the impact of buyouts on the performance of PE-backed firms requires
the identification of a control sample. PE and target companies do not meet randomly, we need
to account for the ex-ante selection process to make unbiased estimates (Boucly et al., 2011).
To identify an appropriate control sample Barber and Lion (1995) methodology was used.
Therefore, the sample of matched firms was controlled for the industry, size, and past
performance. Accordingly, to respect the first criteria the comparable company has the same
first three code digits of the NACE Rev. 2 than the company that experienced the PE buyout,
similarly to Kaplan (1989), Guo et al. (2011), and Wilson et al. (2011). Regarding the second
criteria, size, following an adapted version of Guo et al. (2011) we use a book value of total
assets between 80%-120% of the sample firm’s book value of total assets. Considering the third
criteria, past performance, we follow once again Guo et al. (2011) that stipulated a level of
operating performance (in our case proxied by ROC) between 80%-120% or within ±0.01 of
Table 1 - Data Collection Process
Table 2 - Data Collection Process Zephyr sample 206
Initial three requirements:
Headquartered in Portugal
Clear PE sponsor -9
Non public ownership
Secondary or stage buyouts -20
No reliable data -40
Elimination of SPV -16
Final Sample 121

22
the level of the sample firm’s performance in year - 19. On the case of multiple benchmarks, the
matched firm that has the lower absolute deviation of the last criteria was chosen. A sample of
121 matched firms was composed, which controls for the industry, size, and past performance,
using Sabi database.
4.4. Sample Description
The final sample encompasses 121 PE transactions occurred in Portugal from 2007 to 2016.
In Figure 2 it is possible to conclude that our sample is dominated by deals from early start of
the financial crisis to the peak of sovereign debt crisis, 52% of the transactions occurred in the
period 2007-13, whilst 38% of deals occurred in the economic turmoil aftermath. Following the
international trend, Portuguese PE deals present a cyclical nature, with the number of deals
peaking in the year prior to the financial crisis, tampering during the crisis, and redeeming
afterwards.
This figure reports the distribution of PE transactions by year during the analysed period.
In terms of sectors, our sample encompasses multiple different 4-digit NACE codes,
however in order to give a broader view of the different industries we cluster them in the Broad
Structure of NACE Rev. 2, as presented in Table 2. Accordingly, 32% of our sample comes
from Manufacturing, 17% belongs to Information and Telecommunications, and 17% respects
to Wholesale and Retail (9%) and to the Hospitality sector (9%). Thus, despite traditional sectors
dominate our sample, technology related deals are rising in importance. This is aligned with the
9 Only one lag was considered, since the marginal effect of extra lags is negligible, see Barber and Lion (1995) for
standard arguments.
12
16
109
6 6
1618
21
7
2007 2008 2009 2010 2011 2012 2013 2014 2015 2016
Figure 2 - PE Deals per Year

23
PE Firms Number of Transactions
Explorer Investments - S.C.R. S.A. 23
Espirito Santo Capital S.C.R S.A. 12
ECS S.C.R., S.A. 12
Portugal Capital Ventures - S.C.R. S.A. 11
Others 63
Total 121
strong industrial base of the Portuguese economy, the strong development of Information
Technology related companies, and the robust tourism growth observed in Portugal.
This table presents the sample sectors breakdown, clustered in the Broad Structure of NACE Rev. 2.
Concerning the PE firm nationality, Portuguese PE firms, defined as those
headquartered in Portugal, account for the bulk of deal activity, representing 88% of the sample
transactions as observable in Table 3.
This table reports the nationality of PE firms involved on the sample transactions.
Regarding deals concentration by acquiror, as seen in Table 4, no PE firm accounts for
more than 20% of the sample transactions, which is particular important given the relatively
small number of active PE in the Portuguese market. The most active PE firm was Explorer
Investments - S.C.R. S.A., with 19% of all transactions, followed by Espírito Santo Capital S.C.R
S.A. and ECS S.C.R., S.A., each with a 10% share of the total 121 deals, which is concordant
with the moderate concentration verified in the Portuguese PE industry (CMVM, 2016).
This table reports the breakdown of the sample transactions by PE firm.
Table 2 - Sector Breakdown
Table 3 - Transaction by PE CountryTable 4 - Sector Breakdown
Country Number of Transactions
Portugal 107
Spain 8
United States 3
Others 3
Total 121
Table 3 - Transaction by PE Country
Table 5 - Deal Distribution by PE FirmTable 6 - Transaction by PE Country
Table 4 - Deal Distribution by PE Firm
Table 7 - PE Exits per YearTable 8 - Deal Distribution by PE Firm
Sector - Broad Structure of NACE Rev. 2 Number of Companies
Manufacturing 39
Information and communication 20
Wholesale and retail trade; repair of motor vehicles and motorcycles 10
Accommodation and food service activities 10
Professional, scientific and technical activities 9
Administrative and support service activities 9
Transportation and storage 6
Others 18
Total 121

24
Relatively to the subsample of 31 exited firms, the most active year in terms of exits was
2017, as observable in Figure 3, representing 42% of all identified exits, reflecting a tendency of
exit postponement to after the economic turmoil and valuations recovery.
This figure reports the exits, by exit year, already completed from the initial sample of 121 PE backed firms.
The average holding period of the full sample10 (121 companies) reaches 5.7 years,
varying from 3.0 years when the PE backed company is sold to the management or to the initial
owners to 6.2 years in secondary buyout exits, as observable in Table 5. The average holding
period of portfolio firms is 5.8 years, very close to the full sample holding period, since only
26% of the buyouts were already divested.
Regarding the exit route, the preferred strategy was trade sale, followed by secondary
buyouts, 45% and 19% of all exits, respectively. As expected, the holding period in trade sales
in significantly less than the holding period in sales to another PE firm.
This table details the exit deals by exit strategy and the average holding period by exit route. Trade sale is defined
as a sale to a strategic investor, secondary buyout is understood as the sale to another PE firm, MBO is a traditional
management buyout, and owners repurchase is defined as a sale to the (previous) majority shareholder.
10 For firms that were not yet divested the holding period is the period from the entry year to the present year, 2019.
Table 5 - Exit strategies and Average Holding Period
Table 9 - Descriptive StatisticsTable 10 - Exit strategies and Average Holding Period
Type of Exit Number of Transactions Average Holding Period (in years)
Trade Sale 14 5.6
Secondary Buyout 6 6.2
MBO / Owners Repurchase 3 3.0
Not Available 8 4.5
Total Exits 31 5.2
Portfolio Companies 90 5.8
Total 31 5.7
1 1
3
12
34
13
3
2009 2011 2012 2013 2014 2015 2016 2017 2018
Figure 3 -PE Exits per Year
25
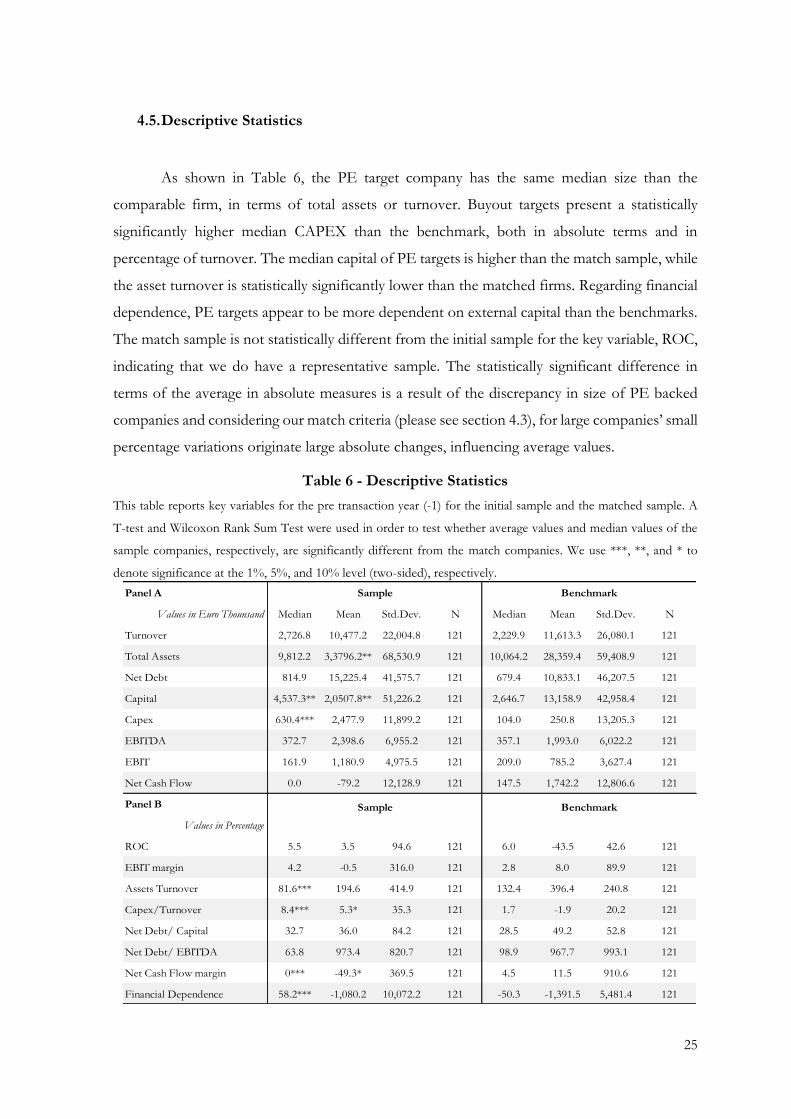
4.5. Descriptive Statistics
As shown in Table 6, the PE target company has the same median size than the
comparable firm, in terms of total assets or turnover. Buyout targets present a statistically
significantly higher median CAPEX than the benchmark, both in absolute terms and in
percentage of turnover. The median capital of PE targets is higher than the match sample, while
the asset turnover is statistically significantly lower than the matched firms. Regarding financial
dependence, PE targets appear to be more dependent on external capital than the benchmarks.
The match sample is not statistically different from the initial sample for the key variable, ROC,
indicating that we do have a representative sample. The statistically significant difference in
terms of the average in absolute measures is a result of the discrepancy in size of PE backed
companies and considering our match criteria (please see section 4.3), for large companies’ small
percentage variations originate large absolute changes, influencing average values.
This table reports key variables for the pre transaction year (-1) for the initial sample and the matched sample. A
T-test and Wilcoxon Rank Sum Test were used in order to test whether average values and median values of the
sample companies, respectively, are significantly different from the match companies. We use ***, **, and * to
denote significance at the 1%, 5%, and 10% level (two-sided), respectively.
Table 6 - Descriptive Statistics
Table 11 - Growth and Investment Change After the PE EntryTable 12 - Descriptive Statistics
Panel A
Values in Euro Thounsand Median Mean Std.Dev. N Median Mean Std.Dev. N
Turnover 2,726.8 10,477.2 22,004.8 121 2,229.9 11,613.3 26,080.1 121
Total Assets 9,812.2 3,3796.2** 68,530.9 121 10,064.2 28,359.4 59,408.9 121
Net Debt 814.9 15,225.4 41,575.7 121 679.4 10,833.1 46,207.5 121
Capital 4,537.3** 2,0507.8** 51,226.2 121 2,646.7 13,158.9 42,958.4 121
Capex 630.4*** 2,477.9 11,899.2 121 104.0 250.8 13,205.3 121
EBITDA 372.7 2,398.6 6,955.2 121 357.1 1,993.0 6,022.2 121
EBIT 161.9 1,180.9 4,975.5 121 209.0 785.2 3,627.4 121
Net Cash Flow 0.0 -79.2 12,128.9 121 147.5 1,742.2 12,806.6 121
Panel B
Values in Percentage
ROC 5.5 3.5 94.6 121 6.0 -43.5 42.6 121
EBIT margin 4.2 -0.5 316.0 121 2.8 8.0 89.9 121
Assets Turnover 81.6*** 194.6 414.9 121 132.4 396.4 240.8 121
Capex/Turnover 8.4*** 5.3* 35.3 121 1.7 -1.9 20.2 121
Net Debt/ Capital 32.7 36.0 84.2 121 28.5 49.2 52.8 121
Net Debt/ EBITDA 63.8 973.4 820.7 121 98.9 967.7 993.1 121
Net Cash Flow margin 0*** -49.3* 369.5 121 4.5 11.5 910.6 121
Financial Dependence 58.2*** -1,080.2 10,072.2 121 -50.3 -1,391.5 5,481.4 121
Sample Benchmark
Sample Benchmark
26
5. Impact of PE Buyouts on the Target Companies Operating Performance
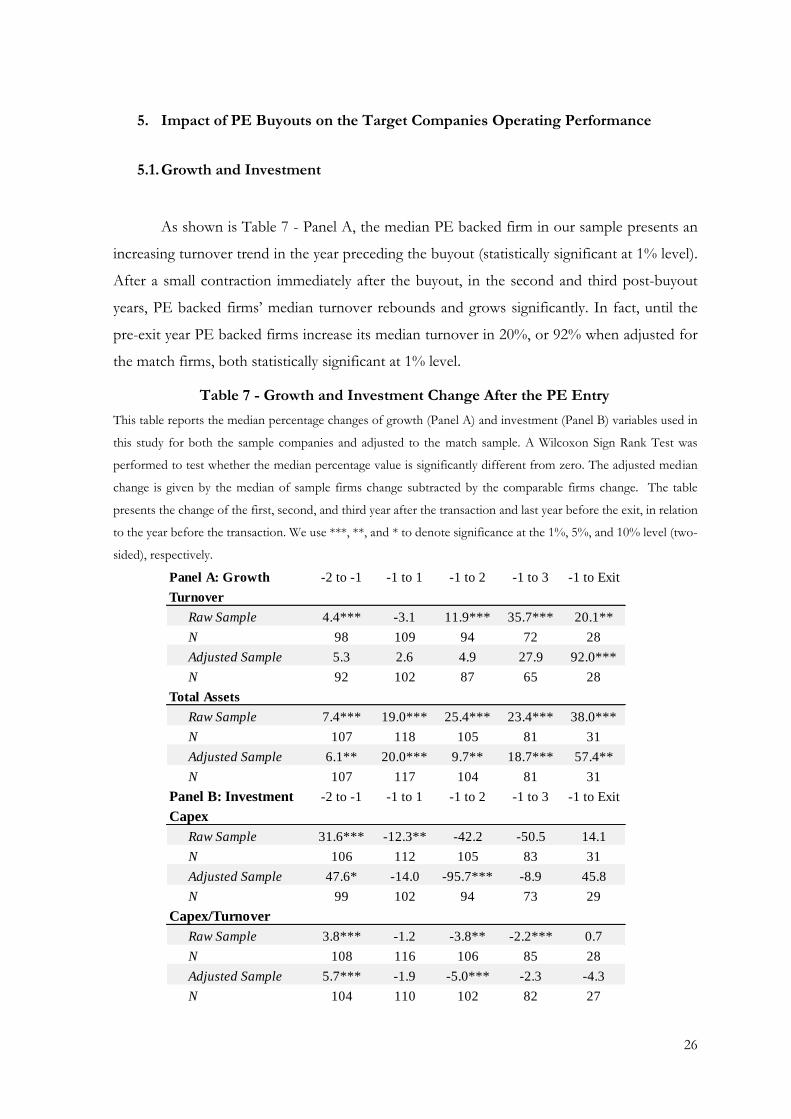
5.1. Growth and Investment
As shown is Table 7 - Panel A, the median PE backed firm in our sample presents an
increasing turnover trend in the year preceding the buyout (statistically significant at 1% level).
After a small contraction immediately after the buyout, in the second and third post-buyout
years, PE backed firms’ median turnover rebounds and grows significantly. In fact, until the
pre-exit year PE backed firms increase its median turnover in 20%, or 92% when adjusted for
the match firms, both statistically significant at 1% level.
This table reports the median percentage changes of growth (Panel A) and investment (Panel B) variables used in
this study for both the sample companies and adjusted to the match sample. A Wilcoxon Sign Rank Test was
performed to test whether the median percentage value is significantly different from zero. The adjusted median
change is given by the median of sample firms change subtracted by the comparable firms change. The table
presents the change of the first, second, and third year after the transaction and last year before the exit, in relation
to the year before the transaction. We use ***, **, and * to denote significance at the 1%, 5%, and 10% level (two-
sided), respectively.
Table 7 - Growth and Investment Change After the PE Entry
Table 13 - Operating Efficiency Change After EntryTable 14 - Growth and Investment Change After the PE Entry
Panel A: Growth -2 to -1 -1 to 1 -1 to 2 -1 to 3 -1 to Exit
Turnover
Raw Sample 4.4*** -3.1 11.9*** 35.7*** 20.1**
N 98 109 94 72 28
Adjusted Sample 5.3 2.6 4.9 27.9 92.0***
N 92 102 87 65 28
Total Assets
Raw Sample 7.4*** 19.0*** 25.4*** 23.4*** 38.0***
N 107 118 105 81 31
Adjusted Sample 6.1** 20.0*** 9.7** 18.7*** 57.4**
N 107 117 104 81 31
Panel B: Investment -2 to -1 -1 to 1 -1 to 2 -1 to 3 -1 to Exit
Capex
Raw Sample 31.6*** -12.3** -42.2 -50.5 14.1
N 106 112 105 83 31
Adjusted Sample 47.6* -14.0 -95.7*** -8.9 45.8
N 99 102 94 73 29
Capex/Turnover
Raw Sample 3.8*** -1.2 -3.8** -2.2*** 0.7
N 108 116 106 85 28
Adjusted Sample 5.7*** -1.9 -5.0*** -2.3 -4.3
N 104 110 102 82 27
27
In terms of total assets, the median PE portfolio company firm grows its asset base in a
standalone or adjusted basis prior to the transaction, statistically significant at 1% and 5%,
respectively. After the buyout, the total assets growth trend continues, increasing its magnitude,
by the third year after the transaction PE backed firms grow its asset base by 23% relatively to
the year before the buyout, or 19% when adjusted for the matched sample, both statistically
significant at 1% level. An even higher increase occurs until the last year before the PE exit.
PE targets present a both economic a statistically significant median CAPEX growth in
the year before the buyout, (32%, significant at 1% level) investing more than the industry
median (median adjusted CAPEX growth of 48%, significant at 1% level). The post-buyout
fixed assets investment decrease is even more pronounced when adjusted for the match sample,
however there is a convergence of the PE backed company to the industry investment level.
Nevertheless, despite the CAPEX decrease in the short medium term, in the year prior
to the PE exit median CAPEX presents a slight increase relative to pre-buyout levels, with PE
backed firms investing more than the industry.
In fact, as presented in Table 7 - Panel B, if in the year prior to the transaction median
CAPEX over turnover change is positive and statistically significant at 1% level, even when
adjusted for the matched firms, in the second and third years after the transaction we observe a
statistically significant reduction at 5% level, - 3.8 percentage points (p.p.) and - 2.2 p.p.,
respectively, when adjusted for the benchmark the decrease aggravates. However, by the year
before the exit CAPEX over turnover stabilizes, at levels close of the ones before the buyout.
Therefore, as observable in Table 7, while PE backed firms grow at a significant higher
pace than the non-PE backed firms, both in terms of turnover and total assets, the investment
level in terms of CAPEX of PE portfolio companies decreases more than in non-buyout
companies. Although this may be related with the significant pre-buyout investment increase of
PE targets, which may translate expansion investment to crystalize growth opportunities.
Hence, while PE backed company’s growth increases for longer time periods, the CAPEX cuts
moderate and lose its statistically significance, indicating that some companies partially correct
the CAPEX cuts performed during the initial buyout years, probably due to a less demanding
debt service, a reinforced auto financing ability, and incremental growth opportunities.
In one hand, these findings are consistent with the results of Chung (2011), Wilson et al.
(2012), and Boucly et al. (2011) given the increase in size, both in terms of total sales and

28
turnover, and the regular increase trend in CAPEX after the transaction is observed. In
particular, regarding the Portuguese market, Mendes and Sousa (2013) and Almeida (2018) reach
similar conclusions about the total assets and total sales growth, however their results point to
a more moderate growth in turnover and assets and to a more favourable CAPEX, but more
volatile, evolution in the first three post-buyout years. In fact, our data supports the qualitative
findings of Gompers et al. (2016), which concluded that PE investors expect to add value via
greater focus on increasing growth.
On the other hand, our results so far appear to be very dissimilar to pre-existing studies,
namely, those focusing on large public-to-private transactions (Kaplan, 1989; Guo et al., 2011).
These studies find evidence consistent with PE implementing measures that aim at downsizing
target operations, while maintaining its ability to create value.
However, there is an explanation, Portuguese PE targets tend to be financially
constrained firms with growth opportunities, since our sample is only composed by private-to-
private deals, and PE help these firms get access to additional sources of external finance and
improve its auto financing ability, as we argue in the next sections.
5.2. Profitability, Productivity, Efficiency and Cash Flow
Focusing on profitability, as shown in Table 8 - Panel A, the median PE backed firm
presents a robust and statistically significant growth in EBITDA and EBIT11 in the year prior
to the buyout, exceeding the match firm’s growth in terms of EBITDA. In the first three years
after the buyout, the median EBITDA of PE backed firms continues to grow at a faster pace
than the benchmark, on the back of operating activity expansion. In particular, median EBITDA
increases 51% in the third post buyout year (statistically significant at 1% level) relative to the
year before the PE entry, outperforming the growth rate of the appropriate benchmark (when
adjusted for the match sample, median EBITDA grows 7%).
11 Typically, the literature explains the difference in growth among EBITDA and EBIT with the fact that
PE increase the levels of depreciations and amortizations, in order to increase the tax shields. However, this
explanation does not hold for the Portuguese market, since generally assets write ups are not accepted as a tax-
deductible expense and non-adjusted growth rates are not significantly different.
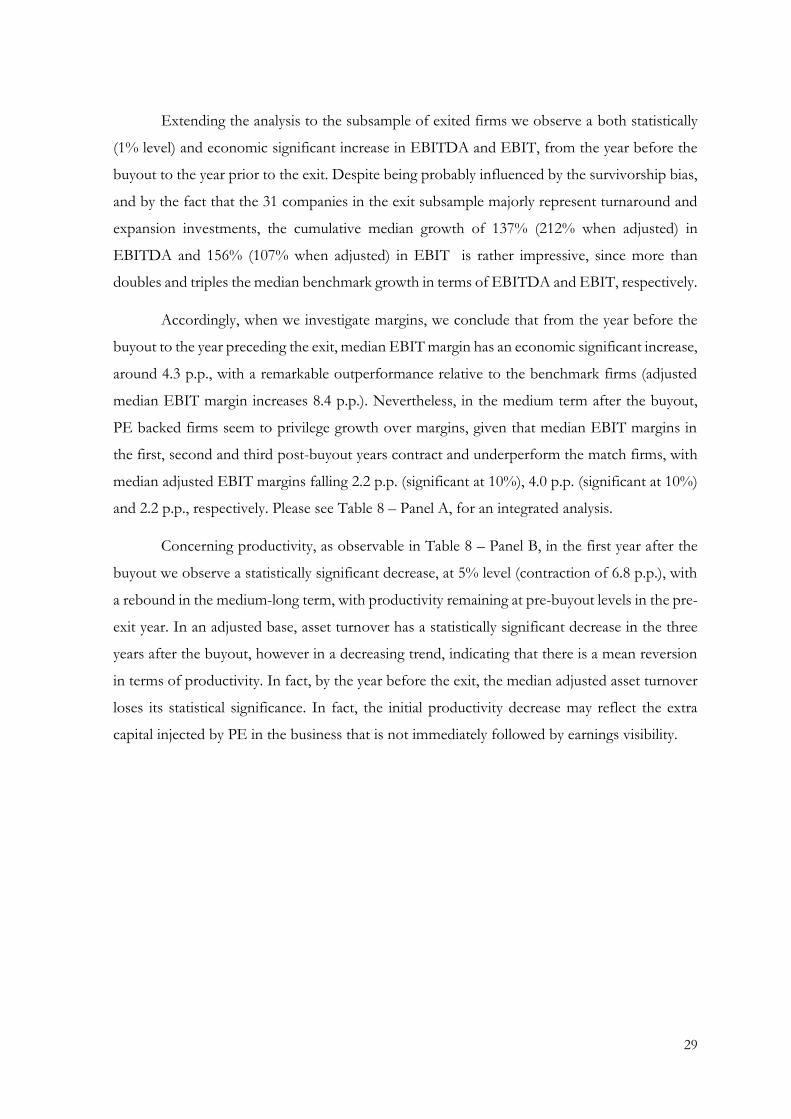
29
Extending the analysis to the subsample of exited firms we observe a both statistically
(1% level) and economic significant increase in EBITDA and EBIT, from the year before the
buyout to the year prior to the exit. Despite being probably influenced by the survivorship bias,
and by the fact that the 31 companies in the exit subsample majorly represent turnaround and
expansion investments, the cumulative median growth of 137% (212% when adjusted) in
EBITDA and 156% (107% when adjusted) in EBIT is rather impressive, since more than
doubles and triples the median benchmark growth in terms of EBITDA and EBIT, respectively.
Accordingly, when we investigate margins, we conclude that from the year before the
buyout to the year preceding the exit, median EBIT margin has an economic significant increase,
around 4.3 p.p., with a remarkable outperformance relative to the benchmark firms (adjusted
median EBIT margin increases 8.4 p.p.). Nevertheless, in the medium term after the buyout,
PE backed firms seem to privilege growth over margins, given that median EBIT margins in
the first, second and third post-buyout years contract and underperform the match firms, with
median adjusted EBIT margins falling 2.2 p.p. (significant at 10%), 4.0 p.p. (significant at 10%)
and 2.2 p.p., respectively. Please see Table 8 – Panel A, for an integrated analysis.
Concerning productivity, as observable in Table 8 – Panel B, in the first year after the
buyout we observe a statistically significant decrease, at 5% level (contraction of 6.8 p.p.), with
a rebound in the medium-long term, with productivity remaining at pre-buyout levels in the pre-
exit year. In an adjusted base, asset turnover has a statistically significant decrease in the three
years after the buyout, however in a decreasing trend, indicating that there is a mean reversion
in terms of productivity. In fact, by the year before the exit, the median adjusted asset turnover
loses its statistical significance. In fact, the initial productivity decrease may reflect the extra
capital injected by PE in the business that is not immediately followed by earnings visibility.

30
This table reports the percentage median changes of profitability (Panel A) and productivity (Panel B) variables
used in this study for both the sample companies and adjusted to the match sample. A Wilcoxon Sign Rank Test
was performed to test whether the median percentage value is significantly different from zero. The adjusted
median change is given by the median of sample firms change subtracted by the comparable firms change. The
table presents the change of the first, second, and third year after the transaction and last year before the exit, in
relation to the year before the transaction. We use ***, **, and * to denote significance at the 1%, 5%, and 10%
level (two-sided), respectively.
Given the profitability and productivity evolution, as presented in Table 8, the median
adjusted ROC of PE backed firms entails a statistically and economic significant
underperformance relative to the match sample in the first three post buyout years, but in a
decreasing trend, median adjusted ROC contracts 4.3 p.p. (significant at 5%), 2.6 p.p. (significant
at 10%), in the first and second post buyout years, respectively, and losing its statistical
significance by year 3, as observable in Table 9 – Panel A.
In fact, for longer time periods, as PE are able to influence key value driver, expanding
the business, sharpening the business model and optimizing the product mix and the cost
Table 8 - Operating Efficiency Change After Entry
Table 15 - Leverage Change After EntryTable 16 - Operating Efficiency Change After Entry
Panel A: Profitability -2 to -1 -1 to 1 -1 to 2 -1 to 3 -1 to Exit
EBITDA
Raw Sample 8.1 34.7*** 18.1* 50.7*** 136.7***
N 102 116 106 79 31
Adjusted Sample 5.6 4.3 -7.9 7.1 212.4***
N 100 115 102 79 31
EBIT
Raw Sample 8.5 20.2** 13.5 37.8* 156.0***
N 102 115 102 78 31
Adjusted Sample -5.6 -12.8 -21.1 -8.2 106.7***
N 100 114 101 78 30
EBIT Margin
Raw Sample 0.2 -0.8 -1.3 -0.3 4.3
N 107 117 111 91 28
Adjusted Sample 0.0 -2.2* -4.0* -2.2 8.4
N 102 110 104 85 27
Panel B: Productivity -2 to -1 -1 to 1 -1 to 2 -1 to 3 -1 to Exit
Assets Turnover
Raw Sample 0.0 -6.8** 0.7 0.5 0.8
N 110 119 103 83 31
Adjusted Sample 2.9 -23.3* -17.9** -16.1* -5.8
N 105 112 99 78 30

31
structure, PE backed firms, by the year before the exit, present a higher median ROC than in
the pre-buyout year. This reflects an outperformance of the industry, which is economically
significant but not statistically relevant.
This table reports the percentage median changes of ROC and Cash Flow (Panel A) and Financial Dependence
(Panel B) variables used in this study for both the sample companies and adjusted to the match sample. A Wilcoxon
Sign Rank Test was performed to test whether the median percentage value is significantly different from zero.
The adjusted median change is given by the median of sample firms change subtracted by the comparable firms
change. The table presents the change of the first, second, and third year after the transaction and last year before
the exit, in relation to the year before the transaction. We use ***, **, and * to denote significance at the 1%, 5%,
and 10% level (two-sided), respectively.
Relative to net cash flow, as observable in Table 9 – Panel A, in absolute levels net cash
flows present a positive evolution both in the pre- and post-buyout periods. Although it lags
the industry growth in the pre-buyout period, after the buyout net cash flow reveals a solid
growth in an increasing trend 72.1% higher relatively to the entry year (statistically significant at
5% level), a consequence of a higher EBITDA and lower investment intensity. Albeit, in relative
Table 9 - ROC, Cash Flow and Financial Dependence Change After Entry
Panel A: ROC & Cash Flow -2 to -1 -1 to 1 -1 to 2 -1 to 3 -1 to Exit
ROC
Raw Sample 0.1 -1.5 -0.3 -0.1 2.9
N 115 119 111 88 31
Adjusted Sample 0.8 -4.3** -2.6* -1.1 4.3
N 114 117 109 87 30
Net Cash Flow
Raw Sample 31.2* 2.0 11.9 72.1** 49.2
N 110 118 106 83 31
Adjusted Sample -65.0 12.5 -8.7 -30.4 42.2
N 109 116 104 82 31
Net Cash Flow Margin
Raw Sample -2.3 -3.9 3.6 4.9 -2.7
N 106 113 108 87 28
Adjusted Sample -10.1 -3.4 6.0 -11.1 2.9
N 106 112 107 87 27
Panel B: Auto Financing -2 to -1 -1 to 1 -1 to 2 -1 to 3 -1 to Exit
Financial Dependency
Raw Sample 5.9 24.1 -6.3 -25.2 -58.4**
N 108 120 108 85 31
Adjusted Sample 42.8 -26.1 -26.6 12.5 0.2
N 102 108 98 78 27
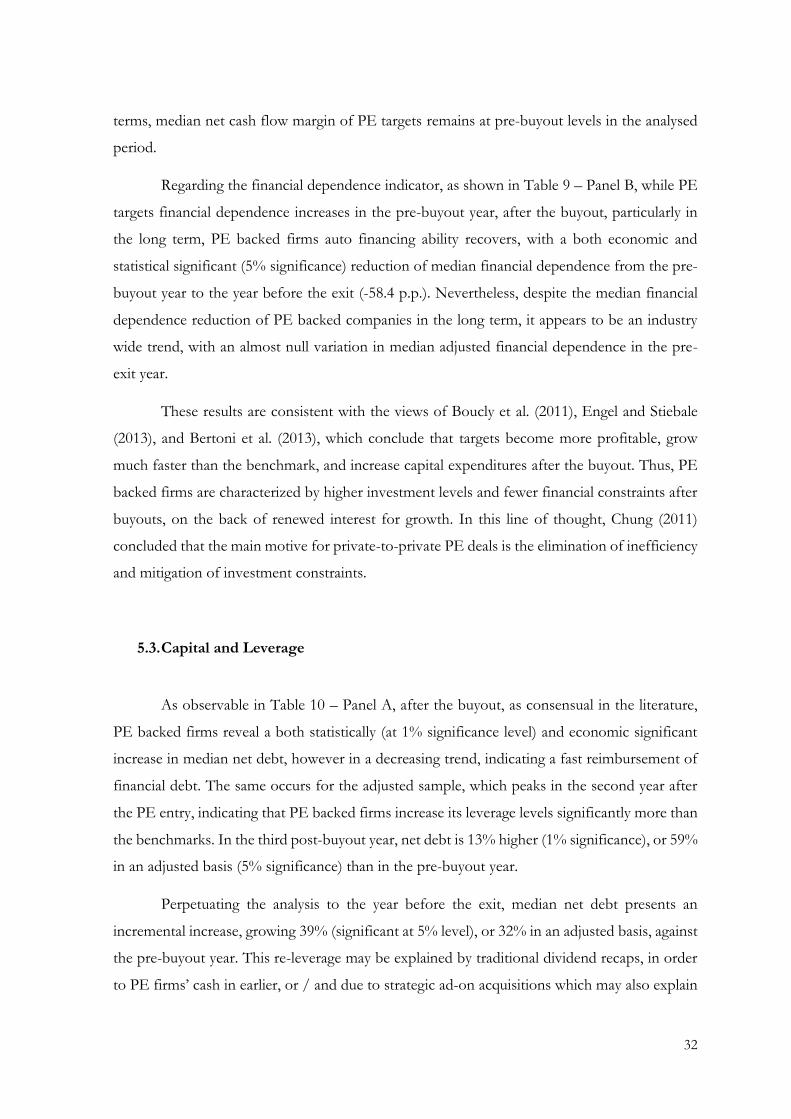
32
terms, median net cash flow margin of PE targets remains at pre-buyout levels in the analysed
period.
Regarding the financial dependence indicator, as shown in Table 9 – Panel B, while PE
targets financial dependence increases in the pre-buyout year, after the buyout, particularly in
the long term, PE backed firms auto financing ability recovers, with a both economic and
statistical significant (5% significance) reduction of median financial dependence from the pre-
buyout year to the year before the exit (-58.4 p.p.). Nevertheless, despite the median financial
dependence reduction of PE backed companies in the long term, it appears to be an industry
wide trend, with an almost null variation in median adjusted financial dependence in the pre-
exit year.
These results are consistent with the views of Boucly et al. (2011), Engel and Stiebale
(2013), and Bertoni et al. (2013), which conclude that targets become more profitable, grow
much faster than the benchmark, and increase capital expenditures after the buyout. Thus, PE
backed firms are characterized by higher investment levels and fewer financial constraints after
buyouts, on the back of renewed interest for growth. In this line of thought, Chung (2011)
concluded that the main motive for private-to-private PE deals is the elimination of inefficiency
and mitigation of investment constraints.
5.3. Capital and Leverage
As observable in Table 10 – Panel A, after the buyout, as consensual in the literature,
PE backed firms reveal a both statistically (at 1% significance level) and economic significant
increase in median net debt, however in a decreasing trend, indicating a fast reimbursement of
financial debt. The same occurs for the adjusted sample, which peaks in the second year after
the PE entry, indicating that PE backed firms increase its leverage levels significantly more than
the benchmarks. In the third post-buyout year, net debt is 13% higher (1% significance), or 59%
in an adjusted basis (5% significance) than in the pre-buyout year.
Perpetuating the analysis to the year before the exit, median net debt presents an
incremental increase, growing 39% (significant at 5% level), or 32% in an adjusted basis, against
the pre-buyout year. This re-leverage may be explained by traditional dividend recaps, in order
to PE firms’ cash in earlier, or / and due to strategic ad-on acquisitions which may also explain

33
the increase in CAPEX and consequent net cash flow margin reduction in the pre-exit year, or
simply a renewed debt capacity, given the PE influence. As widely argued in the literature PE
help make their portfolio firms more credible borrowers, as Boucly et al. (2011) argued: i) PE
are better monitors, but still residual claimers; ii) PE may introduce new financially savvy
members to the investee’s management; iii) because of their long lock-up periods, PE may be
more patient than families, thus more prone to reinvest into the firms.
This table reports the percentage median changes of invested capital (Panel A) and leverage (Panel B) variables
used in this study for both the sample companies and adjusted to the match sample. A Wilcoxon Sign Rank Test
was performed to test whether the median percentage value is significantly different from zero. The adjusted
median change is given by the median of sample firms change subtracted by the comparable firms change. The
table presents the change of the first, second, and third year after the transaction and last year before the exit, in
relation to the year before the transaction. We use ***, **, and * to denote significance at the 1%, 5%, and 10%
level (two-sided), respectively.
Capital follows a similar evolution to net debt, as expected, however with a faster median
growth, probably a result of the combined effect of leverage growth and reinforced auto
financing ability, due to a re-established capacity to generate profits. Regarding the firm’s
Table 10 - Leverage Change After Entry
Table 17 - Operating Performance RegressionsTable 18 - Leverage Change After Entry
Panel A: Capital -2 to -1 -1 to 1 -1 to 2 -1 to 3 -1 to Exit
Net Debt
Raw Sample 0.0 33.6*** 28.7*** 12.9*** 38.6**
N 104 117 105 82 31
Adjusted Sample 2.9 46.2*** 65.1*** 58.8** 32.1
N 104 116 104 80 31
Capital
Sample 6.7*** 21.9*** 23.0*** 18.9* 33.2***
N 105 118 105 81 31
Adjusted Sample 18.0 17.4* 0.0 14.2 28.4***
N 105 117 104 81 31
Panel B: Leverage -2 to -1 -1 to 1 -1 to 2 -1 to 3 -1 to Exit
Net Debt/ EBITDA
Sample -9.1 -3.4 -2.9 -3.7 -9.1
N 87 102 96 78 31
Adjusted Sample -19.4 97.7 65.3 31.1 181.2
N 66 76 70 60 30
Net Debt/ Capital
Sample -1.4 -0.2 -0.3 -4.2 -14.1
N 118 121 112 88 31
Adjusted Sample 0.6 11.2*** 5.5 5.2 3.8
N 117 119 110 96 30

34
capacity to face debt service, measured by net debt to EBITDA, PE targets present, an
increasing trend on an adjusted basis, translating a faster decrease in this metric by non-buyout
firms relatively to PE portfolio companies.
Concerning the debt and equity mix given by net debt over capital, as shown in Table
10 – Panel B, median adjusted net debt to capital peaks in the first post-buyout year, having a
1% statistically significant increase of 11.2 p.p., and then there is a successive reduction of the
ratio, reflecting a convergence of PE baked firms leverage to the match sample.
Our findings are in line with the existing literature, for instance, Boucly et al. (2011),
Guo et al. (2011), Engel and Stiebale (2013), and Bertoni et al. (2013), which report a significant
increase in leverage immediately after the buyout and posterior deleverage, supported by a
reinforced auto financing ability, as previously argued. Previous studies focusing on the
Portuguese market, Mendes and Sousa (2013) and Almeida (2018), found similar conclusions.
5.4. Operating Performance
Recalling the literature review, despite the strong empirical evidence of post PE buyout
improvements in operating performance for the first buyout wave, the evidence for the second
wave is not so consistent.
In Portugal neither Mendes and Sousa (2013) or Almeida (2018) found consistent
evidence regarding improvements in PE backed companies after PE buyouts, when compared
to the appropriate match sample.
Therefore, following Healy et al. (1992), as explained in section 4.1, that employed a
linear regression to estimate improvements in post-buyout performance, we use ROC to
estimate the impact of PE buyout in its targets operating performance in two-time horizons.
Because ROC can be influenced by changes in the invested capital as a direct consequence of
the deal pricing and structure, as a robustness measure, consistent with the literature, we also
report the results for the return on sales (ROS).
First, in the spirit of most empirical research we analyse three years before the buyout
(year -3, -2 and -1) to three years after the buyout (year +1, +2 and +3). Second, in a first
regarding the impact of PE buyouts in its targets operating performance research in Portugal,
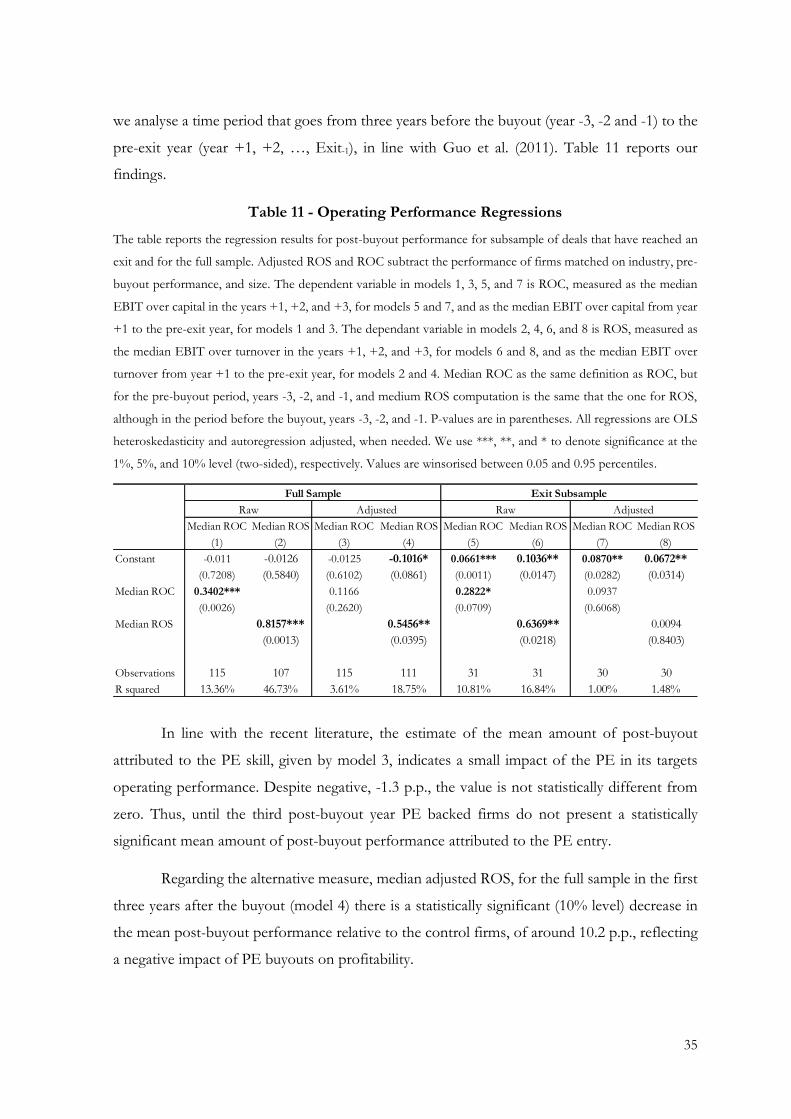
35
we analyse a time period that goes from three years before the buyout (year -3, -2 and -1) to the
pre-exit year (year +1, +2, …, Exit-1), in line with Guo et al. (2011). Table 11 reports our
findings.
The table reports the regression results for post-buyout performance for subsample of deals that have reached an
exit and for the full sample. Adjusted ROS and ROC subtract the performance of firms matched on industry, pre-
buyout performance, and size. The dependent variable in models 1, 3, 5, and 7 is ROC, measured as the median
EBIT over capital in the years +1, +2, and +3, for models 5 and 7, and as the median EBIT over capital from year
+1 to the pre-exit year, for models 1 and 3. The dependant variable in models 2, 4, 6, and 8 is ROS, measured as
the median EBIT over turnover in the years +1, +2, and +3, for models 6 and 8, and as the median EBIT over
turnover from year +1 to the pre-exit year, for models 2 and 4. Median ROC as the same definition as ROC, but
for the pre-buyout period, years -3, -2, and -1, and medium ROS computation is the same that the one for ROS,
although in the period before the buyout, years -3, -2, and -1. P-values are in parentheses. All regressions are OLS
heteroskedasticity and autoregression adjusted, when needed. We use ***, **, and * to denote significance at the
1%, 5%, and 10% level (two-sided), respectively. Values are winsorised between 0.05 and 0.95 percentiles.
In line with the recent literature, the estimate of the mean amount of post-buyout
attributed to the PE skill, given by model 3, indicates a small impact of the PE in its targets
operating performance. Despite negative, -1.3 p.p., the value is not statistically different from
zero. Thus, until the third post-buyout year PE backed firms do not present a statistically
significant mean amount of post-buyout performance attributed to the PE entry.
Regarding the alternative measure, median adjusted ROS, for the full sample in the first
three years after the buyout (model 4) there is a statistically significant (10% level) decrease in
the mean post-buyout performance relative to the control firms, of around 10.2 p.p., reflecting
a negative impact of PE buyouts on profitability.
Table 11 - Operating Performance Regressions
Table 19 - Determinants of PE Buyouts Operating PerformanceTable 20 - Operating Performance Regressions
Median ROC Median ROS Median ROC Median ROS Median ROC Median ROS Median ROC Median ROS
(1) (2) (3) (4) (5) (6) (7) (8)
Constant -0.011 -0.0126 -0.0125 -0.1016* 0.0661*** 0.1036** 0.0870** 0.0672**
(0.7208) (0.5840) (0.6102) (0.0861) (0.0011) (0.0147) (0.0282) (0.0314)
Median ROC 0.3402*** 0.1166 0.2822* 0.0937
(0.0026) (0.2620) (0.0709) (0.6068)
Median ROS 0.8157*** 0.5456** 0.6369** 0.0094
(0.0013) (0.0395) (0.0218) (0.8403)
Observations 115 107 115 111 31 31 30 30
R squared 13.36% 46.73% 3.61% 18.75% 10.81% 16.84% 1.00% 1.48%
RawAdjustedRaw Adjusted
Exit SubsampleFull Sample
36
On a non-adjusted basis, PE backed firms also present a lower mean amount of post-
buyout performance in terms of median ROC and in terms of median ROS, but both not
significant. The decreasing trend is not surprising given that the bulk of our sample falls in the
crisis period12, which typically is correlated with a decrease in operating performance.
Concerning the exit subsample, the two proxies of post-buyout operating performance
present a both statistically (5% level) and economic significant increase, either in an unadjusted
or adjusted basis. Indeed, after the PE entry until the exit, median adjusted ROC (model 7) and
median adjusted ROS (model 8) are, on average, 8.7 p.p. and 6.7 p.p. higher than the benchmark.
Therefore, PE backed firms present a positive and statistically significant mean amount of post-
buyout performance left unexplained by systematic or industry specific factors, which must be,
by definition, attributed to the PE skill.
It is worth noticing that in models 1, 2, 4, 5 and 6 the independent variables present a
statistically significant and positive relation with the levels of ex-post operating performance,
which seems to indicate that firms with a strong (weak) past performance are those more likely
to achieve superior (inferior) post-buyout performance, on average. This not exhaustive
evidence suggests that, not only PE firms’ positive impact its targets performance in the long
run, but they are also good at selecting targets. The separation of the treatment and selection
effects is a topic worth studying in future research.
These results are consistent with the expected from our univariate analysis, where it was
concluded that, in the first three post-buyout years, PE backed firms privilege growth over
margins, outperforming the industry in terms of total assets and turnover. Operating results also
increase in absolute levels, but a slower pace than turnover, particularly, EBITDA outperforms
the benchmarks, with EBIT lagging the benchmark, while assets turnover remains flat.
Extending the analysis until the exit, margins have a significant industry outperformance, with
ROC benefiting from the positive improvements in operating efficiency.
Therefore, for the first three post-buyout years we find no support to our first
hypothesis. This finding is in line with previous studies focused on the Portuguese market,
12 Our regressions where tested for structural breaks on yearly basis, yearly dummies were applied. Then an
alternative “crisis” dummy was used, but it did not seem to be a good approach (we estimate several alternative
formulations), since the sample is small, and the subsamples did not present different results of the ones presented
for the full sample.
37
namely, Mendes and Sousa (2013) and Almeida (2018), and some international evidence, as the
one presented by Chung (2011) for the UK and Scellato and Ughetto (2012) for a large sample
of European companies. These authors found inconclusive evidence regarding PE targets
operating performance with respect to the control group three years after the deal is made. On
the contrary, our results differ from Bergstrom et al. (2007) for Sweden and Boucly et al. (2011)
for the French market, which found statistically significant increases in targets proxy for
operating performance.
Nevertheless, on a first regarding the Portuguese market, we extend our research period
to a subsample of 31 deals with a known outcome, i.e. exit, and for this subsample we find a
statistically significant (5% confidence level) outperformance in PE targets operating
performance after the buyout, of around 8.7 p.p. when adjusted for the math sample. This
confirms that PE investors improve its targets operating performance over the long run, if a
successful exit is accomplished.
5.5. Determinants of Post-buyout Operating Performance
Recalling once again the literature review, given standard sources of value creation
pointed in the literature, we theorize that firms that before the buyout present a certain type of
financial performance are those more prone to operating improvement in the post-buyout
phase.
In fact, Kaplan and Strömberg (2009) categorise three sources of value creation:
financial engineering, governance engineering, and operating engineering. These levers are not
mutually exclusive, but certain PE firms likely focus more in ones than others (Gompers et al.,
2016), nevertheless, most value creation in PE backed firms is obtained by operating
improvements (Heel and Kehoe, 2005; Acharya et al., 2013). The focus on operating
improvements is expected to prevail as the main source of value creation, since the increased
volatility and uncertainty that followed the Global Financial Crisis is expected to lead PE firms
to focus more on the things that they can influence rather than relying on market sentiment
(Plagborg-Møller and Morten, 2017).
Accordingly, firms with low growth ex-ante, particularly those with financial constraints,
high agency conflicts, and firms with turnaround potential (benefiting from PE experience or
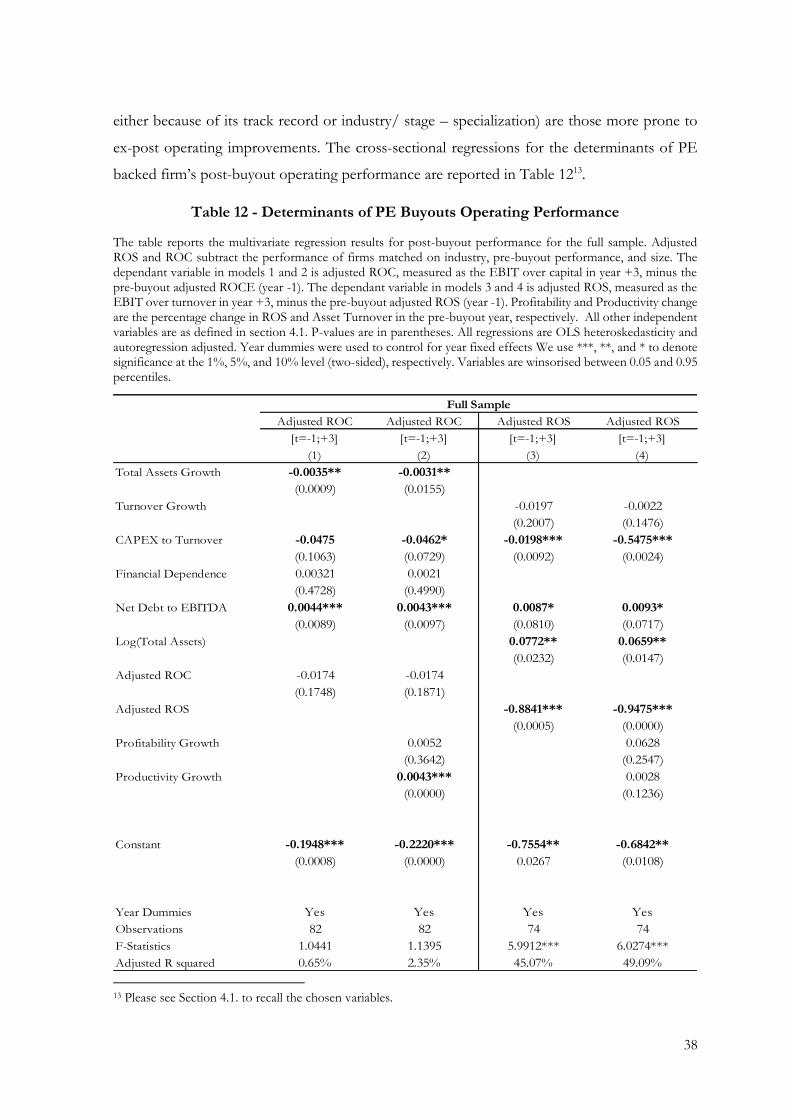
38
either because of its track record or industry/ stage – specialization) are those more prone to
ex-post operating improvements. The cross-sectional regressions for the determinants of PE
backed firm’s post-buyout operating performance are reported in Table 1213.
The table reports the multivariate regression results for post-buyout performance for the full sample. Adjusted ROS and ROC subtract the performance of firms matched on industry, pre-buyout performance, and size. The dependant variable in models 1 and 2 is adjusted ROC, measured as the EBIT over capital in year +3, minus the pre-buyout adjusted ROCE (year -1). The dependant variable in models 3 and 4 is adjusted ROS, measured as the EBIT over turnover in year +3, minus the pre-buyout adjusted ROS (year -1). Profitability and Productivity change are the percentage change in ROS and Asset Turnover in the pre-buyout year, respectively. All other independent variables are as defined in section 4.1. P-values are in parentheses. All regressions are OLS heteroskedasticity and autoregression adjusted. Year dummies were used to control for year fixed effects We use ***, **, and * to denote significance at the 1%, 5%, and 10% level (two-sided), respectively. Variables are winsorised between 0.05 and 0.95 percentiles.
13 Please see Section 4.1. to recall the chosen variables.
Table 12 - Determinants of PE Buyouts Operating Performance
Table 21 - Determinants of PE Buyouts Operating Performance
Adjusted ROC Adjusted ROC Adjusted ROS Adjusted ROS
[t=-1;+3] [t=-1;+3] [t=-1;+3] [t=-1;+3]
(1) (2) (3) (4)
Total Assets Growth -0.0035** -0.0031**
(0.0009) (0.0155)
Turnover Growth -0.0197 -0.0022
(0.2007) (0.1476)
CAPEX to Turnover -0.0475 -0.0462* -0.0198*** -0.5475***
(0.1063) (0.0729) (0.0092) (0.0024)
Financial Dependence 0.00321 0.0021
(0.4728) (0.4990)
Net Debt to EBITDA 0.0044*** 0.0043*** 0.0087* 0.0093*
(0.0089) (0.0097) (0.0810) (0.0717)
Log(Total Assets) 0.0772** 0.0659**
(0.0232) (0.0147)
Adjusted ROC -0.0174 -0.0174
(0.1748) (0.1871)
Adjusted ROS -0.8841*** -0.9475***
(0.0005) (0.0000)
Profitability Growth 0.0052 0.0628
(0.3642) (0.2547)
Productivity Growth 0.0043*** 0.0028
(0.0000) (0.1236)
Constant -0.1948*** -0.2220*** -0.7554** -0.6842**
(0.0008) (0.0000) 0.0267 (0.0108)
Year Dummies Yes Yes Yes Yes
Observations 82 82 74 74
F-Statistics 1.0441 1.1395 5.9912*** 6.0274***
Adjusted R squared 0.65% 2.35% 45.07% 49.09%
Full Sample

39
All regressions control for performance at year -1 (ROS or ROC relative to the matching
firm). Models 3 and 4 also control for the target size. Results are similar for regressions
explaining the level of ROC and ROS, in line with the current empirical literature.
The regressions in Table 12 show that deals with higher debt levels (proxied by net debt
to EBITDA ratio) before the buyout, consistently show better operating performance after the
buyout. These results are not consistent with the disciplining effect of higher debt for the post-
buyout firm, therefore the Free Cash Flow theory of Jensen (1986) does not hold in our sample,
since it predicts a negative relation among pre-buyout leverage and post-buyout performance.
Our data shows a positive and statistically significant relation, in the long term, among ex-ante
leverage and ex-post performance.
However, this result is aligned with the conclusions of most recent studies, like Guo et
al. (2011) or Scellato and Ughetto (2012) which do not provide clear evidence in favour of
Jensen's hypotheses. This finding is not surprising since agency theory cannot fully explain the
LBO of private firms because it is less likely that private firms suffer from agency problems due
to their concentrated ownership structure and due to its family owned and managed base.
For the variables related to growth opportunities of PE backed firms after the buyout,
we find that the growth opportunities ex-ante, proxied by total assets or turnover growth are
negatively and, for models 1 and 2, statistically significant related with ex-post operating
performance. The same occurs for the metric proxying investment intensity, CAPEX over
turnover, which is negatively related with ex-post operating performance, being statistically
significant for models 2, 3 and 4 (at 10%, 1% and 1% level, respectively).
We also observe a positive relation among financial dependence and ex-post
performance, however not significant, models 1 and 2. These results are consistent with the
elimination, or at least mitigation, of financial constraints in PE backed companies, after the
buyout, with the insofar auto financing ability and dependence on external financing tampering
investment.
The literature points two main reasons why PE companies reinvest the cash flow in the
businesses: i) because of their long lock-up periods, PE may be more patient than families, who
need dividends to consume, and as a result are more ready to reinvest the cash flows; ii) with
capital gains being less taxed than dividends, PE funds are encouraged by their investors to
reinvest cash flows instead of paying out dividends.

40
Hence, our results are consistent with the results of Boucly et al. (2011), Engel and
Stiebale (2013), and Bertoni et al. (2013), which argue that PE backed companies experience a
very strong growth in sales and assets, in particular when they were previously more likely to be
financially constrained. With the latter suggesting a with a greater dependency of investments
to internal cash flow for PE backed firms, not found in this study.
Regarding, the levels of pre-buyout performance, and the potential for turnaround, the
ex-ante level of ROC and ROS present a negative relation with post-buyout performance, which
indicates that firms with a relative lower pre-buyout performance are those prone to increase
their operating performance after the PE entry, as expected. While in section 5.4. we stated a
positive relation among past and future PE backed firm’s outperformance relative to the
benchmark, in this section we prove that a lower performance pre-buyout relative to the
benchmark is associated with higher improvements in PE targets operating performance.
The pre-buyout profitability and productivity growth, proxied by ROS and asset
turnover change (models 2 and 4), are positively related with operating performance, indicating
that, despite financial constrained, PE targets which are improving their efficiency, both in the
use of its assets and in its productive process, are those more prone to gains in post-buyout
operating performance, albeit only productivity growth, in model 2, is statistical significant.
Thus, the level of pre-buyout performance has a negative relation with post buyout
improvements in operating performance, as expected and widely reported in the literature, for
instance in Guo et al. (2011). This confirms that PE investors target profit and cash positive
companies, but companies that are underperforming and have potential for optimization.
Overall, leverage changes, financial constraints and targets operating performance,
appear important in explaining operating gains. Therefore, this differences across sample firms
in their ability to improve operating performance are likely to explain some of the variation in
the value created by these deals, which represents a valuable line of future research. In particular,
our results indicate that PE create value by relaxing credit constraints, allowing targets to take
advantage of unexploited growth opportunities. To check this affirmation, as a robustness test,
we compute ICF sensitivity regressions for pre- and post-buyout periods, reported in the next
section, which confirm PE mitigation of its target’s financial constraints.
41
5.6. Financial Constraints Robustness Check
In this section, as previously stated, we compute ICF sensitivity regressions for pre- and
post-buyout periods, as a robustness test relative to PE mitigation of its target’s financial
constraints.
The literature defines ICF sensitivity as the impact that variations in a measure of cash
flow have in the investment intensity, and in the empirical literature are commonly the
coefficient of an OLS regression of an investment intensity measure (e.g. CAPEX/ Lag total
assets) against a measure of cash flow (commonly ROA defined as EBITDA/Lag total assets).
For details please see Asker, Farre-Mensa, and Ljungqvist (2015).
The ICF sensitivity should not be interpreted as the severity of financial constraints but
as an indicator of the existence of financial constraints (Bertoni et al., 2013). Thus, the ICF
sensitivity will not be significantly different from zero for non-financially constrained firms.
Accordingly, we follow Asker et al. (2015) and compute an OLS regression of an
investment intensity measure against a measure of cash flow, from our data organized as a
balanced panel, while controlling for firm and year fixed effects. Nonetheless, it is not
reasonably expectable that two comparable firms, with similar investment opportunities, have
the same investment policy. Thus, to be comparable, the investment decisions need to account
for the different investment opportunities. Generally, in the empirical literature, investment
opportunities are proxied by Tobin’s Q, which is typically defined as the firm’s market value to
the book value of its assets. However, this ratio is not available for private firms, but Asker et
al. (2015) suggest as an alternative the use of turnover growth, an alternative widely used in the
investment literature, which we follow in this research.
𝐼𝑖𝑡
𝐴𝑖𝑡−1= α + 𝛽𝑖 𝑅𝑂𝐴𝑖𝑡 + 𝛽𝑖𝑄𝑖𝑡 + 𝑢𝑖 + 𝑣𝑖 + 𝑒𝑖
The investment intensity measure 𝐼𝑖𝑡 is defined as CAPEX, 𝐴𝑖𝑡−1 is the year-beginning
total assets, 𝑄𝑖𝑡 is the proxy for Tobin’s Q (turnover growth) and 𝑅𝑂𝐴𝑖𝑡, is the EBITDA divided
by year-beginning total assets. The model includes firm (𝑢𝑖) and year (𝑣𝑖) fixed effects, which
(5.1.)

42
allows to estimate within-firm variation in investment in response to within-firm variation in
investment opportunities.
Therefore, as observable in Table 13, we find that while before the buyout PE targets
present a statistically significant relation (at 1% level) with the measure of cash flow, indicating
the existence of pre-entry financial constraints, after the buyout, the investment cash flow
measure is not statistical significant, which indicates that PE lessen its targets financial
constraints, as previously argued, with PE backed firms becoming less sensitive to internal
generated cash flows. This is consistent with the views of Boucly et al. (2011) and Engel and
Stiebale (2014), that found that PE buyouts have a positive impact on investment, particularly,
among French SME.
This table reports the multivariate panel regression results for pre- and post-buyout PE backed firms’
sensitivity to investment opportunities for the full sample. The dependant variable is CAPEX scaled by year-
beginning total assets. Lag ROA is defined as EBITDA over year-beginning total assets. Turnover growth is the
turnover growth rate in the analysed period. Model 1 respects to year -1 and -2, while model 2 reports to years +1
to + 3. P-values are in parentheses. All panel regressions are OLS with year and firm fixed effects. We use ***, **,
and * to denote significance at the 1%, 5%, and 10% level (two-sided), respectively. Values are winsorised between
0.05 and 0.95 percentiles.
Table 13 – Investment Cash Flow Sensitivity Regressions
Pre-Buyout Post-Buyout
(1) (2)
Lag ROA 0.7105*** 0.1042
(0.0001) (0.3995)
Turnover Growth -0.0003 0.0010
(0.8696) (0.6063)
Constant 0.0533** 0.1042***
(0.0115) (0.0000)
Firm Fixed Effects Yes Yes
Year Fixed Effects Yes Yes
Observations 99 117
F-Statistics 3.3460** 1.7171***
Adjusted R squared 58.64% 23.96%
Full Sample
CAPEX / Lag Total Assets

43
6. Conclusion
Using a sample of 121 PE deals (of which 31 have been already exited), occurred in Portugal,
between 2007 and 2016, and a sample of 121 matched firms, we have compared the pre-entry
with the post-entry operating performance and find no evidence that PE firms present
improvements in its operating performance until the first three post-buyout years. However, for
the exit subsample we find a positive and statistically significant improvement in targets
operating performance.
Moreover, regarding the determinants of PE buyouts operating performance, we find no
support for the agency theory and the disciplinary role of debt as a factor related with post-
buyouts operating improvements, coherent with the most recent stream of literature about
private-to-private transactions, as Chung (2011) or Scellato and Ughetto (2012).
Nonetheless, we find solid evidence regarding the fact that PE may spur growth and reduce
financial constraints of its targets. By relaxing financial constraints PE seem to create value
allowing targets to take advantage of unexploited growth opportunities. Our sample indicates
that PE backed companies grow at a significant higher pace than non-PE backed firms, both in
terms of turnover and total assets. PE targets registered a significant growth in EBITDA,
outperforming the benchmark, and a robust profitability expansion in the long run, leading to
reinforced auto financing ability and consequent reduction of financial dependence.
Overall, leverage, growth and past performance appear important in explaining operating
gains. Differences across sample firms in their ability to improve operating performance are
likely to explain some of the variation in the value created by these deals. Because gains in
operating performance in our sample are either comparable to or exceed those observed for the
matched sample, depending on the post-buyout period considered, one can argue that at least
part of the value created by those deals arises from this operating outperformance.
Therefore, this study leaves several interesting topics worth pursuing inquiry, namely: i) the
development of our PE sample, in order to be possible to isolate the crisis period and develop
a comparative analysis; ii) expand the exit sample in order to extend the analysis of PE buyouts
operating performance determinants until the exit; iii) the separation of the treatment and
selection effects, i.e. are PE good at selecting targets, or at creating value; iv) the growth in total
assets and turnover has been consistently reported in most recent studies, it would be important

44
to understand what are the growth drivers, e.g. an increase in non-organic or organic growth; v)
extend this research by collecting the capital flows of each exited deal and try to quantify the
percentage of value creation explained by operating performance improvements.
Notwithstanding, this research as some limitations. In particular, the concentration of deals
in the crisis period, for instance, we found no evidence of consistent operating efficiency gains
in the first three years after the entry. In fact, the period is marked by a significant generalized
reduction in operating performance, which can to some extent distort the PE firm impact.
45
Bibliography
Acharya, V., Gottschalg, O., Hahn, M., and Kehoe, C. (2013). Corporate governance and value
creation: Evidence from private equity. The Review of Financial Studies, 26(2), 368-402.
doi:10.2139/ssrn.1107959
Almeida, A. (2018). The performance of Private Equity backed companies in Portugal (Master’s
Dissertation). Universidade do Porto, Porto.
Asker, J., Farre-Mensa, J., and Ljungqvist, A. (2015). Corporate Investment and Stock Market
Listing: A Puzzle? Review of Financial Studies, 28(2), 342-390. doi:10.2139/ssrn.1603484
Ayash, B., and Schütt, H. (2016). Does going private add value through operating
improvements? Journal of Corporate Finance, 40, 192-215.
doi:10.1016/j.jcorpfin.2016.07.015
Barber, B., and Lyon, J. (1995). Detecting abnormal operating performance: The empirical
power and specification of test statistics. Journal of Financial Economics, 41, 359-399.
doi:10.1016/0304-405X(96)84701-5
Bergstrom, C., Grubb, M., and Jonsson, S. (2007). The operating impact of buyouts in Sweden.
The Journal of Private Equity, 11(1), 22-39. doi:10.3905/jpe.2007.699056
Bertoni, F., Feerer, M., and Martí, J. (2013). The different role played by venture capital and
private equity investors on the investment activity of their portfolio firms. Small Business
Economics, 40(3), 137-163. doi:10.1007/s11187-011-9384-x
Borbás, L. (June of 2013). Access to finance as main challenge for European SMEs. Can
COSME help between 2014-2020? In Óbuda University, MEB 2013 – 11th International
Conference on Management, Enterprise and Benchmarking. Conference from Keleti Faculty of
Business and Management, Budapest. Retrieved from http://kgk.uni-
obuda.hu/sites/default/files/19_Borbas.pdf
Boucly, Q., Sraer, D., and Thesmar, D. (2002). Growth LBOs. Journal of Financial Economics, 102,
432-453. doi:10.1016/j.jfineco.2011.05.014
Brander, J., Egan, E, and Hellmann, T. (2008). Government Sponsored versus Private Venture
Capital: Canadian Evidence. International Differences in Entrepreneurship, 14029. doi:
10.3386/w14029

46
Chung, J. (2011). Leveraged buyouts of private companies. Social Science Research Network
Electronic Journal, 1-37. doi:10.2139/ssrn.1904342
Comissão de Mercado de Valores Mobiliários. (2017). Relatório anual da atividade de capital de risco
2017. Retrieved from http://www.cmvm.pt/pt/EstatisticasEstudosEPublicacoes
/Publicacoes/CapitaldeRisco/Documents/RAC_2017.pdf
Cressy, R., Munari, F., and Malipiero, A. (2007). Playing to their strengths? Evidence that
specialization in the private equity industry confers competitive advantage. Journal of
Corporate Finance, 13(4), 647-669. doi:10.1016/j.jcorpfin.2007.04.007
Cristinzio, A. (2018). Private equity deals insights: Q2 2018. Retrieved from
https://www.pwc.com/us/en/industries/private-equity/library/quarterly-deals-
insights.html
Cumming, D. and Macintosh, J. (2006). Crowding out private equity: Canadian evidence. Journal
of Business Venturing, 21(5), 569-609. doi: 10.1016/j.jbusvent.2005.06.002
Cumming, D., Siegel, M., and Wright, D. (2007). Private Equity, leveraged buyouts and
governance. Journal of Corporate Finance, 13, 439-460. doi:10.1016/j.jcorpfin.2007.04.008
Desbrières, P., and Schatt, A. (2002). The impacts of LBOs on the performance of acquired
firms: the French case. Journal of Business Finance & Accounting, 29(5), 695-727.
doi:10.1111/1468-5957.00447
Engel, D., and Keilbach, M. (2007). Firm-level implications of early stage venture capital
investment -- An empirical investigation. Journal of Empirical Finance, 14(2), 150-167. doi:
10.1016/j.jempfin.2006.03.004
Engel, D., and Stiebal, J. (2013). Private Equity, investment and financial constraints: Firm-level
evidence for France and the United Kingdom. Small Business Economics, 43(1), 197-212.
doi:10.1111/1468-5957.00447
European Commission. (2017). Annual report on European SMEs. Retrieved from
file:///C:/Users/ASUS/Downloads/Annual%20Report%20-
%20EU%20SMEs%202016-2017.pdf
Fama, E., and Jensen, M. (1986). Separation of ownership and control. The Journal of Law &
Economics, 6(2), 301-325. doi:10.1086/467037
47
Gaughan, P. (2011). M&A resurgence: Good or bad? The Journal of Corporate Accounting & Finance.
22, 3-8. doi:10.1002/jcaf.20653
Gilligan, J., and Wright, M. (2014). Private equity demystified: An explanatory guide (3rd Ed.). London:
ICAEW Corporate Finance Faculty.
Gompers, P., Kaplan, S., and Mukharlyamov, V. (2016). What do private equity firms say they
do? Journal of Financial Economics, 121(3), 449-476. doi:10.1016/j.jfineco.2016.06.003
Guo, S., Hotchkiss, E., and Song, W. (2011). Do buyouts (still) create value? The Journal of
Finance, 66(2), 479-517. doi:10.2139/ssrn.1009281
Harris, R., Siegel, D., and Wright, M. (2005). Assessing the impact of management buyouts on
economic efficiency: Plant-level evidence from the United Kingdom. The Review of
Economics and Statistics, 87(1), 148-151. doi:10.1162/0034653053327540
Healy, M., Palepu, G., and Ruback, S. (1992). Does corporate performance improve after
mergers? Journal of Financial Economics, 31(2), 135-175. doi: 10.1016/0304-
405X(92)90002-F
Heel, J., and Kehoe, C. (2005). Why some Private Equity firms do better than others. Mckinsey
Quarterly, 1(1), 24-26. Retrieved from: https://www.mckinsey.com/business-
functions/strategy-and-corporate-finance/our-insights/why-some-private-equity-
firms-do-better-than-others
Jelic, R., and Wright, M. (2011). Exits, performance, and late stage Private Equity: The case of
UK management buy‐outs. European Financial Management, 17(3), 560-593.
doi:10.1111/j.1468-036X.2010.00588.x
Jensen, M. (1986). Agency costs of free cash flow, corporate finance, and takeovers. The American
Economic Review, 6(2), 323-329. doi:10.2139/ssrn.99580
Jensen, M. (1989). Active investors, LBOs, and the privatization of bankruptcy. Journal of Applied
Corporate Finance, 2(1), 35-44. doi:10.2139/ssrn.244152
Jensen, M., and Meckling, W. (1976). Theory of the firm: Managerial behavior, agency costs and
ownership structure. Journal of Financial Economics, 3(4), 305-360. doi:10.1016/0304-
405X(76)90026-X
48
Kaplan, S. (1989). The effects of management buyouts on operating performance and value.
Journal of Financial Economics, 24(2), 217-254. doi:10.1016/0304-405X(89)90047-0
Kaplan, S., and Strömberg, P. (2009). Leveraged buyouts and Private Equity. Journal of Economic
Perspectives, 22(4), 121-146. doi:10.3386/w14207
Kengelbach, J., Keienburg, G., Schmid, T., Degen, D., and Sievers, S. (2018). The 2018 M&A
report: Synergies take center stage. Retrieved from
https://www.bcg.com/publications/2018/synergies-take-center-stage-2018-m-and-a-
report.aspx
Kolev, K., Haleblian, J., and McNamara, G. (2011). A review of the merger and acquisition wave
literature: History, antecedents, consequences and future directions. In D. Faulkner, S.
Teerikangas, and R. Joseph (Eds.), The Handbook of Mergers and Acquisitions (pp. 19-39).
Oxford: Oxford University Press.
Lichtenberg, F., and Siegel, D. (1990). The effects of leveraged buyouts on productivity and
related aspects of firm behavior. Journal of Financial Economics, 27(1), 165-194.
doi:10.3386/w3022
Mendes, J., and Sousa, M. (2013). Private Equity in Portugal - An analysis of the portfolio
companies’ operating performance. Cadernos Do Mercado De Valores Mobiliários, 45, 34-
50. Retrieved from:
http://www.cmvm.pt/pt/EstatisticasEstudosEPublicacoes/Publicacoes/BoletimDaC
MVM/Documents/CadernosMVM45Artigo2.pdf
Plagborg-Møller, E., and Morten, H. (2017). IPO or SBO: The increasing importance of
operational performance for Private Equity exits following the global financial crisis of
2007–08. Journal of Applied Corporate Finance, 29(1), 115-121. doi:10.1111/jacf.12225}
Rajan, R., and Zingales, L. (1998). Financial dependence and growth. The American Economic
Review, 88(3), 559-586. doi:10.3386/w5758
Saints Capital Services (2010). A guide to secondary transactions: Alternative paths to liquidity in private
companies. Retrieved from: https://saintscapital.com/wp-
content/uploads/2015/04/Secondary_Marketing_Booklet.pdf
49
Sannajust, A., Arouri, A., and Chevalier, A. (2014). Drivers of LBO operating performance: An
empirical investigation in Latin America. European Business Review, 27(2), 102-123.
doi:10.1108/EBR-04-2013-0076
Santos, T. (2013). O Private Equity e a recuperação de empresas em distress financeiro (Master’s
Dissertation). Universidade do Porto, Porto.
Scellato, G., and Ughetto, E. (2012). Real effects of Private Equity investments: Evidence from
European buyouts. Journal of Business Research, 66(12), 2642-2649.
doi:10.1016/j.jbusres.2012.06.001
Shivdasani, A. (1993). Board composition, ownership structure, and hostile takeovers. Journal of
Accounting and Economics, 16(3), 166-168. doi:10.1016/0165-4101(93)90009-5
Smith, A. (1990). Capital ownership structure and performance: The case of management
buyouts. Journal of Financial Economics, 13, 143-165. doi:10.1016/0304-405X(90)90024-T
Stumpp, P., Marshella, T., Rowan, M., McCreary, R., and Coppola, M. (2000). Putting EBITDA
in perspective ten critical failings of EBITDA as the principal determinant of cash flow.
Moody’s Investor Service Global Credit Research.
Tykvova, T. (2017). Venture capital and Private Equity financing: An overview of recent
literature and an agenda for future research. Journal of Business Economics, 88, 325-362.
doi:10.1007/s11573-017-0874-4
Ughetto, E. (2010). Assessing the contribution to innovation of Private Equity investors: A
study on European buyouts. Research Policy, 39(1), 126-140.
doi:10.1016/j.respol.2009.11.009
Wiersema, M., and Liebeskind, J. (1995). The effects of leveraged buyouts on corporate growth
and diversification in large firms. Strategic Management Journal, 16(6), 447-460.
doi:10.1002/smj.4250160604
Wilson, N., Wright, M., Siegel, D., and Scholes, L., (2012). Private Equity portfolio company
performance during the global recession. Journal of Corporate Finance, 18(1), 193-205.
doi:10.1016/j.jcorpfin.2011.11.008

50
Appendix 1 – Database limitations
Sabi:
Sabi is a commercial database commercialized and managed by Bureau Van Dijk that
contains accounting and other information for over 700,000 Portuguese companies up to 25
years ago.
A first potential bias is related to data limitation in the coverage period, i.e. for some
deals that are inside the coverage period accounting statements were available for a more limited
time frame. This results in reduction of the initial sample collected from Zephyr.
Second, the database does not possess data on all the companies headquartered in
Portugal, thus some companies identified in Zephyr database do not appear in Sabi database.
Third, the database contains consolidated and unconsolidated financial information,
however, because most firms are not obligated to report consolidated accounts, Sabi does not
encompass consolidated financial data of all economic groups. Since, in some cases,
consolidated accounts may give a more reliable and appropriate image of the economic group
situation, the final results of this research may be biased, given that does not account for the
group structure.
Fourth, we may have missed many divisional buyouts, as in such cases the target may
not be an independent legal entity before the transaction (but just a division of the selling firm),
thus we lack financial information prior to the transaction.
Zephyr:
Zephyr is a database commercialized and managed by Bureau Van Dijk and
encompasses the M&A, IPO, private equity and venture capital deals and rumours. It covers
over 10 years of history for deals worldwide, based on information on rumours as well as
announced and completed deals, being updated daily.
The key limitation of this database is that it may not encompass all deals occurring in a
determined time period, which may lead to a selection bias.