Embed Size (px)
Citation preview
University of Pisa
Department of Economics and Management
Master of Science in
Strategia, Management e Controllo
THESIS TITLE
Leveraged Buyouts (LBOs) in the Private Equity Industry: the
Role of Debt and Financial Structure as Drivers for the Value
Creation of the Fund’s Investors
CANDIDATE: SUPERVISOR:
Stefano Spagnolo Prof. Antonio Corvino
academic year 2015-2016

Table of Contents
Introduction ......................................................................................................... vi
Part I – An Overview of Private Equity ........................................................... 11
1.1 What is Private Equity? .................................................................................... 11
1.2 Brief History and Current Market Overview of LBOs .................................... 15
1.2.1 Before the 1980s .............................................................................................................. 16
1.2.2 1980s: Leveraged Buyouts on the rise ............................................................................. 16
1.2.3 1990s: the fall and rise (again) of the LBO market ......................................................... 17
1.2.4 2000-2007: LBOs booming, but bouncing off the crisis ................................................. 17
1.2.5 2007-2015: LBO market gets back on its feet, ready to restart ....................................... 18
1.2.6 Outlook of the Leveraged Buyout Market today ............................................................. 19
1.3 Leveraged Buyouts at work ............................................................................. 24
1.3.1 Equity side ....................................................................................................................... 24
1.3.1.1 The main vehicle: the Private Equity Fund ................................................................. 24
1.3.1.2 What are GPs and LPs ................................................................................................. 26
1.3.1.3 Capital flows pattern: the J-Curve ............................................................................... 31
1.3.1.4 GP-LPs contract (LPA): fees and “distribution waterfall” .......................................... 32
1.3.1.5 GP-LPs agency costs ................................................................................................... 38
1.3.2 Debt side (hints) .............................................................................................................. 40
1.4 Sources of Value Creation in LBOs and Role of Financial levers ................... 40
1.4.1 Preliminary: agency theory aspects and “perfect targets” for LBOs ............................... 40
1.4.2 Sources of value: the traditional Kaplan’s model ............................................................ 44
1.4.3 Leverage as a source of value .......................................................................................... 48
1.4.4 The evolution of the Kaplan’s model .............................................................................. 52
1.5 LBO performance: Costs and Returns ............................................................. 55
1.5.1 Costs of investing in LBOs .............................................................................................. 55
1.5.1.1 Risk ............................................................................................................................. 56
1.5.2 Returns of investing in LBOs .......................................................................................... 57
1.5.2.1 Absolute performance: IRR and multiples .................................................................. 57
1.5.2.2 Performance patterns at a fund level ........................................................................... 58
1.5.2.3 Performance patterns at a general level ....................................................................... 60
1.5.2.4 Money-weighted vs. time-weighted rates of returns ................................................... 63
1.5.2.5 Relative performance: PMEs....................................................................................... 63
1.5.2.6 LBO vs. public markets: superior returns? .................................................................. 65
Part II – The Debt Side in Leveraged Buyouts ............................................... 69
2.1 Preliminary aspects ........................................................................................... 69
2.2 The primary role of banks: leveraged loans ..................................................... 70
2.3 The LBOs Financing Package (1980 – mid-1990s) ......................................... 73
2.3.1 Senior Debt ...................................................................................................................... 73
2.3.2 Subordinated Debt ........................................................................................................... 76
2.3.2.1 The junk bond market explosion ................................................................................. 77
2.3.3 1989: the end of an era? ................................................................................................... 81
2.4 The LBOs Financing Package (mid-1990s – 2007) ......................................... 82
2.4.1 Senior Debt ...................................................................................................................... 83
2.4.1.1 The Advent of Institutional Investors .......................................................................... 83
2.4.2 Subordinated Debt ........................................................................................................... 85
2.4.3 Other Debt ....................................................................................................................... 86
2.4.4 Developments in buyout financing .................................................................................. 86
2.5 Need more capital? The Structured Credit market, Securitization and Credit
Derivatives ................................................................................................................... 88
2.5.1 The usage of ABS in “Securitized” LBOs ....................................................................... 90
2.5.2 “We created the investor”: investment banks’ CDOs ...................................................... 93
2.5.2.1 Background of Collateralized Debt Obligations .......................................................... 94
2.5.2.2 CDOs in the LBO market ............................................................................................ 98
Part III – Research Approach and Methods ................................................. 103
3.1 The Sample ..................................................................................................... 104
3.2 The Survey ...................................................................................................... 109
Part IV – Empirical Results ............................................................................ 115
4.1 Descriptive Analysis ....................................................................................... 117
4.2 Conclusive remarks ........................................................................................ 142
4.2.1 After the crisis: Value creation or destruction? .............................................................. 143
4.2.2 The LBO financing package after 2007 ......................................................................... 144
4.2.3 Other drivers of value creation ...................................................................................... 148
References ......................................................................................................... 153


vi | P a g .
Introduction
The modern Private Equity (PE) industry can be traced back to the early 1980s,
when it started to gain popularity on an international scale. In particular, Leveraged
Buyouts (henceforth, LBOs) have always played a substantial role in the overall
PE industry, in terms of both the capital required for such transactions and the
relevant impact that they have usually brought in the economy as a whole.
A typical LBO transaction entails a specialized PE firm taking over one or more
companies (so-called “target companies”) through a relatively small level of equity
and a meaningful amount of debt, that usually reaches as high as 80% of the entire
financing package (hence the term “leveraged”). Once the target company is
acquired, the PE firm and its management will have to drive value creation, to
reimburse debt fully and to make a profit for the PE firm and its investors.
But what are specific levers by which a PE firm manages to create value in an LBO
operation? Amongst other scholars, Kaplan argued that three main drivers
ultimately lead to value creation in LBOs: operational engineering, governance
engineering and financial engineering. While operational engineering requires
putting a great focus on sustainable long-term growth, governance engineering
relates to changes and practices adopted within the board of directors and the top
management area once the target company gets acquired, in order to develop a
brand new corporate strategy. Finally, financial engineering relates to leverage and
the overall debt-financing package as a source of value creation.
So far, a great number of authoritative scholars have delivered substantial research
concerning the role of the first two levers as drivers for the value creation process
in LBOs. On the contrary, very few findings are nowadays available regarding the
role of financial engineering in delivering value over years.
Therefore, I decided to fill this research gap by investigating how leverage and the
debt-financing package evolved over time and their ability to drive value for the
vii | P a g .
PE firm and its investors, with particular regard to the aftermath of the 2007
financial crisis on the LBO market. My research question was set out as:
The role of private equity firms and banks in structuring the “debt side” of LBOs
in Europe after the 2007 financial crisis, and possible implications for the Limited
Partners’ value creation.
While the first part of my thesis is based on a literature review process and mainly
concentrates on general aspects of the debt financing package and the evolution
from the inception of the phenomenon in the 1980s, the last part comprehends an
empirical investigation on how the debt component of LBOs has evolved after the
financial crisis, and possible correlations with the renewed value creation process
that has been marked out. In particular:
Part I includes general aspects of the private equity industry. It provides a
brief history of the LBO market, the mechanics by which it actually
operates, and it reports corroborated academic models of value creation for
LBO operations.
Part II focuses specifically on the debt side of LBOs, investigating its
evolution over time and explaining in detail financial instruments and tools
used to reach high levels of debt.
Part III introduces the methodology that I used to carry out my research
project. In particular, it describes the sample of PE firms that I selected and
analyzes the survey that was elaborated and finally sent to such a sample.
Part IV, at last, reports empirical results that were accurately processed by
means of descriptive analysis.

viii | P a g .
Acknowledgements
As the final step of my academic path, this project is the result of much effort and
commitment. Despite I have done all my best and put a lot of energies in doing it,
this work would not have been possible without the support of some people that
helped me follow through.
To begin with, I would like to thank all the executives and top managers of private
equity firms that contributed to my research by responding to the survey that was
sent to them. Among them, I owe special thanks to Dr. Mattana, who helped me
more than once with his superior expertise in the leveraged buyout market, and
that gave me precious advice for almost any aspect of this project.
I would also like to thank my supervisor, Professor Antonio Corvino, for his
valuable knowledge and, last but not least, for his availability and patience in
guiding me throughout this final path.
And most of all, I would like to deeply thank my family for having always
supported me in everything I have done. I owe thanks to my parents, who have
always been on my side and backed me up whenever I needed, and to my sister,
whose presence is source of inspiration and joyousness. I would not be where I am
without you.


An Overview of Private Equity
11 | P a g .
Part I – An Overview of Private Equity
1.1 What is Private Equity?
“I like to define private equity firms as organizations
that run governance that run businesses”
(Michael H. Jensen)
Private Equity (PE) is a relatively recent phenomenon that has been widely defined
by academics, scholars and practitioners over time. Many definitions of this
financial activity can be found on books, papers and academic articles, as well as
those provided by authoritative associations worldwide that deal with this topic.
Regardless of the variety and the number of these different explanations, Private
Equity activity can be generally defined as the purchase of control equity stakes in
unquoted companies that are characterized for high growth potential, with the aim
of actively managing, thereby realizing value creation, and then reselling them on
the market gaining as much as possible. More specifically, it is a medium to long-
term investment that, by strengthening management expertise, delivering
operational improvements and bringing in financial resources, leads the company
to create value on a long-term perspective, which is then monetized by selling back
the firm on the market.
Private Equity as an Alternative Investment asset class
Although put it in these terms Private Equity appears to be somewhat of a typical
and not excessively sophisticated financial activity, it is by contrast encompassed
within the alternative investments category, as shown even in the new report of the
World Economic Forum1. In other words, financial investments can be easily
1 World Economic Forum (2015), Alternative Investments 2020 – An Introduction to Alternative Investments, available at:
Part I
12 | P a g .
divided into two macro categories, the first of them being “traditional
investments”, which comprise typical investments in cash, stocks (private or
public) and bonds (government or corporate), that is, asset classes with which
investors are most familiar with and the easiest and most accessible to find on the
markets. On the other side, the “alternative investments” category is made up of
all the other and more sophisticated asset classes, which are often not even known
by the majority of people without adequate financial expertise, such as
commodities, real estate, even art and antiquities, as well as private equity, venture
capital and hedge funds investments. Besides the mere asset class on which they
are based on, alternative investments are usually characterized by illiquidity, long-
term ranges and high risk that make them highly specialized and suitable only for
a little portion of investors.
Private Equity categories
Private equity investments cannot be considered as a unique, single class. Indeed,
it gathers many different subsets of very dissimilar investments that need to be
separately analyzed to better understand this phenomenon. Specifically, the main
classification splits private equity into different investment categories, each of
them refers to a different stage of the life cycle of the company and requires capital
for a specific purpose. Academics and practitioners have hitherto given different
categorizations and taxonomies of the various types of investments to be collected
below the private equity macro class, and, as easily predictable, several differences
have emerged, especially between U.S. and European terminologies. With the
clear objective of making things simpler, we will report here the most common
and worldwide accepted stages that characterize the various private equity classes,
highlighting their utilization nowadays. According to the British Private Equity &
Venture Capital Association (BVCA)2, one of the most authoritative PE
http://www3.weforum.org/docs/WEF_Alternative_Investments_2020_An_Introduction_to_AI.pdf (accessed December 2015) 2 BVCA (2012), A Guide To Private Equity, available at: http://www.bvca.co.uk/Portals/0/library/Files/Website%20files/2012_0001_guide_to_private_equity.pdf (accessed December 2015), pp. 16-17
An Overview of Private Equity
13 | P a g .
association all over the world, there are different stages in which private equity
investments can be divided into:
Seed, that implies a PE investment at the very beginning: in particular, a
capital commitment is required to develop a business concept by drawing
up the business plan and funding the initial R&D expenses to create the first
prototype of the product;
Start-up, for businesses that are being set up, but need more funding to start
producing the product commercially and develop marketing activities;
Early Stages, for companies that have completed the product development
stage, but need more capital to start generating profits (it is worth noting
that many authors, especially in the past, used to split this category into
first-stage, second-stage and third-stage);
Growth (or Expansion), for established companies that need additional
capital to grow and expand;
Buyout, a large class which encompasses many other subsets of operations
that often rely on a significant quantity of debt to be carried out (each
category will be analyzed subsequently);
Bridge financing, for companies requiring capital to enter the public
markets through an IPO within few months;
Turnaround, to rescue a company in a financial distress situation.
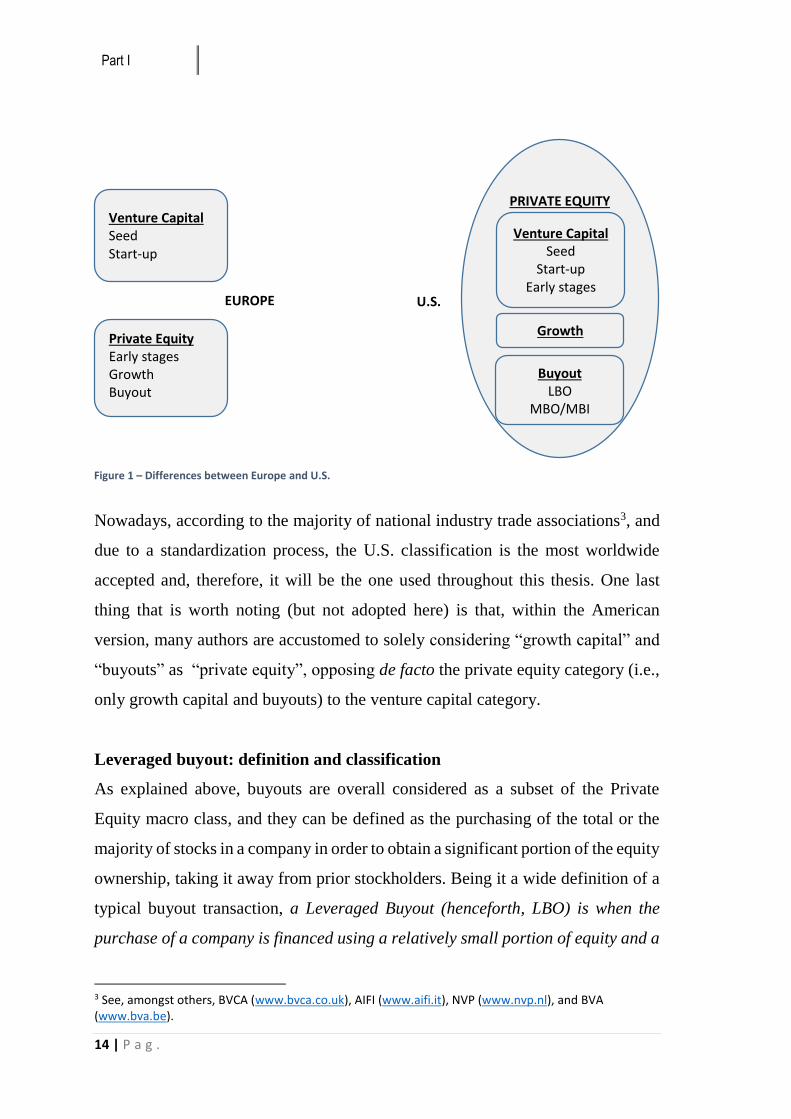
As mentioned earlier, some differences emerged between the U.S. and European
terminologies, especially as far as venture capital investments are concerned. In
particular, the European view used to distinguish Venture Capital (seed and start-
up companies) from Private Equity (early-stages and expansion capital, as well as
buyouts), whereas the American view used to consider Venture Capital as a subset
(along with the buyout subset) of the whole Private Equity macro category. Both
versions are reported in Figure 1.
Part I
14 | P a g .
Nowadays, according to the majority of national industry trade associations3, and
due to a standardization process, the U.S. classification is the most worldwide
accepted and, therefore, it will be the one used throughout this thesis. One last
thing that is worth noting (but not adopted here) is that, within the American
version, many authors are accustomed to solely considering “growth capital” and
“buyouts” as “private equity”, opposing de facto the private equity category (i.e.,
only growth capital and buyouts) to the venture capital category.
Leveraged buyout: definition and classification
As explained above, buyouts are overall considered as a subset of the Private
Equity macro class, and they can be defined as the purchasing of the total or the
majority of stocks in a company in order to obtain a significant portion of the equity
ownership, taking it away from prior stockholders. Being it a wide definition of a
typical buyout transaction, a Leveraged Buyout (henceforth, LBO) is when the
purchase of a company is financed using a relatively small portion of equity and a
3 See, amongst others, BVCA (www.bvca.co.uk), AIFI (www.aifi.it), NVP (www.nvp.nl), and BVA (www.bva.be).
Venture Capital Seed Start-up
Private Equity Early stages Growth Buyout
EUROPE
PRIVATE EQUITY
Buyout LBO
MBO/MBI
Venture Capital Seed
Start-up Early stages
U.S.
Figure 1 – Differences between Europe and U.S.
Growth
An Overview of Private Equity
15 | P a g .
meaningful amount of debt, which typically ranges from 60 to 90 percent of the
total value. In particular, LBOs have played a very important role in the private
equity industry since its inception and they can take a variety of forms, mainly
depending on the subject that carries it out and on the purpose that leads him to
such an operation. We can distinguish, in particular:
Institutional buyout, when an institutional investor (be it a venture capital
or private equity firm, a bank and so forth) acquires the control of a
company in order to increase its value and then dispose of it in some years;
Management buyout (MBO), when internal managers decide to take over
their own company, often because they think that they are capable of
providing higher value to the firm (an institutional investor is in most cases
involved in the ownership acquisition, using internal management as a
prominent source for value creation);
Management buy-in (MBI), when external managers decide to take control
of a business;
It is worth pointing out that this is certainly not a comprehensive list of all possible
buyout configurations4, but includes only the most relevant types and broadly used,
and the most prone to be used alongside high levels of debt, within the private
equity industry. Hence, for the purpose of this work, we will hereafter refer only
to these three main categories.
1.2 Brief History and Current Market Overview of LBOs
Nowadays, Leveraged Buyouts fill a large part of the whole private equity
industry, as it exhibits worldwide aggregate deal values in the order of hundreds
of billions of dollars per year. As easily predictable, U.S.A. are the largest market,
directly followed by Europe (with U.K. being the most important and active
market), while the rest of the world holds negligible percentages, even though the
Asian market has been displaying considerable growth in recent years.
4 By way of example, other possible configurations include Corporate buyouts, Workers buyout, Family buyout and Fiscal buyout.
Part I
16 | P a g .
That said, for a better understanding of today’s market of LBOs, a brief
explanation of the history of these financial operations is going to be needed5.
1.2.1 Before the 1980s
LBOs as we know them today started to enter into popularity in the early 1980s,
when this phenomenon attested rapid expansion as a direct and unavoidable
consequence of the economic environment of prior years. Indeed, the “economic
boom” occurred in the 1960s gave birth to a conglomeration process that led many
companies to continuously grow their size by entering ever more businesses, and
thereby creating enormous corporations that were very often inefficient and value-
destructive. Conglomerates were thus made up of a variety of different and
uncorrelated business units that were allowed to survive only by means of a strong
liquidity capacity of the parent firm.
1.2.2 1980s: Leveraged Buyouts on the rise
It is in such a situation that leveraged buyouts started to be popular, strictly along
with so-called “corporate raiders”: actually, these activities were often badly-
judged, as they used to buy companies with undervalued assets just to close them
down right after and sell the assets separately, making a profit on the difference.
However, the highly-depreciated value whereby such operations were possible
sheds much light on how those businesses were economically inefficient and
useless, and make it natural to understand that LBOs were the natural consequence.
As funds raised in the early 1980s started to display significant and tempting
returns for its investors, ever more funds began to emerge, allured by such
impressive yields. Furthermore, it spurred the issuance of high-yield bonds (so-
called “junk bonds”) as investors rushed to enter such a profitable market, and the
influx of capital over years seemed like it would have never arrested.
5 For a more detailed analysis, see Gilligan, J. and Wright, M. (2014), “Private Equity Demystified – an explanatory guide”, ICAEW Corporate Finance Faculty, London (UK), pp. 23-27 Kaplan, S.N. and Strömberg, P. (2009), “Leveraged Buyouts and Private Equity”, The Journal of Economic Perspectives, Vol. 23, No. 1, pp. 121-128
An Overview of Private Equity
17 | P a g .
Kaplan6, in a subsequent paper, argued that the market was rapidly getting
“overheated” and – as a consequence of that – the large majority of deals concluded
in the 1985-89 period were not as good and profitable as transactions concluded in
the earlier period, showing instead an increase in overpriced deals for companies
that were not worth investing in.
The peak of the market was reached in 1989, with the symbolical buyout of the
U.S. based conglomerate RJR Nabisco, for $23bn or thereabouts. In Europe, the
largest buyout of that period was the one of Gateway Supermarkets for £2.2bn.
1.2.3 1990s: the fall and rise (again) of the LBO market
Right after reaching the peak in the late 1980s, in the early 1990s the market started
to collapse – a massive wave of recent transactions defaulted and many of them
ended in bankruptcy, and millions of investors (especially the ones who invested
in junk bonds) lost their capital.
Although the depressed climate that was predominating in those years, however,
the LBO market was not dead, it was just starting to recover. More observable
deals (public-to-private transactions) had undoubtedly shrunk, as well as the
overall number of completed deals and many smaller funds raised when the market
was skyrocketing disappeared, but the leveraged buyout phenomenon had not
ended. Private, unquoted companies and divisions suddenly became the most
preferred targets. LBO firms began to specialize in one or more sectors becoming
more industry-focused, as they revised their way of doing business, concentrating
on strategy rather than mere liquidity and cash flows in order to pursue sustainable,
long-term value. In short, they recognized errors made in the recent past, and they
were trying not to perpetrate them for the future.
1.2.4 2000-2007: LBOs booming, but bouncing off the crisis
As a result of the imposing process of restructuring and deep reorganization put in
place in the previous decade, the LBO market started to gradually rebound, and
6 Kaplan, S.N. and Stein, J.C. (1993), “The Evolution of Buyout Pricing and Financial Structure”, The Quarterly Journal of Economics, Vol. 108, No. 2
Part I
18 | P a g .
since the early 2000s leveraged buyouts’ relevance was increasing again.
Globalization played an important role even within the LBO sector, as it was
basically split in two segments: on the one hand, the largest LBO firms (most of
them founded at the outset of the 1980s) had become ever bigger and they operated
in an international context; on the other hand, smaller funds had specialized and
invested in specific industries, focusing in particular on mid-market companies.
Furthermore, the debt market had changed as well, mutating the roles of typical
lenders and introducing new players alongside new ways of financing. The LBO
market was rising again, reaching its top in 2006-07 when the bulk of committed
capital reached impressive levels, but then the financial crisis emerged and the
situation crashed once again. Banks preferred to hold cash rather than realize their
typical business activity by lending it, so the huge amount of capital hitherto
reached by private equity LBO funds, which strongly relied on debt to be deployed,
could not be invested. Committed capital, de facto, was entangled within the fund,
causing the LBO firm’s managers to charge annual fees to investors for capital that
was unlikely to yield a return.
1.2.5 2007-2015: LBO market gets back on its feet, ready to restart
In the aftermath of the financial and economic crisis that occurred in 2007-08, the
LBO market, as almost any other economic and financial activity, struggled to
resist for the unavoidable fall of capital provided by those who, just little time
before, were willing to invest in such operations.
Many private equity firms defaulted; others tried to get the best out of the crisis by
purchasing strongly devalued companies in hopes of selling them when the
markets will be rising again; still, others diversified their businesses, by entering
kindred financial activities, usually within the alternative investment’s class, such
as hedge funds and real estate funds.
However, for some years onwards, private equity and the leveraged buyout’s
sector have started to slowly recover – and to gradually rise, once again. Both
commitments and investments have recommenced to increase, year by year, and
so far LBOs have seemed to be well rebounding. As a proof of that, it is worth
An Overview of Private Equity
19 | P a g .
recalling that two of the biggest deals ever made were completed in 2013: the H.J.
Heinz Company’s buyout by 3G Capital along with Berkshire Hathaway for
$28bn, and the Dell Inc. purchase made by MSD Capital and Silver Lake for
approximately $25bn.
1.2.6 Outlook of the Leveraged Buyout Market today
After the brief exposition of the overall history, we will now attempt to outline
what exactly private equity – with particular regard, obviously, to the leveraged
buyout sector – is nowadays, defining both the broad dimension of the market in
terms of billions of dollars, and the major players that compete within this industry.
As far as the market’s size is concerned, to evaluate how big actually this industry
is, we can draw on the two broadest, internationally used measures, which are
capital raised and capital invested by funds, year after year. For the purpose of this
work, we will consider the 2009-2015 period, that is, the period right after the
economic crisis occurred.
A great deal of relevant and reliable data concerning the market’s size is easily
findable, be it on the most significant trade associations (for example, PEGCC and
EVCA7), on dedicated databases such as Preqin and Burgiss, or on publications
made by the biggest companies operating in the industry or in an industry-related
context (e.g. financial advisory, investment banking).
To begin with, the U.S.A. are the global leading market, as it is the most
considerable in a worldwide perspective both for raised and committed capital, and
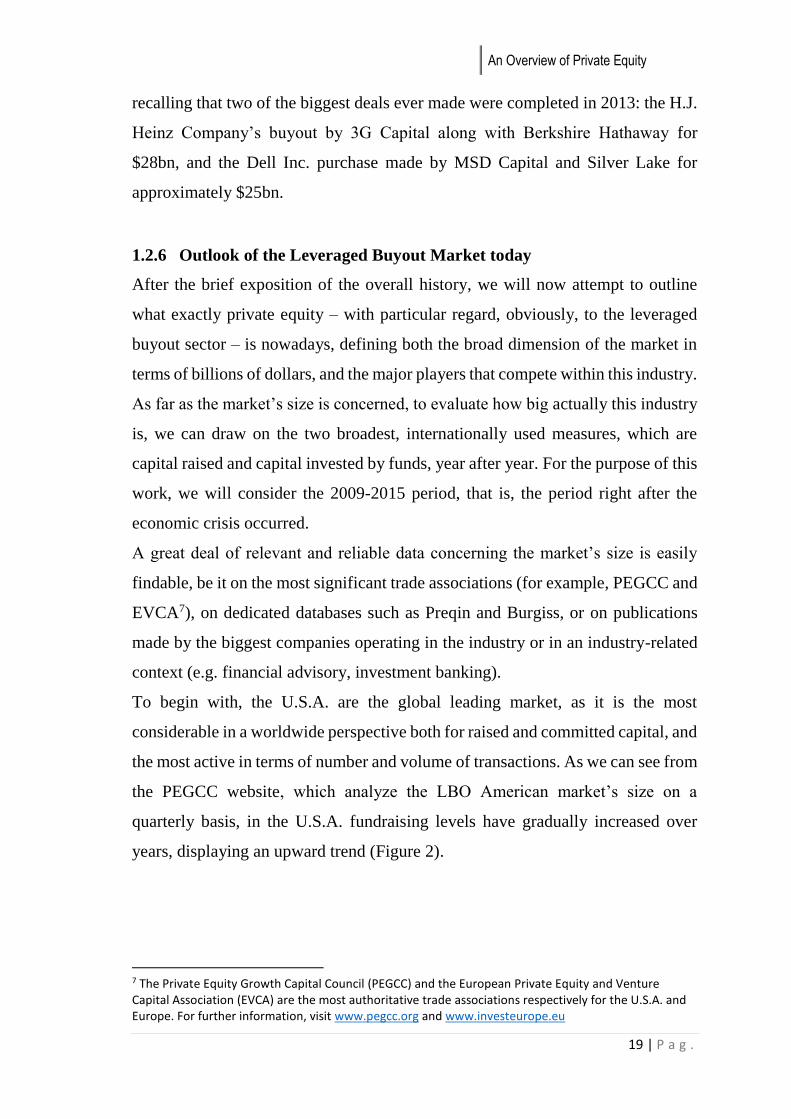
the most active in terms of number and volume of transactions. As we can see from
the PEGCC website, which analyze the LBO American market’s size on a
quarterly basis, in the U.S.A. fundraising levels have gradually increased over
years, displaying an upward trend (Figure 2).
7 The Private Equity Growth Capital Council (PEGCC) and the European Private Equity and Venture Capital Association (EVCA) are the most authoritative trade associations respectively for the U.S.A. and Europe. For further information, visit www.pegcc.org and www.investeurope.eu
Part I
20 | P a g .
Figure 2 – source: Private Equity Growth Capital Council
Moreover, it is worth reporting that the total amount of committed capital (also
called “dry powder”) from which funds’ managers can draw upon when
investment opportunities are available, exhibits a value of $466bn in 2015.
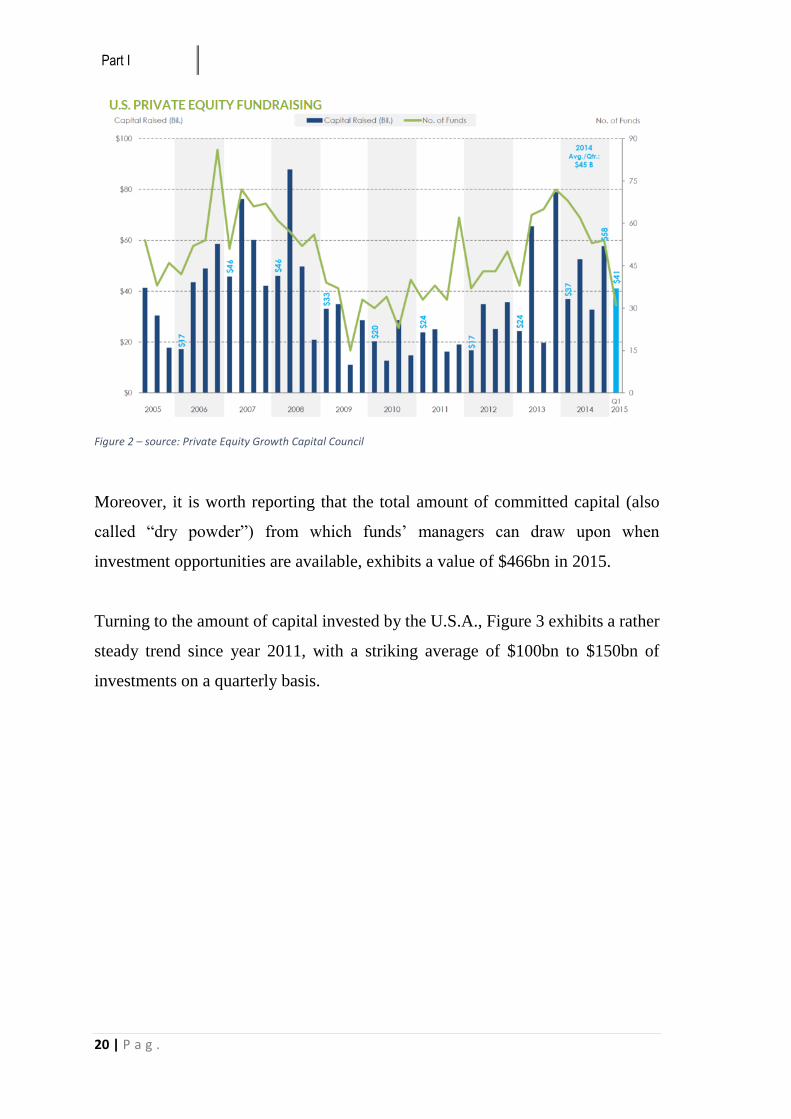
Turning to the amount of capital invested by the U.S.A., Figure 3 exhibits a rather
steady trend since year 2011, with a striking average of $100bn to $150bn of
investments on a quarterly basis.
An Overview of Private Equity
21 | P a g .
Figure 3 – source: Private Equity Growth Capital Council
Turning our attention to the second-leading worldwide market, that is, Europe, for
a general overview of what actually the leveraged buyout market is, we can draw
upon the annual PwC report8, which accurately describes the whole private equity
market across European countries. The graph of the European investment trend
over the last six years is reported below (Figure 4).
Figure 4 –EU Investments (source: Private Equity Trend Report 2015)
8 PricewaterhouseCoopers (2015), “Private Equity Trend Report 2015”, available at: https://www.pwc.lu/en/private-equity/docs/pwc-pe-private-equity-trend-report-2015.pdf (accessed December 2015)

Part I
22 | P a g .
As observable, the European buyout market is consistently smaller than its U.S.
counterpart, both for value and number of deals. Even the fundraising situation,
although not graphically shown, is reported to be gradually rising since 2009,
displaying a positive trend and meaning a progressively renewed confidence in the
private equity asset class.
Nevertheless, what strikingly emerges from both the American and the European
market’s situations is the cyclicality that distinguishes the market itself.
Specifically, as it also results from the little overview on the history of LBOs that
we provided above, the leveraged buyout’s market is characterized by cycles that
repeat again and again, and which are generally known as “boom and bust cycles”
within the industry. As we will explore in detail in next paragraphs, this cyclicality
is, among other things, due to initial above-average performances that lead to an
“overheated” market that, in turn, inexorably lead to a subsequent bust period.
Keeping our focus on the overall outlook of what the LBOs market is today, we
will now conclude by providing an overview of the most important players
worldwide. Such a market, as said earlier, is nowadays characterized by few,
global firms that are often generalist, meaning that they operate in a broad range
of financial sectors and work throughout the world, along with a greater number
of smaller firms that are usually more industry-focused and operate within specific
geographical areas. To give some insight on the size of these global firms and the
bulk of capital they manage, Table 1 provides a summary of their worldwide
relevance by ranking them on the basis of assets under management (AUM)9
globally run within their private equity business.
9 Assets Under Management (AUM) are generally referred to as the committed capital (dry powder) raised by funds plus the total unrealized value of ongoing investments.

An Overview of Private Equity
23 | P a g .
Firm Location AUM ($bn) KKR New York, USA 98.7 The Blackstone Group New York, USA 91 The Carlyle Group Washington, USA 65 TPG Capital Fort Worth, USA 60 Apollo Global Management New York, USA 38 Bain Capital Boston, USA 35
Table 1 – Worldwide biggest LBO firms classified by AUM (2015)
In order to assess the global dimension of the industry and the huge amounts
managed by any of these international firms, many authoritative rankings are
computed nowadays, one of those being the PEI 30010, which classifies the most
prominent PE firms by their last 5-year fundraising levels. Notwithstanding
different metrics are oftentimes used, what is worth pointing out is that, besides
the massive amounts of capital managed, the biggest players are all U.S.-based, as
a proof of the American market being the most active and remarkable market for
this financial industry.
10 PEI 300 is the annual ranking provided by the Private Equity International. For further information, visit https://www.privateequityinternational.com
Part I
24 | P a g .
1.3 Leveraged Buyouts at work
In this section, we will explore typical mechanics by which leveraged buyouts
actually works. As such transactions carry out their operations by means of a large
portion of debt and a smaller equity stake, we will split this section in two parts
analyzing characteristics of both parties in deals. Starting with the “equity side”,
we will provide a description of private equity Limited Partnerships and assess the
role of LPs and GPs within this legal entity, namely, to see how PE and LBO firms
manage to raise money from investors and, subsequently, how they invest it. We
will then go on to investigate the relationship intervening among parties,
examining the key features of the investors-LBO firm agreement, called LPA11.
We will finally conclude by giving a few hints on the role of debt, since a thorough
analysis will be postponed to Part II.
1.3.1 Equity side
Since LBO firms originally initiate leveraged buyout operations, these are required
to provide the equity stake within the entire financial package. Hence, a somewhat
detailed analysis of LBO firms’ main actors, internal relationships intervening
among them and how these firms generally work is going to be needed.
1.3.1.1 The main vehicle: the Private Equity Fund
So far, we have talked generally about private equity and its different variants,
providing an overview of the history of leveraged buyouts and trying to evaluate
its overall market’s size in the world. We will now take a step forward and analyze
operational mechanisms whereby private equity actually carries out its
investments.
Although these are the basics of the industry, many scholars have offered a picture
on the fundamentals of this industry, offering a view to understand how it
11 LPA stands for “Limited Partnership Agreement” and it can be referred to as the official contract laying down rights and responsibilities among parties within the Limited Partnership legal model.
An Overview of Private Equity
25 | P a g .
practically operates12. Private equity firms (and thus, LBO firms as well) raise
money by means of a fund, which typically has a fixed life of ten years, extensible
to an additional two-year period should particular investment’s conditions occur
(“ten plus two” structure). Moreover, they take the form of closed-end funds13 in
which a limited number of investors is admitted, with large portions of capital, and
are characterized by illiquidity, meaning that withdrawals are not permitted once
capital is committed to the fund.
That said, as far as the legal structure is concerned, funds are usually separate
business entities from the parent LBO firm, and in most cases they take the form
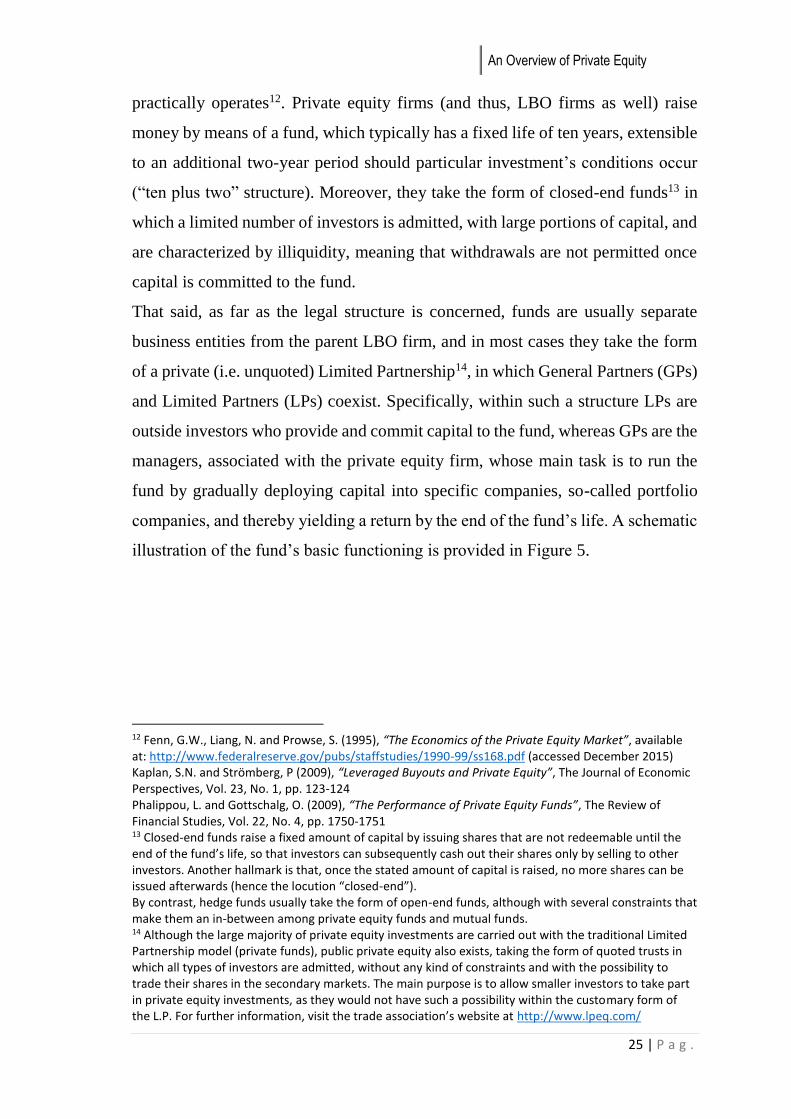
of a private (i.e. unquoted) Limited Partnership14, in which General Partners (GPs)
and Limited Partners (LPs) coexist. Specifically, within such a structure LPs are
outside investors who provide and commit capital to the fund, whereas GPs are the
managers, associated with the private equity firm, whose main task is to run the
fund by gradually deploying capital into specific companies, so-called portfolio
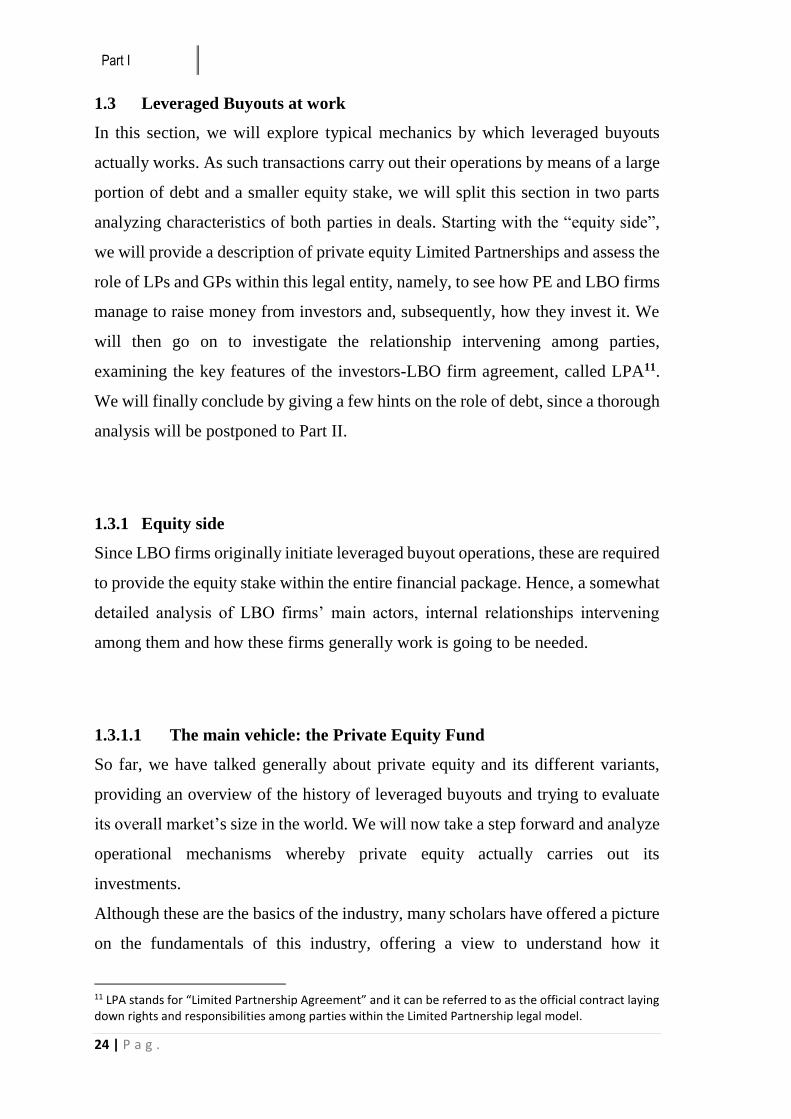
companies, and thereby yielding a return by the end of the fund’s life. A schematic
illustration of the fund’s basic functioning is provided in Figure 5.
12 Fenn, G.W., Liang, N. and Prowse, S. (1995), “The Economics of the Private Equity Market”, available at: http://www.federalreserve.gov/pubs/staffstudies/1990-99/ss168.pdf (accessed December 2015) Kaplan, S.N. and Strömberg, P (2009), “Leveraged Buyouts and Private Equity”, The Journal of Economic Perspectives, Vol. 23, No. 1, pp. 123-124 Phalippou, L. and Gottschalg, O. (2009), “The Performance of Private Equity Funds”, The Review of Financial Studies, Vol. 22, No. 4, pp. 1750-1751 13 Closed-end funds raise a fixed amount of capital by issuing shares that are not redeemable until the end of the fund’s life, so that investors can subsequently cash out their shares only by selling to other investors. Another hallmark is that, once the stated amount of capital is raised, no more shares can be issued afterwards (hence the locution “closed-end”). By contrast, hedge funds usually take the form of open-end funds, although with several constraints that make them an in-between among private equity funds and mutual funds. 14 Although the large majority of private equity investments are carried out with the traditional Limited Partnership model (private funds), public private equity also exists, taking the form of quoted trusts in which all types of investors are admitted, without any kind of constraints and with the possibility to trade their shares in the secondary markets. The main purpose is to allow smaller investors to take part in private equity investments, as they would not have such a possibility within the customary form of the L.P. For further information, visit the trade association’s website at http://www.lpeq.com/
Part I
26 | P a g .
Figure 5 – Private Equity fund’s mechanics
Being that a general and somewhat simplified picture of a typical private equity
fund’s structure, commonly valid for all investments’ stages, within the leveraged
buyout sector things are usually more complicated, as banks and other providers
of debt must be considered. In particular, debt financing is strictly alongside equity
financing (i.e. the private equity fund), where the latter typically holds a littler part.
In addition, unlike other private equity’s investments, in leveraged buyouts’
transactions the fund does not directly invest in portfolio’s companies: rather, it
creates a special purpose vehicle15 at first, in which financial resource stemming
from both equity (the fund) and debt (banks and other lenders) will flow, in order
to acquire the total control, or at least the majority of the target’s stakes.
1.3.1.2 What are GPs and LPs
Notwithstanding GPs and LPs have already been introduced in the previous
paragraph, we will now provide a more detailed profile of such figures within the
fund’s perspective.
15 In LBOs, a Special Purpose Vehicle (SPV), also called Newco, is a legal entity created by the parent firm with the specific aim of buying out a company. Nevertheless, still within the LBO context, SPVs are widely used for other purposes as well, such as separating high-risk projects from the firm, and in financial engineering and securitization’s operations carried out by banks, as we will see in next sections.
Private Equity Fund (L.P.)
General Partner (GP) Limited Partners (LPs)
Company A Company B Company C Company D
= Management
= Investment

An Overview of Private Equity
27 | P a g .
GPs, or the General Partners, are the managers entitled to raise and then run the
fund on behalf of investors, aiming at obtaining a profit to be subsequently
delivered to them. In particular, being GPs are a group of managers within the LBO
firm, legally speaking the latter can be considered as the sole, broad General
Partner. Hence, typical GPs in an LBO transaction are firms like Blackstone, KKR
or Apollo Global Management, which firstly raise money for the fund and then
manage it in order to have a positive return for investors.
Turning to LPs, Limited Partners are simply the investors who provide capital to
the fund. Specifically, once they commit a given amount of capital to the fund that
will be run by the GPs, neither they are allowed to call back any part of the capital
committed until the end of the fund’s life, since the fund is illiquid by nature, nor
they have any possibility to interfere in the investment process.
However, although LPs are all encompassed within such a broad category,
investors’ classes are very different one another, each of them having different
strategies and purposes for investing in private equity. Meaningful research has
hitherto been done relating to this issue, so that nowadays both different classes of
investors and the sets of objectives they aim to pursue are clear enough to
categorize LPs within distinct groups.
Hence, we will start by giving some insight on what are the typical objectives that
characterize various investors, thereby shedding light on reasons why they actually
allocate their money into private equity; then, we will provide a brief overview of
each type of investor separately, highlighting the categories that are more active in
the leveraged buyout sector as well. In particular, on the basis of the objectives set
out by different kinds of investors, we may classify16:
16 Such a classification was originally made by the WEF; see World Economic Forum (2015), Alternative Investments 2020 – An Introduction to Alternative Investments, available at: http://www3.weforum.org/docs/WEF_Alternative_Investments_2020_An_Introduction_to_AI.pdf (accessed December 2015), pp. 18-20; Consistently with the WEF, see also BVCA: BVCA (2015), Examining Private Equity's Place In investors' Portfolio, available at: http://www.bvca.co.uk/Portals/0/library/documents/Guide%20to%20Private%20Equity's%20Place/BVCA%20Guide%20to%20Examining%20Private%20Equity%E2%80%99s%20Place%20in%20Investors%E2%80%99%20Portfolios.pdf (accessed December 2015), pp. 6-7
Part I
28 | P a g .
Long-term sight, which encompasses investors whose main purpose is to
increase their capital over a very long-term horizon, usually more than 15-
20 years. Within the private equity scope, they are allured by above-average
returns, partly due to the illiquidity premium;
Liability driven, when investors’ main objective is to accrue their capital
over a long-term horizon, but they have to deal with regular outflows of
cash on a short-term basis, thus they appreciate both the higher returns and
the possibility of steady cash flows provided by such investments;
Diversification driven, when investors mainly aim at diversifying their
portfolio as a reason to invest in private equity.
Being these the most frequent reasons for investing in the overall private equity’s
asset class, we will now turn to concentrate on various investors’ categories,
focusing on which are most involved in leveraged buyouts, specifically.
Both academics17 and practitioners’ trade associations have so far made a great
deal of research with regard to this issue, thus we will draw on such findings as a
whole in outlining what kind of investors are more attracted by LBOs within the
private equity industry. In particular, we can distinguish:
Pension funds, whether they are public or private (corporate pension funds),
are amongst the most influential and active actors within the whole LP
category, as they have heavily invested in private equity since its inception
in the early 1980s, backing it with increasingly higher quotas of capital.
They have solely financial purposes, aiming at high returns to grow their
capital over time;
17 Fenn, G.W., Liang, N. and Prowse, S. (1995), “The Economics of the Private Equity Market”, available at: http://www.federalreserve.gov/pubs/staffstudies/1990-99/ss168.pdf (accessed December 2015), pp. 45-51 Lerner, J., Schoar, A. and Wongsunwai, W. (2007), “Smart Institutions, Foolish Choices: the Limited Partner Performance Puzzle”, Journal of Finance, Vol. 62, No. 2

An Overview of Private Equity
29 | P a g .
Sovereign wealth funds18, which are funds managed on behalf of public
institutions, have shown a rising interest in private equity activities, and
nowadays they hold a large part of the total fund’s shares;
Financial institutions, broad category encompassing commercial and
investment banks, advisors, insurance companies, and asset managers,
whose aims can vary from higher returns to diversification purposes;
Endowments and foundations, although somewhat more active in the
venture capital sector, represent a rather large fraction of the total capital
raised;
Family offices and high-net worth individuals (wealth management)19,
though they were relevant investors of private equity, their importance have
decreased over years, overwhelmed by the impressive amounts of capital
committed by pension funds; however, on a relative basis, they allocate the
highest percentage of their total portfolio in private equity, compared to
other investors. They are mainly allured by above-average yields, even
though they have diversification purposes as well;
Funds of funds, which are mainly used by investors who do not want to
directly invest into PE funds, especially because they want to mitigate risk
associated with such investments. They have a strong relevance within the
total fund, with sharing similar to that of sovereign wealth funds.
Others, a residual category that comprises less relevant types of private
equity investors who allocate trifling shares of capital over the total
fundraising process. These include corporate investors and academic
institutions.
A summary of various LPs’ classes linked to their main investment’s philosophy
is provided in Table 2.
18 A sovereign wealth fund, as perceivable from the expression itself, is a fund raised with excess financial resources of a government, and managed on behalf of it. These funds are usually common in countries in which there is abundance of scarce resources, such as oil and gold. 19 A family office is typically an advisory firm that deals with wealth management, where main clients are high-net worth individuals who want tailor-made investment solutions for their capital, in order to accrue its value over years. Family offices are similar, but not equal to asset managers.
Part I
30 | P a g .
Investment’s philosophy
Main objectives Investors (LPs)
Long-term sight I. High returns (accrue capital over time)
o Sovereign funds o Endowments and
foundations o Wealth
management Liability driven I. High returns
II. Steady cash flows o Pension funds
Diversification driven I. Diversification II. High returns
o Financial institutions (such as banks and advisors)
Table 2 – source: World Economic Forum
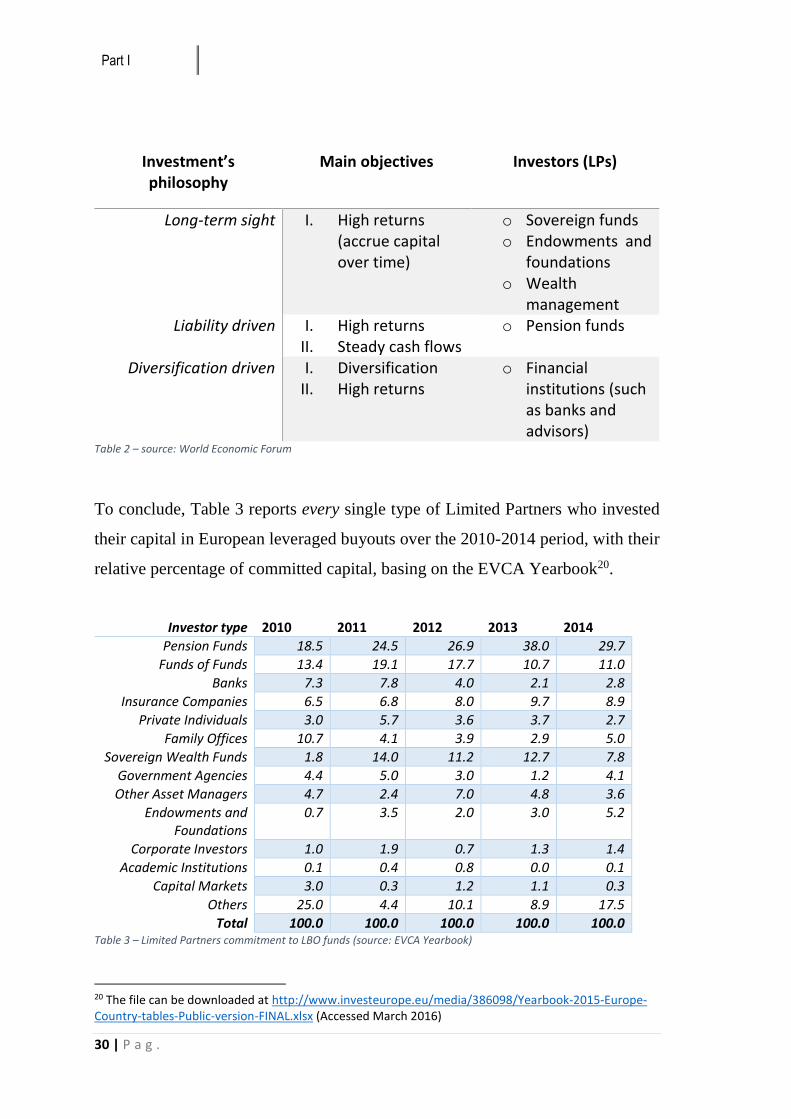
To conclude, Table 3 reports every single type of Limited Partners who invested
their capital in European leveraged buyouts over the 2010-2014 period, with their
relative percentage of committed capital, basing on the EVCA Yearbook20.
Investor type 2010 2011 2012 2013 2014
Pension Funds 18.5 24.5 26.9 38.0 29.7
Funds of Funds 13.4 19.1 17.7 10.7 11.0
Banks 7.3 7.8 4.0 2.1 2.8
Insurance Companies 6.5 6.8 8.0 9.7 8.9
Private Individuals 3.0 5.7 3.6 3.7 2.7
Family Offices 10.7 4.1 3.9 2.9 5.0
Sovereign Wealth Funds 1.8 14.0 11.2 12.7 7.8
Government Agencies 4.4 5.0 3.0 1.2 4.1
Other Asset Managers 4.7 2.4 7.0 4.8 3.6
Endowments and Foundations
0.7 3.5 2.0 3.0 5.2
Corporate Investors 1.0 1.9 0.7 1.3 1.4
Academic Institutions 0.1 0.4 0.8 0.0 0.1
Capital Markets 3.0 0.3 1.2 1.1 0.3
Others 25.0 4.4 10.1 8.9 17.5
Total 100.0 100.0 100.0 100.0 100.0 Table 3 – Limited Partners commitment to LBO funds (source: EVCA Yearbook)
20 The file can be downloaded at http://www.investeurope.eu/media/386098/Yearbook-2015-Europe-Country-tables-Public-version-FINAL.xlsx (Accessed March 2016)
An Overview of Private Equity
31 | P a g .
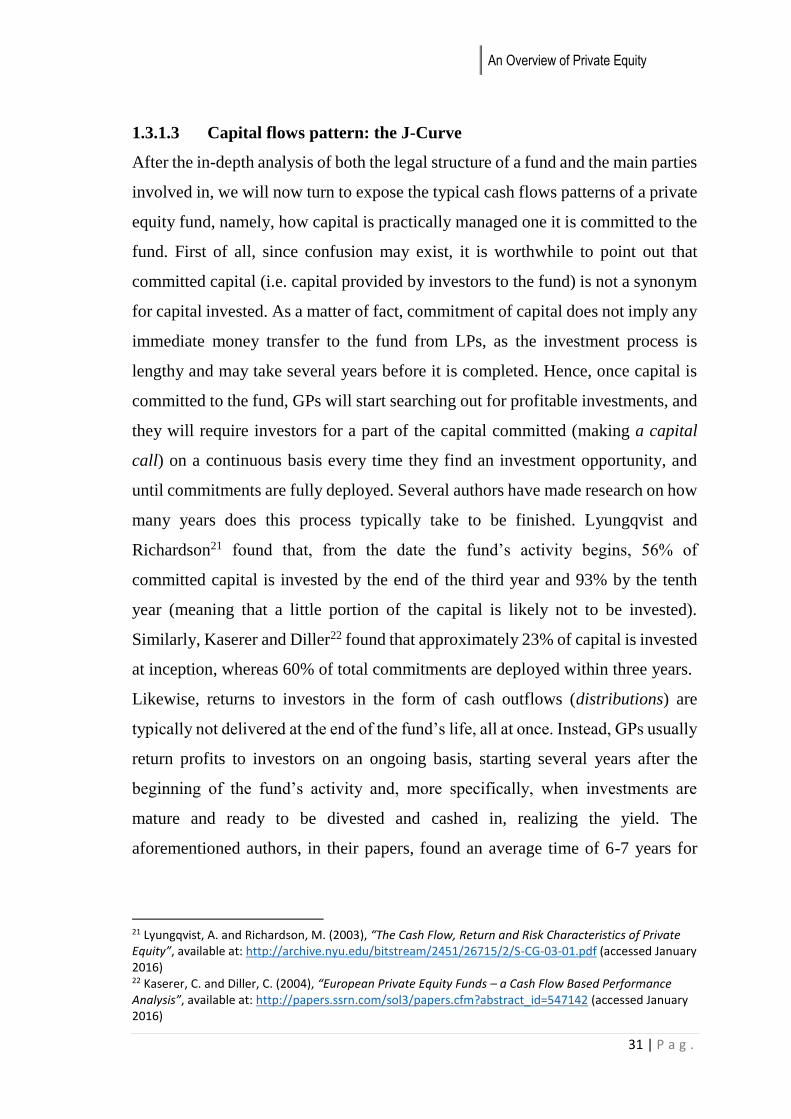
1.3.1.3 Capital flows pattern: the J-Curve
After the in-depth analysis of both the legal structure of a fund and the main parties
involved in, we will now turn to expose the typical cash flows patterns of a private
equity fund, namely, how capital is practically managed one it is committed to the
fund. First of all, since confusion may exist, it is worthwhile to point out that
committed capital (i.e. capital provided by investors to the fund) is not a synonym
for capital invested. As a matter of fact, commitment of capital does not imply any
immediate money transfer to the fund from LPs, as the investment process is
lengthy and may take several years before it is completed. Hence, once capital is
committed to the fund, GPs will start searching out for profitable investments, and
they will require investors for a part of the capital committed (making a capital
call) on a continuous basis every time they find an investment opportunity, and
until commitments are fully deployed. Several authors have made research on how
many years does this process typically take to be finished. Lyungqvist and
Richardson21 found that, from the date the fund’s activity begins, 56% of
committed capital is invested by the end of the third year and 93% by the tenth
year (meaning that a little portion of the capital is likely not to be invested).
Similarly, Kaserer and Diller22 found that approximately 23% of capital is invested
at inception, whereas 60% of total commitments are deployed within three years.
Likewise, returns to investors in the form of cash outflows (distributions) are
typically not delivered at the end of the fund’s life, all at once. Instead, GPs usually
return profits to investors on an ongoing basis, starting several years after the
beginning of the fund’s activity and, more specifically, when investments are
mature and ready to be divested and cashed in, realizing the yield. The
aforementioned authors, in their papers, found an average time of 6-7 years for
21 Lyungqvist, A. and Richardson, M. (2003), “The Cash Flow, Return and Risk Characteristics of Private Equity”, available at: http://archive.nyu.edu/bitstream/2451/26715/2/S-CG-03-01.pdf (accessed January 2016) 22 Kaserer, C. and Diller, C. (2004), “European Private Equity Funds – a Cash Flow Based Performance Analysis”, available at: http://papers.ssrn.com/sol3/papers.cfm?abstract_id=547142 (accessed January 2016)
Part I
32 | P a g .
returns to be accrued and subsequently delivered to investors, since the fund starts
its activity.
That said, it is simply comprehensible that movements between capital inflows
(i.e. capital calls) and capital outflows (i.e. distributions) are graphically
representable as in Figure 7.
Figure 6 – the J-Curve representation for capital movements
One caveat that must be kept in mind relates to the fact that, although the J-Curve
can usefully represent the model whereby capital flows occur in and out of the
fund, it must not be mixed up with the performance-related J-Curve (which
describes the IRR generation over the fund’s life) that will be analyzed in next
paragraphs.
1.3.1.4 GP-LPs contract (LPA): fees and “distribution waterfall”
Fees are one of the most prominent parts within the contractual relationship
intervening between the GP and LPs, since they represent the reward due to the
General Partner (i.e. the LBO firm) as the manager of the fund. Overall, there exist
two main categories of fees (management fees and carried interest) that are
typically embedded in all private equity’s contracts; nonetheless, other less
-60
-40
-20
0
20
40
60
80
1 2 3 4 5 6 7 8 9 10 11 12Cap
ital
flo
ws
Fund's life (years)
J-Curve representation (Capital in/outflows)
Capital calls Distributions J-Curve (capital)
An Overview of Private Equity
33 | P a g .
common types also exist, and we will only refer to the most relevant ones in a
leveraged buyout’s scope.
Broadly speaking, the large majority of existing funds have adopted and still adopt
the so-called 2/20/1 structure, where “2” is the percentage usually requested on an
annual basis for management fees, “20” is the typical percentage of carried interest
and “1” is the percentage share held by the GP in the total fund’s capital23.
Management Fees
As one of the two aforementioned primary fees, management fee are fixed fees
that LPs have to pay out to the GP every year of the fund’s life, and they can be
calculated on either committed capital or net-invested capital, depending on the
contractual terms. This kind of fee is meant to cover the operational costs of
managing the fund, as well as to pay salaries of the GP’s partners. Although the
most common management fees’ percentages are fixed at an average of 2%,
several structures can be set out (in ascending order of sophistication):
a) A constant percentage of the committed capital (e.g. 2%) to be maintained
for the whole life of the fund;
b) A “decreasing fee” schedule, in which the initial percentage set out gets
gradually reduced (e.g. by 25 basis points each year), either on an
immediate basis or after a certain period of time;
c) A constant percentage over the entire life’s fund but with a switch from the
basis upon which fees are calculated (usually from committed to invested
capital);
23 The following analysis draws on the works of authoritative scholars, revisited accurately: Metrick, A., and Yasuda, A. (2010), “The Economics of Private Equity”, Review of Financial Studies, Vol. 23, No. 6 Robinson, D.T. and Sensoy, B.A. (2013), “Do Private Equity Managers Earn Their Fees? Compensation, Ownership and Cash Flow Performance”, Review of Financial Studies, Vol. 26, No. 11 Gilligan, J. and Wright, M. (2014), “Private Equity Demystified – an explanatory guide”, ICAEW Corporate Finance Faculty, London (UK)
Part I
34 | P a g .
d) A decreasing fee schedule with switch in the calculation basis, in which a
gradually lower percentage is set out, associated with a shift from
committed to net-invested capital.
It is worth observing that, holding everything else equal, more complex structures
are usually associated with lower costs for investors, both because of the
decreasing percentages applied and because the net-invested capital basis is
smaller than its counterpart. Moreover, as easily perceivable, more complex
models are generally applied by larger funds, that can afford worse conditions on
a relative basis, relying on their size to accrue impressively higher amounts on an
absolute basis.
However, their fixed nature makes them unrelated to performance, and what is
more, they are found to be increasing when market’s conditions and fundraising
processes are favorable, gradually substituting variable fees as funds get larger24.
In other words, management fees may be considered as a risk-free return for GPs,
which cash them whether they yield profits for investors or they make miserable
investments that lead to losses, and such an issue is nowadays matter of debate
among scholars, considering it one of the agency costs intervening in the GP-LPs
relationship that is reported below.
Carried Interest
Carried interest, also called “carry” or “performance fee”, is the second inevitable
fee findable in any fund’s contract. As opposed to its fixed counterpart, carried
interest is a performance-based variable fee, which takes the form of a percentage
to be retained by GPs over profits consequently to successful divestments (exits).
24 Notwithstanding the fact that management fees rise along with funds’ size, the authors (Robinson and Sensoy) argue that net-of-fees performance is not affected by such additional costs, meaning that performances of larger funds more than compensate the fee’s increase. According to the authors, who support an efficient bargaining thesis between GPs and LPs, this is due to the capability of GPs to exploit favorable opportunities and their superior skills and expertise that permit them to outperform. These findings are in stark contrast to the situation in mutual funds, in which net-of-fees performance are strongly and negatively related to increases in management fees.

An Overview of Private Equity
35 | P a g .
Hence, GPs will start to collect these fees only several years on to the date the fund
began its activity.
In particular, every time the GP exits one or more investments, it will compute the
realized profit over the basis set out in the LPA (as usual, either committed capital
or net-invested capital), setting aside its carried interest’s percentage (in most cases
20%) and paying back the remainder to investors as their own yield. We have to
point out that, reasonably, this is a somewhat simplified explanation as in practice
things are far more complicated: we are mainly referring to the “distribution
waterfall” that will be comprehensively analyzed subsequently in this section.
As mentioned above, being carried interest a variable fee, GPs tend to substitute it
with fixed management fees as funds grow in size, thus showing severe
predilection for a secure fixed-income in place of performance-based rewards.
Nevertheless, in their paper Robinson and Sensoy argued that larger funds are the
most likely to witness the highest carried interest, implying that both skilled GPs
manage to raise higher funds and they are more willing to link their remuneration
to performance, as they are confident of their expertise and abilities. Indeed, unlike
management fees, carried interest are positively related to performance, meaning
that the higher the performance GPs expect to realize, the higher the carried interest
that they will charge to investors.
Other fees
Being management fees and carried interest the most common fees charged to
investors in any contract across every subsector of the private equity industry, we
will now turn to signal another two fees that, conversely, are mainly used within
the buyout sector, namely, transaction fee and monitoring fees. The main
hallmarks characterizing them, as opposed to the most common fees, are that they
are charged to portfolio’s companies rather than investors, and they are
subsequently shared between GP and LPs.
A transaction fee is a one-time fee that private equity (LBO) firms charge to a
company when buying it. Technically speaking, the LBO firm actually charge such
a fee to its SPV, which is aimed at purchasing the portfolio’s company, when it
Part I
36 | P a g .
buys out the target, and it is commonly encompassed within the purchase’s price.
The rationale of the transaction fee is to cover unspecified financial advisory costs
borne by the GP in completing the deal, and it usually ranges from 1% to 2% of
the total transaction value. By nature, the transactions fee can be deemed as a fixed
fee.
By contrast, monitoring fees are charged on a yearly basis because of time and
effort spent by the GP in controlling its investment. They are performance-based
fees, as they are calculated as a percentage over EBITDA value, swinging between
1% and 5% of such an economic measure. This wide range hinges on companies’
size: generally, the smaller the target, the higher the EBITDA’s percentage applied,
and vice versa.
The “distribution waterfall”
The distribution waterfall, as the name itself suggests, is the arrangement set out
within the contract whereby the GP and LPs decide to distribute capital when
investments are gradually exited: in other words, it is the agreement included in
the LPA laying down how capital must be returned to the parties (GP-LPs) when
exiting various investments. As easily perceivable, this process involves the GP’s
ownership stake proceeds and carried interest distributions, whereas it does not
consider management fees as they are retained on an annual basis and are unrelated
to profits. An important caveat is related to the fact that two different versions
actually exist: the European (“whole fund”) and the American (“deal-by-deal”)
distribution waterfalls. For the purposes of this work, we will not investigate
nuances of both types, but we will consider solely the typical structure of the
European variant. Indeed, it is the most preferred from an investor perspective
since it benefits LPs more than the other, and as a result, it has been outclassing
the American version in recent times, becoming the predominant type25.
25 The “deal-by-deal” American waterfall considers each investment separately from others; in so doing, the GP is advantaged in gaining profits earlier (investments’ losses do not have to be offset by higher returns in other profitable investments!), and LPs are thus impaired. Being things so, a claw-back provision is often included within the agreement. By contrast, the European waterfall considers all investments in a fund perspective, therefore being fairer for investors.
An Overview of Private Equity
37 | P a g .
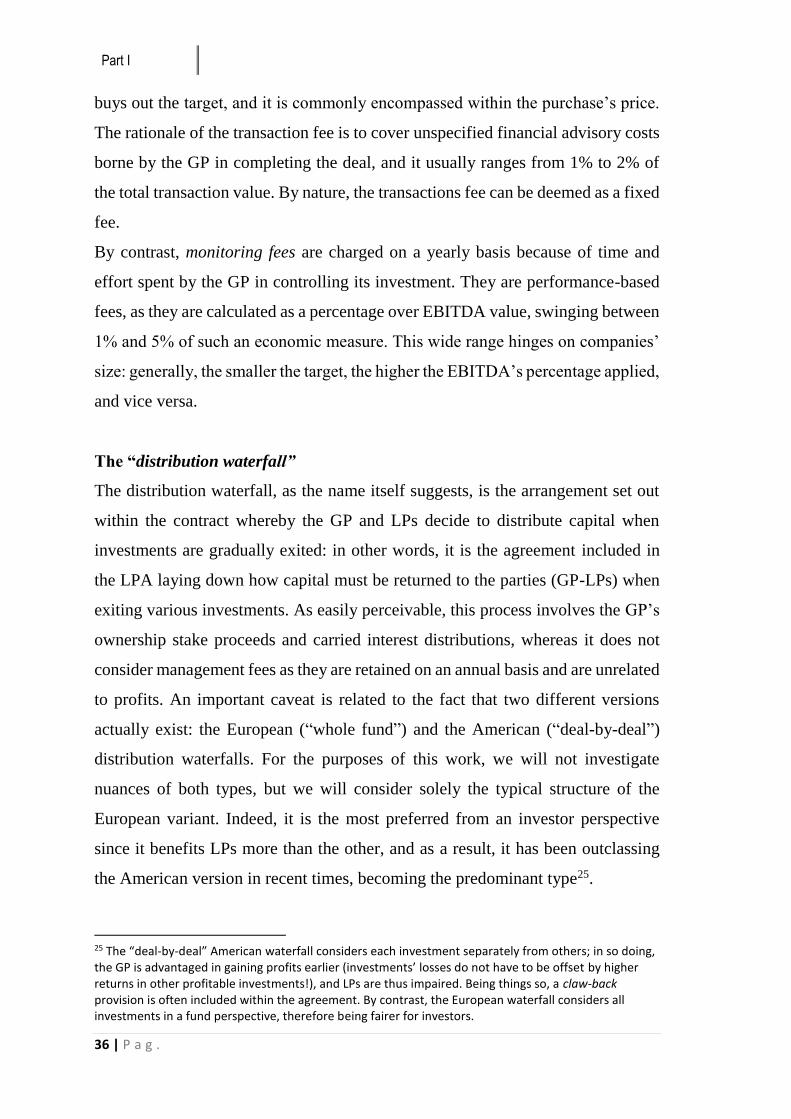
Specifically, the distribution waterfall is a four-phase process that starts
concurrently with companies’ divestments, in which each phase must be fulfilled
before the next enters into practice26:
I. Recovery phase: in this phase, all proceeds need to be returned to investors
until the whole committed capital’s amount initially raised is reached;
II. Hurdle phase: once committed capital is totally returned, investors are
entitled to receive, with priority, a preferred return (hurdle rate) that is
typically set out at 8% of realized profits, before the GP can cash in any
return27;
III. Catch-up phase: after yielding a common 8% preferred return to investors,
the GP can now receive its first carried interest quota. In particular, the
agreement entitles the GP to get any subsequent capital distribution until a
20%-profit over the 100%28 of the total preferred return received by
investors in advance;
IV. Carried interest phase: after the catch-up provision is wholly fulfilled, all
of the subsequent proceeds will be equally distributed on a (typical) 80-20
basis (80% to LPs, 20% to GP).
26 A “phase zero” may be referred to as ongoing incomes flowing to the GP as a consequence of its 1% stake into the fund. 27 Multi-hurdle waterfalls are also possible, by setting up several hurdle rates in which different percentages are allocated respectively to the GP and LPs. 28 Slightly lower quotas are often applied, such as 80% of the preferred return received by investors.
Figure 7 – the distribution waterfall at a glance HURDLE RATE
COMMITTED CAPITAL
REPAYMENT (phase 1)
PREFERRED RETURN
(phase 2)
CATCH-UP
PERIOD (phase 3)
CARRIED INTEREST TO LPs (80%)
GP STAKE’S
INCOMES AND TO GP (20%) (phase 4)
= distributions to GP
= distributions to LPs
Part I
38 | P a g .
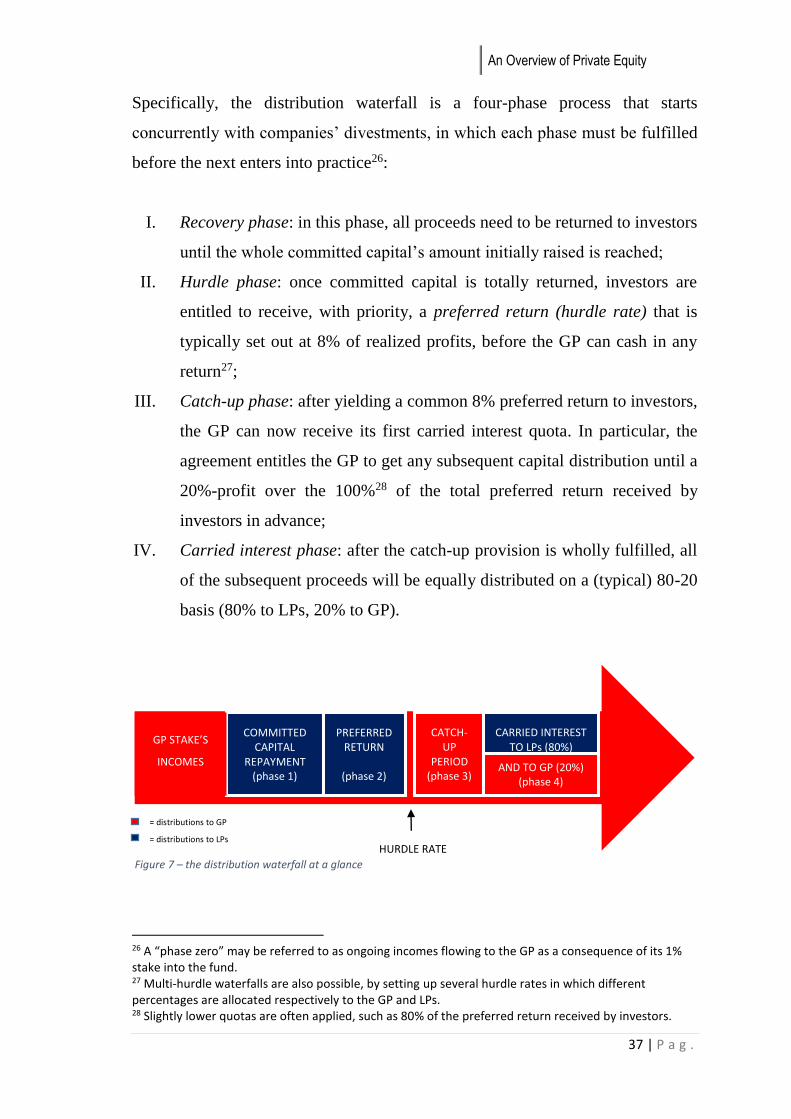
Figure 8 illustrates a typical distribution waterfall, including preliminary and
proceeding incomes (such as dividends) due to the GP as a shareholder of the fund,
and it goes on describing typical phases of the process as they occur.
1.3.1.5 GP-LPs agency costs
Notwithstanding the Agency Theory and its implications will be better explained
in next paragraphs when talking about the principal-agent relationship between the
LBO firm (by means of the fund) and portfolio companies, there is here a need to
make some hints on the parallel principal-agent relationship between GPs and LPs.
Figure 9 tries to exemplify this twofold issue.
Herein, we will restrict the context to the first issue, outlining possible agency costs
stemming from the contract between the GP and LPs (1), and postponing a
comprehensive analysis of agency problems with portfolio companies (2) in
subsequent sections.
However, before going on to address the problem, a brief explanation is going to
be needed. In essence, agency theory can be referred to as the relationship
intervening between the principal (typically shareholders) and the agent (mostly
executives and the top management team). In particular, the principal is the party
who engages the agent to provide a service on its behalf, yet the latter has an
incentive to undertake somewhat risky actions that are not in the principal’s
Agency problems (2)
Agency problems (1)
Fund
LPs Portfolio companies
GP
Figure 8 – Agency Theory issues in private equity

An Overview of Private Equity
39 | P a g .
interest. Hence, such a theory analyzes both problems and feasible solutions to this
matter.
Within a GP-LPs perspective, agency frictions that have been detected refer to29:
i. The catch-up provision set out in the LPA as part of the distribution
waterfall. Indeed, once the hurdle rate is reached and the preferred return
has wholly been delivered to investors, the GP might have more of an
incentive to accelerate distributions, as subsequent returns will be fully
retained until the catch-up phase is fulfilled.
ii. The basis upon which fees are calculated. In fact, more and more GPs tend
nowadays to switch from a “committed capital basis” to a “net-invested
capital basis”, since it is more favorable for investors, but it entails some
downsides as well. In particular, a net-invested capital basis might coax GPs
into keeping so-called “zombie investments”, namely, investments that have
low or no return at all, but preserved only with the aim of not reducing the
calculation basis and, thereby, fees.
iii. Rising management fees as funds grow their size. As previously analyzed
when describing fees, we reported a tendency to heighten fixed-income fees
in connection with larger funds raised. This may be seen as an ever poorer
incentive for the GP to outperform, as fixed fees are unrelated to
performance and the fund’s managers might be more prone to relax,
impairing investors interests.
iv. The low ownership stake of the GP into the fund. Given a typical 1% share
of the overall fund’s capital, many scholars have raised the question of
whether such a tiny percentage may not be sufficient to spur fund’s
managers into maximizing value30.
29 For a further analysis of these agency frictions, see Robinson, D.T. and Sensoy, B.A. (2013), “Do Private Equity Managers Earn Their Fees? Compensation, Ownership and Cash Flow Performance”, Review of Financial Studies, Vol. 26, No. 11 30 As regards iii. and iv., Robinson and Sensoy found no evidence of poorer performance due to the rise of fixed-income fees or to a low stake. Yet, other authors have provided different results in their papers and the issue is still matter of debate among scholars.
Part I
40 | P a g .
1.3.2 Debt side (hints)
Debt is the largest part of the overall financial package in a leveraged buyout
transaction, and as we will see in following paragraphs, it is an essential driver for
creating value. Its incidence covers 60 to 90 percent of the whole target’s value,
and its composition and evolution, as well as in-depth analysis of financial
instruments used and the ever-stronger usage of derivatives deserve a special
consideration in a separated part of this work. For this reason, we will set aside
and appropriately discuss debt in Part II.
1.4 Sources of Value Creation in LBOs and Role of Financial levers
In this section, we will shed light on typical sources of value creation in leveraged
buyouts, relying on past and more recent literature that has dealt with this matter.
It is important to note that, even though we will address value creation on a
portfolio company perspective in this section, it is necessary as it is closely tied to
consequent performances subsequently delivered to investors (LPs) and analyzed
in following paragraphs. In particular, we will begin by observing the most
common factors that allowed the origination of the LBO phenomenon, and we will
go on to extrapolate from the most authoritative academic works what are the
typical levers on which LBOs have relied on to achieve value creation, as well as
their adjustment over time. After that, we will specifically concentrate on finance
as a source of value creation, introducing a cost-benefit analysis of debt based on
a thorough review of existent literature and related to both corporate governance
and merely financial aspects. Finally, we will conclude by revising the traditional
value-creation model formerly seen analyzing how sources, and specifically
finance-related drivers, have evolved over years, in order to have the most up-to-
date model that best fits current times.
1.4.1 Preliminary: agency theory aspects and “perfect targets” for LBOs
Before illustrating what are the classic drivers leading to value creation according
to academic research, it is worthwhile to briefly report what factors most implied
An Overview of Private Equity
41 | P a g .
the emergence of leveraged buyouts in the early 1980s, symptoms of strong
inefficiencies on which LBOs heavily relied on to create value.
To begin with, we have to mention the agency theory and its implications over
public firms. Such a theory, first developed by Jensen and Meckling31, emerged as
a consequence of both an unrelenting growth of companies size and an increasingly
higher level of dispersion in capital ownership. As already anticipated in prior
sections, the author define an agency relationship as a contract between one party
(the principal) delegating another party (the agent) to practically perform a service
on the first’s behalf. Yet, both parties aim at maximizing their own interests and
this leads the agent to act in his own interest rather than in the principal’s, thereby
creating misalignment of interests that generate so-called agency costs32. And that
is what we are getting at: public corporations in the early 1980s suffered
tremendous agency costs, as stockholders (the principals) used to hold minuscule
stakes whereas executives and the management team (the agents) were
substantially free to almost act in their exclusive interest, with detrimental effects
for the overall value of the company. In subsequent papers33, Jensen defines the
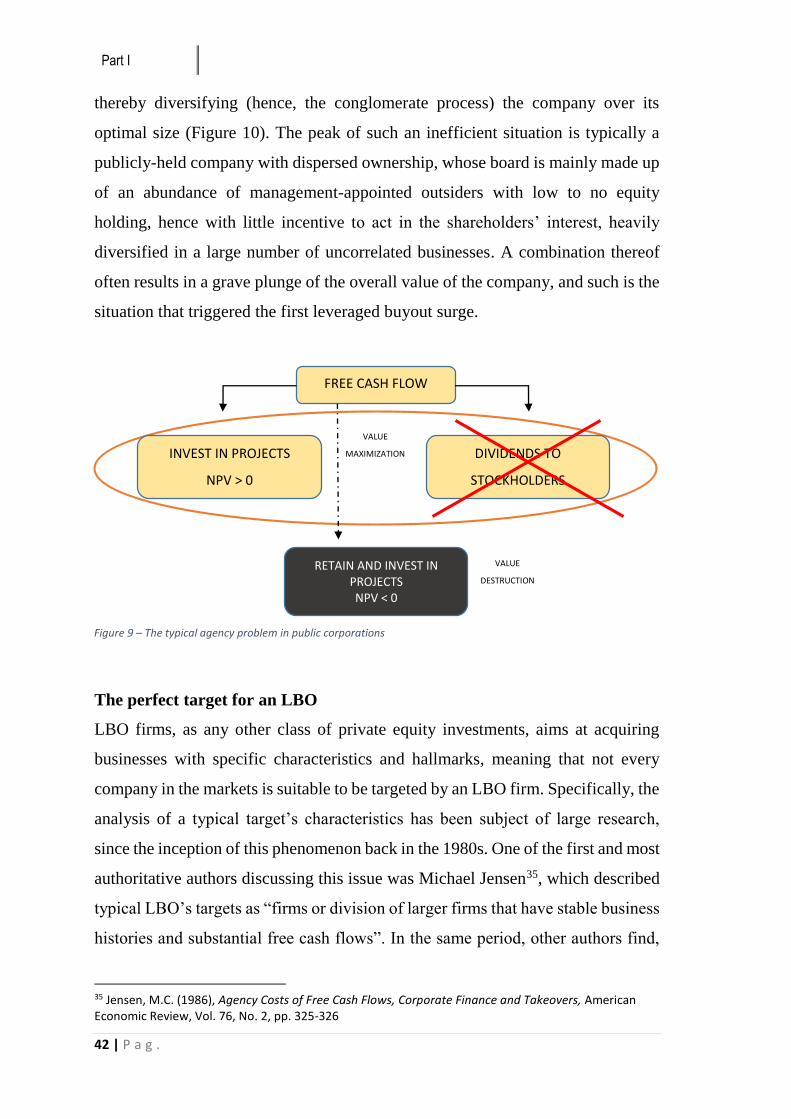
agency problem within the public corporation in terms of free cash flows34 run by
the management team. Indeed, managers have to face the choice of either investing
free cash flows in positive net-value projects or paying it off to stockholders by
way of dividends when no such project is available, in order to maximize value for
investors. Nonetheless, the author argues that the management team shows a
preference for retaining free cash flow in any case, as it gives them major power
over stakeholders, mainly stockholders and debt lenders, even though no positive
net-value project is available on the market. Rather than distributing cash flows to
investors, managers are more prone to overinvest it in non-profitable investments
31 Jensen, M.C. and Meckling, W.H. (1976), “Theory of the Firm: Managerial Behavior, Agency Costs and Ownership Structure”, available at: http://www.sfu.ca/~wainwrig/Econ400/jensen-meckling.pdf (accessed December 2015) 32 With no need for an in-depth analysis for the purposes of this work, agency costs comprise three main categories, namely monitoring costs, bonding costs and residual loss. 33 Jensen, M.C. (1986), “Agency Costs of Free Cash Flow, Corporate Finance and Takeovers”, American Economic Review, Vol. 76, No. 2 Jensen, M.C. (1989), “Eclipse of the Public Corporation”, Harvard Business Review, Vol. 67, No. 5 34 Free cash flow is defined as “cash flow in excess of that required to fund all investment projects with positive Net Present Value when discounted at the relevant cost of capital”.
Part I
42 | P a g .
thereby diversifying (hence, the conglomerate process) the company over its
optimal size (Figure 10). The peak of such an inefficient situation is typically a
publicly-held company with dispersed ownership, whose board is mainly made up
of an abundance of management-appointed outsiders with low to no equity
holding, hence with little incentive to act in the shareholders’ interest, heavily
diversified in a large number of uncorrelated businesses. A combination thereof
often results in a grave plunge of the overall value of the company, and such is the
situation that triggered the first leveraged buyout surge.
The perfect target for an LBO
LBO firms, as any other class of private equity investments, aims at acquiring
businesses with specific characteristics and hallmarks, meaning that not every
company in the markets is suitable to be targeted by an LBO firm. Specifically, the
analysis of a typical target’s characteristics has been subject of large research,
since the inception of this phenomenon back in the 1980s. One of the first and most
authoritative authors discussing this issue was Michael Jensen35, which described
typical LBO’s targets as “firms or division of larger firms that have stable business
histories and substantial free cash flows”. In the same period, other authors find,
35 Jensen, M.C. (1986), Agency Costs of Free Cash Flows, Corporate Finance and Takeovers, American Economic Review, Vol. 76, No. 2, pp. 325-326
Figure 9 – The typical agency problem in public corporations
FREE CASH FLOW
INVEST IN PROJECTS
NPV > 0
RETAIN AND INVEST IN PROJECTS NPV < 0
DIVIDENDS TO
STOCKHOLDERS
VALUE
MAXIMIZATION
VALUE
DESTRUCTION
An Overview of Private Equity
43 | P a g .
consistently with Jensen, similar results: Smith36 argues that companies with
strong, noncyclical and stable cash flows, an established product, with minimal
requirements for capital expenditures and R&D expenses, as well as significant
unused borrowing capacity are the most eligible candidates to be targeted for an
LBO operation. Similarly, Singh37 finds out several hallmarks frequently detected
in MBOs: these include high levels of liquidity (that is, meaningful free cash
flows), low levels of receivables (as a proof of the company’s ability to exact its
payments) and prior attempts of takeovers. Again, Maupin38 investigates
characteristics of many ex-publicly held companies in the year before their going
private, using a detailed framework based on a set of key variables: her findings
suggest that, among other things, companies that underwent an MBO operation
used to exhibit higher cash flows, more significant percentages of stakes held by
management, and lower price/earnings and price/book value multiples, meaning
that they were underestimated in relation to competitors.
The strong similarity of such results leads to the conclusion that, overall, potential
candidates for LBO firms in the first decade of their growing popularity were high-
liquidity generator companies (both public – so-called public-to-private
transactions – and private), with stable and non-cyclical cash flows operating in
mature industries, exhibiting markets undervaluation and which endured prior
takeover’s attempts. In particular, the strong focus on cash flows and liquidity
implies that, all other things being equal, companies operating in dynamic sectors
and with high potential for growth were completely avoided. This stems from the
fact that – as claimed by many academics and practitioners nowadays – in the
1980s, LBO firms were mainly searching out for badly managed companies due
to poor management skills, and when detected, they took them over to create value
by improving efficiency and enhancing operating profits.
36 Smith, A. (1990), The Effects of Leveraged Buyouts, Business Economics, Vol. 25, No. 2, pp. 19-20 37 Singh, H. (1990), Management Buyouts: Distinguishing Characteristics and Operating Changes prior to Public Offering, Strategic Management Journal, Vol. 11, No. 4, pp. 125-127 38 Maupin, R.J. (1987), Financial and Stock Market Variables as Predictors of Management Buyouts, Strategic Management Journal, Vol. 8, No. 4
Part I
44 | P a g .
Nevertheless, some things changed in the 1990s – that is, after the markets’ fall
took place – as LBO firms became more cautious and varied their target aims.
Specifically, as in a recent debate emerged39, they started putting major focus on
growth potential, aiming at companies that, rather than showing high liquidity
capacity, operated in highly-changing industries and had high opportunities for
catching significant market shares. In other words, LBO firms added their interest
to growth, besides cash flow and efficiency: not only did such a new way of
thinking imply the drafting of a specific business plan based on medium to long-
term growth objectives, but also putting a major focus on strategic issues and tools
to effectively accomplish those targets. On the whole, PE firms turned to a more
sustainable, long-term view in place of the “short termism” that mainly took place
during the 1980s.
1.4.2 Sources of value: the traditional Kaplan’s model
After the needful premise provided in the prior paragraph, we can now proceed to
evaluate traditional drivers that have so far led to creating value in portfolio
companies. As anticipated, a great deal of research has hitherto attempted to
analyze and discuss how LBOs manage to enhance their companies value, often
using different metrics but yet leading to similar results. Out of many studies,
however, the most widely accepted and referenced work is attributable to Kaplan40,
who is known for having well identified and summarized the main drivers on
which LBOs most rely on. Basing on his seminal work, Figure 11 recaps the three
main drivers of value creation.
39 Kaplan, S., Ferenbach, C., Bingle, M., Lipschultz, M., Canfield, P. and Jones, A. (2011), “Morgan Stanley Roundtable on the State of Global Private Equity, Journal of Applied Corporate Finance, Vol. 23, No. 4 40 Kaplan, S.N. and Strömberg, P. (2009), “Leveraged Buyouts and Private Equity”, The Journal of Economic Perspectives, Vol. 23, No. 1, pp. 130-133
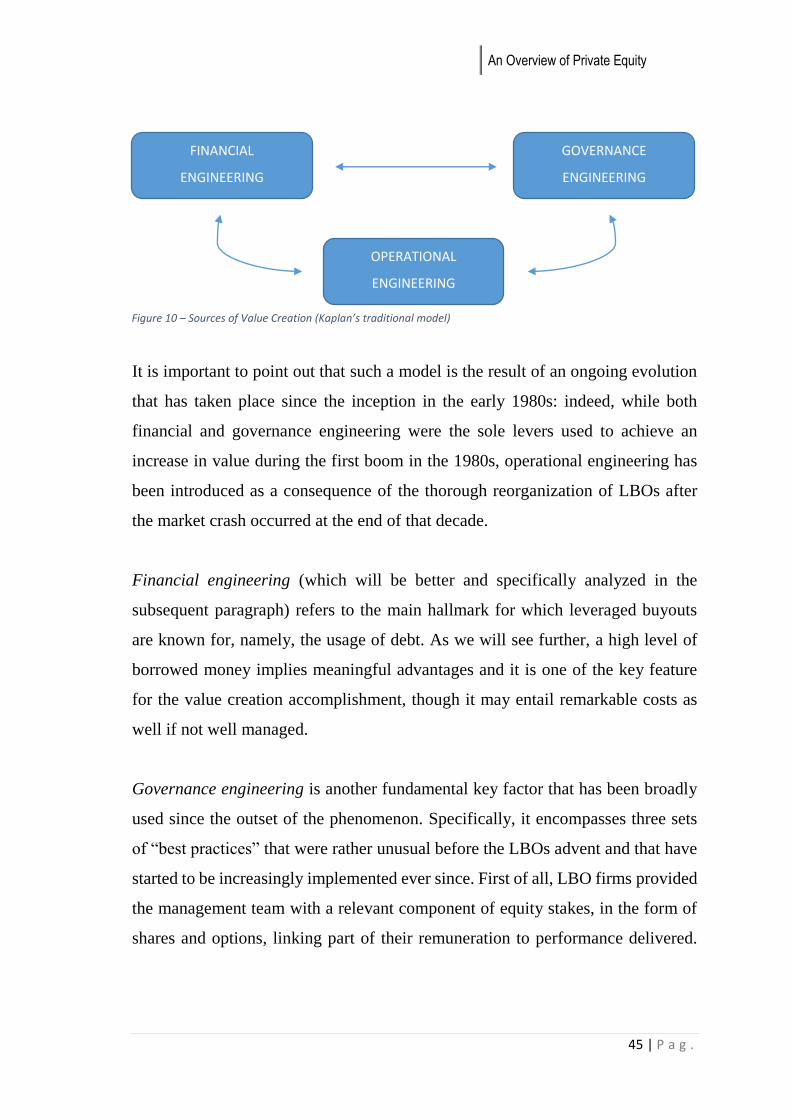
An Overview of Private Equity
45 | P a g .
It is important to point out that such a model is the result of an ongoing evolution
that has taken place since the inception in the early 1980s: indeed, while both
financial and governance engineering were the sole levers used to achieve an
increase in value during the first boom in the 1980s, operational engineering has
been introduced as a consequence of the thorough reorganization of LBOs after
the market crash occurred at the end of that decade.
Financial engineering (which will be better and specifically analyzed in the
subsequent paragraph) refers to the main hallmark for which leveraged buyouts
are known for, namely, the usage of debt. As we will see further, a high level of
borrowed money implies meaningful advantages and it is one of the key feature
for the value creation accomplishment, though it may entail remarkable costs as
well if not well managed.
Governance engineering is another fundamental key factor that has been broadly
used since the outset of the phenomenon. Specifically, it encompasses three sets
of “best practices” that were rather unusual before the LBOs advent and that have
started to be increasingly implemented ever since. First of all, LBO firms provided
the management team with a relevant component of equity stakes, in the form of
shares and options, linking part of their remuneration to performance delivered.
FINANCIAL
ENGINEERING
OPERATIONAL
ENGINEERING
GOVERNANCE
ENGINEERING
Figure 10 – Sources of Value Creation (Kaplan’s traditional model)
Part I
46 | P a g .
Several studies41 found that the creation and application of at least one
compensation plan is customary after an LBO takes place. In addition to this,
though, LBO firms also require the company’s directors and top managers to
acquire significant stakes to be added on their personal investment portfolio, so as
to give them a greater stimulus to strictly engage themselves in delivering
performance.
Secondly, governance engineering refers to the replacement of underperforming
CEOs and key executives, in order to wipe out the oftentimes-main cause of poor
economic results. Such a practice was customary in the 1980s, as reported by
Anders42, as well as nowadays. A more recent study43, conducted on a sample of
LBOs occurred between 1990 and 2006, shows a 51-percent CEO turnover within
the first two years of the LBO. Moreover, it reports a strong, direct relation
between the CEO tenure and the likelihood to be replaced, reaching as high as 67%
when the CEO is entrenched within the company for more than twelve years. These
results, in contrast with critics’ views, display a substantial attention to
restructuring and strategic changes from LBO firms in their portfolio companies.
The last governance practice adopted refers to the superior control on the board
exerted by LBO firms. Jensen44 referred to this fact as the “return of active
investors”, by such an expression meaning investors sitting on boards, monitoring
management (and dismissing it when needed) and actively involved in the strategic
direction. Some recent papers45 denoted that boards of LBO-backed companies are
small-sized compared to those of their quoted peers (public firms), comprise one
or more members of the LBO firm and usually meet on a weekly basis, especially
to discuss about strategic plans and value creation-related topics.
41 See, among others, Muscarella, C.J. and Vetsuypens, M.R. (1990), “Efficiency and Organizational Structure: a Study of Reverse LBOs”, Journal of Finance, Vol. 45, No. 5 42 Anders, G. (1992), “The ‘Barbarians’ in the Boardroom”, Harvard Business Review, Vol. 70, No. 4 43 Gong, J.J. and Wu, S.Y. (2011), “CEO Turnover in Private Equity Sponsored Leveraged Buyouts”, Corporate Governance: an International Review, Vol. 19, No. 3, pp. 201-206 44 Jensen, M.C. (1989), “Active Investors, LBOs, and the Privatization of Bankruptcy”, Journal of Applied Corporate Finance, Vol. 2, No.1, p. 77 45 Acharya, V. and Kehoe, C. (2008), “Corporate Governance and Value Creation: Evidence from Private Equity”, available at: http://www.ecgi.org/competitions/rof/files/Acharya_Kehoe_v5.pdf (accessed January 2016), pp. 31-32
An Overview of Private Equity
47 | P a g .
Operational engineering, as anticipated above, is the last source included in the
model in a chronological order. In particular, it started becoming popular since the
early 1990s, right after the market crash occurred little time earlier. As LBO firms
realized errors and shortcomings that led to such a drop, they started rethinking
their way of doing business, and finally understood that they needed to put greater
focus on long-term growth to achieve more sustainable value creation, instead of
concentrating solely on cash flow generation as they used to do during the 1980s.
Therefore, operational engineering mainly refer to results of such a developing
process, during which most LBO firms began to organize around one or more
specific industries, where they had more capabilities to enhance productiveness
and operations of their portfolio companies on a long-term perspective. This was
accomplished mainly by taking on experienced executives with relevant skills in
those industries: as a result, every LBO firm started to develop their own model to
bring growth to companies. As emerged from a rather recent practitioners’
debate46, over time three models have actually stood out, all of them named after
their parent LBO company:
the Bain Capital model, which draws on external executives to have
portfolio companies run, all of them with a specific professional
background, typically within a consulting- or industry-related scope.
the KKR model, by contrast, relies on a proprietary in-house internal
consulting team that runs all portfolio companies.
the Berkshire model, which is an in-between, uses both internal and external
professionals to drive growth in portfolio companies.
To summarize, the application to portfolio companies of the aforementioned
drivers has hitherto permitted generation of superior operating performance, in the
form of higher revenue growth and improved efficiency on costs. Not only is this
46 Kaplan, S., Ferenbach, C., Bingle, M., Lipschultz, M., Canfield, P. and Jones, A. (2011), “Morgan Stanley Roundtable on the State of Global Private Equity, Journal of Applied Corporate Finance, Vol. 23, No. 4, pp. 16-17, 21-24
Part I
48 | P a g .
valid for “historic” leveraged buyouts47, but it still holds true for more recent deals,
as some studies signal that sources of value creation do not seem to have drastically
changed over years48. Such operating gains finally lead to value creation, resulting
in an increase of both the enterprise value and the equity value of the company.
1.4.3 Leverage as a source of value
After a general introduction of the traditional drivers of value based on Kaplan’s
studies, we will now turn to examine in depth the role of debt as a source for
driving growth in LBO backed companies. We will start by providing an
understanding of what are typical drivers of leverage in LBOs, compared to those
of publicly-held companies. Hence, we will go on to illustrate benefits and costs
of debt, basing on literature arguments.
Drivers of leverage in LBOs
Having ascertained that debt is a primary source by which LBOs create value, we
need to know what are factors determining a certain level of debt in transactions.
Large part of literature argues that debt in LBOs is affected by very different
factors from those of public firms.
Notably, public companies usually determine their optimal D/E ratio following
rules that stem from a combination of the most authoritative capital structure
theorems – namely, Modigliani-Miller, the trade-off theories and the pecking order
theory. As a consequence, the level of debt in public firms usually depends on
factors such as the size of the firm, profitability, growth opportunities and
operating risk (earnings volatility).
47 For a more detailed analysis, see Kitching, J. (1989), “Early Returns on LBOs”, Harvard Business Review, Vol. 67, No. 6 Lichtenberg, F.R. and Siegel, D. (1990), “The Effects of Leveraged Buyouts on Productivity and Related Aspects of Firm Behaviour”, Journal of Financial Economics, Vol. 27, No. 1 48 Guo, S., Hotchkiss, E.S. and Song, W. (2011), “Do Buyouts (still) Create Value?”, Journal of Finance, Vol. 66, No. 2
An Overview of Private Equity
49 | P a g .
That said, many authors49 have found no correlation between such factors and
levels of debt reached in LBO deals: indeed, they argued that debt in LBOs is
mainly driven by debt market conditions and the size of the deal. Specifically, it
is negatively related to market conditions (debt is higher when interest rates are
low)50 and positively related to the size of the deal (the bigger the deal, the higher
the debt), exhibiting a general tendency to lever up companies as much as possible
and disregarding the general capital structure principles.
Moreover, other authors51 found that reputation of LBO firms and the relationship
intervening with banks are additional variables determining an even higher usage
of debt: briefly, LBO firms with solid reputation, as well as with repeated
interactions with banks for leveraged transactions, are more likely to raise higher
amounts of debt capital.
As we can see, the essential importance of debt in leveraged buyouts is remarked
by the fact that LBO firms do not follow the most common principles overall used
for an balanced capital structure, instead they aim at levering up companies as
much as debt is available, in order to deliver the highest return possible to
investors. Such an attitude is responsible for having caused various market crashes
over time, and even though the D/E ratio stands at more reasonable levels today,
high degrees of debt are still an outstanding hallmark for LBOs.
49 Kaplan, S.N. and Strömberg, P. (2009), “Leveraged Buyouts and Private Equity”, The Journal of Economic Perspectives, Vol. 23, No. 1 Axelson, U., Jenkinson, T., Strömberg, P. Weisbach, M.S. (2013), “Borrow Cheap, Buy High? The Determinants of Leverage and Pricing in Buyouts”, Journal of Finance, Vol. 68, No. 6 De Maeseneire, W. and Brinkhuis, S. (2012), “What Drives Leverage in Leveraged Buyouts? An Analysis of European LBOs’ Capital Structure”, Accounting & Finance, Vol. 52 50 Since in LBOs a significant percentage of the overall financial package is made out of debt, we can state that, by extension, the LBO market itself is negatively related to general debt market conditions. 51 Demiroglu, C. and James, C.M. (2010), “The Role of Private Equity Group Reputation in LBO Financing”, Journal of Financial Economics, Vol. 96, No. 2 Ivashina, V. and Kovner, A. (2011), “The Private Equity Advantage: Leveraged Buyout Firms and Relationship Banking”, Review of Financial Studies, Vol. 24, No. De Fontenay, E. (2013), “Private Equity Firms as Gatekeepers”, available at: http://papers.ssrn.com/sol3/papers.cfm?abstract_id=2245156 (accessed December 2015)
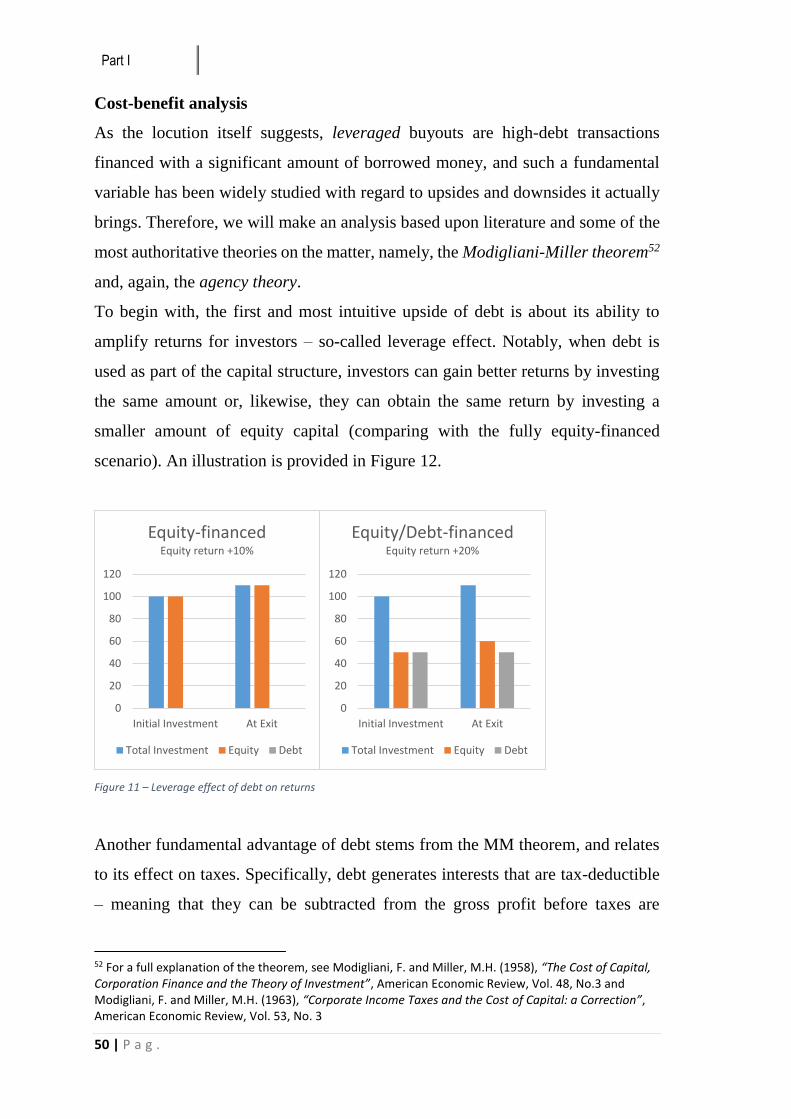
Part I
50 | P a g .
Cost-benefit analysis
As the locution itself suggests, leveraged buyouts are high-debt transactions
financed with a significant amount of borrowed money, and such a fundamental
variable has been widely studied with regard to upsides and downsides it actually
brings. Therefore, we will make an analysis based upon literature and some of the
most authoritative theories on the matter, namely, the Modigliani-Miller theorem52
and, again, the agency theory.
To begin with, the first and most intuitive upside of debt is about its ability to
amplify returns for investors – so-called leverage effect. Notably, when debt is
used as part of the capital structure, investors can gain better returns by investing
the same amount or, likewise, they can obtain the same return by investing a
smaller amount of equity capital (comparing with the fully equity-financed
scenario). An illustration is provided in Figure 12.
Figure 11 – Leverage effect of debt on returns
Another fundamental advantage of debt stems from the MM theorem, and relates
to its effect on taxes. Specifically, debt generates interests that are tax-deductible
– meaning that they can be subtracted from the gross profit before taxes are
52 For a full explanation of the theorem, see Modigliani, F. and Miller, M.H. (1958), “The Cost of Capital, Corporation Finance and the Theory of Investment”, American Economic Review, Vol. 48, No.3 and Modigliani, F. and Miller, M.H. (1963), “Corporate Income Taxes and the Cost of Capital: a Correction”, American Economic Review, Vol. 53, No. 3
0
20
40
60
80
100
120
Initial Investment At Exit
Equity-financedEquity return +10%
Total Investment Equity Debt
0
20
40
60
80
100
120
Initial Investment At Exit
Equity/Debt-financedEquity return +20%
Total Investment Equity Debt
An Overview of Private Equity
51 | P a g .
computed, thereby lowering the total amount to be paid53. This possibility,
guaranteed almost in any country worldwide, has been an important source of
value creation besides operating gains, which has allowed companies to increase
their value by means of lower amounts of taxes to be paid on profits54.
The last advantage attributable to debt comes out of the agency argument, which
we also introduced in previous paragraphs. In particular, Jensen55 first investigated
a high level of debt as a solution for the free cash flow dilemma into (especially
public) companies, when he discussed about agency problems. Indeed, he argued
that a high leverage could prompt managers not to waste financial resources of the
company, as they are required to meet interest payments at specific and fixed
deadlines in order not to go bankrupt. Moreover, it could create tremendous
anxiety and a pervasive sense of crisis that would spur managers into striving to
generate cash flows so as to repay the overwhelming amount of debt as fast as
possible. So, according to agency theory proponents, debt may be seen as (at least
partly) solution to fix interest contrasts between managers and shareholders.
Nevertheless, on the other side, debt has relevant downsides as well. Starting with
the MM theorem, the authors themselves found that an excessive level of debt is
counterproductive, regardless of its overall ability to create value by means of the
tax shield. Indeed, levering up a company over specific levels generates costs
(costs of financial distress) that exceed tax benefits, thus the company incurs
progressive value destruction. Furthermore, an exceptional degree of leverage is
prone to trigger additional agency costs that break out in financial distress
situations. In particular:
Risk shifting, that contemplate a higher likelihood of undertaking high-risk
projects, as an eventual loss would be firstly suffered by creditors;
53 A relevant number of countries impose limitations on tax deductibility, usually allowing companies to deduct as high as 30% of EBITDA. 54 Introducing taxation in the model, the MM theorem states that the value of a company is a positive function of its leverage, due to the positive tax-deduction effect. Hence, the higher the debt, the higher its overall value. 55 Jensen, M.C. (1986), “Agency Costs of Free Cash Flows, Corporate Finance and Takeovers”, American Economic Review, Vol. 76, No. 2 Jensen, M.C. (1989), “Eclipse of the Public Corporation”, Harvard Business Review, Vol. 67, No. 5

Part I
52 | P a g .
Underinvestment (or debt overhang), conversely, determine an inclination
not to invest in any project, even if NPV is positive, as returns would be
entirely snapped up by creditors;
Milking the property, considers the situation in which managers perform
substantial divestments to pay earnings out to investors, harming creditors’
interests.
1.4.4 The evolution of the Kaplan’s model
The last part of this section will be dedicated to analyzing how the traditional
model adopted for value creation (the Kaplan’s model) might be revisited in order
to adjust it for the time being. It is worth pointing out that the basics of the
traditional model still hold true, and by no means we intend to cast doubts on its
validity; nevertheless, our attempt is to bring it up-to-date by adding some key
factors and, above all, evaluating how finance has evolved in recent times.
The World Economic Forum56 has first introduced this newer model, developing
it under a practitioners’ perspective, yet tracing that of academia. Figure 13
provides an illustration of the main sources of value according to this model.
56 World Economic Forum (2015), Alternative Investments 2020 – An Introduction to Alternative Investments, available at: http://www3.weforum.org/docs/WEF_Alternative_Investments_2020_An_Introduction_to_AI.pdf (accessed December 2015), pp. 21-24
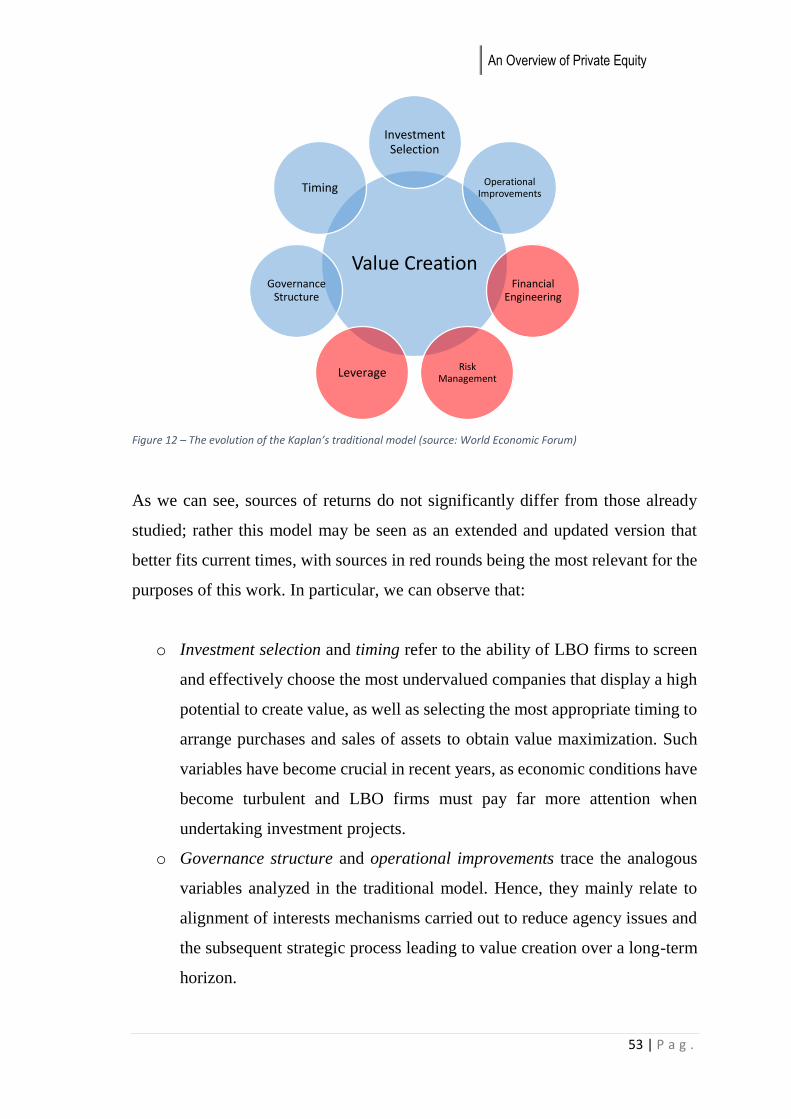
An Overview of Private Equity
53 | P a g .
Figure 12 – The evolution of the Kaplan’s traditional model (source: World Economic Forum)
As we can see, sources of returns do not significantly differ from those already
studied; rather this model may be seen as an extended and updated version that
better fits current times, with sources in red rounds being the most relevant for the
purposes of this work. In particular, we can observe that:
o Investment selection and timing refer to the ability of LBO firms to screen
and effectively choose the most undervalued companies that display a high
potential to create value, as well as selecting the most appropriate timing to
arrange purchases and sales of assets to obtain value maximization. Such
variables have become crucial in recent years, as economic conditions have
become turbulent and LBO firms must pay far more attention when
undertaking investment projects.
o Governance structure and operational improvements trace the analogous
variables analyzed in the traditional model. Hence, they mainly relate to
alignment of interests mechanisms carried out to reduce agency issues and
the subsequent strategic process leading to value creation over a long-term
horizon.
Value Creation
Investment Selection
Operational Improvements
Financial Engineering
Risk ManagementLeverage
Governance Structure
Timing
Part I
54 | P a g .
o Leverage, risk management and financial engineering represent the
fundamental debt factor typical of LBO operations. As we note, this model
comprises three distinguished variables without referring to debt generally,
so as to remark that today – more than in past times – debt has undergone a
substantial process of sophistication that pertain not only to its overall
amount (in terms of size), but particularly to its internal composition. Even
though such a process has always existed since the outset of the LBO
phenomenon, today more than ever it has accrued an increasing importance
due to the ever more sophisticated tools it uses both for getting a larger
number of investors involved in deals and for shifting risk between them.
As a matter of fact, while leverage refers to the overall amount of debt
considering its benefits in terms of enhanced returns and tax savings, risk
management relates to the capability of evaluating the high risk associated
with such debt and, through financial engineering tools (mainly financial
derivatives), repackage and distribute it to various investors’ classes.
Being our main focus on the role of finance and its ability to address value creation
for investors, in next Parts we will be committed to deepening the evolution of
debt over time, in terms of both size and composition, explaining the most
traditional financial instruments overall used and how they evolved over years.
Then, we will concentrate on the financial engineering process that has taken place
in the past ten years and the strong usage of derivatives that has radically
transformed the LBO sector, associating it with performance delivered to investors
so as to verify a possible correlation.
An Overview of Private Equity
55 | P a g .
1.5 LBO performance: Costs and Returns
In this last section, we will provide a framework to evaluate what are typical costs
and correlated performance of investing in the leveraged buyout asset class. What
we aim to do in this paragraph is, first and foremost, to give a general
understanding of costs borne by subjects investing in LBOs, and after this, we will
introduce traditional performance measures by which returns are actually
computed. Importantly, not only will we report typical ratios computed on an
absolute basis, but also adjusted ratios used mainly in literature to effectively
compare such returns to public markets indices. Besides, we will introduce typical
patterns, stemmed from existent literature, that relate to funds’ performance both
at a general and at a fund level. As we remark, LBO investments are comprised
within the alternative investments categories, which are characterized for being
high-risky and, consequently, with an expected high-return. Hence, LBOs returns
need to be far higher than those provided by public markets, otherwise being no
reason for investing in such a riskier asset class. Therefore, our final subsection
will be dedicated to analyze whether or not LBOs have so far generated acceptably
higher returns over “guaranteed” returns provided by public markets.
1.5.1 Costs of investing in LBOs
Investing in an alternative investment asset class entails costs that are not suffered
by who decide to allocate their capital into less risky or risk-free products. In
particular, we refer to both monetary costs, namely fees charged by the GP, and
non-monetary costs that are related to the superior level of risk borne by investors.
While fees have been widely discussed prior in this work, we will herein put a little
focus on the underlying risk, describing its main characteristics and components
that make it heightened compared to more typical investments.

Part I
56 | P a g .
1.5.1.1 Risk
Risk in private equity investments57 is the result of a four-factor set that include:
o Liquidity risk, of course, is the first and most obvious class to be mentioned,
as private equity investments are long-term, illiquid commitments that
cannot be easily sold, especially in public markets. As a consequence, in
most cases investors are bound to keep their investment for its whole life,
having no practical possibility to dispose of it.
o Market risk, also present in public markets for asset prices58, refers to the
risk of short- to mid-term changes in the value of the committed capital
quota.
o Capital risk can be referred to as the long-term counterpart of market risk,
as it alludes to possible changes of value over years that may result in a loss
of capital for investors.
o Funding risk, which is typical of private equity investments, refers to the
possibility that an investor will not be able to pay their commitments when
the GP calls for it during the fund life59.
Sorensen60 et al. found in a recent study that, broadly speaking, over the total
investment costs borne by investors, fees account for 50% while overall risk
accounts for remainder 50%. Regardless of this, much research has hitherto
concentrated mainly on fees when considering costs of private equity and when
comparing its returns with those of public markets, thereby showing possible
upward-biased valuations in their results. We will address this issue again in next
57 For a thorough analysis of the matter, see BVCA and Montana Capital Partners (2015), “Risk in Private Equity”, available at: http://www.bvca.co.uk/Portals/0/library/documents/Guide%20to%20Risk/Risk%20in%20Private%20Equity%20-%20Oct%202015.pdf (accessed January 2016) 58 Since in a private equity investment no market price exists, fund’s managers usually fill in for it by calculating NAVs on a quarterly basis, and using them as substitutes to assess value of capital committed. 59 Funding risk can materialize as a result of either an over-commitment strategy from investors or market distortions that lead to misalignments between capital calls and distributions. Being an in-depth analysis beyond the scope of this work, we address to the BVCA report for a further understanding. 60 Sorensen, M., Wang, N. and Yang, J. (2014), “Valuing Private Equity”, Review of Financial Studies, Vol. 27, No. 7
An Overview of Private Equity
57 | P a g .
paragraphs, when comparing private equity performance with public markets
returns.
1.5.2 Returns of investing in LBOs
Consequently to discussing main costs of leveraged buyouts investments, we will
herein turn to reasoning about returns. We will commence by introducing main
ratios and indices used to evaluate performance, then proceeding to give some
insight about typical performance patterns both at a fund and at a general level.
Lastly, we will conclude by estimating LBO performance over time and comparing
it to public “risk-free” investments, so as to realize whether or not leveraged
buyout investments have generated outperformance over public markets.
1.5.2.1 Absolute performance: IRR and multiples
The preferred metric used by funds to evaluate performance leads to the IRR
calculation. Mathematically speaking, IRR is the discount rate applied to all
inflows and outflows of an investment project that makes the Net Present Value
equal to zero: in so doing, funds can assess the profitability of their investments.
In the NPV formula, IRR is given by:
𝑁𝑃𝑉 = ∑𝑁𝑒𝑡 𝐶𝑎𝑠ℎ 𝐹𝑙𝑜𝑤𝑠𝑡
(1 + 𝑰𝑹𝑹)𝑡= 0
𝑛
𝑡=0
Logically, putting NPV = 0, profitable investments will report IRR > WACC
whereas projects exhibiting IRR < WACC are very likely to incur losses.
Yet, regardless of IRR being the most adopted measure, funds are usually required
to calculate some types of multiples that aim at estimating how much value is
created. These include the distributed to paid-in capital (DPI), residual value to
paid-in capital (RVPI), total value to paid-in capital (TVPI) and the paid-in capital
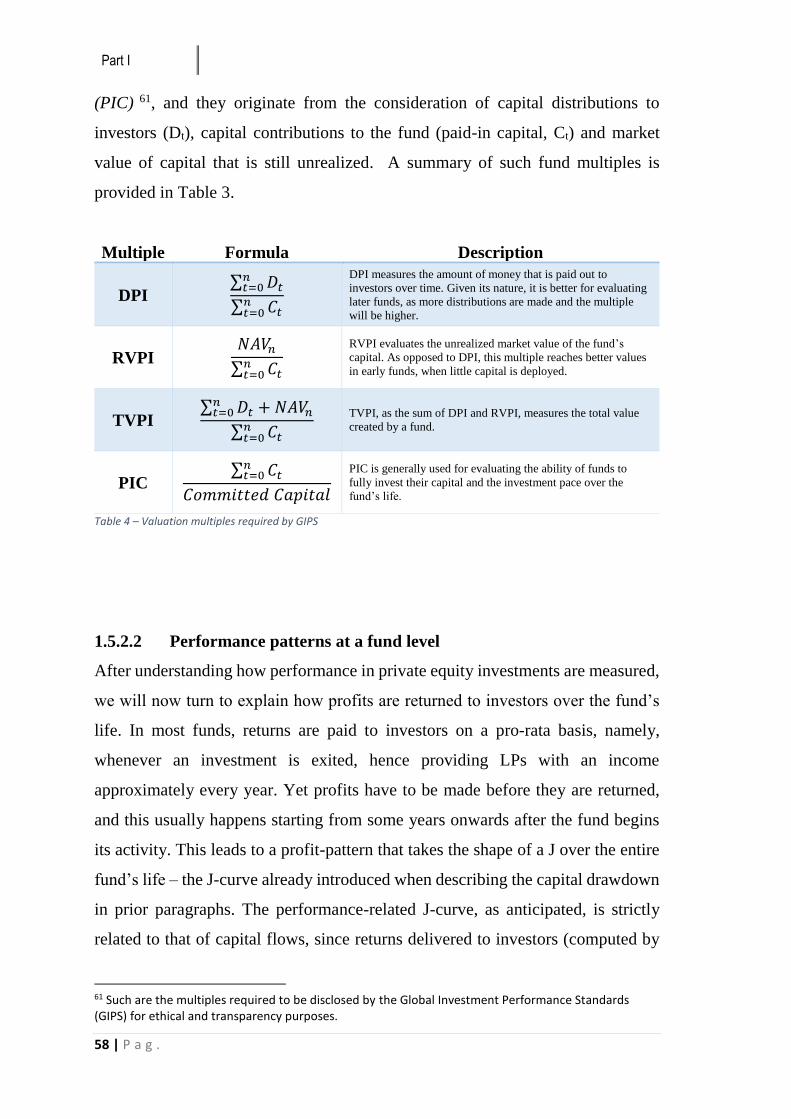
Part I
58 | P a g .
(PIC) 61, and they originate from the consideration of capital distributions to
investors (Dt), capital contributions to the fund (paid-in capital, Ct) and market
value of capital that is still unrealized. A summary of such fund multiples is
provided in Table 3.
Multiple Formula Description
DPI ∑ 𝐷𝑡
𝑛𝑡=0
∑ 𝐶𝑡𝑛𝑡=0
DPI measures the amount of money that is paid out to
investors over time. Given its nature, it is better for evaluating
later funds, as more distributions are made and the multiple
will be higher.
RVPI 𝑁𝐴𝑉𝑛
∑ 𝐶𝑡𝑛𝑡=0
RVPI evaluates the unrealized market value of the fund’s
capital. As opposed to DPI, this multiple reaches better values
in early funds, when little capital is deployed.
TVPI ∑ 𝐷𝑡
𝑛𝑡=0 + 𝑁𝐴𝑉𝑛
∑ 𝐶𝑡𝑛𝑡=0
TVPI, as the sum of DPI and RVPI, measures the total value
created by a fund.
PIC ∑ 𝐶𝑡
𝑛𝑡=0
𝐶𝑜𝑚𝑚𝑖𝑡𝑡𝑒𝑑 𝐶𝑎𝑝𝑖𝑡𝑎𝑙
PIC is generally used for evaluating the ability of funds to
fully invest their capital and the investment pace over the
fund’s life.
Table 4 – Valuation multiples required by GIPS
1.5.2.2 Performance patterns at a fund level
After understanding how performance in private equity investments are measured,
we will now turn to explain how profits are returned to investors over the fund’s
life. In most funds, returns are paid to investors on a pro-rata basis, namely,
whenever an investment is exited, hence providing LPs with an income
approximately every year. Yet profits have to be made before they are returned,
and this usually happens starting from some years onwards after the fund begins
its activity. This leads to a profit-pattern that takes the shape of a J over the entire
fund’s life – the J-curve already introduced when describing the capital drawdown
in prior paragraphs. The performance-related J-curve, as anticipated, is strictly
related to that of capital flows, since returns delivered to investors (computed by
61 Such are the multiples required to be disclosed by the Global Investment Performance Standards (GIPS) for ethical and transparency purposes.
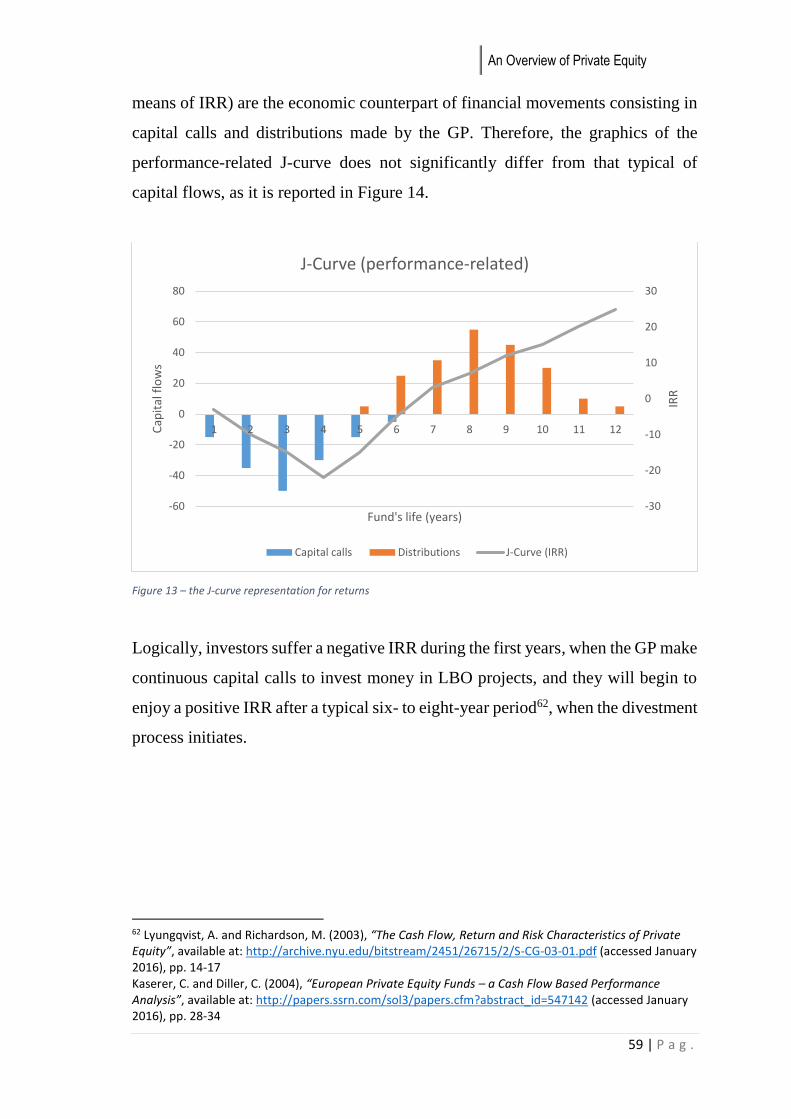
An Overview of Private Equity
59 | P a g .
means of IRR) are the economic counterpart of financial movements consisting in
capital calls and distributions made by the GP. Therefore, the graphics of the
performance-related J-curve does not significantly differ from that typical of
capital flows, as it is reported in Figure 14.
Figure 13 – the J-curve representation for returns
Logically, investors suffer a negative IRR during the first years, when the GP make
continuous capital calls to invest money in LBO projects, and they will begin to
enjoy a positive IRR after a typical six- to eight-year period62, when the divestment
process initiates.
62 Lyungqvist, A. and Richardson, M. (2003), “The Cash Flow, Return and Risk Characteristics of Private Equity”, available at: http://archive.nyu.edu/bitstream/2451/26715/2/S-CG-03-01.pdf (accessed January 2016), pp. 14-17 Kaserer, C. and Diller, C. (2004), “European Private Equity Funds – a Cash Flow Based Performance Analysis”, available at: http://papers.ssrn.com/sol3/papers.cfm?abstract_id=547142 (accessed January 2016), pp. 28-34
-30
-20
-10
0
10
20
30
-60
-40
-20
0
20
40
60
80
1 2 3 4 5 6 7 8 9 10 11 12
IRR
Cap
ital
flo
ws
Fund's life (years)
J-Curve (performance-related)
Capital calls Distributions J-Curve (IRR)
Part I
60 | P a g .
1.5.2.3 Performance patterns at a general level
Given the typical J-curve economic pattern observable at a fund level, we will now
provide some considerations of what affects performance at a more general level,
and its relation with other variables such as new capital influxes and the overall
fund’s size. Moreover, we will see how performance movements closely drive
market upturns and downturns that have occurred and will still occur over time.
To begin with, we need to introduce the definition of what mainly drove the LBO
market in the 1980s-90s decades, namely, the “persistence” phenomenon. Kaplan
and Schoar firstly issued such a locution in their seminal paper63, and it basically
refers to the ability of a fund to maintain its performance in subsequent funds
raised. Thus, in the case of LBOs, they argued that GPs whose funds outperformed
were likely to outperform again in their subsequent fund64, and this was found to
be primarily due to GPs’ skills and valuable expertise. Furthermore, the authors
found a strong, positive relation between the fund’s performance and new influxes
of capital in subsequent funds, meaning that investors were more prone to invest
higher amounts of money in funds raised by GPs that previously performed well.
Additionally, in times during which LBO firms showed above-average returns,
more and more new players were willing to enter the market by raising early funds,
even though they were found to perform poorly. This trend have led to what is
generally called a “boom period”, that is, when the market gets “overheated” by
ever more numerous deals due to the increasing number of funds. Regardless,
being early funds less skilled and hence less profitable, as well as a general
tendency to undertake riskier and, at its limit, reckless transactions, this gradually
reduces the overall rate of return average, ultimately leading to a market crash, or
so-called “bust period”, in which higher default rates are registered, inefficient
funds disappear and the market gradually reorganizes.
63 Kaplan, S.N. and Schoar, A. (2005), “Private Equity Performance: Returns, Persistence and Capital Flows”, The Journal of Finance, Vol. 60, No. 4 64 “Outperformance persistence” refers to the ability of top-quartile performance funds’ GPs to remain top-quartile performers even in subsequent funds raised. As opposed to this, the authors found a negative “underperformance persistence” for mutual funds.

An Overview of Private Equity
61 | P a g .
As a proof of the robustness of the persistence phenomenon, other authoritative
authors65 studied it and finally agreed on its validity. Furthermore, some recent
studies developed one of the main implications of the original Kaplan and Schoar
paper regarding scalability of LBO funds, namely the relationship between the
fund’s size and its performance. In their work, the original authors found a concave
relation between the two variables, suggesting a diseconomy of scale effect66 for
buyout funds. In other words, funds that outperform and, hence, raise higher level
of capital thereby growing their size, tend to impair performance, since they are
not likely to be as high as they were before. As mentioned above, some recent
studies67 argued the validity of the diseconomy of scale thesis, providing some new
hints as well. In particular, the fund’s size may be enlarged by:
a. Raising greater amounts of committed capital
b. Increasing the number of simultaneous investments
c. A combination of both
Phalippou et al. (2015) found that the diseconomy of scale effect is more likely to
occur when funds increase size by means of a soaring number of simultaneous
investments (option b and c), because of superior growth of communicational and
organizational costs that more than compensate increases in learning advantages
and enhanced relationships with banks and other lenders. Hence, returns tend to
decline in a concave relation with the overall size. Instead, genuine increases in
the fund’s size along with a rather low number of simultaneous investments (option
a) has a positive effect, allowing LBO firms to undertake bigger deals that, as
shown in the paper, lead to strong performance. On the whole, then, the authors
argued that scalability in LBO funds is possible, though it must be accomplished
by keeping a somewhat low number of simultaneous investments at the same time
65 Phalippou, L. and Gottschalg, O. (2009), “The Performance of Private Equity Funds”, Review of Financial Studies, Vol. 22, No. 4 Mozes, H.A. and Fiore, A. (2012), “Private Equity Performance: Better than Commonly Believed”, Journal of Private Equity, Vol. 15, No. 3 66Kaplan indeed states that “fund’s size is the enemy of persistence”, thereby implying the presence of diseconomies of scale in buyout funds. A minority of research, though, supports the economy of scale thesis. 67 Lopez-de-Silanes, F., Phalippou, L. and Gottschalg, O. (2015), “Giants at the Gate: Investment Returns and Diseconomies of Scale in Private Equity”, Journal of Financial & Quantitative Analysis, Vol. 50, No. 3
Part I
62 | P a g .
to contrast the overwhelming increase in communicational and organizational
costs.
Given the persistence and its economic implications, it remains to be seen whether
such a phenomenon has varied over years, to evaluate if it is still applicable to
more recent funds. As mentioned earlier, persistence in outperformance for buyout
funds was argued to be valid and robust for funds raised in the 1980s-90s decades,
but things may have changed today. Harris et al. (2014)68 recently published a
renewed version of the original paper that introduced persistence in 2005, studying
possible changes that may have led to some differences in this regard. They found
that persistence in buyout funds has a far smaller magnitude than it had for the first
two decades of activity: although it still exists for buyout funds, it has shifted to
lower-end quartile performers. Notably, LBO funds shifted from an
“outperformance persistence” in the 1980s-90s towards somewhat of an
“underperformance persistence”, meaning that only funds in the performance
lower-end quartile show a pattern that leads to poor performances even in
subsequent funds. As for typical persistence in top-quartile funds, it is argued to
be no longer applicable. Despite further research is going to be required, possible
explanations may be due to the fact that either many GPs have appropriated
expertise and skills of top performer GPs, thereby reducing the persistence rate, or
sources of return have plausibly varied their importance over time and only a
portion of GPs have adapted, disrupting the persistence pattern.
However, as far as diseconomies of scale are concerned, these results have an
important implication: indeed, the outperformance persistence, which allowed GPs
to raise more capital for next funds, has led to ever larger funds that have then
underperformed, as persistence for top performers is, to date, no longer valid. This
seems to validate the aforementioned diseconomy of scale thesis, which states that
the relation between size and performance results in a concave function (mainly
due to the increasing number of investments, as shown above).
68 Harris, R.S., Jenkinson, T., Kaplan, S.N. and Stucke, R. (2014), “Has Persistence Persisted in Private Equity? Evidence from Buyout and Venture Capital Funds”, available at: http://papers.ssrn.com/sol3/papers.cfm?abstract_id=2304808 (accessed December 2015)
An Overview of Private Equity
63 | P a g .
1.5.2.4 Money-weighted vs. time-weighted rates of returns
Before proceeding further, it is important to point out that it is not possible to
directly compare typical funds’ performance measure – namely, IRR – with public
markets’ common indices. In practice, assuming a fund shows a 12% IRR whereas
the S&P500 is at 6%, we could not simply state that the fund has outperformed
public markets. This is because different metrics are used on return valuations, so
that a direct comparison would be misleading. In particular, the IRR measure used
by funds is a money-weighted rate of return, as opposed to time-weighted rates of
returns generally used in public markets: the main difference among these methods
is with regard to sensitivity on contributions and withdrawals carried out over time.
Indeed, while money-weighted rates – as the locution suggests – put emphasis on
capital considering a unique rate of return over the whole period, time-weighted
rates split the full period into sub-periods computing different rates69. Therefore,
money-weighted rates are sensitive to any subsequent in/outflow, with favorable
or detrimental implications depending on the flow direction (in/out of the fund),
whereas time-weighted rates eliminate such distortions by calculating different
rates for each sub-period and rounding them up in a geometric mean.
Given these dissimilarities, a direct comparison is not appropriate and other
performance measures need to be calculated to compensate for this gap. Such
adjusted measures, that provide an overview of funds’ performance over public
markets on a relative basis, will be now analyzed.
1.5.2.5 Relative performance: PMEs
As anticipated, funds’ performance calculated using IRR cannot be directly
compared to public markets returns, since substantial differences among valuation
methods exist. Instead, adjusted calculations need to be carried out to make such a
69 In particular, money-weighted rates of return are more likely to generate distortions, as a capital contribution would enhance the rate even if the manager has performed poorly; conversely, a capital distribution would lower the rate, even if the manager has performed well, impairing its results.
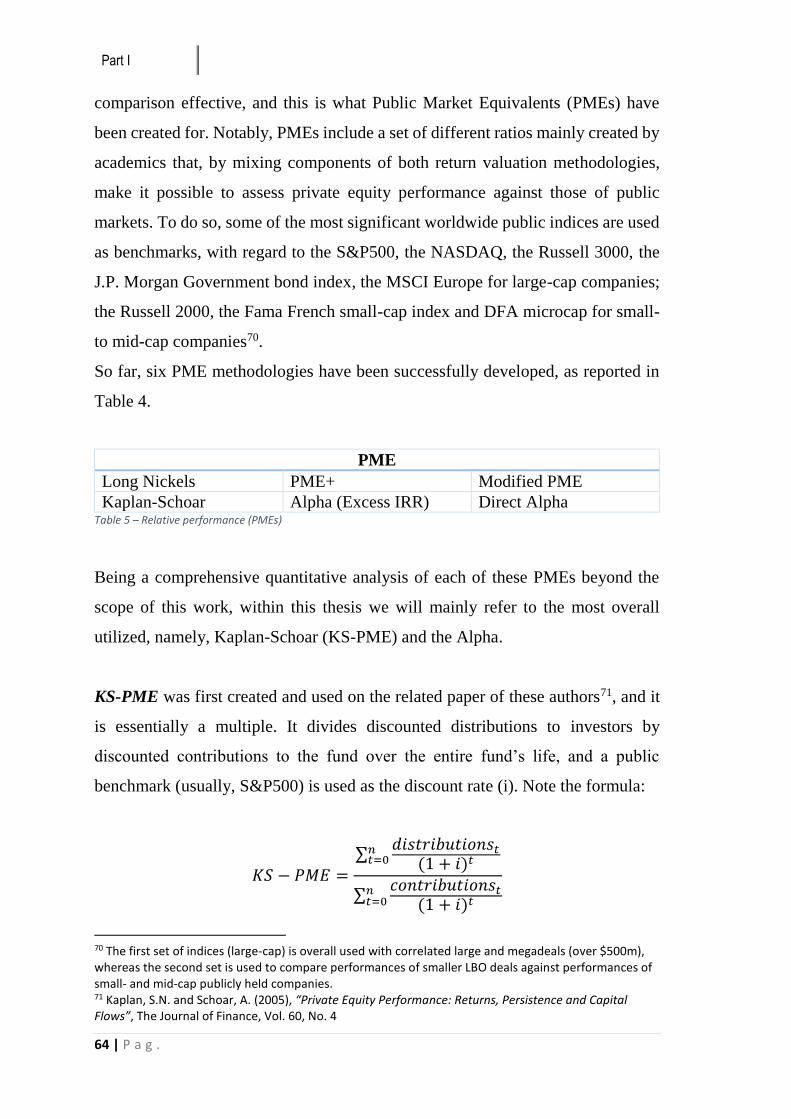
Part I
64 | P a g .
comparison effective, and this is what Public Market Equivalents (PMEs) have
been created for. Notably, PMEs include a set of different ratios mainly created by
academics that, by mixing components of both return valuation methodologies,
make it possible to assess private equity performance against those of public
markets. To do so, some of the most significant worldwide public indices are used
as benchmarks, with regard to the S&P500, the NASDAQ, the Russell 3000, the
J.P. Morgan Government bond index, the MSCI Europe for large-cap companies;
the Russell 2000, the Fama French small-cap index and DFA microcap for small-
to mid-cap companies70.
So far, six PME methodologies have been successfully developed, as reported in
Table 4.
PME
Long Nickels PME+ Modified PME
Kaplan-Schoar Alpha (Excess IRR) Direct Alpha Table 5 – Relative performance (PMEs)
Being a comprehensive quantitative analysis of each of these PMEs beyond the
scope of this work, within this thesis we will mainly refer to the most overall
utilized, namely, Kaplan-Schoar (KS-PME) and the Alpha.
KS-PME was first created and used on the related paper of these authors71, and it
is essentially a multiple. It divides discounted distributions to investors by
discounted contributions to the fund over the entire fund’s life, and a public
benchmark (usually, S&P500) is used as the discount rate (i). Note the formula:
𝐾𝑆 − 𝑃𝑀𝐸 =
∑𝑑𝑖𝑠𝑡𝑟𝑖𝑏𝑢𝑡𝑖𝑜𝑛𝑠𝑡
(1 + 𝑖)𝑡𝑛𝑡=0
∑𝑐𝑜𝑛𝑡𝑟𝑖𝑏𝑢𝑡𝑖𝑜𝑛𝑠𝑡
(1 + 𝑖)𝑡𝑛𝑡=0
70 The first set of indices (large-cap) is overall used with correlated large and megadeals (over $500m), whereas the second set is used to compare performances of smaller LBO deals against performances of small- and mid-cap publicly held companies. 71 Kaplan, S.N. and Schoar, A. (2005), “Private Equity Performance: Returns, Persistence and Capital Flows”, The Journal of Finance, Vol. 60, No. 4
An Overview of Private Equity
65 | P a g .
Being it a multiple, a value greater than 1 indicates outperformance of the fund
over the public benchmark, and vice versa.
Alpha (or Excess IRR), by contrast, compares IRR of a fund with an adjusted-IRR
computed for a specific public benchmark. If the fund’s IRR is greater than the
adjusted-IRR (Alpha > 0), that means outperformance of the fund over the public
markets, and, conversely, if the fund’s IRR is found to be lower than its public
counterpart’s, it means underperformance of the fund.
1.5.2.6 LBO vs. public markets: superior returns?
We will conclude Part I by analyzing existent literature related to whether
investing in leveraged buyouts have hitherto led to superior returns, comparing
them to those achieved in public markets. Being LBOs an alternative class of
investments, with higher levels of risk and costs in general, we would expect to
find consistent outperformance public markets returns, otherwise having no
rational reason for allocating capital in such a riskier way. As already said, authors
use important large-cap indexes of the most relevant stock exchanges on a
worldwide basis, sometimes drawing on indexes that reflect performance of small-
to mid-cap companies for smaller LBOs, with the aim of offsetting the basis for
comparison. Therefore, while the S&P500 index is the most widely used for US
markets, MSCI Europe and other major indexes are used for the European context;
nonetheless, we will signal should authors use different indices in their research.
We will split this subsection in two parts: the first is aimed at analyzing prior
research on LBO performance from the 1980s up to the early 2000s, while the
second, besides expanding the performance analysis for more recent times,
contains adjustments with regard to previous literature.
During the 2000s, substantial research was done to assess whether LBO returns
were high enough to overcome public markets ones. Several authoritative scholars
Part I
66 | P a g .
carried out studies that mainly relied on Venture Economic-based samples of
companies, and results were not always concordant. To begin with, Kaplan and
Schoar72 were among the firsts who attempted to assess LBO performance, using
a sample of US-based funds raised between 1980 and 2001. One of the most
relevant contribution they provided was to create a new PME (i.e., Public Market
Equivalent) in order to contrast LBO returns with those achievable in stock
exchanges. By means of their KS-PME, thus, they found that the LBO market
outperformed public markets on a gross-of-fees basis, whereas returns were
roughly the same if LBO profits were considered net of fees. Similarly, Lyungqvist
and Richardson73 based their research on a sample of funds in which a large LP
invested in during the period 1980-1993, and they found excess returns of such
funds over the S&P500 of 5% to 8% per annum. Nevertheless, not all findings
used to display such optimistic results. For all, Phalippou and Gottschalg74
disagreed on alleged positive returns that had been reported, and they built a model
in which performance of LBOs were adjusted on three corrections75 to better offset
returns against costs. Hence, they proceeded to compare LBO and S&P500
performances by using the Alpha PME, and they found that, with three corrections
applied, gross-of-fees LBO returns roughly equaled public markets ones, while
there was an yearly underperformance of -6% on a net-of-fees basis.
As for European LBOs, Kaserer and Diller76 analyzed a sample of almost 800 EU-
based funds raised between 1980 and 2003 and found superior LBO performance
over the MSCI Europe equity index and the J.P. Morgan Government bond index
by using both absolute and relative performance metrics.
72 Kaplan, S.N. and Schoar, A. (2005), “Private Equity Performance: Returns, Persistence and Capital Flows”, The Journal of Finance, Vol. 60, No. 4 73 Lyungqvist, A. and Richardson, M. (2003), “The Cash Flow, Return and Risk Characteristics of Private Equity”, available at: http://archive.nyu.edu/bitstream/2451/26715/2/S-CG-03-01.pdf (accessed January 2016) 74 Phalippou, L. and Gottschalg, O. (2009), “The Performance of Private Equity Funds”, The Review of Financial Studies, Vol. 22, No. 4 75 The three corrections introduced by the authors refer to: a) writing off NAVs; b) changing the weighting scheme from capital commitment to present value of invested capital; c) inclusion of projected PI for additional funds. 76 Kaserer, C. and Diller, C. (2004), “European Private Equity Funds – a Cash Flow Based Performance Analysis”, available at: http://papers.ssrn.com/sol3/papers.cfm?abstract_id=547142 (accessed January 2016)
An Overview of Private Equity
67 | P a g .
Regardless of results shown by early literature, the same and other authors have
recently found the Venture Economics dataset to have downward biased LBO
performance and, as a consequence, results provided in prior research were
incorrect and misleading. Therefore, a new wave of research papers and articles
have consequently come, relying on new and unbiased data derived from datasets
like Burgiss, Preqin and Cambridge Associates. Many authors have been engaged
in revisiting older findings, to evaluate what performance of LBOs really were.
Results are spectacularly positive so far: almost any scholar agrees with others on
reporting incredibly higher returns than those of prior literature. In particular,
Kaplan et al. (2014)77 report an outperformance of LBOs over public markets of
20% to 27% over the whole fund’s life, matching a mean 3.7% on an annual basis
and considering net-of-fees returns. Consistently with them, Phalippou78 finds
outstanding returns as well, reporting that, out of 10 LBO investments, 2.5 are
“homeruns” (IRR > 50%), 5 exhibit an IRR between 0 and 50%, while 2.5 lose all
or part of their money (with 1 in 10 being a complete bust). Regardless, in another
paper79, the author claims that the large majority of buyout transactions have had
an average deal value of $302m, hence small-cap indices should be used to
compare LBO returns with stock exchange ones, and the Fama-French and the
DFA- microcap would represent a better choice rather than large-cap S&P500 and
NASDAQ. Applying this correction, the author finds that LBO performance
approximately matches public markets ones, showing PMEs multiples roughly
equal to 1.
Again, Mozes and Fiore80 acknowledge possible evaluation problems of IRR as a
performance metric, so that they correct it by applying some adjustments that
77 Harris, R.S., Jenkinson, T., and Kaplan, S.N. (2014), “Private Equity Performance: What Do We Know?”, The Journal of Finance, Vol. 69, No. 5 78 Lopez-de-Silanes, F., Phalippou, L. and Gottschalg, O. (2015), “Giants at the Gate: Investment Returns and Diseconomies of Scale in Private Equity”, Journal of Financial & Quantitative Analysis, Vol. 50, No. 3 79 Phalippou, L. (2014), “Performance of Buyout Funds Revisited?”, Review of Finance, Vol. 18, No. 1 80 Mozes, H.A. and Fiore, A. (2012), “Private Equity Performance: Better than Commonly Believed”, Journal of Private Equity, Vol. 15, No. 3

Part I
68 | P a g .
would likely impair LBO returns. Nonetheless, they find strong outperformance
over stock exchanges returns even on a net-of-fees basis.
The conclusion towards which any scholar seems to be heading, however, is that
leveraged buyout funds have overall generated returns with a risk-reward profile
superior to that of public equities.
The Debt Side in Leveraged Buyouts
69 | P a g .
Part II – The Debt Side in Leveraged Buyouts
2.1 Preliminary aspects
This chapter aims at providing an in-depth understanding of the debt component
in leveraged buyout deals, with the main purpose of analyzing a various range of
the most used debt instruments, how they evolved over time and how they
contributed to reach value creation for the private equity fund’s investors. In other
words, we will focus on scanning different financial instruments that have
characterized the financing package from the very outset of the leveraged buyout
phenomenon in the 1980s, proceeding to explore changes intervened due to
“behavioral” modifications in banks and other actors involved in the transaction,
to finally get to the structured credit market boom in the 2000s that dramatically
ended up with the 2007 financial crisis. Needless to say, the debt package has
suffered drastic changes throughout the 1980-2007 period, both for the increased
sophistication of instruments utilized to finance the deal and for the number of
actors involved in it.
Our review stems from both existent academic research and authoritative private
companies’ reports that deal with this matter. Nevertheless, the largest part of these
analyses and results halt to the 2007 financial crisis, with very little research of the
evolution of the financing package after that date. Therefore, while we will provide
a detailed observation based on proven literature of how debt had evolved until the
financial crack of some years ago, we will postpone the analysis of how such a
crisis affected debt financing in LBOs in the latest 2008-2015 period to Part III.
The financing scheme of a leveraged buyout
Before proceeding to explore financial instruments of the debt package in detail,
we need to remind the basic mechanics of how a leveraged buyout works, so as
not to get puzzled. As already seen in Part I, leveraged buyouts are complex
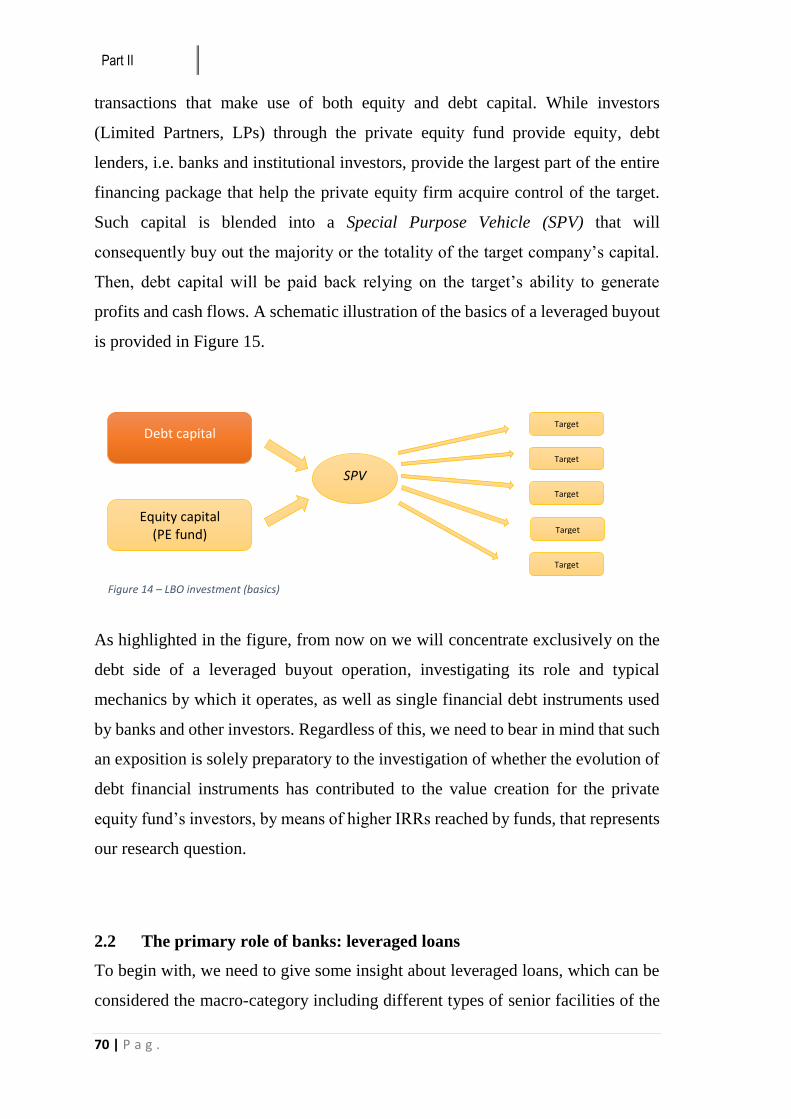
Part II
70 | P a g .
transactions that make use of both equity and debt capital. While investors
(Limited Partners, LPs) through the private equity fund provide equity, debt
lenders, i.e. banks and institutional investors, provide the largest part of the entire
financing package that help the private equity firm acquire control of the target.
Such capital is blended into a Special Purpose Vehicle (SPV) that will
consequently buy out the majority or the totality of the target company’s capital.
Then, debt capital will be paid back relying on the target’s ability to generate
profits and cash flows. A schematic illustration of the basics of a leveraged buyout
is provided in Figure 15.
As highlighted in the figure, from now on we will concentrate exclusively on the
debt side of a leveraged buyout operation, investigating its role and typical
mechanics by which it operates, as well as single financial debt instruments used
by banks and other investors. Regardless of this, we need to bear in mind that such
an exposition is solely preparatory to the investigation of whether the evolution of
debt financial instruments has contributed to the value creation for the private
equity fund’s investors, by means of higher IRRs reached by funds, that represents
our research question.
2.2 The primary role of banks: leveraged loans
To begin with, we need to give some insight about leveraged loans, which can be
considered the macro-category including different types of senior facilities of the
Debt capital
Equity capital (PE fund)
Target
SPV Target
Target
Target
Target
Figure 14 – LBO investment (basics)
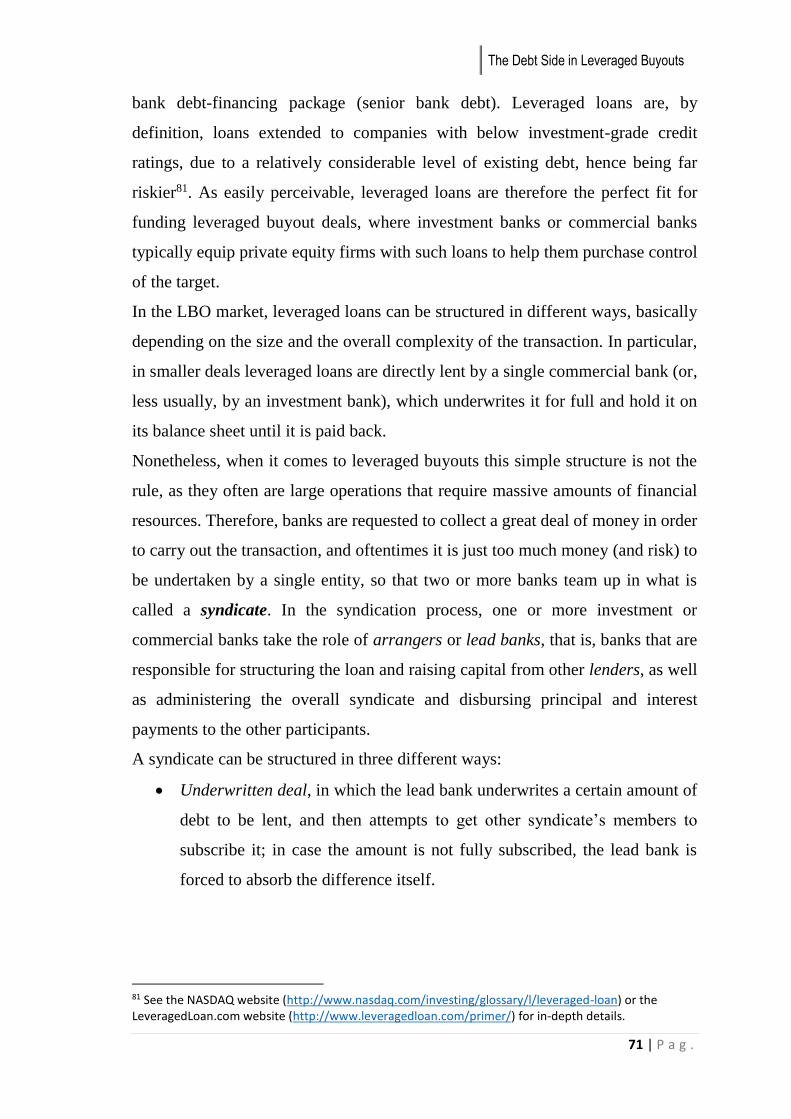
The Debt Side in Leveraged Buyouts
71 | P a g .
bank debt-financing package (senior bank debt). Leveraged loans are, by
definition, loans extended to companies with below investment-grade credit
ratings, due to a relatively considerable level of existing debt, hence being far
riskier81. As easily perceivable, leveraged loans are therefore the perfect fit for
funding leveraged buyout deals, where investment banks or commercial banks
typically equip private equity firms with such loans to help them purchase control
of the target.
In the LBO market, leveraged loans can be structured in different ways, basically
depending on the size and the overall complexity of the transaction. In particular,
in smaller deals leveraged loans are directly lent by a single commercial bank (or,
less usually, by an investment bank), which underwrites it for full and hold it on
its balance sheet until it is paid back.
Nonetheless, when it comes to leveraged buyouts this simple structure is not the
rule, as they often are large operations that require massive amounts of financial
resources. Therefore, banks are requested to collect a great deal of money in order
to carry out the transaction, and oftentimes it is just too much money (and risk) to
be undertaken by a single entity, so that two or more banks team up in what is
called a syndicate. In the syndication process, one or more investment or
commercial banks take the role of arrangers or lead banks, that is, banks that are
responsible for structuring the loan and raising capital from other lenders, as well
as administering the overall syndicate and disbursing principal and interest
payments to the other participants.
A syndicate can be structured in three different ways:
Underwritten deal, in which the lead bank underwrites a certain amount of
debt to be lent, and then attempts to get other syndicate’s members to
subscribe it; in case the amount is not fully subscribed, the lead bank is
forced to absorb the difference itself.
81 See the NASDAQ website (http://www.nasdaq.com/investing/glossary/l/leveraged-loan) or the LeveragedLoan.com website (http://www.leveragedloan.com/primer/) for in-depth details.
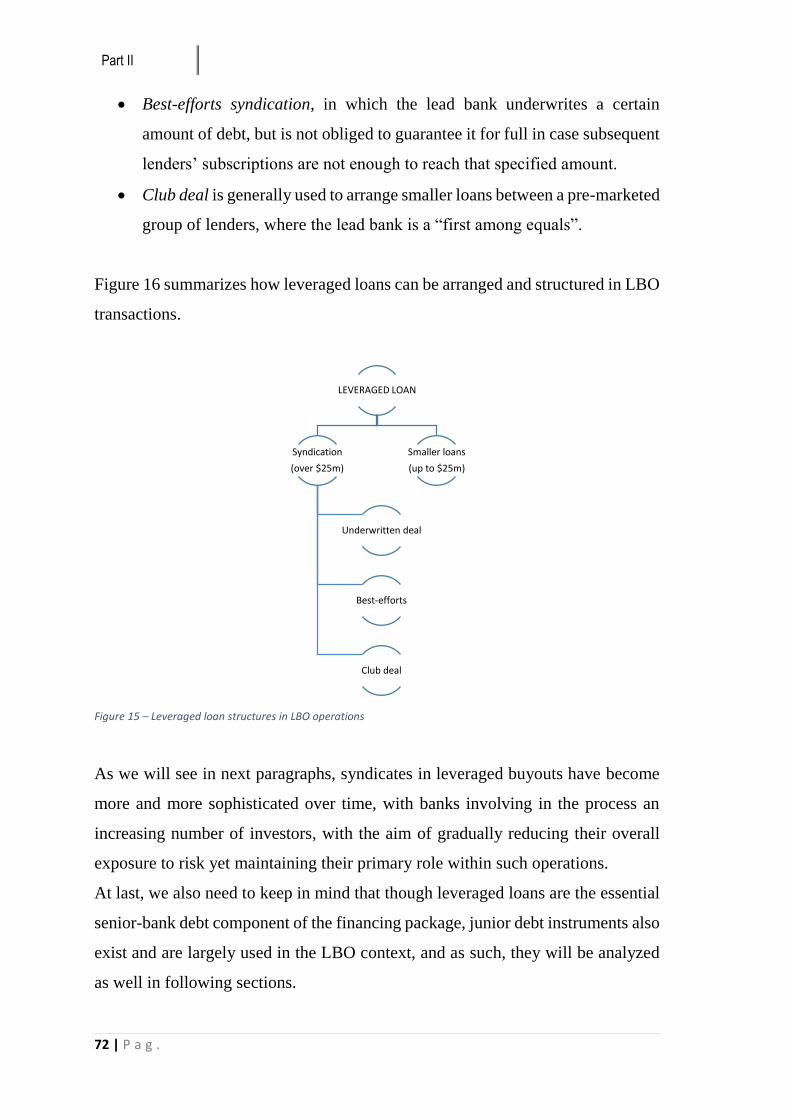
Part II
72 | P a g .
Best-efforts syndication, in which the lead bank underwrites a certain
amount of debt, but is not obliged to guarantee it for full in case subsequent
lenders’ subscriptions are not enough to reach that specified amount.
Club deal is generally used to arrange smaller loans between a pre-marketed
group of lenders, where the lead bank is a “first among equals”.
Figure 16 summarizes how leveraged loans can be arranged and structured in LBO
transactions.
Figure 15 – Leveraged loan structures in LBO operations
As we will see in next paragraphs, syndicates in leveraged buyouts have become
more and more sophisticated over time, with banks involving in the process an
increasing number of investors, with the aim of gradually reducing their overall
exposure to risk yet maintaining their primary role within such operations.
At last, we also need to keep in mind that though leveraged loans are the essential
senior-bank debt component of the financing package, junior debt instruments also
exist and are largely used in the LBO context, and as such, they will be analyzed
as well in following sections.
LEVERAGED LOAN
Syndication
(over $25m)
Underwritten deal
Best-efforts
Club deal
Smaller loans
(up to $25m)
The Debt Side in Leveraged Buyouts
73 | P a g .
2.3 The LBOs Financing Package (1980 – mid-1990s)
As we know, the 1980s were the first decade during which leveraged buyouts
began to gain popularity on a global scale, and as the LBO market boomed and
reached its peak in 1989, the financing package and usage of debt instruments
drastically evolved as well. Notably, not only did debt varied in terms of
compositions and financial instruments that were utilized to fund the deal, but also
in terms of the overall debt level over equity, reaching as high as 90 percent of the
total financing package. After that, private equity firms, investment banks and
other leveraged buyouts’ operators seemed to have learnt from mistakes that led to
the market plunge, rebalancing the capital structure of deals that were undertaken
in first years of the 1990 decade. That said, we will observe how the typical
financial structure of LBOs varied through the 1980s, exploring financing tools in
depth and factors that brought about a radical change in how such operations were
funded. To make the overall analysis more effective, we will separate debt on a
seniority basis, dividing senior debt from junior debt to better understand different
tools and catch interrelations between them that led to changes in the financial
structure funding.
2.3.1 Senior Debt
Senior debt typically comprises secured long- and short-term facilities arranged
and subscribed by banks that typically collaborate within a syndicate or, in smaller
transactions, by a single bank that fully underwrites it. The senior locution stands
for the fact that this kind of debt has the highest priority (i.e. a first claim) over the
target’s cash flows and assets pledged as collateral. In other words, as explained
above, senior debt comprises all categories of debt included in the leveraged loan
package, that can be syndicated or not and must be the first to be paid back. That
said, it remains to investigate which types of financing tools are included in what
is called the leveraged loan, its characteristics and its incidence on total debt, and
how this varied through years.
Part II
74 | P a g .
From the outset in the early 1980s, investment and commercial banks used to lend
senior debt to finance leveraged acquisitions, in the form of both long-term loans
and short-term facilities. In particular, the long-term component of senior debt was
typically a Term A loan, that is, an amortizing loan whose repayment is gradual
and has an average maturity of five to seven years. Such a loan is secured, meaning
that it has a first claim on the target’s cash flows and, in case of default, on assets.
As these loans exhibit the lowest risk exposure, however, they also yield the lowest
interest rate to banks (see Table 5). In the 1980s, Term A loans were known to
have covenant-heavy structures, namely, they were lent on the basis of both
incurrence covenants and maintenance covenants (as opposed to covenant-lite
structures that are solely based on incurrence covenants and will be further
discussed in next sections)82. This is consistent with a risk-averse approach from
banks, which want to mitigate their overall exposure toward highly-leveraged
operations and have their capital (and interests) back as soon as possible.
As anticipated, however, not only did banks use to lend long-term loans to finance
the target’s acquisition, but they also provided it with short-term facilities, mainly
to fund working capital necessities when the company got acquired. In particular,
banks often included a revolving credit facility or other types of debt instruments83
in the leveraged loan package, which the target could draw upon for short-term
needs.
We will now turn to analyze how senior debt evolved through the 1980s or, put
another way, how banks changed their behavior regarding LBO financing. After
few years from the onset of this phenomenon, banks began to realize how markets
82 Financial covenants can take the form of incurrence covenants and maintenance covenants. The formers are meant to be met before the loan is issued, with the purpose of not impairing debtholders’ interests by taking potentially harming actions such as strong dividend payments or the issuance of additional debt by the borrower. By contrast, maintenance covenants take the form of traditional financial ratios that must be met on an ongoing basis, and have the aim of preserving the ability of the borrower to make its payments at agreed deadlines: typical ratios include, amongst others, total debt to EBITDA and EBITDA to interest expenses. For further details, see Achleitner, A., Braun, R., Hinterramskogler, B. and Tappeiner, F. (2012), “Structure and Determinants of Financial Covenants in LBOs”, Review of Finance, Vol. 16, No. 3, pp. 658-668 83 Other forms of short-term financing were, by way of example, CAPEX facilities, acquisition lines of credit and stand-by letters of credit.

The Debt Side in Leveraged Buyouts
75 | P a g .
were eager to invest in leveraged buyouts, as very tempting returns had been
recorded and everybody wanted to put their capital in such profitable investments.
In other words, banks figured out that the LBO market was heating up and then
they started to adopt a “defensive approach” that can be summed up in three
facts84:
o Senior bank debt was drastically reduced over years, from 73% (over total
debt) in 1982 to an average value of 55% in the late-1980s;
o Banks required faster principal and interest repayments, also by means of
an increased usage of asset sales85 to speed up their debt payback;
o Banks increased the overall amount of up-front fees and commissions
charged.
As easily perceivable, investment and commercial banks changed their
commitment in the LBO market, and shifted from a “variable” toward somewhat
of a more “fixed” compensation scheme that put them in a safer position, reducing
their risk in this kind of operations. Nevertheless, the reduction in bank debt led to
neither a decrease of LBOs’ size nor a general drop in the buyout activity, since
banks started to replace senior debt with subordinated debt, and in particular high-
yield (junk) bonds that witnessed a boom since the mid-1980s, as we will discuss
in following sections. Basing on seminal Kaplan and Stein’s work, Table 6
provides the evolution of senior bank debt throughout the 1980 decade, exhibiting,
among others, some of the key characteristics of the aforementioned “defensive
approach”.
84 Kaplan, S.N. and Stein, J.C. (1993), “The Evolution of Buyout Pricing and Financial Structure in the 1980s”, The Quarterly Journal of Economics, Vol. 108, No. 2, pp. 330-335 85 Asset sales can be considered as an additional source of funding, since banks usually required private equity firms to divest part of the target’s businesses so as to accelerate principal and interest repayments.
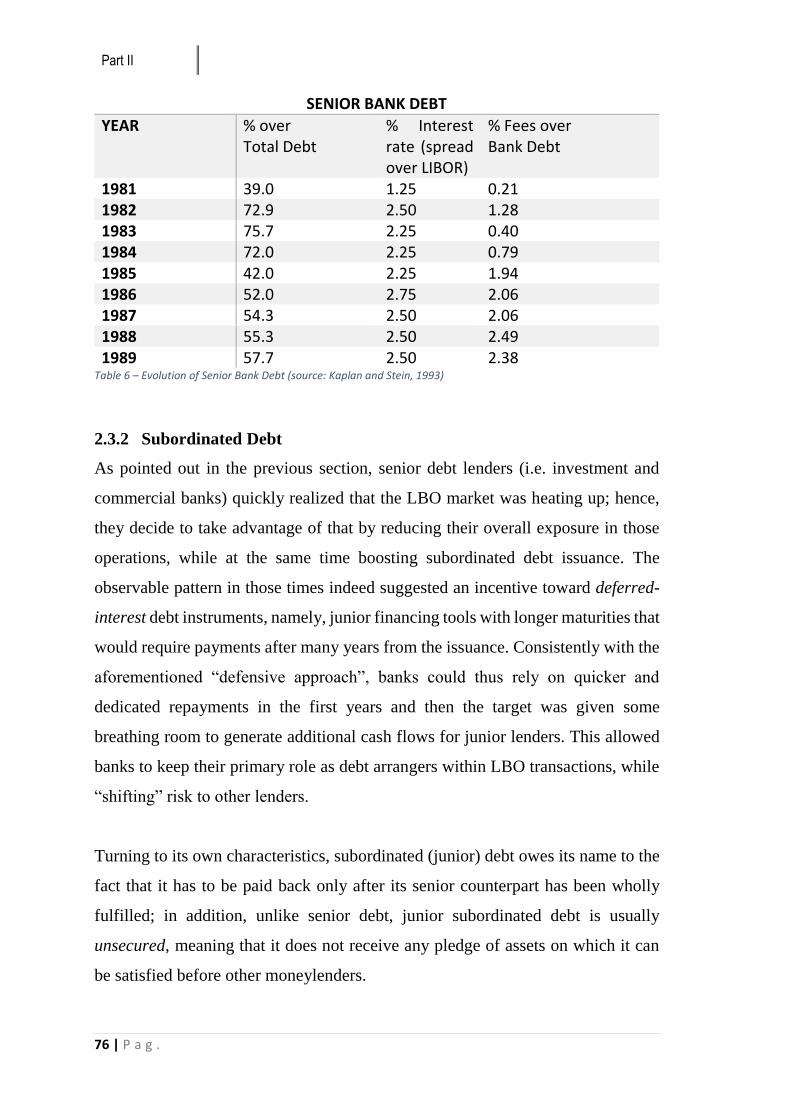
Part II
76 | P a g .
SENIOR BANK DEBT
YEAR % over Total Debt
% Interest rate (spread over LIBOR)
% Fees over Bank Debt
1981 39.0 1.25 0.21 1982 72.9 2.50 1.28 1983 75.7 2.25 0.40 1984 72.0 2.25 0.79 1985 42.0 2.25 1.94 1986 52.0 2.75 2.06 1987 54.3 2.50 2.06 1988 55.3 2.50 2.49 1989 57.7 2.50 2.38
Table 6 – Evolution of Senior Bank Debt (source: Kaplan and Stein, 1993)
2.3.2 Subordinated Debt
As pointed out in the previous section, senior debt lenders (i.e. investment and
commercial banks) quickly realized that the LBO market was heating up; hence,
they decide to take advantage of that by reducing their overall exposure in those
operations, while at the same time boosting subordinated debt issuance. The
observable pattern in those times indeed suggested an incentive toward deferred-
interest debt instruments, namely, junior financing tools with longer maturities that
would require payments after many years from the issuance. Consistently with the
aforementioned “defensive approach”, banks could thus rely on quicker and
dedicated repayments in the first years and then the target was given some
breathing room to generate additional cash flows for junior lenders. This allowed
banks to keep their primary role as debt arrangers within LBO transactions, while
“shifting” risk to other lenders.
Turning to its own characteristics, subordinated (junior) debt owes its name to the
fact that it has to be paid back only after its senior counterpart has been wholly
fulfilled; in addition, unlike senior debt, junior subordinated debt is usually
unsecured, meaning that it does not receive any pledge of assets on which it can
be satisfied before other moneylenders.
The Debt Side in Leveraged Buyouts
77 | P a g .
Junior debt includes a broad range of subordinated financing instruments that
could be classified as either private or public issuances, depending on the nature
of the placement: while the former case involves direct negotiations with private
financial companies, the latter considers issuances to the whole public of investors.
In particular, both forms were present during the 1980s, with increasing
importance over years.
Many financial companies were involved in leveraged buyouts financing by means
of mezzanine capital lending86, that is, a hybrid instrument that is halfway between
debt and equity. Generally, mezzanine financing is unsecured and gives the lender
the opportunity to convert debt into stocks should particular conditions occur (so-
called equity-kicker)87. Given its high-risk nature, mezzanine capital has a high
interest rate as well, whose payment is commonly split between a part of cash and
a part of so-called Payment-In-Kind (PIK) interests88.
Furthermore, Kaplan and Stein89 argued an increased usage of so-called cram
down debt, that is, debt issued by the target once it got acquired as part of the
payment to the pre-buyout shareholders. As other subordinated debt instruments,
the cram down component witnessed higher volumes starting from the mid-1980s.
At last, we need to mention the role of strip financing techniques90, even though
their relevance dwindled during the decade in favor of other financing tools.
2.3.2.1 The junk bond market explosion
Despite aforementioned subordinated debt instruments were widely used
throughout the 1980 decade, none of them was anywhere near as popular as high-
yield bonds became in those times.
86 Institutional investors such as banks, insurance companies, hedge funds and pension funds typically lend mezzanine capital through proprietary specialist investment funds. 87 In many mezzanine-financing contracts, the equity-kicker may be limited or called off for a predetermined higher interest rate. 88 PIK toggles provide the borrower with the possibility to pay due interests either in cash or by increasing the principal amount by the amount of the interest. Their purpose is to lighten the debt burden of the borrower in a time of financial difficulty. 89 Kaplan, S.N. and Stein, J.C. (1993), “The Evolution of Buyout Pricing and Financial Structure in the 1980s”, The Quarterly Journal of Economics, Vol. 108, No. 2, pp. 336-340 90 Strip financing consists of mixing and repackaging debt with equity securities. In LBOs, strip debt mainly refer to subordinated rather than senior debt.
Part II
78 | P a g .
High-yield bonds (commonly referred to as junk bonds) are speculative-grade
bonds rated less than BBB by Standard and Poor’s or, alternatively, less than Baa
by Moody’s, with maturities that range from five up to twenty years. In a leveraged
buyout context, junk bonds are the most junior financial instrument, senior only to
equity, and hence exhibit significant returns (as the name itself suggests).
According to what we have reported so far, it ought not to be difficult to understand
reasons why these bonds reached such a huge popularity for financing LBOs. In
fact, the tempting returns recorded by early leveraged transactions prompted more
and more investors into chasing such high profits, putting a lot of pressure on
participating in LBO deals. As a result, banks cleverly reduced their commitment
so as to let covetous investors have more “skin in the game” and pawning much of
the risk off on them. The outcome was what we all know – a literal explosion of
the junk bonds supply, with a respective proportional demand from worldwide
investors.
There is a great deal of research and publications showing the spectacular growth
of these securities over the 1980s91. Moreover, evidence suggests that the greatest
part of high-yield bonds rose in the leveraged buyout market: while 89 percent of
junk bonds was related to small and medium enterprises in 1980, 93 percent of
those were issued to finance leveraged acquisitions only nine years later, with the
remainder being for small entrepreneurs92. In the wake of Kaplan and Stein’s
seminal findings, other scholars93 studied the impact of junk bonds in LBO
transactions and results are somewhat impressive: while the percentage of LBO
deals that included a deferred-interest component within the financing package
was virtually close to zero in 1981, it reached its peak in 1990 with an average 75
percent of deals that made use of junk bond financing, reaching as high as 35
percent of the total financing package.
91 For a thorough examination of the junk bond phenomenon in the 1980s, see Auerbach, A.J. (1987), Mergers and Acquisitions, University of Chicago Press, Chicago (IL), pp. 5-24 92 Deitsch, M. (1990), “LBOs and Junk Bonds – Good Tools That Went Haywire”, Financial Executive, Vol. 6, No. 5, p. 70 93 Roden, D.M. and Lewellen W.G. (1995), “Corporate Capital Structure Decisions: Evidence from Leveraged Buyouts”, Financial Management, Vol. 24, No. 2, p. 81

The Debt Side in Leveraged Buyouts
79 | P a g .
These results undoubtedly show how huge an impact had these high-yield bonds
in the leveraged buyout market; in Table 7, we provide a summary of some of the
most common types that used to be issued in the LBO financing process.
High-yield bond type Description Zero-coupon bonds (“zeros”) Principal and interests payment is unique and
carried out at maturity. Split-coupon bonds Offer a lower interest rate for first years, and
a predetermined higher rate for later years. Pay-In-Kind bonds Gives the borrower the opportunity to pay
interests either in cash or by issuing additional securities.
Reset-provision bonds Offer a relatively low interest rate at first, but promise a higher rate at a specified future date so as to compensate for the initial lower level.
Extendable-reset bonds Gives the borrower the faculty of resetting the coupon rate and extending the bond’s maturity periodically or at the time of specified events.
Convertible bonds Offer the opportunity to be converted into common stocks under stated terms.
Table 7 – Different types of high-yield bonds
Considering that the above list is not to be considered as thorough (as a matter of
fact, any issuer can customize its bonds’ contents), it clearly reports the most used
junk bonds within a leveraged buyout scope on a standardized basis94.
Consistently with what we stated in prior sections, one thing that is worth
observing is that a large part of these high-yield bonds defers cash interest
payments at longer dates in the future, so that the target can dedicate its early
generation of cash flows to repaying banks senior debt. This fits well with the
“defensive approach” taken on by banks in order to mitigate their exposure to
leveraged buyouts risk, and is strictly related to the overheated market that finally
crashed at the end of the 1980s. A summary of the overwhelming rise of high-yield
bonds in LBO operations is provided in Table 8.
94 See the SIFMA website www.investinginbonds.com for an up-to-date analysis of various typologies of junk bonds. The Securities Industry and Financial Market Association (SIFMA) is an American financial association that deals with the development of ethical best practices in finance and help educate investors.
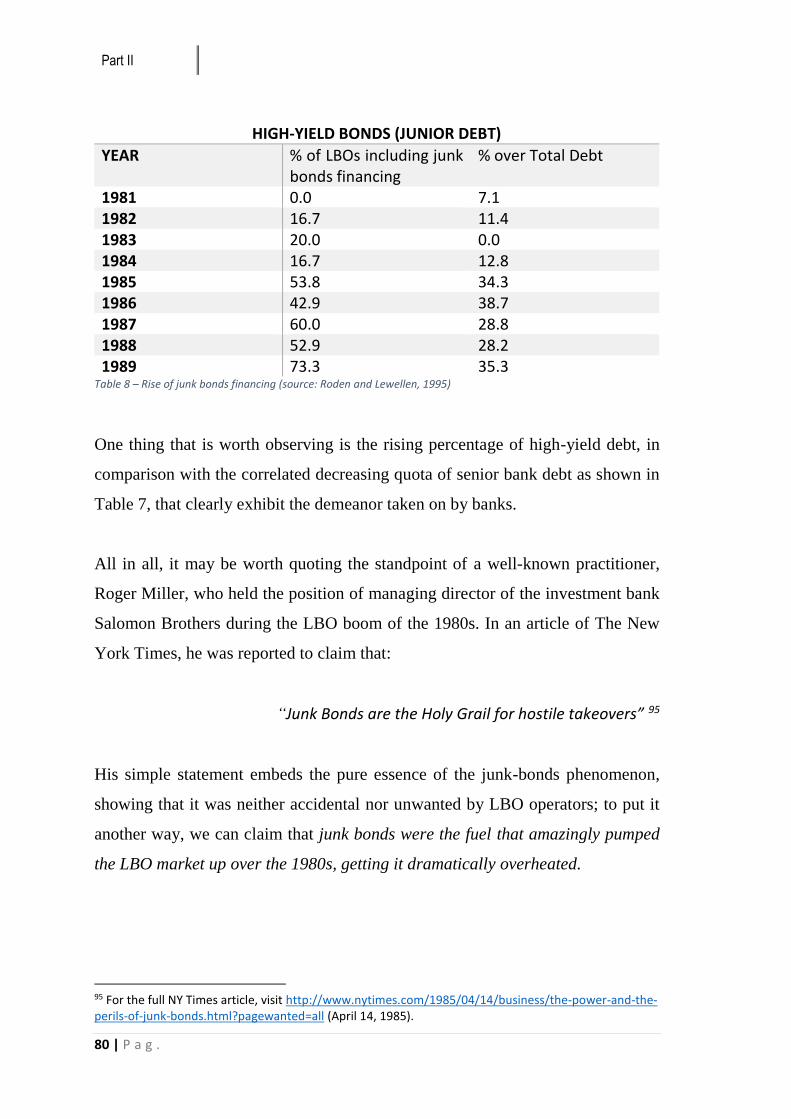
Part II
80 | P a g .
HIGH-YIELD BONDS (JUNIOR DEBT)
YEAR % of LBOs including junk bonds financing
% over Total Debt
1981 0.0 7.1 1982 16.7 11.4 1983 20.0 0.0 1984 16.7 12.8 1985 53.8 34.3 1986 42.9 38.7 1987 60.0 28.8 1988 52.9 28.2 1989 73.3 35.3
Table 8 – Rise of junk bonds financing (source: Roden and Lewellen, 1995)
One thing that is worth observing is the rising percentage of high-yield debt, in
comparison with the correlated decreasing quota of senior bank debt as shown in
Table 7, that clearly exhibit the demeanor taken on by banks.
All in all, it may be worth quoting the standpoint of a well-known practitioner,
Roger Miller, who held the position of managing director of the investment bank
Salomon Brothers during the LBO boom of the 1980s. In an article of The New
York Times, he was reported to claim that:
“Junk Bonds are the Holy Grail for hostile takeovers” 95
His simple statement embeds the pure essence of the junk-bonds phenomenon,
showing that it was neither accidental nor unwanted by LBO operators; to put it
another way, we can claim that junk bonds were the fuel that amazingly pumped
the LBO market up over the 1980s, getting it dramatically overheated.
95 For the full NY Times article, visit http://www.nytimes.com/1985/04/14/business/the-power-and-the-perils-of-junk-bonds.html?pagewanted=all (April 14, 1985).
The Debt Side in Leveraged Buyouts
81 | P a g .
2.3.3 1989: the end of an era?
As already seen in Part I, the symbolic LBO of RJR Nabisco in 1989 is usually
referred to as the highest peak of the first leveraged buyout boom, after which the
market dramatically plunged. However, what actually led to such a sudden fall is
not puzzling at all; rather, it can be considered as the inescapable outcome of a
continuum of events that strongly inflated the LBO market starting from the mid-
1980s. Obviously, we mainly refer to what we have exposed so far, with the junk
bond advent and rise as the primary factor of such a catastrophe. Consistently with
Kaplan and Stein’s “overheated market” hypothesis, the attractive returns that
spurred millions of investors into taking part in LBO deals brought huge quantities
of money in the market, and ever more operations were undertaken consequently.
Yet, due to the fact that larger amounts of committed capital did not imply a
proportional higher number of good targets to be acquired, the majority of deals
that were carried out in the second half of the 1980s was nowhere near as good and
profitable as operations that were realized some years earlier. On top of that, many
of these later deals were found to be overpriced, as a consequence of the abundant
committed capital that was made available from avid investors. The authors best
simplified this situation by claiming that there was “too much financing chasing
too few good deals”.
The final result of this escalation was the abrupt market bubble’s burst that took
place in 1989, with an increasing default rate and many more deals that ended up
in bankruptcy96.
In the aftermath of the first market fall, investors who just little time earlier
excitedly rushed to allocate their capital in LBO deals realized how flimsy the
market had become, and as far as possible, they immediately drew their capital
back. In the same manner, private equity firms and investment banks began to
reorganize the financial structure of deals they undertook, even as a consequence
of the renewed scarceness of capital to deploy. The LBO market was starting to
96 In their sample, Kaplan and Stein calculated an average 2% default rate for deals completed between 1980 and 1984, compared to a 27% default rate for those completed in the subsequent 1985-1989 period. Almost the half of these landed in bankruptcy court.
Part II
82 | P a g .
rebound, as smaller and more balanced quantities of capital were available that
allowed private equity funds to solely invest in profitable deals, as well as to
structure more reasonably their relative financial packages. Even the debt to equity
ratio (D/E) carefully decreased, from 85 to 90 percent down to an average of 70 to
80 percent.
After the junk bond crisis of the late-1980s that led a huge quantity of LBO deals
to severe financial distress, the LBO market finally ran out of its fuel and had to
completely rethink its ways of structuring and financing transactions, so as not to
perpetrate the mistakes that had been made.
2.4 The LBOs Financing Package (mid-1990s – 2007)
In this paragraph, we will proceed with the analysis of the LBOs financing package
in the period that starts from the second half of the 1990s, to finally get to 2007,
that is, the year in which the worldwide financial crisis occurred, tragically ending
what is best known as the second LBO boom97. As we will see in this and following
sections, the leveraged buyout market witnessed a second wave of boosted credit
availability that seemed like it would have never stopped, as investors kept on
pushing massive amounts of capital into funds to finance leveraged transactions.
Nevertheless, this renewed investors’ confidence in LBOs had nothing to do with
the junk bonds’ explosion that took place during the 1980s; rather, it was the result
of far more sophisticated and complex mechanisms that involved structured
finance products and strong usage of credit derivatives, and that dramatically came
to an end with the advent of the 2007 financial crisis.
In this section, we will observe the evolution that had characterized the typical
LBO financing package over this time span, concentrating in particular on changes
intervened in senior and junior financial instruments, and that is strictly related and
97 As a matter of fact, this second period of increased LBO activity can be traced back to the early 2000s, though most of the changes that characterized it began to be used starting from the last years of the 1990s decade.
The Debt Side in Leveraged Buyouts
83 | P a g .
preparatory to the entrance of the aforementioned structured products and
derivatives. Likewise the previous paragraph, we will divide debt instruments and
their usage on a seniority basis, attempting to make the analysis effective as much
as possible.
2.4.1 Senior Debt
Even during the period that goes from the mid-1990s to 2007, senior debt had
proven its predominance in the overall financing package, accounting for a large
percentage over total debt. Syndicates confirmed their primary role for arranging
and providing leveraged loans to finance LBO transactions, yet this does not imply
that nothing changed at all. In fact, banks restarted to put in place their conservative
process initiated back in the 1980s, what we have so far called their “defensive
approach”. Consistently, Term A loans provided by banks exhibited a sharp per
cent decrement over years, yet being quickly replaced by other lower-term senior
loans. Regardless, this shift became evident starting from 2004 onward. Similarly,
even short-term debt in the traditional form of revolving credit and CAPEX
facilities underwent a substantial decrease98.
The clear objective for banks is, as usual, to take on an ever more decreasing
percentage of risk, participating in these operations in different yet more fixed and
profitable ways, while shifting much of the underlying risk on other subjects.
2.4.1.1 The Advent of Institutional Investors
As a consequence of the sharpening process that banks put in place to reduce their
overall risk in highly-leveraged transactions, an increasing number of
moneylenders were admitted into the syndicate, along with newer forms of
financing. As a matter of fact, many categories of institutional investors got
gradually involved in LBOs, becoming leading actors alongside traditional
98 Demiroglu, C. and James, C.M. (2011), “The Role of Private Equity Group Reputation in LBO Financing”, Journal of Financial Economics, Vol. 96, No. 2, pp. 311-313
Part II
84 | P a g .
bankers in the senior lending process. Technically speaking, the syndicate arranger
underwrites a certain amount of Term B and C debt that will later attempt to sell
to institutional investors, which will in turn enter the syndicate in this way.
As anticipated above, the decrease in Term A loans was strictly related to the rise
of another type of senior loans, called Term B and Term C loans, held by
institutional investors such as hedge funds, pension funds and insurance
companies99. These types of subprime loans have longer maturities (typically from
seven to ten years) as well as a bullet structure, meaning that they generally get to
be repaid in a single tranche at the maturity date, as opposed to the amortizing
structure of Term A loans100. Although Term B and C loans started to be used
during the last years of the 1990s, they thrived enormously only some years later,
starting from the early 2000s.
A great deal of research has also focused on the fact that these lower-grade loans
usually exhibited a relatively poor covenant framework, obtaining the name of
covenant-lite loans. As such, covenant-lite loans differ from typical covenant-
heavy structures of typical banks’ debt by the fact that they only embed incurrence
financial covenants, while no maintenance provision is observed. As specified in
previous sections, these incurrence clauses are only to be met on a preliminary
basis, with the aim of not impairing the lender’s interests by taking potentially
harmful actions101. Nevertheless, they do not include any traditional financial
ratios to be abided by on an ongoing basis. Hence, covenant-lite loans exhibit a
higher degree of risk, due to the fact that they are far less restrictive than traditional
covenant-heavy structures102.
99 Even though Term B and Term C loans are the most usual, bigger syndicates can comprise up to Term H loans, each level with a decreasing degree of seniority when compared to the upper level. 100 The bullet structure, along with the longer maturity, entails that Term B, C and lower loans can be paid back only after the whole reimbursement of banks’ Term A loans. 101 Typical incurrence covenants include dividends lock-up and prohibition of issuing additional debt. 102 For a thorough examination of the covenants issue, see Bavaria, S.M. and Lai, A. (2007), “The Leveraging of America: Covenant-Lite Loans Diminish Recovery Prospects”, available at: http://s3.amazonaws.com/zanran_storage/www2.standardandpoors.com/ContentPages/561145523.pdf (accessed March 2016)
The Debt Side in Leveraged Buyouts
85 | P a g .
From an analytical perspective, the rise of these newer types of loans indicates that
banks did not modify their risk-averse attitude, rather they took advantage of the
willingness of many institutional investors to get involved in LBOs by persuading
them into subscribing growing amounts of senior (yet riskier) debt, all in pursue
of a higher yield. In other words, banks maintained their traditional “defensive
approach” that already experienced during the 1980s. It remains to understand how
investment banks managed to persuade institutional investors to subscribe such
huge amounts of debt, thereby replacing traditional bank debt and its correlated
risk. As we will describe in the ad-hoc section, that has a lot to do with derivatives.
2.4.2 Subordinated Debt
The advent of institutional investors in LBO financing was not limited to senior
debt lending, rather a new form of junior financing tool was introduced, especially
from the first years of the 2000s: the second-lien loan. These new type of loans,
as the name itself suggests, have a second claim either on a specified pool of the
target’s assets or on the company as a whole, that rank behind Term A, B and C
loans and working capital facilities, though prioritized compared to mezzanine
capital, high-yield bonds and other junior facilities. However, since they rank as
junior debt, second-lien loans carry a higher interest rate and are often repayable
after a period of eight to ten years in a single tranche (bullet structure). As of their
very introduction, these type of loans was not intended to be held by banks, rather
they were issued for institutional investors. According to Demiroglu and James103,
while issuances of these loans were virtually close to zero until 2004, the second-
lien market was $28 billion worth the year after, with 1 out of 2 LBO deals
including such a component. Second-lien loans accounted for an average of seven
to ten percent, over the whole amount of debt financing in a typical LBO deal.
103 Demiroglu, C. and James, C.M. (2010), “The Role of Private Equity Group Reputation in LBO Financing”, Journal of Financial Economics, Vol. 96, No. 2, pp. 307-309
Part II
86 | P a g .
As far as typical junior debt financial instruments are concerned, such as
mezzanine financing, private placements and high-yield bonds, these are found to
have slightly decreased, standing at a 12 to 14 percent over the full debt package.
2.4.3 Other Debt
Regardless of the fact that a large part of LBOs was financed with more common
debt tools analyzed above, this does not imply that any other types were actually
used. Notably, some leveraged buyout transactions included what are commonly
referred to as vendor loans, sponsor loans and assumed debt104.
A vendor loan is a loan directly provided by the seller (“vendor”) of the target, and
it usually takes the form of a “discount” over the total price to be paid, deferring it
to a later time. However, this discount often accounts for a risible part of the full
price, reaching up to 0.5% of it.
Conversely, a sponsor loan is directly provided by the private equity firm, and may
be issued in case the transaction is found to require a slight additional amount of
capital to be completed. Nevertheless, similarly to vendor loans, these loans were
very little used and, if any, they accounted for an average 0.3% over total debt.
At last, unlike these two types of loans, assumed debt consists of a part of the
preexistent debt that is taken on by the new acquirer, instead of getting reimbursed
as part of the transaction. However, a strict minority of LBO deals was reported to
make use of it.
2.4.4 Developments in buyout financing
In this last section, we will provide evidence about how the typical financial
structure of an LBO deal varied over time. In particular, due to the rising incidence
104 Axelson, U., Jenkinson, T., Strömberg, P. Weisbach, M.S. (2013), “Borrow Cheap, Buy High? The Determinants of Leverage and Pricing in Buyouts”, Journal of Finance, Vol. 68, No. 6, pp. 2233-2237
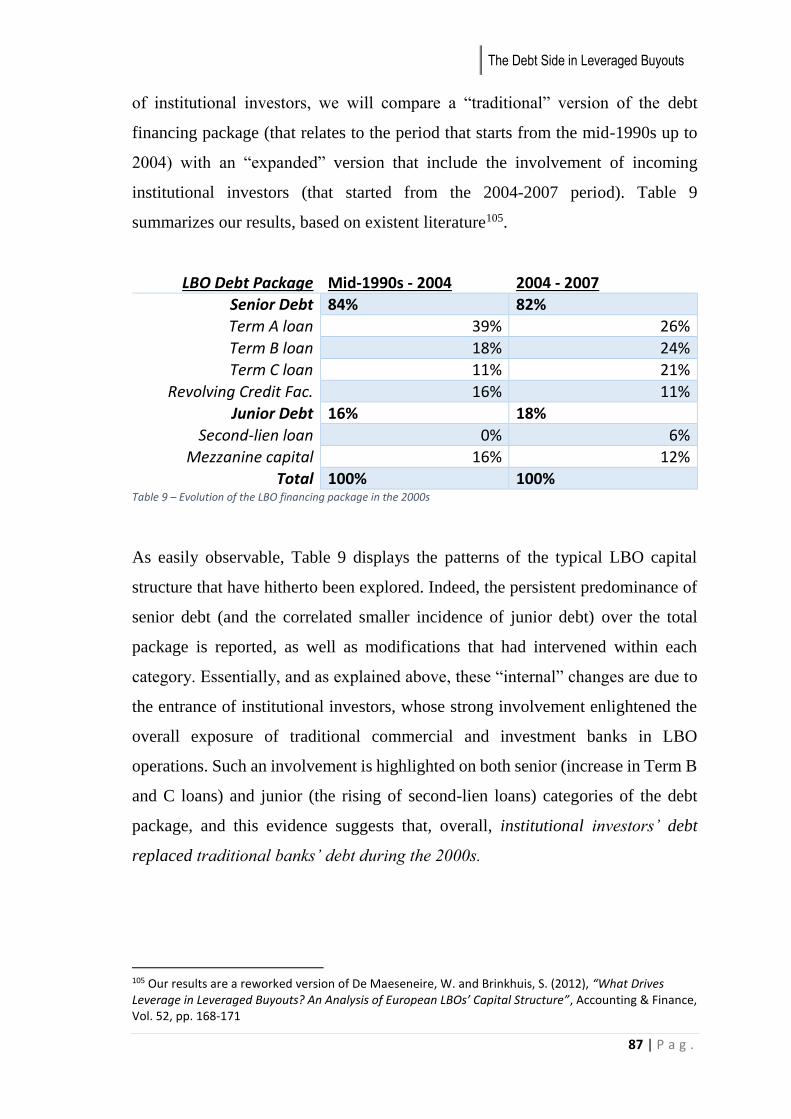
The Debt Side in Leveraged Buyouts
87 | P a g .
of institutional investors, we will compare a “traditional” version of the debt
financing package (that relates to the period that starts from the mid-1990s up to
2004) with an “expanded” version that include the involvement of incoming
institutional investors (that started from the 2004-2007 period). Table 9
summarizes our results, based on existent literature105.
LBO Debt Package Mid-1990s - 2004 2004 - 2007
Senior Debt 84% 82%
Term A loan 39% 26%
Term B loan 18% 24%
Term C loan 11% 21%
Revolving Credit Fac. 16% 11%
Junior Debt 16% 18%
Second-lien loan 0% 6%
Mezzanine capital 16% 12%
Total 100% 100% Table 9 – Evolution of the LBO financing package in the 2000s
As easily observable, Table 9 displays the patterns of the typical LBO capital
structure that have hitherto been explored. Indeed, the persistent predominance of
senior debt (and the correlated smaller incidence of junior debt) over the total
package is reported, as well as modifications that had intervened within each
category. Essentially, and as explained above, these “internal” changes are due to
the entrance of institutional investors, whose strong involvement enlightened the
overall exposure of traditional commercial and investment banks in LBO
operations. Such an involvement is highlighted on both senior (increase in Term B
and C loans) and junior (the rising of second-lien loans) categories of the debt
package, and this evidence suggests that, overall, institutional investors’ debt
replaced traditional banks’ debt during the 2000s.
105 Our results are a reworked version of De Maeseneire, W. and Brinkhuis, S. (2012), “What Drives Leverage in Leveraged Buyouts? An Analysis of European LBOs’ Capital Structure”, Accounting & Finance, Vol. 52, pp. 168-171
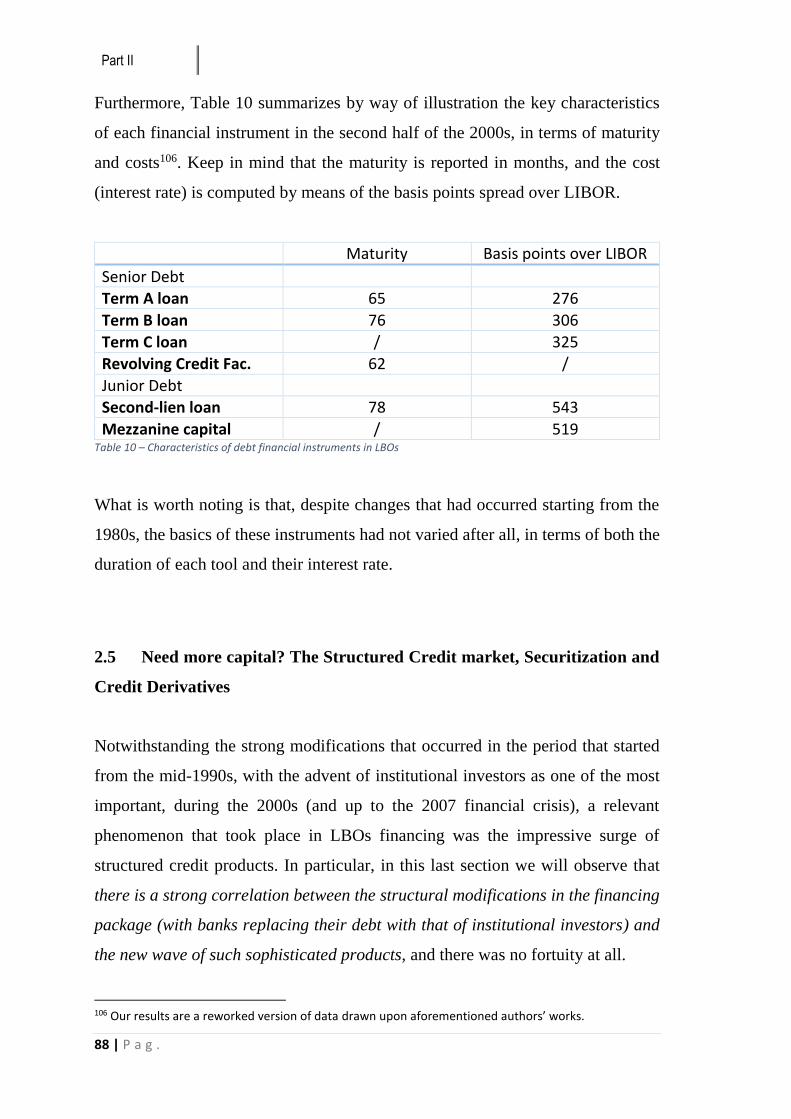
Part II
88 | P a g .
Furthermore, Table 10 summarizes by way of illustration the key characteristics
of each financial instrument in the second half of the 2000s, in terms of maturity
and costs106. Keep in mind that the maturity is reported in months, and the cost
(interest rate) is computed by means of the basis points spread over LIBOR.
Maturity Basis points over LIBOR
Senior Debt
Term A loan 65 276
Term B loan 76 306
Term C loan / 325
Revolving Credit Fac. 62 /
Junior Debt
Second-lien loan 78 543
Mezzanine capital / 519 Table 10 – Characteristics of debt financial instruments in LBOs
What is worth noting is that, despite changes that had occurred starting from the
1980s, the basics of these instruments had not varied after all, in terms of both the
duration of each tool and their interest rate.
2.5 Need more capital? The Structured Credit market, Securitization and
Credit Derivatives
Notwithstanding the strong modifications that occurred in the period that started
from the mid-1990s, with the advent of institutional investors as one of the most
important, during the 2000s (and up to the 2007 financial crisis), a relevant
phenomenon that took place in LBOs financing was the impressive surge of
structured credit products. In particular, in this last section we will observe that
there is a strong correlation between the structural modifications in the financing
package (with banks replacing their debt with that of institutional investors) and
the new wave of such sophisticated products, and there was no fortuity at all.
106 Our results are a reworked version of data drawn upon aforementioned authors’ works.
The Debt Side in Leveraged Buyouts
89 | P a g .
However, the entrance of structured finance products within the LBO market was
nothing unpredictable, if we consider the reasons why they were created and what
they are actually aimed at. Structured finance, indeed, consists of creating complex
and highly sophisticated financial instruments (structured credit products) for
companies that want to increase their sources of financing, while transferring the
overall risk at the same time. Among others, structured finance makes use of a
securitization process to create particular types of securities.
Securitization can be referred to as the process whereby a pool of a company’s
assets are collected and transferred to a special entity (special purpose vehicle,
SPV) so as to sell their related cash flows to investors against the issuance of
specific securities that use those assets as collaterals. The company that carries out
the securitization process aims at immediately cashing out its worth by issuing
assets-backed securities that give the owner the right to obtain regular cash flows
stemming from those assets, on a deferred basis107. In other words, the company
transfers the asset-associated risk to the securities investors, giving them the right
to benefit from regular payments over the assets lifespan, while collecting their
whole worth straightaway.
There are multiple reasons why securitization, and in general structured finance, is
advantageous to highly-leveraged transactions: besides transferring risk to buyers
of structured products, it also permits to optimize the full utilization of available
capital squeezing out as much money as possible, and it often has a lower cost
compared to traditional bank loans, especially for companies with low credit
ratings. On the flip side, however, securitization typically requires a longer span
of time to collect capital, as securities are sold piecemeal, and investment banks
usually charge higher fees for the whole arrangement process108.
107 Although any company may start securitizing their assets, banks are generally known for having used the most this sophisticated process. In fact, securitization has been widely used to quickly monetize some of the most illiquid banks’ assets, such as residential and commercial mortgages, auto loans and student loans. 108 Maiden, B. (2006), “Acquisition Securitization Takes Off in the US”, International Financial Law Review, Vol. 25, No. 5, pp. 8-9
Part II
90 | P a g .
In LBO operations, securitization is commonly carried out in a twofold form,
depending on the nature of the originator, that may be the target company (through
the private equity firm) and/or the investment bank that leads the syndicate.
In fact, securitization can take the form of:
o ABS (Asset-Backed Securities) issuance, with a pool of the target’s assets
as collaterals;
o CDOs (Collateralized Debt Obligations) issuance, on the other hand, that
was carried out by investment and commercial banks, as well as
institutional investors, by pooling part of their leveraged loan portfolio and
selling them to other investors in several tranches.
Both of them will be in depth analyzed in following sections, attempting to get
across how huge an impact these securitization methods had in heating up the LBO
market in what is known as the second LBO boom that tragically ended with the
advent of the financial crisis in 2007.
2.5.1 The usage of ABS in “Securitized” LBOs
Asset-Backed Securities (ABS)109 had become a relevant component of the overall
debt package of LBOs. Although this type of financing had always been used since
the very beginning in the early 1980s, ABS began to gain popularity only starting
from the mid-1990s, to definitively flourish over the subsequent decade110.
As anticipated in the prior paragraph, the ABS securitization (also called pass-
through securitization) involves pooling a set of the LBO target’s assets into a
109 Due to their very nature, ABS can be generally considered as a form of structured bonds. To all intents and purposes, ABS purchasers can thus be referred to as bondholders. 110 For a detailed analysis of the role of ABS in LBOs, see Bouvier, L. and Nisar, T.M. (2015), “Design and Impact of Securitized Leveraged Buyouts”, Cogent Economics and Finance, Vol. 3, No. 1
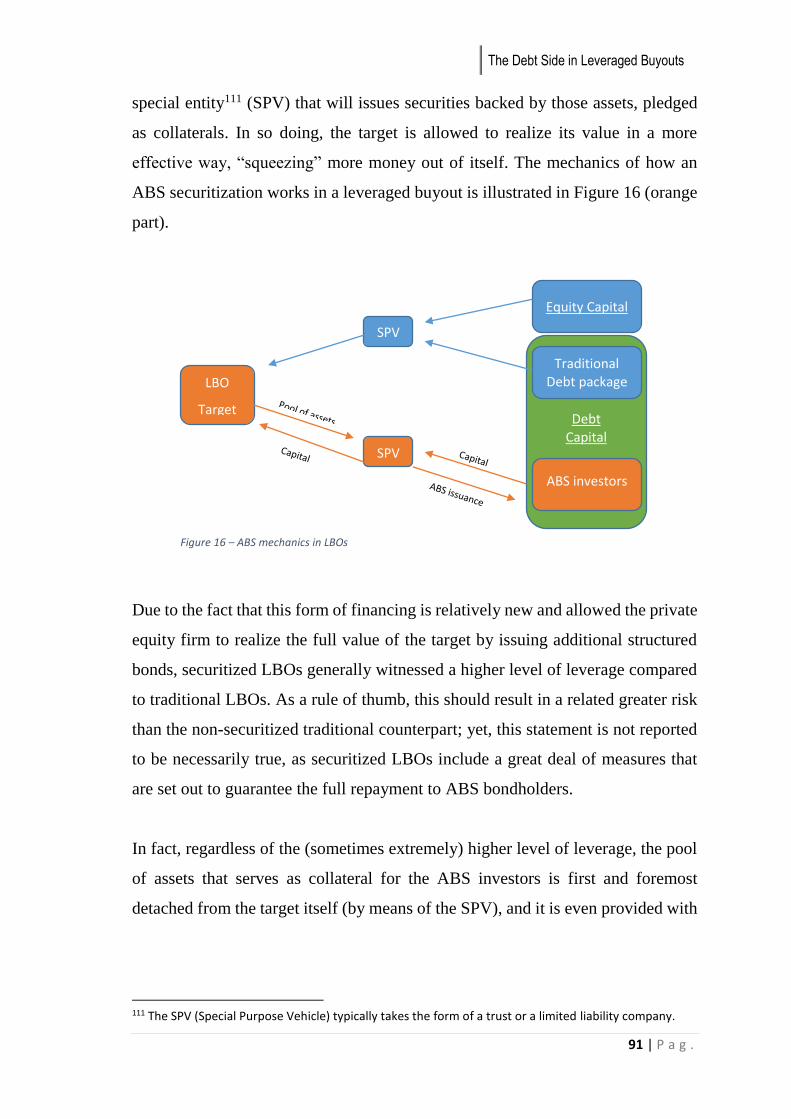
The Debt Side in Leveraged Buyouts
91 | P a g .
special entity111 (SPV) that will issues securities backed by those assets, pledged
as collaterals. In so doing, the target is allowed to realize its value in a more
effective way, “squeezing” more money out of itself. The mechanics of how an
ABS securitization works in a leveraged buyout is illustrated in Figure 16 (orange
part).
Due to the fact that this form of financing is relatively new and allowed the private
equity firm to realize the full value of the target by issuing additional structured
bonds, securitized LBOs generally witnessed a higher level of leverage compared
to traditional LBOs. As a rule of thumb, this should result in a related greater risk
than the non-securitized traditional counterpart; yet, this statement is not reported
to be necessarily true, as securitized LBOs include a great deal of measures that
are set out to guarantee the full repayment to ABS bondholders.
In fact, regardless of the (sometimes extremely) higher level of leverage, the pool
of assets that serves as collateral for the ABS investors is first and foremost
detached from the target itself (by means of the SPV), and it is even provided with
111 The SPV (Special Purpose Vehicle) typically takes the form of a trust or a limited liability company.
Debt Capital
LBO
Target
SPV
Traditional Debt package
Equity Capital
SPV
ABS investors
Figure 16 – ABS mechanics in LBOs
Part II
92 | P a g .
an operational plan that includes financial and operating covenants112 that make
the securities issuance relatively safe. By way of illustration, financial covenants
can include the establishment of a DCR (Debt Coverage Ratio) and a minimum
level of the target net worth to be maintained on an ongoing basis. On the other
hand, operating covenants can envisage the appointment of some independent
directors, as well as the prohibition of undertaking acquisitions, mergers or
disposals beyond certain limits and, oftentimes, a dividend lock-up113. What is
more, not only is this set of covenants meant to be met only by the target company,
but also the private equity firm is usually required to abide by these restrictions.
The breach of one or more such covenants may thus result in accelerated payments
in favor of ABS bondholders, as well as a curtailment of the overall maturity.
A further measure of safeness relates to the amortizing (rather than bullet) structure
of the ABS loan, so that bondholders are entitled to benefit from regular payments
over the entire duration of the loan.
The purpose of all of these measures is to enhance the credit capacity of the target,
so that it can service its securitized debt. In other words, bondholders are protected
from any deterioration in the company’s financial condition and their investment
can be considered relatively safe, despite the higher level of leverage that is
reached. For this reasons, ABS can be ultimately thought of as a type of senior
bonds, as opposed to junior (high-yield) bonds that gained popularity during the
1980s114.
112 The range of covenants that is set out to preserve financial stability may vary depending on the specific LBO target’s characteristics, in particular its business volatility. Broadly speaking, a target company with a higher level of volatility is more likely to be added a wider and more restrictive set of covenants, compared to a more established company with stable cash flows. 113 For a thorough examination of the matter, see Bouvier, L. and Nisar T.M. (2015), “Disciplining Management or Guiding Management: Aligning Interests in Securitized Leveraged Buyouts”, Journal of Corporate Accounting & Finance, Vol. 26, No. 2 114 Although the fact that ABS are a structured finance product, they thus have nothing to do with the reckless level of risk that was typical of the junk bonds responsible for the first LBO crash occurred in 1989.
The Debt Side in Leveraged Buyouts
93 | P a g .
2.5.2 “We created the investor”: investment banks’ CDOs
Regardless of the significant rise of ABS issuance as part of the overall LBO
financing package, that is not the main driver that led to the overheated market that
dramatically dropped in 2007. The usage of Asset-Backed Securities was certainly
an innovative and relatively new way to fund leveraged buyouts, but it was a
smaller part of the whole structured credit market – that had just started up its
engine. The unending search for more and more capital to push into the financing
package found somewhat of an unexplored territory in structured finance products,
and banks were eager to develop new ways of financing that would have led to
increased resources to fund LBO transactions.
In particular, bankers were feeling the twofold need to raise an ever-higher level
of capital to use in LBOs, while at the same time getting a larger number of
investors to put their money in highly risky leveraged transactions. In so doing,
banks would have enhanced their position while reducing their overall risk and
exposure, as usual. The crucial part related to the fact that, broadly speaking,
institutional investors were merely risk-averse so that most of them was not willing
to subscribe leveraged loans that are, by nature, speculative-grade investments.
Given this situation, banks finally came up with a solution, finding it in the
structured credit market: the issuance of Collateralized Debt Obligations (CDOs).
As we will explain in depth in subsequent sections, CDOs happened to be a stroke
of absolute genius115 in the LBO market, and it can be documented to be the
primary driver that led it to the boom that reached its top in 2007. There is some
authoritative research116 that argue a positive correlation between the usage of
these structured finance products and the strong increase in the LBO market:
Figure 17 (that is drawn upon the aforementioned work) illustrates this relation.
115 Despite the fact that CDO products were created and used starting from the 1980s, they witnessed their greatest boom during the 2000s. 116 Shivdasani, A. and Wang Y. (2011), “Did Structured Credit Fuel the LBO Boom?”, The Journal of Finance, Vol. 66, No. 4
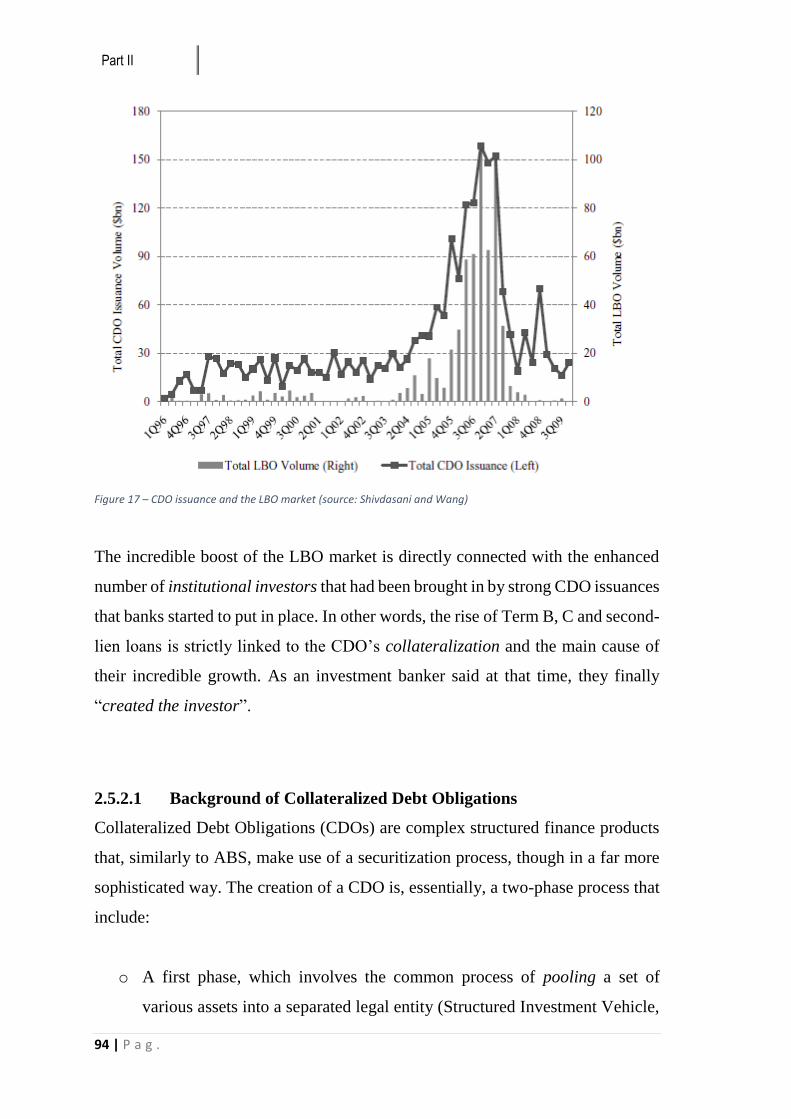
Part II
94 | P a g .
Figure 17 – CDO issuance and the LBO market (source: Shivdasani and Wang)
The incredible boost of the LBO market is directly connected with the enhanced
number of institutional investors that had been brought in by strong CDO issuances
that banks started to put in place. In other words, the rise of Term B, C and second-
lien loans is strictly linked to the CDO’s collateralization and the main cause of
their incredible growth. As an investment banker said at that time, they finally
“created the investor”.
2.5.2.1 Background of Collateralized Debt Obligations
Collateralized Debt Obligations (CDOs) are complex structured finance products
that, similarly to ABS, make use of a securitization process, though in a far more
sophisticated way. The creation of a CDO is, essentially, a two-phase process that
include:
o A first phase, which involves the common process of pooling a set of
various assets into a separated legal entity (Structured Investment Vehicle,

The Debt Side in Leveraged Buyouts
95 | P a g .
SIV). Such assets have generally a low-grade liquidity and high risk117,
namely, assets that only speculative investors would accept to buy;
o A second, consequent phase that involves issuing asset-related securities by
means of several tranches with different degree of risk.
This latter phase is what actually distinguishes CDO securitization from a normal
ABS issuance118, and it is its key characteristic. In fact, once a pool of diversified
assets gets separated and transferred to the SIV, this special entity proceeds to issue
securities in several tranches on a seniority basis and, hence, with different levels
of risk. In other words, each tranche differs from the others in terms of priority for
receiving cash flows and absorbing losses in case of default. A typical CDO
securitization involves the issuance of three different tranches:
I. A Senior tranche119, which has a first claim on the CDO cash flows and it
is the last one for absorbing losses. It is the safest and most highly-
prioritized tranche, which fits well the needs of more risk-averse investors.
II. A Mezzanine tranche, which has a claim on cash flows that is subordinated
to that of the Senior tranche and it is required to compensate for losses
before senior investors;
III. An Equity tranche, which is the most junior since it is the last to receive
cash flow payments and the first loss absorber in case of default of the
assets’ pool.
Such a categorization allows the CDO originator to repackage the actual level of
risk that was originally borne by the underlying assets, hence issuing (at least for
the senior tranches) asset-related securities that show a far lower level of risk than
117 These BBB- (and below) rated assets usually comprise leveraged loans, high-yield bonds, project finance debt, other ABS and structured securities and credit derivatives. For a thorough guide on the matter, see Barclays Capital (2002), “The Barclays Capital Guide to Collateralized Debt Obligations”, available at: http://people.stern.nyu.edu/igiddy/ABS/barclays_cdoguide.pdf (accessed December 2016). 118 As a matter of fact, while ABS may involve two or more different tranches in a few cases, a single and unique issuance is the most common feature for these “simpler” securities. 119 In some cases, a super senior tranche is also included.
Part II
96 | P a g .
that of the collaterals they rely upon. Rating agencies were indeed involved in
providing a credit rating to the tranches of CDO issuances and, as some research
argued120, an incredible quantity of these structured securities got an AAA rating.
To understand the risk-repackaging of the CDO process, we need to keep in mind
that, regardless of the top rating these CDO securities obtained, the underlying
collateral was a highly-risk speculative grade asset that got “beautified” and given
a credit rating that it would have never reached without the securitization
procedure.
Put another way, prioritization is key.
Assuming a CDO were not prioritized and issued all at a single time (like a simple
ABS securitization), it would obtain no credit enhancement since the securities’
credit rating is given by the average rating (and thus the expected losses) of the
underlying pool of assets. Nonetheless, the tranching process allows the CDO
issuer to structure and differentiate payments priorities and, hence, risk, so that
securities of more senior tranches can get a higher credit rating even though assets
pledged as collaterals are, actually, highly risky. The reasoning is actually based
on quantitative finance121: pooling together a set of BBB and below risky assets
leads to many diversification benefits, so that if one of them defaults, the
probability that another one defaulted at the same time is much lower. This, along
with the prioritized structure, permits a risk differentiation for different tranches.
Figure 18 provides an illustration of the overall CDO process that leads to
enhanced rated securities.
120 Coval, J., Jurek, J. And Stafford, E. (2009), “The Economics of Structured Finance”, Journal of Economic Perspectives, Vol. 23, No. 1 121 The Financial Crisis Inquiry Commission (2011), “The Financial crisis Inquiry Report: Final Report of the National Commission on the Causes of the Financial and Economic Crisis in the United States”, Featured Commission Publications, available at: https://www.gpo.gov/fdsys/pkg/GPO-FCIC/pdf/GPO-FCIC.pdf (Accessed March 2016), pp. 127-129
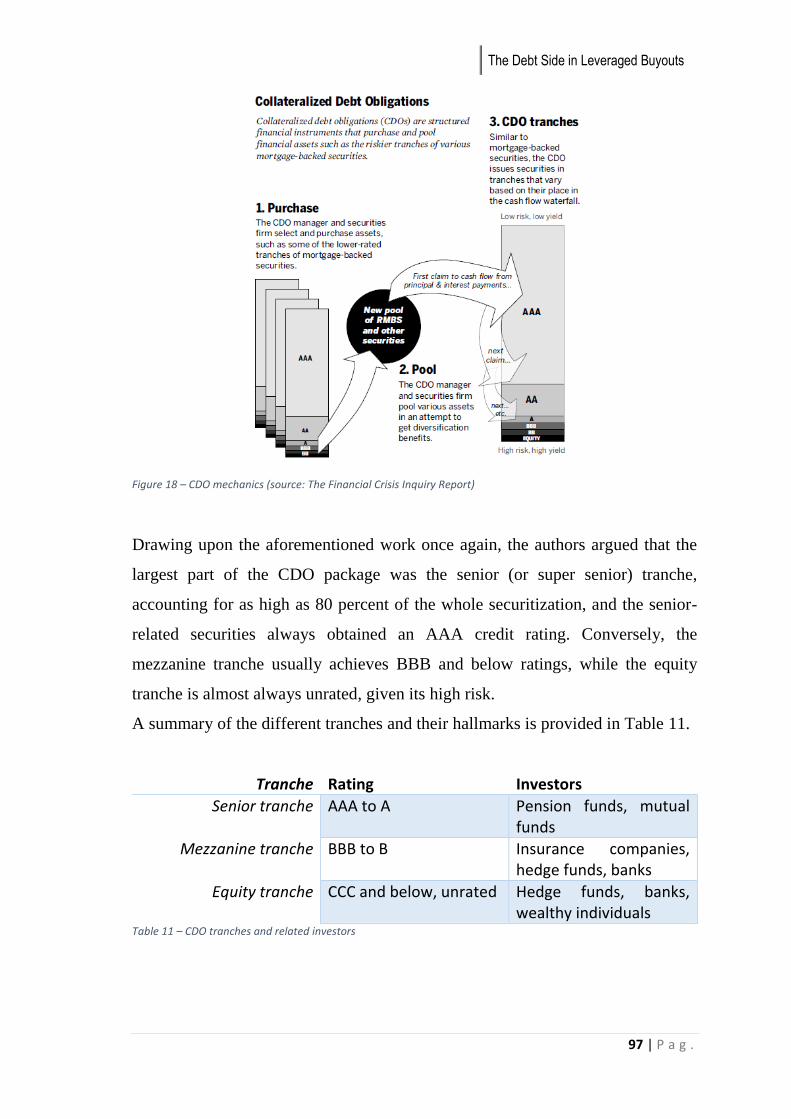
The Debt Side in Leveraged Buyouts
97 | P a g .
Figure 18 – CDO mechanics (source: The Financial Crisis Inquiry Report)
Drawing upon the aforementioned work once again, the authors argued that the
largest part of the CDO package was the senior (or super senior) tranche,
accounting for as high as 80 percent of the whole securitization, and the senior-
related securities always obtained an AAA credit rating. Conversely, the
mezzanine tranche usually achieves BBB and below ratings, while the equity
tranche is almost always unrated, given its high risk.
A summary of the different tranches and their hallmarks is provided in Table 11.
Tranche Rating Investors
Senior tranche AAA to A Pension funds, mutual funds
Mezzanine tranche BBB to B Insurance companies, hedge funds, banks
Equity tranche CCC and below, unrated Hedge funds, banks, wealthy individuals
Table 11 – CDO tranches and related investors
Part II
98 | P a g .
Made this risk differentiation, banks found it easy to get an increasing number of
investors involved, selling the safer senior tranche to more risk-averse institutional
investors, such as pension funds, while leaving to speculative investors (such as
hedge funds) the mezzanine and equity tranches. By doing so, banks managed to
bring in many new investors that had never put their capital in hazardous
operations, pumping new and substantial influxes of money into highly-risky
leveraged transactions. This is how banks “created the investor”.
Different types of CDOs
After the explanation of the basics of a Collateralized Debt Obligation, as well as
its key characteristics, we will go on to explore various types of CDOs that may
be issued. Essentially, various types of CDOs depend on the nature of the
underlying collateral, so that we can distinguish:
o Collateralized Loan Obligations (CLOs), are CDOs that are backed by a
pool of corporate loans, typically leveraged and other risky loans;
o Collateralized Bond Obligations (CBOs), are CDOs that are backed by a
pool of high-yield (junk) bonds;
o ABS-Structured Collateralized Debt Obligations, are CDOs that are backed
by a pool of structured assets, such as ABS or tranches of other CDOs122.
2.5.2.2 CDOs in the LBO market
Unlike all of other financial instruments that have been hitherto explored,
Collateralized Debt Obligations are not a direct form of LBOs financing; rather,
CDOs can be considered as an “indirect” tool of the overall debt package. In other
words, CDOs did not play the same role as Term A, B and C loans, mezzanine or
high-yield capital in providing directly resources to fund the LBO transaction.
122 Since the mezzanine and equity tranches are very risky assets, they can be collateralized again into another CDO – when this happens, the “second-level” CDO is called CDO2 (CDO-squared), that is, a CDO that includes riskier tranches of other CDOs.
The Debt Side in Leveraged Buyouts
99 | P a g .
As a matter of fact, CDOs are complex derivatives that are issued and used
exclusively by investment banks “in the back room”, by repackaging some of the
riskier leveraged loans they had in their balance sheet so as to get an increasing
number of investors to purchase such loans through the CDO tool. Nonetheless,
their importance for raising a far greater level of capital starting from 2004 to 2007
is undisputed: even though these financial products did not directly fund LBO
operations, they strongly contributed to bringing in much more capital through a
more massif involvement of institutional investors.
CDOs in a leveraged buyout context usually embedded some types of leveraged
loans, taking the form of Collateralized Loan Obligations (CLOs), though high-
yield bonds and other structured products also got to be occasionally collateralized.
Hence, in leveraged buyouts the primary source of CLOs were loans that had a
higher level of risk due to their – more or less – subordinated level of seniority.
Such loans were typically Term B and C loans, as well as second-lien loans, that
got bundled with others of similar transactions and then sold in the secondary
market. Needless to remind, their inclusion in CLO derivatives allowed banks to
repackage their risk, so as to sell them to risk-averse institutional investors and
taking them off their balance sheet, thereby eliminating the related risk.
It all happened within the banks’ syndicate: technically speaking, it was the lead
bank (the arranger) that underwrote a certain amount of Term B, C and second-
lien loans, proceeding to pack them with others of analogous operations in a CLO
derivative, then splitting it into tranches and finally selling it to institutional
investors. The functioning of CDOs and their “indirect” role for funding LBOs are
illustrated in Figure 19.
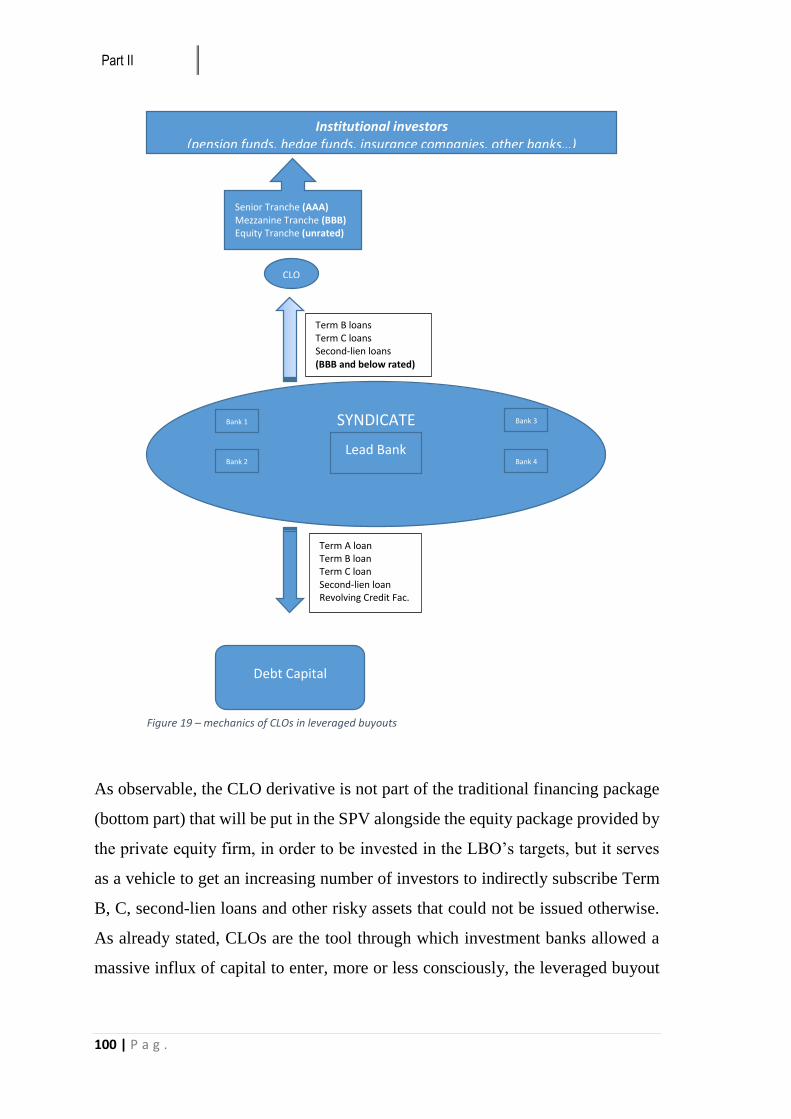
Part II
100 | P a g .
As observable, the CLO derivative is not part of the traditional financing package
(bottom part) that will be put in the SPV alongside the equity package provided by
the private equity firm, in order to be invested in the LBO’s targets, but it serves
as a vehicle to get an increasing number of investors to indirectly subscribe Term
B, C, second-lien loans and other risky assets that could not be issued otherwise.
As already stated, CLOs are the tool through which investment banks allowed a
massive influx of capital to enter, more or less consciously, the leveraged buyout
SYNDICATE
Lead Bank
Bank 1
Bank 2 Bank 4
Bank 3
Term B loans Term C loans Second-lien loans (BBB and below rated)
CLO
Term A loan Term B loan Term C loan Second-lien loan Revolving Credit Fac.
Debt Capital
Senior Tranche (AAA) Mezzanine Tranche (BBB) Equity Tranche (unrated)
Institutional investors (pension funds, hedge funds, insurance companies, other banks…)
Figure 19 – mechanics of CLOs in leveraged buyouts

The Debt Side in Leveraged Buyouts
101 | P a g .
market. For an observation of how much they affected the LBO debt package, see
Table 9 backwards.

Research Approach and Methods
103 | P a g .
Part III – Research Approach and Methods
This part is dedicated to the analysis of the sample that we constructed and to the
description of the survey that was sent to the subjects of such a sample.
What we aim at obtaining by responses to our survey is the answer to our core
research question that we set out at the beginning and which will be herein
reminded as the natural continuum of the work that has hitherto been done.
As Part I of this work mainly focuses on the literature review of Leveraged
Buyouts operations carried out by professional investors (i.e. Private Equity firms),
describing the essentials of such transactions and typical drivers of value creation
for those investors, Part II is dedicated to a specific issue of the LBO matter.
Specifically, the second part of this work concentrates on the debt component of
the financing package in LBO operations, exploring how PE firms and their debt
counterparts (that usually are either investment or commercial banks) had
structured the debt side of their LBO transactions since the very beginning in the
1980s up to the 2007 financial crisis. The analysis includes both the description of
the single financial tools that had become popular in such operations, and their
evolution through years, also exploring patterns that had led to market booms and
subsequent “busts”123. In particular, we outlined what we called the “defensive
approach” that banks have always taken on, and that can be summed up in an
increasingly safer exposure that, in turn, shifts risk on other subjects. As we indeed
observed in Part II, this happened during the first LBO boom in the 1980s (with
the explosion of junk bonds issuance) and, again, during the 2000s when banks
dragged in (through strong issuances of financial and credit derivatives) impressive
amounts of additional capital from institutional investors. Furthermore, we argued
123 We refer to the junk bond explosion that led the LBO market to a boom in the 1980s and to the strong entrance of institutional investors due to the increased usage of credit derivatives during the 2000s that dramatically ended up with the 2007 financial meltdown.
Part III
104 | P a g .
that a strong correlation fastens the debt structuring to economic returns for the
Private Equity firm (and thus, for its LP investors), so that substantial
modifications in the financing package are likely to bring modifications also in
profits that PE firms subsequently accomplish.
In light of this, we set out our research question in terms of how private equity
firms and investment/commercial banks might have revised the debt financing
package after the financial crisis occurred in 2007, so as to investigate whether
there have been some major overhauls both in tools used and their overall
importance. Furthermore, not only will we be analyzing the mere composition of
the debt financing package, but we will also investigate whether what we may call
“behavioral” changes have intervened or not. To clarify, we will observe if banks
have maintained their typical defensive approach, by which they try to reduce their
exposure and risk at the expense of other investors. In studying this issue, we
bordered our research activity within the European territory, including most of the
major countries for private equity activity. After that, we will attempt to establish
possible links with profits and value creation to the fund’s Limited Partners. To
formalize it, we may write down our research question by inquiring
The role of Private Equity firms and banks in structuring the “debt side” of LBOs
in Europe after the 2007 financial crisis, and possible implications for the Limited
Partners’ value creation.
3.1 The Sample
Consistently with our research question, we attempted to construct a sample of PE
firms that deal with private equity transactions, with particular regard to leveraged
buyout deals, in a European context. We drew our data on private equity trade
associations, both at a European level (the InvestEurope association) and at a
national level (for example, the British BVCA and the Italian AIFI), in which the
large majority of PE operators are members and of public domain. Notably, we
Research Approach and Methods
105 | P a g .
based our sample selection on an industry perspective, meaning that we considered
private equity firms whose headquarter is based in one or more European
countries124, regardless of the native country of the targets they invest in:
nevertheless, the large majority of their investments is bordered within the
European territory. Moreover, it is widely reported125 that almost the totality of
private equity investments (and thus, LBOs as well) in Europe is carried out by
European PE firms, so that our sample is significant from this point of view.
Therefore, we constructed a panel of European PE firms that are directly involved
in private equity transactions, selecting those that specialize or, however, carry out
leveraged buyout transactions as part of their core business. More specifically, we
included in our panel independent firms, private equity subdivisions of investment
and commercial banks and subsidiaries of industrial companies expressly dealing
with these kind of investments. On the contrary, we ruled out PE firms that do not
perform leveraged buyout operations, despite working in the private equity
industry, such as venture capitalists and vulture funds. Likewise, we did not
consider firms and companies that do not have a direct involvement in private
equity transactions, even though they strictly support PE firms, such as funds of
funds, third party fund administrators, advisors and placement agents.
Our final sample consists of 256 PE firms, and may be broken down by
geographical scope and by the average size of transactions that each PE firm
actually deals with.
Sample – Geographical scope
As highlighted in the research question, our main aim is to investigate if, and how,
the debt financing package has evolved after the worldwide financial crisis that
took place in 2007 – and in particular, how this happened within the European
context. Our sample comprises PE firms of almost every country within the
124 As opposed to the industry perspective, the market perspective considers the native country of the target company, regardless of the PE firm’s location. 125 For detailed data and facts about European private equity activity, visit the InvestEurope website (http://www.investeurope.eu)

Part III
106 | P a g .
European territory, taking into account – as already stated above – an industry
perspective, namely, considering the nationality of the private equity firm rather
than that of the target invested.
Specifically, we considered PE firms of all of the major countries that distinguish
for private equity activity, attempting to create a sample that includes a fair number
of actors in relation to the relevance of private equity activity in its specific
country: to clarify, this means that we considered a far greater number of UK firms,
compared to that of other countries in which private equity is much less developed
and overall relevant. This should enhance the significance of our sample.
That said, we selected PE firms that are headquartered in UK, France, Germany,
Italy, Benelux (Belgium, the Netherlands and Luxembourg) and Denmark,
Spain and Portugal, and the Nordic regions (Sweden, Finland and Norway), as
these are the most relevant countries in terms of private equity activity126. Instead,
we ruled out PE firms from countries whose relevance in private equity
transactions may be deemed as poorly significant, so as not to affect the
effectiveness of our sample.
The number of PE firms and their relative (percent) incidence over the entire
sample are represented in Figure 20 and 21.
126 We based our observations on the private equity activity data provided by the InvestEurope association, considering the amount of money invested by each country in the private equity industry.
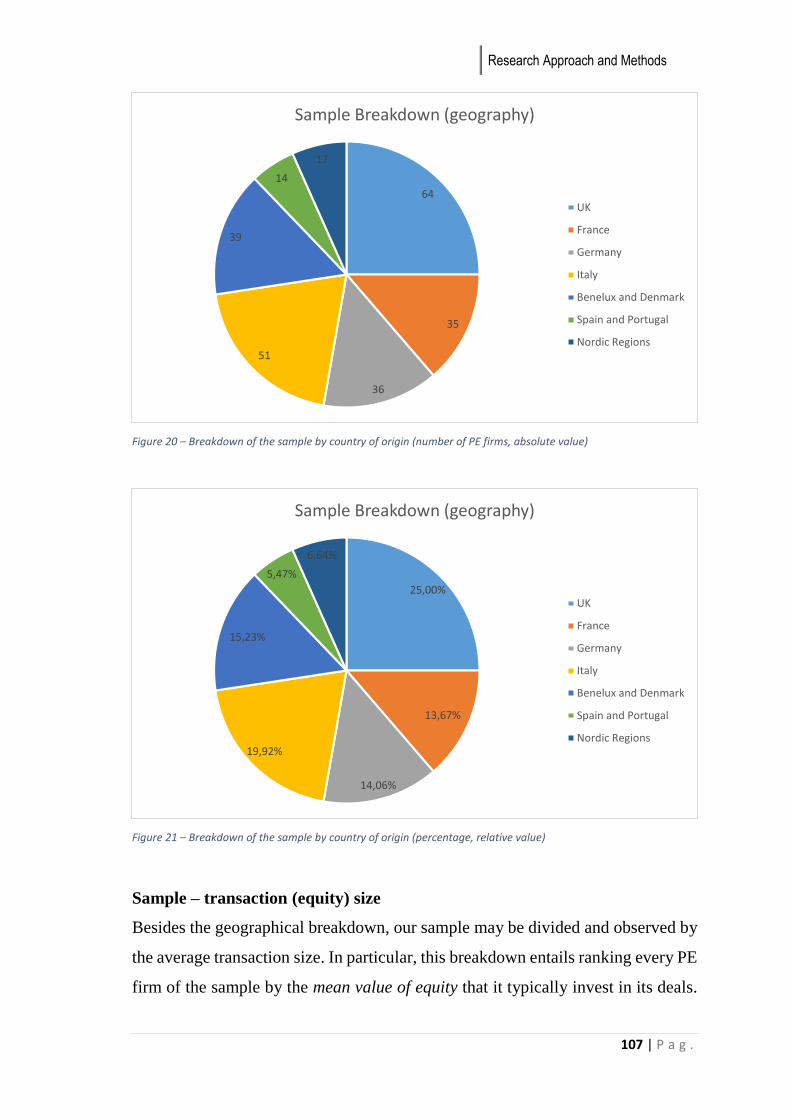
Research Approach and Methods
107 | P a g .
Figure 20 – Breakdown of the sample by country of origin (number of PE firms, absolute value)
Figure 21 – Breakdown of the sample by country of origin (percentage, relative value)
Sample – transaction (equity) size
Besides the geographical breakdown, our sample may be divided and observed by
the average transaction size. In particular, this breakdown entails ranking every PE
firm of the sample by the mean value of equity that it typically invest in its deals.
64
35
36
51
39
14
17
Sample Breakdown (geography)
UK
France
Germany
Italy
Benelux and Denmark
Spain and Portugal
Nordic Regions
25,00%
13,67%
14,06%
19,92%
15,23%
5,47%
6,64%
Sample Breakdown (geography)
UK
France
Germany
Italy
Benelux and Denmark
Spain and Portugal
Nordic Regions
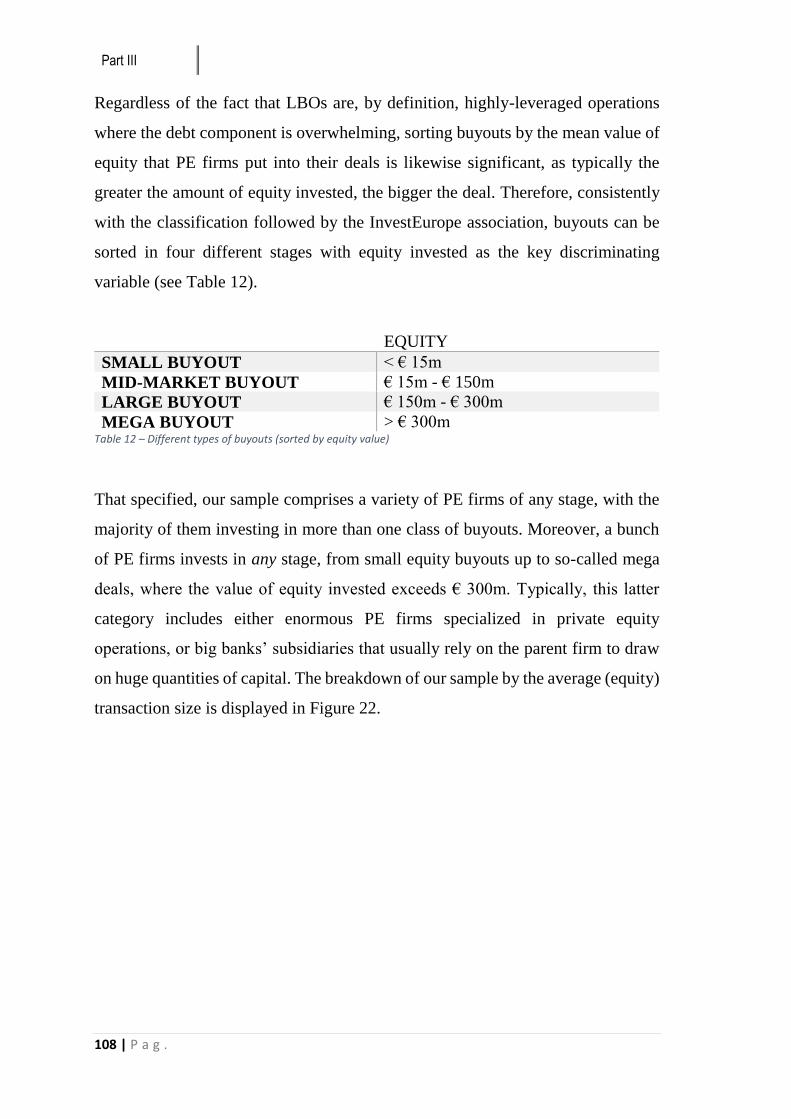
Part III
108 | P a g .
Regardless of the fact that LBOs are, by definition, highly-leveraged operations
where the debt component is overwhelming, sorting buyouts by the mean value of
equity that PE firms put into their deals is likewise significant, as typically the
greater the amount of equity invested, the bigger the deal. Therefore, consistently
with the classification followed by the InvestEurope association, buyouts can be
sorted in four different stages with equity invested as the key discriminating
variable (see Table 12).
EQUITY
SMALL BUYOUT < € 15m
MID-MARKET BUYOUT € 15m - € 150m
LARGE BUYOUT € 150m - € 300m
MEGA BUYOUT > € 300m Table 12 – Different types of buyouts (sorted by equity value)
That specified, our sample comprises a variety of PE firms of any stage, with the
majority of them investing in more than one class of buyouts. Moreover, a bunch
of PE firms invests in any stage, from small equity buyouts up to so-called mega
deals, where the value of equity invested exceeds € 300m. Typically, this latter
category includes either enormous PE firms specialized in private equity
operations, or big banks’ subsidiaries that usually rely on the parent firm to draw
on huge quantities of capital. The breakdown of our sample by the average (equity)
transaction size is displayed in Figure 22.
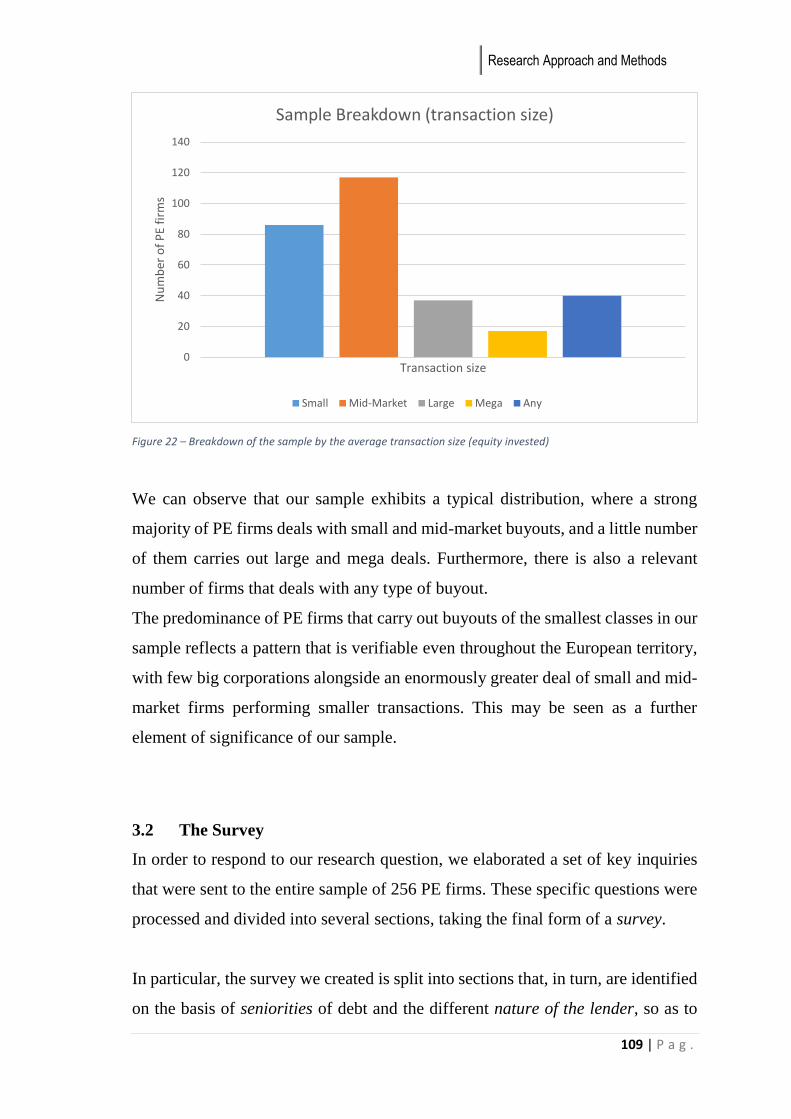
Research Approach and Methods
109 | P a g .
Figure 22 – Breakdown of the sample by the average transaction size (equity invested)
We can observe that our sample exhibits a typical distribution, where a strong
majority of PE firms deals with small and mid-market buyouts, and a little number
of them carries out large and mega deals. Furthermore, there is also a relevant
number of firms that deals with any type of buyout.
The predominance of PE firms that carry out buyouts of the smallest classes in our
sample reflects a pattern that is verifiable even throughout the European territory,
with few big corporations alongside an enormously greater deal of small and mid-
market firms performing smaller transactions. This may be seen as a further
element of significance of our sample.
3.2 The Survey
In order to respond to our research question, we elaborated a set of key inquiries
that were sent to the entire sample of 256 PE firms. These specific questions were
processed and divided into several sections, taking the final form of a survey.
In particular, the survey we created is split into sections that, in turn, are identified
on the basis of seniorities of debt and the different nature of the lender, so as to
0
20
40
60
80
100
120
140
Nu
mb
er o
f P
E fi
rms
Transaction size
Sample Breakdown (transaction size)
Small Mid-Market Large Mega Any
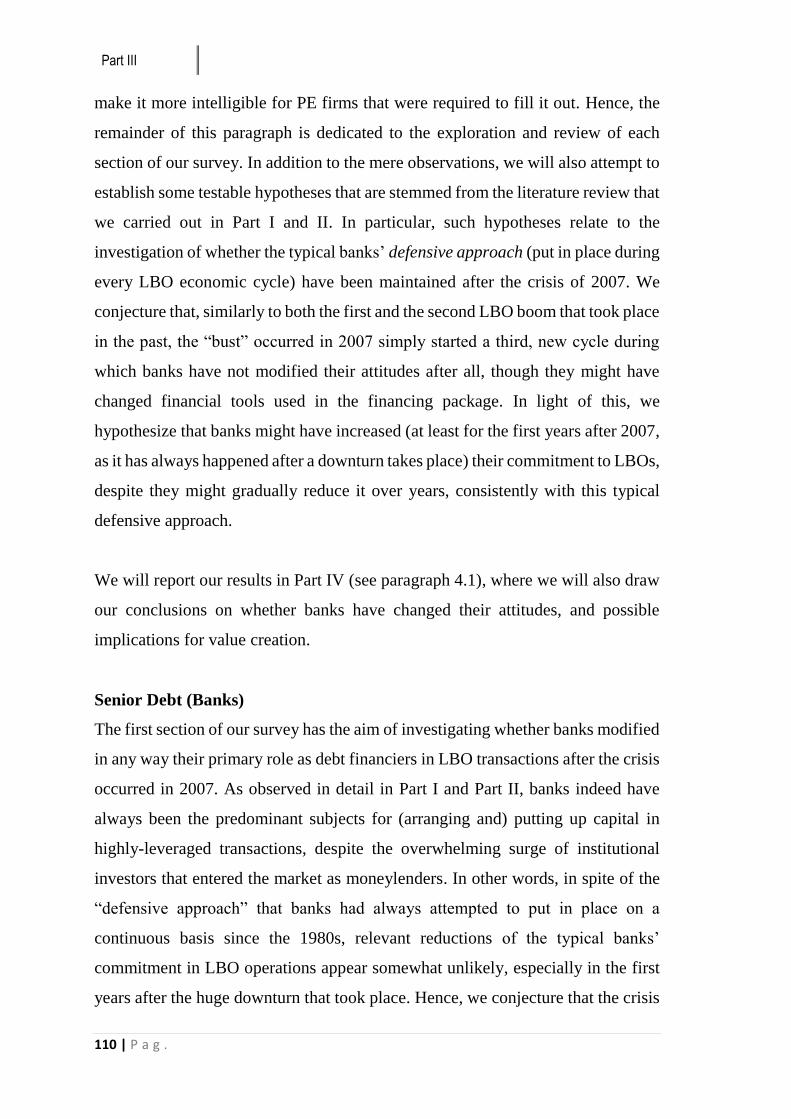
Part III
110 | P a g .
make it more intelligible for PE firms that were required to fill it out. Hence, the
remainder of this paragraph is dedicated to the exploration and review of each
section of our survey. In addition to the mere observations, we will also attempt to
establish some testable hypotheses that are stemmed from the literature review that
we carried out in Part I and II. In particular, such hypotheses relate to the
investigation of whether the typical banks’ defensive approach (put in place during
every LBO economic cycle) have been maintained after the crisis of 2007. We
conjecture that, similarly to both the first and the second LBO boom that took place
in the past, the “bust” occurred in 2007 simply started a third, new cycle during
which banks have not modified their attitudes after all, though they might have
changed financial tools used in the financing package. In light of this, we
hypothesize that banks might have increased (at least for the first years after 2007,
as it has always happened after a downturn takes place) their commitment to LBOs,
despite they might gradually reduce it over years, consistently with this typical
defensive approach.
We will report our results in Part IV (see paragraph 4.1), where we will also draw
our conclusions on whether banks have changed their attitudes, and possible
implications for value creation.
Senior Debt (Banks)
The first section of our survey has the aim of investigating whether banks modified
in any way their primary role as debt financiers in LBO transactions after the crisis
occurred in 2007. As observed in detail in Part I and Part II, banks indeed have
always been the predominant subjects for (arranging and) putting up capital in
highly-leveraged transactions, despite the overwhelming surge of institutional
investors that entered the market as moneylenders. In other words, in spite of the
“defensive approach” that banks had always attempted to put in place on a
continuous basis since the 1980s, relevant reductions of the typical banks’
commitment in LBO operations appear somewhat unlikely, especially in the first
years after the huge downturn that took place. Hence, we conjecture that the crisis

Research Approach and Methods
111 | P a g .
might have attenuated the banks’ defensive approach, at least for the first years;
therefore, according to us, banks might have even increased their commitment (at
least in the first period), as they have always played the most important role in
highly-leveraged transactions, despite they might then decrease it afterwards.
Consistently, we set up a series of hypotheses to be tested.
H1: The crisis did not affect heavily the predominance and relevance of banks
in financing Leveraged Buyout deals, maintaining or even increasing their
quota over the total debt.
H2: In the aftermath of the inauspicious effects of the crisis, banks have
increased interest rates on leveraged loans they provide to fund LBOs.
In order to test such hypotheses, we included related questions in the survey.
Box 1
Senior long-term debt 1- Has the usage of Term A loans remained stable, diminished or increased? 2- What is the average incidence of Term A loans over the total debt? 3- Have Term A loans become more costly after the financial crisis of 2007? 4- Has the usage of financial covenants varied, becoming more or less restrictive? 5- Has the average maturity of Term A loans varied?
Senior short-term debt 1- Has the usage of short-term facilities remained stable, diminished or increased? 2- What types of short-term facilities do you rely on the most? 3- What is the average incidence of such facilities over the total debt?
Part III
112 | P a g .
Senior Debt (Institutional Investors)
Strictly related to our first section, the second section of our survey aims at
analyzing if, and how, institutional investors that quickly rose and became key
actors alongside banks during the 2000s have continued to maintain their leading
role even after the 2007 meltdown, or if they backed out (and in this latter case, to
what extent). According to our judgement, institutional investors might have
strongly lowered their commitment once the crisis occurred, as they realized they
simply got a little too exalted in financing highly-leveraged transactions during the
antecedent period, so that they finally might have resized their overall
commitment.
H3: Institutional investors have substantially lowered their commitment to
leveraged buyout transactions after the advent of the financial crisis.
Box 2
Senior long-term debt 1- Has the usage of Term B and C loans remained stable, diminished or increased? 2- What is the average incidence of Term B and C loans over the total debt? 3- What kind of investors are most active in financing LBO deals? 4- Have Term B and C loans become more costly after the financial crisis of 2007? 5- Has the usage of financial covenants varied, becoming more or less restrictive? 6- Has the average maturity of Term A loans varied?
Research Approach and Methods
113 | P a g .
Junior Debt and other forms of financing
The third section of our survey relates to the usage of junior financial instruments
(i.e. second-lien loans, mezzanine capital, high-yield bonds), as well as other less
common tools (i.e. sponsor loans and vendor loans), and how the crisis affected
their role in financing LBO deals. Given their relatively low relevance even before
2007, we expect these forms of financing not to have modified a lot.
H4: The crisis did not strongly affect the usage of junior debt financing, which
have maintained their relatively low percentage over the total debt package,
despite having increased their interest rates.
H5: Due to the huge impact of the crisis that might have altered typical ways of
financing LBO deals, there have been an increase for non-conventional
forms of financing, such as sponsor loans and vendor loans.
Box 3
Junior Debt 1- Has the usage of second-lien loans, mezzanine capital and high-yield bonds
remained stable, diminished or increased? 2- What is the average incidence of second-lien loans, mezzanine capital and high-yield
bonds over the total debt? 3- Have second-lien loans, mezzanine capital and high-yield bonds become more costly
after the financial crisis of 2007? 4- What is the willingness of institutions and the overall public to invest in junior debt
instruments?
Box 4
Other Debt 1- Have you ever used a sponsor loan to partly finance your LBO deals? If yes, is this
practice more or less used than it used to be before 2007? 2- Have you ever used a vendor loan to partly finance your LBO deals? If yes, is this
practice more or less used than it used to be before 2007?
Part III
114 | P a g .
Derivatives Usage
In the last section of our survey, we inquired about the usage of structured finance
products (i.e. ABS and other securitized products) and, above all, credit derivatives
(i.e. CDOs, CLOs, CBOs). In particular, we asked PE firms whether they have
made use of such sophisticated financial products, also prior to 2007, in order to
elaborate a comparison with the post-crisis period with the aim of finally
investigating if there was some sort of reorganization and rationalization regarding
their use (and abuse).
Since the financial meltdown that occurred in 2007 was reported to be strongly
related to the increasing and uncontrolled issuance of such complex financial and
credit derivatives (even though not preeminently in the LBO market), we expect a
radical restructuring on their overall usage from PE firms and arranging banks.
H6: PE firms and (especially) banks strongly reduced the issuance of structured
finance products and credit derivatives as a consequence of the 2007
financial crisis, making use of them in a more reasonable way.
To test this hypothesis, we asked first and foremost whether the interviewee PE
firm has ever dealt with, and made use of, credit derivatives in one or more of its
LBO deals. If the answer is affirmative, the PE firm is asked to go on to respond
to the specific section, otherwise being redirected to the end of the survey.
Box 5
1- Have you recently used ABS securitization on the target's assets to partly finance your LBOs? And how much compared to the pre-2007 period?
2- Have banks on which you rely ever used CLOs to be sold to institutional investors? If yes, is this practice more or less usual than it was before 2007?
3- Have banks on which you rely ever used CBOs to be sold to institutional investors or to the public? If yes, is this practice more or less usual than it was before 2007?
4- Have banks on which you rely ever securitized ABS or other structured products in what is called a Structured CDO? If yes, is this practice more or less usual than it was before 2007?
5- Have there been any other types of structured finance products or derivatives that have become common in your LBO financing after 2007?
Empirical Results
115 | P a g .
Part IV – Empirical Results
The conclusive part of our work has the aim of shedding light on results and
responses that we achieved by submitting our survey to the sample of 256 private
equity firms. Notably, by means of responses obtained we intend to answer the
research question that we set out at the outset of this thesis, attempting to
understand whether:
after 2007, private equity firms have modified typical ways by which they
raise capital to fund Leverage Buyouts, and possible changes undergone by
the financial structure: in other words, we will observe if, and how, the
financial crisis affected the debt financing package of LBOs;
there are possible correlations between changes in the overall “financial
engineering” value driver (as well as attitudes intervened in other levers of
the value creation process, that will be observed for a complete overview of
the phenomenon) and the value creation process accomplished by private
equity firms and their Limited Partners.
To begin with, we need to report some preliminary statistics on responses that we
received. As accurately described in Part III, our entire sample consisted of 256
private equity firms located throughout the European territory, and whose
investments could be categorized in small, mid, large or mega depending on the
absolute value of equity capital they put up in their deals.
In particular, the survey was sent through email and directly addressed to specific
subjects within each of these 256 PE firms. While for a meaningful majority we
were forced to send the email to the Investor Relations manager or to the Press
Part IV
116 | P a g .
Office127, there was also a significant number of PE firms that made available
personal contacts of their major executives. Hence, we directly sent the survey to
the most prominent subjects within the organization whenever possible: depending
on the type of the firm, as well as on the data provided, we addressed the survey
to partners (Founding Partners, Senior Partners, Managing Partners, other
partners), institutional positions (Chairmen, deputy Chairmen) or to top-
executives (CEOs, Managing Directors, CFOs, executive directors, Heads of
Corporation/Division).
This stage of our research was particularly time-consuming: it took approximately
three months to be completed (February to April 2016) and up to twelve rounds of
emails to the entire sample. This probably depends on the fact that many PE firms
saw the questions of our survey as “confidential information” and were not initially
willing to disclose it. Moreover, others replied to us as being in the middle of a
fundraising process, hence having no time to take our survey.
As of May 2016, however, we obtained a total of 13 responses that represent
5.07% of our entire 256 firms’ sample.
In the remainder of this conclusive section, we will report our results based on a
descriptive analysis, so that we will attempt to assess possible patterns that might
have emerged as a consequence of the crisis in the financing process of LBOs. In
other words, we will attempt to give a final response to our core research question
that we set out at the beginning of this work. Since we acknowledge that changes
and variations that might have intervened in the typical financing package of an
LBO are not the only lever that eventually lead to the value creation process, we
will report other relevant variables (stemmed from value creation drivers, as we
observed during the literature review process) that have contributed to the renewed
value creation process, along with the debt financing package.
127 However, we made specific request to such subjects to address the survey to the competent office/position inside the organization, so as to obtain reliable responses.
Empirical Results
117 | P a g .
Finally, it is important to point out that we did not proceed to process our data in
more sophisticated elaboration, due to the low number of responses received that
would impair statistical significance.
4.1 Descriptive Analysis
In the continuation of this part, we will provide some descriptive breakdowns of
information that we received, elaborating data so as to shed brighter light on
features that have characterized the financing package over the 2007-2015 period.
Our processing is done on the basis of both the seniority and the type of capital
lender, as usual, so that it will be easier to test the hypotheses that we set out in
Part III. By way of illustration, we will hence divide senior debt of banks from
senior debt of institutional investors, as well as senior debt from junior debt.
Senior Debt (banks)
The most prominent and remarkable category to begin with is certainly that of
senior bank debt. As we observed in preceding sections, banks had always had
such an overwhelming role in financing LBO deals ever since the inception, back
in the 1980s, up to the 2007 downturn, despite a continuous tendency to reduce
their commitment (and hence, risk) by dragging in new types of debt investors (the
so-called “defensive approach”). Therefore, the first section of our survey was set
out to investigate whether the crisis affected in some way the attitude of banks for
aspects like commitment, costs (interest rates and fees) and duration of loans
granted. Among other things, thus, we aim at understanding whether banks have
attenuated their typical defensive approach as a consequence of the crisis,
resuming their predominance over highly-leveraged transaction financing when
most of the other providers of capital might have backed out (at least partly).
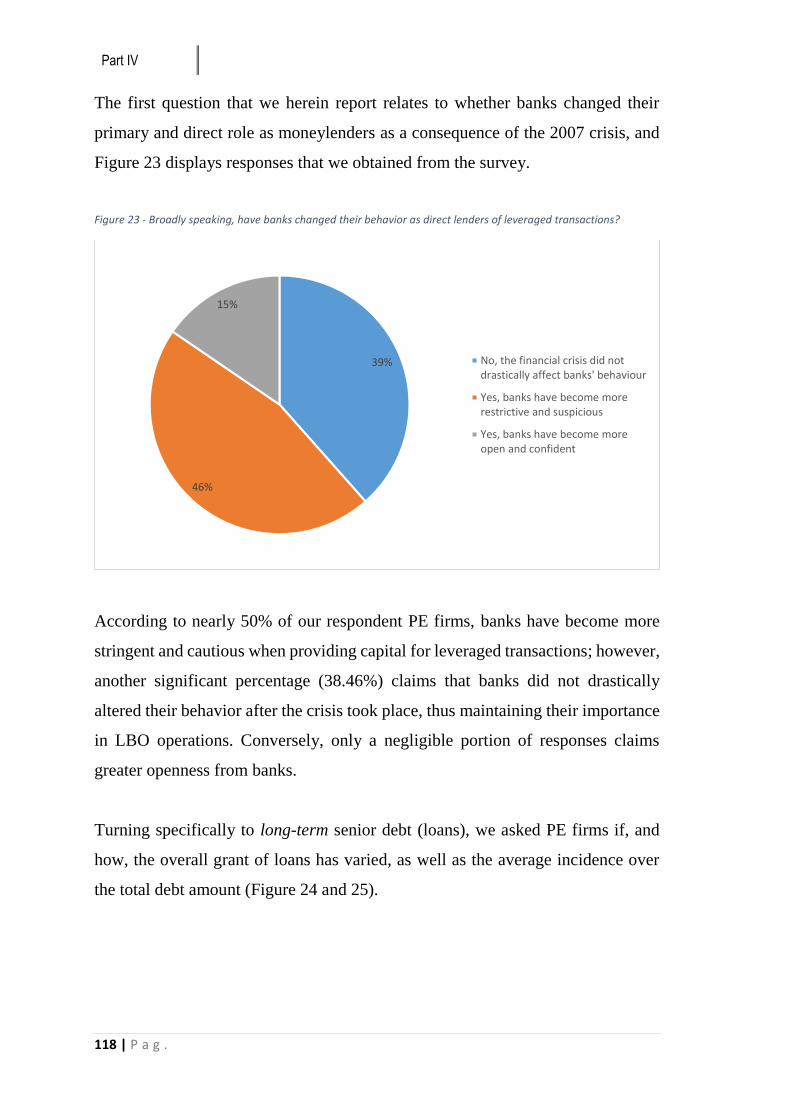
Part IV
118 | P a g .
The first question that we herein report relates to whether banks changed their
primary and direct role as moneylenders as a consequence of the 2007 crisis, and
Figure 23 displays responses that we obtained from the survey.
Figure 23 - Broadly speaking, have banks changed their behavior as direct lenders of leveraged transactions?
According to nearly 50% of our respondent PE firms, banks have become more
stringent and cautious when providing capital for leveraged transactions; however,
another significant percentage (38.46%) claims that banks did not drastically
altered their behavior after the crisis took place, thus maintaining their importance
in LBO operations. Conversely, only a negligible portion of responses claims
greater openness from banks.
Turning specifically to long-term senior debt (loans), we asked PE firms if, and
how, the overall grant of loans has varied, as well as the average incidence over
the total debt amount (Figure 24 and 25).
39%
46%
15%
No, the financial crisis did notdrastically affect banks' behaviour
Yes, banks have become morerestrictive and suspicious
Yes, banks have become moreopen and confident
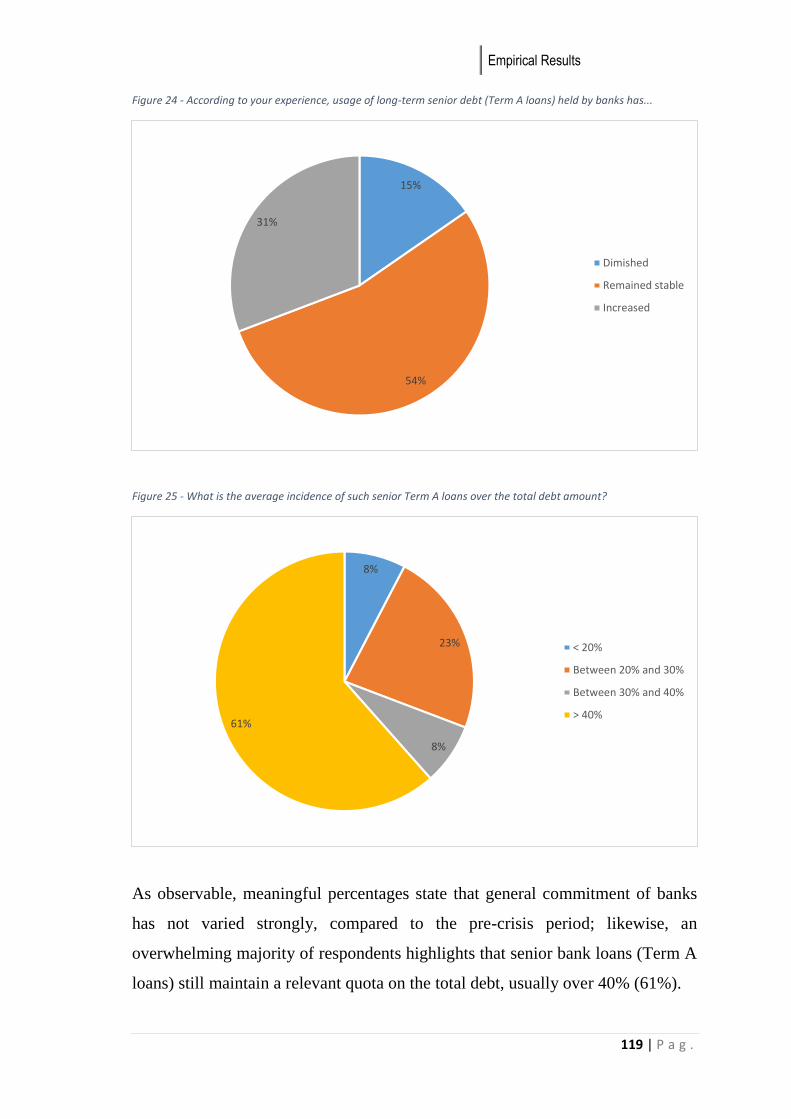
Empirical Results
119 | P a g .
Figure 24 - According to your experience, usage of long-term senior debt (Term A loans) held by banks has...
Figure 25 - What is the average incidence of such senior Term A loans over the total debt amount?
As observable, meaningful percentages state that general commitment of banks
has not varied strongly, compared to the pre-crisis period; likewise, an
overwhelming majority of respondents highlights that senior bank loans (Term A
loans) still maintain a relevant quota on the total debt, usually over 40% (61%).
15%
54%
31%
Dimished
Remained stable
Increased
8%
23%
8%
61%
< 20%
Between 20% and 30%
Between 30% and 40%
> 40%
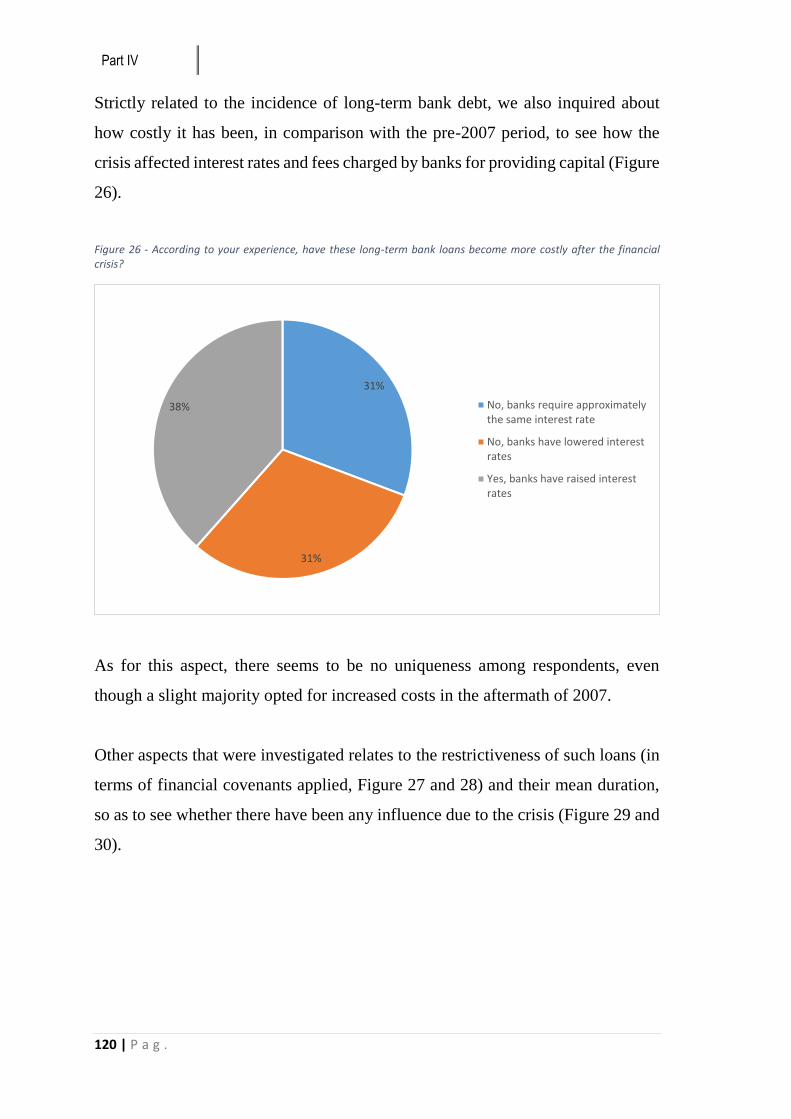
Part IV
120 | P a g .
Strictly related to the incidence of long-term bank debt, we also inquired about
how costly it has been, in comparison with the pre-2007 period, to see how the
crisis affected interest rates and fees charged by banks for providing capital (Figure
26).
Figure 26 - According to your experience, have these long-term bank loans become more costly after the financial crisis?
As for this aspect, there seems to be no uniqueness among respondents, even
though a slight majority opted for increased costs in the aftermath of 2007.
Other aspects that were investigated relates to the restrictiveness of such loans (in
terms of financial covenants applied, Figure 27 and 28) and their mean duration,
so as to see whether there have been any influence due to the crisis (Figure 29 and
30).
31%
31%
38% No, banks require approximatelythe same interest rate
No, banks have lowered interestrates
Yes, banks have raised interestrates
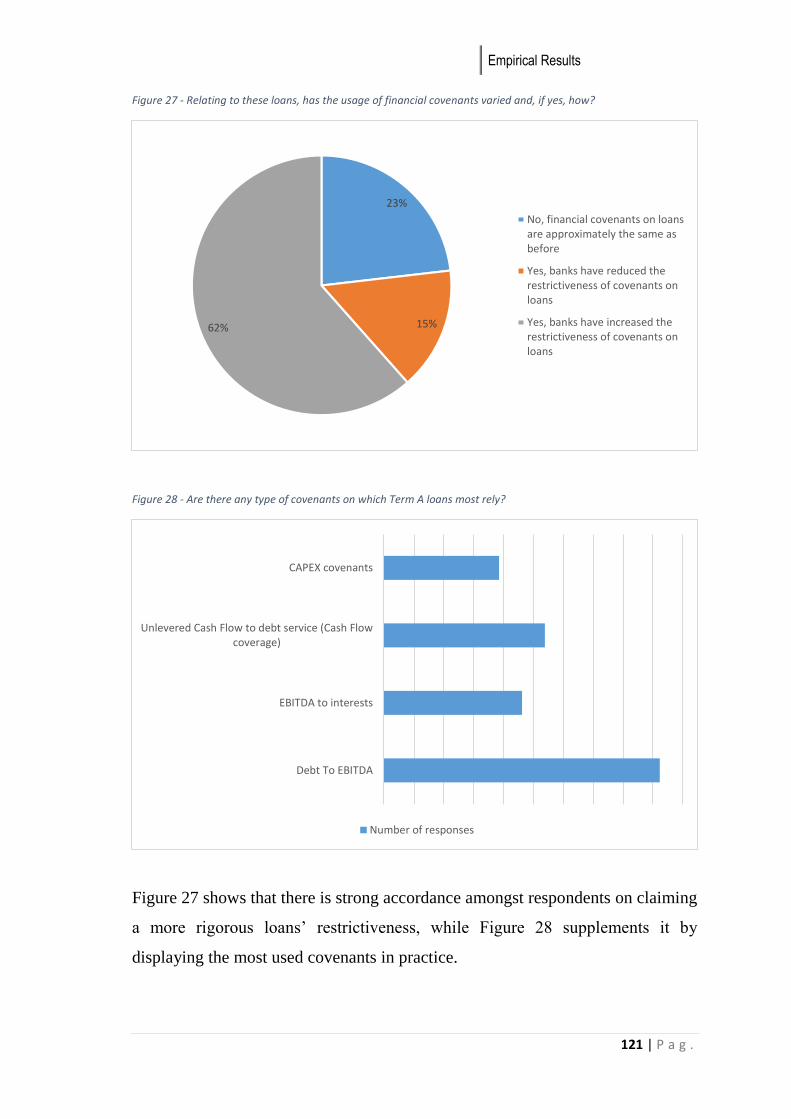
Empirical Results
121 | P a g .
Figure 27 - Relating to these loans, has the usage of financial covenants varied and, if yes, how?
Figure 28 - Are there any type of covenants on which Term A loans most rely?
Figure 27 shows that there is strong accordance amongst respondents on claiming
a more rigorous loans’ restrictiveness, while Figure 28 supplements it by
displaying the most used covenants in practice.
23%
15%62%
No, financial covenants on loansare approximately the same asbefore
Yes, banks have reduced therestrictiveness of covenants onloans
Yes, banks have increased therestrictiveness of covenants onloans
Debt To EBITDA
EBITDA to interests
Unlevered Cash Flow to debt service (Cash Flowcoverage)
CAPEX covenants
Number of responses

Part IV
122 | P a g .
Figure 29 - Given a typical 5 to 7 years maturity, have these loans changed it after the financial crisis?
Figure 30 - According to your previous answer, could you please indicate the average maturity of bank long-term loans?
As far as maturity is concerned, Figure 29 and 30 show that no relevant change
has occurred: in particular, Figure 29 exhibits that nearly 80% of respondent PE
firms agree on saying that the crisis did not affect the general duration of loans
granted, as it still stands at 5 to 7 years, on average (Figure 30).
77%
23%
No, the maturity is still the same asbefore
Yes, loans have lower maturities
0%
5%
10%
15%
20%
25%
30%
35%
40%
45%
1 2 3 4 5 6 7 8 9 10
Years
Percentage of responses
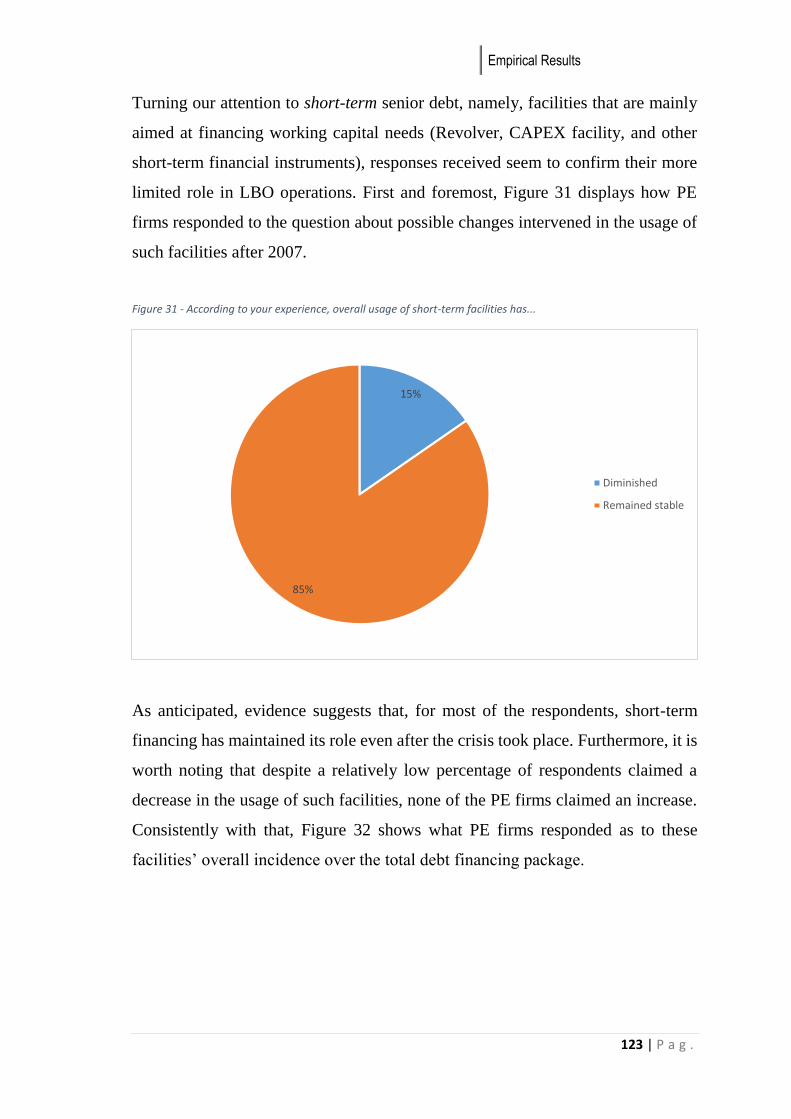
Empirical Results
123 | P a g .
Turning our attention to short-term senior debt, namely, facilities that are mainly
aimed at financing working capital needs (Revolver, CAPEX facility, and other
short-term financial instruments), responses received seem to confirm their more
limited role in LBO operations. First and foremost, Figure 31 displays how PE
firms responded to the question about possible changes intervened in the usage of
such facilities after 2007.
Figure 31 - According to your experience, overall usage of short-term facilities has...
As anticipated, evidence suggests that, for most of the respondents, short-term
financing has maintained its role even after the crisis took place. Furthermore, it is
worth noting that despite a relatively low percentage of respondents claimed a
decrease in the usage of such facilities, none of the PE firms claimed an increase.
Consistently with that, Figure 32 shows what PE firms responded as to these
facilities’ overall incidence over the total debt financing package.
15%
85%
Diminished
Remained stable

Part IV
124 | P a g .
Figure 32 - What is the average incidence of such senior short term facilities over the total debt amount?
Similarly to the pre-crisis period, the short-term financing seems to have
maintained a smaller percentage (compared to the long-term component),
wavering between 10% and 20% over the total debt.
To complete our research, we also inquired about the types of facilities that are
used the most, and as expected, there seems to be the predominance of Revolving
credit facilities, CAPEX facilities and lines of credit (Figure 33).
23%
54%
23%
< 10%
Between 10% and 20%
> 20%
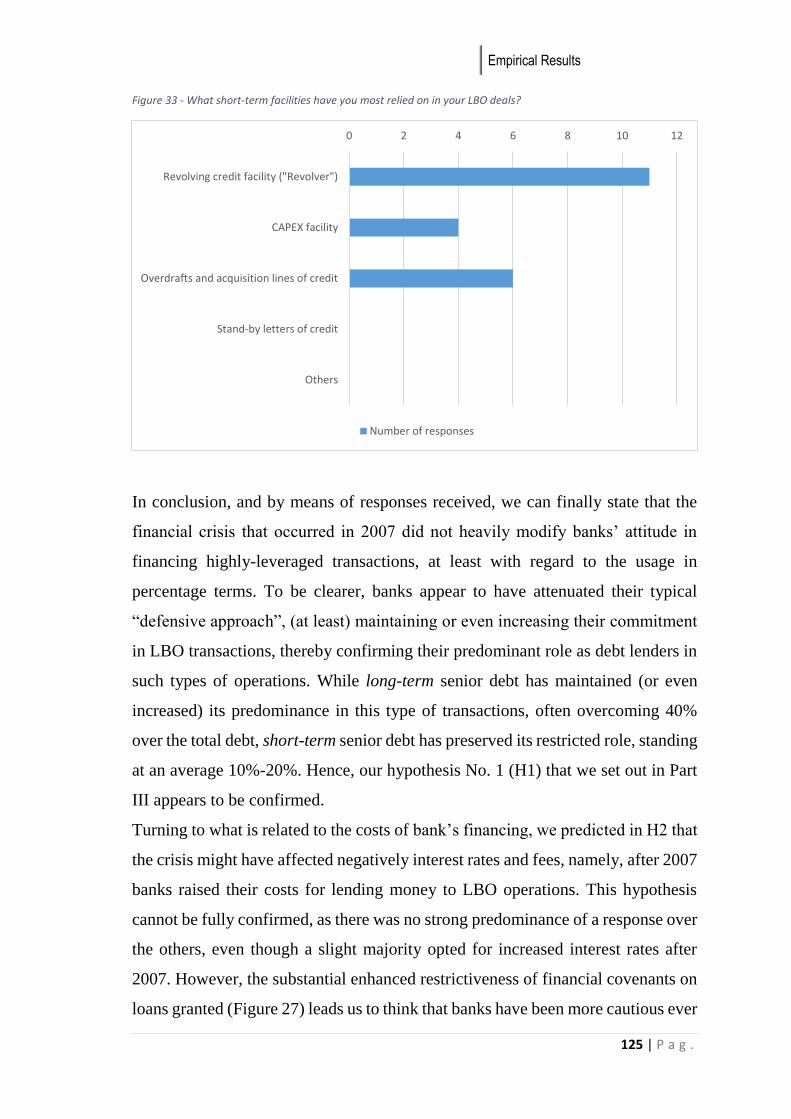
Empirical Results
125 | P a g .
Figure 33 - What short-term facilities have you most relied on in your LBO deals?
In conclusion, and by means of responses received, we can finally state that the
financial crisis that occurred in 2007 did not heavily modify banks’ attitude in
financing highly-leveraged transactions, at least with regard to the usage in
percentage terms. To be clearer, banks appear to have attenuated their typical
“defensive approach”, (at least) maintaining or even increasing their commitment
in LBO transactions, thereby confirming their predominant role as debt lenders in
such types of operations. While long-term senior debt has maintained (or even
increased) its predominance in this type of transactions, often overcoming 40%
over the total debt, short-term senior debt has preserved its restricted role, standing
at an average 10%-20%. Hence, our hypothesis No. 1 (H1) that we set out in Part
III appears to be confirmed.
Turning to what is related to the costs of bank’s financing, we predicted in H2 that
the crisis might have affected negatively interest rates and fees, namely, after 2007
banks raised their costs for lending money to LBO operations. This hypothesis
cannot be fully confirmed, as there was no strong predominance of a response over
the others, even though a slight majority opted for increased interest rates after
2007. However, the substantial enhanced restrictiveness of financial covenants on
loans granted (Figure 27) leads us to think that banks have been more cautious ever
0 2 4 6 8 10 12
Revolving credit facility ("Revolver")
CAPEX facility
Overdrafts and acquisition lines of credit
Stand-by letters of credit
Others
Number of responses
Part IV
126 | P a g .
since, so that the hypothesis of increased costs appears to be the more likely and
coherent with such an attitude. In a period of financial straits, stiffening covenants
while decreasing interest rates at the same time would make no much sense.
Senior Debt (institutional investors)
Institutional investors had obtained an increasingly important role as LBOs’
financers over the 2000s, reaching such impressive amounts of capital committed
right before the crisis (Term B and C loans). As stated in previous sections, they
had indeed been replacing bank debt, becoming key actors in this kind of
operations.
That said, we hence inquired about their role after the meltdown: have institutional
investors maintained an unrestrainable level of commitment as they used to before
2007, or did they back down because of the crisis?
Primarily, we need to understand what types of institutional investors are active in
the LBO market as debt lenders. As we observed in Part II, this macro category
may include a variety of subjects, each of them more or less involved in LBO
transactions. By way of illustration, pension funds (both public and private), hedge
funds, banks and insurance companies are all examples of institutional investors.
The question arises as to what categories are most involved in financing LBO
operations (Figure 34).
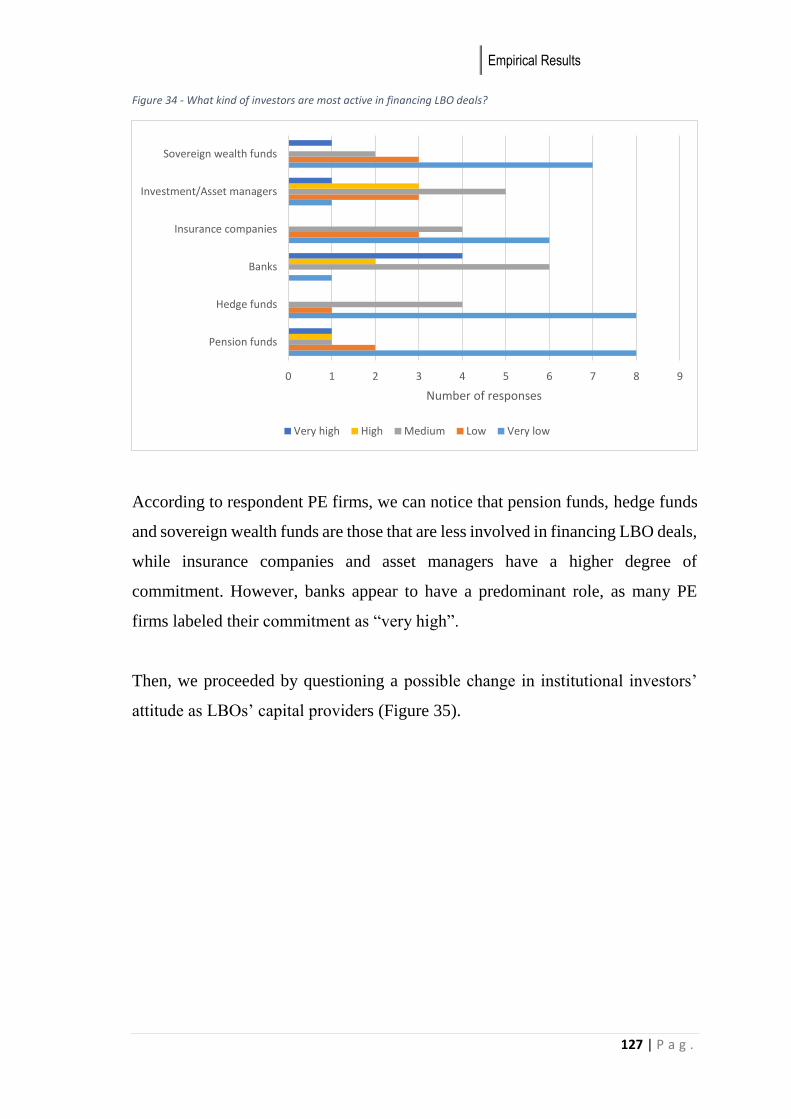
Empirical Results
127 | P a g .
Figure 34 - What kind of investors are most active in financing LBO deals?
According to respondent PE firms, we can notice that pension funds, hedge funds
and sovereign wealth funds are those that are less involved in financing LBO deals,
while insurance companies and asset managers have a higher degree of
commitment. However, banks appear to have a predominant role, as many PE
firms labeled their commitment as “very high”.
Then, we proceeded by questioning a possible change in institutional investors’
attitude as LBOs’ capital providers (Figure 35).
0 1 2 3 4 5 6 7 8 9
Pension funds
Hedge funds
Banks
Insurance companies
Investment/Asset managers
Sovereign wealth funds
Number of responses
Very high High Medium Low Very low
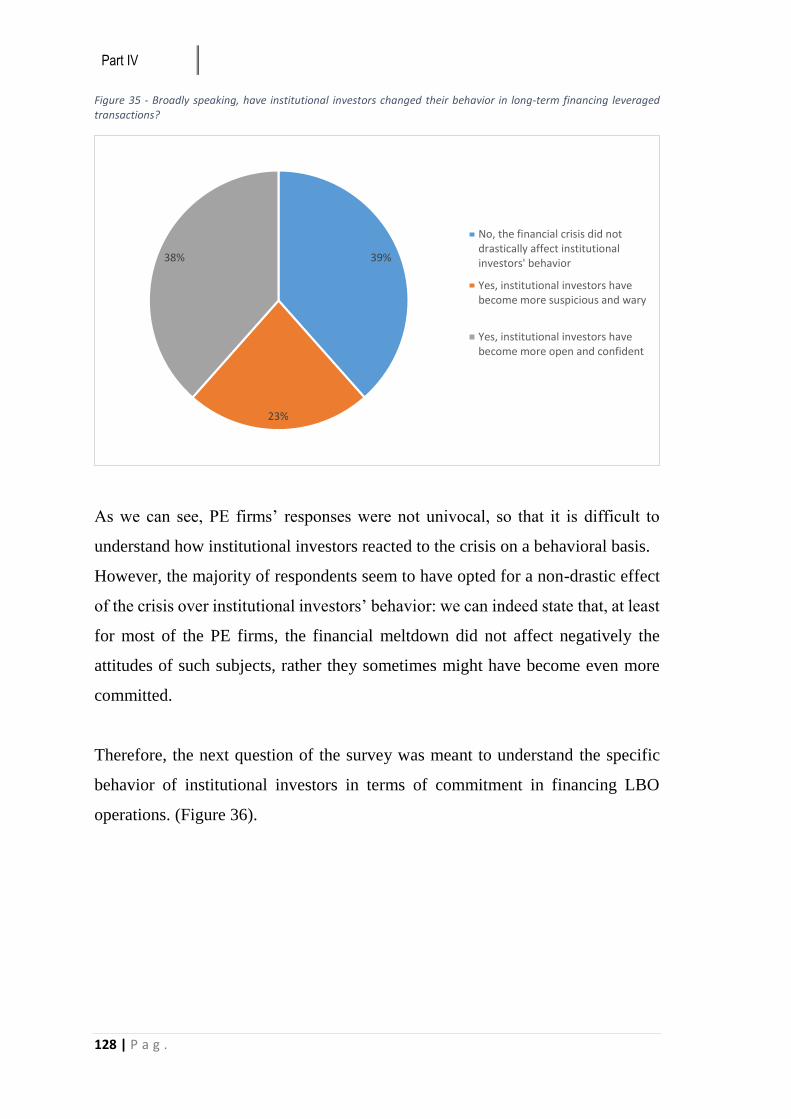
Part IV
128 | P a g .
Figure 35 - Broadly speaking, have institutional investors changed their behavior in long-term financing leveraged transactions?
As we can see, PE firms’ responses were not univocal, so that it is difficult to
understand how institutional investors reacted to the crisis on a behavioral basis.
However, the majority of respondents seem to have opted for a non-drastic effect
of the crisis over institutional investors’ behavior: we can indeed state that, at least
for most of the PE firms, the financial meltdown did not affect negatively the
attitudes of such subjects, rather they sometimes might have become even more
committed.
Therefore, the next question of the survey was meant to understand the specific
behavior of institutional investors in terms of commitment in financing LBO
operations. (Figure 36).
39%
23%
38%
No, the financial crisis did notdrastically affect institutionalinvestors' behavior
Yes, institutional investors havebecome more suspicious and wary
Yes, institutional investors havebecome more open and confident
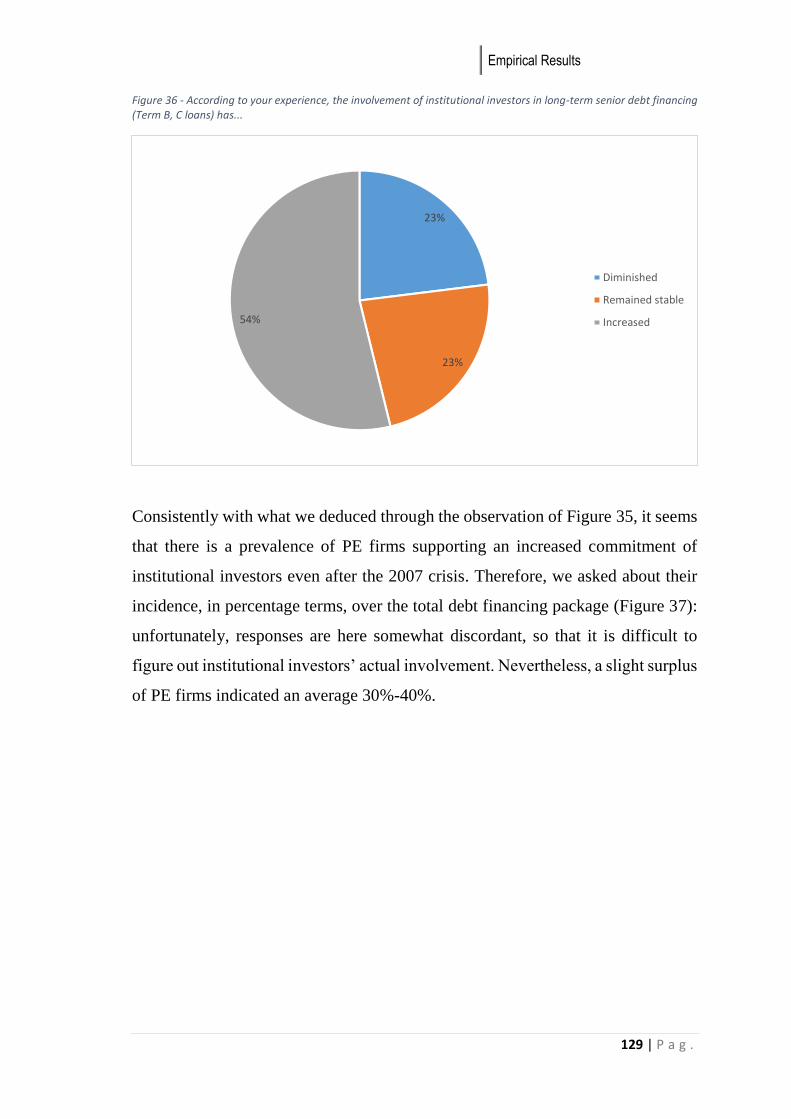
Empirical Results
129 | P a g .
Figure 36 - According to your experience, the involvement of institutional investors in long-term senior debt financing (Term B, C loans) has...
Consistently with what we deduced through the observation of Figure 35, it seems
that there is a prevalence of PE firms supporting an increased commitment of
institutional investors even after the 2007 crisis. Therefore, we asked about their
incidence, in percentage terms, over the total debt financing package (Figure 37):
unfortunately, responses are here somewhat discordant, so that it is difficult to
figure out institutional investors’ actual involvement. Nevertheless, a slight surplus
of PE firms indicated an average 30%-40%.
23%
23%
54%
Diminished
Remained stable
Increased
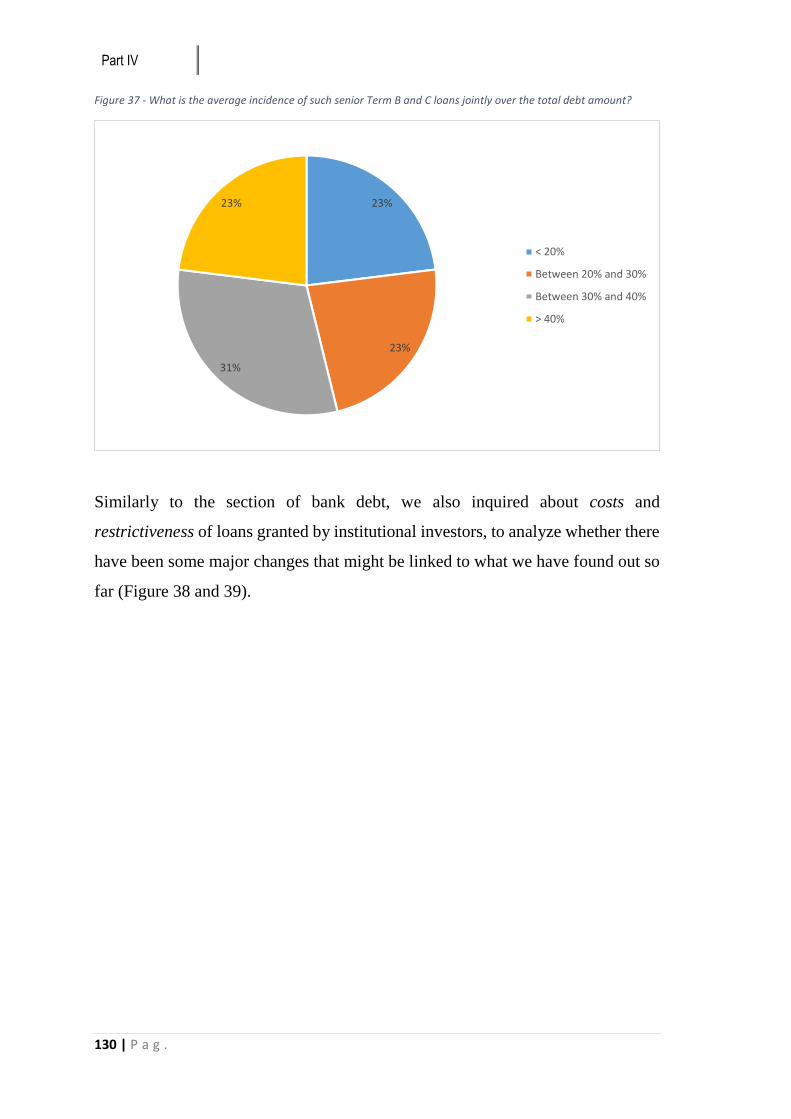
Part IV
130 | P a g .
Figure 37 - What is the average incidence of such senior Term B and C loans jointly over the total debt amount?
Similarly to the section of bank debt, we also inquired about costs and
restrictiveness of loans granted by institutional investors, to analyze whether there
have been some major changes that might be linked to what we have found out so
far (Figure 38 and 39).
23%
23%
31%
23%
< 20%
Between 20% and 30%
Between 30% and 40%
> 40%
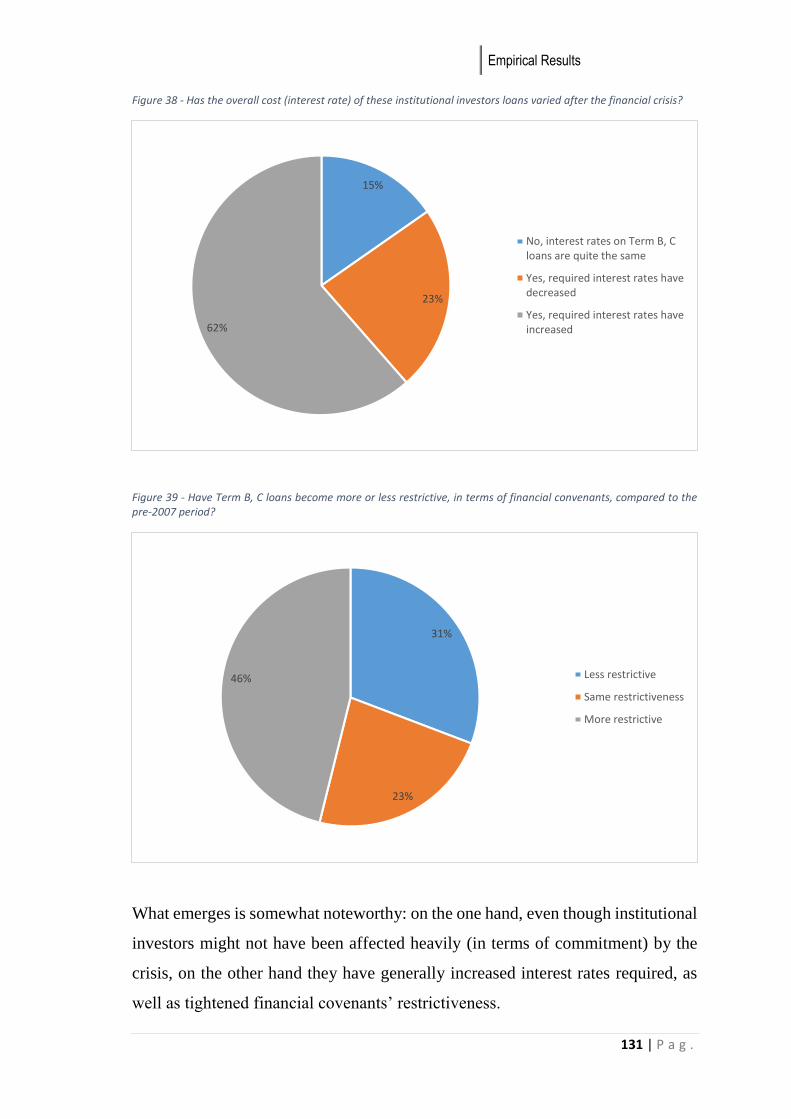
Empirical Results
131 | P a g .
Figure 38 - Has the overall cost (interest rate) of these institutional investors loans varied after the financial crisis?
Figure 39 - Have Term B, C loans become more or less restrictive, in terms of financial convenants, compared to the pre-2007 period?
What emerges is somewhat noteworthy: on the one hand, even though institutional
investors might not have been affected heavily (in terms of commitment) by the
crisis, on the other hand they have generally increased interest rates required, as
well as tightened financial covenants’ restrictiveness.
15%
23%
62%
No, interest rates on Term B, Cloans are quite the same
Yes, required interest rates havedecreased
Yes, required interest rates haveincreased
31%
23%
46% Less restrictive
Same restrictiveness
More restrictive

Part IV
132 | P a g .
Finally, we asked PE firms about the mean duration (maturity) of such Term B and
C loans, in order to have a more complete picture of the situation after the crisis
(Figure 40 and 41).
Figure 40 - Given a typical 7 to 10 years maturity, have these loans changed it after the financial crisis?
Figure 41 - According to your previous answer, could you please indicate the average maturity of institutional investors long-term loans?
77%
15%
8%
No, the maturity is still the sameasbefore
Yes, loans have lower maturities
Yes, loans have higher maturities
0%
10%
20%
30%
40%
50%
60%
70%
5 6 7 8 9 10 11 12
Percentage of responses
Empirical Results
133 | P a g .
Evidence is here very clear. Institutional investors seem not to have altered the
mean maturity of their loans at all, maintaining 7 years on average, similarly to the
pre-crisis period.
In conclusion, we have enough data and information to claim that our hypothesis
No. 3 (H3) cannot be confirmed. In fact, responses obtained by PE firms clearly
exhibit the tendency of institutional investors to commit meaningful amounts of
capital, even after the advent of the crisis. Unlike what we thought, they have not
diminished the bulk of capital provided to finance highly-leveraged transactions,
rather they have maintained or even increased their commitment, even though with
enhanced restrictiveness.
Junior Debt (and other forms of financing)
As we analyzed in detail in Part II, junior debt comprises mezzanine capital, high-
yield bonds and second-lien loans. While the formers had not shown any particular
trend during the 2000s up to 2007, the latter had witnessed a significant increase
over time, especially starting from 2004. As usual, the question arises as to whether
the crisis entailed some major changes regarding the usage of these junior
instruments.
We began by inquiring the willingness of junior debt lenders to keep investing in
LBOs on a behavioral basis (Figure 42).
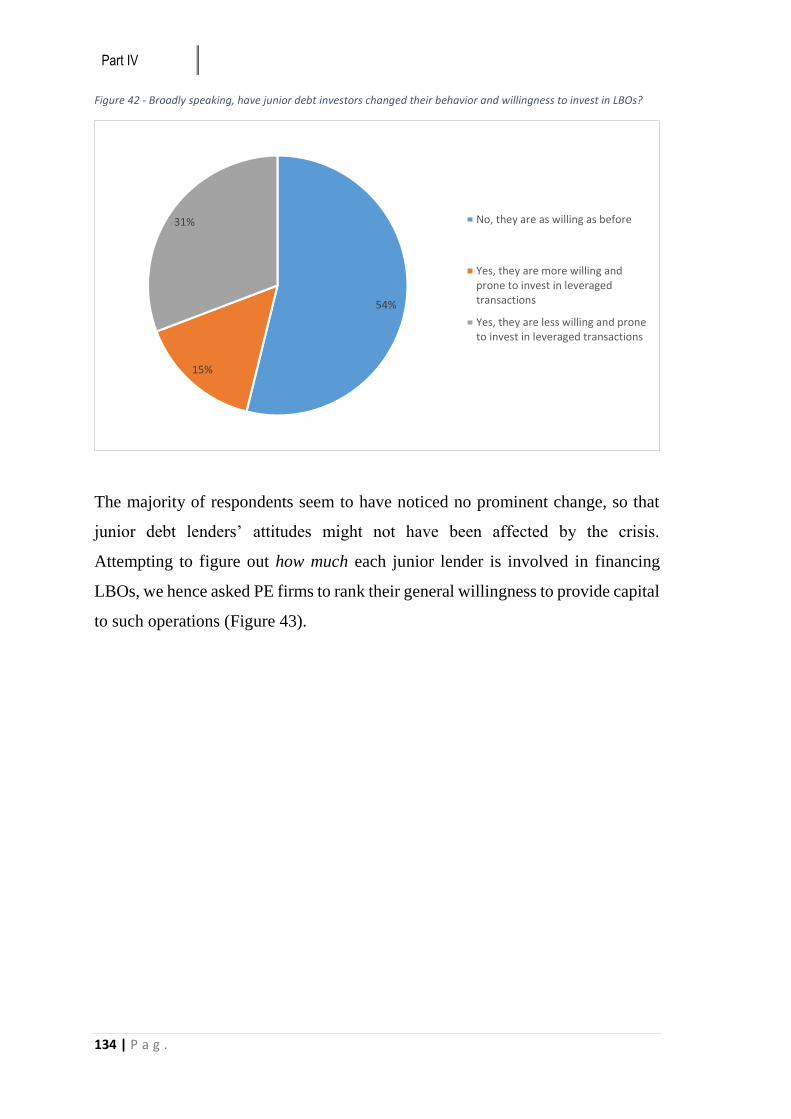
Part IV
134 | P a g .
Figure 42 - Broadly speaking, have junior debt investors changed their behavior and willingness to invest in LBOs?
The majority of respondents seem to have noticed no prominent change, so that
junior debt lenders’ attitudes might not have been affected by the crisis.
Attempting to figure out how much each junior lender is involved in financing
LBOs, we hence asked PE firms to rank their general willingness to provide capital
to such operations (Figure 43).
54%
15%
31% No, they are as willing as before
Yes, they are more willing andprone to invest in leveragedtransactions
Yes, they are less willing and proneto invest in leveraged transactions
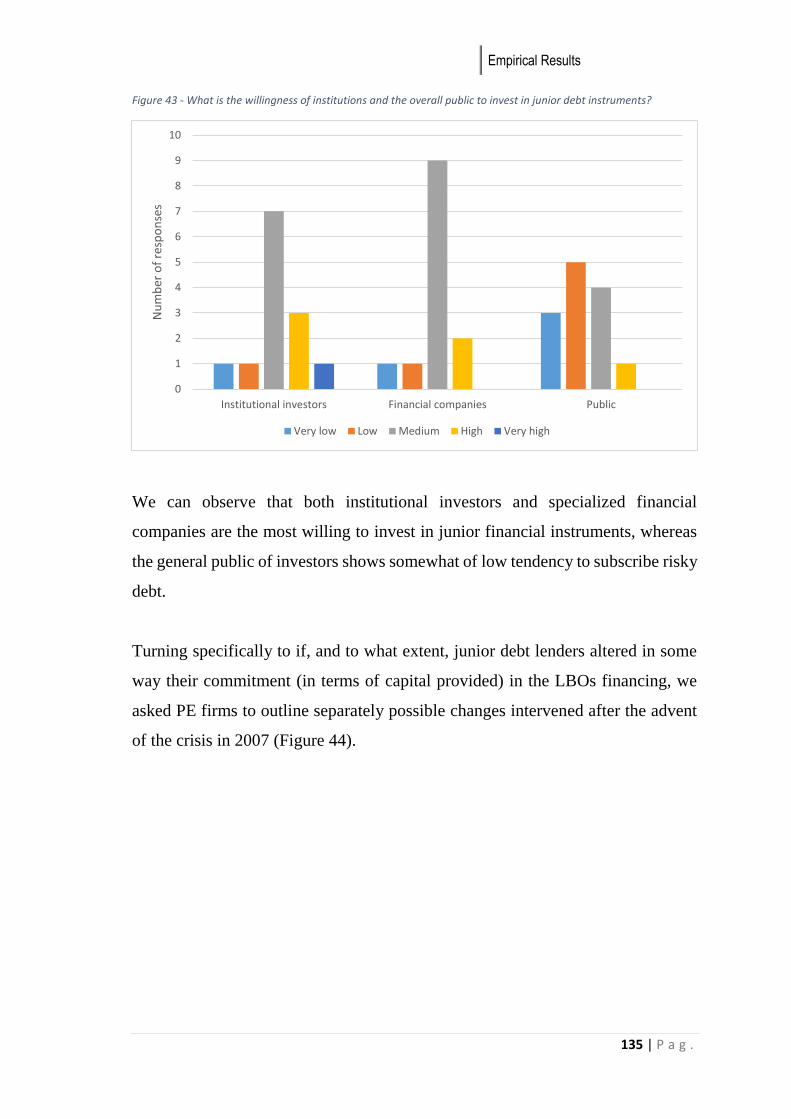
Empirical Results
135 | P a g .
Figure 43 - What is the willingness of institutions and the overall public to invest in junior debt instruments?
We can observe that both institutional investors and specialized financial
companies are the most willing to invest in junior financial instruments, whereas
the general public of investors shows somewhat of low tendency to subscribe risky
debt.
Turning specifically to if, and to what extent, junior debt lenders altered in some
way their commitment (in terms of capital provided) in the LBOs financing, we
asked PE firms to outline separately possible changes intervened after the advent
of the crisis in 2007 (Figure 44).
0
1
2
3
4
5
6
7
8
9
10
Institutional investors Financial companies Public
Nu
mb
er o
f re
spo
nse
s
Very low Low Medium High Very high
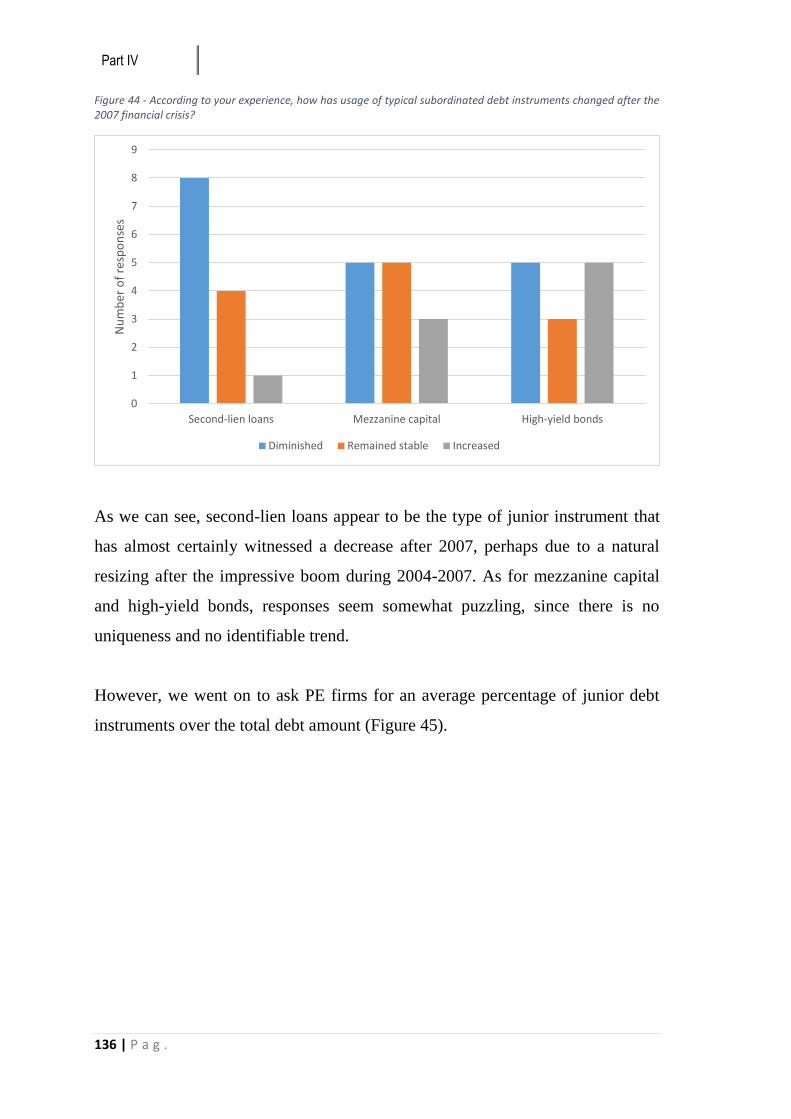
Part IV
136 | P a g .
Figure 44 - According to your experience, how has usage of typical subordinated debt instruments changed after the 2007 financial crisis?
As we can see, second-lien loans appear to be the type of junior instrument that
has almost certainly witnessed a decrease after 2007, perhaps due to a natural
resizing after the impressive boom during 2004-2007. As for mezzanine capital
and high-yield bonds, responses seem somewhat puzzling, since there is no
uniqueness and no identifiable trend.
However, we went on to ask PE firms for an average percentage of junior debt
instruments over the total debt amount (Figure 45).
0
1
2
3
4
5
6
7
8
9
Second-lien loans Mezzanine capital High-yield bonds
Nu
mb
er o
f re
spo
nse
s
Diminished Remained stable Increased
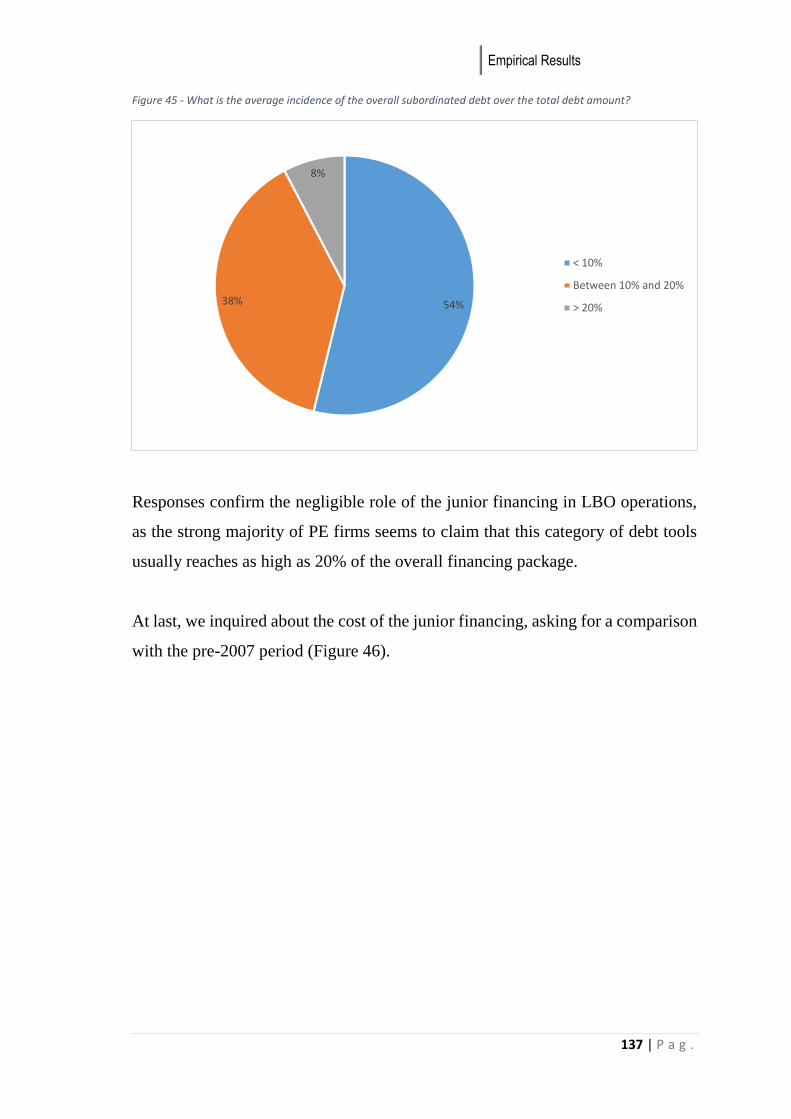
Empirical Results
137 | P a g .
Figure 45 - What is the average incidence of the overall subordinated debt over the total debt amount?
Responses confirm the negligible role of the junior financing in LBO operations,
as the strong majority of PE firms seems to claim that this category of debt tools
usually reaches as high as 20% of the overall financing package.
At last, we inquired about the cost of the junior financing, asking for a comparison
with the pre-2007 period (Figure 46).
54%38%
8%
< 10%
Between 10% and 20%
> 20%
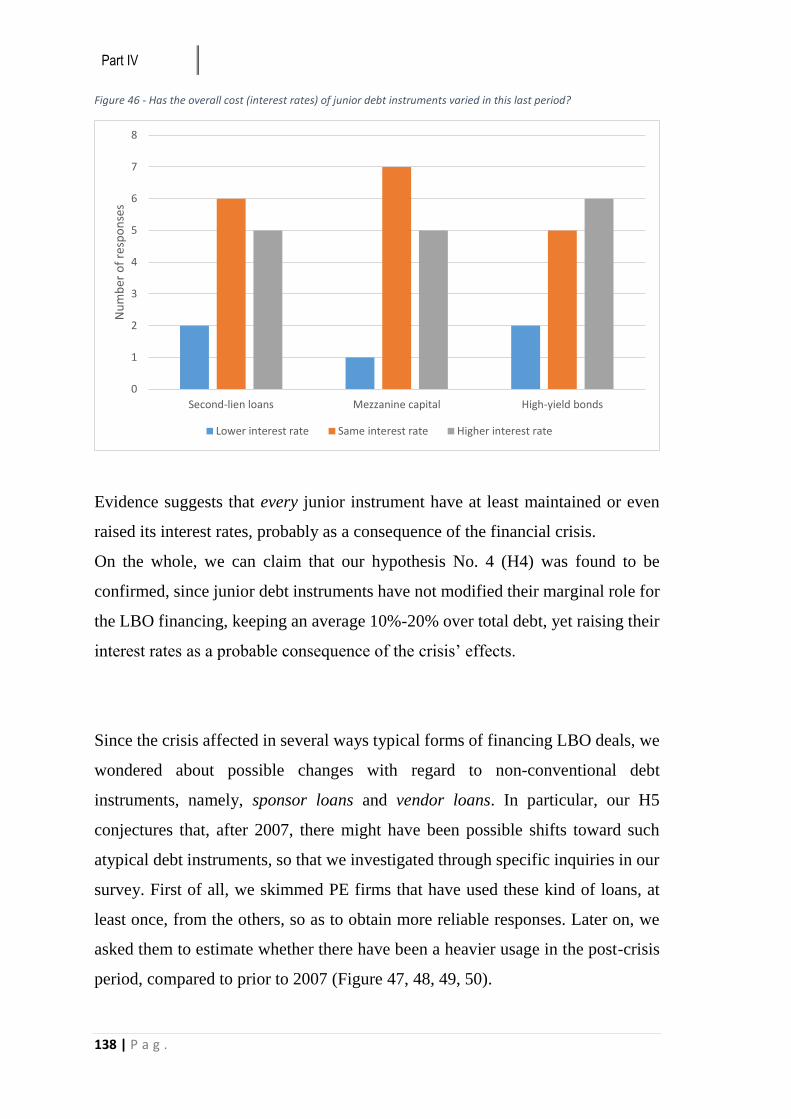
Part IV
138 | P a g .
Figure 46 - Has the overall cost (interest rates) of junior debt instruments varied in this last period?
Evidence suggests that every junior instrument have at least maintained or even
raised its interest rates, probably as a consequence of the financial crisis.
On the whole, we can claim that our hypothesis No. 4 (H4) was found to be
confirmed, since junior debt instruments have not modified their marginal role for
the LBO financing, keeping an average 10%-20% over total debt, yet raising their
interest rates as a probable consequence of the crisis’ effects.
Since the crisis affected in several ways typical forms of financing LBO deals, we
wondered about possible changes with regard to non-conventional debt
instruments, namely, sponsor loans and vendor loans. In particular, our H5
conjectures that, after 2007, there might have been possible shifts toward such
atypical debt instruments, so that we investigated through specific inquiries in our
survey. First of all, we skimmed PE firms that have used these kind of loans, at
least once, from the others, so as to obtain more reliable responses. Later on, we
asked them to estimate whether there have been a heavier usage in the post-crisis
period, compared to prior to 2007 (Figure 47, 48, 49, 50).
0
1
2
3
4
5
6
7
8
Second-lien loans Mezzanine capital High-yield bonds
Nu
mb
er o
f re
spo
nse
s
Lower interest rate Same interest rate Higher interest rate

Empirical Results
139 | P a g .
Figure 47 - Have you ever happened to partly finance your LBO deals with a loan directly provided by your private equity firm (sponsor loan)?
Figure 48 - If yes, is this form of financing more or less used in your firm compared to the period prior to the 2007 financial crisis?
23%
77%
Yes
No
67%
33%
More used
Less used
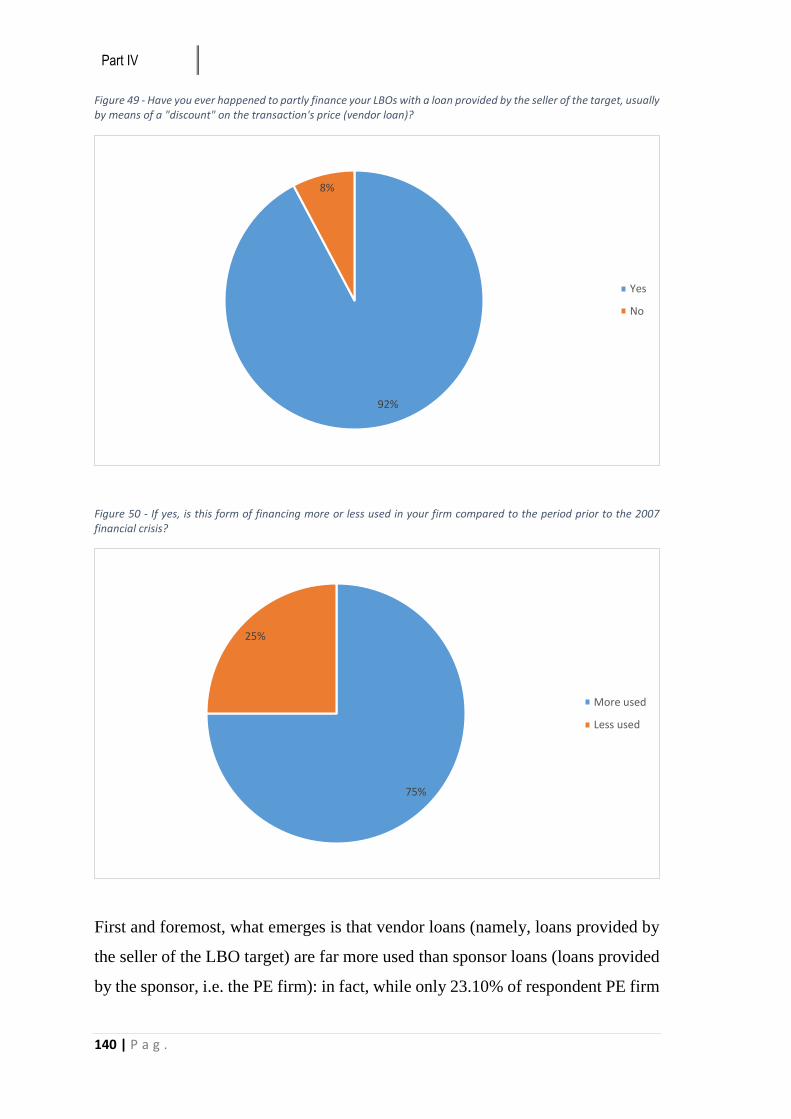
Part IV
140 | P a g .
Figure 49 - Have you ever happened to partly finance your LBOs with a loan provided by the seller of the target, usually by means of a "discount" on the transaction's price (vendor loan)?
Figure 50 - If yes, is this form of financing more or less used in your firm compared to the period prior to the 2007 financial crisis?
First and foremost, what emerges is that vendor loans (namely, loans provided by
the seller of the LBO target) are far more used than sponsor loans (loans provided
by the sponsor, i.e. the PE firm): in fact, while only 23.10% of respondent PE firm
92%
8%
Yes
No
75%
25%
More used
Less used
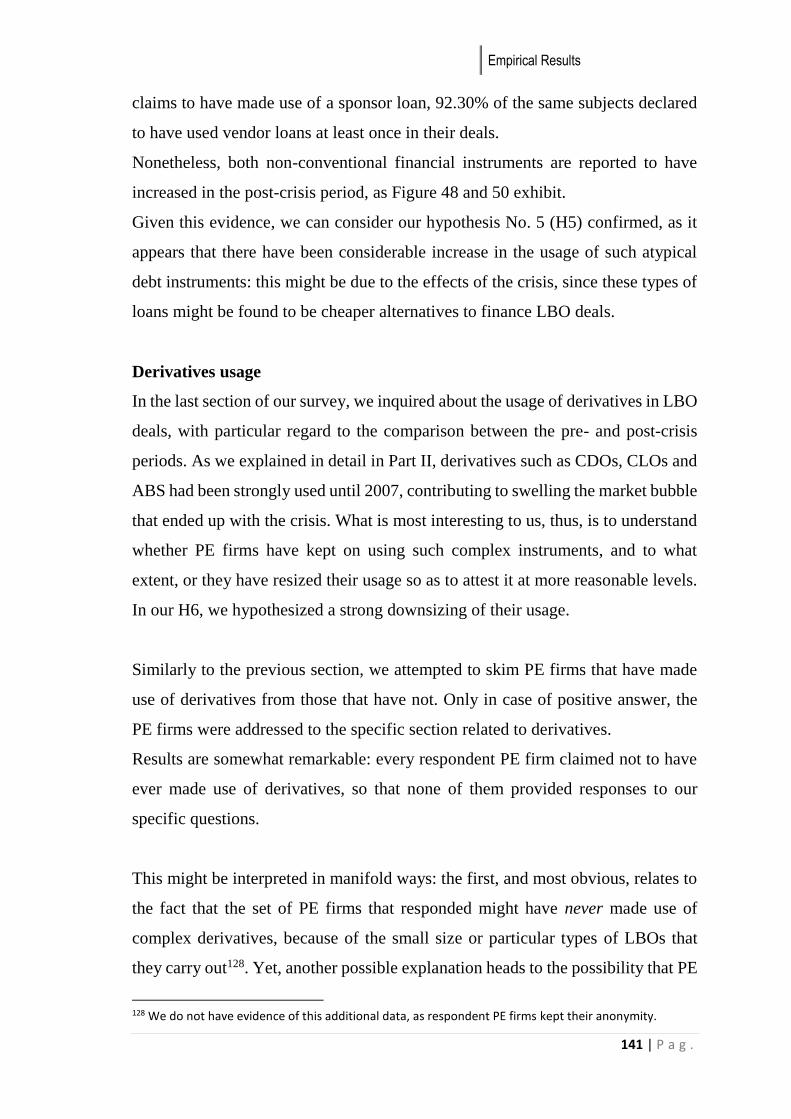
Empirical Results
141 | P a g .
claims to have made use of a sponsor loan, 92.30% of the same subjects declared
to have used vendor loans at least once in their deals.
Nonetheless, both non-conventional financial instruments are reported to have
increased in the post-crisis period, as Figure 48 and 50 exhibit.
Given this evidence, we can consider our hypothesis No. 5 (H5) confirmed, as it
appears that there have been considerable increase in the usage of such atypical
debt instruments: this might be due to the effects of the crisis, since these types of
loans might be found to be cheaper alternatives to finance LBO deals.
Derivatives usage
In the last section of our survey, we inquired about the usage of derivatives in LBO
deals, with particular regard to the comparison between the pre- and post-crisis
periods. As we explained in detail in Part II, derivatives such as CDOs, CLOs and
ABS had been strongly used until 2007, contributing to swelling the market bubble
that ended up with the crisis. What is most interesting to us, thus, is to understand
whether PE firms have kept on using such complex instruments, and to what
extent, or they have resized their usage so as to attest it at more reasonable levels.
In our H6, we hypothesized a strong downsizing of their usage.
Similarly to the previous section, we attempted to skim PE firms that have made
use of derivatives from those that have not. Only in case of positive answer, the
PE firms were addressed to the specific section related to derivatives.
Results are somewhat remarkable: every respondent PE firm claimed not to have
ever made use of derivatives, so that none of them provided responses to our
specific questions.
This might be interpreted in manifold ways: the first, and most obvious, relates to
the fact that the set of PE firms that responded might have never made use of
complex derivatives, because of the small size or particular types of LBOs that
they carry out128. Yet, another possible explanation heads to the possibility that PE
128 We do not have evidence of this additional data, as respondent PE firms kept their anonymity.

Part IV
142 | P a g .
firms might have decreased the derivatives’ usage, because they acknowledged
their relevant role in triggering the crisis, and they decided to build more
sustainable capital structures for their LBOs.
However, our H6 can be neither confirmed nor rejected, due to the lack of data
obtained.
4.2 Conclusive remarks
In this final paragraph, we will draw our conclusions on the evolution of the debt
financing package of LBOs after 2007 and we will attempt to establish possible
correlations with the renewed value creation process that has taken place ever
since. Since we acknowledge that this variable (what is best known as “financial
engineering” in the Kaplan’s value creation model) is not the only one that may
have led to the creation of value, we will introduce some significant variables
attributable to other levers of value creation, so that we will arrange a more
complete overview of the phenomenon.
Firstly, though, we have to understand the value creation trend, starting from the
year in which the crisis occurred, namely, 2007. In fact, before talking about the
creation of value, we need to figure out first whether PE firms have actually entered
a new virtuous cycle of value creation or, on the contrary, they have got into a
vicious cycle of value destruction. Hence, we can proceed by linking trends and
changes intervened in the value creation drivers (above all, the debt financing
package, but also others that will be introduced) to the value creation/destruction
cycle that PE firms have entered starting from 2007.
Therefore, we will divide this paragraph into three sub-paragraphs. While the first
(4.2.1) will analyze what kind of economic cycle PE firms have entered after the
crisis took place, so as to see whether we are in a value creation – or destruction –
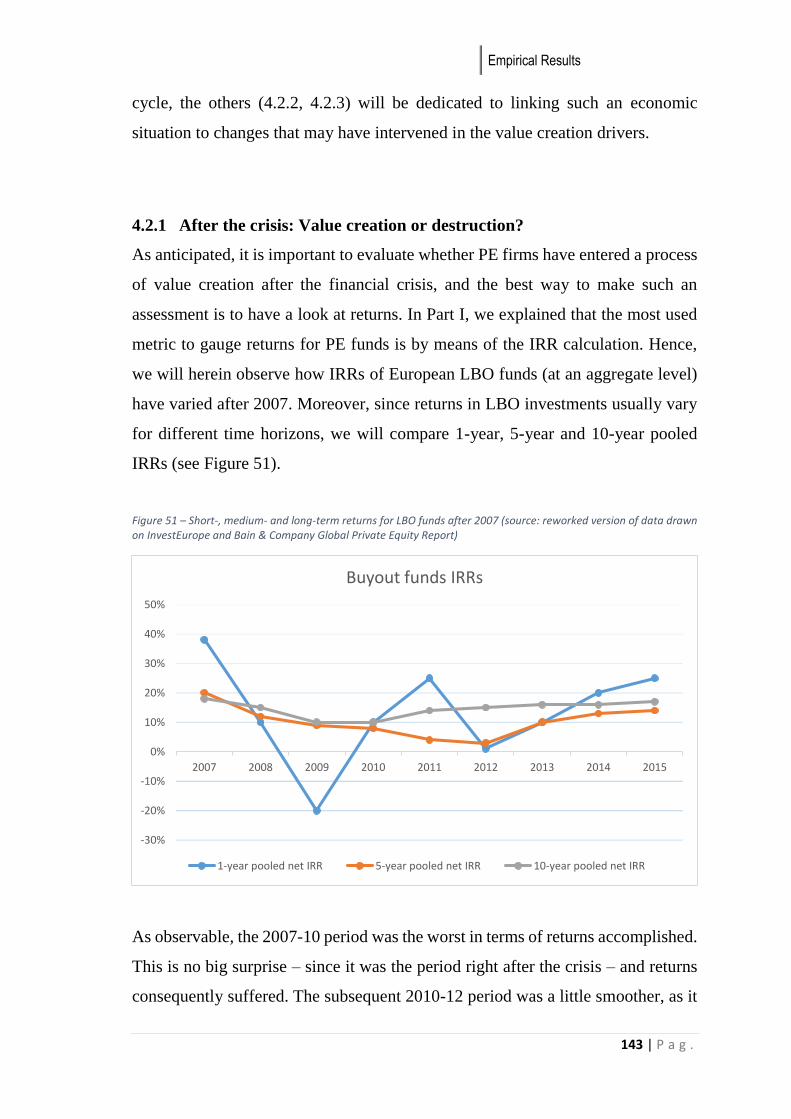
Empirical Results
143 | P a g .
cycle, the others (4.2.2, 4.2.3) will be dedicated to linking such an economic
situation to changes that may have intervened in the value creation drivers.
4.2.1 After the crisis: Value creation or destruction?
As anticipated, it is important to evaluate whether PE firms have entered a process
of value creation after the financial crisis, and the best way to make such an
assessment is to have a look at returns. In Part I, we explained that the most used
metric to gauge returns for PE funds is by means of the IRR calculation. Hence,
we will herein observe how IRRs of European LBO funds (at an aggregate level)
have varied after 2007. Moreover, since returns in LBO investments usually vary
for different time horizons, we will compare 1-year, 5-year and 10-year pooled
IRRs (see Figure 51).
Figure 51 – Short-, medium- and long-term returns for LBO funds after 2007 (source: reworked version of data drawn on InvestEurope and Bain & Company Global Private Equity Report)
As observable, the 2007-10 period was the worst in terms of returns accomplished.
This is no big surprise – since it was the period right after the crisis – and returns
consequently suffered. The subsequent 2010-12 period was a little smoother, as it
-30%
-20%
-10%
0%
10%
20%
30%
40%
50%
2007 2008 2009 2010 2011 2012 2013 2014 2015
Buyout funds IRRs
1-year pooled net IRR 5-year pooled net IRR 10-year pooled net IRR
Part IV
144 | P a g .
witnessed an initial upward trend, immediately followed by an opposed downward
inflexion that squeezed returns again. Nevertheless, from 2012 on and up to 2015
PE firms appear to have begun somewhat of a more stable trend – a constant upturn
that may not end up soon. Given this economic scenario, we may conjecture that,
after a naturally turbulent period during which PE firms underwent a fluctuating
trend due to the aftermath of the crisis, the latest years seem to have begun a stable
economic upturn, in which returns have constantly increased. Hence, it seems
somewhat likely that a renewed path for value creation has been marked out, so
that in the last two sub-paragraphs we will attempt some correlations with what
have probably caused such positive inversion of the trend, namely, the “financial
engineering” variable (by means of the debt financing package analysis) and other
value creation drivers.
4.2.2 The LBO financing package after 2007
Herein, we will attempt to summarize responses and data provided to outline a
typical LBO financing package as it is after 2007. In particular, not only will we
process responses so far analyzed, but we will also draw on an additional question
in which we asked directly PE firms to elaborate a stylized and representative
model of a post-2007 typical debt-financing package. Hence, we will attempt to
correlate our results to the renewed value creation path that seems to have started
for some years. Our results are shown in Figure 52.
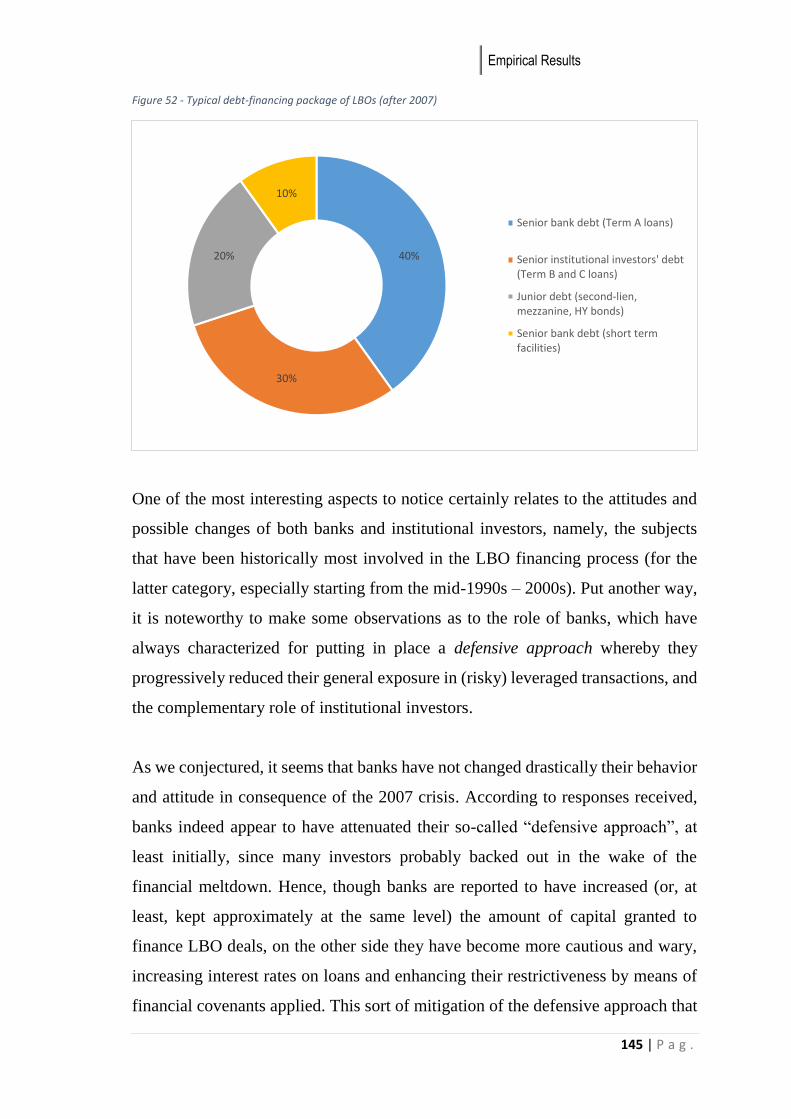
Empirical Results
145 | P a g .
Figure 52 - Typical debt-financing package of LBOs (after 2007)
One of the most interesting aspects to notice certainly relates to the attitudes and
possible changes of both banks and institutional investors, namely, the subjects
that have been historically most involved in the LBO financing process (for the
latter category, especially starting from the mid-1990s – 2000s). Put another way,
it is noteworthy to make some observations as to the role of banks, which have
always characterized for putting in place a defensive approach whereby they
progressively reduced their general exposure in (risky) leveraged transactions, and
the complementary role of institutional investors.
As we conjectured, it seems that banks have not changed drastically their behavior
and attitude in consequence of the 2007 crisis. According to responses received,
banks indeed appear to have attenuated their so-called “defensive approach”, at
least initially, since many investors probably backed out in the wake of the
financial meltdown. Hence, though banks are reported to have increased (or, at
least, kept approximately at the same level) the amount of capital granted to
finance LBO deals, on the other side they have become more cautious and wary,
increasing interest rates on loans and enhancing their restrictiveness by means of
financial covenants applied. This sort of mitigation of the defensive approach that
40%
30%
20%
10%
Senior bank debt (Term A loans)
Senior institutional investors' debt(Term B and C loans)
Junior debt (second-lien,mezzanine, HY bonds)
Senior bank debt (short termfacilities)
Part IV
146 | P a g .
they usually take on is absolutely normal, according to our judgement: in fact, as
it always happens in the aftermath of a substantial downturn of the market, a great
deal of investors draw back in fear and banks need to resume their control over the
LBO financing process. This usually perpetrates for the first years after the
market’s bust, with banks attempting to reduce gradually their risk afterwards,
when other investors renew their confidence in the LBO market.
What is somewhat striking to us, is the apparent little use of derivatives. As
observed in detail in Part II, the (ab)use of such financial instruments from banks
was certainly one of the main reason of the surge of institutional investors.
Regardless, out of the 13 responses received, none of them claimed to have made
use of derivatives in the post-crisis period, so that we wondered about the real
possibility that the crisis might have smashed the derivatives market for LBO
financing. This scenario does not appear plausible to us. Though the usage of
derivatives in LBOs is likely to have been strongly resized after 2007, we do not
think that it have disappeared at all. Our totality of negative responses is probably
due to their low number, compared to the entirety of the sample, so that we cannot
draw some fetched conclusion about sudden and complete non-use of derivatives
after 2007. However, as we anticipated above, we do believe that their usage might
have been highly resized, given their “power” to inflate the market quickly.
Institutional investors have shown somewhat of a puzzling behavior compared to
what we conjectured. As in the aftermath of the market bust in 1989 junk bonds
investors immediately disappear (along with capital they excitedly put in
overheated LBOs), we expected to witness a strong reduction this time as well,
with the bulk of institutional investors rushing to exit the market. Responses that
we received suggest a different approach: in fact, institutional investors seem
willing to invest in LBOs after the crisis took place, even showing a higher degree
of openness and confidence in such operations. However, they have not been naïve
at all, as they have heavily reduced the grant of junior debt (second-lien loans) in
favor of safer senior Term B, C loans that have increased. Similarly to banks, then,
Empirical Results
147 | P a g .
they have required higher interest rates and also tightened the general
restrictiveness of their loans.
With regard to junior debt, it appears to have maintained a minor role, even though
its internal composition might have varied. In fact, alongside the anticipated
plunge of second-lien loans (which were granted by institutional investors and
gained popularity during the years right before the crisis) and an unchanged level
of mezzanine capital, there might have been a rediscovered use of high-yield
bonds. Nevertheless, their usage stands at a mean 10% level, so that an inflated
market bubble like that of the late 1980s seems very unlikely to recur.
To finally summarize, we believe that some of the aspects that we found out may
be qualitatively related to the renewed path of value creation that PE firms seem
to have started for some years. Starting with banks, we described above that one
of their most relevant contribution is certainly the mitigation of their typical
defensive approach, which they had always rushed to put in place. Once the crisis
occurred in 2007, a great deal of investors indeed lost their confidence in financing
LBO deals, hence drawing their capital back. In this scenario, if banks had not
resumed and maintained their control over the LBO financing process, the LBO
market could have virtually disappeared, at least for some years, until financial
markets started to rebound. But this is not all. In fact, their increased restrictiveness
in terms of both interest rates and enhanced financial covenants may have led PE
firms to pay much more attention and shrewdness in selecting the most profitable
deals and rejecting those with uncertain positive returns. Furthermore, the
conjectured abatement of the derivatives market (CLOs, CBOs…) has certainly
benefited the LBO market as a whole, as it allowed not to inflate quickly LBOs
thanks to the impressive amounts of capital that derivatives bring in.
On the institutional investors’ side, their renewed confidence and willingness to
put capital in LBOs was somewhat unexpected. Although they maintained (or even
increased) their commitment, however, they restricted their conditions similarly to

Part IV
148 | P a g .
banks. Moreover, they shrank strongly the grant of junior debt (second-lien loans)
in favor of safer long-term senior loans. Therefore, an increased source of capital
paired with higher interest rates and tighter financial covenants may have led PE
firms to skimming their investments more accurately.
On the whole, we can claim that the higher degree of caution from banks and
institutional investors has probably led PE firms to more prudence and foresight
when screening and selecting their investments, and this finally results in safer and
more profitable deals for both the PE firm and its Limited Partners.
4.2.3 Other drivers of value creation
Obviously, many factors may be responsible for the value creation path that has
been marked out after the crisis. As we observed in detail in Part I, the value
creation model developed by Kaplan and that of the WEF include a range of
variables (drivers) that synergistically lead to value creation. Hence, though the
main object of this work was the analysis of the leverage and financial engineering
drivers, we do not claim that it is the only, nor the most important lever for creating
value for the fund and its investors. In light of this, we believe that a more realistic
and credible framework for the value creation requires considering other drivers
as well, investigating possible changes and patterns that may have intervened after
the crisis. In particular, we observed in Part I that variables like Investment
Selection and Timing are critical, according to the WEF value creation model.
Therefore, we obtained some relevant data that relates to both of these drivers and
that, along with the debt financing package, may help understand what has driven
value creation for some years onward.
Investment Selection
The investment selection driver can be referred to as the ability of PE firms to
understand which are the most desirable and profitable sectors to invest capital at
any given time. In other words, it points at the capability of PE firms of detecting
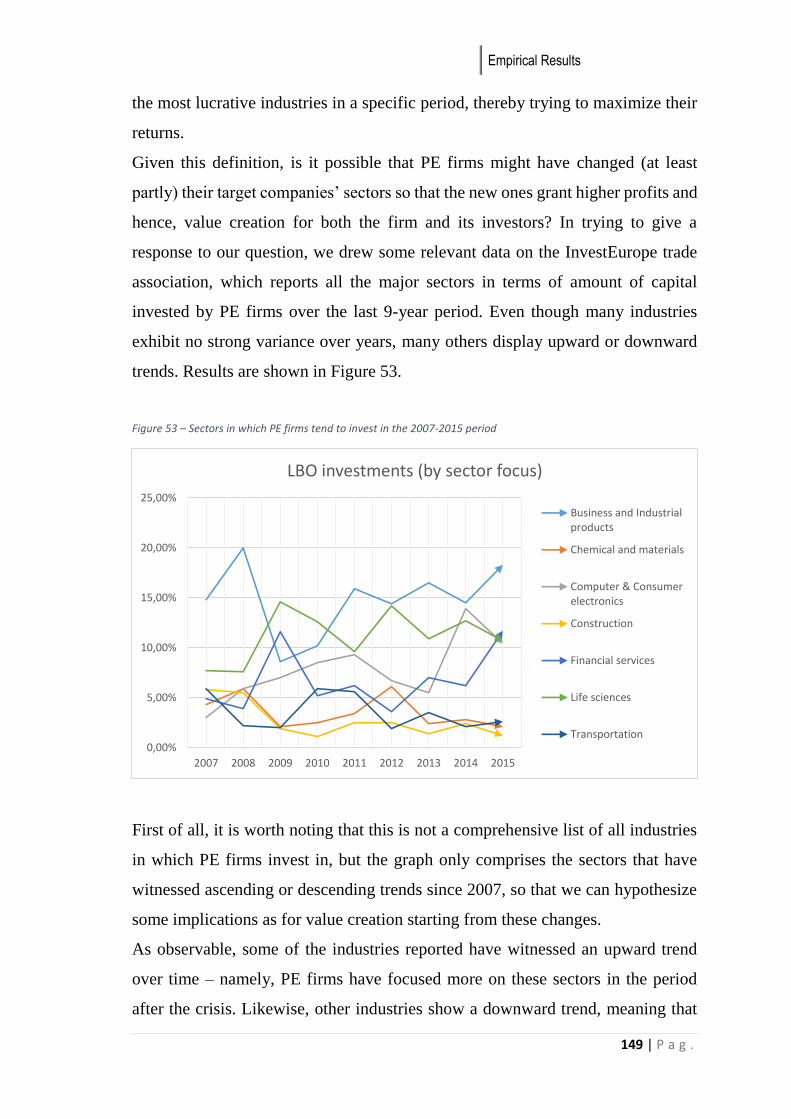
Empirical Results
149 | P a g .
the most lucrative industries in a specific period, thereby trying to maximize their
returns.
Given this definition, is it possible that PE firms might have changed (at least
partly) their target companies’ sectors so that the new ones grant higher profits and
hence, value creation for both the firm and its investors? In trying to give a
response to our question, we drew some relevant data on the InvestEurope trade
association, which reports all the major sectors in terms of amount of capital
invested by PE firms over the last 9-year period. Even though many industries
exhibit no strong variance over years, many others display upward or downward
trends. Results are shown in Figure 53.
Figure 53 – Sectors in which PE firms tend to invest in the 2007-2015 period
First of all, it is worth noting that this is not a comprehensive list of all industries
in which PE firms invest in, but the graph only comprises the sectors that have
witnessed ascending or descending trends since 2007, so that we can hypothesize
some implications as for value creation starting from these changes.
As observable, some of the industries reported have witnessed an upward trend
over time – namely, PE firms have focused more on these sectors in the period
after the crisis. Likewise, other industries show a downward trend, meaning that
0,00%
5,00%
10,00%
15,00%
20,00%
25,00%
2007 2008 2009 2010 2011 2012 2013 2014 2015
LBO investments (by sector focus)
Business and Industrialproducts
Chemical and materials
Computer & Consumerelectronics
Construction
Financial services
Life sciences
Transportation
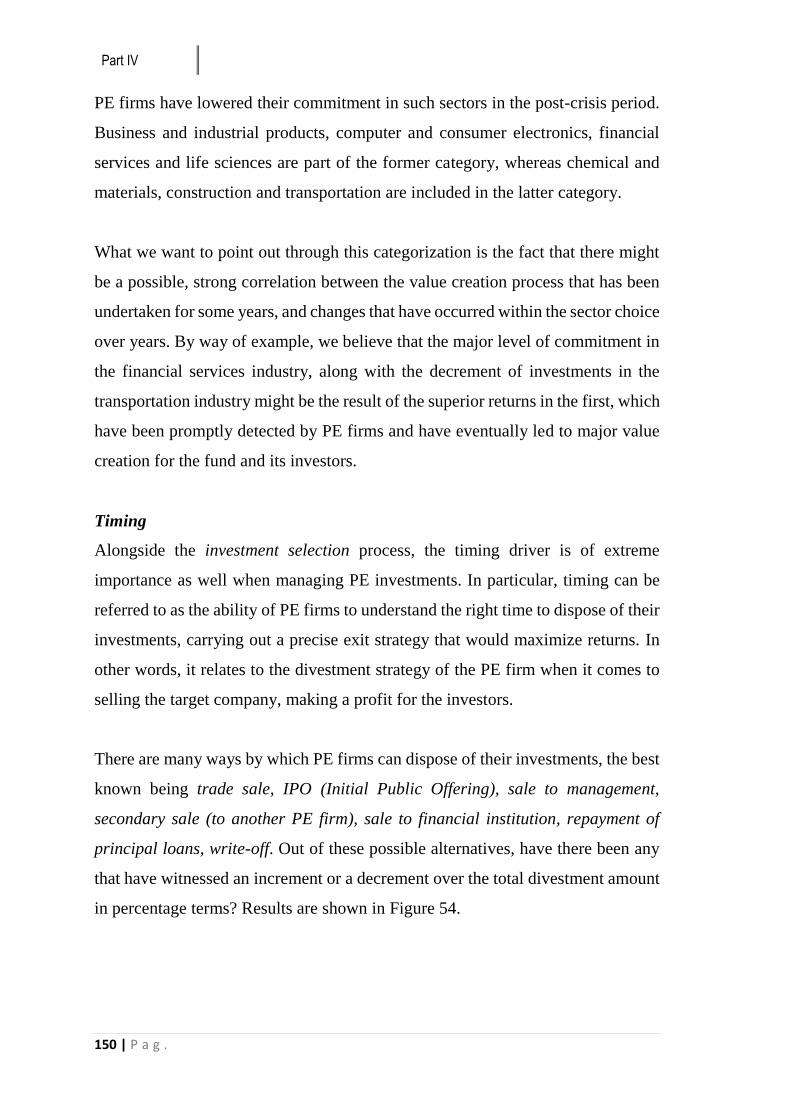
Part IV
150 | P a g .
PE firms have lowered their commitment in such sectors in the post-crisis period.
Business and industrial products, computer and consumer electronics, financial
services and life sciences are part of the former category, whereas chemical and
materials, construction and transportation are included in the latter category.
What we want to point out through this categorization is the fact that there might
be a possible, strong correlation between the value creation process that has been
undertaken for some years, and changes that have occurred within the sector choice
over years. By way of example, we believe that the major level of commitment in
the financial services industry, along with the decrement of investments in the
transportation industry might be the result of the superior returns in the first, which
have been promptly detected by PE firms and have eventually led to major value
creation for the fund and its investors.
Timing
Alongside the investment selection process, the timing driver is of extreme
importance as well when managing PE investments. In particular, timing can be
referred to as the ability of PE firms to understand the right time to dispose of their
investments, carrying out a precise exit strategy that would maximize returns. In
other words, it relates to the divestment strategy of the PE firm when it comes to
selling the target company, making a profit for the investors.
There are many ways by which PE firms can dispose of their investments, the best
known being trade sale, IPO (Initial Public Offering), sale to management,
secondary sale (to another PE firm), sale to financial institution, repayment of
principal loans, write-off. Out of these possible alternatives, have there been any
that have witnessed an increment or a decrement over the total divestment amount
in percentage terms? Results are shown in Figure 54.
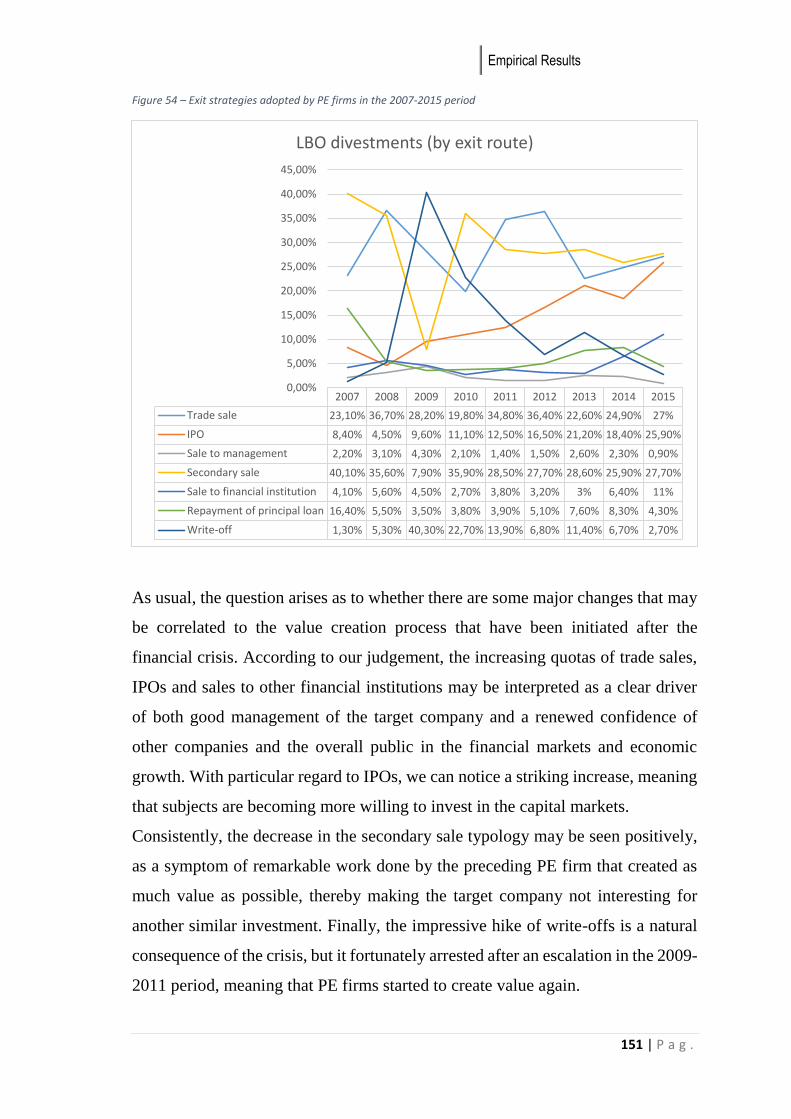
Empirical Results
151 | P a g .
Figure 54 – Exit strategies adopted by PE firms in the 2007-2015 period
As usual, the question arises as to whether there are some major changes that may
be correlated to the value creation process that have been initiated after the
financial crisis. According to our judgement, the increasing quotas of trade sales,
IPOs and sales to other financial institutions may be interpreted as a clear driver
of both good management of the target company and a renewed confidence of
other companies and the overall public in the financial markets and economic
growth. With particular regard to IPOs, we can notice a striking increase, meaning
that subjects are becoming more willing to invest in the capital markets.
Consistently, the decrease in the secondary sale typology may be seen positively,
as a symptom of remarkable work done by the preceding PE firm that created as
much value as possible, thereby making the target company not interesting for
another similar investment. Finally, the impressive hike of write-offs is a natural
consequence of the crisis, but it fortunately arrested after an escalation in the 2009-
2011 period, meaning that PE firms started to create value again.
2007 2008 2009 2010 2011 2012 2013 2014 2015
Trade sale 23,10% 36,70% 28,20% 19,80% 34,80% 36,40% 22,60% 24,90% 27%
IPO 8,40% 4,50% 9,60% 11,10% 12,50% 16,50% 21,20% 18,40% 25,90%
Sale to management 2,20% 3,10% 4,30% 2,10% 1,40% 1,50% 2,60% 2,30% 0,90%
Secondary sale 40,10% 35,60% 7,90% 35,90% 28,50% 27,70% 28,60% 25,90% 27,70%
Sale to financial institution 4,10% 5,60% 4,50% 2,70% 3,80% 3,20% 3% 6,40% 11%
Repayment of principal loan 16,40% 5,50% 3,50% 3,80% 3,90% 5,10% 7,60% 8,30% 4,30%
Write-off 1,30% 5,30% 40,30% 22,70% 13,90% 6,80% 11,40% 6,70% 2,70%
0,00%
5,00%
10,00%
15,00%
20,00%
25,00%
30,00%
35,00%
40,00%
45,00%
LBO divestments (by exit route)

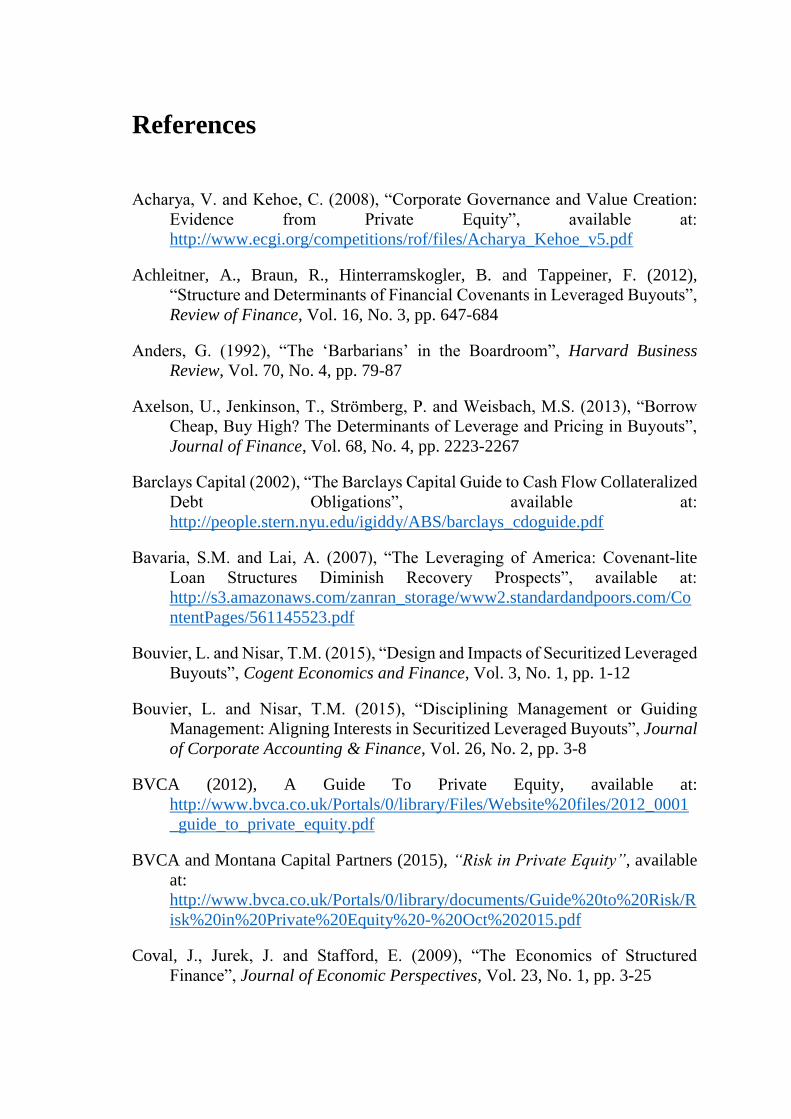
References
Acharya, V. and Kehoe, C. (2008), “Corporate Governance and Value Creation:
Evidence from Private Equity”, available at:
http://www.ecgi.org/competitions/rof/files/Acharya_Kehoe_v5.pdf
Achleitner, A., Braun, R., Hinterramskogler, B. and Tappeiner, F. (2012),
“Structure and Determinants of Financial Covenants in Leveraged Buyouts”,
Review of Finance, Vol. 16, No. 3, pp. 647-684
Anders, G. (1992), “The ‘Barbarians’ in the Boardroom”, Harvard Business
Review, Vol. 70, No. 4, pp. 79-87
Axelson, U., Jenkinson, T., Strömberg, P. and Weisbach, M.S. (2013), “Borrow
Cheap, Buy High? The Determinants of Leverage and Pricing in Buyouts”,
Journal of Finance, Vol. 68, No. 4, pp. 2223-2267
Barclays Capital (2002), “The Barclays Capital Guide to Cash Flow Collateralized
Debt Obligations”, available at:
http://people.stern.nyu.edu/igiddy/ABS/barclays_cdoguide.pdf
Bavaria, S.M. and Lai, A. (2007), “The Leveraging of America: Covenant-lite
Loan Structures Diminish Recovery Prospects”, available at:
http://s3.amazonaws.com/zanran_storage/www2.standardandpoors.com/Co
ntentPages/561145523.pdf
Bouvier, L. and Nisar, T.M. (2015), “Design and Impacts of Securitized Leveraged
Buyouts”, Cogent Economics and Finance, Vol. 3, No. 1, pp. 1-12
Bouvier, L. and Nisar, T.M. (2015), “Disciplining Management or Guiding
Management: Aligning Interests in Securitized Leveraged Buyouts”, Journal
of Corporate Accounting & Finance, Vol. 26, No. 2, pp. 3-8
BVCA (2012), A Guide To Private Equity, available at:
http://www.bvca.co.uk/Portals/0/library/Files/Website%20files/2012_0001
_guide_to_private_equity.pdf
BVCA and Montana Capital Partners (2015), “Risk in Private Equity”, available
at:
http://www.bvca.co.uk/Portals/0/library/documents/Guide%20to%20Risk/R
isk%20in%20Private%20Equity%20-%20Oct%202015.pdf
Coval, J., Jurek, J. and Stafford, E. (2009), “The Economics of Structured
Finance”, Journal of Economic Perspectives, Vol. 23, No. 1, pp. 3-25
De Fontenay, E. (2013), “Private Equity Firms as Gatekeepers”, available at:
http://papers.ssrn.com/sol3/papers.cfm?abstract_id=2245156
De Maeseneire, W. and Brinkhuis, S. (2012), “What Drives Leverage in Leveraged
Buyouts? An Analysis of European LBOs’ Capital Structure”, Accounting &
Finance, Vol. 52, pp. 155-182
Deitsch, M. (1990), “LBOs and Junk Bonds – Good Tools that Went Haywire”,
Financial Executive, Vol. 6, No. 5, p. 70
Demiroglu, C. and James, C.M. (2010), “The Role of Private Equity Group
Reputation in LBO Financing”, Journal of Financial Economics, Vol. 96,
No. 2, pp. 306-330
Fang, L., Ivashina, I. and Lerner, J. (2013), “Combining Banking with Private
Equity Investing”, Review of Financial Studies, Vol. 26, No. 9, pp. 2139-
2173
Fenn, G.W., Liang, N. and Prowse, S. (1995), “The Economics of the Private
Equity Market”, available at:
http://www.federalreserve.gov/pubs/staffstudies/1990-99/ss168.pdf
Gilligan, J. and Wright, M. (2014), “Private Equity Demystified – an Explanatory
Guide”, ICAEW Corporate Finance, London (UK)
Gong, J.J. and Wu, S.Y. (2011), “CEO Turnover in Private Equity Sponsored
Leveraged Buyouts”, Corporate Governance: an International Review, Vol.
19, No. 3, pp. 201-206
Guo, S., Hotchkiss, E.S. and Song, W. (2011), “Do Buyouts (still) Create Value?”,
Journal of Finance, Vol. 66, No. 2, pp. 479-517
Harris, R.S., Jenkinson, T. and Kaplan, S.N. (2014), “Private Equity Performance:
What Do We Know?”, Journal of Finance, Vol. 69, No. 5, pp. 1851-1882
Harris, R.S., Jenkinson, T., Kaplan, S.N. and Stucke, R. (2014), “Has Persistence
Persisted in Private Equity? Evidence from Buyout and Venture Capital
Funds”, available at:
http://papers.ssrn.com/sol3/papers.cfm?abstract_id=2304808
Ivashina, I. and Kovner, A. (2011), “The Private Equity Advantage: Leveraged
Buyout Firms and Relationship Banking”, Review of Financial Studies, Vol.
24, No. 7, pp. 2462-2498
Jensen, M.C. (1986), “Agency Costs of Free Cash Flows, Corporate Finance and
Takeovers”, American Economic Review, Vol. 76, No. 2, pp. 323-329
Jensen, M.C. (1989), “Active Investors, LBOs, and the Privatization of
Bankruptcy”, Journal of Applied Corporate Finance, Vol. 2, No. 1, pp. 77-
85
Jensen, M.C. (1989), “Eclipse of the Public Corporation”, Harvard Business
Review, Vol. 67, No. 5, pp. 61-74
Jensen, M.C. and Meckling, W.H. (1976), “Theory of the Firm: Managerial
Behavior, Agency Costs and Ownership Structure”, available at:
http://www.sfu.ca/~wainwrig/Econ400/jensen-meckling.pdf
Kaplan, S.N. and Schoar, A. (2005), “Private Equity Performance: Returns,
Persistence and Capital Flows”, Journal of Finance, Vol. 60, No. 4, pp. 1791-
1823
Kaplan, S.N. and Stein, J.C. (1993), “The Evolution of Buyout Pricing and
Financial Structure”, The Quarterly Journal of Economics, Vol. 108, No. 2,
pp. 313-357
Kaplan, S.N. and Strömberg, P. (2009), “Leveraged Buyouts and Private Equity”,
The Journal of Economic Perspectives, Vol. 23, No. 1, pp. 121-146
Kaplan, S.N., Ferenbach, C., Bingle, M., Lipschultz, M., Canfield, P. and Jones,
A. (2011), “Morgan Stanley Roundtable on the State of Global Private
Equity”, Journal of Applied Corporate Finance, Vol. 23, No. 4, pp. 8-33
Kaserer, C. and Diller, C. (2004), “European Private Equity Funds – A Cash Flow
Based Performance Analysis”, CEFS Working Paper No. 2004-01
Kitching, J. (1989), “Early Returns on LBO”, Harvard Business Review, Vol. 67,
No. 6, pp. 74-81
Knauer, A., Lahmann, A., Pflücke, M. and Schwetzler, B. (2014), “How Much Do
Private Equity Funds Benefit from Debt-Related Tax Shields?”, Journal of
Applied Corporate Finance, Vol. 26, No. 1, pp. 85-93
Lerner, J., Schoar, A. and Wongsunwai, W. (2007), “Smart Institutions, Foolish
Choices: the Limited Partner Performance Puzzle”, Journal of Finance, Vol.
62, No. 2, pp. 731-764
Lichtenberg, F.R. and Siegel, D. (1990), “The Effects of Leveraged Buyouts on
Productivity and Related Aspects of Firm Behaviour”, Journal of Financial
Economics, Vol. 27, No. 1, pp. 165-194
Ljungqvist, A. and Richardson, M. (2003), “The Cash Flow, Return and Risk
Characteristics of Private Equity”, available at:
http://archive.nyu.edu/bitstream/2451/26715/2/S-CG-03-01.pdf
Lopez-de-Silanes, F., Phalippou, L. and Gottschalg, O. (2015), “Giants at the Gate:
Investment Returns and Diseconomies of Scale in Private Equity”, Journal
of Financial & Quantitative Analysis, Vol. 50, No. 3, pp. 377-411
Maiden, B. (2006), “Acquisition Securitization Takes Off in the US”, International
Financial Law Review, Vol. 25, No. 5, pp. 8-9
Maupin, R.J. (1987), “Financial and Stock Market Variables as Predictors of
Management Buyouts”, Strategic Management Journal, Vol. 8, No. 4, pp.
319-327
Metrick, A. and Yasuda, A. (2010), “The Economics of Private Equity”, Review
of Financial Studies, Vol. 23, No. 6, pp. 2303-2341
Modigliani, F. and Miller, M.H. (1958), “The Cost of Capital, Corporation Finance
and the Theory of Investment”, American Economic Review, Vol. 48, No.3,
pp. 261-297
Modigliani, F. and Miller, M.H. (1963), “Corporate Income Taxes and the Cost of
Capital: a Correction”, American Economic Review, Vol. 53, No. 3, pp. 433-
443
Mozes, H. and Fiore, A. (2012), “Private Equity Performance: Better than
Commonly Believed”, Journal of Private Equity, Vol. 15, No. 3, pp. 19-32
Muscarella, C.J. and Vetsuypens, M.R. (1990), “Efficiency and Organizational
Structure: a Study of Reverse LBOs”, Journal of Finance, Vol. 45, No. 5, pp.
1389-1413
Phalippou, L. (2014), “Performance of Buyout Funds Revisited?”, Review of
Finance, Vol. 18, No. 1, pp. 189-218
Phalippou, L. and Gottschalg, O. (2009), “The Performance of Private Equity
Funds”, the Review of Financial Studies, Vol. 22, No. 4, pp. 1747-1776
PricewaterhouseCoopers (2015), “Private Equity Trend Report 2015”, available
at: https://www.pwc.lu/en/private-equity/docs/pwc-pe-private-equity-trend-
report-2015.pdf
Robinson, D.T. and Sensoy, B.A. (2013), “Do Private Equity Managers Earn Their
Fees? Compensation, Ownership and Cash Flow Performance”, Review of
Financial Studies, Vol. 26, No. 11, pp. 2760-2797
Roden, D.M. and Lewellen, W.G. (1995), “Corporate Capital Structure Decisions:
Evidence from Leveraged Buyouts”, Financial Management (Silver
Anniversary Commemoration), Vol. 24, No. 2, pp. 76-87
Shivdasani, A. and Wang, Y. (2011), “Did Structured Credit Fuel the LBO
Boom?”, Journal of Finance, Vol. 66, No. 4, pp. 1291-1328

Singh, H. (1990), “Management Buyouts: Distinguishing Characteristics and
Operating Changes prior to Public Offerings”, Strategic Management
Journal, Vol. 11, No. 4, pp. 111-129
Smith, A. (1990), “The Effects of Leveraged Buyouts”, Business Economics, Vol.
25, No. 2
Sorensen, M., Wang, N. and Yang, J. (2014), “Valuing Private Equity”, Review of
Financial Studies, Vol. 27, No. 7, pp. 1977-2021
The Financial Crisis Inquiry Commission (2011), “The Financial crisis Inquiry
Report: Final Report of the National Commission on the Causes of the
Financial and Economic Crisis in the United States”, Featured Commission
Publications, available at: https://www.gpo.gov/fdsys/pkg/GPO-
FCIC/pdf/GPO-FCIC.pdf
World Economic Forum (2015), “Alternative Investments 2020 – An Introduction
to Alternative Investments”, available at: http://www3.weforum.org