Embed Size (px)
Citation preview

Presented by
1
Hexion Overview Presentation
JPM | European High Yield & Leveraged Finance Conference
Craig RogersonChairman, President and Chief Executive Officer
September 9, 2021
2
Forward-Looking Statements
Certain statements in this presentation are forward-looking statements within the meaning of and made pursuant to the safe harbor provisions of Section 27A
of the Securities Act of 1933, as amended, and Section 21E of the Securities Exchange Act of 1934, as amended. In addition, our management may from
time to time make oral forward-looking statements. All statements, other than statements of historical facts, are forward-looking statements. Forward-looking
statements may be identified by the words “believe,” “expect,” “anticipate,” “project,” “might,” “plan,” “estimate,” “may,” “will,” “could,” “should,” “seek” or
“intend” and similar expressions. Forward-looking statements reflect our current expectations and assumptions regarding our business, the economy and
other future events and conditions and are based on currently available financial, economic and competitive data and our current business plans. Actual
results could vary materially depending on risks and uncertainties that may affect our operations, markets, services, prices and other factors as discussed in
the Risk Factors section of our filings with the Securities and Exchange Commission (the “SEC”). While we believe our assumptions are reasonable, we
caution you against relying on any forward-looking statements as it is very difficult to predict the impact of known factors, and it is impossible for us to
anticipate all factors that could affect our actual results. Important factors that could cause actual results to differ materially from those in the forward-looking
statements include, but are not limited to, a weakening of global economic and financial conditions, interruptions in the supply of or increased cost of raw
materials, the loss of, or difficulties with the further realization of, cost savings in connection with our strategic initiatives, the impact of our indebtedness, our
failure to comply with financial covenants under our credit facilities or other debt, pricing actions by our competitors that could affect our operating margins,
changes in governmental regulations and related compliance and litigation costs and the other factors listed in the Risk Factors section of our SEC filings. For
a more detailed discussion of these and other risk factors, see the Risk Factors section of our most recent filings made with the SEC. All forward-looking
statements are expressly qualified in their entirety by this cautionary notice. The forward-looking statements made by us speak only as of the date on which
they are made. Factors or events that could cause our actual results to differ may emerge from time to time. We undertake no obligation to publicly update or
revise any forward-looking statement as a result of new information, future events or otherwise, except as otherwise required by law.
This presentation contains non-GAAP financial information. Reconciliation to GAAP is included at the end of the presentation.
3
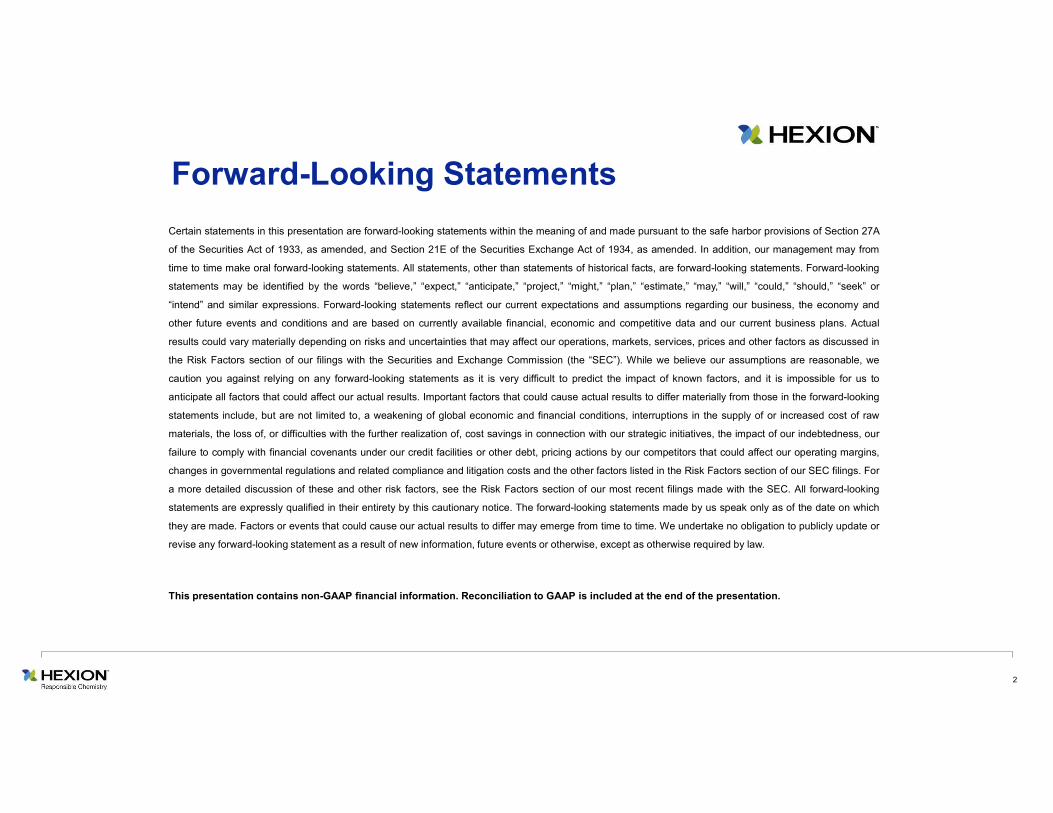
United States, 46%
Europe, 21%
Asia, 17%
Canada, 11%
South America, 5%Wind Energy, 17%
General Construction, 13%
New Home Construction, 12%
Repair / Remodel, 8%Furniture, 8%Energy, 5%
Industrial / Marine, 4%
Automotive, 4%
Agriculture, 4%
Other, 25%Adhesives 47%Coatings & Composites 53%
Global Producer of Adhesives, Coatings, and Composites Materials
Sales by Segment
$2,510MM
Sales by End-Market Sales by Geography
Leading positions in attractive end-markets
Strategically aligned with end-market growth and mega-trends
Strong and stable free cash flow
Specialty portfolio aligned with customers and sustainability trends
Integrated value chain provides competitive advantage
Experienced management team with impressive track record
$2,510MM $2,510MM
Business Highlights
FY’20; Continuing Operations
Scale and Financial Metrics (LTM 6/30/21)
Sales from Continuing Operations ($MM) 2,893
Segment EBITDA(1) from Continuing Operations ($MM) 439
% Margin 15.2%
Free Cash Flow (2) from Continuing Operations ($MM) 331
% of Sales 11.4%
Employees (FY’20) ~2,600
Production / Manufacturing Facilities (FY’20) 34
Countries Where Products are Marketed (FY’20) ~85
Number of Customers (FY’20) 2,900+
(1) Segment EBITDA defined as EBITDA adjusted for certain non-cash items and other unusual income and expenses(2) Free Cash Flow defined as Segment EBITDA from Continuing Operations – Capex from Continuing Operations
1
2
3
4
5
6
Over 80% of Sales Being Products Having the #1 or #2 Global Positions
FY’20; Continuing OperationsFY’20; Continuing Operations
4
Recovery in Action
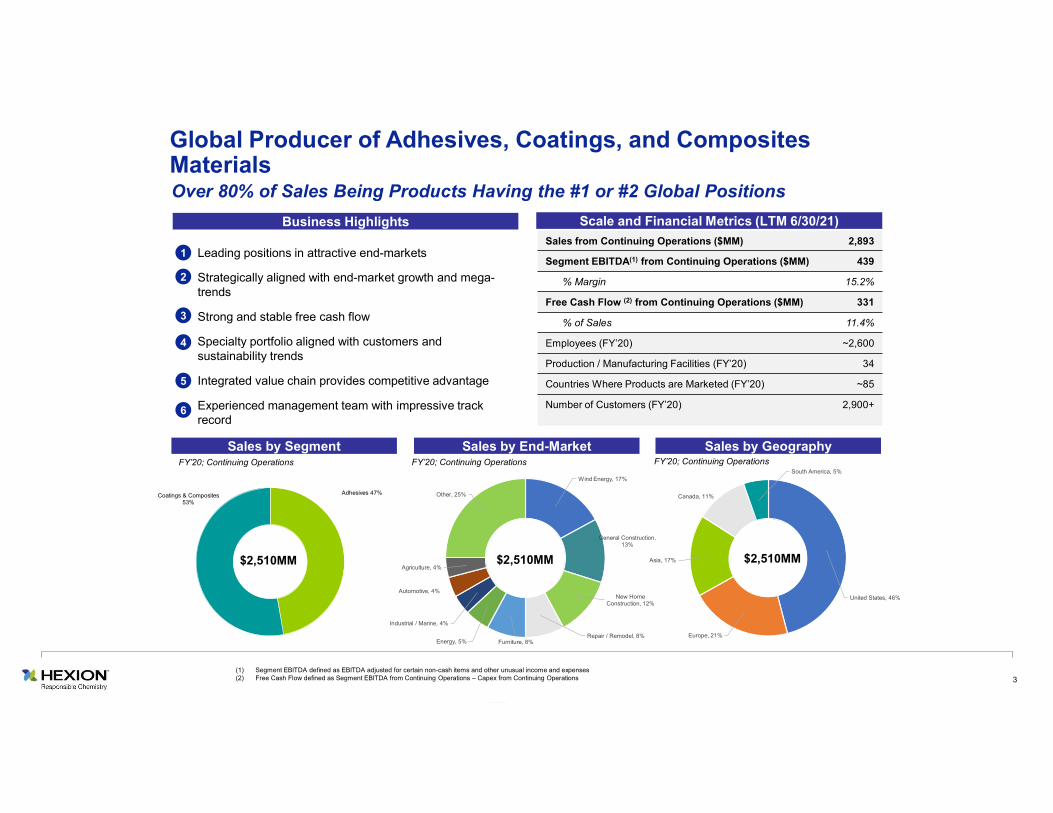
Strong Q2’21 results: Segment EBITDA from Cont. Ops. increased 186% compared to Q2’20 and sequentially by 40% versus Q1’21
(1) Periods reflect the treatment of the recent divestiture of the Phenolic Specialty Resin, Hexamine and European-based Forest Products Resins businesses as discontinued operations. (2) Free Cash Flow defined as Segment EBITDA – Capex; FCF Conversion defined as (EBITDA – Capex) / EBITDA
Benefits of geographic, customer, and product diversity in the portfolio at play:
Not overly dependent on any particular end market or geographic region
Largest customer represented ~ 3% of sales in FY’20
Lean Cost Structure
Successfully implemented two significant cost reduction initiatives since Q4 ’17 and lean cost operations supports increased margins
Strong Cash Flow Generation
FY’20 Free Cash Flow from Continuing Operations of $186 million
Expecting to generate significant Free Cash Flowin FY’21
Strong Liquidity Position of $646MM:
$286MM of unrestricted cash and cash equivalents
5373
56
9174
114
160
8.4%
10.6% 10.5%
14.4%
11.3%
15.1%
18.8%
0
20
40
60
80
100
120
140
160
180
200
0.0%
2.0%
4.0%
6.0%
8.0%
10.0%
12.0%
14.0%
16.0%
18.0%
20.0%
Q4'19 Q1'20 Q2'20 Q3'20 Q4'20 Q1'21 Q2'21
22
4631
6544
90
134
41.5%
63.0%55.4%
71.4%59.5%
78.9% 83.8%
-10
10
30
50
70
90
110
130
150
0
0.2
0.4
0.6
0.8
1
1.2
Q4'19 Q1'20 Q2'20 Q3'20 Q4'20 Q1'21 Q2'21
Segment EBITDA from Continuing Operations and Margin (1) Portfolio With Structural Resilience
Free Cash Flow from Continuing Operations and Conversion (2)
Strong Earnings Performance Structurally Resilient Portfolio and Positive Earnings Momentum in FY’21
($MM)
($MM)
5
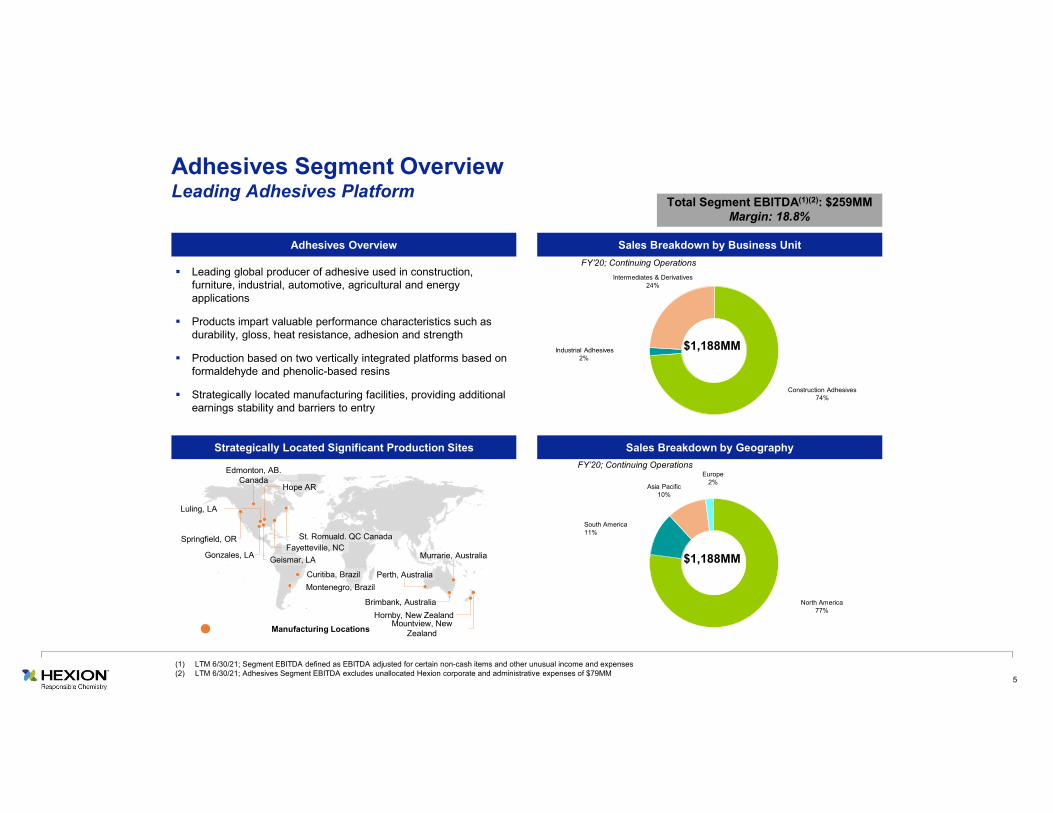
Intermediates & Derivatives24%
Construction Adhesives74%
Industrial Adhesives2%
Adhesives Overview Sales Breakdown by Business Unit
Sales Breakdown by Geography
Leading global producer of adhesive used in construction, furniture, industrial, automotive, agricultural and energy applications
Products impart valuable performance characteristics such as durability, gloss, heat resistance, adhesion and strength
Production based on two vertically integrated platforms based on formaldehyde and phenolic-based resins
Strategically located manufacturing facilities, providing additional earnings stability and barriers to entry
$1,188MM
$1,188MM
Total Segment EBITDA(1)(2): $259MMMargin: 18.8%
Strategically Located Significant Production Sites
Manufacturing Locations
Curitiba, Brazil
Montenegro, Brazil
Edmonton, AB. Canada
Fayetteville, NC
Geismar, LA
Luling, LA
Gonzales, LA
Hope AR
Springfield, OR St. Romuald. QC Canada
Adhesives Segment OverviewLeading Adhesives Platform
(1) LTM 6/30/21; Segment EBITDA defined as EBITDA adjusted for certain non-cash items and other unusual income and expenses(2) LTM 6/30/21; Adhesives Segment EBITDA excludes unallocated Hexion corporate and administrative expenses of $79MM
Murrarie, Australia
Brimbank, Australia
Hornby, New ZealandMountview, New
Zealand
Perth, Australia
FY’20; Continuing Operations
FY’20; Continuing Operations
Asia Pacific10%
North America77%
South America 11%
Europe2%

6
Innovative New Product TrialsPositive Demand in Americas Strategic Capacity Expansions
Adhesives Segment: Multiple Growth Strategies
• Strong new residential construction and remodeling demand in N. Americacontinues to drive positive results for forest products resins
• Long-term growth from increasing uses of cross laminated timber (CLT) in commercial building applications
• Improving demand in Brazil in 1H’21
− Restarted full operations at Montenegro, Brazil site in Q1’21
Hexion announced additional expansion of its Portland site to support the growing demand for ArmorBuilt™ fire resistant wrap, a new product which greatly improves fire protection when applied to a substrate
Progress continues on the Company’s expansion of its Brimbank, Australia site to develop fire-resistant cladding materials leveraging proprietary phenolic resin technology
Extensive conversions underway at several major customers in 2020 for next generation OSB PF technology for board surface applications
Additional “core” applications slated for 2021 as productivity gains (speed) and further reduction in resin usage positions product favorably compared to pMDI
7
0%
20%
40%
60%
80%
100%
0
500
1,000
1,500
2,000
2,500
2000 2002 2004 2006 2008 2010 2012 2014 2016 2018 2020 2022 2024
US
Ho
usi
ng
Sta
rts
(00
0s)
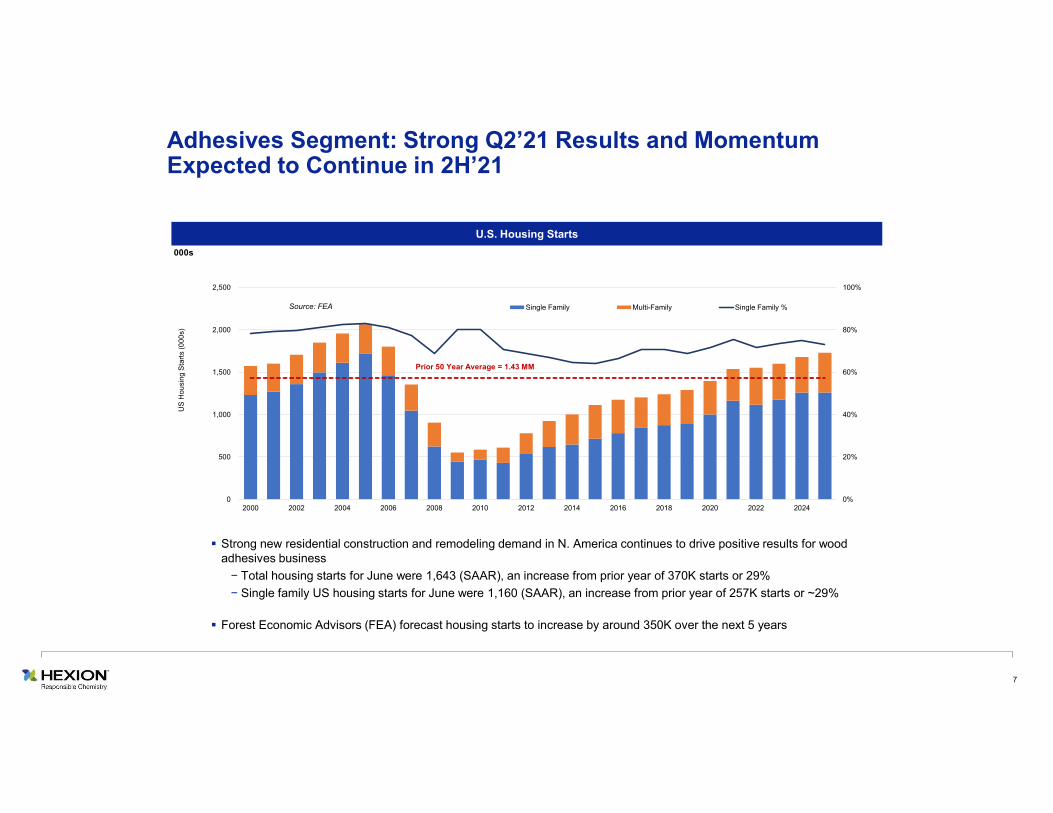
Single Family Multi-Family Single Family %
Prior 50 Year Average = 1.43 MM
000s
Source: FEA
Adhesives Segment: Strong Q2’21 Results and Momentum Expected to Continue in 2H’21
Strong new residential construction and remodeling demand in N. America continues to drive positive results for wood adhesives business
− Total housing starts for June were 1,643 (SAAR), an increase from prior year of 370K starts or 29%
− Single family US housing starts for June were 1,160 (SAAR), an increase from prior year of 257K starts or ~29%
Forest Economic Advisors (FEA) forecast housing starts to increase by around 350K over the next 5 years
U.S. Housing Starts
8
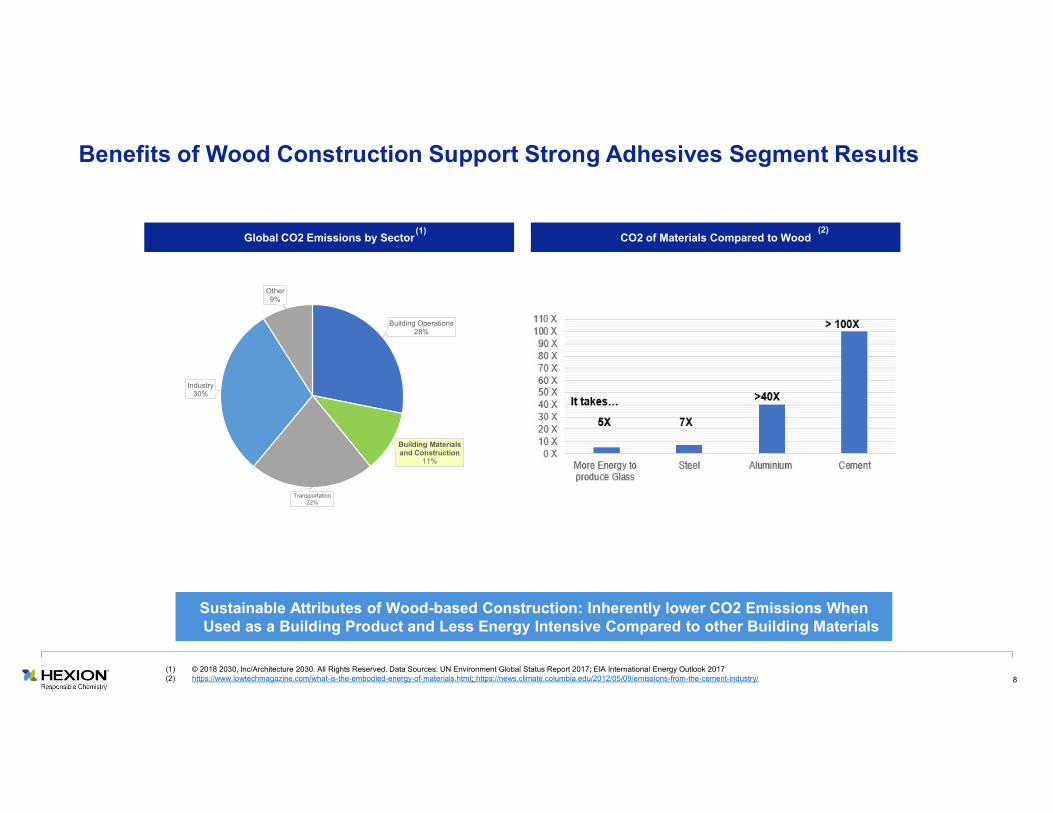
Building Operations28%
Building Materials and Construction
11%
Transportation22%
Industry30%
Other9%
Benefits of Wood Construction Support Strong Adhesives Segment Results
Global CO2 Emissions by Sector CO2 of Materials Compared to Wood
Sustainable Attributes of Wood-based Construction: Inherently lower CO2 Emissions When Used as a Building Product and Less Energy Intensive Compared to other Building Materials
(1)
(1) © 2018 2030, Inc/Architecture 2030. All Rights Reserved. Data Sources: UN Environment Global Status Report 2017; EIA International Energy Outlook 2017(2) https://www.lowtechmagazine.com/what-is-the-embodied-energy-of-materials.html; https://news.climate.columbia.edu/2012/05/09/emissions-from-the-cement-industry/
(2)
9
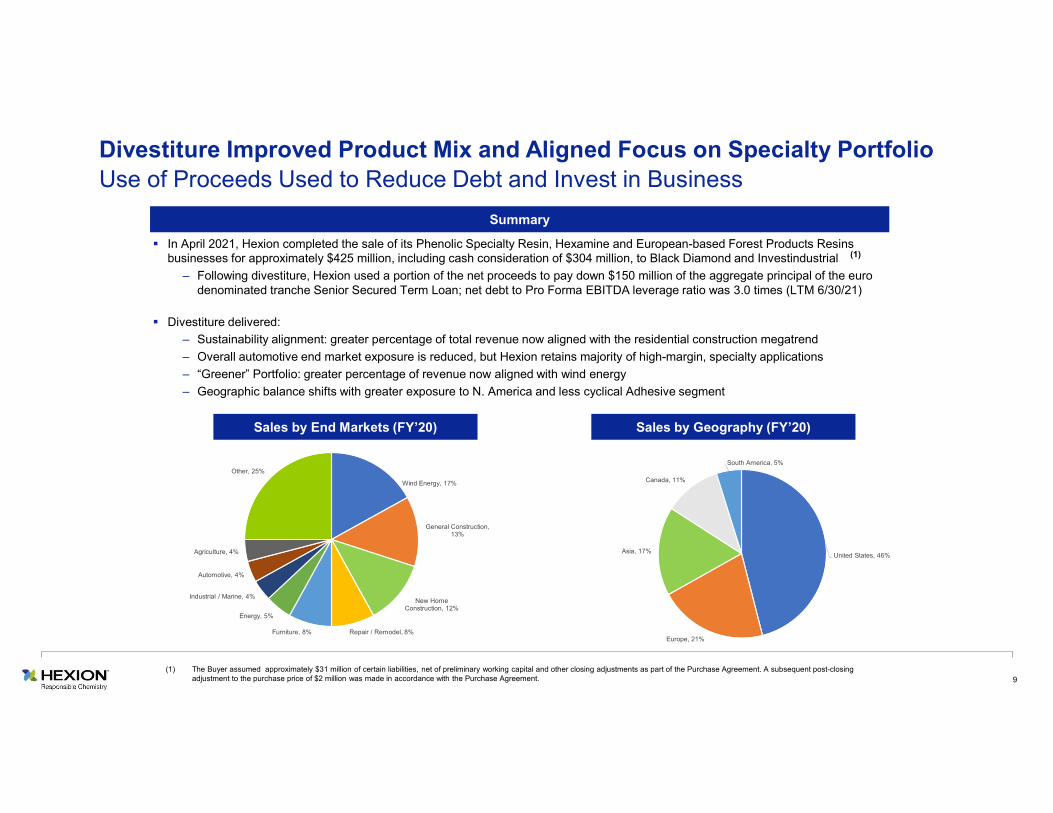
In April 2021, Hexion completed the sale of its Phenolic Specialty Resin, Hexamine and European-based Forest Products Resins businesses for approximately $425 million, including cash consideration of $304 million, to Black Diamond and Investindustrial
– Following divestiture, Hexion used a portion of the net proceeds to pay down $150 million of the aggregate principal of the eurodenominated tranche Senior Secured Term Loan; net debt to Pro Forma EBITDA leverage ratio was 3.0 times (LTM 6/30/21)
Divestiture delivered:
– Sustainability alignment: greater percentage of total revenue now aligned with the residential construction megatrend
– Overall automotive end market exposure is reduced, but Hexion retains majority of high-margin, specialty applications
– “Greener” Portfolio: greater percentage of revenue now aligned with wind energy
– Geographic balance shifts with greater exposure to N. America and less cyclical Adhesive segment
Divestiture Improved Product Mix and Aligned Focus on Specialty Portfolio Use of Proceeds Used to Reduce Debt and Invest in Business
Sales by End Markets (FY’20) Sales by Geography (FY’20)
Summary
Wind Energy, 17%
General Construction, 13%
New Home Construction, 12%
Repair / Remodel, 8%Furniture, 8%
Energy, 5%
Industrial / Marine, 4%
Automotive, 4%
Agriculture, 4%
Other, 25%
United States, 46%
Europe, 21%
Asia, 17%
Canada, 11%
South America, 5%
(1) The Buyer assumed approximately $31 million of certain liabilities, net of preliminary working capital and other closing adjustments as part of the Purchase Agreement. A subsequent post-closing adjustment to the purchase price of $2 million was made in accordance with the Purchase Agreement.
(1)
10
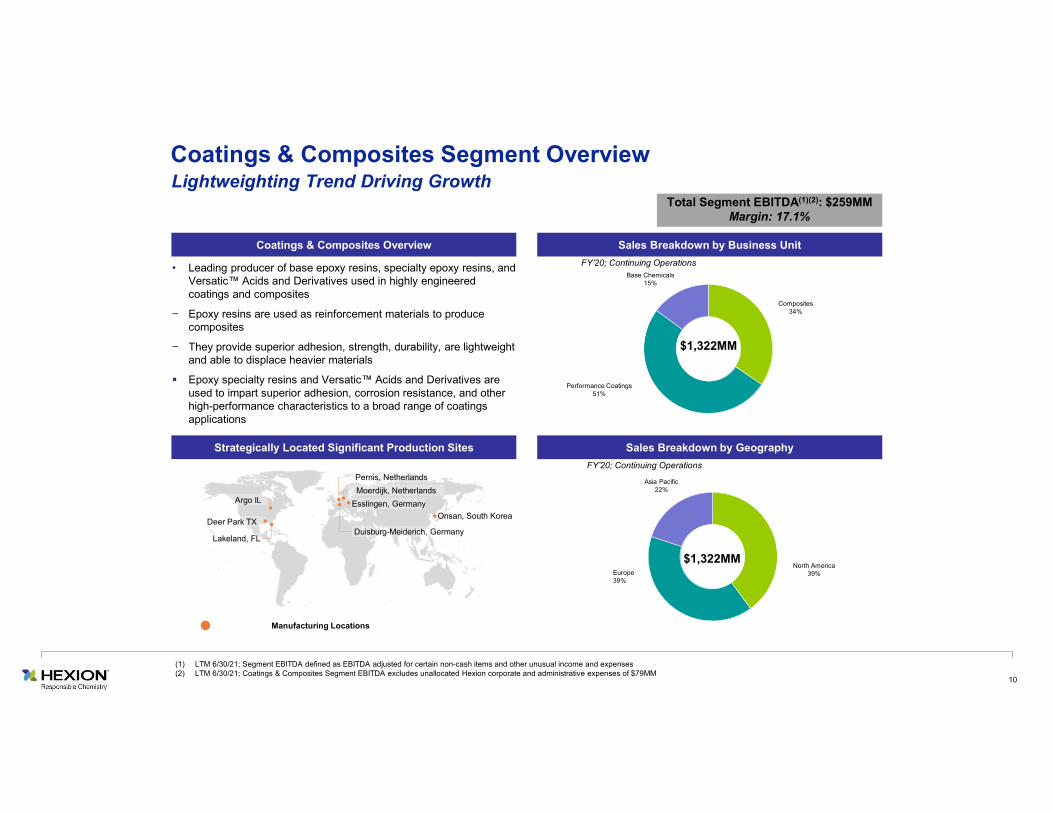
Coatings & Composites Overview
Base Chemicals15%
Performance Coatings51%
Composites34%
Sales Breakdown by Business Unit
Sales Breakdown by Geography
$1,322MM
Asia Pacific22%
North America39%Europe
39%
$1,322MM
Strategically Located Significant Production Sites
Argo IL
Deer Park TX Duisburg-Meiderich, Germany
Lakeland, FL
Moerdijk, Netherlands
Onsan, South Korea
Pernis, Netherlands
Manufacturing Locations
Coatings & Composites Segment OverviewLightweighting Trend Driving Growth
Total Segment EBITDA(1)(2): $259MMMargin: 17.1%
(1) LTM 6/30/21; Segment EBITDA defined as EBITDA adjusted for certain non-cash items and other unusual income and expenses(2) LTM 6/30/21; Coatings & Composites Segment EBITDA excludes unallocated Hexion corporate and administrative expenses of $79MM
• Leading producer of base epoxy resins, specialty epoxy resins, and Versatic™ Acids and Derivatives used in highly engineered coatings and composites
− Epoxy resins are used as reinforcement materials to produce composites
− They provide superior adhesion, strength, durability, are lightweight and able to displace heavier materials
Epoxy specialty resins and Versatic™ Acids and Derivatives are used to impart superior adhesion, corrosion resistance, and other high-performance characteristics to a broad range of coatings applications
Esslingen, Germany
FY’20; Continuing Operations
FY’20; Continuing Operations
11
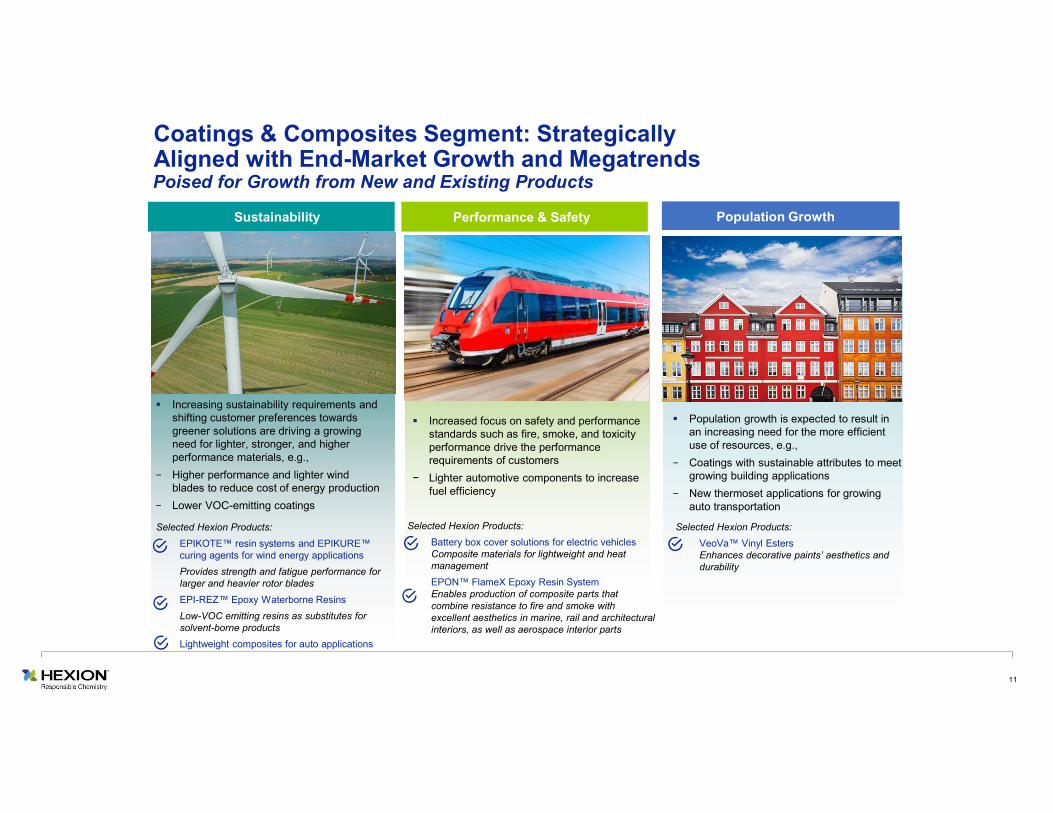
Population growth is expected to result in an increasing need for the more efficient use of resources, e.g.,
− Coatings with sustainable attributes to meet growing building applications
− New thermoset applications for growing auto transportation
Population Growth
Selected Hexion Products:
VeoVa™ Vinyl Esters Enhances decorative paints’ aesthetics and durability
Increasing sustainability requirements and shifting customer preferences towards greener solutions are driving a growing need for lighter, stronger, and higher performance materials, e.g.,
− Higher performance and lighter wind blades to reduce cost of energy production
− Lower VOC-emitting coatings
Sustainability
Increased focus on safety and performance standards such as fire, smoke, and toxicity performance drive the performance requirements of customers
− Lighter automotive components to increase fuel efficiency
Selected Hexion Products:
Battery box cover solutions for electric vehicles Composite materials for lightweight and heat management
EPON™ FlameX Epoxy Resin System Enables production of composite parts that combine resistance to fire and smoke with excellent aesthetics in marine, rail and architectural interiors, as well as aerospace interior parts
Performance & Safety
Poised for Growth from New and Existing Products
Coatings & Composites Segment: Strategically Aligned with End-Market Growth and Megatrends
Selected Hexion Products:
EPIKOTE™ resin systems and EPIKURE™ curing agents for wind energy applications
Provides strength and fatigue performance for larger and heavier rotor blades
EPI-REZ™ Epoxy Waterborne Resins
Low-VOC emitting resins as substitutes for solvent-borne products
Lightweight composites for auto applications
12
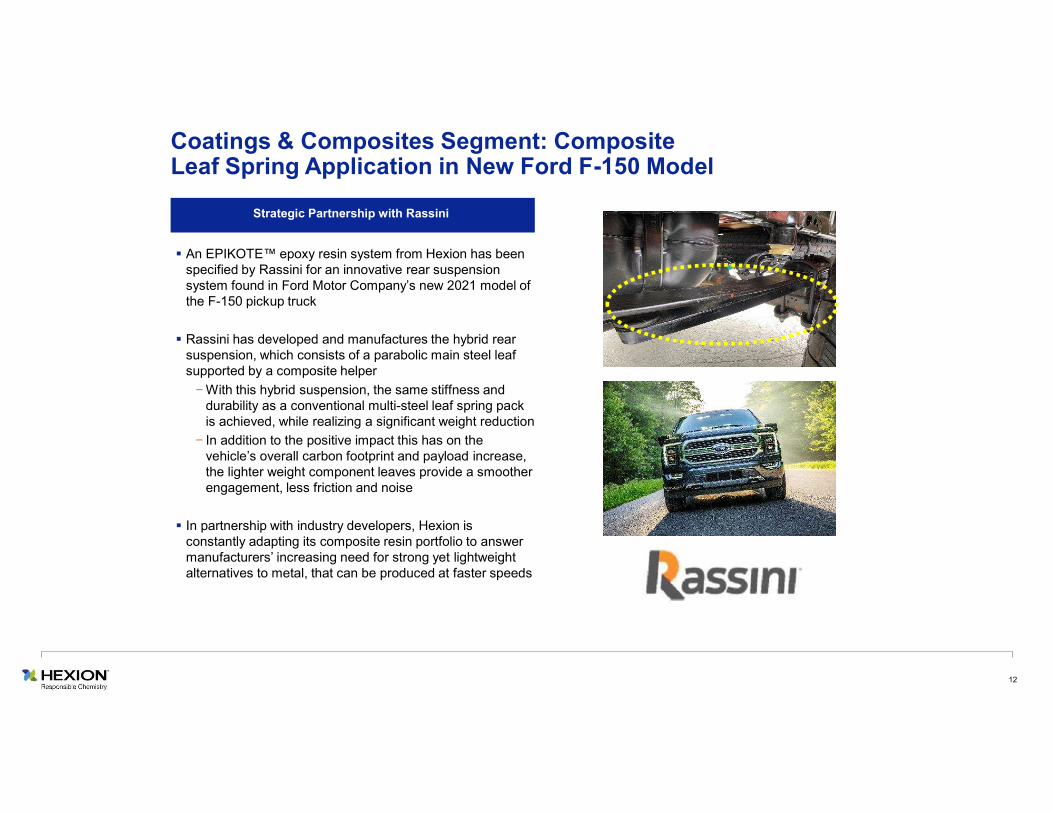
Coatings & Composites Segment: Composite Leaf Spring Application in New Ford F-150 Model
Strategic Partnership with Rassini
An EPIKOTE™ epoxy resin system from Hexion has been specified by Rassini for an innovative rear suspension system found in Ford Motor Company’s new 2021 model of the F-150 pickup truck
Rassini has developed and manufactures the hybrid rear suspension, which consists of a parabolic main steel leaf supported by a composite helper
− With this hybrid suspension, the same stiffness and durability as a conventional multi-steel leaf spring pack is achieved, while realizing a significant weight reduction
− In addition to the positive impact this has on the vehicle’s overall carbon footprint and payload increase, the lighter weight component leaves provide a smoother engagement, less friction and noise
In partnership with industry developers, Hexion is constantly adapting its composite resin portfolio to answer manufacturers’ increasing need for strong yet lightweight alternatives to metal, that can be produced at faster speeds
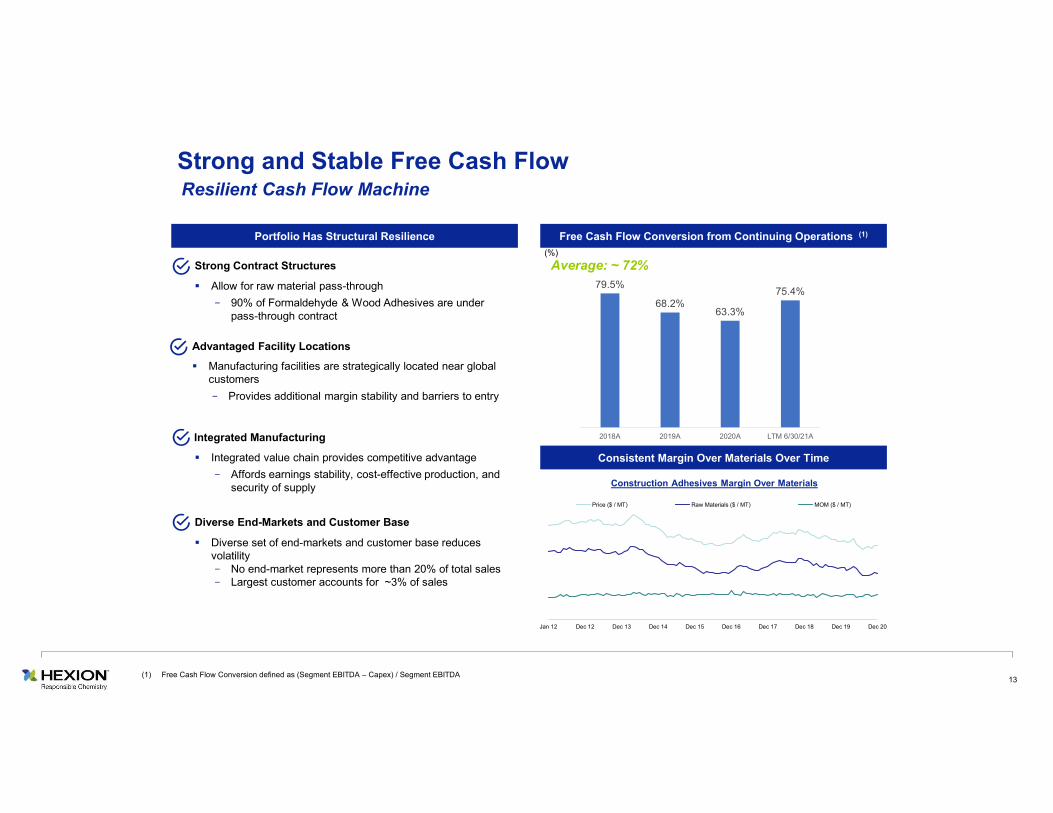
13(1) Free Cash Flow Conversion defined as (Segment EBITDA – Capex) / Segment EBITDA
Average: ~ 72%
Portfolio Has Structural Resilience Free Cash Flow Conversion from Continuing Operations (1)
Consistent Margin Over Materials Over Time
Allow for raw material pass-through
− 90% of Formaldehyde & Wood Adhesives are under pass-through contract
Strong Contract Structures
Manufacturing facilities are strategically located near global customers
− Provides additional margin stability and barriers to entry
Advantaged Facility Locations
Integrated value chain provides competitive advantage
− Affords earnings stability, cost-effective production, and security of supply
Integrated Manufacturing
Diverse set of end-markets and customer base reduces volatility− No end-market represents more than 20% of total sales− Largest customer accounts for ~3% of sales
Diverse End-Markets and Customer Base
(%)
Strong and Stable Free Cash FlowResilient Cash Flow Machine
Construction Adhesives Margin Over Materials
79.5%
68.2%63.3%
75.4%
2018A 2019A 2020A LTM 6/30/21A
Jan 12 Dec 12 Dec 13 Dec 14 Dec 15 Dec 16 Dec 17 Dec 18 Dec 19 Dec 20
Price ($ / MT) Raw Materials ($ / MT) MOM ($ / MT)
14
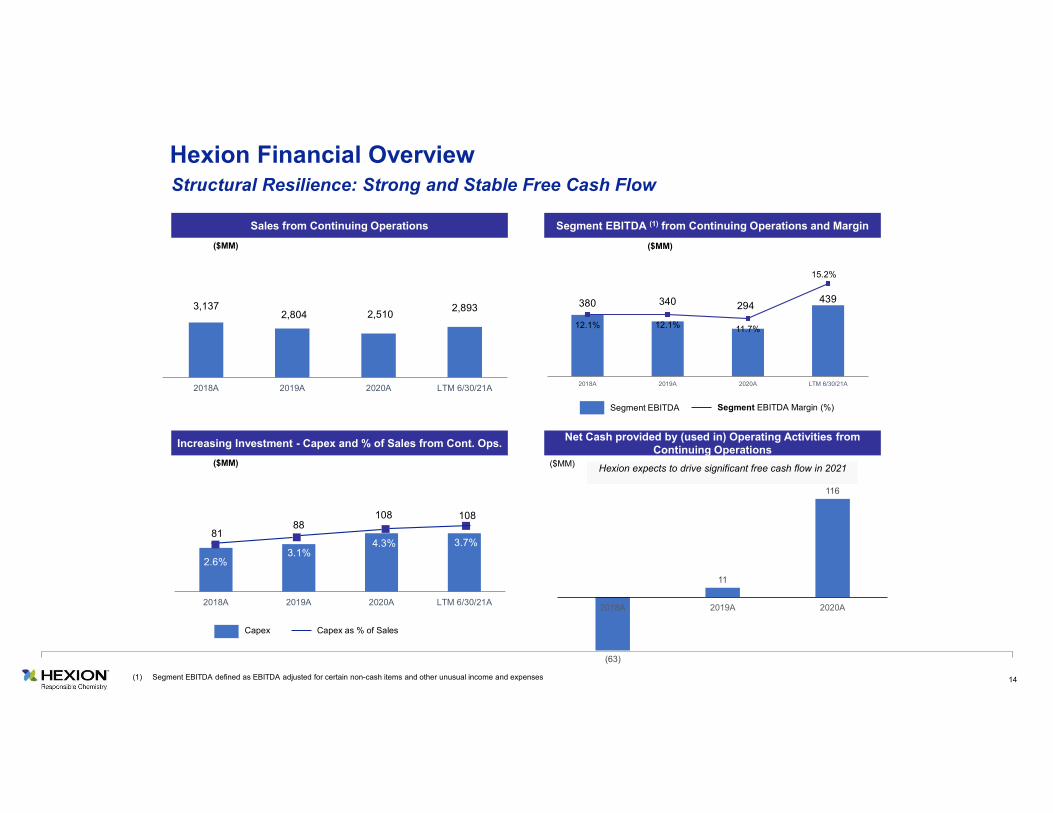
3,137 2,804 2,510
2,893
2018A 2019A 2020A LTM 6/30/21A
380 340 294 439
12.1% 12.1% 11.7%
15.2%
2018A 2019A 2020A LTM 6/30/21A
Increasing Investment - Capex and % of Sales from Cont. Ops.Net Cash provided by (used in) Operating Activities from
Continuing Operations
Sales from Continuing Operations Segment EBITDA (1) from Continuing Operations and Margin
81 88
108 108
2018A 2019A 2020A LTM 6/30/21A
($MM) ($MM)
($MM)($MM)
(1) Segment EBITDA defined as EBITDA adjusted for certain non-cash items and other unusual income and expenses
Capex Capex as % of Sales
Segment EBITDA Segment EBITDA Margin (%)
Hexion Financial OverviewStructural Resilience: Strong and Stable Free Cash Flow
(63)
11
116
2018A 2019A 2020A
Hexion expects to drive significant free cash flow in 2021
2.6%3.1%
4.3% 3.7%
15
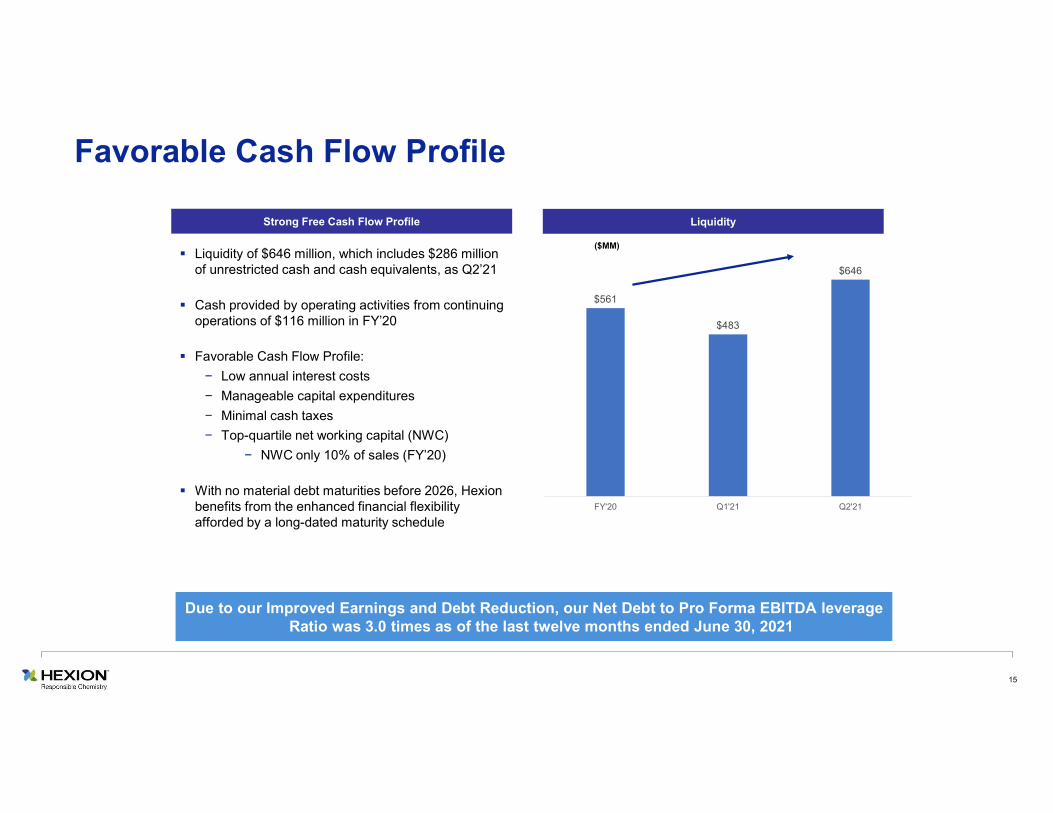
Favorable Cash Flow Profile
Strong Free Cash Flow Profile Liquidity
($MM) Liquidity of $646 million, which includes $286 million
of unrestricted cash and cash equivalents, as Q2’21
Cash provided by operating activities from continuing operations of $116 million in FY’20
Favorable Cash Flow Profile:
− Low annual interest costs
− Manageable capital expenditures
− Minimal cash taxes
− Top-quartile net working capital (NWC)
− NWC only 10% of sales (FY’20)
With no material debt maturities before 2026, Hexion benefits from the enhanced financial flexibility afforded by a long-dated maturity schedule
$561
$483
$646
FY'20 Q1'21 Q2'21
Due to our Improved Earnings and Debt Reduction, our Net Debt to Pro Forma EBITDA leverage Ratio was 3.0 times as of the last twelve months ended June 30, 2021
16
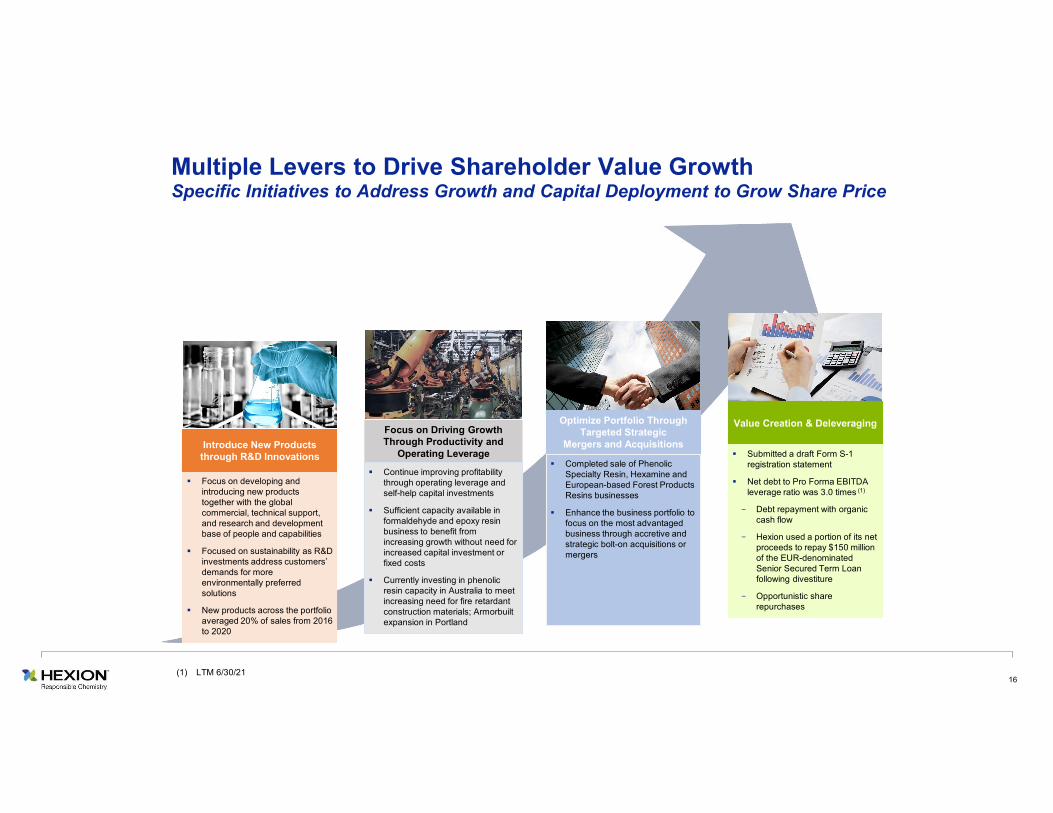
Multiple Levers to Drive Shareholder Value Growth
Focus on developing and introducing new products together with the global commercial, technical support, and research and development base of people and capabilities
Focused on sustainability as R&D investments address customers’ demands for more environmentally preferred solutions
New products across the portfolio averaged 20% of sales from 2016 to 2020
Introduce New Products through R&D Innovations
Focus on Driving Growth Through Productivity and
Operating Leverage
Continue improving profitability through operating leverage and self-help capital investments
Sufficient capacity available in formaldehyde and epoxy resin business to benefit from increasing growth without need for increased capital investment or fixed costs
Currently investing in phenolic resin capacity in Australia to meet increasing need for fire retardant construction materials; Armorbuiltexpansion in Portland
Optimize Portfolio Through Targeted Strategic
Mergers and Acquisitions
Completed sale of Phenolic Specialty Resin, Hexamine and European-based Forest Products Resins businesses
Enhance the business portfolio to focus on the most advantaged business through accretive and strategic bolt-on acquisitions or mergers
Value Creation & Deleveraging
Submitted a draft Form S-1 registration statement
Net debt to Pro Forma EBITDA leverage ratio was 3.0 times (1)
− Debt repayment with organic cash flow
− Hexion used a portion of its net proceeds to repay $150 million of the EUR-denominated Senior Secured Term Loan following divestiture
− Opportunistic share repurchases
Specific Initiatives to Address Growth and Capital Deployment to Grow Share Price
(1) LTM 6/30/21
17
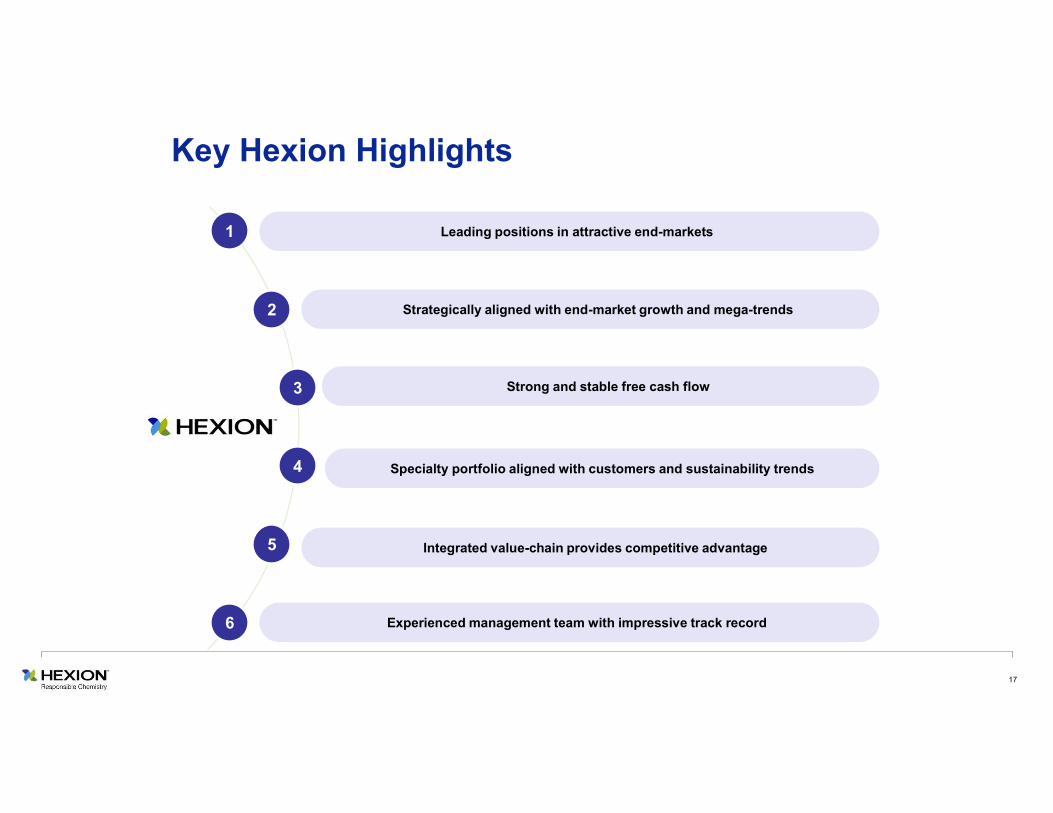
Experienced management team with impressive track record
Leading positions in attractive end-markets
Key Hexion Highlights
4
2
5
3
1
6
Strategically aligned with end-market growth and mega-trends
Strong and stable free cash flow
Integrated value-chain provides competitive advantage
Specialty portfolio aligned with customers and sustainability trends

18
Q&A
Appendix

19
On August 2, 2021, Hexion Holdings Corporation (“Hexion Holdings”), the indirect parent of Hexion Inc., announced it had submitted a draft Form S-1 registration statement on a confidential basis to the U.S. Securities and Exchange Commission for a proposed public offering of its common stock later this year
Revenue from continuing operations totaled $848 million, an increase of 59% year over year
Net income totaled $38 million for the three months ended June 30, 2021 compared to net loss of $42 million in the prior year period
Second quarter 2021 Segment EBITDA (1) from continuing operations of $160 million, increasing 186% year-over-year, and improving 40% sequentially compared to Q1’21
Results reflect strength throughout the portfolio, as well as impact of COVID-19 on prior year period
Q2’21 EBITDA margins approached 19% and increased 830 basis points YoY
Following completion of its recent divestiture, Hexion used $150 million of the net proceeds to pay down the aggregate principalof the EUR-denominated tranche Senior Secured Term Loan; net debt to Pro Forma EBITDA leverage ratio was 3.0 times (LTM 6/30/21)
2020 2021 YoY ∆
Total Revenue from Continuing Operations
$ 535 $ 852 59%
Net Income (Loss) (42) 38 nm
Segment EBITDA (1) 56 160 186%
Segment EBITDA Margin 10.5% 18.8% 830bps
Overview of Second Quarter 2021 Results
(1) Segment EBITDA is a non-GAAP financial measure. The closest GAAP financial measure is Net Loss A table that reconciles Segment EBITDA is at the end of this presentation. Segment EBITDA is defined as EBITDA (earnings before interest, income taxes, depreciation and amortization) adjusted for certain non-cash and other income and expenses. Segment EBITDA is the primary performance measure used by the Company's senior management, the chief operating decision-maker and the board of directors to evaluate operating results and allocate capital resources among segments. Segment EBITDA is defined and reconciled to Net Loss later in this presentation.
(2) In addition, the Buyer assumed approximately $31 million of certain liabilities, net of preliminary working capital and other closing adjustments as part of the Purchase Agreement. A subsequent post-closing adjustment to the initial cash considerations will be made in accordance with the Purchase Agreement.
($ in millions)
Continuing to Drive Year-on-Year Earnings Growth and Well-Positioned for Strong Q3’21
Three Months Ended June 30 (Continuing Operations)
20
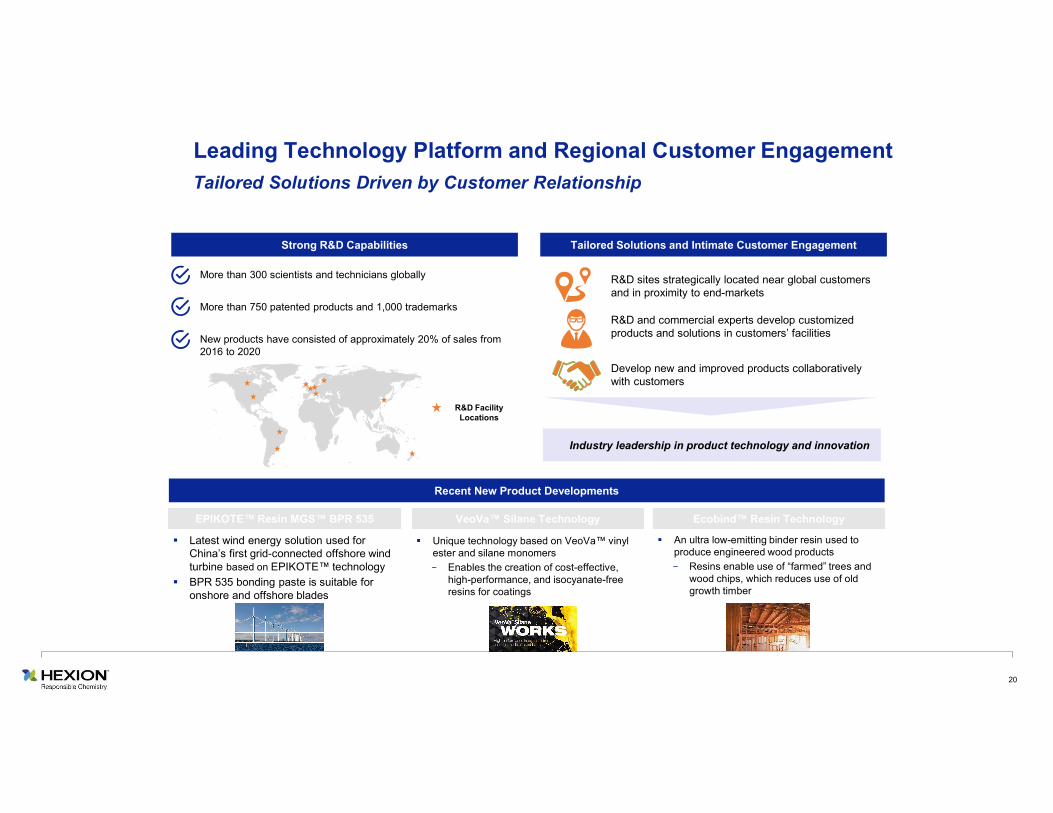
An ultra low-emitting binder resin used to produce engineered wood products
− Resins enable use of “farmed” trees and wood chips, which reduces use of old growth timber
Recent New Product Developments
Strong R&D Capabilities
More than 300 scientists and technicians globally
More than 750 patented products and 1,000 trademarks
New products have consisted of approximately 20% of sales from 2016 to 2020
Tailored Solutions and Intimate Customer Engagement
Ecobind™ Resin TechnologyVeoVa™ Silane Technology
Unique technology based on VeoVa™ vinyl ester and silane monomers
− Enables the creation of cost-effective, high-performance, and isocyanate-free resins for coatings
EPIKOTE™ Resin MGS™ BPR 535
Latest wind energy solution used for China’s first grid-connected offshore wind turbine based on EPIKOTE™ technology
BPR 535 bonding paste is suitable for onshore and offshore blades
Develop new and improved products collaboratively with customers
R&D and commercial experts develop customized products and solutions in customers’ facilities
Leading Technology Platform and Regional Customer Engagement
Tailored Solutions Driven by Customer Relationship
Industry leadership in product technology and innovation
R&D sites strategically located near global customers and in proximity to end-markets
R&D FacilityLocations
21
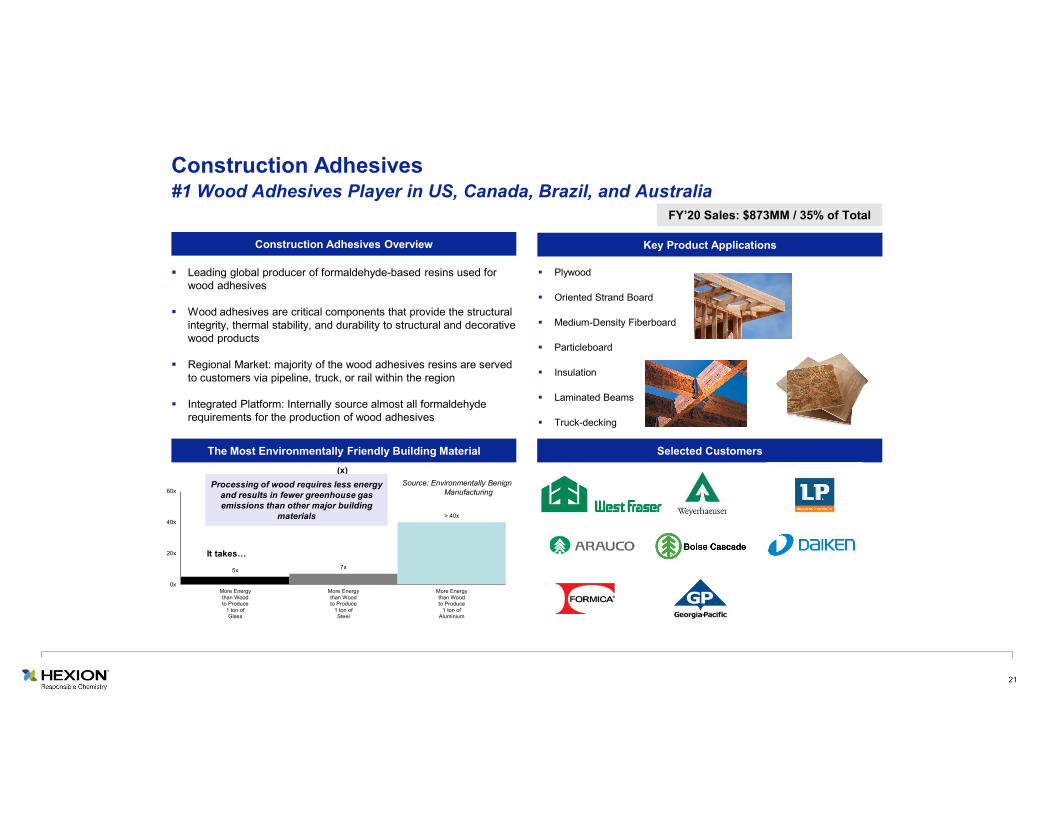
Leading global producer of formaldehyde-based resins used for wood adhesives
Wood adhesives are critical components that provide the structural integrity, thermal stability, and durability to structural and decorative wood products
Regional Market: majority of the wood adhesives resins are served to customers via pipeline, truck, or rail within the region
Integrated Platform: Internally source almost all formaldehyde requirements for the production of wood adhesives
Construction Adhesives Overview Key Product Applications
Plywood
Oriented Strand Board
Medium-Density Fiberboard
Particleboard
Insulation
Laminated Beams
Truck-decking
Selected CustomersThe Most Environmentally Friendly Building Material
FY’20 Sales: $873MM / 35% of Total
Construction Adhesives#1 Wood Adhesives Player in US, Canada, Brazil, and Australia
5x 7x
> 40x
0x
20x
40x
60x
More Energythan Woodto Produce
1 ton ofGlass
More Energythan Woodto Produce
1 ton ofSteel
More Energythan Woodto Produce
1 ton ofAluminium
(x)
It takes…
Processing of wood requires less energy and results in fewer greenhouse gas emissions than other major building
materials
Source: Environmentally Benign Manufacturing
22
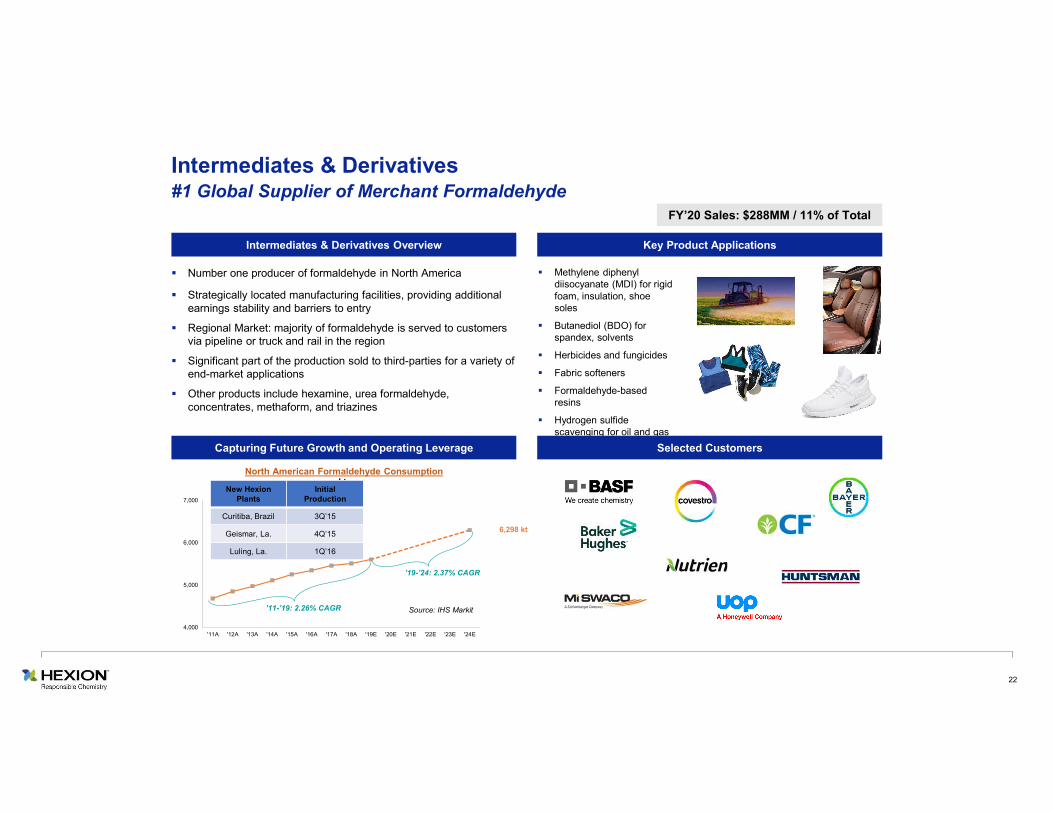
Number one producer of formaldehyde in North America
Strategically located manufacturing facilities, providing additional earnings stability and barriers to entry
Regional Market: majority of formaldehyde is served to customers via pipeline or truck and rail in the region
Significant part of the production sold to third-parties for a variety of end-market applications
Other products include hexamine, urea formaldehyde, concentrates, methaform, and triazines
Intermediates & Derivatives Overview
Methylene diphenyl diisocyanate (MDI) for rigid foam, insulation, shoe soles
Butanediol (BDO) for spandex, solvents
Herbicides and fungicides
Fabric softeners
Formaldehyde-based resins
Hydrogen sulfide scavenging for oil and gas
Key Product Applications
Selected CustomersCapturing Future Growth and Operating Leverage
FY’20 Sales: $288MM / 11% of Total
4,000
5,000
6,000
7,000
'11A '12A '13A '14A '15A '16A '17A '18A '19E '20E '21E '22E '23E '24E
Source: IHS Markit
kt
6,298 kt
New Hexion Plants
Initial Production
Curitiba, Brazil 3Q’15
Geismar, La. 4Q’15
Luling, La. 1Q’16
’19-’24: 2.37% CAGR
’11-’19: 2.26% CAGR
Intermediates & Derivatives#1 Global Supplier of Merchant Formaldehyde
North American Formaldehyde Consumption
23
Selected Customers
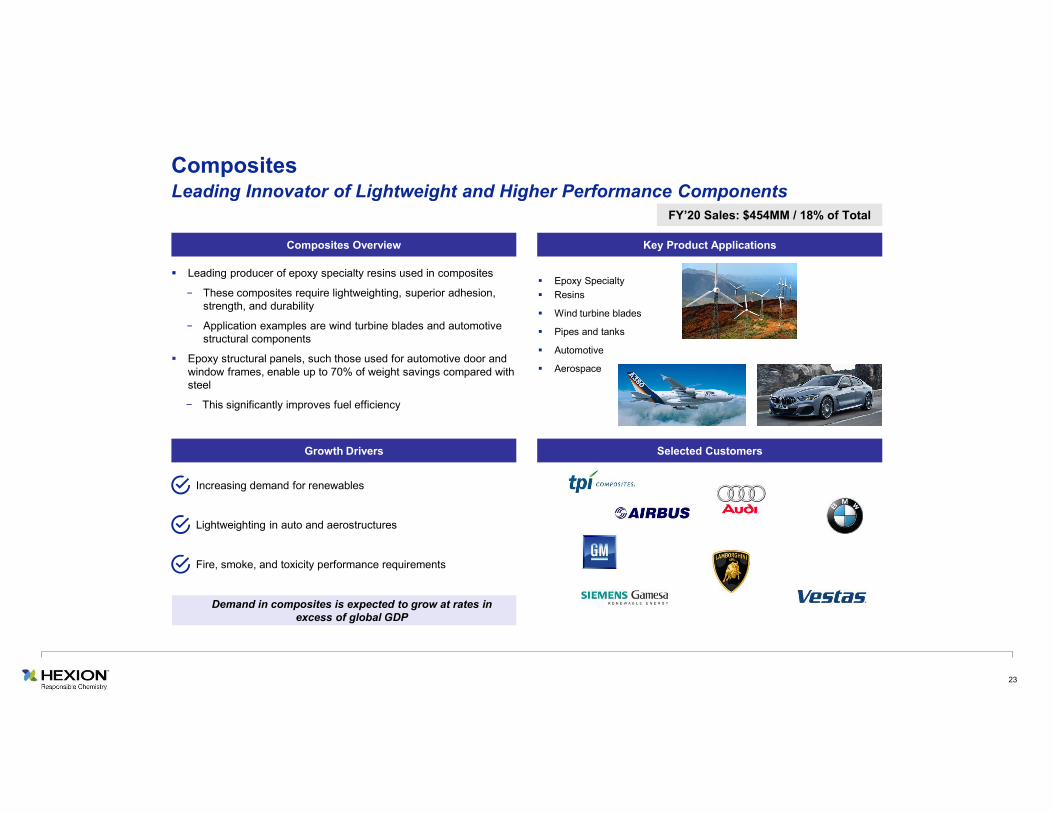
Leading producer of epoxy specialty resins used in composites
− These composites require lightweighting, superior adhesion, strength, and durability
− Application examples are wind turbine blades and automotive structural components
Epoxy structural panels, such those used for automotive door and window frames, enable up to 70% of weight savings compared with steel
− This significantly improves fuel efficiency
Composites Overview
Epoxy Specialty
Resins
Wind turbine blades
Pipes and tanks
Automotive
Aerospace
Key Product Applications
Growth Drivers
FY’20 Sales: $454MM / 18% of Total
CompositesLeading Innovator of Lightweight and Higher Performance Components
Increasing demand for renewables
Lightweighting in auto and aerostructures
Fire, smoke, and toxicity performance requirements
Demand in composites is expected to grow at rates in excess of global GDP
24
Selected Customers
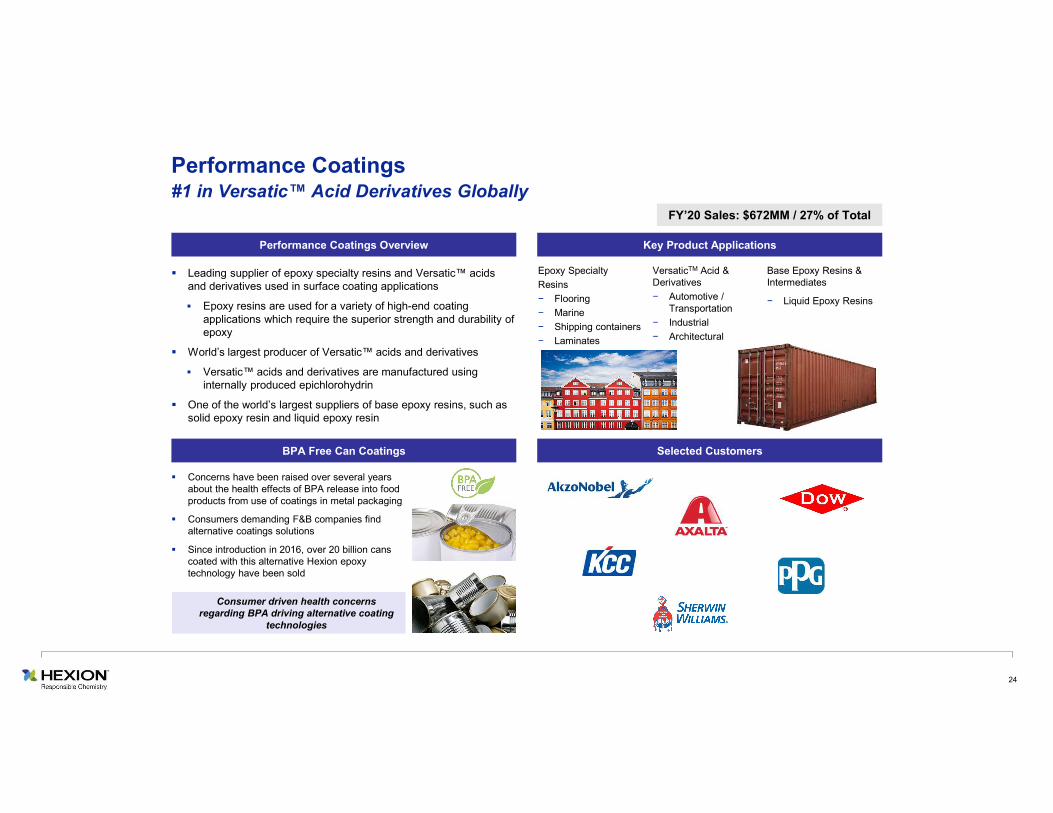
Performance Coatings Overview
Epoxy Specialty
Resins
− Flooring
− Marine
− Shipping containers
− Laminates
VersaticTM Acid & Derivatives
− Automotive / Transportation
− Industrial
− Architectural
Base Epoxy Resins & Intermediates
− Liquid Epoxy Resins
Leading supplier of epoxy specialty resins and Versatic™ acids and derivatives used in surface coating applications
Epoxy resins are used for a variety of high-end coating applications which require the superior strength and durability of epoxy
World’s largest producer of Versatic™ acids and derivatives
Versatic™ acids and derivatives are manufactured using internally produced epichlorohydrin
One of the world’s largest suppliers of base epoxy resins, such as solid epoxy resin and liquid epoxy resin
Key Product Applications
BPA Free Can Coatings
FY’20 Sales: $672MM / 27% of Total
Performance Coatings#1 in Versatic™ Acid Derivatives Globally
Concerns have been raised over several years about the health effects of BPA release into food products from use of coatings in metal packaging
Consumers demanding F&B companies find alternative coatings solutions
Since introduction in 2016, over 20 billion cans coated with this alternative Hexion epoxy technology have been sold
Consumer driven health concerns regarding BPA driving alternative coating
technologies
25
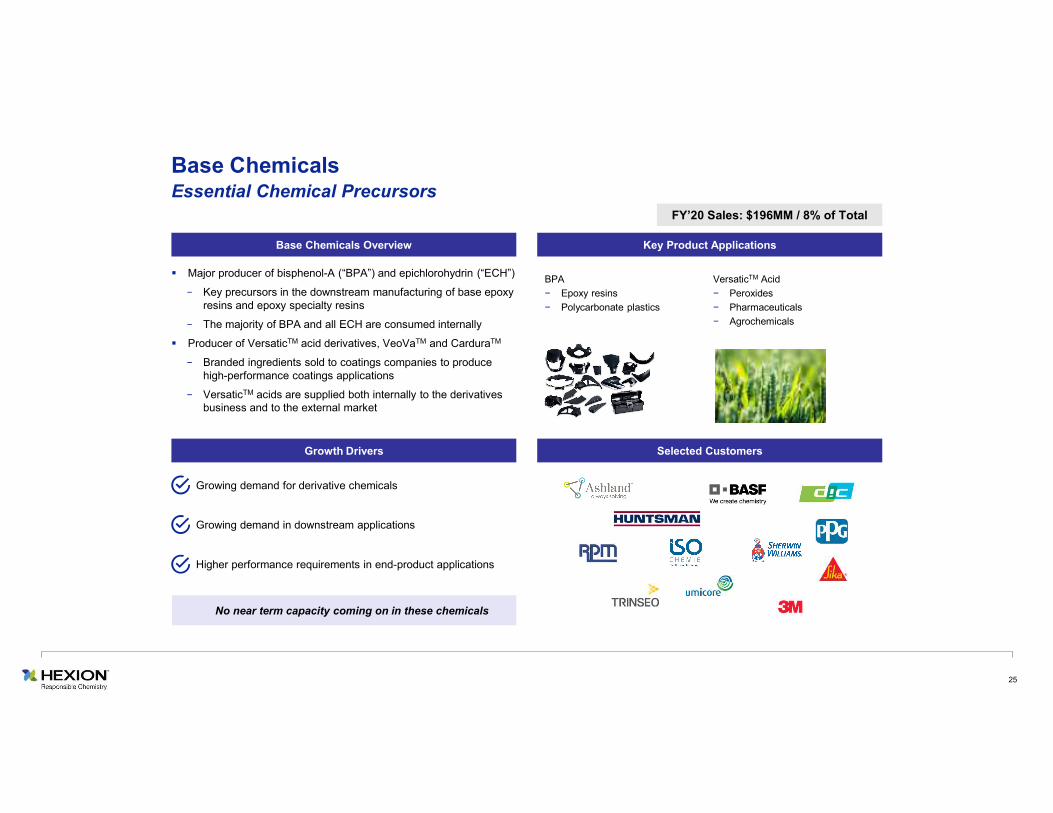
Base Chemicals Overview
BPA
− Epoxy resins
− Polycarbonate plastics
VersaticTM Acid
− Peroxides
− Pharmaceuticals
− Agrochemicals
Major producer of bisphenol-A (“BPA”) and epichlorohydrin (“ECH”)
− Key precursors in the downstream manufacturing of base epoxy resins and epoxy specialty resins
− The majority of BPA and all ECH are consumed internally
Producer of VersaticTM acid derivatives, VeoVaTM and CarduraTM
− Branded ingredients sold to coatings companies to produce high-performance coatings applications
− VersaticTM acids are supplied both internally to the derivatives business and to the external market
Selected Customers
Key Product Applications
Growth Drivers
FY’20 Sales: $196MM / 8% of Total
Base ChemicalsEssential Chemical Precursors
Growing demand for derivative chemicals
Growing demand in downstream applications
Higher performance requirements in end-product applications
No near term capacity coming on in these chemicals
26
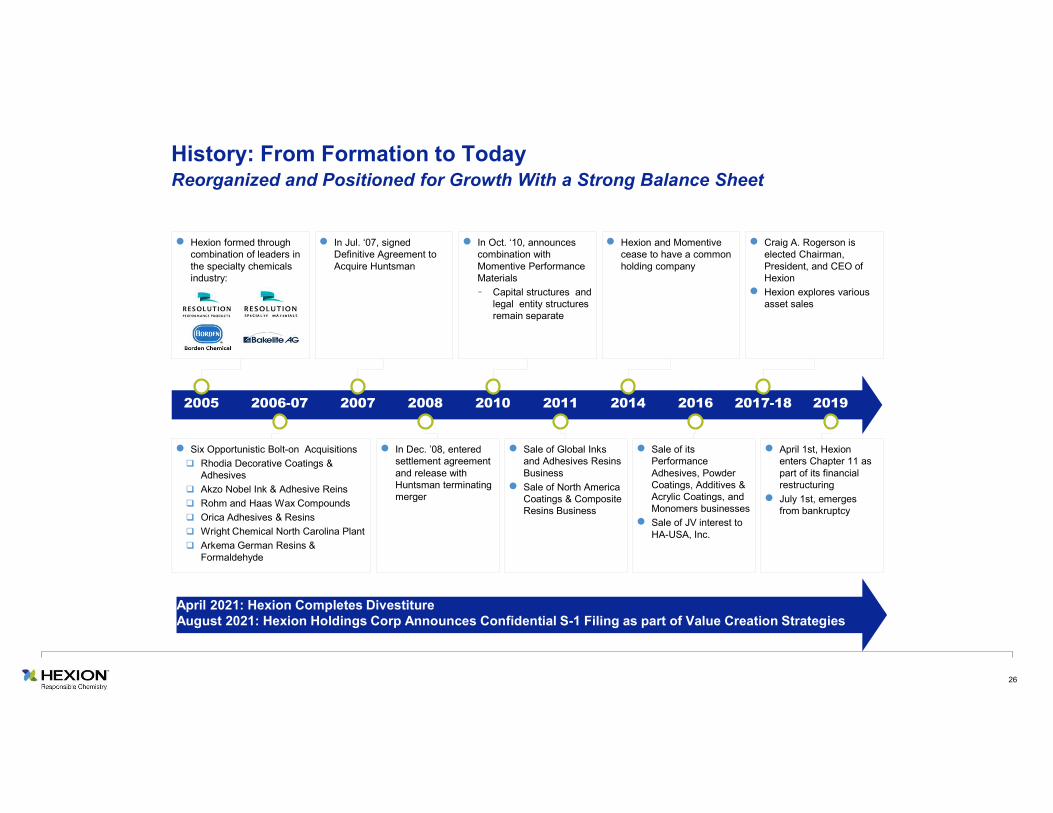
Hexion formed through combination of leaders in the specialty chemicals industry:
In Jul. ‘07, signed Definitive Agreement to Acquire Huntsman
In Oct. ‘10, announces combination with Momentive Performance Materials- Capital structures and
legal entity structures remain separate
Hexion and Momentive cease to have a common holding company
Craig A. Rogerson is elected Chairman, President, and CEO of Hexion
Hexion explores various asset sales
Six Opportunistic Bolt-on Acquisitions
Rhodia Decorative Coatings & Adhesives
Akzo Nobel Ink & Adhesive Reins
Rohm and Haas Wax Compounds
Orica Adhesives & Resins
Wright Chemical North Carolina Plant
Arkema German Resins & Formaldehyde
In Dec. ’08, entered settlement agreement and release with Huntsman terminating merger
Sale of Global Inks and Adhesives Resins Business
Sale of North America Coatings & Composite Resins Business
Sale of its Performance Adhesives, Powder Coatings, Additives & Acrylic Coatings, and Monomers businesses
Sale of JV interest to HA-USA, Inc.
April 1st, Hexion enters Chapter 11 as part of its financial restructuring
July 1st, emerges from bankruptcy
2005 2006-07 2007 2008 2010 2011 2014 2016 2017-18 2019
History: From Formation to Today Reorganized and Positioned for Growth With a Strong Balance Sheet
April 2021: Hexion Completes DivestitureAugust 2021: Hexion Holdings Corp Announces Confidential S-1 Filing as part of Value Creation Strategies
27
Fresh Start Accounting Impact
Upon emerging from Chapter 11 on July 1, 2019 ("Effective Date") and qualifying for the application of fresh-start accounting, Hexion's assets and liabilities were recorded at their estimated fair values which, in some cases, were significantly different than amounts included in the Company's financial statements prior to the Effective Date. Accordingly, Hexion's financial condition and results of operations on and after the Effective Date are not directly comparable to our financial condition and results of operations prior to the Effective Date. References to “Successor” or “Successor Company” relate to the financial position and results of operations of the reorganized Company subsequent to the Effective Date. References to “Predecessor” or “Predecessor Company” refer to the financial position and results of operations of the Company on or before the Effective Date.
28
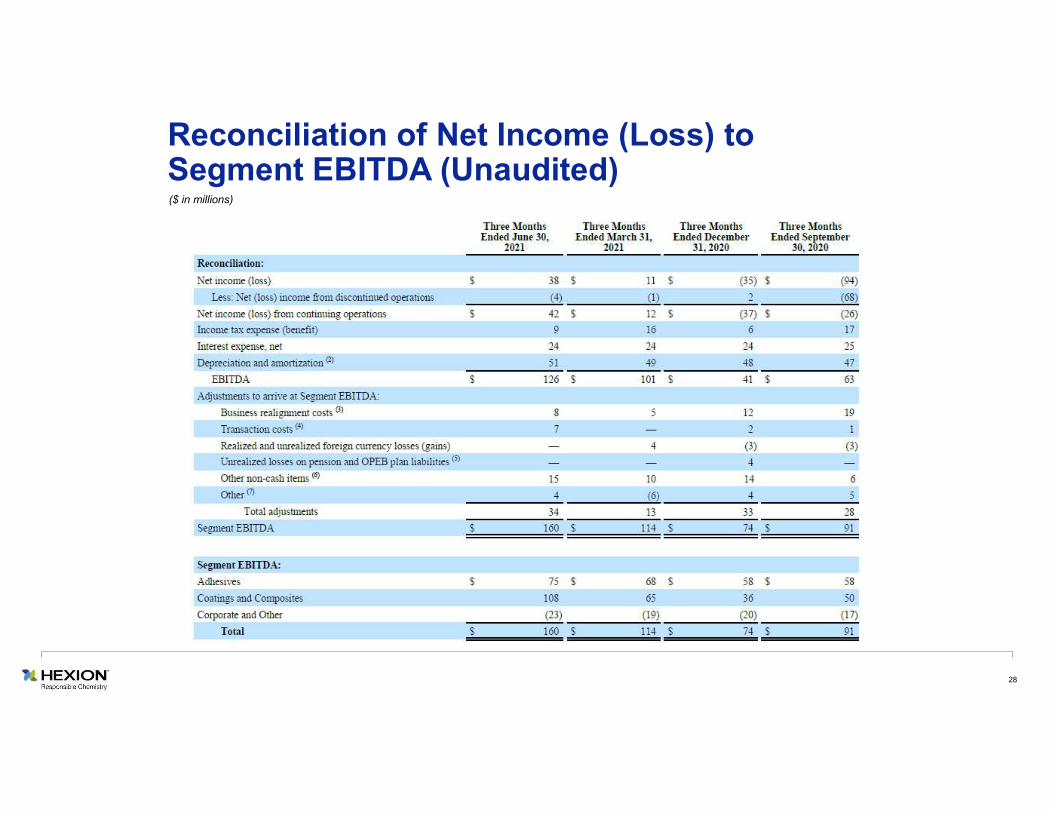
Reconciliation of Net Income (Loss) to Segment EBITDA (Unaudited) ($ in millions)
29
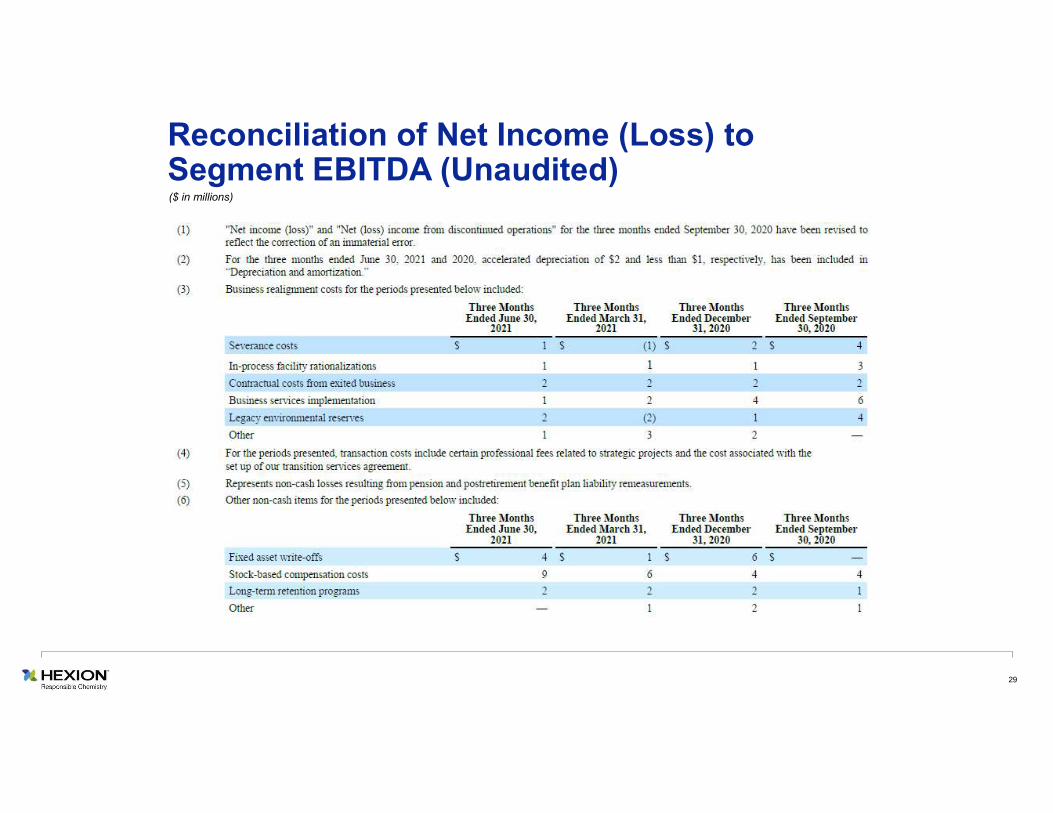
Reconciliation of Net Income (Loss) to Segment EBITDA (Unaudited)($ in millions)
30
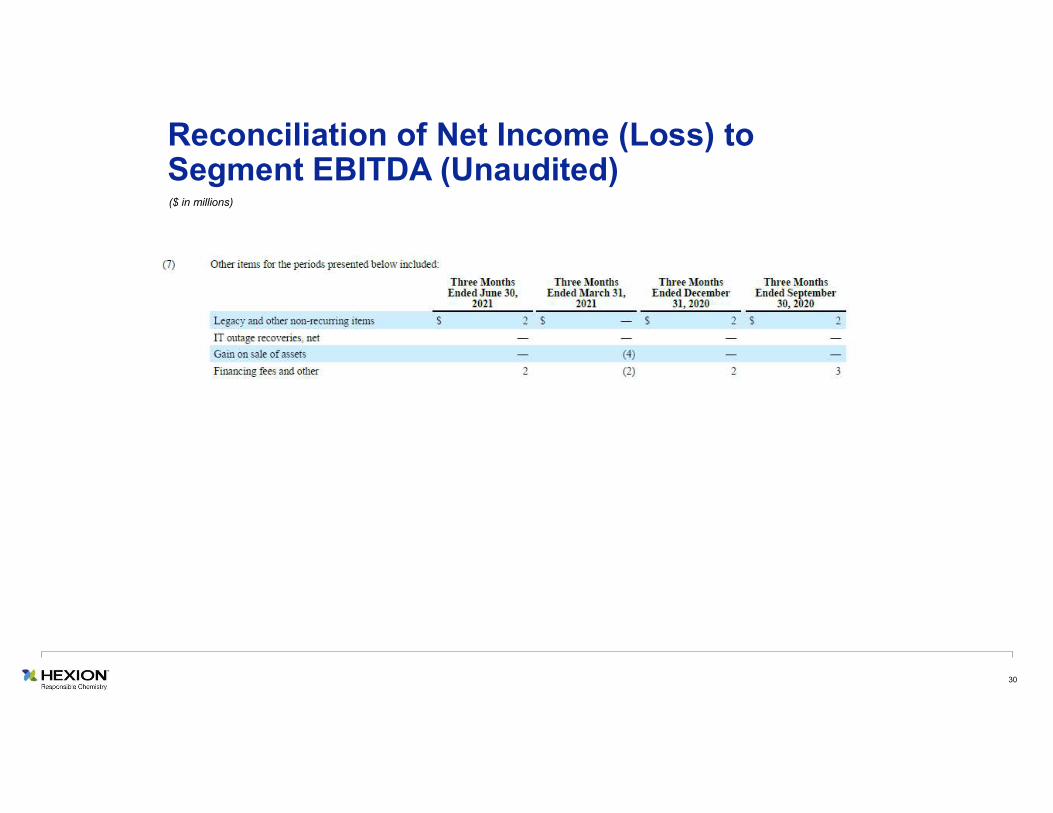
Reconciliation of Net Income (Loss) to Segment EBITDA (Unaudited)($ in millions)
31
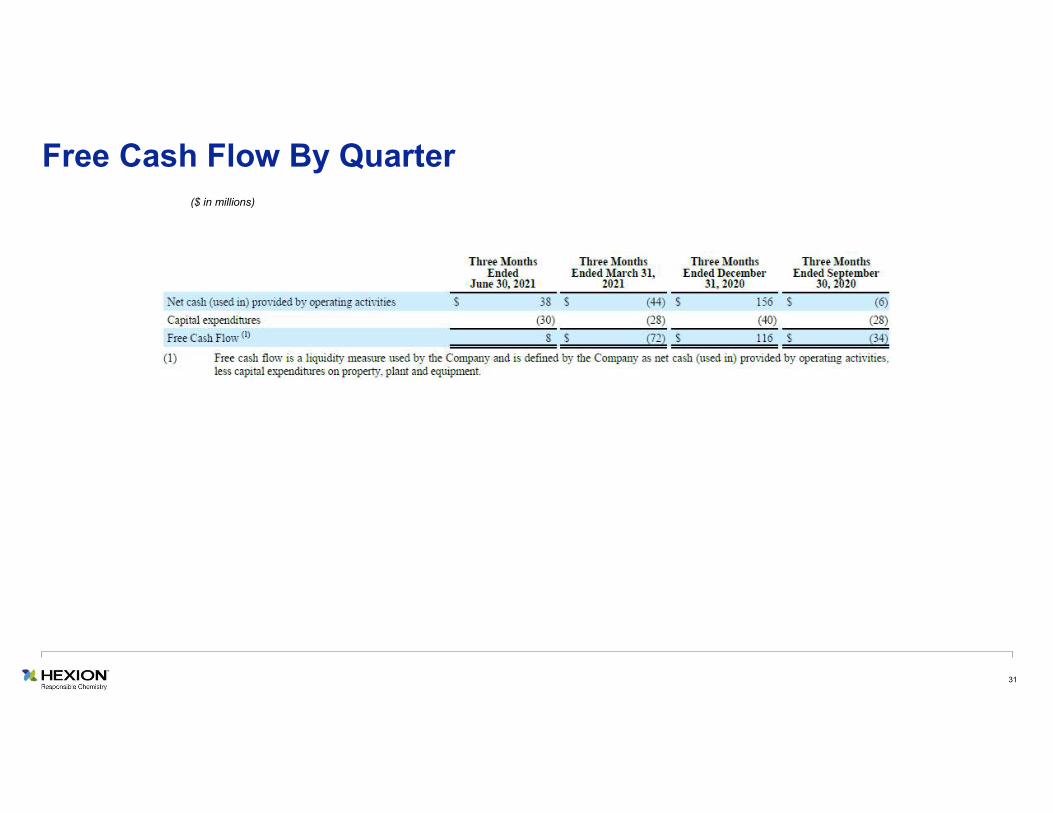
Free Cash Flow By Quarter($ in millions)
32
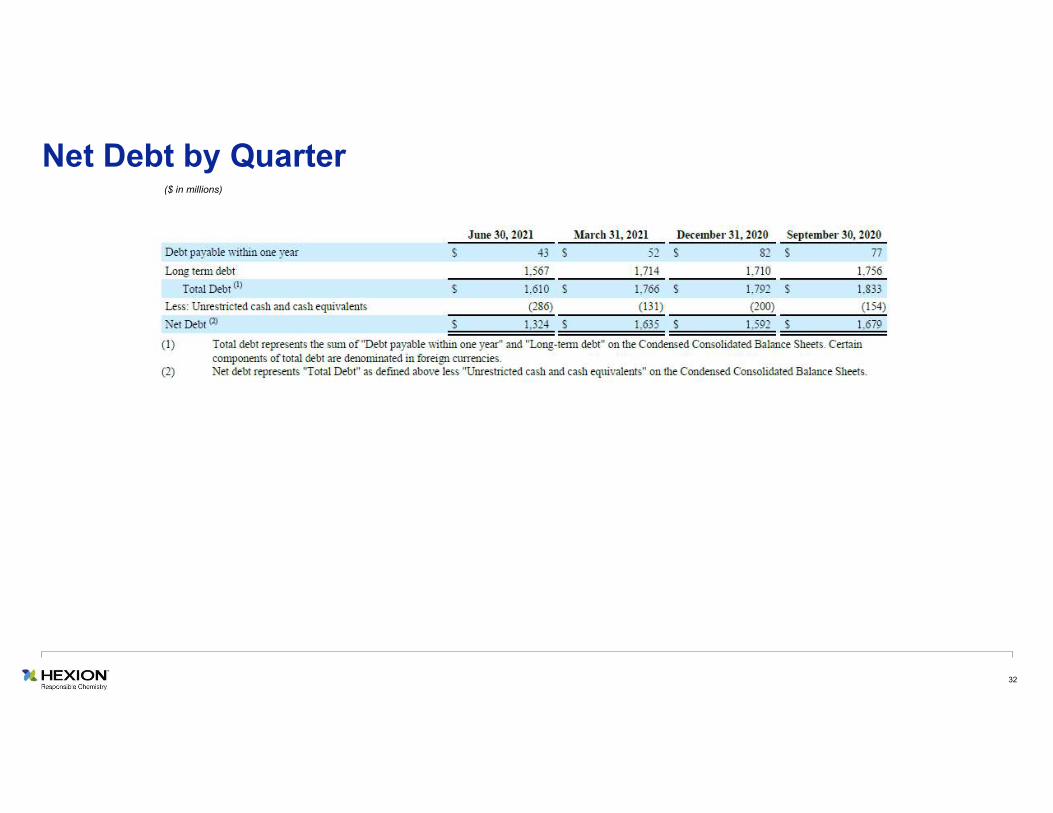
Net Debt by Quarter($ in millions)
33
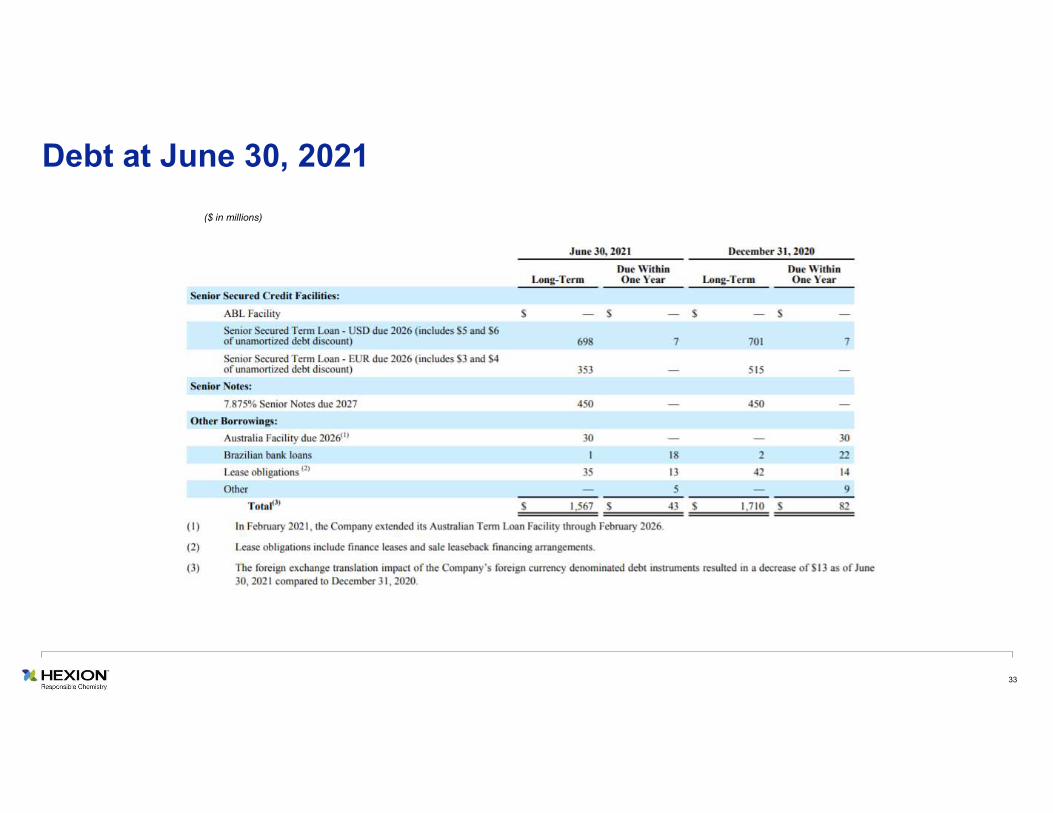
Debt at June 30, 2021
($ in millions)
34
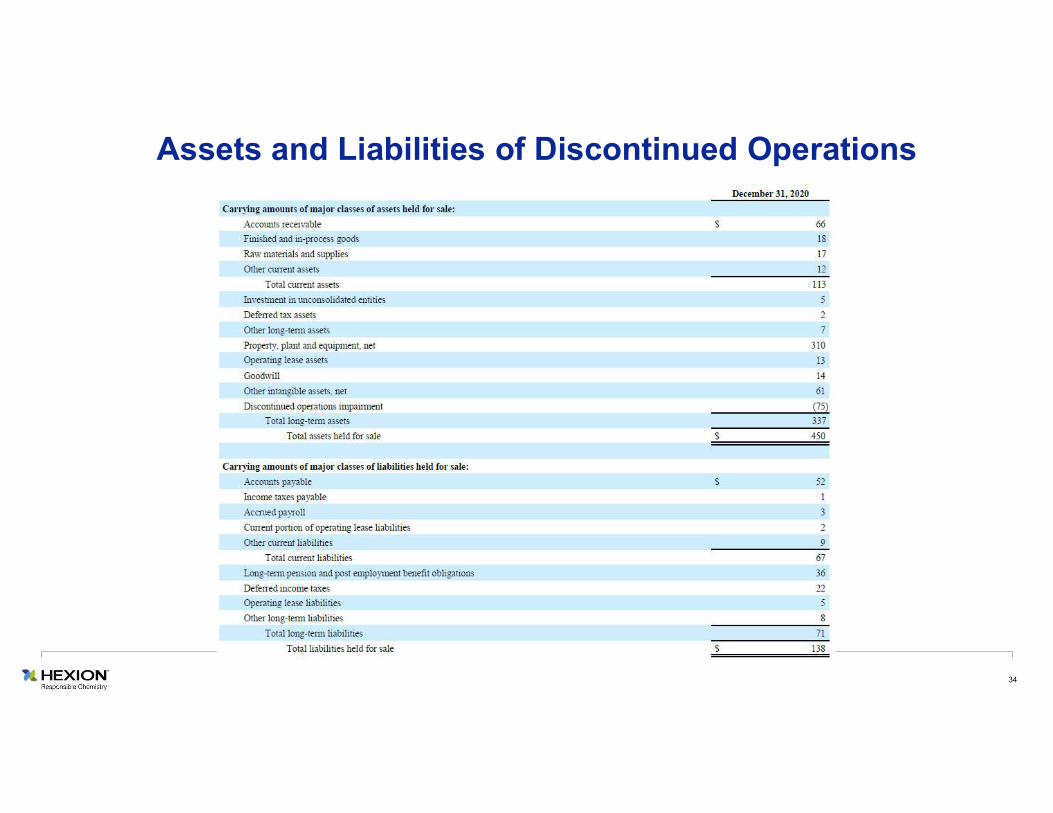
Assets and Liabilities of Discontinued Operations
35
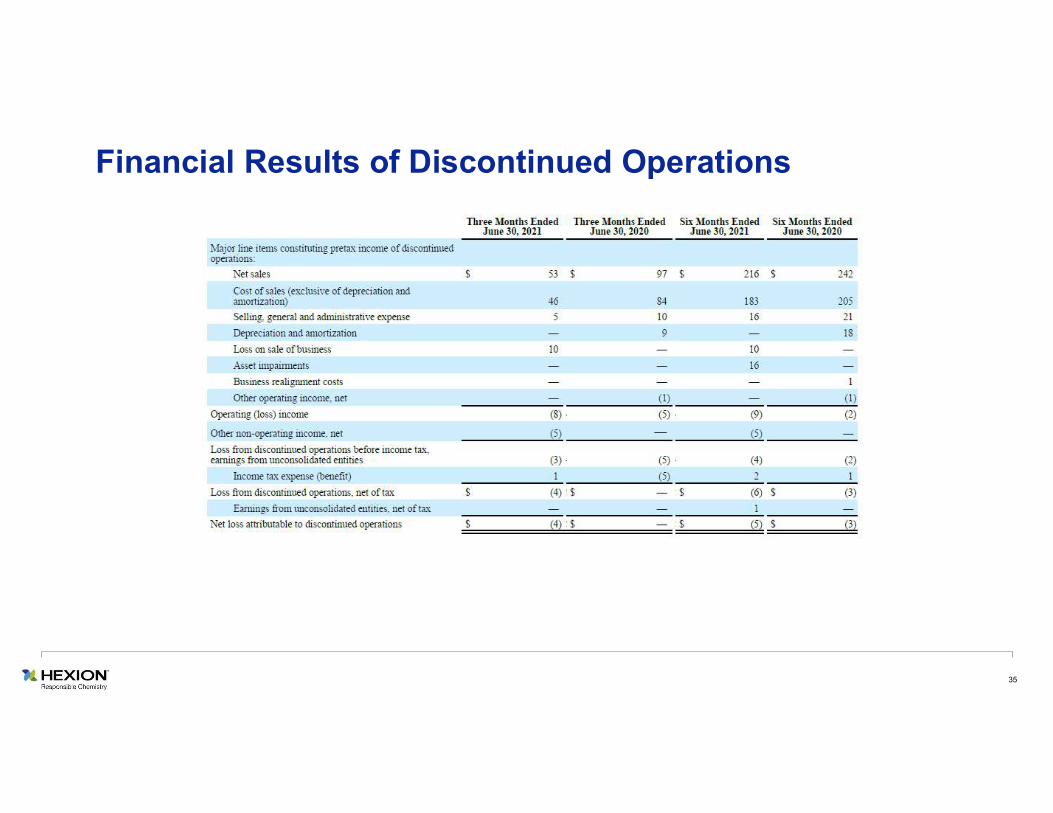
Financial Results of Discontinued Operations
36
World Headquarters 180 East Broad Street Columbus, OH 43215-3799 © 2021 Hexion Inc. All rights reserved. ® and ™ denote trademarks owned or licensed by Hexion Inc. The information provided herein was believed by Hexion Inc. (“Hexion”) to be accurate at the time of preparation or prepared from sources believed to be reliable, but it is the responsibility of the user to investigate and understand other pertinent sources of information, to comply with all laws and procedures applicable to the safe handling and use of the product and to determine the suitability of the product for its intended use. All products supplied by Hexion are subject to Hexion’sterms and conditions of sale. HEXION MAKES NO WARRANTY, EXPRESS OR IMPLIED, CONCERNING THE PRODUCT OR THE MERCHANTABILITY OR FITNESS THEREOF FOR ANY PURPOSE OR CONCERNING THE ACCURACY OF ANY INFORMATION PROVIDED BY HEXION, except that the product shall conform to Hexion’s specifications. Nothing contained herein constitutes an offer for the sale of any product.