Embed Size (px)
Citation preview

UK Private Equity Market – Longevity, Exit Strategies, and Performance of Management Buy-outs
Ranko Jelic
Accounting and Finance, Business School - University of Birmingham,
Address: Birmingham, B15 2TT, United Kingdom, E-mail: [email protected], Phone: +44 (0) 121 414 5990; Fax: +44 (0) 121 414 6238
Acknowledgements: I gratefully acknowledge a personal research grant from the UK Institute for Quantitative Investment Analysis (INQUIRE) received for the project: UK Private Equity Market- Longevity, Exit Strategies and Performance of Management Buyouts. I would like to thank to Peter Pope for his continuous help and support regarding the above project. Especial thanks to my co-authors on other projects, Wolfgang Aussenegg and Mike Wright. Mike has inspired me to do research in area of private equity and Wolfgang has helped me on this project with his advice and data analysis. The research assistance of Thi Hoang Anh and Lei Zheng is also gratefully acknowledged.
1

Abstract
The size of the UK private equity market is equal to the rest of the European markets put together and
the market is dominated by management buy-outs (MBO) and buy-ins (MBI). More recently, ‘club’
deals and increased availability of debt finance has contributed to significant increase in the capital
accumulated by private equity funds resulting in more funds raised by UK-based private equity (PE)
fund managers on the London Stock Exchange public equity markets. Phenomenal growth and highly
publicized cases of acquisitions of some FTSE 100 companies by PE firms created controversy
regarding the economic benefits of PE investments. Some of the above controversies stem from the
paucity of research on private equity markets.
Using a hand-collected dataset of 1,333 buy-outs, we examine buy-outs longevity, choice of
investors/managers exit strategies, private equity firms (PE) backing and buyouts’ operating
performance, during the period 1980-2004. Our results suggest that it takes, on average, 46 months for
sample firms to exit from their buyout structure. Smaller buy-outs and those backed by private equity
tend to have longer longevity than their larger and non-PE backed counterparts. In our sub-sample for
IPO exits, however, PE backed buy-outs tend to have shorter longevity. Our probit regressions
successfully predicted choice of IPO exit strategy in 81% of cases, and show that backing by highly
reputable PE firms increases the likelihood of initial public offerings (IPO) exit by 45%.
We track operating performance of sample buyouts up to 13 years (3 pre and 10 post buy-out years)
and conduct both univariate and multivariate examinations of the operating performance after buy-out
and exit transactions. The results of our pooled cross-sectional time series models suggest a statistically
significant increase in output, efficiency and dividends during the post buy-out period. Overall, our
sample companies exhibited statistically significant improvements in output and statistically significant
reductions in gearing in the post-exit phase, after controlling for sample selection bias regarding the
choice of exit strategy. More reputable PE firms tend to be associated with increases in employment in
both post buy-out and post exit phases. The results for changes in employment of PE backed buy-outs
shed more light on the ongoing debate about the long term role of PE firms in UK. Based on the
evidence, benefits from PE investment do not come at the expense of the longer term health of
companies and employees. Our IPO sub-sample displays no evidence of statistically significant
underperformance that is often documented in the IPO literature. On contrary, the evidence suggests
improved performance during the post listing period.
JEL classification: G24, G32, G34 Key words: MBO, Operating Performance, Private Equity, IPO, Acquisitions
2

Introduction The UK private equity market is dominated by management buy-outs (MBO) and
buy-ins (MBI).1 A recent study reports that the private equity asset class has
outperformed all principal UK comparative asset classes since 1987.2 Nevertheless,
the average private equity weight for UK pension managers was only 3.75% until
2003.3 In the past, the reluctance to invest in private equity was often attributed to
fund trustees’ psychological barriers, and investors’ misconceptions about risks and
cash flows associated with investments in private equity.4
More recently, syndicated (i.e. club) deals and increased availability of debt finance
has contributed to a significant increase in the capital accumulated by private equity
funds. For example, in the first half of 2006 UK-based PE fund managers raised £11.2
billion of capital, compared to £10.4bn of funds raised via IPO on the London Stock
Exchange public equity markets, during the same period.5 An average PE-backed buy-
out deal size has increased from £11.6m in 2002 to £ 16.7 million in 2006. During the
same period, the total number of PE backed deals steadily increased reaching more
than 2000 in 2004, and continuing to increase in 2005 and 2006.6 The above growth
of PE funding was accompanied by cases of takeovers of large (i.e. FTSE 100) UK
public companies by private equity groups, increased leveraged finance provision to
private equity transactions and development of secondary markets for both individual
and PE funds holdings.
The recent trends have generated public interest and raised the profile of PE- backed
deals but at the same time have created controversy: “…to its defenders, private
equity makes companies more efficient. To its attackers, its practitioners are financial
1 The size of the UK private equity (i.e. venture capital) market is equal to the rest of the European markets put together (EVCA, 2001). Private equity refers to all equity investments in unquoted companies, to include late stage (buy-outs) and early stage (seed) investments. The UK, however, private equity market is dominated by venture backed late stage investments. In the USA term private equity is used interchangeably with leveraged buy-out investments whereas term venture capital is reserved for early stage investments. 2 BVCA (2000). 3 Financial Times, 12 May 2003. 4 BVCA (2000). 5 FSA (2006), p. 4. 6 Financial Times, 30 April 2007.
3

manipulators and asset-strippers.”7 The opinions on the long term effects of PE
investments and in particular, whether the benefits for PE funds come at the expense
of the longer term health of companies, are also divided. While the British Private
Equity and Venture Capital Association (BVCA), has provided statistics suggesting
that companies backed by PE have grown employment and sales faster than other
companies, many argue that after the PE exits (typically 3 years) the implications for
shareholders, employees, and others may be unpleasant.8 The above controversy
prompted both public and regulators (i.e. FSA) to require more transparency and a
new regulation for the industry.9 At least some of the above controversies stem from
the paucity of research on private equity markets.
Many of the earlier studies on UK buyouts have focused on short term post-buy-out
operating performance (Wright et al., 1996; Wright, 1986), the short and long term
financial performance of buyouts that went public through IPO (Jelic et al., 2005;
Levis, 2007), the involvement of various institutions in these transactions (Robbie et
al., 1992), and analysis of failure of buyouts (Wright et al., 1996). In the USA, there
has been some separate analyses of reverse leverage and/or management buyouts
(L/MBO) (Muscarella and Vetsuypens, 1990; DeGeorge and Zeckhauser, 1993;
Holthausen and Larcker, 1996) and venture-backed IPO (e.g. Megginson and Weiss,
1991; Lerner, 1994; Brav and Gompers, 1997). The studies of reverse L/MBO,
however, did not examine the role of the private equity funding.10
The objective of this study is to shed more light on the UK private equity market by
investigating factors that influence buyout’s longevity, the choice of
investors/managers exit strategies, post buyouts’ and post exit long term operating
7 Wolf (2007); private equity firms have been characterized by trade unions as “asset strippers who destroy jobs and load companies with debt.” Financial Times, 30 April 2007. 8 See Gordon (2007). 9 The FSA, for example, published a discussion paper aiming to stimulate discussion among policy makers and industry participants about the development of the PE market and in particular on an appropriate level and form of regulatory engagement with the private equity sector in 2006. 10 In the USA, term private equity is used interchangeably, with leveraged buy-out investments whereas term venture capital is reserved for early stage investments. The L/MBO specialists usually invest in mature companies with predictable cash flows. They are normally organized as limited partnerships, and structure their deals using both equity and debt.
4
performance, and the effects different exit strategies, PE backing, and reputation of
PE firms may have on the performance.
Our work contributes to the previous literature by examining deal specific
determinants of buyouts’ longevity and exit strategies. The importance of tracking the
performance over a longer period has been highlighted by both the ongoing debate
about overall benefits of the PE investments and the operating performance literature
(Barber and Lyon, 1996). We, therefore, track the buyouts operating performance up
to 13 years (3 years before and 10 years after buyout transactions), and separately
examine the determinants of the performance changes after both buyouts and exit
transactions. Finally to the best of our knowledge, this is the first study to control for
sample selectivity bias with regard to the choice of different exit strategies in
examining the post events operating performance.
Our results suggest that it takes, on average, 46 months for sample firms to exit from
their buyout structure. Buyouts exited via IPO are, on average, smaller than sample
buyouts exited via trade sales. PE backed transactions tend to be larger than their non-
PE backed counterparts, both in terms of MBO value and value at exit. Backing by a
highly reputable PE firms increases likelihood of flotation by 45%. The reputation of
the PE firm is also positively associated with increase in employment both after buy-
out transaction and after exit. This evidence suggests that long term benefits from PE
investments do not come at the expense of employees.
The rest of the paper is organised as follows. In Section 2, we provide a summary of
related literature and develop testable hypotheses. Section 3 describes the data sources
and our sample. Methodology is discussed in Section 4. Results are presented and
discussed in Section 5. Section 6 contains conclusions with suggestions for further
research.
5

2. Relevant literature and hypotheses
2.1. Determinants of buyouts’ longevity and exit strategies
In spite of the popularity and extensive media coverage of IPO, the evidence on what
is the most desired (and dominant) form of ‘harvesting’ is not clear. For example,
Sahlman (1990) reports that more venture capital backed private firms opted for trade
sales than IPO during the 1980s.11 In addition, recent popularity of public to private
transactions in the UK questions some advantages of public listed companies over
non-listed companies.
A number of studies have identified differences in exit strategy. IPO, for example,
involve public (including regulatory) scrutiny and lengthy disclosure during and after
exit. On the other hand, only a limited number of investors are involved in
information gathering related to trade sales (Chemmanur and Fulghieri 1999). It can
be argued, therefore, that the level of information asymmetry is much higher for trade
sales than for IPO. Although both IPO and sales benefit from the subsequent access to
public debt and equity market, a profitable project in companies that have undergone
trade sales may find it more difficult to raise funding within the internal capital
markets of the acquiring firms (Stein, 1997). Trade sales often entail selling the entire
company so that original owners retain no ownership, while insiders involved in IPO
exits tend to retain some ownership (Poulsen and Stegemoller, 2005).12 Exit strategies
also tend to affect the valuation of the companies. Lerner (1994) for example, reports
that return to investment in companies that exit via flotation was four times that of the
return for trade sales for venture capital backed private firms. Similarly, Koeplin et al.
(2000) report that trade sales are often valued at a 20-30% discount to similar public
takeover deals. The above differences suggest that choice between different exit
strategies may not be random, and that some determinants of choice could be
identified.
Brau et al. (2003) classify the determinants into four different categories: industry
related, market timing related, factors related to overall demand for funding by private
11 Terms: trade sale, sell-out, and direct sale will be used inter-changeably. 12 Insiders would normally enter a lock-up agreement which would prevent them from selling their ownership stakes for a number of months (sometimes years) after IPO.
6

firms, and deal-specific determinants. The evidence for market timing in IPO markets
suggest that peaks in the IPO market (hot issue periods) coincide with peaks in stock
market returns (Ritter, 1984; Lowry (2003), while the overall demand for funding
influences the choice between IPOs and acquisitions to a lesser degree (Mikkelson et
al., 1997). Boehmer and Ljungqvist (2004) suggest that more companies will go
public when outside valuations are high or have increased. They also highlight the
importance of deal (i.e. company) specific factors, such as uncertainty related to
future profitability and insider ownership. For example, when uncertainty is high
more firms would choose IPO, while companies whose shareholders enjoy significant
private benefits of control are less likely to go public. Finally, industry classification
has been identified as an important determinant of exit strategies (Pagano et al.,
1998).
Ellingson and Rydquist (1997) report that sell-outs would be preferred to IPO by
companies with assets that are more difficult to value by dispersed public
shareholders. Poulsen and Stegemoller (2005) consider companies’ ownership,
growth, and information asymmetry as important determinants of choice. They
hypothesise that firms with low insider ownership, lower growth opportunities, and
assets that are more difficult to value by dispersed public shareholders would prefer
trade sale to IPO. They found that IPO are the preferred exit strategy for US
companies with greater growth opportunities, while trade sales seem to be favoured
when managers are selling higher ownership stakes and when firms face financial
constraints.
For UK companies, Wright et al. (1995) reported that size of buy-out is positively
related to exit probability since private equity funds tend to prefer larger companies.
Larger buyouts also tend to have shorter longevity (period between buyout transaction
and exit) than their smaller counterparts. Wright et al. (1995) is one of the rare studies
that examine buyouts’ longevity. The study examines 158 buyouts during 1983-86.
The authors report that many buyouts experience short-term changes in ownership,
many of them remain as such for a considerable period. The longevity seems to be
associated with the size of the transaction and with institutional control variables. For
example, buy-outs with board representation from PE firms have lower survivability
in the buy-out form than those where this is absent.
7

We examine deal specific and market related determinants of longevity and choice of
different exit strategies from buyout structures. In accord with the previous literature,
we predict that larger buyouts and buyouts with PE backing will have shorter
longevity than their smaller and non-PE backed counterparts:
H1: Buyouts’ size is negatively associated with buy-outs longevity
H2: PE backing is negatively associated with buy-outs longevity
Kaplan (1991) suggests that reputation of PE firm may be important for the longevity
of buy-outs. He finds that buy-outs sponsored by more reputable LBO partnerships
are more likely to go public within a particular time period than those sponsored by
less reputable backers.13 Reputable PE firms may be more successful in both selecting
good deals and implementing changes in backed buy-outs. It may, therefore, take less
time for them to prepare the buy-outs for the exit and, thus, they may be more likely
to bring companies to the market sooner (Jelic et al. 2005):14
H3: Reputation of PE firms is negatively associated with buy-outs longevity
We hypothesize that size of buy-outs (LNVMBO), PE backing (PE), and market
conditions at the time of exit (AVFTSE), may be important determinants of the choice
of exit strategy.15 Larger buy-outs and those with PE backing exiting during peaks in
‘hot IPO market’ periods would be more likely to exit via floatation than their
counterparts. We control for source of buy-out transaction (DIVESTMENT), since
divisional buyouts (divestment) may be better suited to a particular exit strategy than
13 The difference, however, was not statistically significant. 14 This hypothesis is opposite to the ‘Grandstanding hypothesis’ proposed by Gompers (1996), according to which less reputable venture capital firms may be tempted to take companies to the market sooner in order to free capital for new investment and establish reputation by investing in a larger number of deals. 15 The market conditions are proxied by average market index (FTSE All Share Index) growth over a two-year period which includes year of exit and the previous year.
8

of entire firm buyouts. The same applies to type of buy-out deal (MBI) and industry
classification (INDUSTRY). Finally, we control for time to exit (TIMEX).
H4: Larger buyouts are more likely to exit via IPO
H5: PE backing increases likelihood of exit via IPO
2.3 Private equity backing and performance
2.3.1 Performance after buy-out transaction
There is extensive evidence that restructuring of buy-outs within a two to three year
period is key to generating gains, and that PE firms board representation contributes
to better performance of PE backed buy-outs (see Thompson and Wright (1995), for a
comprehensive literature survey). The evidence on improvements in operating
performance after buy-out transactions is conclusive (Kaplan, 1989; Smith, 1990;
Opler, 1992; Wright et al., 1996). For example, Wright et al. examine 251 UK buy-
outs and 446 non-buy-outs which were tracked for up to six years after the buy-out.
The authors conclude that buy-outs significantly outperform non-buy-outs in terms of
return on assets and return on equity in years 3 to 5 post buy-out.
The only evidence, so far, on the relative performance of UK buy-outs opting for
different exit strategies comes from Nikoskelainen et al. (2005). The authors report an
internal rate of return of enterprise value of 22.2% and the average equity internal rate
of return of 70.5%, for the sample of 321 UK buy-outs exiting during the period 1995-
2004. Buy-outs that exited via IPO outperformed trade sale exits and secondary
buyout exits. Larger buyouts performed better than medium and smaller buyouts. The
authors also suggest that returns are related to corporate governance mechanisms
resulting from leveraged buyouts.
We, therefore, test the following hypothesis:
9

H6: Operating performance improves in the post-buy-out phase
H7: PE backing is positively associated with improvements in operating performance
in the post-buy-out phase
2.3.2 Operating performance in post-exit phase
The operating performance of buy-outs exited via floats was also examined as a part
of larger samples in IPO literature. For example, Khurshed et al. (2003) report long
term reductions in operating performance for UK IPOs during 1980-83 period, in the
first year after listing. Jain and Kini (1994) and Mikkelson et al. (1997) report long
term deterioration in operating performance for US IPOs. Mikkelson et al. (1997)
argue that the drop in the performance was associated with the firms timing ability to
go public during periods of exceptionally good performance.16 A common feature of
these studies, however, is that they have examined both early stage and buy-out stage
investments combined. Buy-out firms, however, are quite distinct and are not
representative of a typical firm going public, and it is important to study them
separately (Jelic et al., 2005).
Barber and Lyon (1996) provide an alternative explanation for operating
‘underperformance’ after IPO. They report that the results of some studies could be
biased due to the fact that authors did not track the performance of IPO firms long
enough after the floatation. They also suggest that cash flow, rather than accrual
based, measures of performance should be used since the use of accruals tends to
overstate earnings pre-event. Finally, scaling profit by sales rather than total asset can
be a better measure of performance after IPO since it avoids the ‘build up in assets’
measurement problem. The problem is related to the fact that operating assets tend to
increase immediately after the IPO but their deployment is often delayed which would
mean further delay in the effect on operating income. We, therefore, test for the
following hypothesis:
16 Elsewhere a significant decline in the post IPO performance was documented for Japanese IPO (Cai and Wei, 1997; Kutsuna et al. 2002).
10

H8: Buy-outs do not exhibit significant deterioration in the performance in the post-
exit phase, after controlling for sample-selection bias regarding choice of exit
strategy
Lin and Smith (1998) hypothesize that venture capital (VC) firms balance the cost of
continued monitoring involvement (i.e. inability to redeploy advisory talent to other
ventures) against the adverse market reaction to insider selling during IPO. To
expedite redeployment of investments, companies backed by VC are brought to the
market sooner than non-VC backed companies. The authors also report a decline in
VC’s board seats after the IPO exits from 13.6% to 4.9%. This further may imply that
one should expect deterioration in performance after the exit. Empirical evidence for
financial performance (i.e. stock market price based) seems to contradict this view,
and documents absence of the statistically significant underperformance for PE
backed IPO (Espenlaub et al., 1999; Jelic et al. 2005; Levis, 2007).17 Jelic et al.
(2005), for example, report that private equity reputation plays an important role in
financial long term performance of (reversed) buy-outs that were subsequently
floated. The authors have not found underperformance by PE backed buy-outs.
Furthermore, the buy-outs backed by more prestigious firms performed better than
those backed by less prestigious firms, measured by two year buy-and-hold returns.
We, therefore, test for the following hypothesis:
H9: Reputation of PE firms is positively associated with improvements in the
operating performance, after controlling for sample selection bias regarding choice
of exit strategy
17 Levis (2007) reports that PE backing does not seem to be reliable a factor in differentiating average long term performance of UK IPOs, although they do seem to generate more homogenous performance.
11
3. Data sources and sample descriptive statistics
3.1. Data sources
Buy-out and exit transactions have been identified from the Center for Management
Buy-out Research (CMBOR) Quarterly Reviews (various issues), KPMG MBO
commentaries (various issues), Barclays Private Equity Deal Maker (various issues),
Barclays Private Equity – Exits (various issues), KPMG New Issue Statistics, and
www.growthbusiness.co.uk website. This data collection exercise enabled us to obtain
a list of 1,333 UK buyouts, with inception and/or vintage years, size and details about
exit strategies, type of transaction (MBO vs. MBI), vendors, and industry
classification for the period 1980-2004. We monitor the progress of buy-outs
following completion, by surveying the same sources plus London Stock Exchange
Primary Market Fact-sheets, BVCA reports, and websites of PE firms. Additional data
on operating performance, current ownership status, venture capital involvement, and
exit strategies was collected from various sources such as: FAME database, Reuters
database, Datastream database, companies’ annual reports (obtained either from
Companies House or directly from the companies), and IPO and/or acquisition
prospectuses.
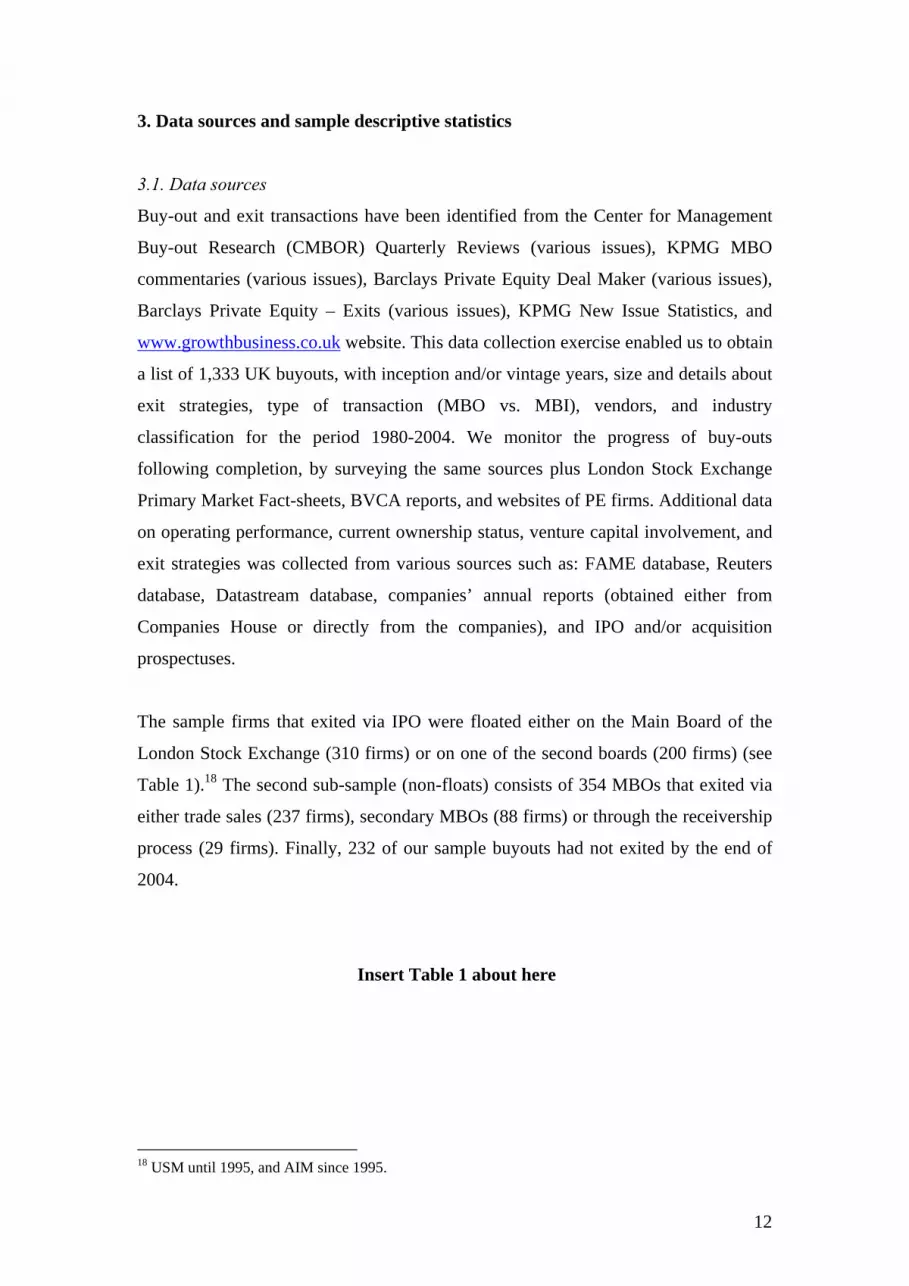
The sample firms that exited via IPO were floated either on the Main Board of the
London Stock Exchange (310 firms) or on one of the second boards (200 firms) (see
Table 1).18 The second sub-sample (non-floats) consists of 354 MBOs that exited via
either trade sales (237 firms), secondary MBOs (88 firms) or through the receivership
process (29 firms). Finally, 232 of our sample buyouts had not exited by the end of
2004.
Insert Table 1 about here
18 USM until 1995, and AIM since 1995.
12

3.2 Sample descriptive statistics
The firms from the second sub-sample (non-floats) are, on average, larger than other
sample firms (median and value at exit, of £40 million and £105 million,
respectively). Non-exits tend to be much smaller transactions then their counterparts
from float and non-float sub samples. It takes, on average, 46 months for sample firms
to exit from their buyout structure. The difference in time to exit for floats and non-
floats is not statistically significant (see Table 2).
Insert Table 2 about here
In our sub-sample for floats, PE backed transactions tend to be larger than their non-
PE backed counterparts, both in terms of buy-out value and value at exit (see Table 3).
They also tend to have shorter longevity (time to exit) than their counterparts that
have not received PE backing. For example, it takes on average 39 months for PE
backed buy-outs to exit via IPO, compared to 56 months for their non-PE backed
counterparts. The differences in average (both mean and median) size and time to exit
between venture backed and non venture capital backed buy-outs are statistically
significant at 1% significance level.
Insert Table 3 about here
In the sub-sample of non-floats, trade sales tend to be smaller transactions than
secondary buy-outs (see Table 4). The differences in median MBO values and values
at exit are statistically significant. Trade sales, however, tend to exit earlier than their
secondary buy-out counterparts. Finally, buy-outs that exit via receivership are the
smallest transactions within the sub-sample.
Insert Table 4 about here
Overall, the descriptive statistics and the results of univariate analysis suggest
statistically significant differences between sample firms stratified by different exit
strategies (and PE backing). The identified differences are consistent with findings
13

reported in Nikoskelainen et al. (2005) who suggest that smaller buy-outs tend to
attract less interest from big investors. Given the above mentioned characteristics of
our sample firms, any comparison of buy-outs that adopted different exit strategies
(e.g. differences in operating performance) requires consideration of the sample
selection bias.
4. Methodology
4.1 Determinants of longevity and exit strategies
We test hypotheses 1 to 3 within the following OLS regression models, with time to
exit as a dependent variable:
TIMEX i = αo + β1 LNVMBO i + β2 PE i+ β3 MBI i + Β4 INDUSTRY i + β5 FLOAT i
+ εi
TIMEX i = αo + β1LNVMBO i + β2 REPUTATION i + β3 MBI i + β4 INDUSTRY i +
β5 FLOAT i + εi
Where, TIMEX is time to exit in number of months from a buy-out transaction until
exit; LNVMBO is the natural logarithm of buy-out value; MBI is a dummy variable
taking value equal to 1 for buy-ins, 0 otherwise; INDUSTRY is a dummy variable
taking value equal to 1 for buy-out/in from manufacturing industry, 0 otherwise;
FLOAT is a dummy variable for IPO taking value equal to 1 for buy-outs exited via
flotation, 0 otherwise; REPUTATION is a dummy variable for reputation of PE firms
taking value equal to 1 for buy-outs backed by more reputable firms, 0 otherwise.
Hypotheses 4 and 5 were tested within the following probit models for determinants
of choice of exit strategies:
14

FLOAT i = αo + β1 LNVMBO i + β2 DIVESTMENT i + β3 MBI i + β4 AVFTSE i + β5
TIMEX i + β6 INDUSTRY i + β7 PE i + εi
FLOAT i = αo + β1 LNVMBO i + β2 DIVESTMENT i + β3 MBI i + β4 AVFTSE i + β5
TIMEX i + β6 INDUSTRY i + β7 REPUTATION i+ εi
Dependent variable is a dummy variable taking value equal to 1 if buy-out exited via
flotation, and 0 otherwise (trade sale, secondary buy-outs, liquidation) (FLOAT). The
choice of floatation is a function of the following explanatory/control variables: a
variable for buy-out value, as natural logarithm buy-out value (LNVMBO); a dummy
variable for source of buy-out transaction taking value equal to 1 for domestic and
foreign divestments, and zero otherwise (privatizations and/or family owned entire
companies, secondary buy-outs, and receivership) (DIVESTMENT); a dummy
variable for buy-in transactions taking value equal to 1 for buy-in transactions, and 0
for buy-outs (MBI); an average growth rate for FTSE All Shares Market Index during
the exit year and the year preceding the exit (AVFTSE); a dummy variable taking
value equal to 1 for manufacturing companies, and 0 otherwise (INDUSTRY); a
variable for length of time (number of months) before exits (TIMEX); a dummy
variable taking value equal to 1 for PE backed firms, and 0 otherwise (PE).
15

4.2. Operating performance during post buy-out/exit phase
4.2.1 Univariate analysis
We investigate operating performance of sample firms before/after buy-out
transactions, as well as before/after exits. Specifically, our study tries to determine
changes in operating performance by measuring changes in (1) profitability, (2)
operating efficiency, (3) output, (4) dividend payments, (5) employment levels, and
(6) leverage.
Profitability:
Return on assets (ROA) = Net profit after tax divided by asset
Return on sales (ROS) = Net profit after tax divided by sales
Operating efficiency:
Sales efficiency (SALEFF) = Sales in £, divided by number of employees, normalized
to unity in the year of MBO or exit (year 0)
Output:
Sales (SALE) = Sales in £, normalized to unity in the year of MBO and or exit (year 0)
Dividends:
Dividends to sales (DIVSAL) = Cash dividends divided by sales
Dividends to assets (DIVA) = Cash dividends divided by assets
Employment:
Total employment (EMPL) = Total number of employees, normalized to unity in the
year of MBO or exit (year 0)
Leverage:
Long term debt ratio (GEAR1) = Total long term debt divided by total assets
Total liabilities ratio (GEAR2) = Total liabilities divided by total assets
16

Barber and Lyon (1996) evaluated the choice of an accounting based performance
measure, statistical tests, and models of expected operating performance. Their
findings highlight the importance of following performance of sample firms for
several years following the event (i.e. buy-out and/or IPO). IPO, for example, may
create a large increase in the book value of their assets as they invest in additional
operating assets, but no commensurate increase in operating profit, since these assets
have not been employed long enough to generate operating profit. Following
performance over a longer period of time would ascertain whether erosion in
operating performance is the result of a temporary build-up in assets. Usage of
alternative measures of performance (i.e. cash based) which are unaffected by the
changes in a firm’s operating assets is also recommended. We follow both
recommendations by following the performance for 5 years after buy-outs and/or IPO
and by calculating both returns on sales (ROS) and return on assets (ROA) measures.
It has also been noted that companies may be motivated to overstate reported profits
in the year prior to IPO. An accrual-based measure, therefore, can increase the
likelihood that ‘underperformance’ will be recorded after IPO. For that reason, we use
an average performance for 3 years prior to the event (buy-out/IPO). The authors
report that non-parametric test perform much better than parametric tests, regardless
of the operating performance measure employed. We, therefore, deploy both
parametric and non-parametric tests (Mann-Whitney and Proportion tests) in order to
check for the robustness of the results.
With regard to the choice of expected performance (i.e. benchmark) the authors
suggest that models that yield well specified and powerful statistical results
incorporate a company’s past performance. In particular, models based on change in
the performance dominate level models in detecting abnormal operating
performance.19 We, therefore, examine and test for significance in changes in
performance up to five years after the event and adopt one of the recommended
models based on companies’ past performance:20
19 Matching by size of sample companies does not seem to be critical in tests designed to detect abnormal performance. 20 The model is also known as a naïve, no-change model of earnings and is often used in the economic literature on analysts and management forecasts. Despite its simplicity, the empirical evidence suggest that it is often not outperformed by more sophisticated forecasting models. The model corresponds to model number 9 discussed in Barber and Lyon (1996).
17

E (Pit) = Pi, t-k.
E (Pit) = expected performance of the buyout during post-event period
Pi, t-k. = past performance before the event 21
First, we compute relevant ratios for every firm for three years before and five years
after buyouts. We then calculate means and medians of cross-section of the firms, for
each ratio, for the pre-buyouts (-1 to –3) and post-buyouts and/or exit (years, +1 to
+5) period. The year of buyout (year 0) is excluded from the analysis, because it may
include both public and private ownership phases of the firm. We compare the
performance in each of the post buy-out years with the average over a 3-year period
before MBO. To test whether the changes in operating performance are significant,
we run a two sample T-test for significant changes in means and a Mann Whitney test
for significant changes in medians. Finally, a proportion test is used to determine
whether proportion (p) of companies that have experienced change in a given
direction is greater than the proportion of the companies expected by chance.22 We
use the same method for analysis of post exit performance.
Insert Figure 1 about here
21 In our case we use average 3 year performance prior to MBO/IPO. 22 Typically we test whether, p = 0.5.
18

4.3 Multivariate analysis of determinants of operating performance
4.3.1 Operating performance in post buy-out phase
The data on the number of deals and the total amount of equity invested by different
PE firms in UK companies was collected from MBO Statistics – KPMG Corporate
finance publications – various issues, from 1981 to 1998. More recent data was
collected from the PE firms’ home websites and www.growthbusiness.co.uk website.
The data collection resulted in a list with number of deals and total funding for more
than 60 leading equity providers. Reputation is then established using the number of
deals as equity leader and total amount invested as criteria, and calculating the
reputation score as a weighted average:
Reputation score = ½ (number of deals as equity leader) + ½(total equity funding in
£m)
Based on the reputation score we established a list of top 10 most reputable PE equity
providers who, among themselves, funded more than 2,000 buy-outs from 1981 to
2004. Two overseas PE firms were included in the list outside the criteria since they
have established their reputation elsewhere (i.e. the USA) before, more recent,
investments in UK companies.
Our models for hypotheses 6 and 7 for determinants of change in operating
performance in post-buyout phase are:
P it = αo + β1 POST it + β2 LNVMBO it + β3 INDUSTRY it + β4 PE it + β5 MBI it +
εi
P it = αo + β1 POST it + β2 LNVMBO it + β3 INDUSTRY it + β4 REPUTATION it +
β5 MBI it + εi
Where, performance measures (Pit = dependent variables) for output, efficiency,
employment, profitability, gearing, and dividends, respectively are: (i) sales in £,
normalized by sales in exit year (SALE), (ii) sales per employee ratio, normalized by
the ratio in exit year (SALEFF), (iii) number of employees, normalized by number of
19

employees in exit year (EMPL), (iv) profit divided by total assets (ROA), (v) long
term debt divided by total assets (GEAR1), and (vi) dividends divided by sales
(DIVSAL). Performance is a function of a pre/post dummy taking value equal to 1 for
post exit years, and 0 otherwise (POST) and several explanatory/control variables.
The explanatory/control variables are a variable for buy-out value at exit, as natural
logarithm of buy-out value (LNVMBO); a dummy variable taking value equal to 1 for
manufacturing companies, and 0 otherwise (INDUSTRY)23; a dummy variable for
more reputable private equity firms’ taking value equal to 1 for top ten PE firms, and
0 otherwise (REPUTATION); a dummy variable for buy-in transactions taking value
equal to 1 for buy-in transactions, and 0 for buy-outs (MBI); a dummy variable taking
value equal to 1 for PE backed firms, and 0 otherwise (PE). All parameters of the
pooled cross-sectional time-series regression are estimated via a Generalized Least
Squares method (GLS). 24
4.3.2 Operating performance in post-exit phase
Our sample descriptive statistics confirms our expectations about the differences
between buy-outs that exited via different methods. The above mentioned differences
suggest that the choice of exit strategy may not be a random choice. In order to
address the selectivity bias we employ a version of Heckman’s two-step estimation
procedure similar to the procedure applied in Jelic et al. (2005).25 The procedure
involves estimating initially a probit regression for the determinants of exit strategy.
The dependent variable is a dummy variable for flotation (1 if exit via floatation; 0,
otherwise) as a dependent variable and several explanatory/control variables as
defined earlier:26
23 A similar classification was made in KPMG’s publications on buy-outs given a significant number of buy-outs from this sector (more than 40% during 1980s). In addition, manufacturing companies require different monitoring skills from PE firms. 24 Reported R2 is an overall R2 as a weighted average of the estimates produced by the between and within estimators. 25 The Heckman (1979) procedure, also known as the ‘Heckit’ estimator and/or Endogenous Switching Regression, was developed for the economic modelling of labour force participation and labour supply decisions. For more on sample selection as a specification error see Greene (2000), Li and Prabhala (2005), Berndt (1991). 26 Note that variables INDUSTRY, PE, and TIMEX were not used in this regression in order to avoid multicollinearity problem in second stage regressions.
20

FLOAT i = αo + β1 LNVMBO i + β2 DIVESTMENT i + β3 MBI i + β4 AVFTSE i + εi
Then, we use the parameters from the probit regression to estimate the probability that
a company will exit via flotation (i.e. IPO). The estimated probabilities (LAMBDA)
are then added as a correction variable to our second stage models for post exit
operating performance. The second stage models are estimated as pooled cross
sectional regressions across time by random-effects GLS method. This model is
useful for the analysis of the effects of an event based on data with cross-sectional and
time series aspects. The effect of changes pre/post event is normally established by
including a dummy variable for all but the earliest period (or year) in the sample
which represents the pre-event (base) period (year). 27
We, therefore, run two separate regressions for hypotheses 8 and 9: first for all buy-
outs and second for buy-outs exited via IPO:
Pit = αo + β1 POST it + β2 TIMEX it + β3 LNVEXIT it + β4 INDUSTRY it + β5
FLOAT it + β6 LAMBDA it + β7 REPUTATION it + εi
Pit = αo + β1 POST it + β2 TIMEX it + β3 LNVEXIT it + β4 INDUSTRY it + β5
REPUTATION it + εi
Where, performance measures (Pit = dependent variables) for output, efficiency,
employment, profitability, gearing, and dividends, respectively are: (i) sales in £,
normalized by sales in exit year (SALE), (ii) sales per employee ratio, normalized by
the ratio in exit year (SALEFF), (iii) number of employees, normalized by number of
employees in exit year (EMPL), (iv) profit divided by total assets (ROA), (v) long
term debt divided by total assets (GEAR1), and (vi) dividends divided by sales
(DIVSAL). The performance is a function of a pre/post dummy taking value equal to 1
for post exit years, and 0 otherwise (POST) and several explanatory/control variables.
27 The estimates are obtained using the routine XTREG from Stata Corporation that allows for robust standard errors.
21

The explanatory/control variables are a variable for buy-out value at exit, as a natural
logarithm of market value at exit (LNVEXIT), a variable for time to exit in number of
months (TIMEX), a dummy variable for exit type, taking value equal to 1 for flotation,
0 otherwise (FLOAT), selectivity correction factor, estimated from the probity
regression for choice of exit strategy, as the inverse Mills ratio (LAMBDA), a dummy
variable for manufacturing companies taking value equal to 1 for manufacturing
companies, and 0 otherwise (INDUSTRY), a dummy variable for more reputable
private equity firms’ taking value equal to 1 for top ten PE firms (REPUTATION), and
0 otherwise.
5. Results
5. 1 Determinants of longevity and exit strategies Table 5 reports results for determinants of buy-out longevity. The LNVMBO and PE
variables have the expected signs and are highly statistically significant. The results,
therefore, lend support to our hypotheses 1 and 2, and are consistent with the results
of our univariate analysis. We, however, find no evidence that reputation of PE firms
determines longevity of buy-outs.
Insert Table 5 about here The results for determinants of exit strategies are shown in Table 6. Regressions A
and D exhibit high goodness of fit (78 and 81 percent, respectively) and have a highly
significant Pasaran-Timmermann statistic. The variables DIVESTMENT, MBI, and
INDUSTRY are all positively associated with the likelihood of flotation, and are
highly statistically significant. LNVMBO and TIMEX are negatively associated with
the likelihood of flotation and are also highly statistically significant. Overall, the
results provide support for our hypothesis 5. The results are also consistent with the
results of our univariate analysis which also suggests statistically significant
differences between sample firms stratified by different exit strategies: non-floats tend
22
to exit later and, on average, tend to be larger firms than their counterparts which
opted for flotation.
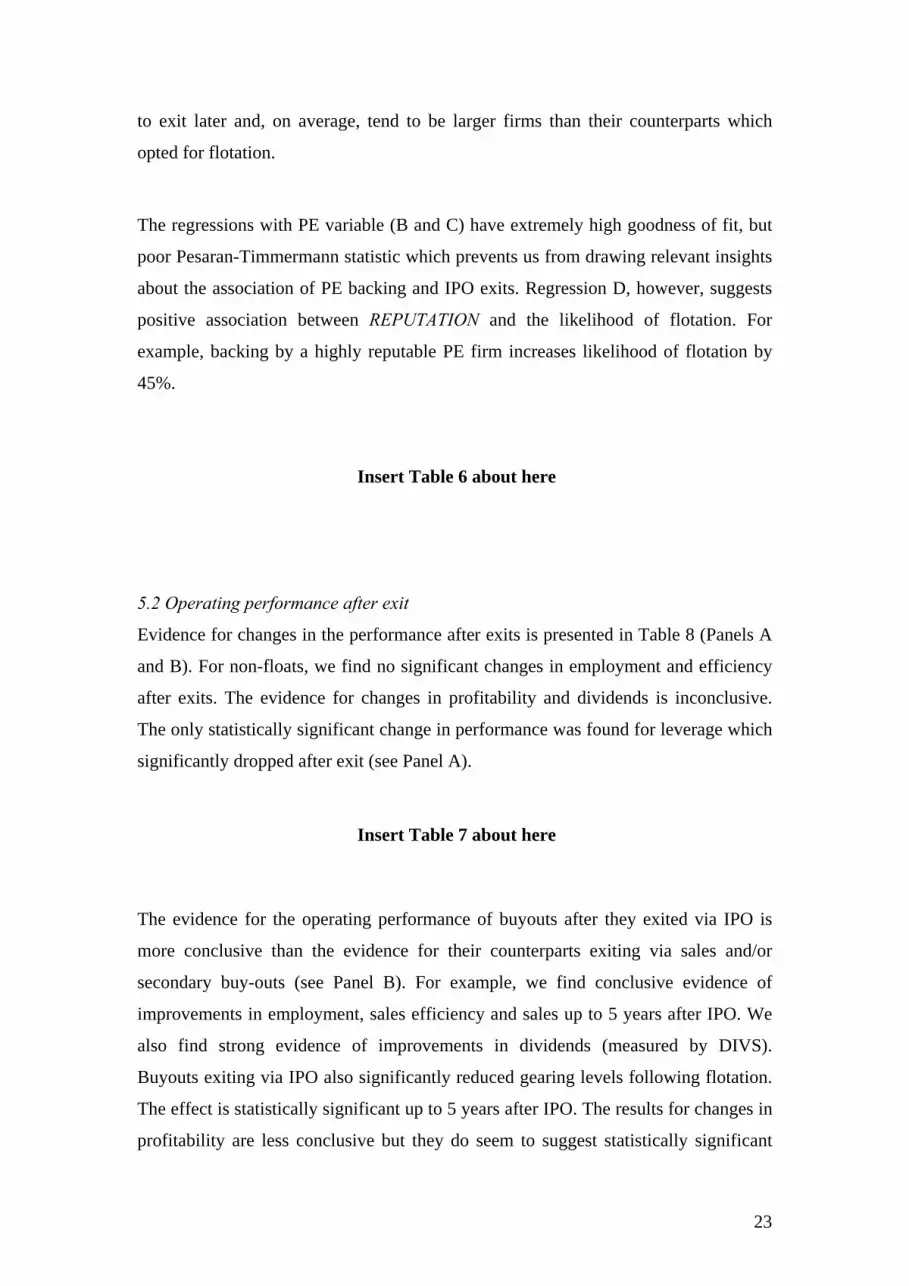
The regressions with PE variable (B and C) have extremely high goodness of fit, but
poor Pesaran-Timmermann statistic which prevents us from drawing relevant insights
about the association of PE backing and IPO exits. Regression D, however, suggests
positive association between REPUTATION and the likelihood of flotation. For
example, backing by a highly reputable PE firm increases likelihood of flotation by
45%.
Insert Table 6 about here
5.2 Operating performance after exit
Evidence for changes in the performance after exits is presented in Table 8 (Panels A
and B). For non-floats, we find no significant changes in employment and efficiency
after exits. The evidence for changes in profitability and dividends is inconclusive.
The only statistically significant change in performance was found for leverage which
significantly dropped after exit (see Panel A).
Insert Table 7 about here
The evidence for the operating performance of buyouts after they exited via IPO is
more conclusive than the evidence for their counterparts exiting via sales and/or
secondary buy-outs (see Panel B). For example, we find conclusive evidence of
improvements in employment, sales efficiency and sales up to 5 years after IPO. We
also find strong evidence of improvements in dividends (measured by DIVS).
Buyouts exiting via IPO also significantly reduced gearing levels following flotation.
The effect is statistically significant up to 5 years after IPO. The results for changes in
profitability are less conclusive but they do seem to suggest statistically significant
23
improvements in the year following IPO, based on the results of MW and one sample
proportion tests.
5.4 Multivariate analysis: determinants of post buy-out/exit operating performance
5.4.1 Determinants of post buy-out performance
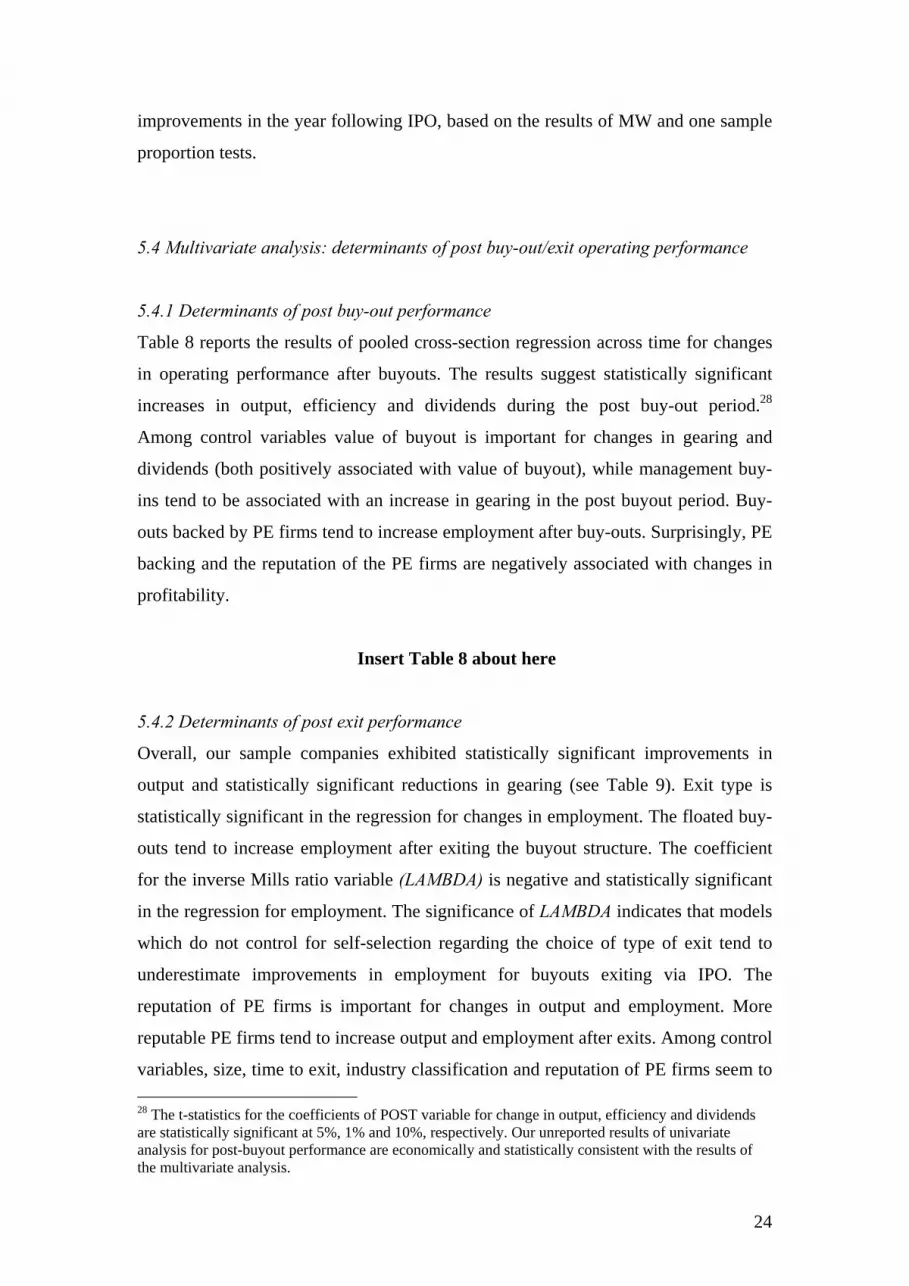
Table 8 reports the results of pooled cross-section regression across time for changes
in operating performance after buyouts. The results suggest statistically significant
increases in output, efficiency and dividends during the post buy-out period.28
Among control variables value of buyout is important for changes in gearing and
dividends (both positively associated with value of buyout), while management buy-
ins tend to be associated with an increase in gearing in the post buyout period. Buy-
outs backed by PE firms tend to increase employment after buy-outs. Surprisingly, PE
backing and the reputation of the PE firms are negatively associated with changes in
profitability.
Insert Table 8 about here
5.4.2 Determinants of post exit performance
Overall, our sample companies exhibited statistically significant improvements in
output and statistically significant reductions in gearing (see Table 9). Exit type is
statistically significant in the regression for changes in employment. The floated buy-
outs tend to increase employment after exiting the buyout structure. The coefficient
for the inverse Mills ratio variable (LAMBDA) is negative and statistically significant
in the regression for employment. The significance of LAMBDA indicates that models
which do not control for self-selection regarding the choice of type of exit tend to
underestimate improvements in employment for buyouts exiting via IPO. The
reputation of PE firms is important for changes in output and employment. More
reputable PE firms tend to increase output and employment after exits. Among control
variables, size, time to exit, industry classification and reputation of PE firms seem to 28 The t-statistics for the coefficients of POST variable for change in output, efficiency and dividends are statistically significant at 5%, 1% and 10%, respectively. Our unreported results of univariate analysis for post-buyout performance are economically and statistically consistent with the results of the multivariate analysis.
24

be the most important for changes in performance. For example, larger companies
tend to perform worse in terms of output, but better in terms of efficiency and
dividends. Manufacturing companies, on average, experience reduction in output after
exits.
Insert Table 9 about here
In a separate regression for post exit performance of buyouts exited via floatation, we
find a statistically significant increase in output, employment, profitability and
dividends, and a reduction in gearing. The results confirm the results of our univariate
analysis, except for changes in efficiency. Among control variables, size (LNVEXIT)
seems to be the most important determinant of changes in performance. Overall, the
sub-sample displays no evidence of statistically significant underperformance that is
often documented in the IPO literature. On contrary, the evidence suggests improved
performance during the post listing period. The results for changes in employment of
PE backed buyouts are particularly interesting and shed more light on the ongoing
debate about the role of PE firms in the UK (Johnson, 2007). The evidence on
changes in employment is consistent with early empirical evidence on changes in
employment following buy-outs (Kaplan, 1989; Smith, 1990) as well as more recent
evidence by CMBOR.29
29 The CMBOR data, as cited in Johnson (2007), reported a steady increase in employment from the second up to the fifth year after buy-outs.
25

5. Conclusion and further research
Using a hand-collected dataset of 1,333 buyouts, we examine buyout’s longevity, the
choice of investors/managers exit strategies, and buyouts’ operating performance. We
add to the literature by examining deal specific determinants of buyouts’ longevity
and exit strategies and by tracking the operating performance up to 13 years (3 pre
and 10 post buy-out years). We separately examine the determinants of the
performance changes after both buy-outs and exit transactions. Finally to the best of
our knowledge, this is the first study to control for sample selectivity bias with regard
to the choice of different exit strategies in examining post event operating
performance.
The average longevity of our sample buyouts is 46 months. The difference in time to
exit for IPO and non-IPO is not statistically significant. Buyouts exited via IPO are,
on average, smaller than sample buyouts exited via trade sales, secondary buy-outs or
receiverships. The results of multivariate analysis suggest that smaller buy-outs and
those backed by private equity tend to longer longevity than their larger and non-PE
backed counterparts. In our IPO sub-sample, however, PE backed buy-outs have
shorter longevity. Our probit regressions for determinants of exit strategies exhibit
high goodness of fit and levels of statistical significance, and show higher likelihood
of flotation for larger and those companies backed by highly reputable PE firms.
Backing by highly reputable PE firms, for example, increases the likelihood of
flotation by 45%.
The results of our pooled cross-sectional time series models suggest a statistically
significant increase in output, efficiency and dividends during the post buyout period.
Overall, our sample companies exhibited statistically significant improvements in
output and statistically significant reductions in gearing in the post-exit phase. Exit
type is statistically significant in the regression for changes in employment. The
floated buy-outs tend to increase employment after exiting the buyout structure. The
significance of our correction variable for self selection (LAMBDA) indicates that
models which do not control for self-selection regarding the choice of type of exit
tend to underestimate improvements in employment in the post-exit phase. More
26

reputable PE firms tend to increase employment in both post-buyout and post-exit
phases. Reputation of PE firms is also important for changes in output.
In a separate regression for post exit performance of buyouts exited via floatation, we
find statistically significant increases in output, employment, profitability and
dividends, and reductions in gearing. The results confirm the results of our univariate
analysis, except for changes in efficiency. Overall, the sub-sample displays no
evidence of statistically significant underperformance that is often documented in the
IPO literature. On the contrary, the evidence suggests improved performance during
the post listing period. The results for changes in employment of PE backed buyouts
are particularly interesting and shed more light on the ongoing debate about the role
of PE firms in UK. Based on the evidence presented, benefits for PE equity investors
do not seem to come at the expense of the employees. Finally, our result for the sub-
sample of IPO buy-outs contradict the long term IPO underperformance hypothesis
supported by US and UK data (Jain and Kini 1994; Khurshed et al. 2003).
Surprisingly, PE backing and the reputation of the PE firms are negatively associated
with changes in profitability measured by ROA. Data constraints have prevented us
from checking for the robustness of this result. Further research should use alternative
measures of profitability which are not affected by changes in gearing (e.g. operating
income). Fama and French (2000) provided strong evidence for mean reversion
properties of earnings together with cross-sectional variations in the tendency for
mean reversion. Control of mean reversion properties of earnings in smaller
companies experiencing exceptional before-even results could, therefore, be of
particular importance for further research in this area.
27

List of references
Barber, B.M. and J.D. Lyon, (1996), Detecting Abnormal Operating Performance:
The Empirical Power and Specification of Test Statistics, Journal of Financial
Economics. 41, 3.
Berndt, E.R. (1991), The Practice of Econometrics – Classic and Contemporary,
Addison Wesley, Massachusetts.
Boehmer, E. and A. Ljungqvist (2004), On the Decision to Go Public: Evidence from
Privately-held Firms, Deutsche Bundesbank Research Centre. Working Paper. Brau, J., B.Francis, and N. Kohers (2003), The Choice of IPO versus Takeover:
Empirical Evidence, The Journal of Business. 76, 4, 583-612.
Brav, A. and P.A. Gompers (1997), ‘Myth or Reality? The Long-Run
Underperformance of Initial Public Offerings: Evidence from Venture and
Nonventure Capital-backed Companies’, Journal of Finance. 52, 1791-1821.
BVCA - British Venture Capital Association, (2000), Private Equity – The New Asset
Class.
Cai, J., C.J.Wei, (1997), The Investment and Operating Performance of Japanese
Initial Public Offerings, Pacific-Basin Finance Journal. 5, 389-417.
Chemmanur, T. J., and P. Fulghieri, (1999), A theory of the going-public decision,
Review of Financial Studies. 12, 249-279.
CMBOR, (2006), Trends in UK Management Buy-outs, Quarterly Review, Centre for
Management Buy-out Research, Nottingham University, Autumn.
28

DeGeorge, F. and R. Zeckhauser (1993), The Reverse LBO Decision and Firm
Performance: Theory and Evidence, Journal of Finance, 48, 4, 1323-49.
Ellingsen, T. and K.Rydqvist, 1997, The Stock Market as a Screening Device and the
Decision to Go Public, Stockholm School of Economics – Working Paper.
Espenlaub, S., I. Garrett and W.P. Mun (1999), ‘Conflicts of Interest and the
Performance of Venture-Capital-Backed IPOs: A Preliminary Look at the UK’,
Venture Capital: An International Journal of Entrepreneurial Finance, 1, 325-350.
EVCA, (2001), EVCA-Yearbooks, European Venture Capital Association, Zaventem.
Fama, E.F. and French,K.R., (2000), Forecasting Profitability and Earnings, Journal
of Business. 73, 2, 161-175.
Financial Times – Fund Management Supplement, 12 May 2003.
Financial times, Private Equity Needs a New Image, Fund Management Supplement,
30th April 2007.
FSA, (2006), Private Equity: a Discussion of Risk and Regulatory Engagement,
Financial Services Authority, November.
Gompers, P.A., (1996), Grandstanding in the Venture Capital Industry’, Journal of
Financial Economics. 42, 133-156.
Greene, W.H. (2000), Econometric Analysis, 4th ed., Prentice Hall, New Jersey.
Gordon, M., Do We condemn or cheer the flight to private equity? Financial Times,
16th February 2007.
29
Heckman, J. (1979), Sample Selection Bias and a Specification Error, Econometrica,
47, 153-161.
Holthausen, D. and D. Larcker (1996), ‘The Financial Performance of Reverse
Leveraged Buy-outs’, Journal of Financial Economics, 42, 3, 293-332.
Jain, B.A. and O. Kini, (1994), The Post Issue Operating Performance of IPO firms,
Journal of Finance, 49.
Jelic, R., B.Saadouni, and M.Wright, (2005), Performance of Private to Public MBOs:
The Role of Venture Capital, Journal of Business Finance and Accounting, 32(3&4),
643-681.
Johnson, S., Buy-outs good for jobs, says study, Financial Times - Fund management
supplement, 26th February 2007.
Kaplan, S., (1991), The Staying Power of Leveraged Buyouts, Journal of Financial
Economics 29, 287-314.
Kaplan, S. (1989), The Effects of Management Buyouts on Operating Performance
and Value, Journal of Financial Economics. 24, 217-254.
Khurshed, A., S. Paleari, and S.Vismara, (2003), The Operating Performance of Initial
Public Offerings: The UK Experience, University of Manchester - Working paper.
KPMG, Management buy-outs commentary, various issues.
Koeplin, J., A.Sarin and A.Shapiro, (2000), The Private Company Discount, Journal
of Applied Corporate Finance. 12, 94-100.
30

Kutsuna, K., H. Okamura, and M. Cowling, (2002), Ownership Structure pre- and
post-IPOs and the Operating Performance of JASDAQ Companies, Pacific-Basin
Finance Journal, 10, 163-181.
Lerner, J. (1994), ‘Venture Capitalists and the Decision to Go Public’, Journal of
Financial Economics. 35, 293-316.
Levis, M., (2007), Private Equity Backed IPOs in UK, Cass Business School,
Working paper.
Lin, T.H. and R.L. Smith (1998), ‘Insider Reputation and Selling Decisions: The
Unwinding of Venture Capital Investments During Equity IPOs’, Journal of Corporate
Finance, 4, 241-263.
Li, K. and Prabhala, N.R., ‘Self-Selection Models in Corporate Finance’, Working
Paper (University of British Columbia and University of Maryland, 2005).
Lowry, M., (2003), Why Does IPO Volume Fluctuate So Mach? Journal of Financial
Economics. 1, 3-40.
Megginson, W. and K.Weiss (1991), Venture Capitalist Certification in Initial Public
Offerings, Journal of Finance. 46, 879-903.
Mikkelson, W.H., M.M. Partch, and K.Shah, (1997), Ownership and Operating
Performance of Companies that go Public, Journal of Financial Economics, 44, 281-
307.
Muscarella, C.J. and M.R. Vetsuypens, (1990), Efficiency and Organizational
Structure: A Study of Reverse LBOs. Journal of Finance 45, 1389-1414.
31

Nikoskelainen, E., M. Wright, and R. Ball, (2005), The Impact of Corporate
Governance Mechanisms on Value Increase in Leverage Buyouts, CMBOR –
Nottingham University working paper.
Opler, T.C., (1992), Operating Performance in Leveraged Buyouts: Evidence from
1985-1989, Financial Management, 21, 27-35.
Pagano, M., F.Panetta and L. Zingales, (1998), Why Do Companies Go Public? An
Empirical Analysis, Journal of Finance 53, 27-64.
Poulsen, A. and M. Stegemoller, (2005), Selling out to Public Firms vs. Initial Public
Offerings, University of Georgia – Working paper.
Ritter, J., (1984), The Hot Issue Market of 1980, Journal of Business. 57, 215-240.
Robbie, K., M. Wright, and B. Chiplin, (1992), Management Buy-outs: Availability
of Specialist Funds, CMBOR Report.
Sahlman, W.A. (1990), ‘The Structure and Governance of Venture-Capital
Organizations’, Journal of Financial Economics. 27, 473-521.
Smith, A.J., (1990), Corporate Ownership Structure and Performance: The Case of
Management Buyouts. Journal of Financial Economics 12, 15-29.
Stein, J., (1997), Internal Capital Markets and the Competition for Corporate
Resources, Journal of Finance. 52, 111-113.
Thompson, S. and M. Wright, (1995), Corporate Governance: The Role of
Restructuring Transactions, Economic Journal. 105. 690-703.
Thomson, S., K. Robbie and P.Wong, (1995), Management Buy-outs in the Short and
Long Term, Journal of Business Finance and Accounting. 22, 4, 461-482.
32
Wolf, M, Barbarians at the gates: the balance of pros and cons, Financial Times, 8th
March 2007.
Wright, M., (1986), The Make-Buy Decision and Managing Markets: The Case of
Management Buy-outs, Journal of Management Studies, 23, 4.
Wright, M., S. Thompson, K. Robbie, and P. Wong, (1995), Management Buy-Outs
in the Short and Long Term, Journal of Business Finance and Accounting, 22, 4, 461-
482.
Wright, M., N. Wilson, K. Robbie, and C. Ennew, (1996), An Analysis of Failure in
UK Buy-outs and Buy-ins, Managerial and Decision Economics, 17, 57-70.
Websites:
www.growthbusiness.co.uk
33
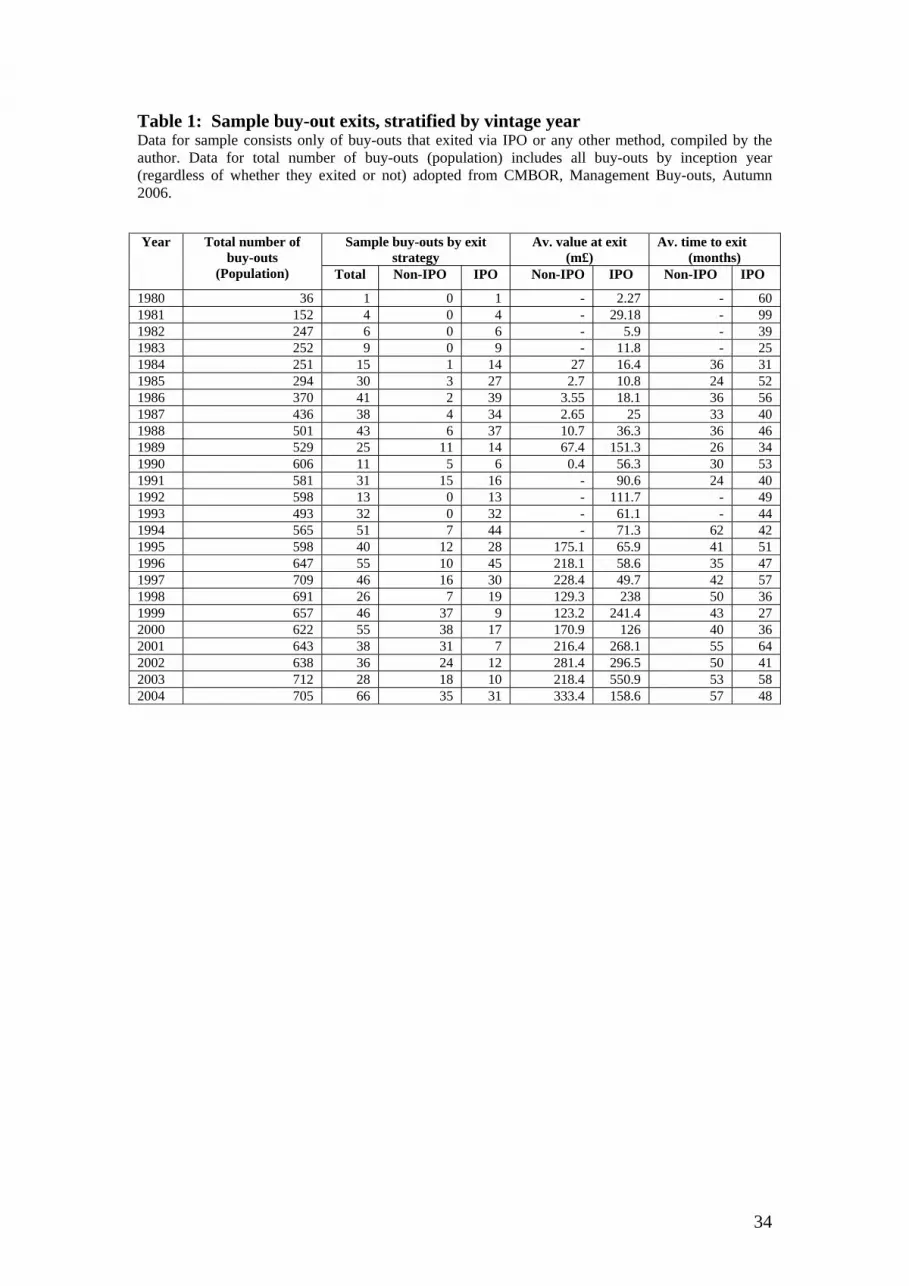
Table 1: Sample buy-out exits, stratified by vintage year Data for sample consists only of buy-outs that exited via IPO or any other method, compiled by the author. Data for total number of buy-outs (population) includes all buy-outs by inception year (regardless of whether they exited or not) adopted from CMBOR, Management Buy-outs, Autumn 2006.
Sample buy-outs by exit strategy
Av. value at exit (m£)
Av. time to exit (months)
Year Total number of buy-outs
(Population) Total Non-IPO IPO Non-IPO IPO Non-IPO IPO
1980 36 1 0 1 - 2.27 - 60 1981 152 4 0 4 - 29.18 - 99 1982 247 6 0 6 - 5.9 - 39 1983 252 9 0 9 - 11.8 - 25 1984 251 15 1 14 27 16.4 36 31 1985 294 30 3 27 2.7 10.8 24 52 1986 370 41 2 39 3.55 18.1 36 56 1987 436 38 4 34 2.65 25 33 40 1988 501 43 6 37 10.7 36.3 36 46 1989 529 25 11 14 67.4 151.3 26 34 1990 606 11 5 6 0.4 56.3 30 53 1991 581 31 15 16 - 90.6 24 40 1992 598 13 0 13 - 111.7 - 49 1993 493 32 0 32 - 61.1 - 44 1994 565 51 7 44 - 71.3 62 42 1995 598 40 12 28 175.1 65.9 41 51 1996 647 55 10 45 218.1 58.6 35 47 1997 709 46 16 30 228.4 49.7 42 57 1998 691 26 7 19 129.3 238 50 36 1999 657 46 37 9 123.2 241.4 43 27 2000 622 55 38 17 170.9 126 40 36 2001 643 38 31 7 216.4 268.1 55 64 2002 638 36 24 12 281.4 296.5 50 41 2003 712 28 18 10 218.4 550.9 53 58 2004 705 66 35 31 333.4 158.6 57 48
34

Table 2 Sample descriptive statistics The table presents descriptive statistics for sample MBOs, during 1980-2004, stratified by occurrence of exits and exit strategies. Floats are MBOs where investors/managers exited via flotations (IPOs). Other exits are MBOs where investors/managers exited via trade sales, secondary MBOs, or liquidations. Non-exits are MBOs that have not changed their status (as of 2004). P-values are reported for two sample T and Mann Whitney tests for differences in mean and median values, respectively.
Mean Median StDev Min Max No MBO value (£ mill)
Floats (510 sample firms) 120.00 16.80 295.50 0.10 2,140 92
Other exits (354 sample firms) 97.30 40.00 194.20 1.80 2,013 322
Non-exits (232 sample firms) 45.40 18.00 163.80 9.00 2,375 223 Floats vs. other exits P-value 0.488 0.000 Floats vs. non exits P-value 0.024 0.211 Other vs. non exits P-value 0.001 0.000
Time to exit (months)
Floats 45.72 36.00 36.78 1 246 499
Other exits 45.65 36.00 32.94 10 180 254 Floats vs. other exits P-value 0.981 0.542
Value on exit (£ mill)
Floats 47.43 22.55 80.68 1.25 890 384
Other exits 212.80 105.00 308.20 21.00 2,300 223 Floats vs. other exits P-value 0.000 0.000
35

Table 3 Buy-outs exited via IPO The table presents descriptive statistics for sample MBOs, during 1980-2004, where investors exited via flotation (IPO). Two sample T and Mann Whitney tests for differences in mean and median values for venture capital (PE) backed MBO and MBO not backed by PE firms.
Mean Median StDev Min Max No MBO value (£ mill)
PE backed 143.2 22.3 320.6 0.4 2,140 76
Non-PE backed 9.87 3.15 16.69 0.1 66.9 16 PE vs. non-PE backed P-value 0.001 0.000
Time to exit (months)
PE backed 39.02 31 28.67 1 246 307
Non-PE backed 56.43 47 44.98 1 225 192 PE vs. non-PE backed P-value 0.000 0.000
Value on exit (£ mill)
PE backed 67.48 38.8 98.75 1.6 890.00 225
Non-PE backed 19.05 10.77 23.87 1.25 185.0 159 PE vs. non-PE backed P-value 0.000 0.0154
36

Table 4 MBO exited via trade sales, secondary MBO and liquidations
The table presents descriptive statistics for sample MBOs, during 1980-2004, where investors/managers exited via trade sales, secondary MBOs, or liquidations. P-values are reported for 2 sample T and Mann Whitney tests for differences in mean and median values, respectively.
Mean Median StDev Min Max No MBO value (£ mill)
Trade sales (237 sample firms) 99.9 36.9 216.7 2.0 2,013 210
Sec. MBOs (88 sample firms) 95.8 49.1 143.7 1.8 700.0 84
Liquidations (29 sample firms) 78.7 22.0 150.3 2.0 667.0 26 Trade sale vs. S. MBOs P-value 0.851 0.405 Trade sale vs. Liquidations P-value 0.526 0.200 Sec. MBOs vs. Liquidations P-value 0.612 0.122
Time to exit (months)
Trade sales 42.1 36 31 10 180 165
Sec. MBOs 53.7 48 36.07 12 168 83 Trade sale vs. S.MBOs P-value 0.014 0.004
Value on exit (£ mill)
Trade sales 195.2 90.0 288.6 21.0 2,300 141
Sec. MBOs 242.9 121.3 343.1 28.0 2,013 80 Trade sale vs. S. MBOs P-value 0.295 0.036
37

Figure 1: Time frame for analysis of operating performance
Pre MBO
Comparison
Post MBO period
y-3 y-2 y-1 MBO y1 y2 y3 y4 y5 y6 y7 y8 y9 y10
Pre exit Post exit
Comparison
38
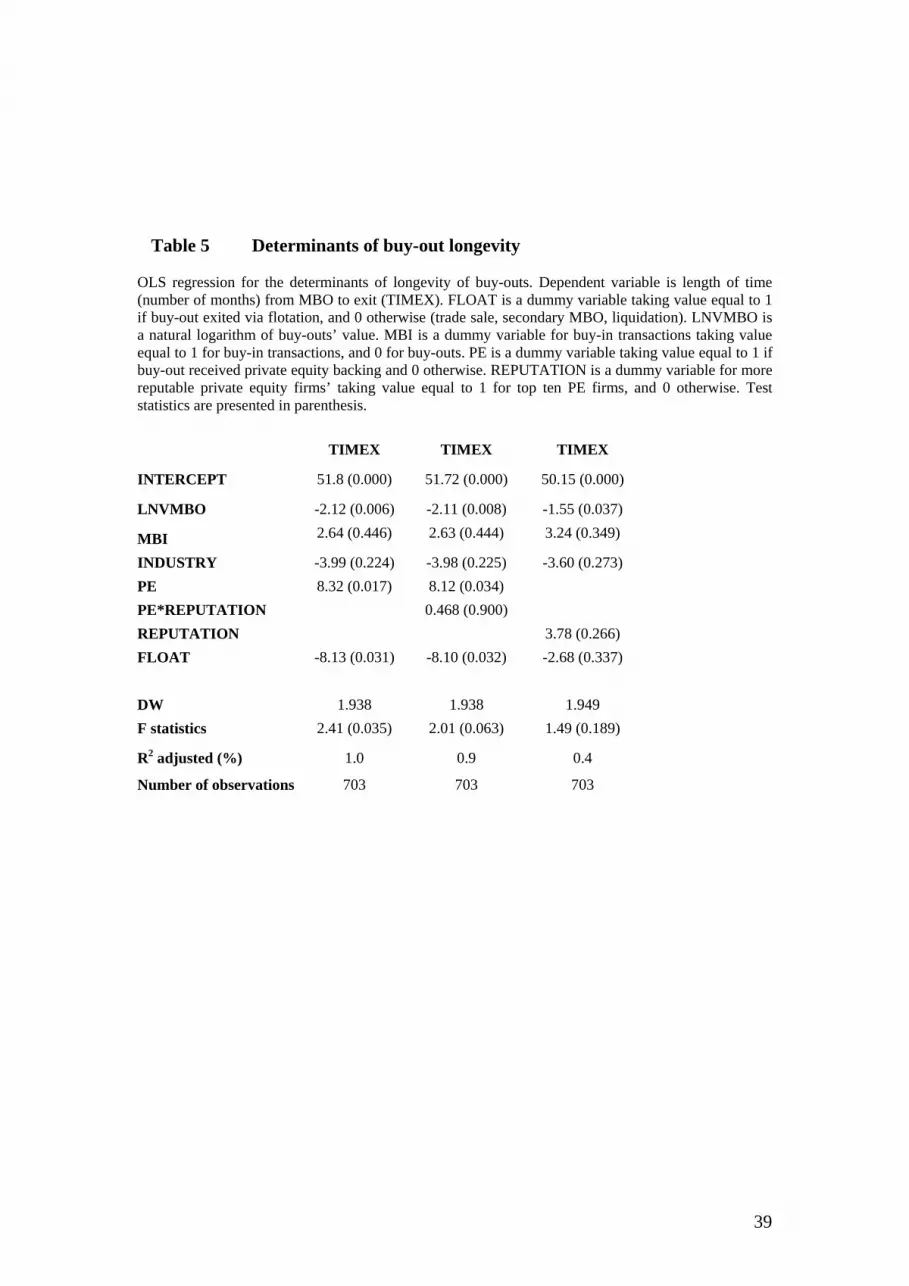
Table 5 Determinants of buy-out longevity OLS regression for the determinants of longevity of buy-outs. Dependent variable is length of time (number of months) from MBO to exit (TIMEX). FLOAT is a dummy variable taking value equal to 1 if buy-out exited via flotation, and 0 otherwise (trade sale, secondary MBO, liquidation). LNVMBO is a natural logarithm of buy-outs’ value. MBI is a dummy variable for buy-in transactions taking value equal to 1 for buy-in transactions, and 0 for buy-outs. PE is a dummy variable taking value equal to 1 if buy-out received private equity backing and 0 otherwise. REPUTATION is a dummy variable for more reputable private equity firms’ taking value equal to 1 for top ten PE firms, and 0 otherwise. Test statistics are presented in parenthesis.
TIMEX TIMEX TIMEX
INTERCEPT 51.8 (0.000) 51.72 (0.000) 50.15 (0.000)
LNVMBO -2.12 (0.006) -2.11 (0.008) -1.55 (0.037)
MBI 2.64 (0.446) 2.63 (0.444) 3.24 (0.349)
INDUSTRY -3.99 (0.224) -3.98 (0.225) -3.60 (0.273) PE 8.32 (0.017) 8.12 (0.034) PE*REPUTATION 0.468 (0.900) REPUTATION 3.78 (0.266) FLOAT -8.13 (0.031) -8.10 (0.032) -2.68 (0.337) DW 1.938 1.938 1.949 F statistics 2.41 (0.035) 2.01 (0.063) 1.49 (0.189)
R2 adjusted (%) 1.0 0.9 0.4
Number of observations 703 703 703
39

40

Table 6 Probit maximum likelihood estimation for the choice of exit strategy Probit regression for the determinants of exit strategy. Dependent variable is a dummy variable taking value equal to 1 if buy-out exited via flotation, and 0 otherwise (trade sale, secondary MBO, liquidation) (FLOAT). The choice of floatation is a function of the following explanatory/control variables: a variable for buy-out value, as natural logarithm buy-out value (LNVMBO), a dummy variable for source of buy-out transaction taking value equal to 1 for domestic and foreign divestments, and zero otherwise (privatizations, entire company (including family owned) going private, secondary buy-outs, and receivership) (DIVESTMENT), a dummy variable for buy-in transactions taking value equal to 1 for buy-in transactions, and 0 for buy-outs (MBI), average growth rate for FTSE All Shares Market Index during the exit year and the year preceding the exit (AVFTSE), a dummy variable for manufacturing companies taking value equal to 1 for companies from engineering, hi-tech, IT, chemicals, textiles, paper and wood, and plastic, and 0 otherwise (INDUSTRY), a variable for lengths of time, as number of months, before exits (TIMEX); PE is a dummy variable taking value equal to 1 if buy-out received private equity backing, and 0 otherwise. REPUTATION is a dummy variable for more reputable private equity firms’ taking value equal to 1 for top ten PE firms, and 0 otherwise. All parameters are estimated using Probit Maximum Likelihood Estimation. The estimation method converged after 6 iterations in models A, D and E; after 8 iterations in models B and C. Test statistics are presented in parenthesis. Regression E is used for estimation of probabilities (inverse Mills ratio) for our pooled cross-sectional time-series regression. A: FLOAT B: FLOAT C: FLOAT D: FLOAT E: FLOAT
LNVMBO -0.315 (0.000) -0.489 (0.000) -0.510 (0.000) -0.301 (0.000) -0.299 (0.000)
DIVESTMENT 1.323 (0.000) 1.111 (0.000) 1.164 (0.000) 1.230 (0.000) 1.349 (0.000)
MBI 0.443 (0.004) 0.049 (0.815) 0.030 (0.887) 0.418 (0.009) 0.379 (0.014) AVFTSE 0.242 (0.306) -0.174 (0.580) -0.215 (0.503) 0.206 (0.395) 0.304 (0.185) INDUSTRY 0.696 (0.000) 0.582 (0.008) 0.563 (0.012) 0.706 (0.000) TIMEX -0.006 (0.002) -0.007 (0.004) -0.008 (0.003) -0.006 (0.003) PE 2.530 (0.000) 2.829 (0.000) REPUTATION
-0.713 (0.008) 1.172 (0.000)INTERCEPT 0.495 (0.143) 0.668 (0.131) 0.765 (0.092) 0.377 (0.273) 0.226 (0.450)
Marginal effects factor 0.390 0.379 0.379 0.386 0.391Goodness of fit 0.782 0.905 0.900 0.807 0.780
Pseudo R2 (%) 30.1 62.68 63.46 34.51 27.0%
Pesaran-Timmermann statistic -4.411 (0.000) -0.964 (0.335) -0.921 (0.357) -3.798 (0.000) -4.612 (0.000)
Number of observations 703 703 703 703 703
41

Table 7 Panel A: Changes in Performance after exit (non-floats) The table presents mean and median values for the measures of operating performance relative to exit year. Statistical significance of mean and median of the operating performance measures in post-exit years (+1 to +5) and the average performance measure during the three year period prior to exit, tested using two sample T-test (for the differences in mean; assuming unequal variance) and Mann Whitney test (for the differences in median). One sample proportion test was used to analyze whether the proportion of firms with increasing performance in post exit years is likely to be equal to 50 percent. > indicates an increase in average (mean and median) performance or higher proportion of MBOs with increase in performance; < indicates a decrease in average (mean and median) performance or higher proportion of MBOs with decrease in performance. Firms included only if they have at least one observation before/after exit (i.e. minimum of three year data). Employment (EMPLOY) =total number of employees, normalized to unity in the year of exit (year 0). Return on sales (ROS) = net profit after tax divided by sales. Return on assets (ROA) =net profit after tax divided by total assets. Return on equity (ROE) = net profit after tax divided by total equity. Sales efficiency (SALEFF) = sales divided by number of employees, normalized to unity in the year of exit (year 0). Sales (SALES) = sales normalized to unity in the year of exit (year 0). Long term debt ratio (GEAR1) = long term debt divided by total assets. Total liabilities ratio (GEAR2) = total liabilities divided by total assets. Dividends to assets (DIVA) = cash dividends divided by total assets. Dividends to sales (DIVS) = cash dividends divided by sales.
Pre EXIT Post EXIT N Year-3 Year-2 Year-1 Year+1 Year +2 Year +3 Year+4 Year+5
EMPLOY Total
31 Mean 1.111902 1.068114 1.052908 0.960437 0.935736
0.897597 1.32192 0.614682 Median 1.020952 0.997664 1 1.002366 1 1.106308 1.156627 0.614682
Change; T-stat; P-value Mean = 1.082 <0.096 <0.142 <0.258 >0.323 <0.587 Change; MW-statistic; P-value Median = 1.0211 <0.4815 <0.5356 >0.8147 >0.2168 <0.7342 Prop: After > Before; p=50% (P-value) <1.000 <0.839 >0.607 >0.375 <1.000Trade sales 22 Mean 1.118222 1.06596 1.052419 0.960855 0.935436 0.900029 1.393621 0.614682 Median
1.003184 0.995283 0.991745 1.004505 0.986012
1.146006 1.369163 0.614682 Change; T-stat; P-value Mean =1.090 <0.203 <0.234 <0.351 >0.327 <0.583 Change; MW-statistic; P-value Median = 1.0211 <0.6149 <0.5500 >0.6340 >0.2506 <0.7025 Prop: After > Before; p=50% (P-value) >1.000 <1.000 >0.549 >0.125 <1.000Sec. MBO 9 Mean 1.089352 1.070048 1.045737 0.954491 0.936374 0.890909 1.035112 n.a. Median
1.006936 1.005685 1.007344 0.975467 1.027453
1.080542 1.035112 n.a. Change; T-stat; P-value Mean = 1.059 <0.281 <0.460 <0.614 n.a. n.a. Change; MW-statistic; P-value Median = 0.9975 <0.5365 >0.8852 >0.5892 n.a. n.a. Prop: After > Before; p=50% (P-value) <1.000 <0.727 <1.000 n.a. n.a.
42

Pre EXIT Post EXIT N Year-3 Year-2 Year-1 Year+1 Year +2 Year +3 Year+4 Year+5
ROA Total
41 Mean 0.090566 0.078429 0.091 0.081221 0.021809 -0.06701 0.07828 0.022742 Median 0.07243 0.086409 0.080866 0.056028 0.043625
0.065545 0.03994 0.022742
Change: Mean (T-stat; P-value) Mean = 0.072 >0.881 <0.711 <0.460 >0.885 <0.165 Change: Median (MW-statistic; P-value) Median = 0.0790 <0.5222 <0.8370 <0.4661 <0.5785 <0.8400 Prop: After > Before; p=50 % (P-value) >0.755 <0.860 <1.000 >1.000 >1.000Trade sales 28 Mean 0.074009 0.066269 0.085849 0.066488 -0.07642 -0.15387 0.075926 0.022742 Median
0.067462 0.086409 0.074319 0.054824 0.026508
0.054846 0.035007 0.022742 Change: Mean (T-stat; P-value) Mean = 0.062 >0.958 <0.458 <0.448 >0.812 <0.404 Change: Median (MW-stat; P-value) Median = 0.0802 <0.6641 <0.7619 <0.6216 <0.6034 <0.8353 Prop: After > Before; p=50 % (P-value) <1.000 <0.832 <0.791 <1.000 >0.500Sec. MBO 13 Mean 0.126991 0.104774 0.102096 0.112955 0.23792 0.106706 0.08299 0.112955 Median
0.15552 0.091813 0.104449 0.074159 0.097326
0.067266 0.084796 0.074159 Change: Mean (T-stat; P-value) Mean = 0.094 >0.728 >0.335 >0.833 <0.842 n.a. Change: Median (MW-stat; P-value) Median = 0.0657 >0.6081 >0.4757 >0.8121 >0.8930 n.a. Prop: After > Before; p=50% (P-value) >0.581 <1.000 >1.000 >1.000 n.a.
33 ROS Total
Mean 0.381297 0.212627 0.245696 0.722329 0.248542 0.063189 0.263609 0.692308 Median 0.073304 0.074706 0.083657 0.101449 0.11377 0.105059 0.233608 0.692308
Change: Mean (T-stat; P-value) Mean = 0.253 >0.356 <0.986 <0.368 >0.960 n.a. Change: Median (MW-statistic; P-value) Median = 0.0762 >0.1865 >0.1671 >0.6621 >0.0343 n.a. Prop: After > Before; p=50 % (P-value) >0.487 >0.845 <0.804 >0.375 n.a.Trade sales 24 Mean 0.381297 0.212627 0.245696 0.722329 0.248542 0.063189 0.263609 0.692308 Median
0.073304 0.074706 0.083657 0.101449 0.11377 0.105059 0.233608 0.692308 Change: Mean (T-stat; P-value) Mean = 0.338 >0.892 <0.925 <0.348 <0.885 n.a. Change: Median (MW-stat; P-value) Median = 0.0762 >0.3122 >0.2994 >0.7152 >0.0441 n.a. Prop: After > Before; p=50 % (P-value) >0.678 >0.815 <0.774 >0.625 n.a.Sec. MBO 9 Mean 0.083511 0.082769 0.049663 1.621232 0.117345 0.088345 0.142159 n.a. Median
0.131068 0.103099 0.083657 0.120843 0.11377 0.128793 0.142159 n.a. Change: Mean (T-stat; P-value) Mean = 0.045 >0.339 >0.228 >0.561 n.a. n.a. Change: Median (MW-stat; P-value) Median = 0.050 >0.4799 >0.3606 >1.0000 n.a. n.a. Prop: After > Before; p=50% (P-value) >1.000 <1.000 <1.000 n.a. n.a.
43

Pre EXIT
Post EXIT N Year-3 Year-2 Year-1 Year+1 Year +2 Year +3 Year+4 Year+5
GEAR1 Total
23 Mean 0.44452 0.37095 0.42428 0.84774 0.27657 0.21056 0.07675 0.07497 Median 0.48387 0.24598 0.34346 0.31257 0.26736 0.24604 0.07298 0.07497
Change: Mean (T-stat; P-value) Mean = 0.378 >0.348 <0..330 <0.119 <0.001 <0.001 Change: Median (MW-statistic; P-value) Median = 0.3274 <0.9186 <0.3183 <0.2947 <.1423 <0.3945 Prop: After > Before; p=50 % (P-value) >1.000 <0.481 <0.180 <1.000 >0.500Trade sales 17 Mean 0.39365 0.4273 0.41888 0.94638 0.25091 0.17199 0.10186 0.07497 Median
0.26455 0.36902 0.32201 0.24211 0.26736 0.24604 0.0851 0.07497 Change: Mean (T-stat; P-value) Mean = 0.365 >0.374 <0.363 <0.079 <0.016 <0.008 Change: Median (MW-stat; P-value) Median = 0.2807 <0.9177 <0.4265 <0.4848 <0.5254 <0.550 Prop: After > Before; p=50 % (P-value) >1.000 <0.791 <0.453 >1.000 >0.500Sec. MBO 6 Mean 0.58442 0.21318 0.4387 0.51237 0.36 0.34553 0.00141 n.a Median
0.66038 0.08663 0.49525 0.63388 0.3786 0.34553 0.00141 n.a Change: Mean (T-stat; P-value) Mean = 0.415 >0.555 <0.795 <0.880 n.a. n.a. Change: Median (MW-stat; P-value) Median = 0.3877 >0.6481 <0.7491 <0.6171 n.a. n.a. Prop: After > Before; p=50% (P-value) <1.000 <0.625
<0.500 n.a. n.a.
GEAR2 Total
32 Mean 0.3506 0.34981 0.35969 0.64176 0.25703 0.18917 0.11115 0.06697 Median 0.24081 0.20244 0.17844 0.11044 0.11769 0.18868 0.1115 0.06697
Change: Mean (T-stat; P-value) Mean = 0.370 >0.435 <0.239 <0.058 <0.003 n.a. Change: Median (MW-statistic; P-value) Median = 02353 <0.1592 <0.1598 <0.2574 <0.5186 n.a. Prop: After > Before; p=50 % (P-value) <0.020 <0.035 <0.065 <0.125 n.a.Trade sales 22 Mean 0.35105 0.34768 0.35521 0.77975 0.25778 0.16774 0.14266 0.06697 Median
0.25972 0.28454 0.22228 0.11044 0.11769 0.21161 0.15516 0.06697 Change: Mean (T-stat; P-value) Mean = 0.368 >0.415 <0.345 <0.038 <0.023 n.a. Change: Median (MW-stat; P-value) Median = 0.2353 <0.5186 <0.3285 <0.3133 <0.5305 n.a. Prop: After > Before; p=50 % (P-value) <0.134 <0.332 <0.289 <0.250 n.a.Sec. MBO 10 Mean 0.37182 0.36068 0.39361 0.37468 0.25492 0.24633 0.01663 n.a. Median
0.20077 0.15328 0.25391 0.1946 0.10111 0.01227 0.01663 n.a. Change: Mean (T-stat; P-value) Mean = 0.402 <0.886 <0.441 <0.603 <0.3719 n.a. Change: Median (MW-stat; P-value) Median = 0.2495 <0.5660 <0.2159 <0.1956 n.a. n.a. Prop: After > Before; p=50% (P-value) <0.180 <0.031 <0.250 n.a. n.a.
44

Pre EXIT
Post EXIT N Year-3 Year-2 Year-1 Year+1 Year +2 Year +3 Year+4 Year+5
DIVS Total
21 Mean 0.73226 0.32924 0.50029 0.57402 0.56805 0.28089 0.11404 4.79835 Median 0.04402 0.04519 0.09997 0.1068 0.08321 0.04257 0.08255 0.15913
Change: Mean (T-stat; P-value) Mean = 0.40 >0.741 <0.745 <0.368 >0.416 n.a. Change: Median (MW-statistic; P-value) Median = 0.0564 >0.1590 <0.3521 >0.6783 >0.0954 n.a. Prop: After > Before; p=50 % (P-value) >0.383 <0.210 <0.727 >1.000 n.a.Trade sales 15 Mean 1.03118 0.47634 0.7308 0.79704 0.77556 0.37601 0.11393 6.36253 Median
0.02722 0.03099 0.10662 0.1068 0.08321 0.03458 0.07551 0.21247 Change: Mean (T-stat; P-value) Mean = 0.52 <0.396 <0.785 <0.367 >0.447 n.a. Change: Median (MW-stat; P-value) Median =0.067 >0.3109 <0.1572 >0.9304 >0.1235 n.a. Prop: After > Before; p=50 % (P-value) >1.000 <0.065 <1.000 <1.000 n.a.Sec. MBO 6 Mean 0.23012 0.05309 0.09148 0.18065 0.10236 0.09064 0.11423 0.10579 Median
0.08105 0.04908 0.05981 0.20056 0.07206 0.06884 0.08959 0.10579 Change: Mean (T-stat; P-value) Mean = 0.112 <0.895 <0.758 >0.975 n.a. n.a. Change: Median (MW-stat; P-value) Median =0.0415 >0.4034 >0.5309 >0.7656 n.a. n.a. Prop: After > Before; p=50% (P-value) >0.375 <1.000
>1.000 n.a. n.a.
DIVA Total
21 Mean 0.15896 0.13634 0.21503 0.23516 0.16283 0.13748 0.13067 0.00899 Median 0.03956 0.04407 0.0929 0.13161 0.05972 0.09927 0.08246 0.00899
Change: Mean (T-stat; P-value) Mean = 0.168 >0.378 <0.955 <0.682 <0.680 n.a. Change: Median (MW-statistic; P-value) Median = 0.0914 >0.2442 <0.3905 >0.6270 <0.9704 n.a. Prop: After > Before; p=50 % (P-value) >0.664 <0.143 <1.000 <1.000 <1.000Trade sales 16 Mean 0.06118 0.16681 0.24646 0.27001 0.19515 0.11637 0.13878 0.00899 Median
0.03956 0.04407 0.13594 0.18856 0.04761 0.06921 0.05857 0.00899 Change: Mean (T-stat; P-value) Mean = 0.167 >0.271 >0.824 >0.553 <0.822 n.a. Change: Median (MW-stat; P-value) Median = 0.0962 >0.2891 <0.2949 <0.4423 <0.6956 n.a. Prop: After > Before; p=50 % (P-value) <1.000 <.039 <1.000 <1.000 n.a.Sec. MBO 5 Mean 0.40339 0.06016 0.1396 0.13755 0.10464 0.18674 0.10634 n.a. Median
0.12747 0.03779 0.07467 0.11547 0.07183 0.13732 0.10634 n.a. Change: Mean (T-stat; P-value) Mean = 0.171 <0.805 <0.614 >0.931 n.a. n.a. Change: Median (MW-stat; P-value) Median = 0.0384 >0.6761 >1.000 >1.000 n.a. n.a. Prop: After > Before; p=50% (P-value) >0.375 >1.000 >1.000 n.a. n.a.
45

Pre Exit Post Exit N Year-3 Year-2 Year-1 Year+1 Year +2 Year +3 Year+4 Year+5
SALEFF Total
30 Mean 0.975827 1.038195 1.008403 1.048161 2.268878 2.663928 0.781106 n.a Median 0.923823 0.963963 0.971168 1.021718 1.059787 1.100572 0.795217 n.a
Change: Mean (T-stat; P-value) Mean = 1.004 >0.619 >0.238 >0.250 <0.433 n.a. Change: Median (MW-statistic; P-value) Median = 0.9606 >0.4305 >0.1195 >0.1291 <0.5862 n.a. Prop: After > Before; p=50 % (P-value) >0.720 <1.000 >0.791 <1.000 n.a.Trade sales 21 Mean 0.975827 1.038195 1.008403 1.048161 2.268878 2.663928 0.781106 n.a Median 0.923823 0.963963 0.971168 1.021718 1.059787 1.100572 0.795217 n.a Change: Mean (T-stat; P-value) Mean = 1.003 >0.692 >0.216 >0.361 <0.350 n.a. Change: Median (MW-stat; P-value) Median = 0.9425 >0.4297 >0.2337 >0.2863 <0.1949 n.a. Prop: After > Before; p=50 % (P-value) >0.832 <0.804 <1.000 <0.625 n.a.Sec. MBO 9 Mean 0.975827 1.038195 1.008403 1.048161 2.268878 2.663928 0.781106 n.a Median
0.923823 0.963963 0.971168 1.021718 1.059787 1.100572 0.795217 n.a Change: Mean (T-stat; P-value) Mean = 1.008 >0.709 >0.350 >0.388 n.a. n.a. Change: Median (MW-stat; P-value) Median = 1.0308 >0.9296 >0.7363 >0.5892 n.a. n.a. Prop: After > Before; p=50% (P-value) >1.000 >0.727 >0.625 n.a. n.a. SALES Total
29 Mean 1.500697 1.854441 1.055443 1.116465 0.979075 0.94735 0.848181 1.170292 Median 0.920408 1.047789 1.032672 1.053526 1.106113 1.078157 0.689688 0.818575
Change: Mean (T-stat; P-value) Mean =1.77 <0.315 <0.227 <0.215 <0.187 <0.457 Change: Median (MW-statistic; P-value) Median =0.9987 >0.5237 >0.5237 >0.4843 <0.0380 <0.6973 Prop: After > Before; p=50 % (P-value) >0.711 >0.076 >0.804 <1.000 <1.000Trade sales 22 Mean 1.622955 2.137831 1.036768 1.162406 0.942002 0.872826 0.806686 1.170292 Median 0.833457 1.024653 1.029918 1.067715 1.140072 0.743567 0.641462 0.818575 Change: Mean (T-stat; P-value) Mean = 1.97 <0.349 <0.238 <0.213 0.200 <0.415 Change: Median (MW-stat; P-value) Median = 0.948 >0.2359 >0.3399 <0.2563 <0.0348 <0.7788 Prop: After > Before; p=50 % (P-value) >0.134 >0.064 <1.000 <1.000 <1.000Sec. MBO 7 Mean 1.19505 1.166206 1.111467 0.97208 1.079703 1.170923 1.221638 n.a. Median 1.138497 1.070925 1.108602 1.040886 1.094249 1.18085 1.221638 n.a. Change: Mean (T-stat; P-value) Mean = 1.148 <0.082 <0.552 >0.802 n.a. n.a. Change: Median (MW-stat; P-value) Median = 1.1715 <0.2013 <0.7983 >0.7768 n.a. n.a. Prop: After > Before; p=50% (P-value) <0.125 >1.000 >0.625 n.a. n.a.
46

Panel B: Changes in performance after exit (IPO)
The table presents mean and median values for the measures of operating performance relative to exit year. Statistical significance of mean and median of the operating performance measures in post-exit years (+1 to +5) and the average performance measure during the three year period prior to exit, tested using two sample T-test (for the differences in mean; assuming unequal variance) and Mann Whitney test (for the differences in median). One sample proportion test was used to analyze whether the proportion of firms with increasing performance in post exit years is likely to be equal to 50 percent. > indicates an increase in average (mean and median) performance or higher proportion of MBO with increase in performance; < indicates a decrease in average (mean and median) performance or higher proportion of MBO with decrease in performance. Firms included only if they have at least one observation before/after exit (i.e. minimum of three year data). Employment (EMPLOY) =total number of employees, normalized to unity in the year of exit (year 0). Return on sales (ROS) = net profit after tax divided by sales. Return on assets (ROA) =net profit after tax divided by total assets. Return on equity (ROE) = net profit after tax divided by total equity. Sales efficiency (SALEFF) = sales divided by number of employees, normalized to unity in the year of exit (year 0). Sales (SALES) = sales normalized to unity in the year of exit (year 0). Long term debt ratio (GEAR1) = long term debt divided by total assets. Total liabilities ratio (GEAR2) = total liabilities divided by total assets. Dividends to assets (DIVA) = cash dividends divided by total assets. Dividends to sales (DIVS) = cash dividends divided by sales.
Pre EXIT Post EXIT N Year-3 Year-2 Year-1 Year+1 Year +2 Year +3 Year+4 Year+5
EMPLOY Total floats
32 Mean 1.28113 0.898487 0.948176 1.195908
1.854461 2.837556 1.189334 1.22718 Median 1.084211 1.172392
1.202105 1.197895 1.242105
Change; T-stat; P-value Mean = 0.957545 >0.011 >0.072 >0.133 >0.021 >0.261 Change; MW-statistic; P-value Median = 0.935647 >0.0001 >0.0000 >0.0014 >0.0072 >0.1184 Prop: After > Before; p=50% (P-value) >0.001 >0.000 >0.012 >0.063 >1.000
47

Pre EXIT Post EXIT N Year-3 Year-2 Year-1 Year+1 Year +2 Year +3 Year+4 Year+5
ROA Total floats
44 Mean 0.045194 0.049146 0.084699 0.106939
0.073792 0.060158 0.029524 0.167235 Median 0.035581 0.051811 0.084843 0.098871 0.089258 0.075345 0.078109 0.082429
Change: Mean (T-stat; P-value) Mean = 0.067932 >0.063 >0.752 <0.716 <0.404 >0.338 Change: Median (MW-statistic; P-value) Median = 0.063809 >0.0124 >0.2119 >0.4922 >0.4787 >0.6046 Prop: After > Before; p=50 % (P-value) >0.000 >0.000 >0.001 >0.001 >0.000 ROS Total floats
56 Mean 0.038123 0.14903 0.055563 0.662506
0.830486 3.355494 1.675717 0.060981 Median 0.031854 0.032596 0.049342 0.070155 0.055207 0.059622 0.059552 0.050332
Change: Mean (T-stat; P-value) <0.339 <0.350 >0.184 >0.347 <0.537 Change: Median (MW-statistic; P-value) >0.0107 >0.1603
>0.1511
>0.2914
>0.3744
Prop: After > Before; p=50 % (P-value) >0.000 >0.000 >0.000 >0.000 >0.000
48

Pre EXIT
Post EXIT N Year-3 Year-2 Year-1 Year+1 Year +2 Year +3 Year+4 Year+5
GEAR1 Total floats
56 Mean 0.24012 0.32598 0.30615 0.12297
0.130334 0.108174 0.11182 0.135143 Median 0.06568 0.15699 0.20517 0.05603 0.10190 0.08277 0.095017 0.084135
Change: Mean (T-stat; P-value) Mean = 0.314068 <0.000 <0.000 <0.000 <0.000 <0.001 Change: Median (MW-statistic; P-value) Median = 0.200715 <0.0002 <0.0013 <0.0005 <0.0018 <0.0328 Prop: After > Before; p=50 % (P-value) <0.000 <0.000 <0.000 <0.000 <0.115 54 GEAR2 Total floats
Mean 0.73342 0.92737 0.79125 0.50897
0.35178 0.285337 0.286276 0.57283 Median 0.69396 0.79717 0.73366 0.47948 0.435351 0 0 0.55198
Change: Mean (T-stat; P-value) Mean = 0.820042 <0.000 <0.000 <0.000 <0.000 <0.206 Change: Median (MW-statistic; P-value) Median = 0.749792 <0.000 <0.000 <0.000 <0.000 <0.0029 Prop: After > Before; p=50 % (P-value) <0.000 <0.003 <0.000 <0.001 <0.115
Pre EXIT
Post EXIT N Year-3 Year-2 Year-1 Year+1 Year +2 Year +3 Year+4 Year+5
DIVS
Total floats 144 Mean 0.01291
40.02546
20.01219
2 0.160547
0
0.190384 0.262424 0.294648 0.019144
Median 00.00143
4 0.023515 0.019615 0.021615 0.020887 0.015447 Change: Mean (T-stat; P-value) Mean = 0.018268 >0.278 >0.297
>0.301
>0.316
>0.903
Change: Median (MW-statistic; P-value) Median = 0.002157 >0.0000 >0.0000
>0.0000
>0.0000 >0.0000 Prop: After > Before; p=50 % (P-value) >0.000
>0.000 >0.000 >0.010 0.022
DIVA
Total floats 58 Mean 0.02538
60.03079
70.02613
2 0.035445
0.021324 0.02159 0.017833 0.043691
Median0.01797
90.00645
90.01700
5 0.032844 0.016487 0.008035 0 0.018881 Change: Mean (T-stat; P-value) Mean = 0.0247628 >0.177 <0.506 <0.635 <0.194 >0.413 Change: Median (MW-statistic; P-value) Median = 0.0163852 >0.2639 >0.3550 <0.1585 <0.1155 >0.8863 Prop: After > Before; p=50 % (P-value) >0.419 <0.890 <0.164 <0.090 <0.664
49
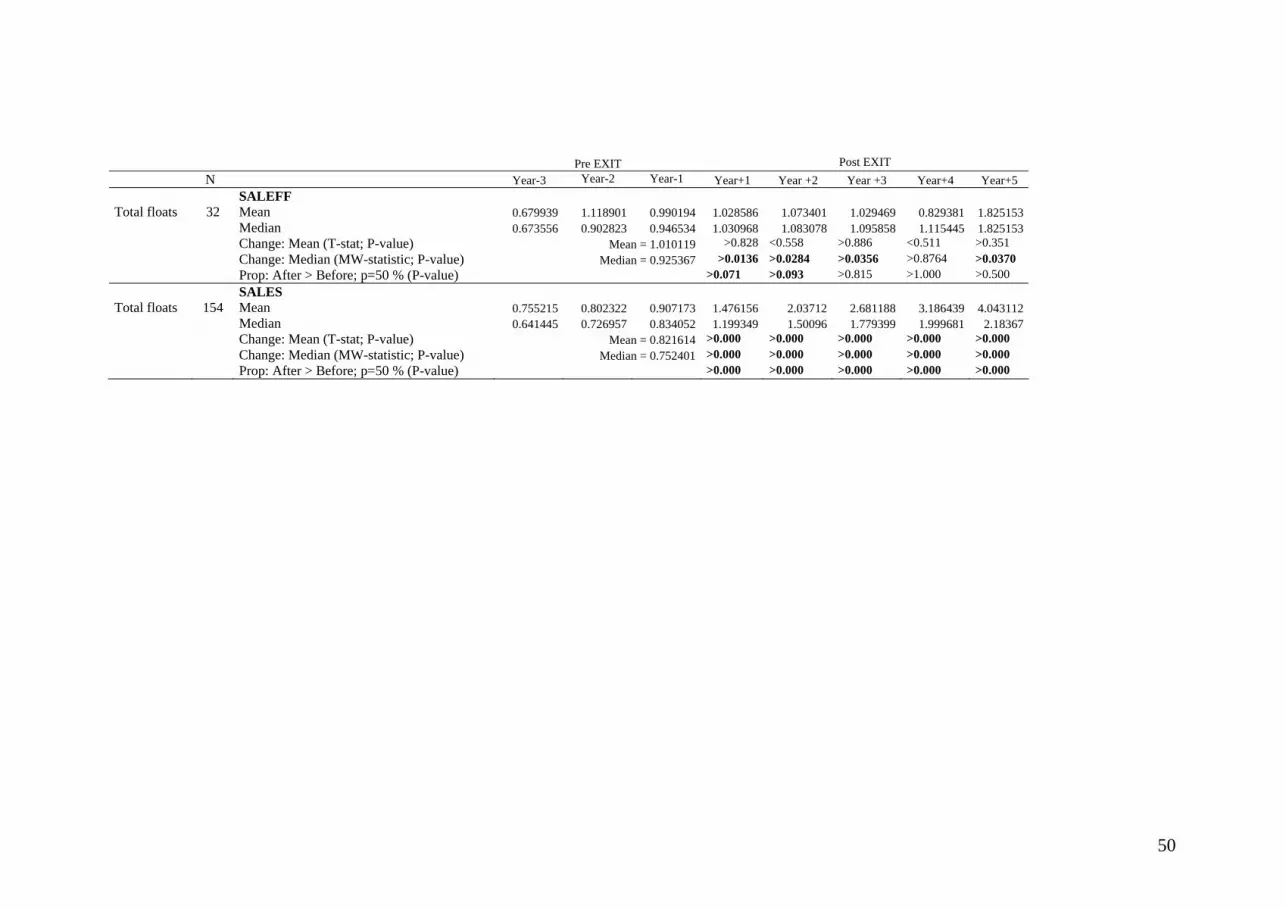
Pre EXIT Post EXIT N Year-3 Year-2 Year-1 Year+1 Year +2 Year +3 Year+4 Year+5
SALEFF Total floats
32 Mean 0.679939 1.118901 0.990194 1.028586 1.073401 1.029469 0.829381 1.825153 Median
0.673556 0.902823 0.946534 1.030968 1.083078
1.095858
1.115445
1.825153 Change: Mean (T-stat; P-value) Mean = 1.010119 >0.828 <0.558 >0.886 <0.511 >0.351
Change: Median (MW-statistic; P-value) Median = 0.925367 >0.0136
>0.0284 >0.0356 >0.8764 >0.0370 Prop: After > Before; p=50 % (P-value) >0.071 >0.093 >0.815 >1.000 >0.500 SALES Total floats
154 Mean 0.755215 0.802322 0.907173 1.476156 2.03712 2.681188 3.186439 4.043112 Median
0.641445 0.726957 0.834052 1.199349
1.50096
1.779399
1.999681
2.18367 Change: Mean (T-stat; P-value) Mean = 0.821614 >0.000 >0.000 >0.000 >0.000 >0.000
Change: Median (MW-statistic; P-value) Median = 0.752401 >0.000 >0.000 >0.000 >0.000 >0.000 Prop: After > Before; p=50 % (P-value) >0.000 >0.000 >0.000 >0.000 >0.000
50

Table 8: Multivariate analysis: determinants of operating performance in post buy-out phase Pooled cross-sectional time-series regression for the determinants of changes in operating performance. Performance measures (dependent variables) for output, efficiency, employment, profitability, gearing, and dividends, respectively are (i) sales in £, normalized by sales in exit year (SALE), (ii) sales per employee ratio, normalized by the ratio in exit year (SALEFF), (iii) number of employees, normalized by number of employees in exit year (EMPL), (iv) profit divided by total assets (ROA), (v) long term debt divided by total assets (GEAR1), and (vi) dividends divided by sales (DIVSAL). The performance is a function of a pre/post dummy taking value equal to 1 for post exit years, and 0 otherwise (POST) and several explanatory/control variables. The explanatory/control variables are a variable for buy-out value at exit, as natural logarithm of buy-out value (LNVMBO), a dummy variable taking value equal to 1 for manufacturing companies, and 0 otherwise (INDUSTRY), a dummy variable for more reputable private equity firms’ taking value equal to 1 for top ten PE firms (PEREPUTATION), and 0 otherwise, a dummy variable for more reputable private equity firms’ taking value equal to 1 for top ten PE firms (REPUTATION), and 0 otherwise. All parameters of the pooled cross-sectional time-series regression are estimated via a GLS random-effects model. R2 is the overall R2 as a weighted average of the estimates produced by the between and within estimators. Test statistics are presented in parenthesis.
DEPENDENT VARIABLES
OUTPUT
(SALE)
EFFICIENCY (SALEFF)
EMPOLYMENT (EMPL)
PROFITABILITY (ROA)
GEARING
(GEAR1)
DIVIDEND
(DIVSAL)
POST 0.201 (0.048)
0.201 (0.048)
0.249 (0.000)
0.249 (0.000)
-0.001 (0.992)
-0.001 (0.992)
-0.083 (0.575)
-0.083 (0.575)
-0.006 (0.848)
-0.006 (0.848)
0.063 (0.078)
0.063 (0.078)
LNVMBO 0.043 (0.450)
0.037 (0.512)
-0.021 (0.351)
-0.025 (0.279)
-0.035 (0.337)
-0.019 (0.590)
-0.026 (0.669)
-0.050 (0.405)
0.052 (0.091)
0.058 (0.081)
0.035 (0.020)
0.041 (0.012)
MBI -0.146 (0.643)
-0.135 (0.670)
0.137 (0.197)
0.146 (0.168)
-0.144 (0.407)
-0.186 (0.266)
0.066 (0.835)
0.121 (0.697)
0.297 (0.074)
0.325 (0.051)
0.010 (0.912)
0.006 (0.955)
INDUSTRY -0.212 (0.371)
-0.180 (0.449)
-0.001 (0.998)
0.001 (0.995)
-0.055 (0.625)
-0.087 (0.423)
0.128 (0.590)
0.226 (0.339)
-0.174 (0.116)
-0.175 (0.119)
-0.012 (0.819)
-0.011 (0.848)
PE 0.166 (0.361)
-0.067 (0.264)
0.133(0.165)
-0.373 (0.039)
-0.086(0.291)
-0.133(0.002)
REPUTAT -0.046 (0.834)
-0.099(0.179)
0.340 (0.004)
-0.701(0.002)
0.007(0.957)
-0.067(0.197)
INTERCEPT 0.929 (0.000)
1.029 (0.000)
0.921 (0.000) 0.932
(0.000)
1.172 (0.000)
1.108 (0.000)
0.228 (0.397)
0.308 (0.246)
0.164 (0.217)
0.114 (0.422)
0.007 (0.914)
-0.068 (0.299)
R2 (overall) 0.015 0.012 0.162 0.165 0.022 0.058 0.016 0.030 0.166 0.153 0.149 0.093
Wald χ2 stat. 6.18 (0.289)
5.38 (0.371)
48.67 (0.000)
49.25 (0.000)
3.49 (0.625)
9.85 (0.080)
4.85 (0.434)
9.76 (0.082)
14.37 (0.013)
12.99 (0.024)
21.30 (0.001)
12.31 (0.031)
N obs./group 432/144 432/144 216/72 261/72 225/75 225/75 327/109 327/109 174/58 174/58 159/53 159/53
51
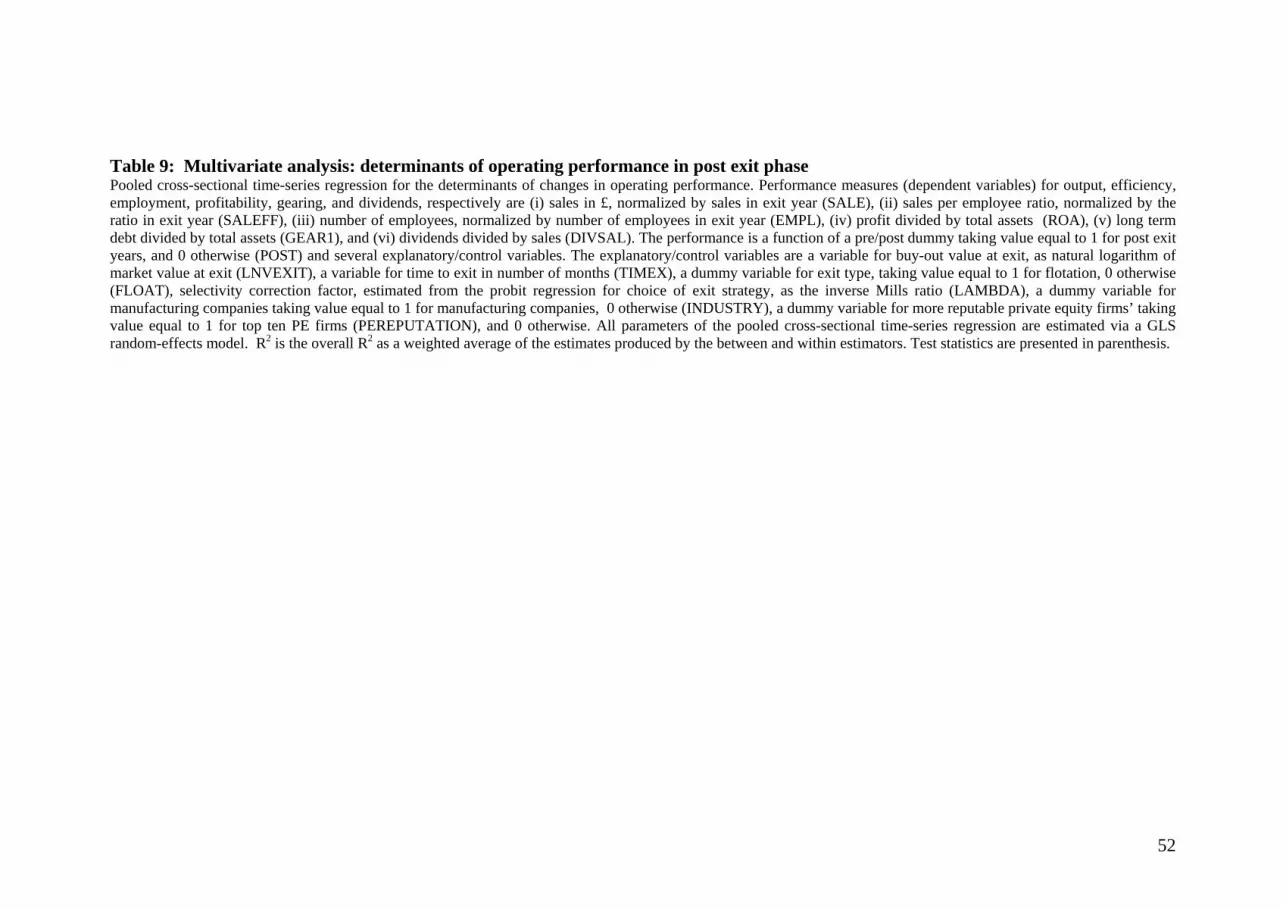
Table 9: Multivariate analysis: determinants of operating performance in post exit phase Pooled cross-sectional time-series regression for the determinants of changes in operating performance. Performance measures (dependent variables) for output, efficiency, employment, profitability, gearing, and dividends, respectively are (i) sales in £, normalized by sales in exit year (SALE), (ii) sales per employee ratio, normalized by the ratio in exit year (SALEFF), (iii) number of employees, normalized by number of employees in exit year (EMPL), (iv) profit divided by total assets (ROA), (v) long term debt divided by total assets (GEAR1), and (vi) dividends divided by sales (DIVSAL). The performance is a function of a pre/post dummy taking value equal to 1 for post exit years, and 0 otherwise (POST) and several explanatory/control variables. The explanatory/control variables are a variable for buy-out value at exit, as natural logarithm of market value at exit (LNVEXIT), a variable for time to exit in number of months (TIMEX), a dummy variable for exit type, taking value equal to 1 for flotation, 0 otherwise (FLOAT), selectivity correction factor, estimated from the probit regression for choice of exit strategy, as the inverse Mills ratio (LAMBDA), a dummy variable for manufacturing companies taking value equal to 1 for manufacturing companies, 0 otherwise (INDUSTRY), a dummy variable for more reputable private equity firms’ taking value equal to 1 for top ten PE firms (PEREPUTATION), and 0 otherwise. All parameters of the pooled cross-sectional time-series regression are estimated via a GLS random-effects model. R2 is the overall R2 as a weighted average of the estimates produced by the between and within estimators. Test statistics are presented in parenthesis.
52

DEPENDENT VARIABLES
OUTPUT
(SALE)
EFFICIENCY (SALEFF)
EMPOLYMENT (EMPL)
PROFITABILITY (ROA)
GEARING
(GEAR1)
DIVIDEND
(DIVSAL)
ALL IPO ALL IPO ALL IPO ALL IPO ALL IPO ALL IPO
POST 0.635 (0.000)
0.939 (0.000) 0.377
(0.329) 0.021
(0.807) 0.232
(0.171)
0.668 (0.060)
0.006 (0.906)
0.033 (0.037)
-0.158 (0.000)
-0.194
(0.000)
0.255 (0.100)
0.276 (0.000)
LNVEXIT -0.149
(0.033)
-0.153 (0.099)
0.423 (0.054)
-0.098 (0.130)
-0.098 (0.257)
0.014 (0.944)
0.020 (0.456)
0.029 (0.006)
0.026 (0.358)
0.049 (0.035)
0.517 (0.000)
0.607 (0.099)
TIMEX -0.002
(0.287)
-0.003 (0.357)
-0.001 (0.967)
-0.003 (0.039)
-0.001 (0.619)
0.002
(0.688)
0.001 (0.839)
0.001 (0.263)
-0.001 (0.861)
-0.001 (0.802)
0.010 (0.033)
0.011 (0.357)
INDUSTRY -0.296
(0.061)
-0.340 (0.119)
0.127 (0.803)
0.302 (0.052)
-0.214 (0.439)
-0.813
(0.285)
0.030 (0.666)
0.002 (0.942)
-0.063 (0.338)
-0.058 (0.271)
-0.001 (1.000)
-0.400 (0.119)
FLOAT 0.223
(0.222)
-0.247(0.651)
0.553(0.030)
-0.006(0.934)
-0.077(0.322)
0.437(0.340)
LAMBDA -0.180
(0.603)
-0.057(0.955)
-1.109(0.011)
0.023(0.863)
-0.040(0.760)
-0.077(0.912)
REPUTATION 0.279
(0.008)
0.294 (0.138)
0.108 (0.851)
-0.055 (0.666)
0.506 (0.064)
0.807 (0.076)
-0.009 (0.903)
0.003 (0.896)
-0.041 (0.535)
-0.028 (0.575)
-0.249 (0.411)
-0.248 (0.138)
INTERCEPT 1.471
(0.000)
1.421 (0.001)
-0.691 (0.578)
1.538 (0.000)
1.721 (0.001)
0.605 (0.514)
-0.023 (0.884)
-0.072 (0.148)
0.340 (0.052)
0.158 (0.160)
-2.612 (0.005)
-2.615 (0.001)
R2 (overall) 0.108 0.122 0.049 0.186 0.142 0.120 0.005 0.154 0.156 0.205 0.126 0.143
Wald χ2 stat. 51.19
(0.000)
40.72 (0.000)
6.47
(0.486)
8.88 (0.114)
21.50 (0.003)
7.37 (0.195)
0.91 (0.996)
14.10 (0.015)
38.78 (0.000)
41.31 (0.000)
20.15 (0.005)
19.42 (0.002)
N obs./group 431/149 278/97 134/46 68/24 137/47 62/22 198/69 102/37 201/70 153/54 252/87 210/73
53

54


