Embed Size (px)
Citation preview

Introductory Guide to Investing in Private Equity SecondariesJochen Mende Senior Director Investment Management Capital Dynamics
Joseph B. Marks Managing Director Investment Management Capital Dynamics
Kairat Perembetov Senior Vice President Research Capital Dynamics
What a CAIA Member Should Know
7Private Equity Secondaries
Introduction
Investors are facing a historically difficult macro environment with significant headwinds felt across various asset classes, impacting return targets. Interest rates are at unprecedented low levels, leading to scant returns for the safest assets and significant principal risk to fixed income returns. Equity markets, which have enjoyed a long expansion post-financial crisis, are trading well above long-term averages exposing investors to downside risk. Additionally, actuarial targets are being significantly lowered, causing balance sheet liabilities to rise at institutionally managed portfolios. Finally, market volatility, which has been exceptionally low in recent years, has increased in the last few months implying pressure on equity returns ahead.
Faced with the dual challenges on both the asset and liability fronts, investors today have an increasingly difficult task and are looking into "alternatives", including private equity
secondaries ("secondaries"). As outlined in the following white paper, Capital Dynamics (or “we”) believe that secondaries present an excellent risk-adjusted return profile, exhibiting defensive attributes while still providing attractive long-term returns.
Introduction to the Mechanics of the Private Equity Secondary Market
Private equity funds are typically organized as limited partnerships, to which investors – also commonly referred to as Limited Partners or LPs – commit capital over the course of a fundraising process. The aggregated capital commitments are managed by a General Partner (“GP”) who is responsible for managing the affairs of the fund. A typical private equity fund has an initial duration of 10-12 years, which can be segmented into an investment period (typically the first five years) and a harvesting period (thereafter), during which investments are being exited. By design, private equity funds do not offer redemption
What a CAIA Member Should Know
Alternative Investment Analyst ReviewQuarter 3 • 2016
8
or liquidity mechanisms for investors. If an LP needs or wishes to exit a fund prematurely, there is no other way than selling via the secondary market.
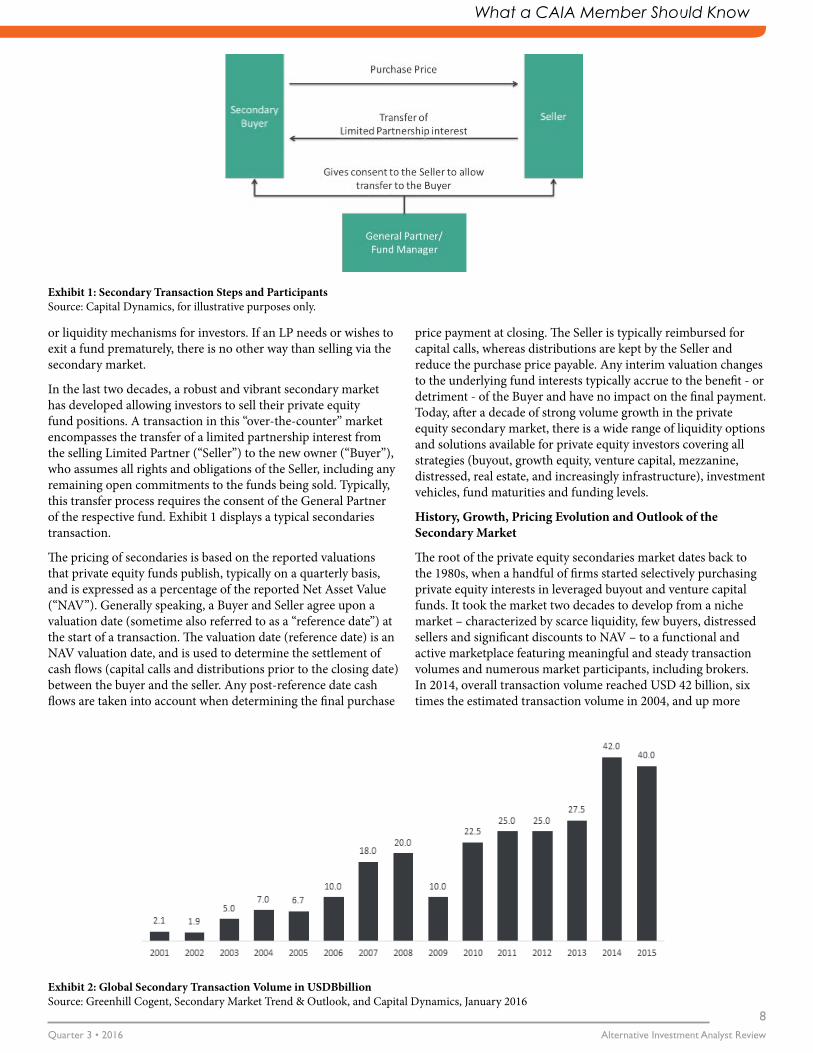
In the last two decades, a robust and vibrant secondary market has developed allowing investors to sell their private equity fund positions. A transaction in this “over-the-counter” market encompasses the transfer of a limited partnership interest from the selling Limited Partner (“Seller”) to the new owner (“Buyer”), who assumes all rights and obligations of the Seller, including any remaining open commitments to the funds being sold. Typically, this transfer process requires the consent of the General Partner of the respective fund. Exhibit 1 displays a typical secondaries transaction.
The pricing of secondaries is based on the reported valuations that private equity funds publish, typically on a quarterly basis, and is expressed as a percentage of the reported Net Asset Value (“NAV”). Generally speaking, a Buyer and Seller agree upon a valuation date (sometime also referred to as a “reference date”) at the start of a transaction. The valuation date (reference date) is an NAV valuation date, and is used to determine the settlement of cash flows (capital calls and distributions prior to the closing date) between the buyer and the seller. Any post-reference date cash flows are taken into account when determining the final purchase
price payment at closing. The Seller is typically reimbursed for capital calls, whereas distributions are kept by the Seller and reduce the purchase price payable. Any interim valuation changes to the underlying fund interests typically accrue to the benefit - or detriment - of the Buyer and have no impact on the final payment. Today, after a decade of strong volume growth in the private equity secondary market, there is a wide range of liquidity options and solutions available for private equity investors covering all strategies (buyout, growth equity, venture capital, mezzanine, distressed, real estate, and increasingly infrastructure), investment vehicles, fund maturities and funding levels.
History, Growth, Pricing Evolution and Outlook of the Secondary Market
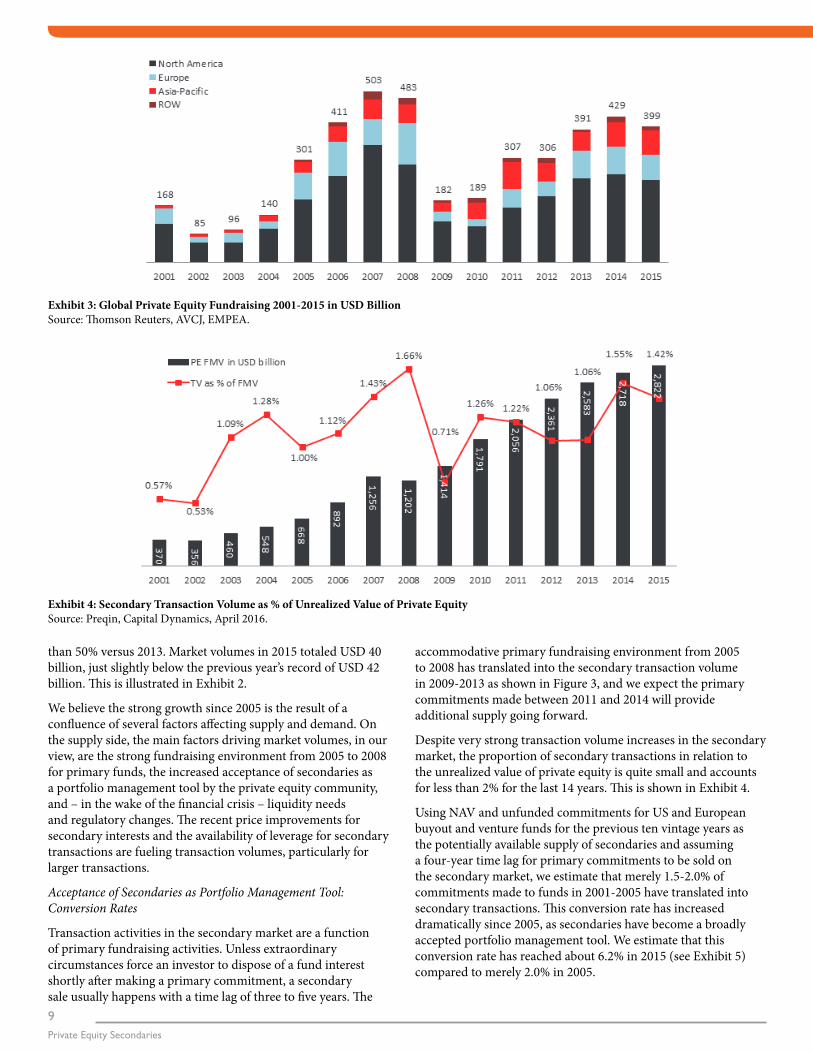
The root of the private equity secondaries market dates back to the 1980s, when a handful of firms started selectively purchasing private equity interests in leveraged buyout and venture capital funds. It took the market two decades to develop from a niche market – characterized by scarce liquidity, few buyers, distressed sellers and significant discounts to NAV – to a functional and active marketplace featuring meaningful and steady transaction volumes and numerous market participants, including brokers. In 2014, overall transaction volume reached USD 42 billion, six times the estimated transaction volume in 2004, and up more
Exhibit 1: Secondary Transaction Steps and Participants Source: Capital Dynamics, for illustrative purposes only.
Exhibit 2: Global Secondary Transaction Volume in USDBbillion Source: Greenhill Cogent, Secondary Market Trend & Outlook, and Capital Dynamics, January 2016
9Private Equity Secondaries
than 50% versus 2013. Market volumes in 2015 totaled USD 40 billion, just slightly below the previous year’s record of USD 42 billion. This is illustrated in Exhibit 2.
We believe the strong growth since 2005 is the result of a confluence of several factors affecting supply and demand. On the supply side, the main factors driving market volumes, in our view, are the strong fundraising environment from 2005 to 2008 for primary funds, the increased acceptance of secondaries as a portfolio management tool by the private equity community, and – in the wake of the financial crisis – liquidity needs and regulatory changes. The recent price improvements for secondary interests and the availability of leverage for secondary transactions are fueling transaction volumes, particularly for larger transactions.
Acceptance of Secondaries as Portfolio Management Tool: Conversion Rates
Transaction activities in the secondary market are a function of primary fundraising activities. Unless extraordinary circumstances force an investor to dispose of a fund interest shortly after making a primary commitment, a secondary sale usually happens with a time lag of three to five years. The
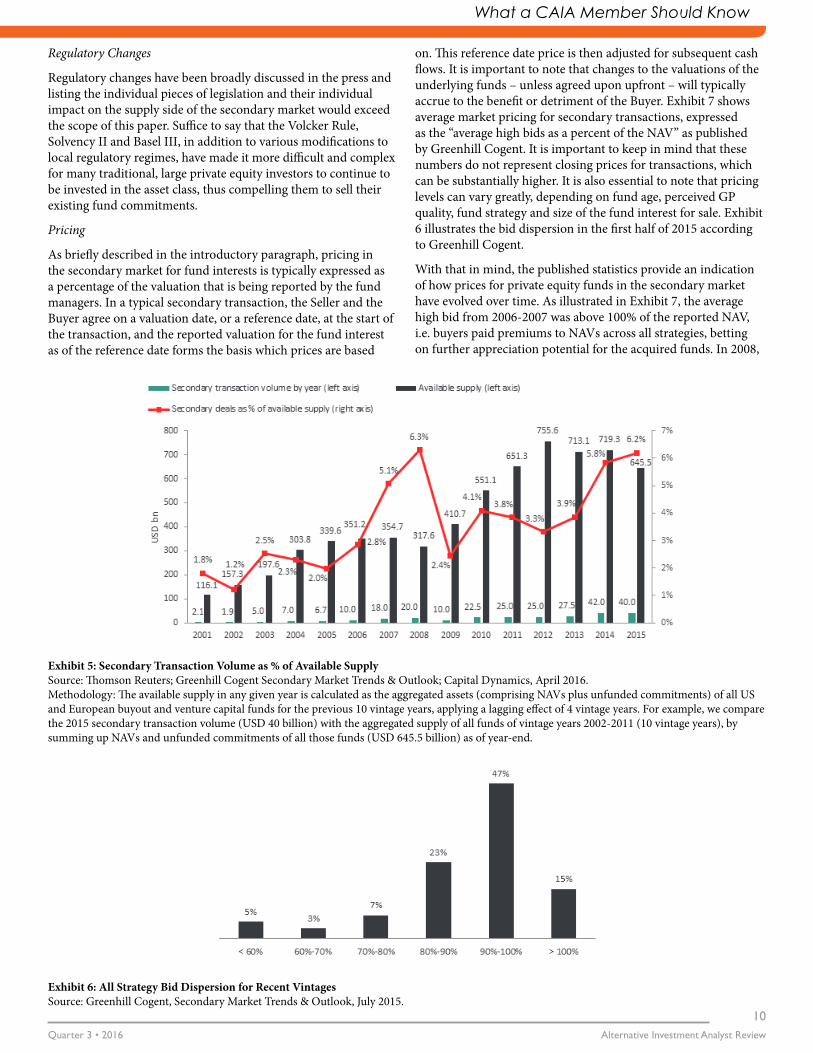
accommodative primary fundraising environment from 2005 to 2008 has translated into the secondary transaction volume in 2009-2013 as shown in Figure 3, and we expect the primary commitments made between 2011 and 2014 will provide additional supply going forward.
Despite very strong transaction volume increases in the secondary market, the proportion of secondary transactions in relation to the unrealized value of private equity is quite small and accounts for less than 2% for the last 14 years. This is shown in Exhibit 4.
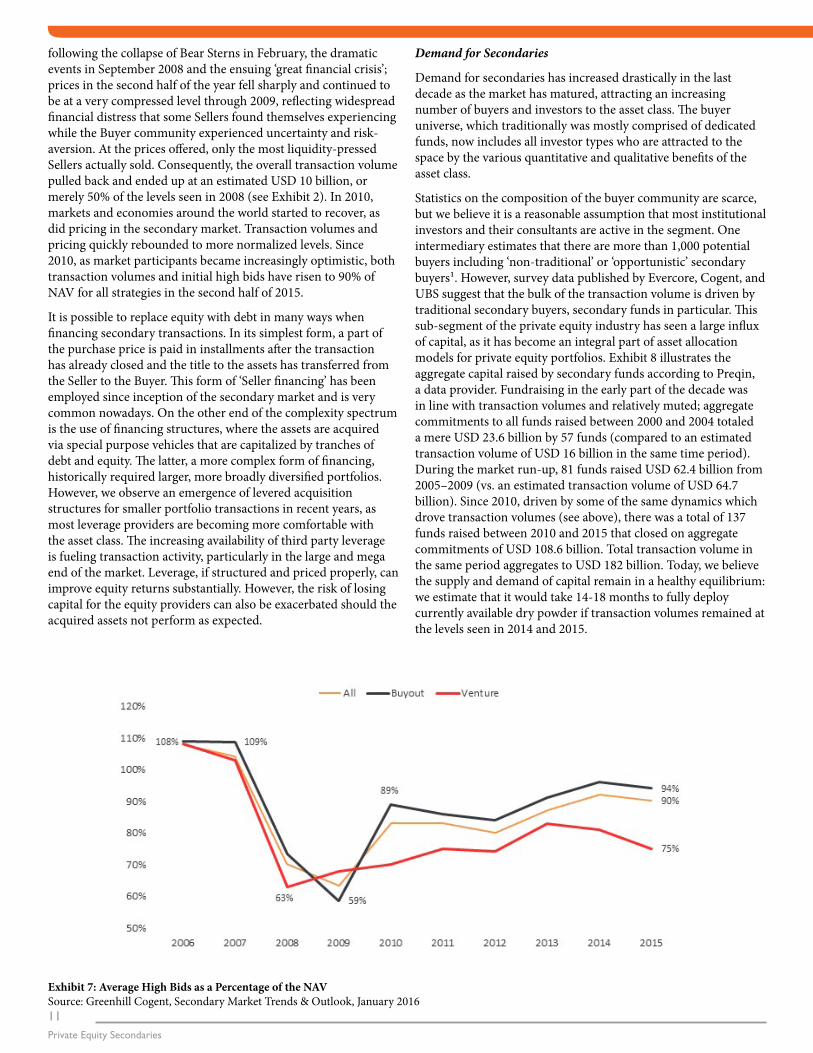
Using NAV and unfunded commitments for US and European buyout and venture funds for the previous ten vintage years as the potentially available supply of secondaries and assuming a four-year time lag for primary commitments to be sold on the secondary market, we estimate that merely 1.5-2.0% of commitments made to funds in 2001-2005 have translated into secondary transactions. This conversion rate has increased dramatically since 2005, as secondaries have become a broadly accepted portfolio management tool. We estimate that this conversion rate has reached about 6.2% in 2015 (see Exhibit 5) compared to merely 2.0% in 2005.
Exhibit 3: Global Private Equity Fundraising 2001-2015 in USD Billion Source: Thomson Reuters, AVCJ, EMPEA.
Exhibit 4: Secondary Transaction Volume as % of Unrealized Value of Private Equity Source: Preqin, Capital Dynamics, April 2016.
What a CAIA Member Should Know
Alternative Investment Analyst ReviewQuarter 3 • 2016
10
Regulatory Changes
Regulatory changes have been broadly discussed in the press and listing the individual pieces of legislation and their individual impact on the supply side of the secondary market would exceed the scope of this paper. Suffice to say that the Volcker Rule, Solvency II and Basel III, in addition to various modifications to local regulatory regimes, have made it more difficult and complex for many traditional, large private equity investors to continue to be invested in the asset class, thus compelling them to sell their existing fund commitments.
Pricing
As briefly described in the introductory paragraph, pricing in the secondary market for fund interests is typically expressed as a percentage of the valuation that is being reported by the fund managers. In a typical secondary transaction, the Seller and the Buyer agree on a valuation date, or a reference date, at the start of the transaction, and the reported valuation for the fund interest as of the reference date forms the basis which prices are based
on. This reference date price is then adjusted for subsequent cash flows. It is important to note that changes to the valuations of the underlying funds – unless agreed upon upfront – will typically accrue to the benefit or detriment of the Buyer. Exhibit 7 shows average market pricing for secondary transactions, expressed as the “average high bids as a percent of the NAV” as published by Greenhill Cogent. It is important to keep in mind that these numbers do not represent closing prices for transactions, which can be substantially higher. It is also essential to note that pricing levels can vary greatly, depending on fund age, perceived GP quality, fund strategy and size of the fund interest for sale. Exhibit 6 illustrates the bid dispersion in the first half of 2015 according to Greenhill Cogent.
With that in mind, the published statistics provide an indication of how prices for private equity funds in the secondary market have evolved over time. As illustrated in Exhibit 7, the average high bid from 2006-2007 was above 100% of the reported NAV, i.e. buyers paid premiums to NAVs across all strategies, betting on further appreciation potential for the acquired funds. In 2008,
Exhibit 5: Secondary Transaction Volume as % of Available Supply Source: Thomson Reuters; Greenhill Cogent Secondary Market Trends & Outlook; Capital Dynamics, April 2016.Methodology: The available supply in any given year is calculated as the aggregated assets (comprising NAVs plus unfunded commitments) of all US and European buyout and venture capital funds for the previous 10 vintage years, applying a lagging effect of 4 vintage years. For example, we compare the 2015 secondary transaction volume (USD 40 billion) with the aggregated supply of all funds of vintage years 2002-2011 (10 vintage years), by summing up NAVs and unfunded commitments of all those funds (USD 645.5 billion) as of year-end.
Exhibit 6: All Strategy Bid Dispersion for Recent Vintages Source: Greenhill Cogent, Secondary Market Trends & Outlook, July 2015.
11Private Equity Secondaries
following the collapse of Bear Sterns in February, the dramatic events in September 2008 and the ensuing ‘great financial crisis’; prices in the second half of the year fell sharply and continued to be at a very compressed level through 2009, reflecting widespread financial distress that some Sellers found themselves experiencing while the Buyer community experienced uncertainty and risk-aversion. At the prices offered, only the most liquidity-pressed Sellers actually sold. Consequently, the overall transaction volume pulled back and ended up at an estimated USD 10 billion, or merely 50% of the levels seen in 2008 (see Exhibit 2). In 2010, markets and economies around the world started to recover, as did pricing in the secondary market. Transaction volumes and pricing quickly rebounded to more normalized levels. Since 2010, as market participants became increasingly optimistic, both transaction volumes and initial high bids have risen to 90% of NAV for all strategies in the second half of 2015.
It is possible to replace equity with debt in many ways when financing secondary transactions. In its simplest form, a part of the purchase price is paid in installments after the transaction has already closed and the title to the assets has transferred from the Seller to the Buyer. This form of ‘Seller financing’ has been employed since inception of the secondary market and is very common nowadays. On the other end of the complexity spectrum is the use of financing structures, where the assets are acquired via special purpose vehicles that are capitalized by tranches of debt and equity. The latter, a more complex form of financing, historically required larger, more broadly diversified portfolios. However, we observe an emergence of levered acquisition structures for smaller portfolio transactions in recent years, as most leverage providers are becoming more comfortable with the asset class. The increasing availability of third party leverage is fueling transaction activity, particularly in the large and mega end of the market. Leverage, if structured and priced properly, can improve equity returns substantially. However, the risk of losing capital for the equity providers can also be exacerbated should the acquired assets not perform as expected.
Demand for Secondaries
Demand for secondaries has increased drastically in the last decade as the market has matured, attracting an increasing number of buyers and investors to the asset class. The buyer universe, which traditionally was mostly comprised of dedicated funds, now includes all investor types who are attracted to the space by the various quantitative and qualitative benefits of the asset class.
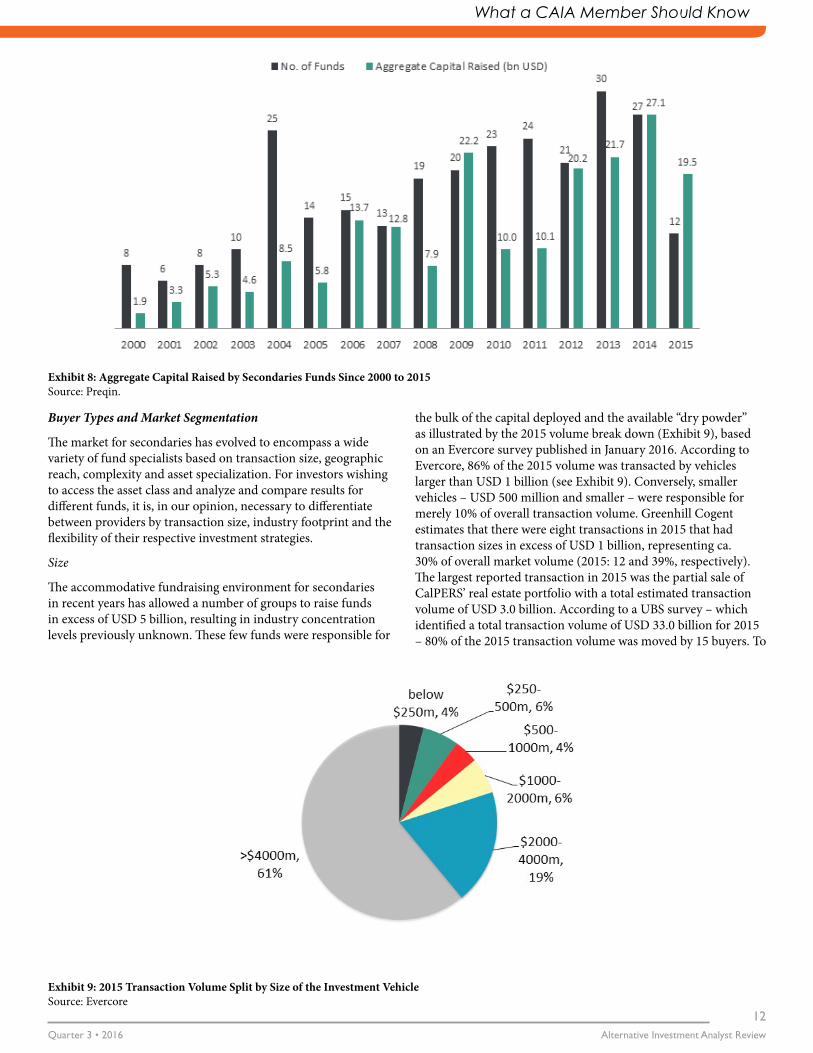
Statistics on the composition of the buyer community are scarce, but we believe it is a reasonable assumption that most institutional investors and their consultants are active in the segment. One intermediary estimates that there are more than 1,000 potential buyers including ‘non-traditional’ or ‘opportunistic’ secondary buyers1. However, survey data published by Evercore, Cogent, and UBS suggest that the bulk of the transaction volume is driven by traditional secondary buyers, secondary funds in particular. This sub-segment of the private equity industry has seen a large influx of capital, as it has become an integral part of asset allocation models for private equity portfolios. Exhibit 8 illustrates the aggregate capital raised by secondary funds according to Preqin, a data provider. Fundraising in the early part of the decade was in line with transaction volumes and relatively muted; aggregate commitments to all funds raised between 2000 and 2004 totaled a mere USD 23.6 billion by 57 funds (compared to an estimated transaction volume of USD 16 billion in the same time period). During the market run-up, 81 funds raised USD 62.4 billion from 2005–2009 (vs. an estimated transaction volume of USD 64.7 billion). Since 2010, driven by some of the same dynamics which drove transaction volumes (see above), there was a total of 137 funds raised between 2010 and 2015 that closed on aggregate commitments of USD 108.6 billion. Total transaction volume in the same period aggregates to USD 182 billion. Today, we believe the supply and demand of capital remain in a healthy equilibrium: we estimate that it would take 14-18 months to fully deploy currently available dry powder if transaction volumes remained at the levels seen in 2014 and 2015.
Exhibit 7: Average High Bids as a Percentage of the NAV Source: Greenhill Cogent, Secondary Market Trends & Outlook, January 2016
What a CAIA Member Should Know
Alternative Investment Analyst ReviewQuarter 3 • 2016
12
Buyer Types and Market Segmentation
The market for secondaries has evolved to encompass a wide variety of fund specialists based on transaction size, geographic reach, complexity and asset specialization. For investors wishing to access the asset class and analyze and compare results for different funds, it is, in our opinion, necessary to differentiate between providers by transaction size, industry footprint and the flexibility of their respective investment strategies.
Size
The accommodative fundraising environment for secondaries in recent years has allowed a number of groups to raise funds in excess of USD 5 billion, resulting in industry concentration levels previously unknown. These few funds were responsible for
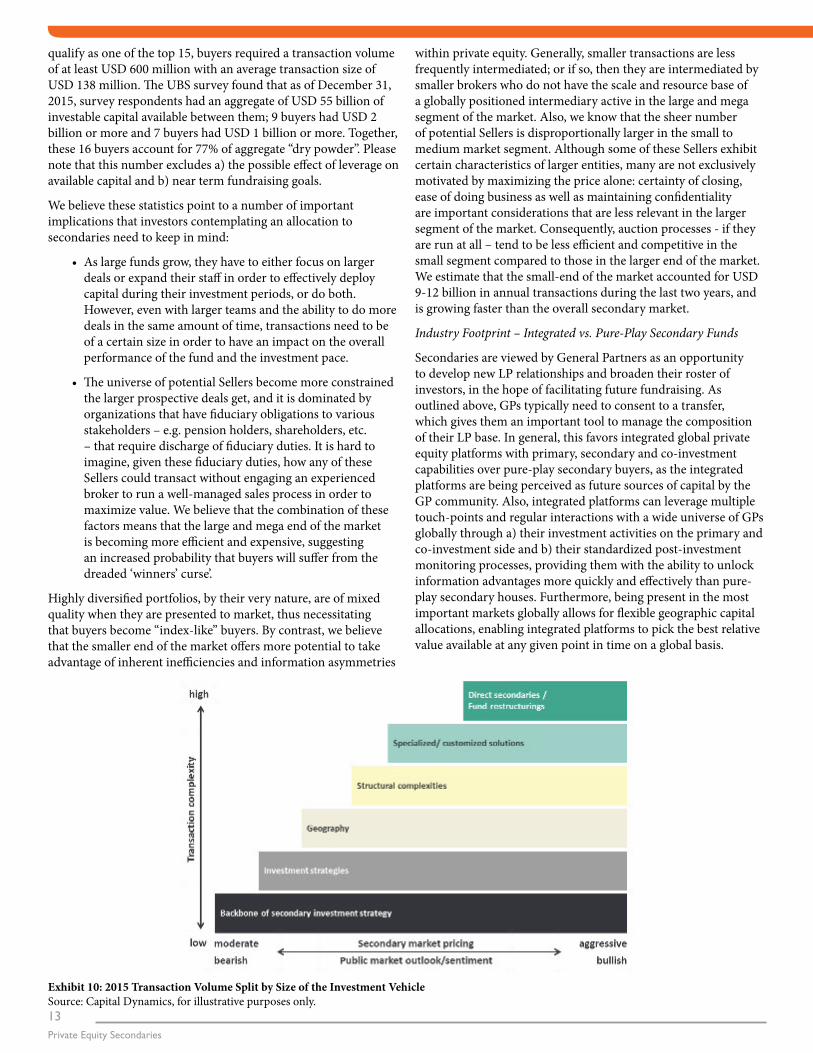
the bulk of the capital deployed and the available “dry powder” as illustrated by the 2015 volume break down (Exhibit 9), based on an Evercore survey published in January 2016. According to Evercore, 86% of the 2015 volume was transacted by vehicles larger than USD 1 billion (see Exhibit 9). Conversely, smaller vehicles – USD 500 million and smaller – were responsible for merely 10% of overall transaction volume. Greenhill Cogent estimates that there were eight transactions in 2015 that had transaction sizes in excess of USD 1 billion, representing ca. 30% of overall market volume (2015: 12 and 39%, respectively). The largest reported transaction in 2015 was the partial sale of CalPERS’ real estate portfolio with a total estimated transaction volume of USD 3.0 billion. According to a UBS survey – which identified a total transaction volume of USD 33.0 billion for 2015 – 80% of the 2015 transaction volume was moved by 15 buyers. To
Exhibit 8: Aggregate Capital Raised by Secondaries Funds Since 2000 to 2015 Source: Preqin.
Exhibit 9: 2015 Transaction Volume Split by Size of the Investment Vehicle Source: Evercore
13Private Equity Secondaries
qualify as one of the top 15, buyers required a transaction volume of at least USD 600 million with an average transaction size of USD 138 million. The UBS survey found that as of December 31, 2015, survey respondents had an aggregate of USD 55 billion of investable capital available between them; 9 buyers had USD 2 billion or more and 7 buyers had USD 1 billion or more. Together, these 16 buyers account for 77% of aggregate “dry powder”. Please note that this number excludes a) the possible effect of leverage on available capital and b) near term fundraising goals.
We believe these statistics point to a number of important implications that investors contemplating an allocation to secondaries need to keep in mind:
• As large funds grow, they have to either focus on larger deals or expand their staff in order to effectively deploy capital during their investment periods, or do both. However, even with larger teams and the ability to do more deals in the same amount of time, transactions need to be of a certain size in order to have an impact on the overall performance of the fund and the investment pace.
• The universe of potential Sellers become more constrained the larger prospective deals get, and it is dominated by organizations that have fiduciary obligations to various stakeholders – e.g. pension holders, shareholders, etc. – that require discharge of fiduciary duties. It is hard to imagine, given these fiduciary duties, how any of these Sellers could transact without engaging an experienced broker to run a well-managed sales process in order to maximize value. We believe that the combination of these factors means that the large and mega end of the market is becoming more efficient and expensive, suggesting an increased probability that buyers will suffer from the dreaded ‘winners’ curse’.
Highly diversified portfolios, by their very nature, are of mixed quality when they are presented to market, thus necessitating that buyers become “index-like” buyers. By contrast, we believe that the smaller end of the market offers more potential to take advantage of inherent inefficiencies and information asymmetries
within private equity. Generally, smaller transactions are less frequently intermediated; or if so, then they are intermediated by smaller brokers who do not have the scale and resource base of a globally positioned intermediary active in the large and mega segment of the market. Also, we know that the sheer number of potential Sellers is disproportionally larger in the small to medium market segment. Although some of these Sellers exhibit certain characteristics of larger entities, many are not exclusively motivated by maximizing the price alone: certainty of closing, ease of doing business as well as maintaining confidentiality are important considerations that are less relevant in the larger segment of the market. Consequently, auction processes - if they are run at all – tend to be less efficient and competitive in the small segment compared to those in the larger end of the market. We estimate that the small-end of the market accounted for USD 9-12 billion in annual transactions during the last two years, and is growing faster than the overall secondary market.
Industry Footprint – Integrated vs. Pure-Play Secondary Funds
Secondaries are viewed by General Partners as an opportunity to develop new LP relationships and broaden their roster of investors, in the hope of facilitating future fundraising. As outlined above, GPs typically need to consent to a transfer, which gives them an important tool to manage the composition of their LP base. In general, this favors integrated global private equity platforms with primary, secondary and co-investment capabilities over pure-play secondary buyers, as the integrated platforms are being perceived as future sources of capital by the GP community. Also, integrated platforms can leverage multiple touch-points and regular interactions with a wide universe of GPs globally through a) their investment activities on the primary and co-investment side and b) their standardized post-investment monitoring processes, providing them with the ability to unlock information advantages more quickly and effectively than pure-play secondary houses. Furthermore, being present in the most important markets globally allows for flexible geographic capital allocations, enabling integrated platforms to pick the best relative value available at any given point in time on a global basis.
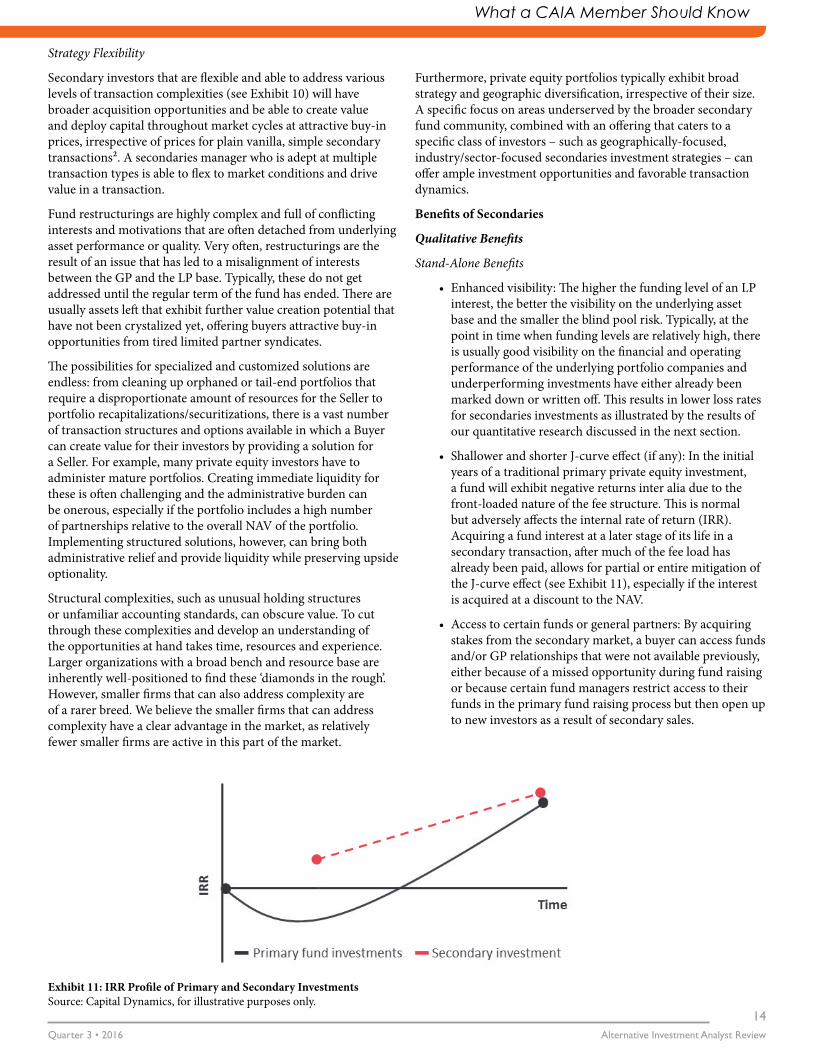
Exhibit 10: 2015 Transaction Volume Split by Size of the Investment Vehicle Source: Capital Dynamics, for illustrative purposes only.
What a CAIA Member Should Know
Alternative Investment Analyst ReviewQuarter 3 • 2016
14
Strategy Flexibility
Secondary investors that are flexible and able to address various levels of transaction complexities (see Exhibit 10) will have broader acquisition opportunities and be able to create value and deploy capital throughout market cycles at attractive buy-in prices, irrespective of prices for plain vanilla, simple secondary transactions2. A secondaries manager who is adept at multiple transaction types is able to flex to market conditions and drive value in a transaction.
Fund restructurings are highly complex and full of conflicting interests and motivations that are often detached from underlying asset performance or quality. Very often, restructurings are the result of an issue that has led to a misalignment of interests between the GP and the LP base. Typically, these do not get addressed until the regular term of the fund has ended. There are usually assets left that exhibit further value creation potential that have not been crystalized yet, offering buyers attractive buy-in opportunities from tired limited partner syndicates.
The possibilities for specialized and customized solutions are endless: from cleaning up orphaned or tail-end portfolios that require a disproportionate amount of resources for the Seller to portfolio recapitalizations/securitizations, there is a vast number of transaction structures and options available in which a Buyer can create value for their investors by providing a solution for a Seller. For example, many private equity investors have to administer mature portfolios. Creating immediate liquidity for these is often challenging and the administrative burden can be onerous, especially if the portfolio includes a high number of partnerships relative to the overall NAV of the portfolio. Implementing structured solutions, however, can bring both administrative relief and provide liquidity while preserving upside optionality.
Structural complexities, such as unusual holding structures or unfamiliar accounting standards, can obscure value. To cut through these complexities and develop an understanding of the opportunities at hand takes time, resources and experience. Larger organizations with a broad bench and resource base are inherently well-positioned to find these ‘diamonds in the rough’. However, smaller firms that can also address complexity are of a rarer breed. We believe the smaller firms that can address complexity have a clear advantage in the market, as relatively fewer smaller firms are active in this part of the market.
Furthermore, private equity portfolios typically exhibit broad strategy and geographic diversification, irrespective of their size. A specific focus on areas underserved by the broader secondary fund community, combined with an offering that caters to a specific class of investors – such as geographically-focused, industry/sector-focused secondaries investment strategies – can offer ample investment opportunities and favorable transaction dynamics.
Benefits of Secondaries
Qualitative Benefits
Stand-Alone Benefits
• Enhanced visibility: The higher the funding level of an LP interest, the better the visibility on the underlying asset base and the smaller the blind pool risk. Typically, at the point in time when funding levels are relatively high, there is usually good visibility on the financial and operating performance of the underlying portfolio companies and underperforming investments have either already been marked down or written off. This results in lower loss rates for secondaries investments as illustrated by the results of our quantitative research discussed in the next section.
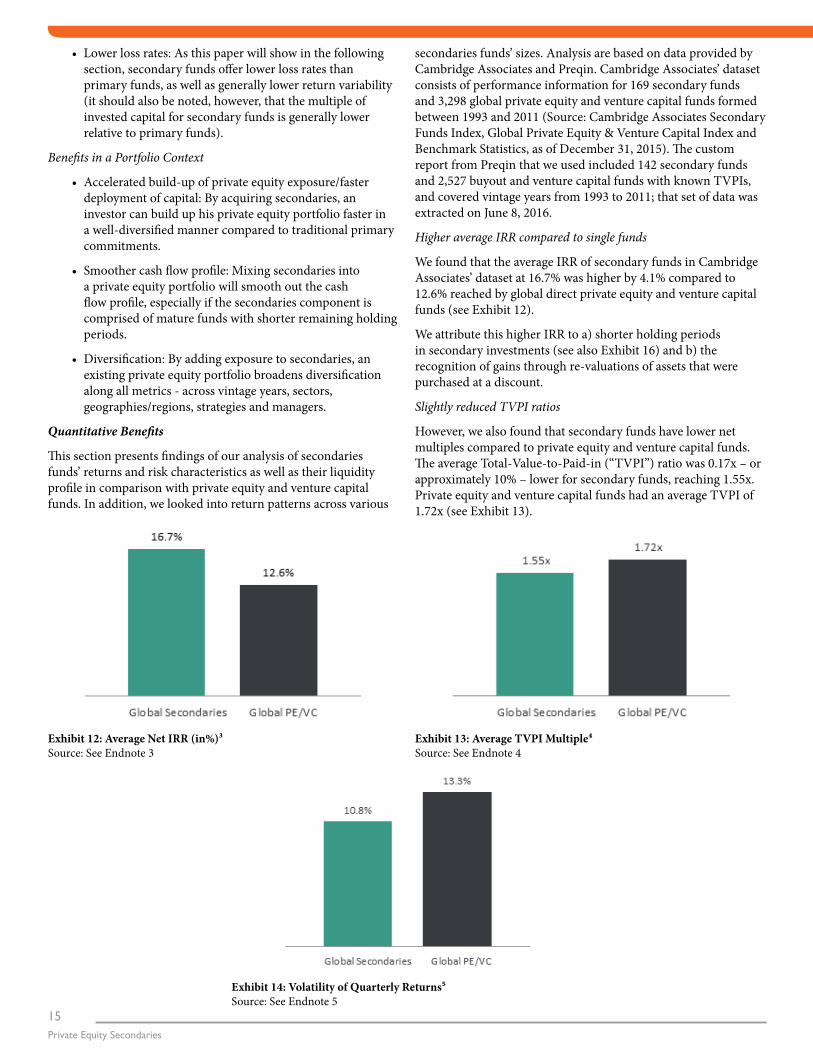
• Shallower and shorter J-curve effect (if any): In the initial years of a traditional primary private equity investment, a fund will exhibit negative returns inter alia due to the front-loaded nature of the fee structure. This is normal but adversely affects the internal rate of return (IRR). Acquiring a fund interest at a later stage of its life in a secondary transaction, after much of the fee load has already been paid, allows for partial or entire mitigation of the J-curve effect (see Exhibit 11), especially if the interest is acquired at a discount to the NAV.
• Access to certain funds or general partners: By acquiring stakes from the secondary market, a buyer can access funds and/or GP relationships that were not available previously, either because of a missed opportunity during fund raising or because certain fund managers restrict access to their funds in the primary fund raising process but then open up to new investors as a result of secondary sales.
Exhibit 11: IRR Profile of Primary and Secondary Investments Source: Capital Dynamics, for illustrative purposes only.
15Private Equity Secondaries
• Lower loss rates: As this paper will show in the following section, secondary funds offer lower loss rates than primary funds, as well as generally lower return variability (it should also be noted, however, that the multiple of invested capital for secondary funds is generally lower relative to primary funds).
Benefits in a Portfolio Context
• Accelerated build-up of private equity exposure/faster deployment of capital: By acquiring secondaries, an investor can build up his private equity portfolio faster in a well-diversified manner compared to traditional primary commitments.
• Smoother cash flow profile: Mixing secondaries into a private equity portfolio will smooth out the cash flow profile, especially if the secondaries component is comprised of mature funds with shorter remaining holding periods.
• Diversification: By adding exposure to secondaries, an existing private equity portfolio broadens diversification along all metrics - across vintage years, sectors, geographies/regions, strategies and managers.
Quantitative Benefits
This section presents findings of our analysis of secondaries funds’ returns and risk characteristics as well as their liquidity profile in comparison with private equity and venture capital funds. In addition, we looked into return patterns across various
secondaries funds’ sizes. Analysis are based on data provided by Cambridge Associates and Preqin. Cambridge Associates’ dataset consists of performance information for 169 secondary funds and 3,298 global private equity and venture capital funds formed between 1993 and 2011 (Source: Cambridge Associates Secondary Funds Index, Global Private Equity & Venture Capital Index and Benchmark Statistics, as of December 31, 2015). The custom report from Preqin that we used included 142 secondary funds and 2,527 buyout and venture capital funds with known TVPIs, and covered vintage years from 1993 to 2011; that set of data was extracted on June 8, 2016.
Higher average IRR compared to single funds
We found that the average IRR of secondary funds in Cambridge Associates’ dataset at 16.7% was higher by 4.1% compared to 12.6% reached by global direct private equity and venture capital funds (see Exhibit 12).
We attribute this higher IRR to a) shorter holding periods in secondary investments (see also Exhibit 16) and b) the recognition of gains through re-valuations of assets that were purchased at a discount.
Slightly reduced TVPI ratios
However, we also found that secondary funds have lower net multiples compared to private equity and venture capital funds. The average Total-Value-to-Paid-in (“TVPI”) ratio was 0.17x – or approximately 10% – lower for secondary funds, reaching 1.55x. Private equity and venture capital funds had an average TVPI of 1.72x (see Exhibit 13).
Exhibit 12: Average Net IRR (in%)3Source: See Endnote 3
Exhibit 14: Volatility of Quarterly Returns⁵Source: See Endnote 5
Exhibit 13: Average TVPI Multiple⁴Source: See Endnote 4
What a CAIA Member Should Know
Alternative Investment Analyst ReviewQuarter 3 • 2016
16
We believe this is due to the fact that secondary purchases are typically being made at a later stage, when the underlying portfolios have already been marked up relative to the original cost basis.
Lower annualized volatility of quarterly returns
Further, we took a closer look at the volatility of global secondary fund returns versus the returns for single private equity and venture capital funds. We found returns from secondaries funds were less volatile on average: 10.8% annual volatility of quarterly returns versus 13.3%.
For this analysis, the annualized volatility of quarterly returns is calculated as the standard deviation on a series of quarterly net end-to-end returns based on cash adjusted NAVs from Q1 1993 to Q4 2015 (92 quarters) and annualized thereafter. The data set used included 196 secondary funds formed between 1991 and 2015, and the Cambridge Associates Global Private Equity & Venture Capital Index included 4,225 global private equity and venture capital funds formed between 1981 and 2015.
We think lower volatility is a result of secondary buyers entering funds at a later stage when compared to the original investor, which allows them to identify and adjust buy-in pricing for underperforming investments.
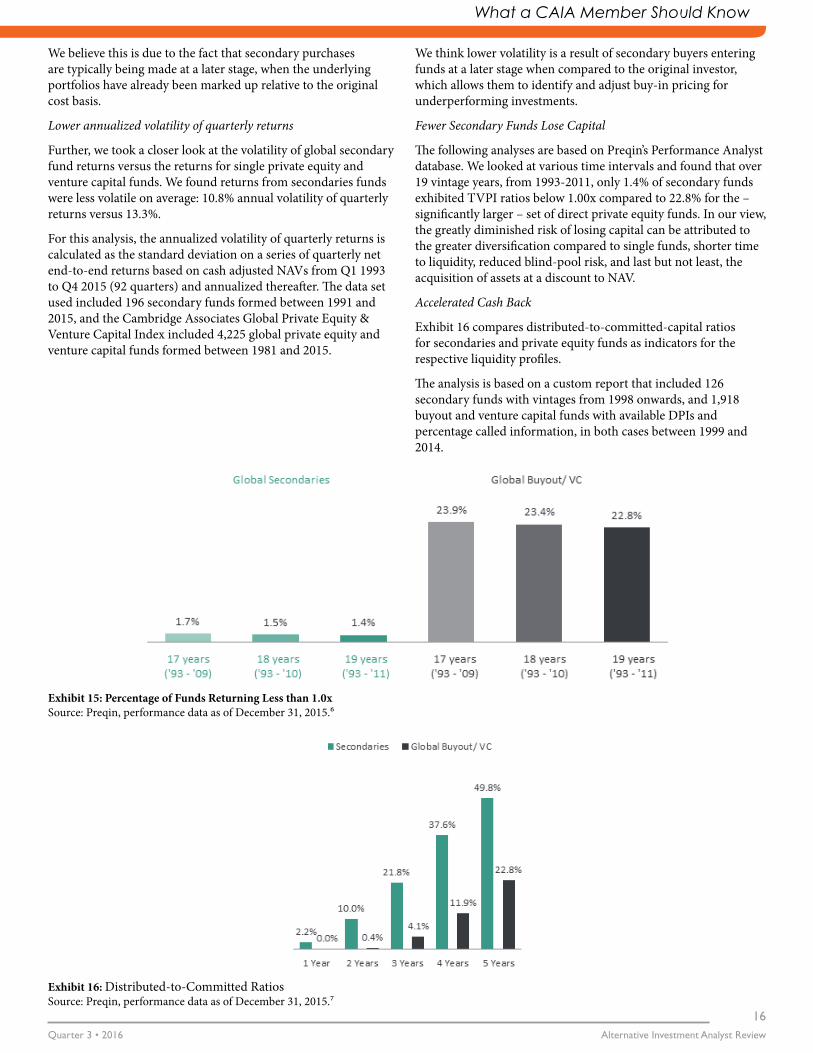
Fewer Secondary Funds Lose Capital
The following analyses are based on Preqin’s Performance Analyst database. We looked at various time intervals and found that over 19 vintage years, from 1993-2011, only 1.4% of secondary funds exhibited TVPI ratios below 1.00x compared to 22.8% for the – significantly larger – set of direct private equity funds. In our view, the greatly diminished risk of losing capital can be attributed to the greater diversification compared to single funds, shorter time to liquidity, reduced blind-pool risk, and last but not least, the acquisition of assets at a discount to NAV.
Accelerated Cash Back
Exhibit 16 compares distributed-to-committed-capital ratios for secondaries and private equity funds as indicators for the respective liquidity profiles.
The analysis is based on a custom report that included 126 secondary funds with vintages from 1998 onwards, and 1,918 buyout and venture capital funds with available DPIs and percentage called information, in both cases between 1999 and 2014.
Exhibit 15: Percentage of Funds Returning Less than 1.0x Source: Preqin, performance data as of December 31, 2015.⁶
Exhibit 16: Distributed-to-Committed Ratios Source: Preqin, performance data as of December 31, 2015.⁷
17Private Equity Secondaries
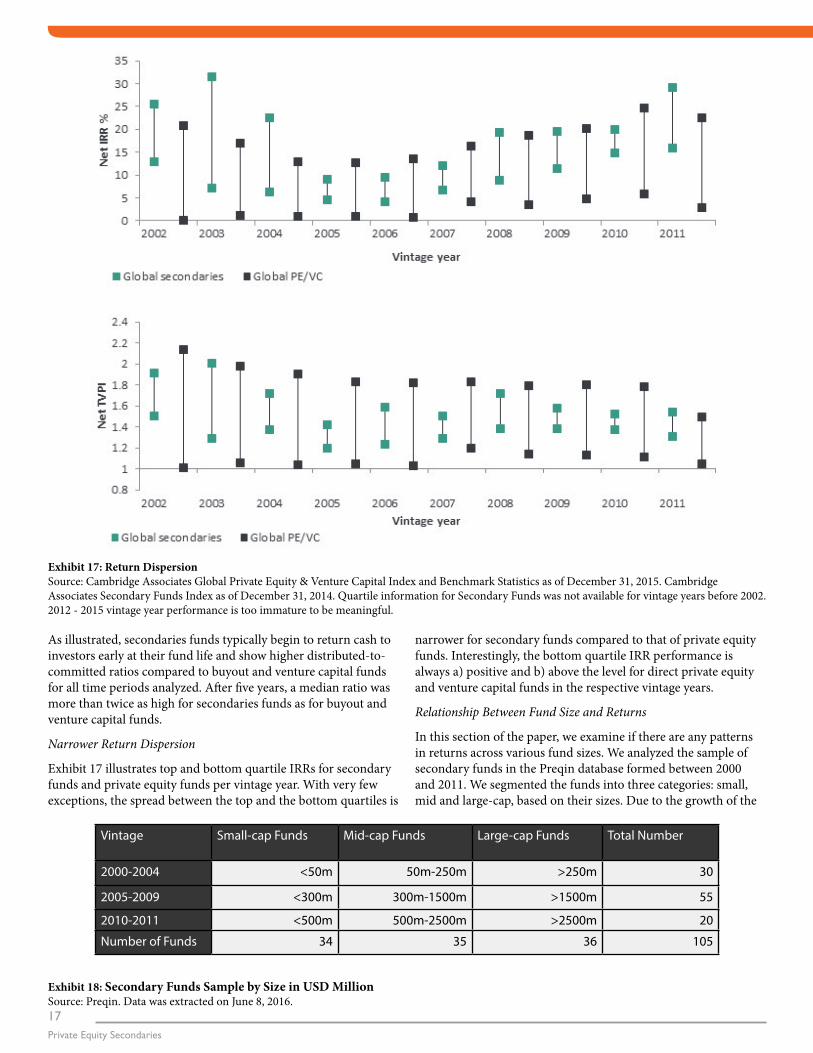
Exhibit 17: Return Dispersion Source: Cambridge Associates Global Private Equity & Venture Capital Index and Benchmark Statistics as of December 31, 2015. Cambridge Associates Secondary Funds Index as of December 31, 2014. Quartile information for Secondary Funds was not available for vintage years before 2002. 2012 - 2015 vintage year performance is too immature to be meaningful.
Exhibit 18: Secondary Funds Sample by Size in USD Million Source: Preqin. Data was extracted on June 8, 2016.
As illustrated, secondaries funds typically begin to return cash to investors early at their fund life and show higher distributed-to-committed ratios compared to buyout and venture capital funds for all time periods analyzed. After five years, a median ratio was more than twice as high for secondaries funds as for buyout and venture capital funds.
Narrower Return Dispersion
Exhibit 17 illustrates top and bottom quartile IRRs for secondary funds and private equity funds per vintage year. With very few exceptions, the spread between the top and the bottom quartiles is
narrower for secondary funds compared to that of private equity funds. Interestingly, the bottom quartile IRR performance is always a) positive and b) above the level for direct private equity and venture capital funds in the respective vintage years.
Relationship Between Fund Size and Returns
In this section of the paper, we examine if there are any patterns in returns across various fund sizes. We analyzed the sample of secondary funds in the Preqin database formed between 2000 and 2011. We segmented the funds into three categories: small, mid and large-cap, based on their sizes. Due to the growth of the
Vintage Small-cap Funds Mid-cap Funds Large-cap Funds Total Number
2000-2004 <50m 50m-250m >250m 30
2005-2009 <300m 300m-1500m >1500m 55
2010-2011 <500m 500m-2500m >2500m 20
Number of Funds 34 35 36 105
What a CAIA Member Should Know
Alternative Investment Analyst ReviewQuarter 3 • 2016
18
market, the fund size segmentation warranted a market evolution approach. As shown below, the segmentation yielded a balanced sample including 34 small-cap, 35 mid-cap and 36 large-cap secondary funds.
Quartile Returns by Fund Size
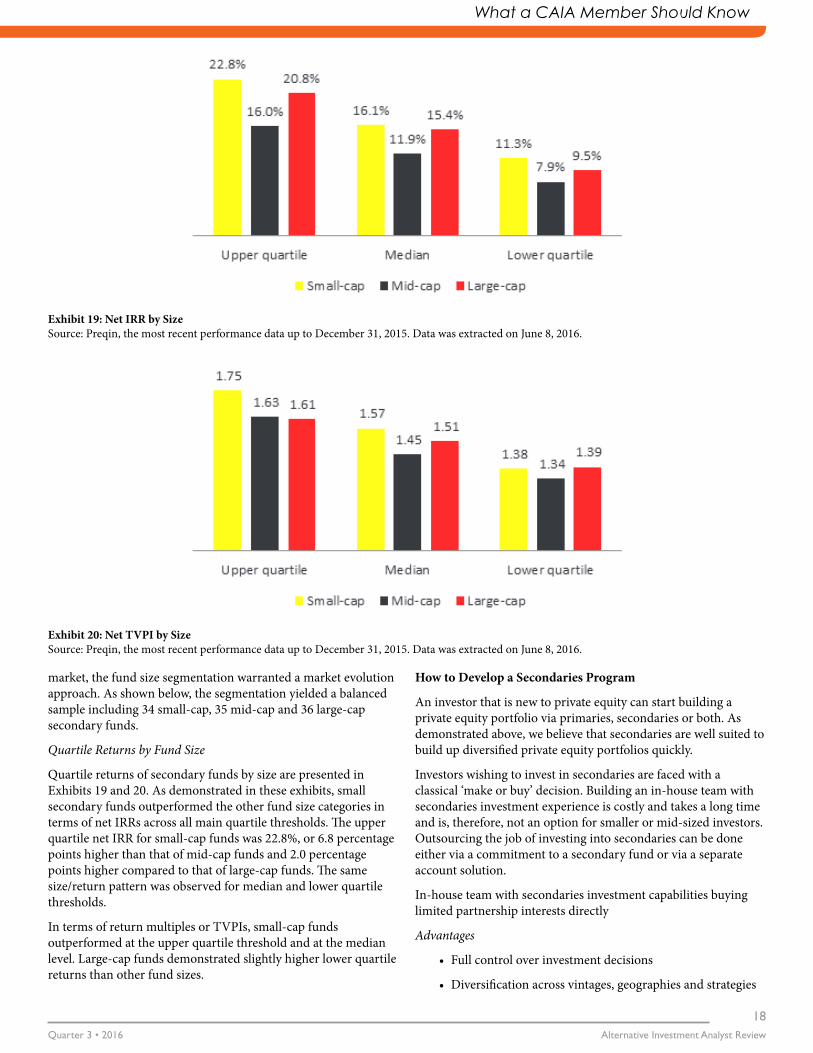
Quartile returns of secondary funds by size are presented in Exhibits 19 and 20. As demonstrated in these exhibits, small secondary funds outperformed the other fund size categories in terms of net IRRs across all main quartile thresholds. The upper quartile net IRR for small-cap funds was 22.8%, or 6.8 percentage points higher than that of mid-cap funds and 2.0 percentage points higher compared to that of large-cap funds. The same size/return pattern was observed for median and lower quartile thresholds.
In terms of return multiples or TVPIs, small-cap funds outperformed at the upper quartile threshold and at the median level. Large-cap funds demonstrated slightly higher lower quartile returns than other fund sizes.
How to Develop a Secondaries Program
An investor that is new to private equity can start building a private equity portfolio via primaries, secondaries or both. As demonstrated above, we believe that secondaries are well suited to build up diversified private equity portfolios quickly.
Investors wishing to invest in secondaries are faced with a classical ‘make or buy’ decision. Building an in-house team with secondaries investment experience is costly and takes a long time and is, therefore, not an option for smaller or mid-sized investors. Outsourcing the job of investing into secondaries can be done either via a commitment to a secondary fund or via a separate account solution.
In-house team with secondaries investment capabilities buying limited partnership interests directly
Advantages
• Full control over investment decisions
• Diversification across vintages, geographies and strategies
Exhibit 19: Net IRR by Size Source: Preqin, the most recent performance data up to December 31, 2015. Data was extracted on June 8, 2016.
Exhibit 20: Net TVPI by Size Source: Preqin, the most recent performance data up to December 31, 2015. Data was extracted on June 8, 2016.

19Private Equity Secondaries
Challenges
• Time: Building in-house capabilities (sourcing, due diligence, negotiation, transaction execution and portfolio monitoring) can take years
• Cost: It is costly to build an extensive sourcing network that can access most all segments of secondaries
• Decision making process. The decision making process must adjusted so that be accelerated capabilities are developed
• Complex process: Creating monitoring, reporting, compliance processes and capabilities can be complex and onerous
Outsourced solution – investments in private equity secondaries via funds or separate account solutions
Advantages
• Speed: Immediate access to the segment, highly scalable, little to no fixed costs
• Diversification: Outsourced solutions allow for effective diversification across all metrics (vintage years, geographies, strategies)
• Experience: Experienced and professional teams are employed to execute transactions, provide reporting and conduct monitoring
Challenges
• Limited control over investment decisions; nonetheless the provider will invest along pre-defined criteria (increased blind pool risk compared to the in-house approach)
• Additional fee layer; however, the additional fee drag scales up and down with exposure and comes with minimal to no fixed costs
Other Considerations
Discounts Versus Uplift
Some might argue that investing in secondaries is only about acquiring LP assets at deep discounts. We think that acquiring assets at a discount is important, but not the only key to successful secondaries transactions. Further elements to successful secondaries transactions are:
• Deep/long-standing relationships with GPs
• Refined understanding of valuation components and drivers for the acquired assets
• Value creation abilities of GPs
Use of Leverage
Some secondary providers apply leverage to their transactions (at the deal and/or fund level) in order to enhance returns. Generally speaking, leverage might lead to higher returns for the equity providers. However, it also has the potential to exacerbate interim adverse valuation movements and increases return volatility.
Concluding Remarks
Secondaries are a highly attractive asset class from a risk/return perspective and on an absolute return basis. We have provided a snapshot of the current state of the market for secondaries and a segmentation framework for investors seeking to access the asset class. Further, we have summarized the qualitative and quantitative benefits of secondaries, both on a stand-alone basis and in the context of private equity portfolios.
The results of our various analyses suggest that secondaries – secondary funds in particular – offer attractive return characteristics making them a valuable, complementary strategy to primary fund investments: historically higher average net IRR, lower levels of volatility, lower number of secondary funds that have lost capital, accelerated cash back and a lower return dispersion all suggest that secondary portfolios have historically generated attractive returns at greatly reduced risk of loss for investors. We believe that the small end of the secondaries market offers the most attractive opportunities for the various reasons outlined herein. Globally positioned managers with integrated primary, secondary and co-investment capabilities offer superior access to the asset class and provide their investors with the benefits of scale and reach. In our view, it is ideal to combine these two factors and access the asset class via a fund that invests in small secondary transactions on a global basis. Endnotes
1. Source: Setter Capital, 2015.
2. Source: NEPC
3. Source data: Cambridge Associates Secondary Funds Index, Global Private Equity & Venture Capital Index and Benchmark Statistics, as of December 31, 2015. The average IRR is a weighted average based on the number of funds in each vintage year. Capital weighted averages were not used to eliminate large cap bias as capitalization of each vintage year was not available.
4. Source data: Cambridge Associates Secondary Funds Index, Global Private Equity & Venture Capital Index and Benchmark Statistics, as of December 31, 2015. The average TVPI or Total Value to Paid In ratio is a weighted average based on the number of funds in each vintage year. Capital weighted averages were not used to eliminate large cap bias as capitalization of each vintage year was not available.
5. Methodology applied: For the purpose of this comparison, the annual volatility of quarterly returns of the Cambridge Associates Secondary Funds Index and Cambridge Associates Global Private Equity & Venture Capital Index is measured. Volatility is calculated as the standard deviation of a series of quarterly net end-to-end returns based on cash adjusted NAVs for the period Q1 1993 to Q4 2015 (92 quarters) and annualized thereafter. The Cambridge Associates Secondary Funds Index included data for 196 secondary funds, formed between 1991 and 2015, and the Cambridge Associates Global Private Equity & Venture Capital Index included 4,225 global private equity and venture capital funds, formed between 1981 and 2015. Source: Cambridge Associates Secondary Funds Index, Global Private Equity & Venture Capital Index and Benchmark Statistics, as of December 31, 2015.
6. Data was extracted on June 8, 2016.
7. The median ratio of distribution to committed capital (DCC) was calculated based on the distributions to paid-in capital (DPI) ratio and % of capital called by individual secondary, buyout and venture capital worldwide of the vintage years 1998 to 2014 from the Preqin Performance Analyst database. Methodology applied: DPI and % of capital called was not available for secondary funds older than 1998. The custom report included 126 secondary funds and 1,918 buyout venture capital funds with available DPI and % of capital called information as of the year end since 1999 through 2015. Gaps in reporting data for individual funds do not significantly distort results based on a test performed with a carry forward of DCC ratios for previously reported periods. Source: Preqin. Data was extracted on June 8, 2016.

What a CAIA Member Should Know
Alternative Investment Analyst ReviewQuarter 3 • 2016
20
Authors' Bios
Jochen Mende Senior Director Investment Management Capital Dynamics
Jochen is a Senior Director on the Secondaries team in Investment Management at Capital Dynamics. He has 11 years of experience in private equity and finance, and
has been involved in secondary and primary investments across the entire private equity spectrum including buyouts, venture capital, energy and distressed debt in Europe, the US, Asia and Latin America. Jochen holds a Diplom Kaufmann degree with honors from the University of Regensburg.
Joseph B. Marks, CFA Managing Director Investment Management Capital Dynamics
Joseph is a Managing Director and Head of Secondaries in Investment Management at Capital Dynamics. He has 18 years of experience in private equity. Prior to joining
us, Joseph was a principal at Coller Capital in New York where he was responsible for the origination, evaluation, and execution of secondary portfolio transactions. He holds a Bachelor's degree in Economics (Honors) from Stanford University, and an MBA and a Juris Doctor in Law from the University of California, Los Angeles. Joseph also holds the professional designation of Chartered Financial Analyst (CFA).
Kairat Perembetov Senior Vice President Research Capital Dynamics
Kairat is a Senior Vice President in Research at Capital Dynamics. Previously, Kairat worked as a financial controller with Burckhardt Compression AG, a Swiss
international engineering group. Kairat holds an honors degree in Economics from the Kazakh State Academy of Management, an MBA in Finance from St. John’s University and has completed a management training program at the University of St. Gallen.