Embed Size (px)
Citation preview
Engineering Geology xxx (2009) xxx–xxx
ENGEO-02966; No of Pages 7
Contents lists available at ScienceDirect
Engineering Geology
j ourna l homepage: www.e lsev ie r.com/ locate /enggeo
ARTICLE IN PRESS
Influence of temperature and salt concentration on the salt weathering of asedimentary stone with sodium sulphate
M. Angeli a,b,⁎, R. Hébert a, B. Menéndez a, C. David a, J.-P. Bigas c
a Université de Cergy-Pontoise, Département de Sciences de la Terre et Environnement CNRS UMR 7072, 5 mail Gay-Lussac, Neuville-sur-Oise, 95031 Cergy-Pontoise cedex, Franceb Norges Geotekniske Institutt, Sognsveien 72, Postboks 3930 Ullevål Stadion, 0806 Oslo, Norwayc CHRYSO, 7 rue de l'Europe, 45300 Sermaises, France
⁎ Corresponding author. Norges Geotekniske Institutt,Ullevål Stadion, 0806 Oslo, Norway. Tel.: +47 2202 198
E-mail address: [email protected] (M. Angeli).
0013-7952/$ – see front matter © 2009 Elsevier B.V. Adoi:10.1016/j.enggeo.2009.06.001
Please cite this article as: Angeli, M., et al.,with sodium sulphate, Engineering Geolog
a b s t r a c t
a r t i c l e i n f oArticle history:Received 23 February 2009Received in revised form 18 May 2009Accepted 2 June 2009Available online xxxx
Keywords:Salt crystallizationSedimentary rocksTemperatureSodium sulphateWeathering
The aim of this study is to evaluate how the ambient temperature and the salt concentration affect the saltdecay of a sedimentary stone. Samples of a detritic limestone have suffered cycles of accelerated ageing at 5,room temperature (around 22 °C) and 50 °C with brines which had different sodium sulphate concentration.The weight of the samples and of the pieces fallen off during the cycles has been monitored. The results showthat the damage is more important at 5 °C than at room temperature. The samples at 50 °C were intact atthe end of the experiment. Second, the weathering patterns are different at different temperatures: finecrumbling at 5 °C; coarse crumbling and contour scaling at room temperature. The decay seems also to be ofa different kind for each concentration at room temperature: crumbling at low concentration, contour scalingat high concentration. Crystallization seems to take place deeper inside the porous network of the stonewhen the concentration of salts in the brine is higher, that is to say when the brine viscosity is higher.
© 2009 Elsevier B.V. All rights reserved.
1. Introduction
Salts, and particularly sodium sulphate, are known to be among themost destructive agents in porous stones, concrete or brick weath-ering. The studyof its crystallizationmechanism is thus very importantto fully understand its damaging effect on porous networks and, inthe future, to find a way to prevent or limit it. Recent studies attributethe importance of sodium sulphate decay to the salt crystallizationpressure of its decahydrate phase (mirabilite Na2SO4.10H2O), ratherthan of its anhydrous phase (thenardite Na2SO4) (Rodriguez-Navarroand Doehne, 1999; Tsui et al., 2003; Angeli, 2007). Nevertheless somerecent works have noted that the unstable heptahydrated phase couldalso have an effect on the damaging effect of sodium sulphate (Rijnierset al., 2005; Hamilton and Hall, 2008; Steiger and Asmussen, 2008).Thermodynamic studies (Benavente et al., 1999; Flatt, 2002; Scherer,2004; Steiger, 2005a,b; Coussy, 2006) as well as experimental studies(Goudie, 1986, 1993; Rodriguez-Navarro and Doehne, 1999; Angeli,2007; Angeli et al., 2007) show that damage depends on the quantityof salt in the stone and the characteristics of the porous network, aswell as on the environmental conditions (e.g. temperature and relativehumidity).
Sognsveien 72, Postboks 39304.
ll rights reserved.
Influence of temperature any (2009), doi:10.1016/j.engg
This study aims to understand what role the temperature and thesalt content in the sample play in the decay of a sedimentary stone,regarding the type and intensity of damage. For this, accelerated ageingtests are performed on only one type of stone, a detritic limestone, andwith only one salt, sodium sulphate, but in different thermodynamicconditions (temperature and salt concentration of the brine).
2. Materials and methods
2.1. Materials
Twelve cubic (∼7×7×7 cm3) samples of a lutetian limestone fromthe Parisian Basin commercially known as “Roche fine” have beenused in this study. This rock has been chosen for several reasons: itsdetritic structure with unimodal porosity is much simpler to studythan other bioconstructed or crystallized limestones; it has beendemonstrated in previous tests (Angeli et al., 2006, 2007) that it isnot very resistant to salt decay hence the tests are quite fast; it ishomogeneous and very regular from one sample to the other, whichallows a very good reproducibility of the tests; it has beenwidely usedfor construction in Paris in the past time (buildings and historicalmonuments); and it is one of the rocks imposed for restoration andconstruction in the protected areas of the “Ile de France” region. Itis a fine-grained detritic limestone made of calcite (90%) and quartz(10%) with a high porosity (37.2%) and a very low tensile strength(1.5 MPa). Its pore distribution is unimodal which makes the study ofits modification easier. Complete hydromechanic properties are givenin Table 1.
d salt concentration on the salt weathering of a sedimentary stoneeo.2009.06.001

Table 1Hydromechanic properties of the “Roche Fine” (from Angeli et al., 2007).
Porosity % Absorption % Bulk densityg/cm3
Evaporationcoef. g/m2/s1/2
Capillary coef.g/m2/s1/2
Median poreradius µm
P wavevelocity m/s
Tensilestrength MPa
Roche fine (St Maximin) 37.2 75.9 1.7 67 1106 12 2898 1.5
2 M. Angeli et al. / Engineering Geology xxx (2009) xxx–xxx
ARTICLE IN PRESS
2.2. Methods
The twelve samples were subjected to accelerated ageing testsadapted from the European standard EN 12370. Those tests were rununder three different ambient temperatures: 5 °C, room temperature(RT∼25 °C), and 50 °C. It is important to notice that two ambientconditions are below the temperature limit of mirabilite stability(32.4 °C), the last one being above which means that no mirabilitecrystallization will occur for this experimental condition.
Three different concentrations of salt in solution have been used inthis study: 5, 12 and 25% of anhydrous sodium sulphate (thenardite)in weight. The tests have only been performed under six thermo-dynamic conditions: indeed the three following conditions (12%/5 °C,25%/5 °C and 25%/RT) are supersaturated with respect to mirabilite,that is to say that under these conditions a liquid solution would bemetastable, i.e. not suitable for capillary imbibitions. The sixthermodynamic conditions tested here are represented as stars onthe phase diagram (Fig. 1): 5%/5 °C; 5%/RT; 5%/50 °C; 12%/RT; 12%/50 °C; 25%/50 °C.
As can be seen on the figure, these conditions correspond tovarious saturation conditions of the sodium sulphate brine. Thissaturation ranges from 0 for pure water to 1 for full saturation. Thecloser the solution is to the full saturation conditions, the faster it willreach supersaturation hence weathering of the sample. This willhappen after fewer imbibitions for a higher saturation (Flatt, 2002;Coussy, 2006). Here are the six saturation conditions tested in thisstudy:
T=5 °C
Please cite this article as: Angeli, Mwith sodium sulphate, Engineering
5% in weight — around 0.85 saturation
T=25 °C 5% in weight — around 0.25 saturation12% in weight — around 0.60 saturation
T=50 °C 5% in weight — around 0.17 saturation12% in weight — around 0.40 saturation25% in weight — around 0.83 saturation
Fig. 1. Sodium sulphate phase diagram (Hougen et al., 1954). The black stars representthe six thermodynamic conditions studied.
These tests are composed of cycles which have a duration of 24 h.The cycles aremade of three different stages: imbibition at an ambienttemperature; drying; return to initial ambient temperature. Timingfor each stage is modified from the EN 12370 standard about stoneresistance to crystallization of salts in pores.
Let us describe in more details the three steps:
(i) 2 h imbibitionwith a brine (concentration of Na2SO4 is fixed bythe 6 thermodynamic conditions) is realized for the threedifferent ambient temperature conditions. Note that tempera-tures of imbibition solution are the same as ambient tempera-tures, i.e. respectively 5 °C, RT and 50 °C. Samples soak in acontainer with 1 cm height of solution. The level of solution ismaintained constant during all stages. Imbibition solution hasbeen prepared with sodium sulphate decahydrate and demi-neralised water. The cycles start at 16 h in the afternoon, theweighing at the beginning of this step will thus be called 16 hweighing.
(ii) Drying: All the samples are placed in a drying oven at 105 °C for16 h. Theweighingperformed at the beginningof this stepwill becalled the 18 h weighing. This step ends at 10 h in the morning.
(iii) Return to initial ambient temperature, i.e. 6 h of cooling from105 °C to respectively 5 °C, RT and 50 °C. The weighing per-formed at the beginning of this step is the 10 h weighing.
., et al., Influence of temperature anGeology (2009), doi:10.1016/j.engg
Sixteen full cycles have been performed during which all thesamples have been weighed three times per cycle (before imbibition,after imbibition, and after drying). The parts of the stones which fellduring the experiments with size from approximately 0.5 mm werecollected and weighed every cycle after drying. They will be referredto as “remains” until the end of the article. The only remains whichwere not collected consist in powder resulting from crumbling.
A cooled incubator is used for the 5 °C ambient environment. 50 °Cambient temperature is obtained using a drying oven and drying stagetakes place in a drying oven. Temperature is set up with a precisionof ±0.1 °C.
3. Results
3.1. General observations
The first thing to notice is that all the samples present a differentdecay from one thermodynamic condition to the other. Some picturesof each sample that are characteristic of the decay are presented inFig. 2. Future references to this figure will refer precisely to theexperimental condition and the number of the cycle.
At 50 °C, no damage has been noticed on none of the 6 samples,only harmless efflorescences on the sides of the samples (Fig. 2; 50 °C,cycle 15). At 5 °C, the damage starts directly as soon as the samplescontain salt, i.e. during the second cycle. After this cycle, few signs ofvery thin contour scaling appear (a few tenths of millimeters). Duringthe third cycle, the thin contour scaling almost ends and is followed bycrumbling. This crumbling is very regular throughout the cycles untilthe end of the test, and the particles lost form a very fine powder.
At RT, the decay processes are a little different. During the 5–6 firstcycles, the samples are slowly damaged. Efflorescences are observedas well as a decay of the lower parts of the samples, those who areimmersed during the tests. The efflorescences are unexpectedly moreimportant on the sample saturated with the 5% brine, i.e. with thelowest salt concentration. But at this point no major difference isobserved between the two concentrations of salts (5 and 12%). Fromapproximately the 6th cycle, contour scaling starts to appear on allsamples, with the detached part thicker for 12% than for 5%. In fact,
d salt concentration on the salt weathering of a sedimentary stoneeo.2009.06.001

Fig. 2. Evolution of the 7 cm cubic samples in the six thermodynamic conditions during the 25 weathering cycles. The picture of the most characteristic sample is shown to illustratedecay.
3M. Angeli et al. / Engineering Geology xxx (2009) xxx–xxx
ARTICLE IN PRESS
from this point on, the decay becomes different for the twoconcentrations. For 5% sodium sulphate, the contour scaling turnsrapidly into crumbling from cycle 8, and crumbling becomes almostthe only type of decay after cycle 11, although some residual scales arefound on the top of the sample (Fig. 2; 5%/RoomT). The remains turnthen into a very fine powder similar to the remains of the experimentsat 5 °C. On the other side, at 12% sodium sulphate, contour scalingcontinues to be the main type of decay, and the detached parts can beup to 1 cm thick. Thus, the decay in these conditions becomes highlydependent of the heterogeneities of the stone: although triggered bythe experimental conditions, contour scaling seems to be localized byflaws in the sample as opposed to crumbling which seems to beregular on the whole surface exposed to evaporation. These micro-structural differences imply also a slight variability in the weight lossschedule, since the scales can be separated from the sample at almostany moment after their apparition. This can explain the difference inthe two samples' weight evolution in this condition (12%/RT): earlyloss of scale for one and late loss of scale for the other, but moresamples tested in this condition are necessary to assess thishypothesis. This is also remarkable to notice that under very similarexperimental conditions (same salt, same stone, same cycles, sametemperature, and same RH) two samples show two different types ofdecay: crumbling and contour scaling, and it seems to depend only onthe quantity of salts contained in the brine.
3.2. Weight monitoring
The samples have been weighed three times during the cycles:before imbibition, after imbibition and after drying. This corresponds,as mentioned earlier, to the beginning of each step of the cycle. Thismeans that two of theweighing are performed on dry samples (beforeimbibition and after drying), and the other is performed on a fully
Please cite this article as: Angeli, M., et al., Influence of temperature anwith sodium sulphate, Engineering Geology (2009), doi:10.1016/j.engg
saturated sample. Fig. 3 presents an example of the weight monitor-ing. Fig. 3a presents the full weight evolution of a sample (A1) duringthe 15 cycles. The parts that fell off the samples during imbibition havealso been weighed.
The difference between the weights at 16 h and 18 h (before andafter imbibition; cf. 1.2.) corresponds to the increase due to the waterand salt supply minus the parts that fell off the sample. The differencebetween 18 h and 10 h (before and after drying in the oven; cf. 1.2.)corresponds to the loss of water and the loss of material (negligibleduring this stage). The difference between the weighing at 10 h and16 h (before and after cooling at room temperature; cf. 1.2.)corresponds only to the equilibration of the water content in thesample due to the change of environmental conditions, from the oven(105 °C; RHN90%) to room conditions (around 25 °C; 35–55%). Thedetailedweight variation during one cycle is presented on Fig. 3b. Fig. 4presents the weight evolution of the samples during the cycles. Thenoticeable curves that have been plotted are the evolution of normal-ized dry weight (Fig. 4a), normalized collected remains (Fig. 4b), andthe sum of normalized dry weight and normalized collected remains(Fig. 4c).
4. Discussion
4.1. Localization of crystallization
Themost striking feature of this experiment is the decay pattern ofthe samples. A difference in the kinetics of damage, i.e. the apparitionof the first signs of decay (alteration index AI, Angeli et al., 2007), andin the intensity was definitely suspected since the properties ofsodium sulphate, mainly saturation inwater, are very variable at thesethree temperatures as can be seen on sodium sulphate phase diagram(Fig. 1). Although these features have been observed during the
d salt concentration on the salt weathering of a sedimentary stoneeo.2009.06.001

Fig. 3. (a) Example weighings performed during the weathering cycles for a sample at5%/5 °C; (b) detail of the weighing performed during one cycle and of theirexperimental meaning.
4 M. Angeli et al. / Engineering Geology xxx (2009) xxx–xxx
ARTICLE IN PRESS
experiments, the most unexpected feature is that the type of decay isvery different from one thermodynamic condition to another.Complete values of AI and alteration velocity AV are presented inTable 2. These two parameters are introduced by Angeli et al. (2006,2007): AI corresponds to the number of the cycle during which onecan see the first sign of decay on the sample; AV is the slope of the plotrepresenting the weight loss in percent as a function of the cyclenumber, once the decay started to become regular. Note that thealteration velocity is not exactly the same as the one defined by Angeliet al. (2007): it can normally only be calculated once the decay hasbecome regular when salt uptake becomes negligible compared tomaterial loss. In this experiment, it is not always the case, but the AV isused anyway to characterize the weight variations. This causes a smallbias in the interpretation of the data. Sincewe do not have reached thesteady state degradation in the case of 12%/RT, i.e. passed the weightincrease and shape effect (phase III in Angeli et al., 2007), the AV islower at 12% than at 5%. But this would not have been the case with ahigher number of cycles, as suggested by the big scales starting toappear on the samples at 12%.
At 50 °C, whatever the salt concentration, the samples do not sufferany damage from salt crystallization. The weight of the sample keepsincreasing through the 15 cycles of the experimental ageing test. Thisweight increases linearly with brines at 5 and 12% sodium sulphate.For the samples filled with 25% sodium sulphate brine, the weightevolution shows 2 parts: first, until cycle 5, the weight gain isapproximately constant at around 4%/cycle. From a porosity of 37.2%and a saturation of 25% inweight, one would expect a weight increaseof 9.3%/cycle since the samples are fully saturated during each cycle.This difference could be due to the relative big size of the pores in this
Please cite this article as: Angeli, M., et al., Influence of temperature anwith sodium sulphate, Engineering Geology (2009), doi:10.1016/j.engg
stone, hence a small surface area leaving very few places for the salt tocrystallize. Then, after cycle 5, the weight gain is still grossly linear butwith a lower weight gain (approximately 1%/cycle): this diminutionin the weight increase is due to the progressive saturation of theporous network by the presence of salts from precedent imbibitions.
Tsui et al. (2003) concluded from their experimental ageing testsperformed at 50 °C that mirabilite was the damaging phase of sodiumsulphate under 32.4 °C, and that crystallization of thenardite wasalmost not dangerous for the stones. This study confirms theharmlessness of thenardite, since none of the samples that sufferedthe test at 50 °C has been damaged. Nevertheless, it is not possible toassess from our experimental observations whether mirabilite or theunstable heptahydrated phase causes damage at 5 °C and RT sinceboth could have crystallized under these conditions.
At 5%/5 °C, we observe almost only crumbling or granulardisintegration, except for the very beginning where a very thincontour scaling seems to be initiated (cycle 2). At 5%/RT, the pattern isvery similar: decay starts with very thin contour scaling and at onemoment shifts to crumbling. The only difference is that this shifthappens later at RT (cycles 6–7 instead of cycle 2), which is quitenormal; it is now generally accepted that supersaturation of thesolution is a mandatory condition to salt damage (Correns, 1949).Sodium sulphate saturation is higher at RT (∼18%) than at 5 °C (∼6%),thus more thenardite needs to be dissolved in the 5% Na2SO4 brine toreach supersaturation at RT than at 5 °C. This supersaturation occursthen after more cycles of imbibition and drying (Flatt, 2002; Coussy,2006). In both cases, the crystallization of sodium sulphate occursthus close to the surface.
At 12%/RT, the decay of the samples starts after 3 cycles (Table 2).At first it is very similar to what happens with the 5% brine, that is tosay a few efflorescences and small damage on the corners of theimmersed parts. Contour scaling also occurs after cycles 6–7, but thistime with much thicker scales. These scales can have a thickness up to1 cm as observed on Fig. 2 (12%/RT, cycles 10 and 15). This contourscaling suggests that the crystallization of sodium sulphate takes placedeeper under the surface of the samples (Ioannou et al., 2005).Temperature and concentration of salt in the brine are thus not onlyresponsible for the presence or absence of damage, but also have aninfluence on the damage patterns.
4.2. Weight monitoring
4.2.1. Dry samplesFig. 4a presents the evolution of the dry sampleweights as a function
of the cycles. This evolution is normalized in order to be able to comparethe weight gains as a function of the concentration of salt in the brines.An important thing to notice is that the experiments are reproducible:for each condition, the two samples have a very similar weightevolution. The only exception is the 12%/RT condition: we can clearlysee a difference between the two samples from cycle 8. This difference isdue to the typeofdecaywhich is at stakehere: thismoment correspondsto the start of a thick contour scaling on both samples. The decaybecomes thus more dependent on the pre-existent heterogeneities ofthe samples, as explained earlier in the general observations. In this casethefirst sample lost a piece close to a corner at the bottomof the sample,while the other kept all his scales during thewhole experiment. Despitethis variation, the alteration velocities of the two samples in thisthermodynamic condition become similar from the tenth cycle.
The weight plots allow quantifying the observations made on thesamples. It is clear on Fig. 4a that themost damaged samples are thoseat 5 °C, although the quantity of salt in them is lower than at the othertemperatures due to a lower solubility of sodium sulphate in water atlow temperature. The low temperature allows a fast supersaturationand thus a very fast apparition of decay. After 15 cycles, these sampleshave lost 20% of their initial weight, with a final AV of 2% per cycle. Thesamples in the 5%/RT conditions suffer also from crumbling from the
d salt concentration on the salt weathering of a sedimentary stoneeo.2009.06.001

Fig. 4. (a) Weight evolution of the 12 samples in dry state. (b)Weight evolution of the collected remains. The remains are collected only once per cycle, i.e. it is impossible to part theloss during imbibition from the loss during drying. Since the samples at 50 °C were not damaged at the end of the test, they have produced absolutely no damage. Their weightevolution has thus not been reported on the figure. (c) Weight evolution of the combined weight (dry state+collected remains) of the 12 samples.
5M. Angeli et al. / Engineering Geology xxx (2009) xxx–xxx
ARTICLE IN PRESS
7th cycle: this crumbling starts later since supersaturation is reachedfaster at 5 °C than at room temperature. The weight loss in this casebecomes significant only after the 10th cycle. Once this crumbling hasstarted, the AV becomes almost the same as in the 5%/5 °C conditions.
4.2.2. Collected remainsFig. 4b presents the weight of the remains that are collected for
each sample during the cycles. In order to compare the weight losses,
Please cite this article as: Angeli, M., et al., Influence of temperature anwith sodium sulphate, Engineering Geology (2009), doi:10.1016/j.engg
these weights have been normalized to the weight of the initial cleansample. Let us remind here that all the remains have been collectedexcept the finest powder coming from the crumbling of the samples.An interesting thing to notice is that crumbling causes a regular loss ofmaterial at every cycle, as demonstrated by the weight of the materialloss by the samples at 5%/5 °C. This is opposed to the material lossduring contour scalingwhich is more random, as proved by theweightof the material lost by the 12%/RT samples.
d salt concentration on the salt weathering of a sedimentary stoneeo.2009.06.001
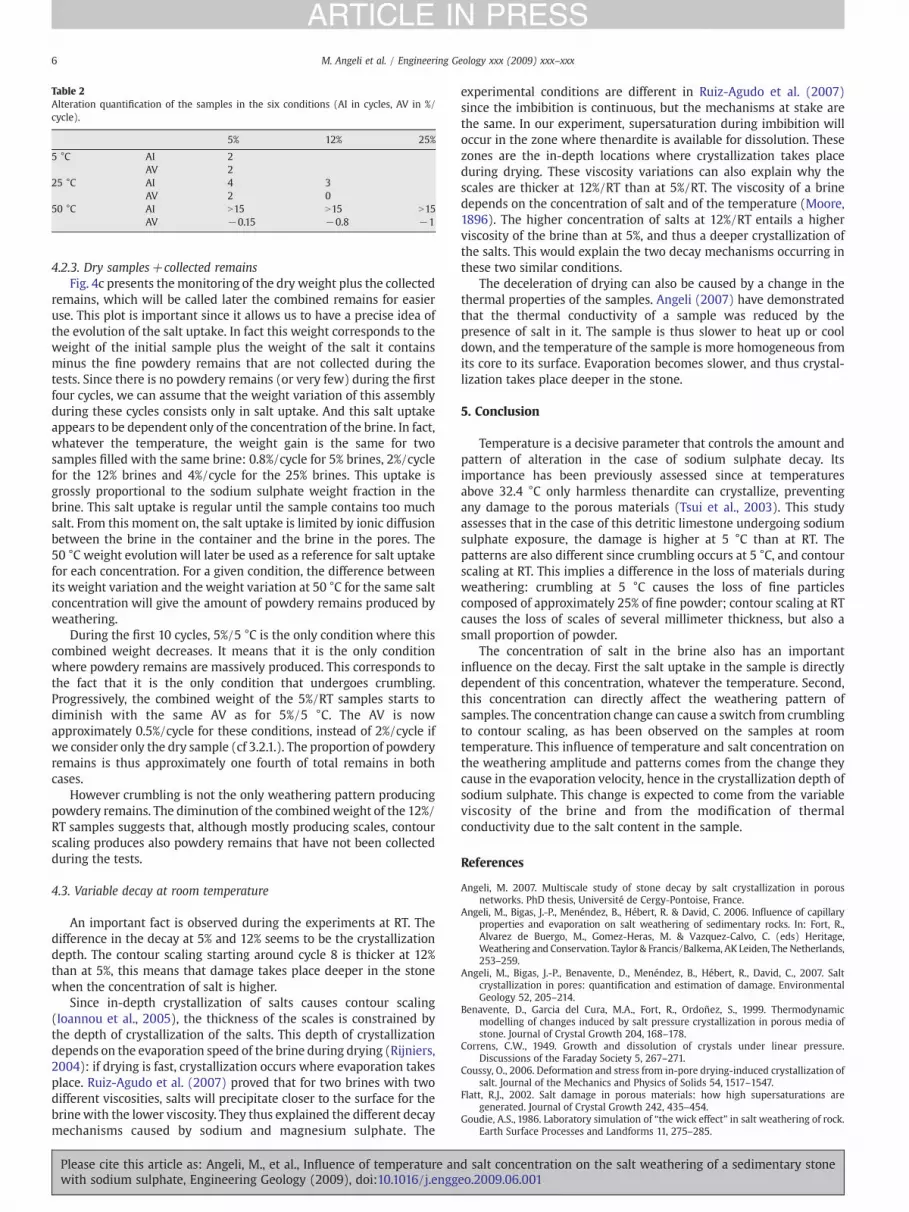
Table 2Alteration quantification of the samples in the six conditions (AI in cycles, AV in %/cycle).
5% 12% 25%
5 °C AI 2AV 2
25 °C AI 4 3AV 2 0
50 °C AI N15 N15 N15AV −0.15 −0.8 −1
6 M. Angeli et al. / Engineering Geology xxx (2009) xxx–xxx
ARTICLE IN PRESS
4.2.3. Dry samples+collected remainsFig. 4c presents themonitoring of the dry weight plus the collected
remains, which will be called later the combined remains for easieruse. This plot is important since it allows us to have a precise idea ofthe evolution of the salt uptake. In fact this weight corresponds to theweight of the initial sample plus the weight of the salt it containsminus the fine powdery remains that are not collected during thetests. Since there is no powdery remains (or very few) during the firstfour cycles, we can assume that the weight variation of this assemblyduring these cycles consists only in salt uptake. And this salt uptakeappears to be dependent only of the concentration of the brine. In fact,whatever the temperature, the weight gain is the same for twosamples filled with the same brine: 0.8%/cycle for 5% brines, 2%/cyclefor the 12% brines and 4%/cycle for the 25% brines. This uptake isgrossly proportional to the sodium sulphate weight fraction in thebrine. This salt uptake is regular until the sample contains too muchsalt. From this moment on, the salt uptake is limited by ionic diffusionbetween the brine in the container and the brine in the pores. The50 °C weight evolution will later be used as a reference for salt uptakefor each concentration. For a given condition, the difference betweenits weight variation and the weight variation at 50 °C for the same saltconcentration will give the amount of powdery remains produced byweathering.
During the first 10 cycles, 5%/5 °C is the only condition where thiscombined weight decreases. It means that it is the only conditionwhere powdery remains are massively produced. This corresponds tothe fact that it is the only condition that undergoes crumbling.Progressively, the combined weight of the 5%/RT samples starts todiminish with the same AV as for 5%/5 °C. The AV is nowapproximately 0.5%/cycle for these conditions, instead of 2%/cycle ifwe consider only the dry sample (cf 3.2.1.). The proportion of powderyremains is thus approximately one fourth of total remains in bothcases.
However crumbling is not the only weathering pattern producingpowdery remains. The diminution of the combinedweight of the 12%/RT samples suggests that, although mostly producing scales, contourscaling produces also powdery remains that have not been collectedduring the tests.
4.3. Variable decay at room temperature
An important fact is observed during the experiments at RT. Thedifference in the decay at 5% and 12% seems to be the crystallizationdepth. The contour scaling starting around cycle 8 is thicker at 12%than at 5%, this means that damage takes place deeper in the stonewhen the concentration of salt is higher.
Since in-depth crystallization of salts causes contour scaling(Ioannou et al., 2005), the thickness of the scales is constrained bythe depth of crystallization of the salts. This depth of crystallizationdepends on the evaporation speed of the brine during drying (Rijniers,2004): if drying is fast, crystallization occurs where evaporation takesplace. Ruiz-Agudo et al. (2007) proved that for two brines with twodifferent viscosities, salts will precipitate closer to the surface for thebrinewith the lower viscosity. They thus explained the different decaymechanisms caused by sodium and magnesium sulphate. The
Please cite this article as: Angeli, M., et al., Influence of temperature anwith sodium sulphate, Engineering Geology (2009), doi:10.1016/j.engg
experimental conditions are different in Ruiz-Agudo et al. (2007)since the imbibition is continuous, but the mechanisms at stake arethe same. In our experiment, supersaturation during imbibition willoccur in the zone where thenardite is available for dissolution. Thesezones are the in-depth locations where crystallization takes placeduring drying. These viscosity variations can also explain why thescales are thicker at 12%/RT than at 5%/RT. The viscosity of a brinedepends on the concentration of salt and of the temperature (Moore,1896). The higher concentration of salts at 12%/RT entails a higherviscosity of the brine than at 5%, and thus a deeper crystallization ofthe salts. This would explain the two decay mechanisms occurring inthese two similar conditions.
The deceleration of drying can also be caused by a change in thethermal properties of the samples. Angeli (2007) have demonstratedthat the thermal conductivity of a sample was reduced by thepresence of salt in it. The sample is thus slower to heat up or cooldown, and the temperature of the sample is more homogeneous fromits core to its surface. Evaporation becomes slower, and thus crystal-lization takes place deeper in the stone.
5. Conclusion
Temperature is a decisive parameter that controls the amount andpattern of alteration in the case of sodium sulphate decay. Itsimportance has been previously assessed since at temperaturesabove 32.4 °C only harmless thenardite can crystallize, preventingany damage to the porous materials (Tsui et al., 2003). This studyassesses that in the case of this detritic limestone undergoing sodiumsulphate exposure, the damage is higher at 5 °C than at RT. Thepatterns are also different since crumbling occurs at 5 °C, and contourscaling at RT. This implies a difference in the loss of materials duringweathering: crumbling at 5 °C causes the loss of fine particlescomposed of approximately 25% of fine powder; contour scaling at RTcauses the loss of scales of several millimeter thickness, but also asmall proportion of powder.
The concentration of salt in the brine also has an importantinfluence on the decay. First the salt uptake in the sample is directlydependent of this concentration, whatever the temperature. Second,this concentration can directly affect the weathering pattern ofsamples. The concentration change can cause a switch from crumblingto contour scaling, as has been observed on the samples at roomtemperature. This influence of temperature and salt concentration onthe weathering amplitude and patterns comes from the change theycause in the evaporation velocity, hence in the crystallization depth ofsodium sulphate. This change is expected to come from the variableviscosity of the brine and from the modification of thermalconductivity due to the salt content in the sample.
References
Angeli, M. 2007. Multiscale study of stone decay by salt crystallization in porousnetworks. PhD thesis, Université de Cergy-Pontoise, France.
Angeli, M., Bigas, J.-P., Menéndez, B., Hébert, R. & David, C. 2006. Influence of capillaryproperties and evaporation on salt weathering of sedimentary rocks. In: Fort, R.,Alvarez de Buergo, M., Gomez-Heras, M. & Vazquez-Calvo, C. (eds) Heritage,Weathering and Conservation. Taylor & Francis/Balkema, AK Leiden, The Netherlands,253–259.
Angeli, M., Bigas, J.-P., Benavente, D., Menéndez, B., Hébert, R., David, C., 2007. Saltcrystallization in pores: quantification and estimation of damage. EnvironmentalGeology 52, 205–214.
Benavente, D., Garcia del Cura, M.A., Fort, R., Ordoñez, S., 1999. Thermodynamicmodelling of changes induced by salt pressure crystallization in porous media ofstone. Journal of Crystal Growth 204, 168–178.
Correns, C.W., 1949. Growth and dissolution of crystals under linear pressure.Discussions of the Faraday Society 5, 267–271.
Coussy, O., 2006. Deformation and stress from in-pore drying-induced crystallization ofsalt. Journal of the Mechanics and Physics of Solids 54, 1517–1547.
Flatt, R.J., 2002. Salt damage in porous materials: how high supersaturations aregenerated. Journal of Crystal Growth 242, 435–454.
Goudie, A.S., 1986. Laboratory simulation of “the wick effect” in salt weathering of rock.Earth Surface Processes and Landforms 11, 275–285.
d salt concentration on the salt weathering of a sedimentary stoneeo.2009.06.001

7M. Angeli et al. / Engineering Geology xxx (2009) xxx–xxx
ARTICLE IN PRESS
Goudie, A.S., 1993. Salt weathering simulation using a single-immersion technique.Earth Surface Processes and Landforms 18, 369–376.
Hamilton, A., Hall, C., 2008. Sodium sulfate heptahydrate: a synchrotron energy-dispersive diffraction study of an elusive metastable hydrated salt. Journal ofAnalytical Atomic Spectrometry 23, 840–844.
Hougen, O.A., Watson, K.W., Ragatz, R.A., 1954. Chemical Process Principles. Part I, 2nd ed.Wiley, New York.
Ioannou, I., Hall, C., Hoff, W.D., Pugsley, V.A., Jacques, S.D.M., 2005. Synchrotronradiation energy-dispersive X-ray analysis of salt distribution in Lépine limestone.Analyst 130, 1006–1008.
Moore, B.E., 1896. On the viscosity of certain salt solution. The Physical Review 5,312–334.
Rijniers, L.A. 2004. Salt crystallization in porous materials: a NMR study. PhD thesis,Techniche Universiteit Eindhoven, The Netherlands.
Rijniers, L.A., Huinink, H.P., Pel, L., Kopinga, K., 2005. Experimental evidence ofcrystallization pressure inside porous media. Physical Review Letters 94,0755031–0755034.
Please cite this article as: Angeli, M., et al., Influence of temperature anwith sodium sulphate, Engineering Geology (2009), doi:10.1016/j.engg
Rodriguez-Navarro, C., Doehne, E., 1999. Salt weathering: influence of evaporation rate,supersaturation and crystallization pattern. Earth Surface Processes and Landforms24, 191–209.
Ruiz-Agudo, E., Mees, F., Jacobs, P., Rodriguez-Navarro, C., 2007. The role of salinesolution properties on porous limestone salt weathering by magnesium andsodium sulfates. Environmental Geology 52, 269–281.
Scherer, G., 2004. Stress from crystallization of salt. Cement and Concrete Research 34,1613–1624.
Steiger, M., 2005a. Crystal growth in porousmaterials— I: the crystallization pressure oflarge crystals. Journal of Crystal Growth 282, 455–469.
Steiger, M., 2005b. Crystal growth in porous materials — II: influence of crystal size onthe crystallization pressure. Journal of Crystal Growth 282, 470–481.
Steiger, M., Asmussen, S., 2008. Crystallization of sodium sulfate phases in porousmaterials: the phase diagramNa2SO4–H2O and the generation of stress. Geochimicaet Cosmochimica Acta 72, 4291–4306.
Tsui, N., Flatt, R.J., Scherer, G.W., 2003. Crystallization damage by sodium sulphate.Journal of Cultural Heritage 4, 109–115.
d salt concentration on the salt weathering of a sedimentary stoneeo.2009.06.001