Embed Size (px)
Citation preview
HAL Id: hal-03548849https://hal-univ-pau.archives-ouvertes.fr/hal-03548849
Submitted on 31 Jan 2022
HAL is a multi-disciplinary open accessarchive for the deposit and dissemination of sci-entific research documents, whether they are pub-lished or not. The documents may come fromteaching and research institutions in France orabroad, or from public or private research centers.
L’archive ouverte pluridisciplinaire HAL, estdestinée au dépôt et à la diffusion de documentsscientifiques de niveau recherche, publiés ou non,émanant des établissements d’enseignement et derecherche français ou étrangers, des laboratoirespublics ou privés.
Distributed under a Creative Commons Attribution| 4.0 International License
Can Weathering of Banded Iron Formations GenerateNatural Hydrogen? Evidence from Australia, Brazil and
South AfricaUgo Geymond, Erick Ramanaidou, Dan Lévy, Abderrahim Ouaya, Isabelle
Moretti
To cite this version:Ugo Geymond, Erick Ramanaidou, Dan Lévy, Abderrahim Ouaya, Isabelle Moretti. Can Weatheringof Banded Iron Formations Generate Natural Hydrogen? Evidence from Australia, Brazil and SouthAfrica. Minerals, MDPI, 2022, 12 (2), pp.163. �10.3390/min12020163�. �hal-03548849�

�����������������
Citation: Geymond, U.; Ramanaidou,
E.; Lévy, D.; Ouaya, A.; Moretti, I.
Can Weathering of Banded Iron
Formations Generate Natural
Hydrogen? Evidence from Australia,
Brazil and South Africa. Minerals
2022, 12, 163. https://doi.org/
10.3390/min12020163
Academic Editors: Blandine
Gourcerol, Phil C. Thurston and
Sylvestre Ganno
Received: 23 December 2021
Accepted: 25 January 2022
Published: 28 January 2022
Publisher’s Note: MDPI stays neutral
with regard to jurisdictional claims in
published maps and institutional affil-
iations.
Copyright: © 2022 by the authors.
Licensee MDPI, Basel, Switzerland.
This article is an open access article
distributed under the terms and
conditions of the Creative Commons
Attribution (CC BY) license (https://
creativecommons.org/licenses/by/
4.0/).
minerals
Article
Can Weathering of Banded Iron Formations Generate NaturalHydrogen? Evidence from Australia, Brazil and South AfricaUgo Geymond 1 , Erick Ramanaidou 2, Dan Lévy 1, Abderrahim Ouaya 3 and Isabelle Moretti 1,*
1 Laboratoire des Fluides Complexes et leurs Réservoirs (LFCR)—E2S UPPA, Université de Pau et des Pays del’Adour, 64012 Pau, France; [email protected] (U.G.); [email protected] (D.L.)
2 Commonwealth Scientific and Industrial Research Organisation (CSIRO), Kensington, WA 6151, Australia;[email protected]
3 Laboratoire des Sciences du Climat et de l’Environnement (LSCE), IPSL, CEA-CNRS-UVSQ,Université Paris-Saclay, 91190 Gif-sur-Yvette, France; [email protected]
* Correspondence: [email protected]
Abstract: Oxidation of iron-rich rock is known to generate H2 in oceanic as well as in continentaldomains. Here we tested the possibility of H2 generation as the result of weathering of banded ironformations (BIF). The BIF constitute more than 60% of global iron ore reserves with low Fe3+/Fetot
and total Fe ranging from 20 to 40 wt% and are therefore good candidates for H2 production potential.In the vicinity of BIF-hosted iron mines in Australia, Brazil and South Africa, satellite imaging hasrevealed the presence of sub-circular depressions that usually are the proxy of H2-emitting features.A morphological comparison of the sub-circular depressions with the ones observed in previousstudies point to probable H2 seeping in these areas. In parallel, a petrological study conducted onaltered and fresh BIF samples from the Hamersley Province in Western Australia also suggests H2
generation during BIF weathering. Indeed, mineral transitions from ferrous silicate (riebeckite and/orminnesotaite) to ferric iron oxi-hydroxides (goethite) or from ferrous and ferric oxides (magnetite)to exclusively ferric oxides (maghemite, hematite, goethite) were observed on the samples. Theoxidation of ferrous iron by aqueous fluids circulating through and leaching the BIF is promising forH2 generation. The BIF weathering profile suggests that the limiting factor is the presence of water,and that this reaction is happening at, or near, surface temperature. This challenges the idea thathigh temperatures are required to generate H2 as it is the case during the serpentinization. The linkbetween BIF and H2 will have however to be further investigated to better constrain the reactionsand their kinetics.
Keywords: natural hydrogen; banded iron formation; iron mine; Australia; South-Africa
1. Introduction1.1. Global Context
Ongoing ecological transition and society’s decarbonization have pushed dihydrogen(H2) under the spotlight, as it has the desired qualities to be a clean energy source, andespecially a clean fuel, as it emits no CO2 during combustion and it has a high calorificpower [1,2]. The demand for H2 to play a role in the energy mix of tomorrow is high,and almost all countries have now a hydrogen road map. However, H2 is currentlymainly produced by polluting processes and used as raw material. Its green mobility isonly starting and, as such, natural H2 as an energy source or vector is becoming moreinvestigated.
First described at the end of the 1970’s offshore along the mid-oceanic ridges, H2emissions in an oceanic context have been abundantly studied for 40 years [3–5]. Theserpentinization process is consequently well known, leading to the oxidation of Fe2+
contained in ferromagnesian minerals found in oceanic lithosphere associated with thereduction of water leading to H2 generation.
Minerals 2022, 12, 163. https://doi.org/10.3390/min12020163 https://www.mdpi.com/journal/minerals

Minerals 2022, 12, 163 2 of 28
In the past decade, studies revealed that H2 emissions also occur in a continental con-text and have been described on wells [6,7] or seeps at the ground level [8–10], especiallyin intracratonic areas [11–14]. There are numerous proposed sources of H2, and the morestudied ones are (1) iron oxidation and water reduction, (2) radiolysis, (3) radio-mechanicaland (4) primordial H2. Because (1) is the more accepted mechanism leading to H2 genera-tion, targeting Fe-rich lithologies that could be oxidized can be a good proxy to look forH2-releasing zones in continental domains.
1.2. An Iron Rich Facies: The Banded Iron Formations
Banded Iron Formations (BIF) are Precambrian sedimentary rocks of marine origin,present in cratonic areas found in all continents [15,16]. Radiochronologic dating showedthat they formed during two periods in Earth’s history: 3500–1800 My (Archean and mainlyProterozoic) and 900–500 My (Neoproterozoic) [17]. It is generally accepted that they precip-itated from ferrous iron previously dissolved in oceanic waters as Fe2+(aq) and transformedin Fe3+ by cyanobacteria producing oxygen or via photoferritroph organisms [18]. For theNeoproterozoic BIF, the precipitation might be related to the oxygenation of oceans duringinterglacier cycles of the Snowball Earth, after long times of anoxia created by the coveringof oceans by ice [19].
Today, BIF constitute the biggest iron ore reserves, with the presence of both ferricand ferrous iron, reaching more than 60% of global iron reserves on Earth [20]. Currently,metallurgy compagnies mostly extract iron from BIF (about 90% of total iron production)as in Australia, Brazil, China or India among others. They focus on BIF-hosted ores, whereiron content is higher (up to 68 wt%; [21]) and exclusively ferric. In parallel, the iron contentin non-weathered BIF is lower (from 20 to 40 wt%; [22]) but highly ferrous and thus appearsvery promising for H2 generation by redox reaction.
1.3. Proxy of H2 Emanations: Sub-Circular Depressions
Sub-circular depressions (SCD), also called “fairy circles” [12], have been describedon the surface of unconsolidated sedimentary layer, covering a much older basement ofPrecambrian origin. In some cases, the presence of H2 in these SCD have been proven andwe will hence call them P_H2_SCD. In other cases, the presence of H2 has not been provenyet and we will hence just call them SCD. So far, assumptions have been made that thesefeatures represent the morphological expression in the landscape of a deeper on-going H2generation or leakage, even if these features and the related H2 emissions can vary in spaceand time [23,24].
Over the past 10 years, works in continental domain have focused on these SCD-emitting H2, which are now observed worldwide, and P_H2_SCD has been describedin the North American [10], Russian [25], Brazilian [9,13] and Western Australian cra-tons [12,26,27]. A statistical work based on SCD in Russia, Australia and Brazil showedthat they can be discriminated from other circular depressions such as karstic features bystudying their morphology [12]. Other features, characterized by a rather circular gap ofvegetation and also called fairy circles, have been described in Namibia [28], but they areflat and often smaller and so can be differentiated from the gas emitting structures.
Thus, the mapping of the SCD is valuable to track the emissions of H2 and start anexploration process through a remote sensing survey of the basins. The spatial correlationbetween the high density of the SCD and Archean or Neoproterozoic cratons has also beennoticed by previous authors [12] (Figure 1) and raises the question of the origins of H2emissions in intracratonic areas.

Minerals 2022, 12, 163 3 of 28Minerals 2022, 12, x FOR PEER REVIEW 3 of 29
Figure 1. World map of the Precambrian cratons and locations of the study areas. Dark grey corre-
sponds to Precambrian cratons.
1.4. Aim of the Study
In this paper, we explore a possible source rock type for H2 generation in cratonic
areas: reduction of water during oxidation of ferrous minerals in BIF. We focus here on
three areas located in Australia, Brazil and South Africa, and two complementary ap-
proaches are used to characterize the link between H2 releases and BIF.
At a large scale, a spatial correlation study is conducted on the presence of sub-cir-
cular depressions mapped in the vicinity of iron mines or outcropping BIF in the areas of
interest (Figure 1), based on satellite imaging. Their characteristics in terms of size and
footprint are compared with those of the P_H2_SCD with measured H2 emanations pub-
lished previously in Australia, Brazil and Russia [12].
Secondly, the potential for H2 production through BIF oxidation is evaluated. To do
so, available data in literature are discussed, and results of our petrological study con-
ducted on BIF samples from Australia are presented. The possibility to have an oxidation
and therefore H2 production near the surface, involving very low temperature of genera-
tion, will be discussed.
2. Study Locations and Geological Settings
2.1. Australia
Australia is subdivided into three major Precambrian cratonic units, respectively: the
North Australian Craton, West Australian Craton and South Australian Craton (Figure 2).
Older terranes such as Yilgarn, Pilbara or Gawler are assumed to have collided from 1800
to 1100 Ma during the make-up of Rodinia and resulted in the formation of Proterozoic
orogenesis terranes. During the late Proterozoic, several rifting cycles associated with the
break-up of the supercontinent resulted in the formation of Proterozoic basins such as
Adelaide [29,30]. Nowadays, these cratons constitute the basement, outcropping or cov-
ered by younger layers of Phanerozoic ages. They contain a diversity of rocks, from sedi-
mentary to igneous intrusive and extrusive. These rocks constitute a vast reservoir of raw
material, including rare earth elements, gold or iron ore. The latter is mined in BIF-hosted
iron ores, mainly in Western Australia, making Australia the first iron ore producer
worldwide.
Figure 1. World map of the Precambrian cratons and locations of the study areas. Dark greycorresponds to Precambrian cratons.
1.4. Aim of the Study
In this paper, we explore a possible source rock type for H2 generation in cratonicareas: reduction of water during oxidation of ferrous minerals in BIF. We focus here on threeareas located in Australia, Brazil and South Africa, and two complementary approachesare used to characterize the link between H2 releases and BIF.
At a large scale, a spatial correlation study is conducted on the presence of sub-circulardepressions mapped in the vicinity of iron mines or outcropping BIF in the areas of interest(Figure 1), based on satellite imaging. Their characteristics in terms of size and footprint arecompared with those of the P_H2_SCD with measured H2 emanations published previouslyin Australia, Brazil and Russia [12].
Secondly, the potential for H2 production through BIF oxidation is evaluated. To do so,available data in literature are discussed, and results of our petrological study conductedon BIF samples from Australia are presented. The possibility to have an oxidation andtherefore H2 production near the surface, involving very low temperature of generation,will be discussed.
2. Study Locations and Geological Settings2.1. Australia
Australia is subdivided into three major Precambrian cratonic units, respectively: theNorth Australian Craton, West Australian Craton and South Australian Craton (Figure 2).Older terranes such as Yilgarn, Pilbara or Gawler are assumed to have collided from 1800to 1100 Ma during the make-up of Rodinia and resulted in the formation of Proterozoicorogenesis terranes. During the late Proterozoic, several rifting cycles associated with thebreak-up of the supercontinent resulted in the formation of Proterozoic basins such asAdelaide [29,30]. Nowadays, these cratons constitute the basement, outcropping or coveredby younger layers of Phanerozoic ages. They contain a diversity of rocks, from sedimentaryto igneous intrusive and extrusive. These rocks constitute a vast reservoir of raw material,including rare earth elements, gold or iron ore. The latter is mined in BIF-hosted iron ores,mainly in Western Australia, making Australia the first iron ore producer worldwide.
Minerals 2022, 12, 163 4 of 28Minerals 2022, 12, x FOR PEER REVIEW 4 of 29
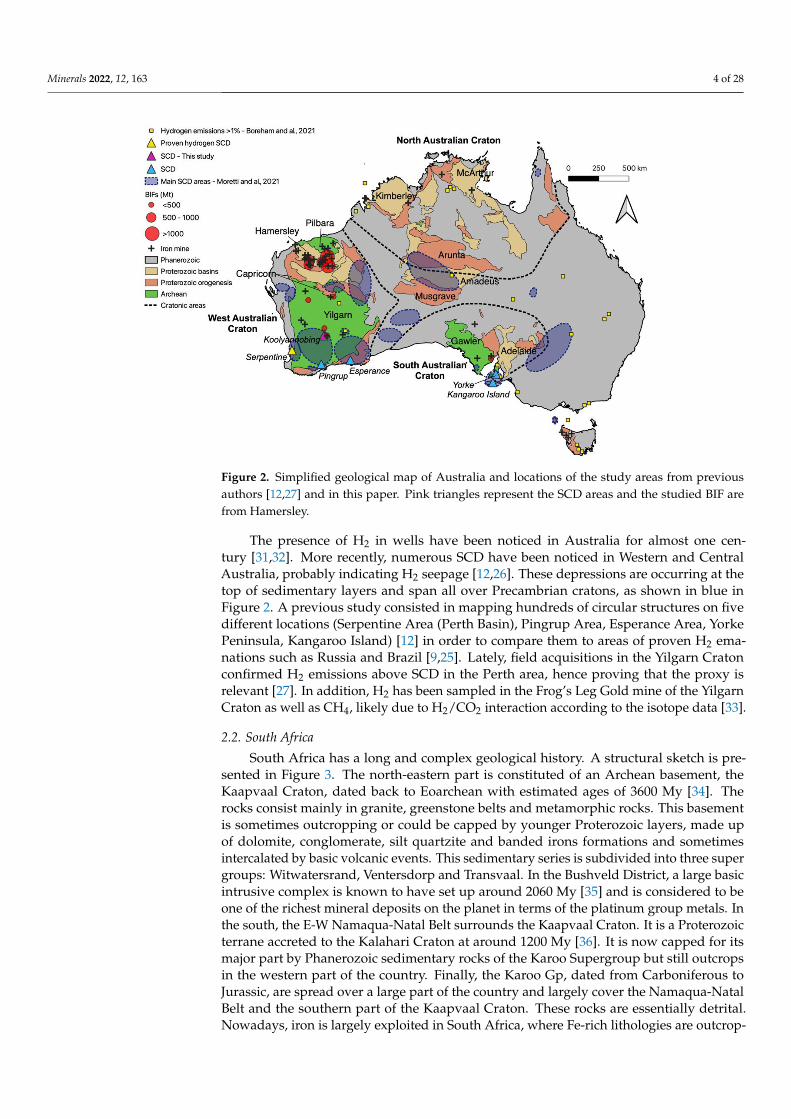
Figure 2. Simplified geological map of Australia and locations of the study areas from previous
authors [12,27] and in this paper. Pink triangles represent the SCD areas and the studied BIF are
from Hamersley.
The presence of H2 in wells have been noticed in Australia for almost one century
[31,32]. More recently, numerous SCD have been noticed in Western and Central Aus-
tralia, probably indicating H2 seepage [12,26]. These depressions are occurring at the top
of sedimentary layers and span all over Precambrian cratons, as shown in blue in Figure
2. A previous study consisted in mapping hundreds of circular structures on five different
locations (Serpentine Area (Perth Basin), Pingrup Area, Esperance Area, Yorke Peninsula,
Kangaroo Island) [12] in order to compare them to areas of proven H2 emanations such as
Russia and Brazil [9,25]. Lately, field acquisitions in the Yilgarn Craton confirmed H2
emissions above SCD in the Perth area, hence proving that the proxy is relevant [27]. In
addition, H2 has been sampled in the Frog’s Leg Gold mine of the Yilgarn Craton as well
as CH4, likely due to H2/CO2 interaction according to the isotope data [33].
2.2. South Africa
South Africa has a long and complex geological history. A structural sketch is pre-
sented in Figure 3. The north-eastern part is constituted of an Archean basement, the
Kaapvaal Craton, dated back to Eoarchean with estimated ages of 3600 My [34]. The rocks
consist mainly in granite, greenstone belts and metamorphic rocks. This basement is
sometimes outcropping or could be capped by younger Proterozoic layers, made up of
dolomite, conglomerate, silt quartzite and banded irons formations and sometimes inter-
calated by basic volcanic events. This sedimentary series is subdivided into three super
groups: Witwatersrand, Ventersdorp and Transvaal. In the Bushveld District, a large basic
intrusive complex is known to have set up around 2060 My [35] and is considered to be
one of the richest mineral deposits on the planet in terms of the platinum group metals.
In the south, the E-W Namaqua-Natal Belt surrounds the Kaapvaal Craton. It is a Prote-
rozoic terrane accreted to the Kalahari Craton at around 1200 My [36]. It is now capped
for its major part by Phanerozoic sedimentary rocks of the Karoo Supergroup but still
outcrops in the western part of the country. Finally, the Karoo Gp, dated from Carbonif-
erous to Jurassic, are spread over a large part of the country and largely cover the Nama-
qua-Natal Belt and the southern part of the Kaapvaal Craton. These rocks are essentially
detrital. Nowadays, iron is largely exploited in South Africa, where Fe-rich lithologies are
Figure 2. Simplified geological map of Australia and locations of the study areas from previousauthors [12,27] and in this paper. Pink triangles represent the SCD areas and the studied BIF arefrom Hamersley.
The presence of H2 in wells have been noticed in Australia for almost one cen-tury [31,32]. More recently, numerous SCD have been noticed in Western and CentralAustralia, probably indicating H2 seepage [12,26]. These depressions are occurring at thetop of sedimentary layers and span all over Precambrian cratons, as shown in blue inFigure 2. A previous study consisted in mapping hundreds of circular structures on fivedifferent locations (Serpentine Area (Perth Basin), Pingrup Area, Esperance Area, YorkePeninsula, Kangaroo Island) [12] in order to compare them to areas of proven H2 ema-nations such as Russia and Brazil [9,25]. Lately, field acquisitions in the Yilgarn Cratonconfirmed H2 emissions above SCD in the Perth area, hence proving that the proxy isrelevant [27]. In addition, H2 has been sampled in the Frog’s Leg Gold mine of the YilgarnCraton as well as CH4, likely due to H2/CO2 interaction according to the isotope data [33].
2.2. South Africa
South Africa has a long and complex geological history. A structural sketch is pre-sented in Figure 3. The north-eastern part is constituted of an Archean basement, theKaapvaal Craton, dated back to Eoarchean with estimated ages of 3600 My [34]. Therocks consist mainly in granite, greenstone belts and metamorphic rocks. This basementis sometimes outcropping or could be capped by younger Proterozoic layers, made upof dolomite, conglomerate, silt quartzite and banded irons formations and sometimesintercalated by basic volcanic events. This sedimentary series is subdivided into three supergroups: Witwatersrand, Ventersdorp and Transvaal. In the Bushveld District, a large basicintrusive complex is known to have set up around 2060 My [35] and is considered to beone of the richest mineral deposits on the planet in terms of the platinum group metals. Inthe south, the E-W Namaqua-Natal Belt surrounds the Kaapvaal Craton. It is a Proterozoicterrane accreted to the Kalahari Craton at around 1200 My [36]. It is now capped for itsmajor part by Phanerozoic sedimentary rocks of the Karoo Supergroup but still outcropsin the western part of the country. Finally, the Karoo Gp, dated from Carboniferous toJurassic, are spread over a large part of the country and largely cover the Namaqua-NatalBelt and the southern part of the Kaapvaal Craton. These rocks are essentially detrital.Nowadays, iron is largely exploited in South Africa, where Fe-rich lithologies are outcrop-

Minerals 2022, 12, 163 5 of 28
ping. Iron mines are mainly located in Archean and Proterozoic terranes, in areas where BIFare numerous.
Minerals 2022, 12, x FOR PEER REVIEW 5 of 29
outcropping. Iron mines are mainly located in Archean and Proterozoic terranes, in areas
where BIF are numerous.
Figure 3. Simplified geological map of South Africa and locations of the study areas in purple. Zone
1 corresponds to Kolomela BIF-hosted iron mine.
For now, no work has been yet dedicated to explore H2-emitting SCD in South Africa,
but few works already pointed out the presence of H2 emissions in South Africa, located
within Proterozoic terranes and near iron mines [11].
2.3. Brazil
The São Francisco Basin is one of the several Proterozoic basins in Brazil (Figure 4).
It is N–S oriented, bounded by two orogenic belts and corresponds to a double foreland
basin with the Brasilia Belt westward and the Araçuai Belt eastward. Both were created
during the Brazilian Orogeny, at the end of the Proterozoic. The stratigraphic column in
the São Francisco Basin includes rocks from Archean metamorphic basement (>1800 My)
that can reach up to 7 km in thickness and ends with the Neoproterozoic Tres Maria For-
mation (576 Ma) of the Bambui Group [37]. The region is rich in BIF, and many iron ore
mines are active particularly in the Quadrilatero Ferrifero. These BIF, while not outcrop-
ping, are also very likely present underground, since large magnetic anomalies have been
recognized near the area where H2 is naturally escaping [37].
Figure 3. Simplified geological map of South Africa and locations of the study areas in purple. Zone1 corresponds to Kolomela BIF-hosted iron mine.
For now, no work has been yet dedicated to explore H2-emitting SCD in South Africa,but few works already pointed out the presence of H2 emissions in South Africa, locatedwithin Proterozoic terranes and near iron mines [11].
2.3. Brazil
The São Francisco Basin is one of the several Proterozoic basins in Brazil (Figure 4).It is N–S oriented, bounded by two orogenic belts and corresponds to a double forelandbasin with the Brasilia Belt westward and the Araçuai Belt eastward. Both were createdduring the Brazilian Orogeny, at the end of the Proterozoic. The stratigraphic column in theSão Francisco Basin includes rocks from Archean metamorphic basement (>1800 My) thatcan reach up to 7 km in thickness and ends with the Neoproterozoic Tres Maria Formation(576 Ma) of the Bambui Group [37]. The region is rich in BIF, and many iron ore mines areactive particularly in the Quadrilatero Ferrifero. These BIF, while not outcropping, are alsovery likely present underground, since large magnetic anomalies have been recognizednear the area where H2 is naturally escaping [37].
Hundreds of SCD have been observed and mapped in this basin, and some of themhave already been monitored, displaying H2 emissions overpassing 600 kg/day/structure(zone 1, 2 and 3 in Figure 4) [9,13].

Minerals 2022, 12, 163 6 of 28Minerals 2022, 12, x FOR PEER REVIEW 6 of 29
Figure 4. Simplified geological map of the São Francisco Basin and locations of the study areas. The
1, 2 and 3 sites hosting proven hydrogen-related depressions have been published by [9,13]. The
other ones are unpublished data.
Hundreds of SCD have been observed and mapped in this basin, and some of them
have already been monitored, displaying H2 emissions overpassing 600 kg/day/structure
(zone 1, 2 and 3 in Figure 4) [9,13].
2.4. BIF and Relationship between These 3 Cratonic Areas
The three cratonic areas correspond to old Precambrian rocks (São Francisco in Brazil,
Kaapvaal in South Africa and Pilbara and Yilgarn in Western Australia) preserved from
tectonics through the ages and host in consequence massive BIF. Fresh BIF from these three
areas exhibit a standard Precambrian BIF chemistry with SiO2 from 34 to 56 wt% and total
Fe content from 20 to 40 wt% with Fe3+/Fetot ranging from 0.05 to 0.58. Minor elements such
as CaO and MgO are found below 10 wt%, while MnO or Al2O3 are found below 2 wt%. The
minerals found are mainly quartz, Fe oxides (magnetite and hematite), Fe silicates (rie-
beckite, greenalite, stilpnomelane) and Fe carbonates (siderite, ankerite), with a variability
depending on the starting bulk chemical composition and the metamorphism undergone
[22]. Sometimes, BIF have been enriched by low temperature processes involving the oxida-
tion of Fe2+ into Fe3+ and hydration with total Fe content around 58–65 wt% for Australian
BIF-hosted iron ores [21,38]. The primary minerals such as magnetite are martitised (oxi-
dized into hematite) and carbonate, silicates and quartz are replaced by goethite. In the lit-
erature, this oxidative mechanism of BIF reaching the surface has been identified for long
([16] and references therein), but it is not known if it has been accompanied by H2 genera-
tion.
3. Rounded Depressions in BIF Rich Areas
3.1. Rounded Depressions Related to Gas Escape
Previous works have emphasized the similarities between the size, expressed in
equivalent diameters, the size distribution and the depth/diameter ratios of the P_H2_SCD
worldwide. The distributions are usually unimodal, with mean equivalent diameters
ranging from tens to few hundreds of meters, respectively 276, 302 and 178 m on average
in the three studied zones in Brazil and 262 m in Russia [12]. In all these areas, the presence
Figure 4. Simplified geological map of the São Francisco Basin and locations of the study areas. The 1,2 and 3 sites hosting proven hydrogen-related depressions have been published by [9,13]. The otherones are unpublished data.
2.4. BIF and Relationship between These 3 Cratonic Areas
The three cratonic areas correspond to old Precambrian rocks (São Francisco in Brazil,Kaapvaal in South Africa and Pilbara and Yilgarn in Western Australia) preserved fromtectonics through the ages and host in consequence massive BIF. Fresh BIF from thesethree areas exhibit a standard Precambrian BIF chemistry with SiO2 from 34 to 56 wt%and total Fe content from 20 to 40 wt% with Fe3+/Fetot ranging from 0.05 to 0.58. Mi-nor elements such as CaO and MgO are found below 10 wt%, while MnO or Al2O3 arefound below 2 wt%. The minerals found are mainly quartz, Fe oxides (magnetite andhematite), Fe silicates (riebeckite, greenalite, stilpnomelane) and Fe carbonates (siderite,ankerite), with a variability depending on the starting bulk chemical composition and themetamorphism undergone [22]. Sometimes, BIF have been enriched by low temperatureprocesses involving the oxidation of Fe2+ into Fe3+ and hydration with total Fe contentaround 58–65 wt% for Australian BIF-hosted iron ores [21,38]. The primary minerals suchas magnetite are martitised (oxidized into hematite) and carbonate, silicates and quartz arereplaced by goethite. In the literature, this oxidative mechanism of BIF reaching the surfacehas been identified for long ([16] and references therein), but it is not known if it has beenaccompanied by H2 generation.
3. Rounded Depressions in BIF Rich Areas3.1. Rounded Depressions Related to Gas Escape
Previous works have emphasized the similarities between the size, expressed inequivalent diameters, the size distribution and the depth/diameter ratios of the P_H2_SCDworldwide. The distributions are usually unimodal, with mean equivalent diametersranging from tens to few hundreds of meters, respectively 276, 302 and 178 m on averagein the three studied zones in Brazil and 262 m in Russia [12]. In all these areas, the presenceof H2 is proven and has been measured by gas detectors. The depth/diameter ratio hasbeen established to be a major characteristic of P_H2_SCD, always falling around 1% [12].The slope of these depressions is also a characteristic that allows to discriminate them fromdolines, usually displaying, at least locally, high slopes over 20◦ [12].
Minerals 2022, 12, 163 7 of 28
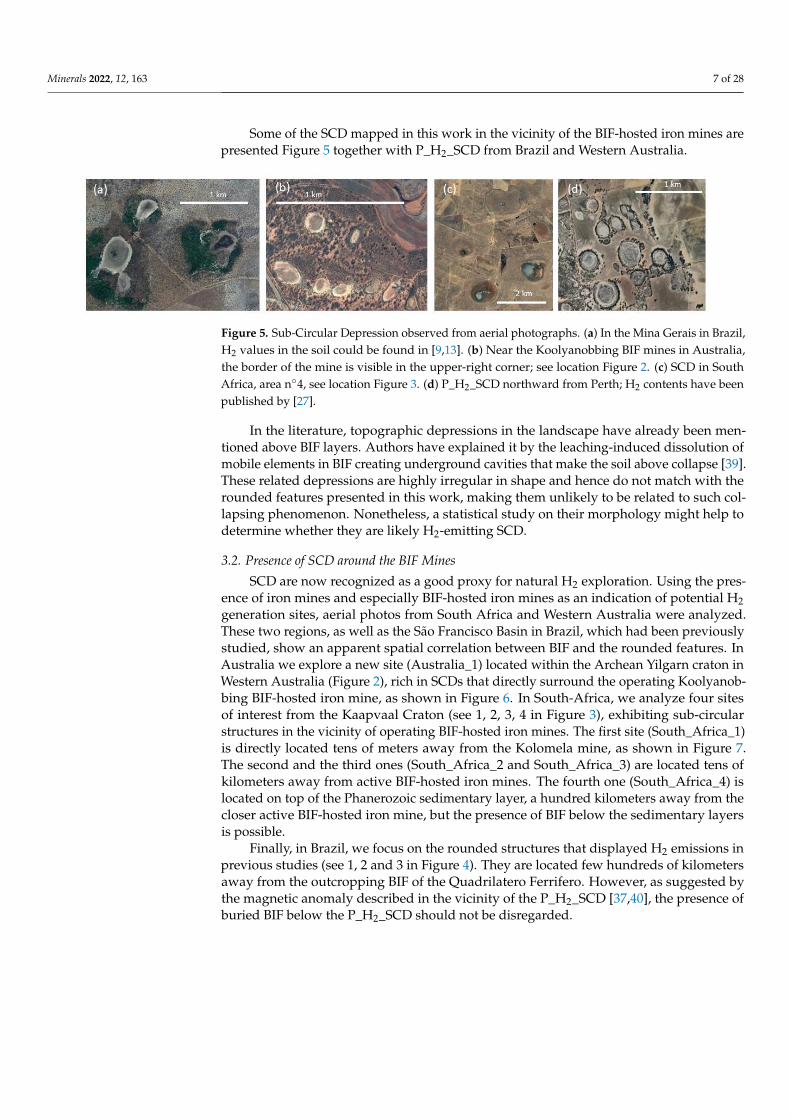
Some of the SCD mapped in this work in the vicinity of the BIF-hosted iron mines arepresented Figure 5 together with P_H2_SCD from Brazil and Western Australia.
Minerals 2022, 12, x FOR PEER REVIEW 7 of 29
of H2 is proven and has been measured by gas detectors. The depth/diameter ratio has
been established to be a major characteristic of P_H2_SCD, always falling around 1% [12].
The slope of these depressions is also a characteristic that allows to discriminate them
from dolines, usually displaying, at least locally, high slopes over 20° [12].
Some of the SCD mapped in this work in the vicinity of the BIF-hosted iron mines
are presented Figure 5 together with P_H2_SCD from Brazil and Western Australia
Figure 5. Sub-Circular Depression observed from aerial photographs. (a) In the Mina Gerais in Brazil, H2 values in the soil
could be found in [9,13]. (b) Near the Koolyanobbing BIF mines in Australia, the border of the mine is visible in the upper-
right corner; see location Figure 2. (c) SCD in South Africa, area n°4, see location Figure 3. (d) P_H2_SCD northward from
Perth; H2 contents have been published by [27].
In the literature, topographic depressions in the landscape have already been men-
tioned above BIF layers. Authors have explained it by the leaching-induced dissolution of
mobile elements in BIF creating underground cavities that make the soil above collapse
[39]. These related depressions are highly irregular in shape and hence do not match with
the rounded features presented in this work, making them unlikely to be related to such
collapsing phenomenon. Nonetheless, a statistical study on their morphology might help
to determine whether they are likely H2-emitting SCD.
3.2. Presence of SCD around the BIF Mines
SCD are now recognized as a good proxy for natural H2 exploration. Using the pres-
ence of iron mines and especially BIF-hosted iron mines as an indication of potential H2
generation sites, aerial photos from South Africa and Western Australia were analyzed.
These two regions, as well as the São Francisco Basin in Brazil, which had been previously
studied, show an apparent spatial correlation between BIF and the rounded features. In
Australia we explore a new site (Australia_1) located within the Archean Yilgarn craton
in Western Australia (Figure 2), rich in SCDs that directly surround the operating
Koolyanobbing BIF-hosted iron mine, as shown in Figure 6. In South-Africa, we analyze
four sites of interest from the Kaapvaal Craton (see 1, 2, 3, 4 in Figure 3), exhibiting sub-
circular structures in the vicinity of operating BIF-hosted iron mines. The first site
(South_Africa_1) is directly located tens of meters away from the Kolomela mine, as
shown in Figure 7. The second and the third ones (South_Africa_2 and South_Africa_3)
are located tens of kilometers away from active BIF-hosted iron mines. The fourth one
(South_Africa_4) is located on top of the Phanerozoic sedimentary layer, a hundred kilo-
meters away from the closer active BIF-hosted iron mine, but the presence of BIF below
the sedimentary layers is possible.
Figure 5. Sub-Circular Depression observed from aerial photographs. (a) In the Mina Gerais in Brazil,H2 values in the soil could be found in [9,13]. (b) Near the Koolyanobbing BIF mines in Australia,the border of the mine is visible in the upper-right corner; see location Figure 2. (c) SCD in SouthAfrica, area n◦4, see location Figure 3. (d) P_H2_SCD northward from Perth; H2 contents have beenpublished by [27].
In the literature, topographic depressions in the landscape have already been men-tioned above BIF layers. Authors have explained it by the leaching-induced dissolution ofmobile elements in BIF creating underground cavities that make the soil above collapse [39].These related depressions are highly irregular in shape and hence do not match with therounded features presented in this work, making them unlikely to be related to such col-lapsing phenomenon. Nonetheless, a statistical study on their morphology might help todetermine whether they are likely H2-emitting SCD.
3.2. Presence of SCD around the BIF Mines
SCD are now recognized as a good proxy for natural H2 exploration. Using the pres-ence of iron mines and especially BIF-hosted iron mines as an indication of potential H2generation sites, aerial photos from South Africa and Western Australia were analyzed.These two regions, as well as the São Francisco Basin in Brazil, which had been previouslystudied, show an apparent spatial correlation between BIF and the rounded features. InAustralia we explore a new site (Australia_1) located within the Archean Yilgarn craton inWestern Australia (Figure 2), rich in SCDs that directly surround the operating Koolyanob-bing BIF-hosted iron mine, as shown in Figure 6. In South-Africa, we analyze four sitesof interest from the Kaapvaal Craton (see 1, 2, 3, 4 in Figure 3), exhibiting sub-circularstructures in the vicinity of operating BIF-hosted iron mines. The first site (South_Africa_1)is directly located tens of meters away from the Kolomela mine, as shown in Figure 7.The second and the third ones (South_Africa_2 and South_Africa_3) are located tens ofkilometers away from active BIF-hosted iron mines. The fourth one (South_Africa_4) islocated on top of the Phanerozoic sedimentary layer, a hundred kilometers away from thecloser active BIF-hosted iron mine, but the presence of BIF below the sedimentary layersis possible.
Finally, in Brazil, we focus on the rounded structures that displayed H2 emissions inprevious studies (see 1, 2 and 3 in Figure 4). They are located few hundreds of kilometersaway from the outcropping BIF of the Quadrilatero Ferrifero. However, as suggested bythe magnetic anomaly described in the vicinity of the P_H2_SCD [37,40], the presence ofburied BIF below the P_H2_SCD should not be disregarded.

Minerals 2022, 12, 163 8 of 28Minerals 2022, 12, x FOR PEER REVIEW 8 of 29
Figure 6. (a) Aerial photo of Koolyanobbing mine (Australia, see location Figure 2) and its SCD high-
lighted in blue. (b) Zoom on the black rectangle in (a), showing SCD located around the mine pits.
Figure 7. (a) SCD mapped (in yellow) in the South_Africa_1 zone in the vicinity of the Kolomela
mine (see location Figure 4). The intensity of the reddish color corresponds to the number of depres-
sions per surface unit. The grayish spots are the pits and other human facilities. (b) Zoom in on the
Kolomela mine and its surroundings with SCD highlighted in blue.
Finally, in Brazil, we focus on the rounded structures that displayed H2 emissions in
previous studies (see 1, 2 and 3 in Figure 4). They are located few hundreds of kilometers
away from the outcropping BIF of the Quadrilatero Ferrifero. However, as suggested by
the magnetic anomaly described in the vicinity of the P_H2_SCD [37,40], the presence of
buried BIF below the P_H2_SCD should not be disregarded.
3.3. Statistics on SCD around BIF Mines in Australia and South Africa
As previously stated, the statistics on the H2 emitting structures have emphasized the
similarities between the size, the size distribution and the depth of the P_H2_SCD world-
wide [12]. The SCD areas recognized by this proxy in Western Australia has then been
proven to emit H2 [27], so the same analyses have been carried out for the five new areas
from South Africa and Australia where BIF are outcropping or suspected in the subsur-
face. The characteristics of each area are reported in Table 1 and Figure 8.
Kolomela mine
Rounded depressions
(a)(b)
0 500 m
Figure 6. (a) Aerial photo of Koolyanobbing mine (Australia, see location Figure 2) and its SCDhigh-lighted in blue. (b) Zoom on the black rectangle in (a), showing SCD located around themine pits.
Minerals 2022, 12, x FOR PEER REVIEW 8 of 29
Figure 6. (a) Aerial photo of Koolyanobbing mine (Australia, see location Figure 2) and its SCD high-
lighted in blue. (b) Zoom on the black rectangle in (a), showing SCD located around the mine pits.
Figure 7. (a) SCD mapped (in yellow) in the South_Africa_1 zone in the vicinity of the Kolomela
mine (see location Figure 4). The intensity of the reddish color corresponds to the number of depres-
sions per surface unit. The grayish spots are the pits and other human facilities. (b) Zoom in on the
Kolomela mine and its surroundings with SCD highlighted in blue.
Finally, in Brazil, we focus on the rounded structures that displayed H2 emissions in
previous studies (see 1, 2 and 3 in Figure 4). They are located few hundreds of kilometers
away from the outcropping BIF of the Quadrilatero Ferrifero. However, as suggested by
the magnetic anomaly described in the vicinity of the P_H2_SCD [37,40], the presence of
buried BIF below the P_H2_SCD should not be disregarded.
3.3. Statistics on SCD around BIF Mines in Australia and South Africa
As previously stated, the statistics on the H2 emitting structures have emphasized the
similarities between the size, the size distribution and the depth of the P_H2_SCD world-
wide [12]. The SCD areas recognized by this proxy in Western Australia has then been
proven to emit H2 [27], so the same analyses have been carried out for the five new areas
from South Africa and Australia where BIF are outcropping or suspected in the subsur-
face. The characteristics of each area are reported in Table 1 and Figure 8.
Kolomela mine
Rounded depressions
(a)(b)
0 500 m
Figure 7. (a) SCD mapped (in yellow) in the South_Africa_1 zone in the vicinity of the Kolomela mine(see location Figure 4). The intensity of the reddish color corresponds to the number of depressionsper surface unit. The grayish spots are the pits and other human facilities. (b) Zoom in on theKolomela mine and its surroundings with SCD highlighted in blue.
3.3. Statistics on SCD around BIF Mines in Australia and South Africa
As previously stated, the statistics on the H2 emitting structures have emphasizedthe similarities between the size, the size distribution and the depth of the P_H2_SCDworldwide [12]. The SCD areas recognized by this proxy in Western Australia has thenbeen proven to emit H2 [27], so the same analyses have been carried out for the five newareas from South Africa and Australia where BIF are outcropping or suspected in thesubsurface. The characteristics of each area are reported in Table 1 and Figure 8.
Table 1. Characteristics of the five new mapped areas in South Africa and Australia.
SCD South_Africa_1 South_Africa_2 South_Africa_3 South_Africa_4 Australia_1
Nb of mapped structures 624 792 866 486 612Min. equiv. diameter (m) 8 19 22 35 45Max. equiv. diameter (m) 437 856 2961 2633 12,784Mean equiv. diameter (m) 67 98 346 476 407
Median equiv. diameter (m) 59 88 187 412 200Depth/diameter 0.017 0.019 0.005 0.014 0.013

Minerals 2022, 12, 163 9 of 28
Minerals 2022, 12, x FOR PEER REVIEW 9 of 29
Table 1. Characteristics of the five new mapped areas in South Africa and Australia.
SCD South_Africa_1 South_Africa_2 South_Africa_3 South_Africa_4 Australia_1
Nb of mapped structures 624 792 866 486 612
Min. equiv. diameter (m) 8 19 22 35 45
Max. equiv. diameter (m) 437 856 2961 2633 12,784
Mean equiv. diameter (m) 67 98 346 476 407
Median equiv. diameter (m) 59 88 187 412 200
Depth/diameter 0.017 0.019 0.005 0.014 0.013
Figure 8. Size distribution of the SCD expressed as equivalent diameter (m) for five new areas in
South Africa and Australia.
The distribution of feature sizes expressed in the equivalent diameter is provided in
Figure 8. Except for South_Africa_1 and South_Africa_2, it is interesting to point out that
median equivalent diameter values are far from mean equivalent diameter values. It can
be explained by the high number of features exceeding 1400 m of equivalent diameter for
these three areas (24 for South_Africa_3; 12 for South_Africa_4; 21 for Australia_1) that
increase the mean diameter. This might reflect the merging of several depressions with
time.
3
60
129
112
60
44
3439
24 22
813
8 8 5 3 2 4 3 0 3 1 1 2 1 1 0 0
21
0
20
40
60
80
100
120
140
1
25
19
35
43
35
38 37
45
32
23
16
29
16
19 18
9 9 8
2 3 3 2 1 0
3 3
0
12
0
5
10
15
20
25
30
35
40
45
50
44
189
124
98
62
44
2329
2432 29
18 1610
17 138 6 7 8 10 6 7 5 4 1 2 6
24
0
20
40
60
80
100
120
140
160
180
200
97
382
235
48
16 6 3 2 1 0 10
50
100
150
200
250
300
350
400
450
247
296
56
173 2 1 1 1 0
0
50
100
150
200
250
300
350
500
450
400
350
300
250
200
150
100
50450
400
350
300250
200
150
10050
350
300
250
200
150
10050
700
650
600
550
500
450
400
1050
1000
950
900
850
800
750
1400
1350
1300
1250
1200
1150
1100 +
++
350
300
250
200
150
10050
700
650
600
550
500
450
400
1050
1000
950
900
850
800
750
1400
1350
1300
1250
1200
1150
1100 +
350
300
250
200
150
10050
700
650
600
550
500
450
400
1050
1000950
900
850
800750
1400
1350
1300
1250
1200
1150
1100 +
Nu
mb
ero
f St
ruct
ure
s
Equivalent diameter
Australia_1
South_Africa_1 South_Africa_2
South_Africa_3
South_Africa_4
MEAN: 67 m MEAN: 97 m
MEAN: 346 m
MEAN: 476 m
MEAN: 407 m
Figure 8. Size distribution of the SCD expressed as equivalent diameter (m) for five new areas inSouth Africa and Australia.
The distribution of feature sizes expressed in the equivalent diameter is provided inFigure 8. Except for South_Africa_1 and South_Africa_2, it is interesting to point out thatmedian equivalent diameter values are far from mean equivalent diameter values. It can beexplained by the high number of features exceeding 1400 m of equivalent diameter for thesethree areas (24 for South_Africa_3; 12 for South_Africa_4; 21 for Australia_1) that increasethe mean diameter. This might reflect the merging of several depressions with time.
3.4. Comparison with the SCD Distributions of the São Francisco Basin3.4.1. SCD Sizes
The size distribution of the mapped depressions in Australia and South Africa iscompared in Figure 9 with the Brazilian depressions where H2 has already been detected.For a better comparison, the size distribution of each area has been normalized to the classpresenting the higher number of features. The Figure shows that many areas in differentregions exhibit a very similar pattern (South_Africa_1, South_Africa_2, South_Africa_3,Australia_1 and Brazil_3) with a unimodal distribution and a rather small modal size(0–200 m equivalent diameter), even if the dispersion can vary from one to another area.

Minerals 2022, 12, 163 10 of 28
On the contrary, three other sites (South_Africa_4, Brazil_1 and Brazil_2) show a largerspectrum of size distributions. Brazil_1 and Brazil_2 exhibit a barely unimodal distributionwith much higher sizes and dispersion, while South_Africa_4 shows a large spectrum butalmost no small structures.
Minerals 2022, 12, x FOR PEER REVIEW 10 of 29
3.4. Comparison with the SCD Distributions of the São Francisco Basin
3.4.1. SCD Sizes
The size distribution of the mapped depressions in Australia and South Africa is
compared in Figure 9 with the Brazilian depressions where H2 has already been detected.
For a better comparison, the size distribution of each area has been normalized to the class
presenting the higher number of features. The Figure shows that many areas in different
regions exhibit a very similar pattern (South_Africa_1, South_Africa_2, South_Africa_3,
Australia_1 and Brazil_3) with a unimodal distribution and a rather small modal size (0–
200 m equivalent diameter), even if the dispersion can vary from one to another area. On
the contrary, three other sites (South_Africa_4, Brazil_1 and Brazil_2) show a larger spec-
trum of size distributions. Brazil_1 and Brazil_2 exhibit a barely unimodal distribution
with much higher sizes and dispersion, while South_Africa_4 shows a large spectrum but
almost no small structures.
Figure 9. Comparison of normalized size distribution of the mapped depressions from South Africa
and Australia with the proven zones of H2 emissions in São Francisco, Brazil. (a) Distributions with
similar unimodal distribution: a small median and average value around 100 m. (b) Distributions
with larger spectrum and mean values above 200 m.
From these graphs, it is tempting to consider the unimodal distribution as a charac-
teristic pattern and the range 0–200 m as the characteristic equivalent diameter size of the
SCD, while the wider distributions around larger average values might correspond to a
set of initial and merged depressions explaining the high variability in features sizes. Bra-
zil_1, which exhibits an intermediate pattern, might be a transitionary stage.
The relationship between the depth of the H2 generation and the size of the SCD is
not direct, as it also depends on many parameters, such as the micro-organism activity
(that consumes the H2) or the relative permeability of the soil (that influences the speed of
the transport toward the surface) [24]. Nonetheless, knowing that South_Africa_1,
South_Africa_2, South_Africa_3 and Australia_1 are located very close to iron mines, we
consider the unimodal distribution as well as the range 0–200 m of equivalent diameter as
Equivalent diameter (m)
Am
ou
nts
(no
rmal
ize
d)
0.50
1.00
0.50
Am
ou
nts
(no
rmal
ized
)
1.00
0.00
0,00
0,50
1,00
0 200 400 600 800 1000 1200
South_Africa_1South_Africa_2South_Africa_3Australia_1Brazil_3
0.50
1.00
0.00
Equivalent diameter (m)
0 200 400 600 800 1000 1200
0 200 400 600 800 1000 1200Equivalent diameter (m)
(a)
(b)
Figure 9. Comparison of normalized size distribution of the mapped depressions from South Africaand Australia with the proven zones of H2 emissions in São Francisco, Brazil. (a) Distributions withsimilar unimodal distribution: a small median and average value around 100 m. (b) Distributionswith larger spectrum and mean values above 200 m.
From these graphs, it is tempting to consider the unimodal distribution as a charac-teristic pattern and the range 0–200 m as the characteristic equivalent diameter size of theSCD, while the wider distributions around larger average values might correspond to a setof initial and merged depressions explaining the high variability in features sizes. Brazil_1,which exhibits an intermediate pattern, might be a transitionary stage.
The relationship between the depth of the H2 generation and the size of the SCD isnot direct, as it also depends on many parameters, such as the micro-organism activity(that consumes the H2) or the relative permeability of the soil (that influences the speedof the transport toward the surface) [24]. Nonetheless, knowing that South_Africa_1,South_Africa_2, South_Africa_3 and Australia_1 are located very close to iron mines, weconsider the unimodal distribution as well as the range 0–200 m of equivalent diameteras a characteristic pattern for SCD originated from a shallow depth H2 and spread outgeneration zone, matching with water–BIF interactions. At the same time, the uncertainpatterns with the high variability of South_Africa_4, Brazil_1 and Brazil_2, located further tothe mines, might correspond to merged fairy circles originating from deeper H2 generationthat complexify the signal at the surface. However, the dynamics of H2 migration upwardin Australia and South Africa have to be further studied, as it has been realized in SãoFrancisco with the characterization of microorganisms [23] that consume the H2.
3.4.2. SCD Depths
It has been noted on the previous studies of P_H2_SCD that the morphology of thedepression, size/depth ratio and slope may help to discriminate them from dolines and

Minerals 2022, 12, 163 11 of 28
other depressions related to karst systems [12]. In Brazil and Russia, this ratio was around1%. Figure 10 shows very similar ratios for the five new studied zones in South Africa andAustralia, with ratios between the depth and equivalent diameters between 0.5% and 2%.This result infers probable H2 emissions at these SCD, which need now to be monitoredin-situ.
Minerals 2022, 12, x FOR PEER REVIEW 11 of 29
a characteristic pattern for SCD originated from a shallow depth H2 and spread out gener-
ation zone, matching with water–BIF interactions. At the same time, the uncertain patterns
with the high variability of South_Africa_4, Brazil_1 and Brazil_2, located further to the
mines, might correspond to merged fairy circles originating from deeper H2 generation
that complexify the signal at the surface. However, the dynamics of H2 migration upward
in Australia and South Africa have to be further studied, as it has been realized in São
Francisco with the characterization of microorganisms [23] that consume the H2.
3.4.2. SCD Depths
It has been noted on the previous studies of P_H2_SCD that the morphology of the
depression, size/depth ratio and slope may help to discriminate them from dolines and
other depressions related to karst systems [12]. In Brazil and Russia, this ratio was around
1%. Figure 10 shows very similar ratios for the five new studied zones in South Africa and
Australia, with ratios between the depth and equivalent diameters between 0.5% and 2%.
This result infers probable H2 emissions at these SCD, which need now to be monitored
in-situ.
Figure 10. Depth/diameter ratio for SCD from Brazil, South Africa and Australia. Brazilian data
from [12], see location Figure 4. Australian and South African data are from this study; see location
of the mapped areas on Figures 2 and 3.
4. BIF Potential for H2 Production: Case Study of Australian Samples
4.1. Geological Context and Sampling
We showed the presence of sub-circular depressions in the vicinity of BIF-hosted iron
mines, inferring that BIF could be involved in H2 generation. As fresh BIF-host important
quantities of ferrous iron (Fetot from 20 to 40 wt% and Fe3+/Fetot from 0.05 to 0.58) [22], they
can indeed theoretically produce H2 by oxidation via water alteration. These undirect el-
ements need to be further investigated and the relationship between BIF and H2 con-
strained unambiguously.
A petrological study was conducted on natural samples coming from Hamersley
Province in Western Australia (Figure 2). The Hamersley Group is a Precambrian (2600–
2450 My) marine deposit of 2.5 km thickness lying horizontally or with a northward low
dip, over 40,000 km2 in the Pilbara Craton. It is divided into eight formations consisting in
BIF, shales, carbonates and volcanics [41]. Among these formations, the Brockman For-
mation constitutes the major iron ore reserve, especially the Dales Gorge Member, which
Figure 10. Depth/diameter ratio for SCD from Brazil, South Africa and Australia. Brazilian datafrom [12], see location Figure 4. Australian and South African data are from this study; see locationof the mapped areas on Figures 2 and 3.
4. BIF Potential for H2 Production: Case Study of Australian Samples4.1. Geological Context and Sampling
We showed the presence of sub-circular depressions in the vicinity of BIF-hostediron mines, inferring that BIF could be involved in H2 generation. As fresh BIF-hostimportant quantities of ferrous iron (Fetot from 20 to 40 wt% and Fe3+/Fetot from 0.05 to0.58) [22], they can indeed theoretically produce H2 by oxidation via water alteration. Theseundirect elements need to be further investigated and the relationship between BIF and H2constrained unambiguously.
A petrological study was conducted on natural samples coming from HamersleyProvince in Western Australia (Figure 2). The Hamersley Group is a Precambrian (2600–2450 My) marine deposit of 2.5 km thickness lying horizontally or with a northward lowdip, over 40,000 km2 in the Pilbara Craton. It is divided into eight formations consisting inBIF, shales, carbonates and volcanics [41]. Among these formations, the Brockman Forma-tion constitutes the major iron ore reserve, especially the Dales Gorge Member, which ismined in areas such as in Mt Tom Price (22.75◦ S, 117.77◦ E). For the Dales Gorge Member,studies conducted on fresh BIF revealed low greenschist facies metamorphism throughoutthe province and a lateral continuity in chemical composition as well as microbands andmacrobands thicknesses [42]. Mineral analyses highlighted the presence of ferrous BIF min-erals corresponding to low-grade metamorphism [22]. In the Dales Gorge Member, sideriteis the main carbonates, while stilpnomelane and minnesotaite are the major silicates [42,43].
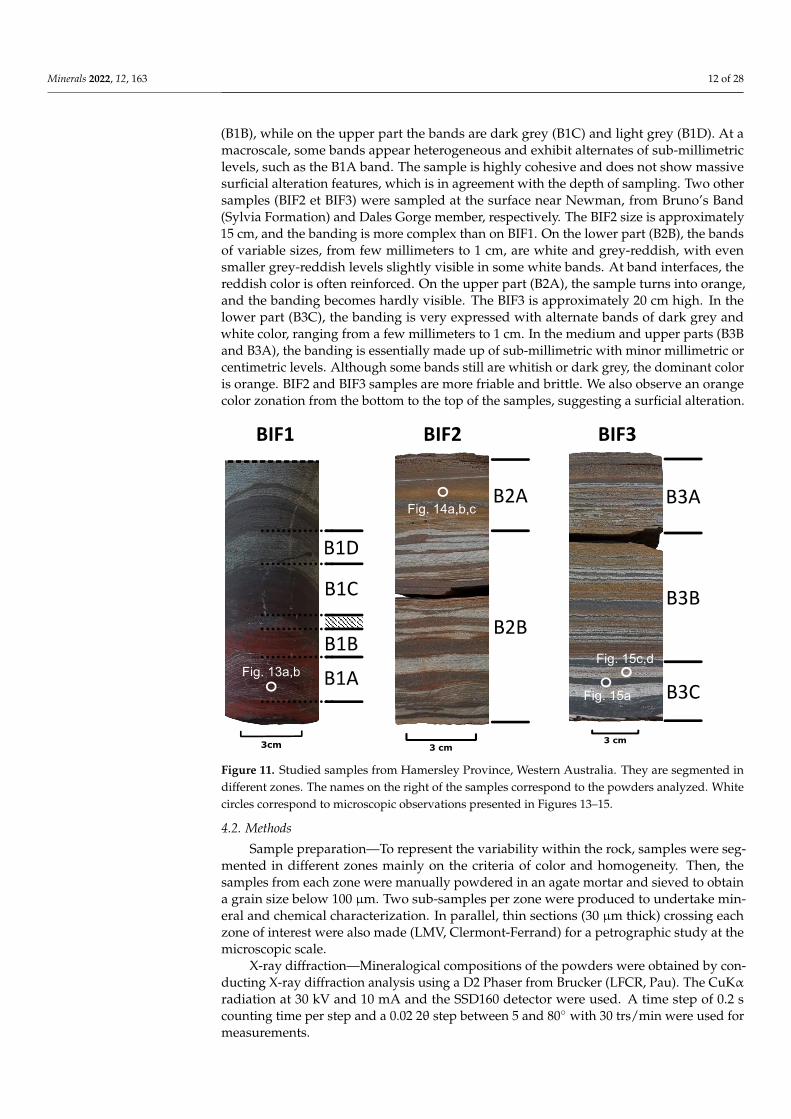
For this study, three samples were selected in the Hamersley Province (Figure 2) andare presented in Figure 11. One fresh sample (hereafter referred as BIF1) was selected froma diamond core from the Dales Gorge Member (Brockman Formation) at a depth of 100 mnear Mt Tom Price. It is approximately 15 cm high and constituted of alternate bands ofsimilar thickness, around 2–3 cm. In the lower part, they are light red (B1A) and dark red
Minerals 2022, 12, 163 12 of 28
(B1B), while on the upper part the bands are dark grey (B1C) and light grey (B1D). At amacroscale, some bands appear heterogeneous and exhibit alternates of sub-millimetriclevels, such as the B1A band. The sample is highly cohesive and does not show massivesurficial alteration features, which is in agreement with the depth of sampling. Two othersamples (BIF2 et BIF3) were sampled at the surface near Newman, from Bruno’s Band(Sylvia Formation) and Dales Gorge member, respectively. The BIF2 size is approximately15 cm, and the banding is more complex than on BIF1. On the lower part (B2B), the bandsof variable sizes, from few millimeters to 1 cm, are white and grey-reddish, with evensmaller grey-reddish levels slightly visible in some white bands. At band interfaces, thereddish color is often reinforced. On the upper part (B2A), the sample turns into orange,and the banding becomes hardly visible. The BIF3 is approximately 20 cm high. In thelower part (B3C), the banding is very expressed with alternate bands of dark grey andwhite color, ranging from a few millimeters to 1 cm. In the medium and upper parts (B3Band B3A), the banding is essentially made up of sub-millimetric with minor millimetric orcentimetric levels. Although some bands still are whitish or dark grey, the dominant coloris orange. BIF2 and BIF3 samples are more friable and brittle. We also observe an orangecolor zonation from the bottom to the top of the samples, suggesting a surficial alteration.
Minerals 2022, 12, x FOR PEER REVIEW 12 of 29
is mined in areas such as in Mt Tom Price (22.75° S, 117.77° E). For the Dales Gorge Mem-
ber, studies conducted on fresh BIF revealed low greenschist facies metamorphism
throughout the province and a lateral continuity in chemical composition as well as mi-
crobands and macrobands thicknesses [42]. Mineral analyses highlighted the presence of
ferrous BIF minerals corresponding to low-grade metamorphism [22]. In the Dales Gorge
Member, siderite is the main carbonates, while stilpnomelane and minnesotaite are the
major silicates [42,43].
For this study, three samples were selected in the Hamersley Province (Figure 2) and
are presented in Figure 11. One fresh sample (hereafter referred as BIF1) was selected from
a diamond core from the Dales Gorge Member (Brockman Formation) at a depth of 100 m
near Mt Tom Price. It is approximately 15 cm high and constituted of alternate bands of
similar thickness, around 2–3 cm. In the lower part, they are light red (B1A) and dark red
(B1B), while on the upper part the bands are dark grey (B1C) and light grey (B1D). At a
macroscale, some bands appear heterogeneous and exhibit alternates of sub-millimetric
levels, such as the B1A band. The sample is highly cohesive and does not show massive
surficial alteration features, which is in agreement with the depth of sampling. Two other
samples (BIF2 et BIF3) were sampled at the surface near Newman, from Bruno’s Band
(Sylvia Formation) and Dales Gorge member, respectively. The BIF2 size is approximately
15 cm, and the banding is more complex than on BIF1. On the lower part (B2B), the bands
of variable sizes, from few millimeters to 1 cm, are white and grey-reddish, with even
smaller grey-reddish levels slightly visible in some white bands. At band interfaces, the
reddish color is often reinforced. On the upper part (B2A), the sample turns into orange,
and the banding becomes hardly visible. The BIF3 is approximately 20 cm high. In the
lower part (B3C), the banding is very expressed with alternate bands of dark grey and
white color, ranging from a few millimeters to 1 cm. In the medium and upper parts (B3B
and B3A), the banding is essentially made up of sub-millimetric with minor millimetric or
centimetric levels. Although some bands still are whitish or dark grey, the dominant color
is orange. BIF2 and BIF3 samples are more friable and brittle. We also observe an orange
color zonation from the bottom to the top of the samples, suggesting a surficial alteration.
Figure 11. Studied samples from Hamersley Province, Western Australia. They are segmented in
different zones. The names on the right of the samples correspond to the powders analyzed. White
circles correspond to microscopic observations presented in Figures 13–15.
Figure 11. Studied samples from Hamersley Province, Western Australia. They are segmented indifferent zones. The names on the right of the samples correspond to the powders analyzed. Whitecircles correspond to microscopic observations presented in Figures 13–15.
4.2. Methods
Sample preparation—To represent the variability within the rock, samples were seg-mented in different zones mainly on the criteria of color and homogeneity. Then, thesamples from each zone were manually powdered in an agate mortar and sieved to obtaina grain size below 100 µm. Two sub-samples per zone were produced to undertake min-eral and chemical characterization. In parallel, thin sections (30 µm thick) crossing eachzone of interest were also made (LMV, Clermont-Ferrand) for a petrographic study at themicroscopic scale.
X-ray diffraction—Mineralogical compositions of the powders were obtained by con-ducting X-ray diffraction analysis using a D2 Phaser from Brucker (LFCR, Pau). The CuKα
radiation at 30 kV and 10 mA and the SSD160 detector were used. A time step of 0.2 scounting time per step and a 0.02 2θ step between 5 and 80◦ with 30 trs/min were used formeasurements.

Minerals 2022, 12, 163 13 of 28
Optical Emission Spectroscopy by Inductively Coupled Plasma (ICP-OES)—Analysesof bulk compositions through major and minor element contents were conducted on thepowders by the SARM (CRPG, Nancy), using ICP-OES on an iCap 6500 (ThermoFischerScientific). It must be noted that the Fe content is expressed as Fe2O3, even if samplescontain Fe2+. Considering the high levels of SiO2 and Fe2O3 in the samples, the givenuncertainty for these components is lower than 2 wt%. As far as the minor elements areconcerned (Al2O3, MnO, MgO, CaO, Na2O, K2O, TiO2 et P2O5), the given uncertainty isbetween 10 and 20%. The volatile content in the sample is given by the loss on ignition.Each analysis was repeated twice.
57Fe Mössbauer spectroscopy—To complete the ICP-OES analyses and determine ironspeciation in the samples, 500 µg of each powder was analyzed with a constant accelerationHalder-type spectrometer (ICMCB, Bordeaux) equipped with a 57Co radioactive source (em-bedded in a Rh matrix), which was maintained at 293 K. The spectrometer was calibratedusing a pure α-Fe0 foil as an external reference. All spectra were recorded in transmissiongeometry at ambient temperature. The Mössbauer hyperfine parameters and the relativeareas of each component were refined with the WinNormos software (WissenschaftlicheElektronik GmbH). Two analyses were made per powder, and each analysis lasted about1 day. The given uncertainty is 3%.
Optical and electron microscopy—An optical study was performed using a NikonEclipse LV10ND microscope. The nature of the samples (rich in opaque iron oxides)required a work under both transmitted and reflected lights. Scanning electron microscopy(SEM) was also performed on the thin sections coated with 20 nm of carbon, using the SEMZEISS Supra 55 VP (ISTeP, Paris, France). Imaging was realized using an electron beam at 15keV and an AsB detector. Some EDS spectra were also acquired to get the semi-quantitativechemical composition of the phases.
4.3. Results4.3.1. Samples Composition
• Iron content and speciation
Iron content and speciation results are provided in Table 2. All Mössbauer and ICP-OES data are available in Appendices A and B. For the fresh sample (BIF1), the differentbands that have been analyzed exhibit similar total Fe content ranging from 11.78 wt% (B1A)to 15.12 wt% (B1B), except for one band that carries much more total Fe with 56.83 wt%(B1C). This high variability is characteristic of BIF facies with iron quartz rich bands andiron oxide rich bands. Iron occurs in both oxides/oxi-hydroxide and silicate minerals. Fe3+
is always carried by iron oxides/oxi-hydroxides, mainly hematite between 30% (B1D) and76% (B1B) and magnetite (Fe3+
tetrahedral + 1/2 Fe2+/3+octahedral) between approximately 10%
(B1B) and 44% (B1C). Fe2+ is carried by oxides and silicates to a lesser extent, with Fe2+
content in magnetite (1/2 Fe2+/3+octahedral) and silicates reaching, respectively, 20% (B1C)
and 6% (B1A) of Fetot. It is interesting to note that Fe-silicates have only been detected inB1A, B1B and B1D: the quartz rich bands (where total Fe content is lower). This can beexplained by the very high content of iron oxide in B1C that hide the Fe-silicate signal duringMössbauer analyses. Because many Fe2+ silicates have similar Mössbauer parameters, thenature of Fe2+ silicates in B1A, B1B and B1D cannot be determined unambiguously, evenmore if it consists in a mix of different silicate species. Nonetheless, Mössbauer parametersfor Fe2+ silicates in this samples match Mössbauer parameters of both stilpnomelane andminnesotaite [43,44]. Finally, the calculated Fe3+/Fetot ratios are high in this sample andexhibit a bimodal variability with B1A and B1B ratios of 0.90 and 0.96, respectively, whereasB1C and B1D ratios are 0.81 and 0.79. This bimodal variability with a higher oxidation inB1A and B1B matches the preferential presence of Fe3+-hydroxides (ferrihydrite, goethite,lepidocrocite) in these bands as well as the reddish color of the lower part of the BIF1sample (Figure 11), inferring an oxidation episode by water circulation in some bands ofthis sample.

Minerals 2022, 12, 163 14 of 28
Table 2. Iron content and speciation in BIF1, BIF2 and BIF3 samples.
Sample
Iron Speciation—Mössbauer Spectroscopy (%)Iron Content
ICP-OES(wt%)
Hematite Goethite * Ferrihydrite Magnetite SilicateFe3+/Fetot Fetot
Fe3+ Fe3+ Fe3+ Fe3+tetra Fe2+/3+
octa Fe3+ Fe2+
B1A 43 10 23 10 8 N.D. 6 0.90 11.78B1B 76 10 N.D. 6 7 N.D. <3 0.96 15.12B1C 34 N.D. 3 24 39 N.D. N.D. 0.81 56.83B1D 30 N.D. 13 19 33 N.D. 5 0.79 14.08B2A 18 78 N.D. <3 <3 <3 N.D. 1.00 42.57B2B 35 56 N.D. 4 3 <3 N.D. 0.99 28.95B3A 18 50 N.D. 14 13 5 N.D. 0.94 27.01B3B 13 43 N.D. 18 19 7 N.D. 0.91 36.87B3C 56 N.D. N.D. 25 19 N.D. N.D. 0.91 41.70
* goethite (α-FeOOH) + lepidocrocite (γ-FeOOH). N.D.: Not Detected.
For the altered samples (BIF2 and BIF3), the total Fe content is much higher than BIF1ranging from 27.01 wt% (B3A) to 42.57 wt% (B2A). Although BIF2 and BIF3 have beensegmented in different zones containing several quartz-rich and iron oxide-rich bands thataverage the mean compositions of the zones, the higher total Fe content in these alteredsamples is essentially significative of iron enrichment by water circulation in subsurfaceconditions. For BIF2 and BIF3, Fe3+ is carried predominantly by oxides/oxi-hydroxideslike in BIF1. Goethite is the main Fe3+-bearing mineral ranging from 43% (B3B) to 78%(B2A) of Fetot, highlighting the high rate of hydration and alteration of the samples, exceptfor B3C where hematite is predominant. On the contrary to BIF1, the little amount of ironcontained in silicates is exclusively Fe3+. Finally, the low amount of Fe2+ is totally carried bymagnetite (1/2 Fe2+/3+
octahedral), with content evaluated from <2% (B2B) to 10% (B3C/B3B).The calculated Fe3+/Fetot ratios for these samples are even higher than for the BIF1, from0.91 (B3C/B3B) to 1.00 (B2A).
• Mineralogy
For the Fresh BIF sample (BIF1), quartz is always abundant, even if it is less present inB1C (Figure 12). Iron oxides are also present in high contents, consisting in dominant Fe3+
oxide (hematite) and to a lesser extent Fe2+/Fe3+ oxide (magnetite), except for B1C wheremagnetite is dominant (Figure 12). No Fe3+ oxi-hydroxide (goethite) is detected in thissample. Finally, it is interesting to point out the detection of low content phases in the B1Aand B1B strips. Indeed, calcite is clearly visible in B1B, while riebeckite is slightly detectedin B1A with characteristic peaks at 2θ ≈ 10.5◦ and 28◦. The XRD observation of riebeckite,a Na-amphibole-bearing Fe2+, in low a content in this sample is consistent with Mössbauerresults that revealed the presence of Fe2+ carried in low amounts by silicates that might beriebeckite. The riebeckite presence in this sample coming from Dales Gorge Member is alsoconsistent with previous studies, as riebeckite was determined to be a ubiquitous mineralof this member [42].
For the altered samples (BIF2 and BIF3), the mineralogy consists exclusively in quartzand iron oxides/oxy-hydroxide (Figure 12). BIF2 and BIF3 exhibit a high content of Fe3+
oxy-hydroxides (goethite), except for B3C. Fe3+ oxide (hematite) is also highly present inthese samples. Fe2+/Fe3+ oxide (magnetite) is also detected but in amount much lowerthan Fe3+ oxide/, except for B3C where magnetite is still strongly present. Finally, neithercarbonate nor Fe2+ silicate have been detected by XRD analyses in the altered samples,implying very low concentrations (under a few percent) if present. These results aresignificant of a higher oxidation degree of BIF2 and BIF3 compared to BIF1 and are in goodagreement with higher Fe3+/Fetot ratios of BIF2 and BIF3 than BIF1 (Table 2).

Minerals 2022, 12, 163 15 of 28
Minerals 2022, 12, x FOR PEER REVIEW 15 of 29
riebeckite, a Na-amphibole-bearing Fe2+, in low a content in this sample is consistent with
Mössbauer results that revealed the presence of Fe2+ carried in low amounts by silicates
that might be riebeckite. The riebeckite presence in this sample coming from Dales Gorge
Member is also consistent with previous studies, as riebeckite was determined to be a
ubiquitous mineral of this member [42].
For the altered samples (BIF2 and BIF3), the mineralogy consists exclusively in quartz
and iron oxides/oxy-hydroxide (Figure 12). BIF2 and BIF3 exhibit a high content of Fe3+
oxy-hydroxides (goethite), except for B3C. Fe3+ oxide (hematite) is also highly present in
these samples. Fe2+/Fe3+ oxide (magnetite) is also detected but in amount much lower than
Fe3+ oxide/, except for B3C where magnetite is still strongly present. Finally, neither car-
bonate nor Fe2+ silicate have been detected by XRD analyses in the altered samples, im-
plying very low concentrations (under a few percent) if present. These results are signifi-
cant of a higher oxidation degree of BIF2 and BIF3 compared to BIF1 and are in good
agreement with higher Fe3+/Fetot ratios of BIF2 and BIF3 than BIF1 (Table 2).
Figure 12. XRD patterns obtained and interpreted for (a) the fresh BIF sample (BIF1) and (b) the
altered BIF samples (BIF2 and BIF3). Letter Q refers to quartz, M to magnetite, H to hematite, G to
goethite, R to riebeckite and C to calcite.
4.3.2. Microscopic Observations
• Fresh BIF
The petrographic study conducted at a microscopic scale on the fresh sample by SEM
revealed a highly characteristic textural assemblage present in the whole B1A strip. As
shown in Figure 13, small and rounded minerals were noticed in bright white, forming
little clusters of a few micrometers. A punctual semi-quantitative analysis performed on
these minerals showed that they correspond to iron oxide (Figure 13c). Fibrous minerals
of tens/hundreds of centimeters in light gray color were also observed in a matrix of quartz
in dark gray. The observation of such asbestos texture is consistent with the presence of
silicate detected during Mössbauer analyses. A punctual semi-quantitative analysis per-
formed on these fibrous minerals confirmed that they correspond to iron silicate (Figure
13d). Although XRD analyses revealed the presence of riebeckite (Na-amphibole) in the
samples, the composition of the Fe2+ silicate herein includes Fe, Mg, K, Al, Si and O but
lacks Na and thus demonstrates that several asbestos Fe2+ silicates are present in the sam-
ple. The qualitative composition provided here matches the theoretical composition of
minnesotaite ((Fe2+, Mg)3Si4O10(OH)2), as well as Mössbauer results and common minerals
found in the Dales Gorge Member [42].
Figure 12. XRD patterns obtained and interpreted for (a) the fresh BIF sample (BIF1) and (b) thealtered BIF samples (BIF2 and BIF3). Letter Q refers to quartz, M to magnetite, H to hematite, G togoethite, R to riebeckite and C to calcite.
4.3.2. Microscopic Observations
• Fresh BIF
The petrographic study conducted at a microscopic scale on the fresh sample by SEMrevealed a highly characteristic textural assemblage present in the whole B1A strip. Asshown in Figure 13, small and rounded minerals were noticed in bright white, forminglittle clusters of a few micrometers. A punctual semi-quantitative analysis performed onthese minerals showed that they correspond to iron oxide (Figure 13c). Fibrous minerals oftens/hundreds of centimeters in light gray color were also observed in a matrix of quartz indark gray. The observation of such asbestos texture is consistent with the presence of silicatedetected during Mössbauer analyses. A punctual semi-quantitative analysis performedon these fibrous minerals confirmed that they correspond to iron silicate (Figure 13d).Although XRD analyses revealed the presence of riebeckite (Na-amphibole) in the samples,the composition of the Fe2+ silicate herein includes Fe, Mg, K, Al, Si and O but lacks Naand thus demonstrates that several asbestos Fe2+ silicates are present in the sample. Thequalitative composition provided here matches the theoretical composition of minnesotaite((Fe2+, Mg)3Si4O10(OH)2), as well as Mössbauer results and common minerals found in theDales Gorge Member [42].
As presented in Figure 14, the BIF2 exhibits alternating microbands of highly reflectivehematite and less reflective goethitic fibrous minerals in a matrix of quartz. The Figure 14bshows fibrous goethite in the matrix of quartz under transmitted light, appearing red-brownish when not extinct.
The BIF3 corresponds at macroscale (Figure 10) to dark and bright strips. This patternis also observed at the microscale with Fe oxide-rich layers alternating (Figure 15a) withquartz layers (Figure 15c,d). Under reflected light, the white-pinkish euhedral iron oxidesare stripped by even whiter straight lines (Figure 15a). In this sample, goethite is alsoobserved surrounding the euhedral oxide minerals (light gray color in Figure 14a) or intoveins in the quartz levels (red-brownish color in Figure 15c). Finally, the quartz levelscontain minor euhedral oxide minerals, almost fully destabilized and crosscut by goethiteveins (Figure 15d).

Minerals 2022, 12, 163 16 of 28Minerals 2022, 12, x FOR PEER REVIEW 16 of 29
Figure 13. (a,b) Fibrous silicates observed by SEM in the fresh BIF sample (BIF1). Qtz corresponds
to quartz, Sil.Fe corresponds to iron silicate and Ox.Fe corresponds to iron oxide. (c,d) Spectra of
punctual semi-quantitative analyses performed on the two points located on image (b). (c) Iron ox-
ide, point 1. (d) Iron silicate, presumably minnesotaite, point 2.
As presented in Figure 14, the BIF2 exhibits alternating microbands of highly reflec-
tive hematite and less reflective goethitic fibrous minerals in a matrix of quartz. The Figure
14b shows fibrous goethite in the matrix of quartz under transmitted light, appearing red-
brownish when not extinct.
Figure 14. Altered BIF2 sample observed by optical microscopy under (a,b) reflected and (c) trans-
mitted lights. We observe fibrous goethite between quartz grains. See location on Figure 11.
The BIF3 corresponds at macroscale (Figure 10) to dark and bright strips. This pattern
is also observed at the microscale with Fe oxide-rich layers alternating (Figure 15a) with
quartz layers (Figure 15c,d). Under reflected light, the white-pinkish euhedral iron oxides
are stripped by even whiter straight lines (Figure 15a). In this sample, goethite is also ob-
served surrounding the euhedral oxide minerals (light gray color in Figure 14a) or into
veins in the quartz levels (red-brownish color in Figure 15c). Finally, the quartz levels
contain minor euhedral oxide minerals, almost fully destabilized and crosscut by goethite
veins (Figure 15d).
Figure 13. (a,b) Fibrous silicates observed by SEM in the fresh BIF sample (BIF1). Qtz correspondsto quartz, Sil.Fe corresponds to iron silicate and Ox.Fe corresponds to iron oxide. (c,d) Spectra ofpunctual semi-quantitative analyses performed on the two points located on image (b). (c) Iron oxide,point 1. (d) Iron silicate, presumably minnesotaite, point 2.
Minerals 2022, 12, x FOR PEER REVIEW 16 of 29
Figure 13. (a,b) Fibrous silicates observed by SEM in the fresh BIF sample (BIF1). Qtz corresponds
to quartz, Sil.Fe corresponds to iron silicate and Ox.Fe corresponds to iron oxide. (c,d) Spectra of
punctual semi-quantitative analyses performed on the two points located on image (b). (c) Iron ox-
ide, point 1. (d) Iron silicate, presumably minnesotaite, point 2.
As presented in Figure 14, the BIF2 exhibits alternating microbands of highly reflec-
tive hematite and less reflective goethitic fibrous minerals in a matrix of quartz. The Figure
14b shows fibrous goethite in the matrix of quartz under transmitted light, appearing red-
brownish when not extinct.
Figure 14. Altered BIF2 sample observed by optical microscopy under (a,b) reflected and (c) trans-
mitted lights. We observe fibrous goethite between quartz grains. See location on Figure 11.
The BIF3 corresponds at macroscale (Figure 10) to dark and bright strips. This pattern
is also observed at the microscale with Fe oxide-rich layers alternating (Figure 15a) with
quartz layers (Figure 15c,d). Under reflected light, the white-pinkish euhedral iron oxides
are stripped by even whiter straight lines (Figure 15a). In this sample, goethite is also ob-
served surrounding the euhedral oxide minerals (light gray color in Figure 14a) or into
veins in the quartz levels (red-brownish color in Figure 15c). Finally, the quartz levels
contain minor euhedral oxide minerals, almost fully destabilized and crosscut by goethite
veins (Figure 15d).
Figure 14. Altered BIF2 sample observed by optical microscopy under (a,b) reflected and (c) trans-mitted lights. We observe fibrous goethite between quartz grains. See location on Figure 11.
Minerals 2022, 12, 163 17 of 28Minerals 2022, 12, x FOR PEER REVIEW 17 of 29
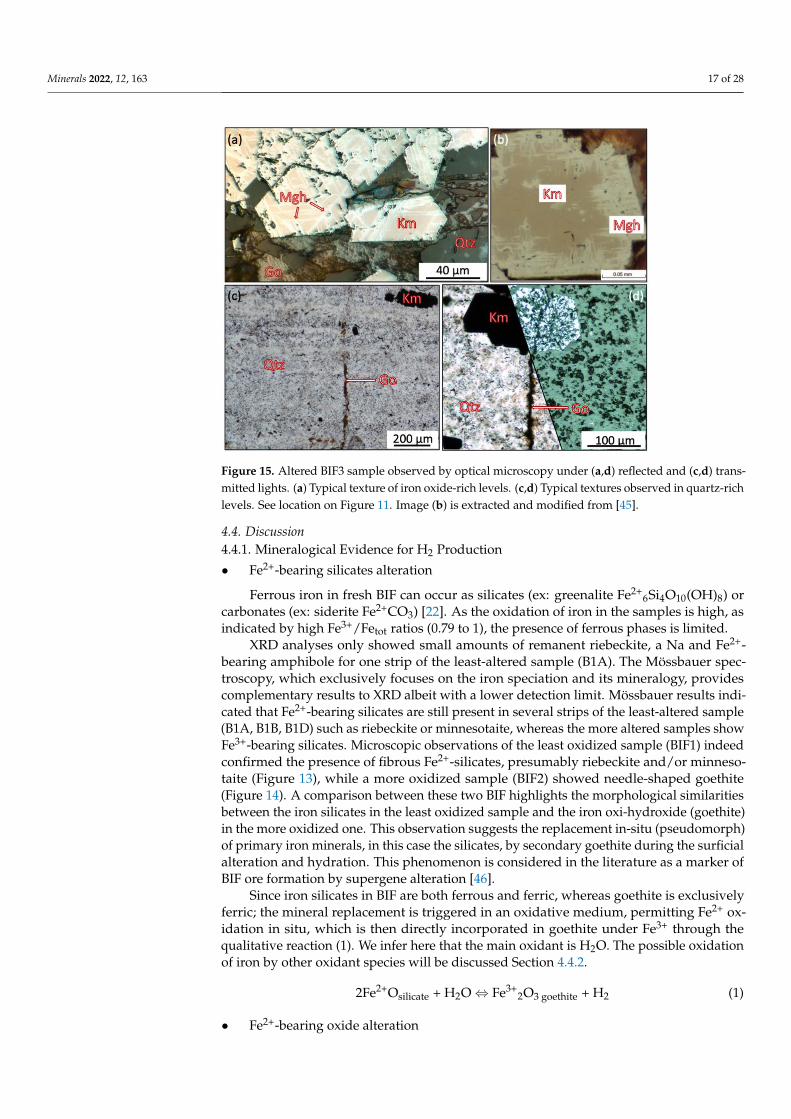
Figure 15. Altered BIF3 sample observed by optical microscopy under (a,d) reflected and (c,d)
transmitted lights. (a) Typical texture of iron oxide-rich levels. (c,d) Typical textures observed in
quartz-rich levels. See location on Figure 11. Image (b) is extracted and modified from [45].
4.4. Discussion
4.4.1. Mineralogical Evidence for H2 Production
• Fe2+-bearing silicates alteration
Ferrous iron in fresh BIF can occur as silicates (ex: greenalite Fe2+6Si4O10(OH)8) or car-
bonates (ex: siderite Fe2+CO3) [22]. As the oxidation of iron in the samples is high, as indi-
cated by high Fe3+/Fetot ratios (0.79 to 1), the presence of ferrous phases is limited.
XRD analyses only showed small amounts of remanent riebeckite, a Na and Fe2+-
bearing amphibole for one strip of the least-altered sample (B1A). The Mössbauer spec-
troscopy, which exclusively focuses on the iron speciation and its mineralogy, provides
complementary results to XRD albeit with a lower detection limit. Mössbauer results in-
dicated that Fe2+-bearing silicates are still present in several strips of the least-altered sam-
ple (B1A, B1B, B1D) such as riebeckite or minnesotaite, whereas the more altered samples
show Fe3+-bearing silicates. Microscopic observations of the least oxidized sample (BIF1)
indeed confirmed the presence of fibrous Fe2+-silicates, presumably riebeckite and/or min-
nesotaite (Figure 13), while a more oxidized sample (BIF2) showed needle-shaped goe-
thite (Figure 14). A comparison between these two BIF highlights the morphological sim-
ilarities between the iron silicates in the least oxidized sample and the iron oxi-hydroxide
(goethite) in the more oxidized one. This observation suggests the replacement in-situ
(pseudomorph) of primary iron minerals, in this case the silicates, by secondary goethite
during the surficial alteration and hydration. This phenomenon is considered in the liter-
ature as a marker of BIF ore formation by supergene alteration [46].
Since iron silicates in BIF are both ferrous and ferric, whereas goethite is exclusively
ferric; the mineral replacement is triggered in an oxidative medium, permitting Fe2+ oxi-
dation in situ, which is then directly incorporated in goethite under Fe3+ through the qual-
itative reaction (1). We infer here that the main oxidant is H2O. The possible oxidation of
iron by other oxidant species will be discussed Section 4.4.2.
2Fe2+Osilicate + H2O Fe3+2O3 goethite + H2 (1)
• Fe2+-bearing oxide alteration
In the three samples, XRD analyses showed that magnetite is the main remaining Fe2+
bearing mineral, which can be explained by a slower oxidation compared to carbonates
Figure 15. Altered BIF3 sample observed by optical microscopy under (a,d) reflected and (c,d) trans-mitted lights. (a) Typical texture of iron oxide-rich levels. (c,d) Typical textures observed in quartz-richlevels. See location on Figure 11. Image (b) is extracted and modified from [45].
4.4. Discussion4.4.1. Mineralogical Evidence for H2 Production
• Fe2+-bearing silicates alteration
Ferrous iron in fresh BIF can occur as silicates (ex: greenalite Fe2+6Si4O10(OH)8) or
carbonates (ex: siderite Fe2+CO3) [22]. As the oxidation of iron in the samples is high, asindicated by high Fe3+/Fetot ratios (0.79 to 1), the presence of ferrous phases is limited.
XRD analyses only showed small amounts of remanent riebeckite, a Na and Fe2+-bearing amphibole for one strip of the least-altered sample (B1A). The Mössbauer spec-troscopy, which exclusively focuses on the iron speciation and its mineralogy, providescomplementary results to XRD albeit with a lower detection limit. Mössbauer results indi-cated that Fe2+-bearing silicates are still present in several strips of the least-altered sample(B1A, B1B, B1D) such as riebeckite or minnesotaite, whereas the more altered samples showFe3+-bearing silicates. Microscopic observations of the least oxidized sample (BIF1) indeedconfirmed the presence of fibrous Fe2+-silicates, presumably riebeckite and/or minneso-taite (Figure 13), while a more oxidized sample (BIF2) showed needle-shaped goethite(Figure 14). A comparison between these two BIF highlights the morphological similaritiesbetween the iron silicates in the least oxidized sample and the iron oxi-hydroxide (goethite)in the more oxidized one. This observation suggests the replacement in-situ (pseudomorph)of primary iron minerals, in this case the silicates, by secondary goethite during the surficialalteration and hydration. This phenomenon is considered in the literature as a marker ofBIF ore formation by supergene alteration [46].
Since iron silicates in BIF are both ferrous and ferric, whereas goethite is exclusivelyferric; the mineral replacement is triggered in an oxidative medium, permitting Fe2+ ox-idation in situ, which is then directly incorporated in goethite under Fe3+ through thequalitative reaction (1). We infer here that the main oxidant is H2O. The possible oxidationof iron by other oxidant species will be discussed Section 4.4.2.
2Fe2+Osilicate + H2O⇔ Fe3+2O3 goethite + H2 (1)
• Fe2+-bearing oxide alteration

Minerals 2022, 12, 163 18 of 28
In the three samples, XRD analyses showed that magnetite is the main remainingFe2+ bearing mineral, which can be explained by a slower oxidation compared to carbon-ates or silicates during weathering. Magnetite is often accompanied by the ferric oxidehematite such as in B3C. Microscopic observations realized in this zone revealed a morecomplex mineralogy (Figure 15) with essentially white-pinkish euhedral oxides strippedby even brighter lines. In the literature, this facies corresponds to kenomagnetite andmaghemite (Figure 15b, [45]). They are known to develop as metastable phases during theon-going martitization process, a slow destabilization and oxidation of primary magnetiteto hematite when BIF are progressively exhumed [16]. Due to the similar properties ofkenomagnetite/maghemite and magnetite/hematite (same crystalline system and/or samechemical element and/or same oxidation degree), it is difficult to discriminate these phases.This explains the XRD results, which only showed hematite and magnetite presence for thissample. In parallel, goethite has also been observed in veins originating from kenomag-netite/maghemite, showing a dissolution pattern (Figure 15d). This can be interpreted asthe mobilization of Fe2+ by alteration fluids in a low oxidative medium and its precipitationunder Fe3+ in goethite veins when the environment becomes more oxidative closer to thesurface. The oxidation of ferrous iron contained in magnetite could be summarized by thequalitative reaction (2). Like for Equation (1), we infer here that the main oxidant is H2O.
2Fe2+Omagnetite + H2O⇔ Fe3+2O3 goethite/hematite + H2 (2)
4.4.2. Is Water the Main Oxidant during BIF Alteration?
The petrographic study shows that BIF-hosted ore formations are the results of thecirculation of oxidizing fluids. Some authors also mention deeper fluid circulation [47,48].Although these fluid circulations leach and oxidize the rocks, the exact nature of the oxidantremains unclear. For example, some authors talked of a “deeply circulating heated meteoricfluid” able to “convert siderite-stilpnomelane to an ankerite-hematite assemblage” [48],but the redox reactions were not further investigated. In some papers, dissolved O2concentrations in circulating groundwater was taken as the main chemical parameter (inaddition to physical parameters such as permeability), constraining the rate of BIF oxidation([49] and references therein). Nonetheless, supergene alteration (and so oxidation) profilescan reach in some cases several hundreds of meters below the surface [50]. Is the circulatingwater still oxygenated at such depth? Numerous studies show that groundwater usuallyfalls toward reducing conditions, since all conventional oxidants (such as O2, NO3
− orSO4
2−) are quickly consumed in the first meters of soil/sediments by organic matteroxidation [51–53]. This favors water being the main oxidant, and thus the possibility forBIF-contained iron to be directly oxidized by water molecules is highly possible.
4.4.3. Fe2+-Budget for H2 Generation in Fresh BIF1 Sample
During BIF-hosted iron ore formation, it has been demonstrated that all Fe2+ is con-verted in Fe3+. Thus, by using the iron content and Fe2+ remaining in the BIF1 sample,a first order estimate of H2-generation remanent potential can be realized. As the lowerpart of this sample shows a higher oxidation rate related to water circulation, the focushas been made on the upper part of the sample (B1C and B1D). On the basis of the genericredox equation leading to iron oxidation and H2 generation (3), H2 potential from bothFe2+
magnetite and Fe2+silicate in B1C and B1D have been evaluated. Detailed calculations are
provided in Appendix C.
2Fe2+O + H2O⇔ Fe3+2O3 + H2 (3)
From B1C, which is an iron oxide rich level containing 56.83 wt% of total Fe andonly magnetite as an Fe2+-bearing mineral, the remanent H2 generation potential throughFe2+
magnetite oxidation is evaluated to 100 mmol per kg of BIF from B1D, which is a quartz-rich level containing 14.08 wt% of total Fe with Fe2+ distributed in both magnetite and
Minerals 2022, 12, 163 19 of 28
silicates; the remanent H2 generation potential through Fe2+magnetite and Fe2+
silicate oxida-tions are evaluated to be 200 mmol and 70 mmol per kg of BIF, respectively. Studies showedthat H2 is produced from <100 mmol to >300 mmol per kg of dunite or harzburgite duringserpentinization, depending on the temperature [54]. The comparison with our first orderestimates demonstrates the potential of fresh BIF for H2 generation. Finally, although H2potential seems much higher for magnetite than silicate in the first instance, since magnetiteis the major Fe2+-bearing mineral in BIF, the kinetics of reaction for martitization mightrequire a longer time as transitionary stages exist, whereas Fe2+-silicates are more easilyweathered during BIF weathering.
4.4.4. Is There a Temporal Concordance between BIF Alteration and H2 Emissions?
The BIF surficial alteration profiles and related ore bodies worldwide are associatedwith past or present lateritization processes in tropical climates. Since the break-up ofPangea 200 My ago, the on-going continental drift induces a continuous evolving newclimate setting for continents. Some studies demonstrated that the Australian drift triggeredmajor climate changes in the continent due to entering the intertropical zone during theCenozoic, with tropical conditions that mainly lasted during the Miocene [50]. Hence, itis not surprising to find BIF-hosted iron ores dated back to the Cenozoic in Australia [55].The lateritization of BIF in Western Australia is likely to be stopped or highly reducednowadays, and so our samples are representative of a past surficial alteration and possibleH2 generation, which is not in agreement with active H2 emitting SCD. Nonetheless, thecurrent degassing of past-produced H2 trapped under impermeable caps such as salt layersas well as in fluid inclusions within BIF rocks is a path to explore.
In parallel, although we did not focus on it during this study, the on-going oxidationof BIF-contained iron likely continues, independently of the lateritization processes, indeeper environments where basinal aqueous fluids circulate. It could be the case in the SãoFrancisco Basin and western Australia where BIF do not outcrop but are suspected belowsub-circular depressions.
4.4.5. Kinetic Factors Concern for H2 Generation by BIF Oxidation
This study promoted promising elements for H2 generation by water reduction andiron oxidation during BIF alteration. These water–rock interactions are mainly associatedwith supergene alteration profiles reaching tens or maximum hundreds of meters [56]. Al-though the generation of H2 at such low depths (and so almost ambient T◦) would not be ofeconomic interest due to a lack of traps, it challenges the idea that high P/T conditions arerequired to generate H2 through iron redox reactions. For example, the serpentinization ofbasic rocks has been widely studied through calculations and experiments showing an op-timal temperature for H2 generation around 300 ◦C [57]. Experiments at near-atmospherictemperature were also investigated and showed that H2 can be formed with the presenceof catalysts such as magnetite [58]. In parallel, only few works focused on H2 generationthrough the oxidation of iron contained in other families of minerals so far. Some of themdemonstrated the possibility of H2 generation by wate–rrock interactions with siderite at200–300 ◦C [59], but the generation at lower temperature has not yet been tested.
In Western Australia, a recent work promoted low generation temperatures of H2thanks to the geothermometer H2-CH4, despite the mechanisms leading to the formationof these gases remain unclear [33]. For BIF, the generation of natural H2 by iron oxidationat these low range of temperatures might require catalysts of biological as well as chemicalorigins, like it has been proposed in serpentinization contexts. For example, authorspointed out that H2 generation efficiency can be highly dependent on pH [60], Ni of Pdpresence [57], the abundance of magnetite [58] or chemical composition of rocks [61]. Therole of microorganisms to facilitate the reaction should also be studied.

Minerals 2022, 12, 163 20 of 28
4.5. Synthesis of the Petrographic Study: A Model of BIF Samples Alteration and RelatedH2 Generation
BIF constitute a massive ferrous iron reservoir when preserved from surficial alteration,but their exhumation induces a strong leaching that can reach few hundreds of meters indepth [56]. This leads to a quasi-complete iron oxidation and formation of BIF-hosted ironores, which are dated to a recent past (Cenozoic) in the case of Western Australia [50,62].The petrological work on samples from Western Australia in transitional stages betweenfresh and weathered showed that both primary ferrous oxides and primary ferrous sili-cates/carbonates are sensitive to oxidizing fluid circulation. On the basis of an iron oreformation model that has been proposed in literature [56], the sketch presented in Fig-ure 16 proposes a conceptual petrological history of the samples related to H2 generation.It must be noticed that the kinetics and depth of H2 generation are not constrained yet,and additional data and modeling will be necessary. Martitization and goethitization areprocesses that are observed in several geological contexts [16,45], but thermodynamic (andsubsequently kinetic) data are needed to verify that the proposed reactions may have animpact of the gas signature in the studied basins.
Minerals 2022, 12, x FOR PEER REVIEW 20 of 29
4.5. Synthesis of the Petrographic Study: A Model of BIF Samples Alteration and Related H2
Generation
BIF constitute a massive ferrous iron reservoir when preserved from surficial altera-
tion, but their exhumation induces a strong leaching that can reach few hundreds of me-
ters in depth [56]. This leads to a quasi-complete iron oxidation and formation of BIF-
hosted iron ores, which are dated to a recent past (Cenozoic) in the case of Western Aus-
tralia [50,62]. The petrological work on samples from Western Australia in transitional
stages between fresh and weathered showed that both primary ferrous oxides and pri-
mary ferrous silicates/carbonates are sensitive to oxidizing fluid circulation. On the basis
of an iron ore formation model that has been proposed in literature [56], the sketch pre-
sented in Figure 16 proposes a conceptual petrological history of the samples related to
H2 generation. It must be noticed that the kinetics and depth of H2 generation are not
constrained yet, and additional data and modeling will be necessary. Martitization and
goethitization are processes that are observed in several geological contexts [16,45], but
thermodynamic (and subsequently kinetic) data are needed to verify that the proposed
reactions may have an impact of the gas signature in the studied basins.
Figure 16. A possible petrological history of the samples and related H2 generation. Fe2+-bearing
minerals such as magnetite and riebeckite/minnesotaite are altered by water circulation and ferrous
iron oxidizes to generate H2. Fe3+-bearing minerals such as hematite are altered by water circulation
to form oxi-hydroxide goethite, but no H2 is generated during this mineral transition.
1. The BIF samples are made up of alternating layers of quartz and primary auto-
morphy magnetite. In the quartz layers, various proportions of minor phases such as
primary iron silicates and primary iron oxides occur;
2. When weathering starts, the BIF undertakes an oxidation episode, underlined by the
presence of kenomagnetite and maghemite, which mark the on-going martitization
process of the primary magnetite. The martitization can be accompanied by a mobi-
lization of Fe2+ in circulation fluids before reprecipitation as Fe3+ in goethite veins
closer to the surface when the medium become more oxidizing. Quartz starts being
dissolved, increasing progressively the permeability and hence fluid circulation;
2Fe
2+O
silic
ate
s+
H2O
→ F
e3+
2O
3go
eth
ite
+ H
2
50m
Surface
Automorph
magnetite
Quartz
Fibrous riebeckiteand minnesotaite
Martitisedmagnetite
Goethite vein
Full martitisation:hematite
Goethitised riebeckiteand minnesotaite
Fully goethitised hematite
1
2
32
Fe2+
Om
agn
etit
e+
H2O
→ F
e3
+2O
3go
eth
ite
/he
mat
ite
+ H
2
Fe3
+ 2O
3h
em
atit
e+
H2O
→ F
e3
+2O
3go
eth
ite
Fresh BIF
BIF-iron ore
Figure 16. A possible petrological history of the samples and related H2 generation. Fe2+-bearingminerals such as magnetite and riebeckite/minnesotaite are altered by water circulation and ferrousiron oxidizes to generate H2. Fe3+-bearing minerals such as hematite are altered by water circulationto form oxi-hydroxide goethite, but no H2 is generated during this mineral transition.
1. The BIF samples are made up of alternating layers of quartz and primary automorphymagnetite. In the quartz layers, various proportions of minor phases such as primaryiron silicates and primary iron oxides occur;
2. When weathering starts, the BIF undertakes an oxidation episode, underlined by thepresence of kenomagnetite and maghemite, which mark the on-going martitizationprocess of the primary magnetite. The martitization can be accompanied by a mobi-lization of Fe2+ in circulation fluids before reprecipitation as Fe3+ in goethite veinscloser to the surface when the medium become more oxidizing. Quartz starts beingdissolved, increasing progressively the permeability and hence fluid circulation;
3. A second oxidative alteration episode occurs closer to the surface, when fluid circula-tion intensifies. The minor phases such as iron silicates or carbonates are destabilized

Minerals 2022, 12, 163 21 of 28
and ferric iron precipitates in situ as goethite pseudomorph, or ex situ in voids createdby the rock leaching.
5. Conclusions
One of the major processes leading to H2 generation in the continental domain isthe oxidation of iron coupled to the water reduction, mostly in basic or ultrabasic rockscontaining high rates of ferrous iron in minerals such as olivine. Based on a work couplingboth satellite images and petrological approaches, we proposed in this paper a new iron-richlithology able to generate H2 through iron oxidation: banded iron formations.
• Topography and sky images analyses
Rounded depressions have been known for a few years to be the expression of cur-rently active H2 emissions in the landscape and are now found worldwide [9,10,25]. Re-cently, a study promoted a statistical approach based on satellite imaging to better con-strain the sub circular depressions (SCD) and proved H2 emitting sub circular depressions(P_H2_SCD) morphologies and separate them from other circular features as karsts [12].The work demonstrated the efficiency of the technique to target new regions to explore forH2 emissions.
In this paper, satellite imaging revealed the presence of these structures around the BIFin several regions worldwide: Australia, South Africa and Brazil. In order to test the natureof these features, hundreds of them were mapped from five new areas of Australia andSouth Africa and were added to the previous dataset. The statistical approach validated theidea of probable on-going H2 seeps in these regions that will need to be monitored by fieldmeasurements in the future, giving credit to the hypothesis of H2 generation by oxidationof BIF-hosted iron.
• Petrological study
The role of BIF as a H2 generator has never been explored yet, despite them standingas a major resource of ferrous iron on earth with Fetot content from 20 and 40 wt% andlow Fe3+/Fetot ratios (from 0.05 to 0.58) when they are preserved from alteration. Inparallel, data from surficial altered BIF always exhibit high Fe3+/Fetot ratios (very close to1), involving a strong oxidation when BIF reach the surface.
We presented in this study the results of a petrological work conducted on weatheredBIF samples from the Hamersley Province in Western Australia. The study revealedmineralogical transitions during supergene alteration, from ferrous/ferric silicates andoxides (riebeckite/minnesotaite and magnetite) to exclusively ferric oxides (hematite) andoxi-hydroxides (goethite). These replacements emphasize the oxidation by water–rockinteractions, which are strong evidence of H2 generation by BIF oxidation.
In addition, evidences presented here infer a H2 potential at a very low depth, whenBIF is weathered at the surface, implying a very low generation temperature (under 50 ◦Cand 150 bar). On the contrary to redox iron transformations at higher temperatures, theability for these transformations to produce reduced gas (H2, CH4) in anoxic conditions atlower temperatures, is still poorly constrained in onshore domains such as in ophioliticcontexts ([63] and references therein). Hence, the new observations in BIF context are amatter of debate and further studies. It also must not be excluded that BIF could react andoxidize when meeting underground water circulation in much deeper environments in thecase of buried BIF under thick sedimentary layers, with higher P-T conditions.
Finally, a question of temporal concordance can be raised: Does currently H2 emittedon fairy circles originate from BIF weathering in Western Australia, South Africa and Brazil?Such surficial alteration profiles are dated to the Cenozoic, the current era, and are relatedto major climate changes worldwide triggered by the break-up of Pangea [50]. Hence, itis possible that active SCD are related to still on-going surficial strong alteration of BIFwhere the climate is still tropical like in Brazil. In some other cases, such as in Australia,the lateritization of BIF is also Cenozoic but has decreased in the past My due to evolutionof Australian climate dynamics related to the continental drift. Thus, this is more uncertain

Minerals 2022, 12, 163 22 of 28
to have an on-going H2 generation by BIF surficial alteration. Nonetheless, the currentemissions of H2 might be related to the oxidation of BIF in deeper environments whereaqueous fluids circulate as well as currently degassing past-produced H2 trapped in rockswithin fluid inclusions or under impermeable caps such as salt layers.
• Implications for the future of H2 exploration
Even if the relationship between H2 generation and BIF will require additional charac-terization, we proposed here to add the iron-rich lithology to the list of potential H2 sourcerocks in the continental context. BIF are a worldwide-distributed lithology. As far as weknow, the spatial correlation between BIF and supposed H2 emanations can be pointedout on more numerous places than only Brazil, Australia or South-Africa. Thus, targetingBIF might be another proxy for natural H2 exploration. Obviously, the targeted BIF forH2 exploration could be in subsurfaces at the opposite of the ones targeted by the ironmine industry, which have to outcrop, or be close to thesurface. BIF constitute the mainferrous-iron resource on Earth, hence including this additional lithology, as a H2 source inthe global balance might significantly increase the annually estimates of emitted H2 thatare now 1013 mol/an according to the latest calculations [14]. Finally, the possibility of H2production at a relative ambient temperature has been suggested in this paper, concurringwith a previous study [33]. If true, it might open a new whole field of research for H2generation, which has always been considered to require higher temperatures up to now.
Author Contributions: All authors contributed to the data interpretation and to the writing of thispaper, which has been finalized by U.G., D.L. and I.M.; U.G. did the petrological study of the BIFwith D.L.; E.R. selected and provided the BIF samples, and he participated in the interpretation of theresults; A.O. did the research and the mapping of the SCD in South Africa under the supervision ofI.M.; The original idea came from I.M. All authors have read and agreed to the published version ofthe manuscript.
Funding: This research has been supported by UPPA. The master’s scholarship of U.G. as wellof some of the analyses have been paid by ENGIE and the master scholarship of A.O. by theSaclay University.
Data Availability Statement: All the data are in the cited literature or included in the paper. Mappingof the structures could be conducted from open-access satellite images.
Acknowledgments: We are grateful to Mathieu Duttine (ICMCB, Bordeaux) who did the Mossbauer’sanalyses, Omar Boudouma (Istep, SU, Paris) for the MEB analyses and Sophie Novak (UP, Paris) forsharing her XRD expertise. We thank also Ema Frery (CSIRO), Gabriel Pasquet (UPPA) and OlivierSissmann (IFPen) for many discussions about natural hydrogen.
Conflicts of Interest: The authors declare no conflict of interest.
Appendix A
Table A1. Chemical compositions (in oxide wt%) of the BIF1, BIF2 and BIF3 samples obtained byICP-OES.
SampleChemical Composition—ICP-OES (wt%)
SiO2 Al2O3 Fe2O3 MnO MgO CaO Na2O K2O TiO2 P2O5 L.O.I. * Total
B1A 71.06 0.11 16.83 <D.L. 1.37 1.07 1.04 <D.L. <D.L. <D.L. 2.72 94.19B1B 57.55 0.05 21.60 0.027 0.13 10.54 0.12 <D.L. <D.L. <D.L. 9.61 99.61B1C 15.78 0.29 81.18 <D.L. 0.88 0.50 0.10 0.12 <D.L. 0.35 0.38 99.58B1D 73.95 0.51 20.11 <D.L. 2.62 0.04 0.08 0.23 <D.L. <D.L. 2.29 99.83B2A 32.32 0.25 60.81 <D.L. <D.L. 0.03 <D.L. <D.L. <D.L. 0.10 6.50 100.01B2B 55.00 0.05 41.35 <D.L. <D.L. <D.L. <D.L. <D.L. <D.L. <D.L. 3.24 99.63B3A 58.18 <D.L. 38.59 0.23 0.09 0.04 <D.L. <D.L. <D.L. 0.10 2.66 99.88B3B 43.30 <D.L. 52.67 0.19 0.19 0.04 <D.L. <D.L. <D.L. <D.L. 2.84 99.23B3C 39.78 <D.L. 59.57 <D.L. <D.L. 0.04 <D.L. <D.L. <D.L. <D.L. −0.27 99.12
* L.O.I.: Loss on Ignition includes loss of volatiles and gain from oxidation of Fe2+. D.L.: Detection Limit.

Minerals 2022, 12, 163 23 of 28
Appendix B
Minerals 2022, 12, x FOR PEER REVIEW 23 of 29
B2B 55.00 0.05 41.35 <D.L. <D.L. <D.L. <D.L. <D.L. <D.L. <D.L. 3.24 99.63
B3A 58.18 <D.L. 38.59 0.23 0.09 0.04 <D.L. <D.L. <D.L. 0.10 2.66 99.88
B3B 43.30 <D.L. 52.67 0.19 0.19 0.04 <D.L. <D.L. <D.L. <D.L. 2.84 99.23
B3C 39.78 <D.L. 59.57 <D.L. <D.L. 0.04 <D.L. <D.L. <D.L. <D.L. −0.27 99.12
* L.O.I.: Loss on Ignition includes loss of volatiles and gain from oxidation of Fe2+. D.L.: Detection Limit.
Appendix B
-12 -8 -4 0 +4 +8 +12
0.92
0.93
0.94
0.95
0.96
0.97
0.98
0.99
1.00
Vitesse (mm/s)
ab
so
rptio
n r
ela
tive
obs.
Fe3+ hématite
Fe3+ lepidocrocite
Fe3+ goethite
Fe3+ magnétite
Fe2+/3+ magnétite
Fe2+ silicate
calc.
B1B d
(mm/s)
D ou 2e
(mm/s)
Bhf(T)
Γ
(mm/s)
Area
(%)
Attribution
S1 0.37(1) -0.18(1) 51.7(1) 0.30(1) 76(3) Fe3+ hematite
DQ2 0.37(2) 0.53(3) - 0.45(5) 7(3) Fe3+ lepidocrocite
S2 0.38(2) -0.33(8) 38.1(8) 0.62(8) 3(3) Fe3+ goethite
S3 0.28(3) -0.04(4) 49.1(2) 0.40(3) 6(3) Fe3+ magnetite
S4 0.63(6) -0.01(2) 46.2(6) 0.50(3) 7(3) Fe2+/3+ magnetite
DQ3 1.10(3) 2.81(5) - 0.30(-) < 3 Fe2+ silicate
-12 -8 -4 0 +4 +8 +12
0.96
0.97
0.98
0.99
1.00
Vitesse (mm/s)
ab
so
rption
re
lative
obs.
Fe3+ hématite
Fe3+ ferrihydrite
Fe3+ lepidocrocite
Fe3+ goethite
Fe3+ magnétite
Fe2+/3+ magnétite
Fe2+ silicate
calc.
B1A d
(mm/s)D ou 2e
(mm/s)Bhf(T)
Γ(mm/s)
Area(%)
Attribution
S1 0.37(1) -0.19(1) 51.6(1) 0.30(1) 43(3) Fe3+ hematite
DQ1 0.34(2) 0.94(8) - 0.69(5) 23(3) Fe3+ ferrihydrite
DQ2 0.38(1) 0.48(3) - 0.28(3) 7(3) Fe3+ lepidocrocite
S2 0.37(2) -0.15(6) 37.1* 0.40(-) 3(3) Fe3+ goethite
S3 0.28(3) -0.07(5) 49.4(5) 0.69(5) 10(3) Fe3+ magnetite
S4 0.64(3) -0.05(5) 46.3(6) 0.90(5) 8(3) Fe2+/3+ magnetite
DQ3 1.09(3) 2.74(6) - 0.47(5) 6(3) Fe2+ silicate
B1A B1B
Re
lative
absorp
tion
Velocity (mm/s)
Rela
tive a
bso
rption
Velocity (mm/s)
-12 -8 -4 0 +4 +8 +12
0.90
0.92
0.94
0.96
0.98
1.00
Vitesse (mm/s)
ab
so
rptio
n r
ela
tive
obs.
Fe3+ hématite
Fe3+ ferrihydrite
Fe3+ magnétite
Fe2+/3+ magnétite
calc.
B1C d
(mm/s)
D ou 2e
(mm/s)
Bhf(T)
Γ
(mm/s)
Area
(%)
Attribution
S1 0.37(1) -0.18(1) 51.7(1) 0.28(1) 34(3) Fe3+ hematite
DQ2 0.35(2) 0.74(6) - 0.66(7) 3(3) Fe3+ ferrihydrite
S3 0.27(1) -0.04(1) 49.1(4) 0.40(2) 24(3) Fe3+ magnetite
S4 0.66(1) -0.01(1) 45.9(4) 0.53(2) 39(3) Fe2+/3+ magnetite
-12 -8 -4 0 +4 +8 +12
0.97
0.98
0.99
1.00
Vitesse (mm/s)
ab
so
rptio
n r
ela
tive
obs.
Fe3+ hématite
Fe3+ ferrihydrite
Fe3+ magnétite
Fe2+/3+ magnétite
Fe2+ silicate
calc.
B1D d
(mm/s)
D ou 2e
(mm/s)
Bhf(T)
Γ
(mm/s)
Area
(%)
Attribution
S1 0.37(1) -0.18(1) 51.7(1) 0.28(1) 30(3) Fe3+ hematite
DQ2 0.36(2) 0.84(3) - 0.65(5) 13(3) Fe3+ ferrihydrite
S3 0.27(1) -0.04(2) 49.0(4) 0.42(3) 19(3) Fe3+ magnetite
S4 0.66(1) -0.03(2) 45.8(4) 0.59(3) 33(3) Fe2+/3+ magnetite
DQ3 1.05(3) 2.66(6) - 0.54(8) 5(3) Fe2+ silicate
Re
lative
absorp
tion
Rela
tive a
bsorp
tio
n
Velocity (mm/s) Velocity (mm/s)
B1C B1D
Minerals 2022, 12, x FOR PEER REVIEW 24 of 29
Figure A1. Mössbauer spectra and data for BIF1, BIF2 and BIF3 samples.
-12 -8 -4 0 +4 +8 +12
0.93
0.94
0.95
0.96
0.97
0.98
0.99
1.00
Vitesse (mm/s)
ab
so
rptio
n r
ela
tive
obs.
Fe3+ goethite
Fe3+ hématite
Fe3+ magnétite
Fe2+/3+ magnétite
Fe3+ silicate
calc.
11 d
(mm/s)D ou 2e
(mm/s)Bhf(T)
Γ(mm/s)
Area(%)
Attribution
S1 0.37(1) -0.20(1) 51.8(2) 0.32(2) 18(3) Fe3+ (hématite)
S2 0.26(2) 0.05(4) 49.3(4) 0.48(2) < 3 Fe3+ tét. (magnétite)
S3 0.67(2) 0.04(3) 46.2(4) 0.50(2) < 3 Fe2+/3+ oct. (magnétite)
S4 0.37(1) -0.27(1) 36* 0.30(-) 78(3) Fe3+ (goethite)
DQ1 0.21(3) 0.64(4) - 0.54(4) < 3 Fe3+ tét. (silicate)
-12 -8 -4 0 +4 +8 +12
0.96
0.97
0.98
0.99
1.00
Vitesse (mm/s)
ab
so
rptio
n r
ela
tive
obs.
Fe3+ goethite
Fe3+ hématite
Fe2+/3+ magnétite
Fe3+ magnétite
Fe3+ silicate
calc.
9 d
(mm/s)D ou 2e
(mm/s)Bhf(T)
Γ(mm/s)
Area(%)
Attribution
S1 0.37(1) -0.20(1) 51.7(2) 0.29(1) 35(3) Fe3+ (hématite)
S2 0.26(2) 0.05(4) 49.3(4) 0.48(2) 4(3) Fe3+ tét. (magnétite)
S3 0.67(2) 0.04(3) 46.2(4) 0.50(2) 3(3) Fe2+/3+ oct. (magnétite)
S4 0.37(2) -0.27(3) 36* 0.30(-) 56(3) Fe3+ (goethite)
DQ1 0.21(3) 0.64(4) - 0.54(4) < 3 Fe3+ tét. (silicate)
B2B B2A
Re
lative
absorp
tion
Velocity (mm/s)
Rela
tive a
bso
rption
Velocity (mm/s)
-12 -8 -4 0 +4 +8 +12
0.94
0.95
0.96
0.97
0.98
0.99
1.00
Vitesse (mm/s)
ab
so
rptio
n r
ela
tive
obs.
Fe3+ hématite
Fe3+ magnétite
Fe2+/3+ magnétite
Fe3+ goethite
Fe3+ silicate
calc.
1 d
(mm/s)D ou 2e
(mm/s)Bhf(T)
Γ(mm/s)
Area(%)
Attribution
S1 0.37(1) -0.16(4) 51.6(3) 0.34(1) 52(3) Fe3+ (hematite)
S2 0.29(2) -0.01(5) 49.4(5) 0.49(4) 30(3) Fe3+ tet. (magnetite)
S3 0.67(2) -0.04(5) 46.1(5) 0.45(4) 15(3) Fe2+/3+ oct. (magnetite)
S4 0.37(2) -0.24(6) 38.1(5) 0.68(4) < 3 Fe3+ (goethite)
DQ1 0.23(3) 0.4(1) - 0.50(4) < 3 Fe3+ tet. (silicate)
-12 -8 -4 0 +4 +8 +12
0.97
0.98
0.99
1.00
Vitesse (mm/s)
ab
so
rptio
n r
ela
tive
obs.
Fe3+ goethite
Fe3+ silicate
Fe2+/3+ magnétite
Fe3+ magnétite
Fe3+ hématite
calc.
4 d
(mm/s)D ou 2e
(mm/s)Bhf(T)
Γ(mm/s)
Area(%)
Attribution
S1 0.37(1) -0.17(3) 51.5(2) 0.32(1) 13(3) Fe3+ (hematite)
S2 0.29(2) -0.01(4) 49.3(3) 0.37(2) 18(3) Fe3+ tet. (magnétite)
S3 0.66(2) -0.01(3) 45.9(3) 0.37(2) 19(3) Fe2+/3+ oct. (magnetite)
S4 0.34(2) -0.27(6) 27* 0.30(-) 43(3) Fe3+ (goethite)
DQ1 0.28(3) 0.7(1) - 0.88(5) 7(3) Fe3+ tet. (silicate)
B3C B3B
Re
lative
absorp
tion
Velocity (mm/s)
Rela
tive a
bso
rption
Velocity (mm/s)
Figure A1. Mössbauer spectra and data for BIF1, BIF2 and BIF3 samples.

Minerals 2022, 12, 163 24 of 28
Minerals 2022, 12, x FOR PEER REVIEW 24 of 29
Figure A1. Mössbauer spectra and data for BIF1, BIF2 and BIF3 samples.
-12 -8 -4 0 +4 +8 +12
0.93
0.94
0.95
0.96
0.97
0.98
0.99
1.00
Vitesse (mm/s)
ab
so
rptio
n r
ela
tive
obs.
Fe3+ goethite
Fe3+ hématite
Fe3+ magnétite
Fe2+/3+ magnétite
Fe3+ silicate
calc.
11 d
(mm/s)D ou 2e
(mm/s)Bhf(T)
Γ(mm/s)
Area(%)
Attribution
S1 0.37(1) -0.20(1) 51.8(2) 0.32(2) 18(3) Fe3+ (hématite)
S2 0.26(2) 0.05(4) 49.3(4) 0.48(2) < 3 Fe3+ tét. (magnétite)
S3 0.67(2) 0.04(3) 46.2(4) 0.50(2) < 3 Fe2+/3+ oct. (magnétite)
S4 0.37(1) -0.27(1) 36* 0.30(-) 78(3) Fe3+ (goethite)
DQ1 0.21(3) 0.64(4) - 0.54(4) < 3 Fe3+ tét. (silicate)
-12 -8 -4 0 +4 +8 +12
0.96
0.97
0.98
0.99
1.00
Vitesse (mm/s)
ab
so
rptio
n r
ela
tive
obs.
Fe3+ goethite
Fe3+ hématite
Fe2+/3+ magnétite
Fe3+ magnétite
Fe3+ silicate
calc.
9 d
(mm/s)D ou 2e
(mm/s)Bhf(T)
Γ(mm/s)
Area(%)
Attribution
S1 0.37(1) -0.20(1) 51.7(2) 0.29(1) 35(3) Fe3+ (hématite)
S2 0.26(2) 0.05(4) 49.3(4) 0.48(2) 4(3) Fe3+ tét. (magnétite)
S3 0.67(2) 0.04(3) 46.2(4) 0.50(2) 3(3) Fe2+/3+ oct. (magnétite)
S4 0.37(2) -0.27(3) 36* 0.30(-) 56(3) Fe3+ (goethite)
DQ1 0.21(3) 0.64(4) - 0.54(4) < 3 Fe3+ tét. (silicate)
B2B B2A
Re
lative
absorp
tion
Velocity (mm/s)
Rela
tive a
bso
rption
Velocity (mm/s)
-12 -8 -4 0 +4 +8 +12
0.94
0.95
0.96
0.97
0.98
0.99
1.00
Vitesse (mm/s)
ab
so
rptio
n r
ela
tive
obs.
Fe3+ hématite
Fe3+ magnétite
Fe2+/3+ magnétite
Fe3+ goethite
Fe3+ silicate
calc.
1 d
(mm/s)D ou 2e
(mm/s)Bhf(T)
Γ(mm/s)
Area(%)
Attribution
S1 0.37(1) -0.16(4) 51.6(3) 0.34(1) 52(3) Fe3+ (hematite)
S2 0.29(2) -0.01(5) 49.4(5) 0.49(4) 30(3) Fe3+ tet. (magnetite)
S3 0.67(2) -0.04(5) 46.1(5) 0.45(4) 15(3) Fe2+/3+ oct. (magnetite)
S4 0.37(2) -0.24(6) 38.1(5) 0.68(4) < 3 Fe3+ (goethite)
DQ1 0.23(3) 0.4(1) - 0.50(4) < 3 Fe3+ tet. (silicate)
-12 -8 -4 0 +4 +8 +12
0.97
0.98
0.99
1.00
Vitesse (mm/s)
ab
so
rptio
n r
ela
tive
obs.
Fe3+ goethite
Fe3+ silicate
Fe2+/3+ magnétite
Fe3+ magnétite
Fe3+ hématite
calc.
4 d
(mm/s)D ou 2e
(mm/s)Bhf(T)
Γ(mm/s)
Area(%)
Attribution
S1 0.37(1) -0.17(3) 51.5(2) 0.32(1) 13(3) Fe3+ (hematite)
S2 0.29(2) -0.01(4) 49.3(3) 0.37(2) 18(3) Fe3+ tet. (magnétite)
S3 0.66(2) -0.01(3) 45.9(3) 0.37(2) 19(3) Fe2+/3+ oct. (magnetite)
S4 0.34(2) -0.27(6) 27* 0.30(-) 43(3) Fe3+ (goethite)
DQ1 0.28(3) 0.7(1) - 0.88(5) 7(3) Fe3+ tet. (silicate)
B3C B3B
Re
lative
absorp
tion
Velocity (mm/s)
Rela
tive a
bso
rption
Velocity (mm/s)
Minerals 2022, 12, x FOR PEER REVIEW 25 of 29
Figure A2. Mössbauer spectra and data for BIF1, BIF2 and BIF3 samples.
-12 -8 -4 0 +4 +8 +12
0.98
0.99
1.00
Vitesse (mm/s)
ab
so
rptio
n r
ela
tive
obs.
Fe3+ goethite
Fe3+ silicate
Fe2+/3+ magnétite
Fe3+ magnétite
Fe3+ hématite
calc.
6 d
(mm/s)D ou 2e
(mm/s)Bhf(T)
Γ(mm/s)
Area(%)
Attribution
S1 0.37(1) -0.19(3) 51.6(2) 0.35(1) 18(3) Fe3+ (hematite)
S2 0.27(2) 0.02(3) 49.5(3) 0.36(2) 14(3) Fe3+ tet. (magnetite)
S3 0.67(2) -0.04(3) 46.3(3) 0.37(2) 13(3) Fe2+/3+ oct. (magnetite)
S4 0.36(2) -0.28(4) 32* 0.30(-) 50(3) Fe3+ (goethite)
DQ1 0.25(3) 0.78(5) - 0.75(5) 5(3) Fe3+ tet. (silicate)
B3A
Re
lative
absorp
tion
Velocity (mm/s)
Figure A2. Mössbauer spectra and data for BIF1, BIF2 and BIF3 samples.

Minerals 2022, 12, 163 25 of 28
Appendix C
Minerals 2022, 12, x FOR PEER REVIEW 26 of 29
Appendix C
Figure A3. Detailed calculations for first-order estimates of H2 generation potential of fresh BIF1 sample.
References
1. Prinzhofer, A.; Deville, É. Hydrogène Naturel: La Prochaine Révolution Energétique ?; Belin: Paris, France, 2015; ISBN 978-2-7011-
8384-8.
2. Truche, L.; McCollom, T.M.; Martinez, I. Hydrogen and Abiotic Hydrocarbons: Molecules That Change the World. Elements
2020, 16, 13–18. https://doi.org/10.2138/gselements.16.1.13.
3. Krasnov, S.G.; Cherkashev, G.A.; Stepanova, T.V.; Batuyev, B.N.; Krotov, A.G.; Malin, B.V.; Maslov, M.N.; Markov, V.F.; Po-
roshina, I.M.; Samovarov, M.S.; et al. Detailed Geological Studies of Hydrothermal Fields in the North Atlantic. Geol. Soc. Lond.
Spec. Publ. 1995, 87, 43–64. https://doi.org/10.1144/GSL.SP.1995.087.01.05.
4. Charlou, J.L.; Donval, J.P.; Fouquet, Y.; Jean-Baptiste, P.; Holm, N. Geochemistry of High H2 and CH4 Vent Fluids Issuing from
Ultramafic Rocks at the Rainbow Hydrothermal Field (36j14VN, MAR). Chem. Geol. 2002, 191, 345–359.
Figure A3. Detailed calculations for first-order estimates of H2 generation potential of freshBIF1 sample.
References
1. Prinzhofer, A.; Deville, É. Hydrogène Naturel: La Prochaine Révolution Energétique? Belin: Paris, France, 2015; ISBN 978-2-7011-8384-8.2. Truche, L.; McCollom, T.M.; Martinez, I. Hydrogen and Abiotic Hydrocarbons: Molecules That Change the World. Elements 2020,
16, 13–18. [CrossRef]3. Krasnov, S.G.; Cherkashev, G.A.; Stepanova, T.V.; Batuyev, B.N.; Krotov, A.G.; Malin, B.V.; Maslov, M.N.; Markov, V.F.; Poroshina,
I.M.; Samovarov, M.S.; et al. Detailed Geological Studies of Hydrothermal Fields in the North Atlantic. Geol. Soc. Lond. Spec. Publ.1995, 87, 43–64. [CrossRef]
4. Charlou, J.L.; Donval, J.P.; Fouquet, Y.; Jean-Baptiste, P.; Holm, N. Geochemistry of High H2 and CH4 Vent Fluids Issuing fromUltramafic Rocks at the Rainbow Hydrothermal Field (36j14VN, MAR). Chem. Geol. 2002, 191, 345–359. [CrossRef]

Minerals 2022, 12, 163 26 of 28
5. Welhan, J.A.; Craig, H. Methane and Hydrogen in East Pacific Rise Hydrothermal Fluids. Geophys. Res. Lett. 1979, 6, 829–831.[CrossRef]
6. Guélard, J.; Beaumont, V.; Rouchon, V.; Guyot, F.; Pillot, D.; Jézéquel, D.; Ader, M.; Newell, K.D.; Deville, E. Natural H2 in Kansas:Deep or Shallow Origin? Geochem. Geophys. Geosyst. 2017, 18, 1841–1865. [CrossRef]
7. Prinzhofer, A.; Cissé, C.S.T.; Diallo, A.B. Discovery of a Large Accumulation of Natural Hydrogen in Bourakebougou (Mali). Int.J. Hydrog. Energy 2018, 43, 19315–19326. [CrossRef]
8. Etiope, G.; Schoell, M.; Hosgörmez, H. Abiotic Methane Flux from the Chimaera Seep and Tekirova Ophiolites (Turkey):Understanding Gas Exhalation from Low Temperature Serpentinization and Implications for Mars. Earth Planet. Sci. Lett. 2011,310, 96–104. [CrossRef]
9. Prinzhofer, A.; Moretti, I.; Françolin, J.; Pacheco, C.; D’Agostino, A.; Werly, J.; Rupin, F. Natural Hydrogen Continuous Emissionfrom Sedimentary Basins: The Example of a Brazilian H2-Emitting Structure. Int. J. Hydrog. Energy 2019, 44, 5676–5685. [CrossRef]
10. Zgonnik, V.; Beaumont, V.; Deville, E.; Larin, N.; Pillot, D.; Farrell, K.M. Evidence for Natural Molecular Hydrogen SeepageAssociated with Carolina Bays (Surficial, Ovoid Depressions on the Atlantic Coastal Plain, Province of the USA). Prog. EarthPlanet. Sci. 2015, 2, 31. [CrossRef]
11. Lollar, B.S.; Onstott, T.C.; Lacrampe-Couloume, G.; Ballentine, C.J. The Contribution of the Precambrian Continental Lithosphereto Global H2 Production. Nature 2014, 516, 379–382. [CrossRef]
12. Moretti, I.; Brouilly, E.; Loiseau, K.; Prinzhofer, A.; Deville, E. Hydrogen Emanations in Intracratonic Areas: New Guide Lines forEarly Exploration Basin Screening. Geosciences 2021, 11, 145. [CrossRef]
13. Moretti, I.; Prinzhofer, A.; Françolin, J.; Pacheco, C.; Rosanne, M.; Rupin, F.; Mertens, J. Long-Term Monitoring of NaturalHydrogen Superficial Emissions in a Brazilian Cratonic Environment. Sporadic Large Pulses versus Daily Periodic Emissions. Int.J. Hydrog. Energy 2021, 46, 3615–3628. [CrossRef]
14. Zgonnik, V. The Occurrence and Geoscience of Natural Hydrogen: A Comprehensive Review. Earth Sci. Rev. 2020, 203, 103140.[CrossRef]
15. Klein, C.; Beukes, N.J. Sedimentology and Geochemistry of the Glaciogenic Late Proterozoic Rapitan Iron-Formation in Canada.Econ. Geol. 1993, 88, 542–565. [CrossRef]
16. Ramanaidou, E.R.; Wells, M.A. Sedimentary Hosted Iron Ores. In Treatise on Geochemistry; Elsevier: Amsterdam, The Netherlands,2014; pp. 313–355. ISBN 978-0-08-098300-4.
17. Ilyin, A.V. Neoproterozoic Banded Iron Formations. Lithol. Miner. Resour. 2009, 44, 78–86. [CrossRef]18. Bekker, A.; Slack, J.F.; Planavsky, N.; Krapez, B.; Hofmann, A.; Konhauser, K.O.; Rouxel, O.J. Iron Formation: The Sedimentary
Product of a Complex Interplay among Mantle, Tectonic, Oceanic, and Biospheric Processes. Econ. Geol. 2010, 105, 467–508.[CrossRef]
19. Cox, G.M.; Halverson, G.P.; Minarik, W.G.; Le Heron, D.P.; Macdonald, F.A.; Bellefroid, E.J.; Strauss, J.V. Neoproterozoic IronFormation: An Evaluation of Its Temporal, Environmental and Tectonic Significance. Chem. Geol. 2013, 362, 232–249. [CrossRef]
20. Zhu, X.-Q.; Tang, H.-S.; Sun, X.-H. Genesis of Banded Iron Formations: A Series of Experimental Simulations. Ore Geol. Rev. 2014,63, 465–469. [CrossRef]
21. Angerer, T.; Duuring, P.; Hagemann, S.G.; Thorne, W.; McCuaig, T.C. A Mineral System Approach to Iron Ore in Archaean andPalaeoproterozoic BIF of Western Australia. Geol. Soc. Lond. Spec. Publ. 2015, 393, 81–115. [CrossRef]
22. Klein, C. Some Precambrian Banded Iron-Formations (BIFs) from around the World: Their Age, Geologic Setting, Mineralogy,Metamorphism, Geochemistry, and Origins. Am. Mineral. 2005, 90, 1473–1499. [CrossRef]
23. Myagkiy, A.; Brunet, F.; Popov, C.; Krüger, R.; Guimarães, H.; Sousa, R.S.; Charlet, L.; Moretti, I. H2 Dynamics in the Soil ofa H2-Emitting Zone (São Francisco Basin, Brazil): Microbial Uptake Quantification and Reactive Transport Modelling. Appl.Geochem. 2020, 112, 104474. [CrossRef]
24. Myagkiy, A.; Moretti, I.; Brunet, F. Space and Time Distribution of Subsurface H2 Concentration in so-Called “Fairy Circles”:Insight from a Conceptual 2-D Transport Model. BSGF Earth Sci. Bull. 2020, 191, 13. [CrossRef]
25. Larin, N.; Zgonnik, V.; Rodina, S.; Deville, E.; Prinzhofer, A.; Larin, V.N. Natural Molecular Hydrogen Seepage Associated withSurficial, Rounded Depressions on the European Craton in Russia. Nat. Resour. Res. 2015, 24, 369–383. [CrossRef]
26. Rezaee, R. Natural Hydrogen System in Western Australia? Earth Sci. 2020, 2020100589. [CrossRef]27. Frery, E.; Langhi, L.; Maison, M.; Moretti, I. Natural Hydrogen Seeps Identified in the North Perth Basin, Western Australia. Int. J.
Hydrog. Energy 2021, 46, 31158–31173. [CrossRef]28. Tschinkel, W.R. Experiments Testing the Causes of Namibian Fairy Circles. PLoS ONE 2015, 10, e0140099. [CrossRef]29. Preiss, W.V. The Adelaide Geosyncline of South Australia and Its Significance in Neoproterozoic Continental Reconstruction.
Precambrian Res. 2000, 100, 21–63. [CrossRef]30. Betts, P.; Giles, D. The 1800–1100Ma Tectonic Evolution of Australia. Precambrian Res. 2006, 144, 92–125. [CrossRef]31. Ward, L. Inflammable Gases Occluded in the Pre-Palaeozoic Rocks of South Australia. Trans. Proc. R. Soc. S. Aust. 1933, 57, 42–47.32. Boreham, C.J.; Edwards, D.S.; Czado, K.; Rollet, N.; Wang, L.; van der Wielen, S.; Champion, D.; Blewett, R.; Feitz, A.; Henson,
P.A. Hydrogen in Australian Natural Gas: Occurrences, Sources and Resources. APPEA J. 2021, 61, 163. [CrossRef]33. Boreham, C.J.; Sohn, J.H.; Cox, N.; Williams, J.; Hong, Z.; Kendrick, M.A. Hydrogen and Hydrocarbons Associated with the
Neoarchean Frog’s Leg Gold Camp, Yilgarn Craton, Western Australia. Chem. Geol. 2021, 575, 120098. [CrossRef]

Minerals 2022, 12, 163 27 of 28
34. Compston, W.; Kröner, A. Multiple Zircon Growth within Early Archaean Tonalitic Gneiss from the Ancient Gneiss Complex,Swaziland. Earth Planet. Sci. Lett. 1988, 87, 13–28. [CrossRef]
35. Scoates, J.S.; Friedman, R.M. Precise Age of the Platiniferous Merensky Reef, Bushveld Complex, South Africa, by the U-PbZircon Chemical Abrasion ID-TIMS Technique. Econ. Geol. 2008, 103, 465–471. [CrossRef]
36. Sodoudi, F.; Yuan, X.; Kind, R.; Lebedev, S.; Adam, J.M.-C.; Kästle, E.; Tilmann, F. Seismic Evidence for Stratification inComposition and Anisotropic Fabric within the Thick Lithosphere of Kalahari Craton: Thick and Layered Mantle Lithosphere.Geochem. Geophys. Geosyst. 2013, 14, 5393–5412. [CrossRef]
37. Reis, H.L.S.; Alkmim, F.F.; Fonseca, R.C.S.; Nascimento, T.C.; Suss, J.F.; Prevatti, L.D. The São Francisco Basin. In São FranciscoCraton, Eastern Brazil; Heilbron, M., Cordani, U.G., Alkmim, F.F., Eds.; Regional Geology Reviews; Springer InternationalPublishing: Cham, Switzerland, 2017; pp. 117–143. ISBN 978-3-319-01714-3.
38. Duuring, P.; Hagemann, S.G.; Laukamp, C.; Chiarelli, L. Supergene Modification of Magnetite and Hematite Shear Zones inBanded Iron-Formation at Mt Richardson, Yilgarn Craton, Western Australia. Ore Geol. Rev. 2019, 111, 102995. [CrossRef]
39. Auler, A.S.; Barton, H.A.; Zambelli, B.; Senko, J.; Parker, C.W.; Sasowsky, I.D.; Souza, T.A.R.; Pujoni, D.; Peñaranda, J.; Davis, R.Silica and Iron Mobilization, Cave Development and Landscape Evolution in Iron Formations in Brazil. Geomorphology 2022, 398,108068. [CrossRef]
40. Donzé, F.-V.; Truche, L.; Shekari Namin, P.; Lefeuvre, N.; Bazarkina, E.F. Migration of Natural Hydrogen from Deep-SeatedSources in the São Francisco Basin, Brazil. Geosciences 2020, 10, 346. [CrossRef]
41. Webb, A.D.; Dickens, G.R.; Oliver, N.H.S. From Banded Iron-Formation to Iron Ore: Geochemical and Mineralogical Constraintsfrom across the Hamersley Province, Western Australia. Chem. Geol. 2003, 197, 215–251. [CrossRef]
42. Ewers, W.E.; Morris, R.C. Studies of the Dales Gorge Member of the Brockman Iron Formation, Western Australia. Econ. Geol.1981, 76, 1929–1953. [CrossRef]
43. Sun, S.; Li, Y.-L. Geneses and Evolutions of Iron-Bearing Minerals in Banded Iron Formations of >3760 to ca. 2200 Million-Year-Old:Constraints from Electron Microscopic, X-Ray Diffraction and Mössbauer Spectroscopic Investigations. Precambrian Res. 2017,289, 1–17. [CrossRef]
44. Van Alboom, A.; De Grave, E. Temperature Dependence of the 57Fe Mössbauer Parameters in Riebeckite. Phys. Chem. Miner.1996, 23, 377–386. [CrossRef]
45. Morris, R.C.; Ramanaidou, E.R. Genesis of the Channel Iron Deposits (CID) of the Pilbara Region, Western Australia. Aust. J.Earth Sci. 2007, 54, 733–756. [CrossRef]
46. Morris, R.C.; Kneeshaw, M. Genesis Modelling for the Hamersley BIF-Hosted Iron Ores of Western Australia: A Critical Review.Aust. J. Earth Sci. 2011, 58, 417–451. [CrossRef]
47. McLellan, J.G.; Oliver, N.H.S.; Schaubs, P.M. Fluid Flow in Extensional Environments; Numerical Modelling with an Applicationto Hamersley Iron Ores. J. Struct. Geol. 2004, 26, 1157–1171. [CrossRef]
48. Taylor, D.; Dalstra, H.J.; Harding, A.E.; Broadbent, G.C.; Barley, M.E. Genesis of High-Grade Hematite Orebodies of theHamersleyProvince, Western Australia. Econ. Geol. 2001, 96, 837–873. [CrossRef]
49. Robbins, L.J.; Funk, S.P.; Flynn, S.L.; Warchola, T.J.; Li, Z.; Lalonde, S.V.; Rostron, B.J.; Smith, A.J.B.; Beukes, N.J.; de Kock, M.O.;et al. Hydrogeological Constraints on the Formation of Palaeoproterozoic Banded Iron Formations. Nat. Geosci. 2019, 12, 558–563.[CrossRef]
50. Tardy, Y.; Kobilsek, B.; Paquet, H. Mineralogical Composition and Geographical Distribution of African and Brazilian PeriatlanticLaterites. The Influence of Continental Drift and Tropical Paleoclimates during the Past 150 Million Years and Implications forIndia and Australia. J. Afr. Earth Sci. 1991, 12, 283–295. [CrossRef]
51. Canfield, D.E.; Jørgensen, B.B.; Fossing, H.; Glud, R.; Gundersen, J.; Ramsing, N.B.; Thamdrup, B.; Hansen, J.W.; Nielsen, L.P.; Hall,P.O.J. Pathways of Organic Carbon Oxidation in Three Continental Margin Sediments. Mar. Geol. 1993, 113, 27–40. [CrossRef]
52. Jørgensen, B.B.; Kasten, S. Sulfur Cycling and Methane Oxidation. In Marine Geochemistry; Schulz, H.D., Zabel, M., Eds.; Springer:Berlin/Heidelberg, Germany, 2006; pp. 271–309. ISBN 978-3-540-32143-9.
53. Lahiri, C.; Davidson, G.R. Heterogeneous Oxygenation of Wetland Soils with Increasing Inundation: Redox Potential, WaterDepth, and Preferential Flow Paths. Hydrol. Processes 2020, 34, 1350–1358. [CrossRef]
54. Albers, E.; Bach, W.; Pérez-Gussinyé, M.; McCammon, C.; Frederichs, T. Serpentinization-Driven H2 Production from ContinentalBreak-Up to Mid-Ocean Ridge Spreading: Unexpected High Rates at the West Iberia Margin. Front. Earth Sci. 2021, 9, 673063.[CrossRef]
55. Angerer, T.; Hagemann, S.G.; Danyushevsky, L. High-Grade Iron Ore at Windarling, Yilgarn Craton: A Product of Syn-OrogenicDeformation, Hypogene Hydrothermal Alteration and Supergene Modification in an Archean BIF-Basalt Lithostratigraphy. Min.Depos. 2013, 48, 697–728. [CrossRef]
56. Morris, R.C. Genesis of Iron Ore in Banded Iron Formations by Supergene and Supergene Metamorphic Processes—A ConceptualModel. In Regional Studies and Specific Deposits; Elsevier: Amsterdam, The Netherlands, 1985; pp. 73–235. ISBN 978-0-444-42497-6.
57. Brunet, F. Hydrothermal Production of H2 and Magnetite from Steel Slags: A Geo-Inspired Approach Based on OlivineSerpentinization. Front. Earth Sci. 2019, 7, 17. [CrossRef]
58. Neubeck, A.; Duc, N.T.; Bastviken, D.; Crill, P.; Holm, N.G. Formation of H2 and CH4 by Weathering of Olivine at Temperaturesbetween 30 and 70 ◦C. Geochem. Trans. 2011, 12, 6. [CrossRef] [PubMed]

Minerals 2022, 12, 163 28 of 28
59. Milesi, V.; Guyot, F.; Brunet, F.; Richard, L.; Recham, N.; Benedetti, M.; Dairou, J.; Prinzhofer, A. Formation of CO2, H2 andCondensed Carbon from Siderite Dissolution in the 200–300 ◦C Range and at 50MPa. Geochim. Cosmochim. Acta 2015, 154, 201–211.[CrossRef]
60. Crouzet, C.; Brunet, F.; Recham, N.; Findling, N.; Lanson, M.; Guyot, F.; Ferrasse, J.-H.; Goffé, B. Hydrogen Production byHydrothermal Oxidation of FeO under Acidic Conditions. Int. J. Hydrog. Energy 2017, 42, 795–806. [CrossRef]
61. Klein, F.; Bach, W.; McCollom, T.M. Compositional Controls on Hydrogen Generation during Serpentinization of UltramaficRocks. Lithos 2013, 178, 55–69. [CrossRef]
62. Ramanaidou, E.R.; Danišik, M.; Wells, M.A. Preliminary Dating of Martite Goethite Iron Ore in the Hamersley Province (WesternAustralia). ASEG Ext. Abstr. 2019, 2019, 1–2. [CrossRef]
63. Mayhew, L.E.; Ellison, E.T.; Miller, H.M.; Kelemen, P.B.; Templeton, A.S. Iron Transformations during Low Temperature Alterationof Variably Serpentinized Rocks from the Samail Ophiolite, Oman. Geochim. Cosmochim. Acta 2018, 222, 704–728. [CrossRef]


![keadilan progresif - Jurnal - Univ. Bandar Lampung [UBL]](https://img.dokumen.tips/doc/110x75/63137c52aca2b42b580d31c4/keadilan-progresif-jurnal-univ-bandar-lampung-ubl.jpg)
