Embed Size (px)
Citation preview
Fifth International Conference onSALT WEATHERING OF BUILDINGS AND STONE SCULPTURES
PROCEEDINGS OF SWBSS 2021
22-24 September 2021Delft, the Netherlands
EDITED BYBarbara LubelliAmeya KamatWido Quist
TU Delft OPEN
PR
OC
EE
DIN
GS
OF S
WB
SS
2021FIFT
H IN
TE
RN
AT
ION
AL C
ON
FER
EN
CE O
N S
ALT W
EA
TH
ER
ING
OF B
UILD
ING
S A
ND
STO
NE S
CU
LPT
UR
ES

PROCEEDINGS OF SWBSS 2021
Fifth International Conference on Salt Weathering of Buildings and
Stone Sculptures
Delft University of Technology Delft, the Netherlands
22-24 September 2021
Edited by Barbara Lubelli, Ameya Kamat & Wido Quist
SWBSS 2021 Scientific Committee Hannelore Derluyn, Université de Pau et des Pays de l'Adour, France
Teresa Diaz Gonçalves, Laboratório Nacional de Engenharia Civil, Portugal
Sebastiaan Godts, Royal Institute for Cultural Heritage, Belgium
Davide Gulotta, Getty Conservation Institute, USA
Andrea Hamilton, University Strathclyde Glasgow, United Kingdom
Rob van Hees, Delft University of Technology, the Netherlands
Ioannis Ioannou, University of Cyprus, Cyprus
Steffen Laue, University of Applied Science Potsdam, Germany
Barbara Lubelli, Delft University of Technology, the Netherlands
Inge Rörig-Dalgaard, Technical University of Denmark, Denmark
Heiner Siedel, Technische Universität Dresden, Germany
Michael Steiger, University of Hamburg, Germany
Ákos Török, Budapest University of Technology and Economics, Hungary
Véronique Vergès-Belmin, Laboratoire de Recherche des Monuments Historiques, France
SWBSS2021 Organizing committee Barbara Lubelli, Delft University of Technology
Wido Quist, Delft University of Technology
Ameya Kamat, Delft University of Technology
Max Veeger, Delft University of Technology
Michiel van Hunen, Cultural Heritage Agency of the Netherlands
Sponsor Scientific co-sponsor
Cultural Heritage Agency of the Netherlands
International Union of Laboratories and Experts in Construction
Materials, Systems and Structures
WELCOME NOTE
Dear colleagues,
Welcome to the 2021 edition of the conference “Salt Weathering on Building and Stone Sculptures”!
This is the 5th edition of the conference, after Copenhagen (2008), Cyprus (2011), Brussel (2014) and Potsdam (2017), and it is the first time the conference is held in hybrid form, due to the COVID-19 pandemic. It is a challenge to organize an event in such an uncertain situation and to make it as attractive and interactive as the previous editions. We hope to meet your expectations!
I’m very glad, that despite the situation, the interest for the conference is strong: we have received more than 40 contributions from 18 countries from all over the world. This confirms the relevance of the problem of salt weathering for the built cultural heritage and stone artifacts in a wide range of environments.
Moreover, the broad spectrum of approaches to the subject presented in these pro-ceedings highlights the importance of the interaction between different disciplines as well as between fundamental research and practice of conservation. I wish this conference to contribute to this fruitful exchange, and to generate new research ideas, whilst strengthening and broadening interdisciplinary collaborations.
On behalf of the organizing committee, I’m looking forward to welcoming as many as possible of you in Delft. We hope that, next to participation to the conference, you will find some free time to visit the city. You can stroll along the canals, enter a windmill, visit the Prinsenhof museum and the Blue Delft Factory, admire the architecture and sculptures in the Old and New Church and, if you are looking for a real Dutch experience, you can rent a bicycle and visit the surroundings!
This event would not have been possible without the collaboration of several per-sons. I would like to thank, on behalf of us all, the Scientific Committee for care-fully reviewing the papers and contributing thereby to the high quality of the pub-lished contributions. My personal thank goes to the organizing committee who sig-nificantly contributed to the organization of this event and to the preparation of the proceedings. Last but not least, I’d like to thank the Cultural Heritage Agency of the Netherlands for co-sponsoring the event and RILEM (International Union of Laboratories and Experts in Construction Materials, Systems and Structures) for contributing to the dissemination.
I sincerely hope you will enjoy the SWBSS2021 conference,
Barbara Lubelli
Chair SWBSS2021 conference Delft University of Technology Faculty of Architecture and the Built Environment Department of Architectural Engineering + Technology
Title: Proceedings of SWBSS 2021 – Fifth International Conference on Salt Weathering of Buildings and Stone Sculptures
Editors: Barbara Lubelli Ameya Kamat Wido Quist
Publisher: TU Delft Open TU Delft / Faculty of Architecture and the Built Environment Julianalaan 134, 2628 BL Delft, The Netherlands
Cover design: Ameya Kamat Max Veeger
©2021 TU Delft Open ISBN 978-94-6366-439-4
TABLE OF CONTENTS
ENVIRONMENTAL CONDITIONS AND SALT DECAY Salt weathering hazards revisited ..................................................................... 11
Heather A. Viles and Andrew S. Goudie
Salt problems and climate control in the case of the church of Sint- Aldegondis in Mespelare, Belgium, an ECOS/RUNSALT approach ............ 13
V. Crevals, S. Godts and J. Desarnaud
Potential salt damage assessment and prevention based on micro samples . 21 I. Rörig-Dalgaard
Implications of using meteorological records to assess the environmental risk of salt crystallization cycles in stone ......................................................... 31
Tim De Kock, Scott A. Orr, Daphne Guilbert, Sebastiaan Godts, Steven Caluwaerts, Veerle Cnudde and Julie Desarnaud
Environmental factors for salt weathering of modern Japanese brick chimney ..................................................................................................... 41
Tomoko Uno, Masaru Abuku, and Chiemi Iba
Investigating the behavior of common salt mixtures in stone materials ....... 49 Sebastiaan Godts, Michael Steiger, Tim De Kock, Julie Desarnaud, Scott A. Orr, Veerle Cnudde and Hilde De Clercq
LABORATORY INVESTIGATIONS AND EXPERIMENTAL TECHNIQUES A new accelerated laboratory test for the assessment of the durability of materials with respect to salt crystallization ............................................... 55
Barbara Lubelli and RILEM TC 271-ASC members
Towards a new salt crystallisation test: comparison of salt contamination procedures .......................................................................................................... 69
Cristiana Nunes, Sebastiaan Godts, Asel M. Aguilar Sanchez, Zuzana Slížková and Barbara Lubelli
Comparative estimation of the pore filling of single salts in natural stone ... 79 Davide Gulotta, Sebastiaan Godts, Tim De Kock and Michael Steiger
5
Experimental determination of salt content in artificial weathered samples of sedimentary stones .......................................................................... 89
Adele Salvi and Beatriz Menendez
Barium nitrate as a result of the barium method and potential damage aspects ................................................................................................... 99
Amelie Stahlbuhk and Michael Steiger
Effect of alkali ferrocyanides on crystallisation of sodium chloride: preliminary results ........................................................................................... 109
Ameya Kamat, Barbara Lubelli and Erik Schlangen
Interaction between sodium chloride and ammonium phosphate on Carrara marble: two laboratory approaches ................................................ 119
Greta Ugolotti, Giulia Masi and Enrico Sassoni
Comparison between damage development on composite and standardized mortar specimens exposed to soluble salts .............................. 129
Marina M. Aškrabić, Dimitrije M. Zakić, Aleksandar R. Savić, Ljiljana R. Miličić, Ivana M. Delić-Nikolić and Zorica Lj. Ilić
Micro-photogrammetry to monitor salt impact on petroglyphs .................. 141 Andrew J. Thorn and Ben T. Collie
Assessment of salt distribution in maastricht and migné limestones with the use of micro-destructive techniques ................................................. 153
Loucas Kyriakou, Asel M. Aguilar Sanchez, Cristiana Nunes and Ioannis Ioannou
Measurement of sodium chloride solution permeability and sorptivity in tuff stone ...................................................................................... 163
Nobumitsu Takatori, Kotaro Sakai, Daisuke Ogura, Soichiro Wakiya and Masaru Abuku
Evaluation of change in pore network structure caused by halite crystallisation .................................................................................................... 173
Etsuko Mizutani, Daisuke Ogura, Masaru Abuku and Hannelore Derluyn
Salt crystallization decay in historic stone masonry: from experimental to onsite assessment ......................................................... 183
Emily R. McSkimming, Graça Vasconcelos and Amelia Dionísio
PMSolver: development of a generic fem code for heat, moisture, and salt transfer and deformation in porous materials ................................ 187
Masaru Abuku and Koichi Ishii
6
Numerical simulation of sodium chloride crystallization in mosaic wall .... 191 Sayaka Yano, Masaru Abuku, Juni Sasaki, and Daisuke Ogura
Crystallization damage at the interfaces of artworks ................................... 195 Rozeline Wijnhorst, Tinhinane Chekai, Stefano de Miranda, Leo Pel, Hannelore Derluyn and Noushine Shahidzadeh
Consideration on the influence of deterioration on deformation velocity in mortar and cement paste specimens subjected to ....................... 199 external aggressive attacks
Cristina Tedeschi and Elsa Garavaglia
MITIGATION AND DESALINATION TREATMENTS Fourteen century limestone deterioration: desalination and restoration criteria .............................................................. 205
Helena Ugrina, Vinka Marinković, and Domagoj Mudronja
Hydrogels as poultice material for desalination – a preliminary study ...... 215 Julie Bartholdy, Poul Klenz Larsen and Isabelle Brajer
Two-step treatments for the consolidation of carbonate stone artworks .... 225 Romane Le Dizès, Déa Jaïs and Noushine Shahidzadeh
Development of hydroxyapatite-chitosan-based treatments for the mitigation of salt damage in Globigerina limestone ...................................... 233
Elisa Franzoni, Enrico Sassoni, and Clelia Marrone
Electro-osmosis and capillary suction ............................................................ 241 Nasser Eslami, Jorge Feijoo, Juan M. Paz-Garcia, Elisa Franzoni and Lisbeth M. Ottosen
Electromigration of K+ and NO3- natural stone and brick under application of a constant voltage .................................................................... 251
Lisbeth M. Ottosen
A green salt mitigation technique for archaeological bricks ........................ 263 Duygu Ergenç, Çağla Meral Akgül and Özlem Cizer
Fundamental study on desalination methods for brick chimneys part 1 desalination by ion diffusion ........................................................................... 273
Aika Kimura, Masaru Abuku, Takayuki Fumoto, Tomoko Uno and Chiemi Iba
7
HANDS ON CONSERVATION
Internal retrofitting with hemp-lime on brick masonry – A study to prevent damage caused by sodium sulphate .................................................. 277
Kristin Balksten and Paulien Strandberg-de Bruijn
Desalination, a heritage architect’s perspective ............................................ 287 Ramon Pater
The conservation of Dutch architectural glazed ceramic tiles containing soluble salts: approaches in practice and dilemmas faced by the conservator ................................................................................................. 297
Michiel W. Overhoff
CASE STUDIES 20 years long-term monitoring of the salt loaded crypt of St. Maria im Kapitol, Cologne ............................................................................................... 307
Steffen Laue, Christoph Schaab, Dagmar Drese, Dietmar Krauthäuser, Georg Helfmeier and Josef Vogt
Durability of traditional renders on a garden wall at Marienlyst Park, Elsinore ............................................................................................................. 317
Poul Klenz Larsen
Analysis of spalling in tuffeau: case study of the castles of Chambord and Chaumont-sur-Loire in France ....................................................................... 327
Sarah Janvier-Badosa, Kévin Beck, Malek Balawi, Marie Ternoy, Romain Janvier and Xavier Brunetaud
Matter loss quantification and chemical analysis for the diagnosis of powdering: the case study of the chapel of Maurepas, Chambord, France 337
Malek Balawi, Kévin Beck, Romain Janvier, Sarah Janvier-Badosa and Xavier Brunetaud
How to live with soluble salts: the conservation of the 9th and 12th c. wall paintings at Riva san Vitale (CH) ................................................................... 345
Marta Caroselli, Paola Iazurlo, Greta Acquistapace, Medea Uccelli, Miriam Guglielmetti, Alessandra Pidò and Francesca Piqué
Study and evaluation of salt efflorescence in Maya murals of Calakmul north acropolis, México ................................................................. 355
Alejandra Alonso-Olvera, Esmeralda Martínez-Piñeiro and Gabriela Mora-Navarro
Effects of sea-salt aerosol on the coastal towers of Northern Puglia ........... 359 Cristina Tedeschi, Francesco Di Benedetto, Giordano Montegrossi and Michele Coppola
8
Environmental conditions and salt decay

10
5th International SWBSS conference – Delft 2021
SALT WEATHERING HAZARDS REVISITED
Heather A. Viles1*, and Andrew S. Goudie2
KEYWORDS Vulnerability, salinization, global heating, policymaking
ABSTRACT In 1997, our book ‘Salt Weathering Hazards’ was published which provided a re-view of the nature, extent and importance of salt weathering around the world. In it, we noted that the salt weathering hazard ‘… is increasing and will continue to do so as human impacts continue to affect both the local environment and the global climate’ [1, p. 17]. Almost 25 years later, it is clear that salt weathering is an in-creasingly important hazard which continues to pose challenges for managing in-frastructure, buildings and historic sites in many parts of the world. Since 1997, there has been rapid growth in the availability of global datasets allowing better understanding and quantification of many of the ways in which humans are en-hancing salt weathering hazards. In this paper, we review the changing dimensions of the salt weathering hazard and discuss the main ways in which human activities are enhancing (and in some cases reducing) the problem.
Salt weathering requires sources of salts, moisture and suitable environmental con-ditions to activate the weathering processes (hazard), as well as vulnerable porous materials for them to work on (vulnerability). Humans are affecting all of these components of the hazard/vulnerability system – through adding salts and moisture to the environment, changing climatic and environmental conditions, building more infrastructure and buildings, and increasing the number and vulnerability of historic sites. However, some human activities are likely to be reducing the salt weathering hazard in some places, and there have also been advances in under-standing leading to some technological solutions to the problem.
In terms of affecting the availability of salt, water and suitable environmental con-ditions for salt weathering, human activities have had major impacts since the 1990s. For example, human impacts are changing both the nature and concentra-
1 School of Geography and the Environment, University of Oxford, Oxford,
UK [email protected] 2 St Cross College, University of Oxford, Oxford, UK
11
5th International SWBSS conference – Delft 2021
tions of salts. Some of the key human impacts are increased saline dust from des-iccating lakes such as the Aral Sea, as well as enhanced atmospheric dust loadings at the global scale. Spatial patterns of salt additions to the environment are also changing, as for example application of road deicing salts in some areas is reducing as a result of global heating, whereas in others it is increasing. Many human activ-ities are also having increasing impacts on the level and salinity of groundwater – sometimes enhancing groundwater levels through, for example, removal of vege-tation in dryland areas, urbanisation and irrigation. In other places, groundwater levels are being lowered through expansion of centre-pivot irrigation, whilst in many coastal areas with high populations, groundwater is becoming increasingly saline as over-pumping of freshwater encourages incursion of saline water follow-ing the Ghyben Herzberg effect. Human-induced global heating is having addi-tional, complex impacts on salt weathering hazards, in particular through increases in the severity and extent of extreme events such as droughts. Global heating can influence many parts of the salt weathering system, and so predicting the net im-pacts at regional or global scales is difficult and further work is required.
In terms of enhancing vulnerability to salt weathering, human activities have also ramped up since the 1990s. Huge infrastructure projects and urban sprawl in, for example, parts of the Middle East, have rapidly increased the amount of potentially vulnerable materials placed within saline environments. Furthermore, increasing numbers of heritage sites are becoming more prone to salt weathering as they be-come older, more deteriorated, and less-well conserved for a wide variety of rea-sons. On the other hand, since the 1990s there has been an increase in the number of potential ways to conserve salt-affected sites, and to protect them against further deterioration. The key challenge now is to quantify and weigh up these different dimensions of the evolving salt weathering hazard at the global scale in order to inform policymakers and practitioners.
REFERENCES [1] A.S. Goudie and H.A. Viles, Salt weathering hazards, Wiley, Chichester, 1997.
12
5th International SWBSS conference – Delft 2021
SALT PROBLEMS AND CLIMATE CONTROL IN THE CASE OF THE CHURCH OF SINT-ALDEGONDIS IN MESPELARE, BELGIUM, AN ECOS/RUNSALT APPROACH
Vincent Crevals1*, Sebastiaan Godts1, and Julie Desarnaud1
KEYWORDS ECOS/RUNSALT, climate control, murals, brick masonry, salt weathering
ABSTRACT In the church of Sint-Aldegonis in Mespelare, Belgium, severe damage was ob-served on the plaster and brick masonry caused by the exposure to salts and mois-ture. Adding to the complexity, the church houses important murals from the 14th to the 18th century that are also affected. To assess the situation and provide advice, both moisture and salt contents were analysed. The actual and hygroscopic mois-ture contents were determined gravimetrically, and the quantification of the ions was carried out by ion chromatography. The results show extreme concentrations of moisture and salts, with salt contents, excluding gypsum, up to 17 wt.%, con-taining, besides sodium carbonate, mainly sodium chloride and sodium sulfate and in lower quantities also potassium chloride and potassium nitrate. The results show extreme concentrations of moisture and salts. The values of the ion mixtures were used to model the behaviour of the salts in changing climatic conditions with ECOS/RUNSALT. Furthermore, the theoretically determined crystallisation be-haviour of several salt solutions was further investigated within a micro-climate chamber at 95 %RH and Raman spectroscopy. At this RH gypsum and gorgeyite formed in the salt solution derived from the plaster. The results led to the conclu-sion that once rising damp is stopped and the RH is maintained below 60 %, the main phase transitions of the salt mixtures could be prevented, thus minimizing future salt damage to the masonry and murals.
1 INTRODUCTION In the conservation and restoration of cultural heritage multiple factors need to be considered. Water, environmental changes, and pollutants are just a few factors that
1 Royal Institute for Royal Institute for Cultural Heritage (KIK-IRPA), Monu-
ments Lab, Belgium, [email protected]
13
5th International SWBSS conference – Delft 2021
can cause damage to historic objects and buildings [1-3]. In the weathering of stone, salts and moisture are often key factors. Their presence can cause damage to build-ings, stone artefacts, archaeological sites and wall paintings and thus present a risk for their structural integrity, appearance, and artistic value. Hence, research regard-ing their occurrence and behaviour is crucial in the conservation and restoration of stone. The sole presence of salts, however, does not pose a threat. Damage caused by salts to stone materials is a consequence of crystallisation/dissolution cycles. For these cycles to occur, liquid water, fluctuations in relative humidity or temper-ature changes are necessary. When salts, from internal or external origin, dissolve in water they decompose into ions that can be transported through porous stone materials via the solution that is displaced by gravity or capillary forces. Changes in the environment, such as, a rise in temperature or a drop in relative humidity, as happens near the drying front, can lead to crystallisation [4-5].
During crystallisation the ions present in the solution will form crystals in the pores of the stone material. Once crystals are completely confined, which is related to, among others, the pore volume/filling, the formed crystals can exert pressure on the pore walls. Even though the exact mechanisms are not fully understood, it is clear that the effects of the pressure exerted by salts can lead to multiple forms of damage [6]. Crystallisation of salts at the stone surface, efflorescence, is often less damaging [7]. When a wall has been decorated by murals, the damage can include humidity stains, powdering, loss of paint or even entire sections of plaster [8-9]. Cases in which salts have caused damage to murals are plentiful, from the prehis-toric rock art in the Albarracin Cultural park in Spain [10] to the frescoes of Mi-chelangelo in the Sistine Chapel [11]. Prevention of crystallisation and phase tran-sitions of salts in stone materials is thus an important part of their conservation.
To choose the most appropriate treatment, adequate preliminary research is re-quired in which the identification of salts and the determination of moisture and salt contents are considered. For this, several techniques can be employed, such as, the determination of the actual and hygroscopic moisture content by gravimetric analysis, the quantification of the ions by ion chromatography, the identification of the efflorescence by X-ray diffraction or Raman spectroscopy and the use of soft-ware, such as, ECOS/RUNSALT, a freeware that provides the user with an output of the crystallization behaviour of a salt mixture on a range of temperature and relative humidity [12-13].
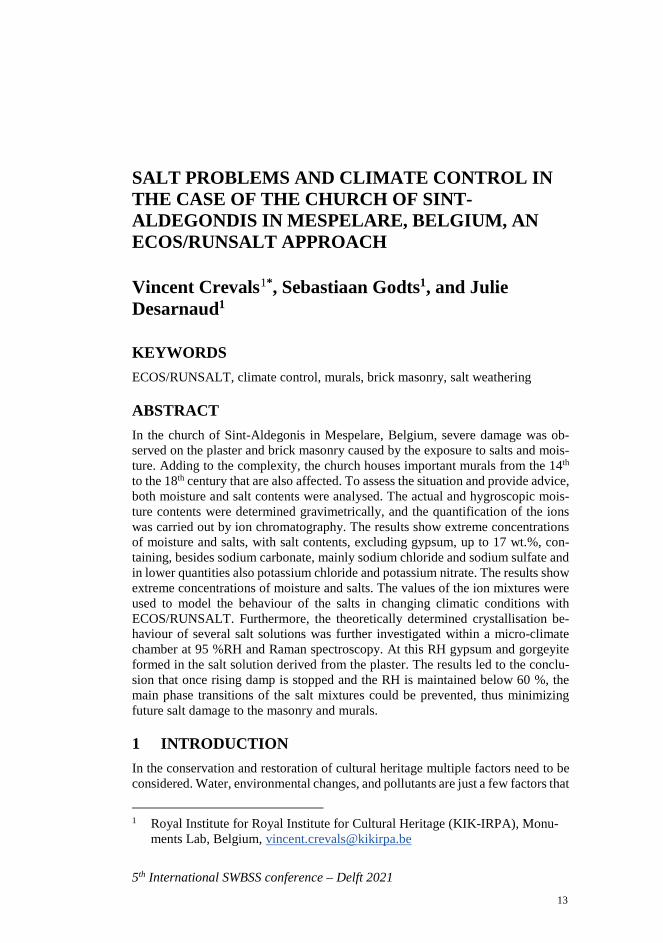
A combination of techniques and tools was used in the investigation of salt con-taminated walls in the church of Sint-Aldegondis in Mespelare (Belgium) that houses several high-quality murals dating from around the 14th up until the 18th century (Figure 1a). Only few examples of such elaborate scenes as found in Mespelare are preserved in Flanders. Their artistic and historic value is a testament of the contribution of wall paintings to the rich artistic tradition that developed in the Burgundian Netherlands. The church showed signs of a moisture source despite recently having undergone a treatment against rising damp and the interior walls showed extensive damage caused by high concentrations of salts. Visually, pow-dering of mortar and brick could be observed as well as efflorescence and the flak-ing of plaster which contains murals (Figure 1b and 1c). It is important that the preservation of the murals is not impeded by the conservation treatments concern-ing the salt and moisture problems [14-15].
14
V. Crevals, S. Godts, and J. Desarnaud
5th International SWBSS conference – Delft 2021
Figure 1: a) Partly uncovered decorative element on the choir wall, ca. 1500. b) Close up of zone II at a height of 95 cm, showing powdering of the bricks. c) Detail of 20th century overpainting near zone IIIb affected by flaking caused by efflo-rescence.
2 METHODOLOGY Three interior areas of the church, heavily affected by salts and moisture, were chosen for sampling (zones I, II and III). In each area powder drill samples were taken at various heights and depths from three building materials, that is, plaster, brick, and mortar. The actual (AMC) and hygroscopic moisture contents (HMC) were determined gravimetrically, after drying at 60 °C and after conditioning at 20 °C at 95 %RH. For the quantification of the ions, Na+, K+, Mg2+, Ca2+, Cl-, NO3
- and SO4
2-, ultrapure water was added to the dried samples and the resulting extract was analysed by ion chromatography (Metrohm). After a correction for the de-tected excess of cations (related to calcium) the amount of carbonates was calcu-lated related to other destructive salts, such as sodium carbonate.
The values of the ion mixtures, excluding equimolar contents of Ca2+ and SO42-,
and excess of cations, were used to model the crystallisation behaviour of the salts at 20 °C between 15 and 98 %RH with the ECOS/RUNSALT model. Despite the exclusion of gypsum and carbonates and a known issue for magnesium sulfates, the model has proven to be a useful tool to assess the crystallisation behaviour of salts [16-17]. To address the model’s restrictions the crystallisation behaviour of three salt solutions was further investigated at 20 ±1 °C and 95 %RH over a time span of 4 h within a micro-climate chamber (GenRH/Mcell) under a 3D-digital microscope (Hirox). Stable salt crystals that formed under these conditions were identified with Raman spectroscopy.
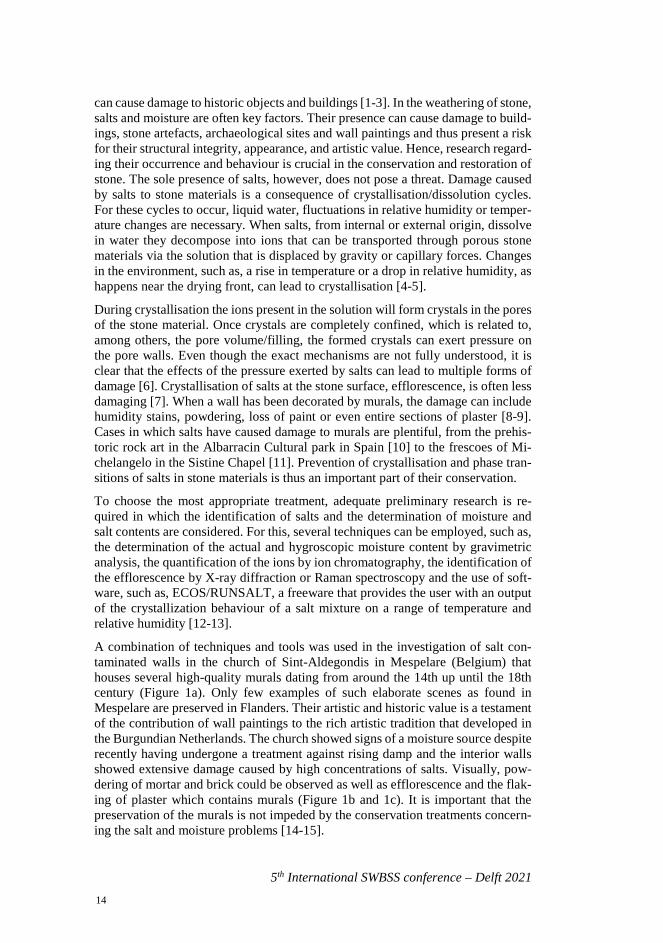
3 RESULTS AND DISCUSSION The results (Figure 2 and 3) show high AMC values in combination with lower HMC values at lower heights in both zones I and II, indicating the presence of a moisture source. Thus, the treatment against rising damp was not effective. Multi-ple reasons can be the cause of this, such as the presence of cavities behind the wall through which the water repellent product can disappear, the use of a non-suitable
a c b
15
5th International SWBSS conference – Delft 2021
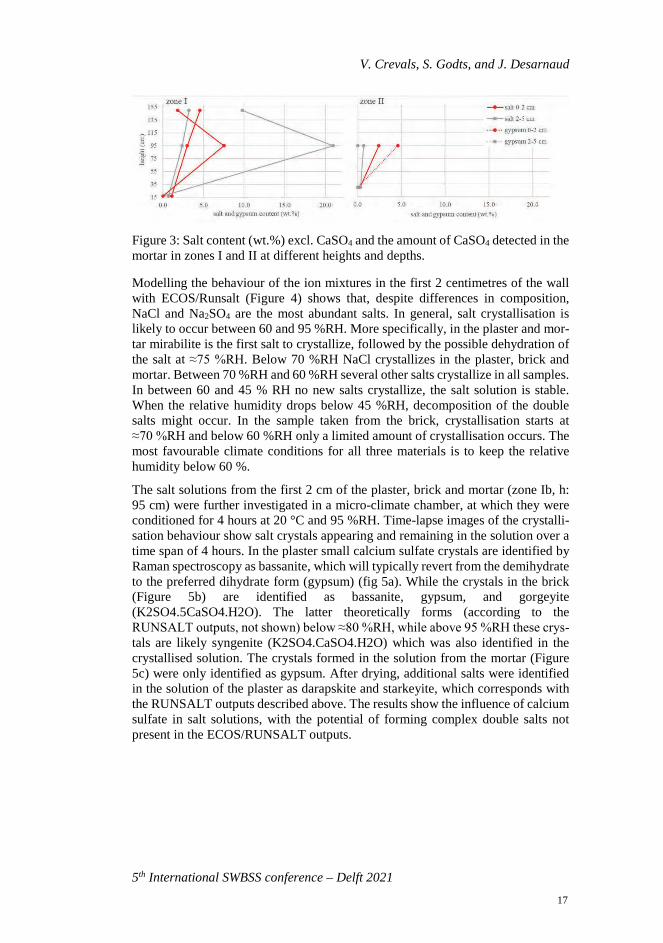
water repellent product or the incorrect application/injection of the product. In zone Ib and Ic and zone IIb the high values for HMC, the high salt content and especially high values of gypsum (CaSO4) (not shown; up to 21 wt.% in the first 2 centimetres of the mortar) indicate the prolonged presence of moisture in the walls. Gypsum has a very low solubility ( ̴ 2 g/L at 25 °C) [18] and even at high moisture contents it will only partially dissolve. The salt content, excluding gypsum, is high for all samples, with the highest values in Ib and Ic.
Both zones show increasing values for HMC and salt content with height and zone I also shows decreasing values for AMC with height and depth. Salt contents in the plaster and the first 2 centimetres of the mortar are higher than the salt contents in the mortar samples in depth (2-5 cm). These results indicate that rising damp is the source of moisture. During periods in which the walls suffer from high moisture contents by rising damp, salts present in the soil, bricks and mortar dissolve and migrate with the water that moves upward due to capillary forces. When this pro-cess is repeated salts will accumulate. The highest salt concentrations are found in the first two centimetres of the mortar at 150 cm above ground level, while gypsum is deposited at lower height (95 cm). The latter can be explained by its lower solu-bility because of which gypsum will crystallize first. The accumulation of salts in the first centimetres of the wall is caused by the drier conditions in the interior of the church.
Figure 2: Actual and hygroscopic moisture content of the mortar samples in zones I and II at different heights and depths.
The values of zone IIIa (17 cm) (not shown) are similar to zone I and II, while zone IIIb (95 cm) has lower values for the total salt content. If no action is taken the salts already present will cause further damages to the brickwork, plaster, and the mu-rals. In many samples the concentration of salts is too high to successfully be re-moved. Additionally, treatments to extract salts are limited because of the presence of the murals. The only way to reduce damage is to stop the water ingress from rising damp and to maintain a favourable climate inside the church, that is, if the salt mixtures remain stable within a feasible range of RH. This can be determined thermodynamically and experimentally.
16
V. Crevals, S. Godts, and J. Desarnaud
5th International SWBSS conference – Delft 2021
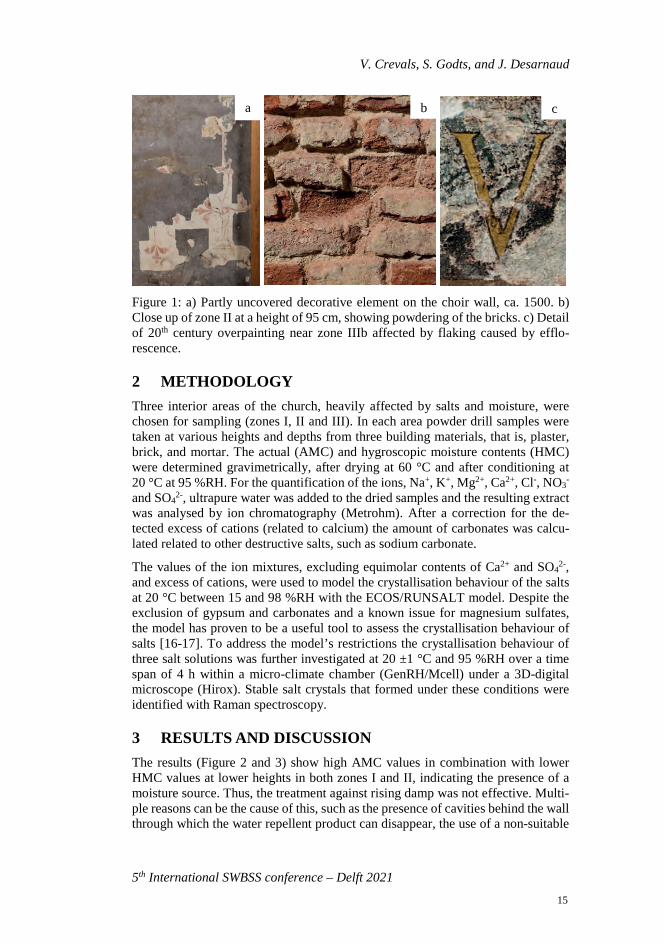
Figure 3: Salt content (wt.%) excl. CaSO4 and the amount of CaSO4 detected in the mortar in zones I and II at different heights and depths.
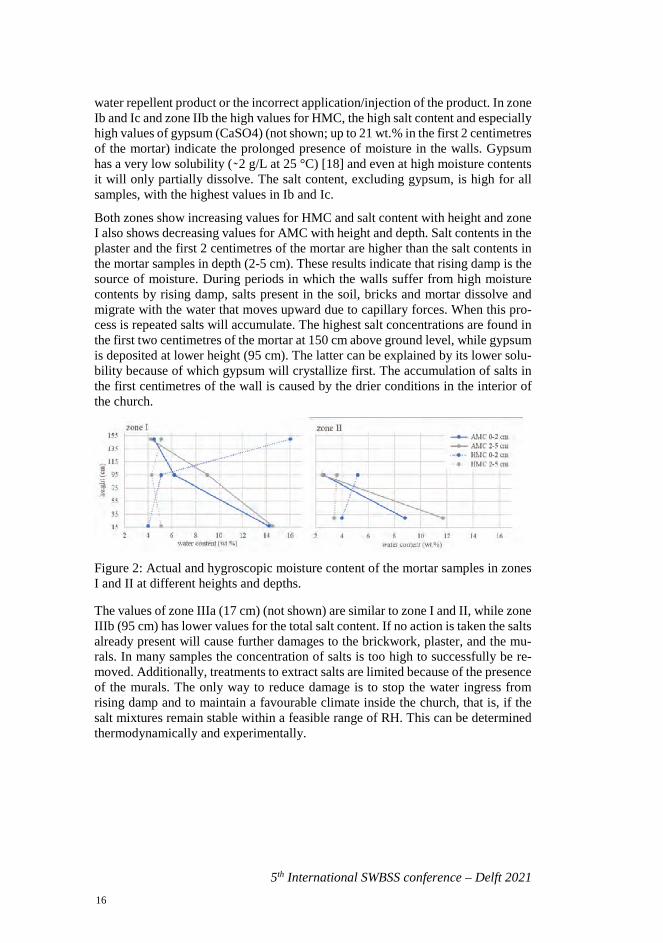
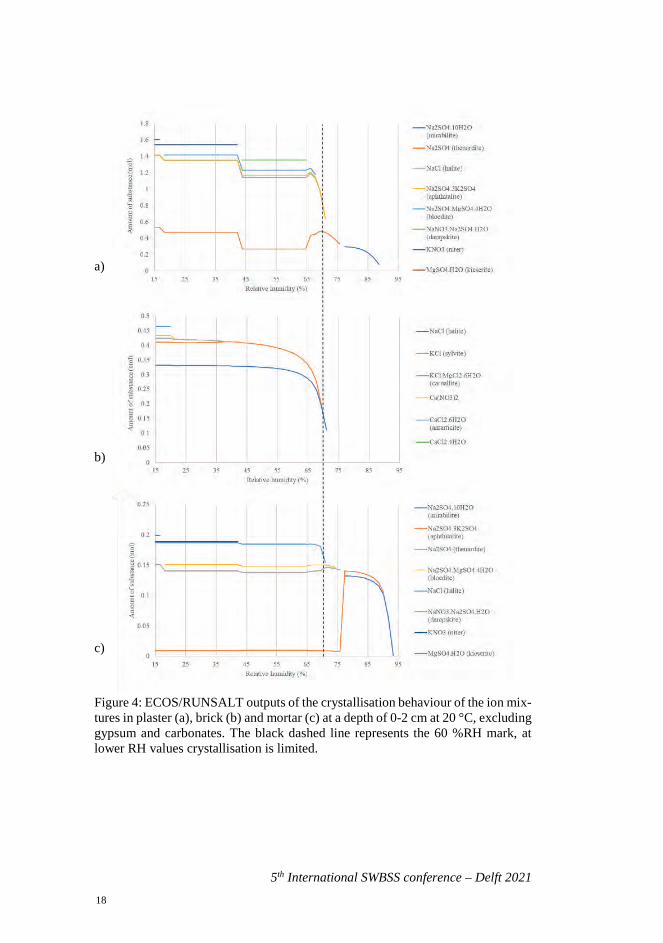
Modelling the behaviour of the ion mixtures in the first 2 centimetres of the wall with ECOS/Runsalt (Figure 4) shows that, despite differences in composition, NaCl and Na2SO4 are the most abundant salts. In general, salt crystallisation is likely to occur between 60 and 95 %RH. More specifically, in the plaster and mor-tar mirabilite is the first salt to crystallize, followed by the possible dehydration of the salt at ≈75 %RH. Below 70 %RH NaCl crystallizes in the plaster, brick and mortar. Between 70 %RH and 60 %RH several other salts crystallize in all samples. In between 60 and 45 % RH no new salts crystallize, the salt solution is stable. When the relative humidity drops below 45 %RH, decomposition of the double salts might occur. In the sample taken from the brick, crystallisation starts at ≈70 %RH and below 60 %RH only a limited amount of crystallisation occurs. The most favourable climate conditions for all three materials is to keep the relative humidity below 60 %.
The salt solutions from the first 2 cm of the plaster, brick and mortar (zone Ib, h: 95 cm) were further investigated in a micro-climate chamber, at which they were conditioned for 4 hours at 20 °C and 95 %RH. Time-lapse images of the crystalli-sation behaviour show salt crystals appearing and remaining in the solution over a time span of 4 hours. In the plaster small calcium sulfate crystals are identified by Raman spectroscopy as bassanite, which will typically revert from the demihydrate to the preferred dihydrate form (gypsum) (fig 5a). While the crystals in the brick (Figure 5b) are identified as bassanite, gypsum, and gorgeyite (K2SO4.5CaSO4.H2O). The latter theoretically forms (according to the RUNSALT outputs, not shown) below ≈80 %RH, while above 95 %RH these crys-tals are likely syngenite (K2SO4.CaSO4.H2O) which was also identified in the crystallised solution. The crystals formed in the solution from the mortar (Figure 5c) were only identified as gypsum. After drying, additional salts were identified in the solution of the plaster as darapskite and starkeyite, which corresponds with the RUNSALT outputs described above. The results show the influence of calcium sulfate in salt solutions, with the potential of forming complex double salts not present in the ECOS/RUNSALT outputs.
17
5th International SWBSS conference – Delft 2021
a)
b)
c)
Figure 4: ECOS/RUNSALT outputs of the crystallisation behaviour of the ion mix-tures in plaster (a), brick (b) and mortar (c) at a depth of 0-2 cm at 20 °C, excluding gypsum and carbonates. The black dashed line represents the 60 %RH mark, at lower RH values crystallisation is limited.
18

V. Crevals, S. Godts, and J. Desarnaud
5th International SWBSS conference – Delft 2021
Figure 5: salt solutions from the drilled samples to a depth of 2 cm from the plaster (a), brick (b) and mortar (c) in zone Ib. Time-lapse image (3D-digital microscopy, HIROX) after 4 hours conditioned at 95 %RH and 20 °C in a micro-climate cham-ber (GenRH/Mcell). Scales in the bottom right of each image (a to c) are 110, 220 and 110 µm, respectively.
4 CONCLUSION A combination of gravimetric analysis and ion chromatography has shown the presence of rising damp in the interior of the church. Stopping the rising damp will not suffice to prevent further damage because of the large amounts of salts in both brick and mortar. Fluctuations in relative humidity will cause cycles of dissolution and crystallisation and will provoke damage to the brickwork and the murals. Con-sequently, the only way to preserve the murals is to minimise variations in relative humidity. Investigations into the presence of salts and the modelling of their be-haviour in a changing climate have shown to be essential in determining the appro-priate conditions to prevent damage to salt laden brickwork and murals. Modelling the crystallisation behaviour of the ion mixtures obtained via ion chromatography revealed a suitable climate below 60 %RH at 20 °C. From the experiments with the salt solutions conditioned at 95 %RH significant changes in the theoretically deter-mined crystallisation behaviour are shown with the formation of gypsum and gor-geyite in the plaster. This research shows a combination of techniques and analyses required to determine a suitable environment to limit crystallisation damage where desalination is not an option. However, it also shows the limits of the current model availed to conservation scientists and indicates that more research is needed to fur-ther the understanding of salt mixtures in general.
REFERENCES [1] G. Pavlogeorgatos, “Environmental parameters in museums,” Building and
Environment, vol. 23, no. 12, pp. 1457-1462, 2003.
[2] D. Reale, C. Noviello, S. Verde, L. Cascini, G. Terracciano, L. Arena, “A multi-disciplinary approach for the damage analysis of cultural heritage: The case study of the St. Gerlando Cathedral in Agrigento,” Remote Sensing of Environment, vol. 235, 2019.
[3] K. Fabbri, A. Bonora, “Two new indices for preventive conservation of the cultural heritage: Predicted risk of damage and heritage microclimate risk,” Journal of Cultural Heritage, vol. 47, no. 12, pp. 208-217, 2021.
[4] F. Caruso, T. Wangler, R. Flatt, “Easy Illustration of Salt Damage in Stone,” Journal of Chemical Education, vol. 95, no. 9, pp. 1615-1620, 2018.
a b c
19
5th International SWBSS conference – Delft 2021
[5] E. Ruiz-Agudo, B. Lubelli, A. Sawdy, “An integrated methodology for saltdamage assessment and remediation: the case of San Jerónimo Monastery(Granada, Spain),” Environmental Earth Sciences, vol. 63, pp. 1475-1486,2011.
[6] ICOMOS-ISCS, Illustrated glossary on stone deterioration patterns, Paris,ICOMOS, 2008.
[7] N. Shahidzadeh-Bonn, J. Desarnaud, F. Bertrand, X. Chateau, D. Bonn,“Damage in porous media due to salt crystallization,” Physical Review E, vol.81, 2010.
[8] A. Arnold, K. Zehnder, “Monitoring wall paintings affected by soluble salts,”In The Conservation of Wall Paintings: Proceedings of a Symposium Orga-nized by the Courtauld Institute of Art and the Getty Conservation Institute,London, July 13–16, 1987, pp. 103–136.
[9] M. Steiger, A.E. Charola, K. Sterflinger, “Weathering and Deterioration,” InStone in Architecture: Properties, durability, S. Siegesmund and R. Snethlage, Eds. Berlin, Heidelberg: Springer Berlin Heidelberg, 2014.
[10] G. Benito, M. Machado, C. Sancho, “Sandstone weathering processes dam-aging prehistoric rock paintings at the Albarracin Cultural Park, NE Spain,”Environmental Geology, vol. 22, pp. 71-79, 1993.
[11] S. Cather, Ed., The conservation of Wall Paintings: Proceedings of a Sympo-sium Organized by the Courtauld Institute of Art and the Getty ConservationInstitute, London, July 13-16, 1987, 1991.
[12] D. Bionda, “RUNSALT – A graphical user interface to the ECOS thermody-namic model for the prediction of the behaviour of salt mixtures under chang-ing climate conditions. http://science.sdf-eu.org/runsalt/,” 2005.
[13] C. A. Price, Ed., An expert chemical model for determining the environmentalconditions needed to prevent salt damage in porous materials. London: Ar-chetype Publications Ltd., 2000.
[14] Agentschap Onroerend Erfgoed, “Parochiekerk Sint-Aldegonde met om-muurd kerkhof,”. Available: https://inventaris.onroerender-fgoed.be/erfgoedobjecten/48603. [Accessed 12 03 2021].
[15] P. Noppe, “Onderzoek Mespelare Sint-Algedondekerk: steekproeven interi-eur” Personal email (September 22, 2020).
[16] S. Godts, R. Hayen, H, De Clercq, “Investigating salt decay of stone materialsrelated to the environment, a case study in the St. James church in Liège, Bel-gium,” Studies in Conservation, vol. 62, no. 6, pp. 329-342, 2016.
[17] B. Menéndez, “Estimation of salt mixture damage on built cultural heritagefrom environmental conditions using ECOS-RUNSALT model,” Journal ofCultural Heritage. vol. 24, pp. 22-30, 2017.
[18] A. Lebedev, V. Kosorukov, “Gypsum solubility in water at 25°C,” Geochem-istry International, vol. 55, pp. 205-210, 2017.
20
5th International SWBSS conference – Delft 2021
POTENTIAL SALT DAMAGE ASSESSMENT AND PREVENTION BASED ON MICRO SAMPLES
I. Rörig-Dalgaard1*
KEYWORDS Micro samples, diagnostic methodology, salt mixtures, case study
ABSTRACT Assessment methods for potential salt damage on cultural heritage sites must fulfill what most often seems to be contradictory criteria: ensure a reliable diagnosis while using non-destructive measuring techniques. This work is a step down the road to overcome this contradiction, by performing a reliable diagnosis for salt damage assessment using micro samples (5-25 mg). Possibilities and limitations of the use of micro samples for assessment and prevention of potential salt damage are exam-ined, by comparing this method with well-known diagnosis methods.
When using smaller samples, more precise measurement methods are needed. The present work documents that the in-build high accuracy balance in the DVS instru-ment enables the precise determination of hygroscopic moisture even when using micro samples. Even the smallest sample size of 5 mg was sufficient to obtain re-liable hygroscopic moisture content results and to identify the presence of salts and determine the deliquescence point. Along with the determination of the deliques-cence point, the influence of the kinetics on the behavior of salt mixtures could be followed.
1 Technical University of Denmark, Brovej – building 118, 2800 Kgs. Lyngby,
21
5th International SWBSS conference – Delft 2021
1 INTRODUCTION A significant part of the problem-solving methodology applied on wall paintings and stones includes representative sampling for analysis [1]. For diagnosis of dam-age in cultural heritage objects, every damage should be avoided and, according to the profession ethics, one is obligated to protect the object, avoiding unnecessary sampling [1-2]. In most cases, this is possible by e.g. determining the ion contents based on extraction poulticeor by collecting small samples from e.g. repair mortars. In rare cases, drill cores are needed for ion content determination and salt content distribution in depth. Only if questions remains open, which can only be answered by measurement of the salt content distribution in depth, drill cores may be ex-tracted [2].
The salt content in wall paintings may vary significantly, not only with location, but also with depth, and over time [3]. This has important implications for site assessment methodology, since analytical results can be strongly affected by fac-tors such as the type of object under investigation, the sample strategy, and the season during which the investigation is carried out [3].
Aiming to minimize sample sizes, high accuracy measurements are needed. One possibility is to use a previously developed salt measuring method [4-6], which thanks to its accuracy makes it possible to use micro samples collected from the surface. Following the approach reported in [2], in most cases a reliable diagnosis would be possible by examining a surface sample.
In the present work, several questions are examined: are micro samples sufficient to obtain a reliable evaluation both in regards to salt content and determination of the RHeq? Or is there a need to determine ion concentrations in depth? Does the seasoning influence the RHeq of the extracted surface samples?
The present work aims to examine possibilities and limitations of the use of micro samples for potential salt damage assessment and prevention, by comparing results from traditional sampling methods (drilling samples in depth) with results obtained with micro samples.
2 MATERIALS AND METHODS
2.1 Materials As recommended in [2], samples from historical sites should be collected by re-storers; only in the case of less important locations, samples may be extracted by scientists. However, scientists are encouraged to participate in the collection of the samples. Samples for the present work were collected by Nordic Conservation, af-ter several onsite discussions with the author.
Since it is preferable for site visits to be undertaken when the concentration of salts (ions) is at its highest near the surface, and thereby most representative of the sce-nario responsible for damage, in general it may be best to schedule investigations during periods of low relative humidity (RH) [3]. In relation to medieval churches, the period with lowest RH is traditionally during the winter period, when the use of heating for religious services further lowers the RH.
22
I. Rörig-Dalgaard
5th International SWBSS conference – Delft 2021
To cover seasonal changes, samples were extracted in: September 2018, December 2018 and February 2019 during the ongoing restoration campaign. Samples were extracted from 8 different locations, but in this paper only samples extracted at location “MGL 2” (“Magleby Church, position 2”) being a rib, are shown.
In September 2018, the main part of the vaults had its covering lime layers re-moved, in order to make the wall paintings visible; at this time a sample was col-lected (CL Sept 2018). However, one area was kept with a covering layer, in order to make subsequent extraction possible during different seasons.
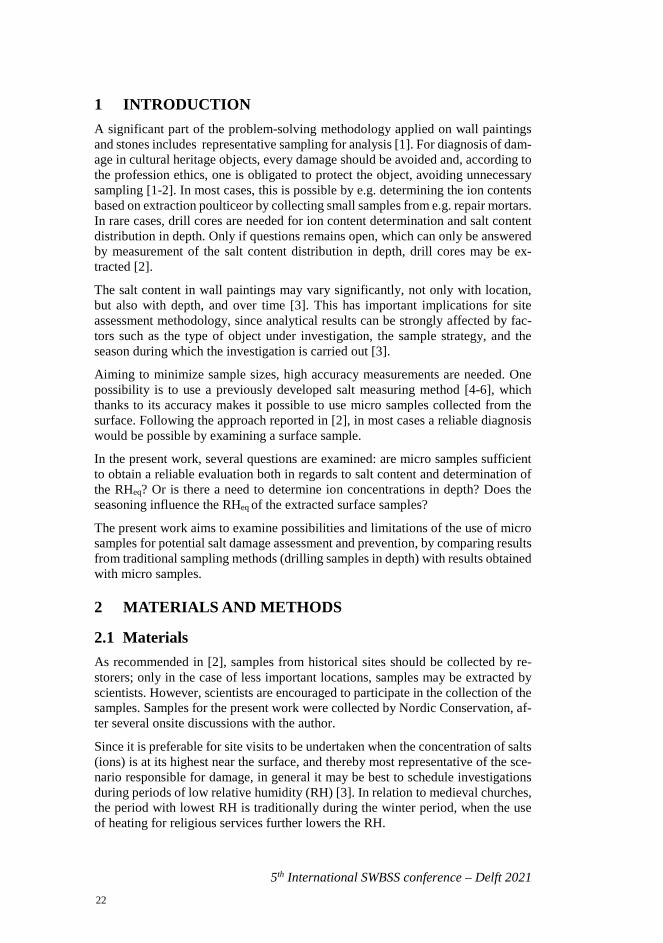
In Dec 2018, a sample of the covering layers was cut out (CL Dec 2018) and pow-der samples (8 mm diameter drill bit ) were taken starting from the painted layer, through the plaster until 10 mm depth (see figure 1 left). Six additional samples were collected at different depths into the brick of the rib (10-20 mm; 20-30 mm etc. until 70 mm depth).
In February 2019 an additional area was uncovered, and samples were collected next to CL Dec 2018. A scrape with an area of 1 cm2 (red circle in the picture) of the wall painting was made from the area uncovered in Dec 2018 and named SWP Feb 2019 (see Figure 1 right)
Figure 1: location of the collection of the samples in Dec, 2018 (left) and Febru-ary 2019 (right).
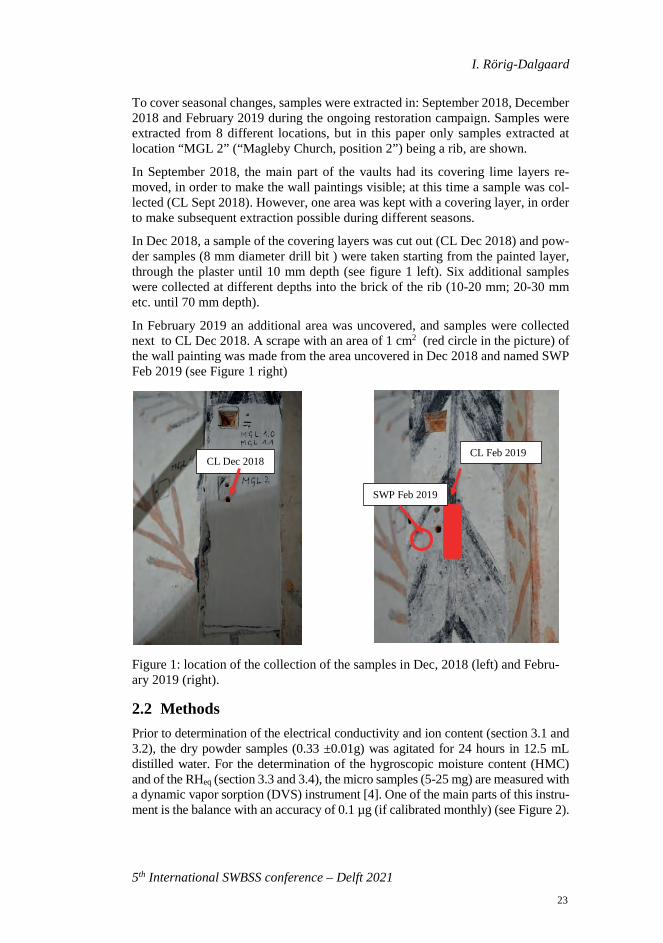
2.2 Methods Prior to determination of the electrical conductivity and ion content (section 3.1 and 3.2), the dry powder samples (0.33 ±0.01g) was agitated for 24 hours in 12.5 mL distilled water. For the determination of the hygroscopic moisture content (HMC) and of the RHeq (section 3.3 and 3.4), the micro samples (5-25 mg) are measured with a dynamic vapor sorption (DVS) instrument [4]. One of the main parts of this instru-ment is the balance with an accuracy of 0.1 µg (if calibrated monthly) (see Figure 2).
CL Dec 2018
CL Feb 2019
SWP Feb 2019
23
5th International SWBSS conference – Delft 2021
Figure 2: The balance within the DVS instrument.
3 RESULTS AND DISCUSSION In this research, several salt detection methods are applied: determination of the electrical conductivity, determination of the hygroscopic moisture content, meas-urement of the ionic content and determination of RHeq.
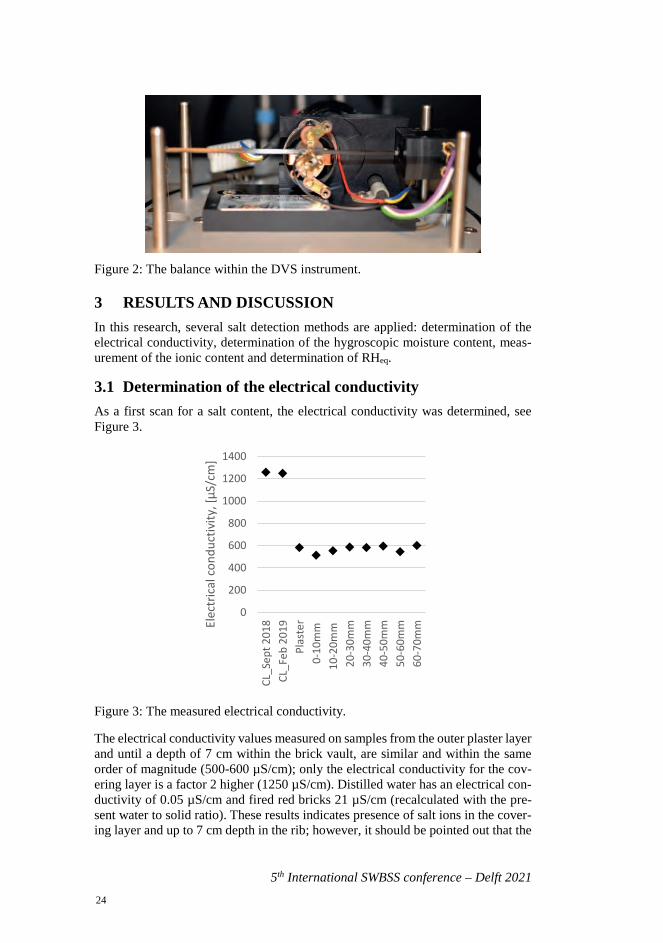
3.1 Determination of the electrical conductivity As a first scan for a salt content, the electrical conductivity was determined, see Figure 3.
Figure 3: The measured electrical conductivity.
The electrical conductivity values measured on samples from the outer plaster layer and until a depth of 7 cm within the brick vault, are similar and within the same order of magnitude (500-600 µS/cm); only the electrical conductivity for the cov-ering layer is a factor 2 higher (1250 µS/cm). Distilled water has an electrical con-ductivity of 0.05 µS/cm and fired red bricks 21 µS/cm (recalculated with the pre-sent water to solid ratio). These results indicates presence of salt ions in the cover-ing layer and up to 7 cm depth in the rib; however, it should be pointed out that the
0
200
400
600
800
1000
1200
1400
CL_S
ept 2
018
CL_F
eb 2
019
Plas
ter
0-10
mm
10-2
0mm
20-3
0mm
30-4
0mm
40-5
0mm
50-6
0mm
60-7
0mmEl
ectr
ical
con
duct
ivity
, [µS
/cm
]
24
I. Rörig-Dalgaard
5th International SWBSS conference – Delft 2021
electrical conductivity may be affected to a minor degree by dissolved components of the material.
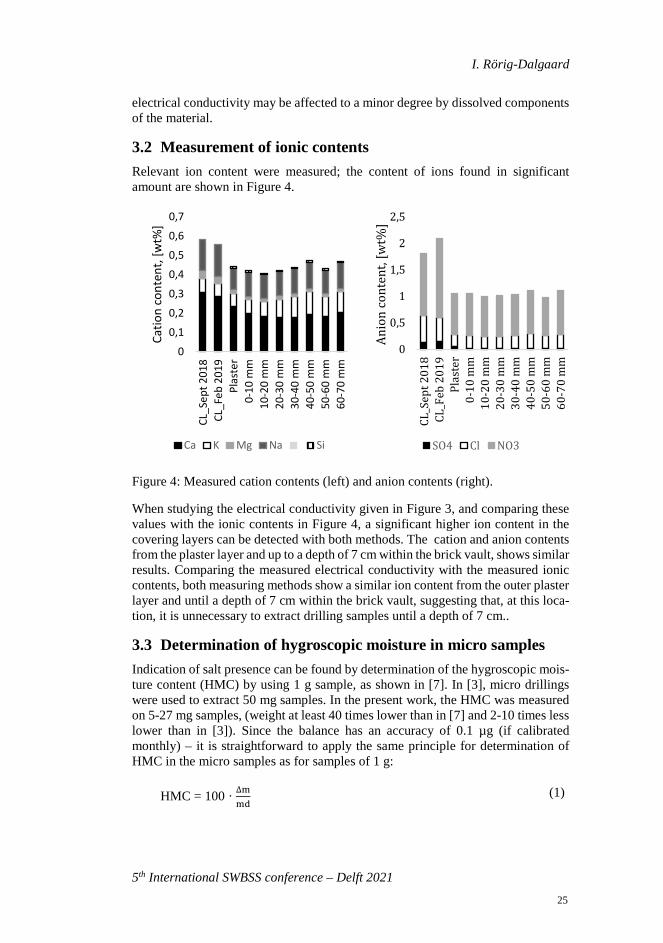
3.2 Measurement of ionic contents Relevant ion content were measured; the content of ions found in significant amount are shown in Figure 4.
Figure 4: Measured cation contents (left) and anion contents (right).
When studying the electrical conductivity given in Figure 3, and comparing these values with the ionic contents in Figure 4, a significant higher ion content in the covering layers can be detected with both methods. The cation and anion contents from the plaster layer and up to a depth of 7 cm within the brick vault, shows similar results. Comparing the measured electrical conductivity with the measured ionic contents, both measuring methods show a similar ion content from the outer plaster layer and until a depth of 7 cm within the brick vault, suggesting that, at this loca-tion, it is unnecessary to extract drilling samples until a depth of 7 cm..
3.3 Determination of hygroscopic moisture in micro samples Indication of salt presence can be found by determination of the hygroscopic mois-ture content (HMC) by using 1 g sample, as shown in [7]. In [3], micro drillings were used to extract 50 mg samples. In the present work, the HMC was measured on 5-27 mg samples, (weight at least 40 times lower than in [7] and 2-10 times less lower than in [3]). Since the balance has an accuracy of 0.1 µg (if calibrated monthly) – it is straightforward to apply the same principle for determination of HMC in the micro samples as for samples of 1 g:
HMC = 100 · ∆mmd
(1)
0
0,1
0,2
0,3
0,4
0,5
0,6
0,7CL
_Sep
t 201
8CL
_Feb
201
9Pl
aste
r0-
10 m
m10
-20
mm
20-3
0 m
m30
-40
mm
40-5
0 m
m50
-60
mm
60-7
0 m
m
Catio
n co
nten
t, [w
t%]
Ca K Mg Na Si
0
0,5
1
1,5
2
2,5
CL_S
ept 2
018
CL_F
eb 2
019
Plas
ter
0-10
mm
10-2
0 m
m20
-30
mm
30-4
0 m
m40
-50
mm
50-6
0 m
m60
-70
mm
Anio
n co
nten
t, [w
t%]
SO4 Cl NO3
25
5th International SWBSS conference – Delft 2021
Where ∆m is the mass gain of the specimen and md is the dry weight of the speci-men.
In the case where only one salt is present, a link can be found between the HMC and the salt content [7]. However, in practice, it is rare to have only a single salt present and therefore this method does only give an indication of the presence of salts. One could also use the HMC measurement as a first step for identifying the presence of salts.
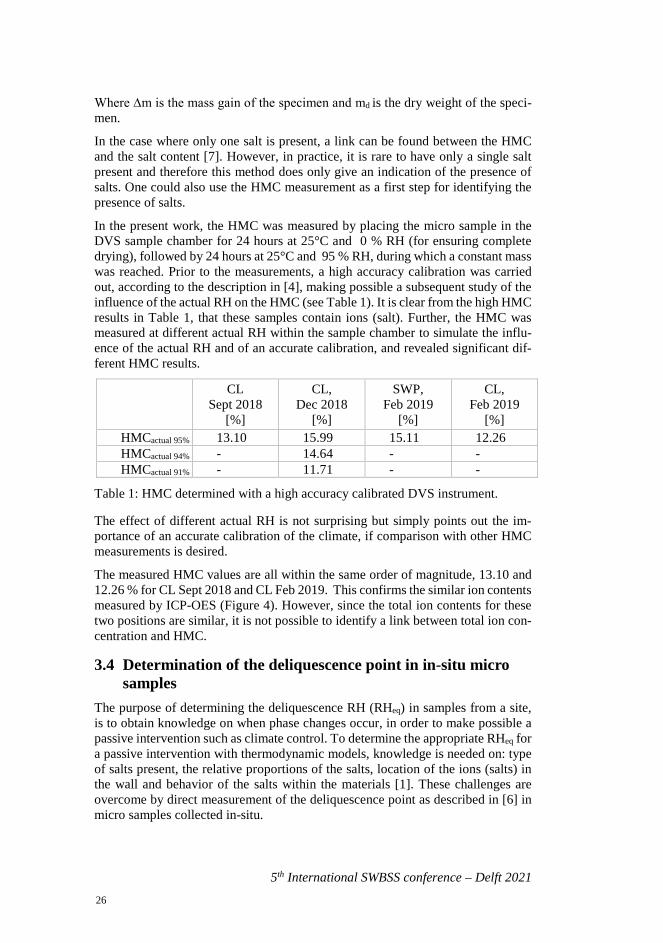
In the present work, the HMC was measured by placing the micro sample in the DVS sample chamber for 24 hours at 25°C and 0 % RH (for ensuring complete drying), followed by 24 hours at 25°C and 95 % RH, during which a constant mass was reached. Prior to the measurements, a high accuracy calibration was carried out, according to the description in [4], making possible a subsequent study of the influence of the actual RH on the HMC (see Table 1). It is clear from the high HMC results in Table 1, that these samples contain ions (salt). Further, the HMC was measured at different actual RH within the sample chamber to simulate the influ-ence of the actual RH and of an accurate calibration, and revealed significant dif-ferent HMC results.
CL Sept 2018
[%]
CL, Dec 2018
[%]
SWP, Feb 2019
[%]
CL, Feb 2019
[%] HMCactual 95% 13.10 15.99 15.11 12.26 HMCactual 94% - 14.64 - - HMCactual 91% - 11.71 - -
Table 1: HMC determined with a high accuracy calibrated DVS instrument.
The effect of different actual RH is not surprising but simply points out the im-portance of an accurate calibration of the climate, if comparison with other HMC measurements is desired.
The measured HMC values are all within the same order of magnitude, 13.10 and 12.26 % for CL Sept 2018 and CL Feb 2019. This confirms the similar ion contents measured by ICP-OES (Figure 4). However, since the total ion contents for these two positions are similar, it is not possible to identify a link between total ion con-centration and HMC.
3.4 Determination of the deliquescence point in in-situ micro samples
The purpose of determining the deliquescence RH (RHeq) in samples from a site, is to obtain knowledge on when phase changes occur, in order to make possible a passive intervention such as climate control. To determine the appropriate RHeq for a passive intervention with thermodynamic models, knowledge is needed on: type of salts present, the relative proportions of the salts, location of the ions (salts) in the wall and behavior of the salts within the materials [1]. These challenges are overcome by direct measurement of the deliquescence point as described in [6] in micro samples collected in-situ.
26
I. Rörig-Dalgaard
5th International SWBSS conference – Delft 2021
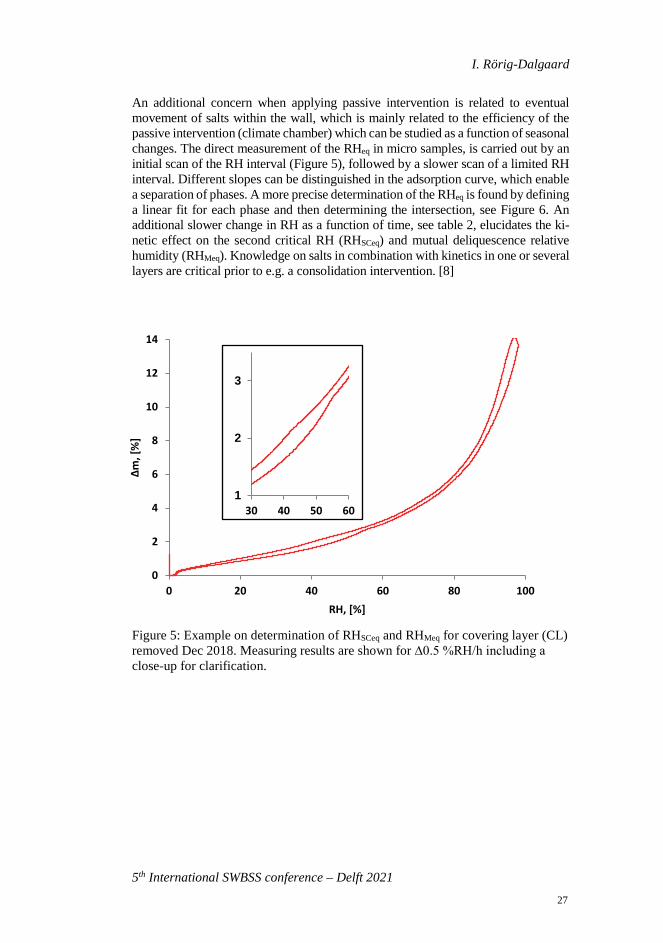
An additional concern when applying passive intervention is related to eventual movement of salts within the wall, which is mainly related to the efficiency of the passive intervention (climate chamber) which can be studied as a function of seasonal changes. The direct measurement of the RHeq in micro samples, is carried out by an initial scan of the RH interval (Figure 5), followed by a slower scan of a limited RH interval. Different slopes can be distinguished in the adsorption curve, which enable a separation of phases. A more precise determination of the RHeq is found by defining a linear fit for each phase and then determining the intersection, see Figure 6. An additional slower change in RH as a function of time, see table 2, elucidates the ki-netic effect on the second critical RH (RHSCeq) and mutual deliquescence relative humidity (RHMeq). Knowledge on salts in combination with kinetics in one or several layers are critical prior to e.g. a consolidation intervention. [8]
Figure 5: Example on determination of RHSCeq and RHMeq for covering layer (CL) removed Dec 2018. Measuring results are shown for ∆0.5 %RH/h including a close-up for clarification.
0
2
4
6
8
10
12
14
0 20 40 60 80 100
∆m, [
%]
RH, [%]
1
2
3
30 40 50 60
27
5th International SWBSS conference – Delft 2021
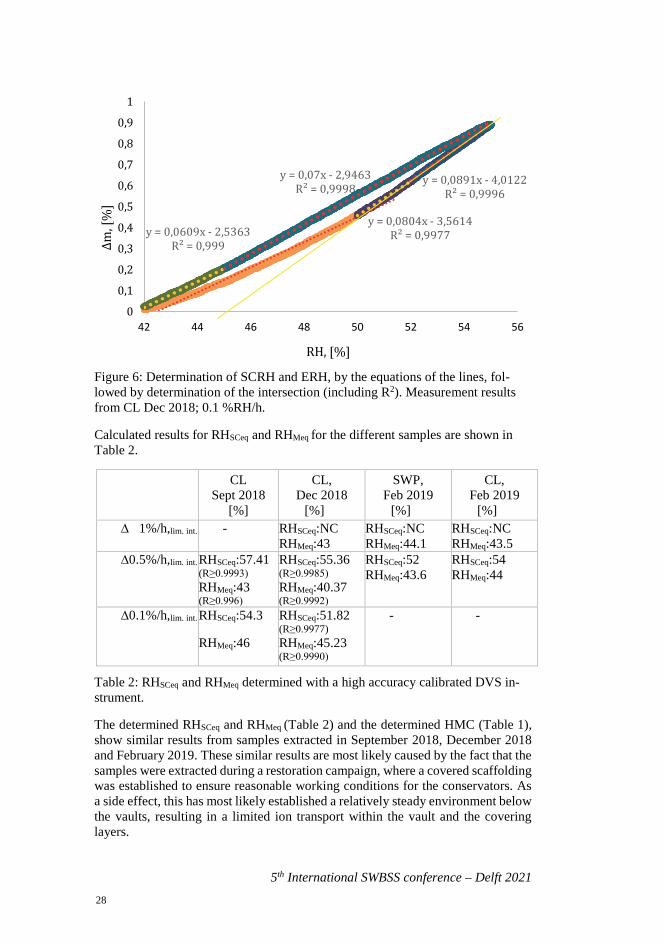
Figure 6: Determination of SCRH and ERH, by the equations of the lines, fol-lowed by determination of the intersection (including R2). Measurement results from CL Dec 2018; 0.1 %RH/h.
Calculated results for RHSCeq and RHMeq for the different samples are shown in Table 2.
CL Sept 2018
[%]
CL, Dec 2018
[%]
SWP, Feb 2019
[%]
CL, Feb 2019
[%] ∆ 1%/h,lim. int. - RHSCeq:NC
RHMeq:43 RHSCeq:NC RHMeq:44.1
RHSCeq:NC RHMeq:43.5
∆0.5%/h,lim. int. RHSCeq:57.41 (R≥0.9993) RHMeq:43 (R≥0.996)
RHSCeq:55.36 (R≥0.9985) RHMeq:40.37 (R≥0.9992)
RHSCeq:52 RHMeq:43.6
RHSCeq:54 RHMeq:44
∆0.1%/h,lim. int. RHSCeq:54.3 RHMeq:46
RHSCeq:51.82 (R≥0.9977) RHMeq:45.23 (R≥0.9990)
- -
Table 2: RHSCeq and RHMeq determined with a high accuracy calibrated DVS in-strument.
The determined RHSCeq and RHMeq (Table 2) and the determined HMC (Table 1), show similar results from samples extracted in September 2018, December 2018 and February 2019. These similar results are most likely caused by the fact that the samples were extracted during a restoration campaign, where a covered scaffolding was established to ensure reasonable working conditions for the conservators. As a side effect, this has most likely established a relatively steady environment below the vaults, resulting in a limited ion transport within the vault and the covering layers.
y = 0,0891x - 4,0122R² = 0,9996
y = 0,0609x - 2,5363R² = 0,999
y = 0,0804x - 3,5614R² = 0,9977
y = 0,07x - 2,9463R² = 0,9998
0
0,1
0,2
0,3
0,4
0,5
0,6
0,7
0,8
0,9
1
42 44 46 48 50 52 54 56
∆m, [
%]
RH, [%]
28
I. Rörig-Dalgaard
5th International SWBSS conference – Delft 2021
In a previous study [6], good agreement was found between ECOS Runsalt calcu-lated results, and direct measured results with the DVS instrument for the salt mix-tures: NaCl-Na2SO4-NaNO3, NaNO3-Na2SO4, NaCl-NaNO3 and NaCl-Na2SO4. Though it should be kept in mind that ECOS Runsalt is challenged by the influence of kinetics, along with some limitations in regard to possible ion types and combi-nations of ions. E.g., NH4,which is considered an ion often present in historical constructions [9], cannot be included in ECOS Runsalt. Additionally, it is not pos-sible to combine Ca2+ and SO4
2- in ECOS Runsalt. Further, the present measured ionic content for Si cannot be included in ECOS Runsalt for determination of a RHeq. One should also be aware of the importance on the chosen RH interval on the output results. See [6] for a more comprehensive discussion on this subject.
In the present work, it has been shown that micro samples seem to provide results as representative as traditional sample sizes, provided the precision of the measur-ing devices is high enough. Though it may be argued, that when having to rely on micro samples, it is of outmost importance, that sample extraction is performed by a qualified professional. In relation to cultural heritage, as described in [9], only in case of a dialog between conservators and scientists can a meaningful approach to the object be made. Therefore, such small samples sizes seem realistic in relation to cultural heritage.
Use of micro samples for potential salt damage assessment and prevention cannot be considered as a simple tool; however, in relation to cultural heritage objects it seems realistic that the method could find its use since it seems to enable a true and fair diagnosis, only demanding minimal intervention in the object. The method can be used to indicate presence of salts, to detect salts in layers of wall-paintings and to determine the RHeq of salt mixtures for subsequent decision about a passive in-tervention.
4 CONCLUSION In conclusion, the analysis of micro samples seems to provide reliable results, pro-vided the precision of the measuring devices is high enough. The methodology seems promising and it reduces the size of the sample needed for assessment and prevention of salt damage on cultural heritage constructions.
The usefulness of the developed methodology is planned to be additionally tested on cultural heritage objects in relation to the following interventions: uncovering of wall paintings, determination of the deliquescence point of the salt mixture in the wall painting to establish a less damaging climate and to forecast potential salt related problems related to an active decrease of the RH.
ACKNOWLEDGEMENTS The Aage and Johanne Louis-Hansen Foundation is gratefully acknowledged for financial support to this project. Head of Nordic Conservation, Conservator Peder Bøllingtoft is acknowledged for many fruitful discussions and practical help with the extraction of the samples.
29
5th International SWBSS conference – Delft 2021
REFERENCES [1] S. Cather, „Aqueous extraction of soluble salts from porous materials: alter-
natives and contra-indications“, in Mauersalze und Architekturoberflächen,pp. 223-236, 2003.
[2] C. Bläuer Böhm, Praktische Hinweise zur Vorgehensweise bei der Untersu-chung and Beurteilung von salzbelasteten Baudenkmälern. Salzschäden anWandmalereien.Beitrage der Fortbildungsveranstaltung der Restaurierungs-werkstätte 28./29. November, Arbeitshefte des Bayerischen Landesamtes fürDenkmalpflege, Helft 78, pp. 39-52.
[3] A. Sawdy and C. Price, “Salt damage at Cleeve Abbey, England. Part II: sea-sonal variablitiy of salt distribution and implications for sampling strateties”,J. Cult. Herit., vol. 6, 2005.
[4] I. Rörig-Dalgaard and S. Svensson, “High accuracy calibration of a dynamicvapor sorption instrument and determination of the equilibrium humiditiesusing single salts”, Rev. Sci. Instrum., vol. 87, no. 5, 2016.
[5] I. Rörig-Dalgaard, “Determination of the deliquesce point in salt mixtures andin in-situ multicomponent salts with DVS equipment”, in 3rd Int. conf. on SaltWeathering of Buildings and Stone Sculptures, 2014, pp. 223-236.
[6] I. Rörig-Dalgaard, “Direct measurements of the RHeq in salt mixtures includ-ing the contribution from metastable phases”, ACS Omega, vol. 6, no. 25,2021.
[7] M. Nasraoui, W. Nowik, B. Lubelli, “A comparative study of hygroscopicmoisture content, electrical conductivity and ion chromatography for salt as-sessment in plasters of historical building”, Constr. Build. Mater., vol. 23,2009.
[8] I. Rörig-Dalgaard, A. Elena Charola, and P. Bøllingtoft, “Presence of saltsrequires inclusion of kinetic issues when consolidating objects” in Consoli-dation 2021, 2021, (accepted).
[9] C. Bläuer Böhm, “Salzunersuchungen an Baudenmmälern”, Zeitschrift fürKunsttechnologie und Konservierung, vol. 8, no. 1, 1994.
30
5th International SWBSS conference – Delft 2021
IMPLICATIONS OF USING METEOROLOGICAL RECORDS TO ASSESS THE ENVIRONMENTAL RISK OF SALT CRYSTALLIZATION CYCLES IN STONE
Tim De Kock1*, Scott A. Orr2, Daphne Guilbert3,
Sebastiaan Godts1,3,4, Steven Caluwaerts5,6, Veerle Cnudde,3,7 and Julie Desarnaud4,8
KEYWORDS Salt, cycling, environmental risk, meteorological data, stone, conservation
ABSTRACT Salt crystallization and dissolution cycles can significantly contribute to the degra-dation of stone, brick and mortar. One year of meteorological observations is used to evaluate the environmental risk using a threshold approach for a NaCl single salt. We illustrate the effect of boundary conditions such as the averaging timeframe and the minimum RH on the determined number of salt phase transi-tions, which are informed by droplet experiments. Additionally, the mitigating ef-fect of crystallization within a porous substrate is explored using heat-air-moisture simulations. The results provide a better understanding of regional and seasonal differences in the environmental risk of salt weathering.
1 University of Antwerp, Antwerp, Belgium, [email protected] 2 University College London, London, United Kingdom 3 Ghent University, Gent, Belgium 4 Royal Institute for Cultural Heritage (KIK-IRPA), Brussels, Belgium 5 Ghent University, Gent, Belgium 6 Royal Meteorological Institute of Belgium, Ukkel, Belgium 7 Utrecht University, Utrecht, The Netherlands 8 Belgian Building Research Institute, Brussels, Belgium
31
5th International SWBSS conference – Delft 2021
1 INTRODUCTION Salt crystallization and dissolution cycles can significantly contribute to the degra-dation of lithic materials as stone, brick and mortar. Degradation can manifest as physical and aesthetical material decay, the degree depending on the amount and type of salt mixture present in the porous substrate, the material properties of that substrate and the ambient environment [1]–[3]. The environmental risk of salt re-lated decay can be understood as the intensity and magnitude of climatic changes, such as fluctuations in relative humidity (RH) that drive salt crystallization and dissolution.
Such environmental risk has already been assessed by parameterizing climate data [4] or analysing meteorological records [5], with the intention to estimate the num-ber of potential salt phase transitions (crystallization-dissolution cycles). Severalauthors have used a threshold approach for single salts: the number of potential saltphase transitions is calculated by the number of RH crossings across the relativehumidity equilibrium of a single salt (RHeq), which is known for common singlesalts. In the case of NaCl, a RHeq of approximately 75.5% RH is commonly ac-cepted, although some authors prefer a critical relative humidity about 10% lower[6], which could be more realistic in the case of salt mixtures [7]. The RHeq ofNa2SO4(.nH2O) is more dependent on temperature, and hence its RH threshold isset as a function of temperature [6]. With the help of thermodynamic data or modelssuch as ECOS-RUNSALT [8], [9], this threshold approach has also been per-formed for more complex salt mixtures [10], [11]. Typically, the timeframe inwhich RH fluctuations must occur are set as boundary condition. This strongly re-lates to the time resolution of the parameterized climate dataset or the resolution ofmeteorological observations. Different timeframes, from six- to twelve hours over24h to 48h have been used. Experiments with NaCl in small stone samples haveshown that, under specific conditions, significant amounts of salt can crystallizewithin the first 6h of drying experiments [12]. In the end, these outcomes are usedas guidelines for climatic control in preventive conservation, or to compare therelative risk of different climates or climate change scenarios.
In this paper, we look at the influence of the spatial-temporal resolution of meteor-ological data on the environmental risk assessment with a threshold approach for the simplest case of NaCl. Therefore we use meteorological data from the urban environment in Gent and its rural surroundings [13] with a high temporal resolu-tion. We evaluate how dependent the resulting number of salt phase transitions is on the chosen timeframe and on the dynamics of the ambient environment. This is compared with preliminary results from accompanying laboratory experiments [7] to improve estimations. Additionally, the meteorological data are used to produce model data of the hygrothermal conditions of Savonnières limestone with heat-air-moisture simulations in Delphin. These results are used to evaluate the buffering effect of the substrate in response to environmental drivers. Finally, information of seasonal and regional variability of salt phase transitions is retrieved.
32
T. De Kock et al.
5th International SWBSS conference – Delft 2021
2 MATERIALS AND METHODS
2.1 Meteorological data The meteorological data are retrieved from a high-accuracy urban climate moni-toring network (MOCCA) in Ghent (Belgium, Cfb climate) [13]. The data of two stations is used: (1) Melle, representing a rural environment in the surroundings of Ghent, is used as standard climate data, (2) Sint-Bavo school in the centre of Ghent to retrieve information on the effect of urban conditions on salt phase transitions. One full year (1 July 2016 – 30 June 2017) of data at high temporal resolution (1-minute interval) is used. This is rather exceptional and allows us to perform this study. Given the low dependency of the RHeq of NaCl on temperature, only RH data was used in this study. RH was measured using a HC2S3 probe with an accu-racy of 0.8% in a passively ventilated radiation shield.
2.2 Methodology and experimental data The data were initially analyzed for NaCl as a single salt, for which 75.5% RH was taken as the RHeq. The number of salt phase transitions was counted as negative crossings (from RH ≥ 75.5% to RH < 75.5%) using the average RH in different averaging timeframes (1 min, 5 min, 10 min, 30 min, 60 min, 720 min (12 h), 1440 min (24 h)). The number of salt phase transitions was considered equivalent as the number of salt crystallization-dissolution cycles. A cycle was only accounted for when no other cycle was recorded within the averaging timeframe before the mo-ment it was identified (e.g. for 1-minute timeframes a cycle can be registered every next minute, whilst for the 24 h-timeframe a cycle can only be registered in the succeeding 24 h period). Other RHeq, for examples in salt mixtures, are not consid-ered in this paper.
Additionally, preliminary experimental results on the crystallization and dissolu-tion kinetics of NaCl droplets were used to inform the environmental risk assess-ment. This set of experiments was performed by recording the solution/crystal in a controlled climatic chamber (GenRH), using RH cycles from 90% down to respec-tively 70%, 60%, 50%, 40%, 30%, 20%, and intermittently back to 90%. These data show a high dependency of the crystallization and less of the dissolution on the magnitude of the RH cycle [7]. Here, we conceptualize the results to include in the meteorological data analysis. A timeframe of 30 minutes is kept constant for the dissolution stage; whilst we set forward a crystallization time of 30 minutes for RH cycles that went down to 70%; 10 min for cycles that went down to 60% RH and 5 minutes for cycles where the minimum RH reached levels below 40%.
2.3 Hygrothermal model data Heat, air and moisture (HAM-) simulations were performed using Delphin 6.1 (Bauklimatik Dresden) to simulate hygrothermal conditions in Savonnières lime-stone using in-house defined properties and the MOCCA data used for the meteor-ological analysis. A 1D construction (500 x 500 mm) with planar horizontal transport in the x-direction was assumed. The inside climate was assumed to be constant with a temperature of 20 °C and relative humidity of 50%. Simulations were run for 6 years (repeating the same yearly record), 5 years for preconditioning
33
5th International SWBSS conference – Delft 2021
of the stone and the final year for studying hygrothermal conditions at the stone surface, at 1.1 cm and 2.0 cm depth. From this, the RH in the (pores of) the stone was retrieved for analysis. The data were reported with a time resolution of 5 minutes.
3 RESULTS AND DISCUSSION
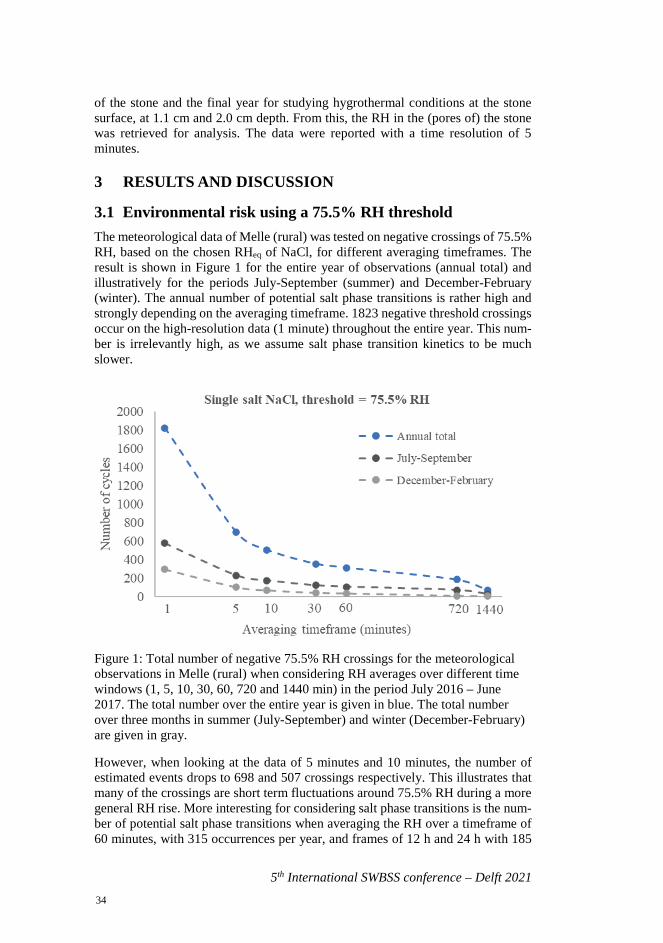
3.1 Environmental risk using a 75.5% RH threshold The meteorological data of Melle (rural) was tested on negative crossings of 75.5% RH, based on the chosen RHeq of NaCl, for different averaging timeframes. The result is shown in Figure 1 for the entire year of observations (annual total) and illustratively for the periods July-September (summer) and December-February (winter). The annual number of potential salt phase transitions is rather high and strongly depending on the averaging timeframe. 1823 negative threshold crossings occur on the high-resolution data (1 minute) throughout the entire year. This num-ber is irrelevantly high, as we assume salt phase transition kinetics to be much slower.
Figure 1: Total number of negative 75.5% RH crossings for the meteorological observations in Melle (rural) when considering RH averages over different time windows (1, 5, 10, 30, 60, 720 and 1440 min) in the period July 2016 – June 2017. The total number over the entire year is given in blue. The total number over three months in summer (July-September) and winter (December-February) are given in gray.
However, when looking at the data of 5 minutes and 10 minutes, the number of estimated events drops to 698 and 507 crossings respectively. This illustrates that many of the crossings are short term fluctuations around 75.5% RH during a more general RH rise. More interesting for considering salt phase transitions is the num-ber of potential salt phase transitions when averaging the RH over a timeframe of 60 minutes, with 315 occurrences per year, and frames of 12 h and 24 h with 185
34
T. De Kock et al.
5th International SWBSS conference – Delft 2021
and 73 cycles, respectively. This means that there are 73 occasions where the av-erage RH was below 75.5% for 24 subsequent hours during which no previous cycle was registered, followed by a period of 24 subsequent hours where the aver-age is above 75.5%. This number is remarkably high. Though, being less than half the number of cycles compared to a 12 h timeframe, it shows the high dependency of the environmental risk assessment on the choice for the length of the timeframe.
3.2 Minimum RH as additional boundary condition Preliminary experiments with fluctuating RH cycles on NaCl droplets give infor-mation on the speed of dissolution and crystallization. This is an oversimplification in the context of stone weathering, as kinetics in capillaries are generally slower. Nevertheless, this straightforward approach is used to incorporate the magnitude of RH jumps in the threshold approach as an additional constraint to the averaging timeframe. The results of the droplet experiment [7] were used to inform the anal-ysis of the climate date, which in turn should inform the design of more realistic experiments in the future.
Based on the droplet experiments, the simplified (and conceptual) assumption is made that dissolution always takes 30 minutes, and that crystallization takes 60 minutes, unless the minimum RH during the crystallization phase was ≤ 70%, for which the crystallization time was set at 30 minutes; ≤ 60% for which the crystal-lization time was set at 10 minutes; and ≤ 40% for which the crystallization time was set at 5 minutes. In other words, the number of threshold crossings was now calculated with the average timeframe of dissolution always set at 30 minutes; whilst a minimum RH condition was applied to the average timeframe of 5, 10, 30 and 60 minutes.
In this case, we get a more realistic response from the analysis, shown in Table 1. For Melle, a total number of 619 cycles complying to the condition of 60 minutes is reducing to 193, 5 and 1 for a timeframe of 30 minutes, 5 minutes and 1 minute respectively. A cycle where the RH rises from 60% to above 75.5% within 10 minutes (and is counted in this timeframe), will also counted the timeframe of 1 h. In theory, it is possible that several 10 minute cycles are occur within one hour, but in practice this is not the case as such large fluctuations follow a single upward trend (i.e. multiple extreme oscillations do not occur within 1h). More interesting is that, although the RH regularly drops to low values, the drop below 75.5% RH is almost never fast enough and sufficient in magnitude to facilitate cycles at the time resolution of 5 minutes.
This data informs us about interpreting meteorological data at high temporal reso-lution. From the 507 negative threshold crossings observed throughout the year with a timeframe of 10 min, five potentially correspond to a salt phase transition if we rely on the (simplified) kinetic data of the droplet experiments. Of the 356 annual crossings with a 30-minute timeframe, 193 could correspond to a potential phase transition in the same reasoning.
35
5th International SWBSS conference – Delft 2021
5 min. (RH ≤ 40%)
10 min. (RH ≤ 60%)
30 min. (RH ≤ 70%)
60 min (RH ≤ 75.5%)
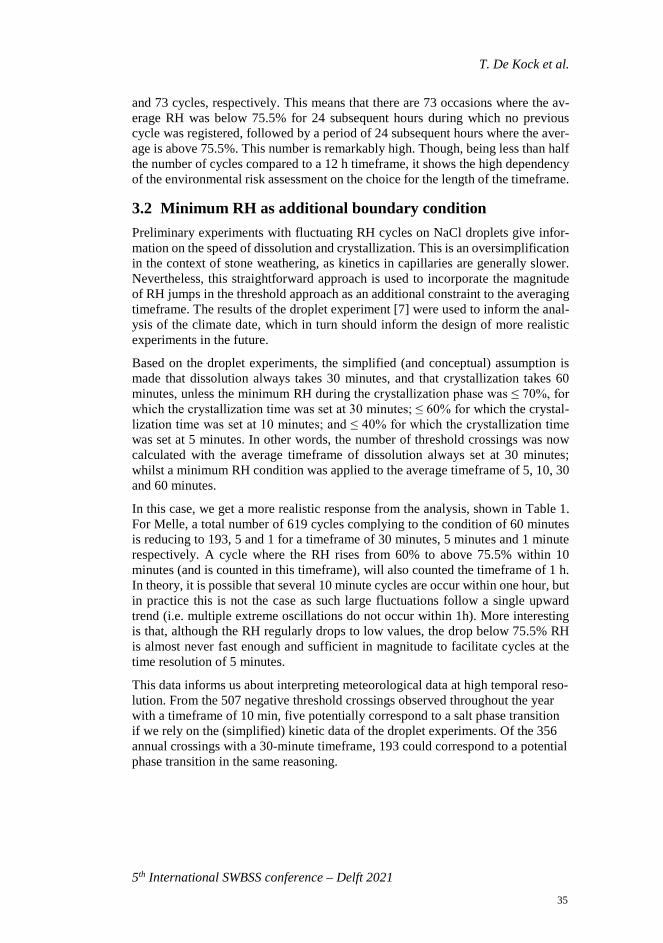
Melle (rural) 1 5 193 619 St Bavo (urban) 0 0 150 649
Table 1: Number of negative 75.5% RH crossings for averaging timeframes of 5, 10, 30 and 60 minutes, applying a minimal RH within that timeframe as addi-tional boundary condition for counting a salt phase transition. Based on the mete-orological records from Melle (rural) and St Bavo school (urban) in the period July 2016 – June 2017.
3.3 Hygrothermal data of substrates The conditions in porous media differ from the unconfined conditions of droplet experiments. Experiment in capillaries of different size and with solution/crystals at different depths can inform us about the differences in kinetics [7]. Additionally, the surface conditions on and in stone substrates might differ from bulk atmos-pheric conditions generally measured in meteorological records. Therefore, we adopt an alternative approach from the perspective of the climate data. Through HAM-simulations, a record of RH at different depths within the porous substrate is created in function of the meteorological observations. This record is tested in the same way as the meteorological data. Because of the computing time necessary for generating the record, we focus on analyzing the record for 1 representative month (July 2016) instead of the entire year (after 5 years of preconditioning to create a realistic record).
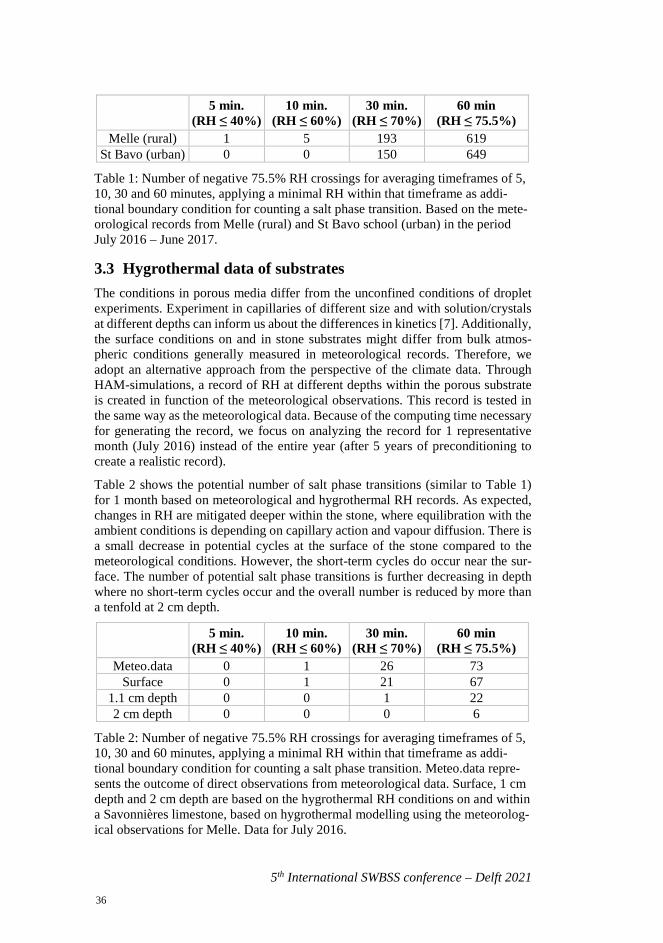
Table 2 shows the potential number of salt phase transitions (similar to Table 1) for 1 month based on meteorological and hygrothermal RH records. As expected, changes in RH are mitigated deeper within the stone, where equilibration with the ambient conditions is depending on capillary action and vapour diffusion. There is a small decrease in potential cycles at the surface of the stone compared to the meteorological conditions. However, the short-term cycles do occur near the sur-face. The number of potential salt phase transitions is further decreasing in depth where no short-term cycles occur and the overall number is reduced by more than a tenfold at 2 cm depth.
5 min. (RH ≤ 40%)
10 min. (RH ≤ 60%)
30 min. (RH ≤ 70%)
60 min (RH ≤ 75.5%)
Meteo.data 0 1 26 73 Surface 0 1 21 67
1.1 cm depth 0 0 1 22 2 cm depth 0 0 0 6
Table 2: Number of negative 75.5% RH crossings for averaging timeframes of 5, 10, 30 and 60 minutes, applying a minimal RH within that timeframe as addi-tional boundary condition for counting a salt phase transition. Meteo.data repre-sents the outcome of direct observations from meteorological data. Surface, 1 cm depth and 2 cm depth are based on the hygrothermal RH conditions on and within a Savonnières limestone, based on hygrothermal modelling using the meteorolog-ical observations for Melle. Data for July 2016.
36
T. De Kock et al.
5th International SWBSS conference – Delft 2021
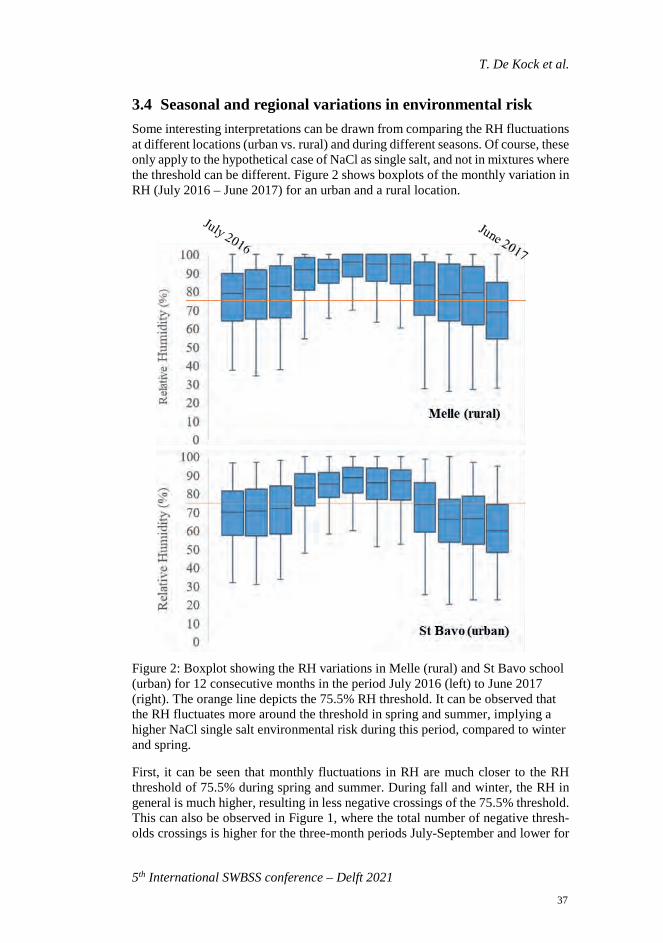
3.4 Seasonal and regional variations in environmental risk Some interesting interpretations can be drawn from comparing the RH fluctuations at different locations (urban vs. rural) and during different seasons. Of course, these only apply to the hypothetical case of NaCl as single salt, and not in mixtures where the threshold can be different. Figure 2 shows boxplots of the monthly variation in RH (July 2016 – June 2017) for an urban and a rural location.
Figure 2: Boxplot showing the RH variations in Melle (rural) and St Bavo school (urban) for 12 consecutive months in the period July 2016 (left) to June 2017 (right). The orange line depicts the 75.5% RH threshold. It can be observed that the RH fluctuates more around the threshold in spring and summer, implying a higher NaCl single salt environmental risk during this period, compared to winter and spring.
First, it can be seen that monthly fluctuations in RH are much closer to the RH threshold of 75.5% during spring and summer. During fall and winter, the RH in general is much higher, resulting in less negative crossings of the 75.5% threshold. This can also be observed in Figure 1, where the total number of negative thresh-olds crossings is higher for the three-month periods July-September and lower for
37
5th International SWBSS conference – Delft 2021
December-February. Hence, for the Cfb climate in Ghent, the outdoor environmen-tal risk for NaCl-related weathering is higher in spring and summer, and less in winter.
It can also be observed that the RH is in general lower throughout the year in an urban environment compared to a rural environment, and the intensity of its fluc-tuations is also mitigated in an urban environment. As a result of the latter, the conditions for short term (< 1h) salt phase transitions as observed in the droplet experiments are less relevant in the urban environment.
4 CONCLUSIONS A meteorological record with high time resolution can provide an accurate estima-tion of the number of times the RHeq is surpassed. Compared to records with low time resolution, averaging timeframes in a high-resolution dataset can yield a more correct number of cycles. Information on the kinetics of crystallization and disso-lution can improve the evaluation of the environmental risk. Using short averaging timeframes yields an irrelevant high number; but in combination with RH con-straints and simple experimental observations, this number is drastically reduced. Within the limits of this study, it can be proposed that few short-term cycles (<1 h) spanning sufficiently large RH fluctuations occur. The outlook of more detailed experimental data will probably put more restrictions on the conditions and there-fore further reduce the number of cycles. HAM-simulations have the potential to further improve environmental risk assessment. However, the approach for analyz-ing the data still needs to be validated and would benefit of experimental research on confined crystallization and dissolution in capillaries.
Analyzing the meteorological data shows that the risk of NaCl weathering in out-door environments is highest in spring and summer for the meteorological record under observation. Significant differences also occur between rural and urban en-vironment, but the impact is dependent on the chosen RHeq and on the season under investigation. The results of such analysis can be used to compare the relative risk of different climates or climate change scenarios.
ACKNOWLEDGEMENTS We acknowledge the Belgium Science Policy (Belspo) for funding KNOWMORE (Heritage stone Monitoring and Remediation: knowledge exchange placements) and PREDICT (Phase Transitions of Salts under Changing Climatic Conditions). We wish to thank Prof. Dr. Heather Viles and Dr. Katrin Wilhelm (University of Oxford) and Prof. Dr. Michael Steiger (Hamburg University) for their inspirational discussions during both projects. Daphne Guilbert acknowledges the Research Foundation – Flanders (FWO) (research grant number 1SC4420N). Bauklimatic-Dresden is acknowledged for providing a Delphin license for this research. We further acknowledge the sponsors (Department Physics and Astronomy of Ghent University, Farys, Observatory Armand Pien) and partners of the MOCCA project to allow the generation of the meteorological data that was used.
38
T. De Kock et al.
5th International SWBSS conference – Delft 2021
REFERENCES [1] A. E. Charola, “Salts in the Deterioration of Porous Materials: An Overview,”
J. Am. Inst. Conserv., vol. 39, no. 3, p. 327, 2000.
[2] E. Doehne, “Salt weathering: a selective review,” in Geological Society Special Publications 205, London, 2002, p. 19.
[3] R. Flatt et al., “Predicting salt damage in practice: A theoretical insight into laboratory tests.,” RILEM Tech. Lett., vol. 2, pp. 108–118, Dec. 2017.
[4] C. M. Grossi, P. Brimblecombe, B. Menéndez, D. Benavente, I. Harris, and M. Déqué, “Climatology of salt transitions and implications for stone weathering,” Sci. Total Environ., vol. 409, no. 13, pp. 2577–2585, Jun. 2011.
[5] S. Godts, R. Hayen, and H. De Clercq, “Investigating salt decay of stone materials related to the environment, a case study in the St. James church in Liège, Belgium,” Stud. Conserv., vol. 62, no. 6, pp. 329–342, Aug. 2017.
[6] D. Benavente, S. Sanchez-Moral, A. Fernandez-Cortes, J. C. Cañaveras, J. Elez, and C. Saiz-Jimenez, “Salt damage and microclimate in the Postumius Tomb, Roman Necropolis of Carmona, Spain,” Environ. Earth Sci., vol. 63, no. 7–8, pp. 1529–1543, Aug. 2011.
[7] S. Godts et al., “NaCl-related weathering of stone: the importance of kinetics and salt mixtures in environmental risk assessment,” Herit. Sci., vol. 9, no. 1, p. 44, Dec. 2021.
[8] C. Price, “An expert chemical model for determining the environmental conditions needed to prevent salt damage in porous media,” 2000.
[9] D. Bionda, “RUNSALT - A graphical user interface to the ECOS thermodynamic model for the prediction of the behaviour of salt mixtures under changing climate conditions,” http://science.sdf-eu.org/runsalt/, 2005.
[10] B. Menéndez, “Estimation of salt mixture damage on built cultural heritage from environmental conditions using ECOS-RUNSALT model,” J. Cult. Herit., vol. 24, pp. 22–30, Mar. 2017.
[11] B. Menéndez, “Estimators of the Impact of Climate Change in Salt Weathering of Cultural Heritage,” Geosciences, vol. 8, no. 11, p. 401, Nov. 2018.
[12] L. Grementieri et al., “Numerical simulation of salt transport and crystallization in drying Prague sandstone using an experimentally consistent multiphase model,” Build. Environ., vol. 123, pp. 289–298, Oct. 2017.
[13] S. Caluwaerts et al., “The urban climate of Ghent, Belgium: A case study combining a high-accuracy monitoring network with numerical simulations,” Urban Clim., vol. 31, art no. 100565, Mar. 2020.
39

40
5th International SWBSS conference – Delft 2021
ENVIRONMENTAL FACTORS FOR SALT WEATHERING OF MODERN JAPANESE BRICK CHIMNEY
Tomoko Uno1*, Masaru Abuku2, and Chiemi Iba3
KEYWORDS Field survey, environmental measurement, computational fluid dynamics (CFD) analysis
ABSTRACT In this study, we investigated the factors affecting the salt weathering of a brick chimney in a historical building used as a Japanese sake brewery. The mapping of the weathered areas, field measurements of the thermal environment and computa-tional fluid dynamics (CFD) analysis of the airflow and temperature in the brick chimney flue were conducted.
The salt observed on the chimney was determined to be sodium sulfate (Na2SO4). The exhaust gas of the boiler was the major source of water and sodium sulfate. The water vapour in the hot exhaust gas with salts would condense on the cold surface inside the brick chimney flue, resulting in salt solution penetration into the brick; subsequently, water evaporation at the outside surface would lead to salt crystallisation. Our field observation showed that salt crystallisation was concen-trated at 1 m above the floor but did not occur above 2 m, at the level where an exhaust pipe of the boiler gas was connected to the brick chimney.
According to the surface temperature measurement results, the temperature in-crease at non-weathered areas was larger than that at weathered areas. The CFD analysis showed that warmer air moved upwards above the exhaust duct, whereas colder air remained stagnant below the exhaust duct. This result suggested that both the airflow and the corresponding temperature distribution in the brick chimney flue influenced the spatial distribution pattern of salt weathering.
1 Mukogawa Women's University, Hyogo, Japan,
[email protected] 2 Kindai University, Higashiosaka city, Osaka, Japan 3 Kyoto University, Kyoto, Japan
41
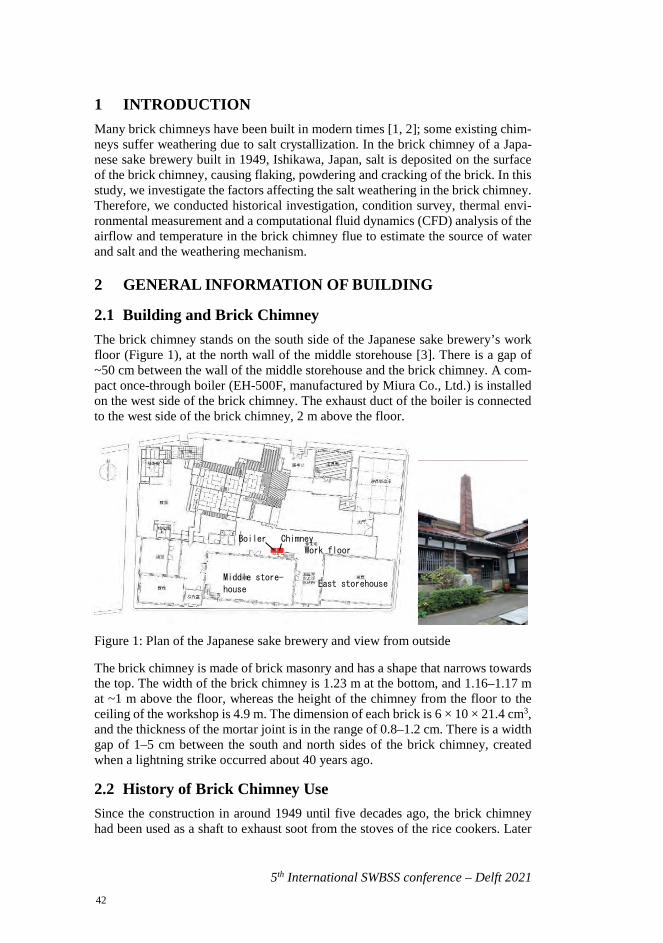
5th International SWBSS conference – Delft 2021
1 INTRODUCTION Many brick chimneys have been built in modern times [1, 2]; some existing chim-neys suffer weathering due to salt crystallization. In the brick chimney of a Japa-nese sake brewery built in 1949, Ishikawa, Japan, salt is deposited on the surface of the brick chimney, causing flaking, powdering and cracking of the brick. In this study, we investigate the factors affecting the salt weathering in the brick chimney. Therefore, we conducted historical investigation, condition survey, thermal envi-ronmental measurement and a computational fluid dynamics (CFD) analysis of the airflow and temperature in the brick chimney flue to estimate the source of water and salt and the weathering mechanism.
2 GENERAL INFORMATION OF BUILDING
2.1 Building and Brick Chimney The brick chimney stands on the south side of the Japanese sake brewery’s work floor (Figure 1), at the north wall of the middle storehouse [3]. There is a gap of ~50 cm between the wall of the middle storehouse and the brick chimney. A com-pact once-through boiler (EH-500F, manufactured by Miura Co., Ltd.) is installed on the west side of the brick chimney. The exhaust duct of the boiler is connected to the west side of the brick chimney, 2 m above the floor.
Figure 1: Plan of the Japanese sake brewery and view from outside
The brick chimney is made of brick masonry and has a shape that narrows towards the top. The width of the brick chimney is 1.23 m at the bottom, and 1.16–1.17 m at ~1 m above the floor, whereas the height of the chimney from the floor to the ceiling of the workshop is 4.9 m. The dimension of each brick is 6 × 10 × 21.4 cm3, and the thickness of the mortar joint is in the range of 0.8–1.2 cm. There is a width gap of 1–5 cm between the south and north sides of the brick chimney, created when a lightning strike occurred about 40 years ago.
2.2 History of Brick Chimney Use Since the construction in around 1949 until five decades ago, the brick chimney had been used as a shaft to exhaust soot from the stoves of the rice cookers. Later
Chimney Boiler
Middle store-
houseEast storehouse
Work floor
42
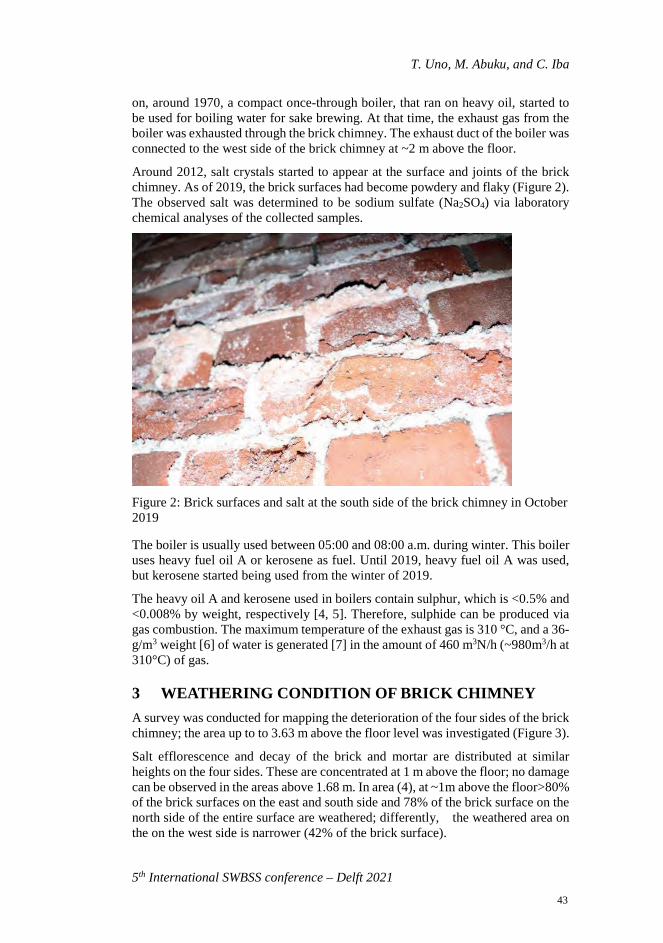
T. Uno, M. Abuku, and C. Iba
5th International SWBSS conference – Delft 2021
on, around 1970, a compact once-through boiler, that ran on heavy oil, started to be used for boiling water for sake brewing. At that time, the exhaust gas from the boiler was exhausted through the brick chimney. The exhaust duct of the boiler was connected to the west side of the brick chimney at ~2 m above the floor.
Around 2012, salt crystals started to appear at the surface and joints of the brick chimney. As of 2019, the brick surfaces had become powdery and flaky (Figure 2). The observed salt was determined to be sodium sulfate (Na2SO4) via laboratory chemical analyses of the collected samples.
Figure 2: Brick surfaces and salt at the south side of the brick chimney in October 2019
The boiler is usually used between 05:00 and 08:00 a.m. during winter. This boiler uses heavy fuel oil A or kerosene as fuel. Until 2019, heavy fuel oil A was used, but kerosene started being used from the winter of 2019.
The heavy oil A and kerosene used in boilers contain sulphur, which is <0.5% and <0.008% by weight, respectively [4, 5]. Therefore, sulphide can be produced via gas combustion. The maximum temperature of the exhaust gas is 310 °C, and a 36-g/m3 weight [6] of water is generated [7] in the amount of 460 m3N/h (~980m3/h at 310°C) of gas.
3 WEATHERING CONDITION OF BRICK CHIMNEY A survey was conducted for mapping the deterioration of the four sides of the brick chimney; the area up to to 3.63 m above the floor level was investigated (Figure 3).
Salt efflorescence and decay of the brick and mortar are distributed at similar heights on the four sides. These are concentrated at 1 m above the floor; no damage can be observed in the areas above 1.68 m. In area (4), at ~1m above the floor>80% of the brick surfaces on the east and south side and 78% of the brick surface on the north side of the entire surface are weathered; differently, the weathered area on the on the west side is narrower (42% of the brick surface).
43
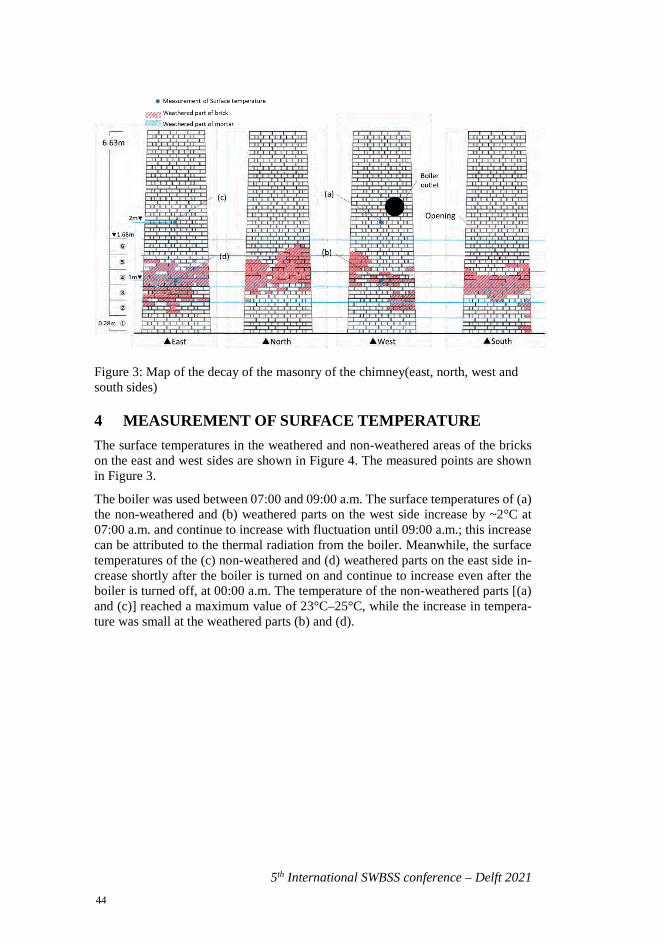
5th International SWBSS conference – Delft 2021
Figure 3: Map of the decay of the masonry of the chimney(east, north, west and south sides)
4 MEASUREMENT OF SURFACE TEMPERATURE The surface temperatures in the weathered and non-weathered areas of the bricks on the east and west sides are shown in Figure 4. The measured points are shown in Figure 3.
The boiler was used between 07:00 and 09:00 a.m. The surface temperatures of (a) the non-weathered and (b) weathered parts on the west side increase by ~2°C at 07:00 a.m. and continue to increase with fluctuation until 09:00 a.m.; this increase can be attributed to the thermal radiation from the boiler. Meanwhile, the surface temperatures of the (c) non-weathered and (d) weathered parts on the east side in-crease shortly after the boiler is turned on and continue to increase even after the boiler is turned off, at 00:00 a.m. The temperature of the non-weathered parts [(a) and (c)] reached a maximum value of 23°C–25°C, while the increase in tempera-ture was small at the weathered parts (b) and (d).
44
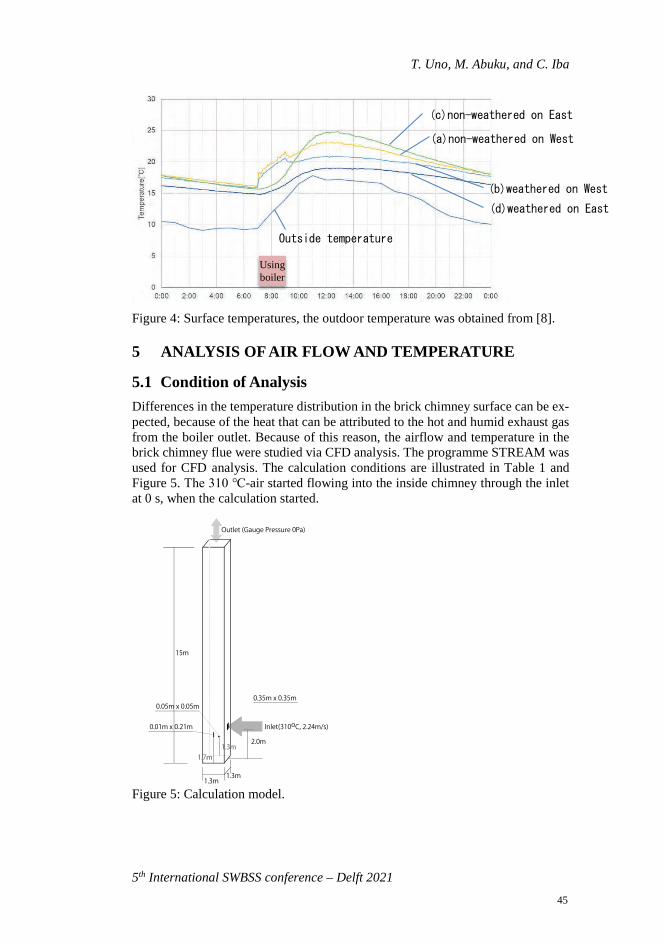
T. Uno, M. Abuku, and C. Iba
5th International SWBSS conference – Delft 2021
Figure 4: Surface temperatures, the outdoor temperature was obtained from [8].
5 ANALYSIS OF AIR FLOW AND TEMPERATURE
5.1 Condition of Analysis Differences in the temperature distribution in the brick chimney surface can be ex-pected, because of the heat that can be attributed to the hot and humid exhaust gas from the boiler outlet. Because of this reason, the airflow and temperature in the brick chimney flue were studied via CFD analysis. The programme STREAM was used for CFD analysis. The calculation conditions are illustrated in Table 1 and Figure 5. The 310 ℃-air started flowing into the inside chimney through the inlet at 0 s, when the calculation started.
Figure 5: Calculation model.
(c)non-weathered on East
(a)non-weathered on West
(b)weathered on West (d)weathered on East
Outside temperature
Using boiler
1.3m1.3m
15m
2.0m1.3m
1.7m
0.35m x 0.35m0.05m x 0.05m
0.01m x 0.21m Inlet(310oC, 2.24m/s)
Outlet (Gauge Pressure 0Pa)
45
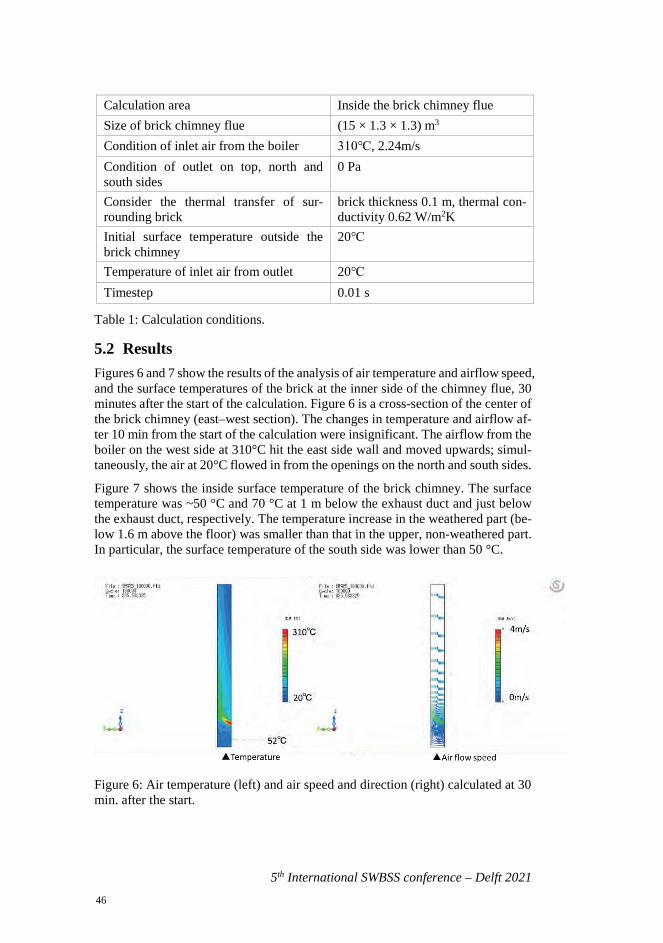
5th International SWBSS conference – Delft 2021
Calculation area Inside the brick chimney flue Size of brick chimney flue (15 × 1.3 × 1.3) m3 Condition of inlet air from the boiler 310℃, 2.24m/s Condition of outlet on top, north and south sides
0 Pa
Consider the thermal transfer of sur-rounding brick
brick thickness 0.1 m, thermal con-ductivity 0.62 W/m2K
Initial surface temperature outside the brick chimney
20℃
Temperature of inlet air from outlet 20℃ Timestep 0.01 s
Table 1: Calculation conditions.
5.2 Results Figures 6 and 7 show the results of the analysis of air temperature and airflow speed, and the surface temperatures of the brick at the inner side of the chimney flue, 30 minutes after the start of the calculation. Figure 6 is a cross-section of the center of the brick chimney (east–west section). The changes in temperature and airflow af-ter 10 min from the start of the calculation were insignificant. The airflow from the boiler on the west side at 310°C hit the east side wall and moved upwards; simul-taneously, the air at 20°C flowed in from the openings on the north and south sides.
Figure 7 shows the inside surface temperature of the brick chimney. The surface temperature was ~50 °C and 70 °C at 1 m below the exhaust duct and just below the exhaust duct, respectively. The temperature increase in the weathered part (be-low 1.6 m above the floor) was smaller than that in the upper, non-weathered part. In particular, the surface temperature of the south side was lower than 50 °C.
Figure 6: Air temperature (left) and air speed and direction (right) calculated at 30 min. after the start.
46
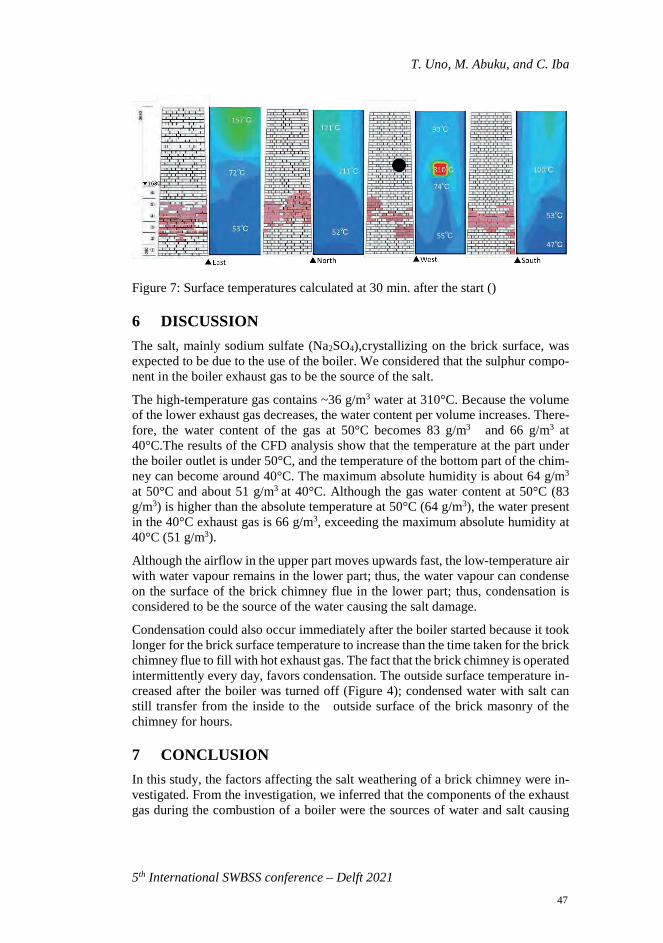
T. Uno, M. Abuku, and C. Iba
5th International SWBSS conference – Delft 2021
Figure 7: Surface temperatures calculated at 30 min. after the start ()
6 DISCUSSION The salt, mainly sodium sulfate (Na2SO4),crystallizing on the brick surface, was expected to be due to the use of the boiler. We considered that the sulphur compo-nent in the boiler exhaust gas to be the source of the salt.
The high-temperature gas contains ~36 g/m3 water at 310°C. Because the volume of the lower exhaust gas decreases, the water content per volume increases. There-fore, the water content of the gas at 50°C becomes 83 g/m3 and 66 g/m3 at 40°C.The results of the CFD analysis show that the temperature at the part under the boiler outlet is under 50°C, and the temperature of the bottom part of the chim-ney can become around 40°C. The maximum absolute humidity is about 64 g/m3 at 50°C and about 51 g/m3 at 40°C. Although the gas water content at 50°C (83 g/m3) is higher than the absolute temperature at 50°C (64 g/m3), the water present in the 40°C exhaust gas is 66 g/m3, exceeding the maximum absolute humidity at 40°C (51 g/m3).
Although the airflow in the upper part moves upwards fast, the low-temperature air with water vapour remains in the lower part; thus, the water vapour can condense on the surface of the brick chimney flue in the lower part; thus, condensation is considered to be the source of the water causing the salt damage.
Condensation could also occur immediately after the boiler started because it took longer for the brick surface temperature to increase than the time taken for the brick chimney flue to fill with hot exhaust gas. The fact that the brick chimney is operated intermittently every day, favors condensation. The outside surface temperature in-creased after the boiler was turned off (Figure 4); condensed water with salt can still transfer from the inside to the outside surface of the brick masonry of the chimney for hours.
7 CONCLUSION In this study, the factors affecting the salt weathering of a brick chimney were in-vestigated. From the investigation, we inferred that the components of the exhaust gas during the combustion of a boiler were the sources of water and salt causing
47
5th International SWBSS conference – Delft 2021
weathering of the brick masonry of the chimney. CFD analysis showed the temper-ature distribution inside the brick chimney flue. The results of the calculation, showed the possibility of the occurrence of water vapour condensation at the lower part of the brick chimney, which corresponds to the weathered part of the masonry. The temperature change due to the intermittent operation of the boiler led to further water and salt supply.
In order to have a deeper understanding regarding the movement of water and salt inside the core of the brick masonry, it is necessary to further examine the temper-ature change inside the core. In future, we aim to clarify the thermal and moisture conditions that affect salt weathering, quantitatively analyse salt weathering and consider measures to control it.
ACKNOWLEDGEMENTS
This is a compilation of a master’s thesis by Mayu Sakamoto, a student (2019) in the Architectural Major, Mukogawa Women’s University. We would like to thank the owner of Higashi Sake Brewery for their cooperation in the survey, and Enago (www.enago.jp) for the English language review. This work was supported by JSPS KAKENHI Grant Number 20K04821.
REFERENCES [1] Cultural Heritage Online (accessed 1.3.2021) [online]: https://bunka.nii.ac.jp/.
[2] G. López-Patiño et al., “Causes of damage to industrial brick masonry chim-neys”, Engineering Failure Analysis, vol. 74, pp. 188–201, 2017.
[3] Kanazawa Institute of Technology, Investigation Report of Higashi-shuzoubuilding no.14.
[4] ENEOS Co., Ltd. (accessed 1.3.2021), “Heavy oil”, Oil Handbook, [online]:https://www.noe.jxtg-group. co.jp/binran/part02/chapter01/section06.html.
[5] ENEOS Co., Ltd. (accessed 1.3.2021), “Kerosene”, Oil Handbook, [online]:https://www.noe.jxtg-group. co.jp/binran/part02/chapter01/section04.html.
[6] The Japan Society of Industrial Machinery Manufacturers pdf (accessed1.3.2021), Guideline for Performance Indication of Once-through Boiler,[online]: https://www.jsim.or.jp/pdf/publication/a-1-55-00-00-00-p06.
[7] Miura Co., Ltd., Specification Sheet for Compact Once-through Boiler.
[8] Japan Meteorological Agency, Meteorological Data, (accessed 10.2019)[online]: https://www.data.jma.go. jp/gmd/risk/obsdl/index.php.
48
5th International SWBSS conference – Delft 2021
INVESTIGATING THE BEHAVIOR OF COMMON SALT MIXTURES IN STONE MATERIALS
Sebastiaan Godts1,2,3*, Michael Steiger4, Tim De Kock2, Julie Desarnaud1,5, Scott A. Orr6, Veerle Cnudde3,7, and Hilde De Clercq1
KEYWORDS Salt mixtures, common salts, salt behavior, climate, damage prediction
ABSTRACT The presence of salt mixtures in changing climatic conditions is a main cause of deterioration and loss of value of buildings and stone sculptures. Unfortunately, the behavior of salt mixtures is difficult to predict and many questions remain unan-swered [1-3]. Currently, the ECOS/RUNSALT software [4,5] is the only model capable of predicting the crystallization behavior of these complex mixtures. How-ever, as kinetics are not considered, the results can introduce error when investi-gating the realistic behavior of salts. Innovative lab experiments and assessment of case studies are carried out to better understand the behavior.
The experiments focus on salts commonly found in building materials derived from 2535 samples from 203 different monuments/sites. The investigation focusses on the following ions: Na+ , Mg2+ , K+ , Ca2+ and Cl- , NO3
- , SO42-. From the initial
statistical analysis, two main groups are identified: 1) mixtures with a high Ca2+ content (1060 samples), and 2) mixtures with a high SO4
2- content (1475 samples), respectively more and less hygroscopic mixtures. Both groups can be found in 115
1 Monuments Lab, Royal Institute for Cultural Heritage (KIK-IRPA), Brussels,
Belgium [email protected] 2 Antwerp Cultural Heritage Sciences, ARCHES, University of Antwerp, Bel-
gium 3 Department of Geology, PProGRess, Ghent University, Belgium 4 Department of Chemistry, University of Hamburg, Germany 5 Renovation & Heritage Lab, Belgium Building Research Institute (BBRI), Bel-
gium 6 Institute for Sustainable Heritage, University College London (UCL), UK 7 Department of Earth Sciences, Utrecht University, Utrecht, The Netherlands
49
5th International SWBSS conference – Delft 2021
of the 203 projects. In all samples, the presence of gypsum (soluble) is on average 3.4 wt.% (median 1.6), while 7.5% of the samples do not contain any gypsum. Furthermore, an excess of cations is typical when analyzing building material, with the majority (69.9% of all samples) attributed to the presence of calcium car-bonates. Other carbonate salts associated with an excess of sodium, potassium, or magnesium also occur in the dataset with 8.3, 4.1 and 1.4%, respectively. After applying a correction to the data by excluding an equimolar content of calcium and sulfate, and an excess of ions related to carbonates. Average results are obtained from the ECOS/RUNSALT outputs, showing common mixtures per group:
1. Calcium group: NaCl - KNO3 - Ca(NO3)2 - NaNO3 - Mg(NO3)2 - K2Cl -MgCl2
2. Sulfate group: NaCl - KNO3 - Na2SO4 - NaNO3 - MgSO4 - K2SO4
with the dominant salts of the mixtures presented in bold, excluding double salts.
In both groups NaCl is present as one of the main salts. As this salt is the most common and its properties have been widely studied, the experimental procedures for this research are defined with solutions of NaCl [6]. Subsequently, the mixtures start with the binary system Na+ - Cl- and are built up by adding one ion at a time: Ca2+, NO3
-, K+ and Mg2+ for the calcium group (1). While for the sulfate group (2) SO4
2-, NO3-, K+ and Mg2+ are added. Ending with a septenary system: Na+ - Mg2+ -
K+ - Ca2+ - Cl- - NO3- - SO4
2-, thus including gypsum and excluding carbonate.
The crystallization and dissolution behavior of relevant mixtures are studied by subjecting solutions to different rates of relative humidity (RH) changes and fixed RH just below the thermodynamically determined equilibrium (RHeq). The behav-ior is recorded via time-lapse images using a 3D-digital microscope, while the so-lution/crystals are subjected to the specific RH in a microclimate chamber. The rate of phase transitions and the formation of complex salts are recorded throughout the experiments. Salts are identified by Raman spectroscopy and XRD during and after the experiments; followed by a verification and investigation of the morphology by environmental scanning electron microscopy. The experimental results are corre-lated to the thermodynamically determined RHeq of the mixtures. The determina-tion and the verification of the critical crystallization and dissolution times at iden-tified RH will aid the understanding of salt weathering in realistic climates. Con-sequently, the results have the potential to define exact relative humidity ranges over time to limit salt crystallization and support proper conservation management plans. Case studies will be assessed to determine the applicability of the lab exper-iments to real-world scenarios.
REFERENCES [1] E. Doehne, C. A. Price, “Stone Conservation: An Overview of Current Re-
search, 2nd edition,” Getty Conservation Institute, 2010.
[2] A. Arnold and K. Zehnder, Monitoring wall paintings affected by solublesalts. The Conservation of Wall Paintings, in: Proceedings of a Symposium
50
S. Godts et al.
5th International SWBSS conference – Delft 2021
Organized by the Courtauld Institute of Art and the Getty Conservation Insti-tute, London, July 13–16, (1987), 1991.
[3] M. Steiger, A. E. Charola and K. Sterflinger, Weathering and Deterioration (chapter 4), in: Stone in architecture: Properties, durability: 5th edition. eds: S. Siegesmund and R. Snethlage, 2014.
[4] C. A. Price, editor, An Expert Chemical Model for Determining the Environ-mental Conditions Needed to Prevent Salt Damage in Porous Materials, Eu-ropean Commission Research Report No 11, Protection and Conservation of European Cultural Heritage. London: Archetype Publications, 2000.
[5] D. Bionda, RUNSALT - A graphical user interface to the ECOS thermody-namic model for the prediction of the behaviour of salt mixtures under chang-ing climate conditions, [online] at: http://science.sdf-eu.org/runsalt/ , 2005.
[6] S. Godts, S. A. Orr, J. Desarnaud, M. Steiger, K. Wilhelm, H. De Clercq, V. Cnudde and T. De Kock, NaCl-Related Weathering of Stone : The Importance of Kinetics and Salt Mixtures in Environmental Risk Assessment, Heritage Science, 2021
51

52
Laboratory investigations and experimental techniques

54
5th International SWBSS conference – Delft 2021
A NEW ACCELERATED LABORATORY TEST FOR THE ASSESSMENT OF THE DURABILITY OF MATERIALS WITH RESPECT TO SALT CRYSTALLIZATION
Barbara Lubelli1*, and RILEM TC 271-ASC members
KEYWORDS Salt weathering, test procedure, assessment methods, RILEM TC 271-ASC
ABSTRACT The RILEM Technical Committee 271-ASC was set up in 2016 with the aim of developing an improved procedure for the assessment of the durability of porous building materials, such as brick and natural stone, against salt crystallization, ac-celerating the deterioration process without significantly altering its mechanism.
The test procedure developed by the TC 271-ASC proposes a new approach to salt crystallization tests. It starts from the consideration that it is necessary to accumu-late a certain amount of salt to activate the damage. Thus salt damage can be seen as a process developing in two phases: accumulation and propagation. Based on this approach, a new salt crystallization test procedure has been defined, consisting of two phases: a first phase, in which salts are introduced in the material and accu-mulate close to the evaporation surface, followed by a second phase, in which dam-age propagates because of repeated dissolution and crystallization cycles induced by re-wetting with liquid water and by relative humidity (RH) changes.
In this paper the procedure is described and the reasons for the choices made are elucidated. The procedure has been tested on two types of limestone and, at the moment of writing, is being validated in a round robin test carried out on 9 different substrates and involving 11 laboratories. Based on the results of the round robin test, the procedure will be fine-tuned.
1 Faculty of Architecture, Delft University of Technology, Delft, the Nether-
lands, [email protected]
55
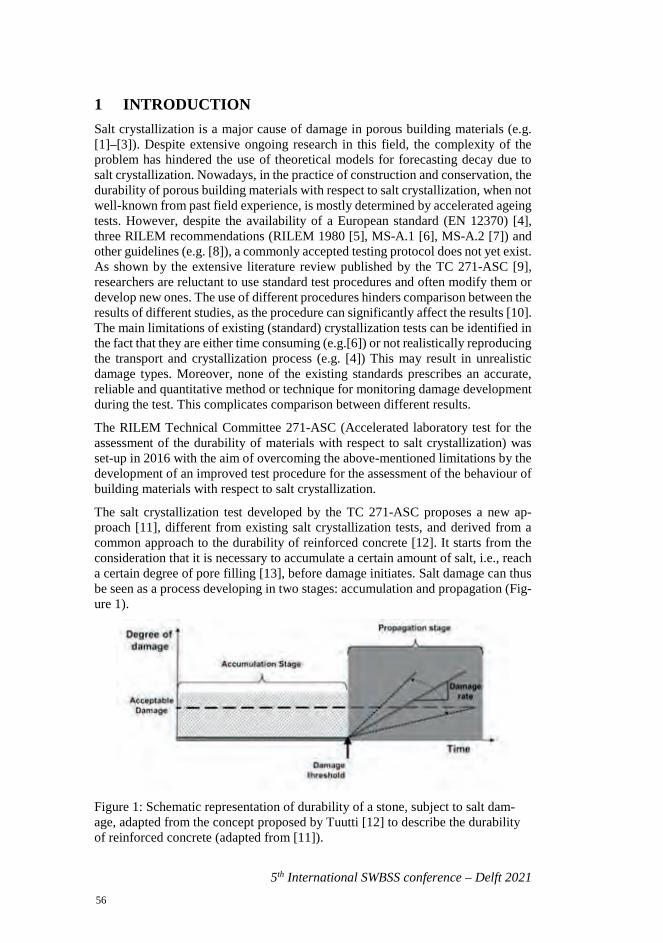
5th International SWBSS conference – Delft 2021
1 INTRODUCTION Salt crystallization is a major cause of damage in porous building materials (e.g. [1]–[3]). Despite extensive ongoing research in this field, the complexity of the problem has hindered the use of theoretical models for forecasting decay due to salt crystallization. Nowadays, in the practice of construction and conservation, the durability of porous building materials with respect to salt crystallization, when not well-known from past field experience, is mostly determined by accelerated ageing tests. However, despite the availability of a European standard (EN 12370) [4], three RILEM recommendations (RILEM 1980 [5], MS-A.1 [6], MS-A.2 [7]) and other guidelines (e.g. [8]), a commonly accepted testing protocol does not yet exist. As shown by the extensive literature review published by the TC 271-ASC [9], researchers are reluctant to use standard test procedures and often modify them or develop new ones. The use of different procedures hinders comparison between the results of different studies, as the procedure can significantly affect the results [10]. The main limitations of existing (standard) crystallization tests can be identified in the fact that they are either time consuming (e.g.[6]) or not realistically reproducing the transport and crystallization process (e.g. [4]) This may result in unrealistic damage types. Moreover, none of the existing standards prescribes an accurate, reliable and quantitative method or technique for monitoring damage development during the test. This complicates comparison between different results.
The RILEM Technical Committee 271-ASC (Accelerated laboratory test for the assessment of the durability of materials with respect to salt crystallization) was set-up in 2016 with the aim of overcoming the above-mentioned limitations by the development of an improved test procedure for the assessment of the behaviour of building materials with respect to salt crystallization.
The salt crystallization test developed by the TC 271-ASC proposes a new ap-proach [11], different from existing salt crystallization tests, and derived from a common approach to the durability of reinforced concrete [12]. It starts from the consideration that it is necessary to accumulate a certain amount of salt, i.e., reach a certain degree of pore filling [13], before damage initiates. Salt damage can thus be seen as a process developing in two stages: accumulation and propagation (Fig-ure 1).
Figure 1: Schematic representation of durability of a stone, subject to salt dam-age, adapted from the concept proposed by Tuutti [12] to describe the durability of reinforced concrete (adapted from [11]).
56
B. Lubelli, and RILEM TC 271-ASC members
5th International SWBSS conference – Delft 2021
In the past few years, an extensive experimental program has been carried out by the TC 271-ASC [14], supported by mathematical modelling of the transport and crystallization process [15]. Each variable (e.g., specimen size and number, salt content, contamination procedure, weathering cycles, assessment methods) has been the object of debate and research. The procedure has initially been tested on two types of limestone, Migné (FR) and Maastricht (NL), having very different porosity and pore size distribution [15]–[17]. At the moment of writing (Spring 2021), the procedure is being validated on nine different substrates (brick and nat-ural stones) in a round robin test involving 11 laboratories.
In the following section the draft procedure is described, and details are provided on the reasons for the various choices made (in italics).
2 TEST PROCEDURE DESCRIPTION
2.1 Scope The test procedure aims to reliably assess the durability of porous building materi-als against salt crystallization, accelerating the deterioration process without sig-nificantly altering its mechanism. Based on the results of the test, the user should be able to define a durability ranking of the different substrates with respect to salt crystallization.
The test reproduces the mechanism of salt damage triggered by capillary transport of salt solution towards the evaporative surface of a material. Damage by sea-salt spray is not considered.
The target group for the test are laboratories in the renovation and construction sectors. Therefore, feasibility has been a main requirement in the definition of the procedure; besides, assessment methods applicable without the need of sophisti-cated equipment or specialized expertise have been selected.
2.2 Salts The test procedure considers damage due to sodium sulphate and sodium chloride, both tested as single salts.
These two salts have been selected as they are very common in the field and known for causing severe damage. Moreover, these salts significantly differ in their crys-tallization behaviour: sodium sulphate can crystallize in different forms, depending on temperature and Relative Humidity (RH) and its solubility is strongly affected by temperature. In contrast, sodium chloride can only crystallize as halite, at tem-peratures higher than 0°C, and its solubility is almost not affected by temperature.
2.3 Substrates The procedure is (expected to be) suitable for brick and natural stone with an aver-age open porosity of 15 vol% and more and Water Absorption Coefficient (WAC) values between 0.05-3 kg/m2s0.5. Local heterogeneity within the samples and the average pore size distribution would require a critical view upon the results. For application on different materials (e.g., mortars) or brick and natural stones outside
57
5th International SWBSS conference – Delft 2021
the given range, as well as for combinations of materials, the procedure might re-quire adaptations.
2.4 Specimen size, shape and number The specimens consist of stone or brick cores of 50±0.5 mm diameter and 50±0.5 mm height. At least 3 specimens should be tested for each salt type and solution concentration.
This size is considered a good compromise between the need to reduce the size for speeding up the test and the necessity of specimens large enough to be representa-tive of the substrate. Besides, this size would still be feasible, when adapting the procedure to assess combinations of materials, such as brick/stone/bedding mor-tar/pointing mortar/plaster/render.
The cylindrical shape has been preferred to the prismatic one, in order to avoid corner effects (i.e., potential stress concentrations at corners). Besides, the cylin-drical shape facilitates sealing of the samples with paraffin film.
This minimum number of replicates is considered a good compromise between the requirement of taking the variation of the substrate into consideration and the ne-cessity of keeping the test feasible, in terms of time and costs.
2.5 Preparation of the specimens Cores should be drilled in such a way that minimum damage is inflicted to the substrate. Wet drilling or jet water cutting are recommended. In the case of brick, the surface usually exposed, i.e., stretcher or the header face of the brick, should preferably be the test surface. In the case of natural stone, the core drilling direction with respect to the bedding plane should be indicated in the test report. After drill-ing, brick or stone dust should be removed from the surface of the drilled cores, e.g., by the use of compressed air, water or a brush. The core specimens should bedried to constant mass in a (ventilated) oven at 40±5 °C. Constant mass is reachedwhen the difference between two successive weightings at an interval of (24±2) his ≤ 0.1%. The specimens should be sealed along their circumference with paraffinfilm, after pre-heating them in an oven at 50 °C for 10 minutes to achieve betteradherence. The paraffin film should extend ca. 0.5 cm above the top surface of thespecimens, in order to avoid that efflorescence and/or material debris, producedduring the test, would fall down. Textile tape (water resistant and water vapourtight) can be used to secure the ends of the paraffin film and ensure sealing tight-ness during the entire test.
Paraffin film has been preferred to liquid paraffin or other impermeable resins, as it does not penetrate into the pores of the material, it can be easily removed and it is almost transparent.
2.6 Weathering procedure The procedure consists of an accumulation and a propagation phase. The accumu-lation phase is identical for sodium sulphate and sodium chloride, except for the solution concentration. In contrast, the propagation phase varies depending on the salt type.
58
B. Lubelli, and RILEM TC 271-ASC members
5th International SWBSS conference – Delft 2021
The reason for the differences is that the most effective damaging conditions (i.e., re-wetting and cycles of temperature and RH) have been selected for each salt.
Accumulation phase procedure
Preparation of salt solutions
Salt solutions should be prepared using demineralized water. Solutions can be pre-pared at room temperature. The following salt solution concentrations should be prepared:
- sodium sulphate: 1% and 5% (expressed as weight of Na2SO4/weight solution)
- sodium chloride: 5% and 10% (expressed as weight NaCl/weight solution)
The solution concentrations have been defined after a series of considerations sup-ported by preliminary experiments, which are summarized hereafter.
It has been decided to use fixed solution concentrations (similarly to [4], [6], [7]), instead of fixed salt content in the specimens (expressed as weight salt/dry weight of specimen), as used e.g., in [18] . A fixed salt solution concentration is more likely to reproduce the field situation (e.g., rising damp of ground water with a given salt concentration) and it simplifies the procedure.
It has been decided to use more than one salt solution concentration. As the salt content in the specimen remains constant during the test, this choice enables a bet-ter ranking of the materials according to their resistance to salt decay. Moreover, it facilitates the estimation of the risks of future decay depending on the starting salt content, supporting thereby decision-making in the field of building conserva-tion. The concentrations of the solution have been defined taking into account the following requirements:
- High but still realistic salt content in the material. Based on field data, the max-imum salt content has been indicatively defined as 3% (weigh salt/weight spec-imen);
- Realistic salt content but still high enough to cause damage. Based on data from previous experience [18], [19] and preliminary tests [14], minimum salt contents of about 0.5% and 1% (weight salt/dry weight specimen) have been defined for sodium sulphate and sodium chloride, respectively.
- Use of salt solution concentrations far from the saturation, in order to avoid immediate salt precipitation in the pores during contamination and favour salt transport and accumulation close to the evaporation surface.
Contamination procedure
Before contamination, the specimen mass is stabilized for 4 hours at room condi-tions (22 ± 2 °C / 45 ± 15% RH). Contamination with salt solution occurs via ca-pillary absorption through the bottom surface of the specimen, i.e., through the sur-face opposite to the evaporative surface.
The contamination procedure has been selected after testing different contamina-tion procedures, shown schematically in Figure 2: 1) contamination from the top surface obtained by dissolution of the salt by hygroscopic adsorption, followed by
59
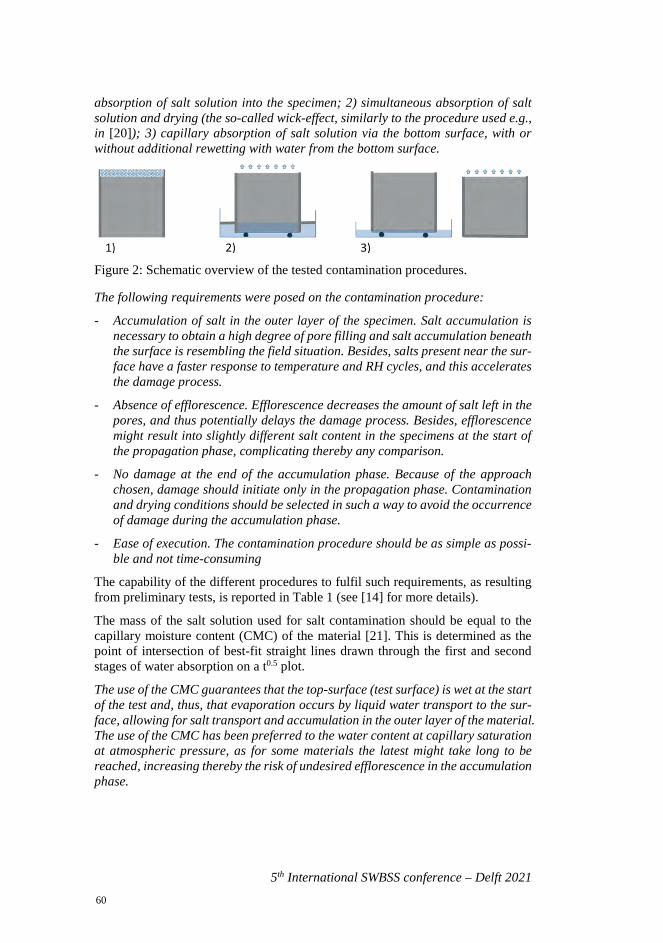
5th International SWBSS conference – Delft 2021
absorption of salt solution into the specimen; 2) simultaneous absorption of salt solution and drying (the so-called wick-effect, similarly to the procedure used e.g., in [20]); 3) capillary absorption of salt solution via the bottom surface, with or without additional rewetting with water from the bottom surface.
Figure 2: Schematic overview of the tested contamination procedures.
The following requirements were posed on the contamination procedure:
- Accumulation of salt in the outer layer of the specimen. Salt accumulation isnecessary to obtain a high degree of pore filling and salt accumulation beneaththe surface is resembling the field situation. Besides, salts present near the sur-face have a faster response to temperature and RH cycles, and this acceleratesthe damage process.
- Absence of efflorescence. Efflorescence decreases the amount of salt left in thepores, and thus potentially delays the damage process. Besides, efflorescencemight result into slightly different salt content in the specimens at the start ofthe propagation phase, complicating thereby any comparison.
- No damage at the end of the accumulation phase. Because of the approachchosen, damage should initiate only in the propagation phase. Contaminationand drying conditions should be selected in such a way to avoid the occurrenceof damage during the accumulation phase.
- Ease of execution. The contamination procedure should be as simple as possi-ble and not time-consuming
The capability of the different procedures to fulfil such requirements, as resulting from preliminary tests, is reported in Table 1 (see [14] for more details).
The mass of the salt solution used for salt contamination should be equal to the capillary moisture content (CMC) of the material [21]. This is determined as the point of intersection of best-fit straight lines drawn through the first and second stages of water absorption on a t0.5 plot.
The use of the CMC guarantees that the top-surface (test surface) is wet at the start of the test and, thus, that evaporation occurs by liquid water transport to the sur-face, allowing for salt transport and accumulation in the outer layer of the material. The use of the CMC has been preferred to the water content at capillary saturation at atmospheric pressure, as for some materials the latest might take long to be reached, increasing thereby the risk of undesired efflorescence in the accumulation phase.
60
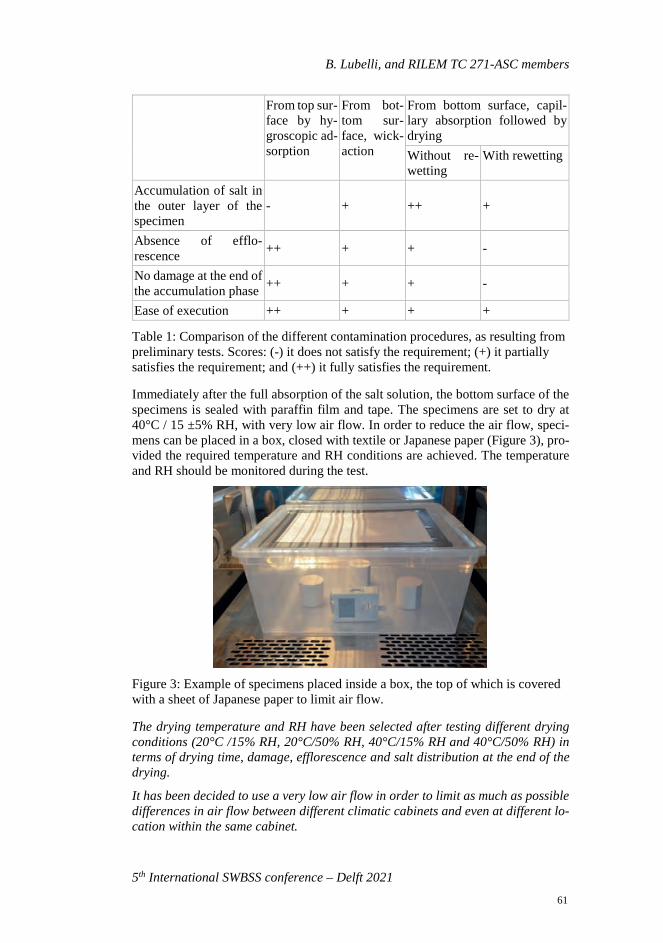
B. Lubelli, and RILEM TC 271-ASC members
5th International SWBSS conference – Delft 2021
From top sur-face by hy-groscopic ad-sorption
From bot-tom sur-face, wick-action
From bottom surface, capil-lary absorption followed by drying
Without re-wetting
With rewetting
Accumulation of salt in the outer layer of the specimen
- + ++ +
Absence of efflo-rescence ++ + + -
No damage at the end of the accumulation phase ++ + + -
Ease of execution ++ + + +
Table 1: Comparison of the different contamination procedures, as resulting from preliminary tests. Scores: (-) it does not satisfy the requirement; (+) it partially satisfies the requirement; and (++) it fully satisfies the requirement.
Immediately after the full absorption of the salt solution, the bottom surface of the specimens is sealed with paraffin film and tape. The specimens are set to dry at 40°C / 15 ±5% RH, with very low air flow. In order to reduce the air flow, speci-mens can be placed in a box, closed with textile or Japanese paper (Figure 3), pro-vided the required temperature and RH conditions are achieved. The temperature and RH should be monitored during the test.
Figure 3: Example of specimens placed inside a box, the top of which is covered with a sheet of Japanese paper to limit air flow.
The drying temperature and RH have been selected after testing different drying conditions (20°C /15% RH, 20°C/50% RH, 40°C/15% RH and 40°C/50% RH) in terms of drying time, damage, efflorescence and salt distribution at the end of the drying.
It has been decided to use a very low air flow in order to limit as much as possible differences in air flow between different climatic cabinets and even at different lo-cation within the same cabinet.
61
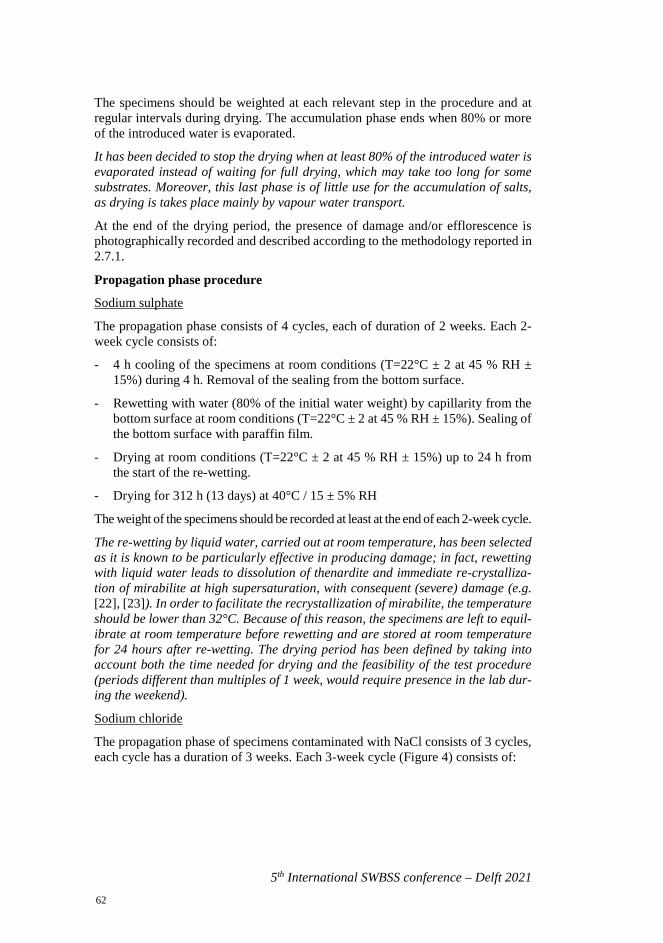
5th International SWBSS conference – Delft 2021
The specimens should be weighted at each relevant step in the procedure and at regular intervals during drying. The accumulation phase ends when 80% or more of the introduced water is evaporated.
It has been decided to stop the drying when at least 80% of the introduced water is evaporated instead of waiting for full drying, which may take too long for some substrates. Moreover, this last phase is of little use for the accumulation of salts, as drying is takes place mainly by vapour water transport.
At the end of the drying period, the presence of damage and/or efflorescence is photographically recorded and described according to the methodology reported in 2.7.1.
Propagation phase procedure
Sodium sulphate
The propagation phase consists of 4 cycles, each of duration of 2 weeks. Each 2-week cycle consists of:
- 4 h cooling of the specimens at room conditions (T=22°C ± 2 at 45 % RH ±15%) during 4 h. Removal of the sealing from the bottom surface.
- Rewetting with water (80% of the initial water weight) by capillarity from thebottom surface at room conditions (T=22°C ± 2 at 45 % RH ± 15%). Sealing ofthe bottom surface with paraffin film.
- Drying at room conditions (T=22°C ± 2 at 45 % RH ± 15%) up to 24 h fromthe start of the re-wetting.
- Drying for 312 h (13 days) at 40°C / 15 ± 5% RH
The weight of the specimens should be recorded at least at the end of each 2-week cycle.
The re-wetting by liquid water, carried out at room temperature, has been selected as it is known to be particularly effective in producing damage; in fact, rewetting with liquid water leads to dissolution of thenardite and immediate re-crystalliza-tion of mirabilite at high supersaturation, with consequent (severe) damage (e.g. [22], [23]). In order to facilitate the recrystallization of mirabilite, the temperature should be lower than 32°C. Because of this reason, the specimens are left to equil-ibrate at room temperature before rewetting and are stored at room temperature for 24 hours after re-wetting. The drying period has been defined by taking into account both the time needed for drying and the feasibility of the test procedure (periods different than multiples of 1 week, would require presence in the lab dur-ing the weekend).
Sodium chloride
The propagation phase of specimens contaminated with NaCl consists of 3 cycles, each cycle has a duration of 3 weeks. Each 3-week cycle (Figure 4) consists of:
62
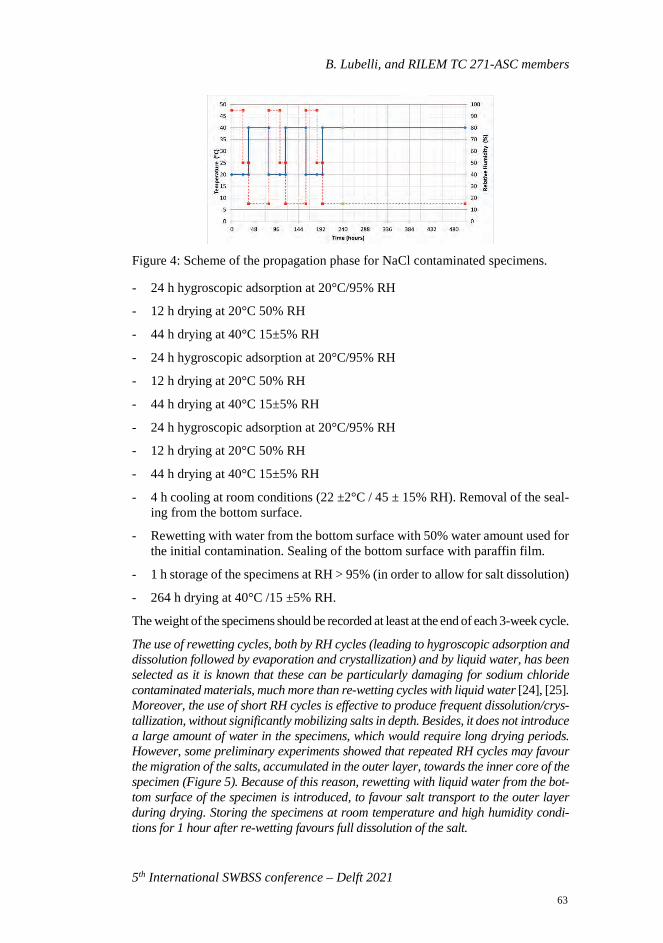
B. Lubelli, and RILEM TC 271-ASC members
5th International SWBSS conference – Delft 2021
Figure 4: Scheme of the propagation phase for NaCl contaminated specimens.
- 24 h hygroscopic adsorption at 20°C/95% RH
- 12 h drying at 20°C 50% RH
- 44 h drying at 40°C 15±5% RH
- 24 h hygroscopic adsorption at 20°C/95% RH
- 12 h drying at 20°C 50% RH
- 44 h drying at 40°C 15±5% RH
- 24 h hygroscopic adsorption at 20°C/95% RH
- 12 h drying at 20°C 50% RH
- 44 h drying at 40°C 15±5% RH
- 4 h cooling at room conditions (22 ±2°C / 45 ± 15% RH). Removal of the seal-ing from the bottom surface.
- Rewetting with water from the bottom surface with 50% water amount used for the initial contamination. Sealing of the bottom surface with paraffin film.
- 1 h storage of the specimens at RH > 95% (in order to allow for salt dissolution)
- 264 h drying at 40°C /15 ±5% RH.
The weight of the specimens should be recorded at least at the end of each 3-week cycle.
The use of rewetting cycles, both by RH cycles (leading to hygroscopic adsorption and dissolution followed by evaporation and crystallization) and by liquid water, has been selected as it is known that these can be particularly damaging for sodium chloride contaminated materials, much more than re-wetting cycles with liquid water [24], [25]. Moreover, the use of short RH cycles is effective to produce frequent dissolution/crys-tallization, without significantly mobilizing salts in depth. Besides, it does not introduce a large amount of water in the specimens, which would require long drying periods. However, some preliminary experiments showed that repeated RH cycles may favour the migration of the salts, accumulated in the outer layer, towards the inner core of the specimen (Figure 5). Because of this reason, rewetting with liquid water from the bot-tom surface of the specimen is introduced, to favour salt transport to the outer layer during drying. Storing the specimens at room temperature and high humidity condi-tions for 1 hour after re-wetting favours full dissolution of the salt.
63
5th International SWBSS conference – Delft 2021
Figure 5: Chloride ion distribution (measured by ion chromatography) at end of the accumulation phase and after one and two RH cycles
2.7 Test report Description of the damage
The development of the damage is assessed visually and photographically at the end of the accumulation phase and at the end of each 2- or 3-week cycle in the propagation phase. The occurrence of decay is photographically recorded. Pictures of each specimen are taken from different angles (perpendicular and with an angle of 45° with respect to the evaporation surface after each cycle, and also parallel to the surface at the end of the test, after removal of the parafilm and tape from the lateral surface). The type of damage is described according to the ICOMOS [26] and the MDCS atlases [27] and the extension and severity are evaluated according to a 4-point scale. The salt efflorescence morphology is reported as well (table 2).
This monitoring procedure has been chosen to allow for a simple but as much as possible objective assessment, which does not require special (laboratory) equip-ment and does not alter the specimens. Despite the attempt to standardize the dam-age description by the use of atlases, the assessment of the severity and extension of the damage, maintains a certain degree of subjectivity. Because of this reason, the quantification of the material loss at the end of the propagation phase is added to the procedure (see 2.7.2).
Material loss
The loss of material should be measured at the end of the propagation phase, after the drying phase of the last cycle, according to the procedure described hereafter. The surface of the specimens is brushed with a soft toothbrush, after removing the paraffin film wrapping. The debris (brushed from the surface and possibly includ-ing efflorescences) is dried at 40°C for 24h. The weight of the debris is recorded (d1). The debris is put in a glass beaker with demineralized water for 24h at room conditions to dissolve the salt efflorescence. The amount of demineralized water used for dissolution should be 10 times the weight of the debris, in order to ensure full dissolution of the salts. The solution is filtered using a filter paper for me-dium/fast filtration. The weight of the dry filter paper is recorded (mfp). After fil-tration, the filter paper and the material left in it are dried at 40°C until constant mass and the cumulative mass (filter paper + material) is recorded (mcum). The ma-terial loss is calculated as follows:
64
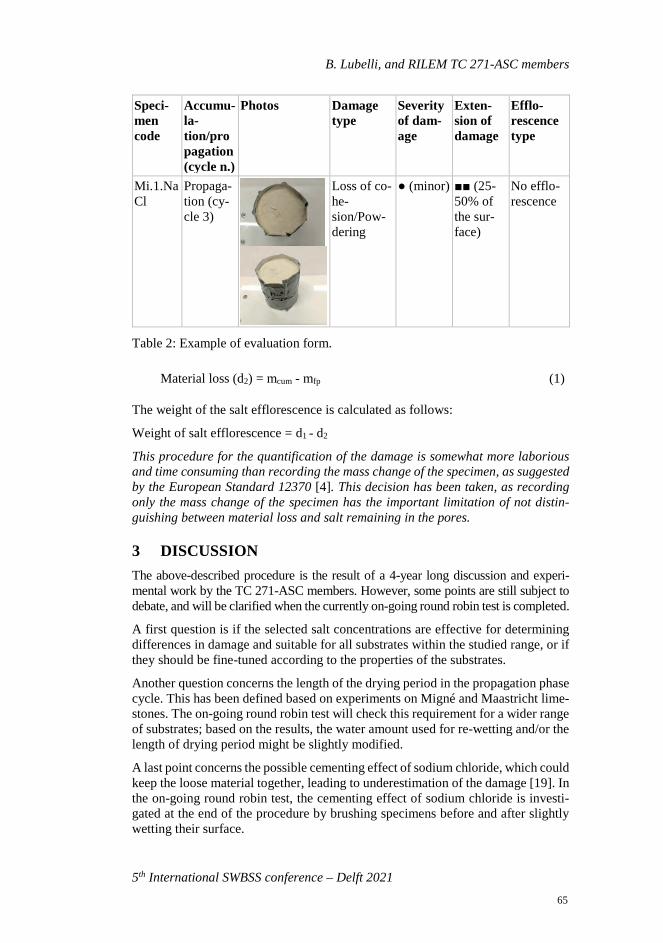
B. Lubelli, and RILEM TC 271-ASC members
5th International SWBSS conference – Delft 2021
Speci-men code
Accumu-la-tion/propagation (cycle n.)
Photos Damage type
Severity of dam-age
Exten-sion of damage
Efflo-rescence type
Mi.1.NaCl
Propaga-tion (cy-cle 3)
Loss of co-he-sion/Pow-dering
● (minor) ■■ (25-50% of the sur-face)
No efflo-rescence
Table 2: Example of evaluation form.
Material loss (d2) = mcum - mfp (1)
The weight of the salt efflorescence is calculated as follows:
Weight of salt efflorescence = d1 - d2
This procedure for the quantification of the damage is somewhat more laborious and time consuming than recording the mass change of the specimen, as suggested by the European Standard 12370 [4]. This decision has been taken, as recording only the mass change of the specimen has the important limitation of not distin-guishing between material loss and salt remaining in the pores.
3 DISCUSSION The above-described procedure is the result of a 4-year long discussion and experi-mental work by the TC 271-ASC members. However, some points are still subject to debate, and will be clarified when the currently on-going round robin test is completed.
A first question is if the selected salt concentrations are effective for determining differences in damage and suitable for all substrates within the studied range, or if they should be fine-tuned according to the properties of the substrates.
Another question concerns the length of the drying period in the propagation phase cycle. This has been defined based on experiments on Migné and Maastricht lime-stones. The on-going round robin test will check this requirement for a wider range of substrates; based on the results, the water amount used for re-wetting and/or the length of drying period might be slightly modified.
A last point concerns the possible cementing effect of sodium chloride, which could keep the loose material together, leading to underestimation of the damage [19]. In the on-going round robin test, the cementing effect of sodium chloride is investi-gated at the end of the procedure by brushing specimens before and after slightly wetting their surface.
65
5th International SWBSS conference – Delft 2021
4 CONCLUSIONS In this paper a new procedure for the assessment of the behaviour of porous build-ing materials, such as brick and natural stone, under the influence of salt crystalli-zation is described, aiming at overcoming (some of) the limitations of existing (standard) crystallization tests. This procedure consists of two phases: a first phase, in which salts are introduced in the material and accumulate close to the evapora-tion surface, and a second phase, in which damage propagates because of repeated dissolution and crystallization cycles, induced by re-wetting with liquid water and by RH changes.
The procedure has been developed and tested as effective on two substrates. At this moment, the procedure is being tested on 9 substrates in a round robin test involv-ing 11 laboratories. Based on the results of the round-robin, the procedure will be fine-tuned. The TC 271-ASC expects to publish the procedure in 2022.
REFERENCES [1] A. Goudie and H. Viles, Salt weathering hazards. wiley, 1997.
[2] A. E. Charola and C. Bläuer, “Salts in Masonry: An Overview of the Problem,”Restor. Build. Monum., vol. 21, no. 4–6, pp. 119–135, 2015
[3] E. Doehne, “Salt Weathering: A Selective Review,” Nat. Stone, Weather.Phenomena, Conserv. Strateg. Case Stud., vol. 205, no. Flatt, pp. 51–64, 2001
[4] CEN, “EN 12370 -Natural stone test methods - Determination of resistanceto salt crystallization,” 1999.
[5] RILEM TC 25-PEM, “Recommended tests to measure the deterioration ofstone and to assess the effectiveness of treatment methods.” 1980.
[6] RILEM TC 127-MS, “MS-A.1 Determination of the resistance of wallettesagainst sulphates and chlorides,” Mater. Struct., vol. 31, no. 1, pp. 2–9, 1998
[7] RILEM TC 127-MS, “MS-A.2 Uni-directional salt crystallization test formasonry units,” Mater. Struct., vol. 31, no. February, pp. 10–11, 1998
[8] WTA, “Merkblatt 2-9-04/D -Sanierputssysteme (Renovation mortarsystems),” 2005.
[9] B. Lubelli et al., “Towards a more effective and reliable salt crystallizationtest for porous building materials: state of the art,” Mater. Struct. Constr., vol.51, 2018
[10] D. Benavente, M. A. García Del Cura, A. Bernabéu, and S. Ordóñez,“Quantification of salt weathering in porous stones using an experimentalcontinous partial immersion method,” Eng. Geol., 2001
[11] R. J. Flatt et al., “Predicting salt damage in practice: a theoretical insight intolaboratory tests,” RILEM Tech. Lett., vol. 2, pp. 108–118, 2017
[12] K. (1982). Tuutti, “Corrosion of steel in concrete,” Stockholm, 1982.
66
B. Lubelli, and RILEM TC 271-ASC members
5th International SWBSS conference – Delft 2021
[13] R. J. Flatt, F. Caruso, A. M. A. Sanchez, and G. W. Scherer, “Chemo-mechanics of salt damage in stone.,” Nat. Commun., vol. 5, p. 4823, 2014
[14] C. Nunes et al., “Towards a more effective and reliable salt crystallisation test for porous building materials - Experimental research on salt contamination procedures and methods for assessment of the salt distribution,” Constr. Build. Mater., 298, 123862, 2021
[15] A. M. D’Altri, S. de Miranda, K. Beck, T. De Kock, and H. Derluyn, “Towards a more effective and reliable salt crystallisation test for porous building materials: predictive modelling of salt distribution,” Constr. Build. Mater.(under review)
[16] G. Borsoi et al., “Effect of solvent on nanolime transport within limestone: How to improve in-depth deposition,” Colloids Surfaces A Physicochem. Eng. Asp., vol. 497, pp. 171–181, 2016
[17] V. Cnudde, J. P. Cnudde, C. Dupuis, and P. J. S. Jacobs, “X-ray micro-CT used for the localization of water repellents and consolidants inside natural building stones,” Mater. Charact., vol. 53, no. 2–4, pp. 259–271, 2004
[18] E. De Witte, Ed., Salt Compatibility of Surface Treatments- Final report EU project SCOST ENV4-CT98-0710. 2001.
[19] B. Lubelli, “Sodium chloride damage to porous building materials,” Delft University of Technology, 2006.
[20] C. Rodriguez-Navarro and E. Doehne, “Salt Weathering : Influence of Evaporation Rate , Supersaturation and Crystallization Pattern,”, Earth Surf. Process. Landforms, vol. 24, pp. 191–209, 1999.
[21] C. Hall and W. D. Hoff, Water transport in brick, stone and concrete. Spon press, 2012.
[22] C. Rodriguez-Navarro, E. Doehne, and E. Sebastian, “How does sodium sulfate crystallize? Implications for the decay and testing of building materials,” Cem. Concr. Res., vol. 30, no. 10, pp. 1527–1534, 2000
[23] J. Desarnaud, F. Bertrand, and N. Shahidzadeh-Bonn, “Impact of the Kinetics of Salt Crystallization on Stone Damage During Rewetting/Drying and Humidity Cycling,” J. Appl. Mech., vol. 80, no. 2, p. 020911, 2013
[24] B. Lubelli and R. P. J. van Hees, “Irreversible dilation of NaCl contaminated lime-cement mortar due to crystallization cycles,” Cem. Concr. Res., vol. 36, pp. 678–687, 2006.
[25] J. Desarnaud and N. Shahidzadeh-Bonn, “Salt crystal purification by deliquescence/crystallization cycling,” Epl, vol. 95, 2011
[26] ICOMOS, ICOMOS-ISCS : Illustrated glossary on stone deterioration patterns. 2008.
[27] “MDCS Damage Atlas.” https://mdcs.monumentenkennis.nl/
67

68
5th International SWBSS conference – Delft 2021
TOWARDS A NEW SALT CRYSTALLISATION TEST: COMPARISON OF SALT CONTAMINATION PROCEDURES
Cristiana Nunes1*, Sebastiaan Godts2, Asel M. Aguilar Sanchez3, Zuzana Slížková1, and Barbara Lubelli4
KEYWORDS Crystallisation test, porous materials, salt accumulation, evaporative surface
ABSTRACT The RILEM TC 271-ASC is currently developing a new ageing test to assess the resistance of porous building materials to salt crystallisation. The new test consists of two phases: salt accumulation and damage propagation. This paper focuses on the salt accumulation phase; this phase should promote salt crystallisation close to the evaporative surface of the substrates (common situation onsite) without leading to salt efflorescence or damage. Damage should take place in the propagation phase, which is not addressed in this paper. This work compares the effectiveness of three contamination procedures for salt accumulation: P1) salt contamination by capillary absorption of salt solution, followed by drying; P2) continuous capillary absorption of salt solution; P3) placement of salt crystals on the surface of the ma-terials followed by the conditioning of the specimens at high relative humidity until complete dissolution of the salts. The results of P1 and P2 procedures presented in this paper are detailed in a separate publication, while this paper focuses on P3 procedure and compares the results. The effectiveness of each procedure has been evaluated by assessing the salt distribution in the specimen using ion chromatog-raphy and scanning electron microscopy. The results show that P3 is technically the least complicated to set up and does not entail the risk of development of salt efflorescence or damage. However, it can lead to salt migration within the speci-mens to a greater depth, hence future research is proposed to counteract this effect.
1 Institute of Theoretical and Applied Mechanics of the Czech Academy of Sci-
ences, Prague, Czech Republic, [email protected] 2 Royal Institute for Cultural Heritage, Brussels, Belgium 3 ETH Zürich, Zürich, Switzerland 4 Delft University of Technology, Delft, The Netherlands
69
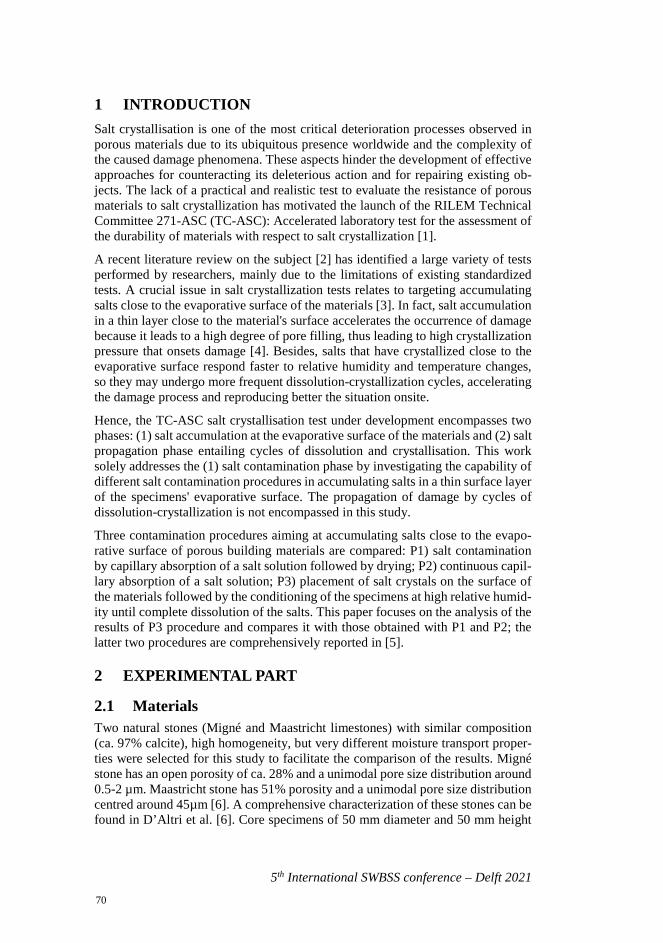
5th International SWBSS conference – Delft 2021
1 INTRODUCTION Salt crystallisation is one of the most critical deterioration processes observed in porous materials due to its ubiquitous presence worldwide and the complexity of the caused damage phenomena. These aspects hinder the development of effective approaches for counteracting its deleterious action and for repairing existing ob-jects. The lack of a practical and realistic test to evaluate the resistance of porous materials to salt crystallization has motivated the launch of the RILEM Technical Committee 271-ASC (TC-ASC): Accelerated laboratory test for the assessment of the durability of materials with respect to salt crystallization [1].
A recent literature review on the subject [2] has identified a large variety of tests performed by researchers, mainly due to the limitations of existing standardized tests. A crucial issue in salt crystallization tests relates to targeting accumulating salts close to the evaporative surface of the materials [3]. In fact, salt accumulation in a thin layer close to the material's surface accelerates the occurrence of damage because it leads to a high degree of pore filling, thus leading to high crystallization pressure that onsets damage [4]. Besides, salts that have crystallized close to the evaporative surface respond faster to relative humidity and temperature changes, so they may undergo more frequent dissolution-crystallization cycles, accelerating the damage process and reproducing better the situation onsite.
Hence, the TC-ASC salt crystallisation test under development encompasses two phases: (1) salt accumulation at the evaporative surface of the materials and (2) salt propagation phase entailing cycles of dissolution and crystallisation. This work solely addresses the (1) salt contamination phase by investigating the capability of different salt contamination procedures in accumulating salts in a thin surface layer of the specimens' evaporative surface. The propagation of damage by cycles of dissolution-crystallization is not encompassed in this study.
Three contamination procedures aiming at accumulating salts close to the evapo-rative surface of porous building materials are compared: P1) salt contamination by capillary absorption of a salt solution followed by drying; P2) continuous capil-lary absorption of a salt solution; P3) placement of salt crystals on the surface of the materials followed by the conditioning of the specimens at high relative humid-ity until complete dissolution of the salts. This paper focuses on the analysis of the results of P3 procedure and compares it with those obtained with P1 and P2; the latter two procedures are comprehensively reported in [5].
2 EXPERIMENTAL PART
2.1 Materials Two natural stones (Migné and Maastricht limestones) with similar composition (ca. 97% calcite), high homogeneity, but very different moisture transport proper-ties were selected for this study to facilitate the comparison of the results. Migné stone has an open porosity of ca. 28% and a unimodal pore size distribution around 0.5-2 µm. Maastricht stone has 51% porosity and a unimodal pore size distribution centred around 45µm [6]. A comprehensive characterization of these stones can be found in D’Altri et al. [6]. Core specimens of 50 mm diameter and 50 mm height
70
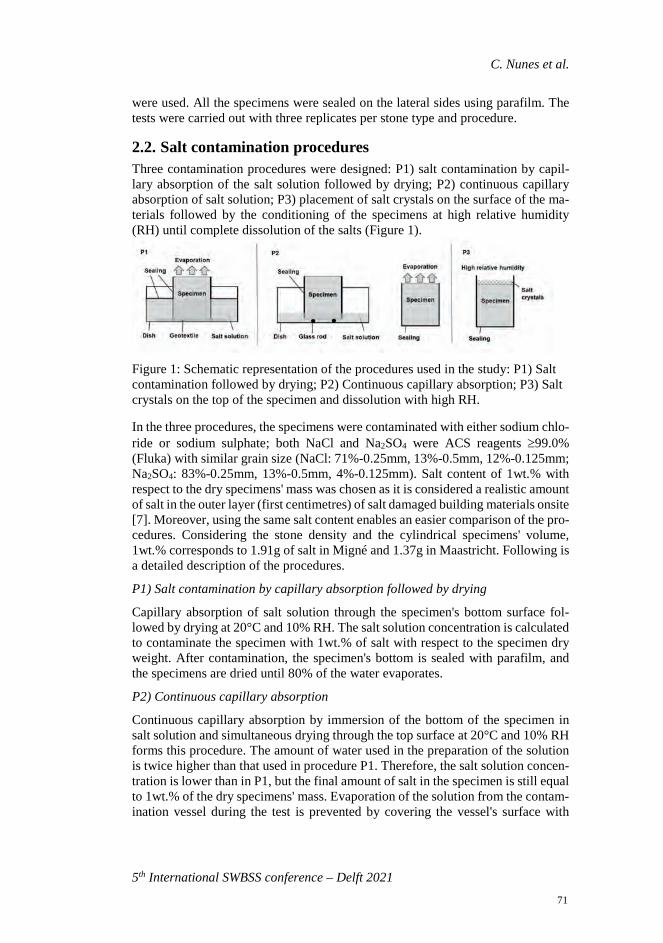
C. Nunes et al.
5th International SWBSS conference – Delft 2021
were used. All the specimens were sealed on the lateral sides using parafilm. The tests were carried out with three replicates per stone type and procedure.
2.2. Salt contamination procedures Three contamination procedures were designed: P1) salt contamination by capil-lary absorption of the salt solution followed by drying; P2) continuous capillary absorption of salt solution; P3) placement of salt crystals on the surface of the ma-terials followed by the conditioning of the specimens at high relative humidity (RH) until complete dissolution of the salts (Figure 1).
Figure 1: Schematic representation of the procedures used in the study: P1) Salt contamination followed by drying; P2) Continuous capillary absorption; P3) Salt crystals on the top of the specimen and dissolution with high RH.
In the three procedures, the specimens were contaminated with either sodium chlo-ride or sodium sulphate; both NaCl and Na2SO4 were ACS reagents ≥99.0% (Fluka) with similar grain size (NaCl: 71%-0.25mm, 13%-0.5mm, 12%-0.125mm; Na2SO4: 83%-0.25mm, 13%-0.5mm, 4%-0.125mm). Salt content of 1wt.% with respect to the dry specimens' mass was chosen as it is considered a realistic amount of salt in the outer layer (first centimetres) of salt damaged building materials onsite [7]. Moreover, using the same salt content enables an easier comparison of the pro-cedures. Considering the stone density and the cylindrical specimens' volume, 1wt.% corresponds to 1.91g of salt in Migné and 1.37g in Maastricht. Following is a detailed description of the procedures.
P1) Salt contamination by capillary absorption followed by drying
Capillary absorption of salt solution through the specimen's bottom surface fol-lowed by drying at 20°C and 10% RH. The salt solution concentration is calculated to contaminate the specimen with 1wt.% of salt with respect to the specimen dry weight. After contamination, the specimen's bottom is sealed with parafilm, and the specimens are dried until 80% of the water evaporates.
P2) Continuous capillary absorption
Continuous capillary absorption by immersion of the bottom of the specimen in salt solution and simultaneous drying through the top surface at 20°C and 10% RH forms this procedure. The amount of water used in the preparation of the solution is twice higher than that used in procedure P1. Therefore, the salt solution concen-tration is lower than in P1, but the final amount of salt in the specimen is still equal to 1wt.% of the dry specimens' mass. Evaporation of the solution from the contam-ination vessel during the test is prevented by covering the vessel's surface with
71
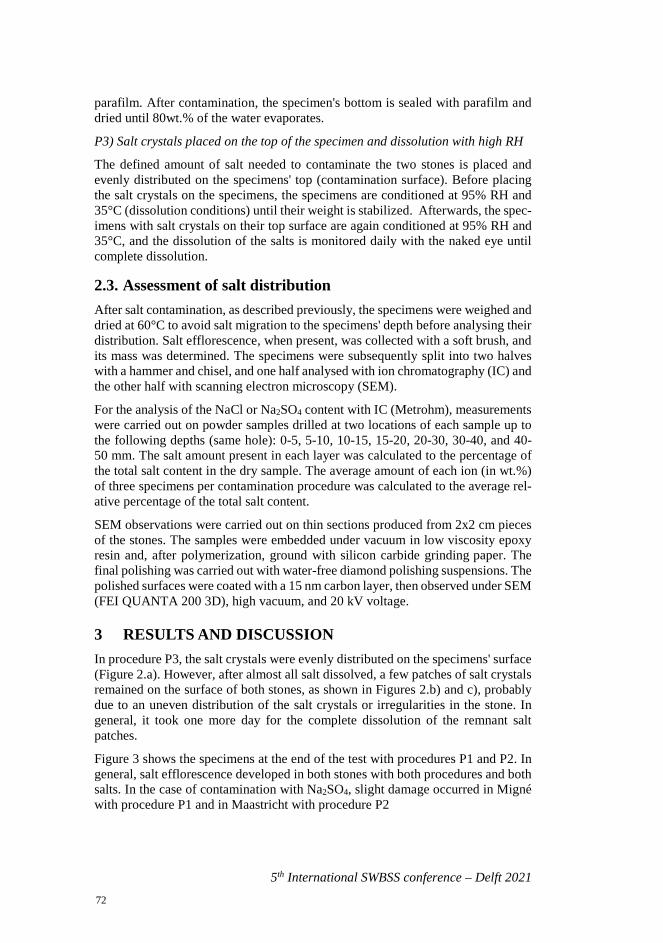
5th International SWBSS conference – Delft 2021
parafilm. After contamination, the specimen's bottom is sealed with parafilm and dried until 80wt.% of the water evaporates.
P3) Salt crystals placed on the top of the specimen and dissolution with high RH
The defined amount of salt needed to contaminate the two stones is placed and evenly distributed on the specimens' top (contamination surface). Before placing the salt crystals on the specimens, the specimens are conditioned at 95% RH and 35°C (dissolution conditions) until their weight is stabilized. Afterwards, the spec-imens with salt crystals on their top surface are again conditioned at 95% RH and 35°C, and the dissolution of the salts is monitored daily with the naked eye until complete dissolution.
2.3. Assessment of salt distribution After salt contamination, as described previously, the specimens were weighed and dried at 60°C to avoid salt migration to the specimens' depth before analysing their distribution. Salt efflorescence, when present, was collected with a soft brush, and its mass was determined. The specimens were subsequently split into two halves with a hammer and chisel, and one half analysed with ion chromatography (IC) and the other half with scanning electron microscopy (SEM).
For the analysis of the NaCl or Na2SO4 content with IC (Metrohm), measurements were carried out on powder samples drilled at two locations of each sample up to the following depths (same hole): 0-5, 5-10, 10-15, 15-20, 20-30, 30-40, and 40-50 mm. The salt amount present in each layer was calculated to the percentage of the total salt content in the dry sample. The average amount of each ion (in wt.%) of three specimens per contamination procedure was calculated to the average rel-ative percentage of the total salt content.
SEM observations were carried out on thin sections produced from 2x2 cm pieces of the stones. The samples were embedded under vacuum in low viscosity epoxy resin and, after polymerization, ground with silicon carbide grinding paper. The final polishing was carried out with water-free diamond polishing suspensions. The polished surfaces were coated with a 15 nm carbon layer, then observed under SEM (FEI QUANTA 200 3D), high vacuum, and 20 kV voltage.
3 RESULTS AND DISCUSSION In procedure P3, the salt crystals were evenly distributed on the specimens' surface (Figure 2.a). However, after almost all salt dissolved, a few patches of salt crystals remained on the surface of both stones, as shown in Figures 2.b) and c), probably due to an uneven distribution of the salt crystals or irregularities in the stone. In general, it took one more day for the complete dissolution of the remnant salt patches.
Figure 3 shows the specimens at the end of the test with procedures P1 and P2. In general, salt efflorescence developed in both stones with both procedures and both salts. In the case of contamination with Na2SO4, slight damage occurred in Migné with procedure P1 and in Maastricht with procedure P2
72
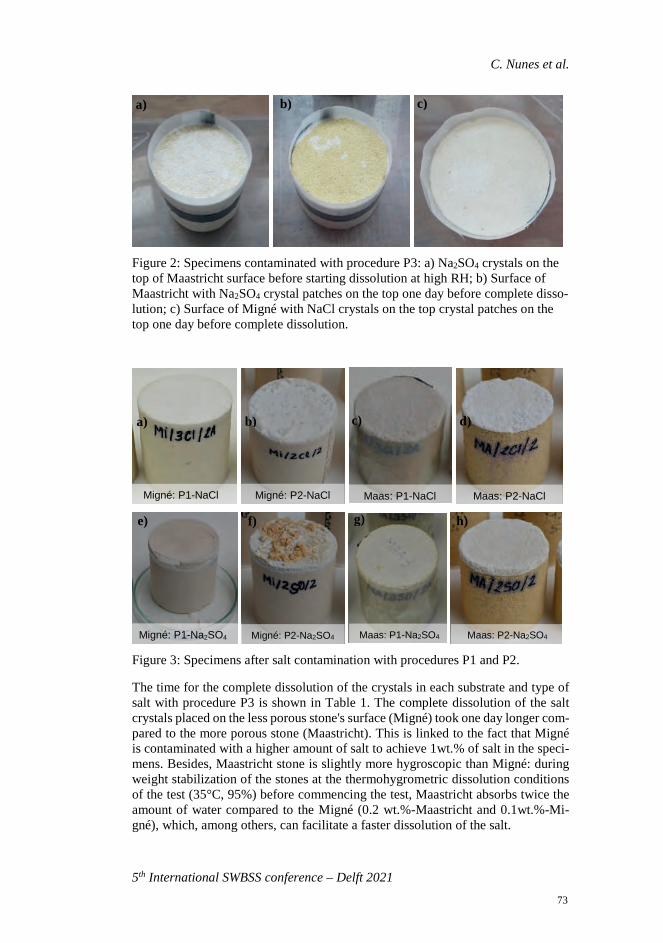
C. Nunes et al.
5th International SWBSS conference – Delft 2021
Figure 2: Specimens contaminated with procedure P3: a) Na2SO4 crystals on the top of Maastricht surface before starting dissolution at high RH; b) Surface of Maastricht with Na2SO4 crystal patches on the top one day before complete disso-lution; c) Surface of Migné with NaCl crystals on the top crystal patches on the top one day before complete dissolution.
Figure 3: Specimens after salt contamination with procedures P1 and P2.
The time for the complete dissolution of the crystals in each substrate and type of salt with procedure P3 is shown in Table 1. The complete dissolution of the salt crystals placed on the less porous stone's surface (Migné) took one day longer com-pared to the more porous stone (Maastricht). This is linked to the fact that Migné is contaminated with a higher amount of salt to achieve 1wt.% of salt in the speci-mens. Besides, Maastricht stone is slightly more hygroscopic than Migné: during weight stabilization of the stones at the thermohygrometric dissolution conditions of the test (35°C, 95%) before commencing the test, Maastricht absorbs twice the amount of water compared to the Migné (0.2 wt.%-Maastricht and 0.1wt.%-Mi-gné), which, among others, can facilitate a faster dissolution of the salt.
a) b) c) d)
e) f) g) h)
Migné: P2-NaCl Maas: P2-NaCl Maas: P1-NaCl Migné: P1-NaCl
Migné: P1-Na2SO4 Migné: P2-Na2SO4 Maas: P2-Na2SO4 Maas: P1-Na2SO4
a) b) c)
73
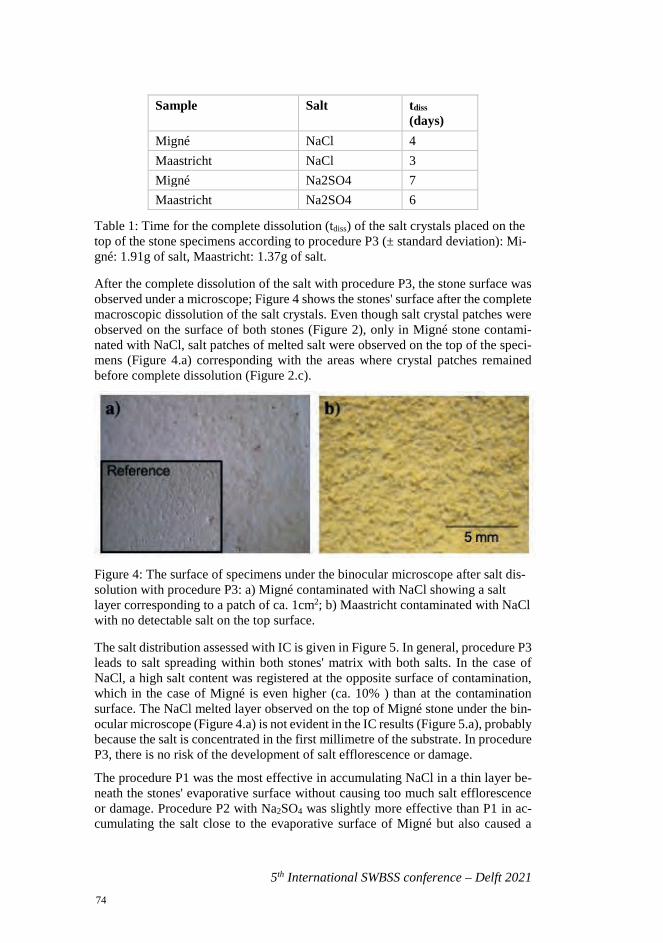
5th International SWBSS conference – Delft 2021
Sample Salt tdiss (days)
Migné NaCl 4 Maastricht NaCl 3 Migné Na2SO4 7 Maastricht Na2SO4 6
Table 1: Time for the complete dissolution (tdiss) of the salt crystals placed on the top of the stone specimens according to procedure P3 (± standard deviation): Mi-gné: 1.91g of salt, Maastricht: 1.37g of salt.
After the complete dissolution of the salt with procedure P3, the stone surface was observed under a microscope; Figure 4 shows the stones' surface after the complete macroscopic dissolution of the salt crystals. Even though salt crystal patches were observed on the surface of both stones (Figure 2), only in Migné stone contami-nated with NaCl, salt patches of melted salt were observed on the top of the speci-mens (Figure 4.a) corresponding with the areas where crystal patches remained before complete dissolution (Figure 2.c).
Figure 4: The surface of specimens under the binocular microscope after salt dis-solution with procedure P3: a) Migné contaminated with NaCl showing a salt layer corresponding to a patch of ca. 1cm2; b) Maastricht contaminated with NaCl with no detectable salt on the top surface.
The salt distribution assessed with IC is given in Figure 5. In general, procedure P3 leads to salt spreading within both stones' matrix with both salts. In the case of NaCl, a high salt content was registered at the opposite surface of contamination, which in the case of Migné is even higher (ca. 10% ) than at the contamination surface. The NaCl melted layer observed on the top of Migné stone under the bin-ocular microscope (Figure 4.a) is not evident in the IC results (Figure 5.a), probably because the salt is concentrated in the first millimetre of the substrate. In procedure P3, there is no risk of the development of salt efflorescence or damage.
The procedure P1 was the most effective in accumulating NaCl in a thin layer be-neath the stones' evaporative surface without causing too much salt efflorescence or damage. Procedure P2 with Na2SO4 was slightly more effective than P1 in ac-cumulating the salt close to the evaporative surface of Migné but also caused a
74
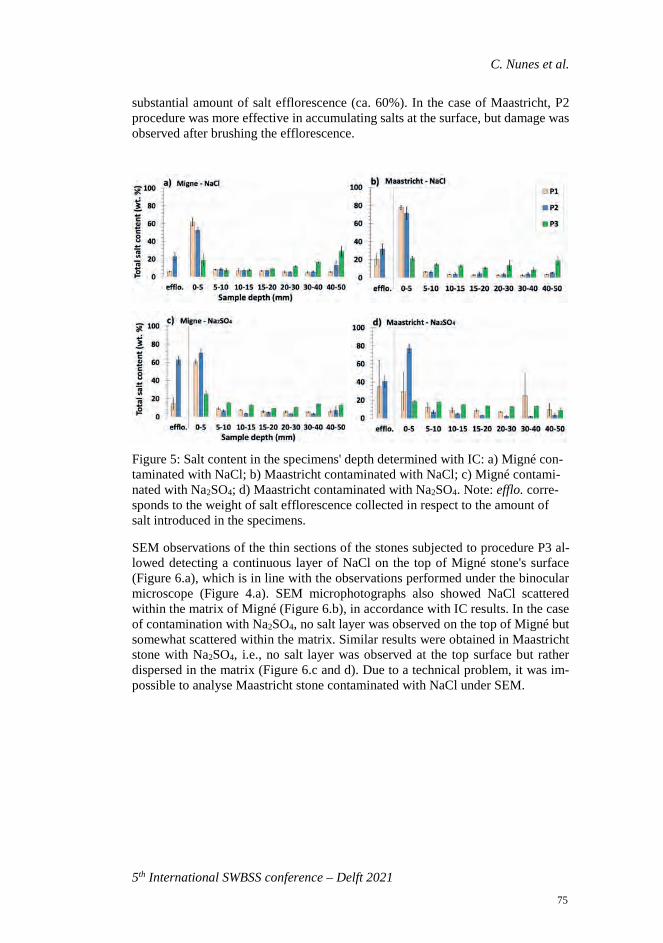
C. Nunes et al.
5th International SWBSS conference – Delft 2021
substantial amount of salt efflorescence (ca. 60%). In the case of Maastricht, P2 procedure was more effective in accumulating salts at the surface, but damage was observed after brushing the efflorescence.
Figure 5: Salt content in the specimens' depth determined with IC: a) Migné con-taminated with NaCl; b) Maastricht contaminated with NaCl; c) Migné contami-nated with Na2SO4; d) Maastricht contaminated with Na2SO4. Note: efflo. corre-sponds to the weight of salt efflorescence collected in respect to the amount of salt introduced in the specimens.
SEM observations of the thin sections of the stones subjected to procedure P3 al-lowed detecting a continuous layer of NaCl on the top of Migné stone's surface (Figure 6.a), which is in line with the observations performed under the binocular microscope (Figure 4.a). SEM microphotographs also showed NaCl scattered within the matrix of Migné (Figure 6.b), in accordance with IC results. In the case of contamination with Na2SO4, no salt layer was observed on the top of Migné but somewhat scattered within the matrix. Similar results were obtained in Maastricht stone with Na2SO4, i.e., no salt layer was observed at the top surface but rather dispersed in the matrix (Figure 6.c and d). Due to a technical problem, it was im-possible to analyse Maastricht stone contaminated with NaCl under SEM.
75
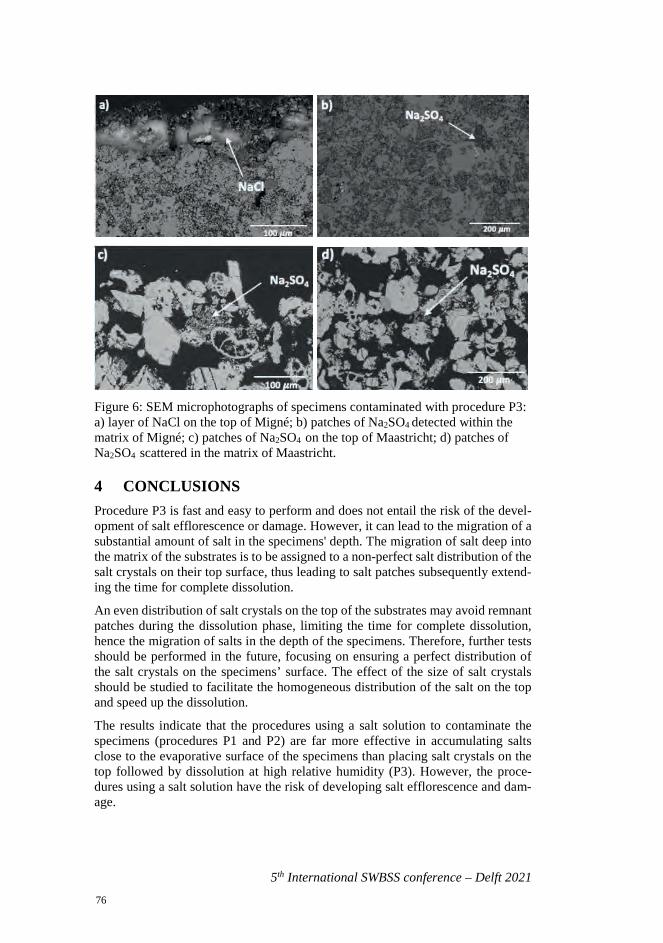
5th International SWBSS conference – Delft 2021
Figure 6: SEM microphotographs of specimens contaminated with procedure P3: a) layer of NaCl on the top of Migné; b) patches of Na2SO4 detected within thematrix of Migné; c) patches of Na2SO4 on the top of Maastricht; d) patches ofNa2SO4 scattered in the matrix of Maastricht.
4 CONCLUSIONS Procedure P3 is fast and easy to perform and does not entail the risk of the devel-opment of salt efflorescence or damage. However, it can lead to the migration of a substantial amount of salt in the specimens' depth. The migration of salt deep into the matrix of the substrates is to be assigned to a non-perfect salt distribution of the salt crystals on their top surface, thus leading to salt patches subsequently extend-ing the time for complete dissolution.
An even distribution of salt crystals on the top of the substrates may avoid remnant patches during the dissolution phase, limiting the time for complete dissolution, hence the migration of salts in the depth of the specimens. Therefore, further tests should be performed in the future, focusing on ensuring a perfect distribution of the salt crystals on the specimens’ surface. The effect of the size of salt crystals should be studied to facilitate the homogeneous distribution of the salt on the top and speed up the dissolution.
The results indicate that the procedures using a salt solution to contaminate the specimens (procedures P1 and P2) are far more effective in accumulating salts close to the evaporative surface of the specimens than placing salt crystals on the top followed by dissolution at high relative humidity (P3). However, the proce-dures using a salt solution have the risk of developing salt efflorescence and dam-age.
76
C. Nunes et al.
5th International SWBSS conference – Delft 2021
ACKNOWLEDGEMENTS All authors are thankful to all the other RILEM TC ASC-271 members for their contribution to discussions. Z. Slížková acknowledges support from the Czech Academy of Sciences under program "Strategy AV21 – 23. City as a Laboratory of Change; Construction, Historical Heritage and Place for Safe and Quality Life".
REFERENCES [1] RILEM Technical Committee 271-ASC, [online] (retrieved on April 2021)
https://www.rilem.net/groupe/271-asc-accelerated-laboratory-test-for-the-assessment-of-the-durability-of-materials-with-respect-to-salt-crystalliza-tion-355
[2] B. Lubelli, et al., "Towards a more effective and reliable salt crystallization test for porous building materials: state of the art," Mater. Struct., vol. 51, no. 2 2019.
[3] B. Lubelli, R. P. J. van Hees, and T. G. Nijland, "Salt crystallization damage: how realistic are existing ageing tests?," in 3rd Int. conf. on Salt Weathering of Buildings and Stone Sculptures, 2014, pp. 259–273.
[4] C. Rodriguez-Navarro, E. Doehne, "Salt weathering: influence of evaporation rate, supersaturation and crystallization pattern," Earth Surf. Proc. and Land-forms, vol. 24, no. 30, pp 191-209, 1999
[5] C. Nunes, et al., "Towards a more effective and reliable salt crystallization test for porous building materials: Comparison of salt contamination proce-dures and methods for assessment of the salt distribution," Contr. Build. Ma-ter. vol. 298, 123862, 2021
[6] A.M. D'Altri, et al., "Towards a more effective and reliable salt crystallisation test for porous building materials: Predictive modelling of salt distribution, Contr. Build. Mater. (under review)
[7] S. Godts, R. Hayen, and H. De Clercq, "Common salt mixtures database: a tool to identify research needs," in 3rd Int. conf. on Salt Weathering of Build-ings and Stone Sculptures, 2014, pp 185-198.
77

78
5th International SWBSS conference – Delft 2021
COMPARATIVE ESTIMATION OF THE PORE FILLING OF SINGLE SALTS IN NATURAL STONE
Davide Gulotta1*, Sebastiaan Godts2,3, Tim De Kock 3 and Michael Steiger4
KEYWORDS Salt crystallization, pore filling, image analysis, ionic chromatography, SEM
ABSTRACT Estimating the pore filling due to salt crystallization in stones is crucial to deter-mine the potential susceptibility to damage. Considering that salts tend to follow the path of least resistance when crystallizing, the pore space needs to be filled for damage to occur. Only when such a condition is achieved, the growing crystals can exert enough pressure against the pore wall to initiate the damage. However, cal-culating the pore filling is a tedious task and often overlooked. This paper discusses the results of two methodological approaches to estimate the pore filling in Maas-tricht stone samples subjected to sodium chloride and sodium sulfate contamina-tion. The investigation is part of an ongoing technical committee developing a la-boratory test to assess the durability of porous materials to salt crystallization (RILEM Technical Committee 271-ASC). The first method exploits an image anal-ysis approach using scanning electron microscopy on polished cross-sections. The second method follows a theoretical approach based on the salt content data deter-mined by ion chromatography, the molar mass and volume of Na2SO4 (thenardite) and NaCl, the dry bulk density and open porosity of the Maastricht limestone. The deviations observed in the results from the two methods are discussed with respect to the potential methodological issues. Some possible strategies to mitigate such discrepancies are proposed.
1 Getty Conservation Institute, Science Department, Los Angeles, CA, USA,
[email protected] 2 Royal Institute for Cultural Heritage (KIK-IRPA), Science Department, Brussels, Bel-
gium / Department of Geology, PProGRess, Ghent University, Belgium 3 Antwerp Cultural Heritage Sciences, ARCHES, University of Antwerp, Belgium 4 Department of Chemistry, University of Hamburg, Germany
79
5th International SWBSS conference – Delft 2021
1 INTRODUCTION Salt crystallization damage is undoubtedly recognized as a major source of decay of building materials and built heritage structures [1, 2]. Understanding the salt distribution within the stone substrates and, particularly, the salt-induced pore fill-ing effects is crucial to determine the potential for crystallization damage. In the context of laboratory accelerated aging procedures, assessing the pore filling also provides insights into the overall salt accumulation process and, in turn, into the location where salt-induced deterioration is most likely to occur. Considering that salts tend to follow the path of least resistance when crystallizing, the pore space needs to be filled up to a critical degree and a high enough crystallization pressure must be developed to initiate the damage [3]. In such conditions, the growing crys-tals' mechanical actions confined within the pore space will result in microstruc-tural damage.
The possibility of a highly-detailed and non-destructive investigation of the salt distribution within stone substrates has been successfully explored using different approaches, including imaging and mineralogical characterization [4, 5]. However, additional work is needed to assess the potential and possible limitations in the use of techniques more readily available to conservation scientists and professionals.
This paper discusses the preliminary results of two methodological approaches to estimate pore filling in Maastricht stone samples after sodium chloride and sodium sulfate crystallization, following experimental salt accumulation procedures [6]. The investigation is part of an ongoing technical committee developing a labora-tory test to assess the durability of porous materials to salt crystallization (RILEM Technical Committee 271-ASC "Accelerated laboratory test for the assessment of the durability of materials with respect to salt crystallization"). The first method exploits an image analysis approach based on scanning electron microscopy images of polished cross-sections. The second method follows a theoretical calculation based on the salt content data determined by ion chromatography, the molar mass and volume of Na2SO4 (thenardite) and NaCl, the dry bulk density and open poros-ity of the Maastricht limestone.
2 MATERIALS AND CHARACTERIZATION METHODS
2.1 Specimens' and contamination The estimation of the pore filling was carried out on Maastricht limestone cylindri-cal specimens contaminated by capillary absorption of a NaCl or Na2SO4 solution, followed by one drying cycle at 20 or 40°C. Specimens were sealed along their side and absorption surface, to induce evaporation only through the upper surface. We estimated and compared the results of the pore filling from three different samples:
Sample Codes: Salt_drying temperature (°C)
NaCl_40 Na2SO4_40 Na2SO4_20
The salt solution concentration used for the contamination was defined according to the desired salt content in the specimen, which was 1 wt.% of its dry mass. The contamination method is further detailed in Nunes et al. [6] (see procedure P1-1S).
80
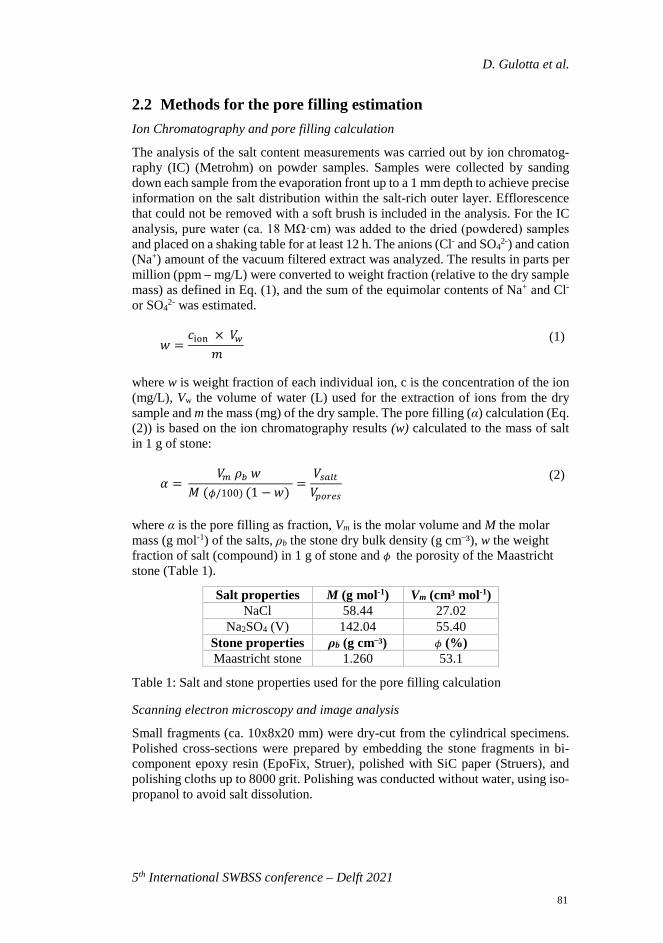
D. Gulotta et al.
5th International SWBSS conference – Delft 2021
2.2 Methods for the pore filling estimation Ion Chromatography and pore filling calculation
The analysis of the salt content measurements was carried out by ion chromatog-raphy (IC) (Metrohm) on powder samples. Samples were collected by sanding down each sample from the evaporation front up to a 1 mm depth to achieve precise information on the salt distribution within the salt-rich outer layer. Efflorescence that could not be removed with a soft brush is included in the analysis. For the IC analysis, pure water (ca. 18 MΩ·cm) was added to the dried (powdered) samples and placed on a shaking table for at least 12 h. The anions (Cl- and SO4
2-) and cation (Na+) amount of the vacuum filtered extract was analyzed. The results in parts per million (ppm – mg/L) were converted to weight fraction (relative to the dry sample mass) as defined in Eq. (1), and the sum of the equimolar contents of Na+ and Cl-
or SO42- was estimated.
𝑤𝑤 =𝑐𝑐ion × 𝑉𝑉𝑤𝑤
𝑚𝑚 (1)
where w is weight fraction of each individual ion, c is the concentration of the ion (mg/L), Vw the volume of water (L) used for the extraction of ions from the dry sample and m the mass (mg) of the dry sample. The pore filling (α) calculation (Eq. (2)) is based on the ion chromatography results (w) calculated to the mass of salt in 1 g of stone:
𝛼𝛼 = 𝑉𝑉𝑚𝑚 𝜌𝜌𝑏𝑏 𝑤𝑤
𝑀𝑀 (𝜙𝜙/100) (1 −𝑤𝑤) =
𝑉𝑉𝑠𝑠𝑠𝑠𝑠𝑠𝑠𝑠𝑉𝑉𝑝𝑝𝑝𝑝𝑝𝑝𝑝𝑝𝑠𝑠
(2)
where α is the pore filling as fraction, Vm is the molar volume and M the molar mass (g mol-1) of the salts, ρb the stone dry bulk density (g cm–³), w the weight fraction of salt (compound) in 1 g of stone and 𝜙𝜙 the porosity of the Maastricht stone (Table 1).
Salt properties M (g mol-1) Vm (cm³ mol-1) NaCl 58.44 27.02
Na2SO4 (V) 142.04 55.40 Stone properties ρb (g cm–³) 𝜙𝜙 (%) Maastricht stone 1.260 53.1
Table 1: Salt and stone properties used for the pore filling calculation
Scanning electron microscopy and image analysis
Small fragments (ca. 10x8x20 mm) were dry-cut from the cylindrical specimens. Polished cross-sections were prepared by embedding the stone fragments in bi-component epoxy resin (EpoFix, Struer), polished with SiC paper (Struers), and polishing cloths up to 8000 grit. Polishing was conducted without water, using iso-propanol to avoid salt dissolution.
81
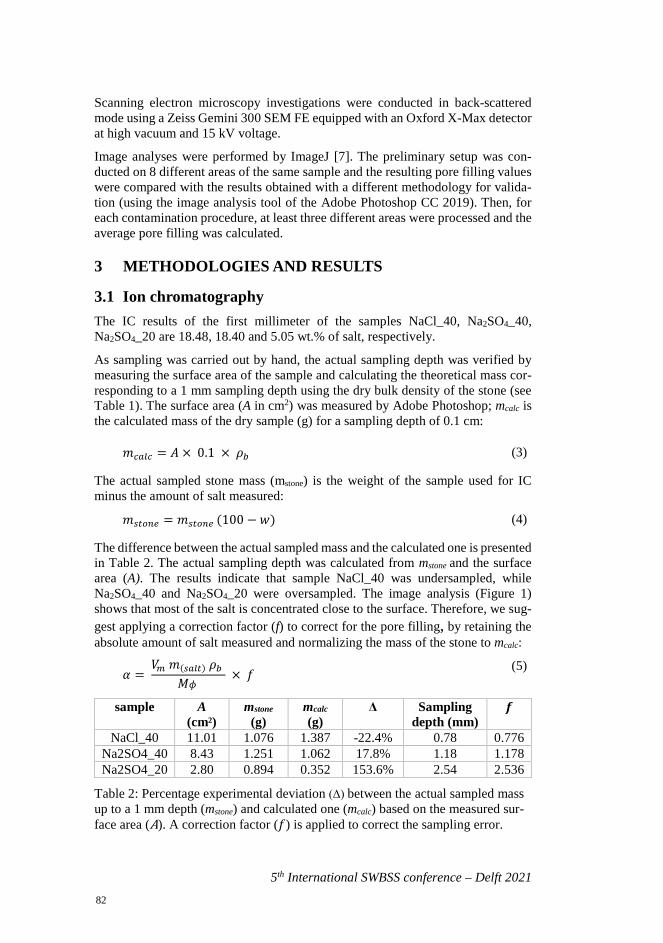
5th International SWBSS conference – Delft 2021
Scanning electron microscopy investigations were conducted in back-scattered mode using a Zeiss Gemini 300 SEM FE equipped with an Oxford X-Max detector at high vacuum and 15 kV voltage.
Image analyses were performed by ImageJ [7]. The preliminary setup was con-ducted on 8 different areas of the same sample and the resulting pore filling values were compared with the results obtained with a different methodology for valida-tion (using the image analysis tool of the Adobe Photoshop CC 2019). Then, for each contamination procedure, at least three different areas were processed and the average pore filling was calculated.
3 METHODOLOGIES AND RESULTS
3.1 Ion chromatography The IC results of the first millimeter of the samples NaCl_40, Na2SO4_40, Na2SO4_20 are 18.48, 18.40 and 5.05 wt.% of salt, respectively.
As sampling was carried out by hand, the actual sampling depth was verified by measuring the surface area of the sample and calculating the theoretical mass cor-responding to a 1 mm sampling depth using the dry bulk density of the stone (see Table 1). The surface area (A in cm2) was measured by Adobe Photoshop; mcalc is the calculated mass of the dry sample (g) for a sampling depth of 0.1 cm:
𝑚𝑚𝑐𝑐𝑠𝑠𝑠𝑠𝑐𝑐 = 𝐴𝐴 × 0.1 × 𝜌𝜌𝑏𝑏 (3)
The actual sampled stone mass (mstone) is the weight of the sample used for IC minus the amount of salt measured:
𝑚𝑚𝑠𝑠𝑠𝑠𝑝𝑝𝑠𝑠𝑝𝑝 = 𝑚𝑚𝑠𝑠𝑠𝑠𝑝𝑝𝑠𝑠𝑝𝑝 (100 − 𝑤𝑤) (4)
The difference between the actual sampled mass and the calculated one is presented in Table 2. The actual sampling depth was calculated from mstone and the surface area (A). The results indicate that sample NaCl_40 was undersampled, while Na2SO4_40 and Na2SO4_20 were oversampled. The image analysis (Figure 1) shows that most of the salt is concentrated close to the surface. Therefore, we sug-gest applying a correction factor (f) to correct for the pore filling, by retaining the absolute amount of salt measured and normalizing the mass of the stone to mcalc:
𝛼𝛼 = 𝑉𝑉𝑚𝑚 𝑚𝑚(𝑠𝑠𝑠𝑠𝑠𝑠𝑠𝑠) 𝜌𝜌𝑏𝑏
𝑀𝑀𝜙𝜙 × 𝑓𝑓
(5)
sample A (cm²)
mstone (g)
mcalc
(g) Δ Sampling
depth (mm) 𝒇𝒇
NaCl_40 11.01 1.076 1.387 -22.4% 0.78 0.776 Na2SO4_40 8.43 1.251 1.062 17.8% 1.18 1.178 Na2SO4_20 2.80 0.894 0.352 153.6% 2.54 2.536
Table 2: Percentage experimental deviation (Δ) between the actual sampled mass up to a 1 mm depth (mstone) and calculated one (mcalc) based on the measured sur-face area (A). A correction factor (𝑓𝑓) is applied to correct the sampling error.
82
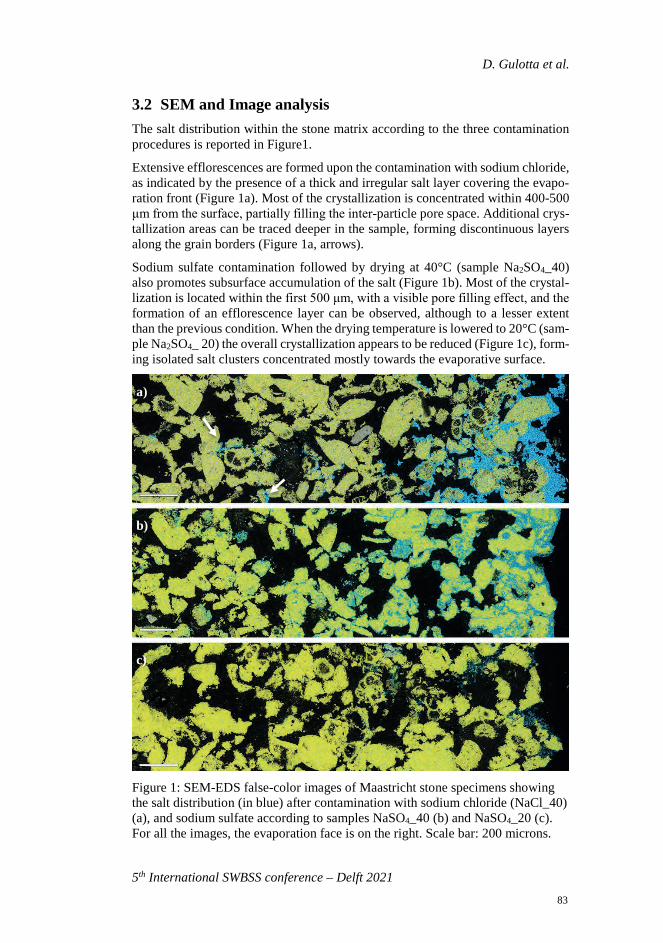
D. Gulotta et al.
5th International SWBSS conference – Delft 2021
3.2 SEM and Image analysis The salt distribution within the stone matrix according to the three contamination procedures is reported in Figure1.
Extensive efflorescences are formed upon the contamination with sodium chloride, as indicated by the presence of a thick and irregular salt layer covering the evapo-ration front (Figure 1a). Most of the crystallization is concentrated within 400-500 μm from the surface, partially filling the inter-particle pore space. Additional crys-tallization areas can be traced deeper in the sample, forming discontinuous layers along the grain borders (Figure 1a, arrows).
Sodium sulfate contamination followed by drying at 40°C (sample Na2SO4_40) also promotes subsurface accumulation of the salt (Figure 1b). Most of the crystal-lization is located within the first 500 μm, with a visible pore filling effect, and the formation of an efflorescence layer can be observed, although to a lesser extent than the previous condition. When the drying temperature is lowered to 20°C (sam-ple Na2SO4_ 20) the overall crystallization appears to be reduced (Figure 1c), form-ing isolated salt clusters concentrated mostly towards the evaporative surface.
Figure 1: SEM-EDS false-color images of Maastricht stone specimens showing the salt distribution (in blue) after contamination with sodium chloride (NaCl_40) (a), and sodium sulfate according to samples NaSO4_40 (b) and NaSO4_20 (c). For all the images, the evaporation face is on the right. Scale bar: 200 microns.
a)
b)
c)
83
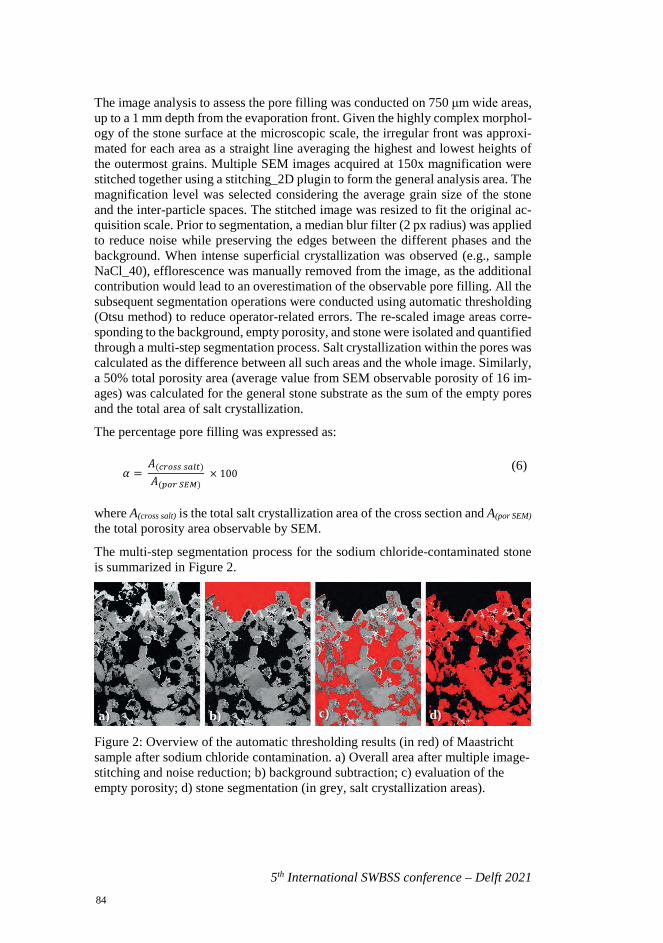
5th International SWBSS conference – Delft 2021
The image analysis to assess the pore filling was conducted on 750 μm wide areas, up to a 1 mm depth from the evaporation front. Given the highly complex morphol-ogy of the stone surface at the microscopic scale, the irregular front was approxi-mated for each area as a straight line averaging the highest and lowest heights of the outermost grains. Multiple SEM images acquired at 150x magnification were stitched together using a stitching_2D plugin to form the general analysis area. The magnification level was selected considering the average grain size of the stone and the inter-particle spaces. The stitched image was resized to fit the original ac-quisition scale. Prior to segmentation, a median blur filter (2 px radius) was applied to reduce noise while preserving the edges between the different phases and the background. When intense superficial crystallization was observed (e.g., sample NaCl_40), efflorescence was manually removed from the image, as the additional contribution would lead to an overestimation of the observable pore filling. All the subsequent segmentation operations were conducted using automatic thresholding (Otsu method) to reduce operator-related errors. The re-scaled image areas corre-sponding to the background, empty porosity, and stone were isolated and quantified through a multi-step segmentation process. Salt crystallization within the pores was calculated as the difference between all such areas and the whole image. Similarly, a 50% total porosity area (average value from SEM observable porosity of 16 im-ages) was calculated for the general stone substrate as the sum of the empty pores and the total area of salt crystallization.
The percentage pore filling was expressed as:
𝛼𝛼 =𝐴𝐴(𝑐𝑐𝑝𝑝𝑝𝑝𝑠𝑠𝑠𝑠 𝑠𝑠𝑠𝑠𝑠𝑠𝑠𝑠)
𝐴𝐴(𝑝𝑝𝑝𝑝𝑝𝑝 𝑆𝑆𝑆𝑆𝑆𝑆) × 100
(6)
where A(cross salt) is the total salt crystallization area of the cross section and A(por SEM) the total porosity area observable by SEM.
The multi-step segmentation process for the sodium chloride-contaminated stone is summarized in Figure 2.
Figure 2: Overview of the automatic thresholding results (in red) of Maastricht sample after sodium chloride contamination. a) Overall area after multiple image-stitching and noise reduction; b) background subtraction; c) evaluation of the empty porosity; d) stone segmentation (in grey, salt crystallization areas).
a) b) c) d)
84
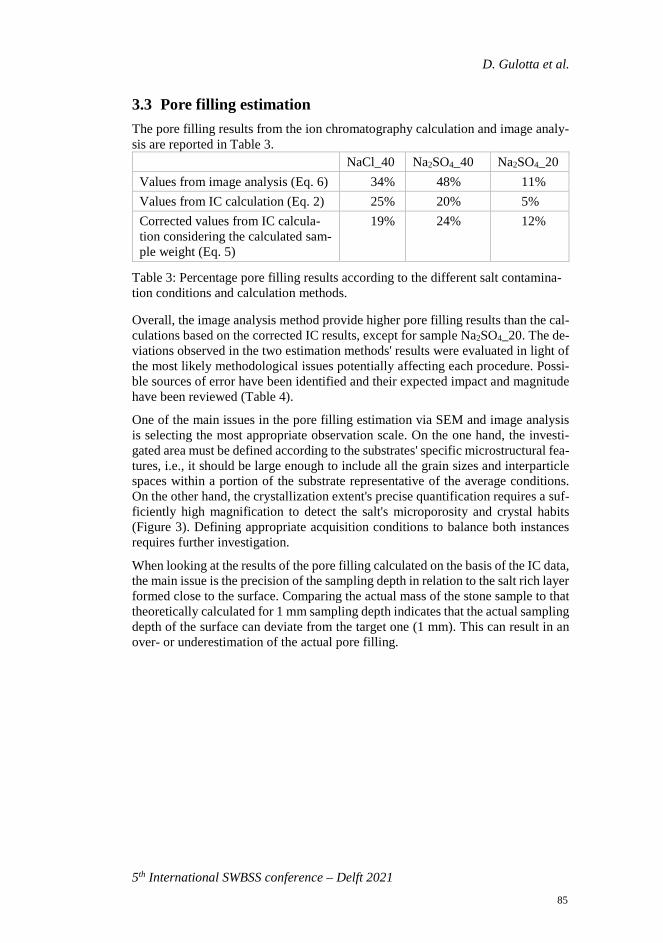
D. Gulotta et al.
5th International SWBSS conference – Delft 2021
3.3 Pore filling estimation The pore filling results from the ion chromatography calculation and image analy-sis are reported in Table 3.
NaCl_40 Na2SO4_40 Na2SO4_20 Values from image analysis (Eq. 6) 34% 48% 11% Values from IC calculation (Eq. 2) 25% 20% 5% Corrected values from IC calcula-tion considering the calculated sam-ple weight (Eq. 5)
19% 24% 12%
Table 3: Percentage pore filling results according to the different salt contamina-tion conditions and calculation methods.
Overall, the image analysis method provide higher pore filling results than the cal-culations based on the corrected IC results, except for sample Na2SO4_20. The de-viations observed in the two estimation methods' results were evaluated in light of the most likely methodological issues potentially affecting each procedure. Possi-ble sources of error have been identified and their expected impact and magnitude have been reviewed (Table 4).
One of the main issues in the pore filling estimation via SEM and image analysis is selecting the most appropriate observation scale. On the one hand, the investi-gated area must be defined according to the substrates' specific microstructural fea-tures, i.e., it should be large enough to include all the grain sizes and interparticle spaces within a portion of the substrate representative of the average conditions. On the other hand, the crystallization extent's precise quantification requires a suf-ficiently high magnification to detect the salt's microporosity and crystal habits (Figure 3). Defining appropriate acquisition conditions to balance both instances requires further investigation.
When looking at the results of the pore filling calculated on the basis of the IC data, the main issue is the precision of the sampling depth in relation to the salt rich layer formed close to the surface. Comparing the actual mass of the stone sample to that theoretically calculated for 1 mm sampling depth indicates that the actual sampling depth of the surface can deviate from the target one (1 mm). This can result in an over- or underestimation of the actual pore filling.
85

Met
hodo
logy
Po
ssib
le so
urce
of e
rror
E
xpec
ted
impa
ct
Mag
nitu
de
Imag
e an
alys
is
SEM
Fi
ne p
oros
ity b
elow
the
imag
e re
solu
tion
is n
ot
dete
cted
U
nder
estim
atio
n of
the
tota
l por
osity
M
ediu
m
Cry
stal
hab
it/m
orph
olog
y. M
icro
poro
us sa
lts
and/
or sm
all-s
ized
cry
stal
s agg
rega
tion
dete
cted
as
com
pact
clu
ster
s
Ove
rest
imat
ion
of th
e to
tal s
alt c
ryst
alliz
atio
n ar
ea
Med
ium
to
high
Sam
ple
prep
arat
ion
caus
ing
salt
redi
strib
utio
n an
d/or
com
pact
ing
effe
cts
Unc
erta
in. P
ossi
ble
alte
ratio
n of
the
tota
l sal
t cr
ysta
lliza
tion
area
Lo
w
Rem
oval
of s
urfa
ce e
fflo
resc
ence
Po
ssib
le o
pera
tor b
iase
s. R
educ
ed to
tal s
alt
cont
ent w
ith re
spec
t to
IC
Hig
h
Imag
e an
alys
is. F
ilter
s and
segm
enta
tion
met
hods
U
ncer
tain
. Pos
sibl
e in
fluen
ce o
n th
e se
gmen
ted
area
s of s
tone
and
salt
crys
talli
zatio
n Lo
w
IC c
alcu
latio
n 1-
mm
man
ual s
ampl
ing
reso
lutio
nSa
mpl
e si
zeM
ism
atch
in th
e ac
tual
sam
pled
are
a/vo
lum
e be
twee
n IC
and
SEM
. Pos
sibl
e sa
lt re
dist
ribut
ion
effe
cts c
anno
t be
excl
uded
A
smal
ler s
ampl
e si
ze a
llow
s for
mor
e er
ror
Med
ium
to
high
Ana
lytic
al m
easu
rem
ent e
rror
s U
ncer
tain
. Pos
sibl
e er
rors
in th
e to
tal s
alt c
onte
nt
Low
Im
age
anal
ysis
SE
M/IC
D
iffer
ence
s in
the
sam
pled
are
a St
one
inhe
rent
het
erog
enei
ty in
duci
ng ra
ndom
er
ror (
parti
cula
rly fo
r im
age
anal
ysis
due
to th
e re
duce
d in
vest
igat
ed a
rea
com
pare
d to
IC)
Low
Inve
stig
atio
n de
pth
Mac
ro a
lignm
ent o
f the
eva
pora
tive
surf
ace
for I
C
vs. h
igh-
reso
lutio
n on
e fo
r SEM
indu
cing
err
or
due
to d
iffer
ence
s in
the
actu
al in
vest
igat
ed a
rea
Med
ium
to
high
Gen
eral
C
ryst
alliz
atio
n-in
duce
d m
icro
stru
ctur
al d
amag
e O
vere
stim
atio
n of
the
pore
filli
ng c
alcu
late
d fr
om
IC d
ue to
the
use
of re
fere
nce
MIP
val
ues f
rom
un
alte
red
spec
imen
s
Low
Tabl
e 4:
Sum
mar
y of
the
poss
ible
met
hodo
logi
cal i
ssue
s and
ass
essm
ent o
f the
ir po
tent
ial i
mpa
ct.
86
D. Gulotta et al.
5th International SWBSS conference – Delft 2021
Figure 3: Example of the morphology and microporosity of unconfined Na2SO4 (thenardite) at 0% RH and 20°C, magnification 356, Scale bar: 10 microns (EP-SEM, Zeiss).
4 CONCLUSIONS The present work reports a preliminary assessment of the potential and limitations of two methodology for the assessment of the pore filling in Maastricht limestone due to salt crystallization. Despite the discrepancies emerged from the comparison between the two approaches, the results provide insights for the comparative eval-uation of different contamination conditions. Some possible methodological issues that might affect the calculations according to the two procedures have been iden-tified and require further investigations.
SEM image analysis combines valuable information on the actual salt distribution within the stone microstructure with the pore filling data. However, the acquisition setup, namely magnification level and related image resolution of the salt crystal-lization features, strongly affects the evaluation.
Calculating the pore filling using IC provides quantitative data over a much larger volume than the previous method. The resulting values are representative of the entire investigated volume irrespectively of the salt distribution at the microstruc-tural scale and can be influenced by the precision in the manual sampling procedure (actual sampling resolution) and the sample size.
ACKNOWLEDGEMENTS Cristiana Lara Nunes for contributing to the preparation of the specimens as part of the RILEM Technical Committee 271-ASC.
87
5th International SWBSS conference – Delft 2021
REFERENCES [1] A. Charola, "Salts in the deterioration of porous material: an overview," Jour-
nal of the American Institute for Conservation, vol. 39, no. 3, pp. 327-343,2000.
[2] S. Siegesmund and R. Snethlage, Stone in Architecture: Properties, Durabil-ity. Springer Berlin Heidelberg, 2014.
[3] H. Derluyn, P. Moonen, and J. Carmeliet, "Deformation and damage due todrying-induced salt crystallization in porous limestone," Journal of the Me-chanics and Physics of Solids, vol. 63, pp. 242-255, 2014.
[4] I. Ioannou, C. Hall, W. Hoff, V. Pugsley, and S. Jacques, "Synchrotron radi-ation energy-dispersive X-ray diffraction analysis of salt distribution inLépine limestone," The Analyst, vol. 130, pp. 1006-8, 2005.
[5] H. Derluyn, J. Dewanckele, M. N. Boone, V. Cnudde, D. Derome, and J. Car-meliet, "Crystallization of hydrated and anhydrous salts in porous limestoneresolved by synchrotron X-ray microtomography," Nuclear Instruments andMethods in Physics Research Section B: Beam Interactions with Materialsand Atoms, vol. 324, pp. 102-112, 2014.
[6] C. Nunes et al., "Towards a more effective and reliable salt crystallisation testfor porous building materials: Experimental research on salt contaminationprocedures and methods for assessment of the salt distribution " Constructionand Building Materials, vol. 298, 2021.
[7] W. S. Rasband. "ImageJ." U. S. National Institutes of Health, [online]https://imagej.nih.gov/ij
88
5th International SWBSS conference – Delft 2021
EXPERIMENTAL DETERMINATION OF SALT CONTENT IN ARTIFICIAL WEATHERED SAMPLES OF SEDIMENTARY STONES
Adele Salvi1*, and Beatriz Menendez2
KEYWORDS
Salt weathering, soluble salts, limestone, non-destructive techniques
ABSTRACT Many well-known techniques allow determine the amount of salt present in a sample, but most of them require its destruction or the extraction of the salt from the sample. In this work, we tested some Non-Destructive-Techniques in order to correlate the amount of salt in a sample with its physical properties.
Samples of four sedimentary rocks, commonly used as building stones, have been contaminated with two salts, sodium chloride and sodium sulphate, and with a mixture of both. Some of the contaminated samples have been artificially weathered. Salt contamination and weathering methodologies are based on those proposed by the RILEM Technical Committee TC 271-ASC (see Lubelli et al. paper in this conference, [1], [2]). After salt precipitation, some of the samples have been measured, and others have experienced more weathering cycles before being measured. Studied stones are Maastricht and Migné limestones, already used in previous work, and Lutetien, Savonnières and Tuffeau limestones commonly used in French monuments of Paris area and Loire valley respectively. Porosities vary from 30 to almost 50%.
Contamination and weathering procedures are presented in [1] and [2]. The goal is to obtain a non-uniform salt distribution into the specimen, similar to what is observed in real cases. In tested samples, P-wave velocity has been measured every 5 mm from the evaporation surface of the sample until 50 mm, which is the length of the sample. After that the sample has been split into two parts vertically. One half has been observed by different microscopical techniques, and from the other half, slices have been cut every 5mm. On these slices density and water vapour absorption have been determined by He-pycnometry and with a Multisample Dynamic Moisture Sorption (ProUmid GmbH & Co. KG). A good correlation exists between both parameters and the distance to the surface. We can conclude that these techniques show the highest amount of salt content close to the surface.
1 University of Bologna, Bologna, Italia [email protected] 2 CY Cergy Paris Université, France
89
5th International SWBSS conference – Delft 2021
1 INTRODUCTION Much of the world’s architectural heritage is mainly made up of carbonate rocks. Such monuments are often affected by different alteration and degradation processes mostly attributed to salt weathering. Salt weathering is considered one of the most powerful weathering agents in porous materials [3-4-5]. Salts can be naturally present in the materials used for construction (such as mortars and bricks) or can derive from external sources (capillarity-rise from the ground, rainwater, atmospheric pollution) [6]. The nature (chemical composition and mineralogical phase), abundance and location of the salts present in a building depend on the material composition, orientation and environmental parameters [7].
The mechanisms of the damaging processes by salts are still not completely clear, and different theoretical explanations have been proposed. The most accepted theory is that the crystallization pressure against the pore walls causes damage or volume variations in the salt structure during wetting and drying cycles [5-6].
Environmental conditions, mainly temperature and relative humidity, control the crystallization of salts and their different locations, at the surface or inside the stone.
Salt, once crystallized, can take up water again by contact with liquid water (dissolution) or with water vapour (deliquescence) [6]. Deliquescence will occur when the relative humidity is higher than the equilibrium relative humidity of the salt solution.
Sodium chloride has a deliquescence relative humidity (DRH) of 75.5%. In porous stone crystallization of sodium chloride in the halite form, occurs when relative humidity falls below 75.5%. Different is the situation for sodium sulphate that has a more complex crystallization-dissolution process due to its many transformation phases. It is well known that sodium sulphate is one the most aggressive salt, mainly due to its phase transitions. Phase transformations are due to wetting-drying cycles and depend on temperature changes. They may lead to crystallization or high supersaturation, and thus high crystallization pressures, being therefore very destructive [8].
When studying salt behaviour in laboratory tests, mainly single salts are used; however, in buildings salt mixtures are commonly found rather than individual salts. The mechanisms of degradation by salt mixtures are much more complex than single salt and not still completely clear. The solubility of a salt in a mixture is affected by the other salts and strongly depends on the mixture composition [8]. The deliquescence relative humidity for salt mixture solution is not just a single value, but rather a range. However, it has been observed that salt mixtures are less dangerous than single salts [9].
2 MATERIALS AND METHODS
2.1 Materials To test salt weathering behaviour in the laboratory, five limestones have been selected: Maastricht, Migné, Loire Tuffeau and Lutetian “Roche Franche”. These
90
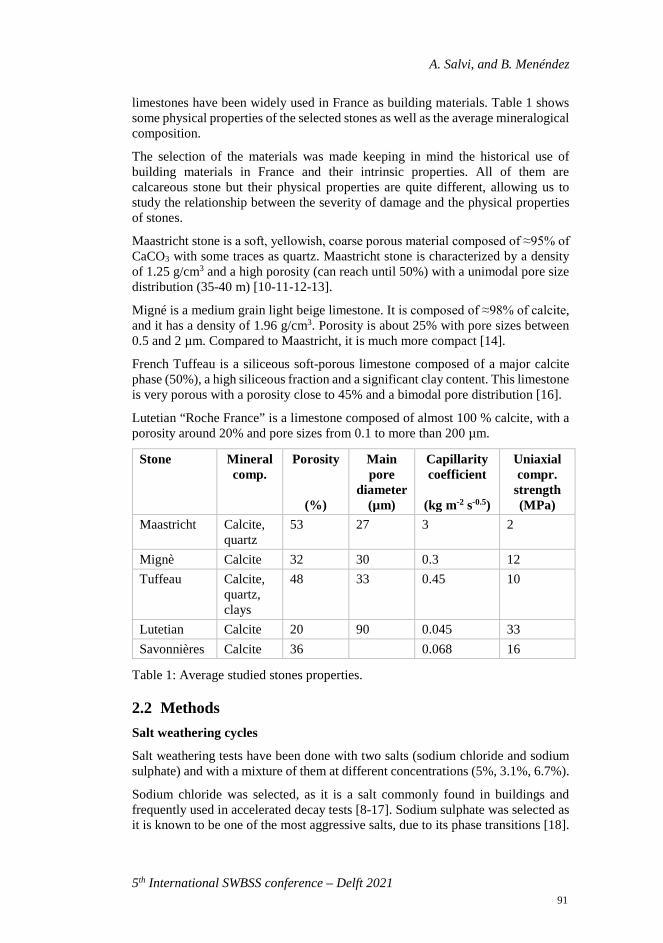
A. Salvi, and B. Menéndez
5th International SWBSS conference – Delft 2021
limestones have been widely used in France as building materials. Table 1 shows some physical properties of the selected stones as well as the average mineralogical composition.
The selection of the materials was made keeping in mind the historical use of building materials in France and their intrinsic properties. All of them are calcareous stone but their physical properties are quite different, allowing us to study the relationship between the severity of damage and the physical properties of stones.
Maastricht stone is a soft, yellowish, coarse porous material composed of ≈95% of CaCO3 with some traces as quartz. Maastricht stone is characterized by a density of 1.25 g/cm3 and a high porosity (can reach until 50%) with a unimodal pore size distribution (35-40 m) [10-11-12-13].
Migné is a medium grain light beige limestone. It is composed of ≈98% of calcite, and it has a density of 1.96 g/cm3. Porosity is about 25% with pore sizes between 0.5 and 2 µm. Compared to Maastricht, it is much more compact [14].
French Tuffeau is a siliceous soft-porous limestone composed of a major calcite phase (50%), a high siliceous fraction and a significant clay content. This limestone is very porous with a porosity close to 45% and a bimodal pore distribution [16].
Lutetian “Roche France” is a limestone composed of almost 100 % calcite, with a porosity around 20% and pore sizes from 0.1 to more than 200 µm.
Stone Mineral comp.
Porosity
(%)
Main pore
diameter (µm)
Capillarity coefficient
(kg m-2 s-0.5)
Uniaxial compr.
strength (MPa)
Maastricht Calcite, quartz
53 27 3 2
Mignè Calcite 32 30 0.3 12 Tuffeau Calcite,
quartz, clays
48 33 0.45 10
Lutetian Calcite 20 90 0.045 33 Savonnières Calcite 36 0.068 16
Table 1: Average studied stones properties.
2.2 Methods Salt weathering cycles
Salt weathering tests have been done with two salts (sodium chloride and sodium sulphate) and with a mixture of them at different concentrations (5%, 3.1%, 6.7%).
Sodium chloride was selected, as it is a salt commonly found in buildings and frequently used in accelerated decay tests [8-17]. Sodium sulphate was selected as it is known to be one of the most aggressive salts, due to its phase transitions [18].
91
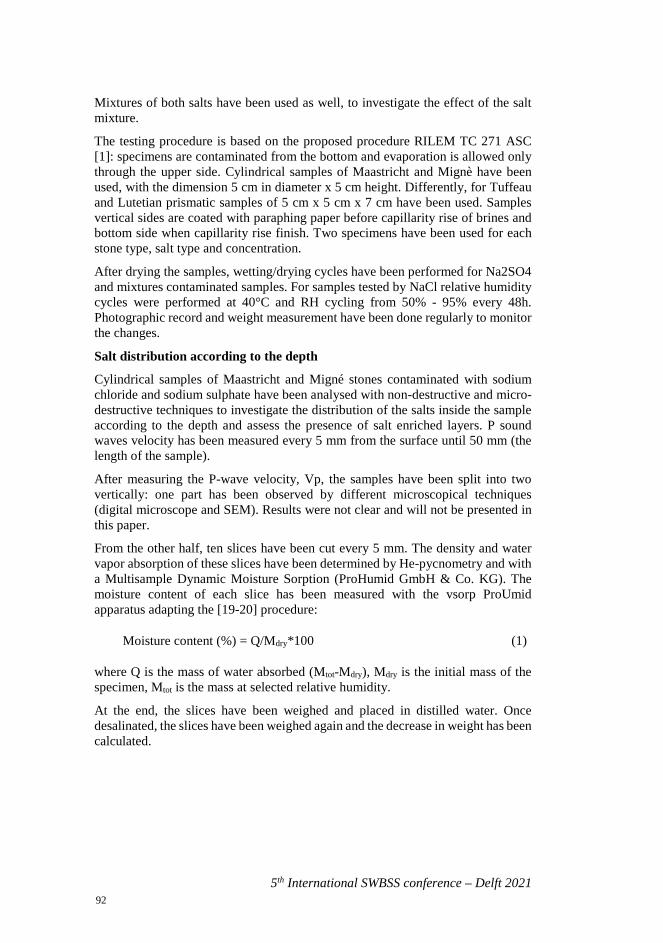
5th International SWBSS conference – Delft 2021
Mixtures of both salts have been used as well, to investigate the effect of the salt mixture.
The testing procedure is based on the proposed procedure RILEM TC 271 ASC [1]: specimens are contaminated from the bottom and evaporation is allowed only through the upper side. Cylindrical samples of Maastricht and Mignè have been used, with the dimension 5 cm in diameter x 5 cm height. Differently, for Tuffeau and Lutetian prismatic samples of 5 cm x 5 cm x 7 cm have been used. Samples vertical sides are coated with paraphing paper before capillarity rise of brines and bottom side when capillarity rise finish. Two specimens have been used for each stone type, salt type and concentration.
After drying the samples, wetting/drying cycles have been performed for Na2SO4 and mixtures contaminated samples. For samples tested by NaCl relative humidity cycles were performed at 40°C and RH cycling from 50% - 95% every 48h. Photographic record and weight measurement have been done regularly to monitor the changes.
Salt distribution according to the depth
Cylindrical samples of Maastricht and Migné stones contaminated with sodium chloride and sodium sulphate have been analysed with non-destructive and micro-destructive techniques to investigate the distribution of the salts inside the sample according to the depth and assess the presence of salt enriched layers. P sound waves velocity has been measured every 5 mm from the surface until 50 mm (the length of the sample).
After measuring the P-wave velocity, Vp, the samples have been split into two vertically: one part has been observed by different microscopical techniques (digital microscope and SEM). Results were not clear and will not be presented in this paper.
From the other half, ten slices have been cut every 5 mm. The density and water vapor absorption of these slices have been determined by He-pycnometry and with a Multisample Dynamic Moisture Sorption (ProHumid GmbH & Co. KG). The moisture content of each slice has been measured with the vsorp ProUmid apparatus adapting the [19-20] procedure:
Moisture content (%) = Q/Mdry*100 (1)
where Q is the mass of water absorbed (Mtot-Mdry), Mdry is the initial mass of the specimen, Mtot is the mass at selected relative humidity.
At the end, the slices have been weighed and placed in distilled water. Once desalinated, the slices have been weighed again and the decrease in weight has been calculated.
92
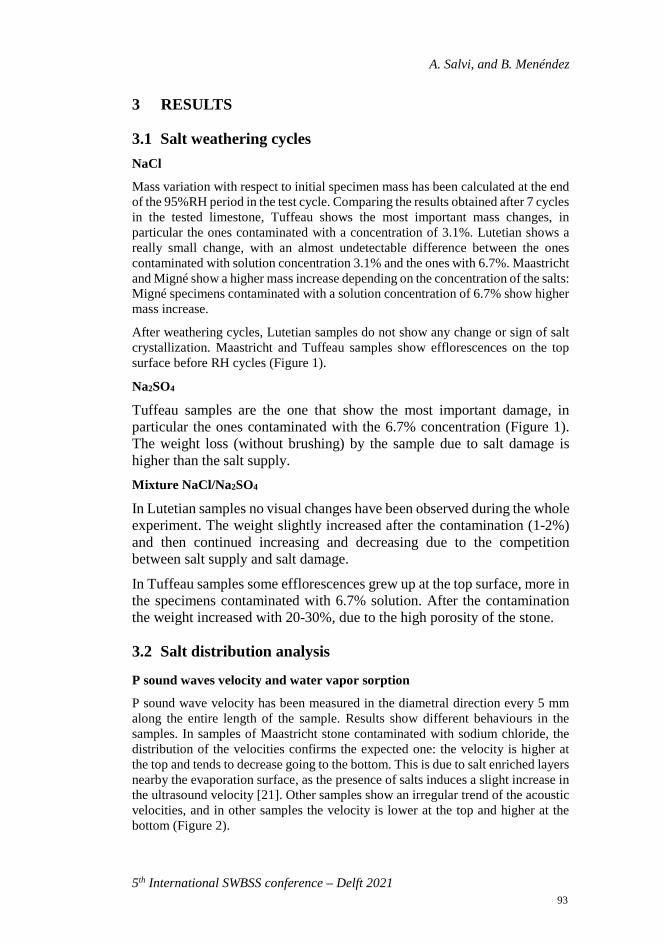
A. Salvi, and B. Menéndez
5th International SWBSS conference – Delft 2021
3 RESULTS
3.1 Salt weathering cycles NaCl
Mass variation with respect to initial specimen mass has been calculated at the end of the 95%RH period in the test cycle. Comparing the results obtained after 7 cycles in the tested limestone, Tuffeau shows the most important mass changes, in particular the ones contaminated with a concentration of 3.1%. Lutetian shows a really small change, with an almost undetectable difference between the ones contaminated with solution concentration 3.1% and the ones with 6.7%. Maastricht and Migné show a higher mass increase depending on the concentration of the salts: Migné specimens contaminated with a solution concentration of 6.7% show higher mass increase.
After weathering cycles, Lutetian samples do not show any change or sign of salt crystallization. Maastricht and Tuffeau samples show efflorescences on the top surface before RH cycles (Figure 1).
Na2SO4
Tuffeau samples are the one that show the most important damage, in particular the ones contaminated with the 6.7% concentration (Figure 1). The weight loss (without brushing) by the sample due to salt damage is higher than the salt supply. Mixture NaCl/Na2SO4
In Lutetian samples no visual changes have been observed during the whole experiment. The weight slightly increased after the contamination (1-2%) and then continued increasing and decreasing due to the competition between salt supply and salt damage.
In Tuffeau samples some efflorescences grew up at the top surface, more in the specimens contaminated with 6.7% solution. After the contamination the weight increased with 20-30%, due to the high porosity of the stone.
3.2 Salt distribution analysis
P sound waves velocity and water vapor sorption
P sound wave velocity has been measured in the diametral direction every 5 mm along the entire length of the sample. Results show different behaviours in the samples. In samples of Maastricht stone contaminated with sodium chloride, the distribution of the velocities confirms the expected one: the velocity is higher at the top and tends to decrease going to the bottom. This is due to salt enriched layers nearby the evaporation surface, as the presence of salts induces a slight increase in the ultrasound velocity [21]. Other samples show an irregular trend of the acoustic velocities, and in other samples the velocity is lower at the top and higher at the bottom (Figure 2).
93
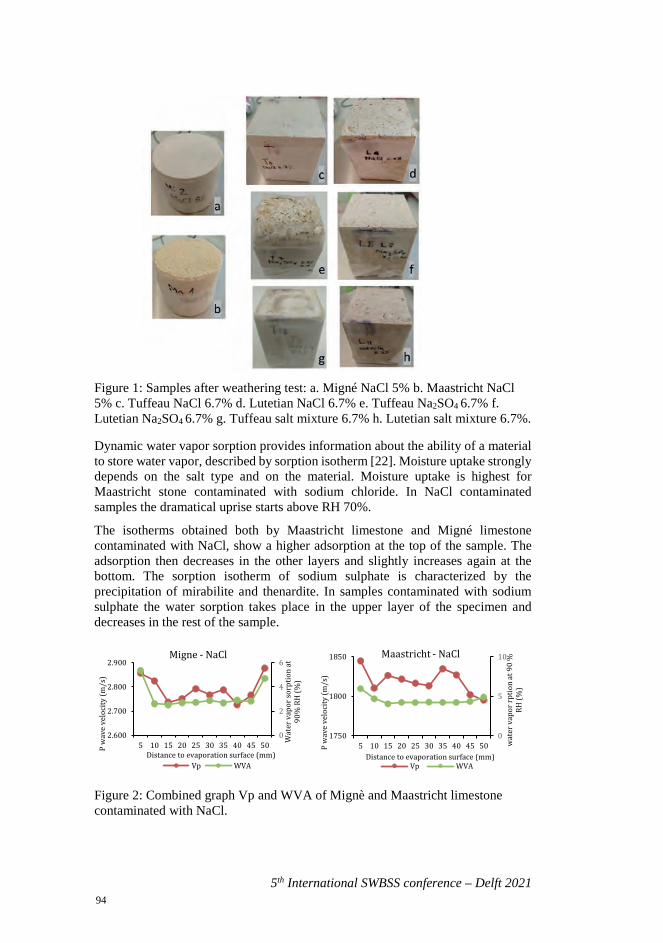
5th International SWBSS conference – Delft 2021
Figure 1: Samples after weathering test: a. Migné NaCl 5% b. Maastricht NaCl 5% c. Tuffeau NaCl 6.7% d. Lutetian NaCl 6.7% e. Tuffeau Na2SO4 6.7% f. Lutetian Na2SO4 6.7% g. Tuffeau salt mixture 6.7% h. Lutetian salt mixture 6.7%.
Dynamic water vapor sorption provides information about the ability of a material to store water vapor, described by sorption isotherm [22]. Moisture uptake strongly depends on the salt type and on the material. Moisture uptake is highest for Maastricht stone contaminated with sodium chloride. In NaCl contaminated samples the dramatical uprise starts above RH 70%.
The isotherms obtained both by Maastricht limestone and Migné limestone contaminated with NaCl, show a higher adsorption at the top of the sample. The adsorption then decreases in the other layers and slightly increases again at the bottom. The sorption isotherm of sodium sulphate is characterized by the precipitation of mirabilite and thenardite. In samples contaminated with sodium sulphate the water sorption takes place in the upper layer of the specimen and decreases in the rest of the sample.
Figure 2: Combined graph Vp and WVA of Mignè and Maastricht limestone contaminated with NaCl.
0
5
10
1750
1800
1850
5 10 15 20 25 30 35 40 45 50 wat
er v
apor
rptio
n at
90
%
RH (%
)
P w
ave
velo
city
(m/s
)
Distance to evaporation surface (mm)
Maastricht - NaCl
Vp WVA
0
2
4
6
2.600
2.700
2.800
2.900
5 10 15 20 25 30 35 40 45 50 Wat
er v
apor
sorp
tion
at
90%
RH
(%)
P w
ave
velo
city
(m/s
)
Distance to evaporation surface (mm)
Migne - NaCl
Vp WVA
94
A. Salvi, and B. Menéndez
5th International SWBSS conference – Delft 2021
Density and mass change
We compared the grain density of contaminated samples. We considered the differences in grain density between the different slices. However, the variation of density in the slices is very small and does not allow correlating the amount of salt present with the distance to the surface (Figure 3).
The variation of weight of the slices after removal of salts (by immersion in distilled water and drying), showed a quite homogeneous decrease in all the slices except those closer to the evaporation surface. This provides another proof for the presence of salts, but not a significant information to establish a different amount of them according to the depth.
Figure 3. Density variation (density slice/mean density slices) and mass loss after cleaning variation for Maastricht samples contaminated with NaCl (above) and Na2SO4 (below) solutions at 5 %.
4 DISCUSSION The four limestones showed different degree of damages depending on their intrinsic properties and on contamination salt type and concentration.
In the weathering test Tuffeau stone (stone with the higher porosity between the stones selected), showed more weight variation, crystallization and damages than the other stones. Lutetian stone, with lower porosity, is the one that showed less damage. Sodium sulphate confirmed to be more aggressive than sodium chloride, or for the mix of the two salts.
95
5th International SWBSS conference – Delft 2021
In general, we can say that the plots of the weight variation of the samples show three main behaviours, as described in [23]:
- Phase I, weight increases due to salt supply;
- Phase II, weight can increase or decrease due to a competition between saltsupply and salt damages;
- Phase III, weight decreases due to salt damages, even if the surface has not beenbrushed.
Most of the sample seems to be at the second stage, while Tuffeau samples contaminated with sodium sulphate are likely to be at the third one.
The combination of different non-destructive and micro-destructive techniques are suitable for the understanding of the distribution of salts inside the sample according to the depth. Vp and water vapor sorption results confirmed the presence of salt in relation to the depth inside the sample. He-pycnometry and weight variation results confirmed the presence of salts, but it is not possible to correlate the results with the depth.
5 CONCLUSION We performed weathering cycles on four different limestones, Tuffeau Lutetian Mignè and Maastricht with sodium sulphate, sodium chloride and a mixture of both at different concentrations. We confirmed that the severity of damage and the crystallization of the salts depends very much on the physical properties of the stone and on the salt type and concentration. The higher the porosity of the stone, the more serious the damage. Sodium sulphate confirmed to be the more aggressive than NaCl.
We analyzed some samples of Maastricht and Mignè stones contaminated with sodium chloride and sodium sulphate with different non-destructive and micro-destructive techniques to investigate the distribution of the salt inside the sample according to the depth. The techniques employed are suitable for the aim of the research. Acoustic techniques and dynamic moisture sorption techniques have demonstrated to have a good correlation with a distance to the evaporation surface, reflecting the highest amount of salt content close to the surface. We confirmed that the salt content depends on the salt type and stone properties.
REFERENCES [1] B. Lubelli et al., Towards a more effective and reliable salt crystallization test
for porous building materials: state of the art, Mater. Struct. Constr., vol. 51,2018
[2] RILEM 271-ASC, 2016, [online] accessed on 14-10-2020,https://www.rilem.net/groupe/271-asc-accelerated-laboratory-test-for-the-assessment-of-the-durability-of-materials-with-respect-to-salt-crystallization-355
96
A. Salvi, and B. Menéndez
5th International SWBSS conference – Delft 2021
[3] M. Sato, T. Hattanji, A laboratory experiment on salt weathering by humidity change: salt damage induced by deliquescence and hydratation, in Progress in Earth and Planetary Science, vol. 5, pp 84-94, 2018
[4] A.S. Goudie, H.A. Viles, Salt weathering hazard, John Wiley & Sons, Chichester, p. 1997
[5] M.F. La Russa, S.A. Ruffolo, C.M. Belfiore, P. Aloise, L. Randazzo, N. Rovella, A. Pezzino, G. Montana, Study of the effects of salt crystallization on degradation of limestone rocks, in Periodico di mineralogia, vol. 82,1, pp 113-127, 2013
[6] J. Desarnaud, F. Bertrand, N. Shahidzadeh-Bonn, Impact of the Kinetics of salt crystallization on stone damage during rewetting/drying and humidity cycling, in Journal of Applied Mechanics, vol. 80, no. 2, pp 020911, 2013
[7] B. Menendez, Estimators of the impact of Climate Change in Salt Weathering of Cultural Heritage, in Geosciences, vol. 8, pp 401, 2018
[8] R.J. Flatt, N.A. Mohamed, F. Caruso, H. Derluyn, J. Desarnaud, B. Lubelli, R.M. Espinosa-Marzal, L.Pel, C. Rodriguez-Navarro, G.W. Scherer, Predicting salt damage in practice: a theoretical insight into laboratory tests, in RILEM Technical Letters, vol. 2, pp. 108-118, 2017
[9] B. Menendez, V. Petranova, Effect of mixed Effect of mixed vs single brine composition on salt weathering in porous carbonate building stones for different environmental conditions, in Engineering geology, vol. 210, pp. 124-139, 2016
[10] R. Dreesen, M. Dusar, Historical building stones in the province of Limburg (NE Belgium): role of petrography in provenance and durability assessment, in Mater. Charact, vol. 53, pp. 273–287, 2004
[11] T.G. Nijland, C.W. Dubelaar, H.J. Tolboom, R.P.J. van Hees, Building stones from a muddy delt: native natural stone from the Netherlands, in CRC Press, Proceedings of Heritage, Weathering and Conservation Conference – HWC 2006, Madrid, June 21–24, Taylor & Francis group, London, pp. 15–21, 2006
[12] B. Lubelli, R. Van Hees, R. Veigac, A. Santos Silva, G. Borsoi, Understanding the transport of nanolime consolidants within Maastricht limestone, in Journal of cultural heritage, vol. 18, pp. 242-249, 2016
[13] C. Hall, A. Hamilton, Porosities of building limestones: using the solid density to assess data quality, in Materials and structures, vol. 49, pp. 3969-3979, 2016
[14] G. Borsoi, B. Lubelli, R. Van Hees, R. Veigac, A. Santos Silva, L. Colla, L. Fedelee, P. Tomasin, Effect of solvent on nanolime transport within limestone: How to improve in-depth deposition, in Colloids and Surfaces A: Physicochem. Eng. Aspects, vol. 497, pp. 171–181, 2016
[15] A. Al-Omari, K. Beck, X. Brunetaud, Á. Török, M. Al-Mukhta, Critical degree of saturation: A control factor of freeze–thaw damage of porous
97
5th International SWBSS conference – Delft 2021
limestones at Castle of Chambord, France, in Engineering geology, vol. 185, pp. 71-80, 2015
[16] M.A. Hassine, K. Beck, X. Brunetaud, M. Al-Mukhtar, Use of electrical resistance measurement to assess the water saturation profile in porous limestones during capillary imbibition, in Constructions and building materials, vol. 165, pp. 206-217, 2018
[17] A. La Iglesia, V. Gonzáles, V. López-Acevedo, C. Viedma, Salt crystallization in porous construction materials I: Estimation of crystallization pressure, in Journal of crystal growth, vol. 177, pp. 111-118, 1997
[18] R.M. Espinoza Marzal, G.W. Scherer, Crystallization of sodium sulfate salt in limestone, in Environmental geology, vol. 56, pp. 605-621, 2008
[19] T. Diaz Goncalves, J. Delgado Rodrigues, Evaluating the salt content of salt-contaminated simples on the basis of their hygroscopic behaviour: Part I: Fundamentals, scope and accuracy of the method, in Journal of Cultural Heritage, vol 7, pp 79-84, 2006
[20] T. Diaz Goncalves, J. Delgado Rodrigues, M.M. Mendes Abreu, Evaluating the salt content of salt-contaminated simples on the basis of their hygroscopic behaviour: Part II: Experiments with nine common soluble salts, in Journal of Cultural Heritage, vol 7, pp 193-200, 2006
[21] J. Delgado Rodriguez, Stone consolidation: Research and Practice, in Int. Symp. on Works of Art and Conservation Science Today, vol 1, pp 1-8, 2010
[22] M. Keppert, Žumár J, Čáchová M, Koňáková D, Svora P, Pavlík Z, Vejmelková E, Černý R, Water Vapor Diffusion and Adsorption of Sandstones: Influence of Rock Texture and Composition, Advances in Materials Science and Engineering, vol. 2016
[23] M. Angeli, J.P. Bigas, D. Benavente, B. Menendez, R. Hebert, C. David, Salt crystallization in pores: quantification and estimation of damage, in Environmental geology, vol. 52, pp. 205-213, 2007
98
5th International SWBSS conference – Delft 2021
BARIUM NITRATE AS A RESULT OF THE BARIUM METHOD AND POTENTIAL DAMAGE ASPECTS
Amelie Stahlbuhk1*, Michael Steiger2
KEYWORDS Salt damage, barium nitrate, wall paintings, barium method, hygroscopic salts
ABSTRACT Wall paintings represent one of the most fragile cultural treasures. Their finely po-rous and decorated surface is exposed to the environment and their support may be connected to ground or infiltration water, both making it susceptible to salts. While hygroscopic salts usually enter the pore network of objects via ground or infiltra-tion water, the formation of gypsum, which is often present as a superficial crust, is the result of acidic deposition of SO2 from the environment. Even though air pollution has decreased in recent decades, many objects are still affected by these crusts, which represent a serious risk, especially for sensitive wall paintings. The “barium method” developed in the 1960s represented a huge progress in the con-servation of wall paintings by successfully combining the removal of gypsum and the consolidation of the porous structure. However, pertinent literature describes the issue of hygroscopic, nitrate-containing pore solutions already present in the object that allow the formation of more soluble barium nitrate, if these nitrates were not effectively removed before the application of the method. Despite this warning, the actual damage potential of Ba(NO3)2 has not yet been investigated.
This study focusses on damage aspects of barium nitrate and discusses results of damage tests and considerations of the damage related behavior of Ba(NO3)2, also in hygroscopic salt mixtures. The results support the assumption that the salt poses a potential risk, which could be enhanced in mixtures with other salts. Thus, the study aims to increase the awareness of the risk of barium nitrate formation on wall paintings.
1 University of Hamburg, Institute of Applied and Inorganic Chemistry, Ham-
burg, Germany, [email protected] 2 University of Hamburg, Institute of Applied and Inorganic Chemistry, Ham-
burg, Germany
99
5th International SWBSS conference – Delft 2021
1 INTRODUCTION Wall paintings form a particularly sensitive group of the cultural heritage built of porous material. The tensile strength of the plaster layer is lower than that of other materials such as stone and brick, and the link between plaster and substrate repre-sents a highly sensitive zone, frequently resulting in detachment. Thus, this class of objects is particularly susceptible to salt weathering. Salts enter objects via a wide variety of sources, e.g. ground water, salt-containing aerosols or even con-servative treatments [1–3]. Pore solutions entering with ground water are often hy-groscopic and contain both chloride and nitrate ions. The latter can often be at-tributed to agricultural activity, organic waste or animal and human excrements. Depending on the ions present in the pore solution and on the surrounding climatic conditions, different salt phases can precipitate [4]. Of course, upon this crystal growth material damage is already possible due to an effective crystallization pres-sure Δp. It is calculated as
Δp = (RT/Vm)∙ln(a/a0), (1)
where R is the ideal gas constant, T the absolute temperature T and Vm is the molar volume. a is the activity of the supersaturated solution in contact with a growing crystal and a0 is the activity of the saturated solution at the same temperature. Thus, a/a0 represents the supersaturation S of the salt solution [5]. For the pressure to be effective S > 1 is required, which means that the salt solution has to contain more of the dissolved salt than it actually should according to thermodynamic consider-ations. Supersaturation is always required for the onset of nucleation in a salt solu-tion [6]. Apart from that, the tendency of a salt solution to supersaturate is also a measure of the damage potential of a specific salt, since, a high supersaturation at the onset of crystallization increases the probability that the supersaturation and consequently also the crystallization pressure is still high at the time the crystal reaches a pore wall.
Some nitrate salts are very hygroscopic and crystallize only at low relative humid-ity [1]. Consequently, they are usually present in dissolved form, and even if not, they can dissolve rapidly when exposed to liquid water due to a high solubility. Gypsum is almost the opposite of these highly hygroscopic salts. Due to its low solubility and high deliquescence humidity, it often accumulates in form of crusts on material surfaces. The formation of gypsum results from acidic deposition of SO2 from the environment [7]. With the decrease of air pollution in the past decades [8], the formation of new gypsum crusts became less relevant. Nevertheless, exist-ing gypsum accumulations represent a massive damage potential. Due to its low solubility, it very often fills the pores close to the surface almost completely. When water enters the gypsum-filled pores, only a small amount of the salt can dissolve. However, due to the high pore filling, this quantity is sufficient to cause damage during the subsequent recrystallization as a result of an effective crystallization pressure [9]. Especially the fragile plaster layers of wall paintings are consequently threatened by superficial gypsum accumulations.
The so-called “barium method”, introduced in the 1960s in Florence, has two ob-jectives in the conservation of wall paintings. On the one hand, gypsum is to be converted into a less soluble and therefore harmless salt, and, on the other hand,
100
A. Stahlbuhk, and M. Steiger
5th International SWBSS conference – Delft 2021
the plaster strength of already weakened objects is to be increased by formation of barely soluble minerals. For this purpose, gypsum is initially converted into cal-cium carbonate by using ammonium carbonate poultices. Highly soluble ammo-nium sulfate, which is also formed, is converted into poorly soluble barium sulfate in a second step, by means of poultices with barium hydroxide solution (a detailed description can be found in the literature [10,11]). Due to the good efficacy of the method, it is an integral and frequently used part of the conservation repertoire and effectively contributes to the preservation of valuable objects.
However, a problem described in the literature concerns the damage potential of a salt other than gypsum. If the painting substrate contains high contents of nitrate, barium nitrate, Ba(NO3)2, may form upon introduction of barium hydroxide solu-tion [12]. Then, a prior and thorough desalination of the substrate has to be per-formed to avoid this complication. Having a much lower solubility (< 0.35 mol∙kg–
1 at 20 °C, e.g. [13]) than other nitrate salts relevant to building structures, the sat-uration concentration of Ba(NO3)2 is quickly achieved, so that the salt may precip-itate in the surface near pore space where the barium ions from the poultice reach the nitrate ions enriched in the pores. Since the solubility of the salt is still higher than that of e.g. gypsum, crystallization processes of the salt may also provoke damage. Although there is an awareness of its damage potential, there are still no related systematic studies on this salt.
Hence, this work includes a discussion on a classical damage test carried out with Ba(NO3)2 as well as relevant studies on supersaturation and the influence on its properties in the presence of other ions in more hygroscopic aqueous solution by modelling phase equilibria. Thus, it is intended to contribute to raising awareness of the risk of Ba(NO3)2 formation, which has already been mentioned in the perti-nent literature, with new results and to the assessment of its damage potential.
2 EXPERIMENTAL
2.1 Damage Test A damage test was carried out with test specimens of the Sand sandstone (dimen-sions: 30 x 15 x 15 ± 2 mm3) after they had been subjected to an ion exchange with barium nitrate solution (m = 0.3 mol∙kg–1, Ba(NO3)2 p.a., Arcos Organics). Speci-mens were loaded with salt by impregnation with a saturated solution at reduced pressure. Repeated impregnations were used to increase the salt content. A total of three groups with different salt contents and a salt-free reference group were con-sidered, each in a threefold determination. After complete drying and determination of the salt content, the samples were wetted with liquid water at intervals of at least seven days, as evenly as possible over all surfaces, and dried at room temperature (relative humidity φ < 5 %). During the test, samples were weighed and changes were tracked visually and photographically. After completion of 20 cycles, an ion profile was prepared for one stone of the groups with the highest and lowest salt content, respectively. For this purpose, the samples were divided into segments, which were ground and extracted in a ratio of 1:50 powder to water. After filtration (pore size 20 µm) only the content of nitrate ions in the filtrate was determined by means of ion chromatography (ICS 1100 system, Thermo Fisher Scientific).
101
5th International SWBSS conference – Delft 2021
2.2 Modelling of phase equilibria To determine the temperature dependence of water activity and solubility the semi empirical Pitzer model [14] was used to parameterize equations for the calculation of the corresponding thermodynamic quantities. Although details of the used model cannot be given here (they can be found elsewhere)[14,15], it should be noted that the fit of the equation for a considered system is based on various experimental data of thermodynamic properties, such as solubility, boiling and melting points. In addition, parameters for the interaction in relevant aqueous mixtures with three different ions were determined for some systems or, if available, were taken from the literature [15]. The parameterization of the respective ternary mixtures allows the calculation of the corresponding properties in electrolyte solutions with more than three ions [14]. Detailed results will be published elsewhere.
2.3 Determination of Supersaturation The critical supersaturation was determined by means of cooling calorimetry using a Calvet-type calorimeter (BT2.15, Setaram). Filtered Ba(NO3)2-solutions (pore size 20 µm) were cooled down to –30 °C and re-heated to 25 °C with a rate of 0.1 K∙min–1.
3 RESULTS AND DISCUSSION Besides Ba(NO3)2 there is no other crystalline phase in the system Ba2+–NO3
––H2O, so the relevant damage mechanism includes the crystallization of the salt from supersaturated solution. The low solubility of Ba(NO3)2 and, consequently, the low solution concentrations led to very small amounts of salt being taken up by the stone specimens in the damage test. Initial salt contents were between 18 and 26 g∙kg–1. Since the amount of water used for wetting was limited to the pore vol-ume of the specimen reduced by the volume occupied by the salt, only 23 % of the salt could be dissolved with each wetting event. If efflorescences were still present at the beginning of the cycles, they were progressively reduced, which is accom-panied by an increasing presence of subflorescence. Sanding and consequently an increasingly uneven surface were observed in case of high salt contents. The evo-lution of the mass ratio is shown in Figure 1. Ion profiles (see Figure 1, right) re-vealed that salt contents were higher in the core of the specimens than at the sur-face. It is assumed that the salt was rinsed further into the stone upon wetting and, despite a high moisture gradient between the salt solution in the stone and the sur-rounding atmosphere, salt crystals precipitating in surface-near pores prevented ca-pillary transport to the surface (pore clogging [16]) and, thus, accumulation at the surface. Due to the high deliquescence humidity (DRH) of the Ba(NO3)2 [17], it is quite conceivable that it precipitates very quickly in areas close to the surface and before the onset of an effective capillary transport, since in these areas the dry con-ditions of the environment become effective more readily than in the interior.
102
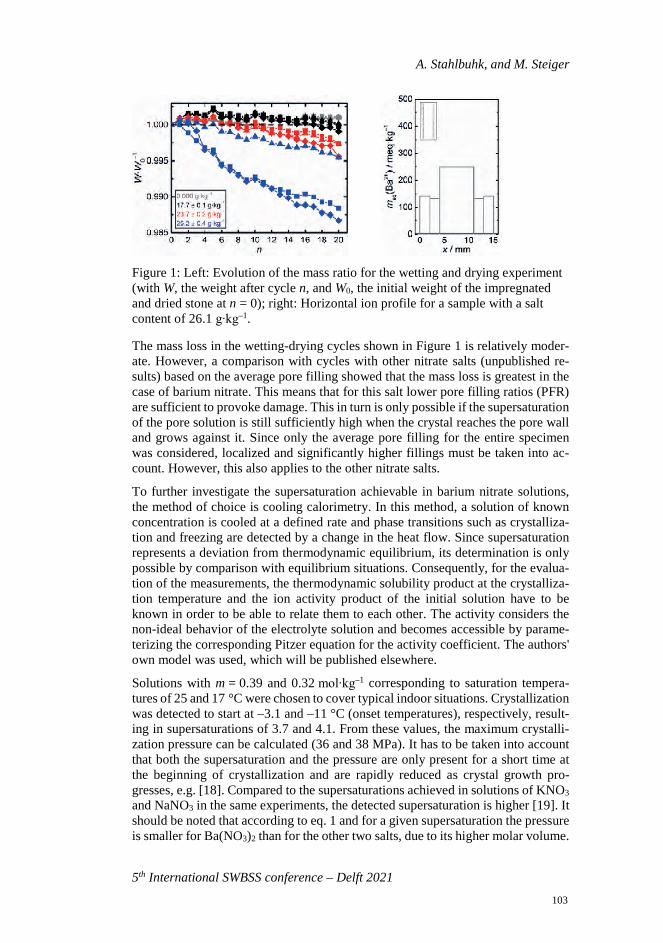
A. Stahlbuhk, and M. Steiger
5th International SWBSS conference – Delft 2021
Figure 1: Left: Evolution of the mass ratio for the wetting and drying experiment (with W, the weight after cycle n, and W0, the initial weight of the impregnated and dried stone at n = 0); right: Horizontal ion profile for a sample with a salt content of 26.1 g∙kg–1.
The mass loss in the wetting-drying cycles shown in Figure 1 is relatively moder-ate. However, a comparison with cycles with other nitrate salts (unpublished re-sults) based on the average pore filling showed that the mass loss is greatest in the case of barium nitrate. This means that for this salt lower pore filling ratios (PFR) are sufficient to provoke damage. This in turn is only possible if the supersaturation of the pore solution is still sufficiently high when the crystal reaches the pore wall and grows against it. Since only the average pore filling for the entire specimen was considered, localized and significantly higher fillings must be taken into ac-count. However, this also applies to the other nitrate salts.
To further investigate the supersaturation achievable in barium nitrate solutions, the method of choice is cooling calorimetry. In this method, a solution of known concentration is cooled at a defined rate and phase transitions such as crystalliza-tion and freezing are detected by a change in the heat flow. Since supersaturation represents a deviation from thermodynamic equilibrium, its determination is only possible by comparison with equilibrium situations. Consequently, for the evalua-tion of the measurements, the thermodynamic solubility product at the crystalliza-tion temperature and the ion activity product of the initial solution have to be known in order to be able to relate them to each other. The activity considers the non-ideal behavior of the electrolyte solution and becomes accessible by parame-terizing the corresponding Pitzer equation for the activity coefficient. The authors' own model was used, which will be published elsewhere.
Solutions with m = 0.39 and 0.32 mol∙kg–1 corresponding to saturation tempera-tures of 25 and 17 °C were chosen to cover typical indoor situations. Crystallization was detected to start at –3.1 and –11 °C (onset temperatures), respectively, result-ing in supersaturations of 3.7 and 4.1. From these values, the maximum crystalli-zation pressure can be calculated (36 and 38 MPa). It has to be taken into account that both the supersaturation and the pressure are only present for a short time at the beginning of crystallization and are rapidly reduced as crystal growth pro-gresses, e.g. [18]. Compared to the supersaturations achieved in solutions of KNO3 and NaNO3 in the same experiments, the detected supersaturation is higher [19]. It should be noted that according to eq. 1 and for a given supersaturation the pressure is smaller for Ba(NO3)2 than for the other two salts, due to its higher molar volume.
103
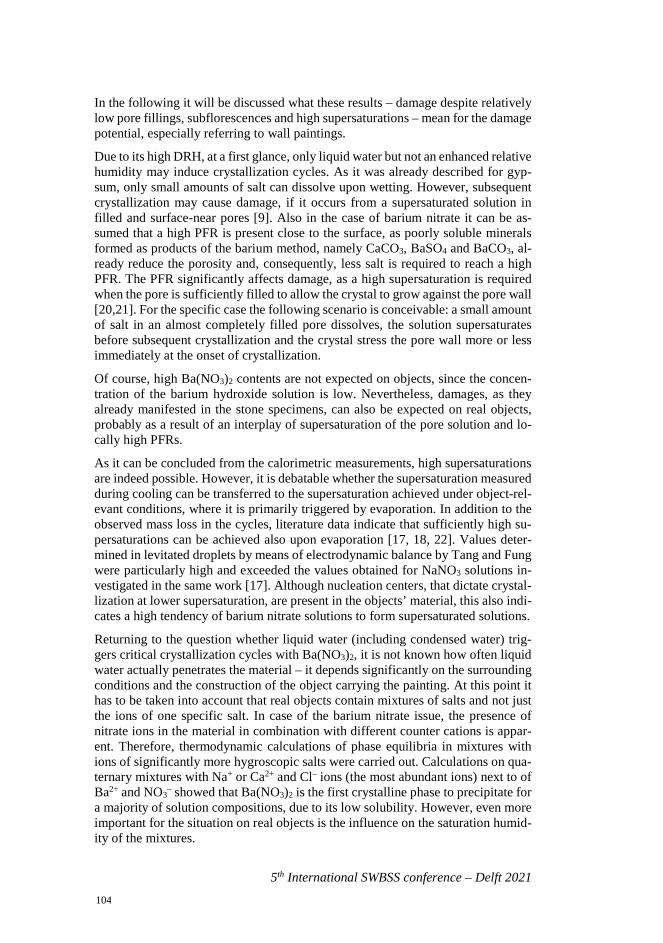
5th International SWBSS conference – Delft 2021
In the following it will be discussed what these results – damage despite relatively low pore fillings, subflorescences and high supersaturations – mean for the damage potential, especially referring to wall paintings.
Due to its high DRH, at a first glance, only liquid water but not an enhanced relative humidity may induce crystallization cycles. As it was already described for gyp-sum, only small amounts of salt can dissolve upon wetting. However, subsequent crystallization may cause damage, if it occurs from a supersaturated solution in filled and surface-near pores [9]. Also in the case of barium nitrate it can be as-sumed that a high PFR is present close to the surface, as poorly soluble minerals formed as products of the barium method, namely CaCO3, BaSO4 and BaCO3, al-ready reduce the porosity and, consequently, less salt is required to reach a high PFR. The PFR significantly affects damage, as a high supersaturation is required when the pore is sufficiently filled to allow the crystal to grow against the pore wall [20,21]. For the specific case the following scenario is conceivable: a small amount of salt in an almost completely filled pore dissolves, the solution supersaturates before subsequent crystallization and the crystal stress the pore wall more or less immediately at the onset of crystallization.
Of course, high Ba(NO3)2 contents are not expected on objects, since the concen-tration of the barium hydroxide solution is low. Nevertheless, damages, as they already manifested in the stone specimens, can also be expected on real objects, probably as a result of an interplay of supersaturation of the pore solution and lo-cally high PFRs.
As it can be concluded from the calorimetric measurements, high supersaturations are indeed possible. However, it is debatable whether the supersaturation measured during cooling can be transferred to the supersaturation achieved under object-rel-evant conditions, where it is primarily triggered by evaporation. In addition to the observed mass loss in the cycles, literature data indicate that sufficiently high su-persaturations can be achieved also upon evaporation [17, 18, 22]. Values deter-mined in levitated droplets by means of electrodynamic balance by Tang and Fung were particularly high and exceeded the values obtained for NaNO3 solutions in-vestigated in the same work [17]. Although nucleation centers, that dictate crystal-lization at lower supersaturation, are present in the objects’ material, this also indi-cates a high tendency of barium nitrate solutions to form supersaturated solutions.
Returning to the question whether liquid water (including condensed water) trig-gers critical crystallization cycles with Ba(NO3)2, it is not known how often liquid water actually penetrates the material – it depends significantly on the surrounding conditions and the construction of the object carrying the painting. At this point it has to be taken into account that real objects contain mixtures of salts and not just the ions of one specific salt. In case of the barium nitrate issue, the presence of nitrate ions in the material in combination with different counter cations is appar-ent. Therefore, thermodynamic calculations of phase equilibria in mixtures with ions of significantly more hygroscopic salts were carried out. Calculations on qua-ternary mixtures with Na+ or Ca2+ and Cl– ions (the most abundant ions) next to of Ba2+ and NO3
– showed that Ba(NO3)2 is the first crystalline phase to precipitate for a majority of solution compositions, due to its low solubility. However, even more important for the situation on real objects is the influence on the saturation humid-ity of the mixtures.
104
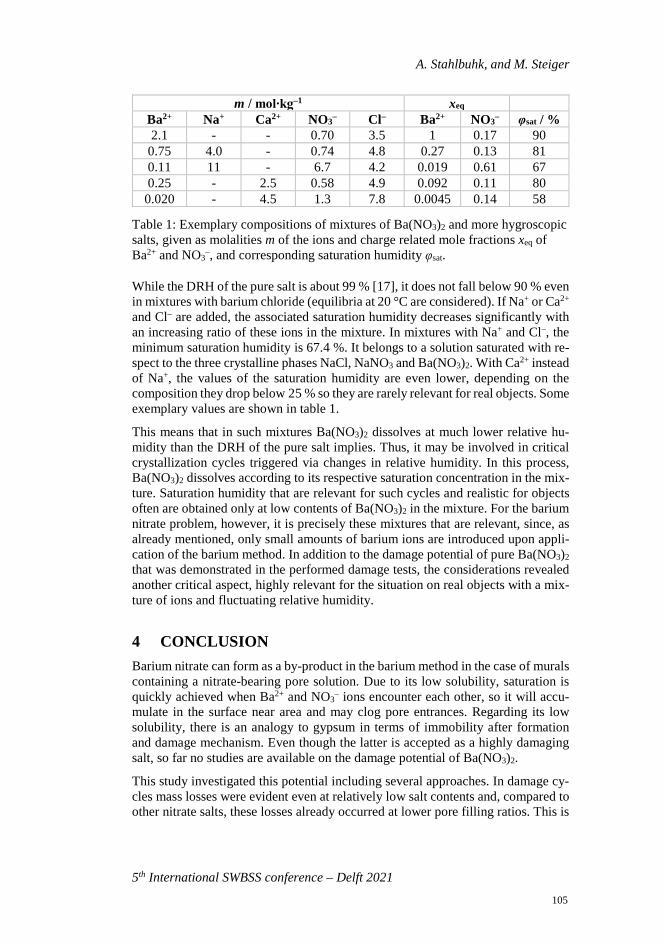
A. Stahlbuhk, and M. Steiger
5th International SWBSS conference – Delft 2021
Table 1: Exemplary compositions of mixtures of Ba(NO3)2 and more hygroscopic salts, given as molalities m of the ions and charge related mole fractions xeq of Ba2+ and NO3
–, and corresponding saturation humidity φsat.
While the DRH of the pure salt is about 99 % [17], it does not fall below 90 % even in mixtures with barium chloride (equilibria at 20 °C are considered). If Na+ or Ca2+ and Cl– are added, the associated saturation humidity decreases significantly with an increasing ratio of these ions in the mixture. In mixtures with Na+ and Cl–, the minimum saturation humidity is 67.4 %. It belongs to a solution saturated with re-spect to the three crystalline phases NaCl, NaNO3 and Ba(NO3)2. With Ca2+ instead of Na+, the values of the saturation humidity are even lower, depending on the composition they drop below 25 % so they are rarely relevant for real objects. Some exemplary values are shown in table 1.
This means that in such mixtures Ba(NO3)2 dissolves at much lower relative hu-midity than the DRH of the pure salt implies. Thus, it may be involved in critical crystallization cycles triggered via changes in relative humidity. In this process, Ba(NO3)2 dissolves according to its respective saturation concentration in the mix-ture. Saturation humidity that are relevant for such cycles and realistic for objects often are obtained only at low contents of Ba(NO3)2 in the mixture. For the barium nitrate problem, however, it is precisely these mixtures that are relevant, since, as already mentioned, only small amounts of barium ions are introduced upon appli-cation of the barium method. In addition to the damage potential of pure Ba(NO3)2 that was demonstrated in the performed damage tests, the considerations revealed another critical aspect, highly relevant for the situation on real objects with a mix-ture of ions and fluctuating relative humidity.
4 CONCLUSION Barium nitrate can form as a by-product in the barium method in the case of murals containing a nitrate-bearing pore solution. Due to its low solubility, saturation is quickly achieved when Ba2+ and NO3
– ions encounter each other, so it will accu-mulate in the surface near area and may clog pore entrances. Regarding its low solubility, there is an analogy to gypsum in terms of immobility after formation and damage mechanism. Even though the latter is accepted as a highly damaging salt, so far no studies are available on the damage potential of Ba(NO3)2.
This study investigated this potential including several approaches. In damage cy-cles mass losses were evident even at relatively low salt contents and, compared to other nitrate salts, these losses already occurred at lower pore filling ratios. This is
m / mol∙kg–1 xeq Ba2+ Na+ Ca2+ NO3– Cl– Ba2+ NO3– φsat / % 2.1 - - 0.70 3.5 1 0.17 90
0.75 4.0 - 0.74 4.8 0.27 0.13 81 0.11 11 - 6.7 4.2 0.019 0.61 67 0.25 - 2.5 0.58 4.9 0.092 0.11 80
0.020 - 4.5 1.3 7.8 0.0045 0.14 58
105
5th International SWBSS conference – Delft 2021
also consistent with the high supersaturation obtained in cooling experiments. Fur-thermore, it was shown by thermodynamic calculations that in the additional pres-ence of Na+ or Ca2+ as well as Cl– ions, Ba(NO3)2 precipitates from the majority of mixture compositions. In addition, the saturation humidity of these mixtures de-crease when the contents of the other ions increase. This allows Ba(NO3)2 to par-ticipate in deliquescence/crystallization cycles. Consequently, it is by no means to be regarded as a passive salt that, due to a low solubility, cannot participate in damage processes triggered by relative humidity. Indeed the content of barium ni-trate in the relevant mixtures and also on the relevant objects is quiet low. Never-theless, an already compacted pore space can favor situations in which a stress, sufficiently high for damage, can act on the porous matrix. On the basis of these thermodynamic considerations it is not possible to investigate how the salts actu-ally behave in mixed solutions, so damage experiments and investigations on the achievable supersaturation in mixtures are of great interest in the future. Neverthe-less, the presented studies clearly revealed that the formation of Ba(NO3)2 on wall paintings has to be taken seriously, as the salt dissolves through the impact of liquid or condensed water, as well as in solutions resulting from the deliquescence of hy-groscopic salts. Due to the consequent damage potential, the possibility of its for-mation should be excluded before application of the barium method.
REFERENCES [1] M. Steiger, A. E. Charola, K. Streflinger, Weathering and deterioration. In: S.
Siegesmund, R. Snethlage (Eds.), Stone in architecture, Springer, Berlin, Hei-delberg, 2014, pp. 225–315.
[2] P. Mora, L. Mora, P. Philippot (Eds.), Butterworths series in conservation and museology, Butterworths, London, 1984.
[3] A. Arnold, K. Zehnder, Monitoring wall paintings affected by soluble salts. In: S. Cather (Ed.), The conservation of wall paintings. Proceedings of a sym-posium organized by the Courtauld Institute of Art and the Getty Conserva-tion Institute, London, July 13-16, 1987. Getty Conservation Institute, Los Angeles, 1996, pp. 103–135.
[4] M. Steiger, Salts in Porous Materials: Thermodynamics of Phase Transitions, Modeling and Preventive Conservation, Resto. Build. Monum. Vol. 11, pp 419–432, 2005.
[5] M. Steiger, Crystal growth in porous materials – I: The crystallization pres-sure of large crystals, J. Cryst. Growth, vol. 282, pp 455–469, 2005.
[6] J. W. Mullin, Crystallization, Butterworth-Heinemann, Oxford, 2001.
[7] M. Steiger, Air pollution damage to stone. In: P. Brimblecombe (Ed.), Urban pollution and changes to materials and building surfaces. Imperial College Press, London, 2016, pp. 65–101.
[8] S. J. Smith, J. van Aardenne, Z. Klimont, R. J. Andres, A. Volke, S. Delgado Arias, Anthropogenic sulfur dioxide emissions: 1850-2005, Atmos. Chem. Phys., vol. 11, pp1101–1116, 2011.
106
A. Stahlbuhk, and M. Steiger
5th International SWBSS conference – Delft 2021
[9] A. E. Charola, J. Pühringer, M. Steiger, Gypsum: A review of its role in the deterioration of building materials, Environ. Geol., vol. 52 , pp 339–352 , 2007.
[10] G. Botticelli, Metodologia di pulitura per pitture murali e di consolidamento con un materiale minerale (bario idrato). In: E. Benedini, U. Baldini (Eds.), Il Restauro nelle Opere d’Arte. Atti del Convegno. Accademia Nazionale Vir-giliana, Mantua, 1987, pp. 43–53.
[11] M. Matteini, A. Moles, La metodologia del "bario in relazione ai problemi di solfatazione e di decoesione che interessano i dipinti murali. In: E. Benedini, U. Baldini (Eds.), Il Restauro nelle Opere d’Arte. Atti del Convegno. Acca-demia Nazionale Virgiliana, Mantua, 1987, pp. 33–41.
[12] M. Matteini, A. Moles, Aspetti critici del trattamento fondato sull'ipiego di idrato di bario. In: C. Danti, M. Matteini, A. Moles (Eds.), Le Pitture Murali. Tecniche, Problemi; Conservazione. Centro Di, Florence, 1990, pp. 297–302.
[13] A. Sieverts, W. Petzold, Binäre Systeme: Nitrate von Metallen der zweiten Gruppe des periodischen Systems und Wasser, Z. anorg. allg. Chem., vol. 212 , pp 233–241, 1933.
[14] K. S. Pitzer, Ion interaction approach: theory and data correlation. In: K. S. Pitzer (Ed.), Activity Coefficients in Electrolyte Solutions. CRC Press, Boca Raton, 1991, pp. 75–153.
[15] M. Steiger, J. Kiekbusch, A. Nicolai, An improved model incorporating Pitzer’s equations for calculation of thermodynamic properties of pore solu-tions implemented into an efficient program code, Construct. Build. Mater., vol. 22, pp 1841–1850 , 2008.
[16] R. M. Espinosa Marzal, G. W. Scherer, Impact of in-pore salt crystallization on transport properties, Environ. Earth Sci., vol. 69, pp 2657–2669, 2013.
[17] I. N. Tang, K. H. Fung, Hydration and Raman scattering studies of levitated microparticles: Ba(NO3)2, Sr(NO3)2, and Ca(NO3)2, J. Chem. Phys., vol. 106 pp 1653–1660, 1997.
[18] A. Naillon, P. Joseph, M. Prat, Sodium chloride precipitation reaction coeffi-cient from crystallization experiment in a microfluidic device, J. Cryst. Growth, vol .463, pp 201–210, 2017.
[19] A. Stahlbuhk, M. Steiger, Investigations on the supersaturation and damage potential of nitrate salts relevant for objects of cultural heritage. In: S. Sieg-esmund, B. Middendorf (Eds.), Monument Future: Decay and Conservation of Stone. Proceedings of the 14th International Congress on the Deterioration and Conservation of Stone, Mitteldeutscher Verlag, Halle, 2020, pp. 419–424.
[20] R. J. Flatt et al., Chemomechanics of salt damage in stone, Nature Commun., vol. 5, pp 1–5, 2014.
107

5th International SWBSS conference – Delft 2021
[21] A. Naillon, P. Joseph, M. Prat, Ion Transport and Precipitation Kinetics asKey Aspects of Stress Generation on Pore Walls Induced by Salt Crystalliza-tion, Phys. Rev. Lett., vol. 120, pp 03452-1–5, 2018.
[22] J. Desarnaud et al., Metastability limit for the nucleation of NaCl crystals inconfinement, J. Phys. Chem. Lett., vol. 5, pp 890–895, 2014.
108
5th International SWBSS conference – Delft 2021
EFFECT OF ALKALI FERROCYANIDES ON CRYSTALLISATION OF SODIUM CHLORIDE: PRELIMINARY RESULTS
Ameya Kamat1,2*, Barbara Lubelli1, and Erik Schlangen2
KEYWORDS Crystallisation pressure, direct measurement, sodium chloride, sodium ferrocya-nide, 3D microscopy
ABSTRACT Sodium chloride (NaCl) is one of the ubiquitous soluble salts in the environment and is responsible for weathering of building materials. The salt weathering is at-tributed to the stress developed from crystallisation of these salts in pores of the building materials, with supersaturation as the driving force. In the last years, re-searchers have successfully mitigated the damage associated with the crystallisa-tion of NaCl by the use of alkali-ferrocyanides (crystallisation inhibitors) in porous building materials. The observed mitigation of the damage has been attributed to lowering of the crystallisation pressure, possibly related to changes in the crystal habit and preferential crystallisation of the salt in the form of efflorescence instead of crypto-florescence. However, the effect of the inhibitor on the development of the so-called crystallisation pressure has not been studied in detail yet. In fact, di-rect measurement of this pressure is challenging and, until now, only a few exper-iments have been successful. In this research, an experimental set-up has been de-veloped to directly measure the crystallisation forces of NaCl and the effect of fer-rocyanide on these, while visualizing the crystallization process under a micro-scope. Some preliminary tests using this set-up have been carried out: these con-sisted in monitoring force evolution from a drop of solution with and without the inhibitor confined between two glass plates.
1 Faculty of Architecture, Delft University of Technology, Delft, the Nether-
lands [email protected] 2 Faculty of Civil Engineering and Geosciences, Delft University of Technol-
ogy, Delft, the Netherlands
109
5th International SWBSS conference – Delft 2021
1 INTRODUCTION Sodium chloride is one of the most common soluble salts responsible for weather-ing of (historic) building materials. Traditional building materials like mortars (plasters and renders) are particularly susceptible to the salt crystallisation induced damage. The damage is often associated with a progressive material loss. Current conservation practices are not completely effective and show limited durability. Moreover, they are scarcely compatible to the existing building fabric. Conserva-tion and repair of the built cultural heritage is a challenging and an expensive task.
An innovative approach to mitigate salt crystallisation damage has been proposed in the last years, which makes use of crystallisation inhibitors [1]. Particularly, so-dium ferrocyanide, an inhibitor of NaCl crystallisation, seems to be promising for the mitigation of NaCl-induced decay. Several laboratory studies show its effec-tiveness in mitigating damage and enhancing salt transport associated with sodium chloride crystallisation in porous building materials [2]–[4]. Recent studies showed an improved resistance to NaCl decay of lime mortar additivated with sodium fer-rocyanide[5], [6]. The mitigation mechanism has been often attributed to increased advection of salt ions to the evaporating surface, favouring efflorescence instead of harmful crypto-florescence, and to changes of the crystal habit, from cubic to dendritic pattern. Moreover, SEM observations in the pores reveal formation of smaller crystals with a high nucleation density [7]. A high nucleation density can result in a higher consumption of supersaturation, which could potentially reduce the crystallisation pressure. However, all these hypotheses have not been experi-mentally validated yet.
Salt weathering is attributed to the development of stresses due to salt crystallisa-tion in the pores of building materials [8]. Progressive damage occurs when the crystallisation stress (pressure) exceeds the tensile strength of building materials. Development of crystallisation stress is driven by supersaturation, meaning the concentration of the dissolved salt ions exceeds the equilibrium saturation thresh-old. The crystallisation pressure in large pores for NaCl can be approximated with the following equation [9] :
𝑃𝑃~𝜈𝜈𝜈𝜈𝜈𝜈𝑉𝑉𝑚𝑚
ln �𝑚𝑚𝑚𝑚0
� (1)
Where, R,T and 𝑉𝑉𝑚𝑚 are the universal gas constant, temperature and molar volume of the crystal respectively. 𝜈𝜈 is the number of ions on full dissociation which for sodium chloride is equal to 2. The supersaturation 𝑚𝑚
𝑚𝑚0 is expressed as a molal ratio
of the dissolved salt concentration to their equilibrium concentration. In the past, a few studies have focused on indirect quantification of pressure by measuring su-persaturation [3],[4]. Recently, a few studies were successful in directly measuring the crystallisation force using mechanical experimental setups. In one study, crys-tallisation force was measured from an evaporating drop of NaCl solution confined between two glass plates using a rheometer [12]. In another study, a similar prin-ciple was used but the force was measured using two electromagnets [13]. Both the studies provide a direct experimental evidence of crystallisation stress measure-ment. However, a vast difference is observed in the range of crystallisation pressure
110
A. Kamat, B. Lubelli, and E. Schlangen
5th International SWBSS conference – Delft 2021
which can be attributed to the contact area measurements. In addition to the force measurements, the crystallisation pressure strongly depends on an accurate deter-mination of the contact area between the growing crystal and the substrate. Esti-mation of the contact area is challenging owing to an uneven crystal profile [13]. Moreover, since contact area is a dynamic parameter, in-situ area measurement is necessary to increase the reliability of the results.
In this paper, as a first step, the adopted measurement principles from [12], [13] have been used as starting point to develop an experimental setup to measure crys-tallisation force. Some preliminary results are reported, focusing on sodium chlo-ride solution, with and without the addition of sodium ferrocyanide decahydrate (Na4Fe(CN)6.10H2O) as the inhibitor. A preliminary study to measure the contact area using 3D microscopy is presented. This will be eventually extended to in-situ measurement of the contact area. Finally, suggestions are given for further im-provements to the developed setup.
2 MATERIALS AND METHODS
2.1 Experimental setup The experimental setup is designed to measure the force exerted by a growing crys-tal confined between two planes. The setup consists of two parts: 1. Assembly of glass plates and 2. The force measurement device. The schematic of the setup is presented in Figure 1.
Glass slides are used as confining planes owing to their smooth surface, transpar-ency and known wetting properties with NaCl solutions. A standard microscope slide (75x25x1 mm) acts as the base plate (test surface) where the salt solution droplet is placed. Two microscope slides with a 1000±5 μm thickness are glued to the base plate to create a gap of 1000±5 μm and support the cover glass. The cover glass (10x10 mm) is positioned on these supports such that the bottom surface of the glass plate touches the top surface of the droplet at the start of the experiment. The cover glass is around 170 μm thick and acts as a low weight rigid plate.
The force measurement device is made of two aluminium beams (150 x 20 mm) with a depth of 80 mm. The bottom beam is fixed. The top beam is supported by a hinge on one side and a variable screw on the other side. The screw allows to change the distance between the two beams. On the underside of the top beam, a low profile force sensor is attached. This is done on the hinged side of the setup so that the distance between the screw and the force sensor is maximized. This ensures a finer control of the vertical movement of the force sensor for each tread rotation of the screw. In this setup, a calibrated high sensitivity piezo-resistive force sensor (Honeywell) with a maximum capacity of 5N has been used. The load actuator of the sensor is composed of a rigid material with a negligible deformation, allowing a reliable force signal. The glass slide assembly including the drop is placed on the lower beam such that the force sensor is exactly above the cover glass of the glass assembly. The force sensor is lowered using the screw until the actuator is in con-tact with the cover glass. The force sensor is connected to an amplifier, which is in turn connected to a computer. Data is continuously acquired at an interval of 1 sec.
111
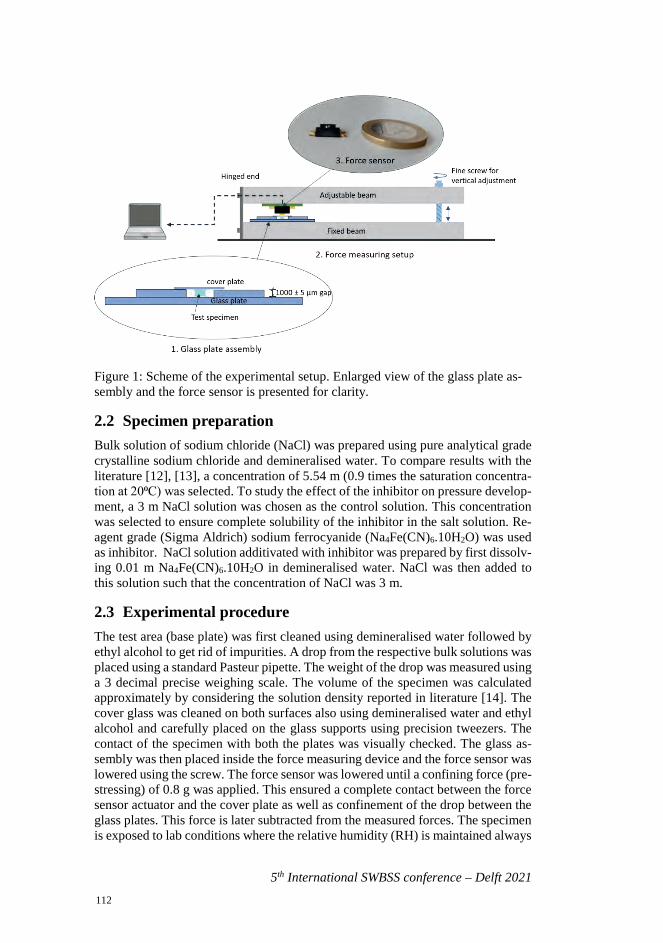
5th International SWBSS conference – Delft 2021
Figure 1: Scheme of the experimental setup. Enlarged view of the glass plate as-sembly and the force sensor is presented for clarity.
2.2 Specimen preparation Bulk solution of sodium chloride (NaCl) was prepared using pure analytical grade crystalline sodium chloride and demineralised water. To compare results with the literature [12], [13], a concentration of 5.54 m (0.9 times the saturation concentra-tion at 20⁰C) was selected. To study the effect of the inhibitor on pressure develop-ment, a 3 m NaCl solution was chosen as the control solution. This concentration was selected to ensure complete solubility of the inhibitor in the salt solution. Re-agent grade (Sigma Aldrich) sodium ferrocyanide (Na4Fe(CN)6.10H2O) was used as inhibitor. NaCl solution additivated with inhibitor was prepared by first dissolv-ing 0.01 m Na4Fe(CN)6.10H2O in demineralised water. NaCl was then added to this solution such that the concentration of NaCl was 3 m.
2.3 Experimental procedure The test area (base plate) was first cleaned using demineralised water followed by ethyl alcohol to get rid of impurities. A drop from the respective bulk solutions was placed using a standard Pasteur pipette. The weight of the drop was measured using a 3 decimal precise weighing scale. The volume of the specimen was calculated approximately by considering the solution density reported in literature [14]. The cover glass was cleaned on both surfaces also using demineralised water and ethyl alcohol and carefully placed on the glass supports using precision tweezers. The contact of the specimen with both the plates was visually checked. The glass as-sembly was then placed inside the force measuring device and the force sensor was lowered using the screw. The force sensor was lowered until a confining force (pre-stressing) of 0.8 g was applied. This ensured a complete contact between the force sensor actuator and the cover plate as well as confinement of the drop between the glass plates. This force is later subtracted from the measured forces. The specimen is exposed to lab conditions where the relative humidity (RH) is maintained always
112
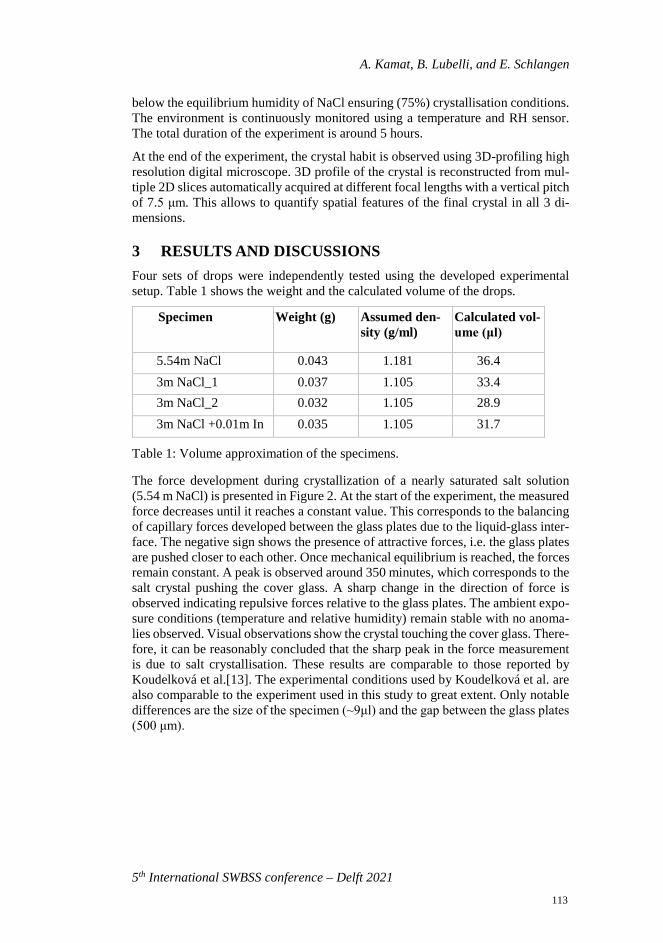
A. Kamat, B. Lubelli, and E. Schlangen
5th International SWBSS conference – Delft 2021
below the equilibrium humidity of NaCl ensuring (75%) crystallisation conditions. The environment is continuously monitored using a temperature and RH sensor. The total duration of the experiment is around 5 hours.
At the end of the experiment, the crystal habit is observed using 3D-profiling high resolution digital microscope. 3D profile of the crystal is reconstructed from mul-tiple 2D slices automatically acquired at different focal lengths with a vertical pitch of 7.5 μm. This allows to quantify spatial features of the final crystal in all 3 di-mensions.
3 RESULTS AND DISCUSSIONS Four sets of drops were independently tested using the developed experimental setup. Table 1 shows the weight and the calculated volume of the drops.
Specimen Weight (g) Assumed den-sity (g/ml)
Calculated vol-ume (μl)
5.54m NaCl 0.043 1.181 36.4 3m NaCl_1 0.037 1.105 33.4 3m NaCl_2 0.032 1.105 28.9 3m NaCl +0.01m In 0.035 1.105 31.7
Table 1: Volume approximation of the specimens.
The force development during crystallization of a nearly saturated salt solution (5.54 m NaCl) is presented in Figure 2. At the start of the experiment, the measured force decreases until it reaches a constant value. This corresponds to the balancing of capillary forces developed between the glass plates due to the liquid-glass inter-face. The negative sign shows the presence of attractive forces, i.e. the glass plates are pushed closer to each other. Once mechanical equilibrium is reached, the forces remain constant. A peak is observed around 350 minutes, which corresponds to the salt crystal pushing the cover glass. A sharp change in the direction of force is observed indicating repulsive forces relative to the glass plates. The ambient expo-sure conditions (temperature and relative humidity) remain stable with no anoma-lies observed. Visual observations show the crystal touching the cover glass. There-fore, it can be reasonably concluded that the sharp peak in the force measurement is due to salt crystallisation. These results are comparable to those reported by Koudelková et al.[13]. The experimental conditions used by Koudelková et al. are also comparable to the experiment used in this study to great extent. Only notable differences are the size of the specimen (~9μl) and the gap between the glass plates (500 μm).
113
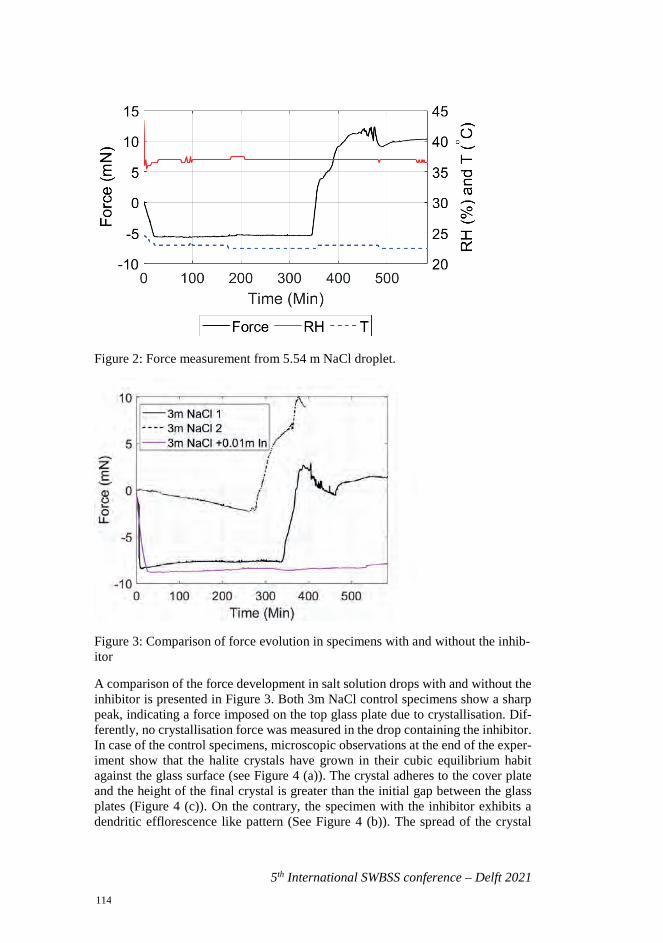
5th International SWBSS conference – Delft 2021
Figure 2: Force measurement from 5.54 m NaCl droplet.
Figure 3: Comparison of force evolution in specimens with and without the inhib-itor
A comparison of the force development in salt solution drops with and without the inhibitor is presented in Figure 3. Both 3m NaCl control specimens show a sharp peak, indicating a force imposed on the top glass plate due to crystallisation. Dif-ferently, no crystallisation force was measured in the drop containing the inhibitor. In case of the control specimens, microscopic observations at the end of the exper-iment show that the halite crystals have grown in their cubic equilibrium habit against the glass surface (see Figure 4 (a)). The crystal adheres to the cover plate and the height of the final crystal is greater than the initial gap between the glass plates (Figure 4 (c)). On the contrary, the specimen with the inhibitor exhibits a dendritic efflorescence like pattern (See Figure 4 (b)). The spread of the crystal
114
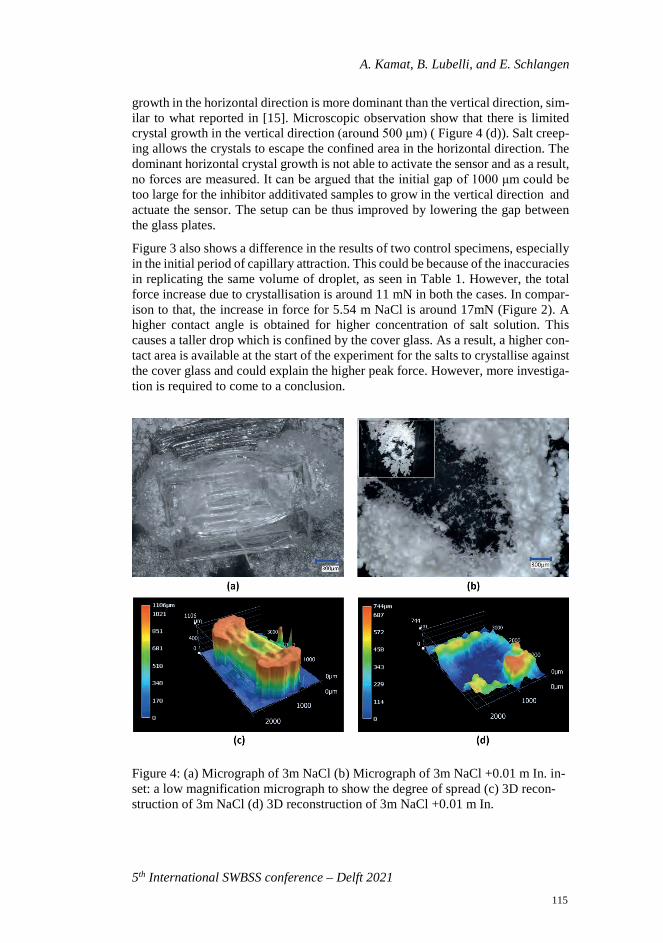
A. Kamat, B. Lubelli, and E. Schlangen
5th International SWBSS conference – Delft 2021
growth in the horizontal direction is more dominant than the vertical direction, sim-ilar to what reported in [15]. Microscopic observation show that there is limited crystal growth in the vertical direction (around 500 μm) ( Figure 4 (d)). Salt creep-ing allows the crystals to escape the confined area in the horizontal direction. The dominant horizontal crystal growth is not able to activate the sensor and as a result, no forces are measured. It can be argued that the initial gap of 1000 μm could be too large for the inhibitor additivated samples to grow in the vertical direction and actuate the sensor. The setup can be thus improved by lowering the gap between the glass plates.
Figure 3 also shows a difference in the results of two control specimens, especially in the initial period of capillary attraction. This could be because of the inaccuracies in replicating the same volume of droplet, as seen in Table 1. However, the total force increase due to crystallisation is around 11 mN in both the cases. In compar-ison to that, the increase in force for 5.54 m NaCl is around 17mN (Figure 2). A higher contact angle is obtained for higher concentration of salt solution. This causes a taller drop which is confined by the cover glass. As a result, a higher con-tact area is available at the start of the experiment for the salts to crystallise against the cover glass and could explain the higher peak force. However, more investiga-tion is required to come to a conclusion.
Figure 4: (a) Micrograph of 3m NaCl (b) Micrograph of 3m NaCl +0.01 m In. in-set: a low magnification micrograph to show the degree of spread (c) 3D recon-struction of 3m NaCl (d) 3D reconstruction of 3m NaCl +0.01 m In.
115
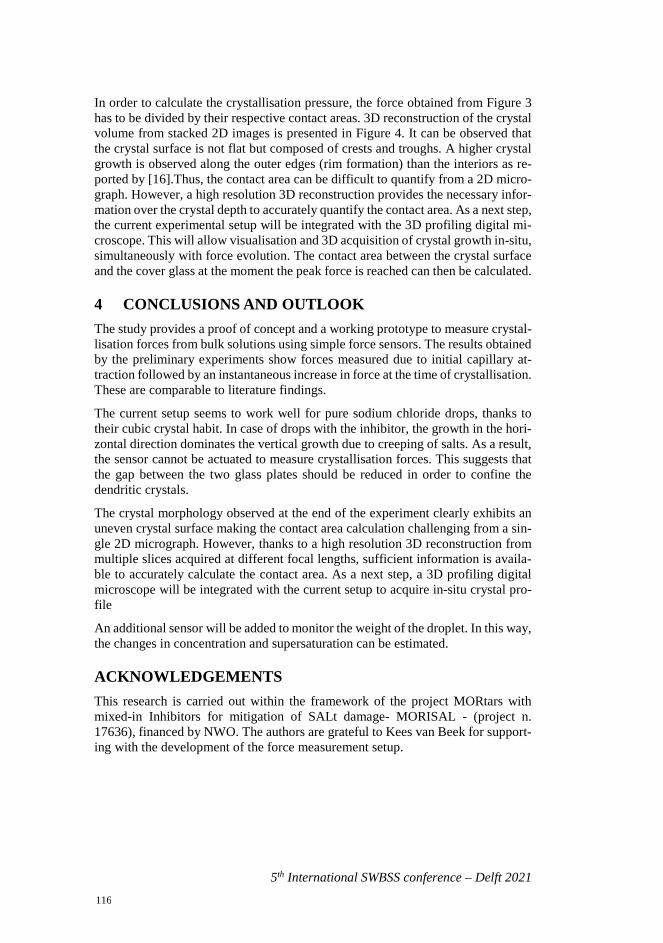
5th International SWBSS conference – Delft 2021
In order to calculate the crystallisation pressure, the force obtained from Figure 3 has to be divided by their respective contact areas. 3D reconstruction of the crystal volume from stacked 2D images is presented in Figure 4. It can be observed that the crystal surface is not flat but composed of crests and troughs. A higher crystal growth is observed along the outer edges (rim formation) than the interiors as re-ported by [16].Thus, the contact area can be difficult to quantify from a 2D micro-graph. However, a high resolution 3D reconstruction provides the necessary infor-mation over the crystal depth to accurately quantify the contact area. As a next step, the current experimental setup will be integrated with the 3D profiling digital mi-croscope. This will allow visualisation and 3D acquisition of crystal growth in-situ, simultaneously with force evolution. The contact area between the crystal surface and the cover glass at the moment the peak force is reached can then be calculated.
4 CONCLUSIONS AND OUTLOOK The study provides a proof of concept and a working prototype to measure crystal-lisation forces from bulk solutions using simple force sensors. The results obtained by the preliminary experiments show forces measured due to initial capillary at-traction followed by an instantaneous increase in force at the time of crystallisation. These are comparable to literature findings.
The current setup seems to work well for pure sodium chloride drops, thanks to their cubic crystal habit. In case of drops with the inhibitor, the growth in the hori-zontal direction dominates the vertical growth due to creeping of salts. As a result, the sensor cannot be actuated to measure crystallisation forces. This suggests that the gap between the two glass plates should be reduced in order to confine the dendritic crystals.
The crystal morphology observed at the end of the experiment clearly exhibits an uneven crystal surface making the contact area calculation challenging from a sin-gle 2D micrograph. However, thanks to a high resolution 3D reconstruction from multiple slices acquired at different focal lengths, sufficient information is availa-ble to accurately calculate the contact area. As a next step, a 3D profiling digital microscope will be integrated with the current setup to acquire in-situ crystal pro-file
An additional sensor will be added to monitor the weight of the droplet. In this way, the changes in concentration and supersaturation can be estimated.
ACKNOWLEDGEMENTS This research is carried out within the framework of the project MORtars with mixed-in Inhibitors for mitigation of SALt damage- MORISAL - (project n. 17636), financed by NWO. The authors are grateful to Kees van Beek for support-ing with the development of the force measurement setup.
116
A. Kamat, B. Lubelli, and E. Schlangen
5th International SWBSS conference – Delft 2021
REFERENCES [1] C. Rodriguez-Navarro, L. Linares-Fernandez, E. Doehne, and E. Sebastian,
“Effects of ferrocyanide ions on NaCl crystallization in porous stone,” J. Cryst. Growth, vol. 243, no. 3–4, pp. 503–516, 2002
[2] B. Lubelli, R. P. J. Van Hees, H. P. Huinink, and C. J. W. P. Groot, “Irreversible dilation of NaCl contaminated lime-cement mortar due to crystallization cycles,” Cem. Concr. Res., vol. 36, no. 4, pp. 678–687, 2006
[3] T. Rivas, E. Alvarez, M. J. Mosquera, L. Alejano, and J. Taboada, “Crystallization modifiers applied in granite desalination: The role of the stone pore structure,” Constr. Build. Mater., vol. 24, no. 5, pp. 766–776, May 2010.
[4] S. Gupta, K. Terheiden, L. Pel, and A. Sawdy, “Influence of Ferrocyanide Inhibitors on the Transport and Crystallization Processes of Sodium Chloride in Porous Building Materials,” Cryst. Growth Des., vol. 12, no. 8, pp. 3888–3898, Aug. 2012.
[5] B. Lubelli, T. G. Nijland, R. P. J. Van Hees, and A. Hacquebord, “Effect of mixed in crystallization inhibitor on resistance of lime-cement mortar against NaCl crystallization,” Constr. Build. Mater., vol. 24, no. 12, pp. 2466–2472, 2010.
[6] S. J. C. Granneman, B. Lubelli, and R. P. J. van Hees, “Effect of mixed in crystallization modifiers on the resistance of lime mortar against NaCl and Na2SO4 crystallization,” Constr. Build. Mater., vol. 194, pp. 62–70, Jan. 2019.
[7] S. Granneman, “Mitigating salt damage in lime-based mortars by built-in crystallization modifiers,” Delft University Press, 2019.
[8] G. W. Scherer, “Crystallization in pores,” Cem. Concr. Res., vol. 29, no. 8, pp. 1347–1358, 1999.
[9] M. Steiger, “Crystal growth in porous materials - I: The crystallization pressure of large crystals,” J. Cryst. Growth, vol. 282, no. 3–4, pp. 455–469, Sep. 2005
[10] L. A. Rijniers, H. P. Huinink, L. Pel, and K. Kopinga, “Experimental Evidence of Crystallization Pressure inside Porous Media,” Phys. Rev. Lett., vol. 94, no. 7, p. 075503, Feb. 2005
[11] J. Desarnaud, H. Derluyn, J. Carmeliet, D. Bonn, and N. Shahidzadeh, “Metastability limit for the nucleation of NaCl crystals in confinement,” J. Phys. Chem. Lett., vol. 5, no. 5, pp. 890–895, 2014
[12] J. Desarnaud, D. Bonn, and N. Shahidzadeh, “The Pressure induced by salt crystallization in confinement,” Sci. Rep., vol. 6, pp. 23–26, 2016
[13] V. Koudelková, B. Wolf, V. Hrbek, and T. Vítů, “Experimental measurement of disjoining force at the glass–salt interface: A direct evidence of salt degradation potential caused by crystallization pressure,” J. Cult. Herit., vol. 42, pp. 1–7, Mar. 2020
117

5th International SWBSS conference – Delft 2021
[14] D. W. Kaufmann, Sodium Chloride-The production and properties of salt and brine. New york: Hafner, 1971.
[15] E. R. Townsend, F. Swennenhuis, W. J. P. Van Enckevort, J. A. M. Meijer,and E. Vlieg, “Creeping: An efficient way to determine the anticaking abilityof additives for sodium chloride,” Cryst. Eng. Comm., vol. 18, no. 33, pp.6176–6183, 2016
[16] A. Røyne and D. K. Dysthe, “Rim formation on crystal faces growing inconfinement,” J. Cryst. Growth, vol. 346, no. 1, pp. 89–100, 2012.
118
5th International SWBSS conference – Delft 2021
INTERACTION BETWEEN SODIUM CHLORIDE AND AMMONIUM PHOSPHATE ON CARRARA MARBLE: TWO LABORATORY APPROACHES
Greta Ugolotti 1, Giulia Masi 1, and Enrico Sassoni1*
KEYWORDS Marble, salt contamination, NaCl, consolidation, ammonium phosphate
ABSTRACT The present paper aims at investigating the interaction between NaCl and diammo-nium hydrogen phosphate (DAP) solutions, in view of field consolidation of NaCl-contaminated substrates by DAP. Two different approaches were tested on marble: part of the specimens was treated by a single solution containing both NaCl and DAP (“NaCl+DAP” samples) and part of the specimens was subjected to a two-step treatment, consisting in preliminary contamination by NaCl and subsequent consolidation by DAP (“NaCl then DAP” samples). For each approach, different NaCl and DAP concentrations were tested. The new phases, formed after treatment, were characterized by FT-IR and SEM and their consolidating effect was assessed by ultrasonic measurements, in terms of increase in dynamic elastic modulus (Ed). To investigate the influence of the NaCl contamination on the durability of the consolidating treatments, consolidated specimens were repeatedly immersed in wa-ter, the solubilized ions were analyzed by ion chromatography and the possible decrease in consolidating efficacy was assessed by Ed. The results of the study point out that, following either approach, new calcium phosphate (CaP) phases were formed, identified by FT-IR as hydroxyapatite and/or octacalcium phosphate. These new phases led to significant increases in Ed, which experienced some re-duction when the consolidated specimens were immersed in water. Nonetheless, the residual Ed was sensibly higher than in the untreated condition, indicating that a significant mechanical benefit was maintained. The “NaCl then DAP” samples, which resemble the actual situation in the field, seem to provide more reliable re-sults than those obtained following the alternative approach. In fact, the combined treatment (“NaCl+DAP”) led to lower increases in Ed and less pronounced for-mation of new CaP, possibly because the presence of sodium and chloride ions in the DAP solution significantly altered the mechanisms of CaP formation.
1 Department of Civil, Chemical, Environmental and Materials Engineering
(DICAM), University of Bologna, Italy, [email protected]
119
5th International SWBSS conference – Delft 2021
1 INTRODUCTION Several types of organic and inorganic consolidants have been proposed through the years for stone consolidation, such as acrylic resins [1], ethyl silicate [2] and nanolimes [3]. However, when applied onto some stone types (i.e. carbonate stones), they often exhibit high limitations regarding some of the requirements that a good consolidant must fulfill, namely efficacy, compatibility, and durability [4]. As an alternative to traditional consolidants, ammonium hydrogen phosphate (DAP) was proposed 10 years ago for consolidation of carbonate stones, such as marble and limestone [4]. By reacting the calcium-based substrate with aqueous DAP solutions, calcium phosphates (CaP) can be formed inside the stone cracks and pores [4-8]. These new CaP phases are able to bond stone grains more effec-tively, thus improving mechanical properties [4, 5]. The effects of DAP have been tested in terms of effectiveness, compatibility and durability [4-8].
For any consolidant, the presence of soluble salts in the stone pores is an issue for two reasons: (i) salts already present inside the pores may compromise the consol-idation treatment, so that no effective bonding can be achieved by the consolidant [2,8]. To prevent this, before consolidant application, it is usually recommended to extract the salts by applying cellulose poultices soaked with deionized water. How-ever, in the case of heavily damaged substrates, salt removal before consolidation is not always feasible, thus the need of applying the consolidant before salt removal (so-called “pre-consolidation”) arises; (ii) ideally, restoration interventions should include measures to arrest the source of soluble salts (e.g., rising damp). However, this is not always possible or successful, thus further salt crystallization cycles may take place after stone consolidation, leading to stress at the grain boundaries and possible failure of the consolidation intervention. Moreover, some treatments (e.g. acrylic resins and ethyl silicate) create waterproof layers, which prevent saline so-lutions from reaching the stone surface and evaporating.
Therefore, the present paper was aimed at analyzing the effects of the presence of sodium chloride (relevant in marine environment) when DAP solutions are used to form CaP for marble consolidation. To this aim, two alternative methods were adopted: i) NaCl was added directly into the DAP solution and then applied on the marble specimens; although not representative of the real situation in the field, this approach has the advantage of simplifying the system and accelerating the process; ii) specimens were pre-contaminated with NaCl and then treated with DAP, to rec-reate a realistic situation where the salt is already present in the stone when it is treated with the DAP solution.
2 MATERIALS AND METHODS
2.1 Materials For each condition, 2 specimens were considered: a bigger prism (5×2×2 cm3) used for mechanical testing and a smaller one (2×2×0.5 cm3) used for mineralogical characterization. All the specimens were sawn from a single slab of fresh Carrara marble. The specimens were artificially weathered by heating in an oven at 250°C for 1 h [4]. In this way, the anisotropic deformation of calcite crystals upon heating
120
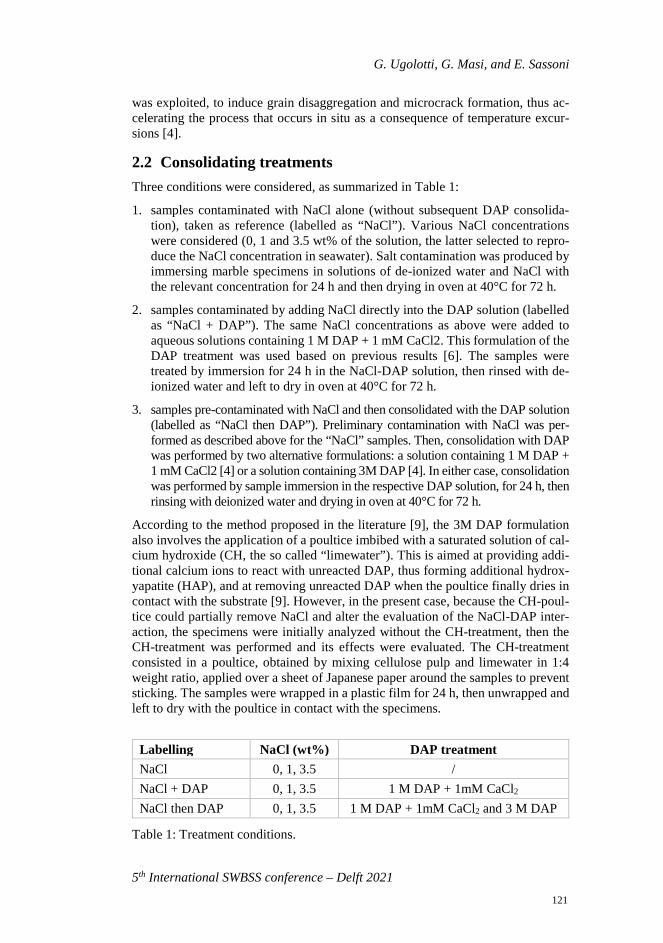
G. Ugolotti, G. Masi, and E. Sassoni
5th International SWBSS conference – Delft 2021
was exploited, to induce grain disaggregation and microcrack formation, thus ac-celerating the process that occurs in situ as a consequence of temperature excur-sions [4].
2.2 Consolidating treatments Three conditions were considered, as summarized in Table 1:
1. samples contaminated with NaCl alone (without subsequent DAP consolida-tion), taken as reference (labelled as “NaCl”). Various NaCl concentrations were considered (0, 1 and 3.5 wt% of the solution, the latter selected to repro-duce the NaCl concentration in seawater). Salt contamination was produced by immersing marble specimens in solutions of de-ionized water and NaCl with the relevant concentration for 24 h and then drying in oven at 40°C for 72 h.
2. samples contaminated by adding NaCl directly into the DAP solution (labelled as “NaCl + DAP”). The same NaCl concentrations as above were added to aqueous solutions containing 1 M DAP + 1 mM CaCl2. This formulation of the DAP treatment was used based on previous results [6]. The samples were treated by immersion for 24 h in the NaCl-DAP solution, then rinsed with de-ionized water and left to dry in oven at 40°C for 72 h.
3. samples pre-contaminated with NaCl and then consolidated with the DAP solution (labelled as “NaCl then DAP”). Preliminary contamination with NaCl was per-formed as described above for the “NaCl” samples. Then, consolidation with DAP was performed by two alternative formulations: a solution containing 1 M DAP + 1 mM CaCl2 [4] or a solution containing 3M DAP [4]. In either case, consolidation was performed by sample immersion in the respective DAP solution, for 24 h, then rinsing with deionized water and drying in oven at 40°C for 72 h.
According to the method proposed in the literature [9], the 3M DAP formulation also involves the application of a poultice imbibed with a saturated solution of cal-cium hydroxide (CH, the so called “limewater”). This is aimed at providing addi-tional calcium ions to react with unreacted DAP, thus forming additional hydrox-yapatite (HAP), and at removing unreacted DAP when the poultice finally dries in contact with the substrate [9]. However, in the present case, because the CH-poul-tice could partially remove NaCl and alter the evaluation of the NaCl-DAP inter-action, the specimens were initially analyzed without the CH-treatment, then the CH-treatment was performed and its effects were evaluated. The CH-treatment consisted in a poultice, obtained by mixing cellulose pulp and limewater in 1:4 weight ratio, applied over a sheet of Japanese paper around the samples to prevent sticking. The samples were wrapped in a plastic film for 24 h, then unwrapped and left to dry with the poultice in contact with the specimens.
Table 1: Treatment conditions.
Labelling NaCl (wt%) DAP treatment NaCl 0, 1, 3.5 / NaCl + DAP 0, 1, 3.5 1 M DAP + 1mM CaCl2 NaCl then DAP 0, 1, 3.5 1 M DAP + 1mM CaCl2 and 3 M DAP
121
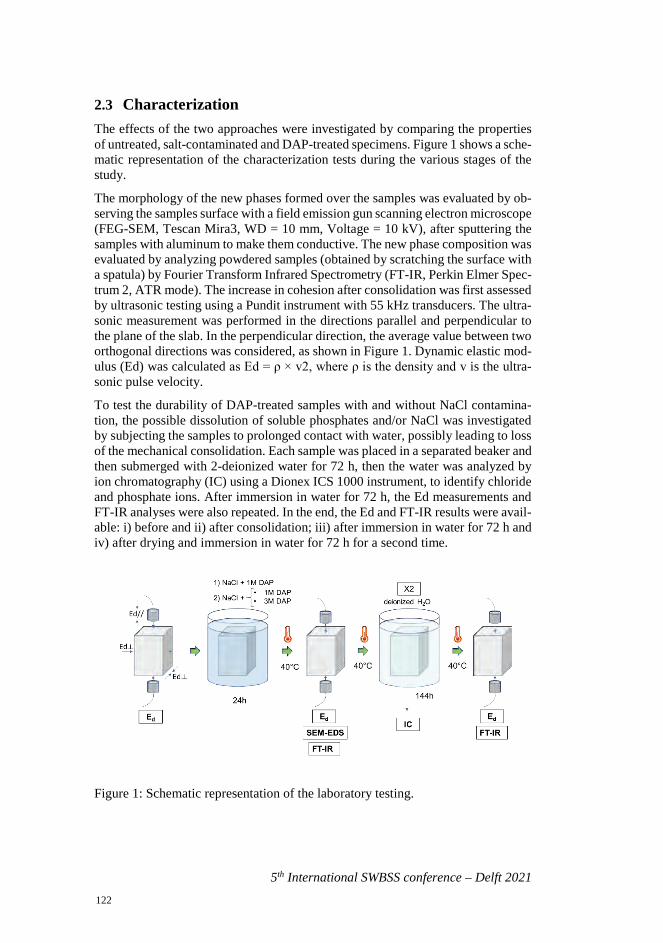
5th International SWBSS conference – Delft 2021
2.3 Characterization The effects of the two approaches were investigated by comparing the properties of untreated, salt-contaminated and DAP-treated specimens. Figure 1 shows a sche-matic representation of the characterization tests during the various stages of the study.
The morphology of the new phases formed over the samples was evaluated by ob-serving the samples surface with a field emission gun scanning electron microscope (FEG-SEM, Tescan Mira3, WD = 10 mm, Voltage = 10 kV), after sputtering the samples with aluminum to make them conductive. The new phase composition was evaluated by analyzing powdered samples (obtained by scratching the surface with a spatula) by Fourier Transform Infrared Spectrometry (FT-IR, Perkin Elmer Spec-trum 2, ATR mode). The increase in cohesion after consolidation was first assessed by ultrasonic testing using a Pundit instrument with 55 kHz transducers. The ultra-sonic measurement was performed in the directions parallel and perpendicular to the plane of the slab. In the perpendicular direction, the average value between two orthogonal directions was considered, as shown in Figure 1. Dynamic elastic mod-ulus (Ed) was calculated as Ed = ρ × v2, where ρ is the density and v is the ultra-sonic pulse velocity.
To test the durability of DAP-treated samples with and without NaCl contamina-tion, the possible dissolution of soluble phosphates and/or NaCl was investigated by subjecting the samples to prolonged contact with water, possibly leading to loss of the mechanical consolidation. Each sample was placed in a separated beaker and then submerged with 2-deionized water for 72 h, then the water was analyzed by ion chromatography (IC) using a Dionex ICS 1000 instrument, to identify chloride and phosphate ions. After immersion in water for 72 h, the Ed measurements and FT-IR analyses were also repeated. In the end, the Ed and FT-IR results were avail-able: i) before and ii) after consolidation; iii) after immersion in water for 72 h and iv) after drying and immersion in water for 72 h for a second time.
Figure 1: Schematic representation of the laboratory testing.
122
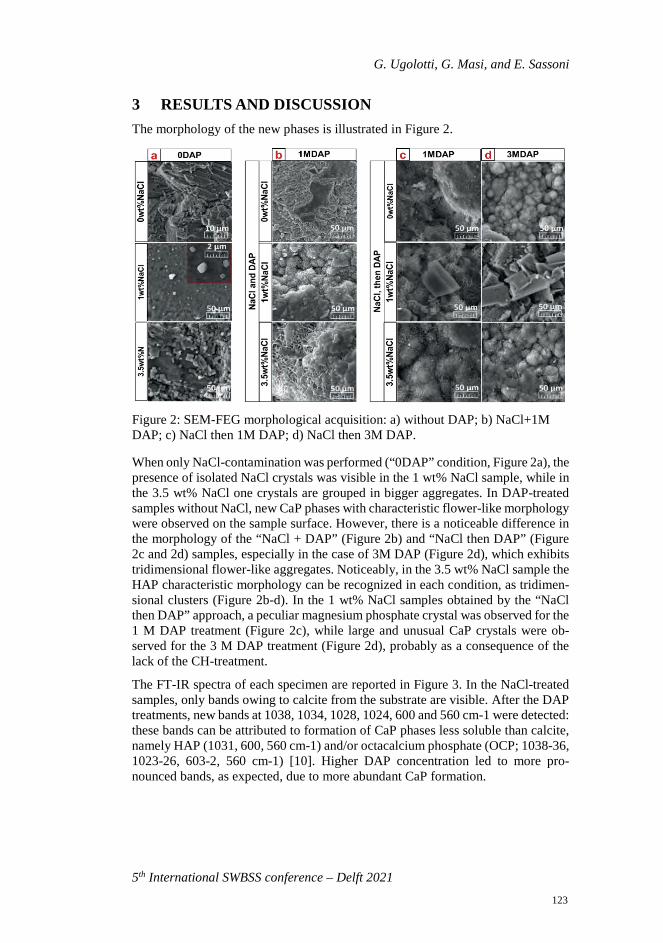
G. Ugolotti, G. Masi, and E. Sassoni
5th International SWBSS conference – Delft 2021
3 RESULTS AND DISCUSSION The morphology of the new phases is illustrated in Figure 2.
Figure 2: SEM-FEG morphological acquisition: a) without DAP; b) NaCl+1M DAP; c) NaCl then 1M DAP; d) NaCl then 3M DAP.
When only NaCl-contamination was performed (“0DAP” condition, Figure 2a), the presence of isolated NaCl crystals was visible in the 1 wt% NaCl sample, while in the 3.5 wt% NaCl one crystals are grouped in bigger aggregates. In DAP-treated samples without NaCl, new CaP phases with characteristic flower-like morphology were observed on the sample surface. However, there is a noticeable difference in the morphology of the “NaCl + DAP” (Figure 2b) and “NaCl then DAP” (Figure 2c and 2d) samples, especially in the case of 3M DAP (Figure 2d), which exhibits tridimensional flower-like aggregates. Noticeably, in the 3.5 wt% NaCl sample the HAP characteristic morphology can be recognized in each condition, as tridimen-sional clusters (Figure 2b-d). In the 1 wt% NaCl samples obtained by the “NaCl then DAP” approach, a peculiar magnesium phosphate crystal was observed for the 1 M DAP treatment (Figure 2c), while large and unusual CaP crystals were ob-served for the 3 M DAP treatment (Figure 2d), probably as a consequence of the lack of the CH-treatment.
The FT-IR spectra of each specimen are reported in Figure 3. In the NaCl-treated samples, only bands owing to calcite from the substrate are visible. After the DAP treatments, new bands at 1038, 1034, 1028, 1024, 600 and 560 cm-1 were detected: these bands can be attributed to formation of CaP phases less soluble than calcite, namely HAP (1031, 600, 560 cm-1) and/or octacalcium phosphate (OCP; 1038-36, 1023-26, 603-2, 560 cm-1) [10]. Higher DAP concentration led to more pro-nounced bands, as expected, due to more abundant CaP formation.
123
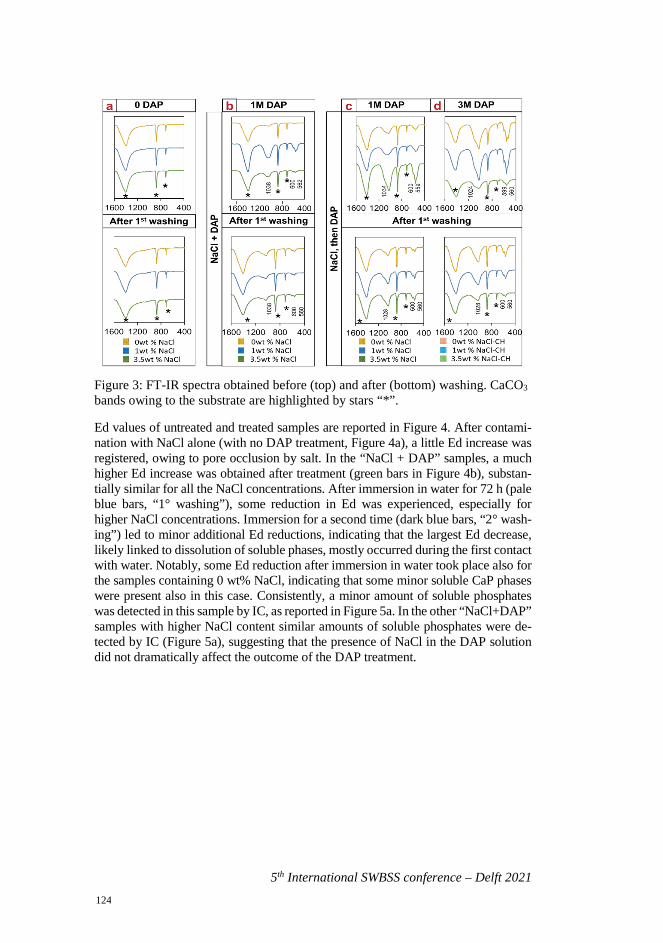
5th International SWBSS conference – Delft 2021
Figure 3: FT-IR spectra obtained before (top) and after (bottom) washing. CaCO3 bands owing to the substrate are highlighted by stars “*”.
Ed values of untreated and treated samples are reported in Figure 4. After contami-nation with NaCl alone (with no DAP treatment, Figure 4a), a little Ed increase was registered, owing to pore occlusion by salt. In the “NaCl + DAP” samples, a much higher Ed increase was obtained after treatment (green bars in Figure 4b), substan-tially similar for all the NaCl concentrations. After immersion in water for 72 h (pale blue bars, “1° washing”), some reduction in Ed was experienced, especially for higher NaCl concentrations. Immersion for a second time (dark blue bars, “2° wash-ing”) led to minor additional Ed reductions, indicating that the largest Ed decrease, likely linked to dissolution of soluble phases, mostly occurred during the first contact with water. Notably, some Ed reduction after immersion in water took place also for the samples containing 0 wt% NaCl, indicating that some minor soluble CaP phases were present also in this case. Consistently, a minor amount of soluble phosphates was detected in this sample by IC, as reported in Figure 5a. In the other “NaCl+DAP” samples with higher NaCl content similar amounts of soluble phosphates were de-tected by IC (Figure 5a), suggesting that the presence of NaCl in the DAP solution did not dramatically affect the outcome of the DAP treatment.
124
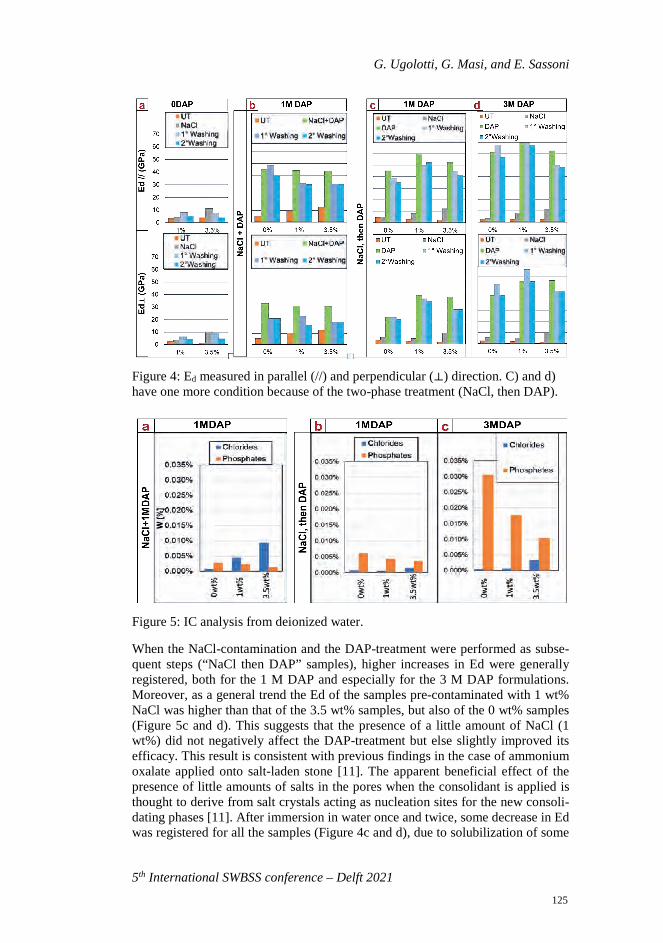
G. Ugolotti, G. Masi, and E. Sassoni
5th International SWBSS conference – Delft 2021
Figure 4: Ed measured in parallel (//) and perpendicular (⟂) direction. C) and d) have one more condition because of the two-phase treatment (NaCl, then DAP).
Figure 5: IC analysis from deionized water.
When the NaCl-contamination and the DAP-treatment were performed as subse-quent steps (“NaCl then DAP” samples), higher increases in Ed were generally registered, both for the 1 M DAP and especially for the 3 M DAP formulations. Moreover, as a general trend the Ed of the samples pre-contaminated with 1 wt% NaCl was higher than that of the 3.5 wt% samples, but also of the 0 wt% samples (Figure 5c and d). This suggests that the presence of a little amount of NaCl (1 wt%) did not negatively affect the DAP-treatment but else slightly improved its efficacy. This result is consistent with previous findings in the case of ammonium oxalate applied onto salt-laden stone [11]. The apparent beneficial effect of the presence of little amounts of salts in the pores when the consolidant is applied is thought to derive from salt crystals acting as nucleation sites for the new consoli-dating phases [11]. After immersion in water once and twice, some decrease in Ed was registered for all the samples (Figure 4c and d), due to solubilization of some
125
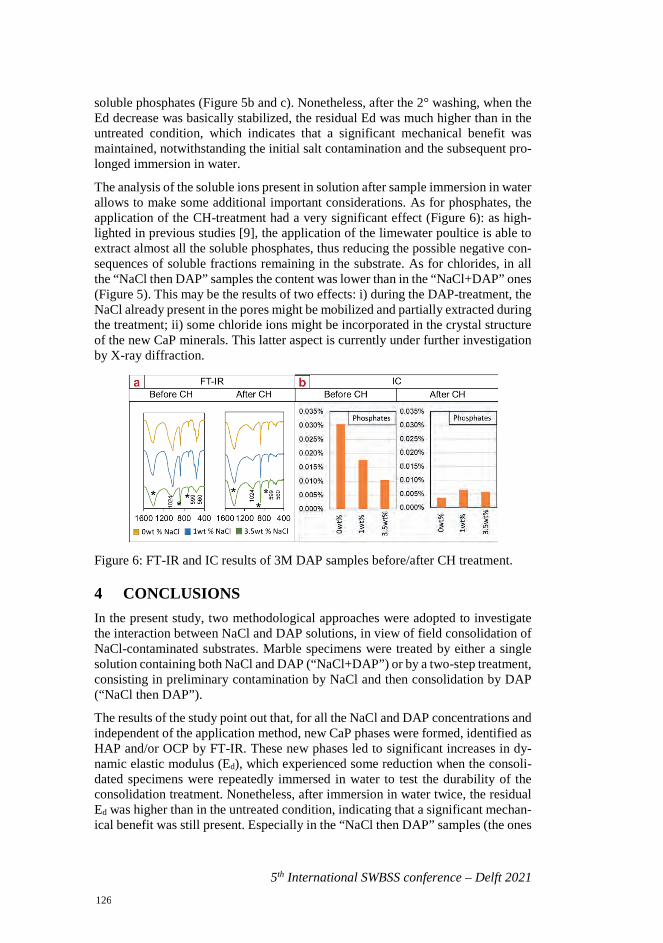
5th International SWBSS conference – Delft 2021
soluble phosphates (Figure 5b and c). Nonetheless, after the 2° washing, when the Ed decrease was basically stabilized, the residual Ed was much higher than in the untreated condition, which indicates that a significant mechanical benefit was maintained, notwithstanding the initial salt contamination and the subsequent pro-longed immersion in water.
The analysis of the soluble ions present in solution after sample immersion in water allows to make some additional important considerations. As for phosphates, the application of the CH-treatment had a very significant effect (Figure 6): as high-lighted in previous studies [9], the application of the limewater poultice is able to extract almost all the soluble phosphates, thus reducing the possible negative con-sequences of soluble fractions remaining in the substrate. As for chlorides, in all the “NaCl then DAP” samples the content was lower than in the “NaCl+DAP” ones (Figure 5). This may be the results of two effects: i) during the DAP-treatment, the NaCl already present in the pores might be mobilized and partially extracted during the treatment; ii) some chloride ions might be incorporated in the crystal structure of the new CaP minerals. This latter aspect is currently under further investigation by X-ray diffraction.
Figure 6: FT-IR and IC results of 3M DAP samples before/after CH treatment.
4 CONCLUSIONS In the present study, two methodological approaches were adopted to investigate the interaction between NaCl and DAP solutions, in view of field consolidation of NaCl-contaminated substrates. Marble specimens were treated by either a single solution containing both NaCl and DAP (“NaCl+DAP”) or by a two-step treatment, consisting in preliminary contamination by NaCl and then consolidation by DAP (“NaCl then DAP”).
The results of the study point out that, for all the NaCl and DAP concentrations and independent of the application method, new CaP phases were formed, identified as HAP and/or OCP by FT-IR. These new phases led to significant increases in dy-namic elastic modulus (Ed), which experienced some reduction when the consoli-dated specimens were repeatedly immersed in water to test the durability of the consolidation treatment. Nonetheless, after immersion in water twice, the residual Ed was higher than in the untreated condition, indicating that a significant mechan-ical benefit was still present. Especially in the “NaCl then DAP” samples (the ones
126
G. Ugolotti, G. Masi, and E. Sassoni
5th International SWBSS conference – Delft 2021
more realistically resembling the treatment conditions in the field), the presence of NaCl in the pores did not have a dramatic negative effect on the treatment outcome, even for high NaCl concentrations (3.5 wt%, corresponding to NaCl concentration in seawater). Actually, the presence of a small amount (1 wt%) of salt in the pores apparently improved the treatment effect (higher Ed increase compared to the 0 wt% NaCl reference), possibly because the NaCl crystals acted as nucleation sites for the new CaP. The possible incorporation of chloride ions into the CaP crystal is currently under investigation by XRD.
Regarding the reliability of the two approaches to study the influence of NaCl con-tamination, the two-step treatment “NaCl then DAP”, seems as more reliable. In fact, the “NaCl+DAP” treatment led to lower increases of Ed and less pronounced formation of new CaP as assessed by FT-IR and XRD, possibly because the pres-ence of sodium and chloride ions in the DAP solution significantly altered the mechanisms of formation of the new CaP.
REFERENCES [1] M. Favaro et al., “Evaluation of polymers for conservation treatments of out-
door exposed stone monuments. Part I: Photo-oxidative weathering,” Polym. Degrad. Stab., vol. 91, no. 12, pp. 3083–3096, 2006
[2] G. W. Scherer and G. S. Wheeler, “Silicate consolidants for stone,” Key Eng. Mater., vol. 391, pp. 1–25, 2009
[3] C. Rodriguez-Navarro and E. Ruiz-Agudo, “Nanolimes: From synthesis to application,” Pure Appl. Chem., vol. 90, no. 3, pp. 523–550, 2018
[4] E. Sassoni, S. Naidu, and G. W. Scherer, “The use of hydroxyapatite as a new inorganic consolidant for damaged carbonate stones,” J. Cult. Herit., vol. 12, no. 4, pp. 346–355, 2011
[5] M. Matteini, S. Rescic, F. Fratini, and G. Botticelli, “Ammonium phosphates as consolidating agents for carbonatic stone materials used in architecture and cultural heritage: Preliminary research,” Int. J. Archit. Herit., vol. 5, no. 6, pp. 717–736, 2011
[6] E. Sassoni, “Hydroxyapatite And Other calcium phosphates for the conserva-tion of cultural heritage: A review,” Materials (Basel), vol. 11, no. 4, 2018
[7] E. Sassoni, G. Graziani, and E. Franzoni, “An innovative phosphate-based consolidant for limestone. Part 1: Effectiveness and compatibility in compar-ison with ethyl silicate,” Constr. Build. Mater., vol. 102, pp. 918–930, 2016
[8] E. Sassoni, G. Graziani, and E. Franzoni, “An innovative phosphate-based consolidant for limestone. Part 2: Durability in comparison with ethyl sili-cate,” Constr. Build. Mater., vol. 102, pp. 931–942, 2016
[9] E. Franzoni, E. Sassoni, and G. Graziani, “Brushing, poultice or immersion? The role of the application technique on the performance of a novel hydrox-yapatite-based consolidating treatment for limestone,” J. Cult. Herit., vol. 16, no. 2, pp. 173–184, 2015
127

5th International SWBSS conference – Delft 2021
[10] I.A. Karampas, C.G. Kontoyannis, Characterization of calcium phosphatesmixtures, Vib. Spectrosc. 64 (2013), pp 126–133
[11] T. Mifsud, J. Cassar, The treatment of weathered Globigerina Limestone: thesurface conversion of calcium carbonate to calcium oxalate, Proc. Int. Conf.Herit. Weather. Conserv. HWC , 2006, pp 727–734.
128
5th International SWBSS conference – Delft 2021
COMPARISON BETWEEN DAMAGE DEVELOPMENT ON COMPOSITE AND STANDARDIZED MORTAR SPECIMENS EXPOSED TO SOLUBLE SALTS
Marina M. Aškrabić1*, Dimitrije M. Zakić2, Aleksandar R. Savić2, Ljiljana R. Miličić3, Ivana M. Delić-Nikolić4, and Zorica Lj. Ilić5
KEYWORDS Rendering mortars, salt crystallization, salt distribution, lime based mortars
ABSTRACT Salt crystallization of lime-based rendering mortars is one of the most common reasons for their deterioration. Still, testing of the resistance to soluble salt action has not yet been standardized for this type of material. Lime-based renders are usu-ally placed in several layers, each of them having a specific role and composition. Nevertheless, tests used in the literature are commonly performed on standardized prismatic or cylindrical mortar specimens. This paper presents a comparison be-tween damage development on the composite samples, prepared on porous stone substrate with two types of rendering mortars, and standardized prismatic mortar specimens. Samples were prepared with pure putty lime mortars and lime-putty based mortars with the addition of natural zeolite. Two types of composite samples and four types of prismatic samples were used during the test. The testing was con-ducted at the age of 90 days using two types of salt solutions (NaCl and Na2SO4). Damage development was followed visually during five cycles of wetting and dry-ing. Salt distribution using XRF analysis was measured at the end of the test on composite samples. It was shown that damage development greatly depends both on sample and mortar types.
1 Faculty of Civil Engineering, University of Belgrade, Belgrade, Serbia, ama-
[email protected] 2 Faculty of Civil Engineering, University of Belgrade, Belgrade, Serbia 3 IMS Institute, Belgrade, Serbia 4 IMS Institute, Belgrade, Serbia 5 Faculty of Civil Engineering, University of Belgrade, Belgrade, Serbia
129
5th International SWBSS conference – Delft 2021
1 INTRODUCTION Salt crystallization is one of the most common degradation mechanisms in porous materials [1]. The main factors affecting the development of the damage are the presence of salt and moisture within the sample, physical properties and the micro-structure of the material, and environmental conditions such as temperature (T) and relative humidity (RH). As a consequence, salt crystals can be formed at the surface of the material (efflorescence) or within the material (sub florescence). Which of these cases prevails, depends on the drying front position which is formed at the plane of equality of liquid and gas flux.
The soluble salts can cause three types of damage in the porous building materials: aesthetic, damage connected with the presence of moisture and damage of material [2]. Effective testing of material durability in the presence of soluble salts should determine the durability of the material, and in the case of restoration of historical buildings - compatibility between the existing and newly prepared materials. Ef-fective test should take care of different parameters: dimensions, type and number of samples, type of salts and concentration of the used solution, ways of accumu-lation of salts in the sample and the environmental conditions during wetting and drying of samples, ways of following and determining damage on the samples. De-tailed overview of different testing methods used so far is presented in the paper [3] as a result of work of the RILEM TC 271-ASC.
2 MATERIALS AND METHODS The research presented in this paper is focused on resistance testing of lime based rendering mortars to the action of soluble salts. Since rendering mortars were histor-ically placed in several layers, each of them having specific design and function [4], durability testing should be performed on the representative samples. Testing of mor-tars in this paper was performed on two types of samples: composite samples con-sisting of two rendering layers placed on the base of natural stone and standardized prismatic mortar samples (4×4×16 cm), further referred to as standardized samples.
Tested mortars were two reference mortars 1/3 and 1/1, consisting only of lime-putty (produced by “Javor”, Veternik, Serbia), river sand and water, and two mor-tars with partial replacement of lime with natural zeolite, 1/3-40 and 1/1-20. Com-position of these mortars is presented in Table 1. Zeolitic tuff used, consisted mostly of clinoptilolite, and originated from Igroš, near Brus, Serbia. Detailed de-scription of the mortar mixes and their physical, mechanical and microstructural properties are presented in paper [5].
Testing conditions were based on the method presented in [2]. Samples were exposed to the 10% salt solution, by capillary action, during the defined period of time and only during first wetting. In the four consequent wettings, samples were immersed only in deionized water. Conditions of drying during one day are shown in Figure 1. The presented cycle was repeated until the 80% of absorbed water evaporated from all of the samples.
The differences between the testing method presented here and in the paper men-tioned above [2] were mostly regarding the composite sample preparation and the duration of the samples’ exposure to the soluble salt solutions.
130
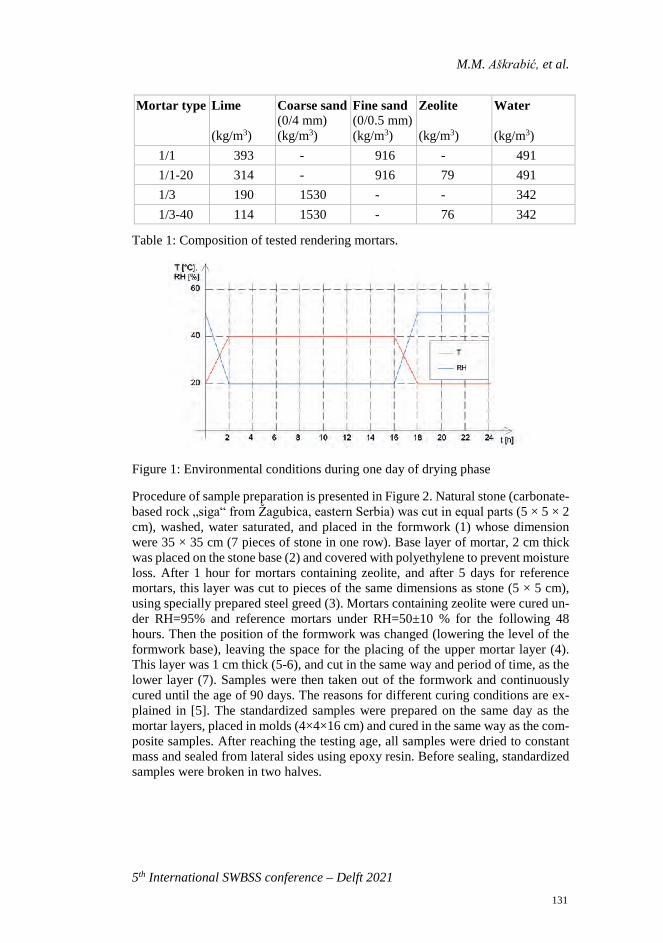
M.M. Aškrabić, et al.
5th International SWBSS conference – Delft 2021
Mortar type Lime (kg/m3)
Coarse sand (0/4 mm) (kg/m3)
Fine sand (0/0.5 mm) (kg/m3)
Zeolite (kg/m3)
Water (kg/m3)
1/1 393 - 916 - 491 1/1-20 314 - 916 79 491 1/3 190 1530 - - 342 1/3-40 114 1530 - 76 342
Table 1: Composition of tested rendering mortars.
Figure 1: Environmental conditions during one day of drying phase
Procedure of sample preparation is presented in Figure 2. Natural stone (carbonate-based rock „siga“ from Žagubica, eastern Serbia) was cut in equal parts (5 × 5 × 2 cm), washed, water saturated, and placed in the formwork (1) whose dimension were 35 × 35 cm (7 pieces of stone in one row). Base layer of mortar, 2 cm thick was placed on the stone base (2) and covered with polyethylene to prevent moisture loss. After 1 hour for mortars containing zeolite, and after 5 days for reference mortars, this layer was cut to pieces of the same dimensions as stone (5 × 5 cm), using specially prepared steel greed (3). Mortars containing zeolite were cured un-der RH=95% and reference mortars under RH=50±10 % for the following 48 hours. Then the position of the formwork was changed (lowering the level of the formwork base), leaving the space for the placing of the upper mortar layer (4). This layer was 1 cm thick (5-6), and cut in the same way and period of time, as the lower layer (7). Samples were then taken out of the formwork and continuously cured until the age of 90 days. The reasons for different curing conditions are ex-plained in [5]. The standardized samples were prepared on the same day as the mortar layers, placed in molds (4×4×16 cm) and cured in the same way as the com-posite samples. After reaching the testing age, all samples were dried to constant mass and sealed from lateral sides using epoxy resin. Before sealing, standardized samples were broken in two halves.
131
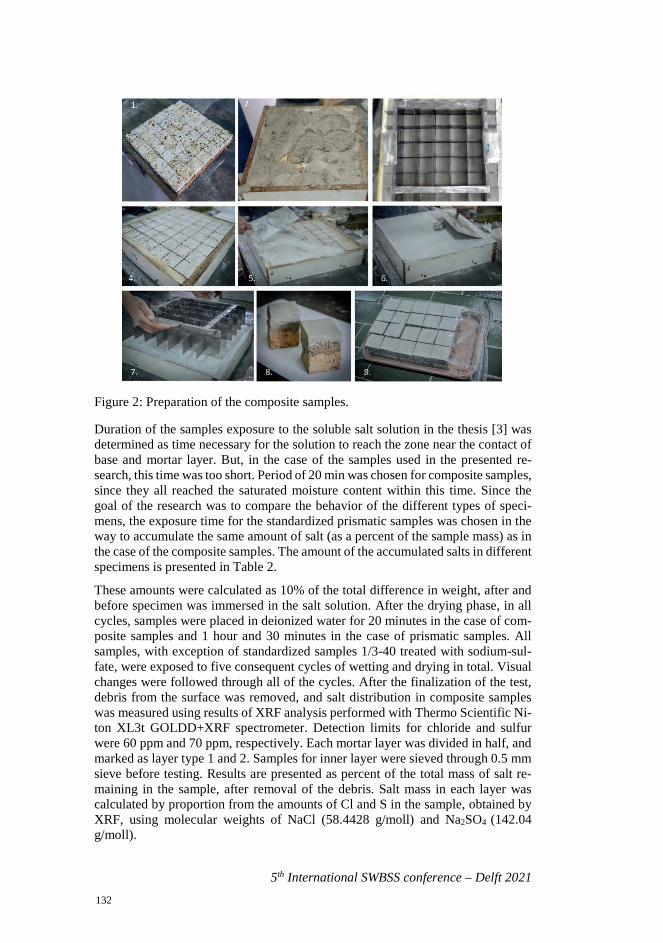
5th International SWBSS conference – Delft 2021
Figure 2: Preparation of the composite samples.
Duration of the samples exposure to the soluble salt solution in the thesis [3] was determined as time necessary for the solution to reach the zone near the contact of base and mortar layer. But, in the case of the samples used in the presented re-search, this time was too short. Period of 20 min was chosen for composite samples, since they all reached the saturated moisture content within this time. Since the goal of the research was to compare the behavior of the different types of speci-mens, the exposure time for the standardized prismatic samples was chosen in the way to accumulate the same amount of salt (as a percent of the sample mass) as in the case of the composite samples. The amount of the accumulated salts in different specimens is presented in Table 2.
These amounts were calculated as 10% of the total difference in weight, after and before specimen was immersed in the salt solution. After the drying phase, in all cycles, samples were placed in deionized water for 20 minutes in the case of com-posite samples and 1 hour and 30 minutes in the case of prismatic samples. All samples, with exception of standardized samples 1/3-40 treated with sodium-sul-fate, were exposed to five consequent cycles of wetting and drying in total. Visual changes were followed through all of the cycles. After the finalization of the test, debris from the surface was removed, and salt distribution in composite samples was measured using results of XRF analysis performed with Thermo Scientific Ni-ton XL3t GOLDD+XRF spectrometer. Detection limits for chloride and sulfur were 60 ppm and 70 ppm, respectively. Each mortar layer was divided in half, and marked as layer type 1 and 2. Samples for inner layer were sieved through 0.5 mm sieve before testing. Results are presented as percent of the total mass of salt re-maining in the sample, after removal of the debris. Salt mass in each layer was calculated by proportion from the amounts of Cl and S in the sample, obtained by XRF, using molecular weights of NaCl (58.4428 g/moll) and Na2SO4 (142.04 g/moll).
132
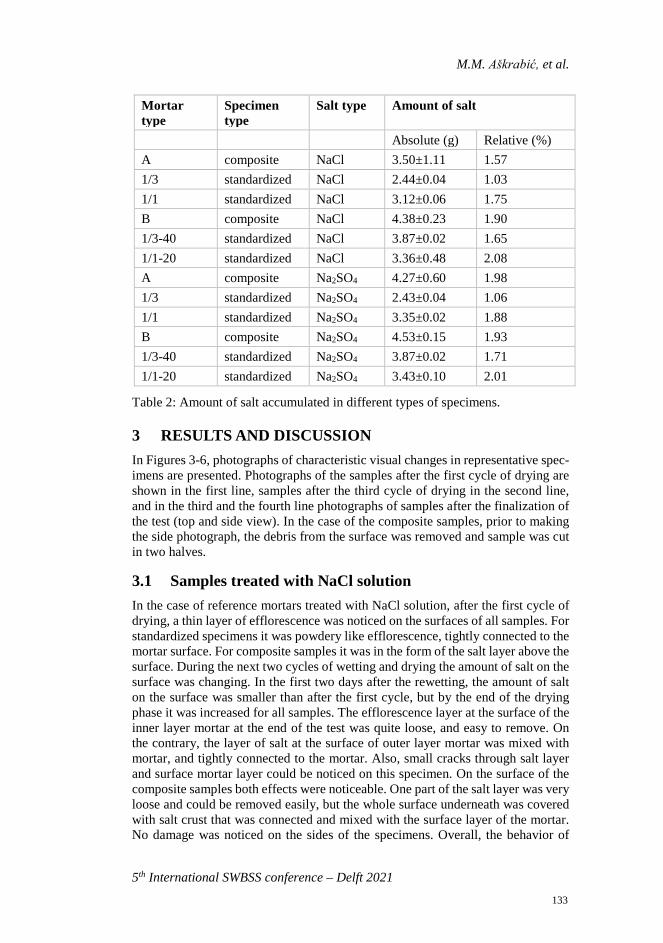
M.M. Aškrabić, et al.
5th International SWBSS conference – Delft 2021
Mortar type
Specimen type
Salt type Amount of salt
Absolute (g) Relative (%) A composite NaCl 3.50±1.11 1.57 1/3 standardized NaCl 2.44±0.04 1.03 1/1 standardized NaCl 3.12±0.06 1.75 B composite NaCl 4.38±0.23 1.90 1/3-40 standardized NaCl 3.87±0.02 1.65 1/1-20 standardized NaCl 3.36±0.48 2.08 A composite Na2SO4 4.27±0.60 1.98 1/3 standardized Na2SO4 2.43±0.04 1.06 1/1 standardized Na2SO4 3.35±0.02 1.88 B composite Na2SO4 4.53±0.15 1.93 1/3-40 standardized Na2SO4 3.87±0.02 1.71 1/1-20 standardized Na2SO4 3.43±0.10 2.01
Table 2: Amount of salt accumulated in different types of specimens.
3 RESULTS AND DISCUSSION In Figures 3-6, photographs of characteristic visual changes in representative spec-imens are presented. Photographs of the samples after the first cycle of drying are shown in the first line, samples after the third cycle of drying in the second line, and in the third and the fourth line photographs of samples after the finalization of the test (top and side view). In the case of the composite samples, prior to making the side photograph, the debris from the surface was removed and sample was cut in two halves.
3.1 Samples treated with NaCl solution In the case of reference mortars treated with NaCl solution, after the first cycle of drying, a thin layer of efflorescence was noticed on the surfaces of all samples. For standardized specimens it was powdery like efflorescence, tightly connected to the mortar surface. For composite samples it was in the form of the salt layer above the surface. During the next two cycles of wetting and drying the amount of salt on the surface was changing. In the first two days after the rewetting, the amount of salt on the surface was smaller than after the first cycle, but by the end of the drying phase it was increased for all samples. The efflorescence layer at the surface of the inner layer mortar at the end of the test was quite loose, and easy to remove. On the contrary, the layer of salt at the surface of outer layer mortar was mixed with mortar, and tightly connected to the mortar. Also, small cracks through salt layer and surface mortar layer could be noticed on this specimen. On the surface of the composite samples both effects were noticeable. One part of the salt layer was very loose and could be removed easily, but the whole surface underneath was covered with salt crust that was connected and mixed with the surface layer of the mortar. No damage was noticed on the sides of the specimens. Overall, the behavior of
133
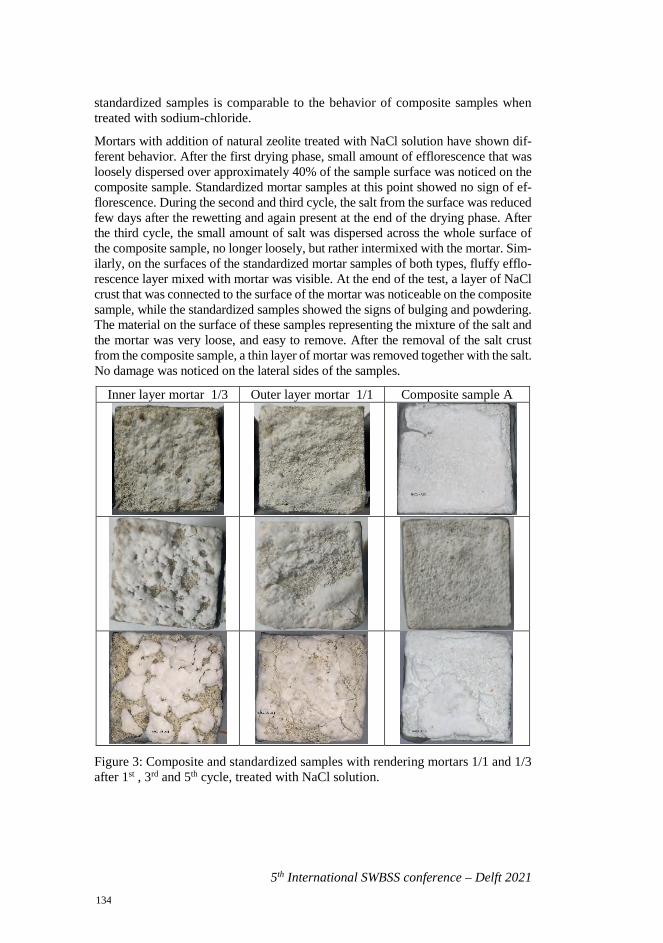
5th International SWBSS conference – Delft 2021
standardized samples is comparable to the behavior of composite samples when treated with sodium-chloride.
Mortars with addition of natural zeolite treated with NaCl solution have shown dif-ferent behavior. After the first drying phase, small amount of efflorescence that was loosely dispersed over approximately 40% of the sample surface was noticed on the composite sample. Standardized mortar samples at this point showed no sign of ef-florescence. During the second and third cycle, the salt from the surface was reduced few days after the rewetting and again present at the end of the drying phase. After the third cycle, the small amount of salt was dispersed across the whole surface of the composite sample, no longer loosely, but rather intermixed with the mortar. Sim-ilarly, on the surfaces of the standardized mortar samples of both types, fluffy efflo-rescence layer mixed with mortar was visible. At the end of the test, a layer of NaCl crust that was connected to the surface of the mortar was noticeable on the composite sample, while the standardized samples showed the signs of bulging and powdering. The material on the surface of these samples representing the mixture of the salt and the mortar was very loose, and easy to remove. After the removal of the salt crust from the composite sample, a thin layer of mortar was removed together with the salt. No damage was noticed on the lateral sides of the samples.
Inner layer mortar 1/3 Outer layer mortar 1/1 Composite sample A
Figure 3: Composite and standardized samples with rendering mortars 1/1 and 1/3 after 1st , 3rd and 5th cycle, treated with NaCl solution.
134
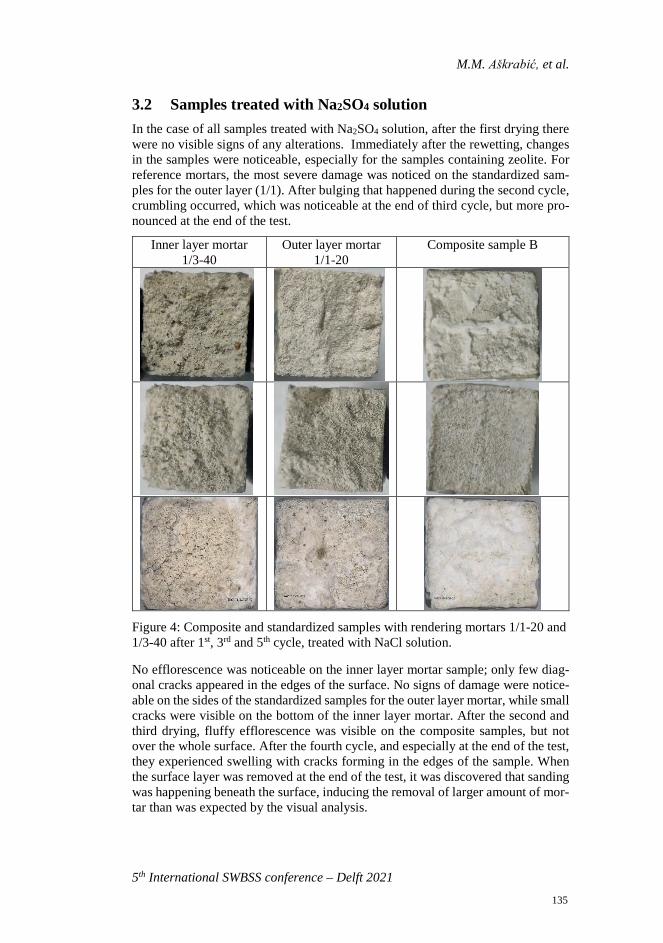
M.M. Aškrabić, et al.
5th International SWBSS conference – Delft 2021
3.2 Samples treated with Na2SO4 solution In the case of all samples treated with Na2SO4 solution, after the first drying there were no visible signs of any alterations. Immediately after the rewetting, changes in the samples were noticeable, especially for the samples containing zeolite. For reference mortars, the most severe damage was noticed on the standardized sam-ples for the outer layer (1/1). After bulging that happened during the second cycle, crumbling occurred, which was noticeable at the end of third cycle, but more pro-nounced at the end of the test.
Inner layer mortar 1/3-40
Outer layer mortar 1/1-20
Composite sample B
Figure 4: Composite and standardized samples with rendering mortars 1/1-20 and 1/3-40 after 1st, 3rd and 5th cycle, treated with NaCl solution.
No efflorescence was noticeable on the inner layer mortar sample; only few diag-onal cracks appeared in the edges of the surface. No signs of damage were notice-able on the sides of the standardized samples for the outer layer mortar, while small cracks were visible on the bottom of the inner layer mortar. After the second and third drying, fluffy efflorescence was visible on the composite samples, but not over the whole surface. After the fourth cycle, and especially at the end of the test, they experienced swelling with cracks forming in the edges of the sample. When the surface layer was removed at the end of the test, it was discovered that sanding was happening beneath the surface, inducing the removal of larger amount of mor-tar than was expected by the visual analysis.
135
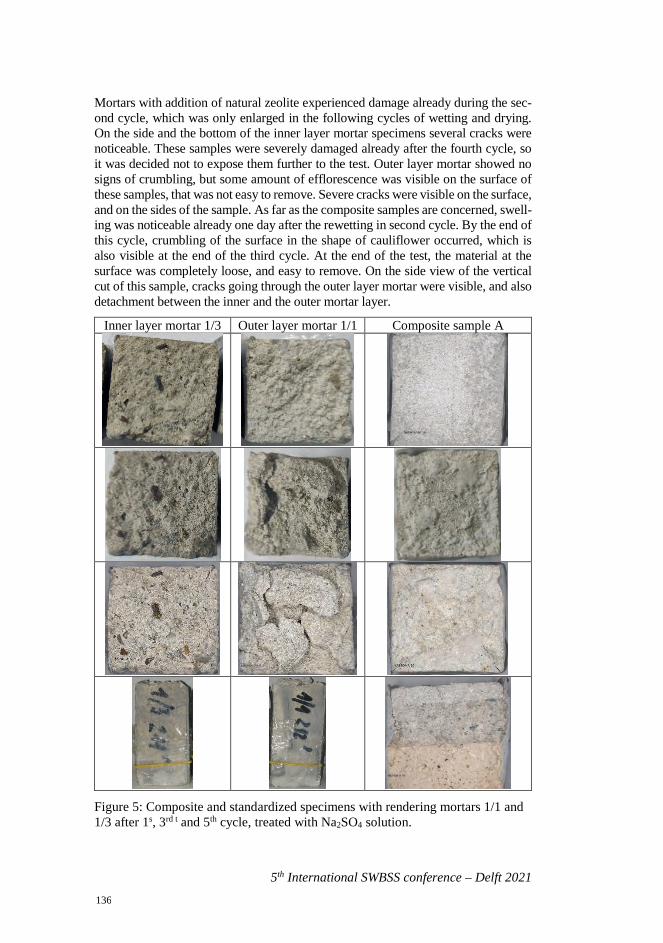
5th International SWBSS conference – Delft 2021
Mortars with addition of natural zeolite experienced damage already during the sec-ond cycle, which was only enlarged in the following cycles of wetting and drying. On the side and the bottom of the inner layer mortar specimens several cracks were noticeable. These samples were severely damaged already after the fourth cycle, so it was decided not to expose them further to the test. Outer layer mortar showed no signs of crumbling, but some amount of efflorescence was visible on the surface of these samples, that was not easy to remove. Severe cracks were visible on the surface, and on the sides of the sample. As far as the composite samples are concerned, swell-ing was noticeable already one day after the rewetting in second cycle. By the end of this cycle, crumbling of the surface in the shape of cauliflower occurred, which is also visible at the end of the third cycle. At the end of the test, the material at the surface was completely loose, and easy to remove. On the side view of the vertical cut of this sample, cracks going through the outer layer mortar were visible, and also detachment between the inner and the outer mortar layer.
Inner layer mortar 1/3 Outer layer mortar 1/1 Composite sample A
Figure 5: Composite and standardized specimens with rendering mortars 1/1 and 1/3 after 1s, 3rd t and 5th cycle, treated with Na2SO4 solution.
136
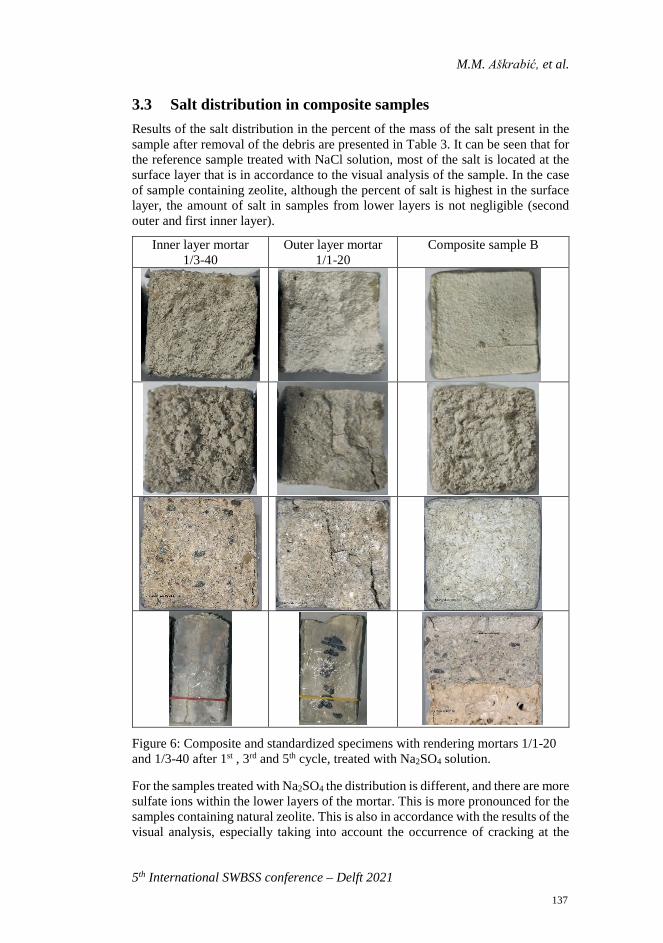
M.M. Aškrabić, et al.
5th International SWBSS conference – Delft 2021
3.3 Salt distribution in composite samples Results of the salt distribution in the percent of the mass of the salt present in the sample after removal of the debris are presented in Table 3. It can be seen that for the reference sample treated with NaCl solution, most of the salt is located at the surface layer that is in accordance to the visual analysis of the sample. In the case of sample containing zeolite, although the percent of salt is highest in the surface layer, the amount of salt in samples from lower layers is not negligible (second outer and first inner layer).
Inner layer mortar 1/3-40
Outer layer mortar 1/1-20
Composite sample B
Figure 6: Composite and standardized specimens with rendering mortars 1/1-20 and 1/3-40 after 1st , 3rd and 5th cycle, treated with Na2SO4 solution.
For the samples treated with Na2SO4 the distribution is different, and there are more sulfate ions within the lower layers of the mortar. This is more pronounced for the samples containing natural zeolite. This is also in accordance with the results of the visual analysis, especially taking into account the occurrence of cracking at the
137
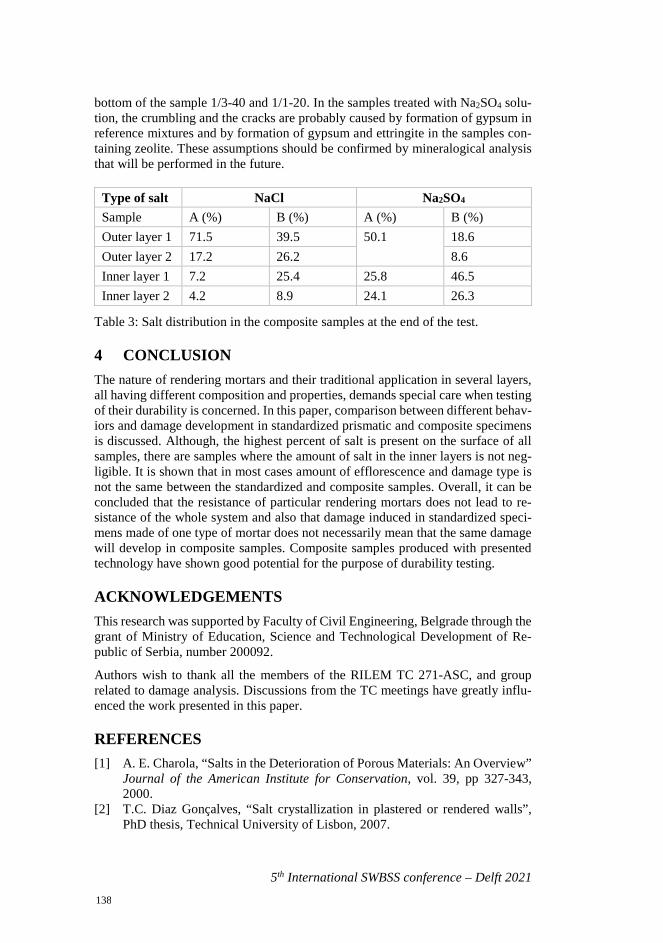
5th International SWBSS conference – Delft 2021
bottom of the sample 1/3-40 and 1/1-20. In the samples treated with Na2SO4 solu-tion, the crumbling and the cracks are probably caused by formation of gypsum in reference mixtures and by formation of gypsum and ettringite in the samples con-taining zeolite. These assumptions should be confirmed by mineralogical analysis that will be performed in the future.
Type of salt NaCl Na2SO4 Sample A (%) B (%) A (%) B (%) Outer layer 1 71.5 39.5 50.1 18.6 Outer layer 2 17.2 26.2 8.6 Inner layer 1 7.2 25.4 25.8 46.5 Inner layer 2 4.2 8.9 24.1 26.3
Table 3: Salt distribution in the composite samples at the end of the test.
4 CONCLUSION The nature of rendering mortars and their traditional application in several layers, all having different composition and properties, demands special care when testing of their durability is concerned. In this paper, comparison between different behav-iors and damage development in standardized prismatic and composite specimens is discussed. Although, the highest percent of salt is present on the surface of all samples, there are samples where the amount of salt in the inner layers is not neg-ligible. It is shown that in most cases amount of efflorescence and damage type is not the same between the standardized and composite samples. Overall, it can be concluded that the resistance of particular rendering mortars does not lead to re-sistance of the whole system and also that damage induced in standardized speci-mens made of one type of mortar does not necessarily mean that the same damage will develop in composite samples. Composite samples produced with presented technology have shown good potential for the purpose of durability testing.
ACKNOWLEDGEMENTS This research was supported by Faculty of Civil Engineering, Belgrade through the grant of Ministry of Education, Science and Technological Development of Re-public of Serbia, number 200092.
Authors wish to thank all the members of the RILEM TC 271-ASC, and group related to damage analysis. Discussions from the TC meetings have greatly influ-enced the work presented in this paper.
REFERENCES [1] A. E. Charola, “Salts in the Deterioration of Porous Materials: An Overview”
Journal of the American Institute for Conservation, vol. 39, pp 327-343,2000.
[2] T.C. Diaz Gonçalves, “Salt crystallization in plastered or rendered walls”,PhD thesis, Technical University of Lisbon, 2007.
138

M.M. Aškrabić, et al.
5th International SWBSS conference – Delft 2021
[3] B. Lubelli et al., “Towards a more effective and reliable salt crystallization test for porous building materials: state of the art,” Mater. Struct. Constr., vol. 51, 2018.
[4] M. Barbero-Barrera et al., Lime render layers: An overview of their proper-ties, J. Cult. Herit., vol. 15, pp 326-330, 2014.
[5] M. Aškrabić et al., „Effects of natural zeolite addition on the properties of lime-putty based rendering mortars“, Constr. Build. Mater., vol. 270, 121363, 2021.
139

140
5th International SWBSS conference – Delft 2021
MICRO-PHOTOGRAMMETRY TO MONITOR SALT IMPACT ON PETROGLYPHS
Andrew J. Thorn1*, and Ben T. Collie2
KEYWORDS Micro-photogrammetry, delamination, crypto-fluorescence, micro-spalling
ABSTRACT A project focusing on the potential industrial impact on a cluster of one million engraved boulders in a remote desert location, requires, among other metrics, the study of micro-spalling because of potential crypto-fluorescence, or surface depo-sition, both of which change the surface morphology at the micro-scale, including pre-spall swelling.
Project outcomes include deploying technologies readily implemented in-field, ul-timately by locally trained operators.
This paper outlines the system, including the operation of a portable fully auto-mated triaxial scanning frame and the processing technologies deployed to produce a 3D photogrammetric model, and the further processing of that model to provide long-term indicators of change.
All three axes are programmed to scan with a single button press, gathering up to 5,600 images over the target within 150 minutes. To acquire fully focused Z-axis images, a stack of 20 images is acquired at 1 mm vertical intervals. The other di-mensions are set to image any given point 4-9 times, depending on the overlap.
System screening identified a 36Mp DSLR fitted with a Zeiss 4x objective as the most effective imaging system, including being an existing piece of field equip-ment used for other studies, only requiring the addition of the objective and its mount.
The Z-axis image stacks are processed through Helicon Focus to reduce the 5,600 images to 250 stacks, submitted to Agisoft Metashape for model construction. The model is interrogated using various measurement programs including CAD, Metashape and Cloud Compare to establish vital change metrics.
1 ARTCARE, Ste Foy la Grande, France [email protected] 2 ARTCARE, Fitzroy North, Victoria, Australia
141
5th International SWBSS conference – Delft 2021
1 INTRODUCTION Salt, in its simplest chemical definition, is the reaction between an acid and a base. In the context of this conference salts are typically deliquescent species or less sol-uble types, both disrupting the surface and altering its appearance. In a five-year study of the interaction between industrial gaseous by-products, the atmosphere through which they travel and an exposed rock surface upon which they interact, change is being measured, chromatically, elementally, and dimensionally. The multi-disciplinary study includes atmospheric modelling and measurement, to-gether with laboratory focused geological, bio-geological and microbiome studies. This photogrammetric system has been designed to model a group of approxi-mately one million engraved boulders in a coastal desert location in Western Aus-tralia. The engravings have been pecked and abraded into a relatively soft weath-ering rind formed on the surface of gabbro and granophyre type igneous rocks.
The authors are responsible for in situ change metrics including colorimetric, ele-mental, and topological change. While all three techniques combine to measure change, only physical dimensional change is described in this paper. This project requires that all metrology be non-contact or minimally so, where it can be demon-strated to be non-disruptive to the surface.
To measure short term dimensional changes requires a detailed scan of the surface at reasonably high resolution. In general surveying, laser scanning provides more accurate results than photogrammetry, however accuracy is a function of distance from target to sensor. Optical profilometry can achieve sub-micron Z-axis resolu-tion, but traditionally has required the sample to be brought to the instrument. More recently portable options are emerging [1]. In the current study image acquisition is achieved through a Zeiss 4x objective attached to a 36Mp digital SLR to operate approximately 70 mm from the surface with a 20x14 mm framing, providing less than 3 micron per pixel resolution. This compares to typical macro-lens-based pho-tography, which is typically 80mm across [2] .The key is that the system can be carried to the object, and the object can be of any dimension and in any orientation.
Despite its reduced operating distance, the objective-on-camera system allows for very close-range imaging and when attached to a microprocessor-controlled scan-ning table acquires surface topography over an area of any desired dimensions.
The technology will be fully described, however due obligations to the custodial community and the contract, the site will not be discussed.
2 THE AIMS OF THE STUDY Industrial impact is being assessed in a multi-disciplinary study, due to concerns expressed by several observers that rapid change has occurred or will occur to the visibility of cultural markings. One component of this study is the in-situ metrology of change to the surface, including colorimetric, elemental, and morphological change. Within the three in-situ metrics, morphological change is being monitored through annual modelling campaigns over five years initially to determine to what extent the surface is undergoing alteration. Colour change has been seen in previ-ous studies as the primary indicator of change, however this can only be deter-mined if the physical integrity of the surface is confirmed. The loss of one mineral
142
A. Thorn, and B. Collie
5th International SWBSS conference – Delft 2021
grain or ephemeral precipitate may distort the colour and this can only be confirmed through a detailed study of the surface. More relevant to the theme of this confer-ence, surface disturbance may take place with only micro-morphological change. This would occur where delamination and crypto-florescence are just beginning to develop within the surface. Of course, ephemeral efflorescence will alter the colour quite markedly and sporadically.
To record morphological change a system has been refined to capture the three-dimensional morphology in sufficiently fine detail and to provide comparative al-teration data over time.
The cultural markings can be more than a meter in length; however, they all have a more or less consistent engraved channel no more than 50mm wide and up to 20mm in depth. For that reason, a study area of nominally 100x100 mm has been chosen to embrace the engraving detail and sufficient surroundings to include ref-erence markers and related deterioration features, such as the extensive delamina-tion occurring on many surfaces. Monitoring of delamination rates, while readily discernible, forms part of the documentation obtained through this study.
3 INSTRUMENTATION AND METHODOLGY Due to the remote coastal desert location along the north west coast of Western Australia, system design has started with site constraints, worked its way through the transportation pathway and arrived at the laboratory. Photogrammetry has been chosen over other techniques because it is relatively compact, provides readily readable real-world imaging and relies on an extensive set of primary images that separately serve as very useful documentary records.
Various early implementations have been trialed, including a stereo microscope with both DSLR and digital imaging devices fitted. A 16Mp microscope digital imager with purpose made lens was also considered for its auto-focus benefit, how-ever auto-focus is challenging for any macro-photography even with suitably high frame rates. Similarly, several microscope objectives were tested, with the 4x giv-ing the best compromise between magnification and depth of focus. Plan achro-matic lenses are chosen for their flat image, without requiring the fastidious colour correction of the more expensive Plan apochromatic colour balanced optics.
3.1 Image acquisition The approach requires image acquisition in-situ using a Zeiss 4x NA 0.1Plan-achromatic objective fitted to a Pentax K1 36Mp full-frame DSLR using a standard objective mount. Such mounts remove auto-focus functionality, which shapes the scanning protocols described below. Plan achromatic objectives give the flattest, most in focus image of any optics, whereas the achromatic feature is sufficient for non-colour critical applications, as colour change is measured spectrometrically.
Images are acquired in .jpg format only as this gives the same level of sharpness as RAW image reconstruction, the superior colour control of the latter not relevant to the study. Much finer colour metrics are achieved through a detailed Spectropho-tometric study. File transfer is done manually at the end of the image acquisition cycle, although Wi-Fi syncing is available. Up to 5,600 36Mp images are acquired,
143
5th International SWBSS conference – Delft 2021
requiring 155 Gb SD storage. This increases to 264Gb for a 61Mp sensor. A camera with two SD slots makes this manageable.
The photogrammetric processing, covered in the next section, relies on some of the exif (exchangeable image file format) data from the image, importantly the focal distance of the lens. Focal distance is that between the object and the imaging sen-sor focal plane, neither of which is recorded in the adopted optical configuration. For a camera lens the focal distance can be approximately measured when a light beam is in focus on a sheet of paper when shone through the lens. A microscope objective is more difficult to measure, however the sharpest light beam is a reason-able measure. The focal length can be set in the camera manually and is usually asked for where a manual lens is connected to the body. The only additional ad-justment is to tell the camera, through the settings, that an extension ring is in use.
With this configuration the objective has a 70mm working distance, providing an image frame 20x14mm. The objective can be fixed further out of the mount to produce a frame 16 mm wide at a working distance of 55mm from the surface. A 5x objective has been tested with the wide view reduced from 16 to 6mm, consid-ered closer than necessary for the detail sought. The 36Mp sensor provides approx-imately 360 pixels per millimetre (2.8microns per pixel) for a 20x14 image, in-creasing to 460 px/mm for 16 mm wide image 2.2 microns per pixel). The program plans to migrate to a 60Mp mirrorless camera, providing better image stability at high resolutions and a pixel density approaching 600 px/mm. While depth of focus is difficult to precisely quantify, a 2mm tall text on a flat sheet of paper is sharp through approximately 4 mm of focal travel. Contrasting with this is the heteroge-neity of the surface to be studied, which includes natural undularity and the cultural channel depth, requiring the objective to travel up to 20 mm, although greater travel and bracketing can be programmed into the Arduino controller very simply.
Photogrammetry protocols usually stipulate a 60% overlap between frames to al-low for full stereoscopic reconstruction of the Z-axis. A 60% overlap ensures that any point on the surface is imaged four times. Setting the frame overlap to 40% ensures that the same point appears in nine images, as indicated in figure 1. This additional coverage, at a cost of a 20% tighter scan yields 225% image density, resulting in better resolution of the 3D model.
Even at the shorter 55 mm focal distance the camera is no more than 19° from vertical, and while this is sufficient to produce good stereoscopic resolution the camera mount includes a graduated rotary baseplate for precise rotation of the cam-era to provide more oblique views. To benefit from off-set camera views requires a double scan to capture the scene form both angles. The downside to running an automated double scan is the extra demand on power and storage, together with the doubling of photogrammetric processing.
An efficient alternative would be to run a 60% overlap at a 25-30° offset to left then right, reducing the total image count to around 2/3 of the 40% single pass regime, with better height resolution. Tilting the lens too far will result in reduced in-focus areas in every image.
144
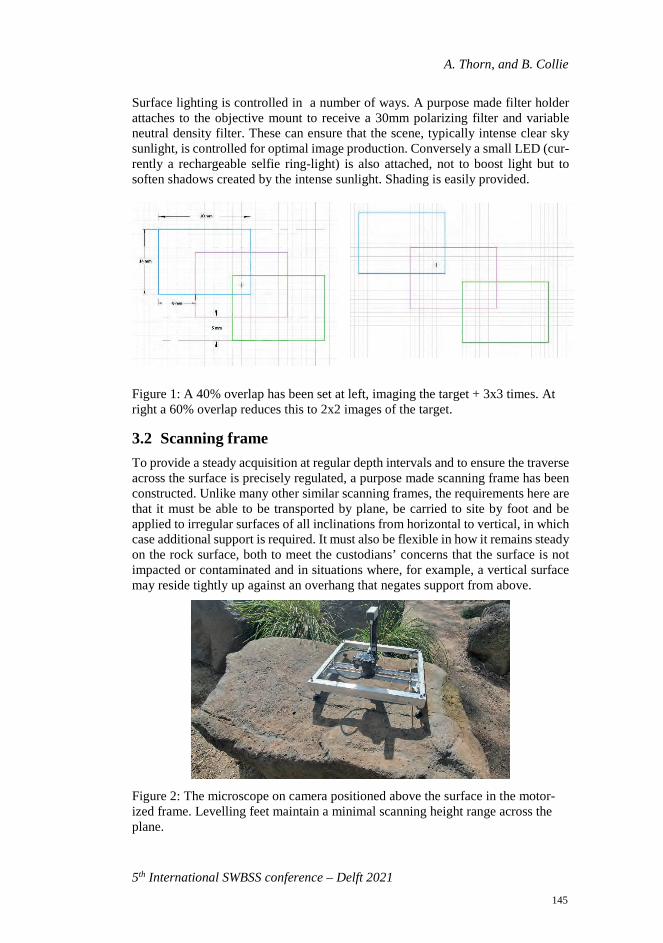
A. Thorn, and B. Collie
5th International SWBSS conference – Delft 2021
Surface lighting is controlled in a number of ways. A purpose made filter holder attaches to the objective mount to receive a 30mm polarizing filter and variable neutral density filter. These can ensure that the scene, typically intense clear sky sunlight, is controlled for optimal image production. Conversely a small LED (cur-rently a rechargeable selfie ring-light) is also attached, not to boost light but to soften shadows created by the intense sunlight. Shading is easily provided.
Figure 1: A 40% overlap has been set at left, imaging the target + 3x3 times. At right a 60% overlap reduces this to 2x2 images of the target.
3.2 Scanning frame To provide a steady acquisition at regular depth intervals and to ensure the traverse across the surface is precisely regulated, a purpose made scanning frame has been constructed. Unlike many other similar scanning frames, the requirements here are that it must be able to be transported by plane, be carried to site by foot and be applied to irregular surfaces of all inclinations from horizontal to vertical, in which case additional support is required. It must also be flexible in how it remains steady on the rock surface, both to meet the custodians’ concerns that the surface is not impacted or contaminated and in situations where, for example, a vertical surface may reside tightly up against an overhang that negates support from above.
Figure 2: The microscope on camera positioned above the surface in the motor-ized frame. Levelling feet maintain a minimal scanning height range across the plane.
145
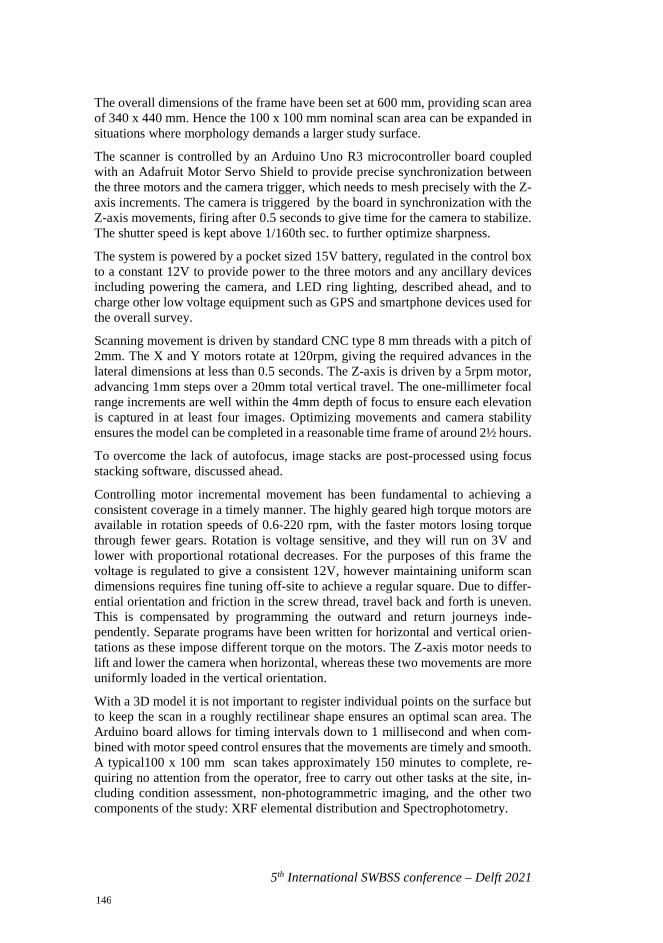
5th International SWBSS conference – Delft 2021
The overall dimensions of the frame have been set at 600 mm, providing scan area of 340 x 440 mm. Hence the 100 x 100 mm nominal scan area can be expanded in situations where morphology demands a larger study surface.
The scanner is controlled by an Arduino Uno R3 microcontroller board coupled with an Adafruit Motor Servo Shield to provide precise synchronization between the three motors and the camera trigger, which needs to mesh precisely with the Z-axis increments. The camera is triggered by the board in synchronization with the Z-axis movements, firing after 0.5 seconds to give time for the camera to stabilize.The shutter speed is kept above 1/160th sec. to further optimize sharpness.
The system is powered by a pocket sized 15V battery, regulated in the control box to a constant 12V to provide power to the three motors and any ancillary devices including powering the camera, and LED ring lighting, described ahead, and to charge other low voltage equipment such as GPS and smartphone devices used for the overall survey.
Scanning movement is driven by standard CNC type 8 mm threads with a pitch of 2mm. The X and Y motors rotate at 120rpm, giving the required advances in the lateral dimensions at less than 0.5 seconds. The Z-axis is driven by a 5rpm motor, advancing 1mm steps over a 20mm total vertical travel. The one-millimeter focal range increments are well within the 4mm depth of focus to ensure each elevation is captured in at least four images. Optimizing movements and camera stability ensures the model can be completed in a reasonable time frame of around 2½ hours.
To overcome the lack of autofocus, image stacks are post-processed using focus stacking software, discussed ahead.
Controlling motor incremental movement has been fundamental to achieving a consistent coverage in a timely manner. The highly geared high torque motors are available in rotation speeds of 0.6-220 rpm, with the faster motors losing torque through fewer gears. Rotation is voltage sensitive, and they will run on 3V and lower with proportional rotational decreases. For the purposes of this frame the voltage is regulated to give a consistent 12V, however maintaining uniform scan dimensions requires fine tuning off-site to achieve a regular square. Due to differ-ential orientation and friction in the screw thread, travel back and forth is uneven. This is compensated by programming the outward and return journeys inde-pendently. Separate programs have been written for horizontal and vertical orien-tations as these impose different torque on the motors. The Z-axis motor needs to lift and lower the camera when horizontal, whereas these two movements are more uniformly loaded in the vertical orientation.
With a 3D model it is not important to register individual points on the surface but to keep the scan in a roughly rectilinear shape ensures an optimal scan area. The Arduino board allows for timing intervals down to 1 millisecond and when com-bined with motor speed control ensures that the movements are timely and smooth. A typical100 x 100 mm scan takes approximately 150 minutes to complete, re-quiring no attention from the operator, free to carry out other tasks at the site, in-cluding condition assessment, non-photogrammetric imaging, and the other two components of the study: XRF elemental distribution and Spectrophotometry.
146
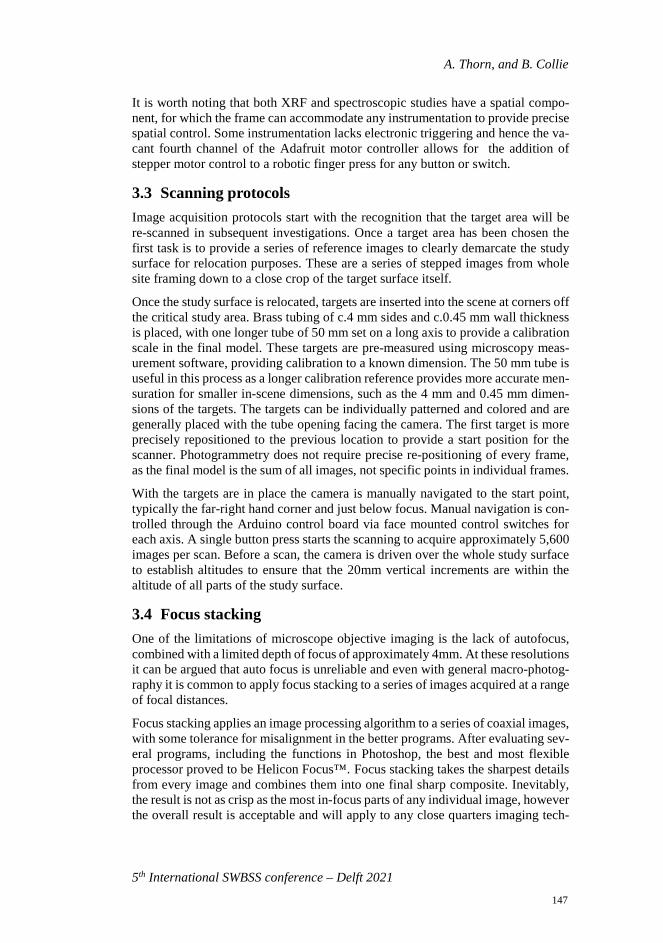
A. Thorn, and B. Collie
5th International SWBSS conference – Delft 2021
It is worth noting that both XRF and spectroscopic studies have a spatial compo-nent, for which the frame can accommodate any instrumentation to provide precise spatial control. Some instrumentation lacks electronic triggering and hence the va-cant fourth channel of the Adafruit motor controller allows for the addition of stepper motor control to a robotic finger press for any button or switch.
3.3 Scanning protocols Image acquisition protocols start with the recognition that the target area will be re-scanned in subsequent investigations. Once a target area has been chosen the first task is to provide a series of reference images to clearly demarcate the study surface for relocation purposes. These are a series of stepped images from whole site framing down to a close crop of the target surface itself.
Once the study surface is relocated, targets are inserted into the scene at corners off the critical study area. Brass tubing of c.4 mm sides and c.0.45 mm wall thickness is placed, with one longer tube of 50 mm set on a long axis to provide a calibration scale in the final model. These targets are pre-measured using microscopy meas-urement software, providing calibration to a known dimension. The 50 mm tube is useful in this process as a longer calibration reference provides more accurate men-suration for smaller in-scene dimensions, such as the 4 mm and 0.45 mm dimen-sions of the targets. The targets can be individually patterned and colored and are generally placed with the tube opening facing the camera. The first target is more precisely repositioned to the previous location to provide a start position for the scanner. Photogrammetry does not require precise re-positioning of every frame, as the final model is the sum of all images, not specific points in individual frames.
With the targets are in place the camera is manually navigated to the start point, typically the far-right hand corner and just below focus. Manual navigation is con-trolled through the Arduino control board via face mounted control switches for each axis. A single button press starts the scanning to acquire approximately 5,600 images per scan. Before a scan, the camera is driven over the whole study surface to establish altitudes to ensure that the 20mm vertical increments are within the altitude of all parts of the study surface.
3.4 Focus stacking One of the limitations of microscope objective imaging is the lack of autofocus, combined with a limited depth of focus of approximately 4mm. At these resolutions it can be argued that auto focus is unreliable and even with general macro-photog-raphy it is common to apply focus stacking to a series of images acquired at a range of focal distances.
Focus stacking applies an image processing algorithm to a series of coaxial images, with some tolerance for misalignment in the better programs. After evaluating sev-eral programs, including the functions in Photoshop, the best and most flexible processor proved to be Helicon Focus™. Focus stacking takes the sharpest details from every image and combines them into one final sharp composite. Inevitably, the result is not as crisp as the most in-focus parts of any individual image, however the overall result is acceptable and will apply to any close quarters imaging tech-
147
5th International SWBSS conference – Delft 2021
nology regardless of technical details. Sharpness of the final model has been eval-uated to determine that focus stacking can provide a sharper model than that achieved where the Photogrammetric software does the selection.
Typically, in a stack of 20 images covering a 20 mm focal distance movement, only 6-10 images contain sharp detail, depending on the undularity of the surface. Hel-icon Focus scans through all images and only selects the useable parts of any thatshow suitably sharp detail, no matter how small a section of the image, so there isno need to manually filter out blurred images. The 5,600 primary images are con-densed to 280 stacked images for photogrammetric processing. Having set the focallength in the camera prior to imaging, Helicon Focus retains this to ensure thestacked image provides the necessary data for photogrammetric processing.
Figure 3: A focus stacked image of one of the 4mm reference targets placed in the scene. Scaling from this target allows for precise measurements within the model. In this example fine details can be discerned that are less than 20 microns wide.
3.5 Photogrammetric model construction Two programs have been assessed for constructing the 3D model. Agisoft Metashape™ has been preferred over Photomodeller Scanner™ for general photo-grammetry due to its ease of use and ready acceptance of images from multiple sources and orientations. Photomodeller can only process images in one orientation and from the one source. While these constraints do not apply to the current imag-ing protocols, the ease of use makes Metashape a sensible choice. Neither program can process edited images that have lost their exif data.
Photogrammetric model building is all about computer processing power and it is most common to describe upper end systems shaped by budget rather than mini-mum requirements. Entry level processing requirements for efficient model pro-cessing, especially with the very processor intensive Metashape are shared be-tween, CPU, GPU, and RAM. Metashape uses all three but in specific processing stages. Some processes are entirely CPU and others GPU, with CPU required for more than 80% of the processing time.
148
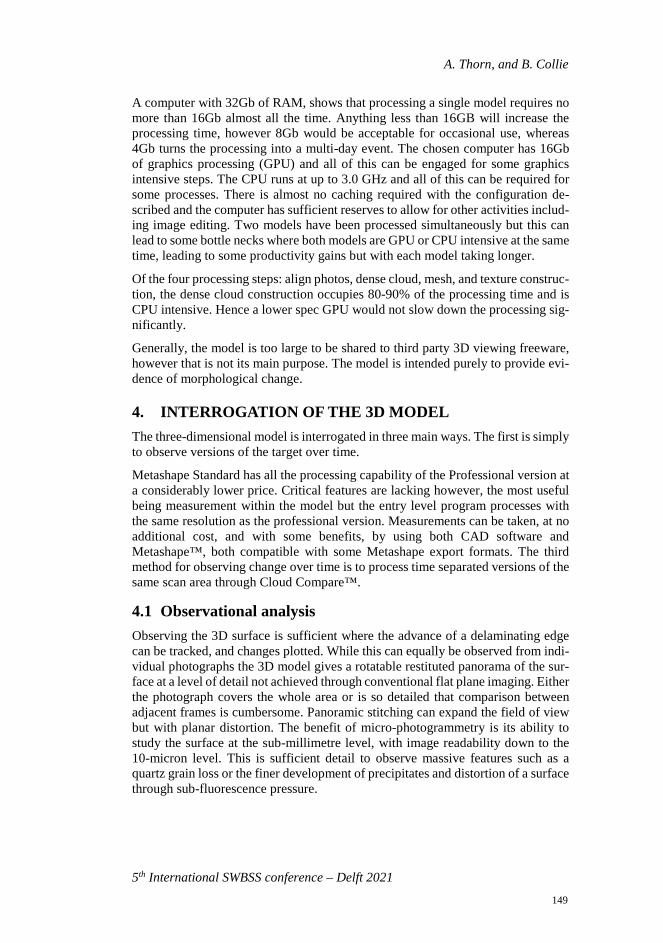
A. Thorn, and B. Collie
5th International SWBSS conference – Delft 2021
A computer with 32Gb of RAM, shows that processing a single model requires no more than 16Gb almost all the time. Anything less than 16GB will increase the processing time, however 8Gb would be acceptable for occasional use, whereas 4Gb turns the processing into a multi-day event. The chosen computer has 16Gb of graphics processing (GPU) and all of this can be engaged for some graphics intensive steps. The CPU runs at up to 3.0 GHz and all of this can be required for some processes. There is almost no caching required with the configuration de-scribed and the computer has sufficient reserves to allow for other activities includ-ing image editing. Two models have been processed simultaneously but this can lead to some bottle necks where both models are GPU or CPU intensive at the same time, leading to some productivity gains but with each model taking longer.
Of the four processing steps: align photos, dense cloud, mesh, and texture construc-tion, the dense cloud construction occupies 80-90% of the processing time and is CPU intensive. Hence a lower spec GPU would not slow down the processing sig-nificantly.
Generally, the model is too large to be shared to third party 3D viewing freeware, however that is not its main purpose. The model is intended purely to provide evi-dence of morphological change.
4. INTERROGATION OF THE 3D MODEL The three-dimensional model is interrogated in three main ways. The first is simply to observe versions of the target over time.
Metashape Standard has all the processing capability of the Professional version at a considerably lower price. Critical features are lacking however, the most useful being measurement within the model but the entry level program processes with the same resolution as the professional version. Measurements can be taken, at no additional cost, and with some benefits, by using both CAD software and Metashape™, both compatible with some Metashape export formats. The third method for observing change over time is to process time separated versions of the same scan area through Cloud Compare™.
4.1 Observational analysis Observing the 3D surface is sufficient where the advance of a delaminating edge can be tracked, and changes plotted. While this can equally be observed from indi-vidual photographs the 3D model gives a rotatable restituted panorama of the sur-face at a level of detail not achieved through conventional flat plane imaging. Either the photograph covers the whole area or is so detailed that comparison between adjacent frames is cumbersome. Panoramic stitching can expand the field of view but with planar distortion. The benefit of micro-photogrammetry is its ability to study the surface at the sub-millimetre level, with image readability down to the 10-micron level. This is sufficient detail to observe massive features such as a quartz grain loss or the finer development of precipitates and distortion of a surface through sub-fluorescence pressure.
149
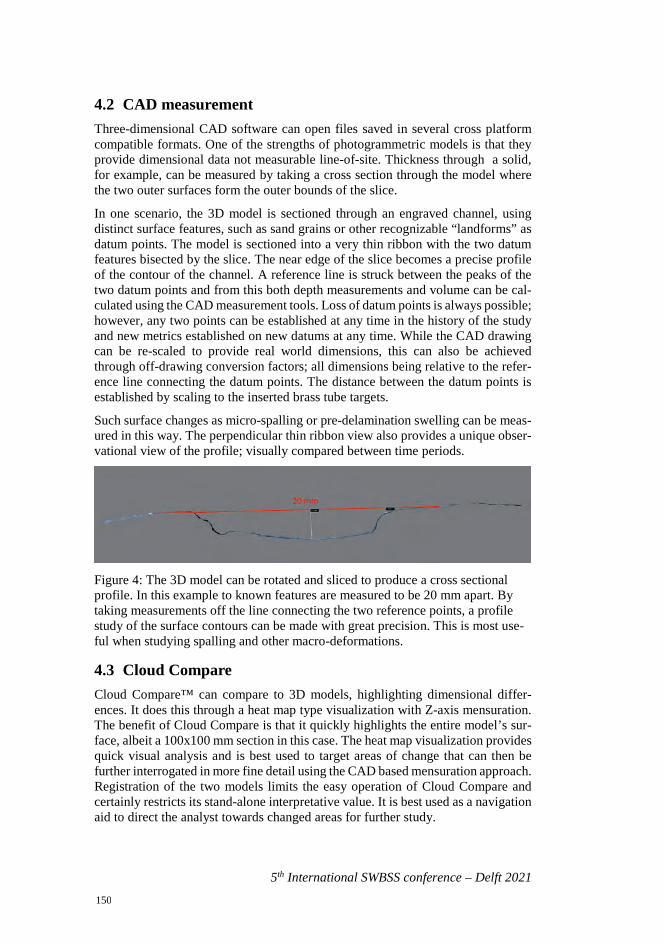
5th International SWBSS conference – Delft 2021
4.2 CAD measurement Three-dimensional CAD software can open files saved in several cross platform compatible formats. One of the strengths of photogrammetric models is that they provide dimensional data not measurable line-of-site. Thickness through a solid, for example, can be measured by taking a cross section through the model where the two outer surfaces form the outer bounds of the slice.
In one scenario, the 3D model is sectioned through an engraved channel, using distinct surface features, such as sand grains or other recognizable “landforms” as datum points. The model is sectioned into a very thin ribbon with the two datum features bisected by the slice. The near edge of the slice becomes a precise profile of the contour of the channel. A reference line is struck between the peaks of the two datum points and from this both depth measurements and volume can be cal-culated using the CAD measurement tools. Loss of datum points is always possible; however, any two points can be established at any time in the history of the study and new metrics established on new datums at any time. While the CAD drawing can be re-scaled to provide real world dimensions, this can also be achieved through off-drawing conversion factors; all dimensions being relative to the refer-ence line connecting the datum points. The distance between the datum points is established by scaling to the inserted brass tube targets.
Such surface changes as micro-spalling or pre-delamination swelling can be meas-ured in this way. The perpendicular thin ribbon view also provides a unique obser-vational view of the profile; visually compared between time periods.
Figure 4: The 3D model can be rotated and sliced to produce a cross sectional profile. In this example to known features are measured to be 20 mm apart. By taking measurements off the line connecting the two reference points, a profile study of the surface contours can be made with great precision. This is most use-ful when studying spalling and other macro-deformations.
4.3 Cloud Compare Cloud Compare™ can compare to 3D models, highlighting dimensional differ-ences. It does this through a heat map type visualization with Z-axis mensuration. The benefit of Cloud Compare is that it quickly highlights the entire model’s sur-face, albeit a 100x100 mm section in this case. The heat map visualization provides quick visual analysis and is best used to target areas of change that can then be further interrogated in more fine detail using the CAD based mensuration approach. Registration of the two models limits the easy operation of Cloud Compare and certainly restricts its stand-alone interpretative value. It is best used as a navigation aid to direct the analyst towards changed areas for further study.
150
A. Thorn, and B. Collie
5th International SWBSS conference – Delft 2021
Figure 5: A typical Cloud Compare heat map indication of change, in this case in the Z axis. Cloud Compare is best used as a map indicating areas of change that can better be re-examined within the 3D model.
5. CONCLUSIONS The system described provides a detailed close study of a surface subjected to ero-sion through salts and other causes. While the same detail is available through the 2,500 images used to produce the model, it is the ability to study the surface from a range of angles and to further interrogate it through dissection to produce meas-urable profiles not attainable by physical means. The application of further pro-cessing, such as that available through Cloud Compare enable a quick identification of change not as readily discerned by scanning individual images.
All observations are conducted at the sub-millimeter resolution with meaningful observations at the sub-fifty-micron level. Surface features in the range 10-20 mi-crons have been resolved in some situations. This can be compared to ephemeral surface disruption that has been repeatedly observed to be more than 100 microns thick in the project context, and pre-delamination swelling of similar dimensions, where crypto fluorescence deforms the surface prior to rupture.
REFERENCES [1] D. Ambrosini, T. de Rubeis, I. Nardi, and D. Paoletti “The Potential of Optical
Profilometry in the Study of Cultural Stone Weathering”, Journal of Imaging, vol. 5, no. 60, 2019.
[2] S. Marziali, and G. Dionisio, “Photogrammetry and Macro Photography. The Experience of the MUSINT II Project in the 3D Digitization of Small Archae-ological Artifacts”, Studies in Digital Heritage, vol. 1, no. 2, 2017, pp. 298-309.
151

152
5th International SWBSS conference – Delft 2021
ASSESSMENT OF SALT DISTRIBUTION IN MAASTRICHT AND MIGNÉ LIMESTONES WITH THE USE OF MICRO-DESTRUCTIVE TECHNIQUES
Loucas Kyriakou1, Asel M. Aguilar Sanchez2, Cristiana Nunes3, and Ioannis Ioannou1*
KEYWORDS Salt Crystallization, micro-drilling, scratching, μ-XRF, limestone
ABSTRACT The durability of building materials against salt crystallization is currently assessed using standardized and other accelerated weathering laboratory tests. However, these test methods usually do not simulate the performance of a material in practice realistically. Therefore, they do not always shed enough light on the evaluation of the salt crystallization phenomenon and the prevention of its damaging results.
This study focuses on the use of two micro-destructive cutting techniques, based on the measurement of scratching and drilling resistance, to assess salt distribution within Maastricht and Migné limestones, following the procedure developed within the framework of RILEM TC ASC-271 activities for the accumulation of salts. Data collected on freshly quarried reference samples and samples contaminated with NaCl and Na2SO4 are presented. The results, which are entirely in line with complementary μ-XRF measurements, vividly show changes in the microstructure of the salt-contaminated samples. These changes, which are reflected in increased cutting resistance peaks, are consistent in both the scratching and drilling resistance patterns, and they suggest that salts accumulate at or near the evaporation surface of the test specimens, resulting in pore clogging.
1 Department of Civil and Environmental Engineering, University of Cyprus,
Nicosia, Cyprus, [email protected] 2 Department of Civil, Environmental and Geomatic Engineering, ETH Zürich,
Zürich, Switzerland 3 Department of Materials, Institute of Theoretical and Applied Mechanics of
the Czech Academy of Sciences, Prague, Czech Republic
153
5th International SWBSS conference – Delft 2021
1 INTRODUCTION Salt crystallization is widely recognized as one of the major causes of weathering in structures and monuments [1, 2]. Soluble salts may be associated with several possible sources, namely saline soils, sea spray, air pollutants [3], biological agents [4], incompatible materials [5], inappropriate cleaning compounds [6], etc. Salts may further be introduced to masonry at the time of its construction.
The damaging effects of salt crystallization are usually linked to the wetting and drying of the masonry. However, the behavior of soluble salts may be considered erratic, since these can remain dormant for long periods, before unexpectedly be-coming active, triggering severe damages to the substrate and disfiguring the his-toric fabric.
Salts may crystallize either on the surface of materials as efflorescence, or within their pores as subflorescence (or cryptoflorescence). The determination of the type of salt crystallization is highly dependent upon the rate of drying, the building ma-terial characteristics, and the type of salt [7]
Whilst efflorescence is usually considered non-hazardous (though possibly un-sightly), subflorescence usually leads to pore clogging. At its commencement, con-sidering the relatively large proportion of pores in building materials, subflo-rescence is unlikely to cause any permanent damage to the masonry [8]. However, at later stages, the accumulation of salt crystals within the pore system of a material induces an augmentation in crystallization pressure, which may exceed the tensile strength of the pore wall and generate irreversible structural damage [9]. Therefore, it is believed that the assessment of subflorescence at early stages, by detecting pore clogging, may provide an early warning for the upcoming crystallization dam-age, thus giving time for conservators to take all the appropriate actions and apply remedial treatments.
Several non-destructive methods have previously been implemented to assess salt crystallization in porous materials [10, 11]. However, these methods usually in-volve complex drawbacks, such as in-situ portability issues, inaccessibility, and the requirement for extensive training of the users. This study focuses on the applica-tion of two micro-destructive techniques, i.e., the scratch tool and the Drilling Re-sistance Measurement System (DRMS), to assess salt distribution within Maas-tricht and Migné limestones, following the procedure developed within the frame-work of RILEM TC ASC-271 activities for the accumulation of salts. It is worth noting that both aforementioned techniques have previously been used mainly to assess the mechanical properties of building materials [12, 13]; their application here, supported by complementary μ-XRF measurements, demonstrates yet an-other potential use in the field of salt crystallization studies.
2 MATERIALS AND METHODS
2.1 Materials and sample preparation Two different limestones have been used in this study. These stones have been deliberately chosen as they have been widely used in the construction of vernacular
154
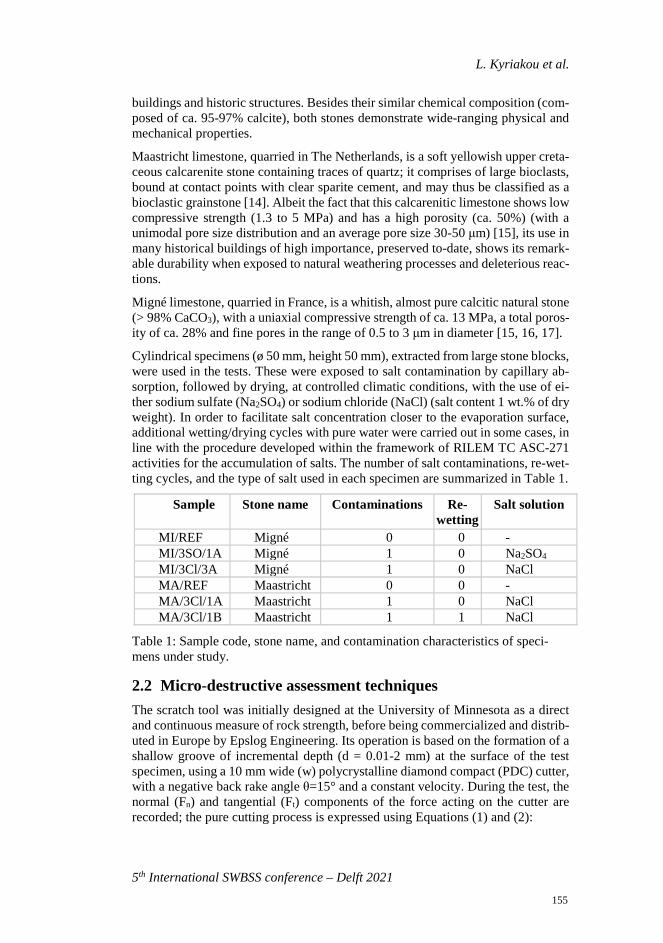
L. Kyriakou et al.
5th International SWBSS conference – Delft 2021
buildings and historic structures. Besides their similar chemical composition (com-posed of ca. 95-97% calcite), both stones demonstrate wide-ranging physical and mechanical properties.
Maastricht limestone, quarried in The Netherlands, is a soft yellowish upper creta-ceous calcarenite stone containing traces of quartz; it comprises of large bioclasts, bound at contact points with clear sparite cement, and may thus be classified as a bioclastic grainstone [14]. Albeit the fact that this calcarenitic limestone shows low compressive strength (1.3 to 5 MPa) and has a high porosity (ca. 50%) (with a unimodal pore size distribution and an average pore size 30-50 μm) [15], its use in many historical buildings of high importance, preserved to-date, shows its remark-able durability when exposed to natural weathering processes and deleterious reac-tions.
Migné limestone, quarried in France, is a whitish, almost pure calcitic natural stone (> 98% CaCO3), with a uniaxial compressive strength of ca. 13 MPa, a total poros-ity of ca. 28% and fine pores in the range of 0.5 to 3 μm in diameter [15, 16, 17].
Cylindrical specimens (ø 50 mm, height 50 mm), extracted from large stone blocks, were used in the tests. These were exposed to salt contamination by capillary ab-sorption, followed by drying, at controlled climatic conditions, with the use of ei-ther sodium sulfate (Na2SO4) or sodium chloride (NaCl) (salt content 1 wt.% of dry weight). In order to facilitate salt concentration closer to the evaporation surface, additional wetting/drying cycles with pure water were carried out in some cases, in line with the procedure developed within the framework of RILEM TC ASC-271 activities for the accumulation of salts. The number of salt contaminations, re-wet-ting cycles, and the type of salt used in each specimen are summarized in Table 1.
Sample Stone name Contaminations Re-wetting
Salt solution
MI/REF Migné 0 0 - MI/3SO/1A Migné 1 0 Na2SO4 MI/3Cl/3A Migné 1 0 NaCl MA/REF Maastricht 0 0 - MA/3Cl/1A Maastricht 1 0 NaCl MA/3Cl/1B Maastricht 1 1 NaCl
Table 1: Sample code, stone name, and contamination characteristics of speci-mens under study.
2.2 Micro-destructive assessment techniques The scratch tool was initially designed at the University of Minnesota as a direct and continuous measure of rock strength, before being commercialized and distrib-uted in Europe by Epslog Engineering. Its operation is based on the formation of a shallow groove of incremental depth (d = 0.01-2 mm) at the surface of the test specimen, using a 10 mm wide (w) polycrystalline diamond compact (PDC) cutter, with a negative back rake angle θ=15° and a constant velocity. During the test, the normal (Fn) and tangential (Ft) components of the force acting on the cutter are recorded; the pure cutting process is expressed using Equations (1) and (2):
155
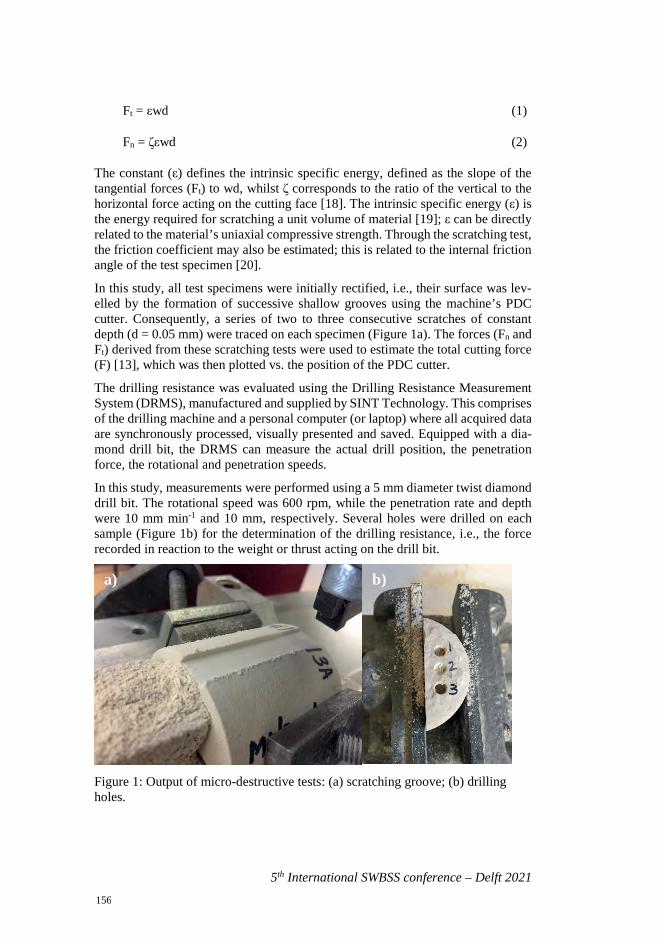
5th International SWBSS conference – Delft 2021
Ft = εwd (1)
Fn = ζεwd (2)
The constant (ε) defines the intrinsic specific energy, defined as the slope of the tangential forces (Ft) to wd, whilst ζ corresponds to the ratio of the vertical to the horizontal force acting on the cutting face [18]. The intrinsic specific energy (ε) is the energy required for scratching a unit volume of material [19]; ε can be directly related to the material’s uniaxial compressive strength. Through the scratching test, the friction coefficient may also be estimated; this is related to the internal friction angle of the test specimen [20].
In this study, all test specimens were initially rectified, i.e., their surface was lev-elled by the formation of successive shallow grooves using the machine’s PDC cutter. Consequently, a series of two to three consecutive scratches of constant depth (d = 0.05 mm) were traced on each specimen (Figure 1a). The forces (Fn and Ft) derived from these scratching tests were used to estimate the total cutting force (F) [13], which was then plotted vs. the position of the PDC cutter.
The drilling resistance was evaluated using the Drilling Resistance Measurement System (DRMS), manufactured and supplied by SINT Technology. This comprises of the drilling machine and a personal computer (or laptop) where all acquired data are synchronously processed, visually presented and saved. Equipped with a dia-mond drill bit, the DRMS can measure the actual drill position, the penetration force, the rotational and penetration speeds.
In this study, measurements were performed using a 5 mm diameter twist diamond drill bit. The rotational speed was 600 rpm, while the penetration rate and depth were 10 mm min-1 and 10 mm, respectively. Several holes were drilled on each sample (Figure 1b) for the determination of the drilling resistance, i.e., the force recorded in reaction to the weight or thrust acting on the drill bit.
Figure 1: Output of micro-destructive tests: (a) scratching groove; (b) drilling holes.
a) b)
156
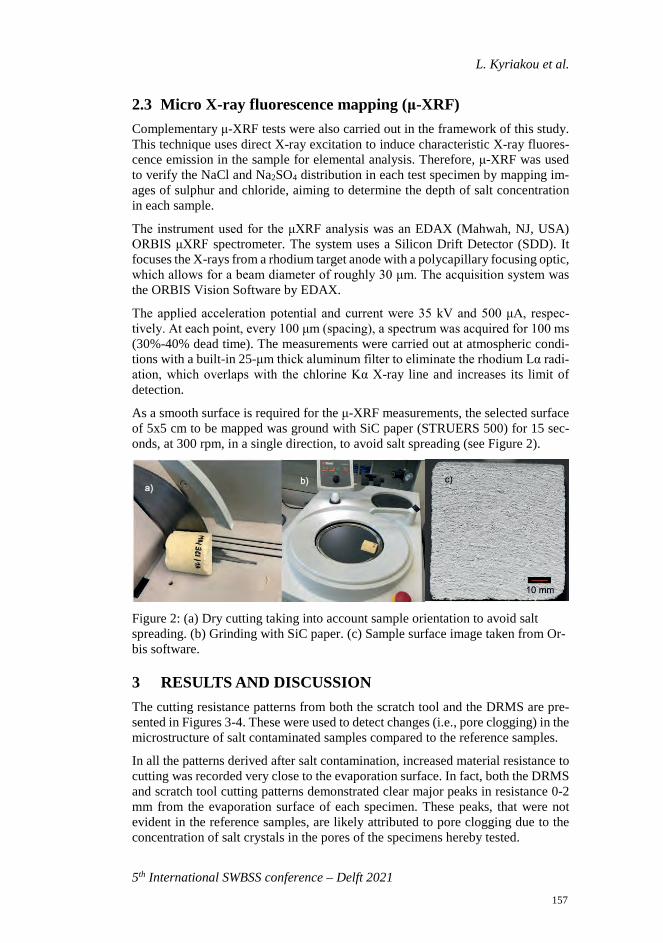
L. Kyriakou et al.
5th International SWBSS conference – Delft 2021
2.3 Micro X-ray fluorescence mapping (μ-XRF) Complementary μ-XRF tests were also carried out in the framework of this study. This technique uses direct X-ray excitation to induce characteristic X-ray fluores-cence emission in the sample for elemental analysis. Therefore, μ-XRF was used to verify the NaCl and Na2SO4 distribution in each test specimen by mapping im-ages of sulphur and chloride, aiming to determine the depth of salt concentration in each sample.
The instrument used for the μXRF analysis was an EDAX (Mahwah, NJ, USA) ORBIS μXRF spectrometer. The system uses a Silicon Drift Detector (SDD). It focuses the X-rays from a rhodium target anode with a polycapillary focusing optic, which allows for a beam diameter of roughly 30 μm. The acquisition system was the ORBIS Vision Software by EDAX.
The applied acceleration potential and current were 35 kV and 500 μA, respec-tively. At each point, every 100 μm (spacing), a spectrum was acquired for 100 ms (30%-40% dead time). The measurements were carried out at atmospheric condi-tions with a built-in 25-μm thick aluminum filter to eliminate the rhodium Lα radi-ation, which overlaps with the chlorine Kα X-ray line and increases its limit of detection.
As a smooth surface is required for the μ-XRF measurements, the selected surface of 5x5 cm to be mapped was ground with SiC paper (STRUERS 500) for 15 sec-onds, at 300 rpm, in a single direction, to avoid salt spreading (see Figure 2).
Figure 2: (a) Dry cutting taking into account sample orientation to avoid salt spreading. (b) Grinding with SiC paper. (c) Sample surface image taken from Or-bis software.
3 RESULTS AND DISCUSSION The cutting resistance patterns from both the scratch tool and the DRMS are pre-sented in Figures 3-4. These were used to detect changes (i.e., pore clogging) in the microstructure of salt contaminated samples compared to the reference samples.
In all the patterns derived after salt contamination, increased material resistance to cutting was recorded very close to the evaporation surface. In fact, both the DRMS and scratch tool cutting patterns demonstrated clear major peaks in resistance 0-2 mm from the evaporation surface of each specimen. These peaks, that were not evident in the reference samples, are likely attributed to pore clogging due to the concentration of salt crystals in the pores of the specimens hereby tested.
157
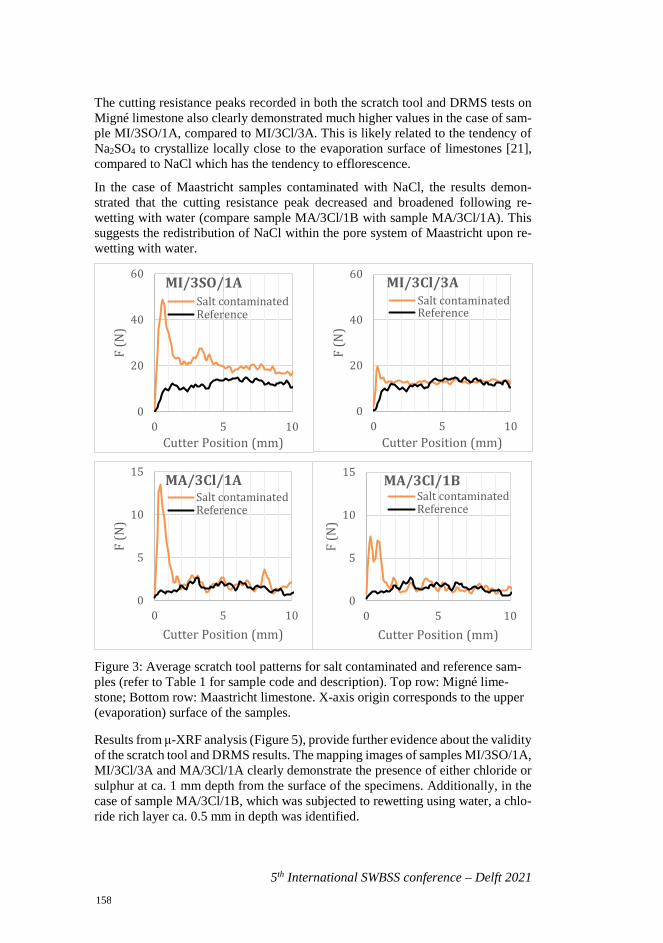
5th International SWBSS conference – Delft 2021
The cutting resistance peaks recorded in both the scratch tool and DRMS tests on Migné limestone also clearly demonstrated much higher values in the case of sam-ple MI/3SO/1A, compared to MI/3Cl/3A. This is likely related to the tendency of Na2SO4 to crystallize locally close to the evaporation surface of limestones [21], compared to NaCl which has the tendency to efflorescence.
In the case of Maastricht samples contaminated with NaCl, the results demon-strated that the cutting resistance peak decreased and broadened following re-wetting with water (compare sample MA/3Cl/1B with sample MA/3Cl/1A). This suggests the redistribution of NaCl within the pore system of Maastricht upon re-wetting with water.
Figure 3: Average scratch tool patterns for salt contaminated and reference sam-ples (refer to Table 1 for sample code and description). Top row: Migné lime-stone; Bottom row: Maastricht limestone. X-axis origin corresponds to the upper (evaporation) surface of the samples.
Results from μ-XRF analysis (Figure 5), provide further evidence about the validity of the scratch tool and DRMS results. The mapping images of samples MI/3SO/1A, MI/3Cl/3A and MA/3Cl/1A clearly demonstrate the presence of either chloride or sulphur at ca. 1 mm depth from the surface of the specimens. Additionally, in the case of sample MA/3Cl/1B, which was subjected to rewetting using water, a chlo-ride rich layer ca. 0.5 mm in depth was identified.
0
20
40
60
0 5 10
F (N
)
Cutter Position (mm)
MI/3SO/1ASalt contaminatedReference
0
5
10
15
0 5 10
F (N
)
Cutter Position (mm)
MA/3Cl/1ASalt contaminatedReference
0
20
40
60
0 5 10
F (N
)
Cutter Position (mm)
MI/3Cl/3ASalt contaminatedReference
0
5
10
15
0 5 10
F(N
)
Cutter Position (mm)
MA/3Cl/1BSalt contaminatedReference
158
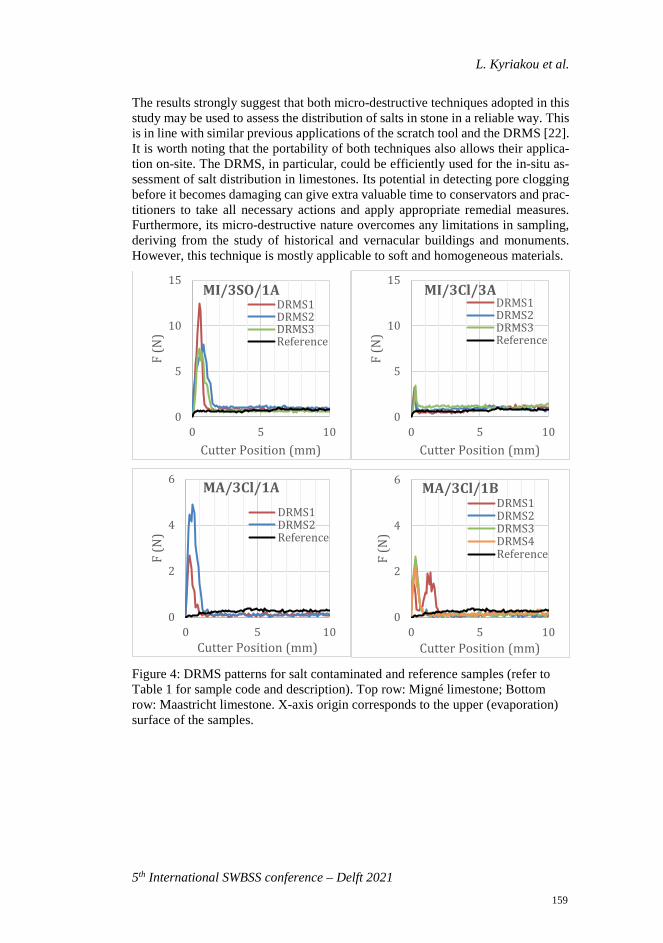
L. Kyriakou et al.
5th International SWBSS conference – Delft 2021
The results strongly suggest that both micro-destructive techniques adopted in this study may be used to assess the distribution of salts in stone in a reliable way. This is in line with similar previous applications of the scratch tool and the DRMS [22]. It is worth noting that the portability of both techniques also allows their applica-tion on-site. The DRMS, in particular, could be efficiently used for the in-situ as-sessment of salt distribution in limestones. Its potential in detecting pore clogging before it becomes damaging can give extra valuable time to conservators and prac-titioners to take all necessary actions and apply appropriate remedial measures. Furthermore, its micro-destructive nature overcomes any limitations in sampling, deriving from the study of historical and vernacular buildings and monuments. However, this technique is mostly applicable to soft and homogeneous materials.
Figure 4: DRMS patterns for salt contaminated and reference samples (refer to Table 1 for sample code and description). Top row: Migné limestone; Bottom row: Maastricht limestone. X-axis origin corresponds to the upper (evaporation) surface of the samples.
0
5
10
15
0 5 10
F (N
)
Cutter Position (mm)
MI/3SO/1ADRMS1DRMS2DRMS3Reference
0
2
4
6
0 5 10
F (N
)
Cutter Position (mm)
MA/3Cl/1ADRMS1DRMS2Reference
0
5
10
15
0 5 10
F (N
)
Cutter Position (mm)
MI/3Cl/3ADRMS1DRMS2DRMS3Reference
0
2
4
6
0 5 10
F (N
)
Cutter Position (mm)
MA/3Cl/1BDRMS1DRMS2DRMS3DRMS4Reference
159
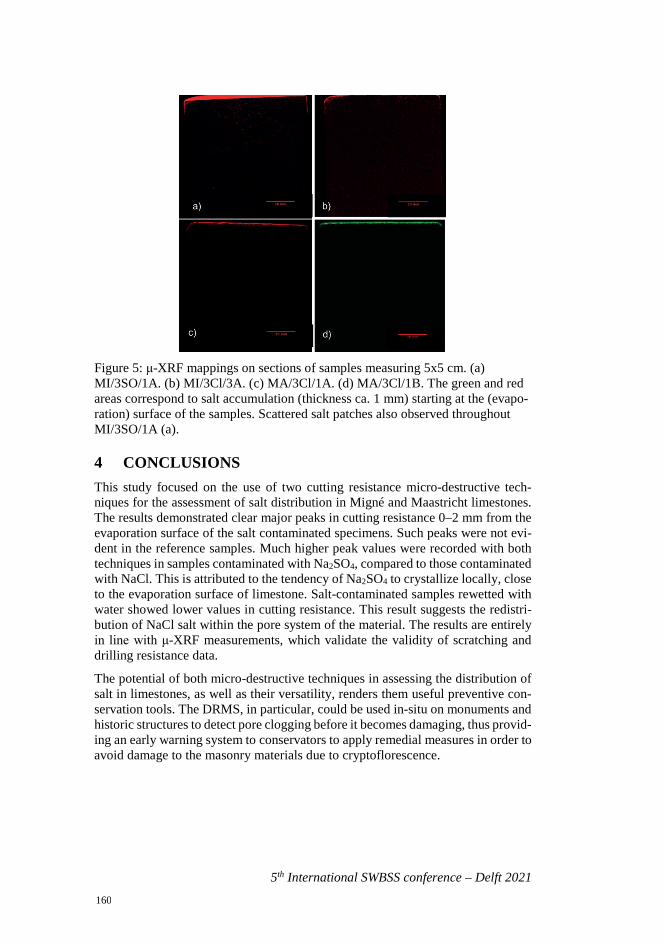
5th International SWBSS conference – Delft 2021
Figure 5: μ-XRF mappings on sections of samples measuring 5x5 cm. (a) MI/3SO/1A. (b) MI/3Cl/3A. (c) MA/3Cl/1A. (d) MA/3Cl/1B. The green and red areas correspond to salt accumulation (thickness ca. 1 mm) starting at the (evapo-ration) surface of the samples. Scattered salt patches also observed throughout MI/3SO/1A (a).
4 CONCLUSIONS This study focused on the use of two cutting resistance micro-destructive tech-niques for the assessment of salt distribution in Migné and Maastricht limestones. The results demonstrated clear major peaks in cutting resistance 0–2 mm from the evaporation surface of the salt contaminated specimens. Such peaks were not evi-dent in the reference samples. Much higher peak values were recorded with both techniques in samples contaminated with Na2SO4, compared to those contaminated with NaCl. This is attributed to the tendency of Na2SO4 to crystallize locally, close to the evaporation surface of limestone. Salt-contaminated samples rewetted with water showed lower values in cutting resistance. This result suggests the redistri-bution of NaCl salt within the pore system of the material. The results are entirely in line with μ-XRF measurements, which validate the validity of scratching and drilling resistance data.
The potential of both micro-destructive techniques in assessing the distribution of salt in limestones, as well as their versatility, renders them useful preventive con-servation tools. The DRMS, in particular, could be used in-situ on monuments and historic structures to detect pore clogging before it becomes damaging, thus provid-ing an early warning system to conservators to apply remedial measures in order to avoid damage to the masonry materials due to cryptoflorescence.
160
L. Kyriakou et al.
5th International SWBSS conference – Delft 2021
ACKNOWLEDGEMENTS The authors would like to acknowledge financial support from the University of Cyprus.
REFERENCES [1] A. E. Charola, “Salts in the Deterioration of Porous Materials: An Overview,”
J. Am. Inst. Conserv., vol. 39, no. 3, pp. 327-343, 2000.
[2] E. Doehne, “Salt weathering: a selective review,” Geol. Soc. Spec. Publ., vol. 205, pp. 51-64, 2002.
[3] B. Graue, S. Siegesmund, P. Oyhantcabal, R. Naumann, T. Licha, and K. Si-mon, “The effect of air pollution on stone decay: the decay of the Drachenfels trachyte in industrial, urban, and rural environments – a case study of the Co-logne, Altenberg and Xanten cathedrals,” Environ. Earth Sci., vol. 69, pp. 1095-1124, 2013.
[4] D. Benavente, M. De Jongh, and J.C. Cañaveras, “Weathering Processes and Mechanisms Caused by Capillary Waters and Pigeon Droppings on Porous Limestones,” Minerals, vol. 18, pp. 1-16, 2021.
[5] P. Lopez-Arce, J. Garcia-Guinea, D. Benavente, L. Tormo, and E. Doehne, “Deterioration of dolostone by magnesium sulphate salt: An example of in-compatible building materials at Bonaval Monastery, Spain,” Constr. Build. Mater., vol. 23, pp. 846-855, 2009.
[6] R. Přikryl, Z. Weishauptová, M. Novotná, J. Přikrylová, and A. Št’astná, “Physical and mechanical properties of the repaired sandstone in the facing masonry of the Charles Bridge in Prague (Czech Republic) and an analytical strudy for the causes of its rapid decay,” Environ. Earth Sci., vol. 63, pp. 1623-1639, 2011.
[7] R.M. Espinoza-Marzal, and G.W. Scherer, “Mechanisms of damage by salt,” B.J. Smith, M. Gomez-Heras, H.A. Viles, and J. Cassar, Eds., Limestone in the Built Environment: Present-Day Challenges for the Preservation of the Past, Geological Society of London, pp. 61-77, 2010.
[8] G.W. Scherer, “Crystallization in pores,” Cem. Concr. Res., vol. 29, pp. 1347-1358, 1999.
[9] G.W. Scherer, “Stress from crystallization of salt,” Cem. Concr. Res., vol. 34, pp. 1613-1624, 2004.
[10] I. Ioannou, C. Hall, W.D. Hoff, V.A. Pugsley, and S.D.M. Jacques, “Synchro-tron radiation energy-dispersive X-ray diffraction analysis of salt distribution in Lepine limestone,” Analyst, vol. 130, pp. 1006-1008, 2005.
[11] B. Lubelli et al., “Towards a more effective and reliable salt crystallization test for porous building materials: state of the art,” Mater. Struct. Constr., vol. 51, pp. 1-21, 2018.
161
5th International SWBSS conference – Delft 2021
[12] L. Kyriakou, M. Theodoridou, and I. Ioannou, “Standardized experimental techniques and novel micro-destructive methods for the assessment of lime mortar properties,” in SMSS 2019 Internaltional Conference on Sustainable Materials, Systems and Structures – Novel Methods for Characterization of Materials and Structures, pp. 12-19, 2019.
[13] M. Theodoridou, F. Dagrain, and I. Ioannou, “Micro-destructive cutting tech-niques for the characterization of natural limestone,” Int. J. Rock Mech. Min. Sci., vol. 76, pp. 98-103, 2015.
[14] R. Dreesen, and M. Dusar, “Historical building stones in the province of Lim-burg (NE Belgium): role of petrography in provenance and durability assess-ment,” Mater. Charact., vol. 53, pp. 273-287, 2004.
[15] G. Borsoi, B. Lubelli, R. van Hees, R. Veiga, A. Santos Silva, L. Colla, L. Fedele, and P. Tomasin, “Effect of solvent on nanolime transport within lime-stone: How to improve in-depth deposition,” Colloids Sur., A Physicochem. Eng. Asp., vol. 497, pp. 171-181, 2016.
[16] V. Voronina, L. Pel, A. Sawdy, and K. Kopinga, “The influence of osmotic pressure on poulticing treatments for cultural heritage objects,” Mater. Struct., vol. 46, pp. 221-231, 2013.
[17] J. Eslami, C. Walbert, A.L. Beaucour, A. Bourges, A. Noumowe, “Influence of physical and mechanical properties on the durability of limestone subjected to freeze-thaw cycles,” Constr. Build. Mater., vol. 162, pp. 420-429, 2018.
[18] E. Detournay, and P. Defourny, “A phenomenological model fort the drilling action of drag bits,” Int. J. Rock Mech. Min. Sci. Geomech. Abstr., vol. 29, pp. 13-23, 1992.
[19] R. Suarez-Rivera, J. Stenebraten, and F. Dagrain, “Continuous scratch testing on core allows effective calibration of log-derived mechanical properties for use in sanding prediction evaluation,” in SPE/ISRM Rock Mechanics conf., 2002.
[20] F. Dagrain, “Characterization of the strength and the abrasiveness of stones based on a scratching test,” in 2nd Int. conf. on Stone and Concrete Machining (ICSCM), 2013.
[21] I. Ioannou, and W.D. Hoff, “Water repellent influence on salt crystallisation in masonry,” Proc. Inst. Civ. Eng. Constr. Mater., vol. 161, pp. 17-23, pp. 17-23, 2013.
[22] S. Modestou, M. Theodoridou, and I. Ioannou, “Micro-destructive mapping of the salt crystallization front in limestone,” Eng. Geol., vol. 193, pp. 337-347, 2015.
162
5th International SWBSS conference – Delft 2021
MEASUREMENT OF SODIUM CHLORIDE SOLUTION PERMEABILITY AND SORPTIVITY IN TUFF STONE
Nobumitsu Takatori,1* Kotaro Sakai,1 Daisuke Ogura,1 Soichiro Wakiya,2 and Masaru Abuku3
KEYWORDS Porous material, sodium chloride solution, hydraulic conductivity, falling-head method, saline water absorption test
ABSTRACT In desalination by poulticing, predicting the amount of desalination and salt concentration in the poultice and base material is important. The transport of a solution in a porous material is determined by its driving force and permeability, both of which may differ between pure water and salt solutions. In particular, for materials with surface charges, the electric double layer formed on the material surface may affect both the driving force and permeability of the salt solution.
We aim to develop a prediction method to calculate the amount of water and salt transport in porous materials during desalination. As the first step of this study, to examine the saline water transport phenomenon in porous materials, we conducted the saline water permeability and absorption tests of NaCl aqueous solutions in tuff. The results showed that the saline water permeability coefficient in the tuff can be adequately estimated by considering saline water density and viscosity based on the Hagen–Poiseuille law, when the salt concentration is above 0.61 molal. Furthermore, this law does not apply to the relationship between the permeability for pure and saline water; moreover, it may be necessary to consider the effect of the salt concentration dependence of the electric double layer structure.
1 Department of Architecture and Architectural Engineering, Graduate School
of Engineering, Kyoto University, Kyoto, Japan, [email protected]
2 National Institutes for Cultural Heritage Nara National Research Institute for Cultural Properties, Nara-shi, Japan.
3 Faculty of Architecture, Kindai University, Osaka, Japan.
163
5th International SWBSS conference – Delft 2021
1 INTRODUCTION The on-site preservation is often desirable for cultural monuments that cannot be separated from the ground, such as tumuli and stone Buddha statues carved into a cliff, because of their authenticity. Separating them from the source of salt is difficult; therefore, one cannot completely suppress salt damage simply by controlling the environment using a shelter [1]. In such cases, in addition to controlling the amount of salt precipitation and accumulation by controlling the surrounding environment, poultice desalination based on the advection-based method [2] may be effective in removing the accumulated salt over a short time period.
In the desalination of such cultural monuments by poulticing, predicting the amount of desalination and the salt concentration in the poultice and the cultural monument is important. However, only a few past studies have calculated the amount of salt transfer in porous materials using numerical analysis.
Most studies have examined the migration of salt solutions (e.g., [3]) have considered salt transport in terms of advection of solution flow, based on Darcy’s law, or diffusion with concentration differences. However, it is not clear whether the permeability and water retention curves of pure water can be used for the migration of saline water, because the salinity of the solution affects its driving force and migration coefficient. In particular, the electric double layer formed on the surface of charged materials (e.g., clays) is affected by the salt concentration of saline water [4], which may therefore affect both the driving force and the migration coefficient of the solution transfer in these materials.
We developed a prediction method to calculate the amount of water and salt transport in porous materials during desalination. As an initial step, we examined the saline water transport phenomenon using the following methods: we measured the permeability coefficient of the porous material quantitatively using a permeability test with a constant driving force. We then measured the transport of saline water quantitatively by capillary pressure via a saline water absorption test.
2 EXPERIMENT To understand saline water permeability in porous materials, we conducted two experiments: a saline water permeability test, using the falling-head method, and a saline water absorption test. By comparing these results, we examined the dependence of saline water transport on the salt concentration in porous materials.
2.1 Material In this study, we used porous tuff stone (Aso pyroclastic-flow deposits in Japan [5]) as test material, because the objective is to apply the results of this study to the desalination of the Motomachi stone Buddha [1]. The specimen used is cylindrical: about 100 mm in height and about 50 mm in diameter. According to the results of zeta potential analysis of rocks from Mount Aso [6], which are considered to be sampled from the stratum similar to the tuff stone used in this experiment, these rocks are electrically charged and may have a surface charge similar to clay.
164
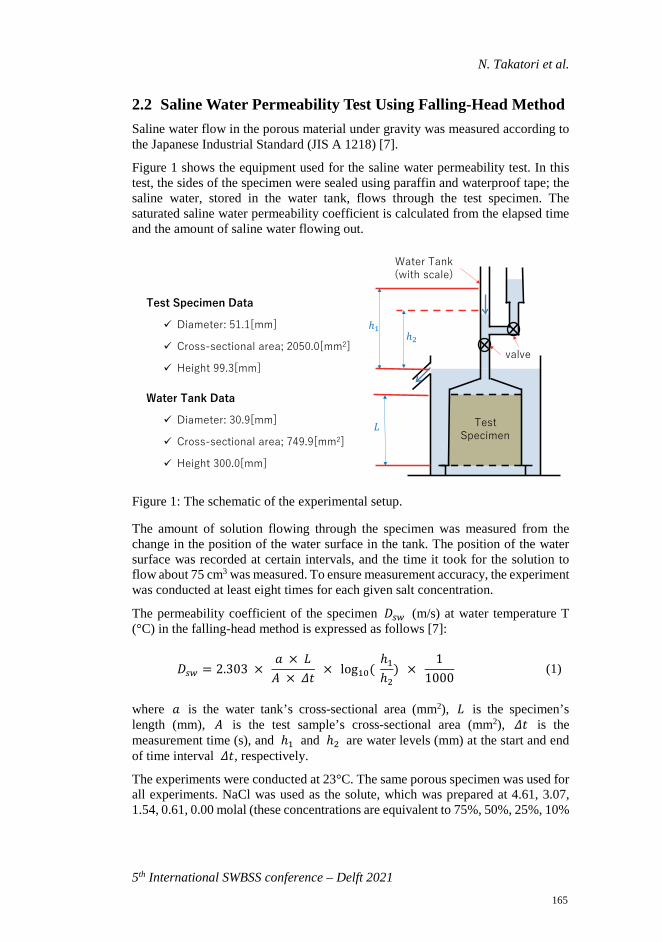
N. Takatori et al.
5th International SWBSS conference – Delft 2021
2.2 Saline Water Permeability Test Using Falling-Head Method Saline water flow in the porous material under gravity was measured according to the Japanese Industrial Standard (JIS A 1218) [7].
Figure 1 shows the equipment used for the saline water permeability test. In this test, the sides of the specimen were sealed using paraffin and waterproof tape; the saline water, stored in the water tank, flows through the test specimen. The saturated saline water permeability coefficient is calculated from the elapsed time and the amount of saline water flowing out.
Figure 1: The schematic of the experimental setup.
The amount of solution flowing through the specimen was measured from the change in the position of the water surface in the tank. The position of the water surface was recorded at certain intervals, and the time it took for the solution to flow about 75 cm3 was measured. To ensure measurement accuracy, the experiment was conducted at least eight times for each given salt concentration.
The permeability coefficient of the specimen 𝐷𝐷𝑠𝑠𝑠𝑠 (m/s) at water temperature T (°C) in the falling-head method is expressed as follows [7]:
𝐷𝐷𝑠𝑠𝑠𝑠 = 2.303 × 𝑎𝑎 × 𝐿𝐿𝐴𝐴 × 𝛥𝛥𝛥𝛥
× log10( ℎ1ℎ2
) × 1
1000 (1)
where 𝑎𝑎 is the water tank’s cross-sectional area (mm2), 𝐿𝐿 is the specimen’s length (mm), 𝐴𝐴 is the test sample’s cross-sectional area (mm2), 𝛥𝛥𝛥𝛥 is the measurement time (s), and ℎ1 and ℎ2 are water levels (mm) at the start and end of time interval 𝛥𝛥𝛥𝛥, respectively.
The experiments were conducted at 23°C. The same porous specimen was used for all experiments. NaCl was used as the solute, which was prepared at 4.61, 3.07, 1.54, 0.61, 0.00 molal (these concentrations are equivalent to 75%, 50%, 25%, 10%
Test Specimen Data
Diameter: 51.1[mm]
Cross-sectional area; 2050.0[mm2]
Height 99.3[mm]
TestSpecimen
Water Tank (with scale)
valve
Water Tank Data
Diameter: 30.9[mm]
Cross-sectional area; 749.9[mm2]
Height 300.0[mm]
165
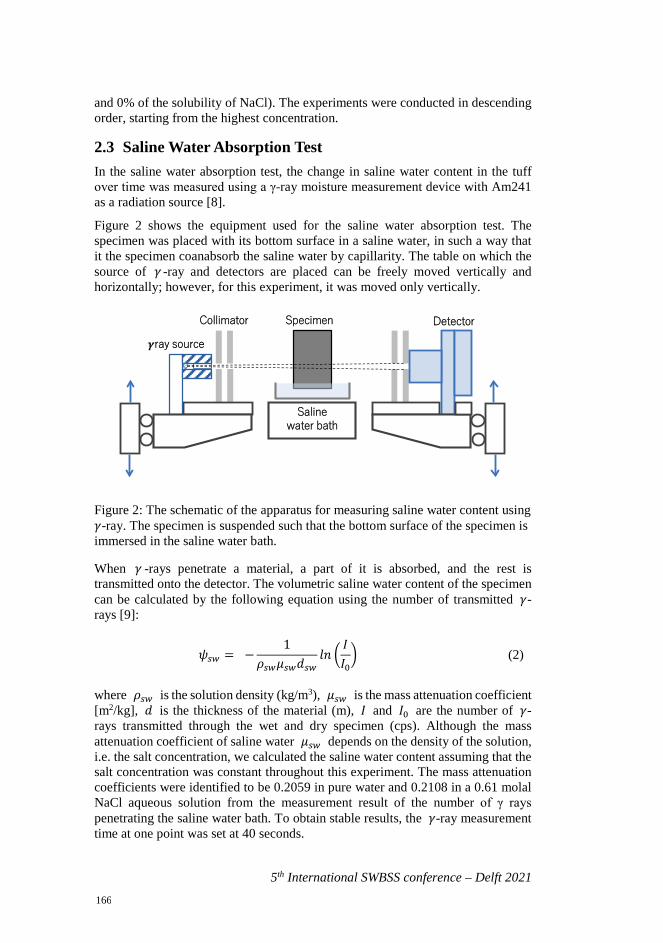
5th International SWBSS conference – Delft 2021
and 0% of the solubility of NaCl). The experiments were conducted in descending order, starting from the highest concentration.
2.3 Saline Water Absorption Test In the saline water absorption test, the change in saline water content in the tuff over time was measured using a γ-ray moisture measurement device with Am241 as a radiation source [8].
Figure 2 shows the equipment used for the saline water absorption test. The specimen was placed with its bottom surface in a saline water, in such a way that it the specimen coanabsorb the saline water by capillarity. The table on which the source of 𝛾𝛾 -ray and detectors are placed can be freely moved vertically and horizontally; however, for this experiment, it was moved only vertically.
Figure 2: The schematic of the apparatus for measuring saline water content using 𝛾𝛾-ray. The specimen is suspended such that the bottom surface of the specimen is immersed in the saline water bath.
When 𝛾𝛾 -rays penetrate a material, a part of it is absorbed, and the rest is transmitted onto the detector. The volumetric saline water content of the specimen can be calculated by the following equation using the number of transmitted 𝛾𝛾-rays [9]:
𝜓𝜓𝑠𝑠𝑠𝑠 = −1
𝜌𝜌𝑠𝑠𝑠𝑠𝜇𝜇𝑠𝑠𝑠𝑠𝑑𝑑𝑠𝑠𝑠𝑠𝑙𝑙𝑙𝑙 �
𝐼𝐼𝐼𝐼0� (2)
where 𝜌𝜌𝑠𝑠𝑠𝑠 is the solution density (kg/m3), 𝜇𝜇𝑠𝑠𝑠𝑠 is the mass attenuation coefficient [m2/kg], 𝑑𝑑 is the thickness of the material (m), 𝐼𝐼 and 𝐼𝐼0 are the number of 𝛾𝛾-rays transmitted through the wet and dry specimen (cps). Although the mass attenuation coefficient of saline water 𝜇𝜇𝑠𝑠𝑠𝑠 depends on the density of the solution, i.e. the salt concentration, we calculated the saline water content assuming that thesalt concentration was constant throughout this experiment. The mass attenuationcoefficients were identified to be 0.2059 in pure water and 0.2108 in a 0.61 molalNaCl aqueous solution from the measurement result of the number of γ rayspenetrating the saline water bath. To obtain stable results, the 𝛾𝛾-ray measurementtime at one point was set at 40 seconds.
Specimen Detector
ray source
Collimator
Saline water bath
166
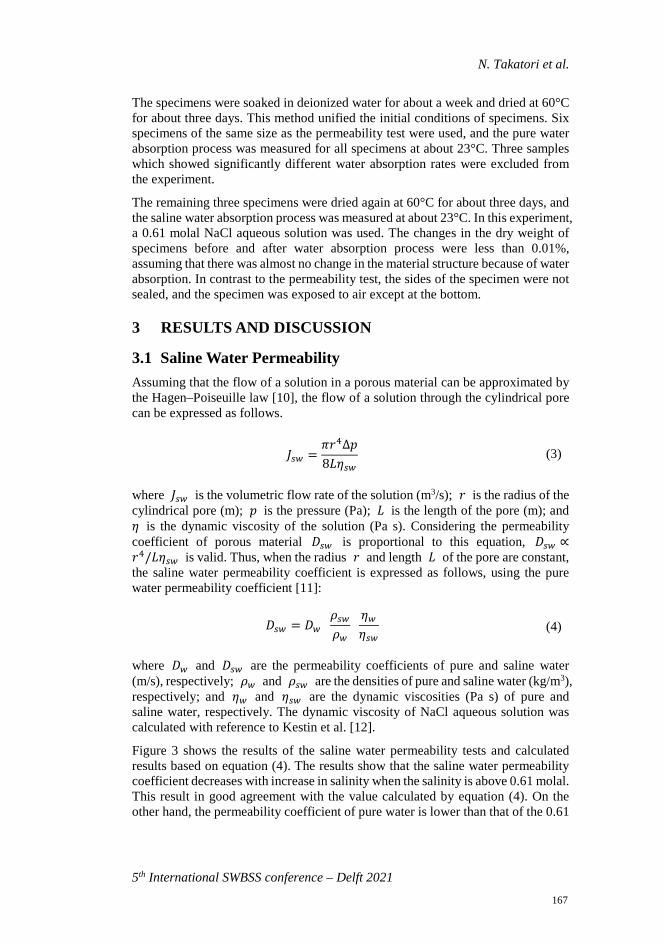
N. Takatori et al.
5th International SWBSS conference – Delft 2021
The specimens were soaked in deionized water for about a week and dried at 60°C for about three days. This method unified the initial conditions of specimens. Six specimens of the same size as the permeability test were used, and the pure water absorption process was measured for all specimens at about 23°C. Three samples which showed significantly different water absorption rates were excluded from the experiment.
The remaining three specimens were dried again at 60°C for about three days, and the saline water absorption process was measured at about 23°C. In this experiment, a 0.61 molal NaCl aqueous solution was used. The changes in the dry weight of specimens before and after water absorption process were less than 0.01%, assuming that there was almost no change in the material structure because of water absorption. In contrast to the permeability test, the sides of the specimen were not sealed, and the specimen was exposed to air except at the bottom.
3 RESULTS AND DISCUSSION
3.1 Saline Water Permeability Assuming that the flow of a solution in a porous material can be approximated by the Hagen–Poiseuille law [10], the flow of a solution through the cylindrical pore can be expressed as follows.
𝐽𝐽𝑠𝑠𝑠𝑠 =𝜋𝜋𝑟𝑟4Δ𝑝𝑝8𝐿𝐿𝜂𝜂𝑠𝑠𝑠𝑠
(3)
where 𝐽𝐽𝑠𝑠𝑠𝑠 is the volumetric flow rate of the solution (m3/s); 𝑟𝑟 is the radius of the cylindrical pore (m); 𝑝𝑝 is the pressure (Pa); 𝐿𝐿 is the length of the pore (m); and 𝜂𝜂 is the dynamic viscosity of the solution (Pa s). Considering the permeability coefficient of porous material 𝐷𝐷𝑠𝑠𝑠𝑠 is proportional to this equation, 𝐷𝐷𝑠𝑠𝑠𝑠 ∝𝑟𝑟4/𝐿𝐿𝜂𝜂𝑠𝑠𝑠𝑠 is valid. Thus, when the radius 𝑟𝑟 and length 𝐿𝐿 of the pore are constant, the saline water permeability coefficient is expressed as follows, using the pure water permeability coefficient [11]:
𝐷𝐷𝑠𝑠𝑠𝑠 = 𝐷𝐷𝑠𝑠 𝜌𝜌𝑠𝑠𝑠𝑠𝜌𝜌𝑠𝑠
𝜂𝜂𝑠𝑠𝜂𝜂𝑠𝑠𝑠𝑠
(4)
where 𝐷𝐷𝑠𝑠 and 𝐷𝐷𝑠𝑠𝑠𝑠 are the permeability coefficients of pure and saline water (m/s), respectively; 𝜌𝜌𝑠𝑠 and 𝜌𝜌𝑠𝑠𝑠𝑠 are the densities of pure and saline water (kg/m3), respectively; and 𝜂𝜂𝑠𝑠 and 𝜂𝜂𝑠𝑠𝑠𝑠 are the dynamic viscosities (Pa s) of pure and saline water, respectively. The dynamic viscosity of NaCl aqueous solution was calculated with reference to Kestin et al. [12].
Figure 3 shows the results of the saline water permeability tests and calculated results based on equation (4). The results show that the saline water permeability coefficient decreases with increase in salinity when the salinity is above 0.61 molal. This result in good agreement with the value calculated by equation (4). On the other hand, the permeability coefficient of pure water is lower than that of the 0.61
167
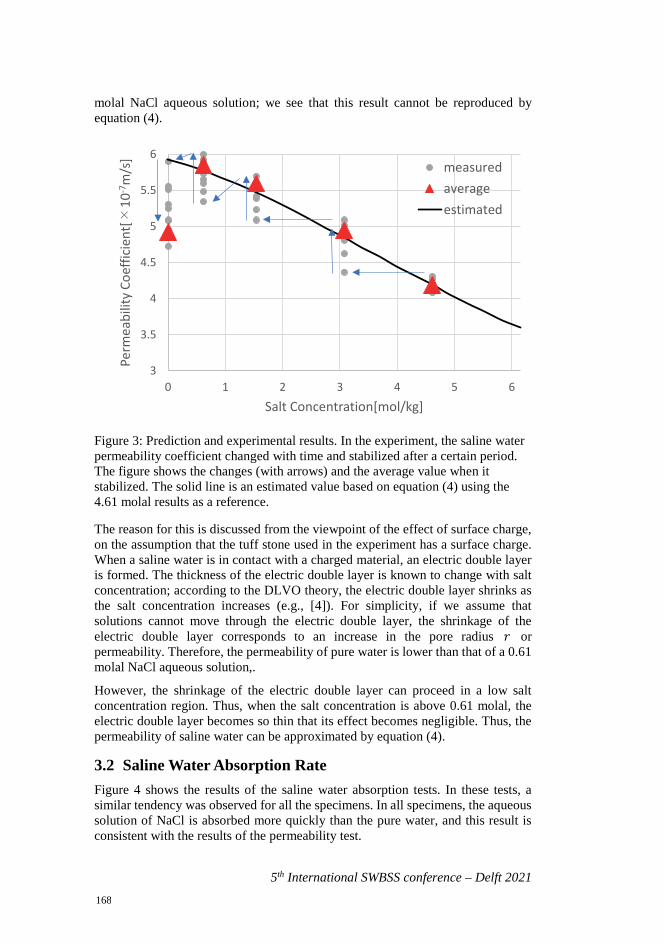
5th International SWBSS conference – Delft 2021
molal NaCl aqueous solution; we see that this result cannot be reproduced by equation (4).
Figure 3: Prediction and experimental results. In the experiment, the saline water permeability coefficient changed with time and stabilized after a certain period. The figure shows the changes (with arrows) and the average value when it stabilized. The solid line is an estimated value based on equation (4) using the 4.61 molal results as a reference.
The reason for this is discussed from the viewpoint of the effect of surface charge, on the assumption that the tuff stone used in the experiment has a surface charge. When a saline water is in contact with a charged material, an electric double layer is formed. The thickness of the electric double layer is known to change with salt concentration; according to the DLVO theory, the electric double layer shrinks as the salt concentration increases (e.g., [4]). For simplicity, if we assume that solutions cannot move through the electric double layer, the shrinkage of the electric double layer corresponds to an increase in the pore radius 𝑟𝑟 or permeability. Therefore, the permeability of pure water is lower than that of a 0.61 molal NaCl aqueous solution,.
However, the shrinkage of the electric double layer can proceed in a low salt concentration region. Thus, when the salt concentration is above 0.61 molal, the electric double layer becomes so thin that its effect becomes negligible. Thus, the permeability of saline water can be approximated by equation (4).
3.2 Saline Water Absorption Rate Figure 4 shows the results of the saline water absorption tests. In these tests, a similar tendency was observed for all the specimens. In all specimens, the aqueous solution of NaCl is absorbed more quickly than the pure water, and this result is consistent with the results of the permeability test.
3
3.5
4
4.5
5
5.5
6
0 1 2 3 4 5 6
Perm
eabi
lity
Coef
ficie
nt[×
10-7
m/s
]
Salt Concentration[mol/kg]
measuredaverageestimated
168
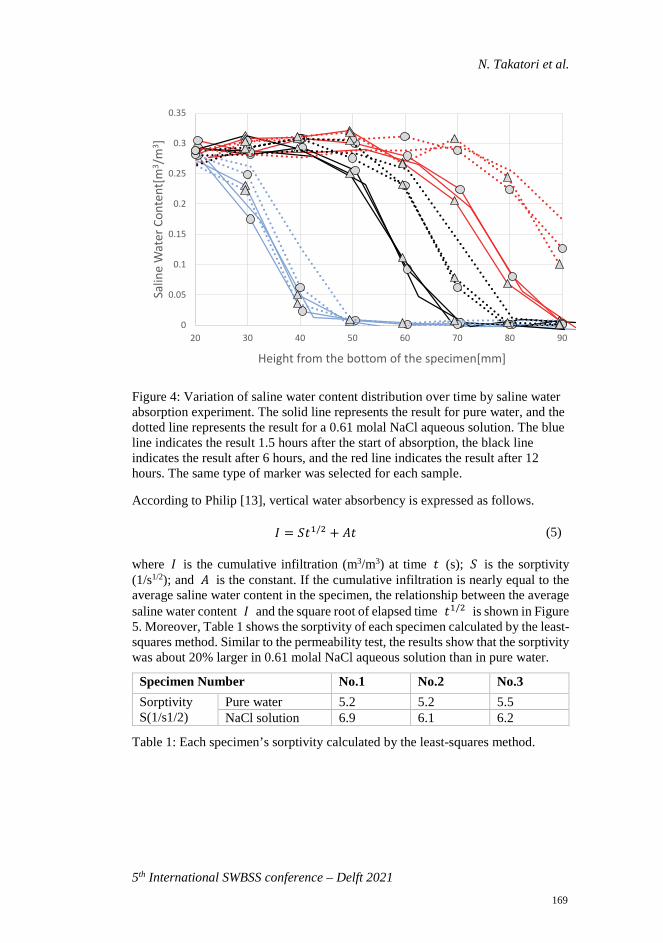
N. Takatori et al.
5th International SWBSS conference – Delft 2021
Figure 4: Variation of saline water content distribution over time by saline water absorption experiment. The solid line represents the result for pure water, and the dotted line represents the result for a 0.61 molal NaCl aqueous solution. The blue line indicates the result 1.5 hours after the start of absorption, the black line indicates the result after 6 hours, and the red line indicates the result after 12 hours. The same type of marker was selected for each sample.
According to Philip [13], vertical water absorbency is expressed as follows.
𝐼𝐼 = 𝑆𝑆𝛥𝛥1/2 + 𝐴𝐴𝛥𝛥 (5)
where 𝐼𝐼 is the cumulative infiltration (m3/m3) at time 𝛥𝛥 (s); 𝑆𝑆 is the sorptivity (1/s1/2); and 𝐴𝐴 is the constant. If the cumulative infiltration is nearly equal to the average saline water content in the specimen, the relationship between the average saline water content 𝐼𝐼 and the square root of elapsed time 𝛥𝛥1/2 is shown in Figure 5. Moreover, Table 1 shows the sorptivity of each specimen calculated by the least-squares method. Similar to the permeability test, the results show that the sorptivity was about 20% larger in 0.61 molal NaCl aqueous solution than in pure water.
Specimen Number No.1 No.2 No.3 Sorptivity S(1/s1/2)
Pure water 5.2 5.2 5.5 NaCl solution 6.9 6.1 6.2
Table 1: Each specimen’s sorptivity calculated by the least-squares method.
0
0.05
0.1
0.15
0.2
0.25
0.3
0.35
20 30 40 50 60 70 80 90
Salin
e W
ater
Con
tent
[m3 /
m3 ]
Height from the bottom of the specimen[mm]
169
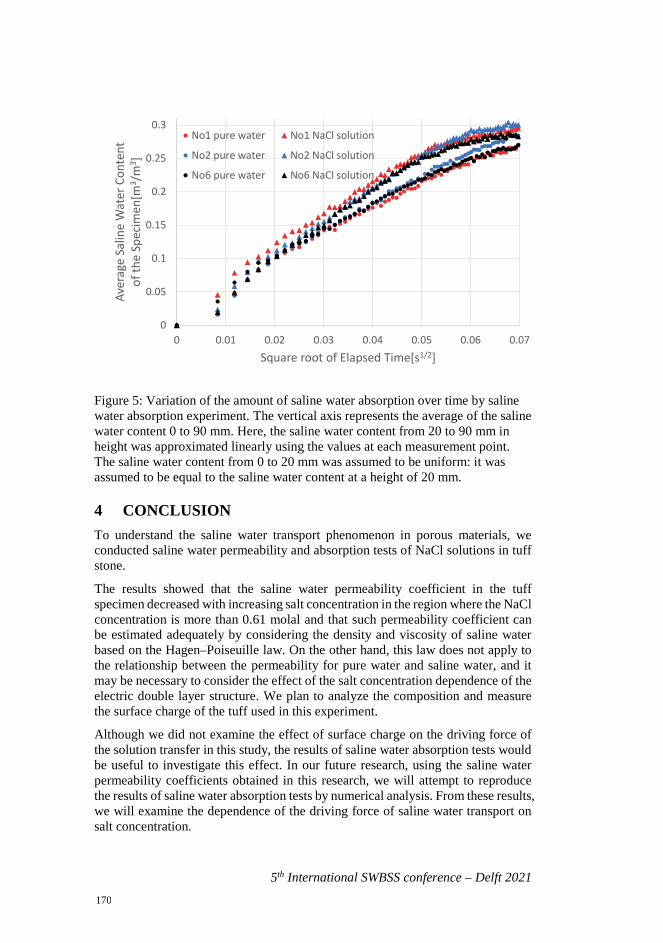
5th International SWBSS conference – Delft 2021
Figure 5: Variation of the amount of saline water absorption over time by saline water absorption experiment. The vertical axis represents the average of the saline water content 0 to 90 mm. Here, the saline water content from 20 to 90 mm in height was approximated linearly using the values at each measurement point. The saline water content from 0 to 20 mm was assumed to be uniform: it was assumed to be equal to the saline water content at a height of 20 mm.
4 CONCLUSION To understand the saline water transport phenomenon in porous materials, we conducted saline water permeability and absorption tests of NaCl solutions in tuff stone.
The results showed that the saline water permeability coefficient in the tuff specimen decreased with increasing salt concentration in the region where the NaCl concentration is more than 0.61 molal and that such permeability coefficient can be estimated adequately by considering the density and viscosity of saline water based on the Hagen–Poiseuille law. On the other hand, this law does not apply to the relationship between the permeability for pure water and saline water, and it may be necessary to consider the effect of the salt concentration dependence of the electric double layer structure. We plan to analyze the composition and measure the surface charge of the tuff used in this experiment.
Although we did not examine the effect of surface charge on the driving force of the solution transfer in this study, the results of saline water absorption tests would be useful to investigate this effect. In our future research, using the saline water permeability coefficients obtained in this research, we will attempt to reproduce the results of saline water absorption tests by numerical analysis. From these results, we will examine the dependence of the driving force of saline water transport on salt concentration.
0
0.05
0.1
0.15
0.2
0.25
0.3
0 0.01 0.02 0.03 0.04 0.05 0.06 0.07
Aver
age
Salin
e W
ater
Con
tent
of
the
Spec
imen
[m3 /
m3 ]
Square root of Elapsed Time[s1/2]
No1 pure water No1 NaCl solution
No2 pure water No2 NaCl solution
No6 pure water No6 NaCl solution
170
N. Takatori et al.
5th International SWBSS conference – Delft 2021
ACKNOWLEDGEMENTS This work was supported by JSPS KAKENHI Grant Number JP20K22445 and JP18H01596. The authors would like to thank Enago (www.enago.jp) for the English review.
REFERENCES [1] N. Takatori et al., “Investigation of the preservation of salt damage about the
Buddha statue carved into the cliff by controlling the room temperature and humidity in the shelter,” 4th International Conference on Salt Weathering on Buildings and Stone Sculptures, pp.125–134, 2017
[2] L. Pel et al. “Physical principles and efficiency of salt extraction by poulticing”, Journal of Cultural Heritage, vol.11, pp.59-67, 2010
[3] A. Nicolai, “Modelling and numerical simulation of salt transport and phase transitions in unsaturated porous building materials,” Ph.D. thesis, Syracuse University, USA, 2008.
[4] T. Cosgrove. “Colloid Science-Principles, Methods and Applications-,” John Wiley & Sons Ltd, 2010
[5] Oita City Board of Education, “Kunishiteishiseki Oita Motomachi Sekibutsu Hozonsyurijigyo Hokokusho (in Japanese),” Education Board of Oita-shi, 1996.
[6] H. Hase et al., “Measurement of zeta-potential in various rock samples of Aso Volcano,” Annuals of Disas. Prev. Res. Inst., Kyoto Univ., No.45 B, 1996.
[7] Japanese Industrial Standard, “Test methods for permeability of saturated soils,” JIS A 1218:2020.
[8] S. Takada et al., “Experimental and Analytical Investigation of Moisture Movement in Clothing,” Journal of Building Physics, vol.31, no. 2, pp.125–142, 2007.
[9] K. Fukui et al. “Effect of air pressure on moisture transfer inside porous building materials,” Japan Architectural Review, vol.1, no. 4, pp.538–547, 2018
[10] A. William et al., “Soil physics -6th edition-,” John Wiley & Sons, 2004.
[11] H. Derluyn, “Salt transport and crystallization in porous limestone: Neutron - X-Ray imaging and poromechanical modeling,” Ph.D. thesis, ETH ZURICH, Switzerland, 2012.
[12] J. Kestin et.al., “Tables of the dynamic and kinematic viscosity of aqueous NaCl solutions in the temperature range 20-150 C and the pressure range 0.1-35MPa”, Journal of Physical and Chemical Reference Data, vol.10, 1981
[13] J. R. Philip, "The theory of infiltration: 4. Sorptivity and algebraic infiltration equations". Soil Science., vol. 84, pp. 257–264, 1957
171

172
5th International SWBSS conference – Delft 2021
EVALUATION OF CHANGE IN PORE NETWORK STRUCTURE CAUSED BY HALITE CRYSTALLISATION
Etsuko Mizutani1,2* , Daisuke Ogura3, Masaru Abuku4 and Hannelore Derluyn5, 6
KEYWORDS Crystallisation, pore clogging, tortuosity, pore size distribution, image analysis
ABSTRACT Pore clogging by salt crystallisation significantly changes both vapour and liquid moisture transport. This study aimed to quantify salt crystal distribution in porous materials and the change in the pore network structure before and after salt crystal-lisation to evaluate the effects of pore clogging on the mass transport phenomena. Three-dimensional scanning by synchrotron X-ray computed tomography (SPring-8, Japan) was conducted to quantify the time change in salt crystal distribution during evaporation. Fired clay brick specimens saturated with a salt (NaCl) solution were dried under ambient conditions and scanned at specific time instants. The amount of the salt crystal determined by image analysis was consistent with the estimated values obtained by the weight measurement of vaporised water. Addi-tionally, the pore size distribution, tortuosity and effective porosity and specific surface area before and after salt precipitation are calculated by the 3D medial axis (3DMA) processing with segmented images to investigate the change of saturated hydraulic conductivity and vapour diffusivity due to salt precipitation. Below a certain depth, the physical properties decreased linearly with increasing salt occu-pancy.
1 NICH, Cultural Heritage Disaster Risk Management Center, Japan, mizu-
[email protected] 2 NICH, Tokyo National Research Institute for Cultural Properties,Japan 3 Graduate school of Engineering, Kyoto University, Kyoto, japan 4 Kindai University, Higashiosaka, Japan 5 Universite de Pau et des Pays de l’Adour, E2S UPPA, CNRS, Total, LFCR,
Pau, France 6 Universite de Pau et des Pays de l’Adour, E2S UPPA, CNRS, DMEX, Pau,
France
173
5th International SWBSS conference – Delft 2021
1 INTRODUCTION A prediction model for salt weathering is very useful for the development of ap-propriate conservation and restoration plans in various climatic conditions and sev-eral numerical models have been proposed [1,2]. However, there are many points where the physical phenomena related to salt precipitation in porous materials are still unknown.
One of the issues of improving the numerical analysis of salt weathering is how to express the change in mass transport properties due to the precipitation of salt. Alt-hough the significance of the effect of pore clogging due to salt precipitation on mass transport is apparent from experimental research in the literature [3, 4], the quantitative relationship between crystal formation and the change in the mass transport properties is unknown because of the difficulty of quantifying the salt crystals in the porous material. To relate salt precipitation and the change of transport properties, one should determine where and how much salts precipitate and how the salt crystals change the pore network structure. The pore network structure is mainly characterised by connectivity, pore size distribution and tortu-osity, which are directly affecting gas and liquid transfer in porous media.
In this paper, a drying experiment using fired clay brick saturated with a NaCl so-lution is conducted to quantify the salt precipitation in porous media, as well as its influence on mass transport. Synchrotron radiation X-ray computed tomography (CT), which offers three-dimensional (3D) images with high spatial resolution, is used to quantify the spatial distribution of salt crystals through time in fired clay brick during drying. Additionally, the medial axis for void space before and after salt crystallisation is constructed in the 3D medial axis (3DMA)based on the burn-ing algorithm [5] to calculate the pore size distribution, effective porosity, tortuos-ity and specific surface area. By using these parameters to characterise the pore network structure, the change of saturated hydraulic conductivity and vapour dif-fusivity due to salt crystals is directly calculated.
2 MATERIALS AND METHODS
2.1 Materials Japanese fired clay brick (red brick produced by Okamoto Co.) was used for the experiments. The capillary moisture content of this brick is 0.17 m3/ m3, and the total open porosity is 0.24 m3/m3. Figure 1 shows the pore size distribution meas-ured by mercury porosimetry.
Brick specimens of 5 mm × 5 mm × 8 mm were prepared, and an epoxy resin was applied on the lateral sides, making these surfaces water and vapour tight. This ensures a one-dimensional mass transfer during the drying experiments. Drying was monitored on three specimens after capillary saturating with a saturated NaCl solution. The monitoring was conducted both gravimetrically and through X-ray CT scanning at beamline BL20B2. The gravimetric measurements were performed outside of the X-ray CT hutch, at 25°C and 35.8 % RH, whereas the climate inside the hutch was slightly warmer, being 26.5°C and 33% RH on average. The speci-mens were placed in a holder as shown in Figure 2. The specimens were held by an upper polypropylene cup in which the salt solution was injected. Then the upper
174
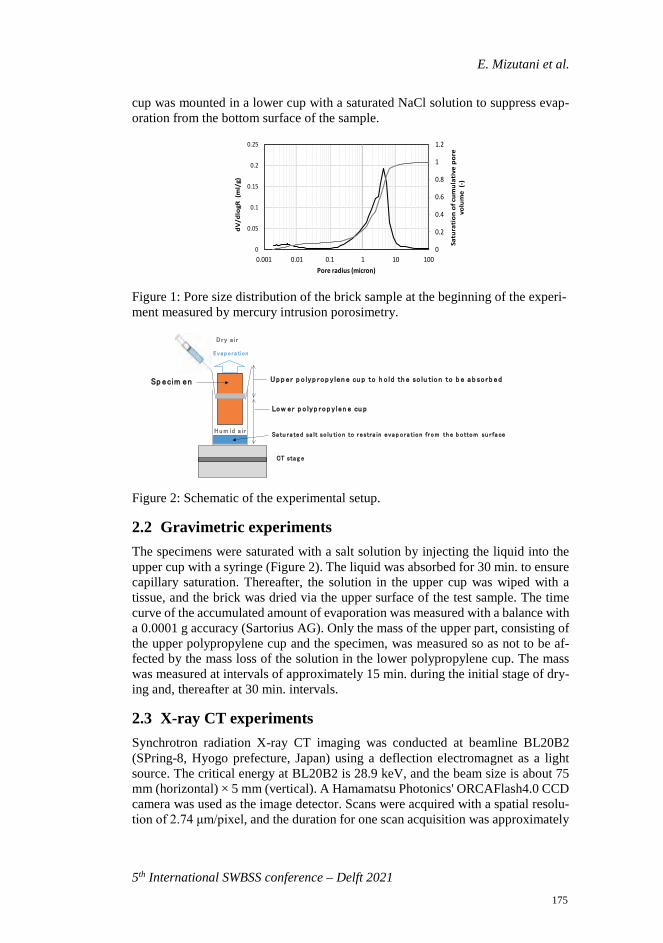
E. Mizutani et al.
5th International SWBSS conference – Delft 2021
cup was mounted in a lower cup with a saturated NaCl solution to suppress evap-oration from the bottom surface of the sample.
Figure 1: Pore size distribution of the brick sample at the beginning of the experi-ment measured by mercury intrusion porosimetry.
Figure 2: Schematic of the experimental setup.
2.2 Gravimetric experiments The specimens were saturated with a salt solution by injecting the liquid into the upper cup with a syringe (Figure 2). The liquid was absorbed for 30 min. to ensure capillary saturation. Thereafter, the solution in the upper cup was wiped with a tissue, and the brick was dried via the upper surface of the test sample. The time curve of the accumulated amount of evaporation was measured with a balance with a 0.0001 g accuracy (Sartorius AG). Only the mass of the upper part, consisting of the upper polypropylene cup and the specimen, was measured so as not to be af-fected by the mass loss of the solution in the lower polypropylene cup. The mass was measured at intervals of approximately 15 min. during the initial stage of dry-ing and, thereafter at 30 min. intervals.
2.3 X-ray CT experiments Synchrotron radiation X-ray CT imaging was conducted at beamline BL20B2 (SPring-8, Hyogo prefecture, Japan) using a deflection electromagnet as a light source. The critical energy at BL20B2 is 28.9 keV, and the beam size is about 75 mm (horizontal) × 5 mm (vertical). A Hamamatsu Photonics' ORCAFlash4.0 CCD camera was used as the image detector. Scans were acquired with a spatial resolu-tion of 2.74 μm/pixel, and the duration for one scan acquisition was approximately
0
0.2
0.4
0.6
0.8
1
1.2
0
0.05
0.1
0.15
0.2
0.25
0.001 0.01 0.1 1 10 100
Satu
rati
on o
f cum
ulat
ive
pore
vo
lum
e (-
)
dV/d
logR
(m
l/g)
Pore radius (micron)
Up p er p o lyp rop y len e cu p to h o ld th e so lu tio n to b e a b so rb ed
Eva p o ra tion
Low er p o lyp rop y len e cu p
Sa tu ra ted sa lt so lu tio n to restra in eva p o ra tio n from th e b o ttom su r fa ce
CT sta g e
Sp ecim en
H u m id a ir
D ry a ir
175
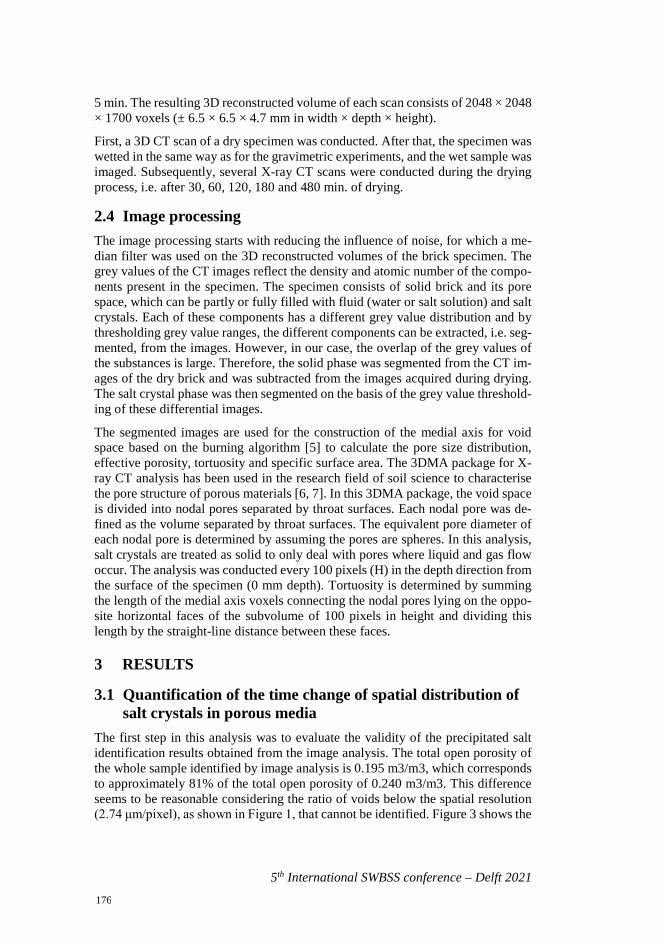
5th International SWBSS conference – Delft 2021
5 min. The resulting 3D reconstructed volume of each scan consists of 2048 × 2048 × 1700 voxels (± 6.5 × 6.5 × 4.7 mm in width × depth × height).
First, a 3D CT scan of a dry specimen was conducted. After that, the specimen was wetted in the same way as for the gravimetric experiments, and the wet sample was imaged. Subsequently, several X-ray CT scans were conducted during the drying process, i.e. after 30, 60, 120, 180 and 480 min. of drying.
2.4 Image processing The image processing starts with reducing the influence of noise, for which a me-dian filter was used on the 3D reconstructed volumes of the brick specimen. The grey values of the CT images reflect the density and atomic number of the compo-nents present in the specimen. The specimen consists of solid brick and its pore space, which can be partly or fully filled with fluid (water or salt solution) and salt crystals. Each of these components has a different grey value distribution and by thresholding grey value ranges, the different components can be extracted, i.e. seg-mented, from the images. However, in our case, the overlap of the grey values of the substances is large. Therefore, the solid phase was segmented from the CT im-ages of the dry brick and was subtracted from the images acquired during drying. The salt crystal phase was then segmented on the basis of the grey value threshold-ing of these differential images.
The segmented images are used for the construction of the medial axis for void space based on the burning algorithm [5] to calculate the pore size distribution, effective porosity, tortuosity and specific surface area. The 3DMA package for X-ray CT analysis has been used in the research field of soil science to characterise the pore structure of porous materials [6, 7]. In this 3DMA package, the void space is divided into nodal pores separated by throat surfaces. Each nodal pore was de-fined as the volume separated by throat surfaces. The equivalent pore diameter of each nodal pore is determined by assuming the pores are spheres. In this analysis, salt crystals are treated as solid to only deal with pores where liquid and gas flow occur. The analysis was conducted every 100 pixels (H) in the depth direction from the surface of the specimen (0 mm depth). Tortuosity is determined by summing the length of the medial axis voxels connecting the nodal pores lying on the oppo-site horizontal faces of the subvolume of 100 pixels in height and dividing this length by the straight-line distance between these faces.
3 RESULTS
3.1 Quantification of the time change of spatial distribution of salt crystals in porous media
The first step in this analysis was to evaluate the validity of the precipitated salt identification results obtained from the image analysis. The total open porosity of the whole sample identified by image analysis is 0.195 m3/m3, which corresponds to approximately 81% of the total open porosity of 0.240 m3/m3. This difference seems to be reasonable considering the ratio of voids below the spatial resolution (2.74 μm/pixel), as shown in Figure 1, that cannot be identified. Figure 3 shows the
176
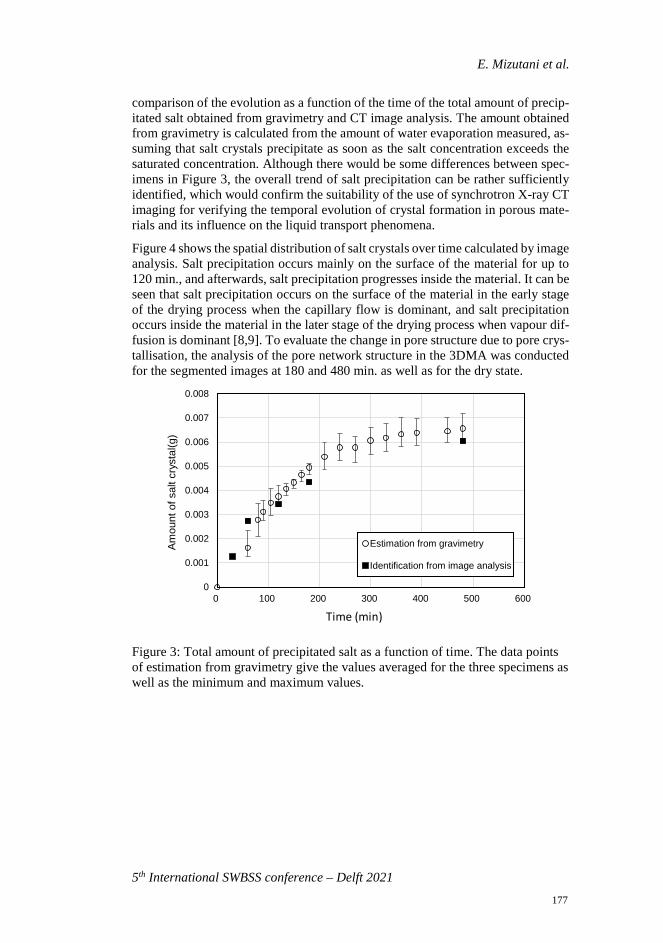
E. Mizutani et al.
5th International SWBSS conference – Delft 2021
comparison of the evolution as a function of the time of the total amount of precip-itated salt obtained from gravimetry and CT image analysis. The amount obtained from gravimetry is calculated from the amount of water evaporation measured, as-suming that salt crystals precipitate as soon as the salt concentration exceeds the saturated concentration. Although there would be some differences between spec-imens in Figure 3, the overall trend of salt precipitation can be rather sufficiently identified, which would confirm the suitability of the use of synchrotron X-ray CT imaging for verifying the temporal evolution of crystal formation in porous mate-rials and its influence on the liquid transport phenomena.
Figure 4 shows the spatial distribution of salt crystals over time calculated by image analysis. Salt precipitation occurs mainly on the surface of the material for up to 120 min., and afterwards, salt precipitation progresses inside the material. It can be seen that salt precipitation occurs on the surface of the material in the early stage of the drying process when the capillary flow is dominant, and salt precipitation occurs inside the material in the later stage of the drying process when vapour dif-fusion is dominant [8,9]. To evaluate the change in pore structure due to pore crys-tallisation, the analysis of the pore network structure in the 3DMA was conducted for the segmented images at 180 and 480 min. as well as for the dry state.
Figure 3: Total amount of precipitated salt as a function of time. The data points of estimation from gravimetry give the values averaged for the three specimens as well as the minimum and maximum values.
0
0.001
0.002
0.003
0.004
0.005
0.006
0.007
0.008
0 100 200 300 400 500 600
Amou
nt o
f sal
t cry
stal
(g)
Elasped time(min)
Estimation from gravimetry
Identification from image analysis
Time (min)
177
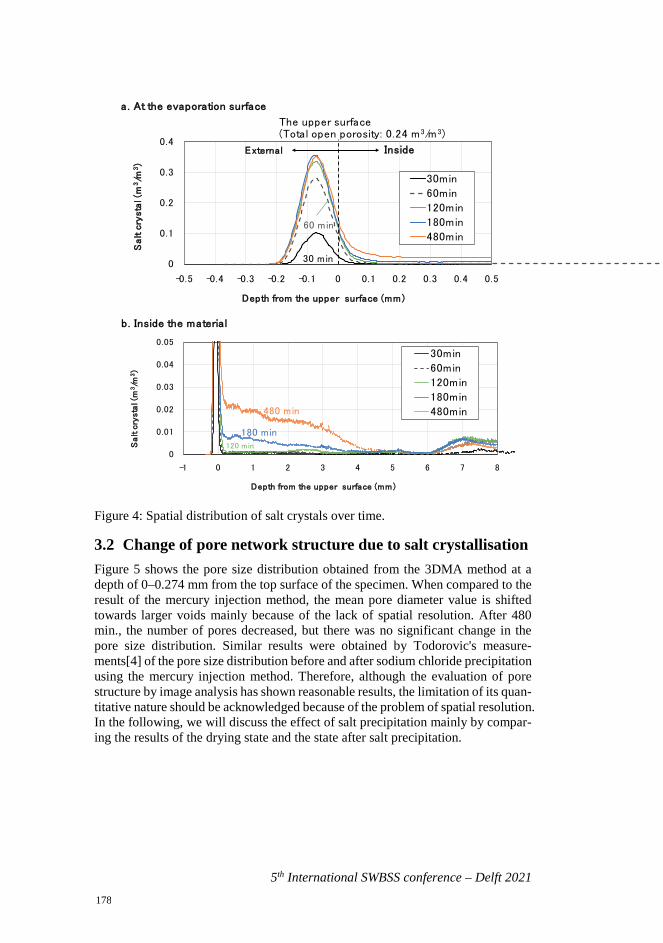
5th International SWBSS conference – Delft 2021
Figure 4: Spatial distribution of salt crystals over time.
3.2 Change of pore network structure due to salt crystallisation Figure 5 shows the pore size distribution obtained from the 3DMA method at a depth of 0–0.274 mm from the top surface of the specimen. When compared to the result of the mercury injection method, the mean pore diameter value is shifted towards larger voids mainly because of the lack of spatial resolution. After 480 min., the number of pores decreased, but there was no significant change in the pore size distribution. Similar results were obtained by Todorovic's measure-ments[4] of the pore size distribution before and after sodium chloride precipitation using the mercury injection method. Therefore, although the evaluation of pore structure by image analysis has shown reasonable results, the limitation of its quan-titative nature should be acknowledged because of the problem of spatial resolution. In the following, we will discuss the effect of salt precipitation mainly by compar-ing the results of the drying state and the state after salt precipitation.
0
0.1
0.2
0.3
0.4
-0.5 -0.4 -0.3 -0.2 -0.1 0 0.1 0.2 0.3 0.4 0.5
Salt c
rysta
l (m
3/m
3)
Depth from the upper surface (mm)
a. At the evaporation surface
30min
60min
120min
180min
480min
30 min
60 min
The upper surface (Total open porosity: 0.24 m3/m3)
External Inside
0
0.01
0.02
0.03
0.04
0.05
-1 0 1 2 3 4 5 6 7 8
Salt c
rysta
l (m
3/m
3)
Depth from the upper surface (mm)
b. Inside the material
30min
60min
120min
180min
480min
180 min
480 min
120 min
178
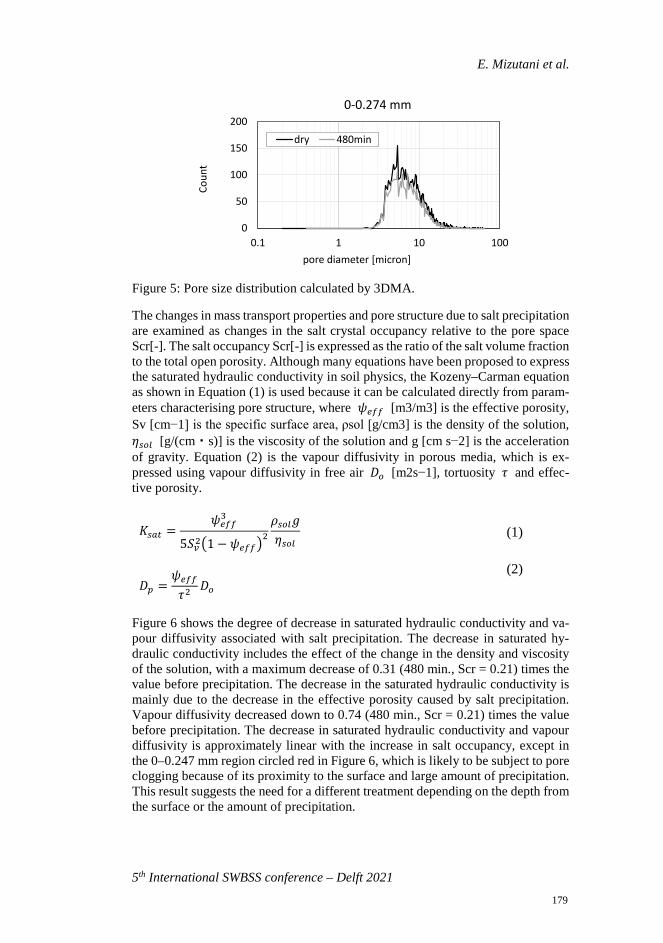
E. Mizutani et al.
5th International SWBSS conference – Delft 2021
Figure 5: Pore size distribution calculated by 3DMA.
The changes in mass transport properties and pore structure due to salt precipitation are examined as changes in the salt crystal occupancy relative to the pore space Scr[-]. The salt occupancy Scr[-] is expressed as the ratio of the salt volume fraction to the total open porosity. Although many equations have been proposed to express the saturated hydraulic conductivity in soil physics, the Kozeny–Carman equation as shown in Equation (1) is used because it can be calculated directly from param-eters characterising pore structure, where 𝜓𝜓𝑒𝑒𝑒𝑒𝑒𝑒 [m3/m3] is the effective porosity, Sv [cm−1] is the specific surface area, ρsol [g/cm3] is the density of the solution, 𝜂𝜂𝑠𝑠𝑠𝑠𝑠𝑠 [g/(cm・s)] is the viscosity of the solution and g [cm s−2] is the acceleration of gravity. Equation (2) is the vapour diffusivity in porous media, which is ex-pressed using vapour diffusivity in free air 𝐷𝐷𝑠𝑠 [m2s−1], tortuosity 𝜏𝜏 and effec-tive porosity.
𝐾𝐾𝑠𝑠𝑠𝑠𝑠𝑠 =𝜓𝜓𝑒𝑒𝑒𝑒𝑒𝑒3
5𝑆𝑆𝑣𝑣2�1 − 𝜓𝜓𝑒𝑒𝑒𝑒𝑒𝑒�2𝜌𝜌𝑠𝑠𝑠𝑠𝑠𝑠𝑔𝑔𝜂𝜂𝑠𝑠𝑠𝑠𝑠𝑠
(1)
𝐷𝐷𝑝𝑝 =𝜓𝜓𝑒𝑒𝑒𝑒𝑒𝑒𝜏𝜏2
𝐷𝐷𝑠𝑠 (2)
Figure 6 shows the degree of decrease in saturated hydraulic conductivity and va-pour diffusivity associated with salt precipitation. The decrease in saturated hy-draulic conductivity includes the effect of the change in the density and viscosity of the solution, with a maximum decrease of 0.31 (480 min., Scr = 0.21) times the value before precipitation. The decrease in the saturated hydraulic conductivity is mainly due to the decrease in the effective porosity caused by salt precipitation. Vapour diffusivity decreased down to 0.74 (480 min., Scr = 0.21) times the value before precipitation. The decrease in saturated hydraulic conductivity and vapour diffusivity is approximately linear with the increase in salt occupancy, except in the 0–0.247 mm region circled red in Figure 6, which is likely to be subject to pore clogging because of its proximity to the surface and large amount of precipitation. This result suggests the need for a different treatment depending on the depth from the surface or the amount of precipitation.
0
50
100
150
200
0.1 1 10 100
Coun
t
pore diameter [micron]
0-0.274 mm
dry 480min
179
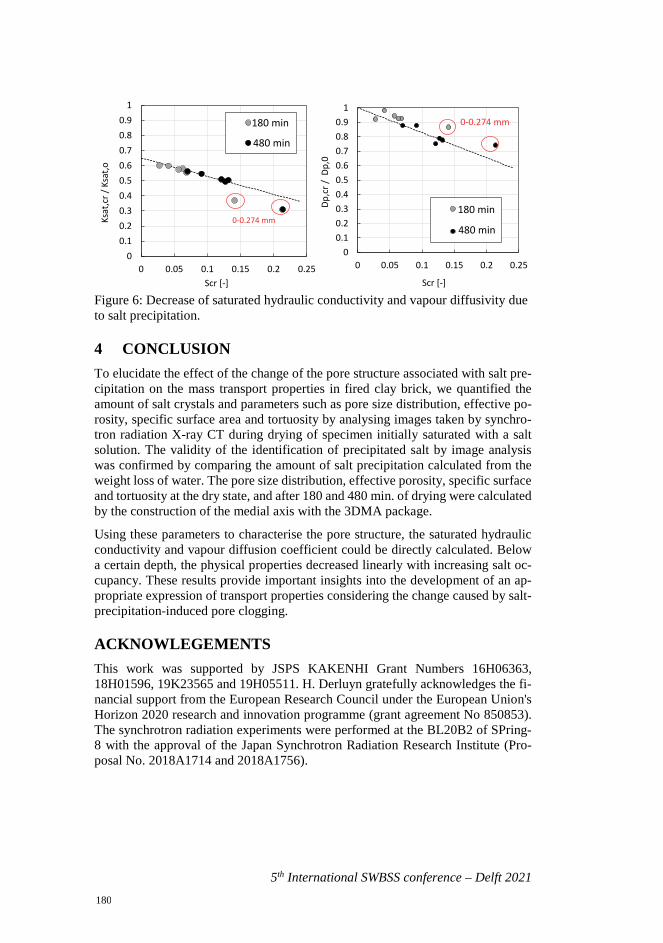
5th International SWBSS conference – Delft 2021
Figure 6: Decrease of saturated hydraulic conductivity and vapour diffusivity due to salt precipitation.
4 CONCLUSION To elucidate the effect of the change of the pore structure associated with salt pre-cipitation on the mass transport properties in fired clay brick, we quantified the amount of salt crystals and parameters such as pore size distribution, effective po-rosity, specific surface area and tortuosity by analysing images taken by synchro-tron radiation X-ray CT during drying of specimen initially saturated with a salt solution. The validity of the identification of precipitated salt by image analysis was confirmed by comparing the amount of salt precipitation calculated from the weight loss of water. The pore size distribution, effective porosity, specific surface and tortuosity at the dry state, and after 180 and 480 min. of drying were calculated by the construction of the medial axis with the 3DMA package.
Using these parameters to characterise the pore structure, the saturated hydraulic conductivity and vapour diffusion coefficient could be directly calculated. Below a certain depth, the physical properties decreased linearly with increasing salt oc-cupancy. These results provide important insights into the development of an ap-propriate expression of transport properties considering the change caused by salt-precipitation-induced pore clogging.
ACKNOWLEGEMENTS This work was supported by JSPS KAKENHI Grant Numbers 16H06363, 18H01596, 19K23565 and 19H05511. H. Derluyn gratefully acknowledges the fi-nancial support from the European Research Council under the European Union's Horizon 2020 research and innovation programme (grant agreement No 850853). The synchrotron radiation experiments were performed at the BL20B2 of SPring-8 with the approval of the Japan Synchrotron Radiation Research Institute (Pro-posal No. 2018A1714 and 2018A1756).
00.10.20.30.40.50.60.70.80.9
1
0 0.05 0.1 0.15 0.2 0.25
Ksat
,cr /
Ksa
t,o
Scr [-]
系列3
系列4
0-0.274 mm
480 min
00.10.20.30.40.50.60.70.80.9
1
0 0.05 0.1 0.15 0.2 0.25
Dp,c
r / D
p,0
Scr [-]
系列3
系列4
0-0.274 mm
180 min
480 min
180 min
180
E. Mizutani et al.
5th International SWBSS conference – Delft 2021
REFERENCES [1] M. Koniorczyk and D. Gawin, “Modelling of salt crystallization in building
materials with microstructure - Poromechanical approach,” Constr. Build. Mater., vol. 36, pp. 860–873, 2012.
[2] H. Derluyn, P. Moonen, and J. Carmeliet, “Deformation and damage due to drying-induced salt crystallization in porous limestone,” J. Mech. Phys. Sol-ids, vol. 63, no. 1, pp. 242–255, 2014.
[3] R. M. Espinosa-Marzal and G. W. Scherer, “Impact of in-pore salt crystalli-zation on transport properties,” Environ. Earth Sci., vol. 69, no. 8, pp. 2657–2669, 2013.
[4] J. Todorović and H. Janssen, “The impact of salt pore clogging on the hygric properties of bricks,” Constr. Build. Mater., vol. 164, pp. 850–863, 2018.
[5] W. B. Lindquist, S.-M. Lee, D. A. Coker, K. W. Jones, and P. Spanne, “Me-dial axis analysis of void structure in three-dimensional tomographic images of porous media,” J. Geophys. Res. Solid Earth, vol. 101, no. B4, pp. 8297–8310, 1996.
[6] S. Hamamoto, P. Moldrup, K. Kawamoto, T. Sakaki, T. Nishimura, and T. Komatsu, “Pore network structure linked by X-ray CT to particle characteris-tics and transport parameters,” Soils Found., vol. 56, no. 4, pp. 676–690, 2016.
[7] M. Takahashi, U. Fujii, C. Ahn, T. Takemura, N. Takahashi, and H. Park, “Microstructure in Kimachi sandstone obtained with mercury intrusion po-rosimetry and µ-focus X ray CT structure analysis,” J. Japan Soc. Eng. Geol., vol. 52, pp. 184–191, 2007.
[8] G. W. Scherer, “Theory of Drying,” J. Am. Ceram. Soc., vol. 73, no. 1, pp. 3–14, 1990.
[9] E. Mizutani et al., “Preliminary investigation of change of pore structure due to salt precipitation during evaporation in brick with X-ray computed tomog-raphy,” in “Monument future : decay and conservation of stone - Proceedings of the 14th International Congress on the Deterioration and Conservation of Stone”, 2020, pp. 455–460.
181

182
5th International SWBSS conference – Delft 2021
SALT CRYSTALLIZATION DECAY IN HISTORIC STONE MASONRY: FROM EXPERIMENTAL TO ONSITE ASSESSMENT
Emily R. McSkimming1*, Graça Vasconcelos2, and Amelia Dionísio3
KEYWORDS Stone masonry, material conservation, salt crystallization, state-of-the-art review
ABSTRACT Stone masonry is a common building fabric of historical architecture worldwide. Many of these buildings were constructed with locally quarried stone and are a means to define the aesthetics of a city. This abstract aims to summarize a state-of-the-art review on salt crystallization decay in historical stone masonry buildings with a focus on the experimental practice, on-site assessment, and the observed gap between these two disciplines. Charola [1] concluded that deterioration induced by salt crystallization cannot be explained by a single mechanism. It is widely ac-cepted that crystallization pressure, albeit not entirely understood, is the most im-portant process at play. Hydration pressure is now considered to be a non-existing phenomenon, as it is another form of crystallization pressure due to the formation of a hydrated phase following dissolution of an anhydrous one [2]. Differential thermal expansion remains somewhat controversial in its relevance and applicabil-ity, with the literature presenting contradictory views. [3]
Experimentally, a simplified representation of the behavior of salt within stone is observed through accelerated ageing tests. However, as a whole, these are not rep-resentative of most situations found in practice (for example capillary rise) and are criticised in the literature. For example, Flatt et al [4] in their detailed review of laboratory tests note that the issue of obtaining reliable and representative results of true decay in practice remains an open research issue. Many of these simulated accelerated decay tests are believed to be very aggressive and unrealistic. [5] They go on further to conclude that there are currently no standards which prescribe an accurate, reliable, quantitative method for monitoring damage developing during 1 University of Minho, Portugal, [email protected] 2 ISISE, Instituto para a Sustentabilidade e Inovação em Engenharia Estrutural,
University of Minho, Portugal 3 CERENA, Centro de Recursos Naturais e Ambiente, Instituto Superior Téc-
nico, University of Lisbon, Portugal
183
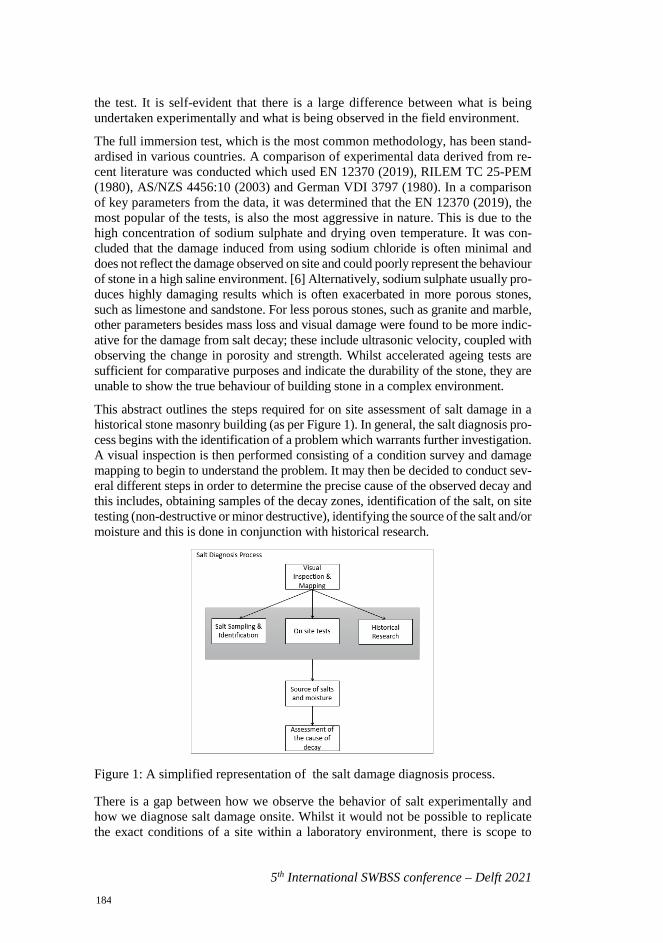
5th International SWBSS conference – Delft 2021
the test. It is self-evident that there is a large difference between what is being undertaken experimentally and what is being observed in the field environment.
The full immersion test, which is the most common methodology, has been stand-ardised in various countries. A comparison of experimental data derived from re-cent literature was conducted which used EN 12370 (2019), RILEM TC 25-PEM (1980), AS/NZS 4456:10 (2003) and German VDI 3797 (1980). In a comparison of key parameters from the data, it was determined that the EN 12370 (2019), the most popular of the tests, is also the most aggressive in nature. This is due to the high concentration of sodium sulphate and drying oven temperature. It was con-cluded that the damage induced from using sodium chloride is often minimal and does not reflect the damage observed on site and could poorly represent the behaviour of stone in a high saline environment. [6] Alternatively, sodium sulphate usually pro-duces highly damaging results which is often exacerbated in more porous stones, such as limestone and sandstone. For less porous stones, such as granite and marble, other parameters besides mass loss and visual damage were found to be more indic-ative for the damage from salt decay; these include ultrasonic velocity, coupled with observing the change in porosity and strength. Whilst accelerated ageing tests are sufficient for comparative purposes and indicate the durability of the stone, they are unable to show the true behaviour of building stone in a complex environment.
This abstract outlines the steps required for on site assessment of salt damage in a historical stone masonry building (as per Figure 1). In general, the salt diagnosis pro-cess begins with the identification of a problem which warrants further investigation. A visual inspection is then performed consisting of a condition survey and damage mapping to begin to understand the problem. It may then be decided to conduct sev-eral different steps in order to determine the precise cause of the observed decay and this includes, obtaining samples of the decay zones, identification of the salt, on site testing (non-destructive or minor destructive), identifying the source of the salt and/or moisture and this is done in conjunction with historical research.
Figure 1: A simplified representation of the salt damage diagnosis process.
There is a gap between how we observe the behavior of salt experimentally and how we diagnose salt damage onsite. Whilst it would not be possible to replicate the exact conditions of a site within a laboratory environment, there is scope to
184
E.R McSkimming, G. Vasconelcos and A. Dionísio
5th International SWBSS conference – Delft 2021
refine the tests to better assist practitioners. Experimental practice should capture more complexity and realistic scenarios, such as partial immersion tests which models the capillary rise often witnessed in historical structures. It is prudent to standardize and widely implement partial immersion tests, within the industry, par-ticularly when they are conducted continually without cycles of wetting and drying, and with differing salt solutions. Further consideration needs to be given to the testing salts; sodium sulphate, the most used test salt, can give drastic results, es-pecially in porous stones which cannot be indicative of true behaviour. Sodium chloride, on the other hand, in many cases shows almost negligible damage and does not represent what is being observed on historical structures. Noting that a complex mixture of salts is often found in historical buildings, further research should be taken to determine the effects of salts when combined, as opposed to single salt solutions. These developments in experimental practice would assist practitioners working onsite to accurately assess the data and increase their under-standing of the true behaviour of salts in historic masonry.
REFERENCES [1] A. E. Charola, “Salts in the deterioration of porous materials: An overview,” J.
Am. Inst. Conserv., vol. 39, no. 3, pp. 327–343, 2000.
[2] E. Ruiz-Agudo, F. Mees, P. Jacobs, and C. Rodriguez-Navarro, “The role of saline solution properties on porous limestone salt weathering by magnesium and sodium sulfates,” Environ. Geol., no. 52, pp. 269–281, 2007.
[3] T. Diaz Gonçalves and V. Brito, “Differential thermal expansion as a cause of salt decay: literature review, experiments, and modelling of micro and macro effects on Ançã limestone,” Stud. Conserv., vol. 62, no. 6, pp. 310–328, 2017.
[4] R. J. Flatt et al., “Predicting salt damage in practice: a theoretical insight into laboratory tests,” RILEM Tech. Lett., vol. 2, pp. 108–118, 2017.
[5] B. Lubelli et al., “Towards a more effective and reliable salt crystallization test for porous building materials: state of the art,” Mater. Struct. Constr., vol. 51, 2018.
[6] E. Mc Skimming, “Weathering Effects on the Engineering Properties of Syd-ney (Yellow Block) Sandstone when used as a Building Material,” Int. J. Ar-chit. Herit., vol. 9, no. 4, pp. 497–509, 2015.
185

186
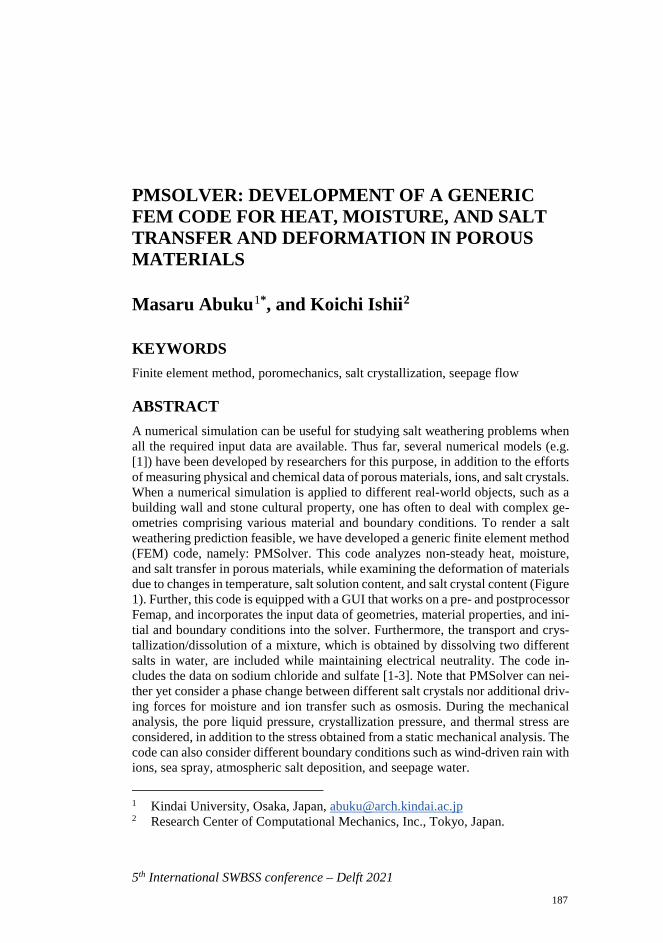
5th International SWBSS conference – Delft 2021
PMSOLVER: DEVELOPMENT OF A GENERIC FEM CODE FOR HEAT, MOISTURE, AND SALT TRANSFER AND DEFORMATION IN POROUS MATERIALS
Masaru Abuku1*, and Koichi Ishii2
KEYWORDS Finite element method, poromechanics, salt crystallization, seepage flow
ABSTRACT A numerical simulation can be useful for studying salt weathering problems when all the required input data are available. Thus far, several numerical models (e.g. [1]) have been developed by researchers for this purpose, in addition to the efforts of measuring physical and chemical data of porous materials, ions, and salt crystals. When a numerical simulation is applied to different real-world objects, such as a building wall and stone cultural property, one has often to deal with complex ge-ometries comprising various material and boundary conditions. To render a salt weathering prediction feasible, we have developed a generic finite element method (FEM) code, namely: PMSolver. This code analyzes non-steady heat, moisture, and salt transfer in porous materials, while examining the deformation of materials due to changes in temperature, salt solution content, and salt crystal content (Figure 1). Further, this code is equipped with a GUI that works on a pre- and postprocessor Femap, and incorporates the input data of geometries, material properties, and ini-tial and boundary conditions into the solver. Furthermore, the transport and crys-tallization/dissolution of a mixture, which is obtained by dissolving two different salts in water, are included while maintaining electrical neutrality. The code in-cludes the data on sodium chloride and sulfate [1-3]. Note that PMSolver can nei-ther yet consider a phase change between different salt crystals nor additional driv-ing forces for moisture and ion transfer such as osmosis. During the mechanical analysis, the pore liquid pressure, crystallization pressure, and thermal stress are considered, in addition to the stress obtained from a static mechanical analysis. The code can also consider different boundary conditions such as wind-driven rain with ions, sea spray, atmospheric salt deposition, and seepage water.
1 Kindai University, Osaka, Japan, [email protected] 2 Research Center of Computational Mechanics, Inc., Tokyo, Japan.
187
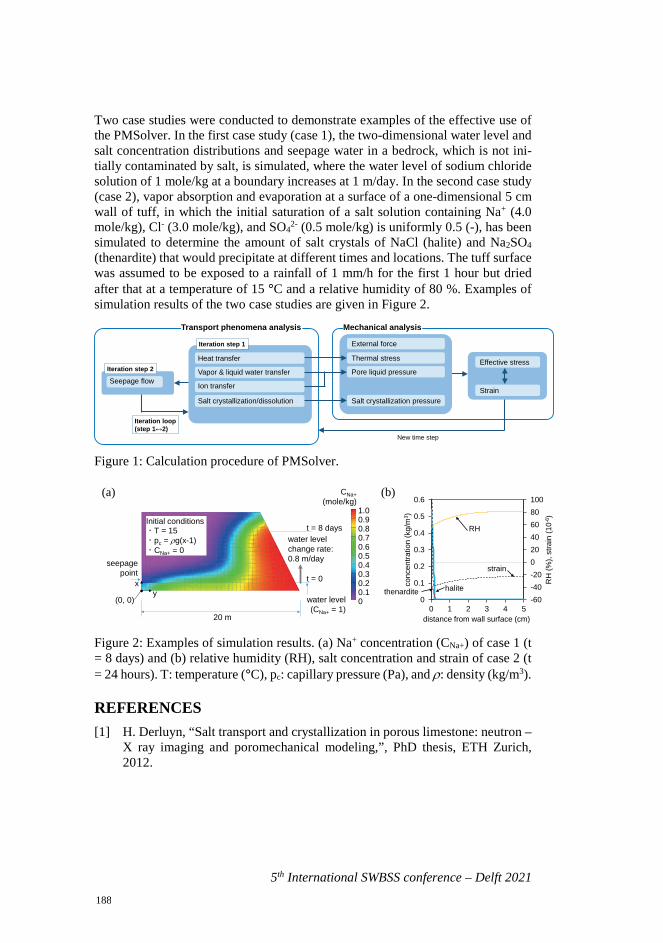
5th International SWBSS conference – Delft 2021
Two case studies were conducted to demonstrate examples of the effective use of the PMSolver. In the first case study (case 1), the two-dimensional water level and salt concentration distributions and seepage water in a bedrock, which is not ini-tially contaminated by salt, is simulated, where the water level of sodium chloride solution of 1 mole/kg at a boundary increases at 1 m/day. In the second case study (case 2), vapor absorption and evaporation at a surface of a one-dimensional 5 cm wall of tuff, in which the initial saturation of a salt solution containing Na+ (4.0 mole/kg), Cl- (3.0 mole/kg), and SO4
2- (0.5 mole/kg) is uniformly 0.5 (-), has been simulated to determine the amount of salt crystals of NaCl (halite) and Na2SO4 (thenardite) that would precipitate at different times and locations. The tuff surface was assumed to be exposed to a rainfall of 1 mm/h for the first 1 hour but dried after that at a temperature of 15 °C and a relative humidity of 80 %. Examples of simulation results of the two case studies are given in Figure 2.
Figure 1: Calculation procedure of PMSolver.
Figure 2: Examples of simulation results. (a) Na+ concentration (CNa+) of case 1 (t = 8 days) and (b) relative humidity (RH), salt concentration and strain of case 2 (t = 24 hours). T: temperature (°C), pc: capillary pressure (Pa), and ρ: density (kg/m3).
REFERENCES [1] H. Derluyn, “Salt transport and crystallization in porous limestone: neutron –
X ray imaging and poromechanical modeling,”, PhD thesis, ETH Zurich, 2012.
Thermal stress
Pore liquid pressure
Salt crystallization pressure
Iteration step 1
Mechanical analysis
Iteration step 2
External force
Effective stress
Transport phenomena analysis
New time step
StrainSeepage flow
Iteration loop(step 1↔2)
Heat transfer
Vapor & liquid water transfer
Ion transfer
Salt crystallization/dissolution
-60-40-20020406080100
0
0.1
0.2
0.3
0.4
0.5
0.6
0 1 2 3 4 5
RH
(%),
stra
in (1
0-6 )
conc
entra
tion
(kg/
m3 )
distance from wall surface (cm)
RH
halitethenardite
strain
(a) CNa+(mole/kg)
00.10.20.30.40.50.60.70.80.91.0
20 m
water level(CNa+ = 1)
t = 0
t = 8 dayswater level change rate:0.8 m/dayseepage
point
(b)
Initial conditions・T = 15・pc = ρg(x-1)・CNa+ = 0
(0, 0)
xy
188

M. Abuku and K. Ishii
5th International SWBSS conference – Delft 2021
[2] M. Steiger, J. Kiebusch, and A Nicolai, “An improved model incorporatingPitzer’s equations for calculation of thermodynamic properties of pore solu-tions implemented into an efficient program code,” Construction and Build-ing Materials, vol. 22, pp. 1841-1850, 2008.
[3] B. S. Krumgalz, R. Pogorelsky, and K. S. Pitzer, “Ion interaction approach tocalculations of volumetric properties of aqueous multiple-solute electrolytesolutions,” Journal of Solution Chemistry, vol. 24, no. 10, pp. 1025-1038,1995.
189

190
5th International SWBSS conference – Delft 2021
NUMERICAL SIMULATION OF SODIUM CHLORIDE CRYSTALLIZATION IN MOSAIC WALL
Sayaka Yano1*, Masaru Abuku1, Juni Sasaki2, and Daisuke Ogura3
KEYWORDS Tessera, moisture transport, phase change, crystallization pressure, strain field
ABSTRACT A mosaic of a wall usually consists of a brick wall, a first mortar layer, a second mortar layer, and a setting bed with tesserae of a glass, marble, or ceramic material according to [1] (Figure 1(a)). It can be seriously damaged by salt crystallization, depending on materials, geometries, environmental conditions, etc. Potential salt types observed on mosaic walls include gypsum, nitratine, sodium chloride, so-dium sulfate, etc. Salt crystals sometimes precipitate on the surface of a wall, within a layer of the wall, or at the interface between two neighboring layers of the wall. Figure 1(b) shows examples of mosaic walls deteriorated by salt crystallization. However, it is not well understood why salt precipitates at different locations de-pending on different conditions.
The purpose of this study is to numerically investigate phenomena of crystalliza-tion of salt in mosaic walls and where in mosaic walls salt crystallization occur under various conditions of parameters such as the distance between tesserae, ma-terial properties of mortar, and the environmental conditions. In the numerical model [2] used in this study heat, moisture, and salt transfer in a two-dimensional section of a mosaic wall are simulated. The crystallization pressure and the corre-sponding strain of the material are also calculated taking into account the crystalli-zation of sodium chloride remaining in brick of a wet wall. In this study, we only deal with sodium chloride that can present on a mosaic wall due to different reasons.
1 Kindai University, Osaka, Japan, [email protected] 2 Kindai University, Osaka, Japan 3 Tohoku University of Art and Design, Yamagata, Japan 4 Kyoto University, Kyoto, Japan
191
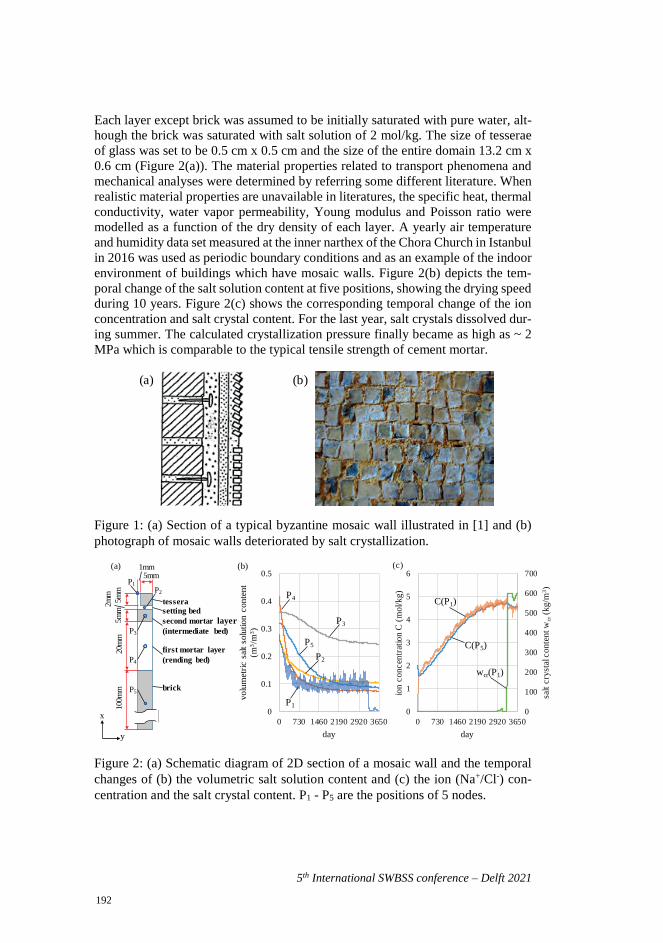
5th International SWBSS conference – Delft 2021
Each layer except brick was assumed to be initially saturated with pure water, alt-hough the brick was saturated with salt solution of 2 mol/kg. The size of tesserae of glass was set to be 0.5 cm x 0.5 cm and the size of the entire domain 13.2 cm x 0.6 cm (Figure 2(a)). The material properties related to transport phenomena and mechanical analyses were determined by referring some different literature. When realistic material properties are unavailable in literatures, the specific heat, thermal conductivity, water vapor permeability, Young modulus and Poisson ratio were modelled as a function of the dry density of each layer. A yearly air temperature and humidity data set measured at the inner narthex of the Chora Church in Istanbul in 2016 was used as periodic boundary conditions and as an example of the indoor environment of buildings which have mosaic walls. Figure 2(b) depicts the tem-poral change of the salt solution content at five positions, showing the drying speed during 10 years. Figure 2(c) shows the corresponding temporal change of the ion concentration and salt crystal content. For the last year, salt crystals dissolved dur-ing summer. The calculated crystallization pressure finally became as high as ~ 2 MPa which is comparable to the typical tensile strength of cement mortar.
Figure 1: (a) Section of a typical byzantine mosaic wall illustrated in [1] and (b) photograph of mosaic walls deteriorated by salt crystallization.
Figure 2: (a) Schematic diagram of 2D section of a mosaic wall and the temporal changes of (b) the volumetric salt solution content and (c) the ion (Na+/Cl-) con-centration and the salt crystal content. P1 - P5 are the positions of 5 nodes.
(b)(a)
0
0.1
0.2
0.3
0.4
0.5
0 730 1460 2190 2920 3650
volu
met
ric s
alt s
olut
ion
cont
ent
(m3 /m
3 )
day
P3
P1
P4
P5
P2
0
100
200
300
400
500
600
700
0
1
2
3
4
5
6
0 730 1460 2190 2920 3650
salt
crys
tal c
onte
nt w
cr(k
g/m
3 )
ion
conc
entra
tion
C (m
ol/k
g)
day
wcr(P1)
C(P1)
C(P5)
5mm
5mm
5mm
20m
m10
0mm
2mm
setting bedsecond mortar layer(intermediate bed)
first mortar layer(rending bed)
brick
tessera
1mm
x
y
(a) (b) (c)
P1P2
P3
P4
P5
192

S. Yano, M. Abuku1, J. Sasaki and D. Ogura
5th International SWBSS conference – Delft 2021
REFERENCES [1] Manuela Farneti, “Technical-historical glossary of mosaic art,” Longo Edi-
tore, 1993.
[2] Masaru Abuku, Koichi Ishii, “PMSolver: development of a generic FEM code for heat, moisture, and salt transfer and deformation in porous materials,” sub-mitted to SWBSS2021, 2021.
193

194
5th International SWBSS conference – Delft 2021
CRYSTALLIZATION DAMAGE AT THE INTERFACES OF ARTWORKS
Rozeline Wijnhorst1, Tinhinane Chekai2, Stefano de Miranda3, Leo Pel4, Hannelore Derluyn2, and Noushine Shahidzadeh1*
KEYWORDS Crystallization damage, layered porous materials, ceramics, tiles, glaze defects
ABSTRACT Over the past decades, much has been learned about the effects of salt crystalliza-tion in porous structures. In order to uncover what happens in the more complex but also more realistic situation of layered porous materials, the JPI-CH CRYSTI-NART project was initiated in the fall of 2020. This project aims to develop an integrated approach for modelling and analysis of the decay mechanism due to salt crystallization in composite materials relevant to the art conservation practice.
The objects of interest in the study at hand are antique Dutch tin-glazed tiles. These tiles consist out of two parts: the clay body (~ 0.5 cm) and the tin glaze top layer (~300 𝜇𝜇𝜇𝜇) (Figure a & b). The body is made out of calcium-rich clay, so the ther-mal expansion coefficient suits the glaze during the firing of the tiles. The porosity of the body depends on the firing time and temperature [1].
Glaze defects are one of the common problems in the conservation of ceramics and tiles [2]. The defects are manifesting by (i) glaze peeling, (ii) crazing which is glaze cracking due to high surface tension and (iii) shivering which is a process that oc-curs when the separation between the glaze and the body induces the removal of a
1 Van der Waals-Zeeman Institute, Institute of Physics, University of Amster-
dam, Amsterdam, The Netherlands, [email protected] 2 Universite de Pau et des Pays de l’Adour, E2S UPPA, CNRS, LFCR - DMEX,
Pau, France 3 Department of Civil, Chemical, Environmental, and Materials Engineering
(DICAM), University of Bologna, Bologna, Italy 4 Eindhoven University of Technology, Department of Applied Physics,
Transport in Permeable Media, Eindhoven, The Netherlands
195
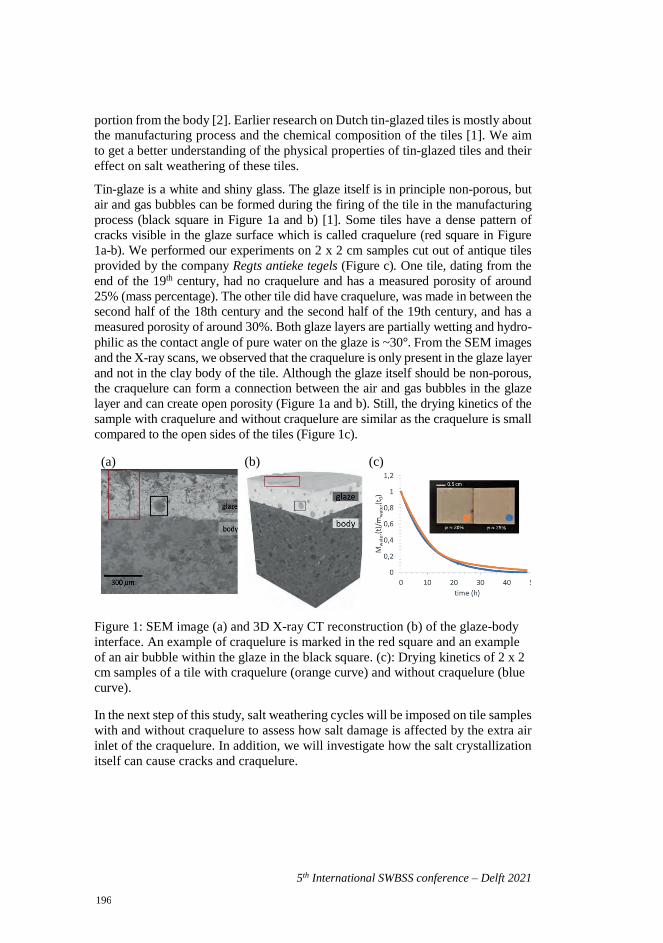
5th International SWBSS conference – Delft 2021
portion from the body [2]. Earlier research on Dutch tin-glazed tiles is mostly about the manufacturing process and the chemical composition of the tiles [1]. We aim to get a better understanding of the physical properties of tin-glazed tiles and their effect on salt weathering of these tiles.
Tin-glaze is a white and shiny glass. The glaze itself is in principle non-porous, but air and gas bubbles can be formed during the firing of the tile in the manufacturing process (black square in Figure 1a and b) [1]. Some tiles have a dense pattern of cracks visible in the glaze surface which is called craquelure (red square in Figure 1a-b). We performed our experiments on 2 x 2 cm samples cut out of antique tiles provided by the company Regts antieke tegels (Figure c). One tile, dating from the end of the 19th century, had no craquelure and has a measured porosity of around 25% (mass percentage). The other tile did have craquelure, was made in between the second half of the 18th century and the second half of the 19th century, and has a measured porosity of around 30%. Both glaze layers are partially wetting and hydro-philic as the contact angle of pure water on the glaze is ~30°. From the SEM images and the X-ray scans, we observed that the craquelure is only present in the glaze layer and not in the clay body of the tile. Although the glaze itself should be non-porous, the craquelure can form a connection between the air and gas bubbles in the glaze layer and can create open porosity (Figure 1a and b). Still, the drying kinetics of the sample with craquelure and without craquelure are similar as the craquelure is small compared to the open sides of the tiles (Figure 1c).
Figure 1: SEM image (a) and 3D X-ray CT reconstruction (b) of the glaze-body interface. An example of craquelure is marked in the red square and an example of an air bubble within the glaze in the black square. (c): Drying kinetics of 2 x 2 cm samples of a tile with craquelure (orange curve) and without craquelure (blue curve).
In the next step of this study, salt weathering cycles will be imposed on tile samples with and without craquelure to assess how salt damage is affected by the extra air inlet of the craquelure. In addition, we will investigate how the salt crystallization itself can cause cracks and craquelure.
(a)
(b)
(c)
196

R. Wijnhorst et al.
5th International SWBSS conference – Delft 2021
REFERENCES [1] K. van Lookeren Campagne et al., “Understanding 17th-18th century Dutch
Tin-glaze Through the Interpretation and Reconstruction of Historical Reci-pes.” GlazeArt, pp 150-164, 2018.
[2] B.H. Wilson, “Monograph and bibliography on terra cotta”. Journal of the American Ceramic Society, pp 94–136, 1926.
197

198
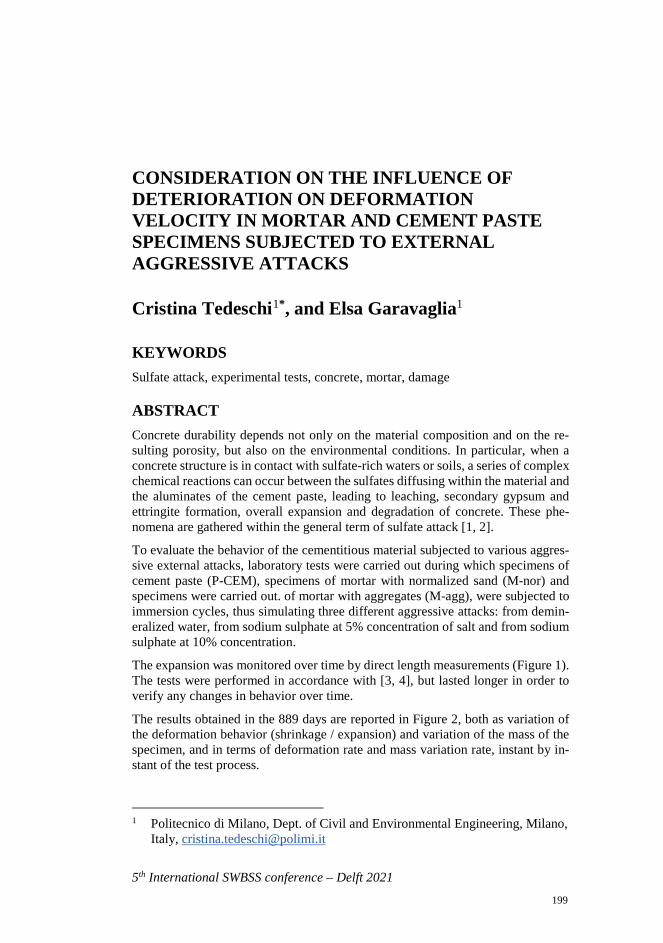
5th International SWBSS conference – Delft 2021
CONSIDERATION ON THE INFLUENCE OF DETERIORATION ON DEFORMATION VELOCITY IN MORTAR AND CEMENT PASTE SPECIMENS SUBJECTED TO EXTERNAL AGGRESSIVE ATTACKS
Cristina Tedeschi1*, and Elsa Garavaglia1
KEYWORDS Sulfate attack, experimental tests, concrete, mortar, damage
ABSTRACT Concrete durability depends not only on the material composition and on the re-sulting porosity, but also on the environmental conditions. In particular, when a concrete structure is in contact with sulfate-rich waters or soils, a series of complex chemical reactions can occur between the sulfates diffusing within the material and the aluminates of the cement paste, leading to leaching, secondary gypsum and ettringite formation, overall expansion and degradation of concrete. These phe-nomena are gathered within the general term of sulfate attack [1, 2].
To evaluate the behavior of the cementitious material subjected to various aggres-sive external attacks, laboratory tests were carried out during which specimens of cement paste (P-CEM), specimens of mortar with normalized sand (M-nor) and specimens were carried out. of mortar with aggregates (M-agg), were subjected to immersion cycles, thus simulating three different aggressive attacks: from demin-eralized water, from sodium sulphate at 5% concentration of salt and from sodium sulphate at 10% concentration.
The expansion was monitored over time by direct length measurements (Figure 1). The tests were performed in accordance with [3, 4], but lasted longer in order to verify any changes in behavior over time.
The results obtained in the 889 days are reported in Figure 2, both as variation of the deformation behavior (shrinkage / expansion) and variation of the mass of the specimen, and in terms of deformation rate and mass variation rate, instant by in-stant of the test process.
1 Politecnico di Milano, Dept. of Civil and Environmental Engineering, Milano,
Italy, [email protected]
199
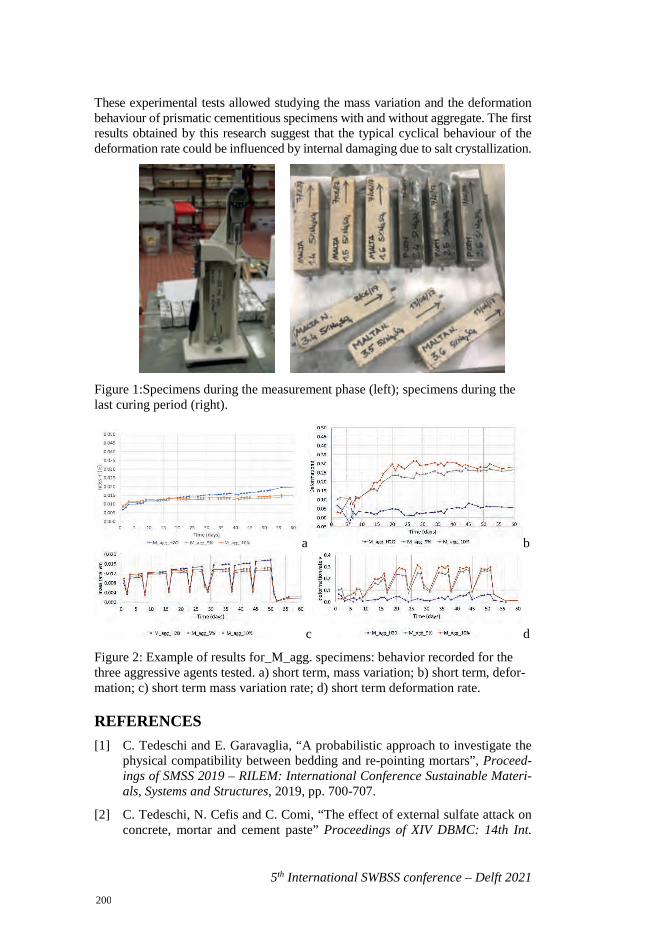
5th International SWBSS conference – Delft 2021
These experimental tests allowed studying the mass variation and the deformation behaviour of prismatic cementitious specimens with and without aggregate. The first results obtained by this research suggest that the typical cyclical behaviour of the deformation rate could be influenced by internal damaging due to salt crystallization.
Figure 1:Specimens during the measurement phase (left); specimens during the last curing period (right).
a b
c d
Figure 2: Example of results for_M_agg. specimens: behavior recorded for the three aggressive agents tested. a) short term, mass variation; b) short term, defor-mation; c) short term mass variation rate; d) short term deformation rate.
REFERENCES [1] C. Tedeschi and E. Garavaglia, “A probabilistic approach to investigate the
physical compatibility between bedding and re-pointing mortars”, Proceed-ings of SMSS 2019 – RILEM: International Conference Sustainable Materi-als, Systems and Structures, 2019, pp. 700-707.
[2] C. Tedeschi, N. Cefis and C. Comi, “The effect of external sulfate attack onconcrete, mortar and cement paste” Proceedings of XIV DBMC: 14th Int.
200
C. Tedeschi and E. Garavaglia
5th International SWBSS conference – Delft 2021
Conf. on Durability of Building Materials and Components, 2017, pp. 225-236.
[3] EN 1015-1 “Methods of test for mortar for masonry - Part 1: Determination of particle size distribution (by sieve analysis)”, 2006.
[4] EN 12617-4 “Product and Systems for the protection and repair of concrete structures. Test Methods – Determination of shrinkage and expansion” 2003.
201

202
Mitigation and desalination treatments

204
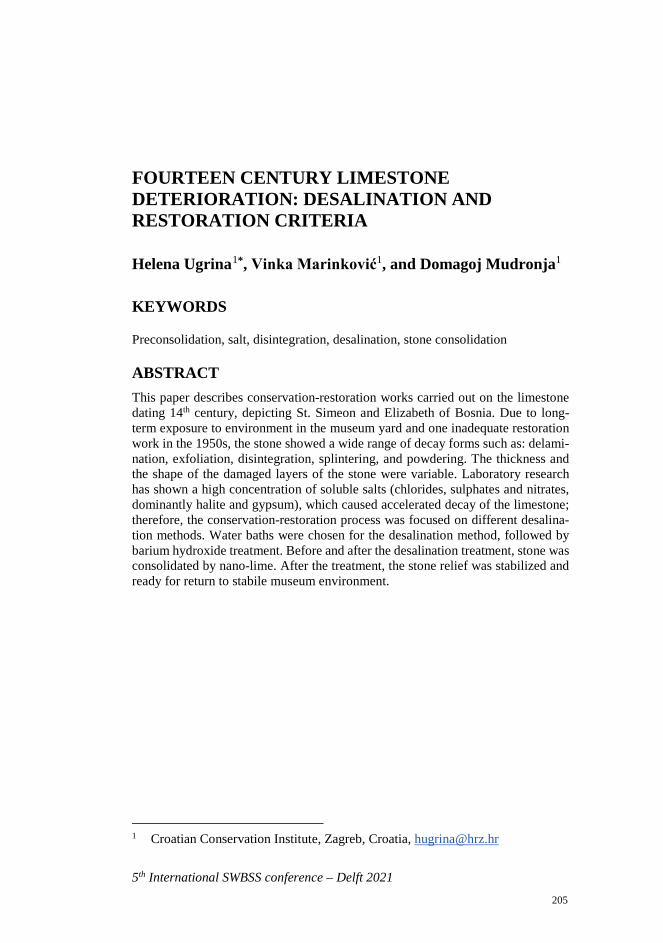
5th International SWBSS conference – Delft 2021
FOURTEEN CENTURY LIMESTONE DETERIORATION: DESALINATION AND RESTORATION CRITERIA
Helena Ugrina1*, Vinka Marinković1, and Domagoj Mudronja1
KEYWORDS
Preconsolidation, salt, disintegration, desalination, stone consolidation
ABSTRACT This paper describes conservation-restoration works carried out on the limestone dating 14th century, depicting St. Simeon and Elizabeth of Bosnia. Due to long-term exposure to environment in the museum yard and one inadequate restoration work in the 1950s, the stone showed a wide range of decay forms such as: delami-nation, exfoliation, disintegration, splintering, and powdering. The thickness and the shape of the damaged layers of the stone were variable. Laboratory research has shown a high concentration of soluble salts (chlorides, sulphates and nitrates, dominantly halite and gypsum), which caused accelerated decay of the limestone; therefore, the conservation-restoration process was focused on different desalina-tion methods. Water baths were chosen for the desalination method, followed by barium hydroxide treatment. Before and after the desalination treatment, stone was consolidated by nano-lime. After the treatment, the stone relief was stabilized and ready for return to stabile museum environment.
1 Croatian Conservation Institute, Zagreb, Croatia, [email protected]
205
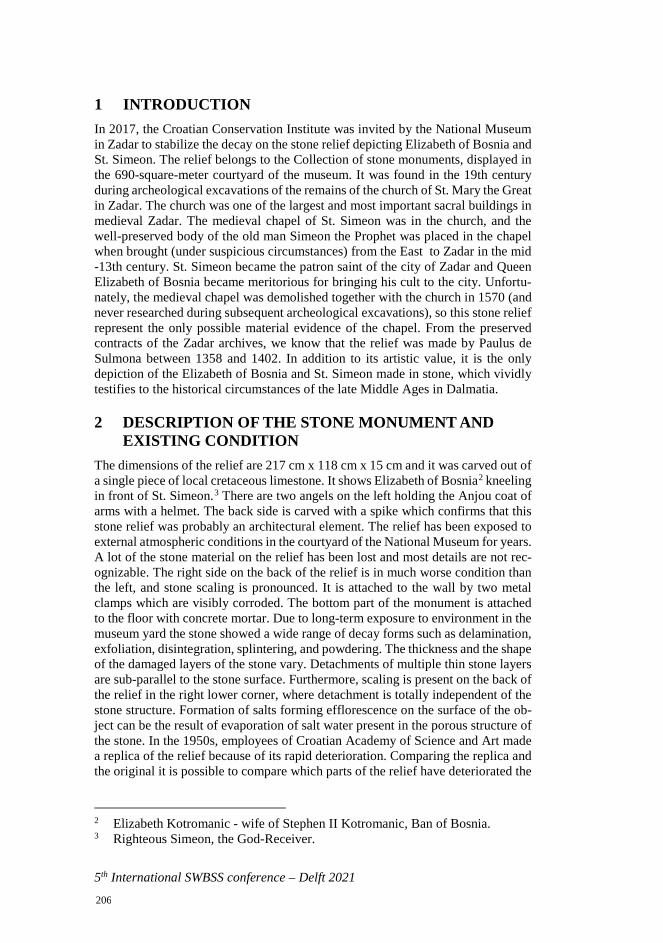
5th International SWBSS conference – Delft 2021
1 INTRODUCTION In 2017, the Croatian Conservation Institute was invited by the National Museum in Zadar to stabilize the decay on the stone relief depicting Elizabeth of Bosnia and St. Simeon. The relief belongs to the Collection of stone monuments, displayed in the 690-square-meter courtyard of the museum. It was found in the 19th century during archeological excavations of the remains of the church of St. Mary the Great in Zadar. The church was one of the largest and most important sacral buildings in medieval Zadar. The medieval chapel of St. Simeon was in the church, and the well-preserved body of the old man Simeon the Prophet was placed in the chapel when brought (under suspicious circumstances) from the East to Zadar in the mid -13th century. St. Simeon became the patron saint of the city of Zadar and QueenElizabeth of Bosnia became meritorious for bringing his cult to the city. Unfortu-nately, the medieval chapel was demolished together with the church in 1570 (andnever researched during subsequent archeological excavations), so this stone reliefrepresent the only possible material evidence of the chapel. From the preservedcontracts of the Zadar archives, we know that the relief was made by Paulus deSulmona between 1358 and 1402. In addition to its artistic value, it is the onlydepiction of the Elizabeth of Bosnia and St. Simeon made in stone, which vividlytestifies to the historical circumstances of the late Middle Ages in Dalmatia.
2 DESCRIPTION OF THE STONE MONUMENT AND EXISTING CONDITION
The dimensions of the relief are 217 cm x 118 cm x 15 cm and it was carved out of a single piece of local cretaceous limestone. It shows Elizabeth of Bosnia2 kneeling in front of St. Simeon.3 There are two angels on the left holding the Anjou coat of arms with a helmet. The back side is carved with a spike which confirms that this stone relief was probably an architectural element. The relief has been exposed to external atmospheric conditions in the courtyard of the National Museum for years. A lot of the stone material on the relief has been lost and most details are not rec-ognizable. The right side on the back of the relief is in much worse condition than the left, and stone scaling is pronounced. It is attached to the wall by two metal clamps which are visibly corroded. The bottom part of the monument is attached to the floor with concrete mortar. Due to long-term exposure to environment in the museum yard the stone showed a wide range of decay forms such as delamination, exfoliation, disintegration, splintering, and powdering. The thickness and the shape of the damaged layers of the stone vary. Detachments of multiple thin stone layers are sub-parallel to the stone surface. Furthermore, scaling is present on the back of the relief in the right lower corner, where detachment is totally independent of the stone structure. Formation of salts forming efflorescence on the surface of the ob-ject can be the result of evaporation of salt water present in the porous structure of the stone. In the 1950s, employees of Croatian Academy of Science and Art made a replica of the relief because of its rapid deterioration. Comparing the replica and the original it is possible to compare which parts of the relief have deteriorated the
2 Elizabeth Kotromanic - wife of Stephen II Kotromanic, Ban of Bosnia. 3 Righteous Simeon, the God-Receiver.
206
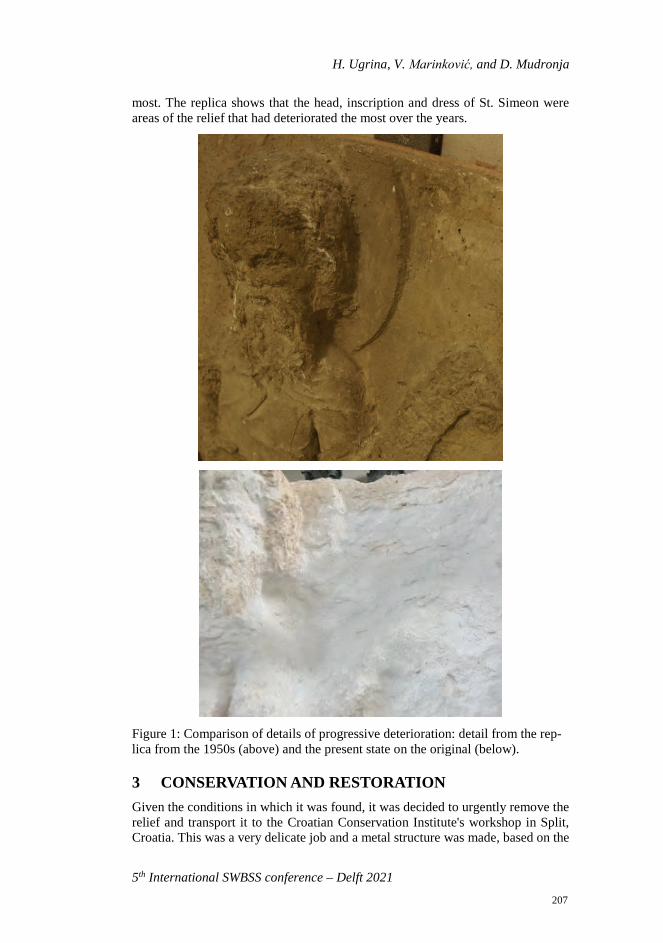
H. Ugrina, V. Marinković, and D. Mudronja
5th International SWBSS conference – Delft 2021
most. The replica shows that the head, inscription and dress of St. Simeon were areas of the relief that had deteriorated the most over the years.
Figure 1: Comparison of details of progressive deterioration: detail from the rep-lica from the 1950s (above) and the present state on the original (below).
3 CONSERVATION AND RESTORATION Given the conditions in which it was found, it was decided to urgently remove the relief and transport it to the Croatian Conservation Institute's workshop in Split, Croatia. This was a very delicate job and a metal structure was made, based on the
207
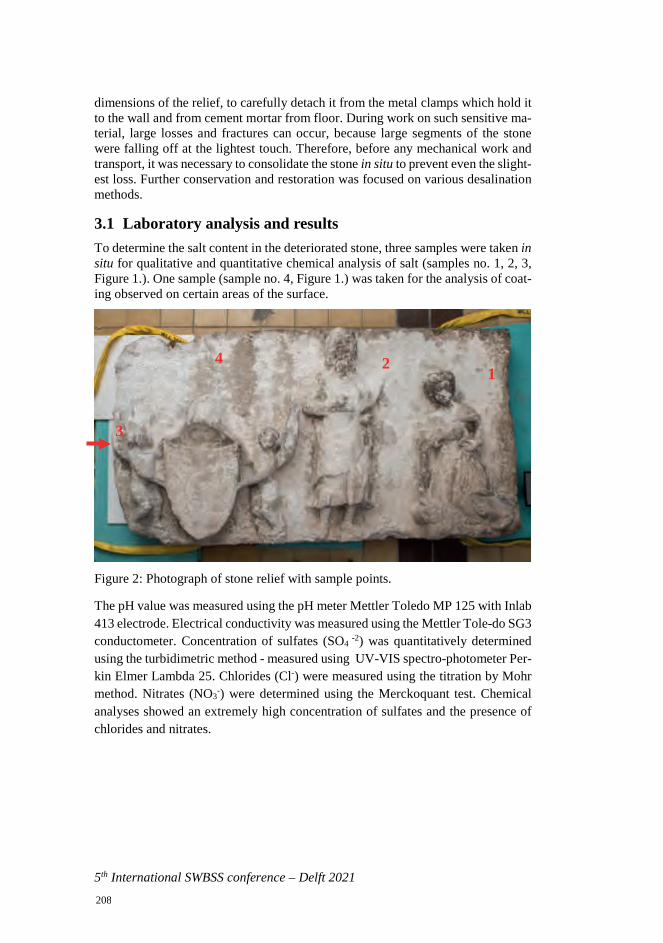
5th International SWBSS conference – Delft 2021
dimensions of the relief, to carefully detach it from the metal clamps which hold it to the wall and from cement mortar from floor. During work on such sensitive ma-terial, large losses and fractures can occur, because large segments of the stone were falling off at the lightest touch. Therefore, before any mechanical work and transport, it was necessary to consolidate the stone in situ to prevent even the slight-est loss. Further conservation and restoration was focused on various desalination methods.
3.1 Laboratory analysis and results To determine the salt content in the deteriorated stone, three samples were taken in situ for qualitative and quantitative chemical analysis of salt (samples no. 1, 2, 3, Figure 1.). One sample (sample no. 4, Figure 1.) was taken for the analysis of coat-ing observed on certain areas of the surface.
Figure 2: Photograph of stone relief with sample points.
The pH value was measured using the pH meter Mettler Toledo MP 125 with Inlab 413 electrode. Electrical conductivity was measured using the Mettler Tole-do SG3 conductometer. Concentration of sulfates (SO4
-2) was quantitatively determined using the turbidimetric method - measured using UV-VIS spectro-photometer Per-kin Elmer Lambda 25. Chlorides (Cl-) were measured using the titration by Mohr method. Nitrates (NO3
-) were determined using the Merckoquant test. Chemical analyses showed an extremely high concentration of sulfates and the presence of chlorides and nitrates.
1 2
3
4
208
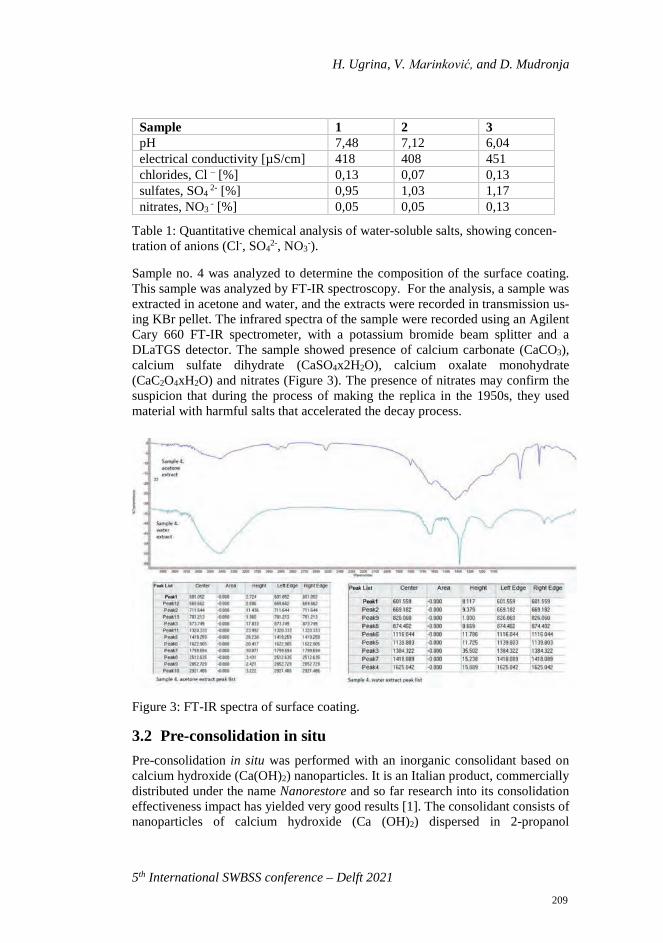
H. Ugrina, V. Marinković, and D. Mudronja
5th International SWBSS conference – Delft 2021
Table 1: Quantitative chemical analysis of water-soluble salts, showing concen-tration of anions (Cl-, SO4
2-, NO3-).
Sample no. 4 was analyzed to determine the composition of the surface coating. This sample was analyzed by FT-IR spectroscopy. For the analysis, a sample was extracted in acetone and water, and the extracts were recorded in transmission us-ing KBr pellet. The infrared spectra of the sample were recorded using an Agilent Cary 660 FT-IR spectrometer, with a potassium bromide beam splitter and a DLaTGS detector. The sample showed presence of calcium carbonate (CaCO3), calcium sulfate dihydrate (CaSO4x2H2O), calcium oxalate monohydrate (CaC2O4xH2O) and nitrates (Figure 3). The presence of nitrates may confirm the suspicion that during the process of making the replica in the 1950s, they used material with harmful salts that accelerated the decay process.
Figure 3: FT-IR spectra of surface coating.
3.2 Pre-consolidation in situ Pre-consolidation in situ was performed with an inorganic consolidant based on calcium hydroxide (Ca(OH)2) nanoparticles. It is an Italian product, commercially distributed under the name Nanorestore and so far research into its consolidation effectiveness impact has yielded very good results [1]. The consolidant consists of nanoparticles of calcium hydroxide (Ca (OH)2) dispersed in 2-propanol
Sample 1 2 3 pH 7,48 7,12 6,04 electrical conductivity [µS/cm] 418 408 451 chlorides, Cl – [%] 0,13 0,07 0,13 sulfates, SO4
2- [%] 0,95 1,03 1,17 nitrates, NO3
- [%] 0,05 0,05 0,13
209
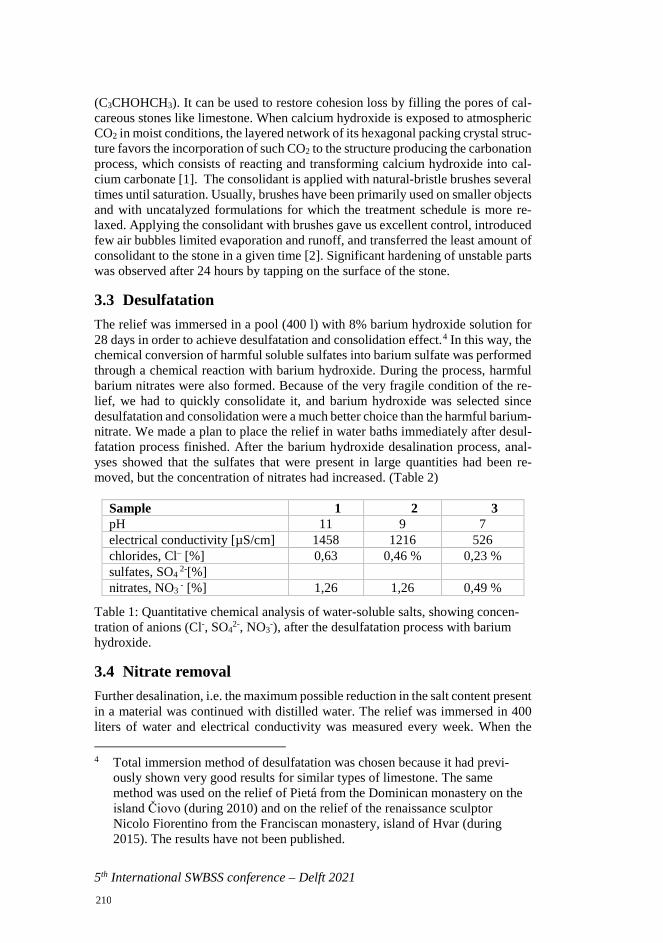
5th International SWBSS conference – Delft 2021
(C3CHOHCH3). It can be used to restore cohesion loss by filling the pores of cal-careous stones like limestone. When calcium hydroxide is exposed to atmospheric CO2 in moist conditions, the layered network of its hexagonal packing crystal struc-ture favors the incorporation of such CO2 to the structure producing the carbonation process, which consists of reacting and transforming calcium hydroxide into cal-cium carbonate [1]. The consolidant is applied with natural-bristle brushes several times until saturation. Usually, brushes have been primarily used on smaller objects and with uncatalyzed formulations for which the treatment schedule is more re-laxed. Applying the consolidant with brushes gave us excellent control, introduced few air bubbles limited evaporation and runoff, and transferred the least amount of consolidant to the stone in a given time [2]. Significant hardening of unstable parts was observed after 24 hours by tapping on the surface of the stone.
3.3 Desulfatation The relief was immersed in a pool (400 l) with 8% barium hydroxide solution for 28 days in order to achieve desulfatation and consolidation effect.4 In this way, the chemical conversion of harmful soluble sulfates into barium sulfate was performed through a chemical reaction with barium hydroxide. During the process, harmful barium nitrates were also formed. Because of the very fragile condition of the re-lief, we had to quickly consolidate it, and barium hydroxide was selected since desulfatation and consolidation were a much better choice than the harmful barium-nitrate. We made a plan to place the relief in water baths immediately after desul-fatation process finished. After the barium hydroxide desalination process, anal-yses showed that the sulfates that were present in large quantities had been re-moved, but the concentration of nitrates had increased. (Table 2)
Table 1: Quantitative chemical analysis of water-soluble salts, showing concen-tration of anions (Cl-, SO4
2-, NO3-), after the desulfatation process with barium
hydroxide.
3.4 Nitrate removal Further desalination, i.e. the maximum possible reduction in the salt content present in a material was continued with distilled water. The relief was immersed in 400 liters of water and electrical conductivity was measured every week. When the
4 Total immersion method of desulfatation was chosen because it had previ-ously shown very good results for similar types of limestone. The same method was used on the relief of Pietá from the Dominican monastery on the island Čiovo (during 2010) and on the relief of the renaissance sculptor Nicolo Fiorentino from the Franciscan monastery, island of Hvar (during 2015). The results have not been published.
Sample 1 2 3 pH 11 9 7 electrical conductivity [µS/cm] 1458 1216 526 chlorides, Cl– [%] 0,63 0,46 % 0,23 % sulfates, SO4
2-[%] nitrates, NO3
- [%] 1,26 1,26 0,49 %
210
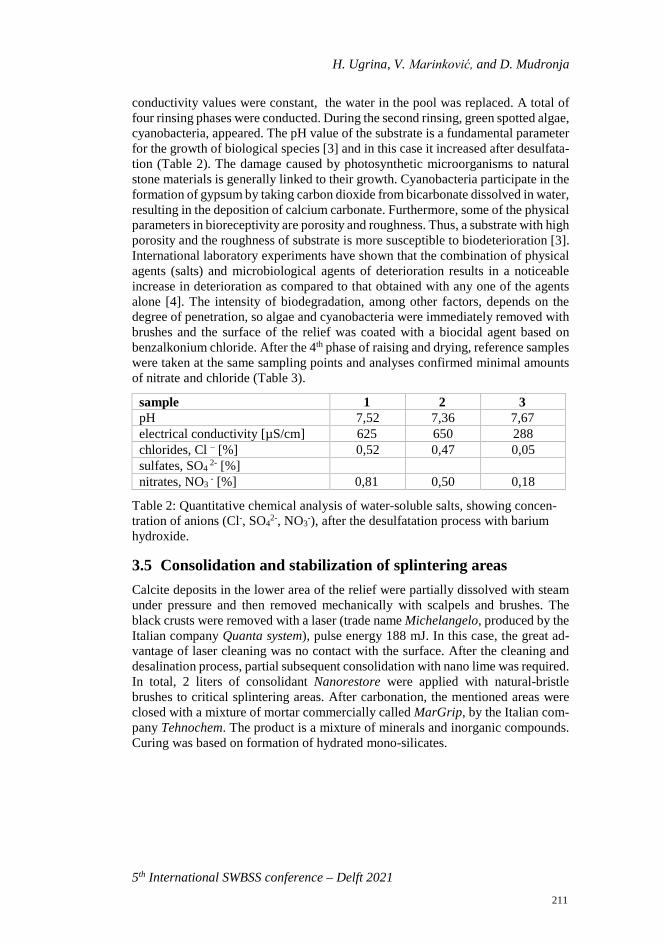
H. Ugrina, V. Marinković, and D. Mudronja
5th International SWBSS conference – Delft 2021
conductivity values were constant, the water in the pool was replaced. A total of four rinsing phases were conducted. During the second rinsing, green spotted algae, cyanobacteria, appeared. The pH value of the substrate is a fundamental parameter for the growth of biological species [3] and in this case it increased after desulfata-tion (Table 2). The damage caused by photosynthetic microorganisms to natural stone materials is generally linked to their growth. Cyanobacteria participate in the formation of gypsum by taking carbon dioxide from bicarbonate dissolved in water, resulting in the deposition of calcium carbonate. Furthermore, some of the physical parameters in bioreceptivity are porosity and roughness. Thus, a substrate with high porosity and the roughness of substrate is more susceptible to biodeterioration [3]. International laboratory experiments have shown that the combination of physical agents (salts) and microbiological agents of deterioration results in a noticeable increase in deterioration as compared to that obtained with any one of the agents alone [4]. The intensity of biodegradation, among other factors, depends on the degree of penetration, so algae and cyanobacteria were immediately removed with brushes and the surface of the relief was coated with a biocidal agent based on benzalkonium chloride. After the 4th phase of raising and drying, reference samples were taken at the same sampling points and analyses confirmed minimal amounts of nitrate and chloride (Table 3).
sample 1 2 3 pH 7,52 7,36 7,67 electrical conductivity [µS/cm] 625 650 288 chlorides, Cl – [%] 0,52 0,47 0,05 sulfates, SO4
2- [%] nitrates, NO3
- [%] 0,81 0,50 0,18
Table 2: Quantitative chemical analysis of water-soluble salts, showing concen-tration of anions (Cl-, SO4
2-, NO3-), after the desulfatation process with barium
hydroxide.
3.5 Consolidation and stabilization of splintering areas Calcite deposits in the lower area of the relief were partially dissolved with steam under pressure and then removed mechanically with scalpels and brushes. The black crusts were removed with a laser (trade name Michelangelo, produced by the Italian company Quanta system), pulse energy 188 mJ. In this case, the great ad-vantage of laser cleaning was no contact with the surface. After the cleaning and desalination process, partial subsequent consolidation with nano lime was required. In total, 2 liters of consolidant Nanorestore were applied with natural-bristle brushes to critical splintering areas. After carbonation, the mentioned areas were closed with a mixture of mortar commercially called MarGrip, by the Italian com-pany Tehnochem. The product is a mixture of minerals and inorganic compounds. Curing was based on formation of hydrated mono-silicates.
211
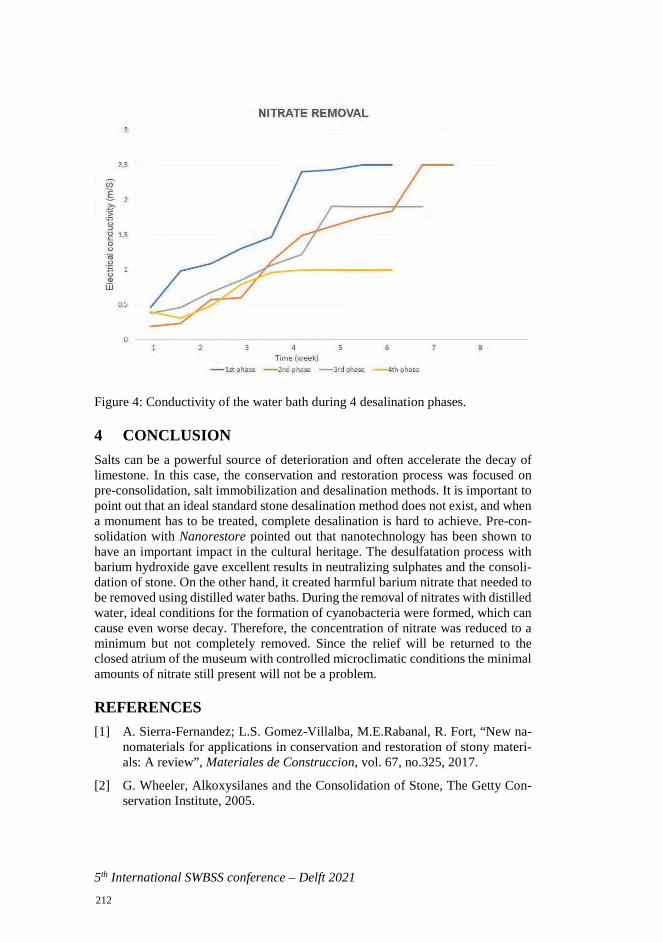
5th International SWBSS conference – Delft 2021
Figure 4: Conductivity of the water bath during 4 desalination phases.
4 CONCLUSION Salts can be a powerful source of deterioration and often accelerate the decay of limestone. In this case, the conservation and restoration process was focused on pre-consolidation, salt immobilization and desalination methods. It is important to point out that an ideal standard stone desalination method does not exist, and when a monument has to be treated, complete desalination is hard to achieve. Pre-con-solidation with Nanorestore pointed out that nanotechnology has been shown to have an important impact in the cultural heritage. The desulfatation process with barium hydroxide gave excellent results in neutralizing sulphates and the consoli-dation of stone. On the other hand, it created harmful barium nitrate that needed to be removed using distilled water baths. During the removal of nitrates with distilled water, ideal conditions for the formation of cyanobacteria were formed, which can cause even worse decay. Therefore, the concentration of nitrate was reduced to a minimum but not completely removed. Since the relief will be returned to the closed atrium of the museum with controlled microclimatic conditions the minimal amounts of nitrate still present will not be a problem.
REFERENCES [1] A. Sierra-Fernandez; L.S. Gomez-Villalba, M.E.Rabanal, R. Fort, “New na-
nomaterials for applications in conservation and restoration of stony materi-als: A review”, Materiales de Construccion, vol. 67, no.325, 2017.
[2] G. Wheeler, Alkoxysilanes and the Consolidation of Stone, The Getty Con-servation Institute, 2005.
212
H. Ugrina, V. Marinković, and D. Mudronja
5th International SWBSS conference – Delft 2021
[3] G. Caneva, M. Pia Nugari, O. Salvadori, Plant Biology for Cultural Heritage, Biodeterioration and Conservation“, The Getty Conservation Institute, 2008.
[4] S. Papida, W. Murphy, E. May, “Enhancement of physical weathering of building stones by microbial populations”, International Biodeterioaration Bulletin, 2000.
[5] V. Marinković, D. Mudronja, S. Kramer, A. Pondelak, “Case study: stone consolidation of reliefs inside the cathedral of St. Lawrence, Trogir – results and doubts of field treatment“, 14th International congress on the deteriora-tion and conservation of stone, 2020.
[6] P. Bosch-Roig, H. Allegue, Ignacio Bosch, “Granite pavement Nitrate Desal-ination: Traditional Methods vs. Biocleaning Methods“, Sustainability, vol. 11,art no. 4227, 2019.
213

214
5th International SWBSS conference – Delft 2021
HYDROGELS AS POULTICE MATERIAL FOR DESALINATION – A PRELIMINARY STUDY
Julie Bartholdy1*, Poul Klenz Larsen1, and Isabelle Brajer1
KEYWORDS Desalination, poultices, hydrogels, salt damage, wall paintings
ABSTRACT In the field of conservation, hydrogels have shown efficacy in extracting embedded soot and dirt from wall paintings and other materials. The gels’ inherent properties are also advantageous and may be exploited in relation to desalination of fragile surfaces. In this pilot study, the ability of six hydrogels to absorb and extract salts was tested (Nanorestore Gel® Peggy 5, Nanorestore Gel® Peggy 6, Nanorestore Gel® HWR, Nanorestore Gel® MWR and gel of 2-3% AgarArt).
In the first experiment, changes in the gels’ physical characteristics in terms of weight and texture upon contact with different solutions of NaCl were registered. In the second experiment, the gels were applied to specimens of clay brick contam-inated with sodium chloride. Their ability to extract salts was subsequently tested by immersing gels in water, and then measuring the Cl- content using test strips.
The experiments show that some hydrogels absorb salts to a degree that make them suitable as poultice materials in desalination. Furthermore, the salt uptake takes place in minutes, which is extraordinary compared to traditional poultice materials. The experiments also show which hydrogels are unsuitable as poultice material.
The results of this pilot study give credence to further studies on the physical/chem-ical properties of hydrogels determining their ability to extract salts.
1 The National Museum of Denmark, I.C. Modewegsvej, Brede, 2800 Kgs.
Lyngby, Denmark, [email protected]
215
5th International SWBSS conference – Delft 2021
1 INTRODUCTION The crystallization of soluble salts plays a significant role in the deterioration of stone masonry and sculptures as well as wall paintings [1]. To prevent deteriora-tion, treatments aimed at reducing the salt content are performed, typically by poul-ticing [2]. Extensive investigations of the mechanisms that move the salts towards the poultice during desalination has been carried out [3] and the importance of ad-justing the pore size distribution of the poultice material has been emphasized [4].
Despite the solid understanding of the process, several problems are still associated with the method, in particular when dealing with very delicate surfaces, such as deteriorated wall paintings. The adjustment of the pore sizes is typically done by adding clay (bentonite or kaolin) to a cellulose poultice [5]. However, due to dis-coloration from clay particles and clearance requiring mechanical pressure, this is not appropriate when dealing with polychromes or fragile material. In these cases, a pure cellulose poultice is therefore often used [6]. The drawback of this is a large influx of moisture due to the poor water retention of the cellulose fibers, which might cause growth of mould, redistribution of salt to areas not previously salt-contaminated and a poor long-term effectiveness of the treatment [7].
In recent years, various hydrogels have gained ground in the field of conservation, mainly as matrices for chemical solutions during surface cleaning of artworks [8-9]. Regarding wall paintings, studies have shown that hydrogels can be effective in removing soot particles without depositing residues. Furthermore, due to their flex-ibility, hydrogels ensure good adhesion and can even be applied to fragile surfaces. Application and removal are performed without abrasive action, greatly reducing or eliminating mechanical damage [10]. In a few cases, gels have also proven ef-fective as desalination poultices on various materials. Primarily agar gels have been tested [11-13], but also polyacrylamide [14] and polyvinyl alcohol gels [15] have shown some interesting results. However, the method has not been systematically investigated, and the exact physicochemical properties of a gel determining the ability of salt extraction are not known.
Hydrogels comprise a three-dimensional network of polymer chains. Due to the hydrophilic properties of the polymers, the gels can contain large amounts of water and possess very good water retention properties. The water supply when applied to a surface will therefore be limited but still be sufficient to bring superficial salts into solution. These properties make hydrogels extremely interesting in relation to desalination of delicate surfaces. Since the dissolution of salts will only be super-ficial, the method is primarily suitable for cases where the salts have accumulated near the surface, in thin plaster layers or similar, as the limited water supply avoids the spread of salts deeper into the material.
It is assumed, that gels work much the same way as other poultices. The extraction of salt ions thus takes place by advection and/or diffusion. Thus, parameters that will be influential for the extractability of the gel are the porosity of the polymer network, but also, for example, the hydrophilicity and the chemical structure of the polymer.
In this preliminary study, the first step is taken towards a better understanding of hydrogels as a poultice material in desalination. The initial focus has been on the
216
J. Bartholdy, P. K. Larsen, and I. Brajer
5th International SWBSS conference – Delft 2021
examination of different gels’ abilities to absorb and extract one of the most com-monly found soluble salts affecting stone masonry and sculptures as well as wall paintings, sodium chloride.
2 EXPERIMENTAL
2.1 Materials A series of commercially available gels commonly used for cleaning of artworks were examined (Table 1).
Poly(vinyl alcohol) (PVA): Two different PVA gels produced by CSGI, Nanorestore Gel® Peggy 5 (PG5) and Nanorestore Gel® Peggy 6 (PG6) were tested. The gels are highly flexible and elastic, and therefore particularly suitable for application on rough and/or irregular surfaces. The PG6 gel consist of a cryo-gelated polymer network of poly(vinyl alcohol) (PVA) whereas the PG5 gel con-sists of a mixture of PVA and polyvinylpyrrolidone (PVP) [9]. PVP is a highly hydrophilic polymer which increases the water retention in the gel.
Poly(2-hydroxy-ethyl methacrylate)/poly(vinylpyrrolidone) (p(HEMA)/PVP): Two different gels produced by CSGI, Nanorestore Gel® MWR and Nanorestore Gel HWR from CSGI were tested. The gels are adapted for cleaning water-sensi-tive painted surfaces, such as tempera and lime-based paintings, and thus, the gels are highly water retentive. The gels consist of interpenetrating polymer networks of poly (2-hydroxyethyl methacrylate) and poly (vinylpyrrolidone) (p(HEMA)/PVP). P(HEMA) is a polymer used for medical use and PVP is a highly hydrophilic polymer used in the food and cosmetics industry. Together they create a highly hydrophilic rigid gel [17].
Agar: The third group of gels tested were prepared from Agar Art supplied by CTS. Agar (or Agar-agar) is a polysaccharide extracted from the cell walls of a species of red algae. It consists of two components: agarose and agaropectin. Agar is available in different purities, but in most products, agarose makes up approx. 70% of the con-tent. The polymeric chains crosslink by heating to 85 °C, allowing gelation [18]. Preparation of agar gels was done by suspending agar powder (Agar Art) in demin-eralized water at a concentration of 3% (w/v) in test 1 and 2% (w/v) in test 2. The suspension was heated to boiling point for 6 minutes and then cooled, whereby the liquid was gelled. The extraction ability of the gel was tested both when brushed onto the samples before complete cooling, as a viscous gel (at 40-45 °C) (Agar brushed), or after cooling completely in the form of precast gels (Agar gel).
The commercially available gels measure 15 x 10 cm, with a thickness of approx. 1 mm for the PVA gels, and approx. 2 mm for the p(HEMA)/PVP gels. The agar applied by brush formed gels of approx. 1-2 mm after repeating application 2-3 times. The precast gels had a thickness of approx. 2-3 mm.
For the absorption tests (test1), gel samples of approx. 5 x 5 cm were cut out of the gel sheets. For the extraction tests (test 2), the gels were applied in one piece and then cut into 4 equal pieces (3.75 x 10 cm), with different contact time for each piece. The water content (W%) of the gels was measured by letting the gels dry out in the laboratory, and therefore indicates free bound water.
217
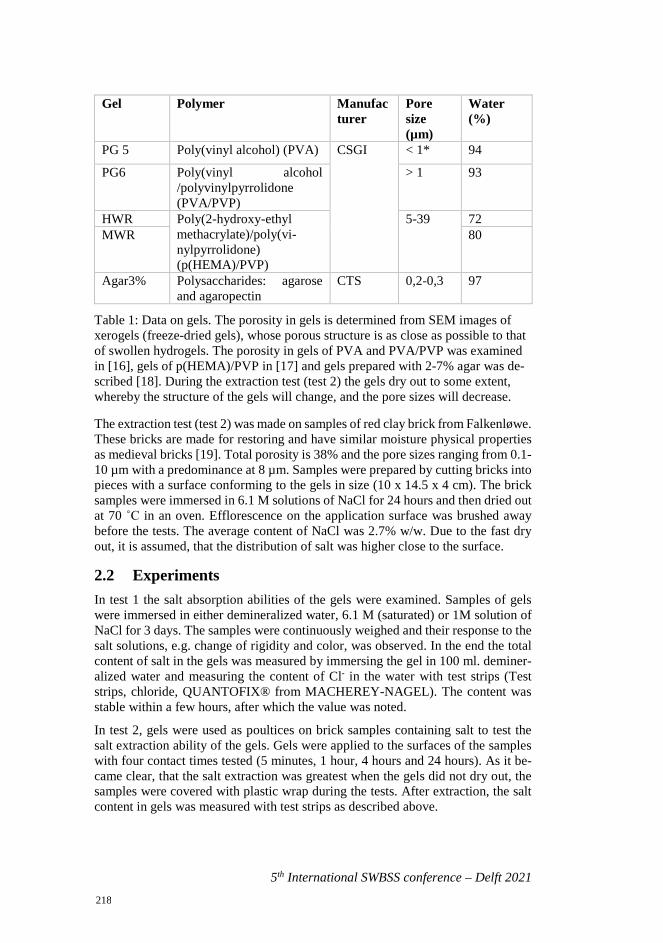
5th International SWBSS conference – Delft 2021
Gel Polymer Manufacturer
Pore size (µm)
Water (%)
PG 5 Poly(vinyl alcohol) (PVA) CSGI < 1* 94
PG6 Poly(vinyl alcohol /polyvinylpyrrolidone (PVA/PVP)
> 1 93
HWR Poly(2-hydroxy-ethyl methacrylate)/poly(vi-nylpyrrolidone) (p(HEMA)/PVP)
5-39 72 MWR 80
Agar3% Polysaccharides: agarose and agaropectin
CTS 0,2-0,3 97
Table 1: Data on gels. The porosity in gels is determined from SEM images of xerogels (freeze-dried gels), whose porous structure is as close as possible to that of swollen hydrogels. The porosity in gels of PVA and PVA/PVP was examined in [16], gels of p(HEMA)/PVP in [17] and gels prepared with 2-7% agar was de-scribed [18]. During the extraction test (test 2) the gels dry out to some extent, whereby the structure of the gels will change, and the pore sizes will decrease.
The extraction test (test 2) was made on samples of red clay brick from Falkenløwe. These bricks are made for restoring and have similar moisture physical properties as medieval bricks [19]. Total porosity is 38% and the pore sizes ranging from 0.1-10 µm with a predominance at 8 µm. Samples were prepared by cutting bricks into pieces with a surface conforming to the gels in size (10 x 14.5 x 4 cm). The brick samples were immersed in 6.1 M solutions of NaCl for 24 hours and then dried out at 70 ˚C in an oven. Efflorescence on the application surface was brushed away before the tests. The average content of NaCl was 2.7% w/w. Due to the fast dry out, it is assumed, that the distribution of salt was higher close to the surface.
2.2 Experiments In test 1 the salt absorption abilities of the gels were examined. Samples of gels were immersed in either demineralized water, 6.1 M (saturated) or 1M solution of NaCl for 3 days. The samples were continuously weighed and their response to the salt solutions, e.g. change of rigidity and color, was observed. In the end the total content of salt in the gels was measured by immersing the gel in 100 ml. deminer-alized water and measuring the content of Cl- in the water with test strips (Test strips, chloride, QUANTOFIX® from MACHEREY-NAGEL). The content was stable within a few hours, after which the value was noted.
In test 2, gels were used as poultices on brick samples containing salt to test the salt extraction ability of the gels. Gels were applied to the surfaces of the samples with four contact times tested (5 minutes, 1 hour, 4 hours and 24 hours). As it be-came clear, that the salt extraction was greatest when the gels did not dry out, the samples were covered with plastic wrap during the tests. After extraction, the salt content in gels was measured with test strips as described above.
218
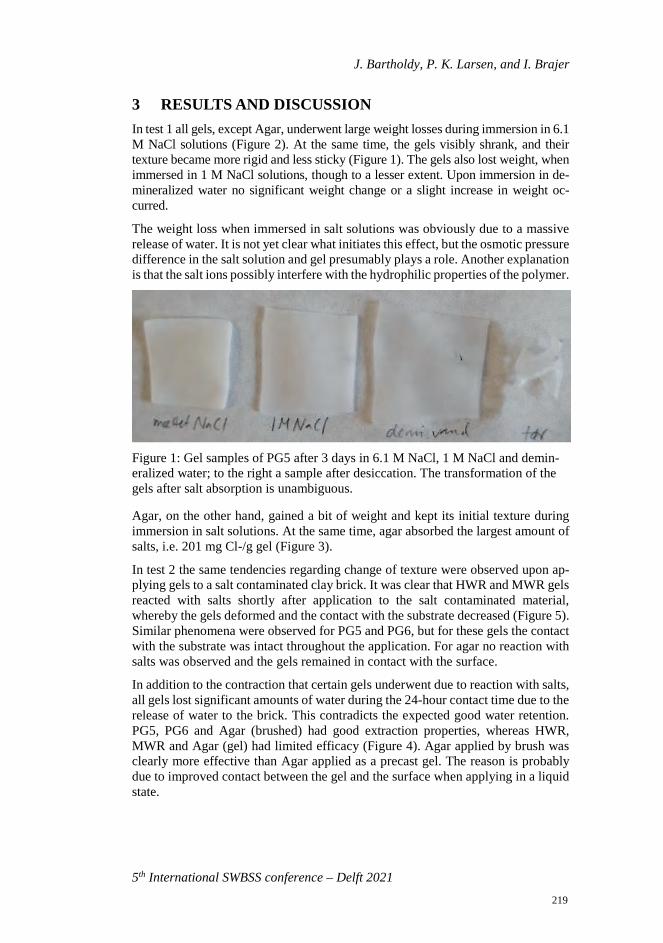
J. Bartholdy, P. K. Larsen, and I. Brajer
5th International SWBSS conference – Delft 2021
3 RESULTS AND DISCUSSION In test 1 all gels, except Agar, underwent large weight losses during immersion in 6.1 M NaCl solutions (Figure 2). At the same time, the gels visibly shrank, and their texture became more rigid and less sticky (Figure 1). The gels also lost weight, when immersed in 1 M NaCl solutions, though to a lesser extent. Upon immersion in de-mineralized water no significant weight change or a slight increase in weight oc-curred.
The weight loss when immersed in salt solutions was obviously due to a massive release of water. It is not yet clear what initiates this effect, but the osmotic pressure difference in the salt solution and gel presumably plays a role. Another explanation is that the salt ions possibly interfere with the hydrophilic properties of the polymer.
Figure 1: Gel samples of PG5 after 3 days in 6.1 M NaCl, 1 M NaCl and demin-eralized water; to the right a sample after desiccation. The transformation of the gels after salt absorption is unambiguous.
Agar, on the other hand, gained a bit of weight and kept its initial texture during immersion in salt solutions. At the same time, agar absorbed the largest amount of salts, i.e. 201 mg Cl-/g gel (Figure 3).
In test 2 the same tendencies regarding change of texture were observed upon ap-plying gels to a salt contaminated clay brick. It was clear that HWR and MWR gels reacted with salts shortly after application to the salt contaminated material, whereby the gels deformed and the contact with the substrate decreased (Figure 5). Similar phenomena were observed for PG5 and PG6, but for these gels the contact with the substrate was intact throughout the application. For agar no reaction with salts was observed and the gels remained in contact with the surface.
In addition to the contraction that certain gels underwent due to reaction with salts, all gels lost significant amounts of water during the 24-hour contact time due to the release of water to the brick. This contradicts the expected good water retention. PG5, PG6 and Agar (brushed) had good extraction properties, whereas HWR, MWR and Agar (gel) had limited efficacy (Figure 4). Agar applied by brush was clearly more effective than Agar applied as a precast gel. The reason is probably due to improved contact between the gel and the surface when applying in a liquid state.
219
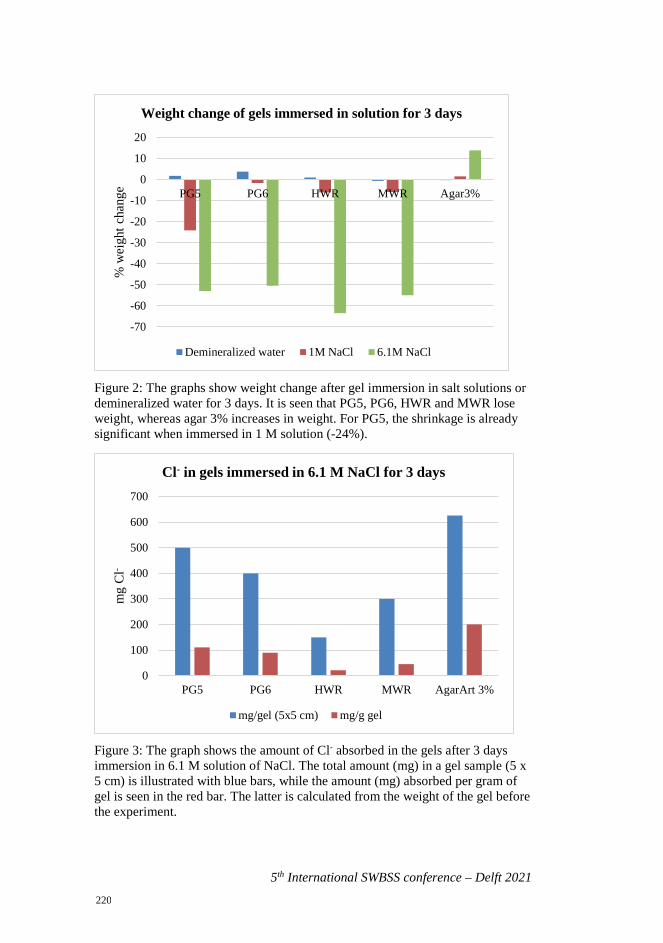
5th International SWBSS conference – Delft 2021
Figure 2: The graphs show weight change after gel immersion in salt solutions or demineralized water for 3 days. It is seen that PG5, PG6, HWR and MWR lose weight, whereas agar 3% increases in weight. For PG5, the shrinkage is already significant when immersed in 1 M solution (-24%).
Figure 3: The graph shows the amount of Cl- absorbed in the gels after 3 days immersion in 6.1 M solution of NaCl. The total amount (mg) in a gel sample (5 x 5 cm) is illustrated with blue bars, while the amount (mg) absorbed per gram of gel is seen in the red bar. The latter is calculated from the weight of the gel before the experiment.
-70
-60
-50
-40
-30
-20
-10
0
10
20
PG5 PG6 HWR MWR Agar3%
% w
eigh
t cha
nge
Weight change of gels immersed in solution for 3 days
Demineralized water 1M NaCl 6.1M NaCl
0
100
200
300
400
500
600
700
PG5 PG6 HWR MWR AgarArt 3%
mg
Cl-
Cl- in gels immersed in 6.1 M NaCl for 3 days
mg/gel (5x5 cm) mg/g gel
220
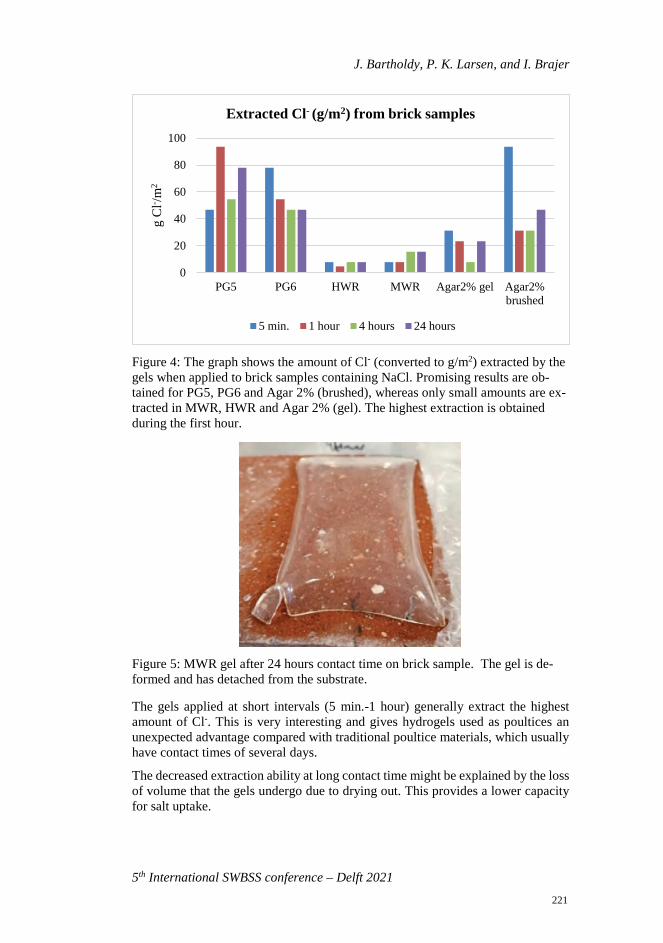
J. Bartholdy, P. K. Larsen, and I. Brajer
5th International SWBSS conference – Delft 2021
Figure 4: The graph shows the amount of Cl- (converted to g/m2) extracted by the gels when applied to brick samples containing NaCl. Promising results are ob-tained for PG5, PG6 and Agar 2% (brushed), whereas only small amounts are ex-tracted in MWR, HWR and Agar 2% (gel). The highest extraction is obtained during the first hour.
Figure 5: MWR gel after 24 hours contact time on brick sample. The gel is de-formed and has detached from the substrate.
The gels applied at short intervals (5 min.-1 hour) generally extract the highest amount of Cl-. This is very interesting and gives hydrogels used as poultices an unexpected advantage compared with traditional poultice materials, which usually have contact times of several days.
The decreased extraction ability at long contact time might be explained by the loss of volume that the gels undergo due to drying out. This provides a lower capacity for salt uptake.
0
20
40
60
80
100
PG5 PG6 HWR MWR Agar2% gel Agar2%brushed
g C
l- /m2
Extracted Cl- (g/m2) from brick samples
5 min. 1 hour 4 hours 24 hours
221
5th International SWBSS conference – Delft 2021
Another notable observation is that despite Agar's significantly higher absorption of salts in test 1, its ability to extract salt in test 2 is generally not better than PG5 and PG6. This shows that the extraction is not proportional to the gel’s ability to absorb salt. The extraction properties are certainly also affected by the gel’s capac-ity of water retention and probably, as with other poultices, the pore size distribu-tion. These factors will determine the extent to which the salts in the substrate are brought into solution and whether a subsequent salt transport from substrate to gel takes place. For traditional poultice material, the contain of pores smaller than in the treated material is crucial. According to available data, MWR and HWR gels contain larger pores than the brick (table 1 and. This could be part of the explana-tion for their poor salt extraction abilities in test 2, but since the gels also show poor salt absorption in test 1, the results are not unambiguous.
It should be noted that only a small amount of the total salt content of the bricks is extracted in these tests. At the most efficient desalination with agar (brushed) and PG5, the extraction is only approx. 10% of the total NaCl content of the brick sam-ple. It should therefore be pointed out that the effect of desalination with gels in these preliminary studies is very superficial, which can be explained by the limited wetting of the sample. This indicates that this method will be best suited for desal-ination where the salt content of the treated material has accumulated near the sur-face.
4 CONCLUSION This pilot study shows that hydrogels are able to absorb salts to a degree that makes them an interesting material for desalination for wall paintings and other fragile surfaces, where cellulose poultice are usually chosen in favor of clay. The salt ex-traction takes place in minutes, which is extraordinary compared to traditional poultice materials, typically requiring an application time of several days. Further-more, as the gels release a much more controlled amount of moisture to the sub-strate, the method avoids the drawbacks of cellulose poultices in relation to e.g. enhancing microbial growth and redistribution of salts to new parts of the masonry.
The promising results, at the same time, open up a wide range of unanswered ques-tions. It was seen that the gels’ ability to extract salts was not only a matter of their ability to absorb salt. Other physical and chemical properties, such as water reten-tion, the hydrophilicity of the polymer and the pore size distribution clearly have an impact, but the exact effects of these physicochemical properties still need in-vestigation. It was also clear that the water retention of some gels was dramatically affected by salts. This, in turn, influenced their ability to absorb salts and maintain contact with the surface during treatment. It is still uncertain which factors play a role in this phenomenon. Another important issue is to examine the depth of desal-ination with gels and whether the amount of salts extracted is comparable to tradi-tional poultices. The divergent abilities of different hydrogels to absorb and extract salts are far from being fully understood after these simple experiments. However, these initial results constitute a viable argument for the need for further investiga-tions. A particularly interesting feature of hydrogel’s non-abrasive ability to re-move dirt on fragile surfaces is also relevant for the treatment of salt-contaminated
222
J. Bartholdy, P. K. Larsen, and I. Brajer
5th International SWBSS conference – Delft 2021
objects. In upcoming studies, this new method of desalination will be further ex-plored, and the capabilities of hydrogels as poultice material will be studied in more detail.
ACKNOWLEDGMENTS This project was financially supported by the Augustinus Foundation and Civilin-geniør Knud Nørgaard og hustru Grethe Nørgaards Fond.
REFERENCES [1] A. E. Charola,. Salts in the deterioration of porous materials: an overview.
Journal of the American institute for conservation , vol. 39, no. 3, pp 327-343, 2000.
[2] V. Vergès-Belmin & H. Siedel, Desalination of masonries and monumental sculptures by poulticing: A review. Restoration of Buildings and Monuments (Bauinstandsetzen und Baudenkmalpflege), vol 11,pp 1-18,2005
[3] Pel, L., A. Sawdy, & V. Voronina, Physical principles and efficiency of salt extraction by poulticing. Journal of Cultural Heritage , vol. 1, no,1,pp 59-67, 2010
[4] A. Sawdy, B. Lubelli, V. Voronina, & L. Pel, Optimizing the extraction of soluble salts from porous materials by poultices. Studies in Conservation 55(1), 26-40, 2010.
[5] B. Lubelli, & R. P. van Hees, Desalination of masonry structures: Fine tuning of pore size distribution of poultices to substrate properties. Journal of Cul-tural Heritage vol. 11, no.1, pp 10-18, 2010.
[6] I. Brajer, & P. K. Larsen, The salt reduction treatment on the wall paintings in Tirsted Church. Paper presented at the 1st International Conference on Salt Weathering on Buildings and Stone Sculptures, The National Museum, Co-penhagen, Denmark, pp 219-236.
[7] V. Vergès-Belmin, A. Heritage, & A. Bourgès, Powdered cellulose poultices in stone and wall painting conservation-myths and realities, Studies in con-servation, vol. 56, no.4, pp 281-297, 2011.
[8] L.V. Angelova, B. Ormsby, J.H. Townsend, & R. Wolbers, Gels in the Con-servation of Art, London, UK: Archetype Publications Ltd; 2017.
[9] A., Bartoletti, R. Barker, D. Chelazzi, N. Bonelli, P. Baglioni, J. Lee, L. V. Angelova, & B. Ormsby, Reviving WHAAM! A comparative evaluation of cleaning systems for the conservation treatment of Roy Lichtenstein’s iconic painting. Heritage Science vol. 8, no. 9, 2020
[10] K. Segel, I. Brajer, M. Taube, C. M. de Fonjaudran, M., Baglioni, D. Chelazzi, R. Giorgi, & P. Baglioni,.Removing Ingrained Soiling from Medieval Lime-based Wall Paintings Using Nanorestore Gel® Peggy 6 in Combination with Aqueous Cleaning Liquids, Studies in Conservation, vol 65, no. (sup1), pp 284-291,2020.
223
5th International SWBSS conference – Delft 2021
[11] D. Gulotta,, D. Saviello, F. Gherardi, L. Toniolo, M. Anzani, A. Rabbolini, &S. Goidanich, Setup of a sustainable indoor cleaning methodology for thesculpted stone surfaces of the Duomo of Milan. Heritage Science, vol. 2, no.1, pp 1-13, 2014.
[12] J. Martinsa, A. Dionisiob, & O. Neves, Agar gel for Ançã limestone desali-nation, 15th Water-Rock Interaction International Symposium, WRI-15,2017, pp 754-757.
[13] M. Bertasa, F. Bandini, A. Felici, M.R., Lanfranchi, R. Negrotti, C. Riminesi,D. Scalarone, & A. Sansonetti, Soluble salts extraction with different thick-eners: Monitoring of the effects on plaster. IOP Conf. Series: Materials Sci-ence and Engineering, 2018 pp. 364.
[14] S. Vicini, M. Castellano, M. C. Faria Soares Lima, P. Licinio & G. GoulartSilva, Polyacrylamide hydrogels for stone restoration: Effect of salt solutionson swelling/deswelling degree and dynamic correlation length. Journal of Ap-plied Polymer Science, vol. 134, no. 16, 2017
[15] S. Rossato ,Evaluation of leather cleaning with rigid gels on the Faust`s biblefrom the French cinémathéque (Paris): comparison between agarose andHWR/Nanorestore gel ®. ICOM-CC leather and related materials, workinggroup, newsletter 9 – May 2020.
[16] N. Bonelli, G. Poggi, D. Chelazzi, R. Giorgi & P. Baglioni, Poly (vinyl alco-hol)/poly (vinyl pyrrolidone) hydrogels for the cleaning of art. Journal of col-loid and interface science, vol. 536, pp 339-348, 2019.
[17] J. A. Domingues, N. Bonelli, R. Giorgi, E. Fratini, F. Gorel, & Baglioni, P.,Innovative hydrogels based on semi-interpenetrating p (HEMA)/PVP net-works for the cleaning of water-sensitive cultural heritage artifacts. Lang-muir , vol. 29, no. 8, pp 2746-2755, 2013.
[18] C. L. Scott, The use of agar as a solvent gel in objects conservation. ObjectsSpecialty Group Postprints, Vol. 19, pp 71-83, 2012.
[19] P. K. Larsen,Moisture physical properties of bricks. An investigation ofFalkenløwe, Stralsund and Hartmann bricks. Technical University of Den-mark, Department of Civil Engineering. Technical report 343, 1995.
224
5th International SWBSS conference – Delft 2021
TWO-STEP TREATMENTS FOR THE CONSOLIDATION OF CARBONATE STONE ARTWORKS
Romane Le Dizès1*, Déa Jaïs1, and Noushine Shahidzadeh1
KEYWORDS Limestone, consolidation, calcium citrate, sol-gel process
ABSTRACT An important part of our cultural heritage, such as artefacts, statues or historical monuments, is exposed to chemical and physical degradation over time. The deg-radation can lead to fractures and/or loss of cohesion among the individual particles forming the material components. It can also damage the painting layers: flaking of the surface layers, powdering etc. To protect weakened porous materials, film-forming substances, resins and polymeric materials are often used to consolidate weakened porous objects and structures. Although progress has been made in im-proving consolidation treatments for silicate stones, the treatments are much less effective when used on carbonate stones (such as marble or limestone) because of the chemical incompatibility between the grains and the common treatments.
Here, we present a novel two-step treatment for consolidating weakened artworks made of porous limestone. Coupling agents are synthetized as a pre-treatment step to prepare the porous network prior to the application of the consolidant. The latter can then be applied successfully without inducing crack formation during drying. The efficiency of the two-step treatment was studied at the microscale and linked to the macroscopic mechanical properties, such as the Young’s modulus and stress at break of the materials after treatment. Our results have advantages over other types of the treatments based on lime nanoparticles: the two- step treatment pro-posed here is easy to implement while being eco-friendly. In addition, it respects several other important criteria, such as the ability to restore the mechanical prop-erties of damaged stones without changing their physical appearance and other properties, such as porosity or permeability.
1 Soft Matter Group, University of Amsterdam, [email protected]
225
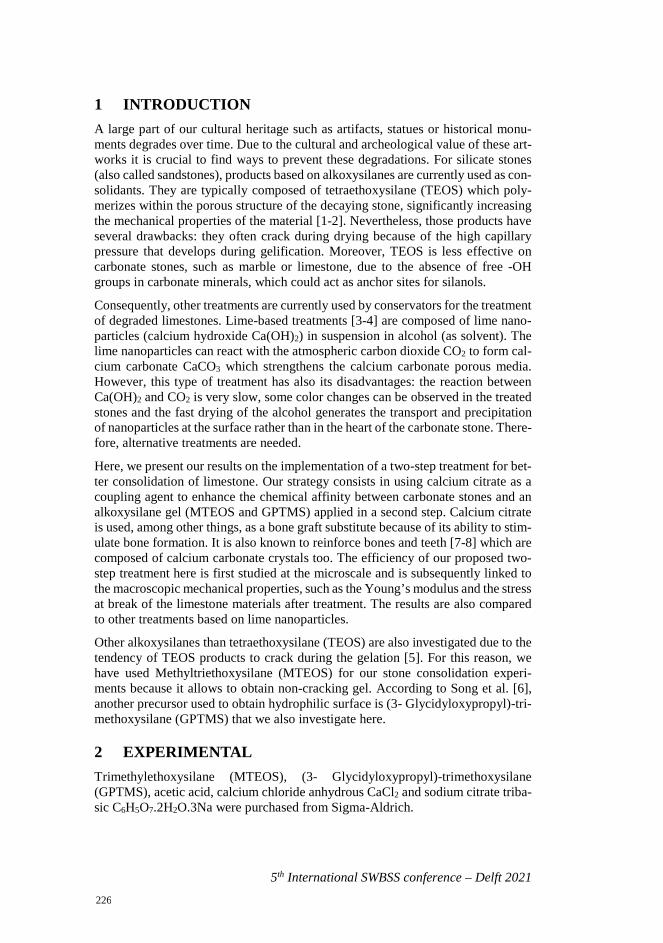
5th International SWBSS conference – Delft 2021
1 INTRODUCTION A large part of our cultural heritage such as artifacts, statues or historical monu-ments degrades over time. Due to the cultural and archeological value of these art-works it is crucial to find ways to prevent these degradations. For silicate stones (also called sandstones), products based on alkoxysilanes are currently used as con-solidants. They are typically composed of tetraethoxysilane (TEOS) which poly-merizes within the porous structure of the decaying stone, significantly increasing the mechanical properties of the material [1-2]. Nevertheless, those products have several drawbacks: they often crack during drying because of the high capillary pressure that develops during gelification. Moreover, TEOS is less effective on carbonate stones, such as marble or limestone, due to the absence of free -OH groups in carbonate minerals, which could act as anchor sites for silanols.
Consequently, other treatments are currently used by conservators for the treatment of degraded limestones. Lime-based treatments [3-4] are composed of lime nano-particles (calcium hydroxide Ca(OH)2) in suspension in alcohol (as solvent). The lime nanoparticles can react with the atmospheric carbon dioxide CO2 to form cal-cium carbonate CaCO3 which strengthens the calcium carbonate porous media. However, this type of treatment has also its disadvantages: the reaction between Ca(OH)2 and CO2 is very slow, some color changes can be observed in the treated stones and the fast drying of the alcohol generates the transport and precipitation of nanoparticles at the surface rather than in the heart of the carbonate stone. There-fore, alternative treatments are needed.
Here, we present our results on the implementation of a two-step treatment for bet-ter consolidation of limestone. Our strategy consists in using calcium citrate as a coupling agent to enhance the chemical affinity between carbonate stones and an alkoxysilane gel (MTEOS and GPTMS) applied in a second step. Calcium citrate is used, among other things, as a bone graft substitute because of its ability to stim-ulate bone formation. It is also known to reinforce bones and teeth [7-8] which are composed of calcium carbonate crystals too. The efficiency of our proposed two-step treatment here is first studied at the microscale and is subsequently linked to the macroscopic mechanical properties, such as the Young’s modulus and the stress at break of the limestone materials after treatment. The results are also compared to other treatments based on lime nanoparticles.
Other alkoxysilanes than tetraethoxysilane (TEOS) are also investigated due to the tendency of TEOS products to crack during the gelation [5]. For this reason, we have used Methyltriethoxysilane (MTEOS) for our stone consolidation experi-ments because it allows to obtain non-cracking gel. According to Song et al. [6], another precursor used to obtain hydrophilic surface is (3- Glycidyloxypropyl)-tri-methoxysilane (GPTMS) that we also investigate here.
2 EXPERIMENTAL Trimethylethoxysilane (MTEOS), (3- Glycidyloxypropyl)-trimethoxysilane (GPTMS), acetic acid, calcium chloride anhydrous CaCl2 and sodium citrate triba-sic C6H5O7.2H2O.3Na were purchased from Sigma-Aldrich.
226
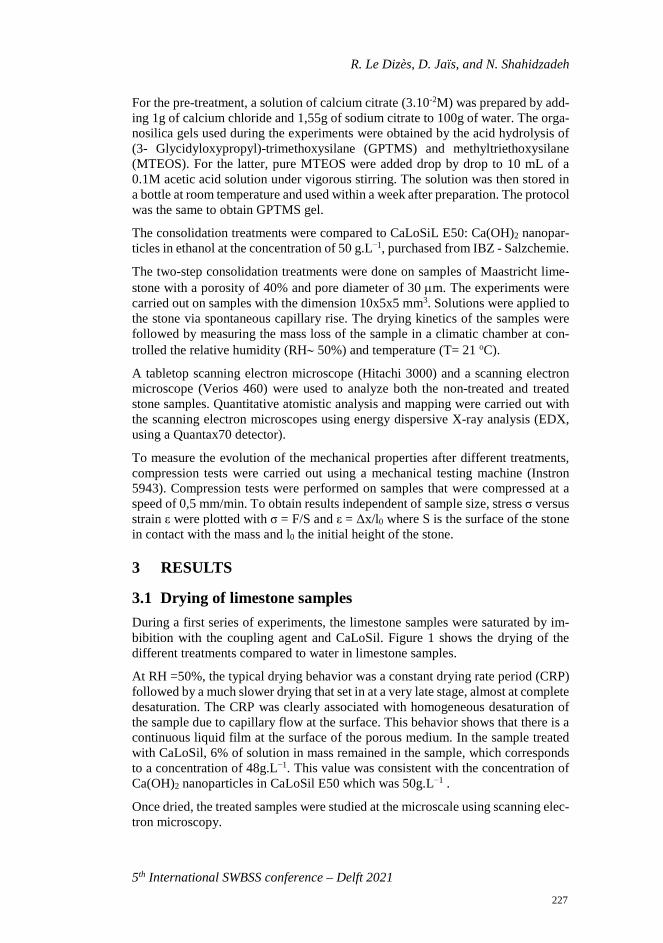
R. Le Dizès, D. Jaïs, and N. Shahidzadeh
5th International SWBSS conference – Delft 2021
For the pre-treatment, a solution of calcium citrate (3.10-2M) was prepared by add-ing 1g of calcium chloride and 1,55g of sodium citrate to 100g of water. The orga-nosilica gels used during the experiments were obtained by the acid hydrolysis of (3- Glycidyloxypropyl)-trimethoxysilane (GPTMS) and methyltriethoxysilane (MTEOS). For the latter, pure MTEOS were added drop by drop to 10 mL of a 0.1M acetic acid solution under vigorous stirring. The solution was then stored in a bottle at room temperature and used within a week after preparation. The protocol was the same to obtain GPTMS gel.
The consolidation treatments were compared to CaLoSiL E50: Ca(OH)2 nanopar-ticles in ethanol at the concentration of 50 g.L−1, purchased from IBZ - Salzchemie.
The two-step consolidation treatments were done on samples of Maastricht lime-stone with a porosity of 40% and pore diameter of 30 µm. The experiments were carried out on samples with the dimension 10x5x5 mm3. Solutions were applied to the stone via spontaneous capillary rise. The drying kinetics of the samples were followed by measuring the mass loss of the sample in a climatic chamber at con-trolled the relative humidity (RH∼ 50%) and temperature (T= 21 oC).
A tabletop scanning electron microscope (Hitachi 3000) and a scanning electron microscope (Verios 460) were used to analyze both the non-treated and treated stone samples. Quantitative atomistic analysis and mapping were carried out with the scanning electron microscopes using energy dispersive X-ray analysis (EDX, using a Quantax70 detector).
To measure the evolution of the mechanical properties after different treatments, compression tests were carried out using a mechanical testing machine (Instron 5943). Compression tests were performed on samples that were compressed at a speed of 0,5 mm/min. To obtain results independent of sample size, stress σ versus strain ε were plotted with σ = F/S and ε = Δx/l0 where S is the surface of the stone in contact with the mass and l0 the initial height of the stone.
3 RESULTS
3.1 Drying of limestone samples During a first series of experiments, the limestone samples were saturated by im-bibition with the coupling agent and CaLoSil. Figure 1 shows the drying of the different treatments compared to water in limestone samples.
At RH =50%, the typical drying behavior was a constant drying rate period (CRP) followed by a much slower drying that set in at a very late stage, almost at complete desaturation. The CRP was clearly associated with homogeneous desaturation of the sample due to capillary flow at the surface. This behavior shows that there is a continuous liquid film at the surface of the porous medium. In the sample treated with CaLoSil, 6% of solution in mass remained in the sample, which corresponds to a concentration of 48g.L−1. This value was consistent with the concentration of Ca(OH)2 nanoparticles in CaLoSil E50 which was 50g.L−1 .
Once dried, the treated samples were studied at the microscale using scanning elec-tron microscopy.
227
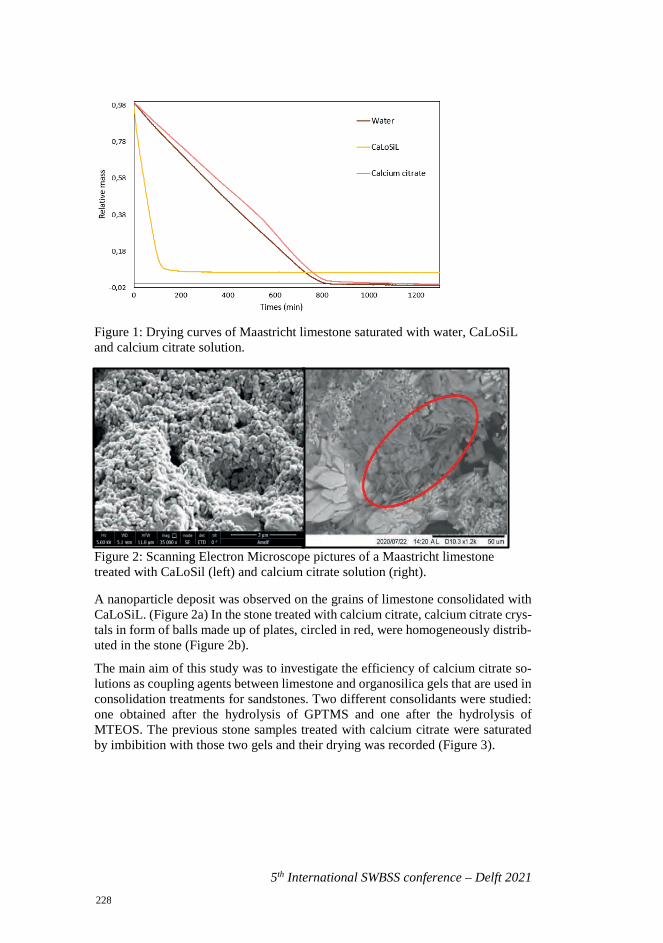
5th International SWBSS conference – Delft 2021
Figure 1: Drying curves of Maastricht limestone saturated with water, CaLoSiL and calcium citrate solution.
Figure 2: Scanning Electron Microscope pictures of a Maastricht limestone treated with CaLoSil (left) and calcium citrate solution (right).
A nanoparticle deposit was observed on the grains of limestone consolidated with CaLoSiL. (Figure 2a) In the stone treated with calcium citrate, calcium citrate crys-tals in form of balls made up of plates, circled in red, were homogeneously distrib-uted in the stone (Figure 2b).
The main aim of this study was to investigate the efficiency of calcium citrate so-lutions as coupling agents between limestone and organosilica gels that are used in consolidation treatments for sandstones. Two different consolidants were studied: one obtained after the hydrolysis of GPTMS and one after the hydrolysis of MTEOS. The previous stone samples treated with calcium citrate were saturated by imbibition with those two gels and their drying was recorded (Figure 3).
228
R. Le Dizès, D. Jaïs, and N. Shahidzadeh
5th International SWBSS conference – Delft 2021
Figure 3: Drying curves of Maastricht limestone saturated with MTEOS and GPTMS.
The drying behavior of these samples was completely different from before: in-stead of showing a constant rate period, the drying curve was exponential from the beginning all the way to the end of the drying. One hypothesis that could explain this exponential decay is the condensation of the gel on the outer surface of the stone sample. These gels form a barrier and prevent the fluid from reaching the surface to evaporate. Because of that, the evaporative surface is becoming smaller according to:
𝑑𝑑𝑑𝑑𝑑𝑑𝑑𝑑
= 𝛼𝛼 𝑑𝑑𝑑𝑑𝑑𝑑𝑑𝑑
(1)
In fact, the drying rate is proportional to the surface of evaporation: 𝑑𝑑𝑑𝑑𝑑𝑑𝑑𝑑
= − 𝑐𝑐𝑐𝑐 (2)
Thus, these equations lead to 𝑑𝑑2𝑑𝑑𝑑𝑑𝑑𝑑2
= −𝑐𝑐𝛼𝛼 𝑑𝑑𝑑𝑑𝑑𝑑𝑑𝑑
(3)
which has an exponential solution in time, and so this explains the exponential de-cay of the mass in the experiments.
It can be noticed that there remains two times more consolidant in the stones treated with GPTMS than in the one treated with MTEOS. The hydrolysis of GPTMS pro-duces methanol, while the hydrolysis of MTEOS produces ethanol. For the two gels, the same amount of alkoxysilane is introduced and for each mole of alkoxysilane, three moles of alcohol are produced. However, one mole of methanol represents 40 mL, while one mole of ethanol represents 58 mL. Thus, for the same amount of solution in a stone, the quantity of alcohol that evaporates is more im-portant for the MTEOS so that the quantity of gel is smaller. Moreover, methanol is more volatile than ethanol, their boiling points are 65°C and 79°C respectively. Thus, it can be assumed that some of the methanol has already evaporated during the synthesis.
229
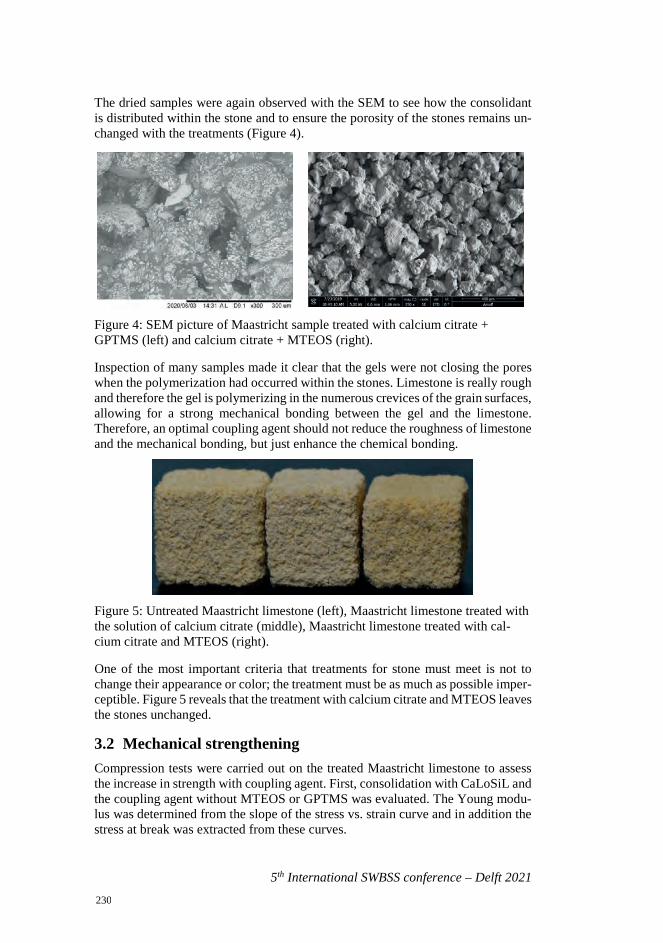
5th International SWBSS conference – Delft 2021
The dried samples were again observed with the SEM to see how the consolidant is distributed within the stone and to ensure the porosity of the stones remains un-changed with the treatments (Figure 4).
Figure 4: SEM picture of Maastricht sample treated with calcium citrate + GPTMS (left) and calcium citrate + MTEOS (right).
Inspection of many samples made it clear that the gels were not closing the pores when the polymerization had occurred within the stones. Limestone is really rough and therefore the gel is polymerizing in the numerous crevices of the grain surfaces, allowing for a strong mechanical bonding between the gel and the limestone. Therefore, an optimal coupling agent should not reduce the roughness of limestone and the mechanical bonding, but just enhance the chemical bonding.
Figure 5: Untreated Maastricht limestone (left), Maastricht limestone treated with the solution of calcium citrate (middle), Maastricht limestone treated with cal-cium citrate and MTEOS (right).
One of the most important criteria that treatments for stone must meet is not to change their appearance or color; the treatment must be as much as possible imper-ceptible. Figure 5 reveals that the treatment with calcium citrate and MTEOS leaves the stones unchanged.
3.2 Mechanical strengthening Compression tests were carried out on the treated Maastricht limestone to assess the increase in strength with coupling agent. First, consolidation with CaLoSiL and the coupling agent without MTEOS or GPTMS was evaluated. The Young modu-lus was determined from the slope of the stress vs. strain curve and in addition the stress at break was extracted from these curves.
230
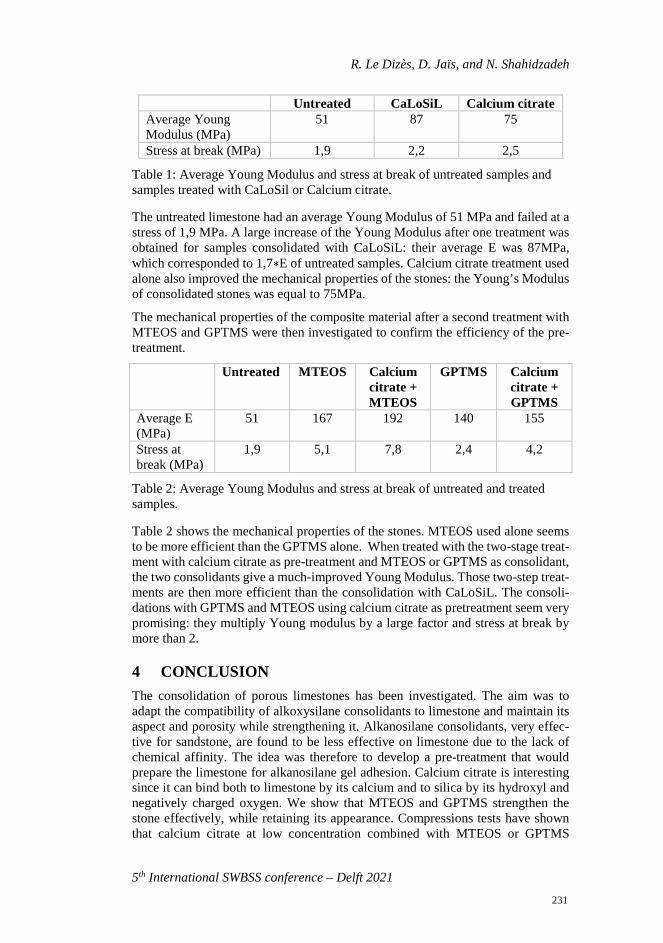
R. Le Dizès, D. Jaïs, and N. Shahidzadeh
5th International SWBSS conference – Delft 2021
Untreated CaLoSiL Calcium citrate Average Young Modulus (MPa)
51 87 75
Stress at break (MPa) 1,9 2,2 2,5
Table 1: Average Young Modulus and stress at break of untreated samples and samples treated with CaLoSil or Calcium citrate.
The untreated limestone had an average Young Modulus of 51 MPa and failed at a stress of 1,9 MPa. A large increase of the Young Modulus after one treatment was obtained for samples consolidated with CaLoSiL: their average E was 87MPa, which corresponded to 1,7∗E of untreated samples. Calcium citrate treatment used alone also improved the mechanical properties of the stones: the Young’s Modulus of consolidated stones was equal to 75MPa.
The mechanical properties of the composite material after a second treatment with MTEOS and GPTMS were then investigated to confirm the efficiency of the pre-treatment.
Untreated MTEOS Calcium citrate + MTEOS
GPTMS Calcium citrate + GPTMS
Average E (MPa)
51 167 192 140 155
Stress at break (MPa)
1,9 5,1 7,8 2,4 4,2
Table 2: Average Young Modulus and stress at break of untreated and treated samples.
Table 2 shows the mechanical properties of the stones. MTEOS used alone seems to be more efficient than the GPTMS alone. When treated with the two-stage treat-ment with calcium citrate as pre-treatment and MTEOS or GPTMS as consolidant, the two consolidants give a much-improved Young Modulus. Those two-step treat-ments are then more efficient than the consolidation with CaLoSiL. The consoli-dations with GPTMS and MTEOS using calcium citrate as pretreatment seem very promising: they multiply Young modulus by a large factor and stress at break by more than 2.
4 CONCLUSION The consolidation of porous limestones has been investigated. The aim was to adapt the compatibility of alkoxysilane consolidants to limestone and maintain its aspect and porosity while strengthening it. Alkanosilane consolidants, very effec-tive for sandstone, are found to be less effective on limestone due to the lack of chemical affinity. The idea was therefore to develop a pre-treatment that would prepare the limestone for alkanosilane gel adhesion. Calcium citrate is interesting since it can bind both to limestone by its calcium and to silica by its hydroxyl and negatively charged oxygen. We show that MTEOS and GPTMS strengthen the stone effectively, while retaining its appearance. Compressions tests have shown that calcium citrate at low concentration combined with MTEOS or GPTMS
231
5th International SWBSS conference – Delft 2021
greatly enhance the mechanical properties of the stone. Both treatments have shown a better mechanical strengthening than CaLoSiL which is currently used for limestone consolidation. Finally, all the experiments carried out have shown that the best treatment to obtain a hydrophilic surface is calcium citrate followed by GPTMS. MTEOS combined with calcium citrate can also be interesting if a hydro-phobic surface is needed for a specific application; we are currently researching this. To highlight the long-term effectiveness of the coupling agent, accelerated ageing tests should be carried out to see if the consolidation of the pre-treated stones is more resistant over time than the consolidation without pre-treatment.
REFERENCES [1] G. W. Scherer and G. S. Wheeler, Silicate Consolidants for Stone, Key Engi-
neering Materials, vol. 391, pp. 1-25, 2009
[2] Maria J. Mosquera, Desire M. de los Santos, Antonio Montes, Lucila Valdez-Castro, New Nanomaterials for Consolidating Stone, 201
[3] R..Navarro, C. Suzuki, Amelia et Ruiz-Agudo, Encarnacio. Alcohol disper-sions of calcium hydroxide nanoparticles for stone conservation. Langmuir,vol. 29, no.36, pp. 11457-11470, 2013.
[4] G. Borsoi, B. Lubelli, R. van Hees, R. Veiga, & A. S. Silva, Application pro-tocol for the consolidation of calcareous substrates by the use of nanolimes:from laboratory research to practice. Restoration of Buildings and Monu-ments, vol 22(4-6), pp. 99-109, 2018
[5] Kim, Eun Kyung, et al. Effects of silica nanoparticle and GPTMS addition onTEOS-based stone consolidants. Journal of Cultural Heritage., vol. 10, no 2,pp. 214-221, 2009.
[6] Song, Ki-Chang, Park, Jung-Kook et Kang, Hyun-Uk. Synthesis of hydro-philic coating solution for polymer substrate using glycidoxypropyltri-methoxysilane. Journal of sol-gel science and technology., vol. 27, no.1, pp.53-59, 2003.
[7] Li, Junfeng, et al. Preparation and properties of calcium citrate nanosheets forbone graft substitute. Bioengineered, vol. 7, no 5, pp. 376-381, 2016.
[8] Allam, Gehan et El-Geleel, Abd. Evaluating the Mechanical Properties, andCalcium and Fluoride Release of Glass-Ionomer Cement Modified withChicken Eggshell Powder. Dentistry journal, Vol. 6, no. 3, pp. 40, 2018.
232
5th International SWBSS conference – Delft 2021
DEVELOPMENT OF HYDROXYAPATITE-CHITOSAN-BASED TREATMENTS FOR THE MITIGATION OF SALT DAMAGE IN GLOBIGERINA LIMESTONE
Elisa Franzoni1*, Enrico Sassoni1, and Clelia Marrone1
KEYWORDS Salt crystallization test, biopolymers, chitosan, phosphatic consolidants, UPV
ABSTRACT Many soft limestones used in heritage buildings in the Mediterranean area are af-fected by salt crystallization, leading to alveolization and dramatic stone loss. To fight salt-induced deterioration of stone, different treatments were recently pro-posed, aimed at modifying the crystallization of salts during either the nucleation or growth of the crystals. In particular, strategies based on crystallization inhibitors and promoters were studied in the literature.
In this paper, a new two-step treatment was applied to Globigerina limestone sam-ples. The treatment consists in the application of an aqueous solution based on di-ammonium hydrogen phosphate, followed by the application of a chitosan solution. The first one produces an inorganic layer of calcium phosphate phases (mainly hy-droxyapatite) and is aimed not only at consolidating the stone and preventing cal-cite dissolution, but also at providing a rough anchoring substrate for chitosan. The second layer is formed by chitosan, a biopolymer that was shown to have an inhib-iting action on the crystallization of sodium sulphate. The two solutions were ap-plied to the limestone samples both alone and combined, adopting different con-centrations. The effects of the treatments were investigated in terms of phase for-mation, pore size distribution modification and change in the dynamic elastic mod-ulus. Then, treated and untreated limestone samples were subjected to an acceler-ated crystallization procedure in laboratory, to evaluate the benefits deriving from the treatments.
1 Department of Civil, Chemical, Environmental and Materials Engineering,
University of Bologna, Bologna, Italy, [email protected]
233
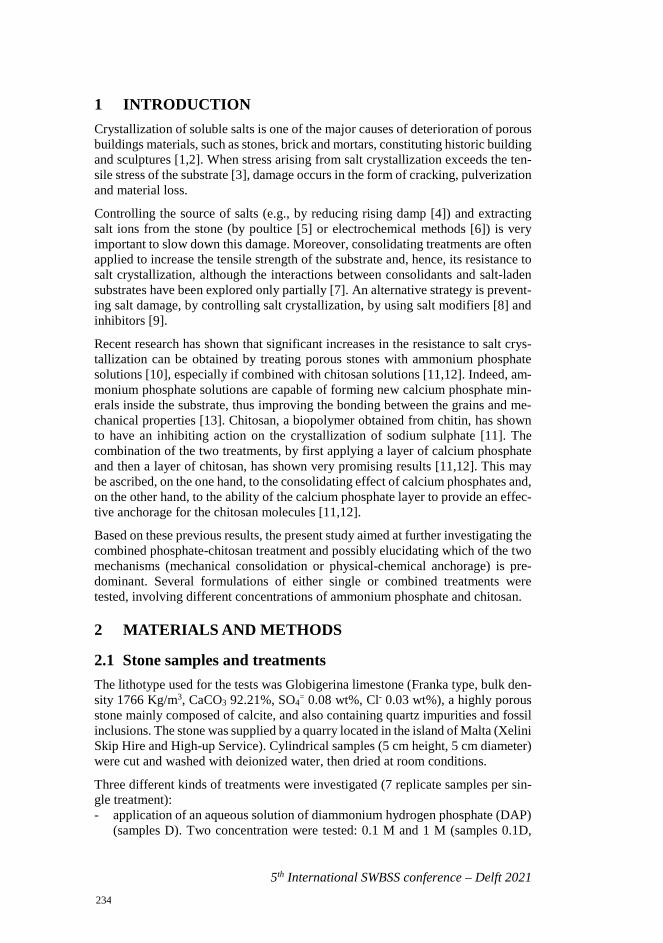
5th International SWBSS conference – Delft 2021
1 INTRODUCTION Crystallization of soluble salts is one of the major causes of deterioration of porous buildings materials, such as stones, brick and mortars, constituting historic building and sculptures [1,2]. When stress arising from salt crystallization exceeds the ten-sile stress of the substrate [3], damage occurs in the form of cracking, pulverization and material loss.
Controlling the source of salts (e.g., by reducing rising damp [4]) and extracting salt ions from the stone (by poultice [5] or electrochemical methods [6]) is very important to slow down this damage. Moreover, consolidating treatments are often applied to increase the tensile strength of the substrate and, hence, its resistance to salt crystallization, although the interactions between consolidants and salt-laden substrates have been explored only partially [7]. An alternative strategy is prevent-ing salt damage, by controlling salt crystallization, by using salt modifiers [8] and inhibitors [9].
Recent research has shown that significant increases in the resistance to salt crys-tallization can be obtained by treating porous stones with ammonium phosphate solutions [10], especially if combined with chitosan solutions [11,12]. Indeed, am-monium phosphate solutions are capable of forming new calcium phosphate min-erals inside the substrate, thus improving the bonding between the grains and me-chanical properties [13]. Chitosan, a biopolymer obtained from chitin, has shown to have an inhibiting action on the crystallization of sodium sulphate [11]. The combination of the two treatments, by first applying a layer of calcium phosphate and then a layer of chitosan, has shown very promising results [11,12]. This may be ascribed, on the one hand, to the consolidating effect of calcium phosphates and, on the other hand, to the ability of the calcium phosphate layer to provide an effec-tive anchorage for the chitosan molecules [11,12].
Based on these previous results, the present study aimed at further investigating the combined phosphate-chitosan treatment and possibly elucidating which of the two mechanisms (mechanical consolidation or physical-chemical anchorage) is pre-dominant. Several formulations of either single or combined treatments were tested, involving different concentrations of ammonium phosphate and chitosan.
2 MATERIALS AND METHODS
2.1 Stone samples and treatments The lithotype used for the tests was Globigerina limestone (Franka type, bulk den-sity 1766 Kg/m3, CaCO3 92.21%, SO4
= 0.08 wt%, Cl- 0.03 wt%), a highly porous stone mainly composed of calcite, and also containing quartz impurities and fossil inclusions. The stone was supplied by a quarry located in the island of Malta (Xelini Skip Hire and High-up Service). Cylindrical samples (5 cm height, 5 cm diameter) were cut and washed with deionized water, then dried at room conditions.
Three different kinds of treatments were investigated (7 replicate samples per sin-gle treatment): - application of an aqueous solution of diammonium hydrogen phosphate (DAP)
(samples D). Two concentration were tested: 0.1 M and 1 M (samples 0.1D,
234
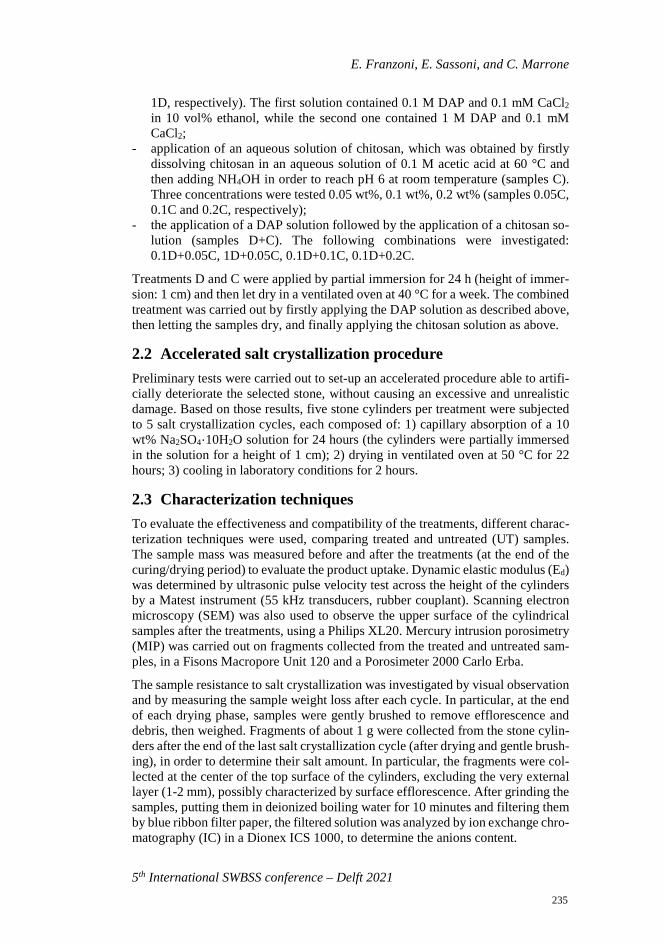
E. Franzoni, E. Sassoni, and C. Marrone
5th International SWBSS conference – Delft 2021
1D, respectively). The first solution contained 0.1 M DAP and 0.1 mM CaCl2 in 10 vol% ethanol, while the second one contained 1 M DAP and 0.1 mM CaCl2;
- application of an aqueous solution of chitosan, which was obtained by firstly dissolving chitosan in an aqueous solution of 0.1 M acetic acid at 60 °C and then adding NH4OH in order to reach pH 6 at room temperature (samples C). Three concentrations were tested 0.05 wt%, 0.1 wt%, 0.2 wt% (samples 0.05C, 0.1C and 0.2C, respectively);
- the application of a DAP solution followed by the application of a chitosan so-lution (samples D+C). The following combinations were investigated: 0.1D+0.05C, 1D+0.05C, 0.1D+0.1C, 0.1D+0.2C.
Treatments D and C were applied by partial immersion for 24 h (height of immer-sion: 1 cm) and then let dry in a ventilated oven at 40 °C for a week. The combined treatment was carried out by firstly applying the DAP solution as described above, then letting the samples dry, and finally applying the chitosan solution as above.
2.2 Accelerated salt crystallization procedure Preliminary tests were carried out to set-up an accelerated procedure able to artifi-cially deteriorate the selected stone, without causing an excessive and unrealistic damage. Based on those results, five stone cylinders per treatment were subjected to 5 salt crystallization cycles, each composed of: 1) capillary absorption of a 10 wt% Na2SO4·10H2O solution for 24 hours (the cylinders were partially immersed in the solution for a height of 1 cm); 2) drying in ventilated oven at 50 °C for 22 hours; 3) cooling in laboratory conditions for 2 hours.
2.3 Characterization techniques To evaluate the effectiveness and compatibility of the treatments, different charac-terization techniques were used, comparing treated and untreated (UT) samples. The sample mass was measured before and after the treatments (at the end of the curing/drying period) to evaluate the product uptake. Dynamic elastic modulus (Ed) was determined by ultrasonic pulse velocity test across the height of the cylinders by a Matest instrument (55 kHz transducers, rubber couplant). Scanning electron microscopy (SEM) was also used to observe the upper surface of the cylindrical samples after the treatments, using a Philips XL20. Mercury intrusion porosimetry (MIP) was carried out on fragments collected from the treated and untreated sam-ples, in a Fisons Macropore Unit 120 and a Porosimeter 2000 Carlo Erba.
The sample resistance to salt crystallization was investigated by visual observation and by measuring the sample weight loss after each cycle. In particular, at the end of each drying phase, samples were gently brushed to remove efflorescence and debris, then weighed. Fragments of about 1 g were collected from the stone cylin-ders after the end of the last salt crystallization cycle (after drying and gentle brush-ing), in order to determine their salt amount. In particular, the fragments were col-lected at the center of the top surface of the cylinders, excluding the very external layer (1-2 mm), possibly characterized by surface efflorescence. After grinding the samples, putting them in deionized boiling water for 10 minutes and filtering them by blue ribbon filter paper, the filtered solution was analyzed by ion exchange chro-matography (IC) in a Dionex ICS 1000, to determine the anions content.
235
5th International SWBSS conference – Delft 2021
3 RESULTS AND DISCUSSION
3.1 Effects of the treatments The mass increase and Ed variation of the samples after the treatments are reported in Table 1. All the treatments caused a very slight weight decrease, probably due to the dissolution of the small amount of salts originally present in the stone. The only exception was treatment 1D, which produced a slight mass increase due to its higher concentration. However, the mass variations were almost negligible in all the treatments, as expected due to their low concentration. This reflects in a basi-cally negligible variation of the pores size distribution and total porosity of the samples following the treatments (Figure 1), hence all of them can be considered compatible from a microstructural point of view. All the treatments caused a slight increase in Ed (Table 1), likely due to some positive effect of the very thin coating deposited on the pores surface, enhancing the ultrasonic pulse wave transmission.
The morphology of the surface of the treated stone samples is reported in Figure 2, where it is possible to observe: the continuous layer of calcium phosphate phases produced by the 1 M DAP solutions, although some local cracks are present due to the relatively high concentration of the solution (Figure 2 a); 2) the presence of an extremely thin chitosan layer, although apparently not continuous (Figure 2 b); 3) some cumuli ascribed to the chitosan layer (Figure 2 c).
Treatment Dynamic elastic modulus Weight uptake [%]
Before treatment (GPa) Increase [%] 0.1D 16.26 (± 0.25) 0.43 (± 0.82) -0.13 (± 0.01)
1D 16.20 (± 0.23) 3.15 (± 1.07) +0.22 (± 0.05)
0.05C 16.34 (± 0.17) 3.34 (± 1.72) -0.44 (± 0.03)
0.1C 16.24 (± 0.15) 4.60 (± 1.05) -0.42 (± 0.02)
0.2C 16.28 (± 0.17) 4.04 (± 0.97) -0.43 (± 0.03)
0.1D + 0.05C 16.30 (± 0.34) 4.06 (± 0.90) -0.35 (± 0.03)
1D + 0.05C 16.15 (± 0.29) 2.45 (± 1.00) -0.07 (± 0.05)
0.1D + 0.1C 16.22 (± 0.15) 4.04 (± 0.97) -0.38 (± 0.05)
0.1D + 0.2C 16.43 (± 0.25) 4.65 (± 1.70) -0.39 (± 0.01)
Table 1: Variations in the Ed and weight of the samples following the treatments based on DAP and chitosan at different concentrations (standard deviations in brackets).
236
E. Franzoni, E. Sassoni, and C. Marrone
5th International SWBSS conference – Delft 2021
Figure 1: Pore size distribution and total porosity of the untreated (UT) and treated samples.
a) b) c)
Figure 2: SEM images of: a) sample 1D; b) sample 0.2C; c) sample 0.1D+0.2C solution (marker 20 µm).
3.2 Resistance to salt crystallization The weight of the samples at the end of each salt crystallization cycle (dry condi-tions) is reported in Figure 3, together with the final value for all the samples. The weight variation of the stone during the cycles is the product of the progressive absorption of sulfate (weight increase) and the detachment of stone fragments ow-ing to the disruptive action of the salt (weight decrease). In fact, after an initial weight increase in the first cycles, where salt accumulation is dominant, the sam-ples start to exhibit a marked decrease. However, while in UT samples this decrease starts from the third cycle, all the treatments cause a delay in the damage start (cycle #4), which is to be considered quite significant given the aggressiveness of the test used. Moreover, while samples treated with chitosan experience only a delay in the damage start, both D and D+C samples also exhibit a smaller weight loss at the end of the 5th cycle with respect to UT samples. In the samples treated with 1D alone or in combination with chitosan (1D+0.05C), the final weight is even higher than the beginning one. These results highlight a positive effect of all the treatments in the mitigation of sulfate damage.
237
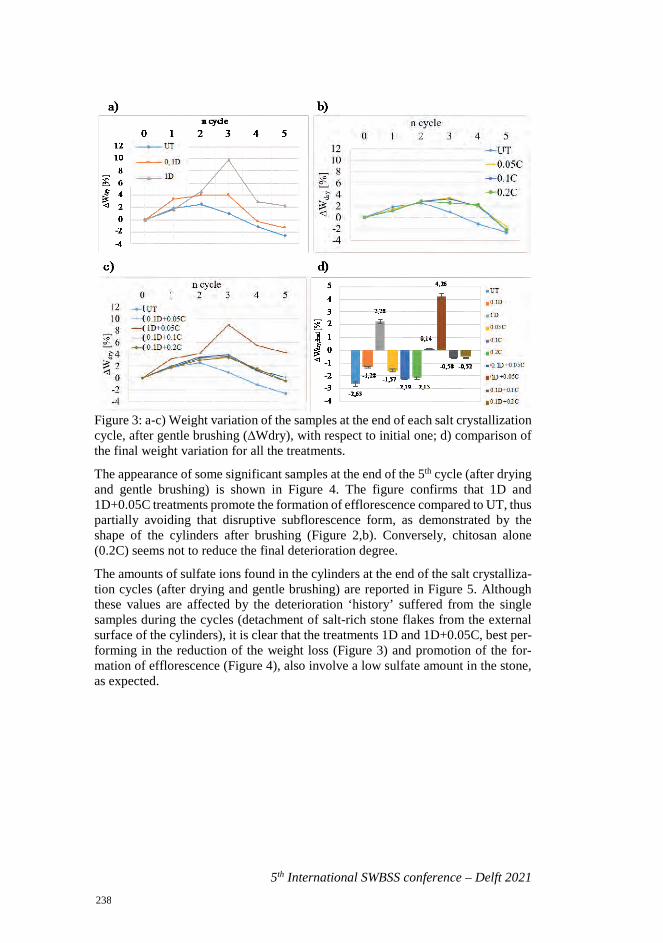
5th International SWBSS conference – Delft 2021
Figure 3: a-c) Weight variation of the samples at the end of each salt crystallization cycle, after gentle brushing (∆Wdry), with respect to initial one; d) comparison of the final weight variation for all the treatments.
The appearance of some significant samples at the end of the 5th cycle (after drying and gentle brushing) is shown in Figure 4. The figure confirms that 1D and 1D+0.05C treatments promote the formation of efflorescence compared to UT, thus partially avoiding that disruptive subflorescence form, as demonstrated by the shape of the cylinders after brushing (Figure 2,b). Conversely, chitosan alone (0.2C) seems not to reduce the final deterioration degree.
The amounts of sulfate ions found in the cylinders at the end of the salt crystalliza-tion cycles (after drying and gentle brushing) are reported in Figure 5. Although these values are affected by the deterioration ‘history’ suffered from the single samples during the cycles (detachment of salt-rich stone flakes from the external surface of the cylinders), it is clear that the treatments 1D and 1D+0.05C, best per-forming in the reduction of the weight loss (Figure 3) and promotion of the for-mation of efflorescence (Figure 4), also involve a low sulfate amount in the stone, as expected.
238
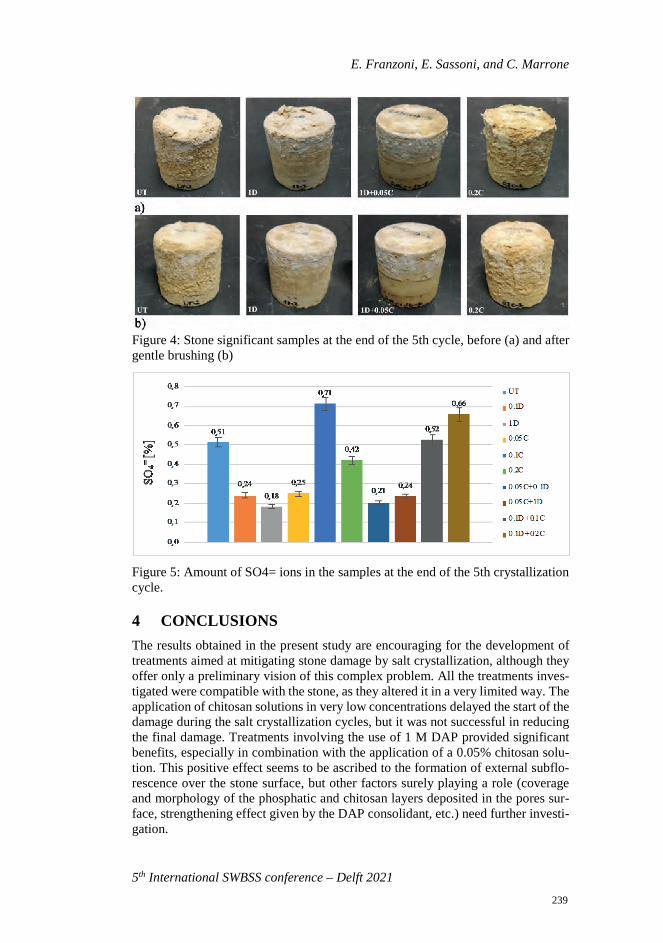
E. Franzoni, E. Sassoni, and C. Marrone
5th International SWBSS conference – Delft 2021
Figure 4: Stone significant samples at the end of the 5th cycle, before (a) and after gentle brushing (b)
Figure 5: Amount of SO4= ions in the samples at the end of the 5th crystallization cycle.
4 CONCLUSIONS The results obtained in the present study are encouraging for the development of treatments aimed at mitigating stone damage by salt crystallization, although they offer only a preliminary vision of this complex problem. All the treatments inves-tigated were compatible with the stone, as they altered it in a very limited way. The application of chitosan solutions in very low concentrations delayed the start of the damage during the salt crystallization cycles, but it was not successful in reducing the final damage. Treatments involving the use of 1 M DAP provided significant benefits, especially in combination with the application of a 0.05% chitosan solu-tion. This positive effect seems to be ascribed to the formation of external subflo-rescence over the stone surface, but other factors surely playing a role (coverage and morphology of the phosphatic and chitosan layers deposited in the pores sur-face, strengthening effect given by the DAP consolidant, etc.) need further investi-gation.
239
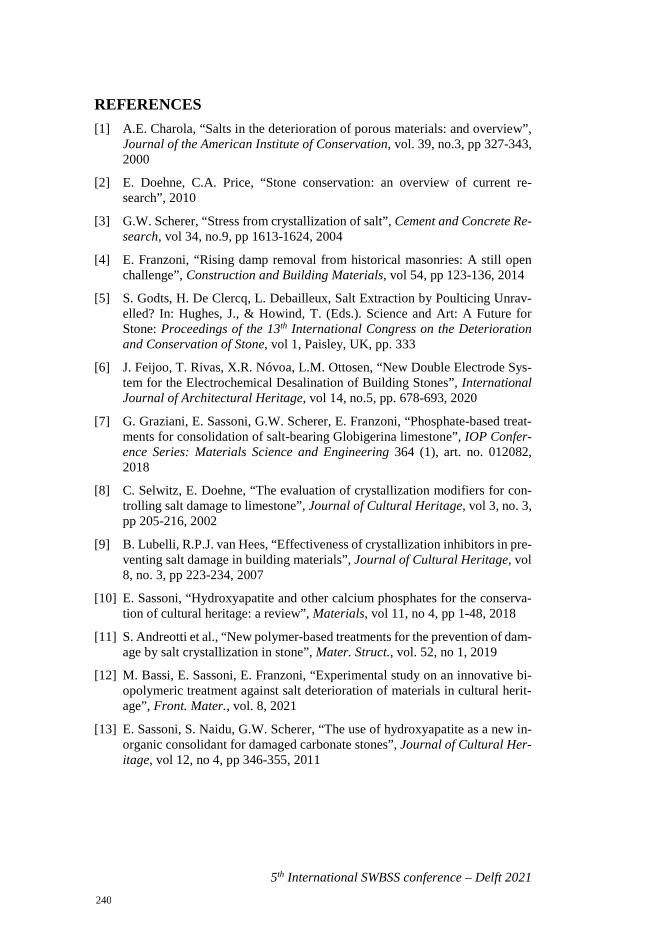
5th International SWBSS conference – Delft 2021
REFERENCES [1] A.E. Charola, “Salts in the deterioration of porous materials: and overview”,
Journal of the American Institute of Conservation, vol. 39, no.3, pp 327-343,2000
[2] E. Doehne, C.A. Price, “Stone conservation: an overview of current re-search”, 2010
[3] G.W. Scherer, “Stress from crystallization of salt”, Cement and Concrete Re-search, vol 34, no.9, pp 1613-1624, 2004
[4] E. Franzoni, “Rising damp removal from historical masonries: A still openchallenge”, Construction and Building Materials, vol 54, pp 123-136, 2014
[5] S. Godts, H. De Clercq, L. Debailleux, Salt Extraction by Poulticing Unrav-elled? In: Hughes, J., & Howind, T. (Eds.). Science and Art: A Future forStone: Proceedings of the 13th International Congress on the Deteriorationand Conservation of Stone, vol 1, Paisley, UK, pp. 333
[6] J. Feijoo, T. Rivas, X.R. Nóvoa, L.M. Ottosen, “New Double Electrode Sys-tem for the Electrochemical Desalination of Building Stones”, InternationalJournal of Architectural Heritage, vol 14, no.5, pp. 678-693, 2020
[7] G. Graziani, E. Sassoni, G.W. Scherer, E. Franzoni, “Phosphate-based treat-ments for consolidation of salt-bearing Globigerina limestone”, IOP Confer-ence Series: Materials Science and Engineering 364 (1), art. no. 012082,2018
[8] C. Selwitz, E. Doehne, “The evaluation of crystallization modifiers for con-trolling salt damage to limestone”, Journal of Cultural Heritage, vol 3, no. 3,pp 205-216, 2002
[9] B. Lubelli, R.P.J. van Hees, “Effectiveness of crystallization inhibitors in pre-venting salt damage in building materials”, Journal of Cultural Heritage, vol8, no. 3, pp 223-234, 2007
[10] E. Sassoni, “Hydroxyapatite and other calcium phosphates for the conserva-tion of cultural heritage: a review”, Materials, vol 11, no 4, pp 1-48, 2018
[11] S. Andreotti et al., “New polymer-based treatments for the prevention of dam-age by salt crystallization in stone”, Mater. Struct., vol. 52, no 1, 2019
[12] M. Bassi, E. Sassoni, E. Franzoni, “Experimental study on an innovative bi-opolymeric treatment against salt deterioration of materials in cultural herit-age”, Front. Mater., vol. 8, 2021
[13] E. Sassoni, S. Naidu, G.W. Scherer, “The use of hydroxyapatite as a new in-organic consolidant for damaged carbonate stones”, Journal of Cultural Her-itage, vol 12, no 4, pp 346-355, 2011
240
5th International SWBSS conference – Delft 2021
ELECTRO-OSMOSIS AND CAPILLARY SUCTION
Nasser Eslami1*, Jorge Feijoo2, Juan M. Paz-Garcia3, Elisa Franzoni4, and Lisbeth M. Ottosen1
KEYWORDS Electro-osmosis, zeta potential, water content, bricks, capillary suction
ABSTRACT Dampness in masonries is a major problem in many buildings and monuments worldwide. Techniques based on electro-osmosis have been proposed as conservation methods to dehumidify masonry subjected to capillary suction. Although electroosmotic techniques have been applied for decades, the effect is still debated. This paper reports an experimental investigation on electro-osmosis in single bricks in a laboratory setup originally designed for electro-desalination. Two types of bricks were used. The samples had different lengths and different initial water content. A poultice composition was designed with neglectable electroosmotic effect and effective buffering of the acid produced from the electrode process at the anode. Four poultices with different concentrations of CaCO3 and kaolinite were examined, and the poultice consisting of calcium carbonate:kaolinite:water with the ratio of 40:10:50 (wt%) fulfilled the requirement. It was seen that more the kaolinite in the mixture, more the electro-osmosis. A constant voltage of 75V was applied to the electrodes in each end of the setup. The zeta potential of the bricks was comparable to the zeta potential in kaolinite, and thus electro-osmosis in the bricks was expected. However, the water content reached saturation all through the brick specimens in every experiment, and there was no difference in water content in the two poultices. Thus, the capillary forces causing water suction into the bricks from the poultices were the strongest and overshadowed the possible electroosmotic effect. Therefore, this work shows that capillary forces need to be taken into account when designing setups for evaluation of electro-osmosis in materials with strong capillarity. The same is valid for in real applications, in case a continuous source of water is present.
1 Dept. Civil Engineering, Technical University of Denmark, (Denmark)
[email protected] 2 Defense University Centre, Spanish Naval Academy (Spain) 3 Dept. Chemical Engineering, University of Malaga (Spain) 4 Dept. Civil Engineering, University of Bologna (Italy)
241
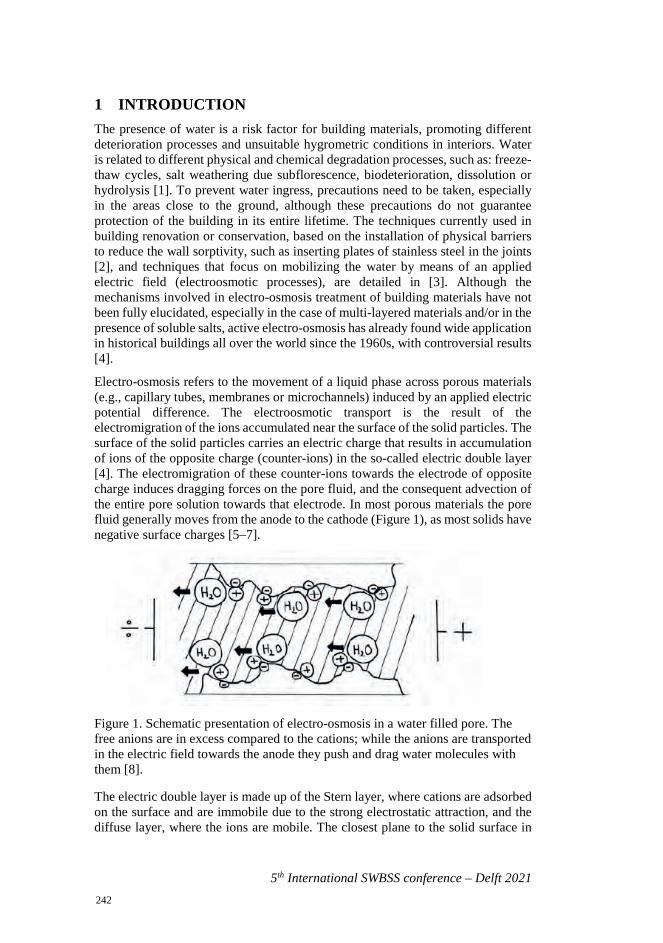
5th International SWBSS conference – Delft 2021
1 INTRODUCTION The presence of water is a risk factor for building materials, promoting different deterioration processes and unsuitable hygrometric conditions in interiors. Water is related to different physical and chemical degradation processes, such as: freeze-thaw cycles, salt weathering due subflorescence, biodeterioration, dissolution or hydrolysis [1]. To prevent water ingress, precautions need to be taken, especially in the areas close to the ground, although these precautions do not guarantee protection of the building in its entire lifetime. The techniques currently used in building renovation or conservation, based on the installation of physical barriers to reduce the wall sorptivity, such as inserting plates of stainless steel in the joints [2], and techniques that focus on mobilizing the water by means of an applied electric field (electroosmotic processes), are detailed in [3]. Although the mechanisms involved in electro-osmosis treatment of building materials have not been fully elucidated, especially in the case of multi-layered materials and/or in the presence of soluble salts, active electro-osmosis has already found wide application in historical buildings all over the world since the 1960s, with controversial results [4].
Electro-osmosis refers to the movement of a liquid phase across porous materials (e.g., capillary tubes, membranes or microchannels) induced by an applied electric potential difference. The electroosmotic transport is the result of the electromigration of the ions accumulated near the surface of the solid particles. The surface of the solid particles carries an electric charge that results in accumulation of ions of the opposite charge (counter-ions) in the so-called electric double layer [4]. The electromigration of these counter-ions towards the electrode of opposite charge induces dragging forces on the pore fluid, and the consequent advection of the entire pore solution towards that electrode. In most porous materials the pore fluid generally moves from the anode to the cathode (Figure 1), as most solids have negative surface charges [5–7].
Figure 1. Schematic presentation of electro-osmosis in a water filled pore. The free anions are in excess compared to the cations; while the anions are transported in the electric field towards the anode they push and drag water molecules with them [8].
The electric double layer is made up of the Stern layer, where cations are adsorbed on the surface and are immobile due to the strong electrostatic attraction, and the diffuse layer, where the ions are mobile. The closest plane to the solid surface in
242
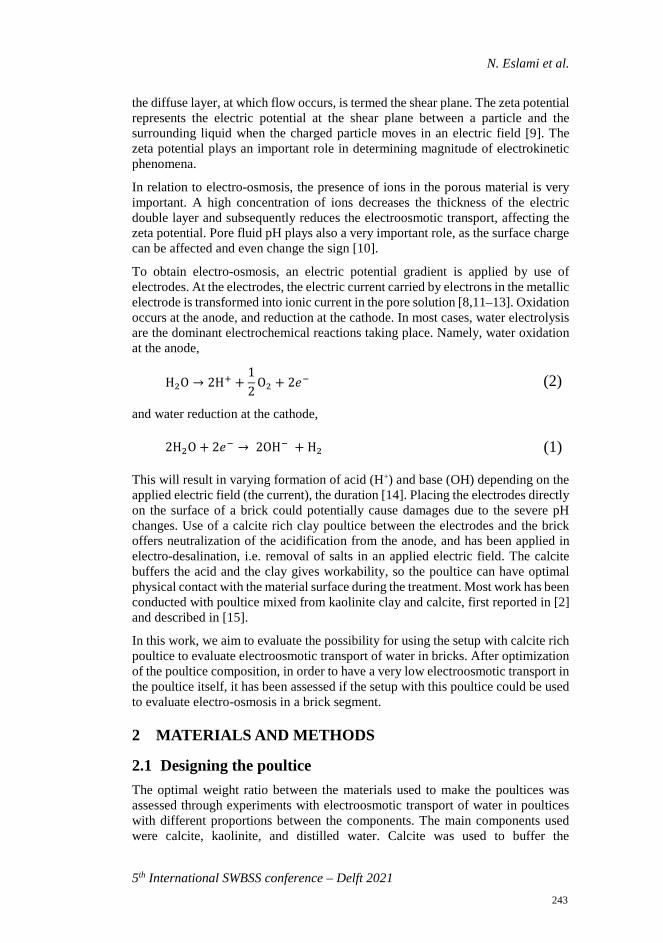
N. Eslami et al.
5th International SWBSS conference – Delft 2021
the diffuse layer, at which flow occurs, is termed the shear plane. The zeta potential represents the electric potential at the shear plane between a particle and the surrounding liquid when the charged particle moves in an electric field [9]. The zeta potential plays an important role in determining magnitude of electrokinetic phenomena.
In relation to electro-osmosis, the presence of ions in the porous material is very important. A high concentration of ions decreases the thickness of the electric double layer and subsequently reduces the electroosmotic transport, affecting the zeta potential. Pore fluid pH plays also a very important role, as the surface charge can be affected and even change the sign [10].
To obtain electro-osmosis, an electric potential gradient is applied by use of electrodes. At the electrodes, the electric current carried by electrons in the metallic electrode is transformed into ionic current in the pore solution [8,11–13]. Oxidation occurs at the anode, and reduction at the cathode. In most cases, water electrolysis are the dominant electrochemical reactions taking place. Namely, water oxidation at the anode,
H2O → 2H+ +12
O2 + 2𝑒𝑒− (2)
and water reduction at the cathode,
2H2O + 2𝑒𝑒− → 2OH− + H2 (1)
This will result in varying formation of acid (H+) and base (OH) depending on the applied electric field (the current), the duration [14]. Placing the electrodes directly on the surface of a brick could potentially cause damages due to the severe pH changes. Use of a calcite rich clay poultice between the electrodes and the brick offers neutralization of the acidification from the anode, and has been applied in electro-desalination, i.e. removal of salts in an applied electric field. The calcite buffers the acid and the clay gives workability, so the poultice can have optimal physical contact with the material surface during the treatment. Most work has been conducted with poultice mixed from kaolinite clay and calcite, first reported in [2] and described in [15].
In this work, we aim to evaluate the possibility for using the setup with calcite rich poultice to evaluate electroosmotic transport of water in bricks. After optimization of the poultice composition, in order to have a very low electroosmotic transport in the poultice itself, it has been assessed if the setup with this poultice could be used to evaluate electro-osmosis in a brick segment.
2 MATERIALS AND METHODS
2.1 Designing the poultice The optimal weight ratio between the materials used to make the poultices was assessed through experiments with electroosmotic transport of water in poultices with different proportions between the components. The main components used were calcite, kaolinite, and distilled water. Calcite was used to buffer the
243
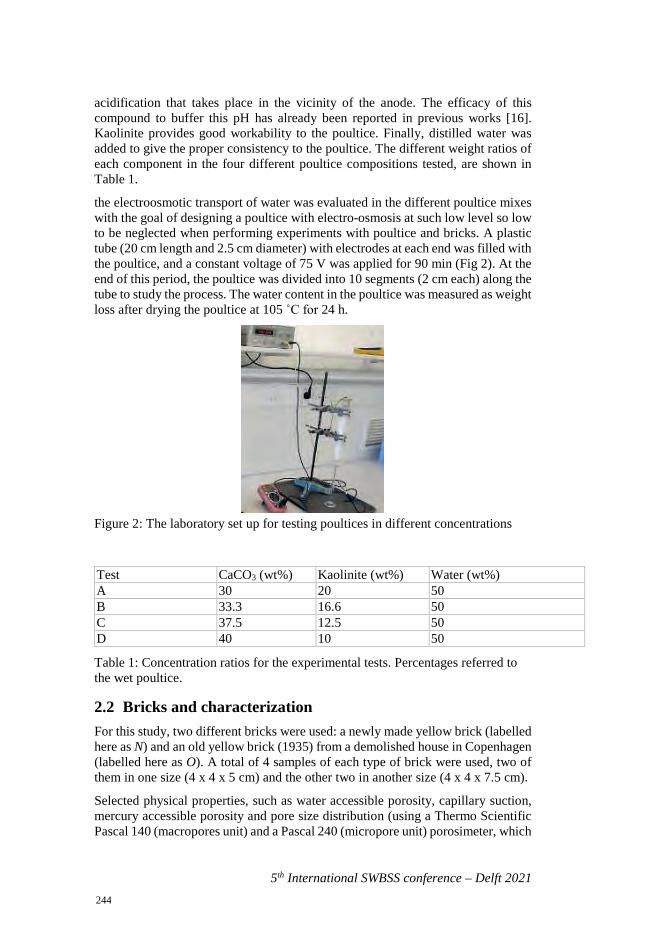
5th International SWBSS conference – Delft 2021
acidification that takes place in the vicinity of the anode. The efficacy of this compound to buffer this pH has already been reported in previous works [16]. Kaolinite provides good workability to the poultice. Finally, distilled water was added to give the proper consistency to the poultice. The different weight ratios of each component in the four different poultice compositions tested, are shown in Table 1.
the electroosmotic transport of water was evaluated in the different poultice mixes with the goal of designing a poultice with electro-osmosis at such low level so low to be neglected when performing experiments with poultice and bricks. A plastic tube (20 cm length and 2.5 cm diameter) with electrodes at each end was filled with the poultice, and a constant voltage of 75 V was applied for 90 min (Fig 2). At the end of this period, the poultice was divided into 10 segments (2 cm each) along the tube to study the process. The water content in the poultice was measured as weight loss after drying the poultice at 105 ˚C for 24 h.
Figure 2: The laboratory set up for testing poultices in different concentrations
Test CaCO3 (wt%) Kaolinite (wt%) Water (wt%) A 30 20 50 B 33.3 16.6 50 C 37.5 12.5 50 D 40 10 50
Table 1: Concentration ratios for the experimental tests. Percentages referred to the wet poultice.
2.2 Bricks and characterization For this study, two different bricks were used: a newly made yellow brick (labelled here as N) and an old yellow brick (1935) from a demolished house in Copenhagen (labelled here as O). A total of 4 samples of each type of brick were used, two of them in one size (4 x 4 x 5 cm) and the other two in another size (4 x 4 x 7.5 cm).
Selected physical properties, such as water accessible porosity, capillary suction, mercury accessible porosity and pore size distribution (using a Thermo Scientific Pascal 140 (macropores unit) and a Pascal 240 (micropore unit) porosimeter, which
244
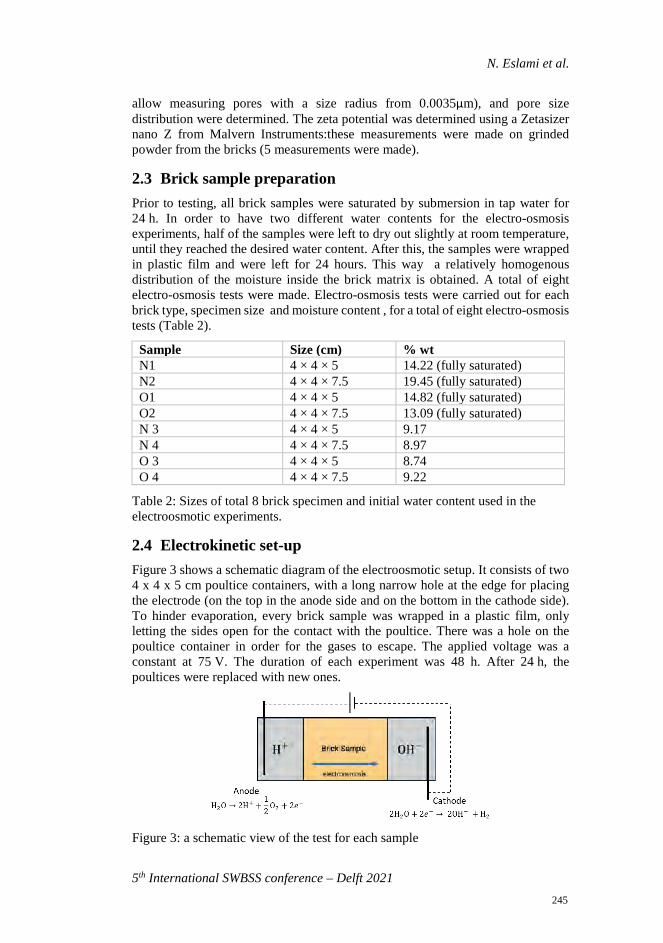
N. Eslami et al.
5th International SWBSS conference – Delft 2021
allow measuring pores with a size radius from 0.0035µm), and pore size distribution were determined. The zeta potential was determined using a Zetasizer nano Z from Malvern Instruments:these measurements were made on grinded powder from the bricks (5 measurements were made).
2.3 Brick sample preparation Prior to testing, all brick samples were saturated by submersion in tap water for 24 h. In order to have two different water contents for the electro-osmosis experiments, half of the samples were left to dry out slightly at room temperature, until they reached the desired water content. After this, the samples were wrapped in plastic film and were left for 24 hours. This way a relatively homogenous distribution of the moisture inside the brick matrix is obtained. A total of eight electro-osmosis tests were made. Electro-osmosis tests were carried out for each brick type, specimen size and moisture content , for a total of eight electro-osmosis tests (Table 2).
Sample Size (cm) % wt N1 4 × 4 × 5 14.22 (fully saturated) N2 4 × 4 × 7.5 19.45 (fully saturated) O1 4 × 4 × 5 14.82 (fully saturated) O2 4 × 4 × 7.5 13.09 (fully saturated) N 3 4 × 4 × 5 9.17 N 4 4 × 4 × 7.5 8.97 O 3 4 × 4 × 5 8.74 O 4 4 × 4 × 7.5 9.22
Table 2: Sizes of total 8 brick specimen and initial water content used in the electroosmotic experiments.
2.4 Electrokinetic set-up Figure 3 shows a schematic diagram of the electroosmotic setup. It consists of two 4 x 4 x 5 cm poultice containers, with a long narrow hole at the edge for placing the electrode (on the top in the anode side and on the bottom in the cathode side). To hinder evaporation, every brick sample was wrapped in a plastic film, only letting the sides open for the contact with the poultice. There was a hole on the poultice container in order for the gases to escape. The applied voltage was a constant at 75 V. The duration of each experiment was 48 h. After 24 h, the poultices were replaced with new ones.
Figure 3: a schematic view of the test for each sample
245
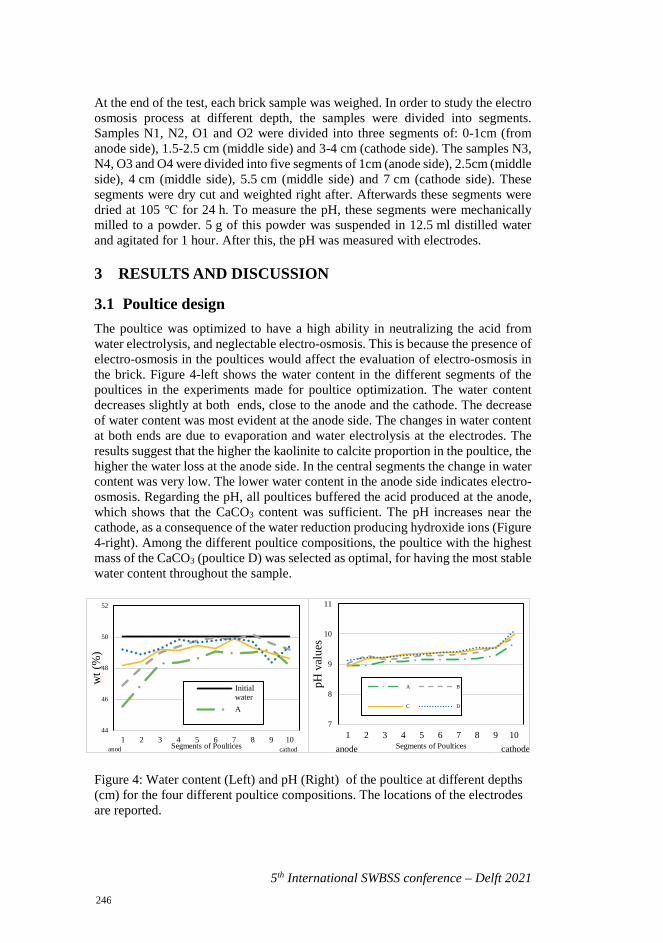
5th International SWBSS conference – Delft 2021
At the end of the test, each brick sample was weighed. In order to study the electro osmosis process at different depth, the samples were divided into segments. Samples N1, N2, O1 and O2 were divided into three segments of: 0-1cm (from anode side), 1.5-2.5 cm (middle side) and 3-4 cm (cathode side). The samples N3, N4, O3 and O4 were divided into five segments of 1cm (anode side), 2.5cm (middle side), 4 cm (middle side), 5.5 cm (middle side) and 7 cm (cathode side). These segments were dry cut and weighted right after. Afterwards these segments were dried at 105 ℃ for 24 h. To measure the pH, these segments were mechanically milled to a powder. 5 g of this powder was suspended in 12.5 ml distilled water and agitated for 1 hour. After this, the pH was measured with electrodes.
3 RESULTS AND DISCUSSION
3.1 Poultice design The poultice was optimized to have a high ability in neutralizing the acid from water electrolysis, and neglectable electro-osmosis. This is because the presence of electro-osmosis in the poultices would affect the evaluation of electro-osmosis in the brick. Figure 4-left shows the water content in the different segments of the poultices in the experiments made for poultice optimization. The water content decreases slightly at both ends, close to the anode and the cathode. The decrease of water content was most evident at the anode side. The changes in water content at both ends are due to evaporation and water electrolysis at the electrodes. The results suggest that the higher the kaolinite to calcite proportion in the poultice, the higher the water loss at the anode side. In the central segments the change in water content was very low. The lower water content in the anode side indicates electro-osmosis. Regarding the pH, all poultices buffered the acid produced at the anode, which shows that the CaCO3 content was sufficient. The pH increases near the cathode, as a consequence of the water reduction producing hydroxide ions (Figure 4-right). Among the different poultice compositions, the poultice with the highest mass of the CaCO3 (poultice D) was selected as optimal, for having the most stable water content throughout the sample.
Figure 4: Water content (Left) and pH (Right) of the poultice at different depths (cm) for the four different poultice compositions. The locations of the electrodes are reported.
7
8
9
10
11
1 2 3 4 5 6 7 8 9 10
pH v
alue
s
Segments of Poultices
A B
C D
anode cathode
44
46
48
50
52
1 2 3 4 5 6 7 8 9 10
wt(
%)
Segments of Poultices
InitialwaterA
cathodanod
246
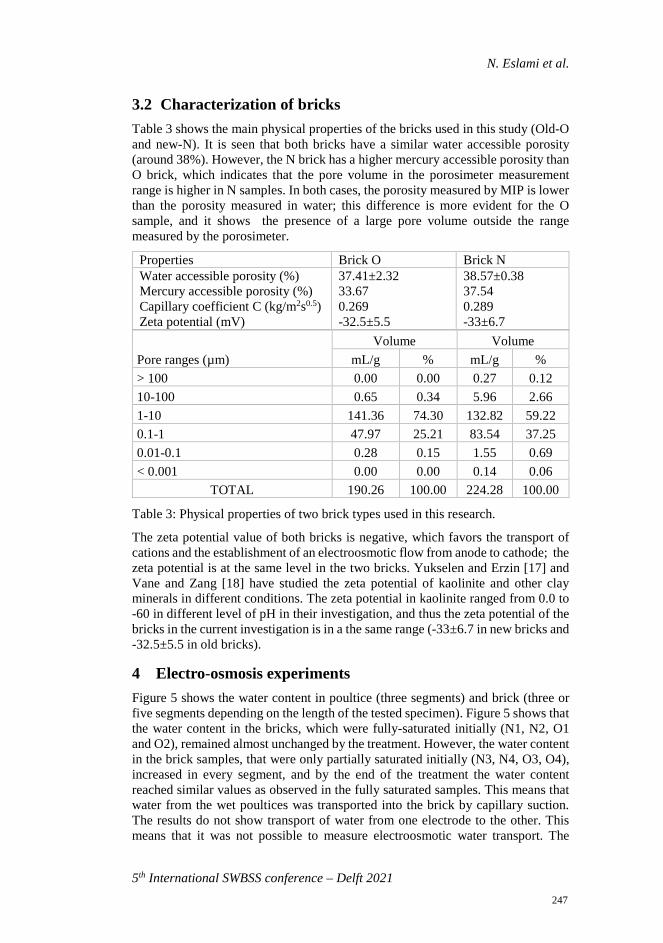
N. Eslami et al.
5th International SWBSS conference – Delft 2021
3.2 Characterization of bricks Table 3 shows the main physical properties of the bricks used in this study (Old-O and new-N). It is seen that both bricks have a similar water accessible porosity (around 38%). However, the N brick has a higher mercury accessible porosity than O brick, which indicates that the pore volume in the porosimeter measurement range is higher in N samples. In both cases, the porosity measured by MIP is lower than the porosity measured in water; this difference is more evident for the O sample, and it shows the presence of a large pore volume outside the range measured by the porosimeter.
Properties Brick O Brick N Water accessible porosity (%) Mercury accessible porosity (%) Capillary coefficient C (kg/m2s0.5) Zeta potential (mV)
37.41±2.32 33.67 0.269 -32.5±5.5
38.57±0.38 37.54 0.289 -33±6.7
Pore ranges (µm) Volume Volume
mL/g % mL/g % > 100 0.00 0.00 0.27 0.12 10-100 0.65 0.34 5.96 2.66 1-10 141.36 74.30 132.82 59.22 0.1-1 47.97 25.21 83.54 37.25 0.01-0.1 0.28 0.15 1.55 0.69 < 0.001 0.00 0.00 0.14 0.06
TOTAL 190.26 100.00 224.28 100.00
Table 3: Physical properties of two brick types used in this research.
The zeta potential value of both bricks is negative, which favors the transport of cations and the establishment of an electroosmotic flow from anode to cathode; the zeta potential is at the same level in the two bricks. Yukselen and Erzin [17] and Vane and Zang [18] have studied the zeta potential of kaolinite and other clay minerals in different conditions. The zeta potential in kaolinite ranged from 0.0 to -60 in different level of pH in their investigation, and thus the zeta potential of the bricks in the current investigation is in a the same range (-33±6.7 in new bricks and -32.5±5.5 in old bricks).
4 Electro-osmosis experiments Figure 5 shows the water content in poultice (three segments) and brick (three or five segments depending on the length of the tested specimen). Figure 5 shows that the water content in the bricks, which were fully-saturated initially (N1, N2, O1 and O2), remained almost unchanged by the treatment. However, the water content in the brick samples, that were only partially saturated initially (N3, N4, O3, O4), increased in every segment, and by the end of the treatment the water content reached similar values as observed in the fully saturated samples. This means that water from the wet poultices was transported into the brick by capillary suction. The results do not show transport of water from one electrode to the other. This means that it was not possible to measure electroosmotic water transport. The
247
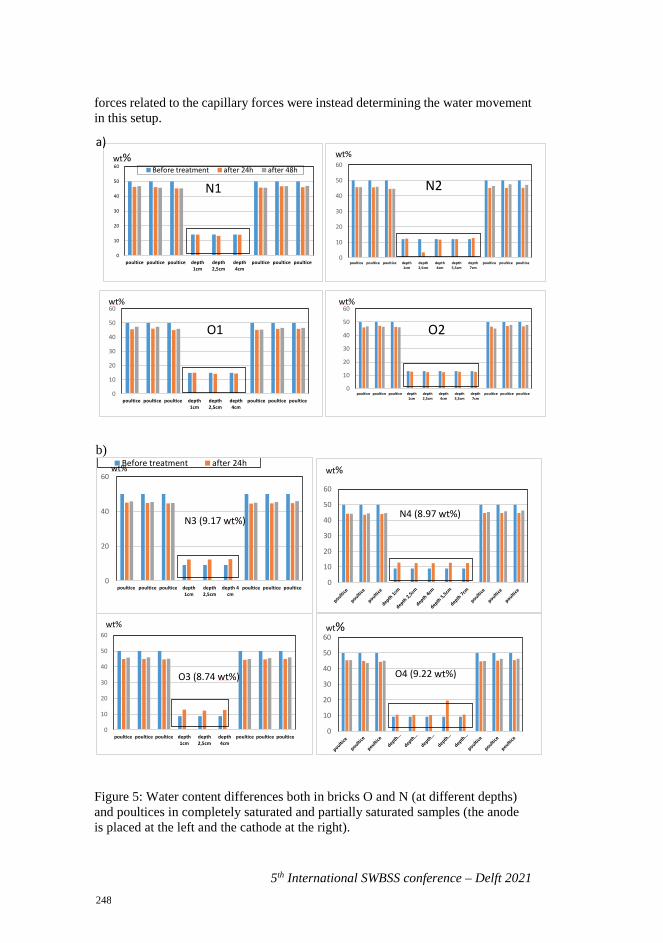
5th International SWBSS conference – Delft 2021
0
10
20
30
40
50
60
poultice poultice poultice depth1cm
depth2,5cm
depth4cm
poultice poultice poultice
N1Before treatment after 24h after 48h
wt%
0
10
20
30
40
50
60
poultice poultice poultice depth1cm
depth2,5cm
depth4cm
depth5,5cm
depth7cm
poultice poultice poultice
N2
wt%
0
10
20
30
40
50
60
poultice poultice poultice depth1cm
depth2,5cm
depth4cm
poultice poultice poultice
O1
wt%
0
10
20
30
40
50
60
poultice poultice poultice depth1cm
depth2,5cm
depth4cm
depth5,5cm
depth7cm
poultice poultice poultice
O2
wt%
forces related to the capillary forces were instead determining the water movement in this setup.
a)
b)
Figure 5: Water content differences both in bricks O and N (at different depths) and poultices in completely saturated and partially saturated samples (the anode is placed at the left and the cathode at the right).
0
20
40
60
poultice poultice poultice depth1cm
depth2,5cm
depth 4cm
poultice poultice poultice
N3 (9.17 wt%)
Before treatment after 24hwt%
0
10
20
30
40
50
60
N4 (8.97 wt%)
wt%
0
10
20
30
40
50
60
poultice poultice poultice depth1cm
depth2,5cm
depth4cm
poultice poultice poultice
O3 (8.74 wt%)
wt%
0
10
20
30
40
50
60
O4 (9.22 wt%)
wt%
248
N. Eslami et al.
5th International SWBSS conference – Delft 2021
4 CONCLUSION In this work, a setup with poultice at the electrodes was tested to assess electro-osmosis in brick specimens. First different poultice compositions were tested. A poultice consisting of calcium carbonate:kaolinite:water with ratio of 40:10:50 (wt%) respectively was chosen, as very little electroosmotic transport of water was seen experimentally in this poultice. Two types of bricks were used in the experiments, new from the factory and a brick from about 1935 from a demolished house. Electro-osmosis might be obtainable in both the bricks, since the zeta potential was in a range of -33±6.7 in new bricks and -32.5±5.5 in old bricks. Electroosmotic tests with two different types of bricks, sizes and initial water contents were made, in the setup with poultice between the electrodes and the brick. It was found that the capillary forces in the brick were dominant compared to the electroosmotic effect. Water was sucked into the brick specimens from the poultices, and the bricks were all water saturated at the end of the experiments. The results show, that in case of free access to water, the capillary forces in the brick are stronger than the electroosmotic effect under the conditions of these experiments.
REFERENCES [1] L. Bertolini, L. Coppola, M. Gastaldi, E. Redaelli, "Electroosmotic transport
in porous construction materials and dehumidification of masonry", Constr. Build. Mater., vol. 23, pp. 254–263, 2009.
[2] L.M. Ottosen, A.J. Pedersen, I. Rörig-Dalgaard, "Salt-related problems in brick masonry and electrokinetic removal of salts", J. Build. Apprais., vol. 3, pp. 181–194, 2007.
[3] E. Franzoni, "Rising damp removal from historical masonries: A still open challenge", Constr. Build. Mater., vol. 54, 2014.
[4] J.M. Paz-Garcia, B. Johannesson, L.M. Ottosen, A.B. Ribeiro, J.M. Rodriguez-Maroto, "Modeling of electric double-layers including chemical reaction effects", Electrochim. Acta., vol. 150, pp. 263–268, 2014.
[5] K. Beddiar, T. Fen-Chong, A. Dupas, Y. Berthaud, P. Dangla," Role of pH in electro-osmosis: Experimental study on NaCl-water saturated kaolinite", Transp. Porous Media., vol. 61, 2005.
[6] A.N. Alshawabkeh, "Electrokinetic soil remediation: Challenges and opportunities", Sep. Sci. Technol., vol. 44, pp. 2171–2187, 2009.
[7] S.T. Auriault J.L., "On the electro-osmotic flow in a saturated porous medium", Int. J. Eng. Sci., vol. 19, pp. 915–928, 1981.
[8] L.M. Ottosen, I. Rörig-Dalgaard, "Drying brick masonry by electro-osmosis", 7th Int. Mason. Conf., vol. 2, 2006.
[9] J. Yuan, R.J. Pruett, "Zeta potential and related properties of kaolin clays from Georgia", Miner. Metall. Process., vol. 15, pp. 50–52, 1998.
249
5th International SWBSS conference – Delft 2021
[10] G. Kortum, J.O. Bockris, Textbook of Electrochemistry., Science, vol. 120, pp. 1094–1094, 1954.
[11] M. Villen-Guzman, J.M.J.M. Paz-Garcia, J.M.J.M. Rodriguez-Maroto, C. Gomez-Lahoz, F. Garcia-Herruzo, "Acid Enhanced Electrokinetic Remediation of a Contaminated Soil using Constant Current Density: Strong vs. Weak Acid", Sep. Sci. Technol., vol. 49, pp. 1461–1468, 2014.
[12] Y.B. Acar, A.N. Alshawabkeh, "Principles of electrokinetic remediation". Environ. Sci. Technol., vol. 27 pp. 2638–2647, 1993.
[13] J.M. Paz-Garcia, B. Johannesson, L.M. Ottosen, A.N. Alshawabkeh, A.B. Ribeiro, J.M. Rodriguez-Maroto, "Modeling of electrokinetic desalination of bricks", Electrochim. Acta., vol. 86, pp. 213–222, 2012.
[14] L.M. Ottosen, I. Rörig-Dalgaard, A. Villumsen, "Electrochemical removal of salts from masonry - Experiences from pilot scale", in: Salt Weather. Build. Stone Sculpt., 2008, pp. 250–341.
[15] I. Rörig-Dalgaard, "Development of a poultice for electrochemical desalination of porous building materials: Desalination effect and pH changes", Mater. Struct. Constr., vol. 46, pp. 959–970, 2013.
[16] J. Feijoo, X.R. Nóvoa, T. Rivas, L.M. Ottosen, "Enhancing the efficiency of electrochemical desalination of stones: a proton pump approach", Mater. Struct. Constr., vol. 51, 2018.
[17] Y. Yukselen, Y. Erzin, "Artificial neural networks approach for zeta potential of Montmorillonite in the presence of different cations", Environ. Geol., vol. 54, pp. 1059–1066, 2008.
[18] L.M. Vane, G.M. Zang, "Effect of aqueous phase properties on clay particle zeta potential and electro-osmotic permeability: Implications for electro-kinetic soil remediation processes", J. Hazard. Mater., 1997.
250
5th International SWBSS conference – Delft 2021
ELECTROMIGRATION OF K+ AND NO3-
NATURAL STONE AND BRICK UNDER APPLICATION OF A CONSTANT VOLTAGE
Lisbeth M. Ottosen1*
KEYWORDS Electromigration, stone, porosity, salt, side effects
ABSTRACT Transport of ions in an applied electric field (electromigration) can be used in con-servation actions both for removal (electro-desalination) and supply (electro-pre-cipitation) of ions out from or into the substrate. For the further development of these methods, increased understanding of the influence from side effects on the transport of the target ions is necessary. Electromigration has most often been in-vestigated under application of a constant current. In this work, a constant voltage is applied, and it reports a direct comparison of electromigration of K+ and NO3
- through substrates with different porosities. Prisms, one brick and four natural stones, were prepared and contaminated with NaCl in exactly the same way. Elec-tromigration experiments were made under the same applied constant voltage. Dur-ing the first hours, the current was very different between the experiments (from 2.3 to 72 mA), showing major difference in the electrical conductivity of the sub-strates - the higher the porosity, the higher the conductivity (and current). The cur-rent developed differently between the experiments. By the end of the 3 days ex-periments, the current was between 3.4 and 9.2 mA, and independent of the sub-strate porosity. During the experiments, the electrode processes and the connected side effects influenced the electromigration of K+ and NO3
- to different extents in the different substrates, and the most in the substrates with high porosity. The ex-periments underline that the electromigration of target ions depends strongly on the substrate when applying a constant voltage, because the substrate conductivity de-termines the current and thus the side effects. Applying a constant current instead, as in most of the previous works, enables better managing of the side effects.
1 INTRODUCTION Transport of ions into and out from moist porous materials can be obtained when applying a direct current (DC) electric field. The transport mechanism is termed as
1 Department of Civil Engineering, Technical University of Denmark, [email protected]
251
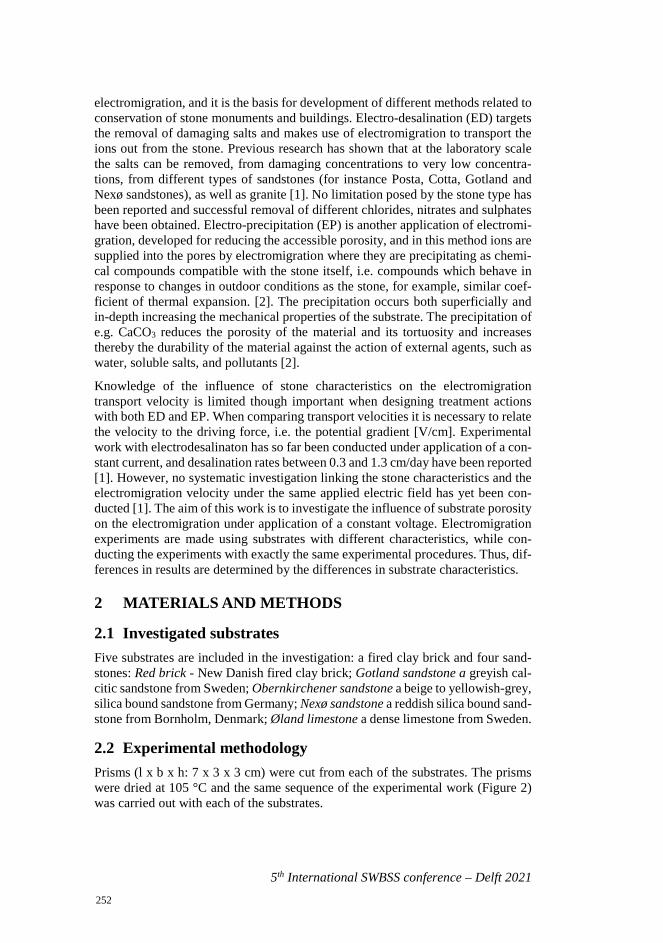
5th International SWBSS conference – Delft 2021
electromigration, and it is the basis for development of different methods related to conservation of stone monuments and buildings. Electro-desalination (ED) targets the removal of damaging salts and makes use of electromigration to transport the ions out from the stone. Previous research has shown that at the laboratory scale the salts can be removed, from damaging concentrations to very low concentra-tions, from different types of sandstones (for instance Posta, Cotta, Gotland and Nexø sandstones), as well as granite [1]. No limitation posed by the stone type has been reported and successful removal of different chlorides, nitrates and sulphates have been obtained. Electro-precipitation (EP) is another application of electromi-gration, developed for reducing the accessible porosity, and in this method ions are supplied into the pores by electromigration where they are precipitating as chemi-cal compounds compatible with the stone itself, i.e. compounds which behave in response to changes in outdoor conditions as the stone, for example, similar coef-ficient of thermal expansion. [2]. The precipitation occurs both superficially and in-depth increasing the mechanical properties of the substrate. The precipitation of e.g. CaCO3 reduces the porosity of the material and its tortuosity and increasesthereby the durability of the material against the action of external agents, such aswater, soluble salts, and pollutants [2].
Knowledge of the influence of stone characteristics on the electromigration transport velocity is limited though important when designing treatment actions with both ED and EP. When comparing transport velocities it is necessary to relate the velocity to the driving force, i.e. the potential gradient [V/cm]. Experimental work with electrodesalinaton has so far been conducted under application of a con-stant current, and desalination rates between 0.3 and 1.3 cm/day have been reported [1]. However, no systematic investigation linking the stone characteristics and the electromigration velocity under the same applied electric field has yet been con-ducted [1]. The aim of this work is to investigate the influence of substrate porosity on the electromigration under application of a constant voltage. Electromigration experiments are made using substrates with different characteristics, while con-ducting the experiments with exactly the same experimental procedures. Thus, dif-ferences in results are determined by the differences in substrate characteristics.
2 MATERIALS AND METHODS
2.1 Investigated substrates Five substrates are included in the investigation: a fired clay brick and four sand-stones: Red brick - New Danish fired clay brick; Gotland sandstone a greyish cal-citic sandstone from Sweden; Obernkirchener sandstone a beige to yellowish-grey, silica bound sandstone from Germany; Nexø sandstone a reddish silica bound sand-stone from Bornholm, Denmark; Øland limestone a dense limestone from Sweden.
2.2 Experimental methodology Prisms (l x b x h: 7 x 3 x 3 cm) were cut from each of the substrates. The prisms were dried at 105 °C and the same sequence of the experimental work (Figure 2) was carried out with each of the substrates.
252
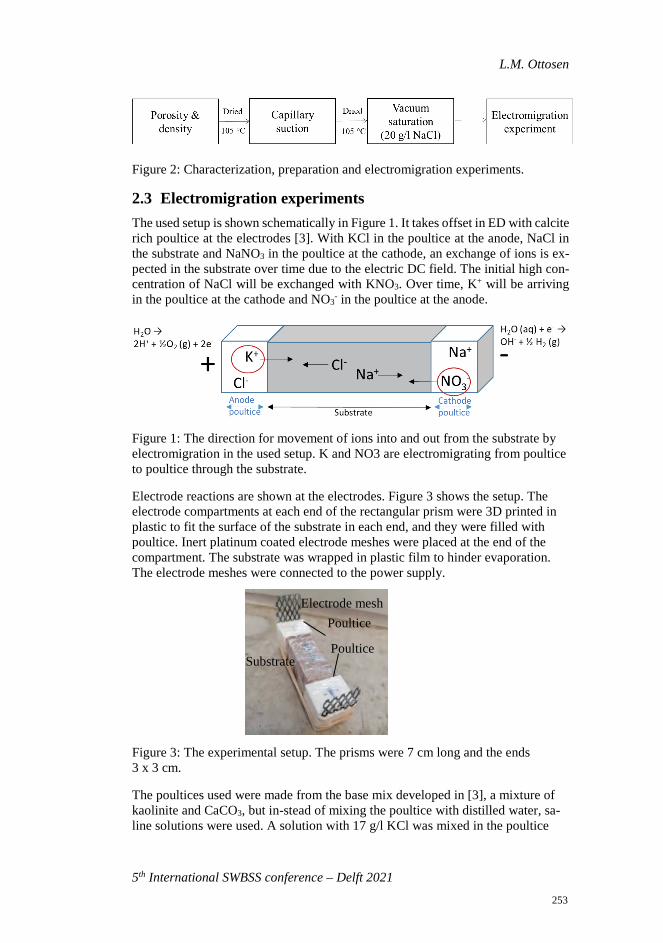
L.M. Ottosen
5th International SWBSS conference – Delft 2021
Figure 2: Characterization, preparation and electromigration experiments.
2.3 Electromigration experiments The used setup is shown schematically in Figure 1. It takes offset in ED with calcite rich poultice at the electrodes [3]. With KCl in the poultice at the anode, NaCl in the substrate and NaNO3 in the poultice at the cathode, an exchange of ions is ex-pected in the substrate over time due to the electric DC field. The initial high con-centration of NaCl will be exchanged with KNO3. Over time, K+ will be arriving in the poultice at the cathode and NO3
- in the poultice at the anode.
Figure 1: The direction for movement of ions into and out from the substrate by electromigration in the used setup. K and NO3 are electromigrating from poultice to poultice through the substrate.
Electrode reactions are shown at the electrodes. Figure 3 shows the setup. The electrode compartments at each end of the rectangular prism were 3D printed in plastic to fit the surface of the substrate in each end, and they were filled with poultice. Inert platinum coated electrode meshes were placed at the end of the compartment. The substrate was wrapped in plastic film to hinder evaporation. The electrode meshes were connected to the power supply.
Figure 3: The experimental setup. The prisms were 7 cm long and the ends 3 x 3 cm.
The poultices used were made from the base mix developed in [3], a mixture of kaolinite and CaCO3, but in-stead of mixing the poultice with distilled water, sa-line solutions were used. A solution with 17 g/l KCl was mixed in the poultice
Poultice
Substrate Poultice
Electrode mesh
253
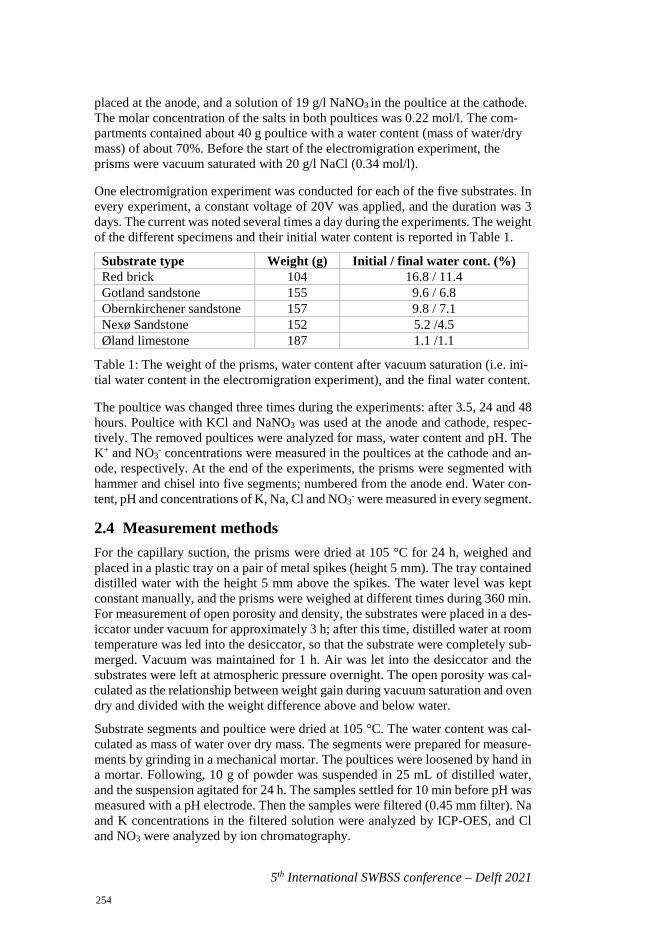
5th International SWBSS conference – Delft 2021
placed at the anode, and a solution of 19 g/l NaNO3 in the poultice at the cathode. The molar concentration of the salts in both poultices was 0.22 mol/l. The com-partments contained about 40 g poultice with a water content (mass of water/dry mass) of about 70%. Before the start of the electromigration experiment, the prisms were vacuum saturated with 20 g/l NaCl (0.34 mol/l).
One electromigration experiment was conducted for each of the five substrates. In every experiment, a constant voltage of 20V was applied, and the duration was 3 days. The current was noted several times a day during the experiments. The weight of the different specimens and their initial water content is reported in Table 1.
Substrate type Weight (g) Initial / final water cont. (%) Red brick 104 16.8 / 11.4 Gotland sandstone 155 9.6 / 6.8 Obernkirchener sandstone 157 9.8 / 7.1 Nexø Sandstone 152 5.2 /4.5 Øland limestone 187 1.1 /1.1
Table 1: The weight of the prisms, water content after vacuum saturation (i.e. ini-tial water content in the electromigration experiment), and the final water content.
The poultice was changed three times during the experiments: after 3.5, 24 and 48 hours. Poultice with KCl and NaNO3 was used at the anode and cathode, respec-tively. The removed poultices were analyzed for mass, water content and pH. The K+ and NO3
- concentrations were measured in the poultices at the cathode and an-ode, respectively. At the end of the experiments, the prisms were segmented with hammer and chisel into five segments; numbered from the anode end. Water con-tent, pH and concentrations of K, Na, Cl and NO3
- were measured in every segment.
2.4 Measurement methods For the capillary suction, the prisms were dried at 105 °C for 24 h, weighed and placed in a plastic tray on a pair of metal spikes (height 5 mm). The tray contained distilled water with the height 5 mm above the spikes. The water level was kept constant manually, and the prisms were weighed at different times during 360 min. For measurement of open porosity and density, the substrates were placed in a des-iccator under vacuum for approximately 3 h; after this time, distilled water at room temperature was led into the desiccator, so that the substrate were completely sub-merged. Vacuum was maintained for 1 h. Air was let into the desiccator and the substrates were left at atmospheric pressure overnight. The open porosity was cal-culated as the relationship between weight gain during vacuum saturation and oven dry and divided with the weight difference above and below water.
Substrate segments and poultice were dried at 105 °C. The water content was cal-culated as mass of water over dry mass. The segments were prepared for measure-ments by grinding in a mechanical mortar. The poultices were loosened by hand in a mortar. Following, 10 g of powder was suspended in 25 mL of distilled water, and the suspension agitated for 24 h. The samples settled for 10 min before pH was measured with a pH electrode. Then the samples were filtered (0.45 mm filter). Na and K concentrations in the filtered solution were analyzed by ICP-OES, and Cl and NO3 were analyzed by ion chromatography.
254
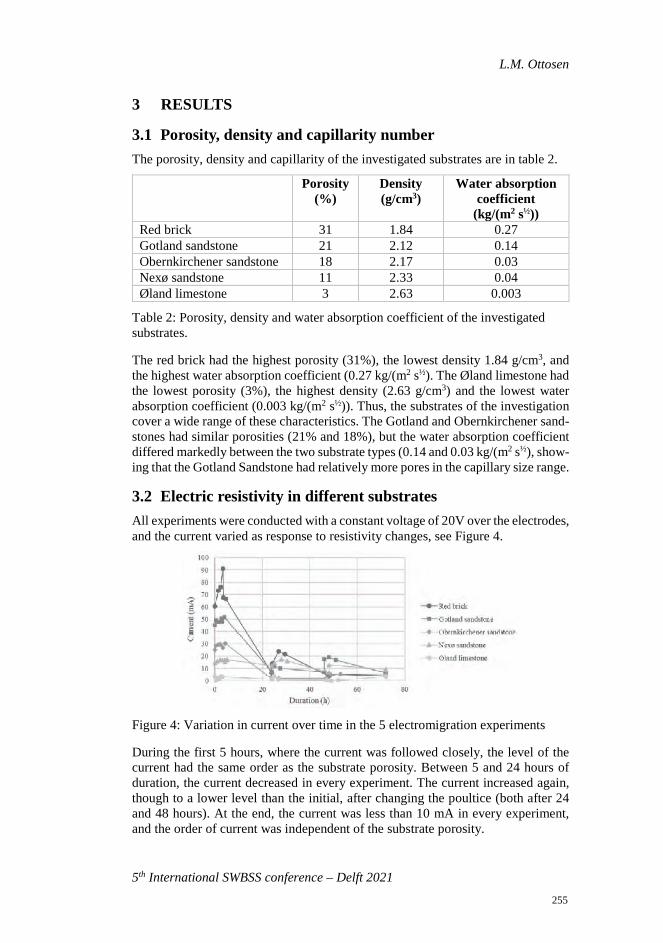
L.M. Ottosen
5th International SWBSS conference – Delft 2021
3 RESULTS
3.1 Porosity, density and capillarity number The porosity, density and capillarity of the investigated substrates are in table 2.
Porosity (%)
Density (g/cm3)
Water absorption coefficient
(kg/(m2 s½)) Red brick 31 1.84 0.27 Gotland sandstone 21 2.12 0.14 Obernkirchener sandstone 18 2.17 0.03 Nexø sandstone 11 2.33 0.04 Øland limestone 3 2.63 0.003
Table 2: Porosity, density and water absorption coefficient of the investigated substrates.
The red brick had the highest porosity (31%), the lowest density 1.84 g/cm3, and the highest water absorption coefficient (0.27 kg/(m2 s½). The Øland limestone had the lowest porosity (3%), the highest density (2.63 g/cm3) and the lowest water absorption coefficient (0.003 kg/(m2 s½)). Thus, the substrates of the investigation cover a wide range of these characteristics. The Gotland and Obernkirchener sand-stones had similar porosities (21% and 18%), but the water absorption coefficient differed markedly between the two substrate types (0.14 and 0.03 kg/(m2 s½), show-ing that the Gotland Sandstone had relatively more pores in the capillary size range.
3.2 Electric resistivity in different substrates All experiments were conducted with a constant voltage of 20V over the electrodes, and the current varied as response to resistivity changes, see Figure 4.
Figure 4: Variation in current over time in the 5 electromigration experiments
During the first 5 hours, where the current was followed closely, the level of the current had the same order as the substrate porosity. Between 5 and 24 hours of duration, the current decreased in every experiment. The current increased again, though to a lower level than the initial, after changing the poultice (both after 24 and 48 hours). At the end, the current was less than 10 mA in every experiment, and the order of current was independent of the substrate porosity.
255
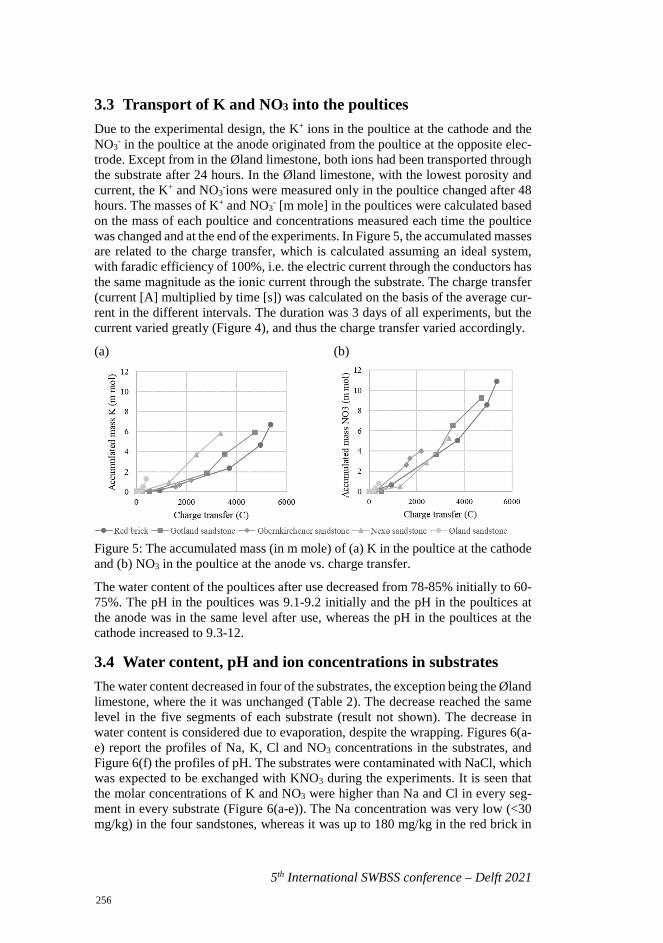
5th International SWBSS conference – Delft 2021
3.3 Transport of K and NO3 into the poultices Due to the experimental design, the K+ ions in the poultice at the cathode and the NO3
- in the poultice at the anode originated from the poultice at the opposite elec-trode. Except from in the Øland limestone, both ions had been transported through the substrate after 24 hours. In the Øland limestone, with the lowest porosity and current, the K+ and NO3
-ions were measured only in the poultice changed after 48 hours. The masses of K+ and NO3
- [m mole] in the poultices were calculated based on the mass of each poultice and concentrations measured each time the poultice was changed and at the end of the experiments. In Figure 5, the accumulated masses are related to the charge transfer, which is calculated assuming an ideal system, with faradic efficiency of 100%, i.e. the electric current through the conductors has the same magnitude as the ionic current through the substrate. The charge transfer (current [A] multiplied by time [s]) was calculated on the basis of the average cur-rent in the different intervals. The duration was 3 days of all experiments, but the current varied greatly (Figure 4), and thus the charge transfer varied accordingly.
(a) (b)
Figure 5: The accumulated mass (in m mole) of (a) K in the poultice at the cathode and (b) NO3 in the poultice at the anode vs. charge transfer.
The water content of the poultices after use decreased from 78-85% initially to 60-75%. The pH in the poultices was 9.1-9.2 initially and the pH in the poultices at the anode was in the same level after use, whereas the pH in the poultices at the cathode increased to 9.3-12.
3.4 Water content, pH and ion concentrations in substrates The water content decreased in four of the substrates, the exception being the Øland limestone, where the it was unchanged (Table 2). The decrease reached the same level in the five segments of each substrate (result not shown). The decrease in water content is considered due to evaporation, despite the wrapping. Figures 6(a-e) report the profiles of Na, K, Cl and NO3 concentrations in the substrates, and Figure 6(f) the profiles of pH. The substrates were contaminated with NaCl, which was expected to be exchanged with KNO3 during the experiments. It is seen that the molar concentrations of K and NO3 were higher than Na and Cl in every seg-ment in every substrate (Figure 6(a-e)). The Na concentration was very low (<30 mg/kg) in the four sandstones, whereas it was up to 180 mg/kg in the red brick in
256
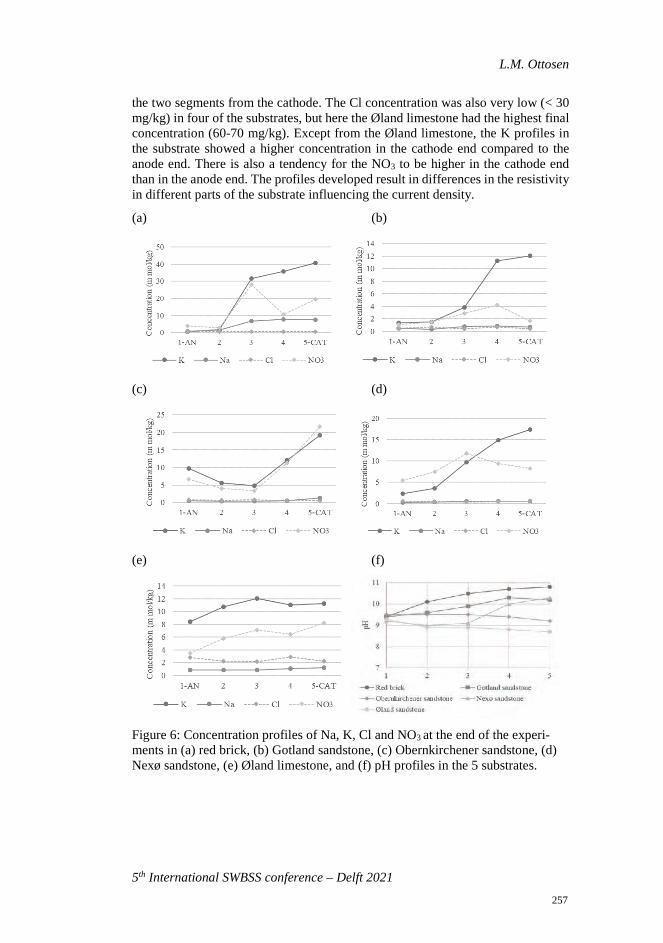
L.M. Ottosen
5th International SWBSS conference – Delft 2021
the two segments from the cathode. The Cl concentration was also very low (< 30 mg/kg) in four of the substrates, but here the Øland limestone had the highest final concentration (60-70 mg/kg). Except from the Øland limestone, the K profiles in the substrate showed a higher concentration in the cathode end compared to the anode end. There is also a tendency for the NO3 to be higher in the cathode end than in the anode end. The profiles developed result in differences in the resistivity in different parts of the substrate influencing the current density.
(a) (b)
(c) (d)
(e) (f)
Figure 6: Concentration profiles of Na, K, Cl and NO3 at the end of the experi-ments in (a) red brick, (b) Gotland sandstone, (c) Obernkirchener sandstone, (d) Nexø sandstone, (e) Øland limestone, and (f) pH profiles in the 5 substrates.
257
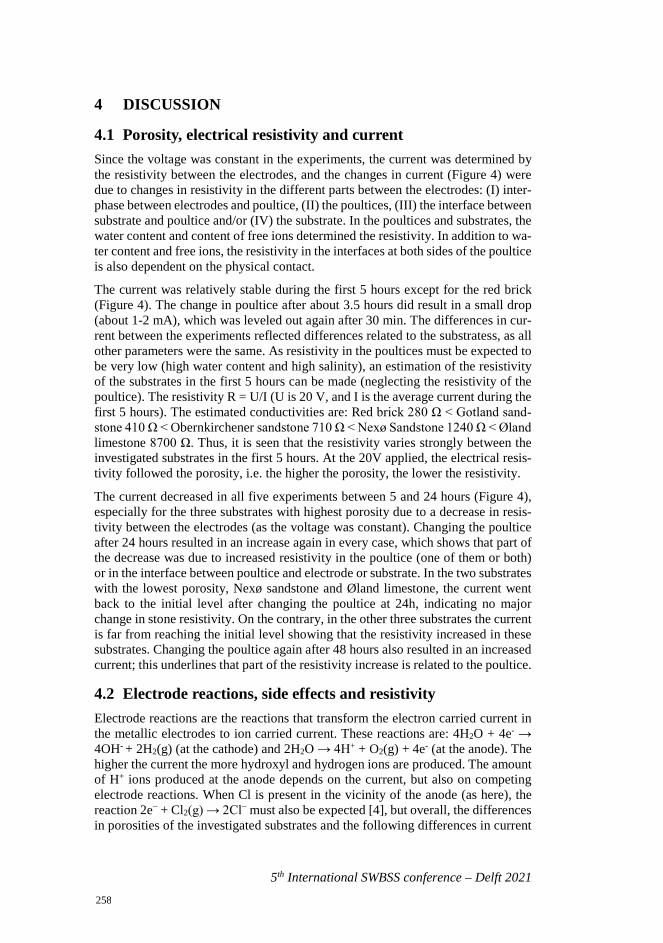
5th International SWBSS conference – Delft 2021
4 DISCUSSION
4.1 Porosity, electrical resistivity and current Since the voltage was constant in the experiments, the current was determined by the resistivity between the electrodes, and the changes in current (Figure 4) were due to changes in resistivity in the different parts between the electrodes: (I) inter-phase between electrodes and poultice, (II) the poultices, (III) the interface between substrate and poultice and/or (IV) the substrate. In the poultices and substrates, the water content and content of free ions determined the resistivity. In addition to wa-ter content and free ions, the resistivity in the interfaces at both sides of the poultice is also dependent on the physical contact.
The current was relatively stable during the first 5 hours except for the red brick (Figure 4). The change in poultice after about 3.5 hours did result in a small drop (about 1-2 mA), which was leveled out again after 30 min. The differences in cur-rent between the experiments reflected differences related to the substratess, as all other parameters were the same. As resistivity in the poultices must be expected to be very low (high water content and high salinity), an estimation of the resistivity of the substrates in the first 5 hours can be made (neglecting the resistivity of the poultice). The resistivity R = U/I (U is 20 V, and I is the average current during the first 5 hours). The estimated conductivities are: Red brick 280 Ω < Gotland sand-stone 410 Ω < Obernkirchener sandstone 710 Ω < Nexø Sandstone 1240 Ω < Øland limestone 8700 Ω. Thus, it is seen that the resistivity varies strongly between the investigated substrates in the first 5 hours. At the 20V applied, the electrical resis-tivity followed the porosity, i.e. the higher the porosity, the lower the resistivity.
The current decreased in all five experiments between 5 and 24 hours (Figure 4), especially for the three substrates with highest porosity due to a decrease in resis-tivity between the electrodes (as the voltage was constant). Changing the poultice after 24 hours resulted in an increase again in every case, which shows that part of the decrease was due to increased resistivity in the poultice (one of them or both) or in the interface between poultice and electrode or substrate. In the two substrates with the lowest porosity, Nexø sandstone and Øland limestone, the current went back to the initial level after changing the poultice at 24h, indicating no major change in stone resistivity. On the contrary, in the other three substrates the current is far from reaching the initial level showing that the resistivity increased in these substrates. Changing the poultice again after 48 hours also resulted in an increased current; this underlines that part of the resistivity increase is related to the poultice.
4.2 Electrode reactions, side effects and resistivity Electrode reactions are the reactions that transform the electron carried current in the metallic electrodes to ion carried current. These reactions are: 4H2O + 4e- → 4OH- + 2H2(g) (at the cathode) and 2H2O → 4H+ + O2(g) + 4e- (at the anode). The higher the current the more hydroxyl and hydrogen ions are produced. The amount of H+ ions produced at the anode depends on the current, but also on competing electrode reactions. When Cl is present in the vicinity of the anode (as here), the reaction 2e− + Cl2(g) → 2Cl− must also be expected [4], but overall, the differences in porosities of the investigated substrates and the following differences in current
258
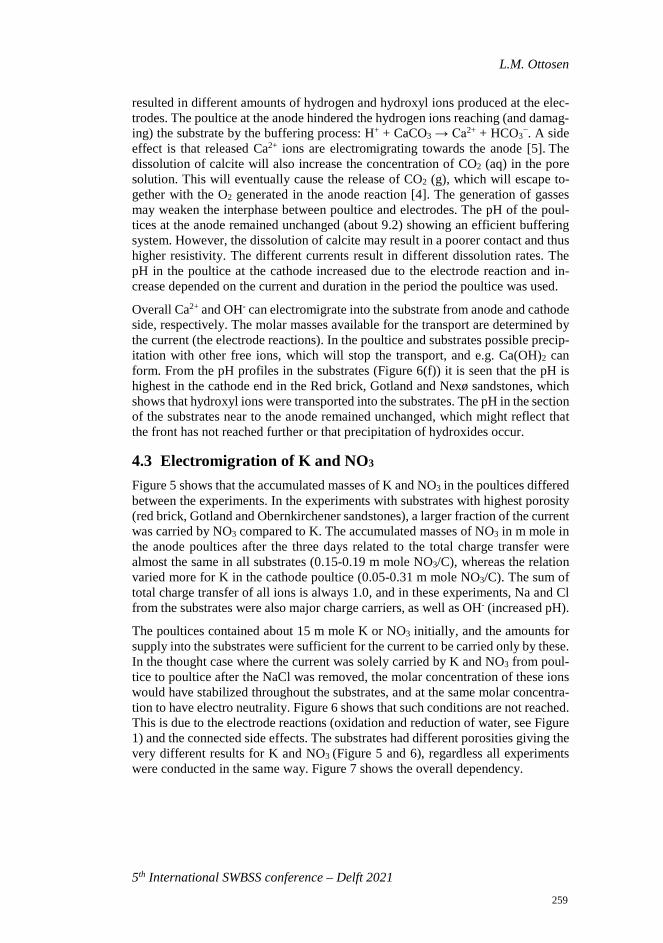
L.M. Ottosen
5th International SWBSS conference – Delft 2021
resulted in different amounts of hydrogen and hydroxyl ions produced at the elec-trodes. The poultice at the anode hindered the hydrogen ions reaching (and damag-ing) the substrate by the buffering process: H+ + CaCO3 → Ca2+ + HCO3
−. A side effect is that released Ca2+ ions are electromigrating towards the anode [5]. The dissolution of calcite will also increase the concentration of CO2 (aq) in the pore solution. This will eventually cause the release of CO2 (g), which will escape to-gether with the O2 generated in the anode reaction [4]. The generation of gasses may weaken the interphase between poultice and electrodes. The pH of the poul-tices at the anode remained unchanged (about 9.2) showing an efficient buffering system. However, the dissolution of calcite may result in a poorer contact and thus higher resistivity. The different currents result in different dissolution rates. The pH in the poultice at the cathode increased due to the electrode reaction and in-crease depended on the current and duration in the period the poultice was used.
Overall Ca2+ and OH- can electromigrate into the substrate from anode and cathode side, respectively. The molar masses available for the transport are determined by the current (the electrode reactions). In the poultice and substrates possible precip-itation with other free ions, which will stop the transport, and e.g. Ca(OH)2 can form. From the pH profiles in the substrates (Figure 6(f)) it is seen that the pH is highest in the cathode end in the Red brick, Gotland and Nexø sandstones, which shows that hydroxyl ions were transported into the substrates. The pH in the section of the substrates near to the anode remained unchanged, which might reflect that the front has not reached further or that precipitation of hydroxides occur.
4.3 Electromigration of K and NO3 Figure 5 shows that the accumulated masses of K and NO3 in the poultices differed between the experiments. In the experiments with substrates with highest porosity (red brick, Gotland and Obernkirchener sandstones), a larger fraction of the current was carried by NO3 compared to K. The accumulated masses of NO3 in m mole in the anode poultices after the three days related to the total charge transfer were almost the same in all substrates (0.15-0.19 m mole NO3/C), whereas the relation varied more for K in the cathode poultice (0.05-0.31 m mole NO3/C). The sum of total charge transfer of all ions is always 1.0, and in these experiments, Na and Cl from the substrates were also major charge carriers, as well as OH- (increased pH).
The poultices contained about 15 m mole K or NO3 initially, and the amounts for supply into the substrates were sufficient for the current to be carried only by these. In the thought case where the current was solely carried by K and NO3 from poul-tice to poultice after the NaCl was removed, the molar concentration of these ions would have stabilized throughout the substrates, and at the same molar concentra-tion to have electro neutrality. Figure 6 shows that such conditions are not reached. This is due to the electrode reactions (oxidation and reduction of water, see Figure 1) and the connected side effects. The substrates had different porosities giving thevery different results for K and NO3 (Figure 5 and 6), regardless all experimentswere conducted in the same way. Figure 7 shows the overall dependency.
259
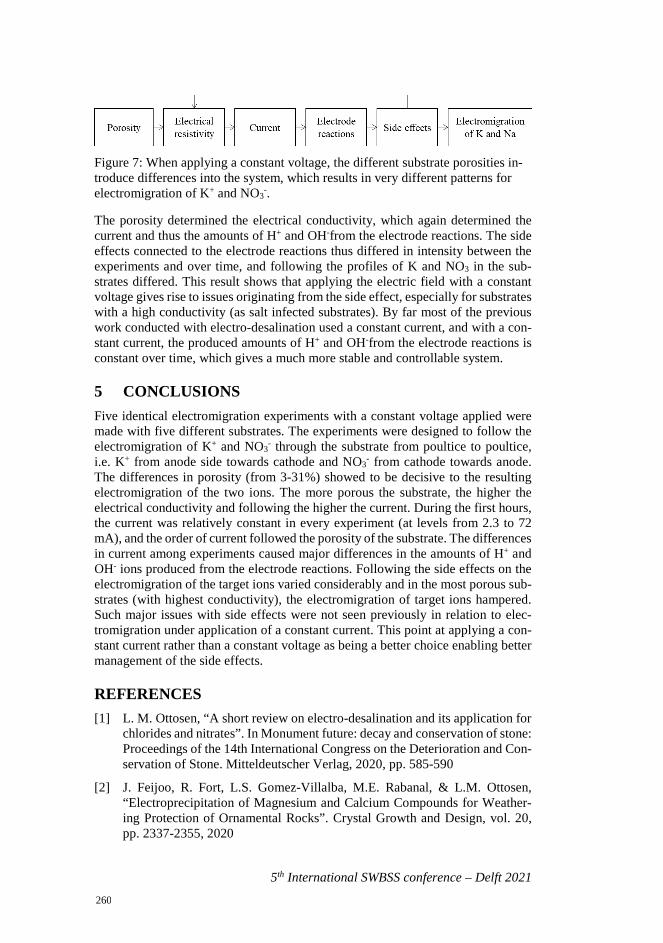
5th International SWBSS conference – Delft 2021
Figure 7: When applying a constant voltage, the different substrate porosities in-troduce differences into the system, which results in very different patterns for electromigration of K+ and NO3
-.
The porosity determined the electrical conductivity, which again determined the current and thus the amounts of H+ and OH-from the electrode reactions. The side effects connected to the electrode reactions thus differed in intensity between the experiments and over time, and following the profiles of K and NO3 in the sub-strates differed. This result shows that applying the electric field with a constant voltage gives rise to issues originating from the side effect, especially for substrates with a high conductivity (as salt infected substrates). By far most of the previous work conducted with electro-desalination used a constant current, and with a con-stant current, the produced amounts of H+ and OH-from the electrode reactions is constant over time, which gives a much more stable and controllable system.
5 CONCLUSIONS Five identical electromigration experiments with a constant voltage applied were made with five different substrates. The experiments were designed to follow the electromigration of K+ and NO3
- through the substrate from poultice to poultice, i.e. K+ from anode side towards cathode and NO3
- from cathode towards anode.The differences in porosity (from 3-31%) showed to be decisive to the resultingelectromigration of the two ions. The more porous the substrate, the higher theelectrical conductivity and following the higher the current. During the first hours,the current was relatively constant in every experiment (at levels from 2.3 to 72mA), and the order of current followed the porosity of the substrate. The differencesin current among experiments caused major differences in the amounts of H+ andOH- ions produced from the electrode reactions. Following the side effects on theelectromigration of the target ions varied considerably and in the most porous sub-strates (with highest conductivity), the electromigration of target ions hampered.Such major issues with side effects were not seen previously in relation to elec-tromigration under application of a constant current. This point at applying a con-stant current rather than a constant voltage as being a better choice enabling bettermanagement of the side effects.
REFERENCES [1] L. M. Ottosen, “A short review on electro-desalination and its application for
chlorides and nitrates”. In Monument future: decay and conservation of stone:Proceedings of the 14th International Congress on the Deterioration and Con-servation of Stone. Mitteldeutscher Verlag, 2020, pp. 585-590
[2] J. Feijoo, R. Fort, L.S. Gomez-Villalba, M.E. Rabanal, & L.M. Ottosen,“Electroprecipitation of Magnesium and Calcium Compounds for Weather-ing Protection of Ornamental Rocks”. Crystal Growth and Design, vol. 20,pp. 2337-2355, 2020
260

L.M. Ottosen
5th International SWBSS conference – Delft 2021
[3] I. Rörig-Dalgaard, “Development of a poultice for electrochemical desalina-tion of porous building materials: desalination effect and pH changes”. Mate-rials and Structures, vol. 46, pp. 959-970, 2013.
[4] G. Skibsted, L.M.Ottosen, P.E. Jensen, J.M. Paz-Garcia, “Electrochemical desalination of bricks – Experimental and modelling”, Electrochimica Acta, vol.181, pp. 24–30, 2015.
[5] J.M. Paz-García, B. Johannesson, L.M.Ottosen,, A.B. Ribeiro, J.M. Rodríguez-Maroto, Simulation-based analysis of the differences in the re-moval rate of chlorides, nitrates and sulfates by electrokinetic desalination treatments. Electrochimica Acta, vol 89 , pp.436– 444, 2013.
261

262
5th International SWBSS conference – Delft 2021
A GREEN SALT MITIGATION TECHNIQUE FOR ARCHAEOLOGICAL BRICKS
Duygu Ergenç1*, Çağla Meral Akgül1, and Özlem Cizer2
KEYWORDS
Sacrificial mortar, bamboo biochar, Roman brick, salt, desalination
ABSTRACT In historic masonry structures, rising damp is the main source of moisture and salt. Damage due to moisture and salts is augmented after archaeological research, where decay occurs before and after excavation. This study investigates the con-servation of salt-damaged fired bricks dating back to the Roman period from the archaeological site Sagalassos through desalination with a sacrificial rendering mortar incorporating bamboo biochar as a novel additive. The brick samples were first freed from salt and then exposed to controlled sodium sulfate contamination. The sacrificial rendering mortar was applied to the salt-contaminated bricks. Half of the samples was left as-is, while the other half was placed in 1 cm water to mimic rising damp conditions. This procedure was repeated several times. After each ap-plication, the salt amount at different depths was measured in the bricks. The effect of biochar on the developed mortars and the desalination efficiency of the mortars were assessed, using Dino Lite digital microscopy, SEM-EDS, XRF, ion chroma-tography, XRD, and TGA-DTA. Preliminary results suggest that utilization of bi-ochar incorporating sacrificial mortar is a promising ecologically friendly solution for salt mitigation.
1 Middle East Technical University, Department of Civil Engineering, Ankara,
Turkey, [email protected] 2 KU Leuven, Department of Civil Engineering, Leuven, Belgium
263
5th International SWBSS conference – Delft 2021
1 INTRODUCTION Salt decay is a major cause of damage as it accelerates the breakdown of porous archaeological materials. Through groundwater, seawater, rain and humidity, salt ions are transported into archaeological building materials both before and after burial. After excavation, water within the material evaporates resulting in salt crys-tallization. This causes irreversible damage in the artifacts due to fluctuating envi-ronmental conditions. The pressure exerted by salt crystallization may cause dete-rioration starting from the surface. On some occasions, protective covering of an excavated site a solution which is increasingly common may not be feasible due to financial constraints. Even when the archaeological asset is covered, a microcli-mate can be created encouraging salt formation. After excavation, due to combined weathering effects, increasing material degradation has been observed at the Ro-man baths at the archaeological site Sagalassos in western Turkey. The archaeo-logical research team seeks a sustainable and user-friendly solution to preserve these structures, which are spread over a large area. A desired solution could be the multiple short-term application of sacrificial rendering mortar to decrease the salt content in the bricks, followed by the application of a single layer of a long-term mortar that provides enhanced protection from freezing during the winter.
A number of studies have been performed on the complex mechanism of salt crys-tallization [1, 2] and salt-induced decay patterns on building materials [3-5]. Sug-gested remedies include applying poultices [6], electromigration [7], sacrificial mortars with clay and nano-additives [8], crystallization modifiers [9], and lime mortars [10, 11]. Although promising results have been obtained, we seek a solu-tion that is more environmentally friendly, cost-effective and that can provide long-term protection.
Biochar is a material obtained by pyrolysis of a biomass in low-oxygen environ-ments. It is a carbon-rich material with an alkaline pH and high specific surface area, water retention capacity, cation exchange capacity and carbon sequestration capacity. High absorption allows CH4 emission reduction [12] and Na+ accumula-tion [13]. It has received attention for its ability to capture carbon and it increases mechanical strength when used as a partial cement replacement in mortars [14]. Bamboo is one of the fastest-growing plants [15] and, accordingly, bamboo bio-char, a cheap absorbent alternative, is used in soil amendments to manage organic and toxic waste. Considering these properties, we explore its effectiveness in mak-ing sacrificial lime mortars. This study aims to understand bamboo biochar’s effect on lime mortar properties and specifically, salt extraction.
2 MATERIALS AND METHODS Roman age fired clay bricks from Sagalassos were cut in prisms of 5×5×3–5 cm, vacuumed, left in distilled water, which was periodically renewed, for one week and then dried at 40°C to ensure they were salt-free. For controlled salt contami-nation, the bricks were completely submerged in a container filled with a 14% Na2SO4 solution for 4 hours, dried at 70°C for 8 hours, and left at 60% relative humidity (RH) for 16 hours. This procedure was repeated 5 times. After this con-trolled contamination procedure, which was modified from [16], some bricks showed slight surface erosion, but no detachment; all bricks were covered with
264
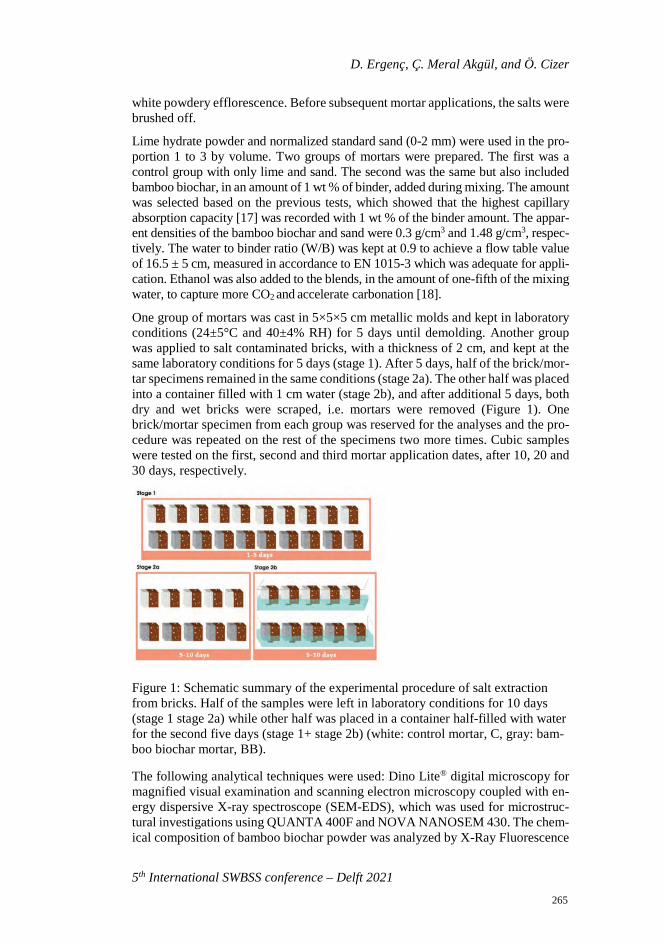
D. Ergenç, Ç. Meral Akgül, and Ö. Cizer
5th International SWBSS conference – Delft 2021
white powdery efflorescence. Before subsequent mortar applications, the salts were brushed off.
Lime hydrate powder and normalized standard sand (0-2 mm) were used in the pro-portion 1 to 3 by volume. Two groups of mortars were prepared. The first was a control group with only lime and sand. The second was the same but also included bamboo biochar, in an amount of 1 wt % of binder, added during mixing. The amount was selected based on the previous tests, which showed that the highest capillary absorption capacity [17] was recorded with 1 wt % of the binder amount. The appar-ent densities of the bamboo biochar and sand were 0.3 g/cm3 and 1.48 g/cm3, respec-tively. The water to binder ratio (W/B) was kept at 0.9 to achieve a flow table value of 16.5 ± 5 cm, measured in accordance to EN 1015-3 which was adequate for appli-cation. Ethanol was also added to the blends, in the amount of one-fifth of the mixing water, to capture more CO2 and accelerate carbonation [18].
One group of mortars was cast in 5×5×5 cm metallic molds and kept in laboratory conditions (24±5°C and 40±4% RH) for 5 days until demolding. Another group was applied to salt contaminated bricks, with a thickness of 2 cm, and kept at the same laboratory conditions for 5 days (stage 1). After 5 days, half of the brick/mor-tar specimens remained in the same conditions (stage 2a). The other half was placed into a container filled with 1 cm water (stage 2b), and after additional 5 days, both dry and wet bricks were scraped, i.e. mortars were removed (Figure 1). One brick/mortar specimen from each group was reserved for the analyses and the pro-cedure was repeated on the rest of the specimens two more times. Cubic samples were tested on the first, second and third mortar application dates, after 10, 20 and 30 days, respectively.
Figure 1: Schematic summary of the experimental procedure of salt extraction from bricks. Half of the samples were left in laboratory conditions for 10 days (stage 1 stage 2a) while other half was placed in a container half-filled with water for the second five days (stage 1+ stage 2b) (white: control mortar, C, gray: bam-boo biochar mortar, BB).
The following analytical techniques were used: Dino Lite® digital microscopy for magnified visual examination and scanning electron microscopy coupled with en-ergy dispersive X-ray spectroscope (SEM-EDS), which was used for microstruc-tural investigations using QUANTA 400F and NOVA NANOSEM 430. The chem-ical composition of bamboo biochar powder was analyzed by X-Ray Fluorescence
265
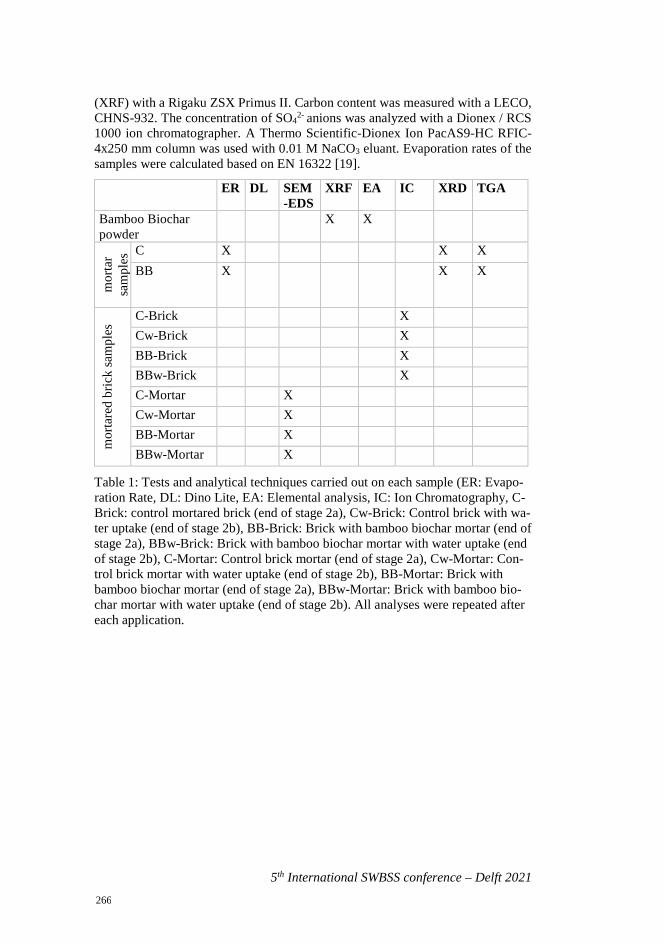
5th International SWBSS conference – Delft 2021
(XRF) with a Rigaku ZSX Primus II. Carbon content was measured with a LECO, CHNS-932. The concentration of SO4
2- anions was analyzed with a Dionex / RCS 1000 ion chromatographer. A Thermo Scientific-Dionex Ion PacAS9-HC RFIC-4x250 mm column was used with 0.01 M NaCO3 eluant. Evaporation rates of the samples were calculated based on EN 16322 [19].
ER DL SEM-EDS
XRF EA IC XRD TGA
Bamboo Biochar powder
X X
mor
tar
sam
ples
C X X X BB X X X
mor
tare
d br
ick
sam
ples
C-Brick X Cw-Brick X BB-Brick X BBw-Brick X C-Mortar X Cw-Mortar X BB-Mortar X BBw-Mortar X
Table 1: Tests and analytical techniques carried out on each sample (ER: Evapo-ration Rate, DL: Dino Lite, EA: Elemental analysis, IC: Ion Chromatography, C-Brick: control mortared brick (end of stage 2a), Cw-Brick: Control brick with wa-ter uptake (end of stage 2b), BB-Brick: Brick with bamboo biochar mortar (end of stage 2a), BBw-Brick: Brick with bamboo biochar mortar with water uptake (end of stage 2b), C-Mortar: Control brick mortar (end of stage 2a), Cw-Mortar: Con-trol brick mortar with water uptake (end of stage 2b), BB-Mortar: Brick with bamboo biochar mortar (end of stage 2a), BBw-Mortar: Brick with bamboo bio-char mortar with water uptake (end of stage 2b). All analyses were repeated after each application.
266
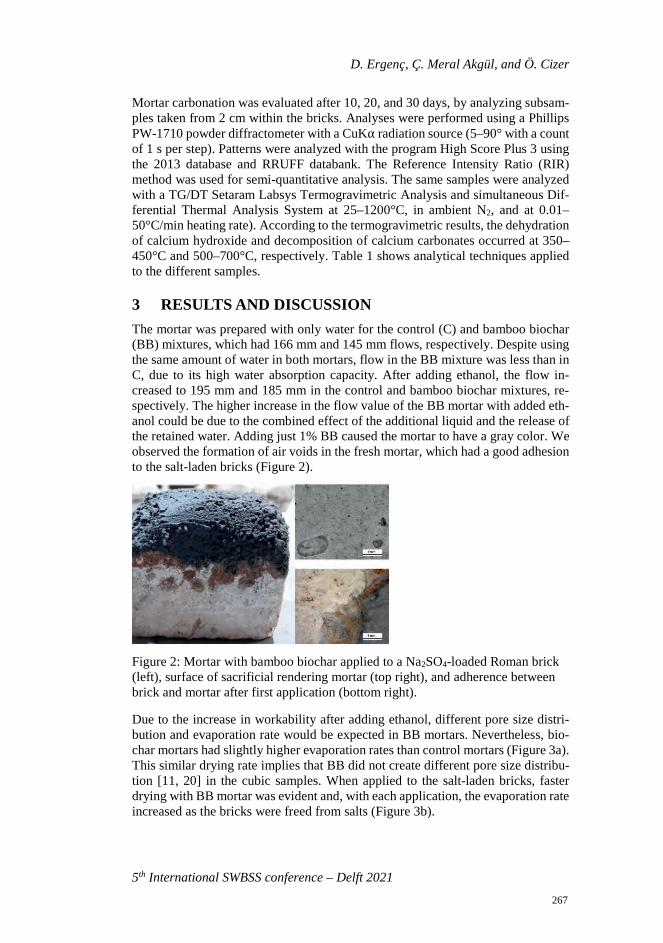
D. Ergenç, Ç. Meral Akgül, and Ö. Cizer
5th International SWBSS conference – Delft 2021
Mortar carbonation was evaluated after 10, 20, and 30 days, by analyzing subsam-ples taken from 2 cm within the bricks. Analyses were performed using a Phillips PW-1710 powder diffractometer with a CuKα radiation source (5–90° with a count of 1 s per step). Patterns were analyzed with the program High Score Plus 3 using the 2013 database and RRUFF databank. The Reference Intensity Ratio (RIR) method was used for semi-quantitative analysis. The same samples were analyzed with a TG/DT Setaram Labsys Termogravimetric Analysis and simultaneous Dif-ferential Thermal Analysis System at 25–1200°C, in ambient N2, and at 0.01–50°C/min heating rate). According to the termogravimetric results, the dehydration of calcium hydroxide and decomposition of calcium carbonates occurred at 350–450°C and 500–700°C, respectively. Table 1 shows analytical techniques applied to the different samples.
3 RESULTS AND DISCUSSION The mortar was prepared with only water for the control (C) and bamboo biochar (BB) mixtures, which had 166 mm and 145 mm flows, respectively. Despite using the same amount of water in both mortars, flow in the BB mixture was less than in C, due to its high water absorption capacity. After adding ethanol, the flow in-creased to 195 mm and 185 mm in the control and bamboo biochar mixtures, re-spectively. The higher increase in the flow value of the BB mortar with added eth-anol could be due to the combined effect of the additional liquid and the release of the retained water. Adding just 1% BB caused the mortar to have a gray color. We observed the formation of air voids in the fresh mortar, which had a good adhesion to the salt-laden bricks (Figure 2).
Figure 2: Mortar with bamboo biochar applied to a Na2SO4-loaded Roman brick (left), surface of sacrificial rendering mortar (top right), and adherence between brick and mortar after first application (bottom right).
Due to the increase in workability after adding ethanol, different pore size distri-bution and evaporation rate would be expected in BB mortars. Nevertheless, bio-char mortars had slightly higher evaporation rates than control mortars (Figure 3a). This similar drying rate implies that BB did not create different pore size distribu-tion [11, 20] in the cubic samples. When applied to the salt-laden bricks, faster drying with BB mortar was evident and, with each application, the evaporation rate increased as the bricks were freed from salts (Figure 3b).
267
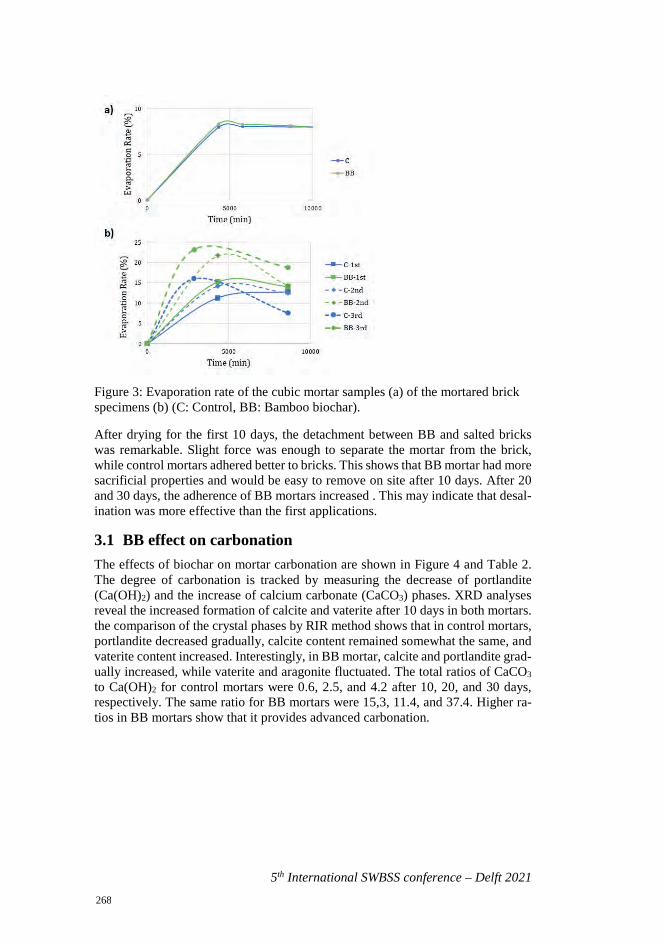
5th International SWBSS conference – Delft 2021
Figure 3: Evaporation rate of the cubic mortar samples (a) of the mortared brick specimens (b) (C: Control, BB: Bamboo biochar).
After drying for the first 10 days, the detachment between BB and salted bricks was remarkable. Slight force was enough to separate the mortar from the brick, while control mortars adhered better to bricks. This shows that BB mortar had more sacrificial properties and would be easy to remove on site after 10 days. After 20 and 30 days, the adherence of BB mortars increased . This may indicate that desal-ination was more effective than the first applications.
3.1 BB effect on carbonation The effects of biochar on mortar carbonation are shown in Figure 4 and Table 2. The degree of carbonation is tracked by measuring the decrease of portlandite (Ca(OH)2) and the increase of calcium carbonate (CaCO3) phases. XRD analyses reveal the increased formation of calcite and vaterite after 10 days in both mortars. the comparison of the crystal phases by RIR method shows that in control mortars, portlandite decreased gradually, calcite content remained somewhat the same, and vaterite content increased. Interestingly, in BB mortar, calcite and portlandite grad-ually increased, while vaterite and aragonite fluctuated. The total ratios of CaCO3 to Ca(OH)2 for control mortars were 0.6, 2.5, and 4.2 after 10, 20, and 30 days, respectively. The same ratio for BB mortars were 15,3, 11.4, and 37.4. Higher ra-tios in BB mortars show that it provides advanced carbonation.
268
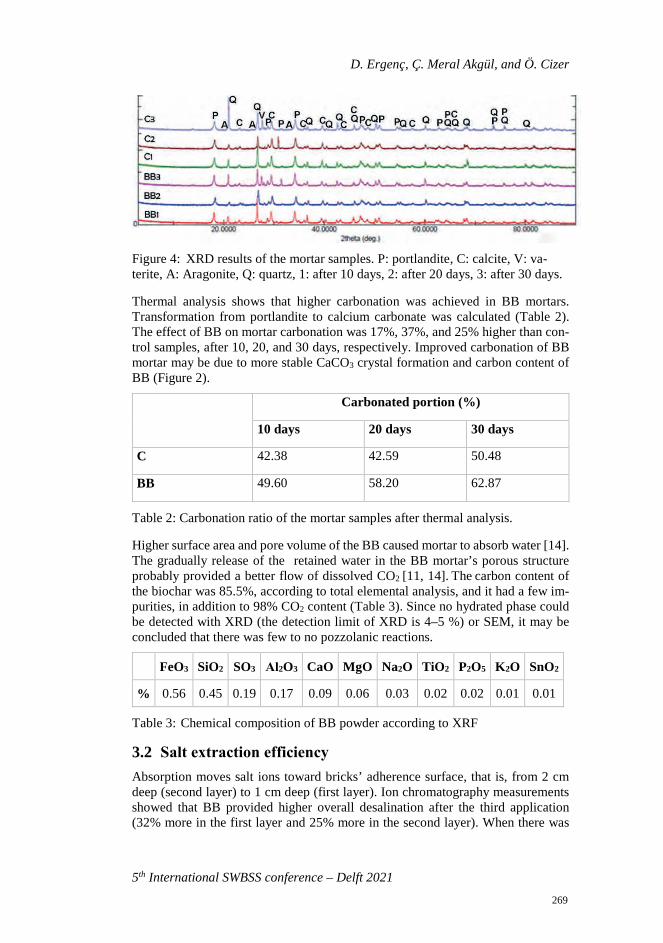
D. Ergenç, Ç. Meral Akgül, and Ö. Cizer
5th International SWBSS conference – Delft 2021
Figure 4: XRD results of the mortar samples. P: portlandite, C: calcite, V: va-terite, A: Aragonite, Q: quartz, 1: after 10 days, 2: after 20 days, 3: after 30 days.
Thermal analysis shows that higher carbonation was achieved in BB mortars. Transformation from portlandite to calcium carbonate was calculated (Table 2). The effect of BB on mortar carbonation was 17%, 37%, and 25% higher than con-trol samples, after 10, 20, and 30 days, respectively. Improved carbonation of BB mortar may be due to more stable CaCO3 crystal formation and carbon content of BB (Figure 2).
Carbonated portion (%)
10 days 20 days 30 days
C 42.38 42.59 50.48
BB 49.60 58.20 62.87
Table 2: Carbonation ratio of the mortar samples after thermal analysis.
Higher surface area and pore volume of the BB caused mortar to absorb water [14]. The gradually release of the retained water in the BB mortar’s porous structure probably provided a better flow of dissolved CO2 [11, 14]. The carbon content of the biochar was 85.5%, according to total elemental analysis, and it had a few im-purities, in addition to 98% CO2 content (Table 3). Since no hydrated phase could be detected with XRD (the detection limit of XRD is 4–5 %) or SEM, it may be concluded that there was few to no pozzolanic reactions.
FeO3 SiO2 SO3 Al2O3 CaO MgO Na2O TiO2 P2O5 K2O SnO2
% 0.56 0.45 0.19 0.17 0.09 0.06 0.03 0.02 0.02 0.01 0.01
Table 3: Chemical composition of BB powder according to XRF 3.2 Salt extraction efficiency Absorption moves salt ions toward bricks’ adherence surface, that is, from 2 cm deep (second layer) to 1 cm deep (first layer). Ion chromatography measurements showed that BB provided higher overall desalination after the third application (32% more in the first layer and 25% more in the second layer). When there was
269
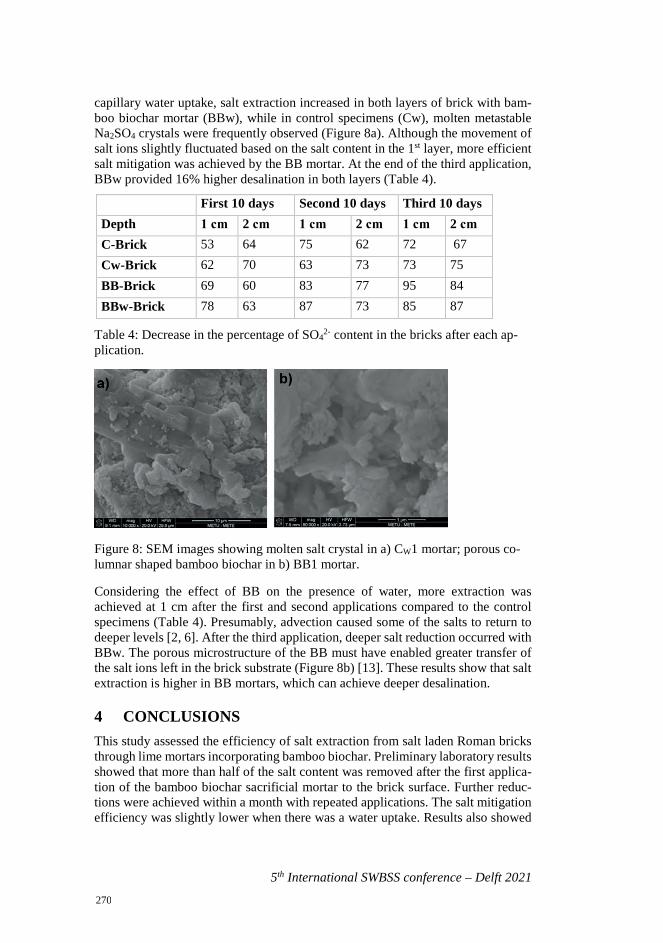
5th International SWBSS conference – Delft 2021
capillary water uptake, salt extraction increased in both layers of brick with bam-boo biochar mortar (BBw), while in control specimens (Cw), molten metastable Na2SO4 crystals were frequently observed (Figure 8a). Although the movement of salt ions slightly fluctuated based on the salt content in the 1st layer, more efficient salt mitigation was achieved by the BB mortar. At the end of the third application, BBw provided 16% higher desalination in both layers (Table 4).
First 10 days Second 10 days Third 10 days
Depth 1 cm 2 cm 1 cm 2 cm 1 cm 2 cm C-Brick 53 64 75 62 72 67 Cw-Brick 62 70 63 73 73 75 BB-Brick 69 60 83 77 95 84 BBw-Brick 78 63 87 73 85 87
Table 4: Decrease in the percentage of SO42- content in the bricks after each ap-
plication.
Figure 8: SEM images showing molten salt crystal in a) CW1 mortar; porous co-lumnar shaped bamboo biochar in b) BB1 mortar.
Considering the effect of BB on the presence of water, more extraction was achieved at 1 cm after the first and second applications compared to the control specimens (Table 4). Presumably, advection caused some of the salts to return to deeper levels [2, 6]. After the third application, deeper salt reduction occurred with BBw. The porous microstructure of the BB must have enabled greater transfer of the salt ions left in the brick substrate (Figure 8b) [13]. These results show that salt extraction is higher in BB mortars, which can achieve deeper desalination.
4 CONCLUSIONS This study assessed the efficiency of salt extraction from salt laden Roman bricks through lime mortars incorporating bamboo biochar. Preliminary laboratory results showed that more than half of the salt content was removed after the first applica-tion of the bamboo biochar sacrificial mortar to the brick surface. Further reduc-tions were achieved within a month with repeated applications. The salt mitigation efficiency was slightly lower when there was a water uptake. Results also showed
270
D. Ergenç, Ç. Meral Akgül, and Ö. Cizer
5th International SWBSS conference – Delft 2021
that adding bamboo biochar promoted advanced carbonation. These promising pre-liminary results suggest that application of the sacrificial mortar with bamboo bio-char might be suitable for mitigating salts in the short term. Research on its long-term effects is still ongoing.
5 ACKNOWLEDGEMENTS This research has benefited from the H2020 Marie Skłodowska-Curie Co-funded 2236 Brain Circulation Scheme 2 (CoCirculation2) of TÜBİTAK (Project no: 119C020). The authors are grateful to Dr. Jeroen Poblome and Dr. Peter Talloen for the Roman brick supply from Sagalassos.
REFERENCES [1] G. W. Scherer, “Crystallization in pores,” Cem. Concr. Res., vol. 29, no. 8,
pp. 1347–1358, 1999.
[2] C. Rodriguez-Navarro and E. Doehne, “Salt weathering: influence of evapo-ration rate, supersaturation and crystallization pattern,” Earth Surf. Process. Landforms, vol. 24, no. 3, pp. 191–209, 1999.
[3] R. Gomez-Heras, M, Fort, “Patterns of halite (NaCl) crystallisation in build-ing stone conditioned by laboratory heating regimes,” Environ. Geol., vol. 52, no. 2, pp. 259–267, 2007.
[4] R. Flatt et al., “Predicting salt damage in practice: A theoretical insight into laboratory tests.,” RILEM Tech. Lett., vol. 2, pp. 108–118, 2017.
[5] B. Lubelli et al., “Towards a more effective and reliable salt crystallization test for porous building materials: state of the art,” Mater. Struct. Constr., vol. 51, no. 2, 2018.
[6] B. Lubelli and R. P. J. van Hees, “Desalination of masonry structures: Fine tuning of pore size distribution of poultices to substrate properties,” J. Cult. Herit., vol. 11, no. 1, pp. 10–18, 2010.
[7] J. Feijoo, R. Fort, L. S. Gomez-Villalba, M. E. Rabanal, and L. M. Ottosen, “Electroprecipitation of Magnesium and Calcium Compounds for Weather-ing Protection of Ornamental Rocks,” Cryst. Growth Des., vol. 20, no. 4, pp. 2337–2355, 2020.
[8] N. Husillos-Rodríguez, P. M. Carmona-Quiroga, S. Martínez-Ramírez, M. T. Blanco-Varela, and R. Fort, “Sacrificial mortars for surface desalination,” Constr. Build. Mater., vol. 173, 2018.
[9] C. Selwitz and E. Doehne, “The evaluation of crystallization modifiers for controlling salt damage to limestone,” J. Cult. Herit., vol. 3, no. 3, pp. 205–216, 2002.
[10] S. J. C. Granneman, B. Lubelli, and R. P. J. van Hees, “Effect of mixed in crystallization modifiers on the resistance of lime mortar against NaCl and Na2SO4 crystallization,” Constr. Build. Mater., vol. 194, pp. 62–70, 2019.
271
5th International SWBSS conference – Delft 2021
[11] D. Ergenç, J. Feijoo, R. Fort, and M. Alvarez de Buergo, “Effects of potas-sium ferrocyanide used for desalination on lime composite performances in different curing regimes,” Constr. Build. Mater., vol. 259, 2020.
[12] A. K. Sakhiya, A. Anand, and P. Kaushal, Production, activation, and appli-cations of biochar in recent times, no. 0123456789. Springer Singapore, 2020.
[13] F. Jin et al., “Effects of biochar on sodium ion accumulation, yield and quality of rice in saline-sodic soil of the west of songnen plain, Northeast China,” Plant, Soil Environ., vol. 64, no. 12, pp. 612–618, 2018.
[14] S. Gupta and H. Wei, “Combination of Biochar and Silica Fume as Partial Cement Replacement in Mortar: Performance Evaluation Under Normal and Elevated Temperature,” Waste and Biomass Valorization, vol. 11, no. 6, pp. 2807–2824, 2020.
[15] B. Armynah, D. Tahir, M. Tandilayuk, Z. Djafar, and W. H. Piarah, “Poten-tials of Biochars Derived from Bamboo Leaf Biomass as Energy Sources: Effect of Temperature and Time of Heating,” Int. J. Biomater., vol. 2019, pp. 12–18, 2019.
[16] CEN, “EN 12370 Natural stone test methods. Determination of resistance to salt crystallization,” 1999.
[17] M. R. Veiga, A. C. Magalhães, and V. Bokan-Bosilikov, “Capillarity Tests on Historic Mortar Samples Extracted From Site. Methodology and Com-pared Results,” 13th Int. Brick Block masonry Conf., pp. 1–10, 2004.
[18] G. Ounoughene, E. Buskens, R. M. Santos, Ö. Cizer, and T. Van Gerven, “Solvochemical carbonation of lime using ethanol: Mechanism and enhance-ment for direct atmospheric CO2 capture,” J. CO2 Util., vol. 26, no. April, pp. 143–151, 2018.
[19] CEN, “EN 16322 Conservation of Cultural Heritage. Test methods. Determi-nation of drying properties” 2013.
[20] C. Nunes, L. Pel, J. Kunecký, and Z. Slížková, “The influence of the pore structure on the moisture transport in lime plaster-brick systems as studied by NMR,” Constr. Build. Mater., vol. 142, pp. 395–409, 2017.
272
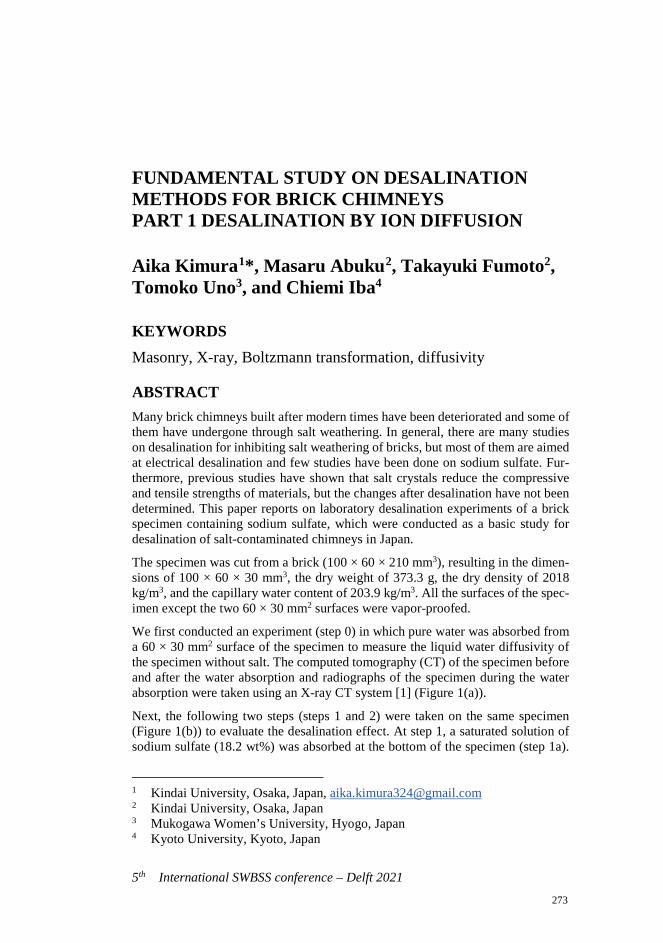
5th International SWBSS conference – Delft 2021
FUNDAMENTAL STUDY ON DESALINATION METHODS FOR BRICK CHIMNEYS PART 1 DESALINATION BY ION DIFFUSION
Aika Kimura1*, Masaru Abuku2, Takayuki Fumoto2, Tomoko Uno3, and Chiemi Iba4
KEYWORDS Masonry, X-ray, Boltzmann transformation, diffusivity
ABSTRACT Many brick chimneys built after modern times have been deteriorated and some of them have undergone through salt weathering. In general, there are many studies on desalination for inhibiting salt weathering of bricks, but most of them are aimed at electrical desalination and few studies have been done on sodium sulfate. Fur-thermore, previous studies have shown that salt crystals reduce the compressive and tensile strengths of materials, but the changes after desalination have not been determined. This paper reports on laboratory desalination experiments of a brick specimen containing sodium sulfate, which were conducted as a basic study for desalination of salt-contaminated chimneys in Japan.
The specimen was cut from a brick (100 × 60 × 210 mm3), resulting in the dimen-sions of 100 × 60 × 30 mm3, the dry weight of 373.3 g, the dry density of 2018 kg/m3, and the capillary water content of 203.9 kg/m3. All the surfaces of the spec-imen except the two 60 × 30 mm2 surfaces were vapor-proofed.
We first conducted an experiment (step 0) in which pure water was absorbed from a 60 × 30 mm2 surface of the specimen to measure the liquid water diffusivity of the specimen without salt. The computed tomography (CT) of the specimen before and after the water absorption and radiographs of the specimen during the water absorption were taken using an X-ray CT system [1] (Figure 1(a)).
Next, the following two steps (steps 1 and 2) were taken on the same specimen (Figure 1(b)) to evaluate the desalination effect. At step 1, a saturated solution of sodium sulfate (18.2 wt%) was absorbed at the bottom of the specimen (step 1a).
1 Kindai University, Osaka, Japan, [email protected] 2 Kindai University, Osaka, Japan 3 Mukogawa Women’s University, Hyogo, Japan 4 Kyoto University, Kyoto, Japan
273
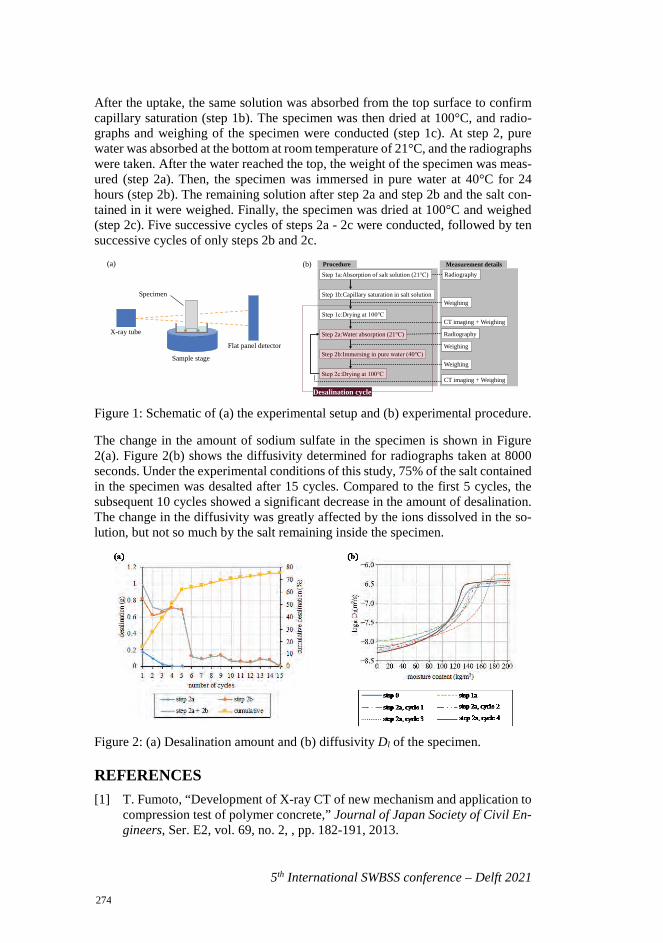
5th International SWBSS conference – Delft 2021
After the uptake, the same solution was absorbed from the top surface to confirm capillary saturation (step 1b). The specimen was then dried at 100°C, and radio-graphs and weighing of the specimen were conducted (step 1c). At step 2, pure water was absorbed at the bottom at room temperature of 21°C, and the radiographs were taken. After the water reached the top, the weight of the specimen was meas-ured (step 2a). Then, the specimen was immersed in pure water at 40°C for 24 hours (step 2b). The remaining solution after step 2a and step 2b and the salt con-tained in it were weighed. Finally, the specimen was dried at 100°C and weighed (step 2c). Five successive cycles of steps 2a - 2c were conducted, followed by ten successive cycles of only steps 2b and 2c.
Figure 1: Schematic of (a) the experimental setup and (b) experimental procedure.
The change in the amount of sodium sulfate in the specimen is shown in Figure 2(a). Figure 2(b) shows the diffusivity determined for radiographs taken at 8000 seconds. Under the experimental conditions of this study, 75% of the salt contained in the specimen was desalted after 15 cycles. Compared to the first 5 cycles, the subsequent 10 cycles showed a significant decrease in the amount of desalination. The change in the diffusivity was greatly affected by the ions dissolved in the so-lution, but not so much by the salt remaining inside the specimen.
Figure 2: (a) Desalination amount and (b) diffusivity Dl of the specimen.
REFERENCES [1] T. Fumoto, “Development of X-ray CT of new mechanism and application to
compression test of polymer concrete,” Journal of Japan Society of Civil En-gineers, Ser. E2, vol. 69, no. 2, , pp. 182-191, 2013.
X-ray tube
Sample stage
Flat panel detector
Specimen
(a) Procedure Measurement detailsRadiography
CT imaging + Weighing
CT imaging + Weighing
Weighing
Weighing
Desalination cycle
Step 1a:Absorption of salt solution (21℃)
Step 1b:Capillary saturation in salt solution
Step 1c:Drying at 100℃
Step 2b:Immersing in pure water (40℃)
Step 2c:Drying at 100℃
Weighing
(b)
Step 2a:Water absorption (21℃) Radiography
274

Hands on conservation

276
5th International SWBSS conference – Delft 2021
INTERNAL RETROFITTING WITH HEMP-LIME ON BRICK MASONRY – A STUDY TO PREVENT DAMAGE CAUSED BY SODIUM SULPHATE
Kristin Balksten1*, and Paulien Strandberg-de Bruijn2
KEYWORDS
Salt damage, brick masonry, hemp-lime, retrofitting, sodium sulphate
ABSTRACT In Sweden there are a great number of neo-gothic churches built in brick masonry around 1870-1910. They are constructed as massive masonry walls with façade bricks attached to a core of massive red bricks. In the majority of these churches there is a presence of sodium sulphate causing salt damages. The source of the salts is known to be the red masonry bricks and the damage occurs both internally and externally on the walls. Damages occurred already after a couple of years after the churches were built and ever since they caused expensive renovations with little or no durability. As the sodium sulphate crystallizes inside the plaster the damages cause spalling of the surface.
Since 2016 a method to prevent or delay salt damages has been studied and evalu-ated. By adding a layer of insulation on the internal wall the microclimate on and nearby the plaster surface can be changed and the damages caused by crystalliza-tion decrease. When adding an insulating layer made by hemp-lime plaster before adding the lime plaster the salts cause less visible damage to the internal plaster.
Full-scale test surfaces have been made both in the laboratory and inside two churches. After two and three years respectively, there are no visible salts causing damages inside the churches, where salts previously came back directly after each renovation. In the wall in the laboratory at Lund University the bricks where con-taminated with sodium sulphate and internally rendered with hemp-lime plaster with a lime plaster surface finish. Even though there are lots of salt-related damages externally there are thus far, more than two years after construction, no signs of any damage internally.
1 Conservation, Faculty of Art History, Uppsala University, Visby, Sweden,
[email protected] 2 Division of Building Materials, Faculty of Engineering, Lund University,
Lund, Sweden
277
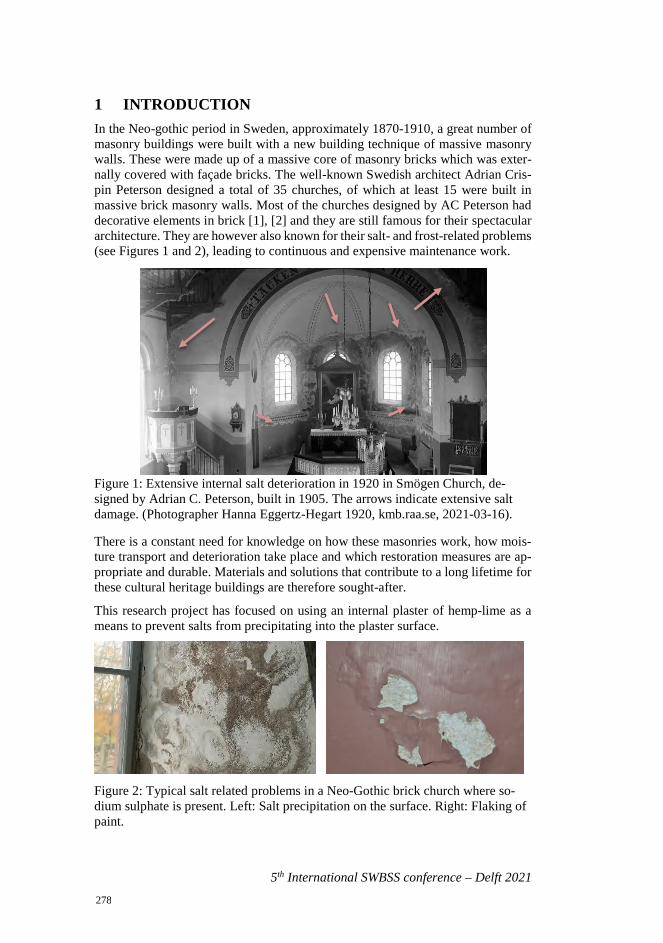
5th International SWBSS conference – Delft 2021
1 INTRODUCTION In the Neo-gothic period in Sweden, approximately 1870-1910, a great number of masonry buildings were built with a new building technique of massive masonry walls. These were made up of a massive core of masonry bricks which was exter-nally covered with façade bricks. The well-known Swedish architect Adrian Cris-pin Peterson designed a total of 35 churches, of which at least 15 were built in massive brick masonry walls. Most of the churches designed by AC Peterson had decorative elements in brick [1], [2] and they are still famous for their spectacular architecture. They are however also known for their salt- and frost-related problems (see Figures 1 and 2), leading to continuous and expensive maintenance work.
Figure 1: Extensive internal salt deterioration in 1920 in Smögen Church, de-signed by Adrian C. Peterson, built in 1905. The arrows indicate extensive salt damage. (Photographer Hanna Eggertz-Hegart 1920, kmb.raa.se, 2021-03-16).
There is a constant need for knowledge on how these masonries work, how mois-ture transport and deterioration take place and which restoration measures are ap-propriate and durable. Materials and solutions that contribute to a long lifetime for these cultural heritage buildings are therefore sought-after.
This research project has focused on using an internal plaster of hemp-lime as a means to prevent salts from precipitating into the plaster surface.
Figure 2: Typical salt related problems in a Neo-Gothic brick church where so-dium sulphate is present. Left: Salt precipitation on the surface. Right: Flaking of paint.
278
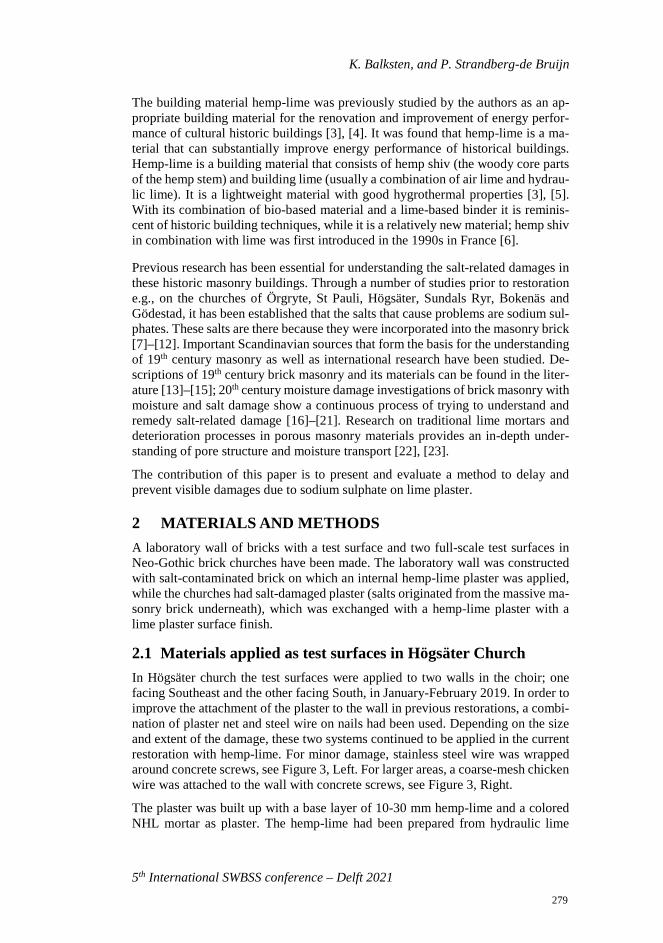
K. Balksten, and P. Strandberg-de Bruijn
5th International SWBSS conference – Delft 2021
The building material hemp-lime was previously studied by the authors as an ap-propriate building material for the renovation and improvement of energy perfor-mance of cultural historic buildings [3], [4]. It was found that hemp-lime is a ma-terial that can substantially improve energy performance of historical buildings. Hemp-lime is a building material that consists of hemp shiv (the woody core parts of the hemp stem) and building lime (usually a combination of air lime and hydrau-lic lime). It is a lightweight material with good hygrothermal properties [3], [5]. With its combination of bio-based material and a lime-based binder it is reminis-cent of historic building techniques, while it is a relatively new material; hemp shiv in combination with lime was first introduced in the 1990s in France [6].
Previous research has been essential for understanding the salt-related damages in these historic masonry buildings. Through a number of studies prior to restoration e.g., on the churches of Örgryte, St Pauli, Högsäter, Sundals Ryr, Bokenäs and Gödestad, it has been established that the salts that cause problems are sodium sul-phates. These salts are there because they were incorporated into the masonry brick [7]–[12]. Important Scandinavian sources that form the basis for the understanding of 19th century masonry as well as international research have been studied. De-scriptions of 19th century brick masonry and its materials can be found in the liter-ature [13]–[15]; 20th century moisture damage investigations of brick masonry with moisture and salt damage show a continuous process of trying to understand and remedy salt-related damage [16]–[21]. Research on traditional lime mortars and deterioration processes in porous masonry materials provides an in-depth under-standing of pore structure and moisture transport [22], [23].
The contribution of this paper is to present and evaluate a method to delay and prevent visible damages due to sodium sulphate on lime plaster.
2 MATERIALS AND METHODS A laboratory wall of bricks with a test surface and two full-scale test surfaces in Neo-Gothic brick churches have been made. The laboratory wall was constructed with salt-contaminated brick on which an internal hemp-lime plaster was applied, while the churches had salt-damaged plaster (salts originated from the massive ma-sonry brick underneath), which was exchanged with a hemp-lime plaster with a lime plaster surface finish.
2.1 Materials applied as test surfaces in Högsäter Church In Högsäter church the test surfaces were applied to two walls in the choir; one facing Southeast and the other facing South, in January-February 2019. In order to improve the attachment of the plaster to the wall in previous restorations, a combi-nation of plaster net and steel wire on nails had been used. Depending on the size and extent of the damage, these two systems continued to be applied in the current restoration with hemp-lime. For minor damage, stainless steel wire was wrapped around concrete screws, see Figure 3, Left. For larger areas, a coarse-mesh chicken wire was attached to the wall with concrete screws, see Figure 3, Right.
The plaster was built up with a base layer of 10-30 mm hemp-lime and a colored NHL mortar as plaster. The hemp-lime had been prepared from hydraulic lime
279
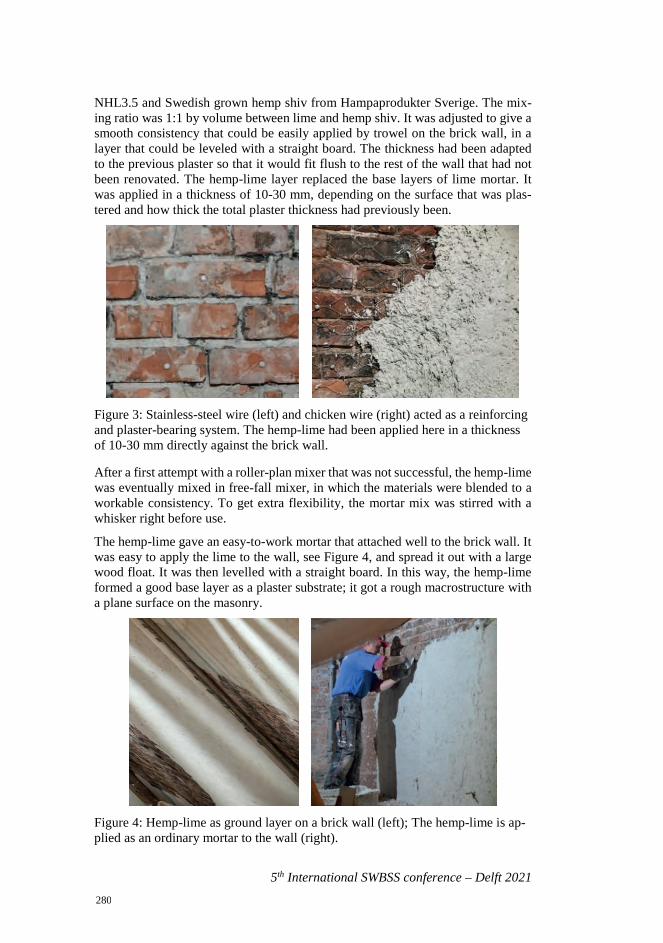
5th International SWBSS conference – Delft 2021
NHL3.5 and Swedish grown hemp shiv from Hampaprodukter Sverige. The mix-ing ratio was 1:1 by volume between lime and hemp shiv. It was adjusted to give a smooth consistency that could be easily applied by trowel on the brick wall, in a layer that could be leveled with a straight board. The thickness had been adapted to the previous plaster so that it would fit flush to the rest of the wall that had not been renovated. The hemp-lime layer replaced the base layers of lime mortar. It was applied in a thickness of 10-30 mm, depending on the surface that was plas-tered and how thick the total plaster thickness had previously been.
Figure 3: Stainless-steel wire (left) and chicken wire (right) acted as a reinforcing and plaster-bearing system. The hemp-lime had been applied here in a thickness of 10-30 mm directly against the brick wall.
After a first attempt with a roller-plan mixer that was not successful, the hemp-lime was eventually mixed in free-fall mixer, in which the materials were blended to a workable consistency. To get extra flexibility, the mortar mix was stirred with a whisker right before use.
The hemp-lime gave an easy-to-work mortar that attached well to the brick wall. It was easy to apply the lime to the wall, see Figure 4, and spread it out with a large wood float. It was then levelled with a straight board. In this way, the hemp-lime formed a good base layer as a plaster substrate; it got a rough macrostructure with a plane surface on the masonry.
Figure 4: Hemp-lime as ground layer on a brick wall (left); The hemp-lime is ap-plied as an ordinary mortar to the wall (right).
280
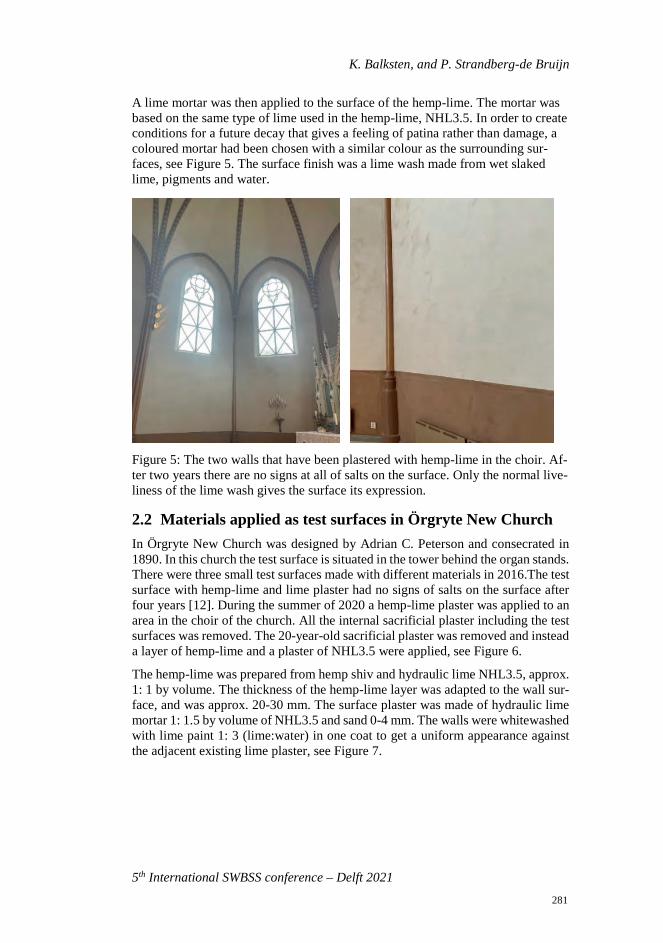
K. Balksten, and P. Strandberg-de Bruijn
5th International SWBSS conference – Delft 2021
A lime mortar was then applied to the surface of the hemp-lime. The mortar was based on the same type of lime used in the hemp-lime, NHL3.5. In order to create conditions for a future decay that gives a feeling of patina rather than damage, a coloured mortar had been chosen with a similar colour as the surrounding sur-faces, see Figure 5. The surface finish was a lime wash made from wet slaked lime, pigments and water.
Figure 5: The two walls that have been plastered with hemp-lime in the choir. Af-ter two years there are no signs at all of salts on the surface. Only the normal live-liness of the lime wash gives the surface its expression.
2.2 Materials applied as test surfaces in Örgryte New Church In Örgryte New Church was designed by Adrian C. Peterson and consecrated in 1890. In this church the test surface is situated in the tower behind the organ stands. There were three small test surfaces made with different materials in 2016.The test surface with hemp-lime and lime plaster had no signs of salts on the surface after four years [12]. During the summer of 2020 a hemp-lime plaster was applied to an area in the choir of the church. All the internal sacrificial plaster including the test surfaces was removed. The 20-year-old sacrificial plaster was removed and instead a layer of hemp-lime and a plaster of NHL3.5 were applied, see Figure 6.
The hemp-lime was prepared from hemp shiv and hydraulic lime NHL3.5, approx. 1: 1 by volume. The thickness of the hemp-lime layer was adapted to the wall sur-face, and was approx. 20-30 mm. The surface plaster was made of hydraulic lime mortar 1: 1.5 by volume of NHL3.5 and sand 0-4 mm. The walls were whitewashed with lime paint 1: 3 (lime:water) in one coat to get a uniform appearance against the adjacent existing lime plaster, see Figure 7.
281
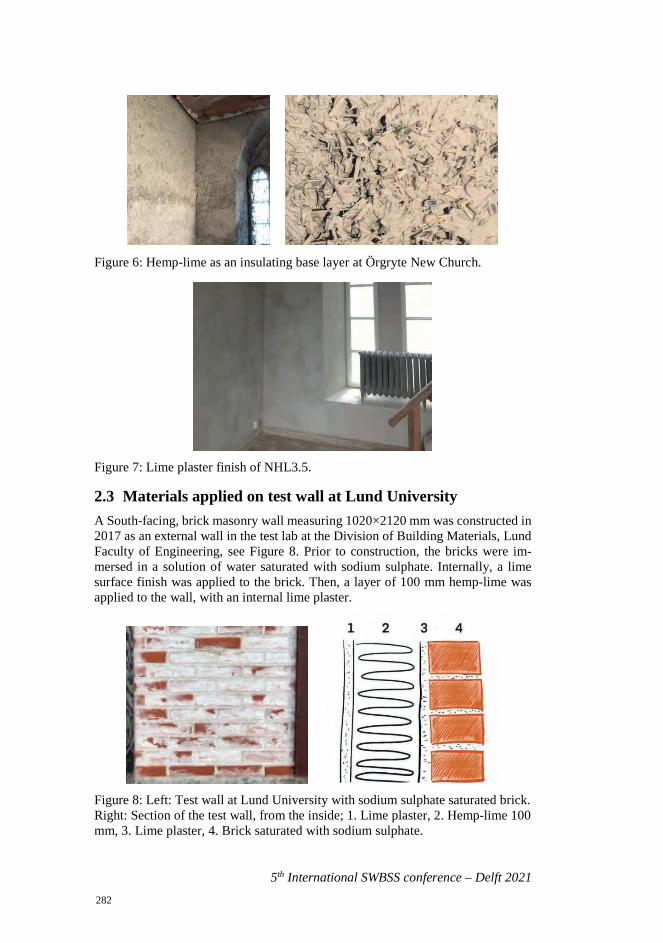
5th International SWBSS conference – Delft 2021
Figure 6: Hemp-lime as an insulating base layer at Örgryte New Church.
Figure 7: Lime plaster finish of NHL3.5.
2.3 Materials applied on test wall at Lund University A South-facing, brick masonry wall measuring 1020×2120 mm was constructed in 2017 as an external wall in the test lab at the Division of Building Materials, Lund Faculty of Engineering, see Figure 8. Prior to construction, the bricks were im-mersed in a solution of water saturated with sodium sulphate. Internally, a lime surface finish was applied to the brick. Then, a layer of 100 mm hemp-lime was applied to the wall, with an internal lime plaster.
Figure 8: Left: Test wall at Lund University with sodium sulphate saturated brick. Right: Section of the test wall, from the inside; 1. Lime plaster, 2. Hemp-lime 100 mm, 3. Lime plaster, 4. Brick saturated with sodium sulphate.
282
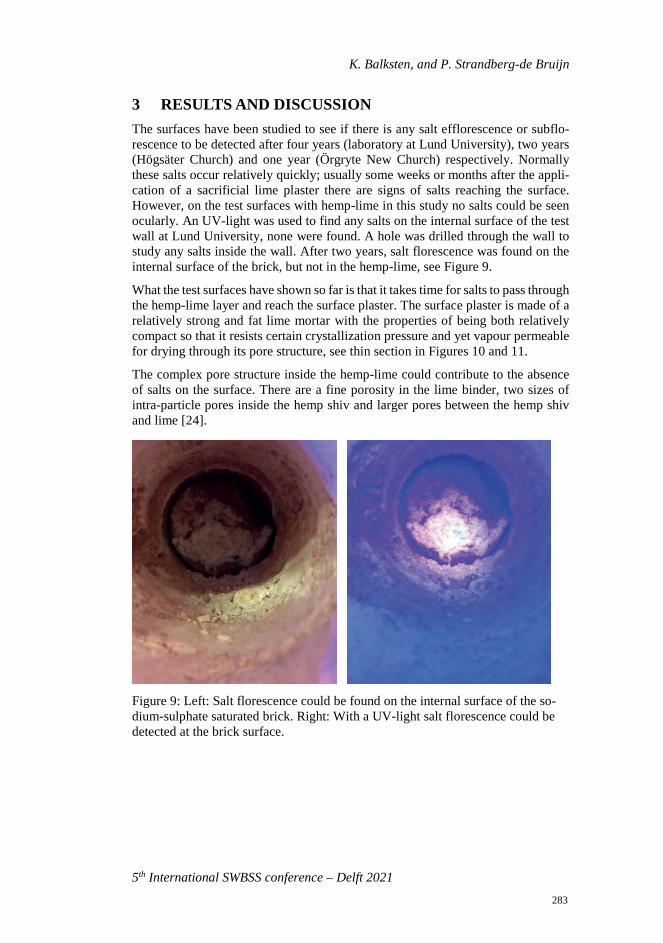
K. Balksten, and P. Strandberg-de Bruijn
5th International SWBSS conference – Delft 2021
3 RESULTS AND DISCUSSION The surfaces have been studied to see if there is any salt efflorescence or subflo-rescence to be detected after four years (laboratory at Lund University), two years (Högsäter Church) and one year (Örgryte New Church) respectively. Normally these salts occur relatively quickly; usually some weeks or months after the appli-cation of a sacrificial lime plaster there are signs of salts reaching the surface. However, on the test surfaces with hemp-lime in this study no salts could be seen ocularly. An UV-light was used to find any salts on the internal surface of the test wall at Lund University, none were found. A hole was drilled through the wall to study any salts inside the wall. After two years, salt florescence was found on the internal surface of the brick, but not in the hemp-lime, see Figure 9.
What the test surfaces have shown so far is that it takes time for salts to pass through the hemp-lime layer and reach the surface plaster. The surface plaster is made of a relatively strong and fat lime mortar with the properties of being both relatively compact so that it resists certain crystallization pressure and yet vapour permeable for drying through its pore structure, see thin section in Figures 10 and 11.
The complex pore structure inside the hemp-lime could contribute to the absence of salts on the surface. There are a fine porosity in the lime binder, two sizes of intra-particle pores inside the hemp shiv and larger pores between the hemp shiv and lime [24].
Figure 9: Left: Salt florescence could be found on the internal surface of the so-dium-sulphate saturated brick. Right: With a UV-light salt florescence could be detected at the brick surface.
283
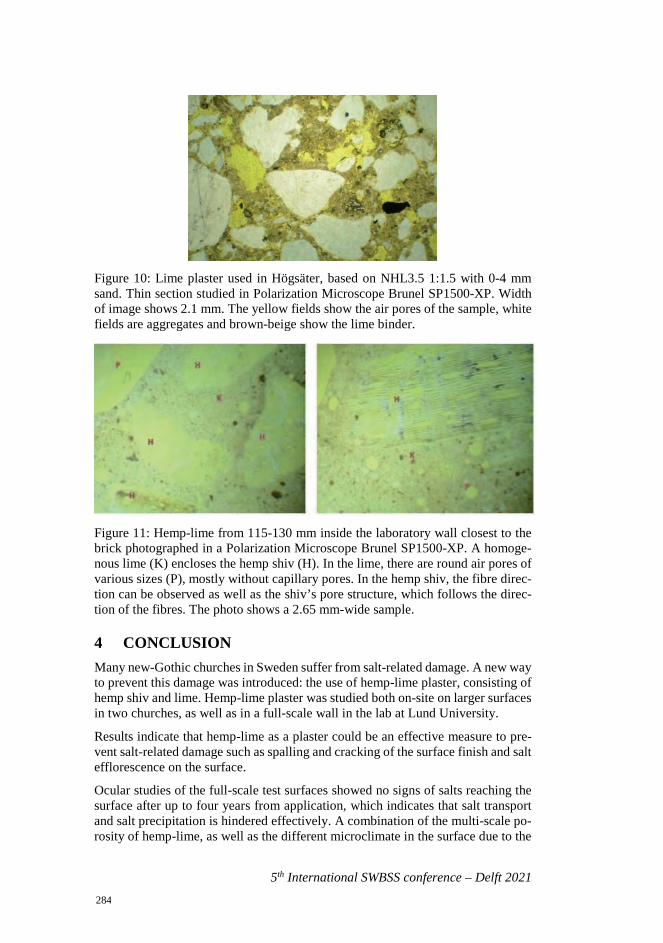
5th International SWBSS conference – Delft 2021
Figure 10: Lime plaster used in Högsäter, based on NHL3.5 1:1.5 with 0-4 mm sand. Thin section studied in Polarization Microscope Brunel SP1500-XP. Width of image shows 2.1 mm. The yellow fields show the air pores of the sample, white fields are aggregates and brown-beige show the lime binder.
Figure 11: Hemp-lime from 115-130 mm inside the laboratory wall closest to the brick photographed in a Polarization Microscope Brunel SP1500-XP. A homoge-nous lime (K) encloses the hemp shiv (H). In the lime, there are round air pores of various sizes (P), mostly without capillary pores. In the hemp shiv, the fibre direc-tion can be observed as well as the shiv’s pore structure, which follows the direc-tion of the fibres. The photo shows a 2.65 mm-wide sample.
4 CONCLUSION Many new-Gothic churches in Sweden suffer from salt-related damage. A new way to prevent this damage was introduced: the use of hemp-lime plaster, consisting of hemp shiv and lime. Hemp-lime plaster was studied both on-site on larger surfaces in two churches, as well as in a full-scale wall in the lab at Lund University.
Results indicate that hemp-lime as a plaster could be an effective measure to pre-vent salt-related damage such as spalling and cracking of the surface finish and salt efflorescence on the surface.
Ocular studies of the full-scale test surfaces showed no signs of salts reaching the surface after up to four years from application, which indicates that salt transport and salt precipitation is hindered effectively. A combination of the multi-scale po-rosity of hemp-lime, as well as the different microclimate in the surface due to the
284
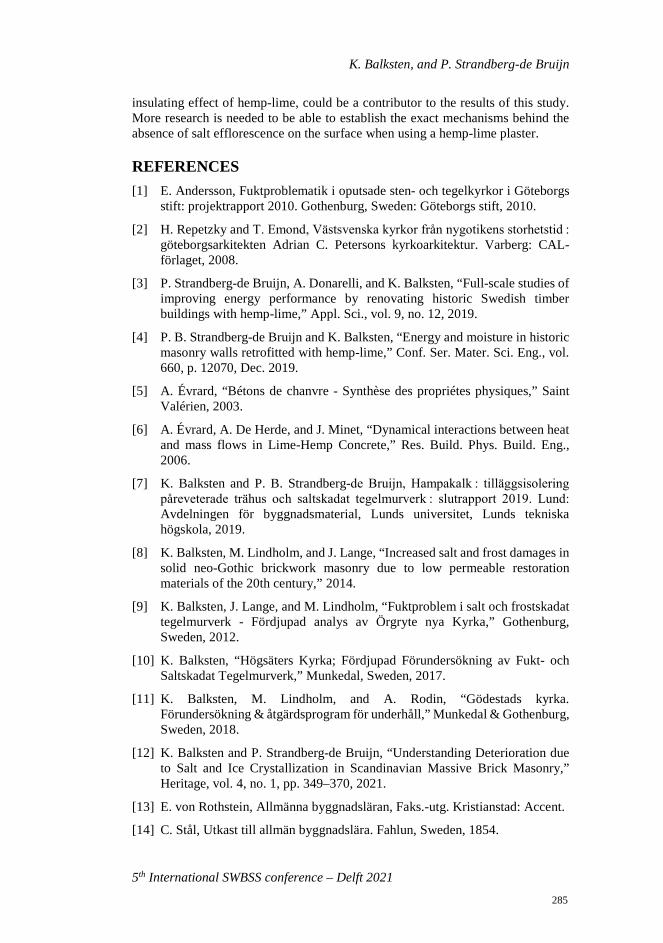
K. Balksten, and P. Strandberg-de Bruijn
5th International SWBSS conference – Delft 2021
insulating effect of hemp-lime, could be a contributor to the results of this study. More research is needed to be able to establish the exact mechanisms behind the absence of salt efflorescence on the surface when using a hemp-lime plaster.
REFERENCES [1] E. Andersson, Fuktproblematik i oputsade sten- och tegelkyrkor i Göteborgs
stift: projektrapport 2010. Gothenburg, Sweden: Göteborgs stift, 2010.
[2] H. Repetzky and T. Emond, Västsvenska kyrkor från nygotikens storhetstid : göteborgsarkitekten Adrian C. Petersons kyrkoarkitektur. Varberg: CAL-förlaget, 2008.
[3] P. Strandberg-de Bruijn, A. Donarelli, and K. Balksten, “Full-scale studies of improving energy performance by renovating historic Swedish timber buildings with hemp-lime,” Appl. Sci., vol. 9, no. 12, 2019.
[4] P. B. Strandberg-de Bruijn and K. Balksten, “Energy and moisture in historic masonry walls retrofitted with hemp-lime,” Conf. Ser. Mater. Sci. Eng., vol. 660, p. 12070, Dec. 2019.
[5] A. Évrard, “Bétons de chanvre - Synthèse des propriétes physiques,” Saint Valérien, 2003.
[6] A. Évrard, A. De Herde, and J. Minet, “Dynamical interactions between heat and mass flows in Lime-Hemp Concrete,” Res. Build. Phys. Build. Eng., 2006.
[7] K. Balksten and P. B. Strandberg-de Bruijn, Hampakalk : tilläggsisolering påreveterade trähus och saltskadat tegelmurverk : slutrapport 2019. Lund: Avdelningen för byggnadsmaterial, Lunds universitet, Lunds tekniska högskola, 2019.
[8] K. Balksten, M. Lindholm, and J. Lange, “Increased salt and frost damages in solid neo-Gothic brickwork masonry due to low permeable restoration materials of the 20th century,” 2014.
[9] K. Balksten, J. Lange, and M. Lindholm, “Fuktproblem i salt och frostskadat tegelmurverk - Fördjupad analys av Örgryte nya Kyrka,” Gothenburg, Sweden, 2012.
[10] K. Balksten, “Högsäters Kyrka; Fördjupad Förundersökning av Fukt- och Saltskadat Tegelmurverk,” Munkedal, Sweden, 2017.
[11] K. Balksten, M. Lindholm, and A. Rodin, “Gödestads kyrka. Förundersökning & åtgärdsprogram för underhåll,” Munkedal & Gothenburg, Sweden, 2018.
[12] K. Balksten and P. Strandberg-de Bruijn, “Understanding Deterioration due to Salt and Ice Crystallization in Scandinavian Massive Brick Masonry,” Heritage, vol. 4, no. 1, pp. 349–370, 2021.
[13] E. von Rothstein, Allmänna byggnadsläran, Faks.-utg. Kristianstad: Accent.
[14] C. Stål, Utkast till allmän byggnadslära. Fahlun, Sweden, 1854.
285
5th International SWBSS conference – Delft 2021
[15] A. Henström, Praktisk handbok i landtbyggnads-konsten: innefattande läran om byggnadsmaterialierna, bygnadsmaterialiernas bearbetning och sammanfogning, byggnadsdelarnes form, dimensioner och styrka. Örebro, Sweden: Beijer, 1869.
[16] Å. Eklind, “Saltvittring i äldre tegelmurverk: tekniska problem och metod att förhindra saltvittring,” Stockholm, 1983.
[17] H. Granholm, Om vattengenomslag i murade väggar med särskild hänsyn till tegel som fasadmaterial. Gothenburg, Sweden: Gumpert, 1958.
[18] G. Fagerlund, “Kritiska vattenmättnadsgrader i samband med frysning av porösa och spröda material.,” Lund, Sweden, 1972.
[19] J. Pühringer, Salt Disintegration: Salt Migration and Degradation by Salt: A Hypothesis. Stockholm, Sweden: Swedish Council for Building Research [Statens råd för byggnadsforskning], 1983.
[20] T. von Konow, The study of salt deterioration mechanisms : decay of brick walls influenced by interior climate changes. Suomenlinna: Suomenlinnan hoitokunta, 2002.
[21] A. Eriksson, Murtegel och tegelmurverk ur byggnadsteknisk synpunkt. Stockholm, Sweden: Swedish Brick Industry Association [Sveriges Tegelindustriförening], 1932.
[22] K. Balksten, “Traditional Lime Mortar and Plaster : Reconstruction with Emphasis on Durability,” Chalmers University of Technology, Gothenburg, Sweden, 2007.
[23] T. von Konow, Restaurering och Reparation med Puts- och Murbruk. Åbo, Finland: Åbo Akademi, 1997.
[24] P. Glé, E. Gourdon, and L. Arnaud, “Acoustical properties of materials made of vegetable particles with several scales of porosity,” Appl. Acoust., vol. 72, no. 5, pp. 249–259, 2011.
286
5th International SWBSS conference – Delft 2021
DESALINATION, A HERITAGE ARCHITECT’S PERSPECTIVE
Ramon Pater1*
KEYWORDS
On-site desalination, post-treatments, sodium sulphate, heating systems
ABSTRACT Desalination can be a solution to conserve our monuments, but on what conditions? With two desalination projects in Amsterdam in the last 2 decades, we’ve worked alongside the researchers of TNO and TU Delft to find solutions to create the optimal conditions for large scale desalination in situ.
In project ‘De Waag’, the mail goal was to conserve the Masterpieces of masonry from the 17th century, which were damaged by mostly NaCl2. For an in-situ treatment we have looked at methods suitable to use at large scale. This resulted in a mechanical application of the poultice by spraying. While the treatment to reduce the saturation of salt was successful, a post-treatment was needed in order to clean the masterpieces of the debris left by the clay (kaolin) in the poultice.
With knowledge of the Waag, the tower of the Zuiderkerk (1614), offered a new challenge. In this case sodium sulphate was the dominant salt responsible for degradation of the masonry. Reducing sodium sulphate has more risks, and those risks can only be controlled while applying a poultice in warmer condition. The main goal was to find a solution to partly heathen the wall on those parts of the tower where salt load was too high. Trying several electrical heating systems, we’ve found the most ideal option.
Both projects resulted in some practical and effective options, but also lessons learned by all the trails conducted. Main conclusion is that large scale in-situ desalination is possible, and methods to make it effective can be useful for other projects, but only after extensive research and monitoring.
1 Archivolt architecten bv, Hoogoorddreef 5, 1011BA Amsterdam, The
Netherlands, [email protected]
287
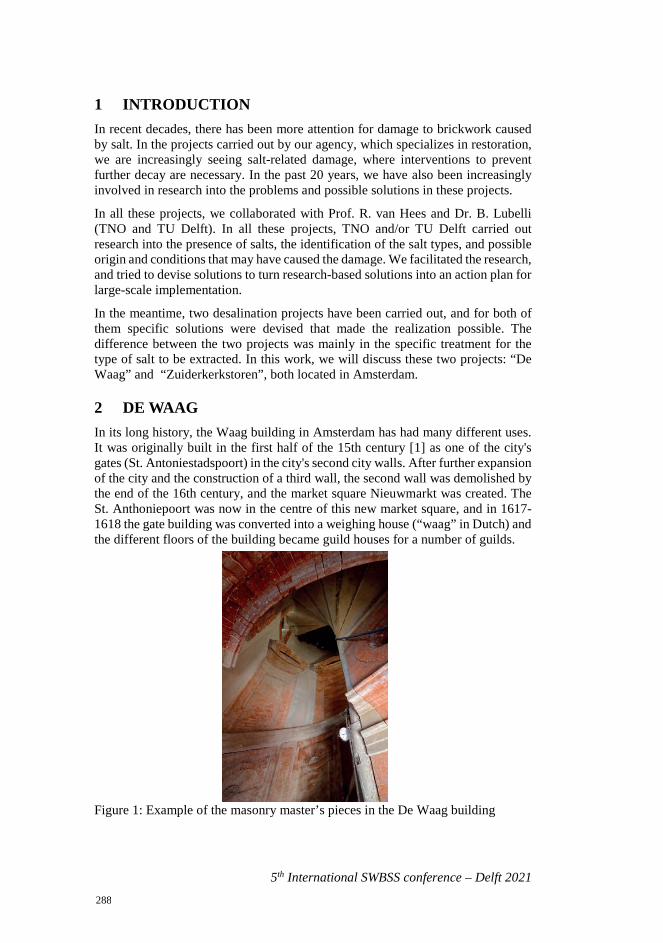
5th International SWBSS conference – Delft 2021
1 INTRODUCTION In recent decades, there has been more attention for damage to brickwork caused by salt. In the projects carried out by our agency, which specializes in restoration, we are increasingly seeing salt-related damage, where interventions to prevent further decay are necessary. In the past 20 years, we have also been increasingly involved in research into the problems and possible solutions in these projects.
In all these projects, we collaborated with Prof. R. van Hees and Dr. B. Lubelli (TNO and TU Delft). In all these projects, TNO and/or TU Delft carried out research into the presence of salts, the identification of the salt types, and possible origin and conditions that may have caused the damage. We facilitated the research, and tried to devise solutions to turn research-based solutions into an action plan for large-scale implementation.
In the meantime, two desalination projects have been carried out, and for both of them specific solutions were devised that made the realization possible. The difference between the two projects was mainly in the specific treatment for the type of salt to be extracted. In this work, we will discuss these two projects: “De Waag” and “Zuiderkerkstoren”, both located in Amsterdam.
2 DE WAAG In its long history, the Waag building in Amsterdam has had many different uses. It was originally built in the first half of the 15th century [1] as one of the city's gates (St. Antoniestadspoort) in the city's second city walls. After further expansion of the city and the construction of a third wall, the second wall was demolished by the end of the 16th century, and the market square Nieuwmarkt was created. The St. Anthoniepoort was now in the centre of this new market square, and in 1617-1618 the gate building was converted into a weighing house (“waag” in Dutch) and the different floors of the building became guild houses for a number of guilds.
Figure 1: Example of the masonry master’s pieces in the De Waag building
288
R. Pater
5th International SWBSS conference – Delft 2021
The focus of the research and the realization project was in particular on the entrance tower of the Mason's Guild. It was mainly on the inside of the tower, along the stone spiral staircase, where members of the guild demonstrated their skills in master's pieces.
These master's pieces consist of richly ornamented masonry wall decorations, several also being part of the parapet along the spiral staircase. A striking aspect of the master's pieces is that almost all the stones are very precisely cut and sanded in shape with only very narrow joints (max. 1 mm wide). Unfortunately, a growing number of these master's pieces show damage due to the presence of salt in the stone. The damage to the stones was progressively increasing, and without treatment, these pieces of high cultural and historical importance would be lost.
2.1 Preliminary research The research carried out by TNO/TU Delft in 2007-2008 was mainly aimed at clarifying what type of salts caused the problem, the reasons why these salts were now causing damage, and finding the most appropriate method to prevent further deterioration.
The most important results of this research were [2].
- The salt predominantly found in the master's pieces is NaCl. We can only speculate about the causes of the presence of the salt. A plausible cause could be that water was used from the canal that still runs under the building today2.
- There was no clear source (i.e. rain-penetration or capillarity of surface water) in the masterpieces that might have activated the salt. However, the decision was made to ensure the best possible water barrier on the exterior by re-pointing the tower.
The fluctuations in temperature and relative humidity in the tower often matched the outside climate. The fluctuations were such that, in particular, NaCl cycles of crystallization occurred. The tower did not offer any possibilities to prevent the crystallization cycles by means of climate control.
With this in mind, further research focused on the possible use of a desalination method. In their research, TNO/TU-Delft also looked at the properties of the bricks and its suitability for salt extraction using a poultice. The stones used in the masonry proved to be porous, allowing moisture to penetrate easily into the brick. good moisture transport is required when an extraction method is used. The brick provided sufficient possibilities for this.
2 In the 17th century, the canals were still open to what was then the Zuiderzee.
With the construction of the Afsluitdijk, from 1927 to 1933, the Zuiderzee became the present IJsselmeer. Without the influence of the sea, the IJsselmeer is fed by fresh water from rivers. As a result, the salt content in the canals also decreased rapidly.
289
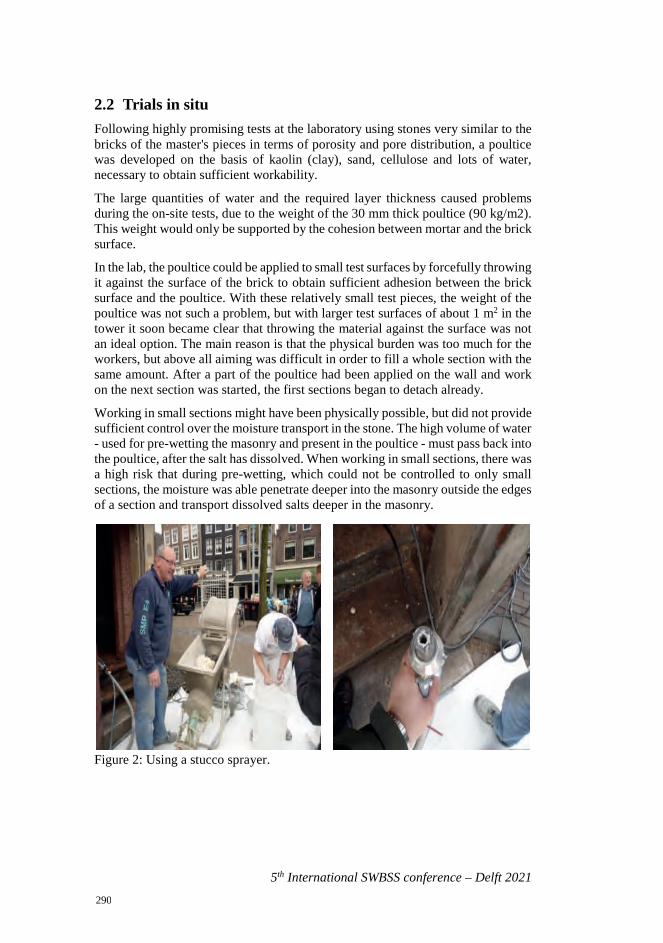
5th International SWBSS conference – Delft 2021
2.2 Trials in situ Following highly promising tests at the laboratory using stones very similar to the bricks of the master's pieces in terms of porosity and pore distribution, a poultice was developed on the basis of kaolin (clay), sand, cellulose and lots of water, necessary to obtain sufficient workability.
The large quantities of water and the required layer thickness caused problems during the on-site tests, due to the weight of the 30 mm thick poultice (90 kg/m2). This weight would only be supported by the cohesion between mortar and the brick surface.
In the lab, the poultice could be applied to small test surfaces by forcefully throwing it against the surface of the brick to obtain sufficient adhesion between the brick surface and the poultice. With these relatively small test pieces, the weight of the poultice was not such a problem, but with larger test surfaces of about 1 m2 in the tower it soon became clear that throwing the material against the surface was not an ideal option. The main reason is that the physical burden was too much for the workers, but above all aiming was difficult in order to fill a whole section with the same amount. After a part of the poultice had been applied on the wall and work on the next section was started, the first sections began to detach already.
Working in small sections might have been physically possible, but did not provide sufficient control over the moisture transport in the stone. The high volume of water - used for pre-wetting the masonry and present in the poultice - must pass back into the poultice, after the salt has dissolved. When working in small sections, there was a high risk that during pre-wetting, which could not be controlled to only small sections, the moisture was able penetrate deeper into the masonry outside the edges of a section and transport dissolved salts deeper in the masonry.
Figure 2: Using a stucco sprayer.
290
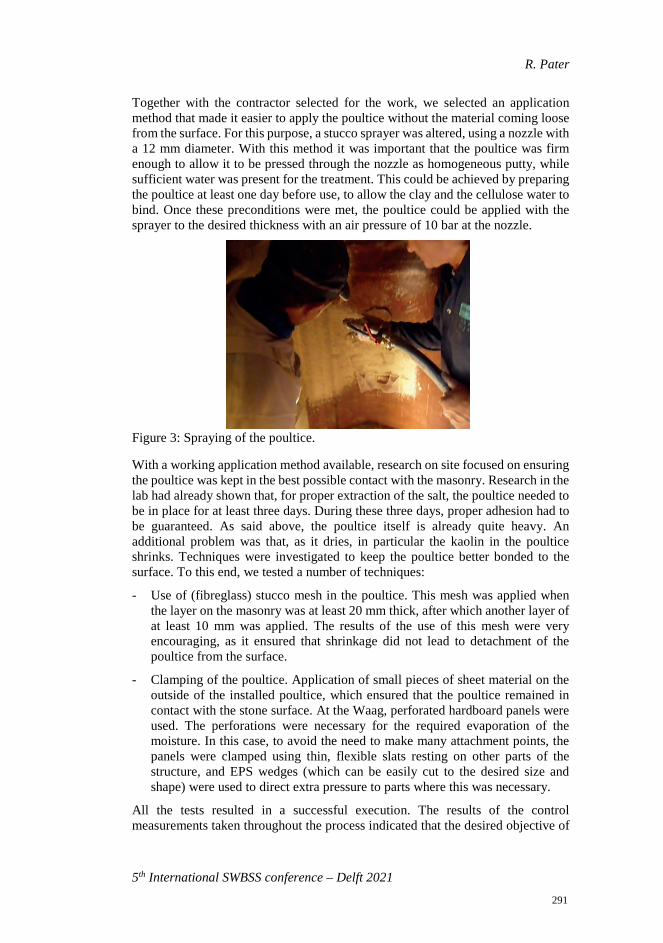
R. Pater
5th International SWBSS conference – Delft 2021
Together with the contractor selected for the work, we selected an application method that made it easier to apply the poultice without the material coming loose from the surface. For this purpose, a stucco sprayer was altered, using a nozzle with a 12 mm diameter. With this method it was important that the poultice was firm enough to allow it to be pressed through the nozzle as homogeneous putty, while sufficient water was present for the treatment. This could be achieved by preparing the poultice at least one day before use, to allow the clay and the cellulose water to bind. Once these preconditions were met, the poultice could be applied with the sprayer to the desired thickness with an air pressure of 10 bar at the nozzle.
Figure 3: Spraying of the poultice.
With a working application method available, research on site focused on ensuring the poultice was kept in the best possible contact with the masonry. Research in the lab had already shown that, for proper extraction of the salt, the poultice needed to be in place for at least three days. During these three days, proper adhesion had to be guaranteed. As said above, the poultice itself is already quite heavy. An additional problem was that, as it dries, in particular the kaolin in the poultice shrinks. Techniques were investigated to keep the poultice better bonded to the surface. To this end, we tested a number of techniques:
- Use of (fibreglass) stucco mesh in the poultice. This mesh was applied when the layer on the masonry was at least 20 mm thick, after which another layer of at least 10 mm was applied. The results of the use of this mesh were very encouraging, as it ensured that shrinkage did not lead to detachment of the poultice from the surface.
- Clamping of the poultice. Application of small pieces of sheet material on the outside of the installed poultice, which ensured that the poultice remained in contact with the stone surface. At the Waag, perforated hardboard panels were used. The perforations were necessary for the required evaporation of the moisture. In this case, to avoid the need to make many attachment points, the panels were clamped using thin, flexible slats resting on other parts of the structure, and EPS wedges (which can be easily cut to the desired size and shape) were used to direct extra pressure to parts where this was necessary.
All the tests resulted in a successful execution. The results of the control measurements taken throughout the process indicated that the desired objective of
291
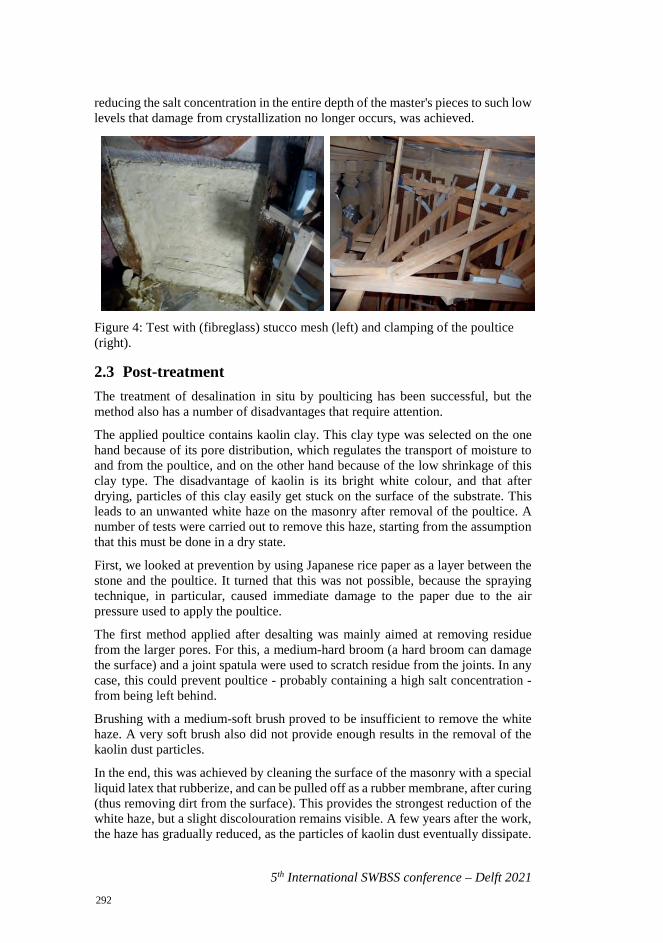
5th International SWBSS conference – Delft 2021
reducing the salt concentration in the entire depth of the master's pieces to such low levels that damage from crystallization no longer occurs, was achieved.
Figure 4: Test with (fibreglass) stucco mesh (left) and clamping of the poultice (right).
2.3 Post-treatment The treatment of desalination in situ by poulticing has been successful, but the method also has a number of disadvantages that require attention.
The applied poultice contains kaolin clay. This clay type was selected on the one hand because of its pore distribution, which regulates the transport of moisture to and from the poultice, and on the other hand because of the low shrinkage of this clay type. The disadvantage of kaolin is its bright white colour, and that after drying, particles of this clay easily get stuck on the surface of the substrate. This leads to an unwanted white haze on the masonry after removal of the poultice. A number of tests were carried out to remove this haze, starting from the assumption that this must be done in a dry state.
First, we looked at prevention by using Japanese rice paper as a layer between the stone and the poultice. It turned that this was not possible, because the spraying technique, in particular, caused immediate damage to the paper due to the air pressure used to apply the poultice.
The first method applied after desalting was mainly aimed at removing residue from the larger pores. For this, a medium-hard broom (a hard broom can damage the surface) and a joint spatula were used to scratch residue from the joints. In any case, this could prevent poultice - probably containing a high salt concentration - from being left behind.
Brushing with a medium-soft brush proved to be insufficient to remove the white haze. A very soft brush also did not provide enough results in the removal of the kaolin dust particles.
In the end, this was achieved by cleaning the surface of the masonry with a special liquid latex that rubberize, and can be pulled off as a rubber membrane, after curing (thus removing dirt from the surface). This provides the strongest reduction of the white haze, but a slight discolouration remains visible. A few years after the work, the haze has gradually reduced, as the particles of kaolin dust eventually dissipate.
292
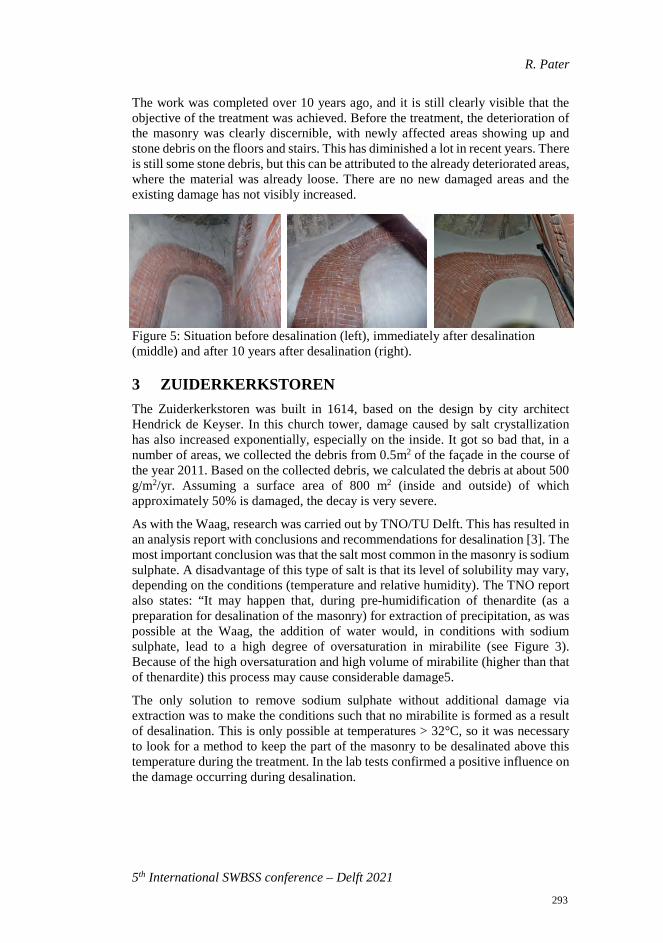
R. Pater
5th International SWBSS conference – Delft 2021
The work was completed over 10 years ago, and it is still clearly visible that the objective of the treatment was achieved. Before the treatment, the deterioration of the masonry was clearly discernible, with newly affected areas showing up and stone debris on the floors and stairs. This has diminished a lot in recent years. There is still some stone debris, but this can be attributed to the already deteriorated areas, where the material was already loose. There are no new damaged areas and the existing damage has not visibly increased.
Figure 5: Situation before desalination (left), immediately after desalination (middle) and after 10 years after desalination (right).
3 ZUIDERKERKSTOREN The Zuiderkerkstoren was built in 1614, based on the design by city architect Hendrick de Keyser. In this church tower, damage caused by salt crystallization has also increased exponentially, especially on the inside. It got so bad that, in a number of areas, we collected the debris from 0.5m2 of the façade in the course of the year 2011. Based on the collected debris, we calculated the debris at about 500 g/m2/yr. Assuming a surface area of 800 m2 (inside and outside) of which approximately 50% is damaged, the decay is very severe.
As with the Waag, research was carried out by TNO/TU Delft. This has resulted in an analysis report with conclusions and recommendations for desalination [3]. The most important conclusion was that the salt most common in the masonry is sodium sulphate. A disadvantage of this type of salt is that its level of solubility may vary, depending on the conditions (temperature and relative humidity). The TNO report also states: “It may happen that, during pre-humidification of thenardite (as a preparation for desalination of the masonry) for extraction of precipitation, as was possible at the Waag, the addition of water would, in conditions with sodium sulphate, lead to a high degree of oversaturation in mirabilite (see Figure 3). Because of the high oversaturation and high volume of mirabilite (higher than that of thenardite) this process may cause considerable damage5.
The only solution to remove sodium sulphate without additional damage via extraction was to make the conditions such that no mirabilite is formed as a result of desalination. This is only possible at temperatures > 32°C, so it was necessary to look for a method to keep the part of the masonry to be desalinated above this temperature during the treatment. In the lab tests confirmed a positive influence on the damage occurring during desalination.
293
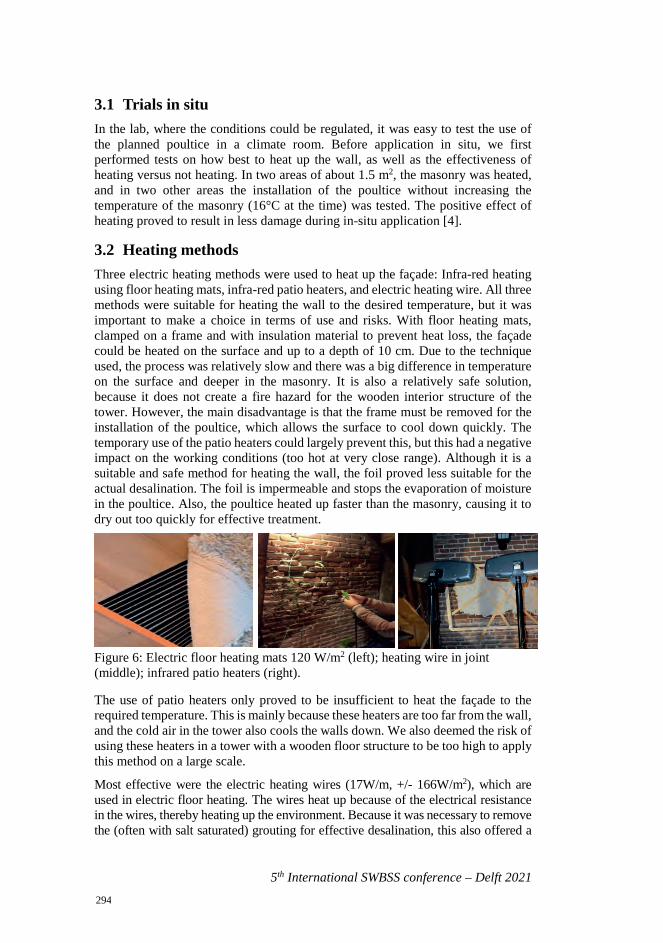
5th International SWBSS conference – Delft 2021
3.1 Trials in situ In the lab, where the conditions could be regulated, it was easy to test the use of the planned poultice in a climate room. Before application in situ, we first performed tests on how best to heat up the wall, as well as the effectiveness of heating versus not heating. In two areas of about 1.5 m2, the masonry was heated, and in two other areas the installation of the poultice without increasing the temperature of the masonry (16°C at the time) was tested. The positive effect of heating proved to result in less damage during in-situ application [4].
3.2 Heating methods Three electric heating methods were used to heat up the façade: Infra-red heating using floor heating mats, infra-red patio heaters, and electric heating wire. All three methods were suitable for heating the wall to the desired temperature, but it was important to make a choice in terms of use and risks. With floor heating mats, clamped on a frame and with insulation material to prevent heat loss, the façade could be heated on the surface and up to a depth of 10 cm. Due to the technique used, the process was relatively slow and there was a big difference in temperature on the surface and deeper in the masonry. It is also a relatively safe solution, because it does not create a fire hazard for the wooden interior structure of the tower. However, the main disadvantage is that the frame must be removed for the installation of the poultice, which allows the surface to cool down quickly. The temporary use of the patio heaters could largely prevent this, but this had a negative impact on the working conditions (too hot at very close range). Although it is a suitable and safe method for heating the wall, the foil proved less suitable for the actual desalination. The foil is impermeable and stops the evaporation of moisture in the poultice. Also, the poultice heated up faster than the masonry, causing it to dry out too quickly for effective treatment.
Figure 6: Electric floor heating mats 120 W/m2 (left); heating wire in joint (middle); infrared patio heaters (right).
The use of patio heaters only proved to be insufficient to heat the façade to the required temperature. This is mainly because these heaters are too far from the wall, and the cold air in the tower also cools the walls down. We also deemed the risk of using these heaters in a tower with a wooden floor structure to be too high to apply this method on a large scale.
Most effective were the electric heating wires (17W/m, +/- 166W/m2), which are used in electric floor heating. The wires heat up because of the electrical resistance in the wires, thereby heating up the environment. Because it was necessary to remove the (often with salt saturated) grouting for effective desalination, this also offered a
294
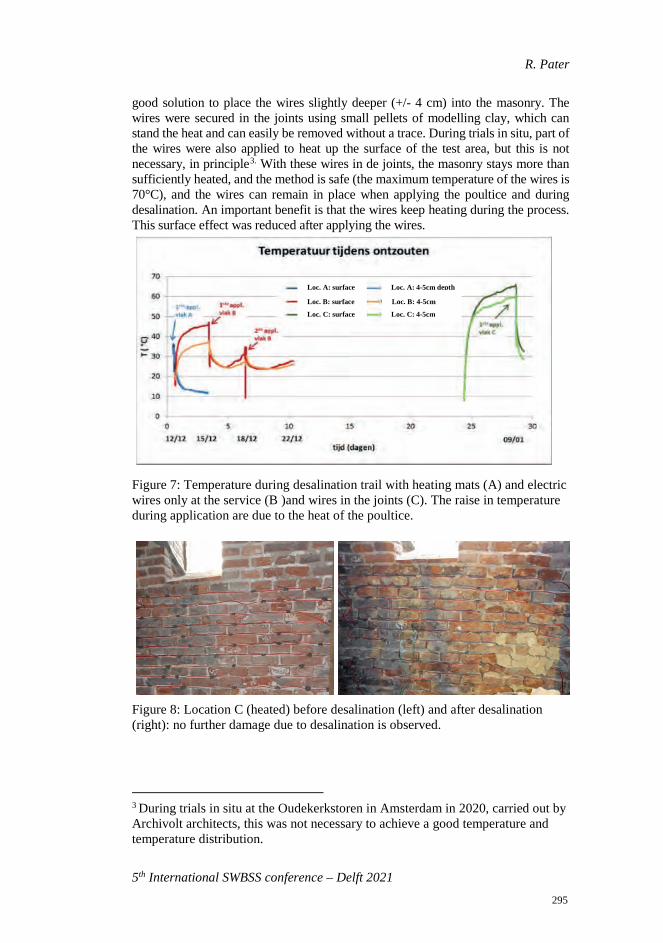
R. Pater
5th International SWBSS conference – Delft 2021
good solution to place the wires slightly deeper (+/- 4 cm) into the masonry. The wires were secured in the joints using small pellets of modelling clay, which can stand the heat and can easily be removed without a trace. During trials in situ, part of the wires were also applied to heat up the surface of the test area, but this is not necessary, in principle3. With these wires in de joints, the masonry stays more than sufficiently heated, and the method is safe (the maximum temperature of the wires is 70°C), and the wires can remain in place when applying the poultice and during desalination. An important benefit is that the wires keep heating during the process. This surface effect was reduced after applying the wires.
Figure 7: Temperature during desalination trail with heating mats (A) and electric wires only at the service (B )and wires in the joints (C). The raise in temperature during application are due to the heat of the poultice.
Figure 8: Location C (heated) before desalination (left) and after desalination (right): no further damage due to desalination is observed.
3 During trials in situ at the Oudekerkstoren in Amsterdam in 2020, carried out by Archivolt architects, this was not necessary to achieve a good temperature and temperature distribution.
Loc. A: surface
Loc. B: surface
Loc. C: surface
Loc. A: 4-5cm depth
Loc. B: 4-5cm Loc. C: 4-5cm
295
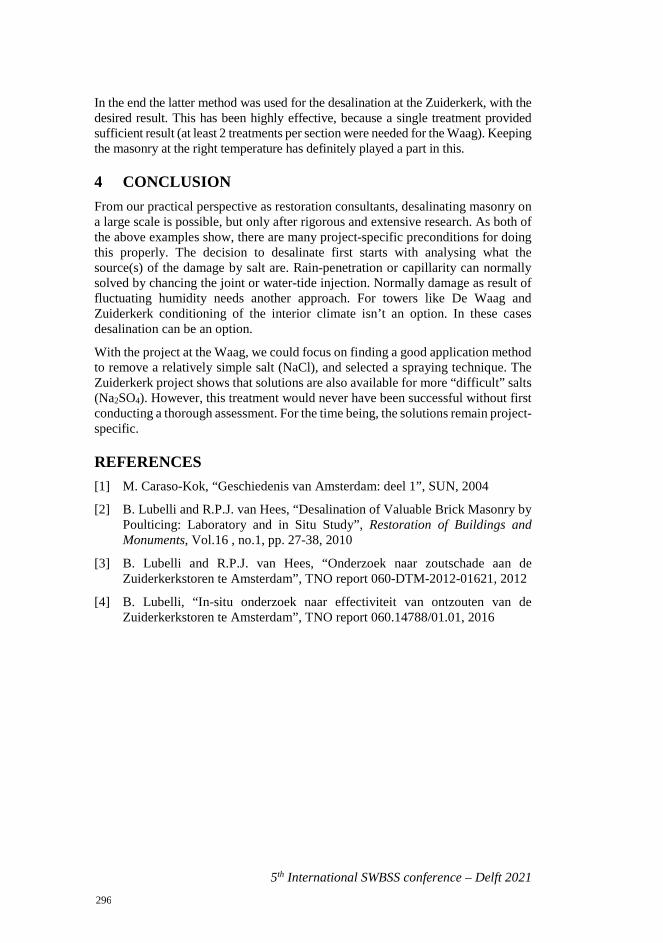
5th International SWBSS conference – Delft 2021
In the end the latter method was used for the desalination at the Zuiderkerk, with the desired result. This has been highly effective, because a single treatment provided sufficient result (at least 2 treatments per section were needed for the Waag). Keeping the masonry at the right temperature has definitely played a part in this.
4 CONCLUSION From our practical perspective as restoration consultants, desalinating masonry on a large scale is possible, but only after rigorous and extensive research. As both of the above examples show, there are many project-specific preconditions for doing this properly. The decision to desalinate first starts with analysing what the source(s) of the damage by salt are. Rain-penetration or capillarity can normally solved by chancing the joint or water-tide injection. Normally damage as result of fluctuating humidity needs another approach. For towers like De Waag and Zuiderkerk conditioning of the interior climate isn’t an option. In these cases desalination can be an option.
With the project at the Waag, we could focus on finding a good application method to remove a relatively simple salt (NaCl), and selected a spraying technique. The Zuiderkerk project shows that solutions are also available for more “difficult” salts (Na2SO4). However, this treatment would never have been successful without first conducting a thorough assessment. For the time being, the solutions remain project-specific.
REFERENCES [1] M. Caraso-Kok, “Geschiedenis van Amsterdam: deel 1”, SUN, 2004
[2] B. Lubelli and R.P.J. van Hees, “Desalination of Valuable Brick Masonry by Poulticing: Laboratory and in Situ Study”, Restoration of Buildings and Monuments, Vol.16 , no.1, pp. 27-38, 2010
[3] B. Lubelli and R.P.J. van Hees, “Onderzoek naar zoutschade aan de Zuiderkerkstoren te Amsterdam”, TNO report 060-DTM-2012-01621, 2012
[4] B. Lubelli, “In-situ onderzoek naar effectiviteit van ontzouten van de Zuiderkerkstoren te Amsterdam”, TNO report 060.14788/01.01, 2016
296
5th International SWBSS conference – Delft 2021
THE CONSERVATION OF DUTCH ARCHITECTURAL GLAZED CERAMIC TILES CONTAINING SOLUBLE SALTS: APPROACHES IN PRACTICE AND DILEMMAS FACED BY THE CONSERVATOR
Michiel W. Overhoff1*
KEYWORDS Tin-glazed tiles, soluble salts, conservation, restoration
ABSTRACT Tin-glazed tiles for architectural purposes were produced in the Netherlands from the end of the 16th century. These tiles were extensively used in buildings in the Netherlands, but they are also found as far away as Brazil. Today tiles are consid-ered important cultural heritage with a clear historical value, but often also an aes-thetic or even an artistic value. They may be valued as individual tiles, but it is important to also consider their value within an ensemble. Tin-glazed tiles that are still in situ can be badly affected by crystallizing salts. Unfortunately, it is the most defining part of the tile, the glaze-layer, that is most vulnerable. The conservation of tin-glazed tiles affected by soluble salts often requires invasive treatments in-cluding removing the tiles from their location and desalinating them in water. Such treatment is not without risk for the tiles. In other situations, tiles might have to be replaced with replicas or similar contemporary tiles. In order to be able to justify any such treatment it is important for the conservator to acquire a better under-standing of the causes of the salt crystallization. This requires research, performed by a researcher specialized in this field, and which should include investigations into the moisture sources and the amount and type of salt ions that are present. This information is often necessary in order to determine a conservation strategy that best preserves the value of the tile with as minimal intervention as required. For the preservation of tin-glazed tiles it is important that the value of research is better understood by both conservators and other stakeholders.
1 Restauratieatelier Overhoff, Amsterdam, [email protected]
297
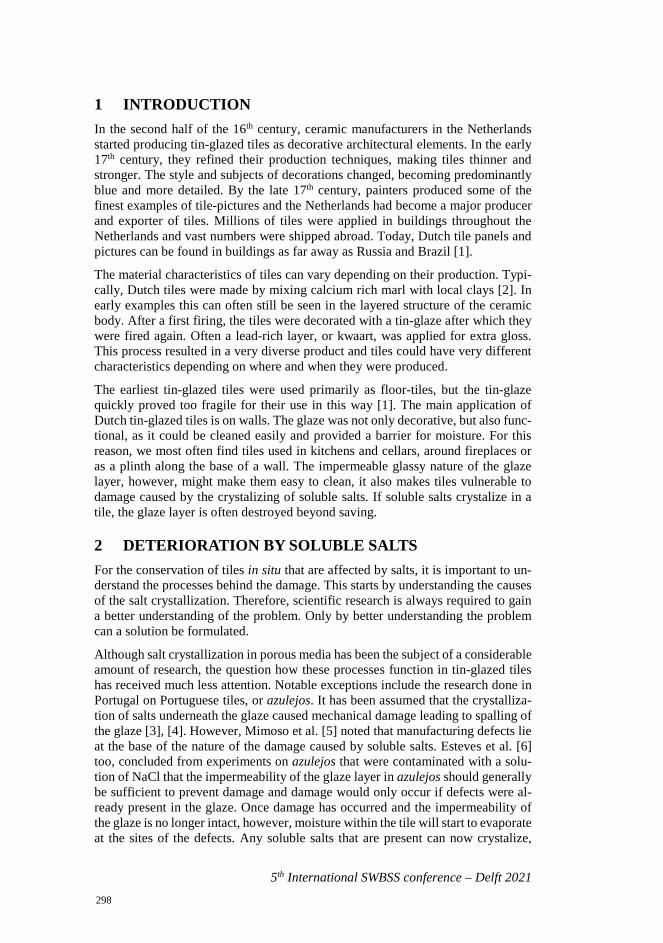
5th International SWBSS conference – Delft 2021
1 INTRODUCTION In the second half of the 16th century, ceramic manufacturers in the Netherlands started producing tin-glazed tiles as decorative architectural elements. In the early 17th century, they refined their production techniques, making tiles thinner and stronger. The style and subjects of decorations changed, becoming predominantly blue and more detailed. By the late 17th century, painters produced some of the finest examples of tile-pictures and the Netherlands had become a major producer and exporter of tiles. Millions of tiles were applied in buildings throughout the Netherlands and vast numbers were shipped abroad. Today, Dutch tile panels and pictures can be found in buildings as far away as Russia and Brazil [1].
The material characteristics of tiles can vary depending on their production. Typi-cally, Dutch tiles were made by mixing calcium rich marl with local clays [2]. In early examples this can often still be seen in the layered structure of the ceramic body. After a first firing, the tiles were decorated with a tin-glaze after which they were fired again. Often a lead-rich layer, or kwaart, was applied for extra gloss. This process resulted in a very diverse product and tiles could have very different characteristics depending on where and when they were produced.
The earliest tin-glazed tiles were used primarily as floor-tiles, but the tin-glaze quickly proved too fragile for their use in this way [1]. The main application of Dutch tin-glazed tiles is on walls. The glaze was not only decorative, but also func-tional, as it could be cleaned easily and provided a barrier for moisture. For this reason, we most often find tiles used in kitchens and cellars, around fireplaces or as a plinth along the base of a wall. The impermeable glassy nature of the glaze layer, however, might make them easy to clean, it also makes tiles vulnerable to damage caused by the crystalizing of soluble salts. If soluble salts crystalize in a tile, the glaze layer is often destroyed beyond saving.
2 DETERIORATION BY SOLUBLE SALTS For the conservation of tiles in situ that are affected by salts, it is important to un-derstand the processes behind the damage. This starts by understanding the causes of the salt crystallization. Therefore, scientific research is always required to gain a better understanding of the problem. Only by better understanding the problem can a solution be formulated.
Although salt crystallization in porous media has been the subject of a considerable amount of research, the question how these processes function in tin-glazed tiles has received much less attention. Notable exceptions include the research done in Portugal on Portuguese tiles, or azulejos. It has been assumed that the crystalliza-tion of salts underneath the glaze caused mechanical damage leading to spalling of the glaze [3], [4]. However, Mimoso et al. [5] noted that manufacturing defects lie at the base of the nature of the damage caused by soluble salts. Esteves et al. [6] too, concluded from experiments on azulejos that were contaminated with a solu-tion of NaCl that the impermeability of the glaze layer in azulejos should generally be sufficient to prevent damage and damage would only occur if defects were al-ready present in the glaze. Once damage has occurred and the impermeability of the glaze is no longer intact, however, moisture within the tile will start to evaporate at the sites of the defects. Any soluble salts that are present can now crystalize,
298
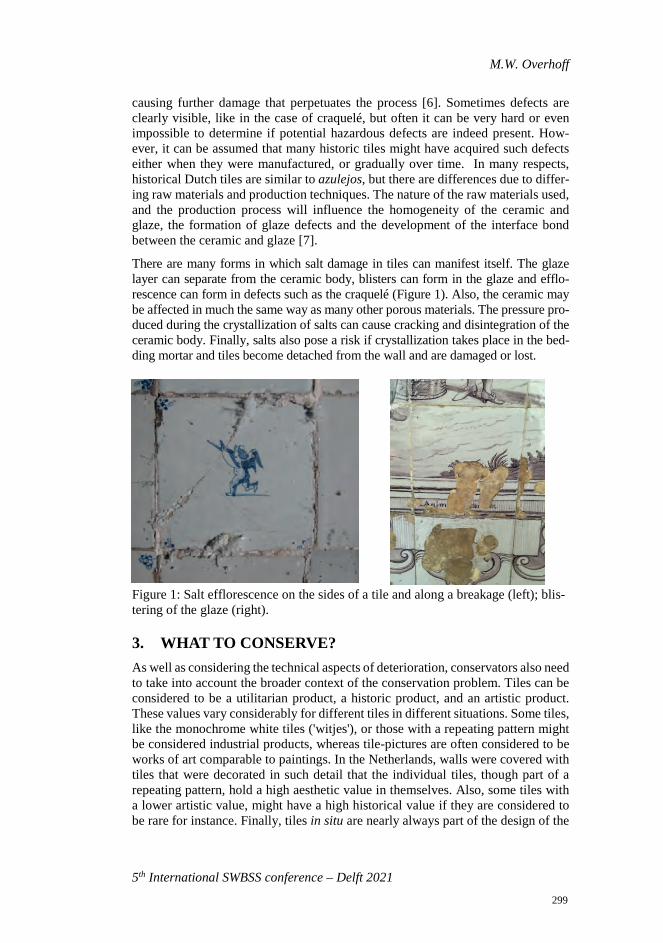
M.W. Overhoff
5th International SWBSS conference – Delft 2021
causing further damage that perpetuates the process [6]. Sometimes defects are clearly visible, like in the case of craquelé, but often it can be very hard or even impossible to determine if potential hazardous defects are indeed present. How-ever, it can be assumed that many historic tiles might have acquired such defects either when they were manufactured, or gradually over time. In many respects, historical Dutch tiles are similar to azulejos, but there are differences due to differ-ing raw materials and production techniques. The nature of the raw materials used, and the production process will influence the homogeneity of the ceramic and glaze, the formation of glaze defects and the development of the interface bond between the ceramic and glaze [7].
There are many forms in which salt damage in tiles can manifest itself. The glaze layer can separate from the ceramic body, blisters can form in the glaze and efflo-rescence can form in defects such as the craquelé (Figure 1). Also, the ceramic may be affected in much the same way as many other porous materials. The pressure pro-duced during the crystallization of salts can cause cracking and disintegration of the ceramic body. Finally, salts also pose a risk if crystallization takes place in the bed-ding mortar and tiles become detached from the wall and are damaged or lost.
Figure 1: Salt efflorescence on the sides of a tile and along a breakage (left); blis-tering of the glaze (right).
3. WHAT TO CONSERVE? As well as considering the technical aspects of deterioration, conservators also need to take into account the broader context of the conservation problem. Tiles can be considered to be a utilitarian product, a historic product, and an artistic product. These values vary considerably for different tiles in different situations. Some tiles, like the monochrome white tiles ('witjes'), or those with a repeating pattern might be considered industrial products, whereas tile-pictures are often considered to be works of art comparable to paintings. In the Netherlands, walls were covered with tiles that were decorated in such detail that the individual tiles, though part of a repeating pattern, hold a high aesthetic value in themselves. Also, some tiles with a lower artistic value, might have a high historical value if they are considered to be rare for instance. Finally, tiles in situ are nearly always part of the design of the
299
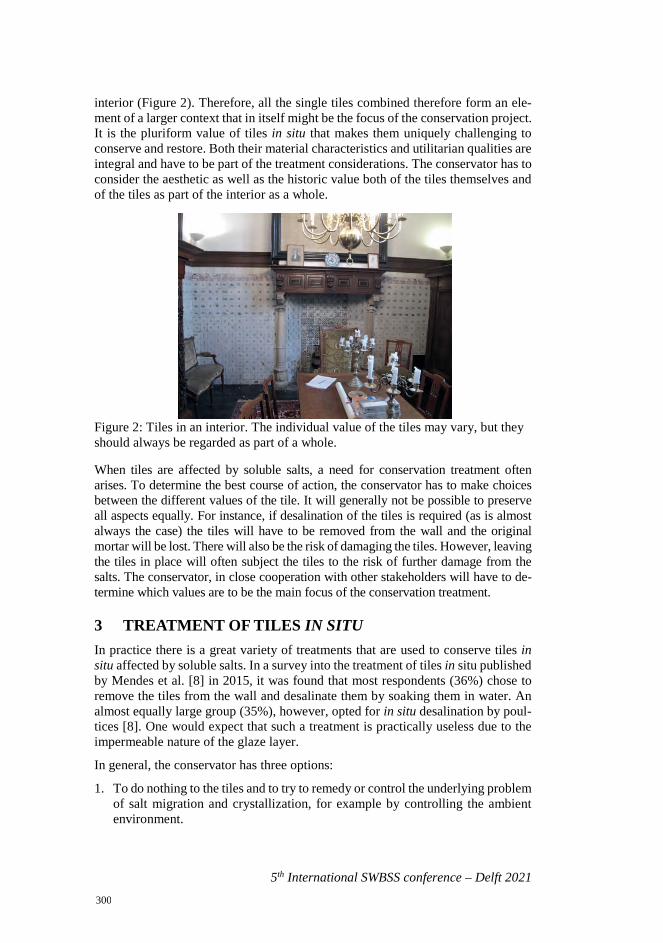
5th International SWBSS conference – Delft 2021
interior (Figure 2). Therefore, all the single tiles combined therefore form an ele-ment of a larger context that in itself might be the focus of the conservation project. It is the pluriform value of tiles in situ that makes them uniquely challenging to conserve and restore. Both their material characteristics and utilitarian qualities are integral and have to be part of the treatment considerations. The conservator has to consider the aesthetic as well as the historic value both of the tiles themselves and of the tiles as part of the interior as a whole.
Figure 2: Tiles in an interior. The individual value of the tiles may vary, but they should always be regarded as part of a whole.
When tiles are affected by soluble salts, a need for conservation treatment often arises. To determine the best course of action, the conservator has to make choices between the different values of the tile. It will generally not be possible to preserve all aspects equally. For instance, if desalination of the tiles is required (as is almost always the case) the tiles will have to be removed from the wall and the original mortar will be lost. There will also be the risk of damaging the tiles. However, leaving the tiles in place will often subject the tiles to the risk of further damage from the salts. The conservator, in close cooperation with other stakeholders will have to de-termine which values are to be the main focus of the conservation treatment.
3 TREATMENT OF TILES IN SITU In practice there is a great variety of treatments that are used to conserve tiles in situ affected by soluble salts. In a survey into the treatment of tiles in situ published by Mendes et al. [8] in 2015, it was found that most respondents (36%) chose to remove the tiles from the wall and desalinate them by soaking them in water. An almost equally large group (35%), however, opted for in situ desalination by poul-tices [8]. One would expect that such a treatment is practically useless due to the impermeable nature of the glaze layer.
In general, the conservator has three options:
1. To do nothing to the tiles and to try to remedy or control the underlying problem of salt migration and crystallization, for example by controlling the ambient environment.
300
M.W. Overhoff
5th International SWBSS conference – Delft 2021
2. Remove the tiles for desalination and conservation and replace them in such a way that they will not be damaged again by soluble salts.
3. Replace the tiles with replicas or similar tiles (the salt problems in the masonry should of course be tackled as well).
In all three cases, an understanding the source of the problem and the options to remedy it are extremely important in order to come to a durable solution.
The first option is the least invasive for the tiles themselves. Efflorescence could be removed, and the conservator might perform some in situ restoration work, but the tiles remain as they were in their original setting. Remedying the underlying problem of salt migration and crystallization, however, can be very difficult. As always when tackling salt problems, it will require research into the moisture sources as well as the type and amounts of salt forming ions that are present. This is necessary in order to gain a proper understanding of the situation. Controlling the problem by climate control for instance, might in some cases work temporarily, but leans heavily upon the responsibility of future caretakers. The treatment is therefore potentially not a very durable one. However, in some cases where the problems occur due to a one-off event (e.g., a now solved leakage) it can still be the best course of action to take as it minimizes intervention.
Figure 3: Removing the tiles using a diamond saw.
If the salt problem is more pervasive and the tiles are badly affected, the tiles them-selves will have to be treated. In order to do so, the tiles will have to be removed from the wall. There are several ways to do this, however, all of them are very invasive, and include risks for the tiles. The use of chisels to loosen the mortar can put a lot of stress on the tile. Sawing into the mortar layer behind the tile is best done with large diamond blades that require large amounts of water for cooling (Figure 3). The conservator will have to weigh the risk posed by removal against the risk posed by the soluble salts.
Once removed, the tiles have to be desalinated. This is most often achieved by soaking the tiles in water and refreshing the water on a regular basis. The conduc-tivity of the water is monitored and once the conductivity levels plateau the tiles
301
5th International SWBSS conference – Delft 2021
are removed from the water and dried. It has been shown that this technique is effective in removing salts, although there are concerns it may also cause degrada-tion of the ceramic itself, especially if the water is stirred during treatment [4]. [6] has also cautioned that the desalination process may be damaging due to hygric expansion of the ceramic body. When to stop the desalination is unclear. In papers that are often cited in conservation practice, Paterakis [9] initially suggested 100 µS/cm (the volume of water is not clear) as acceptable, based on the absence of recrystallization after the treatment of ceramic lamps. In a later paper [10], how-ever, she noted that recrystallization also did not occur in objects is that were de-salinated to conductivity equilibria ranging from 500-3600 µS/cm (using a volume ratio object to water of 1:15) and she concluded that the absence of recrystallization could not be used as a measure for adequate desalination. Other researchers have used modern standards ([11] for instance used the Austrian Önorm B3355-1), but it is unclear how these relate to historical tiles. Also, in the case of the work done by [11] it requires access to ion chromatography for accurate measurements. In practice the decision to stop the process once conductivity measurements start to plateau is inspired more by practicality than by science.
Finally, in some cases tiles are replaced either with modern replicas or with similar contemporary tiles. Obviously, this does not apply to any tiles that have a high artistic or historical value. However, where tiles are part of an ensemble, the preser-vation of the whole can take precedence over the preservation of its individual el-ements. In such cases great care must be taken in order to preserve the original appearance. In modern replica’s, it is extremely difficult and time-consuming to match the appearance of historical tiles. In contemporary tiles there is such a diver-sity in appearance that a suitable match can be difficult to find. Even plain 'white' tiles will differ considerably depending on when and where they were produced. It should always be kept in mind that with replacement the historical value will be lost.
Replacing tiles, whether restored or new, presents new dilemmas. The use of tradi-tional lime-mortars would seem an obvious choice. If, however, soluble salts re-main present and moisture still travels through the masonry, eventually the salts will start to affect the tiles again. For tiles with a high artistic or historical value such a solution is not appropriate. Tiles can also be remounted on suitable backing boards so that soluble salts can no longer migrate into the ceramic. With this solu-tion the aesthetic appearance of the tiles is maintained, although some of the his-torical context as a building material will be lost.
4 CONCLUSIONS AND FINAL REMARKS The conservation of tin-glazed tiles in situ that are affected by soluble salts is a complex challenge. The conservator will have to consider the tiles from an art-historical perspective, and make an assessment of the historical, aesthetic, and ar-tistic values both of the single tiles, as well as of the tiles as part of a whole. Any treatment will affect these values in some way. In close cooperation with other stakeholders, a treatment will have to be determined that best preserves those val-ues that are deemed most important.
302
M.W. Overhoff
5th International SWBSS conference – Delft 2021
Furthermore, it is essential for the conservator to have an understanding of the mechanisms that drive the deterioration of the tiles. Determining the site-specific conditions that cause the crystallization of soluble salts requires in-depth research that should be conducted by a researcher specialized in this field. This should at least include research into the moisture and salt sources in the walls as well as an identification of the salt forming ions that are present. Also, an understanding of the development of the relative humidity over time can be useful, although such data is rarely available. The findings will allow for a more realistic and more de-tailed risk assessment for future damage. The conservator should combine these findings with the art-historical assessment of the tiles to determine the minimal intervention that is needed for the preservation of the tiles.
Although the field of conservation is increasingly supported by scientific research, in practice conservation is often still regarded by many as a craft. [6] commented on the lack of specific training in this area of conservation, with most respondents of their survey indicating they had acquired practical skills through experience ra-ther than via any academic training involving the development of research skills. The importance of research is not always fully understood by both conservators and stakeholders. Even when the conservator understands the importance of re-search and offers to arrange it, it can be difficult to convince the stakeholders due to the time and cost involved. Tin-glazed tiles are of such importance to our cultural heritage that they not only require, but also deserve a thorough approach. The im-portance of research to support the conservation decisions when treating tiles in situ cannot be understated.
ACKNOWLEDGEMENTS The author would like to thank Kate van Lookeren Campagne and Mandy Slager for their comments and thoughts.
REFERENCES [1] A. Berendsen, Ed., “Groot Tegelboek; Een internationaal overzicht van de
tegel door de eeuwen heen,” Amsterdam/Brussel: Elsevier Nederland bv., 1975
[2] K. van Lookeren Campagne, “Een verkeerde loop in ’t vuur: an initial inves-tigation into what Dutch archival sources can tell us about techniques and problems in the production of 17th and 18th century Dutch tin-glazed tiles,” GlazeArch2015, LNEC, Lisbon, 2015
[3] C. Borges, C. Caetano, J. Costa Pessoa, M.O. Figueiredo, A. Lourenço, M. Malhoa Gomes, T.P. Silva, and J.P. Veiga, “Monitoring the removal of solu-ble salts from ancient tiles by ion chromotography,” Journal of Chromotog-raphy A, vol. 770, pp. 195-201, 1997.
[4] J. C. Pessoa, J. L. Farinha Antunes, M.O. Figueiredo and M. A. Fortes, “Re-moval and analysis of soluble salts from ancient tiles,” Studies in Conserva-tion, vol. 41, no. 3, pp. 153-160, 1996.
303
5th International SWBSS conference – Delft 2021
[5] J. M. Mimoso, S.R.M. Pereira and A.S. Silva, “A research on manufacturingdefects and decay by glaze loss in historical Portuguese azulejos,” Relatório24/2011-NPC, LNEC, 2011
[6] L. Esteves, A. Canddeias and J. M. Mimoso, “Experimental research with saltcrystallisation in historical Portuguese azulejos,” Int. Journal of ArchitecturalHeritage, vol. 10, no. 7, 2016
[7] S. R. M. Pereira, M. A. Antunes, A. M. Cardoso, M. Costa, J. Delgado Ro-drigues, L. Esteves, J. Mirão, A. Candeias, and J. M. Mimoso, “Influence ofthe production technology on the morphological characteristics of azulejos,”Glazeart2018 International Conference “Glazed Ceramics in Cultural Herit-age,” LNEC, Lisbon, 2018, pp. 140-149
[8] M. T. Mendes, S. Pereira, T. Ferreira, J. Mirão, and A. Candeias, “In situpreservation and restoration of architectural tiles, materials and procedures:results of an international survey,” Int. Journal of Conservation Science, vol.6 , no. 1, pp. 51-62, 2015.
[9] A.B. Paterakis, “The deterioration of ceramics by soluble salts and methodsfor their removal,” in Recent Advances in the Conservation and Analysis ofArtifacts, London:Summer School Press,1987, pp.67-72
[10] A.B. Paterakis, “Those evasive salt crystals,’ in ICOM Committee for Con-servation, 12th Triennial Meeting Preprints vol II, London, James & James(Science Publishers) ltd., 1998, pp. 799-802
[11] C. M.D. Ferreira, L. M. Ottosen, I.V. Christensen, S. H. Brammer, D.A.F.Sveegaard, “Evaluation of salt removal from azulejos tiles and mortars usingelectrodesalination,” in 12th Int. Conf. on Durability of Building Materialsand Components, Porto, Portugal, 2011, pp. 897-903
304
Case studies

306
5th International SWBSS conference – Delft 2021
20 YEARS LONG-TERM MONITORING OF THE SALT LOADED CRYPT OF ST. MARIA IM KAPITOL, COLOGNE
Steffen Laue1*, Christoph Schaab2, Dagmar Drese3, Dietmar Krauthäuser4, Georg Helfmeier5, and Josef Vogt5
KEYWORDS Cyclic crystallization, monitoring, deliquescence humidity, climate control, damage mitigation
ABSTRACT In the Crypt of St. Maria im Kapitol in Cologne damages of stones and wall paintings are caused by cyclic crystallization and dissolution of the salts halite [NaCl] and nitratine [NaNO3] due to climate changes.
Based on a research project between 1992 and 1996, the LVR-State Service for Historical Monuments, architects, scientists and restorers implemented certain measures and started a new monitoring concept in 2000 aiming to diminish the damages and salt concentrations in the crypt.
The monitoring concept included the periodical collection of weathered stone debris coming off the walls, in addition to regular climate measurements and salt analyses. Monitoring in combination with climate measurements are executed over a period of 20 years. Combining intervention in the room climate on the one hand and salt extractions on the other hand, turned out to be effective measures. Prerequisites for reaching this result are detailed insights into the interaction between building materials, moisture, salts, and environmental conditions. The case study demonstrates the effectiveness of a constructive cooperation of departments, architects, scientists and restorers, resulting in a lasting conservation concept for an object highly contaminated by soluble salts.
1 University of Applied Sciences Potsdam, Department of Conservation and
Restoration, Potsdam, [email protected] 2 Landschaftsverband Rheinland Amt für Denkmalpflege im Rheinland, Abtei
Brauweiler, Pullheim 3 Architekturbüro Schwarz und Partner, Cologne 4 Restauratoren Kartäuserhof GBR, Cologne 5 Dipl.-Ing. Josef Vogt, Beratender Ingenieur, Bedburg
307
5th International SWBSS conference – Delft 2021
1 INTRODUCTION Salt weathering on monuments due to climate changes frequently play a major role in the disintegration of cultural heritage [1], [2]. In general, the crystallization of salts on monuments is dependent on environmental conditions. If the relative hu-midity of the air is lower than the deliquescence humidity of the salt on the surface of a monument, crystallization will occur. If, on the other hand, the relative humid-ity exceeds the deliquescence humidity the salt remains in solution. Finally, if the deliquescence humidity of a salt falls within the range of variation of the ambient relative humidity, cyclic dissolution and crystallization will accelerate the deterio-ration of building materials.
Therefore, to preserve a monument it is indispensable to find out and understand the chemical and physical processes damaging the building materials and the con-ditions under which decay occurs. If it were possible to predict under what climatic conditions a salt will effloresce or hydrate, it would be possible to know which climatic conditions have to be maintained in order to avoid crystallization cycles.
This paper describes the case study of the Crypt of St. Maria im Kapitol in which, after a long investigation and monitoring period, changes in climate conditions and salt reductions led to a step by step reduction of salt damages.
2 CRYPT OF ST. MARIA IM KAPITOL The church St. Maria im Kapitol in Cologne was constructed between 1015 and 1065. The crypt is situated in the eastern part of the church under the choir and about one half of its height is located under ground (figure 1). The walls of the crypt are built from different kind of building stones, most of them are tuff, tra-chyte, sandstone and limestone [3]. The vaults are adorned by Romanesque wall paintings.
During their eventful history these paintings were covered for an unknown period of time and were finally uncovered around 1900. Their condition at that time is documented by aquarell copies. In the 19th century, between 1838 and 1851, the crypt was used as a salt depot [4]. During the Second World War the crypt was partially destroyed. Thus today, only in the eastern part of the crypt original build-ing materials remain, still carrying Romanesque wall paintings in the vaults [5], [6].
After reconstruction, in 1969 a floor heating system was installed which was re-placed in 1987 by a hot-air heating. In 1976, the walls were partly covered by a restoration plaster, leaving the original building materials and wallpaintings partly visible.
In 1992, extreme damage to the various rocks and plasters was apparent and the crypt was included in a research project, in order to understand the crystallization conditions of the salts.
308
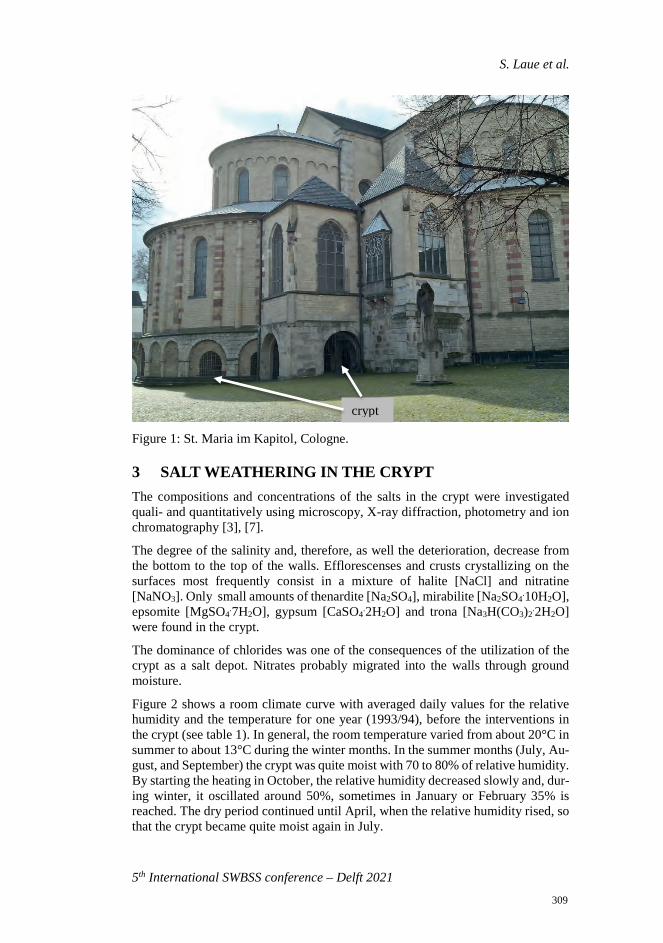
S. Laue et al.
5th International SWBSS conference – Delft 2021
Figure 1: St. Maria im Kapitol, Cologne.
3 SALT WEATHERING IN THE CRYPT The compositions and concentrations of the salts in the crypt were investigated quali- and quantitatively using microscopy, X-ray diffraction, photometry and ion chromatography [3], [7].
The degree of the salinity and, therefore, as well the deterioration, decrease from the bottom to the top of the walls. Efflorescenses and crusts crystallizing on the surfaces most frequently consist in a mixture of halite [NaCl] and nitratine [NaNO3]. Only small amounts of thenardite [Na2SO4], mirabilite [Na2SO4
.10H2O], epsomite [MgSO4
.7H2O], gypsum [CaSO4.2H2O] and trona [Na3H(CO3)2
.2H2O] were found in the crypt.
The dominance of chlorides was one of the consequences of the utilization of the crypt as a salt depot. Nitrates probably migrated into the walls through ground moisture.
Figure 2 shows a room climate curve with averaged daily values for the relative humidity and the temperature for one year (1993/94), before the interventions in the crypt (see table 1). In general, the room temperature varied from about 20°C in summer to about 13°C during the winter months. In the summer months (July, Au-gust, and September) the crypt was quite moist with 70 to 80% of relative humidity. By starting the heating in October, the relative humidity decreased slowly and, dur-ing winter, it oscillated around 50%, sometimes in January or February 35% is reached. The dry period continued until April, when the relative humidity rised, so that the crypt became quite moist again in July.
crypt
309
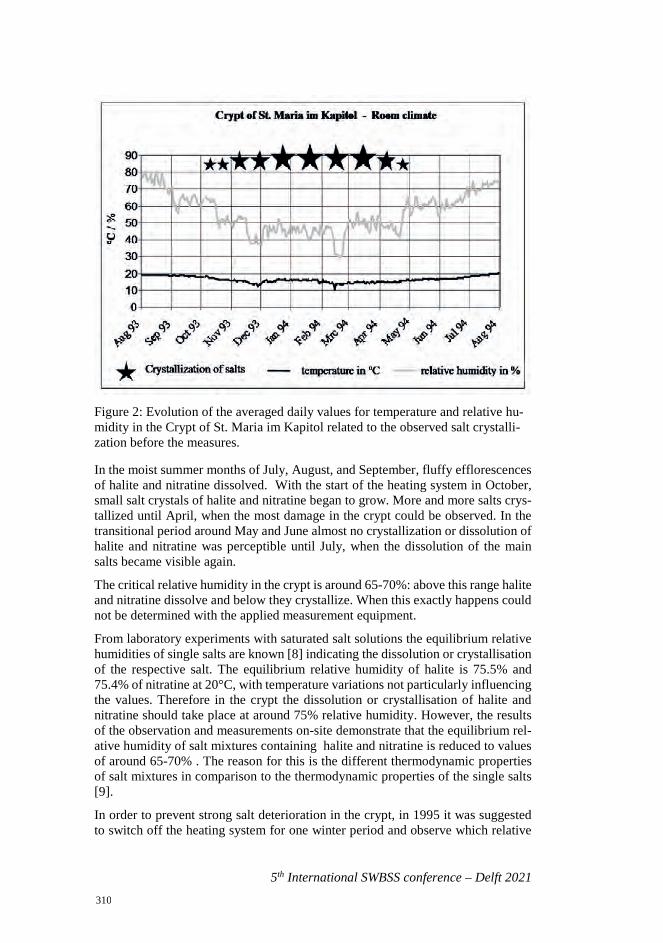
5th International SWBSS conference – Delft 2021
Figure 2: Evolution of the averaged daily values for temperature and relative hu-midity in the Crypt of St. Maria im Kapitol related to the observed salt crystalli-zation before the measures.
In the moist summer months of July, August, and September, fluffy efflorescences of halite and nitratine dissolved. With the start of the heating system in October, small salt crystals of halite and nitratine began to grow. More and more salts crys-tallized until April, when the most damage in the crypt could be observed. In the transitional period around May and June almost no crystallization or dissolution of halite and nitratine was perceptible until July, when the dissolution of the main salts became visible again.
The critical relative humidity in the crypt is around 65-70%: above this range halite and nitratine dissolve and below they crystallize. When this exactly happens could not be determined with the applied measurement equipment.
From laboratory experiments with saturated salt solutions the equilibrium relative humidities of single salts are known [8] indicating the dissolution or crystallisation of the respective salt. The equilibrium relative humidity of halite is 75.5% and 75.4% of nitratine at 20°C, with temperature variations not particularly influencing the values. Therefore in the crypt the dissolution or crystallisation of halite and nitratine should take place at around 75% relative humidity. However, the results of the observation and measurements on-site demonstrate that the equilibrium rel-ative humidity of salt mixtures containing halite and nitratine is reduced to values of around 65-70% . The reason for this is the different thermodynamic properties of salt mixtures in comparison to the thermodynamic properties of the single salts [9].
In order to prevent strong salt deterioration in the crypt, in 1995 it was suggested to switch off the heating system for one winter period and observe which relative
310
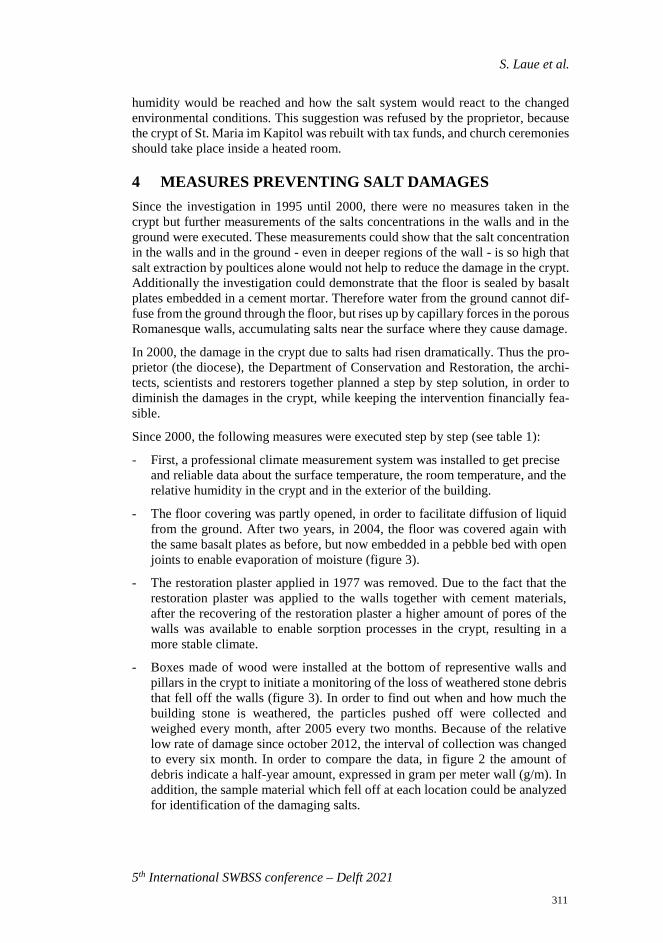
S. Laue et al.
5th International SWBSS conference – Delft 2021
humidity would be reached and how the salt system would react to the changed environmental conditions. This suggestion was refused by the proprietor, because the crypt of St. Maria im Kapitol was rebuilt with tax funds, and church ceremonies should take place inside a heated room.
4 MEASURES PREVENTING SALT DAMAGES Since the investigation in 1995 until 2000, there were no measures taken in the crypt but further measurements of the salts concentrations in the walls and in the ground were executed. These measurements could show that the salt concentration in the walls and in the ground - even in deeper regions of the wall - is so high that salt extraction by poultices alone would not help to reduce the damage in the crypt. Additionally the investigation could demonstrate that the floor is sealed by basalt plates embedded in a cement mortar. Therefore water from the ground cannot dif-fuse from the ground through the floor, but rises up by capillary forces in the porous Romanesque walls, accumulating salts near the surface where they cause damage.
In 2000, the damage in the crypt due to salts had risen dramatically. Thus the pro-prietor (the diocese), the Department of Conservation and Restoration, the archi-tects, scientists and restorers together planned a step by step solution, in order to diminish the damages in the crypt, while keeping the intervention financially fea-sible.
Since 2000, the following measures were executed step by step (see table 1):
- First, a professional climate measurement system was installed to get precise and reliable data about the surface temperature, the room temperature, and the relative humidity in the crypt and in the exterior of the building.
- The floor covering was partly opened, in order to facilitate diffusion of liquid from the ground. After two years, in 2004, the floor was covered again with the same basalt plates as before, but now embedded in a pebble bed with open joints to enable evaporation of moisture (figure 3).
- The restoration plaster applied in 1977 was removed. Due to the fact that the restoration plaster was applied to the walls together with cement materials, after the recovering of the restoration plaster a higher amount of pores of the walls was available to enable sorption processes in the crypt, resulting in a more stable climate.
- Boxes made of wood were installed at the bottom of representive walls and pillars in the crypt to initiate a monitoring of the loss of weathered stone debris that fell off the walls (figure 3). In order to find out when and how much the building stone is weathered, the particles pushed off were collected and weighed every month, after 2005 every two months. Because of the relative low rate of damage since october 2012, the interval of collection was changed to every six month. In order to compare the data, in figure 2 the amount of debris indicate a half-year amount, expressed in gram per meter wall (g/m). In addition, the sample material which fell off at each location could be analyzed for identification of the damaging salts.
311
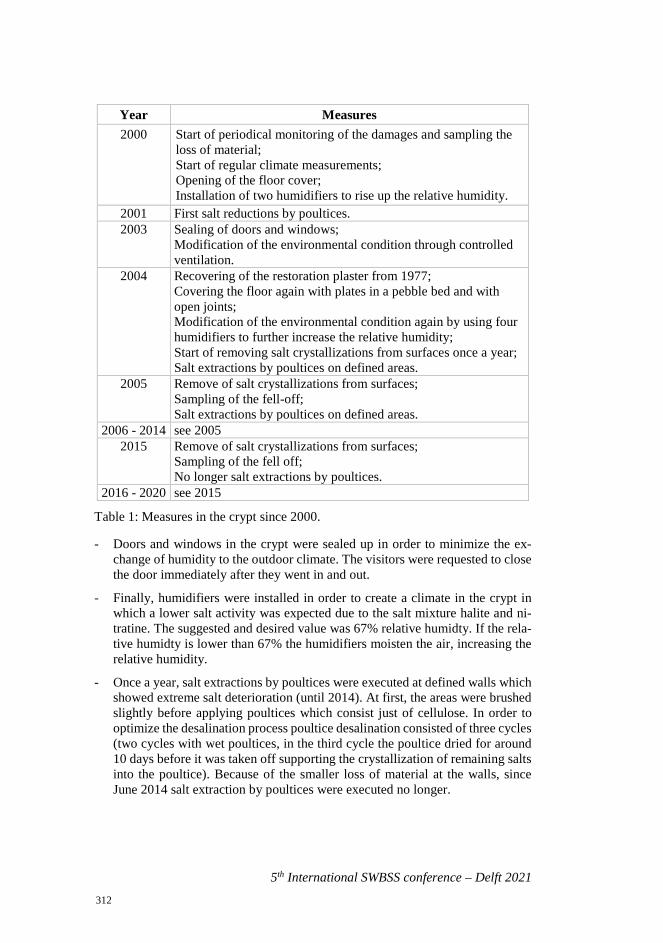
5th International SWBSS conference – Delft 2021
Table 1: Measures in the crypt since 2000.
- Doors and windows in the crypt were sealed up in order to minimize the ex-change of humidity to the outdoor climate. The visitors were requested to close the door immediately after they went in and out.
- Finally, humidifiers were installed in order to create a climate in the crypt in which a lower salt activity was expected due to the salt mixture halite and ni-tratine. The suggested and desired value was 67% relative humidty. If the rela-tive humidty is lower than 67% the humidifiers moisten the air, increasing the relative humidity.
- Once a year, salt extractions by poultices were executed at defined walls which showed extreme salt deterioration (until 2014). At first, the areas were brushed slightly before applying poultices which consist just of cellulose. In order to optimize the desalination process poultice desalination consisted of three cycles (two cycles with wet poultices, in the third cycle the poultice dried for around 10 days before it was taken off supporting the crystallization of remaining salts into the poultice). Because of the smaller loss of material at the walls, since June 2014 salt extraction by poultices were executed no longer.
Year Measures 2000
Start of periodical monitoring of the damages and sampling the loss of material; Start of regular climate measurements; Opening of the floor cover; Installation of two humidifiers to rise up the relative humidity.
2001 First salt reductions by poultices. 2003
Sealing of doors and windows; Modification of the environmental condition through controlled ventilation.
2004
Recovering of the restoration plaster from 1977; Covering the floor again with plates in a pebble bed and with open joints; Modification of the environmental condition again by using four humidifiers to further increase the relative humidity; Start of removing salt crystallizations from surfaces once a year; Salt extractions by poultices on defined areas.
2005 Remove of salt crystallizations from surfaces; Sampling of the fell-off; Salt extractions by poultices on defined areas.
2006 - 2014 see 2005 2015 Remove of salt crystallizations from surfaces;
Sampling of the fell off; No longer salt extractions by poultices.
2016 - 2020 see 2015
312
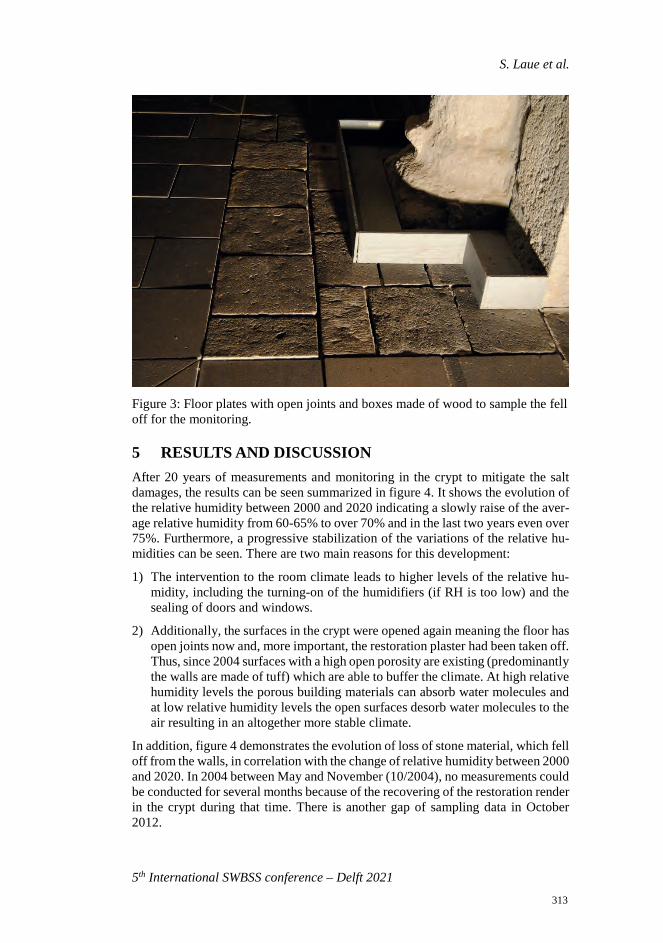
S. Laue et al.
5th International SWBSS conference – Delft 2021
Figure 3: Floor plates with open joints and boxes made of wood to sample the fell off for the monitoring.
5 RESULTS AND DISCUSSION After 20 years of measurements and monitoring in the crypt to mitigate the salt damages, the results can be seen summarized in figure 4. It shows the evolution of the relative humidity between 2000 and 2020 indicating a slowly raise of the aver-age relative humidity from 60-65% to over 70% and in the last two years even over 75%. Furthermore, a progressive stabilization of the variations of the relative hu-midities can be seen. There are two main reasons for this development:
1) The intervention to the room climate leads to higher levels of the relative hu-midity, including the turning-on of the humidifiers (if RH is too low) and the sealing of doors and windows.
2) Additionally, the surfaces in the crypt were opened again meaning the floor has open joints now and, more important, the restoration plaster had been taken off. Thus, since 2004 surfaces with a high open porosity are existing (predominantly the walls are made of tuff) which are able to buffer the climate. At high relative humidity levels the porous building materials can absorb water molecules and at low relative humidity levels the open surfaces desorb water molecules to the air resulting in an altogether more stable climate.
In addition, figure 4 demonstrates the evolution of loss of stone material, which fell off from the walls, in correlation with the change of relative humidity between 2000 and 2020. In 2004 between May and November (10/2004), no measurements could be conducted for several months because of the recovering of the restoration render in the crypt during that time. There is another gap of sampling data in October 2012.
313
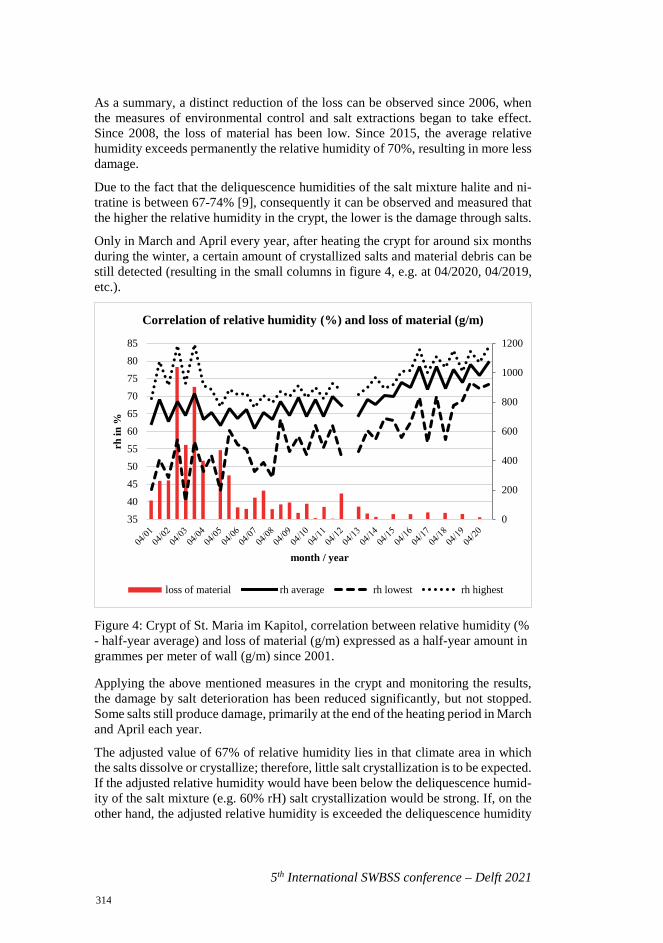
5th International SWBSS conference – Delft 2021
As a summary, a distinct reduction of the loss can be observed since 2006, when the measures of environmental control and salt extractions began to take effect. Since 2008, the loss of material has been low. Since 2015, the average relative humidity exceeds permanently the relative humidity of 70%, resulting in more less damage.
Due to the fact that the deliquescence humidities of the salt mixture halite and ni-tratine is between 67-74% [9], consequently it can be observed and measured that the higher the relative humidity in the crypt, the lower is the damage through salts.
Only in March and April every year, after heating the crypt for around six months during the winter, a certain amount of crystallized salts and material debris can be still detected (resulting in the small columns in figure 4, e.g. at 04/2020, 04/2019, etc.).
Figure 4: Crypt of St. Maria im Kapitol, correlation between relative humidity (% - half-year average) and loss of material (g/m) expressed as a half-year amount in grammes per meter of wall (g/m) since 2001.
Applying the above mentioned measures in the crypt and monitoring the results, the damage by salt deterioration has been reduced significantly, but not stopped. Some salts still produce damage, primarily at the end of the heating period in March and April each year.
The adjusted value of 67% of relative humidity lies in that climate area in which the salts dissolve or crystallize; therefore, little salt crystallization is to be expected. If the adjusted relative humidity would have been below the deliquescence humid-ity of the salt mixture (e.g. 60% rH) salt crystallization would be strong. If, on the other hand, the adjusted relative humidity is exceeded the deliquescence humidity
0
200
400
600
800
1000
1200
3540455055606570758085
rh in
%
month / year
Correlation of relative humidity (%) and loss of material (g/m)
loss of material rh average rh lowest rh highest
314
S. Laue et al.
5th International SWBSS conference – Delft 2021
in an area with more than 75%, microbiology activity can take place in the crypt which will, amongst others, destroy the remaining wall paintings.
As it is shown in figure 4, the averaged relative humidity exceeds 75% relative humidity since two years. The responsible team of the crypt is becoming aware of this fact and is thinking about appropriate interventions like ventilation in the sum-mer month, when the relative humidity is very high. Another possibility could be to activate dehumidifier when the relative humidity exceeds 75 %.
The development of the relative humidities in the crypt through the last years demonstrate, how important a continuous monitoring has to be in future too – even after 20 years. A historical monument that is at least part time open to the public will never reach a constant climate equilibrium.
6 CONCLUSION The presented case study demonstrates the effectiveness of a constructive team-work of Departments, architects, scientists and restorers resulting in a lasting con-servation concept for an object highly contaminated by soluble salts.
In order to reduce the damages in the crypt of St. Maria im Kapitol, the combination of - on the one hand - intervention in the room climate and - on the other hand - salt extractions have proven to be effective measures. Prerequisites for reaching this result are detailed insights into the interaction between building materials, moisture, salts, and environmental conditions. The monitoring of damages in com-bination with salt analyses and climate measurements is a useful tool to evaluate and possibly change measures.
REFERENCES [1] A. Arnold and K. Zehnder, “Salt weathering on monuments,” in Advanced
workshop on analytical methodologies for the investigation of damaged stones, 14.-21.Sept, Pavia, Italy, 1990.
[2] S. Laue, “Salt Weathering of Porous Structures Related to Climate Changes,” Restoration of Buildings and Monuments, vol. 11, no. 6, pp. 381–390, 2005.
[3] S. Laue, C. Bläuer Böhm, and D. Jeannette, “Saltweathering and porosity ex-amples from the crypt of St.Maria im Kapitol, Cologne,” in: 8th International Congress on Deterioration and Conservation of Stone, Berlin, 1996, pp. 512–522.
[4] M. Feld, “Anamnesis report,” unpublished, BMFT-Project, CICS, TH Köln, 1991.
[5] U. Heckner and C. Schaab, “Die Krypta von St. Maria im Kapitol in Köln – Bauforschung und Restaurierung,” in: Colonia Romanica 24, Jahrbuch des Fördervereins Romanische Kirchen Köln e.V, Köln, 2009, pp. 153 – 166.
[6] https://www.romanische-kirchen-koeln.de/index.php?id=mariaimkapitol [online]
315
5th International SWBSS conference – Delft 2021
[7] S. Laue and C. Schaab, “Mitigation of salt damages by climate stabilization and salt extractions in the Crypt of St. Maria im Kapitol, Cologne,” in: 2nd Int. conf. on Salt Weathering of Buildings and Stone Sculptures, 2011, pp. 129–136.
[8] L. Greenspan, “Humidity fixed points of binary saturated aqueous solution,” in J. Res. Nat. Bur. Stand., vol. 81A, 89–96, 1997.
[9] M. Steiger, “Salts in Porous Materials: Thermodynamics of Phase Transi-tions, Modeling and Preventive Conservation,” in Restoration of Buildings and Monuments, vol. 11, no. 6, 419–432, 2005.
316
5th International SWBSS conference – Delft 2021
DURABILITY OF TRADITIONAL RENDERS ON A GARDEN WALL AT MARIENLYST PARK, ELSINORE
Poul Klenz Larsen1*
KEYWORDS Durability, traditional render, moisture content, weathering, brick wall
ABSTRACT The wall surrounding Marienlyst Park has suffered decay for many decades. A test program was conducted over five years to find the most durable solution for its maintenance. The performance of six different renders was evaluated by moisture measurements over the cross section of the wall. Only traditional mortars with lime or hydraulic lime binders were tested. Restoration mortars containing Portland ce-ment and additives were not included.
The 15th century brick wall is approximately 3 m high and has a 1.5 m backfill of soil. The water content of the wall was monitored with a dielectric probe at three levels above the ground. The average moisture content changed during the test pe-riod in accordance with the rainfall. There was an increase in wet seasons and de-crease in dry seasons. The drying rate was rapid and almost independent of the type of render. The main source of moisture was the soil at the back side rather than driving rain at the front side.
The decay related mainly to the thickness and the composition of the plaster. Two or three layers of hydraulic lime mortars were the most resistant to weathering, whereas a single layer of lime mortar was the least durable. It is difficult to predict the lifetime of the renders based on the performance in the first five years. Even the best rendering will likely require regular maintenance due to the moisture mi-gration from the soil.
1 INTRODUCTION Historic masonry walls are exposed to moisture from different sources such as wind-driven rain or rising damp from the ground. Moisture is a main agent of decay
1 Department of Environmental Archaeology and Materials Science, The Na-
tional Museum, Lyngby, Denmark, [email protected]
317
5th International SWBSS conference – Delft 2021
for bricks, joints and render, and moisture measurements are often used for moni-toring the condition of the construction. It is assumed that variation in moisture content over time is a key parameter for the durability of exterior rendering. The present study investigates the relevance of moisture measurements for predicting the decay of traditional renders.
Moisture measurements at the surface do not give accurate information about the conditions inside a wall. A further complication is contamination with salts, which may accumulate at the surface. The ionic content of the pore water will severely disturb the signal of most moisture meters and make surface measurements unreli-able. To conduct a detailed study of the moisture distribution, it is required to meas-ure the moisture over the cross section of a wall.
2 METHOD
2.1 The dielectric probe A portable instrument developed for soil moisture measurements was used for this study [1]. The probe was a type PR1/6 from Delta Devices Ltd. with 6 sensors mounted on a rod, connected to a meter HH2. Each sensor has two circular steel rings of 25 mm diameter separated by a distance of 50 mm (Figure 1). An electric field at 100 MHz frequency is induced to measure the impedance around the probe. The amplitude of the signal depends on the dielectric property of the surrounding material, which is strongly related to the moisture content. The electric field is di-rectional, so each measurement is repeated 3 times, each at a 120° rotation of the probe.
2.2 Installation During operation, the probe was mounted inside access tubes with a diameter of 27 mm. The tubes were permanently installed in horizontal holes drilled in the wall. The tube protected the probe during operation and prevented evaporation from within the holes. A plastic cap inhibited the ingress of wind-driven rain into the holes. To avoid disturbance of the moisture distribution within the wall, the holes were drilled without the use of water for cooling. Nevertheless, the moisture con-tent of the masonry was possibly influenced by the heat released during drilling. Equilibrium was probably re-established within several weeks, and it was unlikely that the moisture distribution was permanently altered by the installation. The drill-ing took place one month before the first measurements.
2.3 Influence of air gap A field calibration of the instrument concluded that the readings were very sensitive to air gaps around the access tube [2]. It is impossible to account for this inherent limitation of the method. Therefore, the individual readings were mainly used to study the variations in moisture content, and not interpreted as absolute values. A calibration test of the influence of an air gap along the access tube was reported in [3]. An air gap of one mm reduced the signal by 25% and that of 3 mm resulted in a 50 % reduction. As it is difficult to achieve a perfect fit, an alternative method would be to drill an oversize hole and use a filler to ensure perfect contact. In such
318
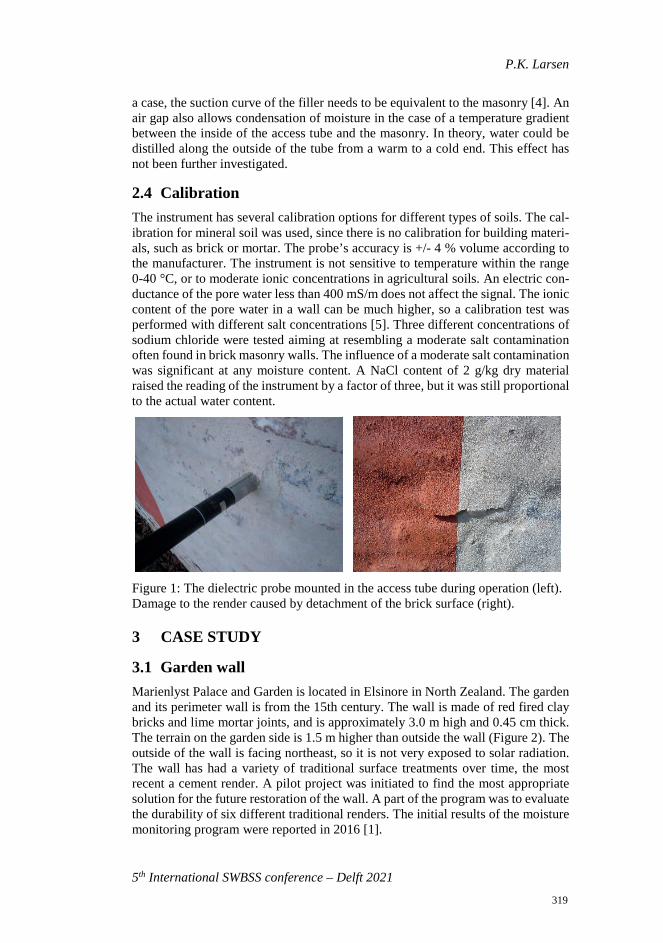
P.K. Larsen
5th International SWBSS conference – Delft 2021
a case, the suction curve of the filler needs to be equivalent to the masonry [4]. An air gap also allows condensation of moisture in the case of a temperature gradient between the inside of the access tube and the masonry. In theory, water could be distilled along the outside of the tube from a warm to a cold end. This effect has not been further investigated.
2.4 Calibration The instrument has several calibration options for different types of soils. The cal-ibration for mineral soil was used, since there is no calibration for building materi-als, such as brick or mortar. The probe’s accuracy is +/- 4 % volume according to the manufacturer. The instrument is not sensitive to temperature within the range 0-40 °C, or to moderate ionic concentrations in agricultural soils. An electric con-ductance of the pore water less than 400 mS/m does not affect the signal. The ionic content of the pore water in a wall can be much higher, so a calibration test was performed with different salt concentrations [5]. Three different concentrations of sodium chloride were tested aiming at resembling a moderate salt contamination often found in brick masonry walls. The influence of a moderate salt contamination was significant at any moisture content. A NaCl content of 2 g/kg dry material raised the reading of the instrument by a factor of three, but it was still proportional to the actual water content.
Figure 1: The dielectric probe mounted in the access tube during operation (left). Damage to the render caused by detachment of the brick surface (right).
3 CASE STUDY
3.1 Garden wall Marienlyst Palace and Garden is located in Elsinore in North Zealand. The garden and its perimeter wall is from the 15th century. The wall is made of red fired clay bricks and lime mortar joints, and is approximately 3.0 m high and 0.45 cm thick. The terrain on the garden side is 1.5 m higher than outside the wall (Figure 2). The outside of the wall is facing northeast, so it is not very exposed to solar radiation. The wall has had a variety of traditional surface treatments over time, the most recent a cement render. A pilot project was initiated to find the most appropriate solution for the future restoration of the wall. A part of the program was to evaluate the durability of six different traditional renders. The initial results of the moisture monitoring program were reported in 2016 [1].
319
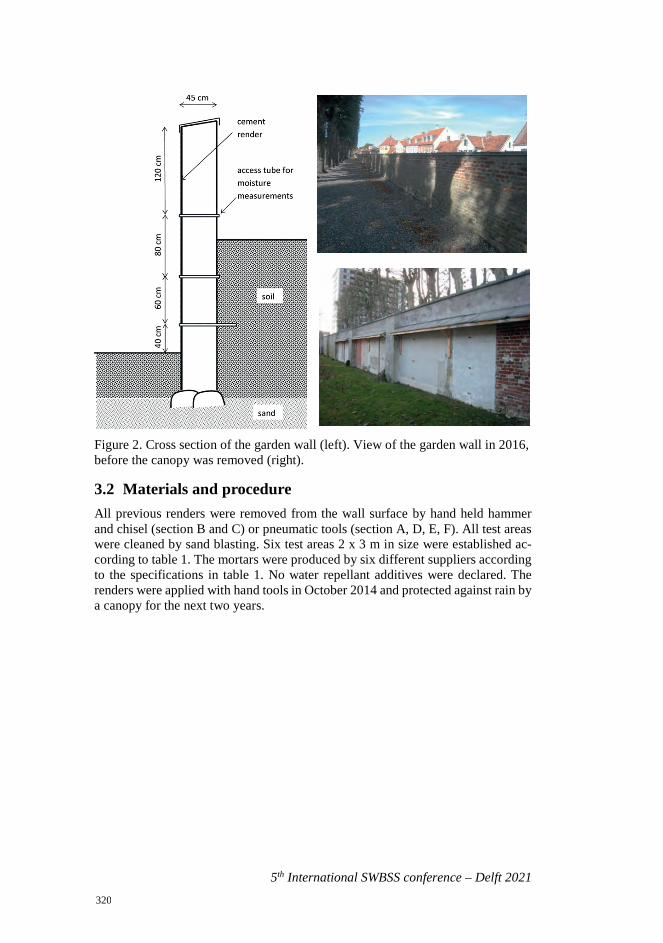
5th International SWBSS conference – Delft 2021
Figure 2. Cross section of the garden wall (left). View of the garden wall in 2016, before the canopy was removed (right).
3.2 Materials and procedure All previous renders were removed from the wall surface by hand held hammer and chisel (section B and C) or pneumatic tools (section A, D, E, F). All test areas were cleaned by sand blasting. Six test areas 2 x 3 m in size were established ac-cording to table 1. The mortars were produced by six different suppliers according to the specifications in table 1. No water repellant additives were declared. The renders were applied with hand tools in October 2014 and protected against rain by a canopy for the next two years.
320
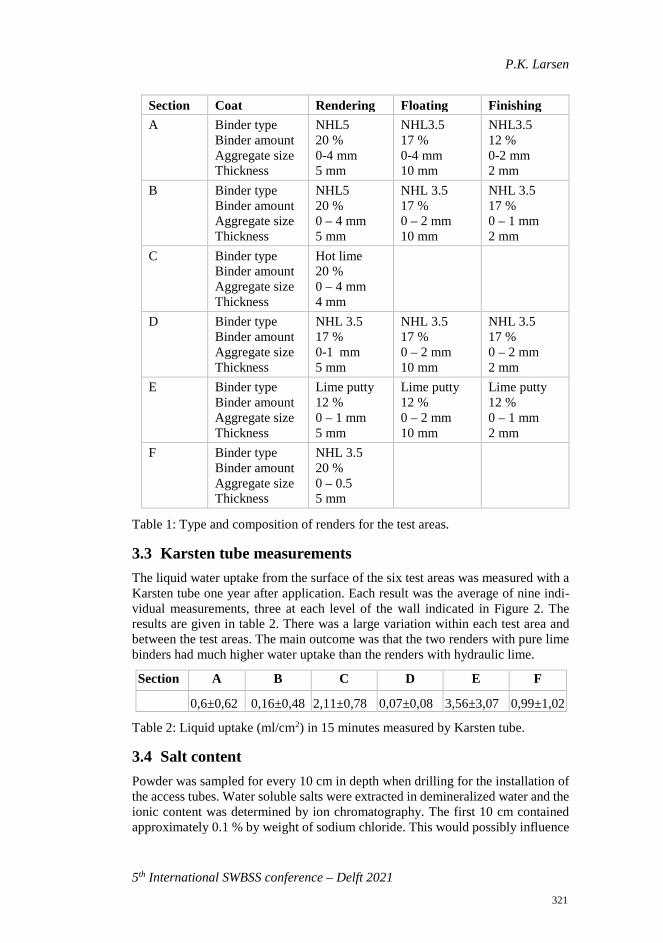
P.K. Larsen
5th International SWBSS conference – Delft 2021
Section Coat Rendering Floating Finishing A
Binder type Binder amount Aggregate size Thickness
NHL5 20 % 0-4 mm 5 mm
NHL3.5 17 % 0-4 mm 10 mm
NHL3.5 12 % 0-2 mm 2 mm
B
Binder type Binder amount Aggregate size Thickness
NHL5 20 % 0 – 4 mm 5 mm
NHL 3.5 17 % 0 – 2 mm 10 mm
NHL 3.5 17 % 0 – 1 mm 2 mm
C
Binder type Binder amount Aggregate size Thickness
Hot lime 20 % 0 – 4 mm 4 mm
D Binder type Binder amount Aggregate size Thickness
NHL 3.5 17 % 0-1 mm 5 mm
NHL 3.5 17 % 0 – 2 mm 10 mm
NHL 3.5 17 % 0 – 2 mm 2 mm
E Binder type Binder amount Aggregate size Thickness
Lime putty 12 % 0 – 1 mm 5 mm
Lime putty 12 % 0 – 2 mm 10 mm
Lime putty 12 % 0 – 1 mm 2 mm
F Binder type Binder amount Aggregate size Thickness
NHL 3.5 20 % 0 – 0.5 5 mm
Table 1: Type and composition of renders for the test areas.
3.3 Karsten tube measurements The liquid water uptake from the surface of the six test areas was measured with a Karsten tube one year after application. Each result was the average of nine indi-vidual measurements, three at each level of the wall indicated in Figure 2. The results are given in table 2. There was a large variation within each test area and between the test areas. The main outcome was that the two renders with pure lime binders had much higher water uptake than the renders with hydraulic lime.
Section A B C D E F
0,6±0,62 0,16±0,48 2,11±0,78 0,07±0,08 3,56±3,07 0,99±1,02
Table 2: Liquid uptake (ml/cm2) in 15 minutes measured by Karsten tube.
3.4 Salt content Powder was sampled for every 10 cm in depth when drilling for the installation of the access tubes. Water soluble salts were extracted in demineralized water and the ionic content was determined by ion chromatography. The first 10 cm contained approximately 0.1 % by weight of sodium chloride. This would possibly influence
321
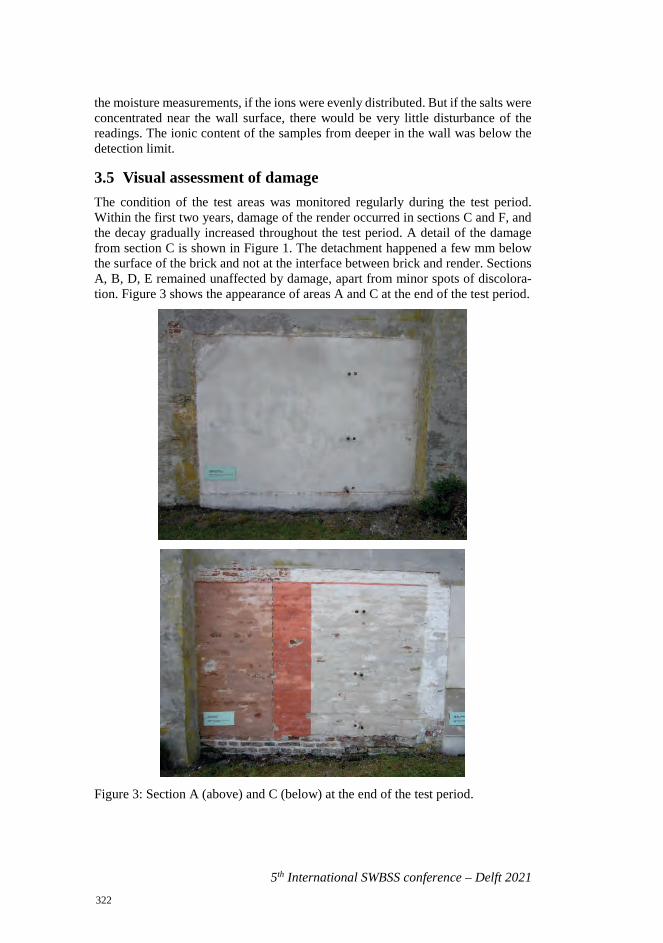
5th International SWBSS conference – Delft 2021
the moisture measurements, if the ions were evenly distributed. But if the salts were concentrated near the wall surface, there would be very little disturbance of the readings. The ionic content of the samples from deeper in the wall was below the detection limit.
3.5 Visual assessment of damage The condition of the test areas was monitored regularly during the test period. Within the first two years, damage of the render occurred in sections C and F, and the decay gradually increased throughout the test period. A detail of the damage from section C is shown in Figure 1. The detachment happened a few mm below the surface of the brick and not at the interface between brick and render. Sections A, B, D, E remained unaffected by damage, apart from minor spots of discolora-tion. Figure 3 shows the appearance of areas A and C at the end of the test period.
Figure 3: Section A (above) and C (below) at the end of the test period.
322
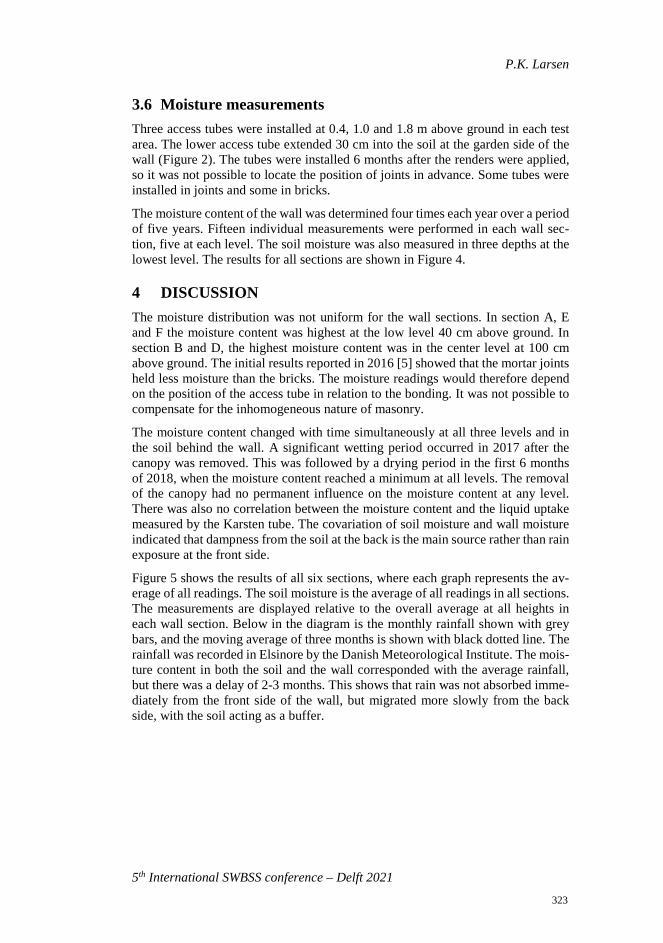
P.K. Larsen
5th International SWBSS conference – Delft 2021
3.6 Moisture measurements Three access tubes were installed at 0.4, 1.0 and 1.8 m above ground in each test area. The lower access tube extended 30 cm into the soil at the garden side of the wall (Figure 2). The tubes were installed 6 months after the renders were applied, so it was not possible to locate the position of joints in advance. Some tubes were installed in joints and some in bricks.
The moisture content of the wall was determined four times each year over a period of five years. Fifteen individual measurements were performed in each wall sec-tion, five at each level. The soil moisture was also measured in three depths at the lowest level. The results for all sections are shown in Figure 4.
4 DISCUSSION The moisture distribution was not uniform for the wall sections. In section A, E and F the moisture content was highest at the low level 40 cm above ground. In section B and D, the highest moisture content was in the center level at 100 cm above ground. The initial results reported in 2016 [5] showed that the mortar joints held less moisture than the bricks. The moisture readings would therefore depend on the position of the access tube in relation to the bonding. It was not possible to compensate for the inhomogeneous nature of masonry.
The moisture content changed with time simultaneously at all three levels and in the soil behind the wall. A significant wetting period occurred in 2017 after the canopy was removed. This was followed by a drying period in the first 6 months of 2018, when the moisture content reached a minimum at all levels. The removal of the canopy had no permanent influence on the moisture content at any level. There was also no correlation between the moisture content and the liquid uptake measured by the Karsten tube. The covariation of soil moisture and wall moisture indicated that dampness from the soil at the back is the main source rather than rain exposure at the front side.
Figure 5 shows the results of all six sections, where each graph represents the av-erage of all readings. The soil moisture is the average of all readings in all sections. The measurements are displayed relative to the overall average at all heights in each wall section. Below in the diagram is the monthly rainfall shown with grey bars, and the moving average of three months is shown with black dotted line. The rainfall was recorded in Elsinore by the Danish Meteorological Institute. The mois-ture content in both the soil and the wall corresponded with the average rainfall, but there was a delay of 2-3 months. This shows that rain was not absorbed imme-diately from the front side of the wall, but migrated more slowly from the back side, with the soil acting as a buffer.
323
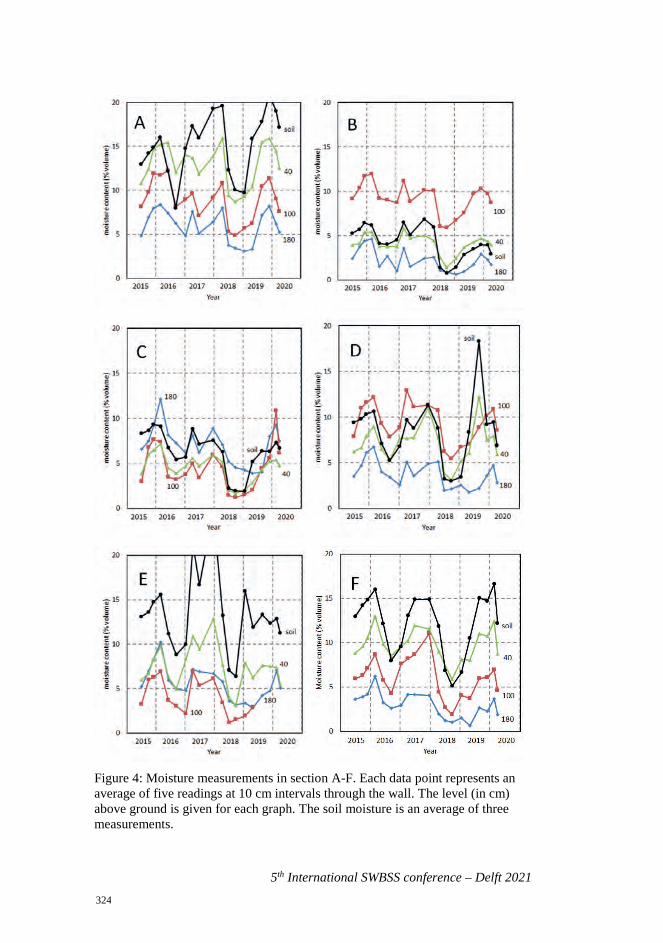
5th International SWBSS conference – Delft 2021
Figure 4: Moisture measurements in section A-F. Each data point represents an average of five readings at 10 cm intervals through the wall. The level (in cm) above ground is given for each graph. The soil moisture is an average of three measurements.
324
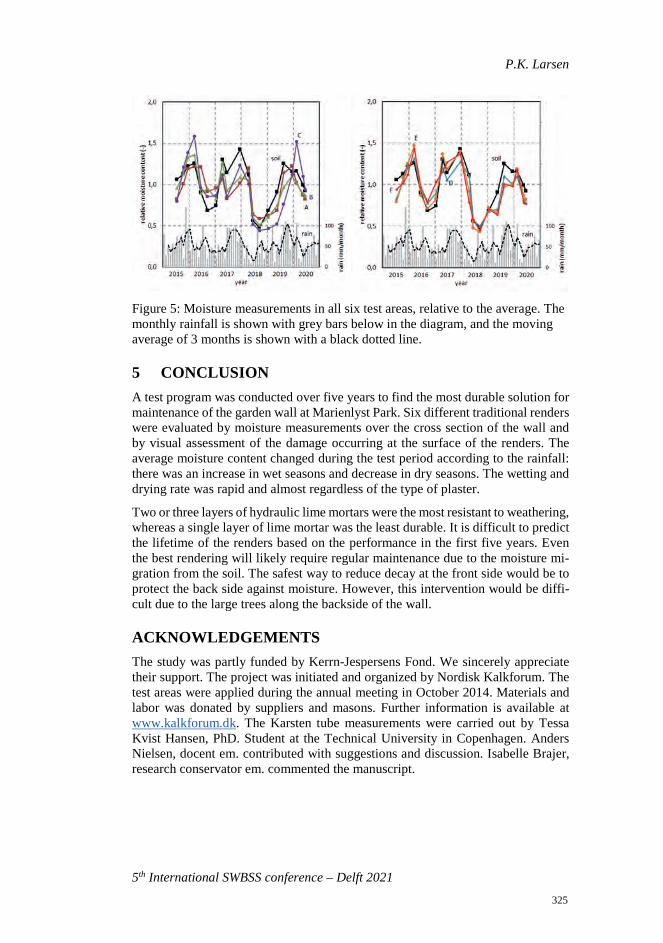
P.K. Larsen
5th International SWBSS conference – Delft 2021
Figure 5: Moisture measurements in all six test areas, relative to the average. The monthly rainfall is shown with grey bars below in the diagram, and the moving average of 3 months is shown with a black dotted line.
5 CONCLUSION A test program was conducted over five years to find the most durable solution for maintenance of the garden wall at Marienlyst Park. Six different traditional renders were evaluated by moisture measurements over the cross section of the wall and by visual assessment of the damage occurring at the surface of the renders. The average moisture content changed during the test period according to the rainfall: there was an increase in wet seasons and decrease in dry seasons. The wetting and drying rate was rapid and almost regardless of the type of plaster.
Two or three layers of hydraulic lime mortars were the most resistant to weathering, whereas a single layer of lime mortar was the least durable. It is difficult to predict the lifetime of the renders based on the performance in the first five years. Even the best rendering will likely require regular maintenance due to the moisture mi-gration from the soil. The safest way to reduce decay at the front side would be to protect the back side against moisture. However, this intervention would be diffi-cult due to the large trees along the backside of the wall.
ACKNOWLEDGEMENTS The study was partly funded by Kerrn-Jespersens Fond. We sincerely appreciate their support. The project was initiated and organized by Nordisk Kalkforum. The test areas were applied during the annual meeting in October 2014. Materials and labor was donated by suppliers and masons. Further information is available at www.kalkforum.dk. The Karsten tube measurements were carried out by Tessa Kvist Hansen, PhD. Student at the Technical University in Copenhagen. Anders Nielsen, docent em. contributed with suggestions and discussion. Isabelle Brajer, research conservator em. commented the manuscript.
325
5th International SWBSS conference – Delft 2021
REFERENCES [1] P.K. Larsen, “Determination of water distribution in brick masonry walls”,
Proceedings of the International RILEM Conference on Materials, Systemsand Structures in Civil Engineering: Conference segment on Historical Ma-sonry. RILEM publications, 2016, pp. 185-195.
[2] W.R. Whalley, R.E. Cope, C.J. Nicholl & A.P. Whitmore, “In-field calibra-tion of a dielectric soil moisture meter designed for use in an access tube”, inSoil Use and Management vol. 20, pp. 203-206, 2004.
[3] P.K. Larsen, “Determination of Water Content in Brick Masonry Walls usinga dielectric Probe”, Journal of Architectural Conservation vol 18, no. 1, pp.47-62, 2012.
[4] A. Weiß, “Durchfeuchtung mittelalterlicher Backstein-mauerwerke in Vor-pommern. Alternativen zur gravimetrischen Feuchtebestimmung”, Klima undKlimastabilität in historischen Bauwerken. Wissenschaftlich-Technische-Ar-beitsgemeinschaft für Bauwerkserhaltung und Denkmalpflege e.V. (Hrsg.)Pfaffenhofen, 2011, pp. 33 – 48.
[5] P.K. Larsen, “Long term monitoring of water content in a brick masonry wallusing a dielectric probe”, Proceedings of the 16th International Brick andBlock Masonry Conference, June 26-30, 2016, Padua. Eds. C. Modena, F. daPorte, M.R. Valluzzi. Balkema Publishers, A.A. / Taylor & Francis, TheNetherlands, 2016, pp. 509-515.
326
5th International SWBSS conference – Delft 2021
ANALYSIS OF SPALLING IN TUFFEAU: CASE STUDY OF THE CASTLES OF CHAMBORD AND CHAUMONT-SUR-LOIRE IN FRANCE
Sarah Janvier-Badosa1*, Kévin Beck2, Malek Balawi2, Marie Ternoy2, Romain Janvier2,3,4, and Xavier Brunetaud2
KEYWORDS Spalling, gypsum, limestone, tuffeau, case study
ABSTRACT The main historic monuments of the Loire Valley in France are built with tuffeau. This very porous and soft siliceous limestone presents many technical and aesthetic advantages justifying its wide use. Among the most damaging degradations of tuffeau, spalling is the most destructive one.
This study aimed at verifying the profiles of gypsum content observed in spalling of tuffeau at the castle of Chambord during a previous study. Here, samples from both the Castle of Chambord and from the Castle of Chaumont-sur-Loire were col-lected to provide more extensive and thus representative data for monuments made out of tuffeau in the Loire Valley.
For all samples, in both castles, a systematic presence of gypsum was observed in areas subjected to spalling. The gypsum content is always very low at the surface and progressively increases (always around 1%) up to the depth of the zone where the crack is present, and then decreases along depth. No other salt was detected. This study also proved that preexistent cracking is not necessary for gypsum to crystallize. All these statements are totally in accordance with the previous study, hence allowing to confirm its representativeness.
1 Univ. Lorraine, CNRS, Nancy, France,[email protected] 2 Univ. Orleans, Univ. Tours, INSA-CVL, Orléans, France 3 Univ. Orleans, INSA-CVL, Orléans, France 4 MAP-CRAI, CNRS/MC, Nancy, France
327
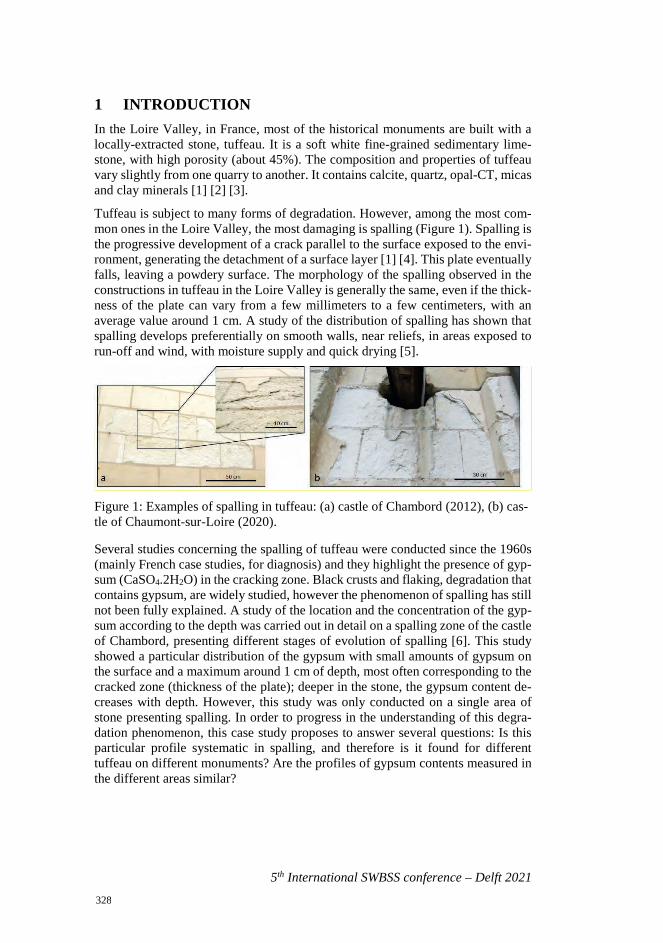
5th International SWBSS conference – Delft 2021
1 INTRODUCTION In the Loire Valley, in France, most of the historical monuments are built with a locally-extracted stone, tuffeau. It is a soft white fine-grained sedimentary lime-stone, with high porosity (about 45%). The composition and properties of tuffeau vary slightly from one quarry to another. It contains calcite, quartz, opal-CT, micas and clay minerals [1] [2] [3].
Tuffeau is subject to many forms of degradation. However, among the most com-mon ones in the Loire Valley, the most damaging is spalling (Figure 1). Spalling is the progressive development of a crack parallel to the surface exposed to the envi-ronment, generating the detachment of a surface layer [1] [4]. This plate eventually falls, leaving a powdery surface. The morphology of the spalling observed in the constructions in tuffeau in the Loire Valley is generally the same, even if the thick-ness of the plate can vary from a few millimeters to a few centimeters, with an average value around 1 cm. A study of the distribution of spalling has shown that spalling develops preferentially on smooth walls, near reliefs, in areas exposed to run-off and wind, with moisture supply and quick drying [5].
Figure 1: Examples of spalling in tuffeau: (a) castle of Chambord (2012), (b) cas-tle of Chaumont-sur-Loire (2020).
Several studies concerning the spalling of tuffeau were conducted since the 1960s (mainly French case studies, for diagnosis) and they highlight the presence of gyp-sum (CaSO4.2H2O) in the cracking zone. Black crusts and flaking, degradation that contains gypsum, are widely studied, however the phenomenon of spalling has still not been fully explained. A study of the location and the concentration of the gyp-sum according to the depth was carried out in detail on a spalling zone of the castle of Chambord, presenting different stages of evolution of spalling [6]. This study showed a particular distribution of the gypsum with small amounts of gypsum on the surface and a maximum around 1 cm of depth, most often corresponding to the cracked zone (thickness of the plate); deeper in the stone, the gypsum content de-creases with depth. However, this study was only conducted on a single area of stone presenting spalling. In order to progress in the understanding of this degra-dation phenomenon, this case study proposes to answer several questions: Is this particular profile systematic in spalling, and therefore is it found for different tuffeau on different monuments? Are the profiles of gypsum contents measured in the different areas similar?
328
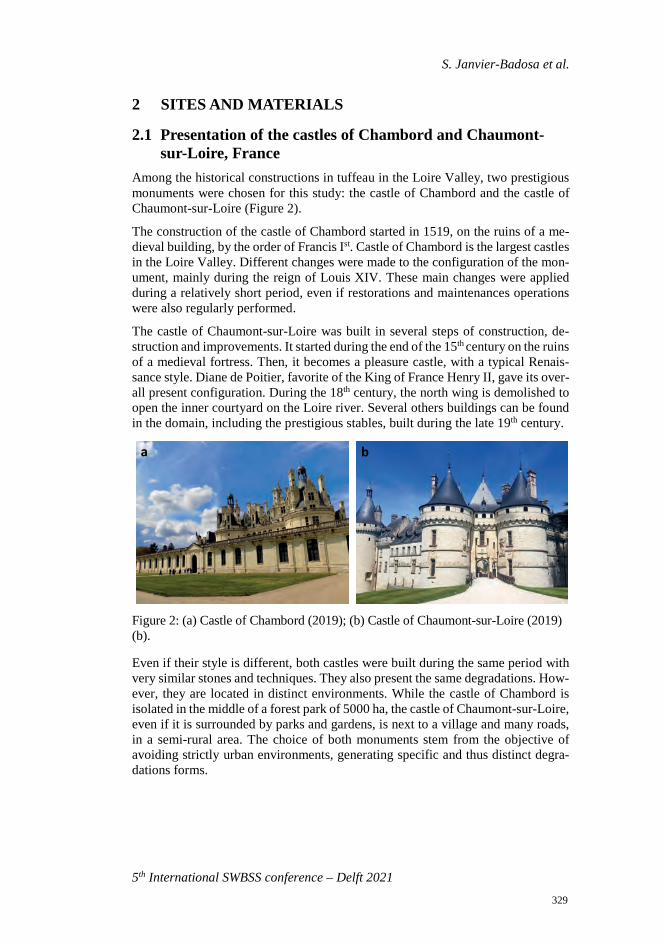
S. Janvier-Badosa et al.
5th International SWBSS conference – Delft 2021
2 SITES AND MATERIALS
2.1 Presentation of the castles of Chambord and Chaumont-sur-Loire, France
Among the historical constructions in tuffeau in the Loire Valley, two prestigious monuments were chosen for this study: the castle of Chambord and the castle of Chaumont-sur-Loire (Figure 2).
The construction of the castle of Chambord started in 1519, on the ruins of a me-dieval building, by the order of Francis Ist. Castle of Chambord is the largest castles in the Loire Valley. Different changes were made to the configuration of the mon-ument, mainly during the reign of Louis XIV. These main changes were applied during a relatively short period, even if restorations and maintenances operations were also regularly performed.
The castle of Chaumont-sur-Loire was built in several steps of construction, de-struction and improvements. It started during the end of the 15th century on the ruins of a medieval fortress. Then, it becomes a pleasure castle, with a typical Renais-sance style. Diane de Poitier, favorite of the King of France Henry II, gave its over-all present configuration. During the 18th century, the north wing is demolished to open the inner courtyard on the Loire river. Several others buildings can be found in the domain, including the prestigious stables, built during the late 19th century.
Figure 2: (a) Castle of Chambord (2019); (b) Castle of Chaumont-sur-Loire (2019) (b).
Even if their style is different, both castles were built during the same period with very similar stones and techniques. They also present the same degradations. How-ever, they are located in distinct environments. While the castle of Chambord is isolated in the middle of a forest park of 5000 ha, the castle of Chaumont-sur-Loire, even if it is surrounded by parks and gardens, is next to a village and many roads, in a semi-rural area. The choice of both monuments stem from the objective of avoiding strictly urban environments, generating specific and thus distinct degra-dations forms.
a b
329
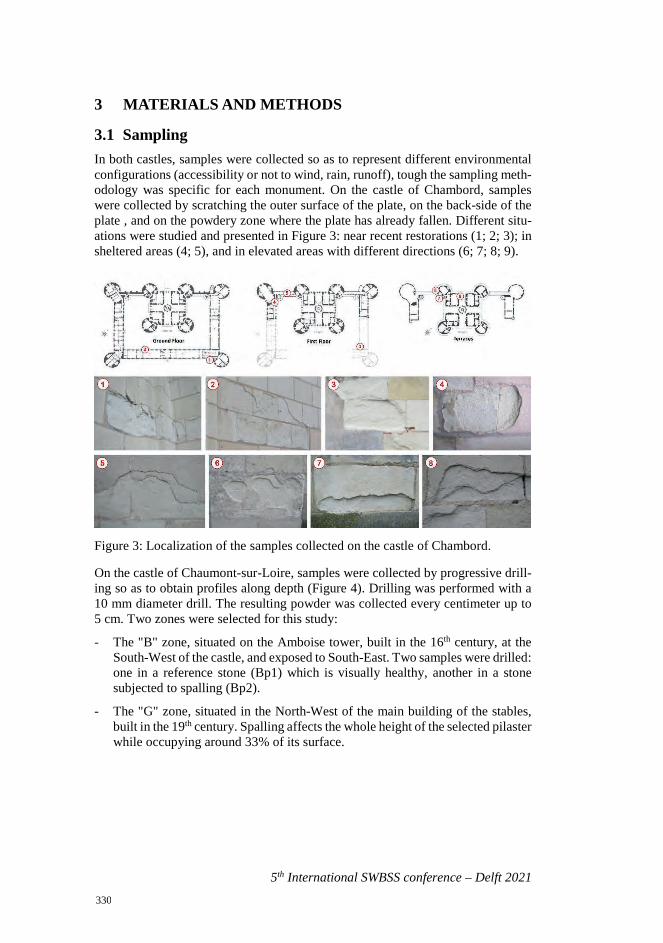
5th International SWBSS conference – Delft 2021
3 MATERIALS AND METHODS
3.1 Sampling In both castles, samples were collected so as to represent different environmental configurations (accessibility or not to wind, rain, runoff), tough the sampling meth-odology was specific for each monument. On the castle of Chambord, samples were collected by scratching the outer surface of the plate, on the back-side of the plate , and on the powdery zone where the plate has already fallen. Different situ-ations were studied and presented in Figure 3: near recent restorations (1; 2; 3); in sheltered areas (4; 5), and in elevated areas with different directions (6; 7; 8; 9).
Figure 3: Localization of the samples collected on the castle of Chambord.
On the castle of Chaumont-sur-Loire, samples were collected by progressive drill-ing so as to obtain profiles along depth (Figure 4). Drilling was performed with a 10 mm diameter drill. The resulting powder was collected every centimeter up to 5 cm. Two zones were selected for this study:
- The "B" zone, situated on the Amboise tower, built in the 16th century, at the South-West of the castle, and exposed to South-East. Two samples were drilled: one in a reference stone (Bp1) which is visually healthy, another in a stone subjected to spalling (Bp2).
- The "G" zone, situated in the North-West of the main building of the stables, built in the 19th century. Spalling affects the whole height of the selected pilaster while occupying around 33% of its surface.
330
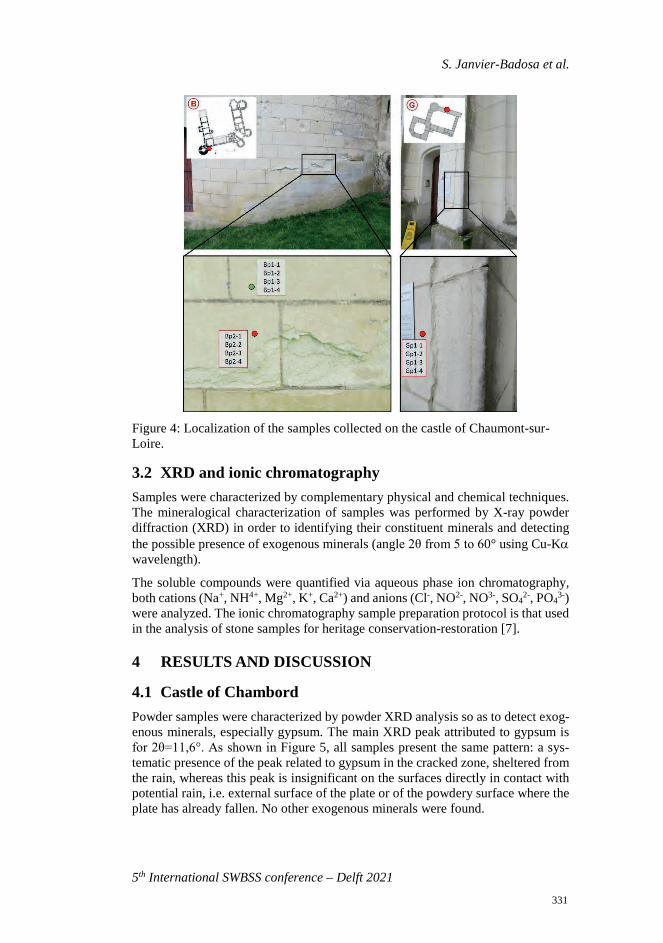
S. Janvier-Badosa et al.
5th International SWBSS conference – Delft 2021
Figure 4: Localization of the samples collected on the castle of Chaumont-sur-Loire.
3.2 XRD and ionic chromatography Samples were characterized by complementary physical and chemical techniques. The mineralogical characterization of samples was performed by X-ray powder diffraction (XRD) in order to identifying their constituent minerals and detecting the possible presence of exogenous minerals (angle 2θ from 5 to 60° using Cu-Kα wavelength).
The soluble compounds were quantified via aqueous phase ion chromatography, both cations (Na+, NH4+, Mg2+, K+, Ca2+) and anions (Cl-, NO2-, NO3-, SO4
2-, PO43-)
were analyzed. The ionic chromatography sample preparation protocol is that used in the analysis of stone samples for heritage conservation-restoration [7].
4 RESULTS AND DISCUSSION
4.1 Castle of Chambord Powder samples were characterized by powder XRD analysis so as to detect exog-enous minerals, especially gypsum. The main XRD peak attributed to gypsum is for 2θ=11,6°. As shown in Figure 5, all samples present the same pattern: a sys-tematic presence of the peak related to gypsum in the cracked zone, sheltered from the rain, whereas this peak is insignificant on the surfaces directly in contact with potential rain, i.e. external surface of the plate or of the powdery surface where the plate has already fallen. No other exogenous minerals were found.
331
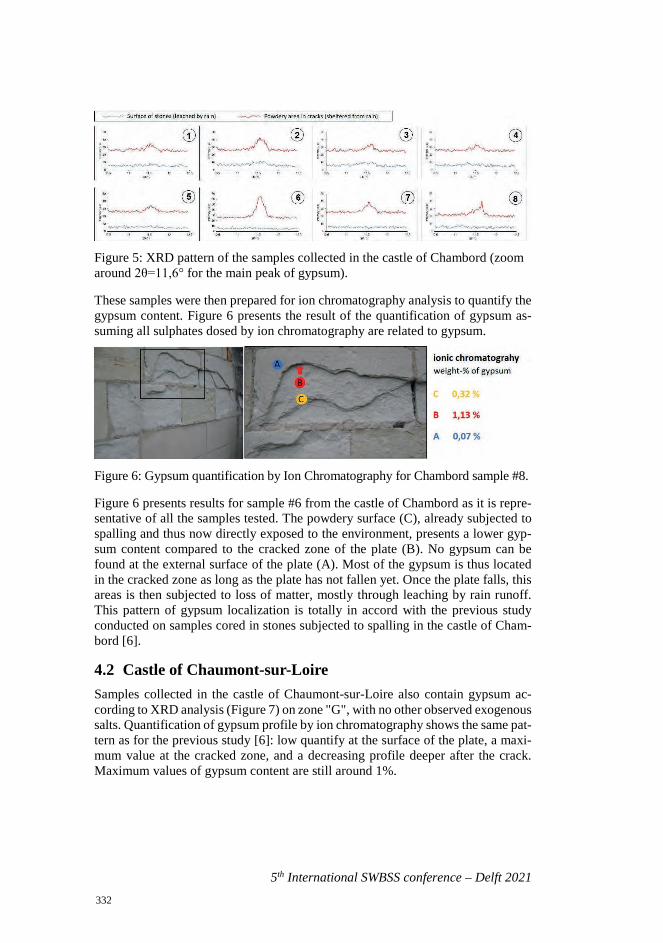
5th International SWBSS conference – Delft 2021
Figure 5: XRD pattern of the samples collected in the castle of Chambord (zoom around 2θ=11,6° for the main peak of gypsum).
These samples were then prepared for ion chromatography analysis to quantify the gypsum content. Figure 6 presents the result of the quantification of gypsum as-suming all sulphates dosed by ion chromatography are related to gypsum.
Figure 6: Gypsum quantification by Ion Chromatography for Chambord sample #8.
Figure 6 presents results for sample #6 from the castle of Chambord as it is repre-sentative of all the samples tested. The powdery surface (C), already subjected to spalling and thus now directly exposed to the environment, presents a lower gyp-sum content compared to the cracked zone of the plate (B). No gypsum can be found at the external surface of the plate (A). Most of the gypsum is thus located in the cracked zone as long as the plate has not fallen yet. Once the plate falls, this areas is then subjected to loss of matter, mostly through leaching by rain runoff. This pattern of gypsum localization is totally in accord with the previous study conducted on samples cored in stones subjected to spalling in the castle of Cham-bord [6].
4.2 Castle of Chaumont-sur-Loire Samples collected in the castle of Chaumont-sur-Loire also contain gypsum ac-cording to XRD analysis (Figure 7) on zone "G", with no other observed exogenous salts. Quantification of gypsum profile by ion chromatography shows the same pat-tern as for the previous study [6]: low quantify at the surface of the plate, a maxi-mum value at the cracked zone, and a decreasing profile deeper after the crack. Maximum values of gypsum content are still around 1%.
332
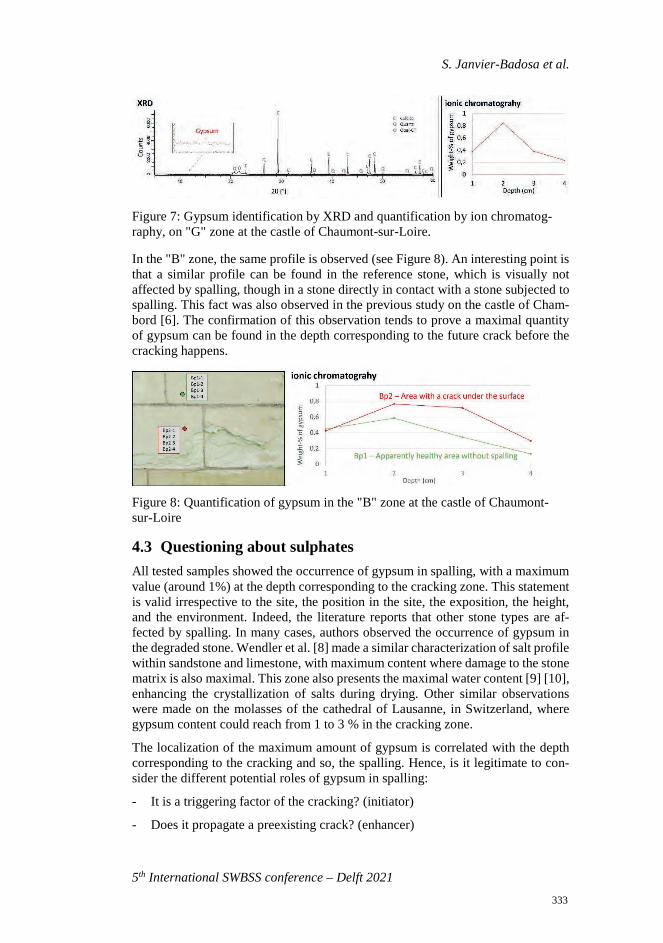
S. Janvier-Badosa et al.
5th International SWBSS conference – Delft 2021
Figure 7: Gypsum identification by XRD and quantification by ion chromatog-raphy, on "G" zone at the castle of Chaumont-sur-Loire.
In the "B" zone, the same profile is observed (see Figure 8). An interesting point is that a similar profile can be found in the reference stone, which is visually not affected by spalling, though in a stone directly in contact with a stone subjected to spalling. This fact was also observed in the previous study on the castle of Cham-bord [6]. The confirmation of this observation tends to prove a maximal quantity of gypsum can be found in the depth corresponding to the future crack before the cracking happens.
Figure 8: Quantification of gypsum in the "B" zone at the castle of Chaumont-sur-Loire
4.3 Questioning about sulphates All tested samples showed the occurrence of gypsum in spalling, with a maximum value (around 1%) at the depth corresponding to the cracking zone. This statement is valid irrespective to the site, the position in the site, the exposition, the height, and the environment. Indeed, the literature reports that other stone types are af-fected by spalling. In many cases, authors observed the occurrence of gypsum in the degraded stone. Wendler et al. [8] made a similar characterization of salt profile within sandstone and limestone, with maximum content where damage to the stone matrix is also maximal. This zone also presents the maximal water content [9] [10], enhancing the crystallization of salts during drying. Other similar observations were made on the molasses of the cathedral of Lausanne, in Switzerland, where gypsum content could reach from 1 to 3 % in the cracking zone.
The localization of the maximum amount of gypsum is correlated with the depth corresponding to the cracking and so, the spalling. Hence, is it legitimate to con-sider the different potential roles of gypsum in spalling:
- It is a triggering factor of the cracking? (initiator)
- Does it propagate a preexisting crack? (enhancer)
333
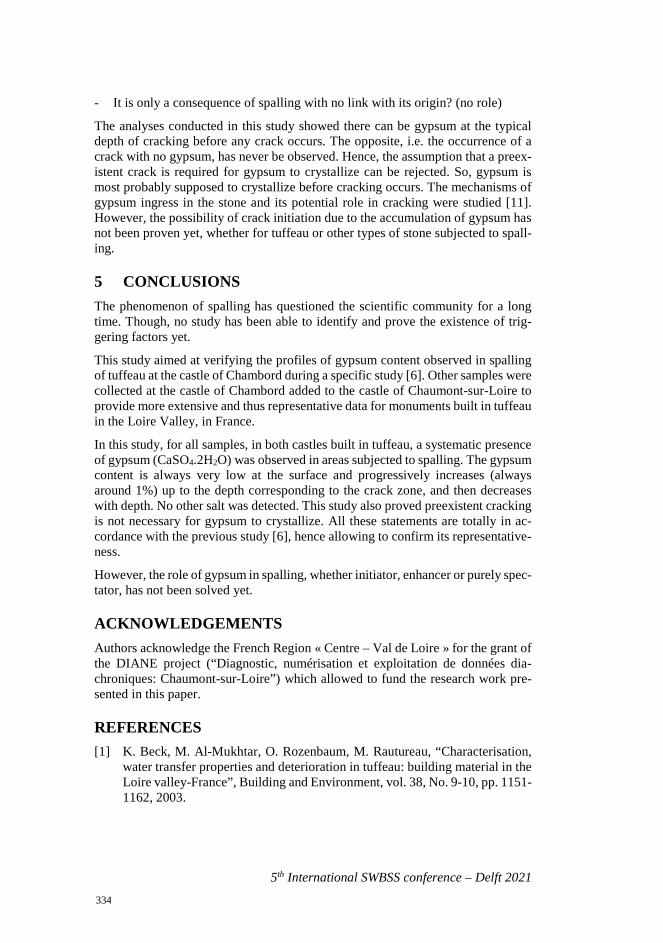
5th International SWBSS conference – Delft 2021
- It is only a consequence of spalling with no link with its origin? (no role)
The analyses conducted in this study showed there can be gypsum at the typical depth of cracking before any crack occurs. The opposite, i.e. the occurrence of a crack with no gypsum, has never be observed. Hence, the assumption that a preex-istent crack is required for gypsum to crystallize can be rejected. So, gypsum is most probably supposed to crystallize before cracking occurs. The mechanisms of gypsum ingress in the stone and its potential role in cracking were studied [11]. However, the possibility of crack initiation due to the accumulation of gypsum has not been proven yet, whether for tuffeau or other types of stone subjected to spall-ing.
5 CONCLUSIONS The phenomenon of spalling has questioned the scientific community for a long time. Though, no study has been able to identify and prove the existence of trig-gering factors yet.
This study aimed at verifying the profiles of gypsum content observed in spalling of tuffeau at the castle of Chambord during a specific study [6]. Other samples were collected at the castle of Chambord added to the castle of Chaumont-sur-Loire to provide more extensive and thus representative data for monuments built in tuffeau in the Loire Valley, in France.
In this study, for all samples, in both castles built in tuffeau, a systematic presence of gypsum (CaSO4.2H2O) was observed in areas subjected to spalling. The gypsum content is always very low at the surface and progressively increases (always around 1%) up to the depth corresponding to the crack zone, and then decreases with depth. No other salt was detected. This study also proved preexistent cracking is not necessary for gypsum to crystallize. All these statements are totally in ac-cordance with the previous study [6], hence allowing to confirm its representative-ness.
However, the role of gypsum in spalling, whether initiator, enhancer or purely spec-tator, has not been solved yet.
ACKNOWLEDGEMENTS Authors acknowledge the French Region « Centre – Val de Loire » for the grant of the DIANE project (“Diagnostic, numérisation et exploitation de données dia-chroniques: Chaumont-sur-Loire”) which allowed to fund the research work pre-sented in this paper.
REFERENCES [1] K. Beck, M. Al-Mukhtar, O. Rozenbaum, M. Rautureau, “Characterisation,
water transfer properties and deterioration in tuffeau: building material in theLoire valley-France”, Building and Environment, vol. 38, No. 9-10, pp. 1151-1162, 2003.
334
S. Janvier-Badosa et al.
5th International SWBSS conference – Delft 2021
[2] M. Rautureau, “Tendre comme la pierre”, ouvrage collectif sous la direction de Michel Rautureau. Ed. Conseil régional, Centre et Université d’Orléans, 2001.
[3] D. Dessandier, “Etude du milieu poreux et des propriétés de transfert des fluides du tuffeau blanc de Touraine, Application à la durabilité des pierres en œuvre”, Thèse de doctorat, Université de Tours, 1995.
[4] Icomos, “Illustrated glossary of stone deterioration patterns” Icomos, directed by V. Vergès-Belmin, 2008.
[5] S. Janvier-Badosa, X. Brunetaud, K. Beck, M. Al-Mukhtar, “Kinetics of stone degradation of the Castle of Chambord – France”, Int. J. of Architectural Her-itage, Vol. 10, No. 1, p. 96-105, 2016.
[6] S. Janvier, K. Beck, X. Brunetaud, M. Al-Mukhtar, “The occurrence of gyp-sum in the scaling of stones at the castle of Chambord (France)”, Journal of Environmental Earth Sciences, vol. 71, No. 11, pp. 4751–4759, 2014.
[7] Standard NORMAL 13/83 Dosaggio dei sali solubili, Italy, 1983.
[8] E. Wendler, D.D. Klemm, R. Snethlage, “Contour scaling on building facades - Dependence on stone type and environmental conditions, Analytical Meth-odologies for the Investigation of Damaged Stones”, MRS Online Proceed-ings Library, vol. 185, pp. 265–271, 1990.
[9] V. Verges-Belmin, J. Godin, C. Brunjail, G. Chéné, “Etudes de cas, l'église Notre-Dame-la-Grande de Poitiers et la cathédrale Saint-Gatien de Tours”, Géomécanique environnementale, risques naturels et patrimoine, sous la di-rection de Schrefler et Delage, éd. Hermès Science publication, pp. 307-329, 2001.
[10] J.P. Pauly, “Altération de la Pierre en œuvre en relation avec la climatologie et l’architecture. Simulation et produits de protection”, Thèse de doctorat, In-stitut National Polytechnique de Loraine, 329 p., 1990.
[11] S. Janvier-Badosa, K. Beck, X. Brunetaud, A. Guirimand-Dufour, M. Al-Mukhtar, “Gypsum and spalling decay mechanism of Tuffeau limestone”, En-vironmental Earth Sciences, vol. 73, No. 3, pp. 2209-2221, 2015.
335

336
5th International SWBSS conference – Delft 2021
MATTER LOSS QUANTIFICATION AND CHEMICAL ANALYSIS FOR THE DIAGNOSIS OF POWDERING: THE CASE STUDY OF THE CHAPEL OF MAUREPAS, CHAMBORD, FRANCE
Malek Balawi1, Kévin Beck1, Romain Janvier1,2,3, Sarah Janvier-Badosa4, and Xavier Brunetaud1*
KEYWORDS Powdering, sodium chloride, 3D survey, limestone, tuffeau, case study
ABSTRACT This study is extracted from a case study of the chapel of Maurepas, in the national estate of Chambord, in France. It is focused on the diagnosis of two corner quoins made of tuffeau stonework in the inner side of the chapel. These corner quoins visually suffer from severe powdering. Both matter loss quantification and chemi-cal analysis were performed to assess the intensity and the origin of this powdering. A 3D survey was performed using a laser scanner to quantify the matter loss where the powdering is maximal. The processing of 3D data revealed a reduction up to 37% of the section of the pillar. Samples were drilled at different heights and dif-ferent depths to assess the nature and proportion of potential salts, added to the quantification of water content. XRD analyses showed the presence of NaCl while ion chromatography could quantify its content, up to 10%. Even if the pillars are located in the inner side of the chapel, there is a significant water content in the stonework, especially where it is polluted by NaCl. All evidences tend to conclude the phenomenon of powdering is still in progress even if some remediation was already attempted in 1992 in this chapel.
1 INTRODUCTION The diagnosis of built heritage is a social duty necessary to ensure its preservation over time. It generally involves multidisciplinary approaches due to the complexity of durability issues added to that of historic building materials. This study is part
1 Univ. Orleans, Univ. Tours, INSA-CVL, Orléans, France,
[email protected] 2 Univ. Orleans, INSA-CVL, Orléans, France 3 MAP-CRAI, CNRS/MC, Nancy, France 4 Univ. Lorraine, CNRS, IJL, Nancy, France
337
5th International SWBSS conference – Delft 2021
of the health diagnosis of the chapel of Maurepas in the national estate of Cham-bord, in France. This chapel is presently subjected to powdering, especially in the inner part, since the outer part was restored in 1992. This study aims to quantify matter loss, salt presence, and water content to assess the intensity and the origin of this degradation. Moreover, since some remediation was attempted in 1992, it would be useful to assess if the phenomenon is still in progress or already stopped.
Quantifying the loss of matter is not an easy process when it is not possible to compare the actual state with the original one. To quantify something missing, it is necessary to make assumptions concerning the original shape, and perform local measurements of geometrical positions. To acquire the precise actual position of the facing of a wall, it is possible to perform a 3D survey. Such 3D survey can use photogrammetry and/or laser scanning [1][2]. Laser scanning can generally ensure a relevant geometrical precision, whereas photogrammetry, though cheaper and more versatile, is more susceptible to artifacts, uncertainties, and potential pro-cessing failure.
The health diagnosis of materials generally involves chemical analysis [3]. The combination of chemical and mineralogical characterization is used to detect changes in the composition of the damaged materials including exogenous miner-als, like salts. The mineralogical characterization allows identifying crystalline phases, while the chemical analysis is more dedicated to quantification. As water is generally a necessary element involved in degradation processes, it is also useful to quantify its amount in the damaged materials.
A 3D survey based on laser scanning was performed to quantify the matter loss due to powdering in the most damaged stone course of the inner corner quoins support-ing the arch. Samples of stone powder were also collected at different heights and different depths by drilling for water content quantification and chemical analysis, using both XRD and ion chromatography.
2 PRESENTATION OF THE CHAPEL OF MAUREPAS The chapel of Maurepas (Figure 1) is a small building located in the heart of the National Estate of Chambord, listed as a UNESCO World Heritage site since 1981, in the Loire Valley in France. The chapel is supposed to be built a little after the castle of Chambord, during the 17th century. It is now isolated in a place surrounded by the forest. There is barely any available historical document concerning this chapel. The last known restoration was done in 1992, in the outer part of the chapel. The inner side is supposed not to have ever been restored.
Built on lake limestone foundations, the elevations of the chapel are made of tuffeau rubble covered with lime coating, with corner quoins in tuffeau stonework. This chapel follows a generally rectangular plan, only the south wall opens onto a small chapel, framed by stonework quoins, and crowned with an arch. The subject of this study is the interior corner quoins supporting the arch.
338
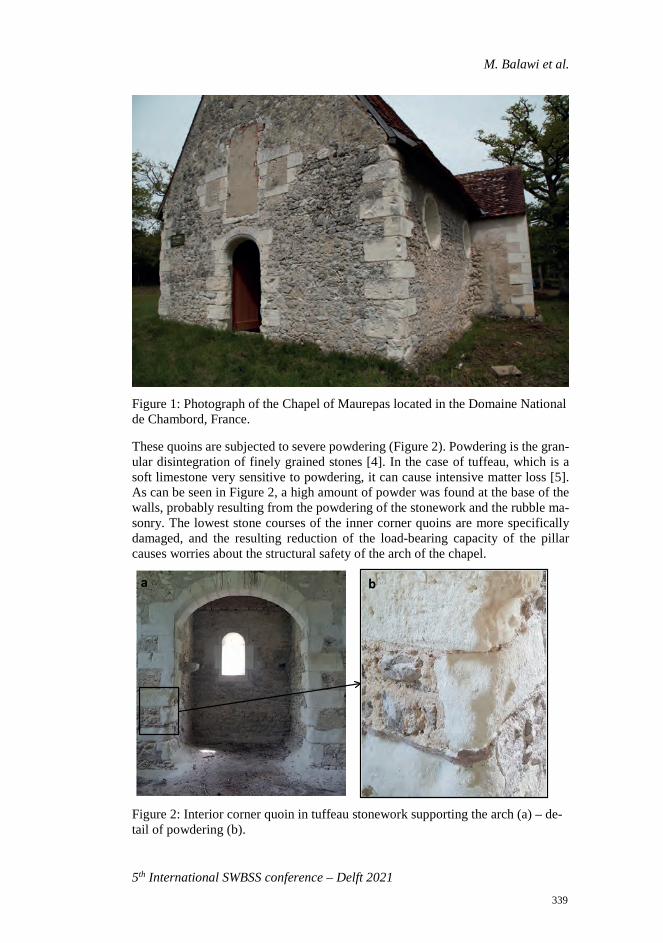
M. Balawi et al.
5th International SWBSS conference – Delft 2021
Figure 1: Photograph of the Chapel of Maurepas located in the Domaine National de Chambord, France.
These quoins are subjected to severe powdering (Figure 2). Powdering is the gran-ular disintegration of finely grained stones [4]. In the case of tuffeau, which is a soft limestone very sensitive to powdering, it can cause intensive matter loss [5]. As can be seen in Figure 2, a high amount of powder was found at the base of the walls, probably resulting from the powdering of the stonework and the rubble ma-sonry. The lowest stone courses of the inner corner quoins are more specifically damaged, and the resulting reduction of the load-bearing capacity of the pillar causes worries about the structural safety of the arch of the chapel.
Figure 2: Interior corner quoin in tuffeau stonework supporting the arch (a) – de-tail of powdering (b).
a b
339
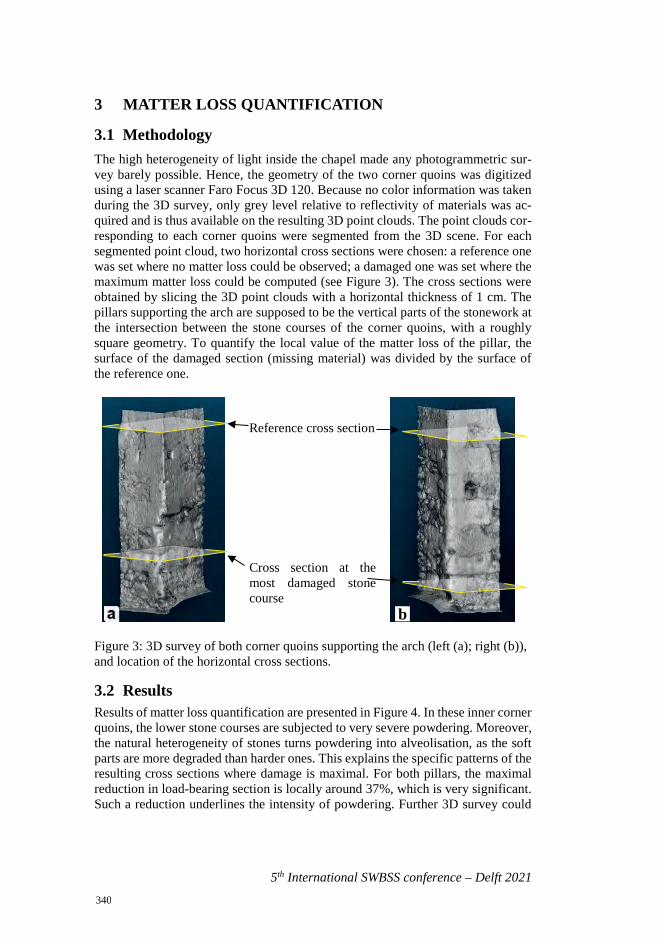
5th International SWBSS conference – Delft 2021
3 MATTER LOSS QUANTIFICATION
3.1 Methodology The high heterogeneity of light inside the chapel made any photogrammetric sur-vey barely possible. Hence, the geometry of the two corner quoins was digitized using a laser scanner Faro Focus 3D 120. Because no color information was taken during the 3D survey, only grey level relative to reflectivity of materials was ac-quired and is thus available on the resulting 3D point clouds. The point clouds cor-responding to each corner quoins were segmented from the 3D scene. For each segmented point cloud, two horizontal cross sections were chosen: a reference one was set where no matter loss could be observed; a damaged one was set where the maximum matter loss could be computed (see Figure 3). The cross sections were obtained by slicing the 3D point clouds with a horizontal thickness of 1 cm. The pillars supporting the arch are supposed to be the vertical parts of the stonework at the intersection between the stone courses of the corner quoins, with a roughly square geometry. To quantify the local value of the matter loss of the pillar, the surface of the damaged section (missing material) was divided by the surface of the reference one.
Reference cross section
Cross section at the most damaged stone course
Figure 3: 3D survey of both corner quoins supporting the arch (left (a); right (b)), and location of the horizontal cross sections.
3.2 Results Results of matter loss quantification are presented in Figure 4. In these inner corner quoins, the lower stone courses are subjected to very severe powdering. Moreover, the natural heterogeneity of stones turns powdering into alveolisation, as the soft parts are more degraded than harder ones. This explains the specific patterns of the resulting cross sections where damage is maximal. For both pillars, the maximal reduction in load-bearing section is locally around 37%, which is very significant. Such a reduction underlines the intensity of powdering. Further 3D survey could
b
340
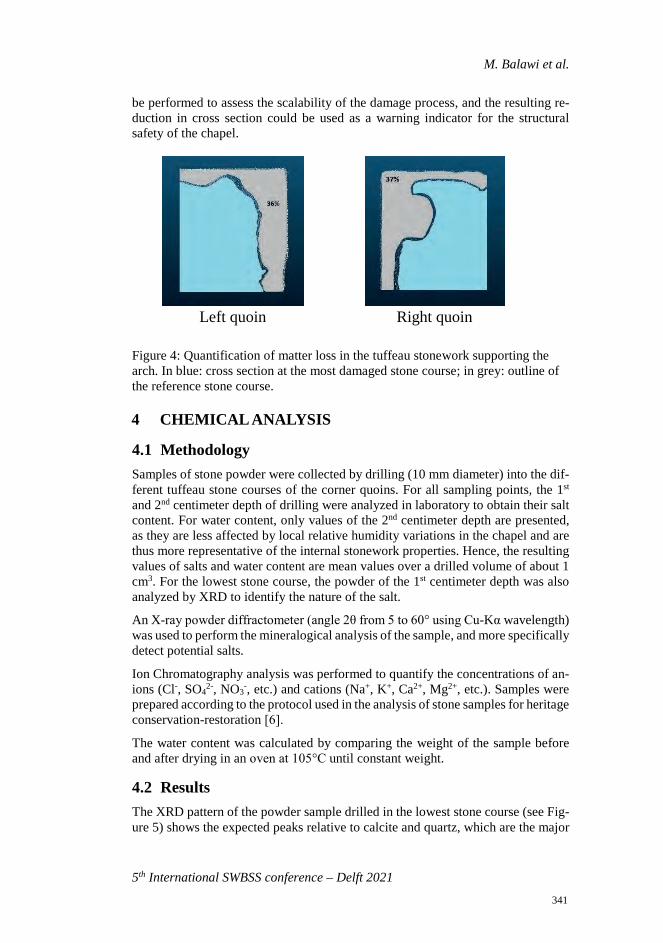
M. Balawi et al.
5th International SWBSS conference – Delft 2021
be performed to assess the scalability of the damage process, and the resulting re-duction in cross section could be used as a warning indicator for the structural safety of the chapel.
Left quoin
Right quoin
Figure 4: Quantification of matter loss in the tuffeau stonework supporting the arch. In blue: cross section at the most damaged stone course; in grey: outline of the reference stone course.
4 CHEMICAL ANALYSIS
4.1 Methodology Samples of stone powder were collected by drilling (10 mm diameter) into the dif-ferent tuffeau stone courses of the corner quoins. For all sampling points, the 1st and 2nd centimeter depth of drilling were analyzed in laboratory to obtain their salt content. For water content, only values of the 2nd centimeter depth are presented, as they are less affected by local relative humidity variations in the chapel and are thus more representative of the internal stonework properties. Hence, the resulting values of salts and water content are mean values over a drilled volume of about 1 cm3. For the lowest stone course, the powder of the 1st centimeter depth was also analyzed by XRD to identify the nature of the salt.
An X-ray powder diffractometer (angle 2θ from 5 to 60° using Cu-Kα wavelength) was used to perform the mineralogical analysis of the sample, and more specifically detect potential salts.
Ion Chromatography analysis was performed to quantify the concentrations of an-ions (Cl-, SO4
2-, NO3-, etc.) and cations (Na+, K+, Ca2+, Mg2+, etc.). Samples were
prepared according to the protocol used in the analysis of stone samples for heritage conservation-restoration [6].
The water content was calculated by comparing the weight of the sample before and after drying in an oven at 105°C until constant weight.
4.2 Results The XRD pattern of the powder sample drilled in the lowest stone course (see Fig-ure 5) shows the expected peaks relative to calcite and quartz, which are the major
341
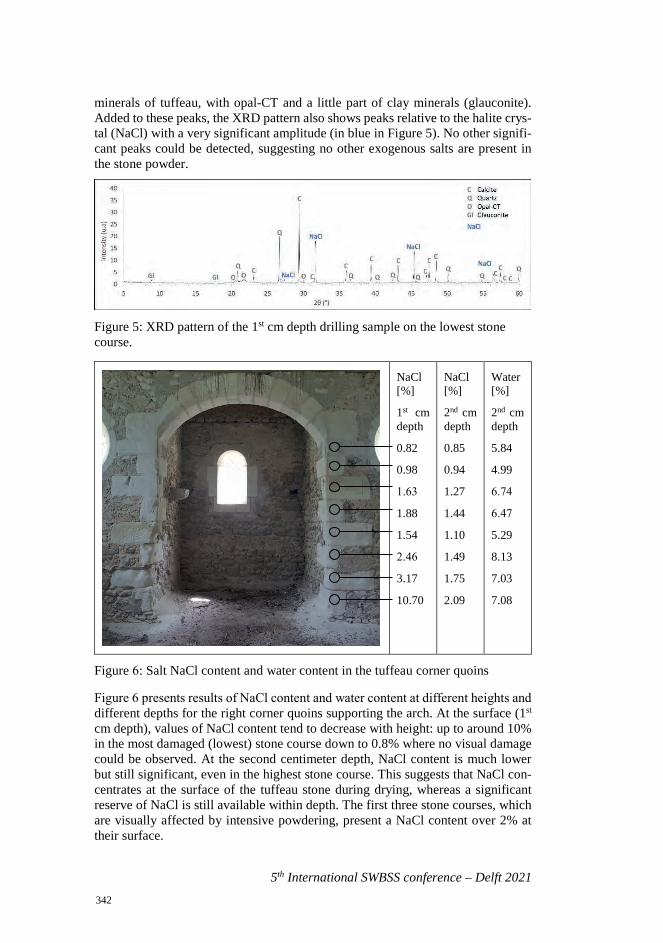
5th International SWBSS conference – Delft 2021
minerals of tuffeau, with opal-CT and a little part of clay minerals (glauconite). Added to these peaks, the XRD pattern also shows peaks relative to the halite crys-tal (NaCl) with a very significant amplitude (in blue in Figure 5). No other signifi-cant peaks could be detected, suggesting no other exogenous salts are present in the stone powder.
Figure 5: XRD pattern of the 1st cm depth drilling sample on the lowest stone course.
NaCl [%]
1st cm depth
0.82
0.98
1.63
1.88
1.54
2.46
3.17
10.70
NaCl [%]
2nd cm depth
0.85
0.94
1.27
1.44
1.10
1.49
1.75
2.09
Water [%]
2nd cm depth
5.84
4.99
6.74
6.47
5.29
8.13
7.03
7.08
Figure 6: Salt NaCl content and water content in the tuffeau corner quoins
Figure 6 presents results of NaCl content and water content at different heights and different depths for the right corner quoins supporting the arch. At the surface (1st cm depth), values of NaCl content tend to decrease with height: up to around 10% in the most damaged (lowest) stone course down to 0.8% where no visual damage could be observed. At the second centimeter depth, NaCl content is much lower but still significant, even in the highest stone course. This suggests that NaCl con-centrates at the surface of the tuffeau stone during drying, whereas a significant reserve of NaCl is still available within depth. The first three stone courses, which are visually affected by intensive powdering, present a NaCl content over 2% at their surface.
342
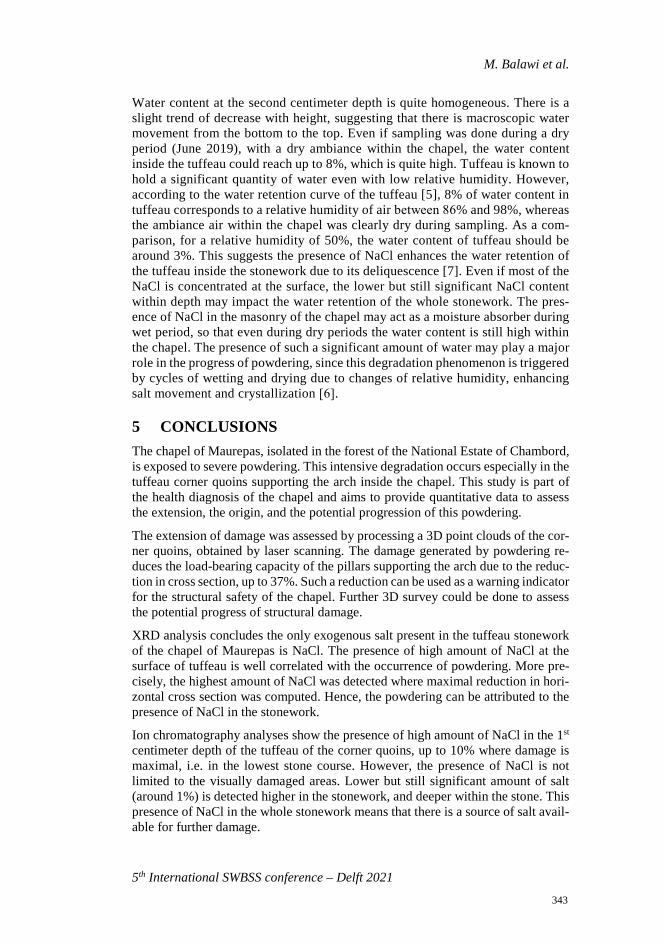
M. Balawi et al.
5th International SWBSS conference – Delft 2021
Water content at the second centimeter depth is quite homogeneous. There is a slight trend of decrease with height, suggesting that there is macroscopic water movement from the bottom to the top. Even if sampling was done during a dry period (June 2019), with a dry ambiance within the chapel, the water content inside the tuffeau could reach up to 8%, which is quite high. Tuffeau is known to hold a significant quantity of water even with low relative humidity. However, according to the water retention curve of the tuffeau [5], 8% of water content in tuffeau corresponds to a relative humidity of air between 86% and 98%, whereas the ambiance air within the chapel was clearly dry during sampling. As a com-parison, for a relative humidity of 50%, the water content of tuffeau should be around 3%. This suggests the presence of NaCl enhances the water retention of the tuffeau inside the stonework due to its deliquescence [7]. Even if most of the NaCl is concentrated at the surface, the lower but still significant NaCl content within depth may impact the water retention of the whole stonework. The pres-ence of NaCl in the masonry of the chapel may act as a moisture absorber during wet period, so that even during dry periods the water content is still high within the chapel. The presence of such a significant amount of water may play a major role in the progress of powdering, since this degradation phenomenon is triggered by cycles of wetting and drying due to changes of relative humidity, enhancing salt movement and crystallization [6].
5 CONCLUSIONS The chapel of Maurepas, isolated in the forest of the National Estate of Chambord, is exposed to severe powdering. This intensive degradation occurs especially in the tuffeau corner quoins supporting the arch inside the chapel. This study is part of the health diagnosis of the chapel and aims to provide quantitative data to assess the extension, the origin, and the potential progression of this powdering.
The extension of damage was assessed by processing a 3D point clouds of the cor-ner quoins, obtained by laser scanning. The damage generated by powdering re-duces the load-bearing capacity of the pillars supporting the arch due to the reduc-tion in cross section, up to 37%. Such a reduction can be used as a warning indicator for the structural safety of the chapel. Further 3D survey could be done to assess the potential progress of structural damage.
XRD analysis concludes the only exogenous salt present in the tuffeau stonework of the chapel of Maurepas is NaCl. The presence of high amount of NaCl at the surface of tuffeau is well correlated with the occurrence of powdering. More pre-cisely, the highest amount of NaCl was detected where maximal reduction in hori-zontal cross section was computed. Hence, the powdering can be attributed to the presence of NaCl in the stonework.
Ion chromatography analyses show the presence of high amount of NaCl in the 1st centimeter depth of the tuffeau of the corner quoins, up to 10% where damage is maximal, i.e. in the lowest stone course. However, the presence of NaCl is not limited to the visually damaged areas. Lower but still significant amount of salt (around 1%) is detected higher in the stonework, and deeper within the stone. This presence of NaCl in the whole stonework means that there is a source of salt avail-able for further damage.
343
5th International SWBSS conference – Delft 2021
The significant water content within the stone (up to 8%), way higher than what tuffeau should retain for dry ambiance, suggests that NaCl acts as a moisture ab-sorber during wet period enhancing the retention of water in the whole masonry. This water is then available for the progression of powdering as this degradation process is triggered by cycles of wetting and drying.
ACKNOWLEDGEMENTS Authors acknowledge the French Region « Centre – Val de Loire » for the grant of the DIANE project (“Diagnostic, numérisation et exploitation de données dia-chroniques: Chaumont-sur-Loire”) which allowed to fund the research work pre-sented in this paper.
REFERENCES [1] G. Pavlidisa, A. Koutsoudisa, F. Arnaoutogloua, V. Tsioukasb,C Chamzas,
2006, “Methods for 3D digitization of Cultural Heritage”, Journal of Cultural Heritage, vol. 8, no 1, pp. 93-98, 2007.
[2] X. Brunetaud, C. Stefani, S. Janvier-Badosa, K. Beck, M. AL-Mukhtar, “Comparison between photomodelling and laser scanning to create a 3D model for a digital health record”, European Journal of Environmental and Civil Engineering, vol. 16, pp. 48-63, 2012.
[3] S. Janvier, K. Beck, X. Brunetaud, M. Al-Mukhtar, “The occurrence of gyp-sum in the scaling of stones at the castle of Chambord (France)”, Journal of Environmental Earth Sciences, vol. 71, no. 11, pp. 4751–4759, 2014.
[4] Icomos, Illustrated glossary of stone deterioration patterns Icomos, 2008.
[5] K. Beck, “Étude des propriétés hydriques et des mécanismes d’altération de pierres calcaires à forte porosité”, Ph-D thesis, University of Orléans, 226 p., 2006.
[6] Standard NORMAL 13/83 Dosaggio dei sali solubili, Italy, 1983.
[7] T. Lombardo, S. Simon, E. Doehne, “The response of NaCl and Umm Ishrin Sandstone to humidity cycling: Mechanisms of salt weathering”, The 10th International Congress on Detorioration and Conservation of Stone, Stock-holm, 27 June-2 July 2004.
344
5th International SWBSS conference – Delft 2021
HOW TO LIVE WITH SOLUBLE SALTS: THE CONSERVATION OF THE 9TH AND 12TH C. WALL PAINTINGS AT RIVA SAN VITALE (CH)
Marta Caroselli1*, Paola Iazurlo1, Greta Acquistapace1, Medea Uccelli1, Miriam Guglielmetti1, Alessandra Pidò1, and Francesca Piqué1
KEYWORDS
Soluble salts, monitoring, conservation work
ABSTRACT The Baptistery of San Giovanni in Riva San Vitale (Switzerland) is an extraordi-nary example of early Christian architecture dating back to the 5th century. It con-tains some of the earliest wall paintings of the Canton Tessin, dating from the 9th to 15th century, often overlapping in a complex stratigraphy and surviving only in portions. Between 1953 and 1955 the building underwent an important architec-tural and painting restoration project. Since 2017 the University of Applied Sci-ences and Arts of Southern Switzerland (SUPSI) is involved in the study and con-servation of the wall paintings. Following preliminary research aimed to collect background information, a thorough condition assessment identified and mapped the different deterioration phenomena affecting the interior surfaces. The most challenging deterioration problem is related to the presence of soluble salts. The on-going diagnostic study includes the identification of the salts, their crystalline habits and the interior microclimate. This is necessary to plan an adequate inter-vention to stabilize the wall paintings. Salts efflorescence were analyzed with Po-larized Light Microscopy and FT-IR ATR spectroscopy. Moisture distribution and hygroscopicity were assessed in various interior and exterior points through micro-core sampling. The results showed that salt efflorescences are mainly composed of gypsum and epsomite and that moisture is present due to capillary rise and infiltra-tions. The presence of gypsum is due to materials used in previous interventions. The deterioration mechanism is on-going and during the first wall painting conser-vation campaign (Fall of 2020) the decision was taken not to treat the areas actively affected by salts, but to monitor them over time in order to understand their behav-iors and take an educated decision in the near future.
1 University of Applied Sciences and Arts of Southern Switzerland (SUPSI), Institute of
Materials and Construction (IMC), Switzerland [email protected]
345
5th International SWBSS conference – Delft 2021
1 INTRODUCTION This paper presents the investigations conducted in the Baptistery of San Giovanni in Riva San Vitale as part of the on-going wall painting conservation program car-ried out by SUPSI. The apse, where the conservation program started in the Fall 2020, is characterized by cycles of overlapping fragmentary paintings, belonging to different centuries, stratified in a complex sequence. Preliminary investigations identified painting materials and methods as well as previous interventions. Diag-nostic study focused on the understanding of degradation phenomena, such as plas-ter disintegration, decohesion, and detachment of the paint layer mostly related to the activity of soluble salts.
The study is necessary for planning the conservation intervention, and includes the characterization of the problem of salts in the whole Baptistery and the understand-ing of the causes and mechanisms of deterioration. Preliminary salt reduction tests were carried out with different extractive poultices, both prepared and mixed on site and commercially available. In addition, a program for monitoring the micro-climate and some problematic areas is still on-going.
The information collected provided the basis for the assessment of the situation and is fundamental for planning the intervention and future maintenance procedures [1].
2 THE BAPTISTERY OF SAN GIOVANNI AND THE PAINTING CYCLES
2.1 The Baptistery The Baptistery of San Giovanni Battista in Riva San Vitale (Figure 1a) was built in the early Christian period between the 5th and 6th centuries on the foundations of a pre-existing Roman building. The internal octagonal plan, externally shows a square perimeter surmounted by an octagonal lantern [2]. Over the centuries, the building underwent many structural and aesthetical changes, particularly, the inter-nal floor was elevated and buildings were constructed adjacent to the Baptistery (Figure 1b).
The restoration of the Baptistery carried out between 1953 and 1955, involved the demolition of the adjacent buildings, the recovery of the original floor and of the early Christian immersion baptismal font. In addition, archaeological investiga-tions revealed the remains of two previous apses [3].
Now the Baptistery is an isolated building standing at the center of a courtyard. It is located approximately 1 meter below the road level. Furthermore, inside the building, the floor of the apse is 30 cm lower that the internal floor and the external sidewalk. This situation influences the flow of rainwater, which converges near the external perimeter walls. Furthermore, the proximity of the building to Lake Cere-sio and the Laveggio river has caused, in the past, periodical foods, especially dur-ing heavy rain periods.
346
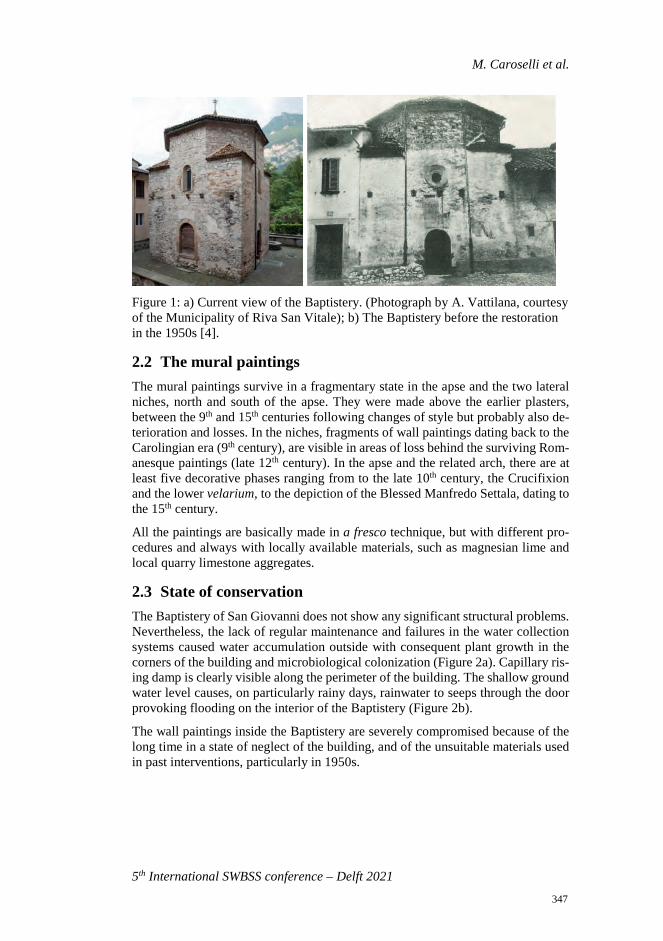
M. Caroselli et al.
5th International SWBSS conference – Delft 2021
Figure 1: a) Current view of the Baptistery. (Photograph by A. Vattilana, courtesy of the Municipality of Riva San Vitale); b) The Baptistery before the restoration in the 1950s [4].
2.2 The mural paintings The mural paintings survive in a fragmentary state in the apse and the two lateral niches, north and south of the apse. They were made above the earlier plasters, between the 9th and 15th centuries following changes of style but probably also de-terioration and losses. In the niches, fragments of wall paintings dating back to the Carolingian era (9th century), are visible in areas of loss behind the surviving Rom-anesque paintings (late 12th century). In the apse and the related arch, there are at least five decorative phases ranging from to the late 10th century, the Crucifixion and the lower velarium, to the depiction of the Blessed Manfredo Settala, dating to the 15th century.
All the paintings are basically made in a fresco technique, but with different pro-cedures and always with locally available materials, such as magnesian lime and local quarry limestone aggregates.
2.3 State of conservation The Baptistery of San Giovanni does not show any significant structural problems. Nevertheless, the lack of regular maintenance and failures in the water collection systems caused water accumulation outside with consequent plant growth in the corners of the building and microbiological colonization (Figure 2a). Capillary ris-ing damp is clearly visible along the perimeter of the building. The shallow ground water level causes, on particularly rainy days, rainwater to seeps through the door provoking flooding on the interior of the Baptistery (Figure 2b).
The wall paintings inside the Baptistery are severely compromised because of the long time in a state of neglect of the building, and of the unsuitable materials used in past interventions, particularly in 1950s.
347
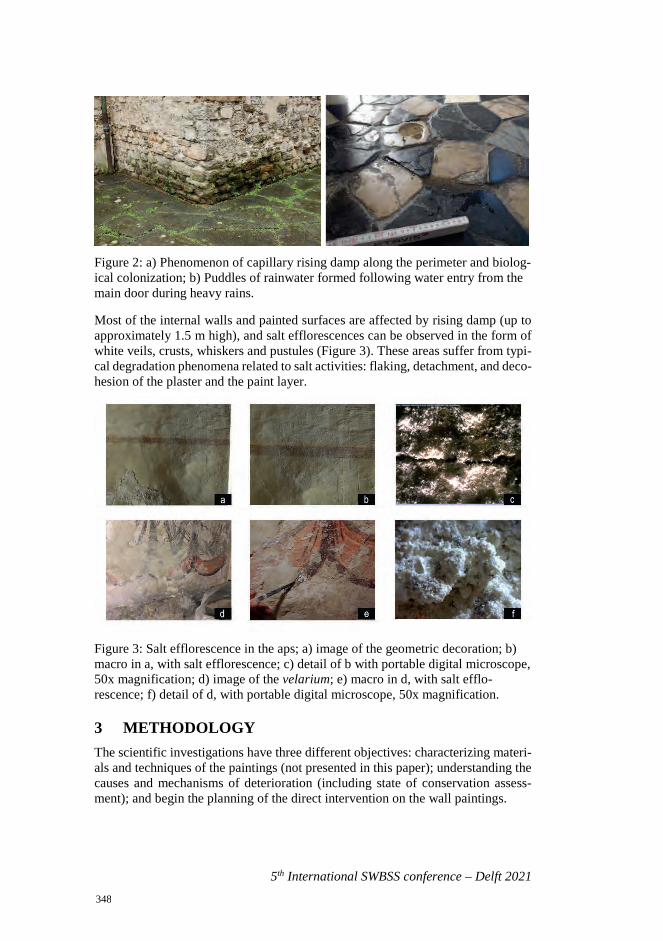
5th International SWBSS conference – Delft 2021
Figure 2: a) Phenomenon of capillary rising damp along the perimeter and biolog-ical colonization; b) Puddles of rainwater formed following water entry from the main door during heavy rains.
Most of the internal walls and painted surfaces are affected by rising damp (up to approximately 1.5 m high), and salt efflorescences can be observed in the form of white veils, crusts, whiskers and pustules (Figure 3). These areas suffer from typi-cal degradation phenomena related to salt activities: flaking, detachment, and deco-hesion of the plaster and the paint layer.
Figure 3: Salt efflorescence in the aps; a) image of the geometric decoration; b) macro in a, with salt efflorescence; c) detail of b with portable digital microscope, 50x magnification; d) image of the velarium; e) macro in d, with salt efflo-rescence; f) detail of d, with portable digital microscope, 50x magnification.
3 METHODOLOGY The scientific investigations have three different objectives: characterizing materi-als and techniques of the paintings (not presented in this paper); understanding the causes and mechanisms of deterioration (including state of conservation assess-ment); and begin the planning of the direct intervention on the wall paintings.
348
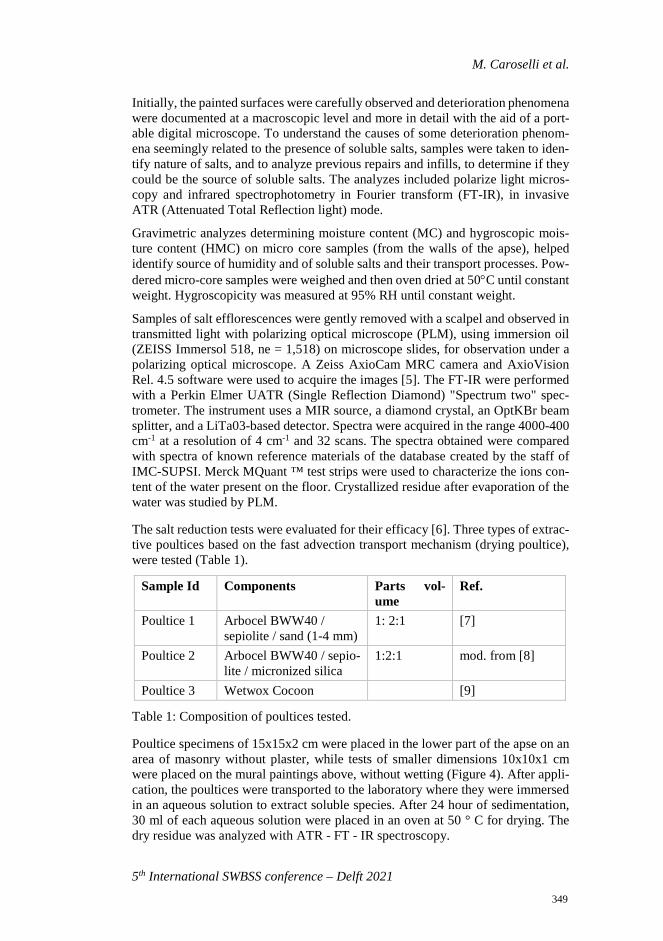
M. Caroselli et al.
5th International SWBSS conference – Delft 2021
Initially, the painted surfaces were carefully observed and deterioration phenomena were documented at a macroscopic level and more in detail with the aid of a port-able digital microscope. To understand the causes of some deterioration phenom-ena seemingly related to the presence of soluble salts, samples were taken to iden-tify nature of salts, and to analyze previous repairs and infills, to determine if they could be the source of soluble salts. The analyzes included polarize light micros-copy and infrared spectrophotometry in Fourier transform (FT-IR), in invasive ATR (Attenuated Total Reflection light) mode.
Gravimetric analyzes determining moisture content (MC) and hygroscopic mois-ture content (HMC) on micro core samples (from the walls of the apse), helped identify source of humidity and of soluble salts and their transport processes. Pow-dered micro-core samples were weighed and then oven dried at 50°C until constant weight. Hygroscopicity was measured at 95% RH until constant weight.
Samples of salt efflorescences were gently removed with a scalpel and observed in transmitted light with polarizing optical microscope (PLM), using immersion oil (ZEISS Immersol 518, ne = 1,518) on microscope slides, for observation under a polarizing optical microscope. A Zeiss AxioCam MRC camera and AxioVision Rel. 4.5 software were used to acquire the images [5]. The FT-IR were performed with a Perkin Elmer UATR (Single Reflection Diamond) "Spectrum two" spec-trometer. The instrument uses a MIR source, a diamond crystal, an OptKBr beam splitter, and a LiTa03-based detector. Spectra were acquired in the range 4000-400 cm-1 at a resolution of 4 cm-1 and 32 scans. The spectra obtained were compared with spectra of known reference materials of the database created by the staff of IMC-SUPSI. Merck MQuant ™ test strips were used to characterize the ions con-tent of the water present on the floor. Crystallized residue after evaporation of the water was studied by PLM.
The salt reduction tests were evaluated for their efficacy [6]. Three types of extrac-tive poultices based on the fast advection transport mechanism (drying poultice), were tested (Table 1).
Sample Id Components Parts vol-ume
Ref.
Poultice 1 Arbocel BWW40 / sepiolite / sand (1-4 mm)
1: 2:1 [7]
Poultice 2 Arbocel BWW40 / sepio-lite / micronized silica
1:2:1 mod. from [8]
Poultice 3 Wetwox Cocoon [9]
Table 1: Composition of poultices tested.
Poultice specimens of 15x15x2 cm were placed in the lower part of the apse on an area of masonry without plaster, while tests of smaller dimensions 10x10x1 cm were placed on the mural paintings above, without wetting (Figure 4). After appli-cation, the poultices were transported to the laboratory where they were immersed in an aqueous solution to extract soluble species. After 24 hour of sedimentation, 30 ml of each aqueous solution were placed in an oven at 50 ° C for drying. The dry residue was analyzed with ATR - FT - IR spectroscopy.
349
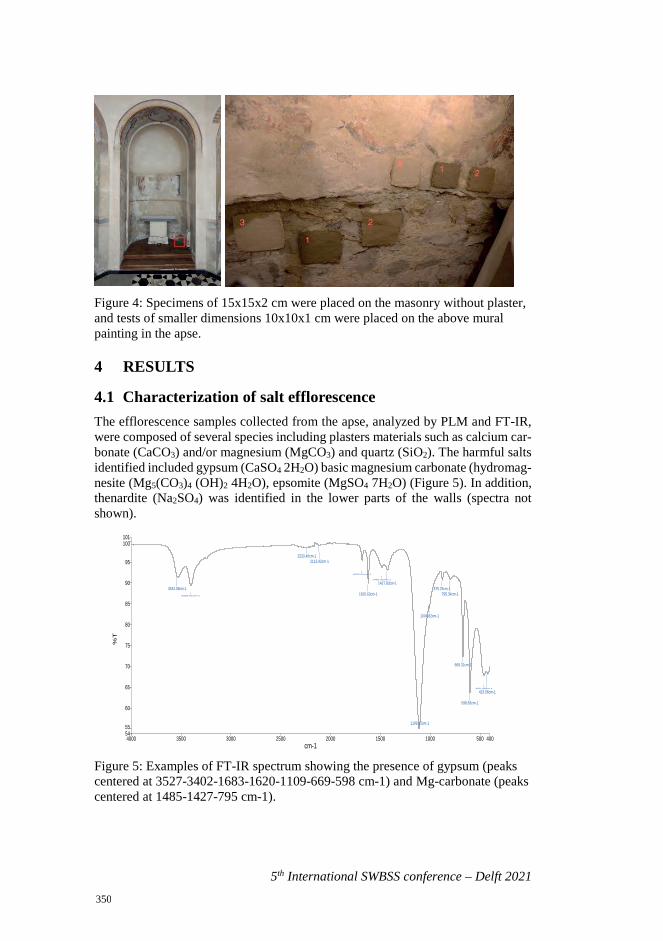
5th International SWBSS conference – Delft 2021
Figure 4: Specimens of 15x15x2 cm were placed on the masonry without plaster, and tests of smaller dimensions 10x10x1 cm were placed on the above mural painting in the apse.
4 RESULTS
4.1 Characterization of salt efflorescence The efflorescence samples collected from the apse, analyzed by PLM and FT-IR, were composed of several species including plasters materials such as calcium car-bonate (CaCO3) and/or magnesium (MgCO3) and quartz (SiO2). The harmful salts identified included gypsum (CaSO4 2H2O) basic magnesium carbonate (hydromag-nesite (Mg5(CO3)4 (OH)2 4H2O), epsomite (MgSO4 7H2O) (Figure 5). In addition, thenardite (Na2SO4) was identified in the lower parts of the walls (spectra not shown).
Figure 5: Examples of FT-IR spectrum showing the presence of gypsum (peaks centered at 3527-3402-1683-1620-1109-669-598 cm-1) and Mg-carbonate (peaks centered at 1485-1427-795 cm-1).
4000 4003500 3000 2500 2000 1500 1000 500
101
5455
60
65
70
75
80
85
90
95
100
cm-1
%T
1109.15cm-1
598.83cm-1
456.48cm-1
423.06cm-1
669.31cm-1
1004.82cm-1
3402.01cm-1 1620.63cm-1875.25cm-1
795.34cm-13534.08cm-1
1427.83cm-11485.35cm-1
1683.00cm-1
2233.46cm-12113.92cm-1
350
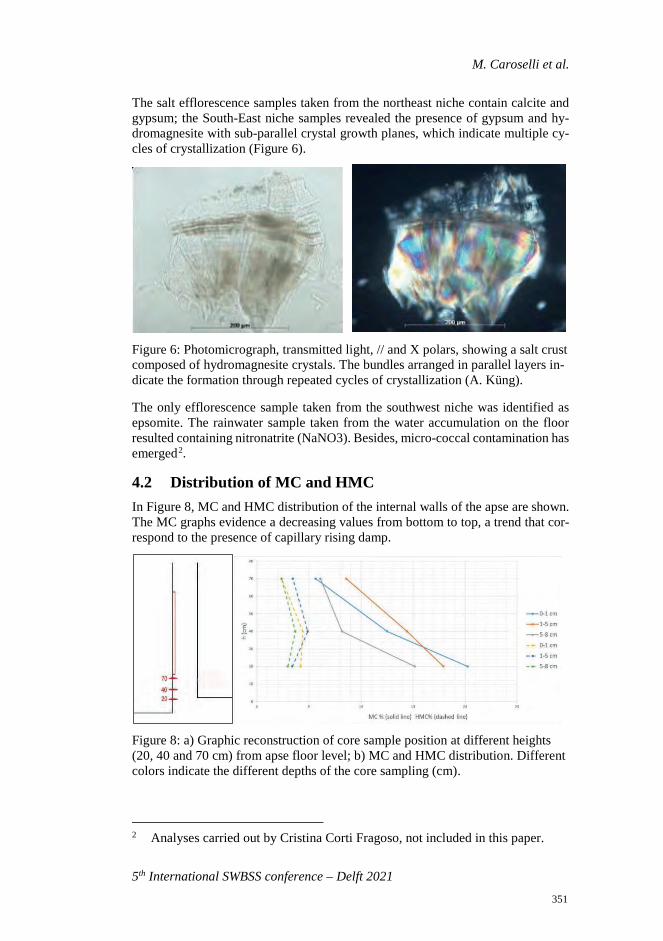
M. Caroselli et al.
5th International SWBSS conference – Delft 2021
The salt efflorescence samples taken from the northeast niche contain calcite and gypsum; the South-East niche samples revealed the presence of gypsum and hy-dromagnesite with sub-parallel crystal growth planes, which indicate multiple cy-cles of crystallization (Figure 6).
Figure 6: Photomicrograph, transmitted light, // and X polars, showing a salt crust composed of hydromagnesite crystals. The bundles arranged in parallel layers in-dicate the formation through repeated cycles of crystallization (A. Küng).
The only efflorescence sample taken from the southwest niche was identified as epsomite. The rainwater sample taken from the water accumulation on the floor resulted containing nitronatrite (NaNO3). Besides, micro-coccal contamination has emerged2.
4.2 Distribution of MC and HMC In Figure 8, MC and HMC distribution of the internal walls of the apse are shown. The MC graphs evidence a decreasing values from bottom to top, a trend that cor-respond to the presence of capillary rising damp.
Figure 8: a) Graphic reconstruction of core sample position at different heights (20, 40 and 70 cm) from apse floor level; b) MC and HMC distribution. Different colors indicate the different depths of the core sampling (cm).
2 Analyses carried out by Cristina Corti Fragoso, not included in this paper.
351
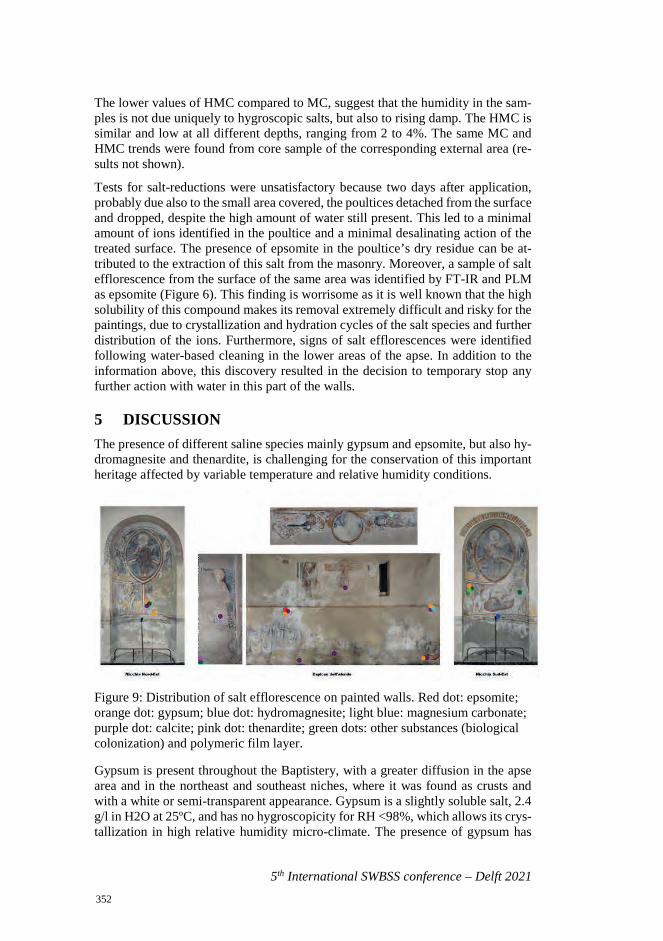
5th International SWBSS conference – Delft 2021
The lower values of HMC compared to MC, suggest that the humidity in the sam-ples is not due uniquely to hygroscopic salts, but also to rising damp. The HMC is similar and low at all different depths, ranging from 2 to 4%. The same MC and HMC trends were found from core sample of the corresponding external area (re-sults not shown).
Tests for salt-reductions were unsatisfactory because two days after application, probably due also to the small area covered, the poultices detached from the surface and dropped, despite the high amount of water still present. This led to a minimal amount of ions identified in the poultice and a minimal desalinating action of the treated surface. The presence of epsomite in the poultice’s dry residue can be at-tributed to the extraction of this salt from the masonry. Moreover, a sample of salt efflorescence from the surface of the same area was identified by FT-IR and PLM as epsomite (Figure 6). This finding is worrisome as it is well known that the high solubility of this compound makes its removal extremely difficult and risky for the paintings, due to crystallization and hydration cycles of the salt species and further distribution of the ions. Furthermore, signs of salt efflorescences were identified following water-based cleaning in the lower areas of the apse. In addition to the information above, this discovery resulted in the decision to temporary stop any further action with water in this part of the walls.
5 DISCUSSION The presence of different saline species mainly gypsum and epsomite, but also hy-dromagnesite and thenardite, is challenging for the conservation of this important heritage affected by variable temperature and relative humidity conditions.
Figure 9: Distribution of salt efflorescence on painted walls. Red dot: epsomite; orange dot: gypsum; blue dot: hydromagnesite; light blue: magnesium carbonate; purple dot: calcite; pink dot: thenardite; green dots: other substances (biological colonization) and polymeric film layer.
Gypsum is present throughout the Baptistery, with a greater diffusion in the apse area and in the northeast and southeast niches, where it was found as crusts and with a white or semi-transparent appearance. Gypsum is a slightly soluble salt, 2.4 g/l in H2O at 25ºC, and has no hygroscopicity for RH <98%, which allows its crys-tallization in high relative humidity micro-climate. The presence of gypsum has
352
M. Caroselli et al.
5th International SWBSS conference – Delft 2021
been attributed (to be confirmed) to the use of cement and/or gypsum based mortars in previous treatments in combination with a long standing source of liquid water. Epsomite is a highly soluble salt, 300 g/l in H2O at 20ºC. This salt when subjected to cycles of crystallization and solubilization activated by liquid, can cause serious deterioration on plasters and wall paintings. Epsomite is a very common salt in the Insubric area, as its formation is related to the presence of magnesian mortar as a constituent material while the possible sources of sulphate is discussed above. In-side the Baptistery, this salt was identified and distributed on the west side of the building, inside the niches. In the apse, it was found only in the bottom area where micro-core samples showed higher moisture content and hygroscopic humidity.
These studies identified the main source of humidity in the masonry from water table by capillary rise due to the lower level of the Baptistery’s floor. In some areas, there are sources of secondary importance of hygroscopic humidity, for example rain water which is not well drained, accumulates in the ground and rising up in the walls. The on-going microclimatic monitoring is investigating the relation between changes in temperature and relative humidity with the presence and activities of salt crystallized on the walls. This might allow to understand if the salts species are still subjected to cycles of deliquescence and recrystallization as a consequence of climatic fluctuation in the Baptistery. Furthermore, the observation of some control areas of salt crystallization in relation to the environmental monitoring is crucial to understand whether the mechanism of degradation is still active.
Concerning the desalination tests using extractive poultices, it was decided to sus-pend the intervention as it involves the application of water. The few salt reduction tests carried out led to unsatisfactory results because the poultices lost capillarity continuity with the surface after only two days. If the future development of the intervention will include salt-reduction intervention with extractive poultices, it will be necessary to support the poultices onto the masonry, to maximize their ef-fectiveness, taking into account the results obtained in this preliminary testing phase. Any intervention in this delicate situation must be planned and carried out with extreme care. Stopping the ingress of liquid water will probably provoke the crystallization of salts and it is important to avoid this on the painted surfaces.
6 CONCLUSIONS This work focused on the difficulties encountered, as often happens, when dealing with degradation phenomena linked to the presence of soluble salts on ancient wall paintings. These phenomena are the result of the complex interaction of multiple and intermingle factors that must be taken into consideration because they can in-fluence the progress of the solubilization, crystallization and hydration cycles of the salt species. The first phase of the conservation and restoration intervention included the characterization of the constituent materials, the degradation products, the moisture content and higroscopictiy of the masonry (through micro core sam-ples), the characterization of soluble salts and their distribution. Most of the efflo-rescences resulted to be gypsum and epsomite, while thenardite and hydromagne-site were found in limited areas. The source and distribution of these salts seem to be primarily linked to rising damp and unsuitable conservation materials used in the past. After an initial study phase, it was decided to halt the use of water-based
353
5th International SWBSS conference – Delft 2021
treatments and carry out a salt and environment monitoring program before choos-ing how to proceed in the most fragile areas affected by salts. The effects of the interventions will be visible over time, therefore, evaluating efficacy requires long-term studies.
ACKNOWLEDGEMENTS The authors would like to thanks Andreas Küng for the PLM analyses of the salts; the municipality of Riva San Vitale and the Cultural Heritage Office of Tessin can-ton for the given support.
REFERENCES [1] B. Lubelli, et al., An integrated methodology for salt damage assessment and
remediation: the case of San Jeronimo Monastery (Granada, Spain). Environ-mental Earth Sciences, vol. 63, pp. 1475-1486, 2018
[2] R. Cardani, Il Battistero di Riva San Vitale. Gli interventi di restauro: le duefasi degli anni ’20 e ’50. Rivista svizzera d’arte e d’archeologia, vol 47, pp285-304, 1990
[3] R. Cardani, L. Damiani Cabrini, Riva San Vitale. Il Battistero di San Giovannie la chiesa di Santa Croce. Berna: Società di storia dell’arte in Svizzera SSAS,2006.
[4] AA.VV. Il Battistero di Riva San Vitale. Note sui restauri, Bellinzona,Edizioni dello Stato, 1955.
[5] A. Küng. Efflorescenze e croste saline all’interno del battistero di Riva S.Vi-tale, internal unpublished report, IMC SUPSI, 2018.
[6] S. Cather, Aqueous extraction of soluble salts from porous materials: alterna-tives and contra-indications, in H. Leitner, S. Laue, H. Siedel (eds). Mau-ersalze und Architekturobeiflachen, 2003, pp 167-172.
[7] B. Lubelli & R. van Hees, Desalination of masonry structures: Fine tuning ofpore size distribution of poultices to substrate properties. Journal of CulturalHeritage, vol 11, pp 10-18, 2010.
[8] A. Sawdy et al., A review of salt transport in porous media, assessment meth-ods and salt reduction treatments. In: Salt Weathering on Buildings and StoneSculptures, 22–24 October 2008, The National Museum Copenhagen, Den-mark, 2008, pp 1-27.
[9] L. Randazzo et al., Salt extraction from lime-based mortars: An experimentalstudy using different poultice formulations. Construction and Building Mate-rials, vol 255,2020, art no. 119391.
354
5th International SWBSS conference – Delft 2021
STUDY AND EVALUATION OF SALT EFFLORESCENCE IN MAYA MURALS OF CALAKMUL NORTH ACROPOLIS, MÉXICO
Alejandra Alonso-Olvera1*, Esmeralda Martínez-Piñeiro2, and Gabriela Mora-Navarro1
KEYWORDS Maya mural painting, tropical microenvironment, crystallization patterns.
ABSTRACT This paper discusses the study and evaluation of salt efflorescences and their damaging effect in Mayan mural paintings of Structure Sub1-4 of Calakmul Archaeological Site. A comprehensive study of damaging salts in twenty-four mural paintings shows interest-ing crystallization patterns, varying depending on the nature of the salts and the water supply mechanisms (capillarity, filtration, condensation, and high rates of relative hu-midity) present in the extreme microclimate conditions existing in the four chambers of structure Sub1-4. Sixty-three samples were studied through optical microscopy, X-ray diffraction (XRD), X-ray fluorescence (XRF), Raman spectroscopy, and Fourier-trans-form infrared spectroscopy (FT-IR). XRF analyses identified calcium, iron, sulfur, sili-con, and traces of barium (only in a place treated with barium nanoparticles), while In-frared spectroscopy indicated the presence of calcium carbonate and gypsum. The amount of calcium carbonate and gypsum was calculated with the semi-quantitative anal-ysis based on the tabulated Reference Intensity Ratios of X-ray diffractograms and EVA software.
Calcium carbonate ions were lixiviated and recrystallized at the surface, causing efflo-rescences and crusts. Gypsum was present as efflorescences, forming crystals with vari-ous habits on the surface, or as subflorescences, forming crystalline aggregates below the surface [1]. According to the composition of the identified salt mixture, we created a risk map; this map reportsthe location of the samples, the damage caused by the salts at the surface or beneath the paint layer. Red and orange areas in the map indicate the
1 Instituto Nacional de Antropología e Historia, Coordinación Nacional de Conserva-
ción del Patrimonio Cultural, Ciudad de Mexico, Mexico. [email protected]
2 Universidad de Guanajuato, Noria Alta S/N, Mexico
355
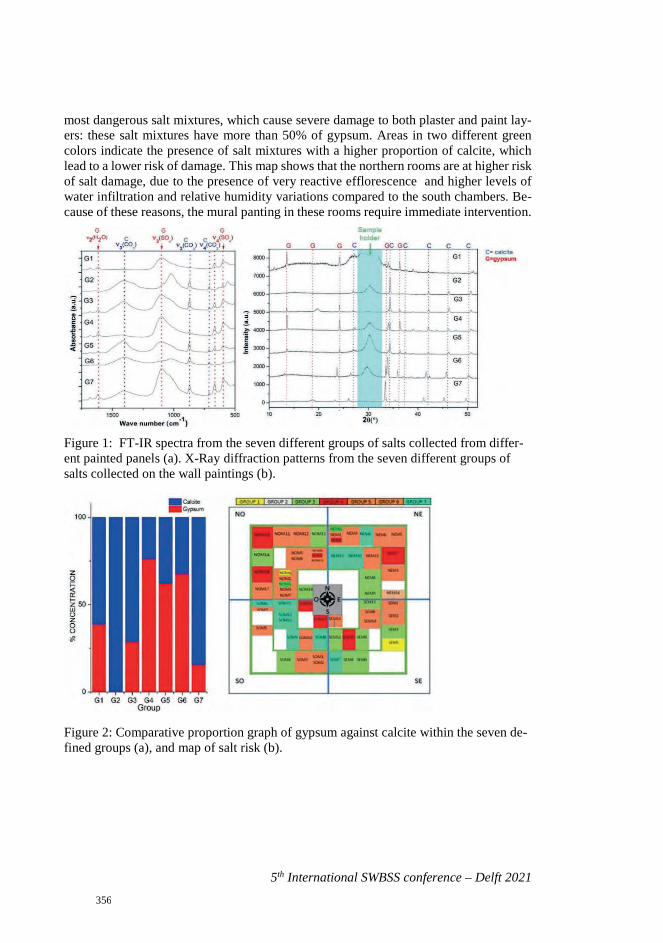
5th International SWBSS conference – Delft 2021
most dangerous salt mixtures, which cause severe damage to both plaster and paint lay-ers: these salt mixtures have more than 50% of gypsum. Areas in two different green colors indicate the presence of salt mixtures with a higher proportion of calcite, which lead to a lower risk of damage. This map shows that the northern rooms are at higher risk of salt damage, due to the presence of very reactive efflorescence and higher levels of water infiltration and relative humidity variations compared to the south chambers. Be-cause of these reasons, the mural panting in these rooms require immediate intervention.
Figure 1: FT-IR spectra from the seven different groups of salts collected from differ-ent painted panels (a). X-Ray diffraction patterns from the seven different groups of salts collected on the wall paintings (b).
Figure 2: Comparative proportion graph of gypsum against calcite within the seven de-fined groups (a), and map of salt risk (b).
356
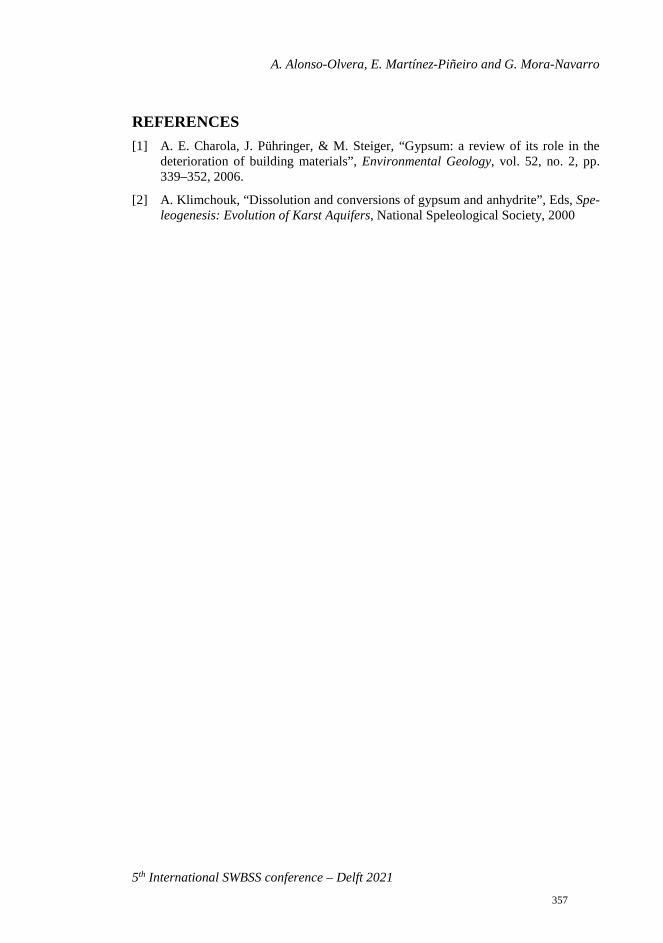
A. Alonso-Olvera, E. Martínez-Piñeiro and G. Mora-Navarro
5th International SWBSS conference – Delft 2021
REFERENCES [1] A. E. Charola, J. Pühringer, & M. Steiger, “Gypsum: a review of its role in the
deterioration of building materials”, Environmental Geology, vol. 52, no. 2, pp. 339–352, 2006.
[2] A. Klimchouk, “Dissolution and conversions of gypsum and anhydrite”, Eds, Spe-leogenesis: Evolution of Karst Aquifers, National Speleological Society, 2000
357

358
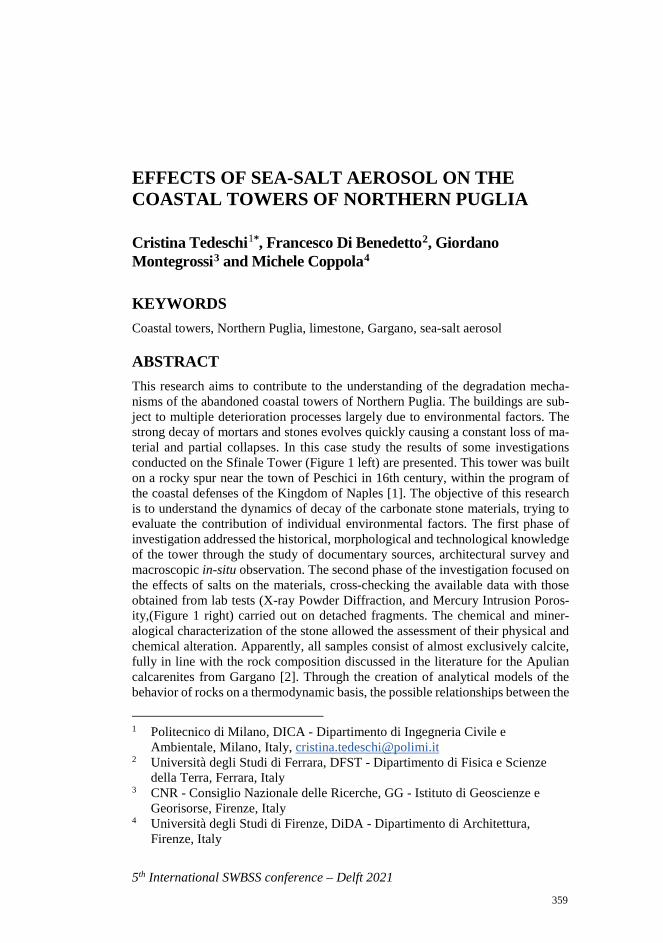
5th International SWBSS conference – Delft 2021
EFFECTS OF SEA-SALT AEROSOL ON THE COASTAL TOWERS OF NORTHERN PUGLIA
Cristina Tedeschi1*, Francesco Di Benedetto2, Giordano Montegrossi3 and Michele Coppola4
KEYWORDS Coastal towers, Northern Puglia, limestone, Gargano, sea-salt aerosol
ABSTRACT This research aims to contribute to the understanding of the degradation mecha-nisms of the abandoned coastal towers of Northern Puglia. The buildings are sub-ject to multiple deterioration processes largely due to environmental factors. The strong decay of mortars and stones evolves quickly causing a constant loss of ma-terial and partial collapses. In this case study the results of some investigations conducted on the Sfinale Tower (Figure 1 left) are presented. This tower was built on a rocky spur near the town of Peschici in 16th century, within the program of the coastal defenses of the Kingdom of Naples [1]. The objective of this research is to understand the dynamics of decay of the carbonate stone materials, trying to evaluate the contribution of individual environmental factors. The first phase of investigation addressed the historical, morphological and technological knowledge of the tower through the study of documentary sources, architectural survey and macroscopic in-situ observation. The second phase of the investigation focused on the effects of salts on the materials, cross-checking the available data with those obtained from lab tests (X-ray Powder Diffraction, and Mercury Intrusion Poros-ity,(Figure 1 right) carried out on detached fragments. The chemical and miner-alogical characterization of the stone allowed the assessment of their physical and chemical alteration. Apparently, all samples consist of almost exclusively calcite, fully in line with the rock composition discussed in the literature for the Apulian calcarenites from Gargano [2]. Through the creation of analytical models of the behavior of rocks on a thermodynamic basis, the possible relationships between the
1 Politecnico di Milano, DICA - Dipartimento di Ingegneria Civile e
Ambientale, Milano, Italy, [email protected] 2 Università degli Studi di Ferrara, DFST - Dipartimento di Fisica e Scienze
della Terra, Ferrara, Italy 3 CNR - Consiglio Nazionale delle Ricerche, GG - Istituto di Geoscienze e
Georisorse, Firenze, Italy 4 Università degli Studi di Firenze, DiDA - Dipartimento di Architettura,
Firenze, Italy
359
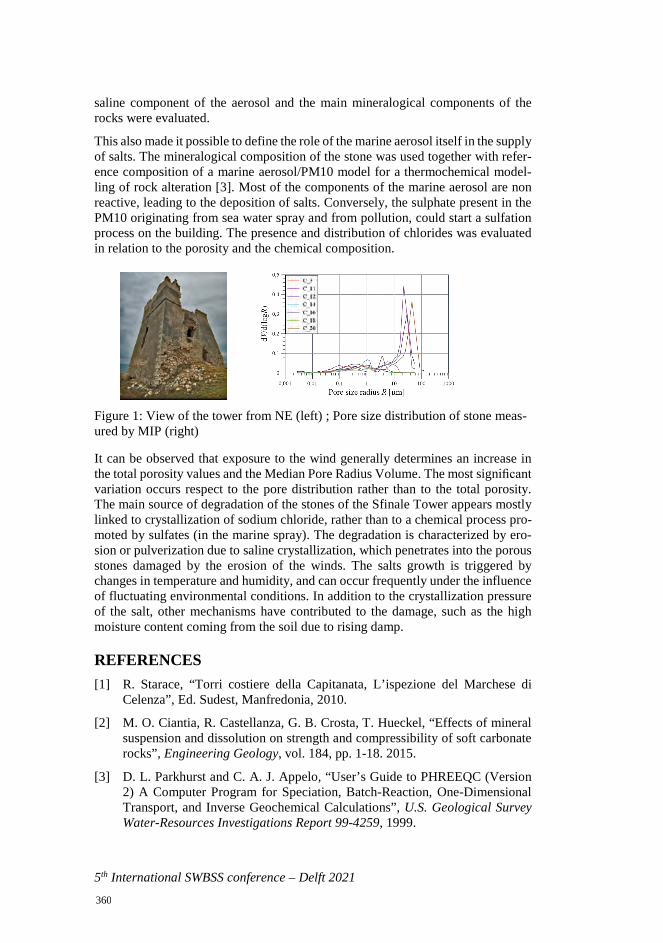
5th International SWBSS conference – Delft 2021
saline component of the aerosol and the main mineralogical components of the rocks were evaluated.
This also made it possible to define the role of the marine aerosol itself in the supply of salts. The mineralogical composition of the stone was used together with refer-ence composition of a marine aerosol/PM10 model for a thermochemical model-ling of rock alteration [3]. Most of the components of the marine aerosol are non reactive, leading to the deposition of salts. Conversely, the sulphate present in the PM10 originating from sea water spray and from pollution, could start a sulfation process on the building. The presence and distribution of chlorides was evaluated in relation to the porosity and the chemical composition.
Figure 1: View of the tower from NE (left) ; Pore size distribution of stone meas-ured by MIP (right)
It can be observed that exposure to the wind generally determines an increase in the total porosity values and the Median Pore Radius Volume. The most significant variation occurs respect to the pore distribution rather than to the total porosity. The main source of degradation of the stones of the Sfinale Tower appears mostly linked to crystallization of sodium chloride, rather than to a chemical process pro-moted by sulfates (in the marine spray). The degradation is characterized by ero-sion or pulverization due to saline crystallization, which penetrates into the porous stones damaged by the erosion of the winds. The salts growth is triggered by changes in temperature and humidity, and can occur frequently under the influence of fluctuating environmental conditions. In addition to the crystallization pressure of the salt, other mechanisms have contributed to the damage, such as the high moisture content coming from the soil due to rising damp.
REFERENCES [1] R. Starace, “Torri costiere della Capitanata, L’ispezione del Marchese di
Celenza”, Ed. Sudest, Manfredonia, 2010.
[2] M. O. Ciantia, R. Castellanza, G. B. Crosta, T. Hueckel, “Effects of mineralsuspension and dissolution on strength and compressibility of soft carbonaterocks”, Engineering Geology, vol. 184, pp. 1-18. 2015.
[3] D. L. Parkhurst and C. A. J. Appelo, “User’s Guide to PHREEQC (Version2) A Computer Program for Speciation, Batch-Reaction, One-DimensionalTransport, and Inverse Geochemical Calculations”, U.S. Geological SurveyWater-Resources Investigations Report 99-4259, 1999.
360


Fifth International Conference onSALT WEATHERING OF BUILDINGS AND STONE SCULPTURES
PROCEEDINGS OF SWBSS 2021
22-24 September 2021Delft, the Netherlands
EDITED BYBarbara LubelliAmeya KamatWido Quist
TU Delft OPEN
PR
OC
EE
DIN
GS
OF S
WB
SS
2021FIFT
H IN
TE
RN
AT
ION
AL C
ON
FER
EN
CE O
N S
ALT W
EA
TH
ER
ING
OF B
UILD
ING
S A
ND
STO
NE S
CU
LPT
UR
ES