Embed Size (px)
Citation preview
(2006) 205–221www.elsevier.com/locate/chemgeo
Chemical Geology 235
On the formation of an inverted weathering profile on MountKilimanjaro, Tanzania: Buried paleosol or groundwater weathering?
Mark Gabriel Little ⁎, Cin-Ty Aeolus Lee
Department of Earth Sciences, MS-126, Rice University, 6100 Main Street, Houston, TX 77005, USA
Received 21 November 2005; received in revised form 26 May 2006; accepted 28 June 2006
Editor: L.M. Walter
Abstract
This paper presents an investigation into the degree and nature of chemicalweathering during soil formation on a volcanic (phonolite)substrate on the southern slopes of Mt. Kilimanjaro in northern Tanzania. The high field strength elements Nb and Ta were used toestimate enrichments and depletions relative to the bedrock. The degree ofweatheringwas found to increasewith depth in the soil profile.At depths greater than 200 cm, Si, Na, K, Ca, and Mg have been depleted by nearly 100% while Al has been enriched, resulting in ahighly aluminous soil residue (40–50 wt.% Al2O3). At depths shallower than 200 cm, the soil is also depleted in Si, Na, K, Ca and Mgthough not to the extents seen at depths greater than 200 cm. The lower degrees of weathering in the upper 200 cm are also evidenced bythe fact that the layer above 200 cm is characterized by slight positive Eu anomalies relative to other rare earth elements whereas thedeeper layer exhibits no Eu anomalies. The rare earth element systematics are consistent with preferential weathering of the glassymatrixin the upper 200 cm, leaving behind plagioclase phenocrysts, which are enriched in Eu. In the deeper layer, weathering appears to be soextensive that both Eu-rich plagioclase phenocrysts and Eu-poor glass/ash have largely weathered away. These observations collectivelyshow that the upper and lower layers of theweathering profile have undergone different weathering histories. Four scenariosmay explainthe apparent inverted weathering profile: re-precipitation followed by erosion, Aeolian deposition, a buried paleosol, and enhancedweathering due to lateral subsurface water flow. The first hypothesis fails to explain the massive losses of Si, Na, K, Ca, and Mg below200 cm. TheAeolian deposition hypothesis is also untenable because it contradicts the trace element andREE's behaviors. The latter twohypotheses are both reasonable; however, the buried paleosol model is inconsistent with some physical and geochemical observationsand the subsurface flow model requires the influence of hydraulic conditions not tested in this study. It is concluded here that either theburied paleosol model or the subsurface flow model can explain the formation of the Machame soils with the latter having novelimplications for the transport of dissolved cations to the ocean.© 2006 Elsevier B.V. All rights reserved.
Keywords: Soil formation; Subsurface water; Chemical weathering; Tanzania
1. Introduction
Quantifying the rate of continental weathering is offundamental importance for understanding atmospheric
⁎ Corresponding author.E-mail address: [email protected] (M.G. Little).
0009-2541/$ - see front matter © 2006 Elsevier B.V. All rights reserved.doi:10.1016/j.chemgeo.2006.06.012
CO2 drawdown (Berner et al., 1983; Berner, 1995) and themagnitude of the fluxes of various elements into themarine environment, many of which have paleo-ocean-ographic significance (Gaillardet et al., 1999; Kump et al.,2000; Sak et al., 2003). In a quasi-steady-state system, thecontinental weathering flux can, in theory, be estimatedanywhere along the pathway between the source and the

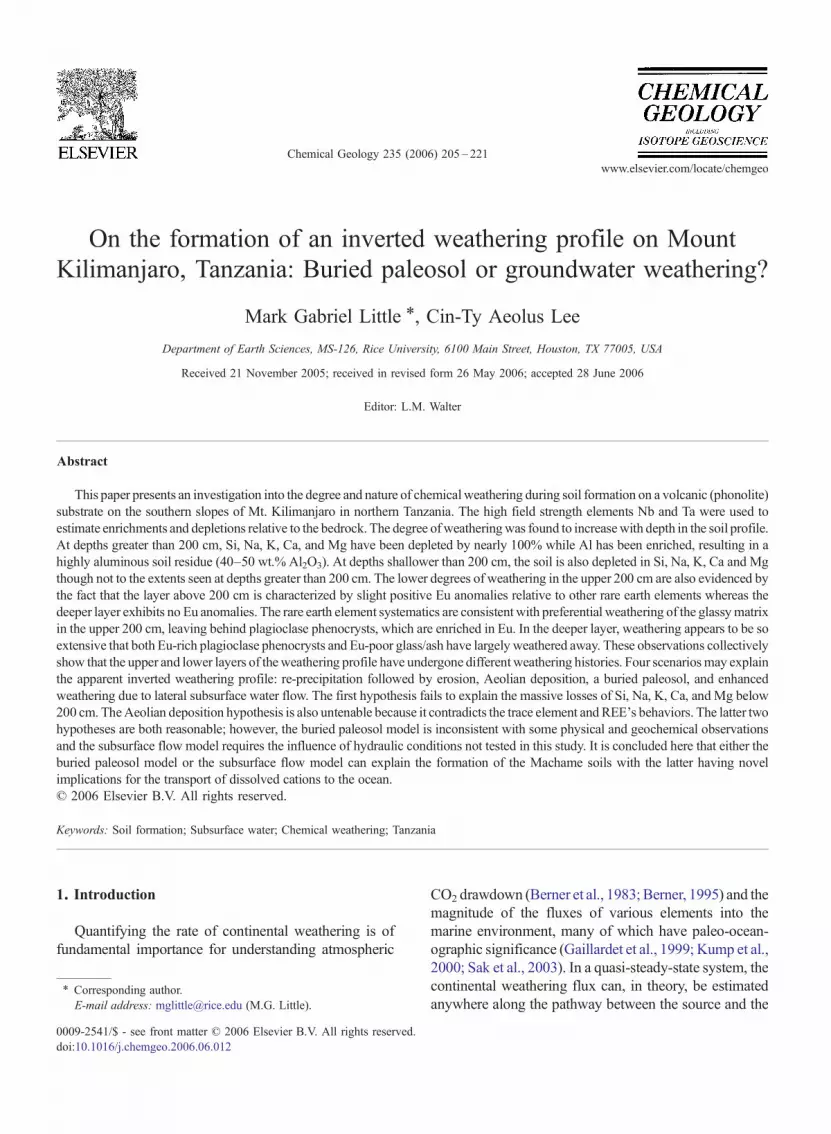
Fig. 1. Road cut in the Machame region of Tanzania on the southernslopes of Mt. Kilimanjaro. The gray circles indicate the approximatedepths at which samples were taken.
206 M.G. Little, C.-T. Aeolus Lee / Chemical Geology 235 (2006) 205–221
sink, the latter represented by marine sediments and theformer represented by chemical weathering of thecontinents. This means that one approach in measuringthe continental weathering flux is to measure the flux ofsolutes into the marine environment at the mouths ofmajor river systems (Gaillardet et al., 1999; Dessert et al.,2001). This approach is convenient because thewatershedareas of large river systems effectively average over largeregions of continental crust, and as such, are believed to befairly representative of average continental weatheringrates. Thus, if the goal is to quantify global weatheringrates and fluxes into the marine environment on largescales, the riverine perspective should be sufficient.However, if the goal is to better understand themechanisms of continental weathering, the averagingeffect of rivers is no longer a benefit. To understand themechanisms of continental weathering, attention mustthen be focused toward understanding the source terms inaddition to the riverine fluxes.
In this context, the most obvious source term to turn tois the chemical weathering flux associated with soilformation on either stable geomorphic surfaces (non-eroding) or steady-state landforms, where erosion andconversion of bedrock to soil roughly balance. However,other source terms may also exist. For example,subsurface water flow may result in chemical weatheringof the deep subsurface, but its significance in the globalcontext is unclear largely because of the greaterinaccessibility of the deep subsurface compared to soilprofiles. Nevertheless, recent studies seem to hint thatsubsurface water flow may contribute to the chemicalweathering flux of continents (Basu et al., 2001). If suchsubsurface water is significant and bypasses the rivermouth by directly entering the oceans, the solute fluxmeasured at river mouths may underestimate the truecontinental weathering flux to oceans for some elements.
We investigated a young, but unusually matureweathering profile situated on an intermediate volcanicsubstrate on the southern slopes of Mt. Kilimanjaro innortheastern Tanzania, a region having a tropicalequatorial climate. This weathering profile was fortu-itously exposed by a road cut, affording access to thedeep, and otherwise inaccessible, portions of theweathering profiles in this region. Importantly, in thisweathering profile, the degree of weathering appears to begreatest at depth, which is the inverse of what is seen intypical soil profiles where weathering is top–down. Weargue here that this inverted profile may be the result of aburied paleosol or enhanced chemical weathering at depthdue to focused subsurface lateral water flow. The latterinterpretation, if correct, would underscore the impor-tance of subsurface water weathering at least locally.
2. Study area and description of weathering profile
Samples were collected from a road cut-exposedweathering profile (03°11.275′ S, 37°14.157′ E, elevation1639 m) in the Machame region of northern Tanzania onthe southern slope of Mt. Kilimanjaro (Fig. 1). Theandosols in this region were formed on phonolitic lava andash flows. The weathering profile examined in this study issituated on a relatively undissected surface, which suggestsrelatively little erosion.Most erosion is confined to isolatedravines bordering large swathes of non-eroding geomor-phic surfaces. The studied weathering profile is situated onthe edge of one of these uneroded geomorphic surfaces andhas been conveniently exposed as a consequence of a deepravine and a road cut. Lava flows on the southern slope ofKilimanjaro have been dated between roughly 0.17 to0.51Ma (Evernden and Curtis, 1965; Dawson, 1992). Themodern, average annual rainfall in the Machame region is1929 mm/year (Anderson, 1982).
The relatively unweathered protolith of the Machamesoils is a bluish-gray lithified welded ash of phonoliticcomposition. We obtained a sample of the protolith fromblocks of bedrock exposed near the base of the roadcut.The groundmass of the protolith is largely aphanitic(∼90% of thin section area) and is dominated by smallplagioclase lathes and tiny dark green to black grains ofmagnetite–ulvospinel. Occasional phenocrysts are oli-vines with some of those having alteration rims ofiddingsite. The thickness of the sampled weatheringprofile is∼5 m and consists of three main horizons (frombottom to top): a dark gray, semi-consolidated saprolitecomposed of gibbsite gravel and weathered clasts; afriable, grayish brown, aluminum rich gravel with largevoids; and a dark brown, organic rich, sandy loam layer. A

207M.G. Little, C.-T. Aeolus Lee / Chemical Geology 235 (2006) 205–221
very shallow Oi horizon, less than 5 cm thick, consistingprimarily of forest litter, was also present, but notsampled. We collected 8 soil samples at 30–60 cmintervals down to a maximum depth of ∼370 cm.
3. Methods
Machame soil and protolith samples were dried for24 h at 105 °C. Samples were then ground by hand with aceramic mortar and pestle. Six grams of each samplepowder and USGS rock powder standards BHVO1,BHVO2, and BIR1 were sent to Washington StateUniversity at Pullman's GeoAnalytical Lab for XRFdetermination of Si, Ti, Al, Fe, Mn, Mg, Ca, Na, K, and Pconcentrations and for determination of Loss on Ignition(LOI), defined as the fraction of mass lost after heatingeach sample for 16 h at 900 °C (Johnson et al., 1999;Cornelius, 2004).
Sample powders, a blank, and BHVO1, BHVO2, andBIR1 USGS rock standards were prepared for induc-tively coupled plasma mass spectrometry (ICP-MS)analysis at Rice University using a series of aciddissolutions. Approximately 80 mg of the Machame soiland rock powders, BHVO2, and BIR1 were weighed; 2aliquots of approximately 40 and 80 mg of BHVO1were weighed for use as an external standard. Powderswere placed in Teflon beakers with approximately0.5 mL each of concentrated Seastar HNO3 andHClO4. These solutions were sealed and ultrasonicatedfor ∼20 min. Beakers were then heated overnight at115 °C. The following day, beakers were removed fromthe oven, unsealed, and placed on heating pads at∼175 °C until the solutions had dried down. Thisprocess of adding acids, overnight heating, and dryingdown was repeated 2 additional times; once again with
Table 1LOI-corrected major element oxide concentrations
Wt.% 5 cm 30 91 122 1
LOI 33.25 31.84 29.94 31.38 3Na2O 0.38 0.35 0.38 0.35MgO 0.76 0.67 0.73 0.66Al2O3 30.17 30.08 31.16 30.07 4SiO2
a 30.51 30.31 30.37 30.32b 2P2O5 1.09 1.06 1.09 1.00K2O 0.78 0.72 0.74 0.73CaO 0.59 0.51 0.60 0.50TiO2 4.32 3.99 4.27 3.83MnO 0.18 0.17 0.18 0.16FeO 17.49 16.97 17.96 16.79 1Total 86.26 84.82 87.47 84.40 8
All values determined using medium resolution ICP-MS unless indicated.a Values determined by XRF.b Values interpolated due to problems in XRF.
the addition of 0.5 mL each of concentrated HNO3 andHClO4 and finally with the addition of 1.0 mL of HClO4
only.Following the third and final dry down, ∼1 mL of
2% HNO3 was added to the samples. Beakers wereplaced on a hot plate at ∼100 °C for about 2 h.Approximately 280 μL of a 440.81 ppb indium solution(to serve as an internal standard) was precisely weighedinto a 125 mL capacity, low density polyethylene bottle.The contents of the Teflon beakers were carefullywashed into the polyethylene bottles using dilute HNO3.A small drop of 1 M HCl was added to keep thedissolved Fe in solution. The contents of the bottleswere then diluted up to 100 mL (∼1 ppb indium in thefinal solution) with dilute HNO3 and weighed again.
Machame samples, blank, BHVO1, BHVO2, andBIR1 were all run on a Finnigan Element II, singlecollector ICP-MS at Rice University. The ICP-MS wasrun in low and medium resolution modes (m /Δm=300,4000), the latter allowing for the analysis of Na, Mg, Al,P, K, Ca, Sc, Ti, V, Cr, Mn, Fe, Co, Ni, Cu, Zn, Zr, andNb, for which isobaric molecular interferences canoccasionally be a problem in low resolution. The Invalues were used to correct for instrumental drift. Theprocedural blank was used to correct for blanksintroduced during the dissolution process. The externalprecision is b3%.
4. Results
The concentration data from the XRF analysis wereconsistent with the ICP-MS data for the major elements.For internal consistency, we report only ICP-MS data inTables 1 and 2 (with the exception of Si which is lost asvolatile SiF4 during our dissolution process). The partly
83 244 305 366 Protolith
2.96 28.34 27.67 28.63 7.950.27 0.05 0.11 0.12 4.420.67 0.30 0.33 0.26 1.111.20 65.03 67.09 79.59 25.904.45 5.38b 3.53 4.44 56.780.80 0.52 0.63 0.72 0.360.55 0.09 0.13 0.09 7.170.37 0.03 0.03 0.04 1.893.62 2.18 2.78 2.46 1.310.19 0.24 0.32 0.34 0.256.22 12.11 15.20 14.46 7.298.35 85.93 90.15 102.51 106.49
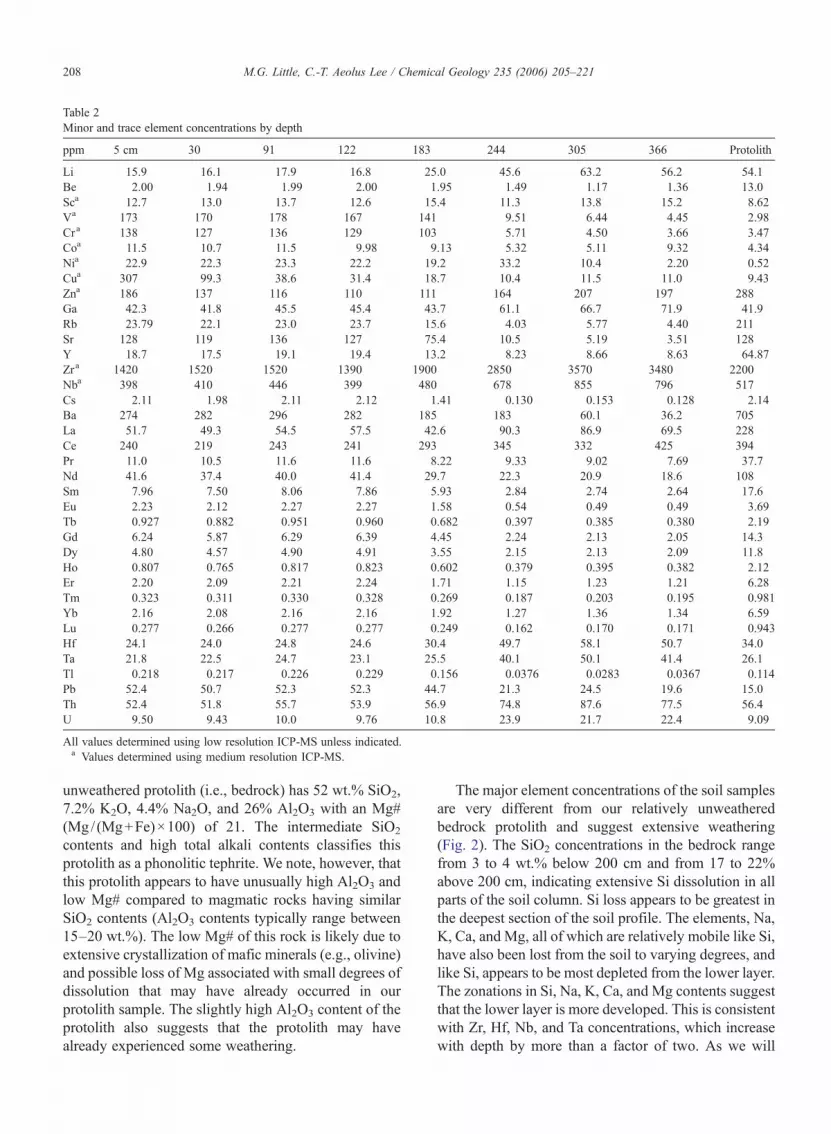
Table 2Minor and trace element concentrations by depth
ppm 5 cm 30 91 122 183 244 305 366 Protolith
Li 15.9 16.1 17.9 16.8 25.0 45.6 63.2 56.2 54.1Be 2.00 1.94 1.99 2.00 1.95 1.49 1.17 1.36 13.0Sca 12.7 13.0 13.7 12.6 15.4 11.3 13.8 15.2 8.62Va 173 170 178 167 141 9.51 6.44 4.45 2.98Cra 138 127 136 129 103 5.71 4.50 3.66 3.47Coa 11.5 10.7 11.5 9.98 9.13 5.32 5.11 9.32 4.34Nia 22.9 22.3 23.3 22.2 19.2 33.2 10.4 2.20 0.52Cua 307 99.3 38.6 31.4 18.7 10.4 11.5 11.0 9.43Zna 186 137 116 110 111 164 207 197 288Ga 42.3 41.8 45.5 45.4 43.7 61.1 66.7 71.9 41.9Rb 23.79 22.1 23.0 23.7 15.6 4.03 5.77 4.40 211Sr 128 119 136 127 75.4 10.5 5.19 3.51 128Y 18.7 17.5 19.1 19.4 13.2 8.23 8.66 8.63 64.87Zra 1420 1520 1520 1390 1900 2850 3570 3480 2200Nba 398 410 446 399 480 678 855 796 517Cs 2.11 1.98 2.11 2.12 1.41 0.130 0.153 0.128 2.14Ba 274 282 296 282 185 183 60.1 36.2 705La 51.7 49.3 54.5 57.5 42.6 90.3 86.9 69.5 228Ce 240 219 243 241 293 345 332 425 394Pr 11.0 10.5 11.6 11.6 8.22 9.33 9.02 7.69 37.7Nd 41.6 37.4 40.0 41.4 29.7 22.3 20.9 18.6 108Sm 7.96 7.50 8.06 7.86 5.93 2.84 2.74 2.64 17.6Eu 2.23 2.12 2.27 2.27 1.58 0.54 0.49 0.49 3.69Tb 0.927 0.882 0.951 0.960 0.682 0.397 0.385 0.380 2.19Gd 6.24 5.87 6.29 6.39 4.45 2.24 2.13 2.05 14.3Dy 4.80 4.57 4.90 4.91 3.55 2.15 2.13 2.09 11.8Ho 0.807 0.765 0.817 0.823 0.602 0.379 0.395 0.382 2.12Er 2.20 2.09 2.21 2.24 1.71 1.15 1.23 1.21 6.28Tm 0.323 0.311 0.330 0.328 0.269 0.187 0.203 0.195 0.981Yb 2.16 2.08 2.16 2.16 1.92 1.27 1.36 1.34 6.59Lu 0.277 0.266 0.277 0.277 0.249 0.162 0.170 0.171 0.943Hf 24.1 24.0 24.8 24.6 30.4 49.7 58.1 50.7 34.0Ta 21.8 22.5 24.7 23.1 25.5 40.1 50.1 41.4 26.1Tl 0.218 0.217 0.226 0.229 0.156 0.0376 0.0283 0.0367 0.114Pb 52.4 50.7 52.3 52.3 44.7 21.3 24.5 19.6 15.0Th 52.4 51.8 55.7 53.9 56.9 74.8 87.6 77.5 56.4U 9.50 9.43 10.0 9.76 10.8 23.9 21.7 22.4 9.09
All values determined using low resolution ICP-MS unless indicated.a Values determined using medium resolution ICP-MS.
208 M.G. Little, C.-T. Aeolus Lee / Chemical Geology 235 (2006) 205–221
unweathered protolith (i.e., bedrock) has 52 wt.% SiO2,7.2% K2O, 4.4% Na2O, and 26% Al2O3 with an Mg#(Mg/ (Mg+Fe)×100) of 21. The intermediate SiO2
contents and high total alkali contents classifies thisprotolith as a phonolitic tephrite. We note, however, thatthis protolith appears to have unusually high Al2O3 andlow Mg# compared to magmatic rocks having similarSiO2 contents (Al2O3 contents typically range between15–20 wt.%). The low Mg# of this rock is likely due toextensive crystallization of mafic minerals (e.g., olivine)and possible loss of Mg associated with small degrees ofdissolution that may have already occurred in ourprotolith sample. The slightly high Al2O3 content of theprotolith also suggests that the protolith may havealready experienced some weathering.
The major element concentrations of the soil samplesare very different from our relatively unweatheredbedrock protolith and suggest extensive weathering(Fig. 2). The SiO2 concentrations in the bedrock rangefrom 3 to 4 wt.% below 200 cm and from 17 to 22%above 200 cm, indicating extensive Si dissolution in allparts of the soil column. Si loss appears to be greatest inthe deepest section of the soil profile. The elements, Na,K, Ca, and Mg, all of which are relatively mobile like Si,have also been lost from the soil to varying degrees, andlike Si, appears to be most depleted from the lower layer.The zonations in Si, Na, K, Ca, and Mg contents suggestthat the lower layer is more developed. This is consistentwith Zr, Hf, Nb, and Ta concentrations, which increasewith depth by more than a factor of two. As we will

Fig. 2. The loss on ignition (LOI), LOI-corrected element concentrations (SiO2, CaO, MgO, Al2O3, Na2O, K2O, FeO, TiO2, Zr, Hf, Ta, Nb, Yb, Pb, Cu, U, and Th), Chemical Depletion Factor (CDF),and Chemical Index of Alteration (CIA) are plotted by depth. Also plotted as a dotted line or marked symbol are the LOI, element concentrations, and CIA of the protolith. The Chemical Index ofAlteration is defined as CIA ¼ Al2O3
Al2O3þCaOþNa2O(Nesbitt and Young, 1984). The Chemical Depletion Factor is averaged for Nb and Ta, where CDF ¼ 1− Xrock
Xsoil(Riebe et al., 2003).
209M.G.Little,
C.-T.
Aeolus
Lee
/Chem
icalGeology
235(2006)
205–221

210 M.G. Little, C.-T. Aeolus Lee / Chemical Geology 235 (2006) 205–221
discuss in more detail in Section 5.2, these elements arerelatively immobile, hence their concentrations shouldincrease with progressive weathering dissolution. Wenote that two other elements often used as immobileelement tracers, Al and Ti, may have been mobilized asthe LOI-corrected Al and Ti contents are higher than theprotolith throughout the soil column (Fig. 2).
The rare earth elements (REEs) also display someconsistent patterns (Fig. 3). Except for Ce, REEconcentrations are slightly depleted (relative to theprotolith) throughout the soil column, being mostdepleted at depths greater than 200 cm. The depletion ofREEs appears also to be accompanied by subtlefractionations in the relative abundances of the REEs. A
Fig. 3. Here we present three plots of REE concentration ratios (La, Ce, Pr, Nconcentrations are plotted for plotted samples above 200 cm (○), and samcontinental crust [B] and soil/chondrite [C] concentration ratios for the REE'
positive Ce anomaly (relative to the other REEs) hasdeveloped throughout the soil column. In some cases, theCe concentrations are enriched over the protolith and insome cases depleted, but there is no apparent systematiccorrelation with depth unlike the gross behaviors of theother REEs. We also note that above 200 cm, theprotolith-normalized abundance patterns are convexupwards and show subtle positive Eu anomalies (relativeto the other REEs). The convex REE profiles suggest atface value that the light REEs and heavy REEs may havebeen more efficiently depleted than the middle REEs. Atdepths greater than 200 cm, the protolith-normalizedabundance patterns are remarkably flat (i.e. no Euanomaly) except for the positive Ce anomaly.
d, Sm, Eu, Tb, Gd, Dy, Ho, Er, Tm, Yb, and Lu). Soil/protolith REEples below 200 cm (●) in ppm in [A]. Also plotted are soil/uppers. In [B] and [C], ratios are also plotted for the protolith sample as (⁎).
211M.G. Little, C.-T. Aeolus Lee / Chemical Geology 235 (2006) 205–221
Finally, one suite of elements shows clear surfaceenrichments. The major element oxides P2O5 and TiO2
have been enriched from ∼0.4 to 1% and ∼1 to 4%,respectively, from the protolith to surface layer. Co, Pb, Cu,Cr, Ni, and V showmuch larger surface enrichments: at thesurface these elements may be 2 orders of magnitudegreater than concentrations in the protolith and at depth(Fig. 2). U and Th show moderate enrichments throughoutthe soil column though the enrichments below 200 cm aregreatest (Fig. 2).
5. Estimating mass changes during soil formation
The elements Zr, Hf, Nb, and Ta are generally consid-ered immobile (conservative), hence their weight concen-trations should increase with increasing degree of massdissolution associated with weathering. In most soil pro-files, it is the shallowest parts that have been undergoingweathering for the longest times, thus the concentrations ofimmobile elements should be elevated at shallow levels,gradually decreasing with depth down to the bedrock.However, the Machame soils are enriched in Zr, Hf, Nb,and Ta at depth (Fig. 2). In this section, we attempt toquantify the amount of dissolution experienced in the soilcolumn. In Section 6, we discuss possible mechanisms forthe formation of an apparent inverted soil profile.
5.1. Calculating chemical weathering and elementmobility
The Chemical Depletion Factor (CDF) and theChemical Index of Alteration (CIA) are two proxiesfor chemical weathering (Nesbitt and Young, 1984;Riebe et al., 2003). The CDF is an estimate of masschanges during soil formation based on immobileelements where,
CDF ¼ 1−Cirock
Cisoil
ð1Þ
The CDF is an approximation of the fraction of net massremoved during soil formation so that values approachzero for the least weathered soil and values approach 1for highly weathered soils. The CIA is an estimate of theamount of chemical weathering based on the ratio of Al,which is relatively refractory, to the sum of Al and moremobile major elements Ca and Na where,
CIA ¼ Al2O3
Al2O3 þ CaOþ Na2Oð2Þ
As a rock is weathered and the Ca and Na arepreferentially dissolved, the CIA increases from initial
values of around 0.6 for upper continental crustal rocks toa maximum of 1.0. These two proxies provide a genericmethod of comparison to other soils andwithin the profile.
We also want to determine the mobility of individualelements. To do this we estimate relative mass lossesand additions by considering a mass balance approach,that is,
M0 ¼ Msoil þMD
m0 ¼ msoil þ mD ð3Þ
whereM0 represents the total mass of the original parentmaterial, Msoil is the mass remaining in the soil residue,MΔ is the net mass change during weathering by suchprocesses as chemical weathering, aeolian deposition, orauthigenic precipitation from solute-laden water derivedfrom other parts of the weathering profile or precipita-tion (Brimhall and Dietrich, 1987). The lowercase m0
represents the mass of one element in the original parentmaterial, msoil is the element in the soil, and mΔ is thenet mass change of that element during weathering. Weexplicitly ignore the effects of adding water or organics;therefore, all concentrations referred to herein are LOI-corrected. Before we can estimate the relative amount ofeach element lost, we must first identify the relationshipbetween the mass of the original protolith, the mass ofthe soil produced, and the concentrations of immobileelements in the protolith and the soil. The mass ratio oforiginal protolith to current soil can be estimated by,
Msoil
M0¼ Ci
0
Cisoil
ð4Þ
where C0i is the weight concentration of an immobile
element i in the original bedrock protolith and Csoili is
the concentration of the same immobile element in thesoil. It follows that the ratio of the mass change of amobile element, j, to mass of that element in theprotolith can be expressed by,
m jD
m j0
¼Ci0
Cisoil⁎C j
soil−Cj0
Cj0
ð5Þ
This equation allows us to estimate the relativechange in mass of a particular element lost or gained.
5.2. Identification of an appropriate immobile elementtracer
The first step in estimatingmass losses and additions isto correct measured elemental concentrations in the dry
212 M.G. Little, C.-T. Aeolus Lee / Chemical Geology 235 (2006) 205–221
soil and bedrock for volatiles, such as organic carbon andwater. The correction factor is determined from the loss onignition (LOI in Table 1), which is ameasure of howmuchorganic carbon, water and other volatiles present in thesoil but not likely to be derived from the protolith itself.The second step is to identify an appropriate immobileelement tracer. In reality, no elements exhibit trueimmobility; however, there are a few that have beenproven to be relatively immobile. Ti and Al are oftentreated as immobile elements during various weatheringprocesses (Colman, 1982; Cramer and Nesbitt, 1983;April et al., 1986; Middelburg et al., 1988; Gouveia et al.,1993; Taylor and Blum, 1995; Teutsch et al., 1999; Sak etal., 2003). Their popularity is largely due to the fact thatmeasurements of Ti and Al are routine. However,elements such as Zr, Nb and Ta have also been used(Brimhall et al., 1988, 1991; Kirkwood andNesbitt, 1991;Bain et al., 1993; Kurtz et al., 2000). What all of theseelements have in common is that they are relatively highfield strength elements (ionic charge/ionic radius) andhence have limited solubilities in water. The question iswhich one of these elements is likely to be the leastmobile. Al is actually the most mobile of these elements,consistent with its lower field strength compared to Zr, Ti,Nb and Ta (Vitousek et al., 1997). Nevertheless, Ti hasalso been shown to be mobile (Brimhall et al., 1988).Under conditions of Ti and Al mobility, it has beensuggested that Nb and Tamay remain relatively immobile(Kurtz et al., 2000).
We can assess the behaviors of Nb, Ta, Zr, Hf, Al, andTi in the Machame soils. An additional element, Hf, isconsidered because of its similar geochemical behavior toZr. Table 3 presents the protolith to soil concentrationratios,
Ci0
Cisoil, of Nb, Ta, Zr, Hf, Ti, and Al. The values
calculated fromNb, Ta, Zr, Hf, and Al suggest a spectrum
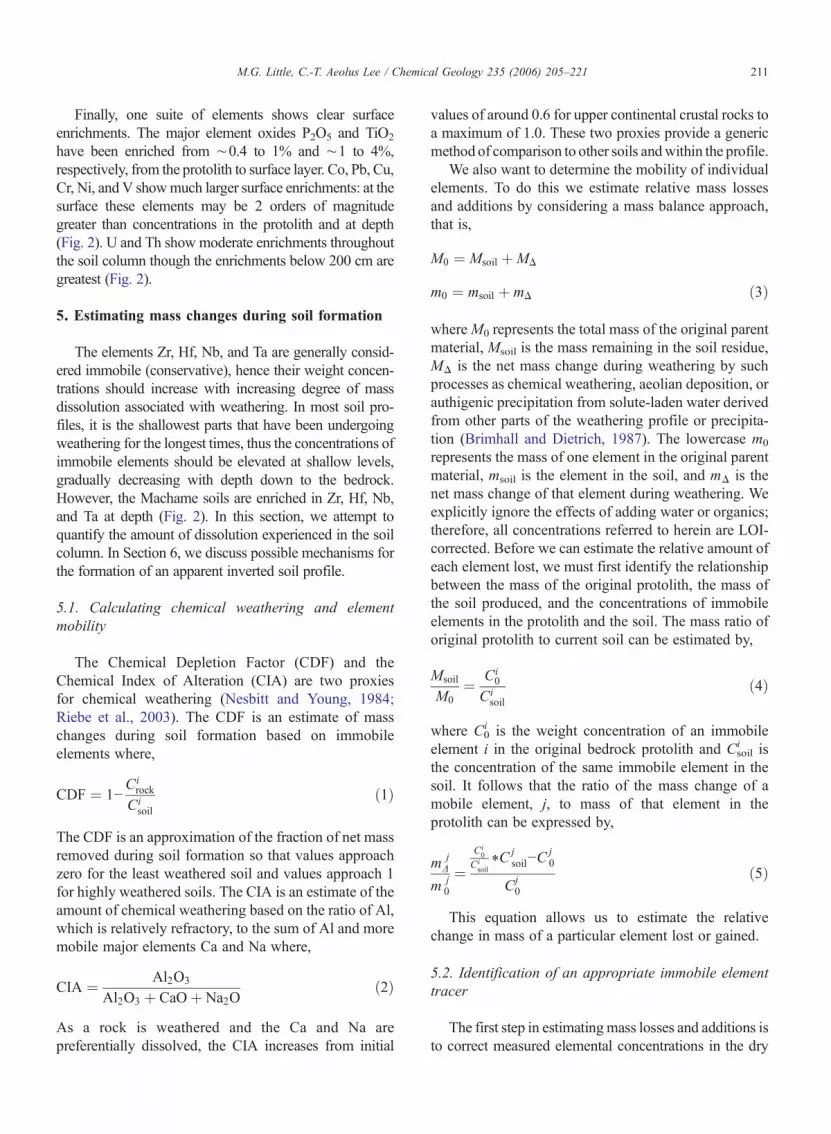
Table 3Protolith to soil ratios, C0/Csoil, for Ti, Al, Zr, Hf, Nb, and Ta
C0/Csoil 5 cm 30 91 122 183 244 305 366 Protolith
Ti 0.30 0.33 0.31 0.34 0.36 0.60 0.47 0.53Al 0.86 0.86 0.83 0.86 0.63 0.40 0.39 0.33Zr 1.12 1.07 1.10 1.18 0.84 0.60 0.48 0.49Hf 1.02 1.05 1.04 1.03 0.81 0.53 0.46 0.52Nb 0.94 0.93 0.88 0.96 0.78 0.59 0.47 0.50Ta 0.87 0.86 0.80 0.84 0.75 0.51 0.41 0.49CIAa 0.97 0.97 0.97 0.97 0.98 1.00 1.00 1.00 0.80CDFb 0.10 0.11 0.16 0.10 0.24 0.45 0.56 0.50
All data corrected for LOI.a Chemical Index of Alteration, where CIA ¼ Al2O3
Al2O3 þ CaOþ Na2O(Nesbitt and Young, 1984).b Chemical Depletion Factor averaged for Nb and Ta, where
CDF ¼ 1−Xrock
Xsoil(Riebe et al., 2003).
of modest net mass change (+/−20%) above 150 cmdepth and large losses (N40%) between below 150 cm (Tiis a distinct outlier because the
CTi0
CTisoil
values suggest 70–75% mass removal above 150 cm). We can examine thegeochemical behavior of these elements in detail byplotting Ta versusNb, Hf versus Zr, Al2O3 versus Nb, andTiO2 versus Nb in Fig. 4. Also plotted is the protolithreference line corresponding to the Ta/Nb, Hf/Zr, Al2O3/Nb, and Ti/Nb ratios of the protolith sample. Perfectlyimmobile elements should plot on the dotted line becausewhile the absolute concentrations of two immobileelements will change due to dilution or concentrationeffects, their relative abundances should not. It can beseen from Fig. 5A and B that Nb/Ta and Zr/Hf ratios areremarkably constant as evidenced by the fact that the datapoints fall close to the protolith reference line. Thissuggests that Nb, Ta, Zr, and Hf are behaving as immobileelements. In contrast, the Al/Nb ratios of the mostweathered samples deviate from the protolith referenceline (Fig. 4C). This suggests that Al may have been addedsince Nb has now been demonstrated to be immobile. Wealso note that Ti /Nb ratios also deviate from the protolithreference line for samples above 200 cm, indicating thatTi has been added (Fig. 4D). Collectively, these observa-tions suggest that Nb, Ta, Zr, and Hf are relativelyimmobile whereas Al and Ti are not. We note, however,that the apparent immobility of Zr and Hf may be partlycoincidental. The LOI-corrected Zr andHf concentrationsappear to be slightly depleted (by about 10%) relative tothe protolith, which suggests that Zr and Hf may haveactually suffered small losses (Fig. 5). These observationsare consistent with other observations that have shownthat Zr (and by inference Hf) may be slightly mobileunder intense weathering conditions. For example, duringbauxite formation on volcanic rocks in Southern Brazil,Zr has been shown to be more mobile than Fe and Nbusing isovolumetric mass balance methods (Melfi et al.,1996). In all ensuing discussions, we have thus chosenNband Ta as our most immobile element tracers.
5.3. Estimating mass fluxes
Nb and Ta concentrations are used in conjunctionwith Eq. (3) to estimate the total amount of originalprotolith mass remaining in the soil residuum. If therehas been significant mass loss, the mass concentrationsof Nb and Ta (corrected for LOI) should be greater thanthat of the protolith. It can be seen from Fig. 4 that theLOI-corrected Nb and Ta concentrations are slightlyhigher (10%) than that of the protolith in the upper200 cm of the weathering profile and significantlyhigher (200%) in the lower 200 cm. These features
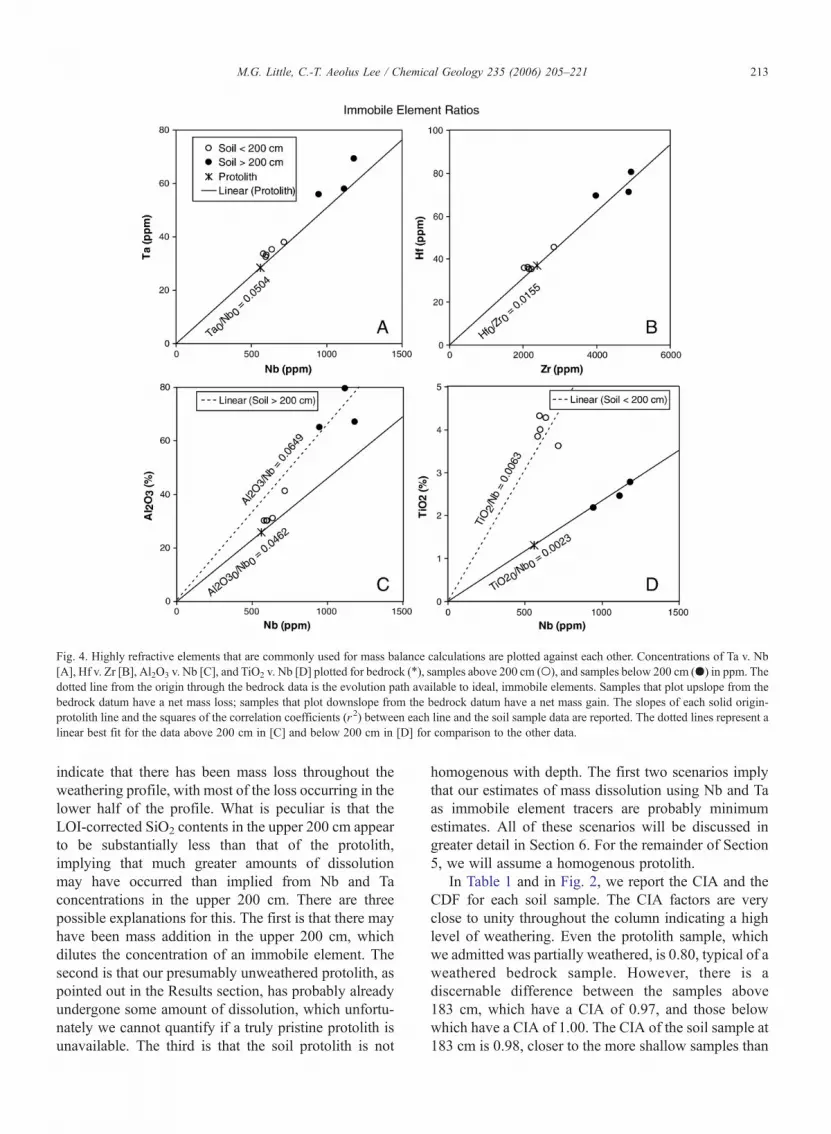
Fig. 4. Highly refractive elements that are commonly used for mass balance calculations are plotted against each other. Concentrations of Ta v. Nb[A], Hf v. Zr [B], Al2O3 v. Nb [C], and TiO2 v. Nb [D] plotted for bedrock (⁎), samples above 200 cm (○), and samples below 200 cm (●) in ppm. Thedotted line from the origin through the bedrock data is the evolution path available to ideal, immobile elements. Samples that plot upslope from thebedrock datum have a net mass loss; samples that plot downslope from the bedrock datum have a net mass gain. The slopes of each solid origin-protolith line and the squares of the correlation coefficients (r2) between each line and the soil sample data are reported. The dotted lines represent alinear best fit for the data above 200 cm in [C] and below 200 cm in [D] for comparison to the other data.
213M.G. Little, C.-T. Aeolus Lee / Chemical Geology 235 (2006) 205–221
indicate that there has been mass loss throughout theweathering profile, with most of the loss occurring in thelower half of the profile. What is peculiar is that theLOI-corrected SiO2 contents in the upper 200 cm appearto be substantially less than that of the protolith,implying that much greater amounts of dissolutionmay have occurred than implied from Nb and Taconcentrations in the upper 200 cm. There are threepossible explanations for this. The first is that there mayhave been mass addition in the upper 200 cm, whichdilutes the concentration of an immobile element. Thesecond is that our presumably unweathered protolith, aspointed out in the Results section, has probably alreadyundergone some amount of dissolution, which unfortu-nately we cannot quantify if a truly pristine protolith isunavailable. The third is that the soil protolith is not
homogenous with depth. The first two scenarios implythat our estimates of mass dissolution using Nb and Taas immobile element tracers are probably minimumestimates. All of these scenarios will be discussed ingreater detail in Section 6. For the remainder of Section5, we will assume a homogenous protolith.
In Table 1 and in Fig. 2, we report the CIA and theCDF for each soil sample. The CIA factors are veryclose to unity throughout the column indicating a highlevel of weathering. Even the protolith sample, whichwe admitted was partially weathered, is 0.80, typical of aweathered bedrock sample. However, there is adiscernable difference between the samples above183 cm, which have a CIA of 0.97, and those belowwhich have a CIA of 1.00. The CIA of the soil sample at183 cm is 0.98, closer to the more shallow samples than

214 M.G. Little, C.-T. Aeolus Lee / Chemical Geology 235 (2006) 205–221

215M.G. Little, C.-T. Aeolus Lee / Chemical Geology 235 (2006) 205–221
the deeper ones; however, it may also represent atransition from less to more weathered material. TheCDF, an estimate of net mass loss, indicates that theorginal protolith underwent a net ∼10% loss of massabove 183 cm and a net loss of ∼50% below 183 cm.The soil sample at 183 cm again shows an intermediatenet loss of ∼25%. The CIA and CDF both indicate thatweathering throughout the soil column increases withdepth.
Our mass balance calculations can be extended toestimating the mass dissolution flux of each element. Fig.5 is a plot of
m jD
m j0for the major elements, SiO2, CaO, MgO,
Al2O3, Na2O, P2O5, MnO, FeO, K2O, and TiO2 and thetrace elements Zr, Nb, Eu, Pb, Cu, U, and Th calculatedfrom Eq. (5). These values generally represent time-averaged losses during pedogenesis that contribute to thedissolved load that eventuallymakes it to the rivers. Giventheir weight percentages in the bulk rock, it is clear fromFig. 5 that the time-averaged dissolution flux should bedominated by Si, K, andNa. Interestingly, there appears tobe a net addition of Fe in the upper 200 cm and a netaddition of Al below 200 cm, suggesting that Fe and Aland have either been redistributed in the soil column orthat excess Fe and Al has been introduced from outside ofthe soil system. Ti, Fe, and P exhibit somewhat unusualbehaviors in that they are all added above 200 cm butrelatively immobile below. Al is the only major elementsignificantly added below 200 cm. The last panel in Fig. 5shows a sum of all of the major and minor element lossesthroughout the soil column as well as the ChemicalDepletion Factor. While there is a discrepancy betweenthe two estimates of total mass loss, they are wellcorrelated and the absolute deviation between theestimated decreases with depth.
6. Possible explanations for the inverted weatheringprofile
The CIA, Table 1 and Fig. 2, and the relative masslosses,
m jD
m j0, in Fig. 5 show that there have been huge mass
losses throughout the soil column with the moredepleted layers occurring below 200 cm. There are atleast four hypotheses that may explain some parts or allof this phenomenon. Before we explore these hypoth-eses, we rule out from the outset the possibility thatlateral movement of material through colluvial process-es and landslides has led to the development of these
Fig. 5. The relative mass change, m jD
m j0
, is plotted for SiO2, CaO, MgO, Al2O3
from Eq. (5). Also plotted are two estimates of the total mass loss during peusing Eq. (5),
Pm j
D ¼ P Ci0
CisoilTCj
soil−Cj0, and the dashed line is the Chem
represent measured mass losses unaccounted for by the immobile element r
geochemically stratified zones. Below, 200 cm, the soilis extremely weathered, but possesses a rigid, highlypourous structure which would most likely be destroyedwith significant lateral movement of solid material. Thehorizons above 200 cm appeared to be laterallyhomogenous and without large clasts both of whichsuggest that any recent contribution to the soil fromcolluvial processes is limited and insignificant.
We must also mention the surface enrichments of Pb,Cu, and P which remain unexplained by the four natural,non-anthropic hypotheses presented below. There is awealth of research documenting the surface enrichmentof Pb, Cu and other metals through anthropogenicdeposition and biocycling (Olson and Skogerboe, 1975;Hamelin et al., 1989; Alloway, 1995; Han and Banin,1997; Keller and Domergue, 1996; Erel et al., 1997;Othman et al., 1997; Wilkens and Loch, 1998; Lee et al.,1998; Hansmann and Koppel, 2000; Blaser et al., 2000;Teutsch et al., 2001; Wilcke et al., 2001; Halamic et al.,2003). In agricultural settings, fertilization and manureapplication can lead to persistant P enrichments(Carpenter et al., 1998). While atmospheric dust cannotaccount for Pb, P, and Cu, exclusively, other anthropicdepositions such as fertilizer, manure, and particulatesfrom exhaust and smoke could account for surfaceenrichments of these elements.
We now proceed to lay out each of the fourhypotheses and explore their plausibilities in the contextof the data.
6.1. Re-precipitation followed by erosion
One way to achieve higher concentrations of certainmajor elements at the surface is to invoke recent erosion(Fig. 6A). This scenario could work as follows. The firststep is the development of a deep, mature soil profilefrom the top–down. Soluble elements such as Ca, Sr,Na, and Mg would be leached throughout the soilcolumn with the upper parts experiencing greaterdepletion. Fe and other particle reactive elements, suchas Mn and Mg, leached from the upper part of the soilcolumn, will migrate downward and reprecipitate ontoclay surfaces and/or form amorphous Fe and Mnhydroxides, generating an enrichment front just beneaththe depleted upper layer. If the upper horizons above theenriched layer are subsequently removed through rapidphysical erosion (by rapid, we mean faster than the
, Na2O, K2O, P2O5, MnO, FeO, TiO2, Zr, Nb, Eu, Pb, Cu, U, and Thdogenesis. The solid line is the sum of all mass differences calculatedical Depletion Factor (CDF). Discrepancies between these two linesatios.

Fig. 6. Schematic models of four hypotheses to explain the formation of the Machame soil profile. Hypotheses A describes re-precipitation of particlereactive elements followed by latter-day surface erosion. Hypothesis B requires the addition of many elements by Aeolian dust deposition.Hypothesis C proposes that the soil was formed from two different lava layers. Hypothesis D calls for enhanced weathering due to lateral subsurfacewater flow. We have also included an inset for the subsurface flow model that shows a potential recharge mechanism.
216 M.G. Little, C.-T. Aeolus Lee / Chemical Geology 235 (2006) 205–221
timescales of leaching and downward migration and re-precipitation of particle reactive elements), the enrichedlayer could be exposed at the surface, giving the artifactof an inverted soil profile. In other words, thishypothesis would require the upper 200 cm of our soilprofile to represent a paleo-enrichment front (Nesbitt etal., 1980).
Re-precipitation may be able to explain the Fe addedabove 200 cm in the Machame profile (Fig. 5) and mayalso explain Ti which has a concentration profile (Fig. 2)and relative mass loss profile (Fig. 5) very similar to therespective profiles of Fe. Like Fe, Ti has been shown tobe mobile in highly weathered tropical environments(Cornu et al., 1999). Cornu et al. (1999) showed sig-nificant Ti losses through the formation of anataseprecipitates as well as general mobility due to plant–soilcycling. Some re-precipitation processes may also
explain the slight Th enrichments observed in theupper 200 cm (Fig. 5) as Th may be mobilized inassociation with dissolved organic matter or colloids insome marine environments (Guo et al., 1997). Th wasfound to be mobilized through dissolution/re-precipita-tion processes or association with organic colloids in atropical watershed in Cameroon (Braun et al., 2005).The presence of colloids, organic matter, and waterprovide the conditions necessary for the mobilization ofTh. Therefore, the enrichment of Fe, Ti, and Th in a zoneof reprecipication may be feasible.
Despite these successes, the model simply fails toexplain the majority of the major elements. Ca, Mg, Na,K, and Si are not particle reactive; hence, their higherabundances in the upper 200 cm cannot be explained bythis same process. This process is thus considereduntenable in explaining the inverted soil profile.

217M.G. Little, C.-T. Aeolus Lee / Chemical Geology 235 (2006) 205–221
6.2. Aeolian dust deposition
Atmospheric dust deposition is another hypotheticalmechanism that might be invoked to explain highelemental concentrations above 200 cm relative toconcentrations below 200 cm (Fig. 6B). Dust depositionhas been suggested to explain the development of somebauxite formations which, like the Machame soils, havehigh Al2O3 contents (Brimhall et al., 1988). Marineaerosol deposition has also been shown to be critical tosoil formation and maintaining nutrient budgets on theHawaiian Islands (Chadwick et al., 1999). At more than250 km from the Indian Ocean, it is doubtful that marineaerosols have a significant impact on soils in Mt. Meru;thus, we will restrict our discussion to continentallyderived dust. For the Machame region, the dustdeposition hypothesis requires that dust is deposited atthe surface of the soil column. The dust must then bemixed down into the soil column by burrowing animals,roots, clay shrink/swell, and/or other biological andphysical processes (Brimhall et al., 1991). The dust mayoriginate locally or be blown in from great distances(Chadwick et al., 1999; Grousset and Biscaye, 2005).As a result, enrichments in atmospherically depositedelements are superimposed onto a mature soil profile. Acloser look at what elements are enriched and the natureof their enrichments can help to assess the plausibility ofthis scenario in explaining our apparent inverted soilprofile.
Firstly, the profiles of the major elements do not seemto be consistent with surface deposition. Ca, Mg, Si, Pb,P, Fe, and Ti are enriched at the surface but abruptlydecay in concentration below 122 cm. If these surfaceenrichments are associated with external (Aeolian)inputs, then we would expect the downward depthdistribution of these elements to decay monotonicallywith depth due to downward transport by bioturbation(Brimhall et al., 1991). The step function stop inconcentration of the above-mentioned elements isinconsistent with an external surface input. The onlyelement to show a monotonic decay with depth is Cu.
The applicability of the Aeolian hypothesis can befurther assessed by examining the magnitude and com-position of the elemental enrichments at the surface. Ifthe surface enrichments above ∼200 cm are caused bydust inputs, we can take the composition of the soilbelow 200 cm to be the baseline composition of theprofile. We can then estimate a minimum percentage ofthe soil column that originated as dust by summing allelemental mass enrichments above the baseline con-centrations. We find that at least 38% of the total soil drymass down to 200 cm must be dust-derived in order to
account for the concentration profiles of the majorelements. We can also calculate the chemical composi-tion of the dust which results in the following majorelement composition: 66% SiO2, 23% FeO, 7% TiO2,2% K2O, 1% MgO, 1% CaO, 1% Na2O, and 0% Al2O3.Dust of this composition most likely represents amixture of quartz, iron oxides (magnetite, spinel), andTi-bearing oxides (rutile and ilmenite), implying anorigin from felsic continental crust. Such material wouldbe expected to be enriched in the high field strengthelements due to the presence of Ti-bearing oxides(which could be used to explain the high Ti in the upperlayer). If this material was a significant component ofthe upper layer of the Machame soil profile, the highfield strength element systematics would be controlledto a large extent by the dust. This dust, however, wouldbe characterized by low Nb/Ta ratios. This is because thesource of this dust, upper continental crust, typically hasNb/Ta ratios between 10–12 (Rudnick and Fountain,1995), much lower than most intraplate volcanic rocks,such as our Machame protolith. In fact, the hypotheticaldust should have even lower Nb/Ta ratios because it isknown that rutile, the dominant repository for Nb and Tain silicate rocks, prefers Ta over Nb and hence typicallyhas a low Nb/Ta ratio compared to the host rock(Klemme et al., 2004). The fact that the Nb/Ta ratios ofthe Machame soils are high (∼20, a typical value formantle-derived rocks) and constant throughout the soilcolumn implies that dust of the required composition didnot fall in amounts sufficient to generate the enrich-ments seen in the upper layer. Furthermore from Fig. 3C,it is clear that the soil/chrondrite REE ratios for theshallow Machame soils do not exhibit the behaviorexpected with a significant contribution of continentalcrust because there is no negative Eu anomaly as well ashigh soil/chondrite ratios (Kurtz et al., 2001). Thus, dustdeposition cannot adequately reconcile the major andtrace element data and is therefore an unreasonable hy-pothesis to explain the inverted profile.
6.3. Buried Paleosol
The two chemically distinct soil layers may representtwo soils of different ages formed from two differentlava flows (Fig. 6C). In this scenario, a soil, now re-presented as the Machame soil below 200 cm, formedon a lava flow-chemically identical to the material thatwe sampled as the Machame protolith. After this soildevelops and is extensively weathered, it is covered bya subsequent lava flow. The overlying lava flow thenundergoes weathering itself and forms a second soilhorizon, now represented as the soil above 200 cm.

Fig. 7. U/Nb and Th/Nb ratios plotted for bedrock (⁎), samples above200 cm (○), and samples below 200 cm (●).
218 M.G. Little, C.-T. Aeolus Lee / Chemical Geology 235 (2006) 205–221
Assuming similar weathering rates for the developmentof the relic soil and the modern soil and given thesignificantly more depleted horizons below 200 cm, thismodel requires that the relic soil was directly exposed tothe atmosphere much longer than the modern soil hasbeen.
This model could, in theory, explain why the upperlayer is less weathered than the deeper layer. It can alsoexplain the behavior of Eu relative to the other REE's.The Machame protolith is rich in plagioclase pheno-crysts. These plagioclase phenocrysts have preferential-ly partitioned Eu into their mineral lattices over otherREEs, a process which left the complementary glassymatrix poor in Eu. Because glass lacks crystallinestructure, the glassy matrix is more susceptible tochemical weathering than the plagioclase phenocrysts.According to this two lava hypothesis, the relic soilbelow 200 cm was weathered more intensely, destroyingnearly all primary minerals, including plagioclase. Thiswould explain the positive Eu anomaly above 200 cmand lack of an anomaly below 200 cm (Fig. 2).
Some characteristics of the soil, however, are in-consistent with a buried paleosol model. First, the soilprofile lacks physical evidence of a bake zone in thefield. If the soil below 200 cm did represent an olderrelic soil, we would expect a bake zone to be foundbetween the soils. This bake zone would have probablybeen highly resistant to weathering and should havebeen preserved. Second, the depth behavior of chemicalweathering, manifest in terms of CIA and CDF, isinconsistent with a buried paleosol. If the change incomposition at ∼200 cm indeed represents a transitionfrom a younger, less weathered soil and to an olderpaleosol, we would expect to see a decrease in thedegree of weathering as we approach this boundaryfrom above. Conversely, as we approach the transitionfrom below, we would expect to observe an increasein the degree of weathering. The constant weatheringdegrees in the upper and lower layers may be in-consistent with this hypothesis. However, the buriedpaleosol model is consistent with the bulk of the geo-chemical data including Al and is, therefore, a viablemechanism for soil formation in the Machame region.
6.4. Lateral subsurface water flow
A fourth hypothesis involves enhancedweathering dueto lateral subsurfacewater flow, (Fig. 6D).Meteoricwatersenter the subsurface at higher elevations. This subsurfacewater then flows from its recharge region down the flanksof the mountain, the flow being driven by the hydraulichead imposed bymountain topography. Thismodel yields
the following predictions. Progressive reaction of apackage of groundwater along its flow path should leadto 1) consumption of oxygen due to oxidative weathering(i.e., 0.5O2+2FeO=Fe2O3) and 2) consumption of CO2
due to acidic breakdown of silicate (e.g., CO2+H2O+CaSiO3=HCO3
−+Ca2++HCO3−). As such, we might
expect weathering by subsurface water flows to be largeonly near recharge point but small further along theflowpath. However, in volcanically active regions, there islikely a constant background flux of volcanic gassespermeating through the volcano (Cruz et al., 1999;Aiuppa et al., 2000). Such gases will be reducing but richin CO2, and as a consequence, flux of such gasses into thesubsurface water could increase acidity but not lead to anincrease in O2. Thus, in volcanically active regions, wemight expect subsurface groundwater to be acidic andreducing.
If this model is applicable to our study site, theimplication is that the entire soil profile has formedfrom the same protolith as a result of stratification inweathering processes. The soil above 200 cm wasformed from typical top–down weathering while thesoil below 200 cm was created contemporaneously bysubsurface water flow, the two weathering regimesbeing distinguished by their different weathering rates(below 200 cm is faster) and possibly by differentredox conditions. The former is suggested by the stepfunction distribution of Ca, Mg, Na, and Si (Fig. 2)and the shallow Eu anamoly (Fig. 3A). The latter issuggested by the contrasting behaviors of U and Th inthe two layers (Fig. 7). Th appears to be enriched in theupper 200 cm (i.e., high Th/Nb) and depleted below200 cm, indicating that Th is relatively immobile in the

219M.G. Little, C.-T. Aeolus Lee / Chemical Geology 235 (2006) 205–221
top layer but mobile in the bottom layer. U appears tobe enriched relative to Nb at all depths, but theenrichment in U is greatest in the bottom layer. The U/Nb systematics indicate that U has been added at alldepths, particularly in the bottom layer. These featuressuggest that the bottom layer may have been somewhatreducing and the top layer more oxidizing. This redoxstratification would allow for Th mobility andpreferential immobilization of U in the more reducingbottom layer and Th immobility and variable behaviorof U in the more oxygenated upper layer (Langmuir,1997). Focused subsurface water flowing through thebottom layer would be consistent with these observa-tions. In fact, the net additions of U throughout the soilcolumn, particularly in the bottom layer, are probablynot solely sustainable by leaching of U from thesurface followed by re-precipitation at depth. In thismodel, net additions of U are due to immobilization ofdissolved U in subsurface water being laterallyadvected through the system. The upper 200 cmcorresponds to the unsaturated vadose zone, whichwould be relatively oxygenated. Therefore, the sub-surface flow model is consistent with the major andtrace geochemical data, except Al, and with thephysical data and thus remains a viable hypothesis toexplain the formation of the Machame soils.
7. Implications of lateral subsurface water flow
Based on our discussion in Section 6, the data appear tobe best explained by the buried paleosol scenario or thesubsurfrace water flow model-with the caveat that Fe andTi behavior may be the result of mobility due to re-precipitation or association with colloids. While wecannot confidently rule out either hypothesis, we believethat the subsurface water flow model deserves particularattention because it can explain the unusual U/Thsystematics. If our bias is correct, there are some novelimplications of lateral subsurface water flow. Our casestudy would suggest that groundwater weathering couldincrease local weathering rates by at least a factor of two(Table 3). This means that if only typical top–down soilformation processes are considered, weathering ratescould be under-estimated. We note that the importance ofsubsurface water weathering may not be confined to ourcase study. Chen et al. (1988) concluded that bauxites inthe Tatun volcanic region of northern Taiwan were alsoformed by enhanced weathering associated with ground-water flow (Chen et al., 1988). In south Asia, Basu et al.(2001) showed that groundwater may be as important assurface water from theGanges–Brahmaputra river systemin delivering dissolved Sr to the oceans (Basu et al., 2001).
Finally, Manga (1998) has shown that there is extensivegroundwater flow in the Oregon Cascades arc (Manga,1998).What all of these regions have in common is a largeand steady recharge zone of meteoric water and a strongtopographic gradient to drive groundwater flow. Theseregions are also subject to volcanic degassing ormetamorphic decarbonation reactions.
If weathering by subsurface water flow turns out to besignificant in volcanic or tectonically active regions, thisphenomenon is not only important for soil formation andocean trace element budgets, but possibly for the globalcarbon cycle. The weathering of silicate rocks is a slow,but permanent means of sequestering carbon (Berneret al., 1983). Our data suggest that weathering associatedwith subsurface water flow is 30% more effective thantop–down soil formation processes at mobilizing Ca. ForMg, the subsurface water is 90%more effective at our sitethan top–down processes. It is possible that the enhancedweathering by subsurface water flow in our study site isfacilitated by the addition of volcanic CO2 slowly seepingout of themountainside. Assuming that Ca andMg are theprimary cations responsible for silicateCO2 sequestration,our study suggests that estimates of the CO2 drawdowncapacity of silicate weathering, at least in volcanicallyactive regions, may need to account for weathering bysubsurface water flow. If so, weathering by subsurfacewater flow may be a means of modulating the amount ofCO2 emitted from volcanic environments.
8. Conclusions
We investigated an inverted weathering profileformed on a volcanic substrate on the southern slopesof Mount Kilimanjaro, Tanzania, a region having atropical equatorial climate. The following conclusionswere made:
1) The degree of chemical weathering increases withdepth into the soil profile.
2) The depletion of mobile major elements, Si, Na, K, Ca,and Mg, and the relative immobility of Al have createdsoils of 30–40 wt.% Al2O3 at depths greater than200 cm.
3) The refractory elements Nb, Ta, Zr, and Hf are shownto be immobile throughout the soil column while Tiand Al are not. Ti and Fe are enriched above 200 cmand immobile below while Al appears to be slightlydepleted at shallow depths but enriched at greaterdepths.
4) All geochemical and physical evidences suggest thepresence of two distinct weathering regimes separat-ed at 200 cm.

220 M.G. Little, C.-T. Aeolus Lee / Chemical Geology 235 (2006) 205–221
5) Two models can explain the bulk of the chemical andphysical observations: either a buried paleosol orintense weathering associated with lateral subsurfacewater flow.
6) If subsurface water flow is responsible for the formationof the Machame soils, inputs of trace elements and Caand Mg into the ocean budget are locally significant,and, if regionally representative, they should haveimplications for the global CO2 cycle.
Acknowledgments
This work was supported by Rice University startupfunds and a Packard fellowship to Lee. We thank A.S.S.Mbwana, Rama Ngatoluwa, and George Sayulla of theSelian Research Institute in Arusha, Tanzania for theirsupport. We are also grateful to Musa Naroro, Felix John,and Nuru for their logistical help in the field. Commentsby Carter Sturm were greatly appreciated.
References
Aiuppa, A., et al., 2000. Mobility and fluxes of major, minor and tracemetals during basalt weathering and groundwater transport at Mt.Etna volcano (Sicily). Geochimica et Cosmochimica Acta 64 (11),1827–1841.
Alloway, B.J., 1995. Heavy Metals in Soils. Heavy Metals in Soils.Blackie Academic and Professional, Suffolk, England. 368 pp.
Anderson, G.D., 1982. A survey of the soils and land use potential ofthe southern and eastern slopes of Kilimanjaro, Tanzania. 1,Institute of Resource Assessment, University of Dar Es Salaam andInternational Development Program, Clark Univeristy, Dar EsSalaam.
April, R., Newton, R., Coles, L.T., 1986. Chemical weathering in theAdirondack watersheds: past and present-day rates. GeologicalSociety of America Bulletin 97, 1232–1238.
Bain, D.C., Mellor, A., Robertson-Rintoul, M.S.E., Buckland, S.T., 1993.Variations in weathering processes and rates with time in achronosequence of soils from Glen Feshie, Scotland. Geoderma 57,275–293.
Basu, A.R., Jacobsen, S.B., Poreda, R.J., Dowling, C.B., Aggarwal, P.K.,2001. Large groundwater strontium flux to the oceans from theBengal Basin and the marine strontium isotope record. Science 293,1470–1473.
Berner, R.A., 1995. Chemical weathering and its effect on atmosphericCO2 and climate. In: White, A.F., Brantley, S.L. (Eds.), ChemicalWeathering Rates of Silicate Minerals. Reviews in Mineralogy.Mineralogical Society of America, pp. 565–583.
Berner, R.A., Lasaga, A.C., Garrels, R.M., 1983. The carbonate–silicate geochemical cycle and its effects on atmospheric carbondioxide and climate. American Journal of Science 283, 641–683.
Blaser, P., Zimmermanna, S., Lustera, J., Shotyk, W., 2000. Criticalexamination of trace element enrichments and depletions in soils:As, Cr, Cu, Ni, Pb, and Zn in Swiss forest soils. The Science of theTotal Environment 249 (1–3), 257–280.
Braun, J.-J., et al., 2005. Present weathering rates in a humid tropicalwatershed: Nsimi, South Cameroon. Geochimica et CosmochimicaActa 69 (2), 357–387.
Brimhall, G.H., Dietrich, W.E., 1987. Constitutive mass balancerelations between chemical composition, volume, density, poros-ity, and strain in metasomatic hydrochemical systems; results onweathering and pedogenesis. Geochimica et Cosmochimica Acta51 (3), 567–587.
Brimhall, G.H., et al., 1988. Metal enrichment in bauxites by depositionof chemically mature aeolian dust. Nature 333, 819–824.
Brimhall, G.H., et al., 1991. Deformational mass transport andinvasive processes in soil evolution. Science 255, 695–702.
Carpenter, S., et al., 1998. Nonpoint pollution of surface waters withphosphorus and nitrogen. Ecological Applications 8 (3), 559–568.
Chadwick, O.A., Derry, L.A., Vitousek, P.M., Huebert, B.J., Hedin, L.O.,1999. Changing sources of nutrients during four million years ofecosystem development. Nature 397, 491–497.
Chen, C.-H., Liu, K.-K., Shieh, Y.-N., 1988. Geochemical and isotopicstudies of bauxitization in the Tatun volcanic area, northernTaiwan. Chemical Geology 68, 41–56.
Colman, S.M., 1982. Chemical weathering of basalts and andesites:evidence from weathering rinds. USGS Professional Paper, vol. 1246.
Cornelius, D.J., 2004. Washington State University at Pullman'sGeoAnalytical Lab. personal communication.
Cornu, S., et al., 1999. Evidence of titanium mobility in soil profiles,Manaus, central Amazonia. Geoderma 91 (3), 281–295.
Cramer, J.J., Nesbitt, H.W., 1983. Mass-balance relations and trace-element mobility during continental weathering of various igneousrocks. Sciences Géologiques. Mémoire 73, 63–73.
Cruz, J.V., Coutinho, R.M., Carvalho, M.R., Oskarsson, N., Gislason,S.R., 1999. Chemistry of waters from Furnas volcano, SaoMiguel, Azores: fluxes of volcanic carbon dioxide and leachedmaterial. Journal of Volcanology and Geothermal Research 92,151–167.
Dawson, J.B., 1992. Neogene tectonics and volcanicity in the NothTanzania sector of the Gregory Rift Valley: contrasts with theKenya sector. Tectonophysics 204, 81–92.
Dessert, C., et al., 2001. Erosion of Deccan Traps determined by rivergeochemistry: impact on the global climate and the 87Sr/86Sr ratioof seawater. Earth and Planetary Science Letters 188, 459–474.
Erel, Y., Veron, A., Halicz, L., 1997. Tracing the transport ofanthropogenic lead in the atmosphere and in soils using isotopicratios. Geochimica et Cosmochimica Acta 61 (21), 4495–4505.
Evernden, J.F., Curtis, G.H., 1965. The potassium–argon dating of LateCenozoic rocks inAfrica and Italy. CurrentAnthropology6, 343–384.
Gaillardet, J., Dupre, B., Louvat, P., Allegre, C.J., 1999. Global silicateweathering and CO2 consumption rates deduced from thechemistry of large rivers. Chemical Geology 159, 3–30.
Gouveia, M.A., et al., 1993. Behavior of REE and other trace andmajor elements during weathering of granite rocks, Evora,Portugal. Chemical Geology 107, 113–126.
Grousset, F.E., Biscaye, P.E., 2005. Tracing dust sources and transportpatterns using Sr, Nd and Pb isotopes. Chemical Geology 222,149–167.
Guo, L., Santschi, P.H., Baskaran, M., 1997. Interaction of thoriumisotopes with colloidal organic matter in oceanic environments.Colloids and Surfaces, A 120, 255–271.
Halamic, J., Galovic, L., Sparica, M., 2003. Heavy metal (As, Cd, Cu,Hg, Pb and Zn) distribution in topsoil developed on alluvialsediments of the Drava and Sava Rivers in NW Croatia. GeologiaCroatica 56 (2), 215–232.
Hamelin, B., Grousset, F.E., Biscaye, B.E., Zindler, A., 1989. Pb isotopesin trade wind aerosols at Barbados: the influence of EuropeanEmissions over the North Atlantic. Journal of Geophysical Research94, 16243–16250.

221M.G. Little, C.-T. Aeolus Lee / Chemical Geology 235 (2006) 205–221
Han, F., Banin, A., 1997. Long-term transformation and redistributionof potentially toxic heavy metals in arid-zone soils incubated: I.under saturated conditions. Water, Air, and Soil Pollution 95,399–423.
Hansmann,W., Koppel, V., 2000. Lead-isotopes as tracers of pollutantsin soils. Chemical Geology 171, 123–144.
Johnson, D.M., Hooper, P.R., Conrey, R.M., 1999. XRF analysis ofrocks and minerals for major and trace elements on a single lowdilution Li-tetraborate fused bead. Advances in X-ray Analysis 41,843–867.
Keller, C., Domergue, F.-L., 1996. Soluble and particulate transfers ofCu, Cd, Al, Fe and some other major elements in gravitationalwaters of a podzol. Geoderma 71, 263–274.
Kirkwood, D.E., Nesbitt, H.W., 1991. Formation and evolution of soilsfrom an acidified watershed: Plastic Lake, Ontario, Canada.Geochimica et Cosmochimica Acta 55, 1295–1308.
Klemme, S., Prowatke, S., Hametner, K., Gunther, D., 2004. Partitioningof trace elements between rutile and silicate melts: implicationsfor subduction zones. Geochimica et Cosmochimica Acta 69 (9),2361–2371.
Kump, L.R., Brantley, S.L., Arthur, M.A., 2000. Chemical weathering,atmospheric CO2, and climate. Annual Review of Earth andPlanetary Sciences 28, 611–667.
Kurtz, A.C., Derry, L.A., Chadwick, O.A., Alfano,M.J., 2000. Refractoryelement mobility in volcanic soils. Gelogy 28 (8), 683–686.
Kurtz, A.C., Derry, L.A., Chadwick, O.A., 2001. Accretion of Asiandust to Hawaiin soils: isotopic, elemental, and mineral massbalances. Geochimica et Cosmochimica Acta 65 (12), 1971–1983.
Langmuir, D., 1997. Aqueous Environmental Geochemistry, vol. 1.Prentice Hall, Upper Saddle Rive, NJ. 589 pp.
Lee, S.-Z., Chang, L., Yang, H.-H., Chen, C.-M., Liu, M.-C., 1998.Adsorption characteristics of lead onto soils. Journal of HazardousMaterials 63, 37–49.
Manga, M., 1998. Advective heat transport by low-temperaturedischarge in the Oregon Cascades. Geology 26, 799–802.
Melfi, A.J., Subies, F., Nahon, D., Formoso, M.L.L., 1996. Zirconiummobility in bauxites of Southern Brazil. Journal of South AmericanEarth Sciences 9 (3/4), 161–170.
Middelburg, J.J., Weijden, C.H.V.D., Woittiez, J.R.W., 1988. Chemicalprocesses affecting the mobility of major, minor and trace elementsduringweathering of granitic rocks. Chemical Geology 68, 253–273.
Nesbitt, H.W., Young, G.M., 1984. Prediction of some weatheringtrends of plutonic and volcanic rocks based on thermodynamic andkinetic considerations. Geochimica et Cosmochimica Acta 48,1523–1534.
Nesbitt, H.W., Markovics, G., Price, R.C., 1980. Chemical processesaffecting alkalis and alkaline earths during continental weathering.Geochimica et Cosmochimica Acta 44, 1659–1666.
Olson, K.W., Skogerboe, R.K., 1975. Identification of soil leadcompounds from automotive sources. Environmental Science &Technology 9 (3), 227–230.
Othman, I., Al-Oudat, M., Al-Masri, M.S., 1997. Lead levels in roadsidesoils and vegetation of Damascus City. The Science of the TotalEnvironment 207, 43–48.
Riebe, C.S., Kirchner, J.W., Finkel, R.C., 2003. Long-term rates ofchemical weathering and physical erosion from cosmogenicnuclides and geochemical mass balance. Geochimica et Cosmo-chimica Acta 67 (22), 4411–4427.
Rudnick, R.L., Fountain, D.M., 1995. Nature and composition of thecontinental crust: a lower crust perspective. Reviews of Geophysics33 (3), 267–309.
Sak, P.B., Fisher, D.M., Gardner, T.W., Murphy, K., Brantley, S.L.,2003. Rates of weathering rind formation on Costa Rican basalt.Geochimica et Cosmochimica Acta 68 (7), 1453–1472.
Taylor, A., Blum, J.D., 1995. Relation between soil age and silicateweathering rates determined from the chemical evolution of aglacial chronosequence. Geology 23, 979–982.
Teutsch, N., Erel, Y., Halicz, L., Chadwick, O.A., 1999. The influenceof rainfall on metal concentration and behavior in the soil.Geochimica et Cosmochimica Acta 63 (21), 3499–3511.
Teutsch, N., Erel, Y., Halicz, L., Banin, A., 2001. Distribution ofnatural and anthropogenic lead in Mediterranean soils. Geochimicaet Cosmochimica Acta 65 (17), 2853–2864.
Vitousek, P.M., et al., 1997. Soil and ecosystem development acrossthe Hawaiian Islands. GSA Today 7, 1–8.
Wilcke, W., Krauss, M., Kobza, J., Zech, W., 2001. Quantification ofanthropogenic lead in Slovak forest and arable soils along adeposition gradient with stable isotope ratios. Journal of PlantNutrition and Soil Science 164, 303–307.
Wilkens, B.J., Loch, J.P.G., 1998. Accumulation of cadmium and zincfrom diffuse immission on acid sandy soils, as a function of soilcomposition. Water, Air, and Soil Pollution 96, 1–16.