Embed Size (px)
Citation preview
1
EROSION AND WEATHERING PROCESSES IN THE
DELAWARE RIVER BASIN
Hongbing Sun1,a
, Carol Natter1 and Pierre Lacombe
2
1Department of Geological, Environmental, and Marine Sciences, Rider University,
Lawrenceville, NJ 08648. 2USGS Water Resources Division, Trenton, NJ
ABSTRACT
Total suspended sediments and the total dissolved solids (TDS) from three river
gaging stations, near Delaware Water Gap, Riegelsville and Trenton on the Delaware
River measured by the USGS were used to estimate the physical erosion, chemical
weathering and total denudation rates of the Delaware River Basin. The denudation rates
are 28 and 128 tons/km2/yr for the upper stream and downstream stretches. Overall, the
chemical weathering is more prominent in the basin than the physical weathering due to
the low gradient of the region and sufficient moisture levels in the regional soil. The total
suspended sediments are high during March and April when snow melting and ground
thawing occur, and low during the summer when the river discharge is low. The response
of TDS to the river discharge is more complicated. Overall, higher temperatures increases
the chemical weathering, and low discharge increases the ion concentration in the water.
The saturation indices calculated using the WATEQ4F program indicate that calcite and
dolomite are more saturated in the summer, while silica and halite show opposite patterns.
While the saturation index of silica may be explained by its thermodynamic property, the
saturation index of the halite that deviates from the normal pattern is thought to be related
with the application of winter deicing salt in the region.
Soil cores were also collected from four sites in the basin. Data from a 15-foot
soil core indicates that weight percentage of quartz decreases with depth, while the
weight percentage of feldspar increases. Various mineral types and abundance were also
recognized from other shallow soil cores. These diverse mineral patterns reflect the
diverse ion species in the river basin.
INTRODUCTION
Because of the effect of weathering on water quality and landscape in a basin,
there are always interests in better understanding the weathering processes (Blum et al.,
a: Corresponding author’s e-mail: [email protected]
Proceedings of GANJ XXV - Environmental and Engineering Geology of Northeastern New
Jersey, October, 2008. p.27-38.

2
1998, Braun et al., 2005, Grosbois et
al., 2000, White and Blum, 1995,
White and Brantley, 2003). Various
methods, from mass balance, isotope
analysis, lab experiment to computer
modeling, have been used in the
erosion and weathering studies (Roy
et al., 1999, Moon et al., 2007, Yuan
et al., 2007). During recent years,
because of the detrimental effect of
sulfate, nitrate and road salts on the
ecosystem, the buffering capacities
of various weathering processes
have become the focuses of some of
the studies as well (Douglas et al.,
2002, Witfield et al., 2006, Lerman
and Wu 2006, Moncoulon et al., 2004,
da Gonceicao and Bonotto, 2004).
Progresses have been made on
understanding how the chemical weathering of soils and bedrock responde to different
environmental factors such as temperature, pH and landscape (Riebe et al., 2004, White
and Fernando, 1995, White and Brandtley, 2003). However, because of the climatic,
geographic and geologic variations of regions, weathering can be significantly different
from region to region. The relationship developed for the chemical ions also can be
different (Braun et al., 2005, Millot et al., 2003). In addition, there has not been a
thorough study of the weathering processes and the effect of anthropogenic loadings in
the Delaware River Basin (DRB). Therefore, this project intends to provide an initial
investigation on the weathering processes in the DRB (Figure 1).
Figure 1. Locations of soil sample sites and three
USGS water stations in the Delaware River Basin,
including State lines of NJ, NY, PA, DE
NY
PA
NJ
DE

3
RESEARCH METHOD
Total Denudation Rate
Total denudation rate of the DRB is the sum of its physical erosion and chemical
weathering rates. Physical erosion is calculated as the average of the total suspended
sediments normalized by the catchment area of the basin up to that particular outlet
station. The suspended sediments are the sediment particles that were removed by the
river water from the basin.
Chemical weathering rate is calculated as the product of total dissolved solids
(TDS) and the discharge of the river water, with this product being normalized by the
catchment area (Yuan et al., 2007, Douglas, 2006). The TDS is approximated by the sum
of the concentrations of major cations, including the Ca2+
, Mg2+
, Na+, K
+, HCO3
-, SO4
2-,
Cl- and silica in the system, mainly the first 7 ions. This approach has been practiced in
many previous studies (Riebe et al., 2004, Ryu et al., 2008, Roy et al., 1999, Yuan et al.,
2007, Karim and Veizer, 2000).
Seasonal Variations of Erosion Rate
Because discharge and precipitation change seasonally, the physical removal of
sediments and chemical dissolution of the ions, which are related to discharge and
precipitation, will change seasonally. The total loadings of suspended sediments reflect
the amount of physical erosion, and the total dissolved major ions reflect the chemical
weathering of the rocks and soil in the basin. The monthly averages were calculated by
adding all the sample data collected in a particular month for all the years that data are
available. Also, in order to examine the relationship between the water temperature and
dissolved silica concentration, a simple linear correlation was calculated.
Saturation Indices of Mineral Species
Saturation index is a term that is used to describe the dissolution state of a mineral
in water. It is calculated as the log ion activity product of the dissolution reaction divided
by the equilibrium constant of a reaction (Drever, 1997). For example, for the dissolution
of gypsum, the saturation indices equation is given as,

4
( )
)(
24
2
logloggypsumsp
solutionsoca
sp K
aa
K
IAPIndexSaturation
−+
==
where IAP is Ion Activity Product and Ksp is equilibrium constant of the reaction equation.
The ratio of IAP and Ksp can also be normalized by the number of ions to obtain the
saturation ratio (Zhang and Nacollas, 1990).
The WATEQ4F (Ball and Nodstrom, 1991) which evaluates the distribution and
the saturation level of each species for each element was used to calculate the saturation
index of each species. The program uses the measured ion concentrations of a water
system as input.
Soil Mineral Patterns of the Area
Soil cores were collected from five sites in the basin (fig 1). A15-foot core
collected at the Naval Air Warfare Center (NAWC), West Trenton site was obtained from
the USGS Trenton office. Two-foot shallow soil cores were collected from four sites
along Route 29 near the Delaware River. The soil sample’s X-ray powder diffraction
spectra were collected. RockJock6 (Eberl, 2003) was used to quantify weight percentage
of the soil minerals based on the X-ray spectra of the soil and rock minerals. Mertens et al.
(2006) recommended the RockJock program to be the “method of choice” for the soil
clay mineral analysis based on the X-ray spectra. Weight abundances of soil minerals are
the bases for mass balance analyses of the chemical weathering.
RESULTS
Denudation Rate of the DRB
The Delaware Water Gap is the most upstream station, Riegelsville is the middle
station, and Trenton is the most downstream station. The Delaware River becomes tidal
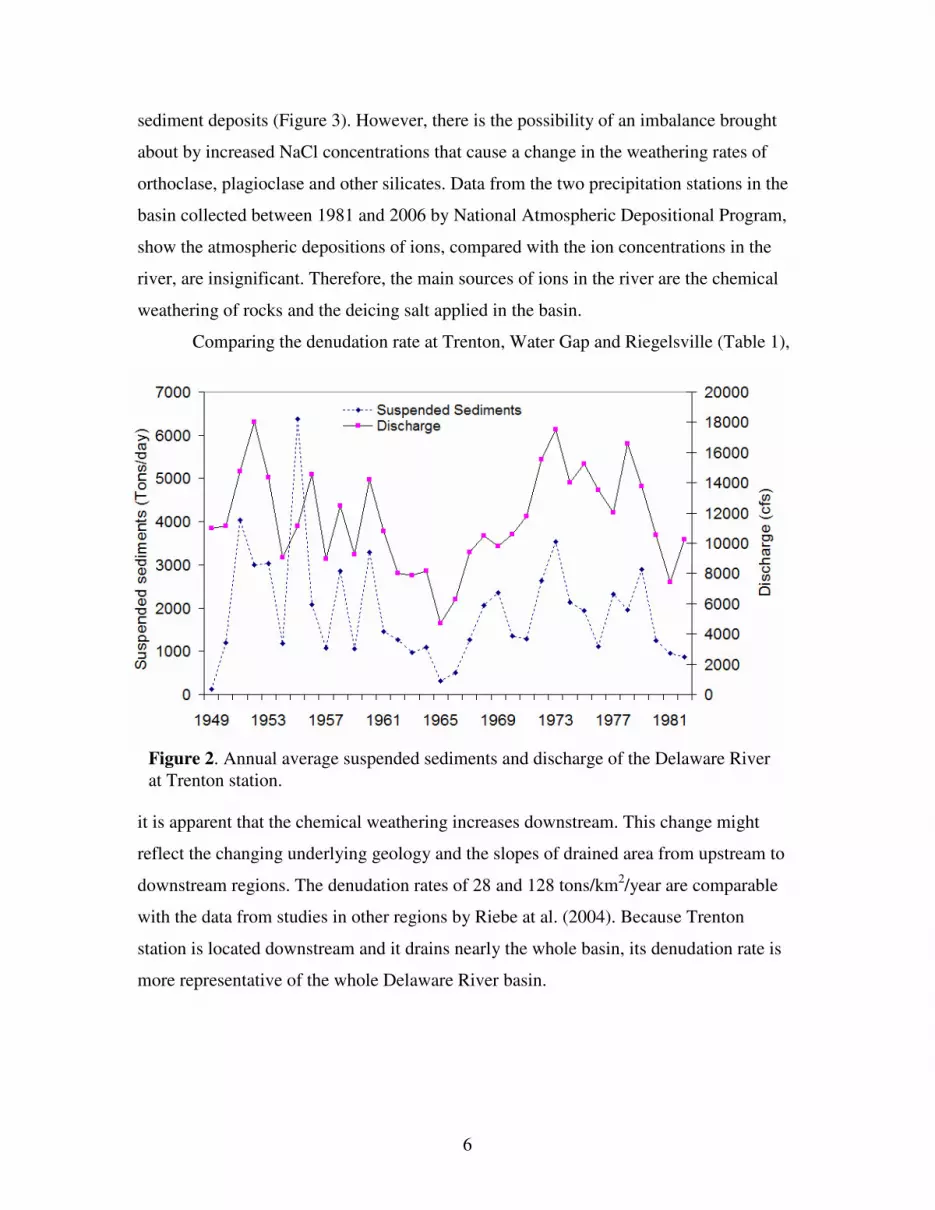
in less than a mile below the Trenton station (Figure 1). Total suspended sediments
generally increase with river discharge. During 1945-82, the mean annual suspended
sediments at the Trenton station ranged from 50 to 6500 tons per day (Figure 2).
Concentrations of the major ions, calcium, magnesium, potassium, and silica,
which resulted from the chemical weathering, fluctuated annually in response to river
discharge. However, they did not show a significantly trend from 1945 to 2008 (Figure 3).

5
Concentrations of sodium and chloride increased by 2 to 4 times as a result of increased
application of the winter deicing salt (Sun et al., 2006, Lucarino and Sun, 2007). Also,
the molar concentration of chloride has risen above the sodium concentration in the last
20 years. This reversal of concentrations may indicate that sodium derived from
weathering of albite to kaolinite, which was considered the sole source of sodium (Blum
et al., 1998), has become less significant in relation to the artificial input of sodium from
the deicing salt. Sulfate concentration shows a low and decreasing trend since the 1970s.
This decline may be related to the clean-air act passed by Congress in 1970’s which
Table 1. Denudation rates calculated from the suspended sediments and total
dissolved solid at three gage stations of the Delaware River: near Delaware Water
Gap, Riegelsville and Trenton stations..
Stations Physical
Erosion Tons/km
2/yr
Chemical
Weathering Tons/km
2/yr
Total
Denudation Tons/km
2/yr
Data Period /Source
Water Gap 11.47 16.94 28.41 Physcial:1964-65, 1971-
72; Chemical: 1965-68
Riegelsville --- 77.79 --- Chemical: 1960-78;
1991-2008
Trenton 41.71 86.34 128.04 Physical: 1950-82;
Chemical: 1944-2008
Panola Min.
GA 14±2 --- 23±3
Source: Riebe et al.,
(2004).
Nicols Peak, S.
Sierra Nevada 127±12 --- 111±13
Source: Riebe et al.,
(2004).
resulted in the reduction of the dry wet depositions of sulfate in the basin. However, this
decline also may be related to the change of equilibrium balance brought by the increased
use of NaCl in the basin (Lucarino and Sun, 2007). Biocarbonate data at the three stations
were recorded for less than10 years by USGS. Because of the positive linear relationship
between the concentration of biocarbonate and the concentrations of calcium and
magnesium (with R2 from 0.5 to 0.96), one can deduce that the concentration of
biocarbonate probably did not have a significant trend based on the concentrations of
calcium and magnesium (fig. 3). The high concentration of silica during the mid 1950’s,
may be caused by floods that exposed unweathered bedrock with the removal of thick
6
sediment deposits (Figure 3). However, there is the possibility of an imbalance brought
about by increased NaCl concentrations that cause a change in the weathering rates of
orthoclase, plagioclase and other silicates. Data from the two precipitation stations in the
basin collected between 1981 and 2006 by National Atmospheric Depositional Program,
show the atmospheric depositions of ions, compared with the ion concentrations in the
river, are insignificant. Therefore, the main sources of ions in the river are the chemical
weathering of rocks and the deicing salt applied in the basin.
Comparing the denudation rate at Trenton, Water Gap and Riegelsville (Table 1),
it is apparent that the chemical weathering increases downstream. This change might
reflect the changing underlying geology and the slopes of drained area from upstream to
downstream regions. The denudation rates of 28 and 128 tons/km2/year are comparable
with the data from studies in other regions by Riebe at al. (2004). Because Trenton
station is located downstream and it drains nearly the whole basin, its denudation rate is
more representative of the whole Delaware River basin.
Figure 2. Annual average suspended sediments and discharge of the Delaware River
at Trenton station.

7
Figure 3. Average monthly concentration trends of major ions and discharge of
the Delaware River at Trenton station. Upper panel, Ca, Mg, K, SO4 and Si;
lower panel, Na, Cl and the normalized discharge.
8
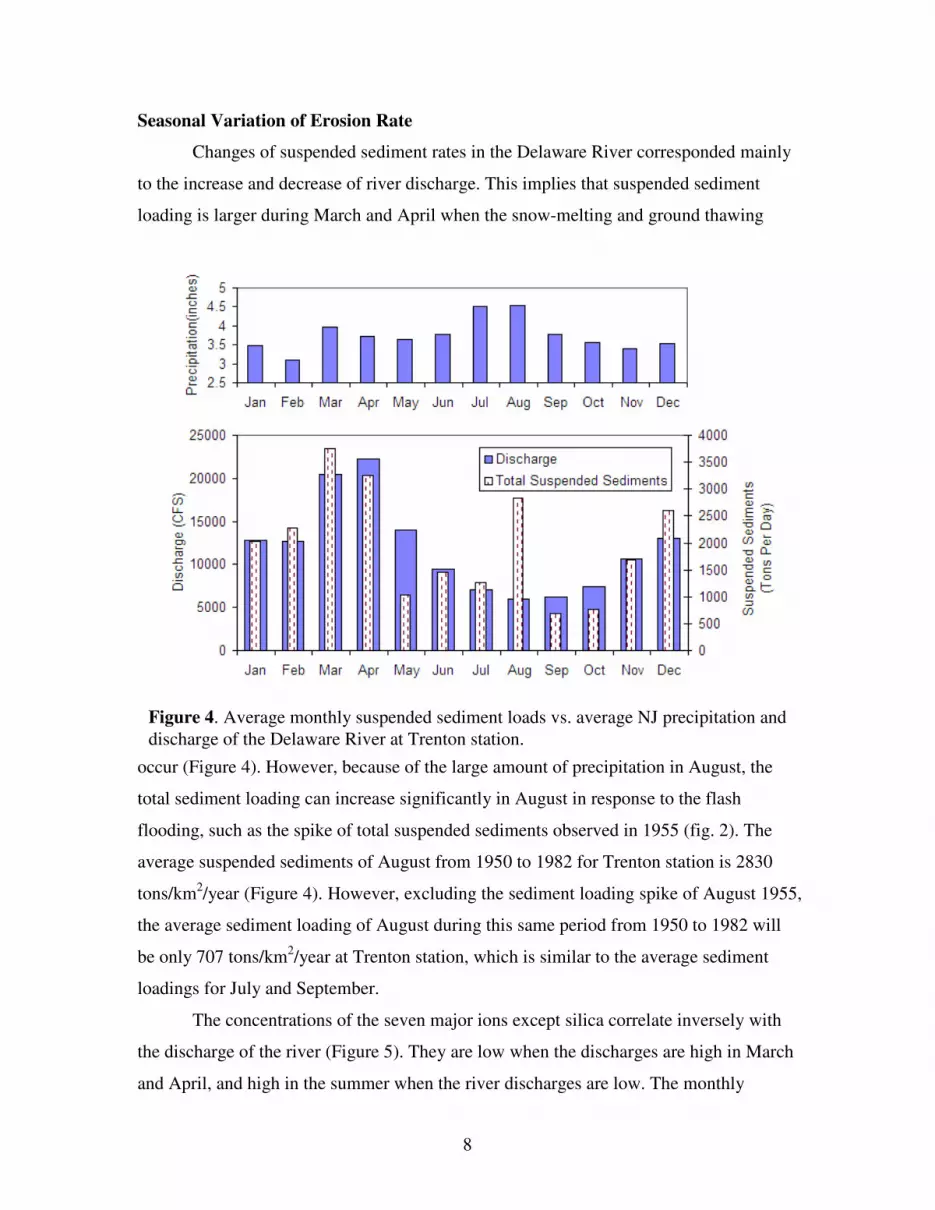
Seasonal Variation of Erosion Rate
Changes of suspended sediment rates in the Delaware River corresponded mainly
to the increase and decrease of river discharge. This implies that suspended sediment
loading is larger during March and April when the snow-melting and ground thawing
occur (Figure 4). However, because of the large amount of precipitation in August, the
total sediment loading can increase significantly in August in response to the flash
flooding, such as the spike of total suspended sediments observed in 1955 (fig. 2). The
average suspended sediments of August from 1950 to 1982 for Trenton station is 2830
tons/km2/year (Figure 4). However, excluding the sediment loading spike of August 1955,
the average sediment loading of August during this same period from 1950 to 1982 will
be only 707 tons/km2/year at Trenton station, which is similar to the average sediment
loadings for July and September.
The concentrations of the seven major ions except silica correlate inversely with
the discharge of the river (Figure 5). They are low when the discharges are high in March
and April, and high in the summer when the river discharges are low. The monthly
Figure 4. Average monthly suspended sediment loads vs. average NJ precipitation and
discharge of the Delaware River at Trenton station.

9
concentrations of silica are high in the winter period and low in the summer and fall
periods, and have a negative correlation with temperature. This might indicate that the
solubility of silica may be responding to the temperature differently from the other ions
(Moon et al., 2007). However, the silica concentration generally increases with
temperature from most of the previous studies (White and Blum, 1995). The total TDS
loading (TDS x discharge), which is the total weight of the major ions including silica,
shows a similar changing pattern as the total suspended sediment (Figure 4), with a small
loading in the summer months and a relative large loading in the spring months.
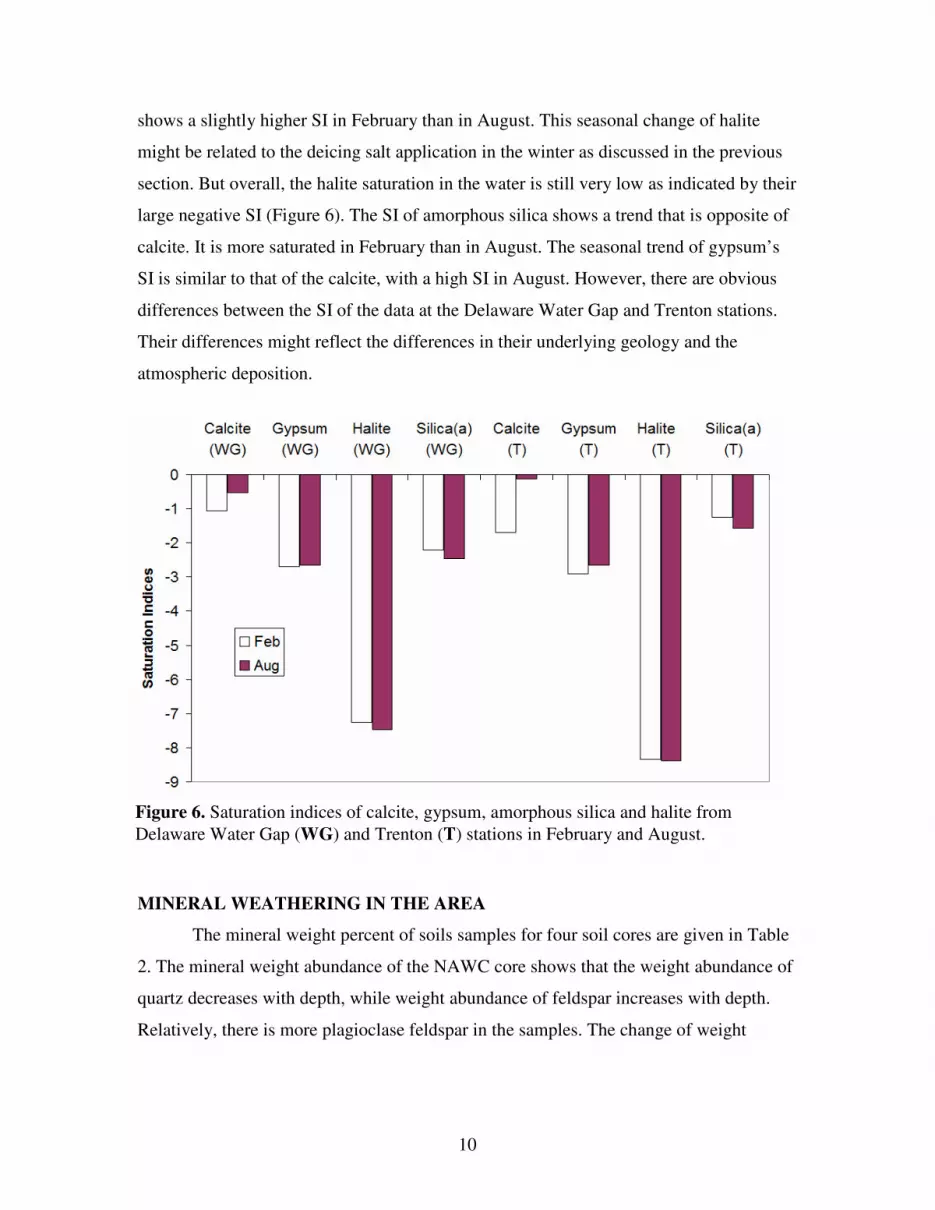
Saturation Indices of Minerals in Water
The saturation index (SI) was calculated for the period between 1970 and 2008
for each station when the data are available, with the river chemistry as the input for the
WATEQ4F program. Saturation indices of 50 mineral species were given by the program
output. Only the average SI of a few minerals that are related with the road salt, sulfate
atmospheric loading and two other common weathering products, calcite and amorphous
silica are identified here (Figure 6). For calcite, it is near saturation in August, which
corresponds to its higher molar concentration in the summer (Figure 5). Halite (NaCl)
Figure 5. Seasonal variation of ion concentrations vs. discharge of the Delaware River
at Trenton station.
10
shows a slightly higher SI in February than in August. This seasonal change of halite
might be related to the deicing salt application in the winter as discussed in the previous
section. But overall, the halite saturation in the water is still very low as indicated by their
large negative SI (Figure 6). The SI of amorphous silica shows a trend that is opposite of
calcite. It is more saturated in February than in August. The seasonal trend of gypsum’s
SI is similar to that of the calcite, with a high SI in August. However, there are obvious
differences between the SI of the data at the Delaware Water Gap and Trenton stations.
Their differences might reflect the differences in their underlying geology and the
atmospheric deposition.
MINERAL WEATHERING IN THE AREA
The mineral weight percent of soils samples for four soil cores are given in Table
2. The mineral weight abundance of the NAWC core shows that the weight abundance of
quartz decreases with depth, while weight abundance of feldspar increases with depth.
Relatively, there is more plagioclase feldspar in the samples. The change of weight
Figure 6. Saturation indices of calcite, gypsum, amorphous silica and halite from
Delaware Water Gap (WG) and Trenton (T) stations in February and August.

11
abundance of clay minerals with depth depends on the specific type of mineral dominant
and varied weight abundances for clay minerals. This diverse mineral weight
Table 2. Mineral weight percent abundance of the study sites
NAWC, Naval Air Warfare Center, West Trenton; Stock, Stockton Elementary School ground;
Park , Washington Crossing Park; Diosite, diorite road cut on Route 29.
NAWC West Trenton Site,
Depths below Land surface in Feet Other Sites
Depth → 0 2 3.8 7.9 10 11.8 15.8 Stock PARK Diosite
Quartz 45.16 46.32 42.40 7.08 0.00 1.96 14.07 35.08 0.00 8.56
K-feldspar 10.56 3.02 7.51 21.81 25.29 16.11 3.42 12.87 2.48 8.35
Na,Ca feldspar 3.06 7.28 14.78 7.27 23.76 42.51 48.94 15.49 23.04 35.69
Calcite 0.02 0.00 0.00 0.00 0.00 0.00 0.00 0.00 0.00 0.11
Dolomite 0.54 0.00 0.17 0.07 0.13 0.00 0.00 0.25 0.90 0.29
Pyrite 0.00 0.03 0.09 0.13 0.00 0.40 0.17 0.02 0.97 0.43
Gypsum 1.33 0.58 0.00 0.49 0.34 0.00 0.88 0.67 0.00 1.01
Magnetite 0.00 0.00 0.00 0.00 0.00 0.00 0.00 0.24 0.73 0.01
Hematite 0.00 0.07 0.34 0.10 0.00 3.76 5.03 0.58 2.16 0.10
Goethite 1.72 1.75 1.66 0.89 0.80 0.00 0.26 1.21 0.00 1.27
Kaolinite 6.29 4.88 5.00 11.59 6.51 0.09 0.60 1.96 0.00 7.59
Smectite 20.56 18.40 19.04 28.43 22.37 18.20 11.86 9.98 20.28 16.17
Illite 2.16 5.08 1.24 4.63 19.28 12.58 0.00 5.03 5.09 2.01
Biotite 1.91 1.69 1.35 2.68 0.00 0.00 0.14 6.35 8.78 4.31
Chlorite 3.32 3.34 0.80 5.83 1.51 1.66 0.20 9.88 33.03 11.80
Muscovite 3.36 7.56 5.61 8.99 0.00 2.71 14.42 0.40 2.54 2.31
abundance from various soil sites including some of our earlier studies (Sun et al., 2008)
reflects the diverse ion concentrations in the DRB.
Even though the weight abundance of carbonate minerals, calcite and dolomite
are only a small portion of the soil mineral mass, because of the relative large amount of
calcium, and magnesium in the river water, they still might play a large role in the mass
12
balance calculation of calcium and magnesium in the Delaware River based on similar
studies conducted by other researchers (Blum et al, 1998, Grosbois et al, 2000).
SUMMARY AND CONCLUSIONS
Denudation rates in the Delaware River Basin vary from upper stream to
downstream. Overall, the chemical weathering is prominent due to the high moisture
level and longer soil water residence time in the DRB. The total denudation rates of 28
and 128 tons/km2/yr are comparable to the rates obtained from other regions of the
country. The major ion concentrations are usually high in the summer with a sequence of
Ca>Mg>Na>K. Concentration of silica shows a slightly different trend. Because of the
anthropogenic contribution of the winter deicing salt, the concentrations of Na and Cl
have nearly quadrupled during 1945-2007. The weight abundance of soil minerals
changes with soil depth. Overall, there is more quartz near the surface and more feldspar
at depth, which could reflect the decreasing level of mineral weathering with depth.
REFERENCES
Ball, J.W. and Nordstrom, D.K., 1991: User's Manual for WATEQ4F, with Revised
Thermodynamic Data Base and Test Cases for Calculating Speciation of Major,
Trace, and Redox Elements in Natural Waters. U.S. Geological Survey Open-File
Report 91-183.
Blum, J.D., Gazis, C.A., Jacobson, D. A., Chamberlain, C.P.,1998 Carbonate versus
silicate weathering in the Raikhot watershed within the High Himalayan
Crystalline Series. Geology; 26:411–414.
Braun, J.J. Ngoupayou, J.R.N. Jérôme V., Dupre, B., Bedimo, J.B., Boeglin, J. B.,
Robain, H., Nyeck, B., Freydier, R., Nkamdjou, L.S., Rouiller, J., Muller, J.P.,
2005. Present weathering rates in a humid tropical watershed: Nsimi, South
Cameroon. Geochimica et Cosmochimica Acta, 69:357–387.
da Conceicao¸ F.T. and Bonotto, D.M., 2004.Weathering rates and anthropogenic
influences in a sedimentary basin, Sao Paulo State, Brazil. Applied Geochemistry,
19:575–591.
Douglas T.A., C. Chamberlain, P. Blum, J.D., 2002. Land use and geologic controls on
the major elemental and isotopic (d15N and 87Sr/86Sr) geochemistry of the
Connecticut River watershed, USA. Chemical Geology, 189:19– 34.
13
Drever, J. I., 1997. The geochemistry of natural waters. 3rd
edition. Prentice Hall.
Eberl, D. D., 2003. User’s Guide To Rockjock -- A Program For Determining
Quantitative Mineralogy From Powder X-Ray Diffraction Data, US Geological
Survey, Open-File Report 03-78.
Grosbois C., Negrel P., Fouillac C., and Grimaud, D., 2000. Dissolved load of the Loire
River: chemical and isotopic characterization. Chemical Geolog, 170:179–201
Karim, A and Veizer, J., 2000 Weathering processes in the Indus River Basin:
implications from riverine carbon, sulfur, oxygen, and strontium isotopes.
Chemical Geology 170:153–177.
Lerman, A. Wu, L., 2006. CO2 and sulfuric acid controls of weathering and river water
composition. Journal of Geochemical Exploration, 88:427–430.
Lucarino, K. and Sun, H., 2007. Changes of salt levels responding to road salt
application in winter runoff water and the trend of salt level in the Delaware River.
GSA Abstracts with Programs Vol. 39, No. 6.
Mertens, G., Zeelmaekers, E. and Machiel, L., 2006. Use of quantitative X-ray diffraction
for academic and industrial applications. Acta Crystallographica, Section A. A62,
s209.
Millot, R. Gaillardet, J. , Dupre, B. and Allegre, C.J., 2003. Northern latitude chemical
weathering rates: Clues from the Mackenzie River Basin, Canada. Geochimica et
Cosmochimica Acta, 67: 1305–1329.
Moncoulon, D. Probst,A. and Party, C.R. J., 2004. Weathering, atmospheric deposition
and vegetation uptake: role for ecosystem sensitivity to acid deposition and
critical load. Geoscience 336:1417–1426.
Moon, S. Huh, Y. Qin, J. Pho, N.Y., 2007. Chemical weathering in the Hong (Red) River
basin: Rates of silicate weathering and their controlling factors. Geochimica et
Cosmochimica Acta, 71:1411–1430.
Riebe, C. Kirchnera, S., Robert, W. J and Finkel, C. 2004. Erosional and climatic effects
on long-term chemical weathering rates in granitic landscapes spanning diverse
climate regimes. Earth and Planetary Science Letters, 224:547– 562.
Roy, S. Gaillardet, J. and All`Egre, C. J., 1999. Geochemistry of dissolved and
suspended loads of the Seine river, France: Anthropogenic impact, carbonate and
silicate weathering. Geochimica et Cosmochimica Acta, 63:1277–1292.

14
Ryu J.S., Lee, K.S, Chang, H.W., Seon, H., 2008. Chemical weathering of carbonates
and silicates in the Han River basin, South Korea. Chemical Geology. 247: 66–80.
Sun, H., Hewins, D., Latini, D., and Husch, J. 2006. Changes in Impervious Surface Area,
Flood Frequency, and Water Chemistry within the Delaware River Basin during
the Past 50 Years: Initial Results. Proceedings of the 7th International Conference
on Hydroscience and Engineering. Drexel E-Repository and Archive
http://idea.library.drexel.edu/, 15pp.
Sun, H., Nelson, M., Chen, F., and Husch, J., 2008. Soil mineral structural water loss
during LOI analyses: Impact on organic matter content determinations. Soil
Science Society of America Journal. In Review.
White A. F.,and Blum, A.E., 1995 Effects of climate on chemical, weathering in
watersheds. Geochimica et Cosmochimica Acta, 59:1729- 1747.
White, A. F, and Brantley S. L., 2003.The effect of time on the weathering of silicate
minerals: why do weathering rates differ in the laboratory and field? Chemical
Geology, 202:479–506.
Whitfield, C.J., Watmough, S.A. Aherne, J. and Dillon, P.J., 2006. A comparison of
weathering rates for acid-sensitive catchments in Nova Scotia, Canada and their
impact on critical load calculations. Geoderma, 136: 899–911.
Yuan, F., Miyamoto, S. and Anand, S., 2007. Changes in major element hydrochemistry
of the Pecos River in the American Southwest since 1935. Applied Geochemistry,
22:1798–1813.
Zhang, J.W., and Nancollas, G.H., 1990. Mechanisms of Growth and Dissolution of
Sparingly Soluble Salts, in Mineral-Water Interface Geochemistry, M.F.
Hochella, Jr. and A.F. White, Eds., Reviews in Mineralogy, 23: 365-396.