Embed Size (px)
Citation preview

Shore & Beach Vol. 82, No. 1 Winter 2014 Page 31
Tidal inlets usually connect an open body of water (e.g. ocean) to an inland bay (FitzGerald 1996) and
provide the opportunity for water circu-lation in the bay. This connection and circulation aids in aquatic abundance, and can serve recreational and navigational purposes. The size and the location of an inlet are often fixed by hardening the channel walls throughout the inlet length in order to provide a safe and reliable channel. In this regard, designing a chan-nel with the appropriate dimensions that is stable under the existing hydrodynamic conditions is a difficult effort. In addition to the morphological variation within the channel, the surrounding areas can also be significantly under the influence of the engineered inlet (Bruun 1995; Dean and Work 1993; Fenster and Dolan 1996; Galgano 2009). Extended jetties inter-rupt the alongshore sediment transport process along the beach. In other words, the source of the sediment to the down-drift beach is mainly removed. On the other hand, wave driven forces can move the sediment away from the downdrift
Downdrift beach erosion adjacent to the Indian River Inlet, Delaware, USA
By
Mohammad Keshtpoor1; Jack A. Puleo2; Fengyan Shi31Ph.D. candidate, Civil and Environmental Engineering Department, University of Delaware, Newark, DE 19711.
2Associate Professor, Civil and Environmental Engineering Department, University of Delaware, Newark, DE 19711.3Research Associate Professor, Civil and Environmental Engineering Department,
University of Delaware, Newark, DE 19711.
ABSTRACTIndian River Inlet (IRI) is located at roughly the midpoint of the Atlantic coast of Delaware and is the major waterway that connects the Atlantic Ocean to two Delaware inland bays. Twin jetties constructed in late 1930s to keep the inlet from filling also interrupt the alongshore sediment transport. Since then, the updrift beach has accreted and downdrift beach suffered from erosion. In 1990, the U.S. Army Corps of Engineers constructed a sand bypassing system to mitigate the downdrift beach erosion by transferring sand slurry from the updrift to downdrift side of the inlet. In an effort to investigate the impact of the bypassing system on downdrift beach, Empirical Orthogonal Function (EOF) analysis is applied on beach profile data collected from 1985 until 2008 to address two questions. First, did the bypass-ing system fulfill the beach nourishment goals? If so, how much material is enough to be bypassed to protect the downdrift beach? EOF results show high correlation between the third temporal eigenfunction at the downdrift beach and time series of bypassed volumes from 1994 until 2000. The combination of
the spatial and temporal eigenfunctions indicates that the mean value of bypassed volumes from 1991 until 2000 was likely sufficient to mitigate downdrift beach erosion. The downdrift beach has been eroded severely since 2009, even though the bypassed volumes have exceeded the optimum value for previ-ous years. Increased erosion is likely related to extra-tropical storm impact, (i.e. Hurricane Felix 1995; Hurricane Irene in 2011; and Hurricane Sandy in 2012). Numerical simulation of hydrodynamics and sediment transport of inlet-adjacent areas is one of the most efficient ways to study the behavior of the downdrift beach to varying forcing boundary conditions. Here, we used a numerical model including sediment transport coupled with a wave model and a nearshore circulation model to meet the goals of this study. The major goal is to estimate the sediment transport rate variability under the effect of dominant and different directional waves to determine the important processes for downdrift beach erosion. Finally, we included the characteristics of Hurricane Felix (1995) within the model to obtain the results for a severe condition.
ADDITIONAL KEYWORDS : Indian River Inlet, downdrift beach erosion, empirical orthogonal func-tion analysis, sediment transport rate.
Manuscript submitted 29 July 2013, revised and accepted 23 January 2014.
beach in the direction of net littoral drift. Cross-shore sediment movement may also increase the sediment loss from the downdrift beach. As a direct result of inlet stabilization, the downdrift beach gener-ally erodes and the shoreline recedes landward. Shoreline recession raises the concern about the possible damage to inland infrastructure such as roads and buildings.
To counter the shoreline offset near a tidal inlet several approaches can be applied to mitigate the beach erosion at the downdrift beach (overview given by Keshtpoor et al. 2013). One of the effec-tive methods is to fill the downdrift beach with sediment from the ebb shoal, flood shoal, or the accretionary fillet at the up-
drift beach. Mechanical bypassing is one of the efficient tools to discharge to the downdrift beach an amount of sediment that is similar to the net yearly alongshore transport rate.
The objective of this study is to investigate the optimum magnitude of bypassing sand that leads to protec-tion of the downdrift beach adjacent to the Indian River Inlet (IRI), Delaware, USA based on available morphological data. Moreover, the pattern of sediment transport is studied numerically for different scenarios and under various dominant wave forcing. The study area and beach profile data used in analyses are described. Subsequently, the applied statistical method and the results obtained from the data analysis are presented. Nu-merical simulation of the study area and the results are then described. Results of the numerical simulation and conclusions are presented.
STUDY AREARoughly 40 km of Mid-Atlantic
Ocean coast is located in state of Dela-
Shore & Beach Vol. 82, No. 1 Winter 2014Page 32
Figure 1. Map of Delaware coast showing Indian River Inlet and Rehoboth and Indian River Bays.
Figure 2. Early history of Indian River Inlet and adjacent shoreline evolution. Aerial photos were provided by the U.S. Geological Survey (USGS) and the U.S. Army Corps of Engineers (USACE).
ware from Cape Henlopen at the north to Fenwick Island at Delaware-Maryland state line at the south (Figure 1). At roughly the midpoint, the sandy beach is cut by the twin jetties of IRI that con-nects the Atlantic Ocean to two Delaware inland bays, Rehoboth bay at the north and Indian River Bay to the west of the inlet. Inland bays are almost equal in surface area with a combined total area of approximately 75 km2. The inlet width is 150 m and is armored throughout its 370 m of inlet interior shoreline in addi-tion to roughly 450 m of jetty length. The minimum distance between State Route 1 (hurricane evacuation route) and the mean shoreline position at the downdrift beach is approximately 60 m.
WavesWaves along the Delaware coast are
small to moderate with significant wave height less than 1 m 58% of the time and less than 2 m 92% of the time (Keshtpoor et al. 2013; from Wave Information Study (WIS) results). Dominant wave forcing from the south-east drives a long-term net alongshore sediment transport rate (ASTR) to the north along much of the Delaware coast. Oceanic tidal range is 1.25 m and forces a 0.80 ± 0.13 m tide in Indian River Bay (USGS gage 01484540) and a 0.49 ± 0.09 m tide in Rehoboth Bay (USGS gage 01484670) based on tide gage records since 2005.
Alongshore Sediment TransportNet ASTR estimates near Indian River
Inlet have been documented by numerous researchers. Lanan and Dalrymple (1977) estimated the value of 104,000 m3/year from sand budget analyses. Several stud-ies used WIS data sets and alongshore sediment transport formulations to esti-mate the net ASTR in this area. Weggel and Douglass (1986) used WIS data from 1956 to 1974 and estimated 22,200 m3/year for alongshore sediment transport. Using the same data, Mann and Dalrym-ple (1986) estimated 117,000 ± 64,000 m3/year. Puleo (2010) used WIS data from 1980 to 1999 to obtain the value of 373,000 ± 196,000 m3/year. USACE (1996) estimated the value of 478,000 m3/year for ASTR based on WIS data from 1956 to 1993 and the GENESIS model.
HistoryIRI was open for a short time after
storm conditions prior to inlet stabili-zation. Alongshore sediment transport filled the inlet mouth and tidal currents
were not able to counteract the tendency for inlet infilling. The inlet, thus, was an ephemeral opening that provided an un-safe waterway for navigation (Figure 2a). In 1938, the USACE began construction of twin jetties to maintain inlet stabil-ity (Figure 2b). Bed erosion underneath of the channel walls necessitated the armoring of the interior channel walls (Figure 2c). Since jetty construction, the downdrift beach has eroded severely and threatened the main transportation route along the Delaware coast. According to Lanan and Dalrymple (1977) the down-drift beach eroded a maximum of 146 m
at a location 610 m north of the inlet from 1938 to 1977. To mitigate the recession, sand was occasionally mined from back bay and flood tidal shoals to nourish the downdrift beach. Finally in 1990, the USACE constructed a sand-bypassing system to transfer the sand slurry from the updrift beach to the downdrift beach to protect it against erosion. The design rate of bypassed sand to the downdrift beach was determined as 84,100 m3/year based on the volumetric growth of the ebb shoal, downdrift beach nourishment efforts and prior estimates using WIS information (USACE 1984).
Inlet area morphologyMulti-beam inlet-adjacent morphol-
ogy survey data in 2004 by USACE are shown in Figure 3. Three deep scour holes within the inlet are evident beside the complicated bathymetry around the channel. Tidal currents introduce large bed shear stress over the bed that are lo-cally maximized at the three areas within the inlet. The hydrodynamics of IRI are significantly under the influence of Dela-ware Bay. When IRI ebbs the ebb current of Delaware Bay redirects the ebb current of IRI towards the south. Consequently, the ebb tidal shoal has mainly grown towards the south.
Beach profile dataThe USACE has collected beach pro-
files, typically out to closure depth since 1985 (and until 2008 for this study). Data were collected at least yearly and often twice per year since bypassing system initiation. The term pre-bypassing, here, refers to the years 1985-1989. The length and cross-shore sample spacing within the profiles also varied over time. Sixteen profile lines are selected for analyses in this work and are spaced irregularly to the north and south of the inlet (Figure 3). For this study the naming convention includes numbers increasing from the inlet centerline with suffixes N indicat-ing north of the inlet (downdrift) and S indicating south of the inlet (updrift). Table 1 shows the distance in meters of each profile line from the inlet centerline. For example, 1N and 1S are profile lines located 137 m north and south of the inlet centerline, respectively. The shoreline north and south of the inlet trends about 5° west of north. In this paper, easting is used as a proxy for cross-shore dis-tance. Profile data are referenced to the Delaware State Plane NAD83 (North American Datum 1983; horizontal) and

Shore & Beach Vol. 82, No. 1 Winter 2014 Page 33
Figure 3. 2004 USACE multi-beam sonar bathymetry of the Indian River Inlet and adjacent beaches. Beach profile lines used in this study are indicated by black lines.
Figure 4. Normalized second (panel a) and third (panel b) spatial eigenfunction amplitudes for the bypassing time frame from 1991 to 2008 (from Keshtpoor et al. 2013). The black dashed line represents the 1991 shoreline (−0.12 m NAVD88).
NAVD88 (North American Vertical Da-tum of 1988; vertical) coordinate system in meters. Mean sea level is 0.12 m below the NAVD88 zero datum at the beaches adjacent to the Indian River Inlet. The intersection of mean sea level with the beach (elevation of −0.12 m NAVD88) is defined as the shoreline in this study.
Beach profiles are used to construct three-dimensional bathymetric surfaces north and south of the inlet for EOF analyses. The horizontal profile coor-dinates are rotated clockwise by 5° and shifted so the alongshore datum is the inlet centerline to simplify interpolation procedures onto a uniform grid before ap-plying an optimal interpolation technique (Plant et al. 2002).
EMPIRICAL ORTHOGONAL FUNCTION (EOF) ANALYSIS
MethodEOF analysis is applied to interpolated
bathymetric surfaces to identify and de-scribe the spatially-coherent effect of the sand bypassing system on the beaches adjacent to IRI. EOF has been widely used to investigate the morphological and bathymetric changes in coastal areas (e.g. Aubrey 1979; Winant et al. 1975; Miller and Dean 2007a, b; Hansen and Barnard 2010; Fairly et al. 2009; Plant and Griggs 1992). EOF decomposition separates the observed variability of, in this case, bathymetry into independent spatial and temporal modes (Equation 1). The physical interpretation of the resulting modes can be determined based on the correspondence of the spatial component to known geomorphic features (e.g., sand bars) or by relating the temporal depen-dence to environmental forcing (Aubrey 1979; Winant et al. 1975).
h (x,y,t) = (N ∑ n=1) (cn (t) en (x,y) (1)
where h is water elevation, x and y are the cross-shore and alongshore coordi-nates in a rotated coordinate system that aligns the shoreline with NAD83 North (rotation of 5° clockwise), t is time, cn are the temporally-varying coefficients, en are the spatially-varying eigenfunctions, and n is the mode number in descending order relative to the amount of variance explained.
Equation 1 describes that the spatial and temporal dependency of water eleva-tion split into two independent orthogonal bases (eigenfunctions), cn and en using Taylor series expansion. The spatial eigenfunction represents the spatial bathymetric variation and behaves similar to a standing wave. The first mode (n = 1) represents the mean beach behavior and usually absorbs a large portion of the total variance. Early users applied EOF analysis on one-dimensional beach pro-
Table 1.Alongshore distance (m) of beach profiles from the inlet centerline north (N) and south (S) of the inlet (from Keshtpoor et al. 2013).
Profile Distance fromnumber inlet centerline (m) 1 137 2 259 3 381 4 625 5 868 6 1,112 7 1,356 8 1,600

Shore & Beach Vol. 82, No. 1 Winter 2014Page 34
Figure 5. Second and third modes temporal eigenfunction coefficients for the bypassing time frame from 1991 to 2008 (from Keshtpoor et al. 2013).
Figure 6. Third temporal eigenfunction coefficient (dimensionless; gray) for the downdrift beach vs cumulative bypassed volume the previous year (black) from 1991 until 2008 (from Keshtpoor et al. 2013).
file data in coastal environments collected monthly (Winant et al. 1975; Aubrey 1979). Their interpretation of the second mode (also called the bar-berm function) data was related to seasonal variation of the beach profiles. In other words, the second mode relates to the offshore and onshore movement of sandbars during stormy and calm conditions. The third mode (also called the terrace function)
represents the low tide terrace that ap-peared in the beach profile data. Here, since the EOF analysis is based on data collected annually, the seasonal and ter-race effects are filtered out by subtracting the mean beach surface. The variance of the remaining modes represents the beach morphological behavior beyond the mean value. In the present two-dimensional EOF analysis based on yearly collected
data, the second and the third modes ab-sorb the majority of the variance and can produce the reconstructed data. It will be shown that these two modes represent the effect of sand bypassing system on beach bathymetric data.
ResultsKeshtpoor et al. (2013) analyzed the
updrift and the downdrift beaches for pre-bypassing and bypassing periods using the EOF technique. They showed that the downdrift beach typically erodes as a result of jetty presence on the beach. Here, we briefly discuss the results of EOF analysis for the downdrift beach in the bypassing period.
The normalized second and third spa-tial eigenfunctions for the bypassing time frame (1991-2008) at the downdrift beach show spatial variation (Figure 4). The percent variance explained for the mean subtracted second and third modes is, respectively, 42% and 23% on the down-drift beach. The high amplitude areas are restricted to the vicinity of the shoreline areas. The high amplitude area extends 625 m at the downdrift beach along the shoreline and then changes the sign and continues with smaller amplitude. Also, in the third mode there are two high amplitudes with different signs along the shoreline. Temporal coefficients for the second mode at the downdrift beach are generally positive and oscillate in a nar-row range except in 1991 and 1995 until 2000 (Figure 5) whereas the third mode temporal coefficients oscillate about zero every several years. The magnitude of the second mode temporal coefficients generally exceeds the magnitude of the third mode temporal coefficients such that when coupled with the respective spatial eigenfunctions, the downdrift beach generally accretes from 1991 to 1999 along the shoreline near the jetty. However, there is an exception in 1995 (reconstructed bathymetry not shown) where the downdrift beach erodes near the shoreline. In 2000, though c2 is al-most zero, c3 is positive (in response to the bypassed volume in 1999) maintain-ing downdrift beach positive shoreline displacement. Again, following 2000, the magnitude of the second mode tem-poral coefficients, oscillating in a narrow range, exceeds that of the third mode. The negative second mode coefficients coupled with the largely positive spatial eigenfunctions near the shoreline north of the inlet indicate general erosion of the

Shore & Beach Vol. 82, No. 1 Winter 2014 Page 35
Figure 7. Computational domain in Delaware State Plane Easting and Delaware State Plane Northing coordinates. The color scale (m) represents the water depth.
Figure 8. Wave rose based on hourly recorded directional wave data from NOAA buoy station 44009 from 1994 to 1998. Directional span is 30o and alternating color refers to 1 m change in significant wave height in each bin. Percent occurrence (concentric circles) represent the probability of occurrence of each wave case in each bin.
downdrift beach after 2000. The oscillat-ing third mode temporal coefficient for the downdrift beach is weakly correlated (r2=0.24) to bypassed volume with a one-year time lag (Figure 6) from 1991 to 2008. However, the correlation with a one-year time lag is higher (r2=0.94; significant at the 95% level) from 1994 to 2000 (seven years). Prior to 1994 the downdrift beach was likely adjusting to the large singular nourishment volume in 1990 (more than 137,000 m3) and the beginning of sediment bypassing. Fol-lowing 2000, the average bypass volume decreased significantly and results in a less pronounced response of the down-drift beach to the bypassed volume.
EOF analysis shows that the mean bypassed volume from 1991 to 1999 may be enough to mitigate downdrift beach erosion. To investigate the patterns of beach evolution we use numerical model-ing to find the downdrift beach response to dominant offshore forcing.
NUMERICAL SIMULATION OF SEDIMENT TRANSPORT
PATTERNS ADJACENT TO IRIObliquely approaching waves gener-
ate alongshore currents and consequently bed shear stress after breaking. The generated bed shear stress dislodges and moves the sediments from the bed. The effect of the wave-driven alongshore circulation and transport has been studied extensively (e.g. Komar and Inman 1970; Longuet-Higgins 1970; Thoronton and Guza 1986). Tidally induced and wave-driven currents, especially adjacent to a tidal inlet, play a key role in nearshore circulation and transport process in coast-al areas. Depending on tide range and local wave characteristics, the nonlinear wave-current interaction, also modulates the transport phenomenon. The presence of waves also increases turbulence that can lead to enhanced shear stresses and sediment suspension. Currents, on the other hand, alter the wave field through refraction processes (see Hansen et al. 2013 for a recent discussion).
Here, we study numerically the pattern of sediment transport at the downdrift (north) side of IRI by forcing the offshore boundary of the computational domain (Figure 7) with both tide and waves. The most recent version of NearCOM (Near-shore Community Model System) is used here. NearCOM integrates the wave model SWAN (Booij et al. 1999), a modi-
Shore & Beach Vol. 82, No. 1 Winter 2014Page 36
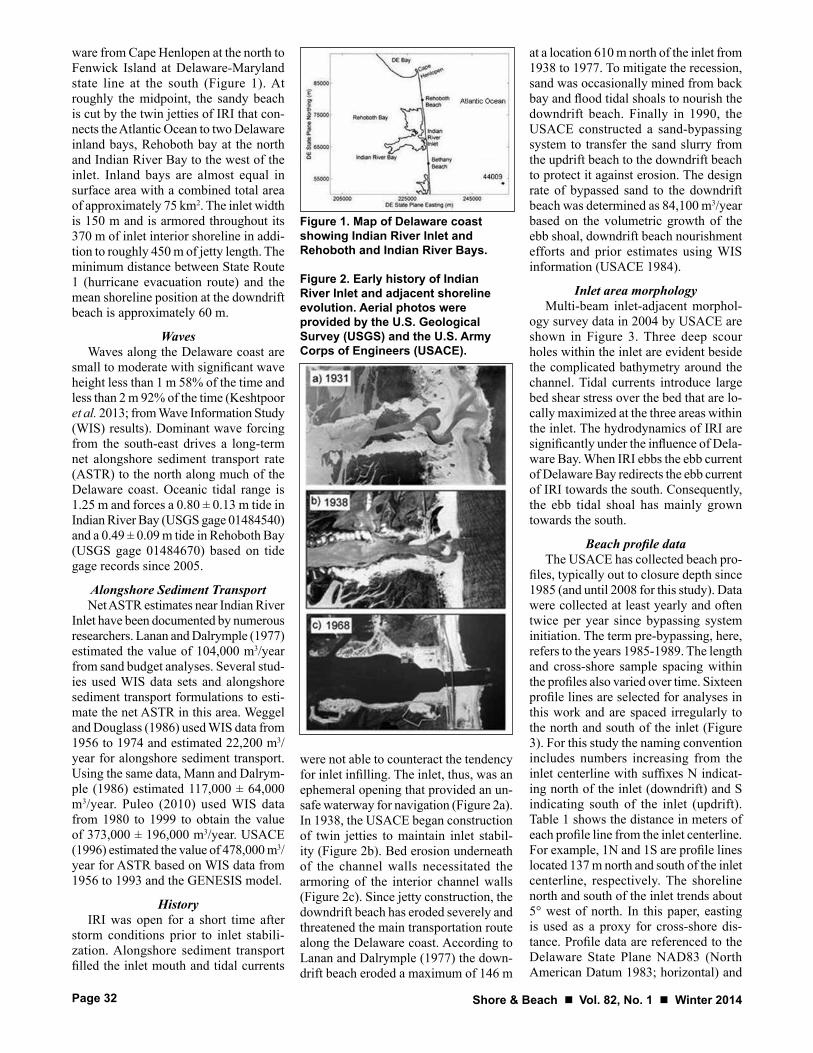
Figure 9. Cross-shore integrated sediment transport rate (m3/s) from the second to the fifth day of the simulation in a) alongshore direction, and b) cross-shore direction, for wave case 4. Positive values represent northward and landward transport in alongshore (a) and cross-shore (b) directions, respectively. Negative values indicate southward and seaward transport in alongshore (a) and cross-shore (b) directions, respectively. Zero on x-axis is the location of inlet centerline. IRI flood and ebb tide durations are also shown.
Figure 10. Gradient of sediment transport rate () (dQx/dx)+(dQy/dy) in a) flow reversal from ebb to flood, b) maximum flood, c) flow reversal from flood to ebb, and d) maximum ebb, after 74 hrs of simulation (between neap tide and spring tide). Color scale indicates the gradient sediment transport rate in m3/(m2s).
fied version of SHORECIRC (Svendsen et al. 2004), and a sediment transport model (Soulsby 1997), to numerically simulate waves, currents, and sediment transport in nearshore ocean (Shi et al. 2013). SHORCIRC solves the Quasi-3D nonlinear shallow water equations in contravariant form with taking into account the dispersion effect caused by the vertical variation of current. A hybrid TVD type numerical scheme combining the finite difference and finite volume is used in solving the equations. In the conservative specification of SHORE-CIRC the surface elevation gradient term is rearranged to obtain a numerically well-balanced form. The spectral wave model SWAN solves the wave action balance equation that explains the tem-poral, geographical, and spectral spatial changes of wave spectrum. SHORECIRC and SWAN run sequentially on the same grid system and communicate through a coupler. The wave radiation stresses are transferred from SWAN to SHORECIRC and the resulting wave averaged water depth and mean current field are in turn transferred back to SWAN. The sediment transport calculation is performed at each hydrodynamic time step. NearCOM is well-accepted in coastal communities and there is a growing demand to use NearCOM in various coastal applica-tions, such as wave-current interaction in an inlet system, storm-induced coastal inundation, beach and dune erosion and tidal flat processes.
Computational domainFigure 7 shows the computational
domain extending from ~10 km south of IRI to ~17 km north of Cape May in New Jersey along the shoreline. Rehoboth Bay, Indian River Bay, and Delaware Bay are included in the domain. The offshore boundary where waves and tides are forced is located ~34 km east of the Delaware coast at ~32 m water depth. Minimum grid resolution is 10 m in the alongshore and cross-shore directions within the IRI to resolve the flow field through the channel and is stretched out linearly to the maximum resolution of 300 m at the ocean and Delaware Bay.
Tidal boundary conditionIn NearCOM the formula of surface
elevation at a tidal boundary is expressed by (Shi et al. 2013)
η (t) = (N ∑ n=1) a(x ,n) f(n) cos(2π/(T(n))-ϕ(x ,n)+Θ(n)) (2)

Shore & Beach Vol. 82, No. 1 Winter 2014 Page 37
Figure 11. Mean of cross-shore integrated sediment transport rate in alongshore direction over 500 m local northing for the six wave cases (Table 2). Positive and negative values, respectively, represent the northward and southward transport along the shoreline. The positive and negative values represent northward and southward sediment transport rate.
Figure 12. Mean of cross-shore integrated sediment transport rate in cross-shore direction over 500 m local northing for six wave cases (Table 2). Positive and negative values, respectively, represent the landward and seaward transport normal to the shoreline. The positive and negative values represent landward and seaward sediment transport rate.
where a and φ represent amplitude and phase lag, respectively, for a harmonic constituent at location x. T is tidal period and f and Ѳ are the lunar node factor and global phase lag, respectively, for a constituent. N is the total number of constituents applied at the boundary and n is the mode number. For this study we applied 6 tidal constituents M2, S2, N2, K2, K1, and O1 that are obtained from the ADCIRC package (http://adcirc.org/products/adcirc-tidal-databases/) based on latitude and longitude of each point on the boundary.
Wave boundary conditionFigure 8 shows the wave rose for
significant wave height from NOAA Buoy Station 44009 (shown in Figure 1) in discrete directional bins indicating the direction, relative to true north, waves are propagating from (e.g. 90o indicates waves propagation from due east). The alternating gray scale indicates sig-nificant wave heights in 1 m increments (0-1 m and 1-2 m etc.) with wave height increasing from the center of the wave rose. Percent occurrence (concentric circles) is calculated from 35,630 hourly measured data in five years from 1994 until 1998. It is evident that the dominant direction that waves propagate from is east-southeast (90o, 120o, and 150o) that generates northward littoral drift on the beach. The method we use here to find dominant wave force, similar to the ap-proach of Hansen et al. (2013), is based on highest probability of occurrence in the wave rose (Figure 8). Six different cases from the wave rose were chosen with the probability of occurrence greater than 5% and sorted in descending order as shown in Table 2. The significant wave height, wave period, and wave direction for each case is calculated as the mean within the corresponding bin and case. The open boundary is forced using these conditions for each of the individual wave cases.
RESULTS OF NUMERICAL SIMULATION
Results of wave casesSix wave cases with the probability of
occurrence more than 5% (Table 2) are applied individually at the open boundar-ies. Each model is run for 16 days of real time to include the effect of spring tide on nearshore circulation patterns. Note that the results that are shown here are focused on the downdrift beach (at the north of the inlet) and on the area of 500

Shore & Beach Vol. 82, No. 1 Winter 2014Page 38
Figure 13. Significant wave height (a), wave
period (b), and wave direction (c)
for a time period surrounding the
event of Hurricane Felix, August 1995
from the day of 14 to 21. The bold black lines show
the computational period of the model. Shore normal angel
is represented by gray line in panel c.
Table 2.Wave characteristics and probability of occurrence from 1994 to 1998 based on data from NOAA Buoy Station 44009.
Case number Hs (m) T (s) Ѳ(o) Probability (%)1 0.68 8.79 120.46 13.262 0.72 7.09 149.25 9.833 0.71 9.69 91.32 9.644 1.42 9.53 89.98 8.515 1.41 8.05 150.55 7.696 1.40 9.37 119.95 5.87
m north of the jetty since the distance be-tween the shoreline and State Route 1 is narrowest in this area. Also, the discharge of the sand bypassing system is placed within this distance along the shoreline.
Figure 9 shows the cross-shore inte-grated sediment transport rate (m3/s) in alongshore (Figure 9a), and cross-shore (Figure 9b) directions within the time period of the second day until the fifth day, for wave case 4 that has the most sig-nificant impact on the beach. The positive and negative values in alongshore direc-tion (Figure 9a) represent the northward and southward sediment transport along the shoreline, respectively. The positive and negative values in the cross-shore direction (Figure 9b) represent the land-ward and seaward sediment transport normal to the shoreline, respectively. The dominant direction of sediment
transport rate (STR) is northward during flood tide as it is evident from the posi-tive values in Figure 9a since there is no major southward mechanism (e.g. ebb flow from Delaware Bay) to reduce the northward wave-driven STR. During the ebb tide, the ebb flow of Delaware Bay counters the direction of alongshore STR that reaches its maximum value within 100 m north of the inlet centerline (on the x-axis). Cross-shore STR plays an impor-tant role in sediment movement within 150 m north of the inlet and exceeds the value of 0.02 m3/s and -0.02 m3/s during the flood tide and ebb tide, respectively. During the ebb tide, vortex flow at the in-let mouth enhances the seaward (negative in Figure 9b) cross-shore transport rate.
The gradient of sediment transport rate m3/(m2s) is shown in Figure 10 at 4 dif-ferent times throughout a tidal cycle after
74 hrs of simulation. The values in the figure represent (∂Q_x)/∂x+(∂Q_y)/∂y where Qx and Qy are STR in the cross-shore (x) and alongshore (y) directions, respectively. The units of m3/(m2s) rep-resent the volume of erosion or accretion per unit time per unit area of the bed. Negative and positive gradients represent accretion and erosion, respectively. The downdrift beach erodes adjacent to the shoreline within 500 m north of the inlet centerline except at the point of 80 m. The possible accretionary areas throughout the tidal cycle are seaward of the reces-sionary areas along the shoreline. The maximum erosion and deposition occur near the jetty and during the maximum flood (Figure 10b) and maximum ebb (Figure 10d). The pattern of bed evolu-tion is complicated in this area due to high turbulence under complex hydrodynamic conditions.
The mean of cross-shore integrated STR (m3/s) is taken over 500 m north of the jetty in alongshore (Figure 11) and cross-shore (Figure 12) directions for the six wave cases (given in Table 2). Mean STR for cases 1, 2, 3 and cases 4, 5, 6 are shown in Figure 11a, 12a and 11b, 12b, respectively. The greater STR occurs in the cases that are approaching the shore-line at an angle closer to 90o with respect to true north with larger wave height. This may seem counterintuitive. However,
Shore & Beach Vol. 82, No. 1 Winter 2014 Page 39
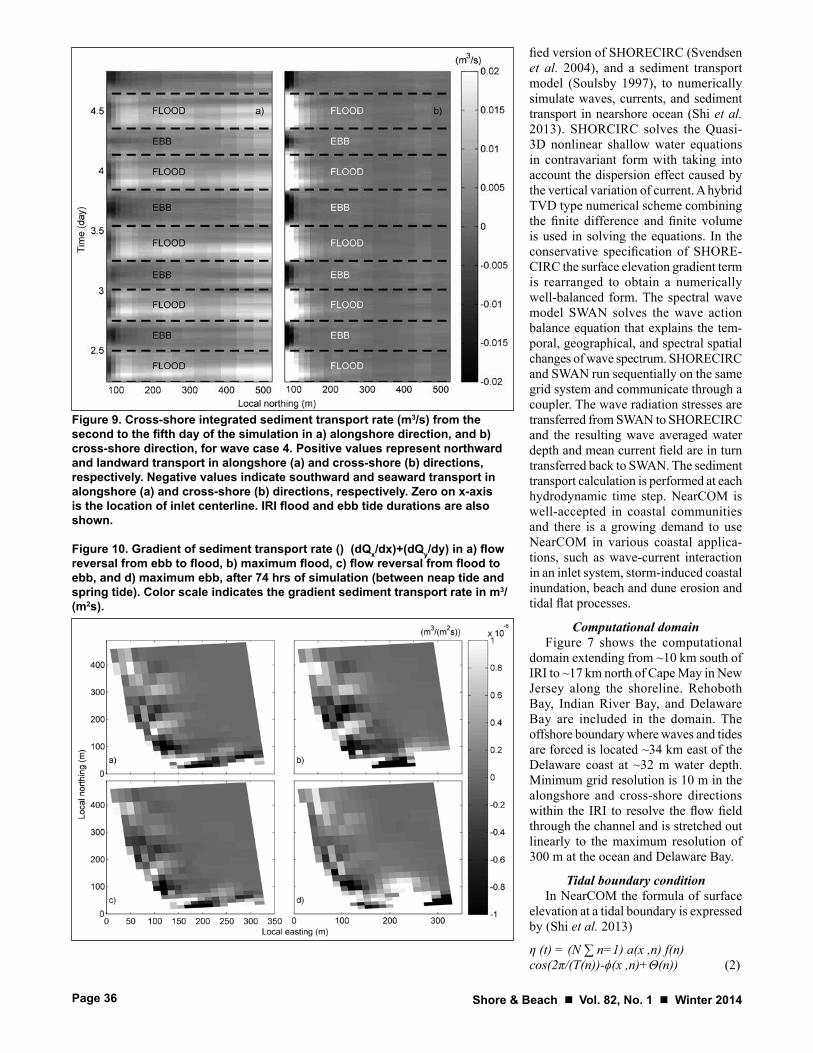
Figure 14. Cross-shore integrated sediment transport rate (m3/s) in a) alongshore direction, and b) cross-shore direction.
waves with an offshore angle closer to 90o maintain a larger wave height due to decreased refraction over the ebb shoal as compared to waves arriving from the southeast. The effect on the downdrift shoreline of the latter waves is also reduced via sheltering provided by the jetties. Surprisingly, the result of wave case 3 with Hs = 0.70 m and Ѳ = 91.32o shows higher STR than that of wave case 5 with Hs=1.41 m but Ѳ=150.55o. The highest STR throughout the 15 days is associated with wave case 4 (Hs=1.42 m; Ѳ=89.98o). The mean value of STR (m3/year) for all wave cases are represented in Table 3.
There are two reasonable sediment transport patterns that lead to sediment loss at the downdrift beach near the jetty. The first one is to have negative cross-shore (offshore) and alongshore (south) STR at the same time causing sediment to be moved towards and into the inlet. The second would have positive cross-shore (onshore) STR along with positive (north) alongshore STR transporting sand north along the coast. The correlation between alongshore STR (Figure 11) and cross-shore STR (Figure 12) reveals the possibility of sediment loss for each wave case. Table 4 represent the correlation between alongshore and cross-shore STR averaged over 500 m north of the jetty with zero lag. Highly correlated mean cross-shore and alongshore STR (84% for case 3 and 5; 94% for case 4 and 6) confirms the potential types of sediment loss patterns at IRI (and potentially for other inlet-adjacent areas). Therefore, the values in Table 3 represent the sediment loss from the downdrift beach for wave cases 3 to 6. The inlet-adjacent STR at the downdrift beach varies from 15,900 m3/year to 157,200 m3/year in the northward alongshore direction and from 32,600 m3/year to 191,800 m3/year in the landward cross-shore direction.
Results of Hurricane FelixHurricane Felix occurred in 14-21
August 1995. We simulate this event here to include one of the severe con-ditions that has affected the Delaware coast. Delaware beaches experienced large waves in this time period that led to beach erosion. Figure 13 shows the wave height (Figure 13a), wave period (Figure 13b), and wave direction (Figure 13c) within the time period surrounding this event. The duration of the hurricane is represented by the two bold lines. The
gray lines shown in Figure 13a separate the months and in Figure 13c represents the shore normal direction. The gener-ated wave height slightly exceeds 4 m, the wave period extends from 8 s to 16 s during the peak wave height, and wave direction varies from 70o to 140o (greater than 90o during peak wave height).
Figure 14 represents the cross-shore integrated alongshore (Figure 14a) and cross-shore (Figure 14b) STR (m3/s). The large alongshore STR (0.2 m3/s) significantly affects the beach from the location 300 m north of the inlet center-
line (on x-axis) to the north within the period of 16-21 August (y-axis). Also, the high positive values of cross-shore STR are observed near the jetty (Figure 15b) and reaches 0.2 m3/s from 19th to 21st. Figure 15 shows the mean of cross-shore integrated alongshore (Figure 15a) and cross-shore (Figure 15b) STR over 500 m north of the jetty. Landward cross-shore and northward alongshore STR indicate that sediments have been transported to the north along the shoreline during this event except within 100 m north of the jetty in which the direction of longshore STR changes toward south (transport of sediments into the inlet). Taking the inte-gral of STR gradient within 500 m north of the jetty and during the event yields 72,800 m3 of sediment loss within 500 m north of the jetty during Hurricane Felix.
CONCLUSIONSThe morphological evolution in
response to the sand-bypassing system and the pattern of sediment transport at the downdrift beach of Indian River Inlet are investigated. As evident from the shoreline offset, the net littoral drift is northward that leads to downdrift ero-sion. Beach profile data from 1991 until 2008 are analyzed by the EOF technique.
Table 3.Mean net sediment transport rate (m3/year) in alongshore (Qy) and cross-shore (Qx) directions over 500 m local northing.
Case Qy Qxnumber (m3/year) (m3/year)1 -3,400 -7,1002 -900 -1,9003 20,900 40,2004 157,200 191,8005 15,900 32,6006 94,700 121,800
Shore & Beach Vol. 82, No. 1 Winter 2014Page 40
Table 4.Table 4. Correlation between the mean alongshore and cross-shore STR over 500 m local northing with zero time lag.
Casenumber r2 (%) 1 58 2 -11 3 84 4 94 5 84 6 94
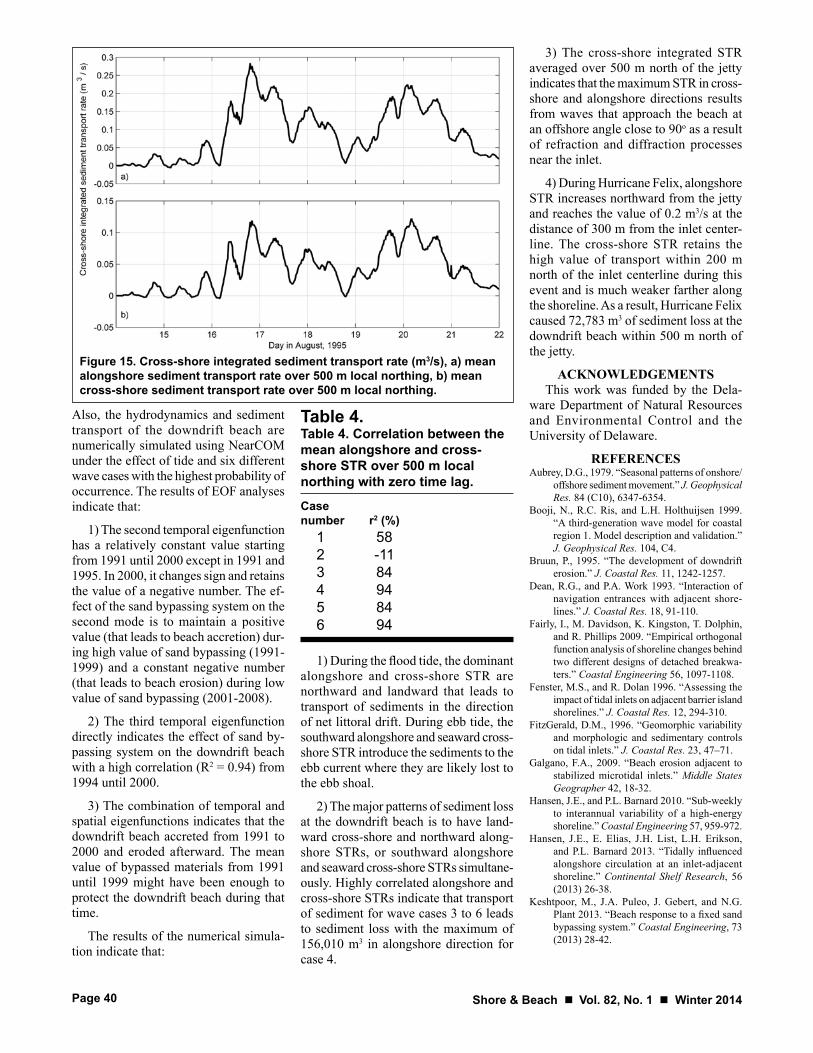
Figure 15. Cross-shore integrated sediment transport rate (m3/s), a) mean alongshore sediment transport rate over 500 m local northing, b) mean cross-shore sediment transport rate over 500 m local northing.
Also, the hydrodynamics and sediment transport of the downdrift beach are numerically simulated using NearCOM under the effect of tide and six different wave cases with the highest probability of occurrence. The results of EOF analyses indicate that:
1) The second temporal eigenfunction has a relatively constant value starting from 1991 until 2000 except in 1991 and 1995. In 2000, it changes sign and retains the value of a negative number. The ef-fect of the sand bypassing system on the second mode is to maintain a positive value (that leads to beach accretion) dur-ing high value of sand bypassing (1991-1999) and a constant negative number (that leads to beach erosion) during low value of sand bypassing (2001-2008).
2) The third temporal eigenfunction directly indicates the effect of sand by-passing system on the downdrift beach with a high correlation (R2 = 0.94) from 1994 until 2000.
3) The combination of temporal and spatial eigenfunctions indicates that the downdrift beach accreted from 1991 to 2000 and eroded afterward. The mean value of bypassed materials from 1991 until 1999 might have been enough to protect the downdrift beach during that time.
The results of the numerical simula-tion indicate that:
1) During the flood tide, the dominant alongshore and cross-shore STR are northward and landward that leads to transport of sediments in the direction of net littoral drift. During ebb tide, the southward alongshore and seaward cross-shore STR introduce the sediments to the ebb current where they are likely lost to the ebb shoal.
2) The major patterns of sediment loss at the downdrift beach is to have land-ward cross-shore and northward along-shore STRs, or southward alongshore and seaward cross-shore STRs simultane-ously. Highly correlated alongshore and cross-shore STRs indicate that transport of sediment for wave cases 3 to 6 leads to sediment loss with the maximum of 156,010 m3 in alongshore direction for case 4.
3) The cross-shore integrated STR averaged over 500 m north of the jetty indicates that the maximum STR in cross-shore and alongshore directions results from waves that approach the beach at an offshore angle close to 90o as a result of refraction and diffraction processes near the inlet.
4) During Hurricane Felix, alongshore STR increases northward from the jetty and reaches the value of 0.2 m3/s at the distance of 300 m from the inlet center-line. The cross-shore STR retains the high value of transport within 200 m north of the inlet centerline during this event and is much weaker farther along the shoreline. As a result, Hurricane Felix caused 72,783 m3 of sediment loss at the downdrift beach within 500 m north of the jetty.
ACKNOWLEDGEMENTSThis work was funded by the Dela-
ware Department of Natural Resources and Environmental Control and the University of Delaware.
REFERENCESAubrey, D.G., 1979. “Seasonal patterns of onshore/
offshore sediment movement.” J. Geophysical Res. 84 (C10), 6347-6354.
Booji, N., R.C. Ris, and L.H. Holthuijsen 1999. “A third-generation wave model for coastal region 1. Model description and validation.” J. Geophysical Res. 104, C4.
Bruun, P., 1995. “The development of downdrift erosion.” J. Coastal Res. 11, 1242-1257.
Dean, R.G., and P.A. Work 1993. “Interaction of navigation entrances with adjacent shore-lines.” J. Coastal Res. 18, 91-110.
Fairly, I., M. Davidson, K. Kingston, T. Dolphin, and R. Phillips 2009. “Empirical orthogonal function analysis of shoreline changes behind two different designs of detached breakwa-ters.” Coastal Engineering 56, 1097-1108.
Fenster, M.S., and R. Dolan 1996. “Assessing the impact of tidal inlets on adjacent barrier island shorelines.” J. Coastal Res. 12, 294-310.
FitzGerald, D.M., 1996. “Geomorphic variability and morphologic and sedimentary controls on tidal inlets.” J. Coastal Res. 23, 47–71.
Galgano, F.A., 2009. “Beach erosion adjacent to stabilized microtidal inlets.” Middle States Geographer 42, 18-32.
Hansen, J.E., and P.L. Barnard 2010. “Sub-weekly to interannual variability of a high-energy shoreline.” Coastal Engineering 57, 959-972.
Hansen, J.E., E. Elias, J.H. List, L.H. Erikson, and P.L. Barnard 2013. “Tidally influenced alongshore circulation at an inlet-adjacent shoreline.” Continental Shelf Research, 56 (2013) 26-38.
Keshtpoor, M., J.A. Puleo, J. Gebert, and N.G. Plant 2013. “Beach response to a fixed sand bypassing system.” Coastal Engineering, 73 (2013) 28-42.

Shore & Beach Vol. 82, No. 1 Winter 2014 Page 41
Komar, P.D., and D.L. Inman 1970. “Longshore sand transport on beaches.” J. Geophysical Res. 75, 5914-5927.
Lanan, G.A., and R.A. Dalrymple 1977. A Coastal Engineering Study of Indian River Inlet, Delaware. University of Delaware, 227 p.
Longuet-Higgins, M.S., 1970. “Longshore currents generated by obliquely incident sea waves 1.” J. Geophysical Res. 75, 6790-6801.
Mann, D.W., and R.A. Dalrymple 1986. “A quan-titative approach to Delaware’s nodal point.” Shore & Beach 54(2), 13-16.
Miller, J.K., and R.G. Dean 2007a. “Shoreline variability via empirical orthogonal function analysis: Part I temporal and spatial charac-teristics.” Coastal Engineering 54, 111-131.
Miller, J.K., and R.G. Dean 2007b. “Shoreline variability via empirical orthogonal function analysis: Part II relationship to nearshore con-ditions.” Coastal Engineering 54, 133-150.
Plant, N.G., and G.B. Griggs 1992. “Interactions between nearshore processes and beach morphology near a seawall.” J. Coastal Res. 8(1), 183-200.
Plant, N., K.T. Holland, and J.A. Puleo 2002. “Analysis of the scale of errors in nearshore bathymetric interpolation.” Marine Geology 191, 71-86.
Puleo, J.A., 2010. “Estimating alongshore sediment transport and the nodal point location on the Delaware-Maryland coast.” J. of Waterway, Port, Coastal, and Ocean Engineering 136, 135-144.
Shi, F., J.T. Kirby, T.-J. Hsu, J. Chen, and R. Mieras 2013. “A hybrid TVD solver for nearshore community model documentation and user’s manual.” Research Report NO. CACR-13-06, Center for Applied Coastal Research, University of Delaware.
Soulsby, R.L., 1997. Dynamics of Marine Sands, Thomas Telford Publications, London.
Svendsen, I.A., K.A. Haas, and Q. Zhao 2004. “Quasi-3D Nearshore Circulation Model SHORECIRC: Version 2.0.” Research Re-port, Center for Applied Coastal Research, University of Delaware.
Thornton, E.B., and R.T. Guza 1986. “Surf zone longshore currents and random waves: field data and models.” J. Physical Oceanography 16, 1165-1178.
USACE 1984. Atlantic Coast of Delaware: General Design Memorandum and Environmental Assessment. U.S. Army Corps of Engineers, Philadelphia District, Philadelphia, PA, 75 p.
USACE 1996. Rehoboth Beach/Dewey Beach Interim Feasibility Study: Final Feasibil-ity Report and Final Environmental Impact Statement. U.S. Army Corps of Engineers, Philadelphia District, Philadelphia, PA, 146 p.
Weggel, J.R., and S.L. Douglass 1986. Synthetic generation of longshore sand transport data and simulation of sand bypassing at Indian River Inlet, Delaware. Drexel University, Hydraulics and Hydrology Lab, Report 86-1.
Winant, C.D., D.L. Inman, and C.E. Nordstrom, 1975. “Description of seasonal beach changes using empirical eigenfunctions.” J. Geophysi-cal Res. 80 (15), 1979-1986.
Government membership: Up to 25,000 population: $500 per year 25,001-100,000 population: $750 per year 100,001-200,000 population: $825 per year Over 200,000 population: $1,000 per year(5 quarterly copies of “Shore & Beach” and 5 monthly e-newsletters, plus additional benefits)
International Membership: Individual membership: $125 per year (1 quarterly copy of “Shore & Beach” and 1 monthly e-newsletter).
Student membership: $50 per year(1 quarterly copy of “Shore & Beach” and 1 monthly e-newsletter, two-year maximum)
Library membership: $150 per year (1 quarterly copy of “Shore & Beach”)
Any additional donation goes toward our educational and informational efforts, and is greatly appreciated.
Fill out this form and fax it to (239) 362-9771 or mail it toASBPA, 5460 Beaujolais Lane, Fort Myers, FL 33919-2704.
Within the United States: Corporate membership: $1,000 per year (5 quarterly copies of “Shore & Beach” and 5 monthly e-newsletters; additional recognition benefits)
Regular membership: $100 per year (1 quarterly copy of “Shore & Beach” and 1 monthly e-newsletter)
Individual corporate/association membership: $250 per year (1 quarterly copy of “Shore & Beach” and 1 monthly e-newsletter, additional recognition benefits)
Library membership: $100 per year (1 quarterly copy of “Shore & Beach”)
Young Professional membership: $50 per year(1 quarterly copy of “Shore & Beach” and 1 monthly e-newsletter, two-year maximum post-graduation)
Student membership: $25 per year(1 quarterly copy of “Shore & Beach” and 1 monthly e-newsletter)
2014 ASBPA MEMBERSHIP APPLICATIONName _______________________________________________________________________
Company or organization ________________________________________________________
Address ______________________________________________________________________
City _____________________________________________________ State ______________
Zip + 4 ____________________________ Country: _________________________________
E-mail address ______________________________________________ (required to receive newsletters)
Phone __________________________________ Fax _________________________________
PAYMENT: A check payable to ASBPA for $___________ (U.S. funds) is enclosed for my annual dues. Please charge my credit card: Visa MasterCard American ExpressPRINT CLEARLYCard no. _______________________________________________ Exp. date ______________
V-code ________________________ (last three digits on signature panel)
Cardholder’s name _____________________________________________________________
— MEMBERSHIPS AND DUES —
The ASBPA 2014 National Coastal Conference
is coming to Virginia Beach, VA
Tuesday-Friday, Oct. 14-17
at the Sheraton Oceanfront
Want to present?Deadline for abstracts is May 19.
Want to be a sponsor?Opportunities online at www.asbpa.org.
Want to register?Online registration opens early May.
All the details will be at www.asbpa.org
SAVE THE
DATE!