Embed Size (px)
Citation preview

Delaware State Judiciary Pension Plan
Actuarial Valuation as of June 30, 2021
Produced by Cheiron
January 2022

TABLE OF CONTENTS Section Page Letter of Transmittal ........................................................................................................................ i Foreword ........................................................................................................................................ iii Section I Board Summary .......................................................................................................1 Section II Risk Disclosure ......................................................................................................10 Section III Assets .....................................................................................................................15 Section IV Liabilities ...............................................................................................................18 Section V Contributions..........................................................................................................22 Section VI Accounting Statement Information ........................................................................24 Appendices Appendix A Membership Information .......................................................................................29 Appendix B Actuarial Assumptions and Methods .....................................................................36 Appendix C Summary of Plan Provisions ..................................................................................41

January 20, 2022 Board of Pension Trustees State of Delaware McArdle Building 860 Silver Lake Boulevard, Suite 1 Dover, Delaware 19904 Dear Members of the Board: At your request, we have conducted the annual actuarial valuation of the Delaware State Judiciary Pension Plan (Plan) as of June 30, 2021. The results of this valuation are contained in this report. The purpose of the valuation is discussed in the Foreword. This report contains information on Plan assets and liabilities, as well as analyses combining asset and liability performance and projections. It also discloses State contribution levels and certain required disclosures under the Governmental Accounting Standards Board (GASB) Statement No. 67. In completing the valuation and preparing our report, we relied on information, some oral and some written, supplied by staff of the Office of Pensions. This information includes, but is not limited to, the Plan provisions, employee data, and financial information. We performed an informal examination of the obvious characteristics of the data for reasonableness and consistency in accordance with Actuarial Standard of Practice No. 23. The contribution results of this report are only applicable to the State contribution for Fiscal Year (FY) 2023 and rely on future Plan experience conforming to the underlying assumptions. Future experience may differ significantly from the current experience due to such factors as the following: program experience differing from that anticipated by the assumptions, changes in assumptions, and changes in program provisions or applicable law. This report and its contents have been prepared in accordance with generally recognized and accepted actuarial principles and practices that are consistent with our understanding of the Code of Professional Conduct and applicable Actuarial Standards of Practice set out by the Actuarial Standards Board as well as applicable laws and regulations, including the use of assumptions and methods for funding purposes that comply with the Actuarial Standards of Practice. Furthermore, as credentialed actuaries, we meet the Qualification Standards of the American Academy of Actuaries to render the opinions contained in this report. This report does not address any contractual or legal issues. We are not attorneys, and our firm does not provide any legal services or advice.

Board of Pension Trustees January 20, 2022 Page ii
This report was prepared for the Delaware State Judiciary Pension Plan for the purposes described herein and for the use by the Plan’s auditor in completing an audit related to the matters herein. Other users of this valuation report are not intended users as defined in the Actuarial Standards of Practice, and Cheiron assumes no duty or liability to any other user. This report does not contain any adjustments for the potential impact of COVID-19 on either economic or demographic assumptions. We anticipate that the virus may have implications in both the short and long term, but the net impact of these is not determinable at this time. Sincerely, Cheiron Fiona E. Liston, FSA, MAAA, EA Elizabeth Wiley, FSA, FCA, MAAA, EA Principal Consulting Actuary Consulting Actuary

DELAWARE STATE JUDICIARY PENSION PLAN ACTUARIAL VALUATION AS OF JUNE 30, 2021
FOREWORD
iii
Cheiron has performed the annual actuarial valuation of the Delaware State Judiciary Pension Plan (Plan) as of June 30, 2021. The purpose of this report is to: 1) Measure and disclose, as of the valuation date, the financial condition of the Plan, 2) Indicate trends in the financial condition of the Plan, 3) Determine the contribution rate to be paid by the State for Fiscal Year (FY) 2023, and 4) Provide certain accounting statement information. An actuarial valuation establishes and analyzes plan assets and liabilities on a consistent basis and traces the progress of both from one year to the next. It includes measurement of the plan’s investment performance as well as an analysis of liability gains and losses. Section I presents a summary containing our findings and disclosing important trends experienced by the Plan in recent years. Section II reviews the primary risks facing the Plan and quantifies these using various risk and maturity measures. Section III contains details on various asset measures, together with pertinent performance measurements. Section IV shows similar information on liabilities, measured for actuarial, accounting, and governmental reporting purposes. Section V presents the FY 2023 actuarially determined contribution. Section VI includes certain required disclosures under Governmental Accounting Standards Board (GASB) Statement No. 67 and items recommended by the Government Finance Officers Association (GFOA). The appendices to this report contain a summary of the Plan’s membership at the valuation date, a summary of the major provisions of the Plan, and a summary of the actuarial methods and assumptions used in the valuation. The actuarial assumptions reflect our understanding of the likely future experience of the Plan, and the assumptions individually and as a whole represent our best estimate for the future experience of the Plan. The results of this report rely on future Plan experience conforming to the underlying assumptions and methods outlined in this report. To the extent that the actual Plan experience deviates from the underlying assumptions and methods, or there are any changes in Plan provisions, the true cost of the Plan will vary from our results.

DELAWARE STATE JUDICIARY PENSION PLAN ACTUARIAL VALUATION AS OF JUNE 30, 2021
SECTION I – BOARD SUMMARY
1
General Comments The actuarially determined contribution (ADC) rate was calculated to decrease from 18.21% for FY 2022 to 11.22% for FY 2023. During the year ended June 30, 2021, the Plan’s assets earned 37.84% on a market value basis. However, due to the Plan’s asset smoothing method, which recognizes portions of investment gains and losses over time, the return on an actuarial value basis was less at 13.44%. Although less than the return on a market value basis, this return was more than the assumed investment rate of return of 7.0% for the prior year, resulting in an actuarial gain on investments of $5.7 million. The Plan experienced a moderate actuarial loss on Plan liabilities resulting from salary increases different from those assumed and members retiring, terminating, becoming disabled, and dying at rates different from the actuarial assumptions. This liability loss increased the actuarial liability by $0.5 million. This type of relatively small gain or loss is normal in the course of Plan experience, as we cannot predict exactly how people will behave. In addition to the actuarial loss, the Plan’s liabilities also increased by $0.3 million due to changes in assumptions as recommended in an experience study performed in 2021. There was also an increase in the liability of $0.3 million due to a staggered benefit increase for those who retired before July 1, 2016. Retired Judicial participants and beneficiaries with a date of retirement before July 1, 2016 were eligible for an increase in pension of between 1% and 3% of their benefit depending on their date of retirement. Anticipated FY 2022 benefit payments were also increased to reflect an expected $30 thousand in one-time retiree benefits to be paid in November 2021 that will be reimbursed by the State. This one-time payment has no impact on the State’s ongoing contribution requirement. This valuation report also contains certain information to be reported in the June 30, 2021 Annual Comprehensive Financial Report (ACFR) of the Delaware Public Employees’ Retirement System (Delaware PERS) under GASB Statement No. 67, as well as additional disclosure information recommended by the Government Finance Officers Association (GFOA). The GASB disclosures are based on the use of updated procedures to roll forward the 2020 actuarial valuation liability results. The calculation of net pension liability in Section VI is shown as disclosed for the plan year ending June 30, 2021, based on the 2020 funding actuarial valuation liability results, updated by the roll forward and to reflect the assumption changes adopted by the Board of Trustees as recommended in the recent experience study. We also present a projection of the June 30, 2022 disclosure in Section VI, assuming all actuarial assumptions are exactly met over the coming year, which is based on the 2021 funding actuarial valuation liability results. As of the June 30, 2021 funding actuarial valuation, the Plan reported a net surplus, equivalent to a negative unfunded actuarial liability, of $11.9 million. This is an increase from the $7.6 million surplus for the prior year.
DELAWARE STATE JUDICIARY PENSION PLAN ACTUARIAL VALUATION AS OF JUNE 30, 2021
SECTION I – BOARD SUMMARY
2
Trends Asset Returns The graph below shows measurements of the Plan’s assets over the last 20 years based on both market values and actuarial values. The green bars represent the market value measurements, while the blue line shows the smoothed actuarial value measurements. The black labels above the blue line are the actuarial value of asset measurements as of the valuation date for each year in millions of dollars.
29 3133 35 38
43 47 49 5256
59 6470
75 7780 84 87
90
99
$0
$20
$40
$60
$80
$100
$120
$140
Mill
ion
s
June 30,
Market Value of Assets (MVA) Actuarial Value of Assets (AVA)
The market value of assets (MVA) returned 37.8% over the last year. The determination of the Plan’s actuarial value of assets (AVA) for the current year reflects a portion of the return above the 7.0% assumed for the prior year, and continued recognition of prior years’ gains and losses, with the combined effect of returning 13.4% over FY 2021. Over the period of July 1, 2002 to June 30, 2021, the Plan’s assets, measured using the actuarial value of asset measurements, returned a compound 9.0%, compared to the current valuation assumption of 7.0%. On a market value of assets basis, the Plan returned 7.4% over the same period.
DELAWARE STATE JUDICIARY PENSION PLAN ACTUARIAL VALUATION AS OF JUNE 30, 2021
SECTION I – BOARD SUMMARY
3
Assets and Liabilities
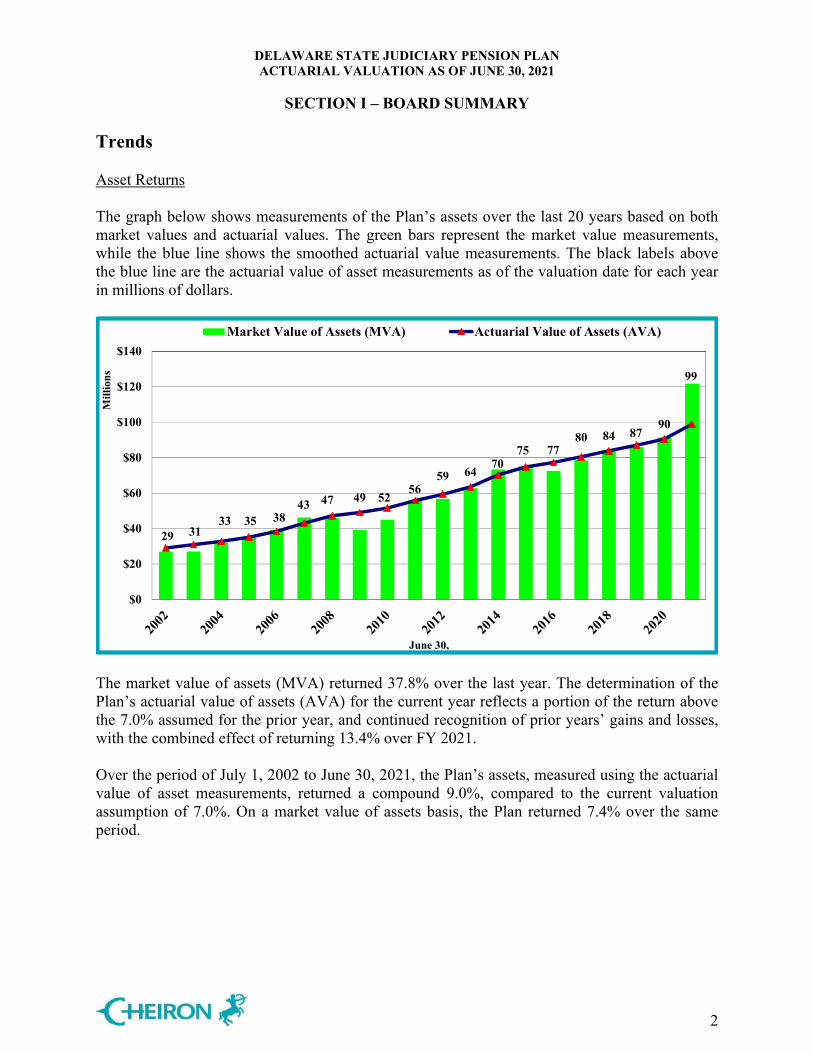
The three colored bars below represent the three different measures of liability discussed in this report. The first measure is given by the yellow bars, the present value of accrued benefits (PVAB). The PVAB values represent the value of all benefits earned by current members through the valuation date. These values do not reflect any future additional service or salary increases for current members beyond the valuation dates.
The second liability measure shown is the one currently used for the Plan’s funding target, the actuarial liability (AL). These target amounts are represented by the top of the gray bars. This measurement is also the basis of the liability measure used in GASB 67. The funded ratios reported by the Plan are the percentages shown above the bars and are developed by comparing these target measurements of liability to the actuarial value of assets at each valuation date.
The amount represented by the top of the pink bars, the present value of future benefits (PVB), is the amount needed as of each valuation date to provide all benefits for the current members and their beneficiaries, including reflection of assumed future service and pay increases. If the Plan had an actuarial value of assets equal to the PVB as of a certain date, no additional contributions would, in theory, be needed to pay the benefits of the current members if all assumptions were exactly met from that point forward.
$0
$20
$40
$60
$80
$100
$120
$140
Mil
lion
s
June 30,
PVAB AL PVB AVA MVA
Funded ratios are as a percentage of MVA, and values would be different if presented as percentage of AVA.
DELAWARE STATE JUDICIARY PENSION PLAN ACTUARIAL VALUATION AS OF JUNE 30, 2021
SECTION I – BOARD SUMMARY
4
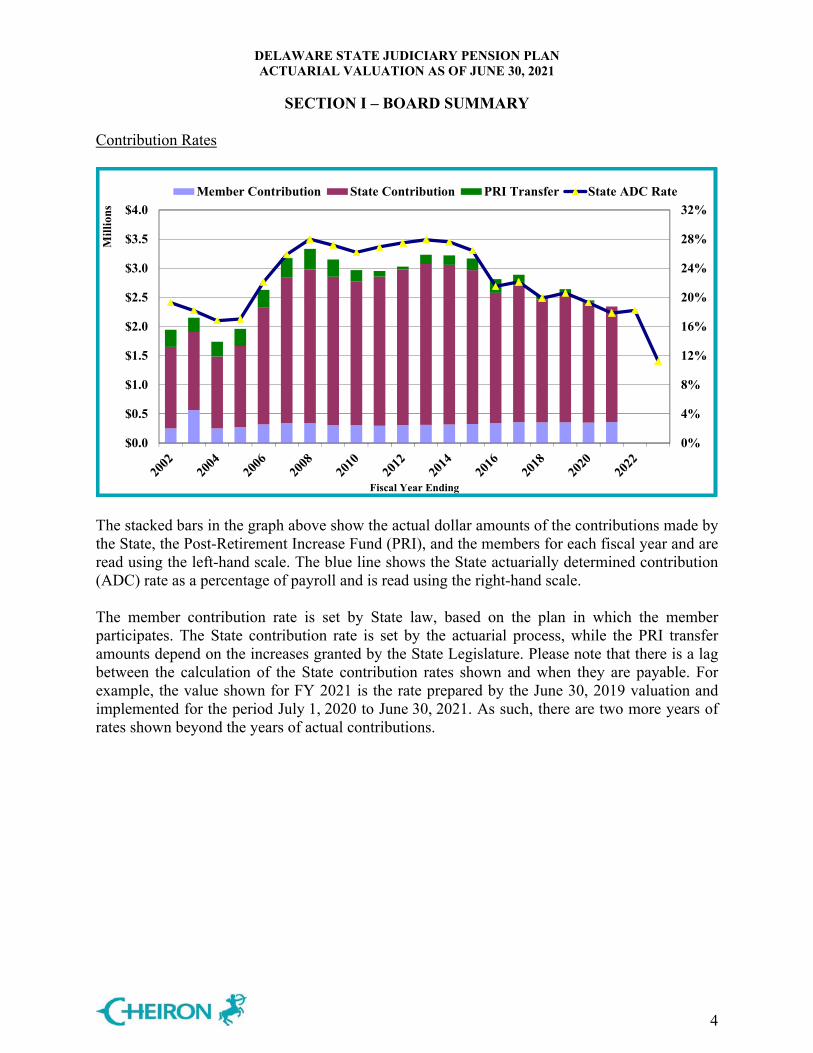
Contribution Rates
0%
4%
8%
12%
16%
20%
24%
28%
32%
$0.0
$0.5
$1.0
$1.5
$2.0
$2.5
$3.0
$3.5
$4.0
Mil
lion
s
Fiscal Year Ending
Member Contribution State Contribution PRI Transfer State ADC Rate
The stacked bars in the graph above show the actual dollar amounts of the contributions made by the State, the Post-Retirement Increase Fund (PRI), and the members for each fiscal year and are read using the left-hand scale. The blue line shows the State actuarially determined contribution (ADC) rate as a percentage of payroll and is read using the right-hand scale. The member contribution rate is set by State law, based on the plan in which the member participates. The State contribution rate is set by the actuarial process, while the PRI transfer amounts depend on the increases granted by the State Legislature. Please note that there is a lag between the calculation of the State contribution rates shown and when they are payable. For example, the value shown for FY 2021 is the rate prepared by the June 30, 2019 valuation and implemented for the period July 1, 2020 to June 30, 2021. As such, there are two more years of rates shown beyond the years of actual contributions.

DELAWARE STATE JUDICIARY PENSION PLAN ACTUARIAL VALUATION AS OF JUNE 30, 2021
SECTION I – BOARD SUMMARY
5
Participant Trends The bars below show the number of members as of each valuation date, divided between active members, terminated vested members, and retirees/beneficiaries. These bars are read using the left-hand scale. As with most maturing plans, this plan continues to show growth in the number of inactive members. The numbers that appear above each bar represent the ratio of active members to inactive members (retirees, beneficiaries, and terminated vested members) at each valuation date. The active-to-inactive ratio has decreased from 1.3 actives for each inactive in 2002 to 0.9 actives for each inactive in 2021. The black line shows the covered payroll for the Plan as of each valuation date and is read using the right-hand scale.
$0
$2
$4
$6
$8
$10
$12
$14
0
20
40
60
80
100
120
140
Pay
roll
in M
illio
nsJune 30,
Actives Terminated Vesteds In-Pay Members Payroll

DELAWARE STATE JUDICIARY PENSION PLAN ACTUARIAL VALUATION AS OF JUNE 30, 2021
SECTION I – BOARD SUMMARY
6
Future Outlook Baseline Projections
These graphs show the expected progress of the Plan over the next 10 years, assuming the Plan’s assets earn 7.0% on a market value basis and assuming all other assumptions are exactly met, including that the actuarially determined contribution (ADC) amounts are made in full. The chart entitled “Plan Funding” shows the projected State ADC rate steadily declines to 0.0% by FYE 2029, absent further gains or losses.
The “Assets and Liabilities” graph shows the projected funded ratios for the Plan over the 10-year projection period. The Plan’s funded status is projected to increase from 114% to 137% over the 10-year projection period, assuming all assumptions are exactly met. Both the increase in the Plan’s funded status and the sharp decrease in contribution rate are due to continued recognition of the FY 2021 investment performance.
Funded ratios are as a percentage of AVA, and values would be different if presented as percentage of MVA.
18.2%
11.2%
7.6%
5.0%
2.9%
1.4%0.2% 0.0% 0.0% 0.0% 0.0%
0%
2%
4%
6%
8%
10%
12%
14%
16%
18%
20%
FY22 FY23 FY24 FY25 FY26 FY27 FY28 FY29 FY30 FY31 2033
Plan Funding
Employer Contribution Rate
114%
120% 124% 128%131%
133% 134% 136% 136%137% 137%
$0
$20
$40
$60
$80
$100
$120
$140
$160
$180
$200
$220
2021 2022 2023 2024 2025 2026 2027 2028 2029 2030 2031
Mil
lio
ns
Mil
lion
s
Fiscal Year Ending
Assets and Liabilities
PVAB AL PVB AVA MVA

DELAWARE STATE JUDICIARY PENSION PLAN ACTUARIAL VALUATION AS OF JUNE 30, 2021
SECTION I – BOARD SUMMARY
7
Projections with Asset Returns of 8.0%
The Plan’s investment earnings will affect the future funding status of the Plan. The two graphs on this page show what the next 10 years are expected to look like if the Plan’s investment performance is 8.0% each year, 1.0% higher than the valuation investment rate of return assumption. These two graphs assume all other assumptions are exactly met, including State contributions made equal to the full actuarially determined amounts.
The “Plan Funding” graph shows that under this scenario, the State ADC rate would decrease more rapidly than in the baseline case. The rate declines to 0.0% of payroll by FYE 2027, two years earlier than the baseline scenario. The “Assets and Liabilities” graph shows that under this scenario, the Plan would reach a 149% funded ratio by 2031, an improvement over the baseline scenario’s ultimate level of 137%. With on-going investment gains, the Market Value continues to be higher than the Actuarial Value of Assets.
Funded ratios are as a percentage of AVA, and values would be different if presented as percentage of MVA.
18.2%
11.2%
7.5%
4.5%
2.0%
0.0% 0.0% 0.0% 0.0% 0.0% 0.0%0%
2%
4%
6%
8%
10%
12%
14%
16%
18%
20%
FY22 FY23 FY24 FY25 FY26 FY27 FY28 FY29 FY30 FY31 2033
Plan Funding
Employer Contribution Rate
114%
120% 125% 129%133%
136%139%
142% 144%146%
149%
$0
$20
$40
$60
$80
$100
$120
$140
$160
$180
$200
$220
2021 2022 2023 2024 2025 2026 2027 2028 2029 2030 2031
Mil
lio
ns
Mil
lion
s
Fiscal Year Ending
Assets and Liabilities
PVAB AL PVB AVA MVA

DELAWARE STATE JUDICIARY PENSION PLAN ACTUARIAL VALUATION AS OF JUNE 30, 2021
SECTION I – BOARD SUMMARY
8
114%
119% 123% 126% 128% 130% 130% 130% 130% 129% 128%
$0
$20
$40
$60
$80
$100
$120
$140
$160
$180
$200
$220
2021 2022 2023 2024 2025 2026 2027 2028 2029 2030 2031
Mil
lio
ns
Mil
lion
s
Fiscal Year Ending
Assets and Liabilities
PVAB AL PVB AVA MVA
Projections with Asset Returns of 6.0%
The graphs on this page show projections of the Plan’s funding status and contributions assuming that the Plan’s investment performance is 6.0% each year of the projection, 1.0% lower than the valuation investment rate of return assumption. Note that these projections assume all other assumptions are exactly met, including payment of State contributions made equal to the full actuarially determined contribution.
Under this scenario, the State ADC decreases at a rate slower than the baseline scenario, and then slightly increases to approximately 3.0% of payroll by the end of the 10-year projection period, greater than the 0.0% ultimate rate in the baseline scenario. Additionally, the funded ratio is projected to be lower in this scenario, reaching 128% at the end of the 10-year projection period, compared to the 137% ultimate ratio in the baseline scenario. By introducing investment losses, the two measures of asset value come together by 2030 and much of the untapped FY 2021 gains are offset by these projected losses.
Funded ratios are as a percentage of AVA, and values would be different if presented as percentage of MVA.
18.2%
11.2%
7.8%
5.4%
3.8%2.8% 2.2% 2.0% 2.1% 2.5% 3.0%
0%
2%
4%
6%
8%
10%
12%
14%
16%
18%
20%
FY22 FY23 FY24 FY25 FY26 FY27 FY28 FY29 FY30 FY31 2033
Plan Funding
Employer Contribution Rate

DELAWARE STATE JUDICIARY PENSION PLAN ACTUARIAL VALUATION AS OF JUNE 30, 2021
SECTION I – BOARD SUMMARY
9
Table I-1 Summary of Principal Plan Results
Valuation as of:
June 30, 2020 June 30, 2021 % Change
Member Counts Active Members 58 59 1.72% Disabled Members 0 0 N/ARetirees and Beneficiaries 56 60 7.14% Terminated Vested Members 2 3 50.00% Terminated Non-Vested Members 0 0 N/ATotal Member Counts 116 122 5.17%
Covered Payroll of Active Members* $ 11,012,100 $ 10,794,200 (1.98)%
Annual Benefit Payments for Retirees, Disabled Members, and Beneficiaries $ 5,511,900 $ 6,160,500 11.77% Assets and Liabilities Actuarial Liability (AL) $ 82,807,200 $ 86,922,400 4.97% Actuarial Value of Assets (AVA) 90,415,900 98,822,800 9.30% Unfunded AL (UAL) $ (7,608,700) $ (11,900,400) (56.41)%Funded Ratio on AVA Basis (AVA/AL) 109.2% 113.7% Funded Ratio on MVA Basis (MVA/AL) 110.3% 140.0%
Present Value of Accrued Benefits (PVAB) $ 82,469,300 $ 84,470,000 2.43% Market Value of Assets (MVA) 91,304,700 121,655,200 33.24% Unfunded PVAB $ (8,835,400) $ (37,185,200) (320.87)%Accrued Benefit Funded Ratio (MVA/PVAB)
110.7%
144.0%
State Contribution Rate Fiscal Year 2022 Fiscal Year 2023 Entry Age Normal Cost 23.32% 19.62% UAL Amortization Payment (5.21)% (8.55%) Administrative Expense 0.10% 0.15% Actuarially Determined Contribution (ADC) 18.21% 11.22% * Assumes one year of payroll increase projection, so represents payroll beginning on each valuation date.

DELAWARE STATE JUDICIARY PENSION PLAN ACTUARIAL VALUATION AS OF JUNE 30, 2021
SECTION II – RISK DISCLOSURE
10
Introduction The Plan’s actuarial valuation results are dependent on assumptions about future economic and demographic experience. Based on actuarial standards of practice, the assumptions represent a reasonable estimate for future experience. However, actual future experience will never conform exactly to the assumptions and may differ significantly from the assumptions. This deviation is the risk that pension plan sponsors undertake in relying on a pension plan’s actuarial valuation results. This section of this report is intended to identify the primary drivers of these risks, provide background information and assessments about these identified risks, and communicate the significance of these risks to this plan. Historical Experience For this plan, the two primary measurements where there is risk that the actual measurements will significantly differ from the expected future measurements are in the measurements of the liabilities of the Plan and the resulting calculation of the actuarially determined contributions. Therefore, while future experience will not be the same as past experience, it is useful to look at what factors have contributed to the actual liability measurements at each valuation date deviating from that which was predicted by the prior year’s valuation. The following graph shows the gains/(losses) for each valuation date between the actual liability measurement and the expected liability broken down by cause.
($3)
($2)
($1)
$0
$1
$2
$3
$4
$5
$6
$7
2007 2009 2011 2013 2015 2017 2019 2021
in M
illi
ons
Judiciary Plan Gain/(Loss) History
Asset Gain/(Loss) Liability Gain/(Loss) Assumption and Method Changes
PRI Liability Increases Plan Changes Net Gain/(Loss)

DELAWARE STATE JUDICIARY PENSION PLAN ACTUARIAL VALUATION AS OF JUNE 30, 2021
SECTION II – RISK DISCLOSURE
11
This shows that, up until this past year, the liability gain/(loss) has been the most significant risk for the Plan over this period in regard to the actual liability measurements deviating from the expected. After that, the next two most significant causes are the asset gain/(loss) and increases in liability from the PRI increases. Over the whole period, the liability gain/(loss) has had the greatest cumulative impact on the liability. Risk Identification Considering the specific characteristics of the Plan, the assumptions and methods used in the actuarial valuations for the Plan, and the recent history, we have identified the risks that we think are the most significant in terms of possibly leading to actual values of the measurements deviating from those expected by the valuation process, as follows:
Investment risk, Longevity and other demographic risk, and Assumption change risk.
While we have identified these risks as potentially significant in regard to actual measurements deviating from expected, it is possible that there are other risks that we have not identified that will turn out to be significant. For example, while it is possible that the State could start paying contributions other than the actuarially determined contributions and the measurements thus differ as a result of contribution risk, we have not included contribution risk above, as this Plan has consistently received contributions equal to what is assumed in the valuation process. Investment Risk is the potential for investment returns to be different than anticipated. In the case of this plan, that is the risk that the returns on assets will be materially different from the 7.0% that is currently assumed. If actual investment returns are lower than anticipated by the assumptions used in the actuarial valuation, this will increase the unfunded liability measurements and require higher contributions in the future than if the actual returns equaled the assumed returns. On the other hand, if the actual returns are higher than the assumptions, the resulting unfunded liability measurements and actuarially determined contributions will be lower than anticipated. As seen in the historical section, this has been a significant driver of deviations in the actual measurements from those expected by the valuations. Longevity and Other Demographic Risk is the potential for mortality or other demographic experience to be different than expected. Generally, longevity and other demographic risks emerge slowly over time as the actual experience deviates from expected and is typically periodically reduced through the Plan’s regular actuarial experience process. As such, these risks are often dwarfed by other risks, particularly those due to the investment returns. However, for small plans like this, there are relatively few members and so the behavior of individual members can have significant impact on the liabilities. The historical section shows that this is true for this plan, with the magnitude of the gains and losses from liability experience being of even greater magnitude than those from investment experience.

DELAWARE STATE JUDICIARY PENSION PLAN ACTUARIAL VALUATION AS OF JUNE 30, 2021
SECTION II – RISK DISCLOSURE
12
Assumption Change Risk is the potential for the environment to change such that future valuation assumptions are different than the current assumptions. Causes of these changes include capital market changes resulting in changes in the assumed rates of return, changes in employee behavior and/or plan provisions requiring changes in the demographic assumptions, and similar changes. Assumption change risk is an extension of the risks previously identified, but rather than capturing the risk as it is experienced, it captures the cost of recognizing a change in environment when the current assumption is no longer reasonable. The historical review earlier in this section showed that assumption change risk has been a relatively significant risk for this plan over the recent historical period. The revisions to the assumed rate of return from 8.0% to 7.5% in 2011, from 7.5% to 7.2% in 2014, and from 7.2% to 7.0% in 2017 constitute the majority of the increases to the unfunded measurements from the expected values as a result of assumption changes. Changes to the demographic assumptions to reflect mortality improvements have also had a relatively significant impact as have changes in the methodology of the funding policy throughout the years. The remaining changes to assumptions have had relatively insignificant impacts. It is important to note that these changes simply reflect recognizing changes in the expected values of assumptions. If these revisions had not been made, we would anticipate that these amounts would be gradually recognized in the other risks. If future expectations of assumptions such as interest rates or mortality change further, we anticipate similar amounts will have to be recognized. Plan Maturity Measures The future financial condition of a mature pension plan is more sensitive to each of the risks identified in the previous section than in a less mature plan. Before assessing the risks to the Plan from a forward-looking perspective, it is of value to understand the maturity of the Plan compared to other plans as well as how the Plan’s maturity has changed over time. Plan maturity can be measured in a variety of ways, but they all get at one basic dynamic, the larger the plan is compared to the contribution or revenue base that supports it, the more sensitive the plan will be to risk. There are extensive measures available to assess plan maturity. For this plan, we have examined a number of these and all indicate that the Plan is maturing but is less mature than most of its peers. We have included the most simplistic of these measures as a demonstration of this. The most simplistic measure of the Plan’s maturity is the support ratio, which is the ratio of the number of inactive members (those receiving benefits currently or entitled to a deferred benefit) to the number of active members. The following graph shows the support ratio over time for the Plan versus a universe of other public plans.

DELAWARE STATE JUDICIARY PENSION PLAN ACTUARIAL VALUATION AS OF JUNE 30, 2021
SECTION II – RISK DISCLOSURE
13
The Boston College’s Center for Retirement Research, NASRA, and the Center for State and Local Government Excellence maintain the Public Plans Database that contains the majority of state plans as well as many large municipal plans, covering over 95% of the membership in public plans as well as over 95% of the assets held by public pension plans. The chart that follows shows the support ratio for all plans in this database since 2001. The colored bars represent the central 90% of the support ratios for the plans in the database. The Delaware State Judiciary Pension Plan is represented by the gold diamonds. Note that this chart shows one more year for the System than the universe as the 2021 numbers are not yet available for the database.
0.00
0.50
1.00
1.50
2.00
2.50
200120022003200420052006200720082009201020112012201320142015201620172018201920202021
Support Ratio
5th to 25th Percentile 25th to 50th Percentile 50th to 75th Percentile
75th to 95th Percentile Delaware State Judiciary
Survey Data from Public Plans Database as of 6/28/2021
This graph shows the support ratio for the Plan has generally increased over time. This graph shows that Delaware State Judiciary’s support ratio is slightly lower than a typical plan in the most recent years, indicating that the Plan is less mature. Over the previous decade, the Plan’s ratio has grown at a slower rate than typical plans in this universe; most have increased at a faster rate the last two years. As of the most recent dates for which the full database is available, the Delaware State Judiciary support ratio is between the 25th to 50th percentiles among all plans in the database.

DELAWARE STATE JUDICIARY PENSION PLAN ACTUARIAL VALUATION AS OF JUNE 30, 2021
SECTION II – RISK DISCLOSURE
14
More Detailed Assessment A more detailed assessment is always valuable to enhance the understanding of the risks identified above; however, the value of this must be compared alongside the costs of such an exercise. The costs in this case are both measurable costs as expressed by the actuarial fees for the additional assessment and the cost of staff time required to support the effort, and more intangible costs such as the additional information potentially drowning out the principal findings from the valuation and overwhelming decision makers. Whether or not to have a more detailed risk assessment performed at this time is the Board’s decision, but we do not believe that this additional risk assessment is required at this time based on our understanding of the Board’s priorities. Conclusion The results of this valuation are based on the assumptions and methodology used within the valuation, and to the extent that actual experience deviates from these, the actual future measurements will deviate from those projected by this valuation. The most significant risks related to this are anticipated to be investment risk, mortality and other demographic risk, and assumption change risk.

DELAWARE STATE JUDICIARY PENSION PLAN ACTUARIAL VALUATION AS OF JUNE 30, 2021
SECTION III – ASSETS
15
Pension plan assets play a key role in the financial operation of the Plan and in the decisions that the Board of Trustees may make with respect to future deployment of those assets. The level of assets, the allocation of assets among asset classes, and the methodology used to measure assets will likely affect benefit levels, State actuarially determined contributions, and the ultimate security of members’ benefits. In this section, we present detailed information on the Plan’s assets including: Disclosure of the Plan’s assets at June 30, 2020 and June 30, 2021, Statement of the changes in market values during FY 2021, Development of the actuarial value of assets, An assessment of investment performance, and A projection of the Plan’s expected cash flows for the next 10 years. Market Value of Assets Disclosure The market values of assets represent “snap-shot or cash-out” values that provide the principal basis for measuring financial performance from one year to the next. However, market values can fluctuate widely with swings in the marketplace, and as such, are usually not suitable for budgeting and long-range planning. Table III-1 below shows the market values as of June 30, 2020 and June 30, 2021, along with the changes between the two.
Table III-1 Changes in Market Value of Assets
Market Value of Assets – June 30, 2020 $ 91,304,700
Additions Member Contributions $ 356,800 State Contributions 1,985,100 PRI Transfers - Investment Returns 33,860,100
Total Additions $ 36,202,000
Deductions Benefit Payments $ 5,837,000 Administrative Expenses 14,500
Total Deductions $ 5,851,500
Market Value of Assets – June 30, 2021 $ 121,655,200

DELAWARE STATE JUDICIARY PENSION PLAN ACTUARIAL VALUATION AS OF JUNE 30, 2021
SECTION III – ASSETS
16
Actuarial Value of Assets The actuarial value of assets represents a “smoothed” value developed by the actuary to reduce, or eliminate, erratic results that could develop from short-term fluctuations in the market value of assets. The actuarial value for this plan equals the expected actuarial value of assets, developed from the immediately prior valuation, plus 20% of the difference between the actual market value of assets and the expected actuarial value of assets at the valuation date. The table below illustrates the calculation of the actuarial value of assets as of June 30, 2021.
Table III-2 Development of Actuarial Value of Assets
1. Actuarial Value of Assets at June 30, 2020 $ 90,415,900
2. Amount in (1) with interest to June 30, 2021 at 7.0% per year 96,745,000
3. State, PRI and member contributions for FY 2021 2,341,900
4. Interest on contributions assuming payments made uniformly throughout the year to June 30, 2021 at 7.0% per year
80,600
5. Disbursements from Trust except investment expenses, July 1, 2020 through June 30, 2021
5,851,500
6. Interest on disbursements to June 30, 2021 at 7.0% per year 201,300
7. Expected Actuarial Value of Assets at June 30, 2021 = (2) + (3) + (4) – (5) – (6)
$ 93,114,700
8. Actual Market Value of Assets at June 30, 2021 $ 121,655,200
9. Excess of (8) over (7) $ 28,540,500
10. Actuarial Value of Assets at June 30, 2021 = (7) + 20% of (9)
$ 98,822,800

DELAWARE STATE JUDICIARY PENSION PLAN ACTUARIAL VALUATION AS OF JUNE 30, 2021
SECTION III – ASSETS
17
Investment Performance The market value of assets (MVA) returned 37.81% during 2021, which is more than the assumed 7.0% investment rate of return. The actuarial value of assets (AVA) returned 13.44% over this same year, reflecting the asset smoothing methodology being utilized by the Plan for the measurement of the actuarial value of assets. Since a maximum of 20% of the gain or loss from the performance of the Plan is recognized in a given year under the adopted asset smoothing method, in periods of very good performance, the AVA can lag significantly behind the MVA, and in a period of negative returns, the AVA does not decline as rapidly as the MVA. Projection of Cash Flows
Table III-3 Cash Flow Projections
Year Beginning July 1, Expected Benefit Payments Expected Contributions*
2021 $ 6,397,000 $ 2,435,000 2022 6,618,000 1,693,000 2023 6,937,000 1,735,000 2024 7,232,000 1,779,000 2025 7,350,000 1,823,000
2026 7,547,000 1,784,000 2027 7,707,000 1,829,000 2028 7,782,000 1,875,000 2029 7,937,000 1,921,000 2030 8,239,000 1,969,000
* Expected contributions include State contributions, member contributions, and PRI transfers. For illustration purposes, we have assumed the State contribution rate will remain level at 11.22% from FYE 2023 forward and that payroll will increase at the actuarially assumed rate of 2.50% per year. FYE 2022 amounts include the the estimate of the HB251 $500 payments to an estimated 60 retirees.
Expected benefit payments are projected for the closed group valued at June 30, 2021. Projecting any further than 10 years using a closed group would not yield reliable projections due to the omission of new hires in the benefit payments, compounded by their inclusion in the expected contributions.

DELAWARE STATE JUDICIARY PENSION PLAN ACTUARIAL VALUATION AS OF JUNE 30, 2021
SECTION IV – LIABILITIES
18
In this section, we present detailed information on the Plan’s liabilities for funding purposes, including: Disclosure of the Plan’s liabilities at June 30, 2020 and June 30, 2021, and Statement of changes in these liabilities during the year. Disclosure Three liability measurements are calculated and presented in this report. Each type is distinguished by the purpose, or purposes, for which they are used. Present Value of Benefits (PVB): Used for analyzing the financial outlook of a plan, this
represents the amount of money needed today to fund all future benefits and expenses of a plan, assuming current members continue to accrue benefits, there are no new entrants, and that all actuarial assumptions are met.
Actuarial Liability (AL): Used for funding calculations for a plan and GASB disclosures,
this liability is calculated by taking the present value of benefits (PVB) and subtracting the present value of future member contributions (PVFEEC) and the present value of future State normal costs (PVFNC) under an acceptable actuarial funding method. The Plan uses the Entry Age Normal funding method.
Present Value of Accrued Benefits (PVAB): Used for communicating the current level of
liabilities, this liability represents the total amount of money needed today to fully fund the current accrued obligations of a plan, assuming no future accruals of benefits or salary increases. These liabilities are also required for some accounting purposes of some plans (Topic No. 960). This plan is not subject to this requirement, but this information is provided for informational purposes, as it is sometimes used as part of assessing whether a plan can meet its current benefit commitments. However, it is not intended as a settlement liability value. Note that the development of this amount also assumes that all actuarial assumptions are met, including the assets earning 7.0% per year.
None of the liability amounts disclosed in this report is appropriate for measuring a settlement of the Plan’s liabilities. The following table discloses each of these liabilities for the current and immediately prior funding valuations. With respect to each disclosure, a subtraction of an appropriate value of plan assets yields, for each respective type, either a net surplus or an unfunded amount.

DELAWARE STATE JUDICIARY PENSION PLAN ACTUARIAL VALUATION AS OF JUNE 30, 2021
SECTION IV – LIABILITIES
19
Table IV-1 Liabilities and Net (Surplus)/Unfunded Amounts
June 30, 2020 June 30, 2021 Present Value of Benefits Active Member Benefits $ 51,016,600 $ 46,524,900 Retiree, Beneficiary, Disabled, and Terminated Member Benefits
52,671,200
59,369,300
Present Value of Benefits (PVB) $ 103,687,800 $ 105,894,200 Market Value of Assets (MVA) $ 91,304,700 $ 121,655,200 Future Member Contributions 2,827,800 2,887,600 Future State Contributions & PRI Fund Transfers 9,555,300 (18,648,600)Total Resources $ 103,687,800 $ 105,894,200 Actuarial Liability Present Value of Benefits (PVB) $ 103,687,800 $ 105,894,200 Present Value of Future State Normal Costs (PVFNC) 18,052,800 16,084,200 Present Value of Future Member Contributions (PVFEEC) 2,827,800 2,887,600 Actuarial Liability (AL=PVB–PVFNC–PVFEEC) $ 82,807,200 $ 86,922,400 Actuarial Value of Assets (AVA) 90,415,900 98,822,800 Net (Surplus)/Unfunded AL (AL – AVA) $ (7,608,700) $ (11,900,400) Present Value of Accrued Benefits Present Value of Benefits (PVB) $ 103,687,800 $ 105,894,200Present Value of Future Benefit Accruals (PVFBA) 21,218,500 21,424,200 Present Value of Accrued Benefits (PVAB=PVB–PVFBA)
$ 82,469,300
$ 84,470,000
Market Value of Assets (MVA) $ 91,304,700 $ 121,655,200 Net (Surplus)/Unfunded PVAB (PVAB – MVA) $ (8,835,400) $ (37,185,200)

DELAWARE STATE JUDICIARY PENSION PLAN ACTUARIAL VALUATION AS OF JUNE 30, 2021
SECTION IV – LIABILITIES
20
Changes in Liabilities Each of the liabilities disclosed in the prior table are expected to change at each valuation. The components of that change, depending upon which liability is analyzed, can include: New entrants since the last valuation Benefits accrued since the last valuation Plan amendments increasing benefits Passage of time which adds interest to the prior liability Benefits paid to retirees since the last valuation Participants retiring, terminating, or dying at rates different than expected A change in actuarial or investment assumptions A change in the actuarial funding method Unfunded liabilities (or surpluses), developed from subtraction of an appropriate value of Plan assets from these liability measures, will change because of all of the above as well as due to changes in Plan asset measures resulting from: State contributions different than expected Investment earnings different than expected A change in the methodology used to measure Plan assets In each valuation, we report on those elements of change that are of particular significance, potentially affecting the long-term financial outlook of the Plan. Below we present key changes in the liabilities since the last valuation, in thousands.
Table IV-2 Liability Changes
(In Thousands) Present Value
of Benefits Actuarial Liability
Present Value of Accrued
Benefits Liabilities June 30, 2020 $103,688 $ 82,807 $ 82,469 Liabilities June 30, 2021 105,894 86,922 84,470Liability Increase/(Decrease) 2,206 4,115 2,001 Change Due to: PRI 332 332 332 Actuarial (Gain)/Loss NC * 551 NC* Benefit Changes 0 0 0 Assumption Changes (2,406) 315 (1,772) Benefits Accumulated and
Other (Gain)/Loss
4,280
2,917 3,441
* NC = not calculated

DELAWARE STATE JUDICIARY PENSION PLAN ACTUARIAL VALUATION AS OF JUNE 30, 2021
SECTION IV – LIABILITIES
21
Table IV-3 below provides additional information about the liability measurements for funding purposes as of both the current and the immediately prior valuations.
Table IV-3 Actuarial Liabilities for Funding
June 30, 2020 June 30, 2021 1. Actuarial Liabilities Retiree, Beneficiary, Disabled, and
Terminated Members
$ 52,671,200 $ 59,369,300
Active Members 30,136,000 27,553,100 Total Actuarial Liability (AL) $ 82,807,200 $ 86,922,400 2. Actuarial Value of Assets (AVA) $ 90,415,900 $ 98,822,800 3. Unfunded Actuarial Liability (UAL) [AL –
AVA] $ (7,608,700) $ (11,900,400)
4. Present Value of Outstanding PRI Transfers $ 0 $ 331,500 5. Net Base for 20-Year UAL Amortization (3-4)
$ (7,608,700) $ (12,231,900)
DELAWARE STATE JUDICIARY PENSION PLAN ACTUARIAL VALUATION AS OF JUNE 30, 2021
SECTION V – CONTRIBUTIONS
22
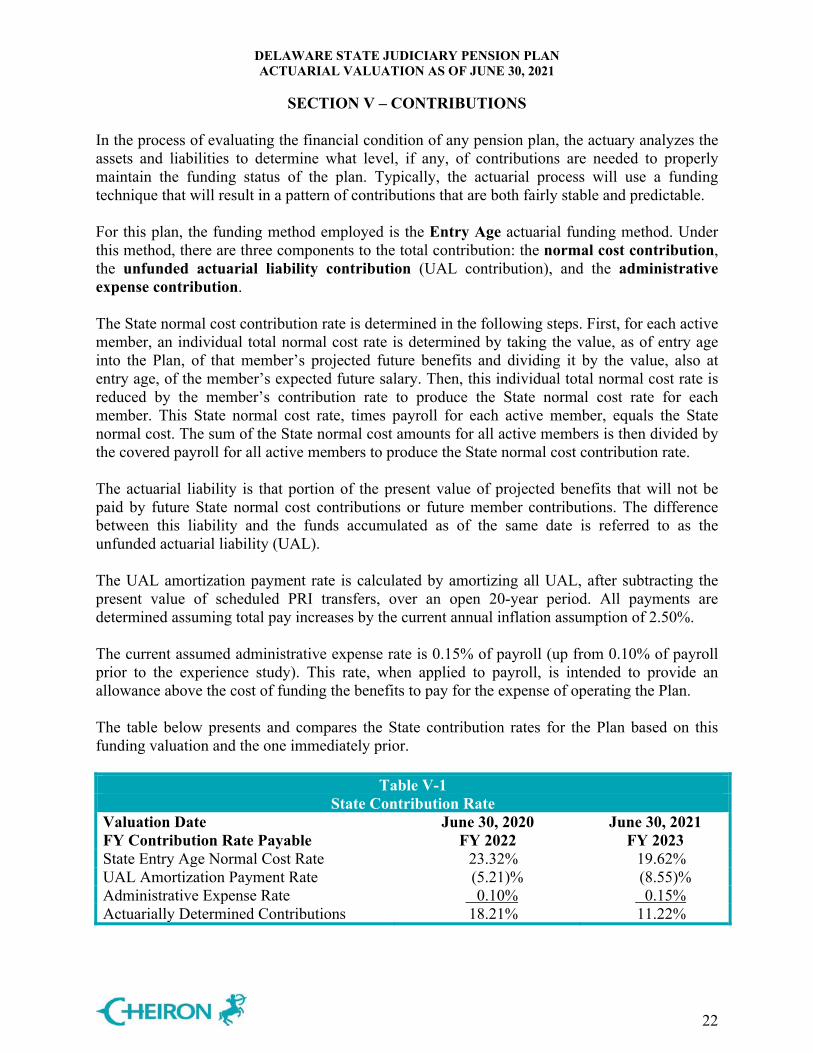
In the process of evaluating the financial condition of any pension plan, the actuary analyzes the assets and liabilities to determine what level, if any, of contributions are needed to properly maintain the funding status of the plan. Typically, the actuarial process will use a funding technique that will result in a pattern of contributions that are both fairly stable and predictable. For this plan, the funding method employed is the Entry Age actuarial funding method. Under this method, there are three components to the total contribution: the normal cost contribution, the unfunded actuarial liability contribution (UAL contribution), and the administrative expense contribution. The State normal cost contribution rate is determined in the following steps. First, for each active member, an individual total normal cost rate is determined by taking the value, as of entry age into the Plan, of that member’s projected future benefits and dividing it by the value, also at entry age, of the member’s expected future salary. Then, this individual total normal cost rate is reduced by the member’s contribution rate to produce the State normal cost rate for each member. This State normal cost rate, times payroll for each active member, equals the State normal cost. The sum of the State normal cost amounts for all active members is then divided by the covered payroll for all active members to produce the State normal cost contribution rate. The actuarial liability is that portion of the present value of projected benefits that will not be paid by future State normal cost contributions or future member contributions. The difference between this liability and the funds accumulated as of the same date is referred to as the unfunded actuarial liability (UAL). The UAL amortization payment rate is calculated by amortizing all UAL, after subtracting the present value of scheduled PRI transfers, over an open 20-year period. All payments are determined assuming total pay increases by the current annual inflation assumption of 2.50%. The current assumed administrative expense rate is 0.15% of payroll (up from 0.10% of payroll prior to the experience study). This rate, when applied to payroll, is intended to provide an allowance above the cost of funding the benefits to pay for the expense of operating the Plan. The table below presents and compares the State contribution rates for the Plan based on this funding valuation and the one immediately prior.
Table V-1 State Contribution Rate
Valuation Date FY Contribution Rate Payable
June 30, 2020 FY 2022
June 30, 2021 FY 2023
State Entry Age Normal Cost Rate 23.32% 19.62% UAL Amortization Payment Rate (5.21)% (8.55)%Administrative Expense Rate 0.10% 0.15%Actuarially Determined Contributions 18.21% 11.22%

DELAWARE STATE JUDICIARY PENSION PLAN ACTUARIAL VALUATION AS OF JUNE 30, 2021
SECTION V – CONTRIBUTIONS
23
Table V-2 below provides additional detail about the development of the actuarially determined State contribution rate as well as the expected dollar amounts these rates will result in for FY 2023.
Table V-2 Expected FY 2023
State Contributions In Dollars As % of Payroll1. Present Value of Projected Benefits Attributable to: a. Total Normal Cost $ 2,483,700 23.01% b. Expected Member Contributions 365,900 3.39% c. State Paid Normal Cost (a) – (b) $ 2,117,800 19.62% 2. Amortization of Unfunded Liability/(Surplus) $ (922,900) (8.55)% 3. Allowance for Administrative Expense $ 16,200 0.15% 4. Total State Actuarially Determined Contributions (1) + (2) + (3) $ 1,211,100
11.22%

DELAWARE STATE JUDICIARY PENSION PLAN ACTUARIAL VALUATION AS OF JUNE 30, 2021
SECTION VI – ACCOUNTING STATEMENT INFORMATION
24
ASC Topic No. 960 of the Financial Accounting Standards Board (FASB) requires plans subject to it to disclose certain information regarding their funded status. This plan is not subject to this requirement, but this information is provided for informational purposes. Statement No. 67 of the Governmental Accounting Standards Board (GASB) establishes standards for disclosure of pension information by public employee retirement systems (PERS) and governmental employers in notes to financial statements and supplementary information. Disclosures based on FASB ASC Topic No. 960 provide a quasi “snap shot” view of how the Plan’s assets compare to its liabilities if contributions stopped and accrued benefit claims had to be satisfied. However, due to potential legal requirements and the possibility that alternative interest rates would have to be used to determine the liabilities, these values may not be a good indication of the amount of money it would take to buy the benefits for all members if the Plan were to terminate and should not be considered a settlement value. FASB ASC Topic No. 960 specifies that a comparison of the present value of accrued (accumulated) benefits, with the market value of the assets as of the valuation date, must be provided. Again, this plan is not subject to this requirement, but the relevant amounts as of June 30, 2020 and June 30, 2021 are provided for informational purposes and are exhibited in Table VI-1, which also includes a reconciliation of liabilities determined as of the prior valuation, July 1, 2020, to the liabilities as of June 30, 2021. These values are based on the funding liability results. This valuation contains information reported in the June 30, 2021 Annual Comprehensive Financial Report (ACFR) of Delaware PERS under GASB Statement No. 67. Disclosures are based on the use of updated procedures to roll forward the 2020 funding valuation results. The calculation of Net Pension Liability in Table VI-2 shows the amounts to be disclosed for FY 2021, based on the liabilities of the roll forward of the 2020 funding valuation, as well as a projection of the anticipated FY 2022 disclosures, based on liabilities from the 2021 funding valuation, assuming all actuarial assumptions are met over the coming year. The actual disclosures for FY 2022 will be developed once the asset measure for GASB as of June 30, 2022 is known. Tables VI-3 through VI-5 are exhibits to be used for the State’s ACFR. Table VI-3 is the Note to Required Supplementary Information. Table VI-4 is a history of gains and losses in accrued liability, and Table VI-5 is the Schedule of Funded Liabilities by Type, which shows the portion of accrued liability covered by the actuarial value of assets. The Government Finance Officers Association (GFOA) has named this exhibit the Schedule of Funded Liabilities by Type. None of the liabilities or assets shown is appropriate for settlement purposes. Furthermore, the Schedule of Funded Liabilities by Type does not accurately depict a plan’s future financial condition but rather is a test developed by the GFOA to assess the level of funding that relies on the payroll for future hires to pay for the benefits that have already been accrued by the current population. This valuation does not contain the additional disclosures required by GASB Statement No., only for the State’s ACFR.

DELAWARE STATE JUDICIARY PENSION PLAN ACTUARIAL VALUATION AS OF JUNE 30, 2021
SECTION VI – ACCOUNTING STATEMENT INFORMATION
25
Table VI-1 Accounting Statement Disclosure and
Reconciliation of Present Value of Accrued Benefits June 30, 2020 June 30, 2021 FASB ASC Topic No. 960 Basis 1. Present Value of Accrued Benefits (PVAB)
a. Members Currently Receiving Payments $ 50,174,200 $ 55,909,900 b. Former Vested Members 2,497,000 3,459,400 c. Active Members 29,798,100 25,100,700
2. Total PVAB [1(a) + 1(b) + 1(c)] $ 82,469,300 $ 84,470,000
3. Market Value of Assets (MVA) 91,304,700 121,655,200
4. Unfunded PVAB [2 – 3] $ (8,835,400) $ (37,185,200)
5. Ratio of MVA to PVAB [3 / 2] 110.7% 144.0%
Reconciliation of PVAB PVAB at June 30, 2020 $ 82,469,300 Increase/(Decrease) During Year Attributable to: Passage of Time 5,572,000 Benefits Paid – FY 2021 (5,837,000) Benefit Changes (PRI) 331,500 Assumption Changes (1,772,300) Benefits Accrued, Other Gains/Losses 3,706,500 Net Increase/(Decrease) 2,000,700 PVAB at June 30, 2021 $ 84,470,000

DELAWARE STATE JUDICIARY PENSION PLAN ACTUARIAL VALUATION AS OF JUNE 30, 2021
SECTION VI – ACCOUNTING STATEMENT INFORMATION
26
Table VI-2 GASB No. 67 Disclosures
Estimated June 30, 2021 June 30, 2022 Total Pension Liability (TPL) Service cost $ 2,482,000 $ 2,484,000 Interest 5,822,000 6,039,000 Changes in benefit terms 0 362,000 Differences between expected and actual experience
(22,000)
551,000
Changes in assumptions 1,058,000 0 Benefit payments, including refunds of member contributions
(5,837,000)
(6,397,000)
Net change in TPL $ 3,503,000 $ 3,039,000 TPL - beginning $ 82,537,000 $ 86,040,000 TPL - ending (a) $ 86,040,000 $ 89,079,000 Fiduciary Net Position (FNP) Contributions - State $ 1,985,000 $ 1,966,000 Contributions - Non-employer (PRI) 0 75,000 Contributions – State Ad Hoc 0 30,000Contributions - Member 357,000 366,000 Net investment income 33,859,000 8,379,000Benefit payments, including refunds of member contributions
(5,837,000)
(6,397,000)
Administrative expenses (14,000) (16,000)Net change in FNP $ 30,350,000 $ 4,403,000 FNP - beginning $ 91,305,000 $ 121,657,000 FNP - ending (b) $ 121,655,000 $ 126,060,000 Net Pension Liability/(Asset) - ending [(a)-(b)]
$(35,615,000)
$ (36,981,000)
Items printed in red will be replaced with actual amounts once known at the end of FY 2022.

DELAWARE STATE JUDICIARY PENSION PLAN ACTUARIAL VALUATION AS OF JUNE 30, 2021
SECTION VI – ACCOUNTING STATEMENT INFORMATION
27
Table VI-3 Note to Required Supplementary Information
The June 30, 2021 total pension liability presented in Table VI-2 was determined as part of the measurement at the date indicated. Additional information as of the latest measurement date follows.
Measurement date: July 1, 2021Valuation date: July 1, 2020
Actuarial cost method: Entry age normal
Actuarial assumptions: Investment rate of return* 7.0%Projected salary increases* 2.5% plus merit component based on serviceCost-of-living adjustments ad hoc
* Includes inflation at 2.50%
The actuarially determined contribution for fiscal year 2023 will use the contribution rate developed in Section V of this valuation. It was determined using the measurement date and key assumptions that follow.
Measurement date: July 1, 2021Valuation date: July 1, 2021Actuarial cost method: Entry age normal
Amortization method: Percentage of pay – openPay increases at 2.5% per year
Amortization period: 20 years
Asset valuation method: Smoothed market, 20% annual market weight
Actuarial assumptions: Investment rate of return* 7.0%Projected salary increases* 2.5% plus merit component based on serviceCost-of-living adjustments ad hoc
* Includes inflation at 2.50%
The actuarial assumptions used have been recommended by the actuary and adopted by the Plan’s Board of Trustees based on the most recent review of the Plan’s experience completed in 2021. The economic assumptions were updated first effective with the 2017 valuation based on the Board’s annual review of these assumptions. The total rate of State contributions to the Plan is composed of the State normal cost rate, the unfunded actuarial liability amortization payment rate, and the administrative expenses rate. The State normal cost rate is a level percent of payroll cost that, along with member contributions, will pay for projected benefits at retirement for each active member. The actuarial liability is that portion of the present value of projected benefits that will not be paid by future State normal costs or future member contributions. The difference between this liability and the funds accumulated as of the same date is the unfunded actuarial liability. The allowance for administrative expenses is based upon the Plan’s actual administrative expenses.

DELAWARE STATE JUDICIARY PENSION PLAN ACTUARIAL VALUATION AS OF JUNE 30, 2020
SECTION VI – ACCOUNTING STATEMENT INFORMATION
28
Table VI-4 Analysis of Financial Experience
Gain and Loss in Accrued Liability during Years Ended June 30
Resulting from Differences between Assumed Experience and Actual Experience Gain (or Loss) for Year Ending June 30,
(expressed in thousands)Type of Activity 2016 2017 2018 2019 2020 2021 Investment Income on Actuarial Assets $ (1,201) $ (481) $ 116 $ (275) $ 222 $ 5,708 Combined Liability Experience 2,017 2,254 2,625 1,678 22 (551)(Loss)/Gain during Year from Financial Experience 816 1,773 2,741 1,403 244 5,157Non-Recurring Items 1,953 (1,344) (20) 0 (293) (647) Composite Gain (or Loss) during Year $ 2,769 $ 429 $ 2,721 $ 1,403 $ (49) $ 4,510
Table VI-5
Schedule of Funded Liabilities by Type Aggregate Accrued Liabilities for
(expressed in thousands)
Valuation Date
June 30, Active Member Contributions
Retirees & Beneficiaries
Active Member State-Financed Contributions
Actuarial Value of Reported
Assets Portion of Accrued Liabilities Covered by Reported Assets
(1) (2) (3) (1) (2) (3) 2021 $ 4,773 $ 55,910 $ 26,239 $ 98,823 100% 100% 145%2020 5,310 50,174 28,984 90,416 100 100 128
2019 5,985 44,355 27,296 86,980 100 100 126 2018 5,446 44,918 27,472 83,834 100 100 123 2017 5,193 44,075 27,472 80,445 100 100 113 2016 5,834 39,411 28,976 77,302 100 100 111

DELAWARE STATE JUDICIARY PENSION PLAN ACTUARIAL VALUATION AS OF JUNE 30, 2021
APPENDIX A – MEMBERSHIP INFORMATION
29
Delaware State Judiciary Pension PlanData Reconciliation
A P-TDV P-RET P-DIS P-SR P-SURV Total
1. June 30, 2020 valuation 58 2 41 0 0 15 116
2. Additions
(a) New entrants 7 2 9
(b) New Beneficiary/QDRO 1 1
(c) Total 7 2 1 10
3. Reductions
(a) Terminated - not vested (2) (2)
(b) Paid Out/Expired/Death (1) (1) (2)
(c) Total (2) (1) (1) (4)
4. Changes in status
(a) P-TDV
(b) P-SUPP
(c) Returned to work
(d) P-RET (4) (1) 5
(e) PRET25
(f) P-DIS
(g) P-LTD
(h) P-SURV
(i) PSUR25
(j) P-SR
(k) Data corrections
(l) Total (4) (1) 5
5. June 30, 2021 valuation 59 3 45 0 0 15 122
A=Active, P-TDV=Terminated Deferred Vested, P-SUPP=Terminated Deferred Vested, P-RET=Retired, PRET25=Retired, P-DIS=Disabled, P-LTD=Long-Term Disabled, P-SURV=Surviving Beneficiary, PSUR25=Surviving Beneficiary, P-SR=Disabled

DELAWARE STATE JUDICIARY PENSION PLAN ACTUARIAL VALUATION AS OF JUNE 30, 2021
APPENDIX A – MEMBERSHIP INFORMATION
30
Delaware State Judiciary Pension Plan Population Distribution
of Active Members by Age and Service as of June 30, 2021
Counts By Age/ServiceService
Age Under 1 1 to 4 5 to 9 10 to 14 15 to 19 20 to 24 25 to 29 30 to 34 35 to 39 40 & up Total
Under 25 0 0 0 0 0 0 0 0 0 0 0
25 to 29 0 0 0 0 0 0 0 0 0 0 0
30 to 34 0 0 0 0 0 0 0 0 0 0 0
35 to 39 2 1 0 0 0 0 0 0 0 0 3
40 to 44 0 2 3 0 0 0 0 0 0 0 5
45 to 49 3 1 2 0 0 0 0 0 0 0 6
50 to 54 1 1 4 2 0 0 0 0 0 0 8
55 to 59 1 3 5 1 2 1 0 0 0 0 13
60 to 64 0 6 1 1 2 1 0 0 0 0 11
65 to 69 0 1 2 0 2 2 1 0 0 0 8
70 & up 0 0 0 1 0 2 1 1 0 0 5
Total 7 15 17 5 6 6 2 1 0 0 59

DELAWARE STATE JUDICIARY PENSION PLAN ACTUARIAL VALUATION AS OF JUNE 30, 2021
APPENDIX A – MEMBERSHIP INFORMATION
31
Delaware State Judiciary Pension Plan Population Distribution
of Active Members by Age as of June 30, 2021
Delaware State Judiciary Pension Plan Population Distribution
of Active Members by Service as of June 30, 2021
0 0 0
3
5
6
8
13
11
8
5
0
2
4
6
8
10
12
14
Under 25 25 to 29 30 to 34 35 to 39 40 to 44 45 to 49 50 to 54 55 to 59 60 to 64 65 to 69 70 & up
Cou
nt
Age
7
15
17
5
6 6
2
1
0 0 0
2
4
6
8
10
12
14
16
18
20
Under 1 1 to 4 5 to 9 10 to 14 15 to 19 20 to 24 25 to 29 30 to 34 35 to 39 40 & up
Cou
nt
Service

DELAWARE STATE JUDICIARY PENSION PLAN ACTUARIAL VALUATION AS OF JUNE 30, 2021
APPENDIX A – MEMBERSHIP INFORMATION
32
Delaware State Judiciary Pension Plan Salary Distribution
of Active Members by Age and Service as of June 30, 2021
Average Salary by Age/ServiceService
Age Under 1 1 to 4 5 to 9 10 to 14 15 to 19 20 to 24 25 to 29 30 to 34 35 to 39 40 & up Total
Under 25 0$ 0$ 0$ 0$ 0$ 0$ 0$ 0$ 0$ 0$ 0$
25 to 29 0 0 0 0 0 0 0 0 0 0 0
30 to 34 0 0 0 0 0 0 0 0 0 0 0
35 to 39 62,219 190,080 0 0 0 0 0 0 0 0 104,839
40 to 44 0 190,570 194,112 0 0 0 0 0 0 0 192,695
45 to 49 145,558 183,543 161,571 0 0 0 0 0 0 0 157,227
50 to 54 171,399 190,080 190,080 186,811 0 0 0 0 0 0 186,928
55 to 59 178,493 190,080 190,189 190,080 190,080 190,080 0 0 0 0 189,231
60 to 64 0 191,007 211,302 190,080 190,080 201,657 0 0 0 0 193,567
65 to 69 0 190,080 190,080 0 195,868 186,811 190,080 0 0 0 190,710
70 & up 0 0 0 190,080 0 196,128 190,080 190,080 0 0 192,499
Total 130,143$ 190,080$ 188,718$ 188,772$ 192,009$ 192,936$ 190,080$ 190,080$ 0$ 0$ 182,952$

DELAWARE STATE JUDICIARY PENSION PLAN ACTUARIAL VALUATION AS OF JUNE 30, 2021
APPENDIX A – MEMBERSHIP INFORMATION
33
Delaware State Judiciary Pension Plan Salary Distribution
of Active Members by Age as of June 30, 2021
Delaware State Judiciary Pension Plan Salary Distribution
of Active Members by Service as of June 30, 2021
$0 $0 $0
$104,839
$192,695
$157,227
$186,928 $189,231 $193,567 $190,710 $192,499
$0
$50,000
$100,000
$150,000
$200,000
$250,000
Under 25 25 to 29 30 to 34 35 to 39 40 to 44 45 to 49 50 to 54 55 to 59 60 to 64 65 to 69 70 & up
Ave
rage
Sal
ary
Age
$130,143
$190,080 $188,718 $188,772 $192,009 $192,936 $190,080 $190,080
$0 $0$0
$50,000
$100,000
$150,000
$200,000
$250,000
Under 1 1 to 4 5 to 9 10 to 14 15 to 19 20 to 24 25 to 29 30 to 34 35 to 39 40 & up
Ave
rage
Sal
ary
Service
DELAWARE STATE JUDICIARY PENSION PLAN ACTUARIAL VALUATION AS OF JUNE 30, 2021
APPENDIX A – MEMBERSHIP INFORMATION
34
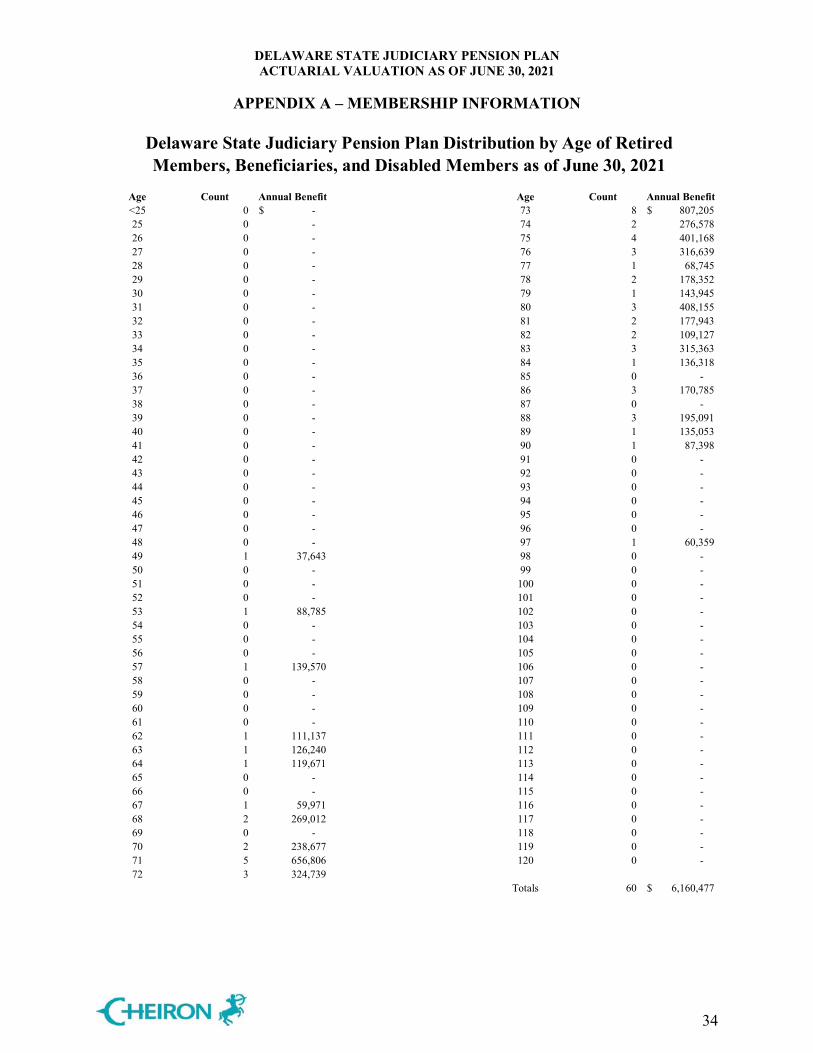
Delaware State Judiciary Pension Plan Distribution by Age of RetiredMembers, Beneficiaries, and Disabled Members as of June 30, 2021
Age Count Annual Benefit Age Count Annual Benefit<25 0 -$ 73 8 807,205$ 25 0 - 74 2 276,578 26 0 - 75 4 401,168 27 0 - 76 3 316,639 28 0 - 77 1 68,745 29 0 - 78 2 178,352 30 0 - 79 1 143,945 31 0 - 80 3 408,155 32 0 - 81 2 177,943 33 0 - 82 2 109,127 34 0 - 83 3 315,363 35 0 - 84 1 136,318 36 0 - 85 0 - 37 0 - 86 3 170,785 38 0 - 87 0 - 39 0 - 88 3 195,091 40 0 - 89 1 135,053 41 0 - 90 1 87,398 42 0 - 91 0 - 43 0 - 92 0 - 44 0 - 93 0 - 45 0 - 94 0 - 46 0 - 95 0 - 47 0 - 96 0 - 48 0 - 97 1 60,359 49 1 37,643 98 0 - 50 0 - 99 0 - 51 0 - 100 0 - 52 0 - 101 0 - 53 1 88,785 102 0 - 54 0 - 103 0 - 55 0 - 104 0 - 56 0 - 105 0 - 57 1 139,570 106 0 - 58 0 - 107 0 - 59 0 - 108 0 - 60 0 - 109 0 - 61 0 - 110 0 - 62 1 111,137 111 0 - 63 1 126,240 112 0 - 64 1 119,671 113 0 - 65 0 - 114 0 - 66 0 - 115 0 - 67 1 59,971 116 0 - 68 2 269,012 117 0 - 69 0 - 118 0 - 70 2 238,677 119 0 - 71 5 656,806 120 0 - 72 3 324,739
Totals 60 6,160,477$

DELAWARE STATE JUDICIARY PENSION PLAN ACTUARIAL VALUATION AS OF JUNE 30, 2021
APPENDIX A – MEMBERSHIP INFORMATION
35
Delaware State Judiciary Pension Plan Distribution by Age of Retired
Members, Beneficiaries, and Disabled Members as of June 30, 2021
$0
$100
$200
$300
$400
$500
$600
$700
$800
$900
48 50 52 54 56 58 60 62 64 66 68 70 72 74 76 78 80 82 84 86 88 90 92 94 96 98 100 102
An
nu
al B
enef
itT
hous
ands
Age

DELAWARE STATE JUDICIARY PENSION PLAN ACTUARIAL VALUATION AS OF JUNE 30, 2021
APPENDIX B – ACTUARIAL ASSUMPTIONS AND METHODS
36
A. Long-Term Assumptions Used to Determine Plan Costs and Liabilities
1. Demographic Assumptions
a. Rates of Mortality Mortality rates are based on the sex-distinct employee, healthy annuitant, and disabled annuitant mortality tables described below, including adjustment factors applied to the published tables for each group. Future mortality improvements are reflected by applying a custom projection scale on a generational basis to adjusted base tables from the base year shown below.
i. Sample Rates of Mortality for Active Healthy Lives at Selected Ages
(number of deaths per 10,000 members):
(2021 Values Shown) Age Male Female 25 3 1 30 5 2 35 7 3 40 8 4 45 10 5 50 14 8 55 21 13 60 33 20 65 47 28 70 66 44 75 99 73 80 158 125
Rates are based on 100% of the Pub-2010 General Employee Mortality Table, for males and females, using the Pub-2010 General Benefits Weighted Healthy Annuitant Mortality Table rates after the end of the General Employee Mortality Table, both projected from the 2010 base rates using the RPEC-2020 model, with an ultimate rate of 0.85% for ages 20-80, grading down to an ultimate rate of 0% for ages 114-120, and convergence to the ultimate rate in the year 2027. The valuation uses a fully generational projection of mortality improvements. Sample rates shown are those projected through the valuation date.

DELAWARE STATE JUDICIARY PENSION PLAN ACTUARIAL VALUATION AS OF JUNE 30, 2021
APPENDIX B – ACTUARIAL ASSUMPTIONS AND METHODS
37
ii. Sample Rates of Mortality for Healthy Annuitant Lives at Selected Ages (number of deaths per 10,000 members):
(2021 Values Shown)
Age Male Female 50 30 21 55 45 30 60 69 41 65 99 59 70 153 95 75 259 170 80 467 315 85 859 596 90 1,490 1,111 95 2,322 1,811 100 3,341 2,729
Rates are based on 107% and 100% of the Pub-2010 General Benefits Weighted Healthy Annuitant Mortality Table, respectively, for males and females, using the Pub-2010 General Employee Mortality Table for ages prior to start of the Healthy Annuitant Mortality Table, both projected from the 2010 base rates using the RPEC-2020 model, with an ultimate rate of 0.85% for ages 20-80, grading down to an ultimate rate of 0% for ages 114-120, and convergence to the ultimate rate in the year 2027. The valuation uses a fully generational projection of mortality improvements. Sample rates shown are those projected through the valuation date.
iii. Sample Rates of Active Disabilities
None assumed
b. Termination of Employment (Prior to Normal Retirement Eligibility)
None assumed c. Rates of Retirement
Normal Retirement: 25% for all years the member is retirement eligible upon attaining age 62 with 12 years of credited service
100% probability of retirement once reaching age 75. Rates only applicable if member meets eligibility.

DELAWARE STATE JUDICIARY PENSION PLAN ACTUARIAL VALUATION AS OF JUNE 30, 2021
APPENDIX B – ACTUARIAL ASSUMPTIONS AND METHODS
38
d. Salary Increase Rates Salaries are assumed to increase 3.90% from FYE 2021 to FYE 2022, 3.40% from FYE 2022 to FYE 2023, 2.80% from FYE 2023 to FYE 2024, For all future years, the salary increase is assumed to be equal to the assumed annual inflation rate of 2.50%.
e. Family Composition
Female spouses are assumed to be three years younger than males. 80% are assumed married for both male and female employees. Actual marital characteristics are used for pensioners.
2. Economic Assumptions
a. Investment Rate of Return: 7.00% b. General Wage Increase Rate: 2.50% c. Annual Assumed Cost-of-Living Increase Rate for Retirees: 0.00% d. Total Payroll Increase Rate (for Amortization): 2.50% e. Administrative Expenses as a Percentage of Covered Payroll: 0.15%
3. Rationale for Assumptions The assumptions were adopted by the Board of Trustees upon recommendation of the
actuary, based on an experience study review performed in 2021 and covering the period July 1, 2015 through June 30, 2020. The Board continually reviews the investment rate of return assumption, and adopted a reduced rate of 7.0% at the advice of its investment consultants, first effective for funding with the 2017 valuation.
4. Technical and Miscellaneous Assumptions
a. Decrement timing: Middle of year, except at 100% retirement, which is assumed at the beginning of year
b. Eligibility timing: As of beginning of year c. Crediting interest for refunds: 5.00%

DELAWARE STATE JUDICIARY PENSION PLAN ACTUARIAL VALUATION AS OF JUNE 30, 2021
APPENDIX B – ACTUARIAL ASSUMPTIONS AND METHODS
39
5. Disclosures Regarding Models Used
In accordance with Actuarial Standard of Practice (ASOP) No. 56 Modeling, the following disclosures are made:
a. Valuation Software
Cheiron utilizes ProVal, an actuarial valuation software program leased from Winklevoss Technologies (WinTech), to calculate liabilities and projected benefit payments. We have reviewed the underlying workings of this model to the degree feasible and consistent with ASOP No. 56 and believe them to be appropriate for the purposes of the valuation. b. Projections
This valuation report includes projections of future contributions and funded status for the purpose of assisting the Board of Trustees and the sponsors of the Plan with the management of the Plan. The projections are based on the same census data and financial information as of June 30, 2021 as disclosed in this actuarial valuation. The projections assume continuation of the Plan provisions and actuarial assumptions in effect as of June 30, 2021 and do not reflect the impact of any changes in benefits or actuarial assumptions that may be adopted after June 30, 2021. The projections assume that all future assumptions are met except where specifically indicated. The future outcomes become increasingly uncertain over time, and therefore the general trends and not the absolute values should be considered in the review of these projections. Further, for the purpose of these projections, we have only reflected the impact of new entrants entering the Plan in aggregate and have not developed individual liabilities or detailed profiles related to these potential new entrants. We feel this is appropriate for the purpose of these projections, but if they were to be used for other purposes, this may not be appropriate and alternative projections may need to be developed.
6. Changes and Rationale Since Last Valuation The following assumptions were changed to better reflect the experience observed during
the experience study covering the period July 1, 2015 through June 30, 2020. The Board of Trustees adopted the experience study at the September 24, 2021 meeting.
Healthy Inactive, Active, and Disabled Mortality Rates of Active Disability Retirement Salary Increase Administrative Expense

DELAWARE STATE JUDICIARY PENSION PLAN ACTUARIAL VALUATION AS OF JUNE 30, 2021
APPENDIX B – ACTUARIAL ASSUMPTIONS AND METHODS
40
B. Actuarial Methods 1. Funding Method
The Entry Age Normal funding method is used to determine costs. Under this funding method, a normal cost rate is determined as a level percent of pay for each active member. The normal cost rate times payroll equals the normal cost for each active member. The normal cost plus member contributions will pay for projected benefits at retirement for each active plan participant. The actuarial liability is that portion of the present value of projected benefits that will not be paid by future State normal costs or member contributions. The difference between this liability and funds accumulated as of the same date is referred to as the unfunded actuarial liability. The portion of the actuarial liability in excess of Plan assets is amortized to develop an additional cost or savings that is added to each year’s employer normal cost. Under this cost method, actuarial gains and losses are directly reflected in the size of the unfunded actuarial liability. The portion of unfunded liability not expected to be paid through PRI transfers is amortized over a rolling 20-year period as a percentage of payroll. PRI transfers are made to pay for each PRI as granted over a five-year period. These transfers are treated as a receivable for purposes of developing the State rate. All payments are determined assuming total pay increased by the annual inflation rate. Use of a rolling amortization period means that the UAL amount is never anticipated to be fully paid off. This method was chosen to provide for a more level contribution rate over time.
2. Actuarial Value of Assets
For purposes of determining the State Judiciary employer contribution rate to the Plan, we use an actuarial value of assets. This asset smoothing method dampens the volatility in asset values that could occur because of fluctuations in market conditions. Use of an asset smoothing method is consistent with the long-term nature of the actuarial valuation process. The actuarial value of assets is a weighted average giving 20% weight to the current market value and 80% weight to the prior year’s actuarial value increased by expected interest and contributions and decreased by benefit payments and expenses. This is mathematically equivalent to recognizing 100% of the actuarially assumed interest rate, plus contributions, fewer payments each year, and 20% of the portion of each year’s returns that have not already been reflected in asset values.
3. Changes and Rationale Since Last Valuation
The open period for the rolling amortization was changed to 20 years in order that the surplus be preserved for a longer period of time.

DELAWARE STATE JUDICIARY PENSION PLAN ACTUARIAL VALUATION AS OF JUNE 30, 2021
APPENDIX C – SUMMARY OF PLAN PROVISIONS
41
This appendix provides a summary of the plan provisions. Where the Plan, as determined by the State Code and the Plan Rules and Regulations, and this summary differ, the Plan governs. 1. Membership
The Plan covers individuals while members of the State Judiciary.
2. Member Contributions 3% of compensation, which exceeds $6,000 per annum plus an additional 2% of compensation in excess of the Social Security wage base 3. Credited Service
All service as a member After accruing 12 years of Judicial service, previous State service may be credited for purposes of retirement eligibility.
4. Final Average Compensation
Final Average Compensation is the average over the highest three consecutive years (or shorter period of service) of compensation paid to the judge.
5. Normal Retirement
Eligibility: (i) age 62 with 12 years of service as a judge, or (ii) any age with 24 years of
service, or (iii) involuntarily retired after 22 years of service as a judge Benefit: 1/24 of final average compensation for each of the first 12 years of service as a
judge plus 1/48 of final average compensation for each of the next 12 years of service as a judge
6. Disability Benefit
Eligibility: Permanently disabled while active Benefit: Normal retirement benefit with the following revisions: For judges appointed
after June 30, 1980, a minimum of 12 years of service as a judge and a maximum of 24 years of service as a judge is used in the benefit determination.

DELAWARE STATE JUDICIARY PENSION PLAN ACTUARIAL VALUATION AS OF JUNE 30, 2021
APPENDIX C – SUMMARY OF PLAN PROVISIONS
42
7. Survivor’s Benefit
A pension is payable to the surviving spouse of a judge who dies in office regardless of his or her number of years of service at the time of death. A pension is also payable to the surviving spouse of a former judge with a vested right to a pension or a retired judge. If a judge is not survived by a spouse, a pension is payable to surviving eligible dependent children, if any, in equal shares until the youngest unmarried child attains age 18 (or age 22 if attending school or child’s death if permanently disabled), as follows:
Eligibility: Death while in office Benefit: For eligible survivors of members who die in office: 66 ⅔% of the member’s
accrued pension based on not less than 12 years of service, deferred to age 50, or reduced if paid prior to age 50, with a 2% reduction for form of payment
8. Vesting
Eligibility: 12 or more years of service as a judge Benefit: Normal Retirement based on final average compensation and service at date of
termination. Death prior to starting a monthly benefit results in a 50% spousal benefit, if eligible spouse exists, commencing when member would have been age 62. In lieu of a pension, a member may receive a refund of accumulated contributions (with interest for judges appointed after June 30, 1980). Upon application for a refund of contributions, a member’s vested right to a monthly benefit shall be forfeited.
9. Withdrawal
Eligibility: Terminated service Benefit: Accumulated employee contributions with interest for judges appointed prior to
July 1, 1980. Accumulated employee contributions with interest for judges appointed after June 30, 1980.
10. Form of Payment
The normal form of payment is a 50% joint and survivor annuity. As an alternative to the normal form, a member may elect one of the following optional forms of payment upon service retirement or disability: • 66 2/3% joint and survivor form with a 2% reduction in benefits, • 75% joint and survivor form with a 3% reduction in benefits, or • 100% joint and survivor form with a 6% reduction in benefits. The 66 2/3% and 100% options are only available for retirement on or after January 1, 2015.

DELAWARE STATE JUDICIARY PENSION PLAN ACTUARIAL VALUATION AS OF JUNE 30, 2021
APPENDIX C – SUMMARY OF PLAN PROVISIONS
43
11. Cost-of-Living Adjustment
Cost-of-living adjustments are made only on an ad hoc basis.
12. Changes Since Last Valuation
House Bill 250 included a Post-Retirement Increase starting on July 30, 2021 based on retiree’s effective date of retirement of the following percentages: • 3%, effective date of retirement prior to July 1, 1991 • 2%, effective date of retirement from July 1, 1991 to June 30, 2001 • 1%, effective date of retirement from July 1, 2001 to June 30, 2016 House Bill 252 provided for a one-time payment of $500.00 included in the pensioner’s November 30, 2021 monthly pension payment to all who retired as of July 1, 2021. The cost of this supplemental payment will be reimbursed by the State.