Embed Size (px)
Citation preview
Earth Surface Processes and LandformsEarth Surf. Process. Landforms 26, 885–900 (2001)DOI: 10.1002/esp.234
MAPPING DECAY: INTEGRATING SCALES OF WEATHERINGWITHIN A GIS
R. J. INKPEN,* D. FONTANA AND P. COLLIER
Department of Geography, University of Portsmouth, Buckingham Building, Lion Terrace, Portsmouth, Hampshire, PO1 3HE, UK
Received 29 March 2000; Revised 18 October 2000; Accepted 18 December 2000
ABSTRACT
It is possible to develop a stone weathering/degradation database with wide applicability using a geographic informationsystem (GIS) framework to integrate spatially and non-spatially referenced data. Two case studies are provided illustratingthe manner in which photographic information relevant to assessing stone degradation may be used within a GIS. A timesequence of old photographs of the Judges Lodgings, Oxford, is located within a relative reference framework andclassification of weathering forms undertaken. A single photograph of a wall of the School of Geography in Oxfordis located within an absolute spatial reference framework and weathering forms classified. In the latter example, theproblems of scale-dependent definitions of weathering forms are examined. Copyright 2001 John Wiley & Sons, Ltd.
KEY WORDS: geographic information system (GIS); stone weathering; scale
INTRODUCTION
Identification and mapping of weathering forms is essential for both practical remedial work and academicresearch. Building conservators, for example, require a rapid and consistent scheme for identifying the natureand extent of stone degradation to inform remedial strategies. Classification of stone weathering/degradationfeatures is also essential for research projects where the interpretation of spatial and temporal variationsin the degradation of stone requires identification of weathering forms and their association with particularweathering processes or combinations of processes. Translation of process/form relationships from laboratory-based studies to field-based investigation also requires careful observation of decay forms and their inter-relationships under actual conditions.
Classification systems have been devised based both upon laboratory work and upon visual observation ofspecific weathering forms on buildings. By mapping these forms and the spatial variability of environmentalparameters, such as moisture content and wind patterns, different spatial distributions can be correlated andcausal links inferred from field observations. Although classification schemes (e.g. Fitzner et al., 1992) beginto tackle the complex and intricate sets of relationships between weathering forms and possible mechanisms,there is a tendency to focus on a particular scale within any single study. The context of the scale of study andpossible relationships with other scales and other forms as well as the integration of data from other studiesare rarely considered. This paper suggests a possible means of integrating a range of studies and data sourcesinto a framework for the analysis of process/form relationships using a geographic information system (GIS).Integration of data into a GIS may help to build up layers of spatially referenced information which couldbe used, not only to interrogate hypotheses within a specific study, but also to provide a readily accessiblesource of information for other as yet unspecified questions.
In the context of this study, a GIS is regarded as an information system designed to operate with datareferenced by spatial or geographic coordinates. It can be viewed as both a database with specific capabilitiesfor data that are spatially referenced, and as a set of operations for manipulating and working with thosedata (Star and Estes, 1990). At a more general level Coppock and Rhind (1991, p. 22) regard a GIS as
* Correspondence to: R. J. Inkpen, Department of Geography, University of Portsmouth, Buckingham Building, Lion Terrace,Portsmouth, Hampshire, PO1 3HE, UK. E-mail: [email protected]
Copyright 2001 John Wiley & Sons, Ltd.
886 R. J. INKPEN, D. FONTANA AND P. COLLIER
‘any system for handling geographical data’. The key point about a GIS is made by Eastman (1992, p. 32)who states that: ‘With experience, GIS becomes simply an extension of one’s own analytical thinking. Thesystem has no inherent answers, only those of the analyst. It is a tool, just like statistics is a tool. It is a toolfor thought’. It is important to remember that a GIS of itself can provide no answers but it can, however,help in developing new ways of visualizing and analysing data with the investigator as the central figure indeveloping and testing ideas.
CLASSIFICATION OF WEATHERING
Classification systems usually try to link a weathering process or combination of processes to particular typesof weathering features. Links may be established from laboratory studies or from the common association ofparticular features with the presence of specific weathering agents. Sometimes, however, this tends to resultin correlation being equated with causation. The presence of high concentrations of salts and a particular setof weathering forms, for example, may be used to infer that degradation is solely a result of salt weatheringmechanisms. Although only one weathering agent may be identified, stone weathering and decay are moreprobably the product of a combination of factors such as the state of the stone, the continued supply of salt,the removal of weathered products and the position of the stone block or weathering form.
One of the simplest systems, devised by Camuffo et al. (1982), classifies weathered surfaces on the basisof colour. White surfaces are those that are rainwashed and are therefore identified as areas of surface losswhile black surfaces are areas of deposition where black crusts, such as sulphation crusts, form. Grey areasare areas of dust deposition rather than transitional zones between black and white areas. Location is centralto this classification system as the degree of exposure has an important bearing on whether or not a surfaceis rainwashed or sheltered. Other classification systems have concentrated on identification and mapping ofa selected range of features. Robinson and Williams (1996), for example, identified and mapped areas ofactive and inactive cavernous weathering on sandstone blocks on churches of different ages in West Sussex.From these data they suggest that a great deal of cavernous weathering occurred during the eighteenth andnineteenth centuries.
Zezza (1996) identified and mapped different types of weathering on four buildings in the Mediterranean:Cadiz Cathedral, Bari Cathedral, the Church of Sta Marija Ta in Cwerra, Malta, and the Sanctuary of DemeterElsusis, Greece. Zezza used a methodology identified as Integrated Computerized Analysis (ICA) for weather-ing to relate different types of information about weathering in a common framework. This method combinesidentification and mapping of building lithology with information on the distribution of weathering forms andother indices of alteration such as ultrasonic identification of subsurface degradation. Although this type ofintegrated system represents the early stages of development in classification, the potential for deriving usefulinformation for both understanding weathering behaviour and developing appropriate conservation strategiescannot be underestimated.
Central to all these schemes, however, is development of an appropriate classification system for weather-ing features. Fitzner (1990) developed a system based on hierarchy of feature classification (see also Fitzneret al., 1992, 1996). This system defines four groups of weathering forms at the highest level in the classifi-cation hierarchy: loss of stone material, deposits, stone detachment and fissures/deformation. Within each ofthese groups there are further subdivisions into 29 weathering forms with finer divisions down to individualweathering features. Further differentiation is possible by adding an ‘intensity parameter’ to each individualfeature. The relative success of these systems for aiding conservation work is in the early stage of evaluation.
Another example of a classification system is the durability index used by the Building Research Establish-ment (BRE, UK) in combination with knowledge of the structure of a building to define damage zones. Foreach area of the building the mix of factors that produces its weathering environment is reduced to a potentialdamage indicator. The classification is then used to identify which durability class would be appropriate forparticular zones. Approaches such as these tend to ignore the problem of equating damage on buildings witha laboratory-derived measure of durability. The damage potential of any zone is the result of a combinationof factors that vary both spatially and temporally. The same damage may be present on different parts of the
Copyright 2001 John Wiley & Sons, Ltd. Earth Surf. Process. Landforms 26, 885–900 (2001)
INTEGRATING SCALES OF WEATHERING IN A GIS 887
building, but result from the combination of a different set of factors. The durability index is a general index,whilst weathering environments result from specific combinations of different factors.
A simple classification scheme based on colour and surface disruption characteristics was used by Antilland Viles (1998) to map over 700 individually recognizable blocks of stone in an external wall of WorcesterCollege, Oxford. The resulting maps (Antill and Viles, 1998, p. 36, Figures 1 and 2) illustrated the distributionof weathering forms. Unfortunately, where block boundaries could not be identified because of the extent ofdamage no weathering forms could be mapped. Similar problems were experienced by Halsey et al. (1996)who analysed the weathering of Midlands sandstone churches using standard-sized quadrats and found itdifficult to map weathering forms according to this standard unit. Schemes such as those devised by Fitzner(1990) and the BRE have attempted to overcome these problems by mapping the extent of weathering formsacross blocks, although the former then expresses these forms within the context of blocks. Within eachof these studies there is recognition that weathering forms are visible within and across the units of study.However, the integration of observations across unit boundaries remains problematic and methods, if tried,are not usually transferable to other studies. However, within a GIS, the definition of the unit of study iscontrolled by the nature in which the raw data are stored, not necessarily by the requirements of a specificproject. It may therefore be possible to compare distributions of weathering forms produced using differentdefinitions of the unit of study.
MAPPING CHANGE
General requirements
Any classification system employed should be easy to use in the field and permit reproducible classificationby different operators. Although there is at present no standard classification scheme for identification ofweathering form, terms such as black crusts, flaking, blisters and scaling are widely used and clearly defined(e.g. Fitzner et al., 1992, 1996; Robinson and Williams, 1996; Antill and Viles, 1998). Most of these schemesare based on the visual appearance of the surface in terms of colour, texture and, where present, scaleof disruption. Further subdivision usually involves the assumption of particular processes being associatedwith forms. Such subdivisions, however, often require detailed knowledge of laboratory production of surfacealteration and/or experience of surveying weathering forms on buildings, or both. The two examples of the useof GIS for mapping forms outlined below both use simple classification schemes to avoid, as far as possible,any implicit suggestions concerning processes. An additional benefit of using a solely visual and relativelycrude classification scheme is that it is relatively easy for other investigators to use similar definitions andcontrast their results. This could help to establish, at best, a common framework for defining different typesof weathering forms and, at worst, a basis for dialogue between groups, which is sensitive to classificationproblems associated with different buildings, stone types and even national conventions.
The visual basis for the classification schemes in the following case studies necessitates the use of anadaptable image recording method for analysis of weathered surfaces at a range of scales. Photography,whether calibrated or uncalibrated, provides such a resource (Inkpen et al., 2000). Photography of varioustypes, therefore, forms the visual basis of classification in both case studies. This should not, however, beinterpreted as implying that photography is either the best or the only way in which visual data can berecorded or integrated into a GIS. Manual recording of weathering forms provides data that can be spatiallyreferenced (Fitzner, 1990; Fitzner et al., 1992, 1996; Antill and Viles, 1998). In addition, such data, whencombined with photographic and image analysis work, provide essential ground truth, ground verification orreference information (Lillesand and Kiefer, 2000) for interpretation of weathering forms. The value of thephotograph lies in the ability to reinterpret using a common source and to act as a specific and potentiallycoordinating layer within the GIS.
Photography provides the basis for a common spatial framework for all data collected for different studiesthat deal with the same building. Inkpen et al (2000), for example, note that the stereo-photography of theSchool of Geography wall in Oxford can be used to accurately locate any point on the wall to within 200 µmin the x, y and z directions. Any subsequent study can use the same spatial reference system by relatingimagery taken at that time to the same control points or common points used in the Inkpen et al. (2000)
Copyright 2001 John Wiley & Sons, Ltd. Earth Surf. Process. Landforms 26, 885–900 (2001)
888 R. J. INKPEN, D. FONTANA AND P. COLLIER
study. Likewise, establishing a common spatial framework for data means that any samples collected can beaccurately located as can spatial patterns of alterations at a point in time or between time periods. Spatiallyunreferenced data can also be added to the GIS as either point data or as a distinct layer.
An important point with regard to the development of such weathering geographic information systems isthat the level of interpretation is kept as a series of distinct layers separate from the data upon which theinterpretations are based. The classification schemes set out for each example below are clearly stated andthe patterns of forms that they define are presented as distinct layers within the GIS. The original imageryis still available in its relatively raw form for other forms of interrogation or subsequent reassessment ofthe classification scheme by another operator. This is not to suggest that the imagery is theory-free as anyinformation is collected with a particular purpose in mind and this purpose will affect what is collected andhow it is collected (Rhoads and Thorn, 1996). Despite this, the use of the imagery and its interpretation isnot fixed: it is only constrained. The imagery was collected to study a particular phenomenon, in this casestone weathering, with its subsequent use not restricted to an individual investigator’s perception of thatphenomenon. The potential of the imagery for other uses and its reuse exists; there is, therefore, researchpotential (Collier et al., 1995; Fontana et al., 1999) within the raw data that could be exploited further.
Relative assessment of change in weathering over time: Judges Lodgings, Oxford
The archive of the Heritage, Stone and Masonry section at BRE (UK) holds numerous sets of photographsof buildings taken at various dates. The Judges Lodgings at 16 St Giles, Oxford, has imagery spanning40 years taken in 1892, 1914 and 1932. This building is located in the centre of Oxford and is constructedfrom local Headington stone. The 1892 and 1932 images were taken with unknown cameras and are thereforetreated as uncalibrated photographs. The 1914 image is from a postcard and is of a much poorer resolutionthan the other images. No accurate measurements could be taken of the lodgings, which may have undergonealterations and cleaning since the imagery was initially taken. This represents almost the worst-case scenariofor establishing a spatial reference framework as no absolute distances are available and any comparison willbe dealing with relative dimensions.
Each image was scanned at a resolution of 800 dpi (uninterpolated) and stored in tag image file format(TIFF) for image analysis and use within a GIS. This scanning resolution was sufficient to resolve all the sharpvisible detail in the photographs. The first task was to establish a common relative spatial reference frameworkbetween the images. Although no absolute measurements could be made there were fixed points visible on eachimage that could be used as control points between images. Specifically, the window frames, the doorframeand the ironwork provided sufficient points (eight in all) to provide a basis for geo-coordinating the imagesinto a common relative spatial reference framework. The 1892 photograph was used as the base image andthe other two photographs corrected to the location of the control points in that image (Figure 1). Once acommon reference system had been established, weathering forms within each image could be identified andmapped within that framework. For the purposes of this study, a subsection of the building, the central sectionof the front, was mapped in detail. This section had the largest areas of uninterrupted stone work visible in allphotographs and so was the section of the building where comparison of change in weathering forms betweentime periods was clearest.
All the photographs were black and white and so only weathering forms that could be identified bychanges in grey scale and by changes in surface texture were classified. A simple four-fold classificationwas used: blackened areas, white areas, grey areas and disrupted areas. Blackened areas were interpretedas representing areas of deposition, white areas as zones of runoff or wash and grey areas as relativelyundisturbed surfaces. Disrupted areas were interpreted as areas that had either flaked or blistered, a form ofdecay common to Headington stone as noted by Arkell (1947), Oakeshott (1975) and Antill and Viles (1998).A simple classification also meant that differences in lighting conditions between the photographs and sopotential differences in spectral response of the different surfaces were not a major problem in distinguishingbetween weathering forms. The resolution of the photography, particularly in the case of the 1914 postcard,would have made a complicated classification scheme difficult to implement in any consistent manner. Usingthis classification scheme, the extent of each form was mapped directly onto each geo-coordinated imageseparately within MapInfo. Mapping was performed by a single operator by digitizing on-screen the extent of
Copyright 2001 John Wiley & Sons, Ltd. Earth Surf. Process. Landforms 26, 885–900 (2001)

INTEGRATING SCALES OF WEATHERING IN A GIS 889
Figure 1. Judges Lodgings, Oxford: top, 1892; middle, 1914; bottom, 1932
each weathering form. The same operator mapped each weathering form on each image separately as a singlelayer of objects. This meant that the location and definition of a weathering form interfered as little as waspossible with decisions on the location and classification of the other forms. Once all the weathering formson all the images had been mapped, the layers were combined and were overlaid on the 1892 photograph.
Copyright 2001 John Wiley & Sons, Ltd. Earth Surf. Process. Landforms 26, 885–900 (2001)

890 R. J. INKPEN, D. FONTANA AND P. COLLIER
Figures 2–4 illustrate the blackened areas overlaid on the 1892, 1914 and 1932 images. The extension ofthe blackened areas beyond the edge of the 1892 image is not a problem with the spatial referencing, but withthe original cropping of the photograph which cut off too much from the 1892 image. In addition to a visualimpression of change, a measure of the relative magnitude of changes can also be collected from the GIS foreach weathering form as a whole and for specific areas of the front. Each self-contained region of a particularweathering form can be identified as an entity within the GIS and assigned attributes. At the simplest level thiscould just be an identification (ID) number. Specific properties such as those concerning area and perimetercan also be extracted from the GIS and attributed to the region. The ID can also be linked to other data thatmay be stored in spreadsheet format such as strength properties, density and saturation coefficients. In thisway overall change in the extent of each weathering class may be measured between time periods as wellas the amount of change in specific locations on the stone surface. Comparable measurements of the extentof forms are possible, despite the lack of absolute distances, because the common relative spatial frameworkmeans that relative distances and areas upon each image are the same. Not only can areas be compared, butthe relative shapes of patches of weathering forms can also be compared within this common framework.The amount of relative change (Table I) illustrates that there is a large overall change in the proportion ofeach weathering form between each time period.
The change in the extent of each weathering form and the locations of most active change can be seen fromthe distributions derived from each image. A progressive blackening of the central zone of the building canbe seen between 1892 and 1914. Some areas of disrupted surface do remain, but these tend to be confined toareas close to the windows and at the edges of the wall. From 1914 to 1932, there appears to be a decreasein the extent of blackened areas and an increase in disrupted surfaces. Areas close to the windows and edgesof the wall seem to act as a focus for change, with disrupted areas apparently expanding from them intothe blackened areas. In the case of both blackened and disrupted surfaces the number of discrete regionsmapped decreases from 1892 to 1914, but remains the same between 1914 and 1932. White areas do notseem to alter much in their overall dimensions, number or their location throughout the time period, tendingto remain below the window ledges in each image. The blackened area appears to coalesce and stabilize asa single entity at the top of the front. The disrupted surface dispersed patches likewise seem to create one ortwo regions of common surface features by 1932. It is tempting to view the changes as if the coalescing of
Figure 2. Base image of central area of Judges Lodgings from 1892 with blackened areas mapped on from 1892
Copyright 2001 John Wiley & Sons, Ltd. Earth Surf. Process. Landforms 26, 885–900 (2001)

INTEGRATING SCALES OF WEATHERING IN A GIS 891
Figure 3. Base image of central area of Judges Lodgings from 1892 with blackened areas mapped on from 1914
Figure 4. Base image of central area of Judges Lodgings from 1892 with blackened areas mapped on from 1932
other discrete entities were producing a single entity or few entities. The merging of different areas of similarsurface characteristics produces this impression. It does, however, highlight the point that the definition ofthe entity of interest is operator-dependent within the GIS, not by the unit of study, and so the production ofentities at different scales is possible.
Copyright 2001 John Wiley & Sons, Ltd. Earth Surf. Process. Landforms 26, 885–900 (2001)
892 R. J. INKPEN, D. FONTANA AND P. COLLIER
Table I. Relative areas of weathering forms on Judges Lodgings (areas definedrelative to reference system used in 1892 photograph)
Year Mean Standard deviation Minimum Maximum
Darkened1892 155Ð5 253Ð3 5 8841914 794Ð3 1595Ð4 10 48311932 433Ð2 1080Ð4 9 3842
White1892 59Ð6 117Ð2 1 567Ð61914 80 24Ð3 33Ð5 98Ð81932 99Ð9 121Ð5 24 424Ð6
Disrupted1892 511Ð2 587Ð4 25 13811914 527Ð4 460Ð4 136 16691932 1330Ð7 1421Ð9 2 4483
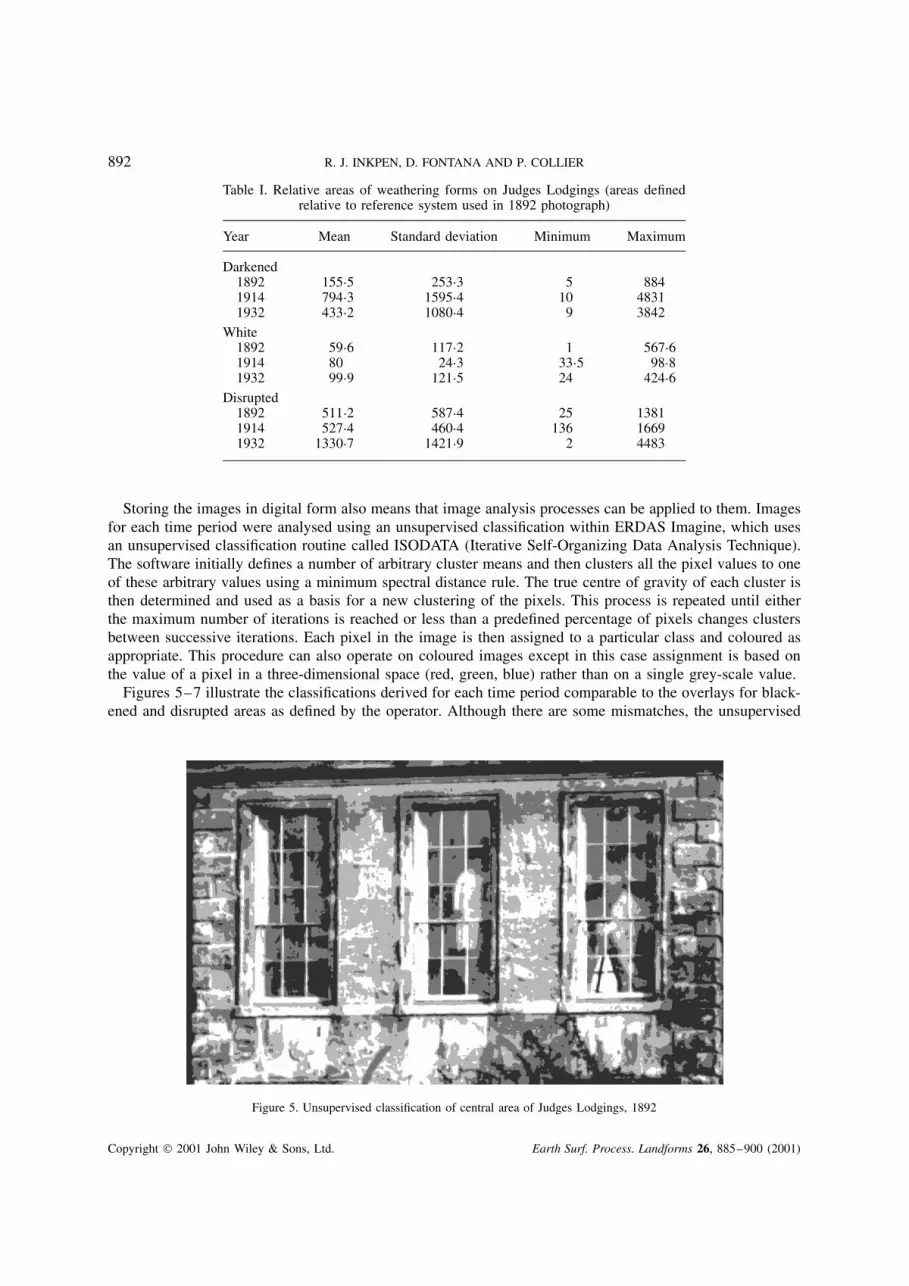
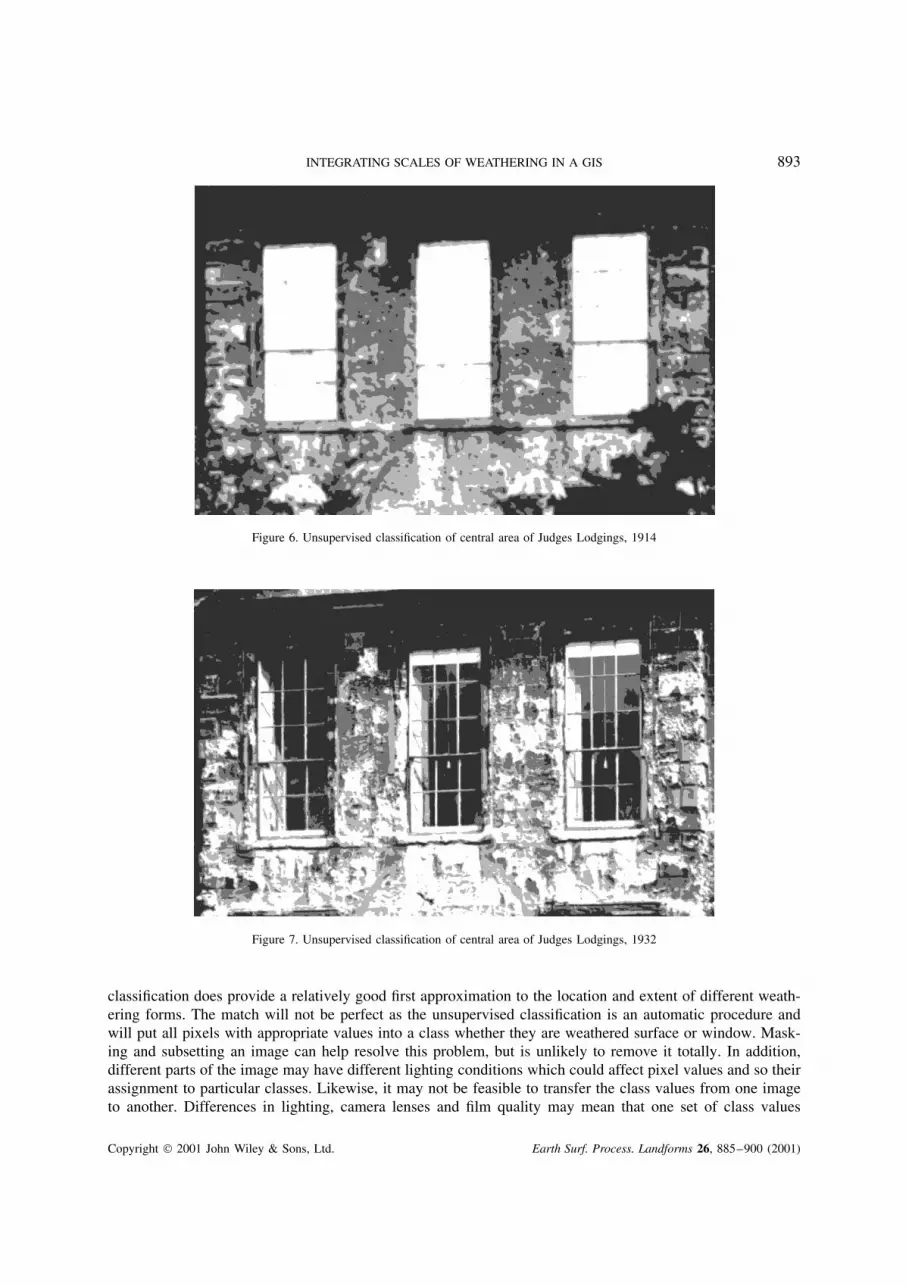
Storing the images in digital form also means that image analysis processes can be applied to them. Imagesfor each time period were analysed using an unsupervised classification within ERDAS Imagine, which usesan unsupervised classification routine called ISODATA (Iterative Self-Organizing Data Analysis Technique).The software initially defines a number of arbitrary cluster means and then clusters all the pixel values to oneof these arbitrary values using a minimum spectral distance rule. The true centre of gravity of each cluster isthen determined and used as a basis for a new clustering of the pixels. This process is repeated until eitherthe maximum number of iterations is reached or less than a predefined percentage of pixels changes clustersbetween successive iterations. Each pixel in the image is then assigned to a particular class and coloured asappropriate. This procedure can also operate on coloured images except in this case assignment is based onthe value of a pixel in a three-dimensional space (red, green, blue) rather than on a single grey-scale value.
Figures 5–7 illustrate the classifications derived for each time period comparable to the overlays for black-ened and disrupted areas as defined by the operator. Although there are some mismatches, the unsupervised
Figure 5. Unsupervised classification of central area of Judges Lodgings, 1892
Copyright 2001 John Wiley & Sons, Ltd. Earth Surf. Process. Landforms 26, 885–900 (2001)
INTEGRATING SCALES OF WEATHERING IN A GIS 893
Figure 6. Unsupervised classification of central area of Judges Lodgings, 1914
Figure 7. Unsupervised classification of central area of Judges Lodgings, 1932
classification does provide a relatively good first approximation to the location and extent of different weath-ering forms. The match will not be perfect as the unsupervised classification is an automatic procedure andwill put all pixels with appropriate values into a class whether they are weathered surface or window. Mask-ing and subsetting an image can help resolve this problem, but is unlikely to remove it totally. In addition,different parts of the image may have different lighting conditions which could affect pixel values and so theirassignment to particular classes. Likewise, it may not be feasible to transfer the class values from one imageto another. Differences in lighting, camera lenses and film quality may mean that one set of class values
Copyright 2001 John Wiley & Sons, Ltd. Earth Surf. Process. Landforms 26, 885–900 (2001)

894 R. J. INKPEN, D. FONTANA AND P. COLLIER
is inappropriate for another image of the same building at a different time period. The advantage of suchclassification is that in some cases a relatively quick and good first approximation of the extent of weatheringforms can be gained from a large number of images covering a vast area.
There are a number of severe limitations on the images of the Judges Lodgings. The images are of relativelypoor resolution and this can make the identification of the boundary of weathering forms problematic. Zoomingin on an area may not help distinguish where the boundaries of weathering forms are. Defining boundariesdoes not depend upon identifying the change in colour between two pixels, but involves the complex interplaybetween the operator and different scales of cues within the image. Identifying the limit of a blackened areainvolves identifying a distinction between it and the next class of form. Viewing the two forms togetherpermits such a distinction to be drawn. Zooming in on an image to individual pixels destroys the contextof the pixels and so their relationship to the weathering forms that could be observed at another scale. Thisimplies that mapping forms is scale-dependent and boundaries should be based on the most appropriate scaleat which forms are visible and not on the smallest scale to which observations can be made. For this study,boundaries were defined by viewing the images at twice normal magnification. Another limitation was thatthese photographs were the only ones available for the Judges Lodgings. If more photographs could befound and they had common identifiable points in them they could be incorporated into the GIS as spatiallyreferenced information, but it is unlikely they would refer to identical time periods. Without closer rangeimagery, classification of weathering forms and linking between scales is limited to the resolution of theavailable photography.
Identification and integration of weathering classifications between images: School of Geography wall,Oxford
The photographs of this wall are described by Inkpen et al. (2000). The wall is constructed of Headingtonstone and was erected in 1898. Stereo-pairs of photographs of the wall were taken from two distances,one set covering the whole wall, the other concentrating on an area of particular interest (Figure 8). Takingtwo sets of photographs means that the potential range of scales over which forms can be identified andintegrated is increased. All photographs were scanned at 1000 dpi (uninterpolated) and stored as image filesof approximately 15–20 Mbyte. The wall had previously been surveyed (Inkpen et al., 2000) so that any pointcould be located to within 200 µm in the x, y and z directions. This meant that both scales of photographycould be located within the same common absolute spatial framework.
Figure 8. Photograph of wall at School of Geography, Oxford, with blocks visible from photograph marked on. Wall approximately5 m by 2 m
Copyright 2001 John Wiley & Sons, Ltd. Earth Surf. Process. Landforms 26, 885–900 (2001)
INTEGRATING SCALES OF WEATHERING IN A GIS 895
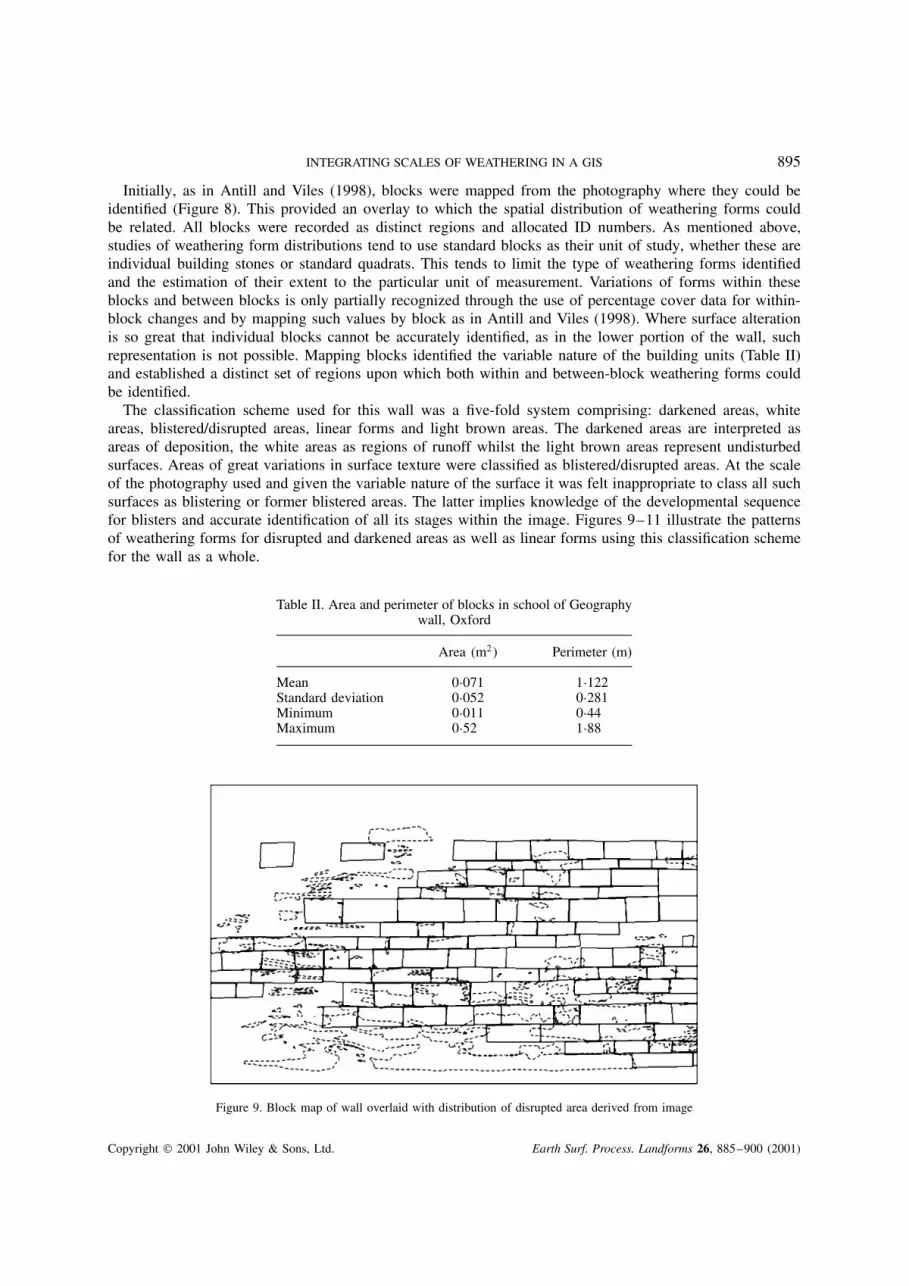
Initially, as in Antill and Viles (1998), blocks were mapped from the photography where they could beidentified (Figure 8). This provided an overlay to which the spatial distribution of weathering forms couldbe related. All blocks were recorded as distinct regions and allocated ID numbers. As mentioned above,studies of weathering form distributions tend to use standard blocks as their unit of study, whether these areindividual building stones or standard quadrats. This tends to limit the type of weathering forms identifiedand the estimation of their extent to the particular unit of measurement. Variations of forms within theseblocks and between blocks is only partially recognized through the use of percentage cover data for within-block changes and by mapping such values by block as in Antill and Viles (1998). Where surface alterationis so great that individual blocks cannot be accurately identified, as in the lower portion of the wall, suchrepresentation is not possible. Mapping blocks identified the variable nature of the building units (Table II)and established a distinct set of regions upon which both within and between-block weathering forms couldbe identified.
The classification scheme used for this wall was a five-fold system comprising: darkened areas, whiteareas, blistered/disrupted areas, linear forms and light brown areas. The darkened areas are interpreted asareas of deposition, the white areas as regions of runoff whilst the light brown areas represent undisturbedsurfaces. Areas of great variations in surface texture were classified as blistered/disrupted areas. At the scaleof the photography used and given the variable nature of the surface it was felt inappropriate to class all suchsurfaces as blistering or former blistered areas. The latter implies knowledge of the developmental sequencefor blisters and accurate identification of all its stages within the image. Figures 9–11 illustrate the patternsof weathering forms for disrupted and darkened areas as well as linear forms using this classification schemefor the wall as a whole.
Table II. Area and perimeter of blocks in school of Geographywall, Oxford
Area �m2� Perimeter (m)
Mean 0Ð071 1Ð122Standard deviation 0Ð052 0Ð281Minimum 0Ð011 0Ð44Maximum 0Ð52 1Ð88
Figure 9. Block map of wall overlaid with distribution of disrupted area derived from image
Copyright 2001 John Wiley & Sons, Ltd. Earth Surf. Process. Landforms 26, 885–900 (2001)
896 R. J. INKPEN, D. FONTANA AND P. COLLIER
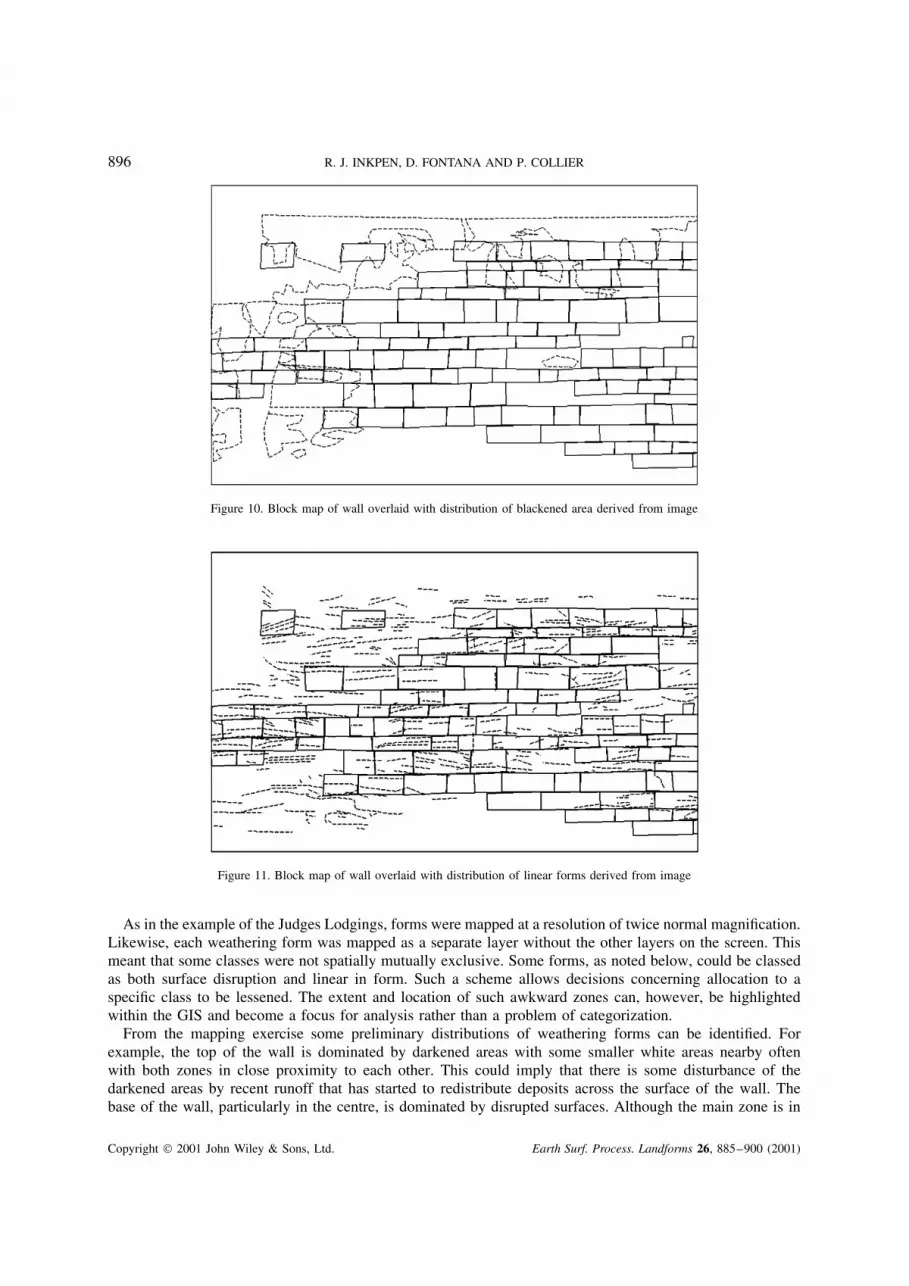
Figure 10. Block map of wall overlaid with distribution of blackened area derived from image
Figure 11. Block map of wall overlaid with distribution of linear forms derived from image
As in the example of the Judges Lodgings, forms were mapped at a resolution of twice normal magnification.Likewise, each weathering form was mapped as a separate layer without the other layers on the screen. Thismeant that some classes were not spatially mutually exclusive. Some forms, as noted below, could be classedas both surface disruption and linear in form. Such a scheme allows decisions concerning allocation to aspecific class to be lessened. The extent and location of such awkward zones can, however, be highlightedwithin the GIS and become a focus for analysis rather than a problem of categorization.
From the mapping exercise some preliminary distributions of weathering forms can be identified. Forexample, the top of the wall is dominated by darkened areas with some smaller white areas nearby oftenwith both zones in close proximity to each other. This could imply that there is some disturbance of thedarkened areas by recent runoff that has started to redistribute deposits across the surface of the wall. Thebase of the wall, particularly in the centre, is dominated by disrupted surfaces. Although the main zone is in
Copyright 2001 John Wiley & Sons, Ltd. Earth Surf. Process. Landforms 26, 885–900 (2001)
INTEGRATING SCALES OF WEATHERING IN A GIS 897
the central base, above this are a number of distinct linear zones of disruption that can also be seen spreadingtowards the sides of the wall above. Some of these linear forms are also visible in Figure 11. Thin regionsof disrupted surface were classed as both disrupted surfaces and linear forms because it was felt that suchfeatures exhibited a trend similar to that of other linear features in the image, making exclusion from thisclass problematic. Each linear form identified was given an individual ID and classified as a thin disruptedsurface or not by an attribute code. This means that such forms could be excluded from subsequent analysisif further investigation suggested a different origin from other linear forms on the wall. The distribution oflinear forms is some places appear similar to distribution patterns found on walls that have been covered byclimbing vegetation. Oakeshott (1975) suggests that such vegetation was a common feature on Oxford wallsin the 1950s and the present-day linear forms observed may reflect this.
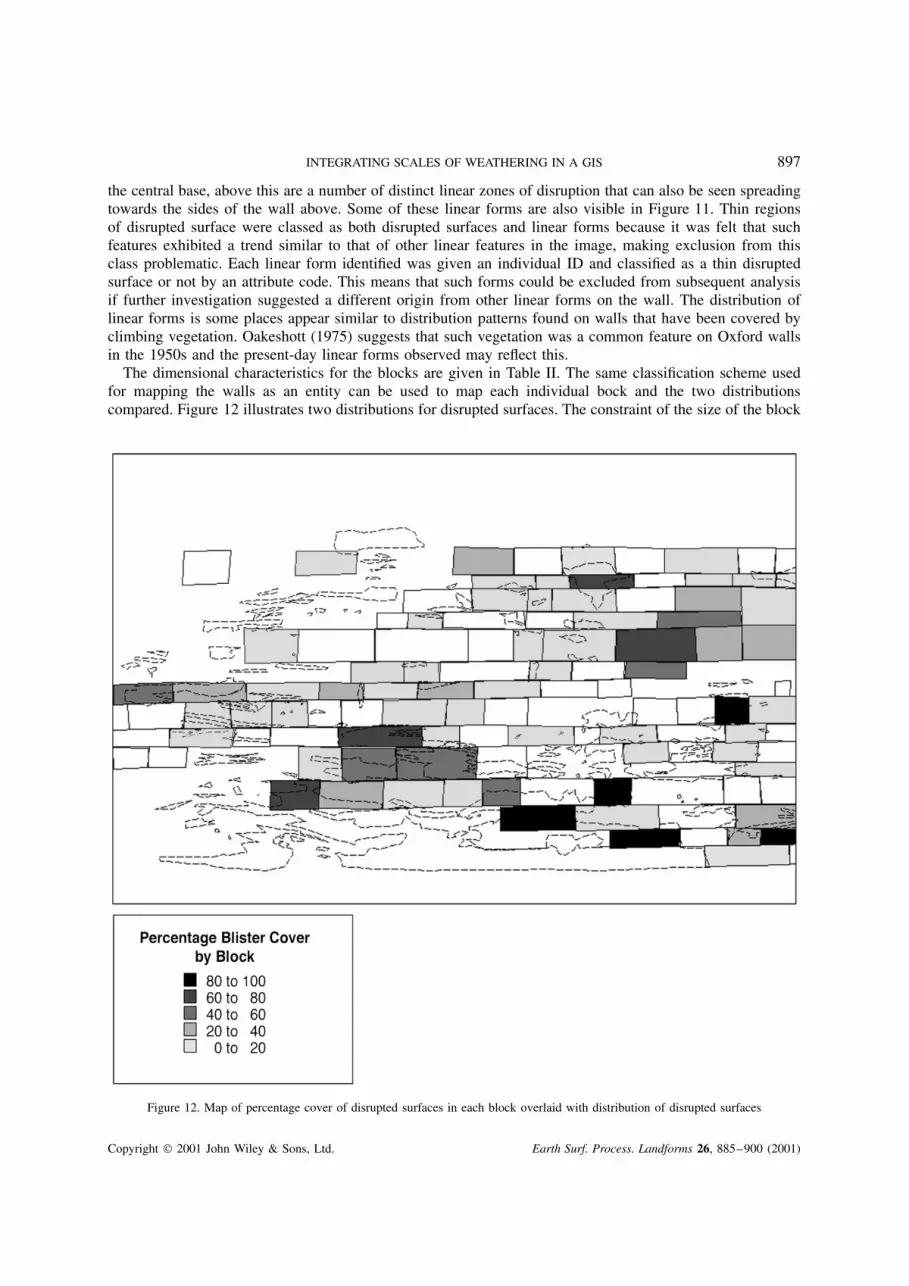
The dimensional characteristics for the blocks are given in Table II. The same classification scheme usedfor mapping the walls as an entity can be used to map each individual bock and the two distributionscompared. Figure 12 illustrates two distributions for disrupted surfaces. The constraint of the size of the block
Figure 12. Map of percentage cover of disrupted surfaces in each block overlaid with distribution of disrupted surfaces
Copyright 2001 John Wiley & Sons, Ltd. Earth Surf. Process. Landforms 26, 885–900 (2001)
898 R. J. INKPEN, D. FONTANA AND P. COLLIER
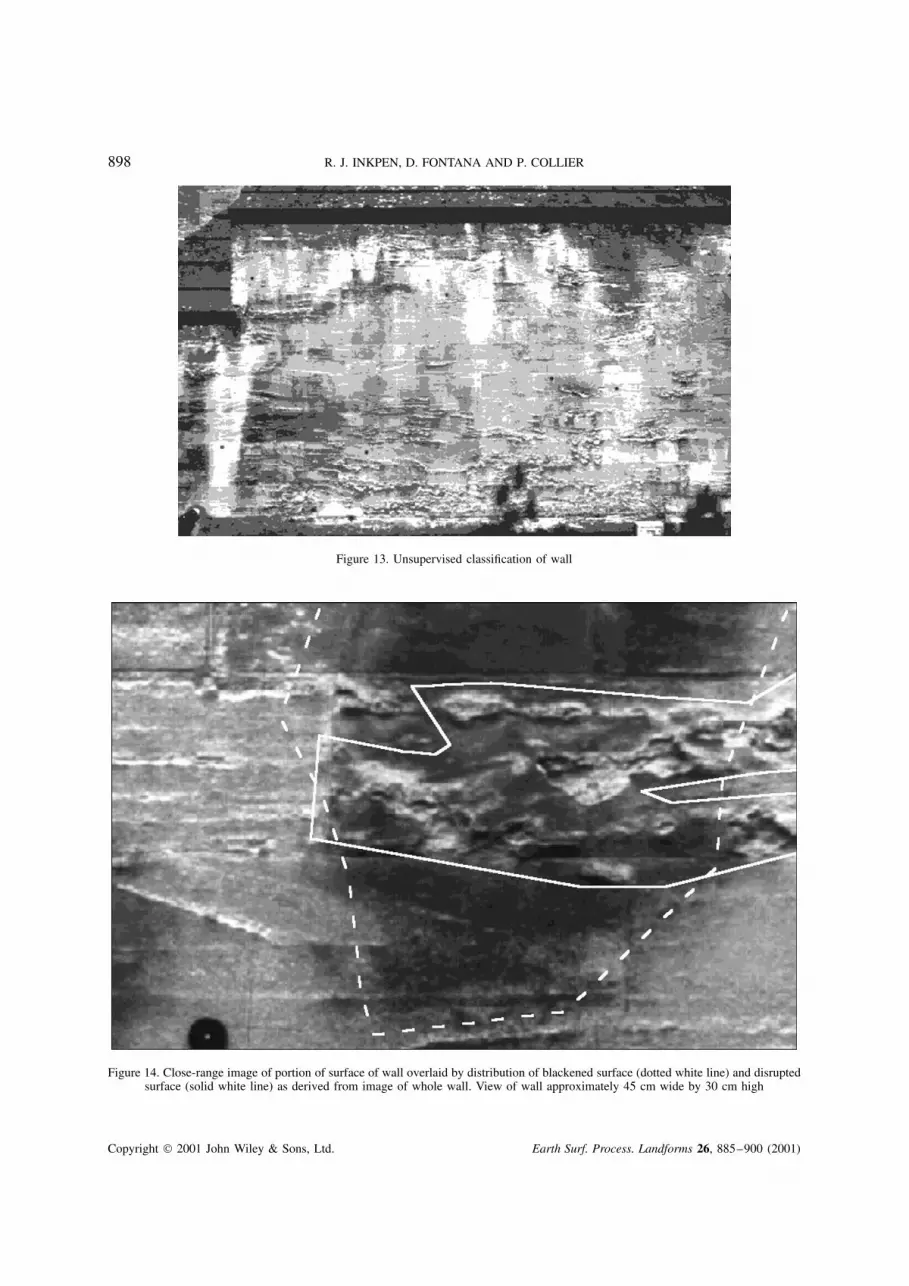
Figure 13. Unsupervised classification of wall
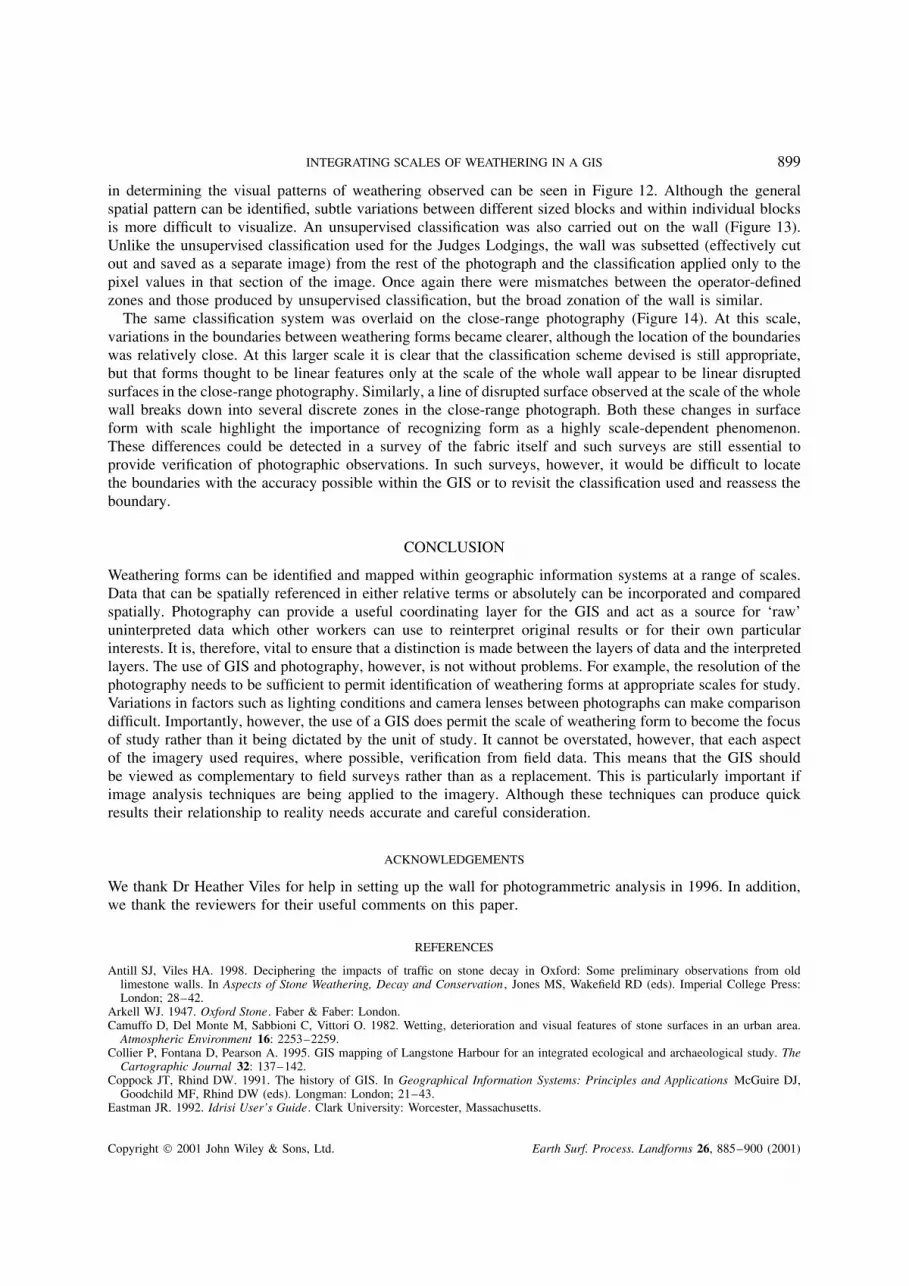
Figure 14. Close-range image of portion of surface of wall overlaid by distribution of blackened surface (dotted white line) and disruptedsurface (solid white line) as derived from image of whole wall. View of wall approximately 45 cm wide by 30 cm high
Copyright 2001 John Wiley & Sons, Ltd. Earth Surf. Process. Landforms 26, 885–900 (2001)
INTEGRATING SCALES OF WEATHERING IN A GIS 899
in determining the visual patterns of weathering observed can be seen in Figure 12. Although the generalspatial pattern can be identified, subtle variations between different sized blocks and within individual blocksis more difficult to visualize. An unsupervised classification was also carried out on the wall (Figure 13).Unlike the unsupervised classification used for the Judges Lodgings, the wall was subsetted (effectively cutout and saved as a separate image) from the rest of the photograph and the classification applied only to thepixel values in that section of the image. Once again there were mismatches between the operator-definedzones and those produced by unsupervised classification, but the broad zonation of the wall is similar.
The same classification system was overlaid on the close-range photography (Figure 14). At this scale,variations in the boundaries between weathering forms became clearer, although the location of the boundarieswas relatively close. At this larger scale it is clear that the classification scheme devised is still appropriate,but that forms thought to be linear features only at the scale of the whole wall appear to be linear disruptedsurfaces in the close-range photography. Similarly, a line of disrupted surface observed at the scale of the wholewall breaks down into several discrete zones in the close-range photograph. Both these changes in surfaceform with scale highlight the importance of recognizing form as a highly scale-dependent phenomenon.These differences could be detected in a survey of the fabric itself and such surveys are still essential toprovide verification of photographic observations. In such surveys, however, it would be difficult to locatethe boundaries with the accuracy possible within the GIS or to revisit the classification used and reassess theboundary.
CONCLUSION
Weathering forms can be identified and mapped within geographic information systems at a range of scales.Data that can be spatially referenced in either relative terms or absolutely can be incorporated and comparedspatially. Photography can provide a useful coordinating layer for the GIS and act as a source for ‘raw’uninterpreted data which other workers can use to reinterpret original results or for their own particularinterests. It is, therefore, vital to ensure that a distinction is made between the layers of data and the interpretedlayers. The use of GIS and photography, however, is not without problems. For example, the resolution of thephotography needs to be sufficient to permit identification of weathering forms at appropriate scales for study.Variations in factors such as lighting conditions and camera lenses between photographs can make comparisondifficult. Importantly, however, the use of a GIS does permit the scale of weathering form to become the focusof study rather than it being dictated by the unit of study. It cannot be overstated, however, that each aspectof the imagery used requires, where possible, verification from field data. This means that the GIS shouldbe viewed as complementary to field surveys rather than as a replacement. This is particularly important ifimage analysis techniques are being applied to the imagery. Although these techniques can produce quickresults their relationship to reality needs accurate and careful consideration.
ACKNOWLEDGEMENTS
We thank Dr Heather Viles for help in setting up the wall for photogrammetric analysis in 1996. In addition,we thank the reviewers for their useful comments on this paper.
REFERENCES
Antill SJ, Viles HA. 1998. Deciphering the impacts of traffic on stone decay in Oxford: Some preliminary observations from oldlimestone walls. In Aspects of Stone Weathering, Decay and Conservation , Jones MS, Wakefield RD (eds). Imperial College Press:London; 28–42.
Arkell WJ. 1947. Oxford Stone. Faber & Faber: London.Camuffo D, Del Monte M, Sabbioni C, Vittori O. 1982. Wetting, deterioration and visual features of stone surfaces in an urban area.
Atmospheric Environment 16: 2253–2259.Collier P, Fontana D, Pearson A. 1995. GIS mapping of Langstone Harbour for an integrated ecological and archaeological study. The
Cartographic Journal 32: 137–142.Coppock JT, Rhind DW. 1991. The history of GIS. In Geographical Information Systems: Principles and Applications McGuire DJ,
Goodchild MF, Rhind DW (eds). Longman: London; 21–43.Eastman JR. 1992. Idrisi User’s Guide. Clark University: Worcester, Massachusetts.
Copyright 2001 John Wiley & Sons, Ltd. Earth Surf. Process. Landforms 26, 885–900 (2001)
900 R. J. INKPEN, D. FONTANA AND P. COLLIER
Fitzner B. 1990. Mapping of natural stone monuments – documentation of lithotypes and weathering forms. In Analytical Methodologiesfor the Investigation of Damaged Stone, Veniale F, Zezza U (eds). Proceedings of the advanced workshop, Pavia, 14–21 October1990. La Goliardica Pavese.
Fitzner B, Heinrichs K, Kownatzki R. 1992. Classification and mapping of weathering forms. In Proceedings of the Seventh InternationalCongress on Deterioration and Conservation of Stone, Lisbon, 15–18 October 1992. Laboratorio Nacional de Engenharia Civil:957–968.
Fitzner B, Heinrichs K, Volker M. 1996. Monument mapping – a contribution to monument preservation. In Origins, Mechanismsand Effects of Salt on Degradation of Monuments in Marine and Continental Environments, Zezza F (ed.). Proceedings EuropeanCommission Research Workshop, March 25–27 1996, Bari, Italy. Protection and Conservation of the European Cultural HeritageResearch Report No. 4: 345–355.
Fontana D, Collier P, Inkpen RJ. 1999. A GIS approach to interpreting indicators of sea-level change: illustrations from SouthernEngland. In GIS and New Advances in Integrated Coastal Management, Brest, 9–11 September, 1999. Ifremer: Brest.
Halsey DP, Dews SJ, Mitchell DJ, Harris FC. 1996. The black soiling of sandstone buildings in the west Midlands England: regionalvariations and decay mechanisms. In Processes of Urban Stone Decay , Smith BJ, Warke PA (eds). Donhead: London; 53–65.
Inkpen RJ, Collier P, Fontana D. 2000. Close-range photogrammetric analysis of rock surfaces. Zeitschrift fur Geomorphologie N.F.Suppl. Bd. 120: 67–81.
Lillesand TM, Kiefer RW. 2000. Remote Sensing and Image Interpretation (4th edn). John Wiley & Sons: Chichester.Oakeshott WF (ed.). 1975. Oxford Stone Restored: the Work of the Oxford Historic Buildings Fund, 1957–1974 . Oxford University
Press: Oxford.Rhoads BL, Thorn CE. 1996. Toward a philosophy of geomorphology. In The Scientific Nature of Geomorphology , Rhoads BL,
Thorn CE (eds). John Wiley & Sons: Chichester; 115–143.Robinson DA, Williams RBG. 1996. An analysis of the weathering of Wealden sandstone churches. In Processes of Urban Stone Decay ,
Smith BJ, Warke PA (eds). Donhead: London; 133–149.Star J, Estes J. 1990. Geographic Information Systems: An Introduction . Prentice-Hall: Englewood, New Jersey.Zezza F. 1996. Decay patterns of weathered stones in marine environments. In Origins, Mechanisms and Effects of Salts on Degradation
of Monuments in Marine and Continental Environments, Zezza F (ed.). Proceedings European Commission Research Workshop, March25–27 1996, Bari, Italy. Protection and Conservation of the European Cultural Heritage Research Report No. 4: 99–130.
Copyright 2001 John Wiley & Sons, Ltd. Earth Surf. Process. Landforms 26, 885–900 (2001)