Embed Size (px)
Citation preview

EARTH SURFACE PROCESSES AND LANDFORMS, VOL. 14,383-398 (1989)
RATES AND PATTERNS OF BEDROCK DENUDATION BY COASTAL SALT SPRAY WEATHERING:
A SEVEN-YEAR RECORD
D. N. MOTTERSHEAD
Edge Hill College of Higher Education, St. Helens Road, Ormskirk. Lancashire L39 4QP. U.K.
Received 26 February 1988 Revised 8 November 1989
ABSTRACT
Rapid surface lowering of bedrock is taking place in the supratidal zone by salt spray weathering. A seven-year run of data demonstrates a mean rate of lowering of 0-625 mm a-'. Considerable variation exists in annual point lowering values within measurement sites, although between-site variation is not significant. Aggregate year to year variations in surface lowering are not significant. Spatial variation in individual point values may be compensated by temporal variation over an 1 1-year period. There is a marked summer maximum in surface lowering rate, and this is strongly correlated with monthly air temperature. Spatially and temporally episodic swelling of the rock surface is demonstrated. This does not correlate statistically with any available climatic variable and is deemed to be a real and largely stochastic phenomenon. It is interpreted as rock bursting at the granular scale due to haloclasty. The processes most likely to be responsible for the observed rapid denudation are crystallization and thermal expansion of halite, both of which are enhanced by high summer temperatures.
KEY WORDS Coastal weathering Salt weathering Micro-erosion meter Rock swelling
INTRODUCTION
This paper investigates rates of coastal denudation of greenschist in the supratidal zone on the Start-Prawle peninsula in south Devon, United Kingdom (Figure 1). The nature of the rock weathering processes operating in the study location is indicated by the abundance of honeycomb weathering patterns on exposed surfaces; these features are commonly regarded as indicative of weathering by salt crystallization (Bartrum, 1936; Mustoe, 1982, 1983; McGreevey, 1985a; Butler and Mount, 1986). Studies by the present author (Motter- shead, 1981,1982,1983) have demonstrated that rock denudation is indeed active, with a mean rate of surface lowering derived from 34 points over a one year period measured by micro-erosion meter (MEM) of 0.61 mm a-'. The micro-erosion meter has been used in the littoral environment by several previous authors (Trudgill, 1976a, b; Robinson, 1976,1977; Kirk, 1977; Spencer, 1981,1985; Gill and Lang, 1983; Shakesby and Walsh, 1986), although the main focus of most of these studies is the intertidal rather than the supratidal zone.
1. To investigate spatial variation in denudation rates at different scales; 2. To investigate temporal variations in denudation rates at various scales; 3. To identify and explain apparent anomalies in surface lowering rates; and 4. To make inferences concerning the nature of the processes responsible for the phenomena observed.
Specific objectives of the present paper are
0197-9337/89/050383-16$08.00 0 1989 by John Wiley & Sons, Ltd.

384 D. N. MOmERSHEAD
MEM site 0 Pedestal sample area + aiff iim head
W M M T .... ... .... & h a h
Height in 0 metres 100
Figure 1. Location map (HWMMT=High Water Mark, Mean Tide)
THE STUDY SITES
The littoral zone in the study area consists of three dissected shore platforms, the lowest in the current intertidal zone, and two raised platforms at elevations of approximately 4.5 and 7.5 m O.D. (Orme, 1960), cut across the greenschist outcrop. Mottershead (1986) has suggested that such precise characterization of shore platforms of varying altitude is inappropriate and argues that the platforms are better identified as lower, middle, and upper respectively. Three MEM sites were established on the middle platform in a zone exhibiting freshly weathered rock surfaces. All the sites lie above and not more than 10 m distant from High Water Mark
SALT SPRAY WEATHERING RATES AND PATTERNS 385
(HWM), and none is more than 3 m in elevation above HWM. On such a rocky shore in a storm wave environment, regular splashing by seawater spray is a feature of the supratidal zone, creating a distinctive environment of weathering and denudation (Tricart, 1960).
The two variants of greenschist present at the study sites have been described by Ussher (1904) and Tilley (1923) (Table I). At site 1 the bedrock is actinolite-chlorite-pidote-albite schist. This strongly foliated rock is pale grey-green in colour with a marked silky sheen and even texture. At sites 2 and 3 the second greenschist variant, a chlorite<pidote-albite schist, is present. This rock is not so markedly schistose as the other type, and has a particularly high content of the soft mineral chlorite (Moh hardness 2). On weathered surfaces it is dull dark green in colour and of gnarled appearance.
The experimental surfaces are variably rough in texture, and friable in that they are readily scratchable by penknife and easily penetrated with a hand drill. The surface rock is seen to be substantially weakened in relation to the more sound rock beneath.
EXPERIMENTAL METHOD
The micro-erosion meter employed was constructed according to the original specification of High and Hanna (1970), with a dial guage reading to 0.001 mm and a vertical probe range of 13.6 mm. It predates the modifications described by Trudgill et al. (1981).
The three MEM sites consist ofan array offour triangles at each site to generate, with the off-central probe, a possible maximum of 12 measurement points per site. The irregular microtopography of the sites meant that a small number of points lay beyond the range of the probe from the outset.
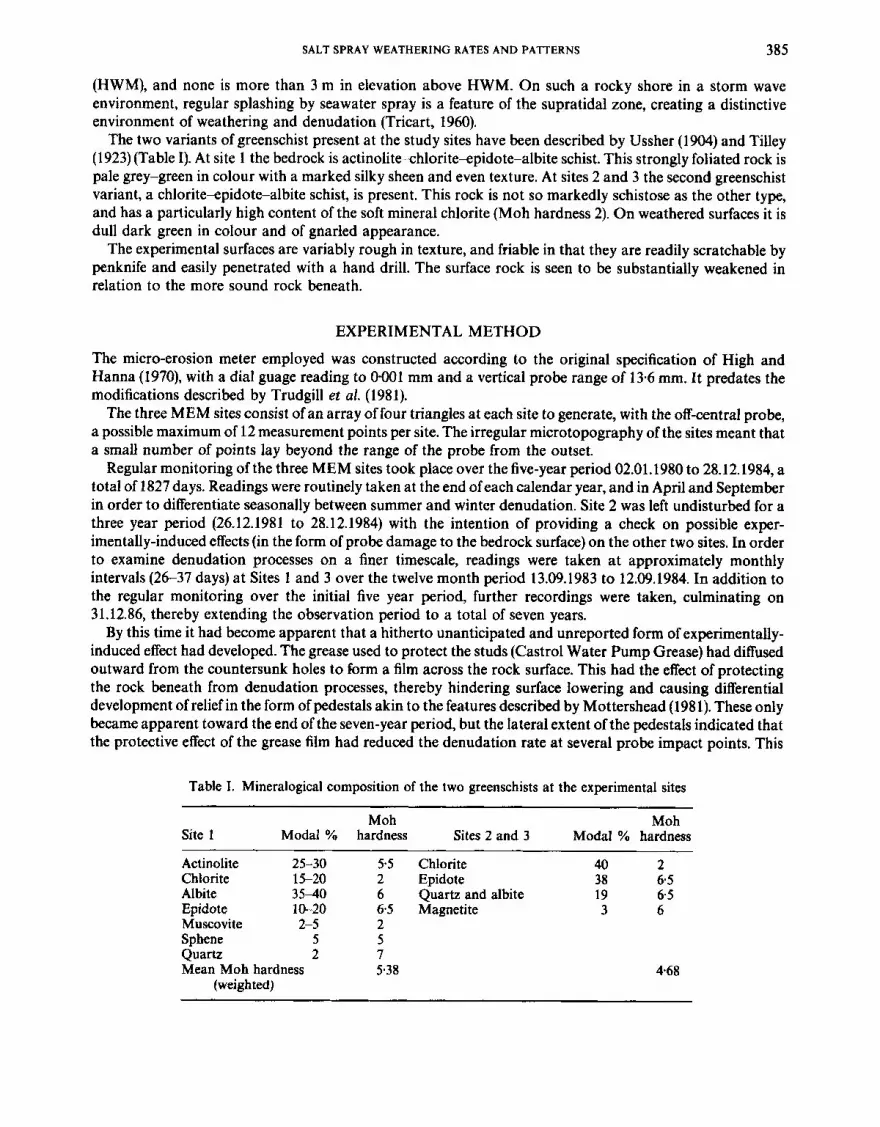
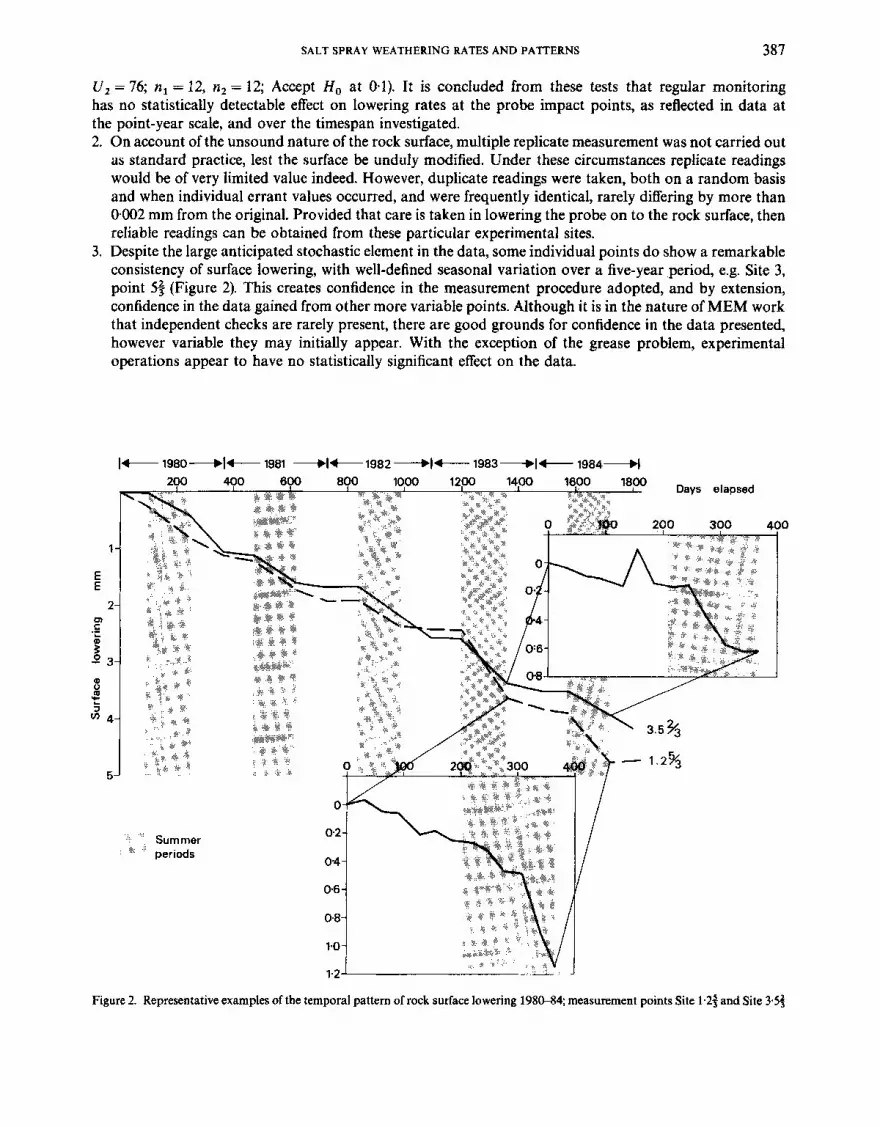
Regular monitoring of the three MEM sites took place over the five-year period 02.01.1980 to 28.12.1984, a total of 1827 days. Readings were routinely taken at the end ofeach calendar year, and in April and September in order to differentiate seasonally between summer and winter denudation. Site 2 was left undisturbed for a three year period (26.12.1981 to 28.12.1984) with the intention of providing a check on possible exper- imentally-induced effects (in the form of probe damage to the bedrock surface) on the other two sites. In order to examine denudation processes on a finer timescale, readings were taken at approximately monthly intervals (26-37 days) at Sites 1 and 3 over the twelve month period 13.09.1983 to 12.09.1984. In addition to the regular monitoring over the initial five year period, further recordings were taken, culminating on 31.12.86, thereby extending the observation period to a total of seven years.
By this time it had become apparent that a hitherto unanticipated and unreported form of experimentally- induced effect had developed. The grease used to protect the studs (Castrol Water Pump Grease) had diffused outward from the countersunk holes to form a film across the rock surface. This had the effect of protecting the rock beneath from denudation processes, thereby hindering surface lowering and causing differential development of relief in the form of pedestals akin to the features described by Mottershead (1981). These only became apparent toward the end of the seven-year period, but the lateral extent of the pedestals indicated that the protective effect of the grease film had reduced the denudation rate at several probe impact points. This
Table I. Mineralogical composition of the two greenschists at the experimental sites
Site 1 Modal YO
Actinolite 25-30 Chlorite 15-20 Albite 35-40 Epidote 10-20
Sphene 5 Quartz 2
Muscovite 2-5
Mean Moh hardness (weighted)
Moh hardness Sites 2 and 3
5.5 Chlorite 2 Epidote 6 Quartz and albite 6 5 Magnetite 2 5 7 5.38
Moh Modal % hardness
40 2 38 6 5 19 6 5 3 6
4.68

386 D. N. MOTTERSHEAD
effect is restricted to Sites 2 and 3, and at these two sites only a small number of measurement points remain unaffected and provide reliable data for the entire seven-year period. Close scrutiny of the annual lowering rates suggests a divergence between grease-affected and grease-free points after three years. Accordingly data from the grease-affected points after the end of 1982 are discarded. Only the data in which confidence can be retained are included in the analyses, which are necessarily modified from the form originally intended.
THENATUREOFTHEDATA
A substantial body of data, variable both in duration and distribution, has therefore been accumulated and permits several modes of analysis. The data are summarized in Table 11. Before proceeding further it is pertinent to consider the reliability of the data, for the results of an investigation of this kind rely heavily on their quality. Furthermore, it is in the nature of MEM work that independent checks are normally absent. Some reassurances in respect of data quality are therefore required. Within the present study there are two areas of concern in this respect. First, on a friable and uneven rock surface there exists an increased possibility of modification of natural processes by experimental effects. This may occur in two ways. Regularly repeated impacts by the probe at the same point may indent the rock surface, damaging it and possibly accelerating the lowering process. Additionally, the removal of weathered debris in the form of loose sediment from the irregular rock surface prior to monitoring may prevent the accumulation of a protective layer of rock meal, particularly in hollows, also accelerating surface lowering. The second concern is that the nature of the salt weathering process identified in previous studies at this site is such that rock surface lowering at any given point is likely to be an irregular episodic process, as individual discrete rock fragments become detached from the surface. The pattern of lowering would be expected to be different from the smoothly continuous lowering effected by solution processes documented in previous studies elsewhere. On a priori grounds, therefore, a large stochastic element may be expected to be present in the data, inducing variability and irregularity, and thereby rendering difficult the detection of patterns which might confirm confidence in the data.
A number of checks are, however present within the body of the data:
1. A comparison of rates of lowering between unmonitored and regularly monitored periods is possible at Site 1. This may be expected to reveal any experimental modification of the lowering rate. Two tests of this effect are possible with the data available from Site 1. First, the mean annual lowering rate derived from the 12 points over the routinely-monitored period 198&84 (with 23 intermediate readings) is tested against the mean annual rates derived for the same points for 1985-86 (with one intermediate reading). The non- parametric Mann-Whitney test applied to the two data sets indicated no significant difference ( U , = 54, U , = 90; n, = 12, n, = 12; Accept H , at 0.1). Secondly, the rates derived from the 12 points for the once- monitored period 1985-86 can be compared with those obtained for the most intensively monitored calendar year, 1984, with eight intermediate readings. Again there is no significant difference ( U , = 68,
Table 11. Summary of type and volume of surface lowering data accumulated over the seven-year experimental period
Site 1 Site 2 Site 3 Total
Cumulative 7-year point totals 12 2 3 17
Cumulative 5-year point totals 12 2 3 17 (1980-1986)
(1980-1984)
(1980-1982)
(1980-1981)
Cumulative 3-year point totals 12 - 9 21
Cumulative 2-year point totals 12 9 9 30
Single year point totals 60 18 33 111
Monthly totals 144 - - 144 Seasonal totals 120 36 66 222
SALT SPRAY WEATHERING RATES AND PATTERNS 387
U , = 76; n, = 12, n, = 12; Accept H, at 0.1). It is concluded from these tests that regular monitoring has no statistically detectable effect on lowering rates at the probe impact points, as reflected in data at the point-year scale, and over the timespan investigated. 2. On account of the unsound nature of the rock surface, multiple replicate measurement was not carried out
as standard practice, lest the surface be unduly modified. Under these circumstances replicate readings would be of very limited value indeed. However, duplicate readings were taken, both on a random basis and when individual errant values occurred, and were frequently identical, rarely differing by more than 0.002 mm from the original. Provided that care is taken in lowering the probe on to the rock surface, then reliable readings can be obtained from these particular experimental sites.
3. Despite the large anticipated stochastic element in the data, some individual points do show a remarkable consistency of surface lowering, with well-defined seasonal variation over a five-year .period, e.g. Site 3, point 5$ (Figure 2). This creates confidence in the measurement procedure adopted, and by extension, confidence in the data gained from other more variable points. Although it is in the nature of MEM work that independent checks are rarely present, there are good grounds for confidence in the data presented, however variable they may initially appear. With the exception of the grease problem, experimental operations appear to have no statistically significant effect on the data.
1-
E E
2- m .- L
; -0 3- Q m - 5
U-J 4-
5-
Figure 2. Representative examples of the temporal pattern of rock surface lowering 1980-84; measurement points Site 1.23 and Site 3.52,

388 D. N. MOTTERSHEAD
RESULTS
Over the seven-year monitoring period, 11 1 point years of surface lowering data were recorded from 30 points, yielding a mean rate of surface lowering of 0.625 mm a-'. This compares favourably with the value of 0-612 mm a-' derived from 34 points in the initial year of measurement, and demonstrates that in this location ca. 30 point years of monitoring yields a representative value of annual surface lowering.
The distribution of values of annual rates of point lowering comprising all available data (n = 11 1) is shown in histogram form in Figure 3. The distribution possesses a marked positive skewness, a characteristic of MEM data noted previously by Trudgill et al. (1981). A feature of the data is the occurrence of elevations of the surface between consecutive readings, indicated by a positive sign. Their significance is examined in a later section. A second feature is the variability within the data, with a range in individual values from + 0.196 mm elevation to an annual lowering of 2.881 mm. Bedrock surface lowering by granular disintegration can be expected to produce irregular point lowering rates, as episodic detachments of particles are separated by periods of stasis (Trudgill, 1976b; Spencer, 1981). This appears to be borne out by these data, which incorporate a large stochastic element.
Variations in the annual data The data set illustrated in Figure 2 contains considerable internal variation, both spatial and temporal,
which may be analysed in several ways. Comparison between temporal and spatial variation is possible with
30
20
> U al 0-
L L e!
10
n - 111
Mean - 0.625
Median - 0.504
Upper Quartile - 0,868
Lower Quartile - 0.295
Figure 3. Frequency distribution of annual rates of point lowering, for 1 1 1 point years. A point year is defined as a reading for a single point over a one year period. (Positive value indicates surface swelling)

SALT SPRAY WEATHERING RATES AND PATTERNS 389
the data from Site 1, utilizing the five-year run of annual values from each of twelve points. This 12 x 5 data matrix allows analysis of variance between both years and points.
Year to year variations. Temporal variations in lowering rate may be expected to reflect the varying inputs of agents of denudation, which are essentially climatically controlled. The statistical significance of year to year variations in denudation rate is tested using the non-parametric Kruskal-Wallis test, since the data are non-normal. For differences between years, this yields:
H = 4.92, d.f. = 4; Accept H o at 0.1.
Thus, samples of individual point lowering rate values do not differ in a statistically significant manner from year to year.
Within-site variations. Spatial variation in lowering rate between individual points at the within-site scale may be expected to occur because of microscale variations in mineralogy, rock texture, and surface microtopography, factors which are based on unobservably small phenomena. Within-site spatial variation at Site 1 can be tested by examining differences between points, which yields:
H = 36.76, d.f. = 11; Reject H, at 0401.
Thus highly significant differences in point lowering rates are shown to exist between points at a single site. This emphasizes the spatial variability, due to extremely local factors, of surface lowering at the microscale.
Between-site uariations. The analysis of spatial variability can be extended by incorporating data from Sites 2 and 3, and examining between-site differences. These can be expected to reflect variations in factors at a larger and more observable scale, such as rock composition, texture and mechanical properties, or differences in the denudation environment. Two sets of annual lowering data are available for this analysis. A two-year run of annual data exists for Sites 1,2 and 3 for 12,9, and 9 points respectively. The between-site variance of the three sites can be tested using the Kruskal-Wallis test, which gives:
H = 4.01, d.f. = 2; Accept H, at 0.1.
Seven-year total lowering values are available for Site 1, plus two points from Site 2 and three from Site 3. The data for Sites 2 and 3 are combined, because of the small number of occurrences, on the grounds that they represent the same greenschist variant. A Mann-Whitney test of the difference between Site 1 and Sites 2 and 3 combined over seven years in lowering rates shows
U , = 17, U2 =43; n , = 12, n2 = 5; Accept H, at 0.1.
In both tests it is demonstrated that the study sites do not demonstrate statistically significant differences in lowering rate at the between-site spatial scale. The three sites embrace significant differences in both bedrock type, and in degree of exposure to agents of denudation. Neither factor apparently acts as a significant variant of annual surface lowering rate at the sites studied.
Microtopographic variation. A further possible source of internal variation of point lowering rates is that of microtopographic control, which can be investigated using the seven year run of data from Site 1. Observations were made as to whether the probe tip alighted on a summit, flat, or hollow. The 12 points yield a mean seven-year aggregate total of 4.348 mm for summits (n = 4), 4.245 mm for flats (n = 5), and 2.377 for hollows (n = 3). Differences between the three groups were tested using the Kruskal-Wallis test and yielded:
H = 1-985; n , , n 2 , n3 = 5, 4, 3; Accept H, at 0.1.
Differences are thus not statistically significant, although the sample sizes are admittedly small. This result differs from that of Spencer (1981) who found the topographic lows to be lowering more rapidly. In this case it would appear that the relative relief is being maintained, neither increasing or decreasing given the absence of a topographic control on lowering rates.
Persistence through time. This aspect of spatial variation in annual point lowering rates is a further question which the data permit to be addressed. That is to say, do the same individual points show consistently high or low rates of lowering year by year, or are the effects of spatial variations in lowering rates levelled out by compensation over the passing of years as is implied by the limited relief of the weathering

390 D. N. MOTTERSHEAD
surface combined with the lack of microtopographic control on lowering rate? This question can be investigated through the point year data from all three sites. The degree of persistence of rates of lowering (inheritance from an initial rate) can be assessed by carrying out a correlation test between the rates of lowering for individual points compared for two separate years, successively correlating the value for each point from the initial year of observation against that from each of the following years (Table 111). Spearman rank correlation was employed since the data are strongly skewed. The correlation is strongly significant at all three sites ( r = + 0.846; + 0-767; + 0.800) after one year has elapsed, indicating a significant inheritance effect on this timescale. Correlation with the initial rate then declines considerably, with increasing elapsed years. The effect of elapsed time on dependence on the initial value can be illustrated by examining the relationship between rho and elapsed years. Pearsons product moment correlation coefficient is employed and a linear regression fitted, using all points (n = 7) available from the data. The correlation (r = - 0.689) is nominally significant at the 0.1 level, and although this moderate value should be treated with caution, the relationship may be regarded as indicative, and interpreted on that basis. By substitution, the point at which the lowering rate becomes completely independent of the initial reading (rho = 0) is estimated at approximately five years. This would therefore appear to mark the limit of dependence of erosion rate values on a preceding value, and thereby the limit of inheritance of lowering rate. It may further be postulated on a priori grounds that since the initial spatial differentiation in rate is shown to be dissipated over a five-year period, and since evidence suggests that the relief of the rock surface is not increasing then it is likely that the entire surface is, over a sufficient period of time, lowering at a uniform rate. This in turn implies that the spatial differentiation in relief produced by the initial differential lowering rates may actually be reversed, as found by Viles and Trudgill (1984). This may therefore be achieved by a subsequent negative correlation of annual point year rates with the initial year, and if this is the case then it is possible to extrapolate the relationship to rho = - 1 in order to suggest an estimate of the length of this postulated cycle of variation. This procedure yields an estimate of 11 - + 2 years at the 95 per cent confidence level.
Table 111. Spearman rank correlation coefficients of lowering values for each site of successive years against the initial year at
Sites 1, 2, and 3. Significance levels in parentheses
Site 1 Site 2 Site 3 (12 points) (9 points) (9 points)
Elapsed years 1 + 0.846 + 0.767 + 0.800 (001) (0.05) (005)
2 +0.406 + 0167 (n.s.) (n.s.)
3 +0*671 (0.05)
4 +0.161 (ns.)
Variations in the seasonal data Seasonal variations in surface lowering can be examined at all three sites for the years in which regular
monitoring took place. The annual totals can be disaggregated into summer (mid April-mid September) and winter (the converse) seasons, and are tabulated in Table IV. Lowering values for all three sites are aggregated; values are standardized to annualized rates by scaling proportional to the monitoring interval.
Isolated exceptions occur at individual sites in particular years but in aggregate the summer rate is, overall, consistently greater than that of winter in each year. A Mann-Whitney test of the difference between summer and winter rates of lowering for all sites shows:
U1 = 18, U, = 26; n, = 12, n, = 12; Reject H, at 0.001.

SALT SPRAY WEATHERING RATES AND PATTERNS 39 1
Table IV. Seasonal variations in surface lowering (summer/winter) 1980-1984 for all sites aggregated
Annualized rate (all sites) Summer/winter Days (mm a- ') ratio
1980 S 158 0.774 W 206 0.488
1981 S 143 0.587 W 219 0.456
1982 S 149 0.858 w 221 0.566
1983 S 158 1503 W 229 0.25 1
1984 S 148 1.168 W 196 0.347
Weighted mean annualized
Percentage of total denudation: rates of loss:
1.59
1.29
1.51
5.99
3.37
Summer 1.005 mm a - Winter 0.446 mm a- Summer 61 per cent Winter 39 per cent
The difference is thus shown to be statistically highly significant. The annualized summer rate of lowering, weighted for number of points and days, of 1.005 mm a-1 contrasts with the winter rate of 0.46 m a - '. Some 61 per cent of the total lowering takes place in the five months of summer, compared to 39 per cent in the seven months of winter. The summer dominance of weathering activity is confirmed by field observations, in that physical evidences of salt crystallization (efflorescences) and granular disintegration (rock meal) manifest themselves at this time of year.
The summer/winter ratio is considerably higher in 1983 and 1984, years of notably hot summers recorded at Slapton some 9 km to the north, a station for which long term data are available (Ratsey, 1975). In 1983 the average daily temperature for two midsummer months exceeded the long term mean by 3°C and in 1984 by 2°C. Both years experienced air temperatures in excess of 24°C. Attention is thus directed towards temperature as a significant controlling factor.
Variations in the monthly data
Seasonal effects were investigated in more detail through the monthly data recorded at Site 1 in the period September 1983-September 1984. The 12 points at this site provide a 12 x 12 matrix of monthly values. Rates of lowering are again annualized in order to eliminate the effect of the variable monitoring interval.
The monthly data matrix can be analysed for differences between months, using the Kruskal-Wallis test. This shows H = 24.98, d.f. = 11; Reject H, at 0.01. Monthly variations in surface lowering rates are thus shown to be statistically significant. This confirms the conclusions drawn from the seasonal data.
The data show distinctly higher rates of lowering during the six summer months from mid May to mid October, and in this particular year even on until mid November. The most active six months show a mean annualized rate of lowering of 1.213 mm a-' compared to 0.120 mm a- for the remainder. The strength of this contrast is consistent with the strong seasonality of this particular year.
Surface swellings An unexpected phenomenon which became apparent during the experiment was the episadic occurrence of
elevations of the surface between observations. Initially suspected to be the consequence of operator or instrument error, they continued to recur despite care in operation and checking of field readings. The magnitude of the swellings is in excess of the experimental determinations of instrument error in MEM made by Spate et al. (1985) insofar as these may be applicable to the present circumstance. The significance of an absolute increase in elevation of a point is enhanced when set in the context of a generally lowering surface.

392 D. N. MOTTERSHEAD
Swellings increase in frequency at finer timescales, the probability of occurrence increasing from the annual (p = 0018) through the seasonal (p = 0.138) to the monthly (p = 0-310) observation intervals. Most frequent in the monthly data, their magnitude is illustrated in Figure 4 and their occurrence tabulated in Table V. A further and perhaps more significant form of analysis is to examine the duration and magnitude of swellings above an initial base, incorporating cumulatively both sign and magnitude of all consecutive readings until the surface is reduced to an elevation below the minimum which preceded the swelling. This is tabulated in Table VI.
n = 45 Median = 0.013rnm
- 0.045 0 0.10 Elevation of surface m m
020 0-32 034
Figure 4. Frequency distribution of swellings observed in the raw monthly data, Site 1
Table V. Occurrence of swellings at Site 1 1983-84, identified as a positive elevation of the rock surface between consecutive monthly
readings
Total number Aggregate of Total number of swellings swelling
From To of swellings > 0.010 mm (mm)
13.09.83 12.10.83 12.10.83 16.1 1.83 16.11.83 13.12.83 13.12.83 19.01.84 19.01.84 14.02.84 14.02.84 14.03.84 14.03.84 17.04.84 17.04.84 14.05.84 14.05.84 11.06.84 11.06.84 16.07.84 16.07.84 17.08.84 17.08.84 12.09.84
6 3 2 5 5 6 3 7 2 3 1 4
3 1 0 3 2 3 1 6 2 2 1 1
+0.237 + 0034 + 0003 + 0153 +0118 + 0055
+ 0063 + 0128 + 0163 + 0016
+ 0026 + 0567

SALT SPRAY WEATHERING RATES AND PATTERNS 393
Table VI. Duration and maximum elevation of swellings above an initial base identified in the monthly matrix, Site 1, 1983-84
Duration No of Maximum elevation attained (months) occurrences (mm)
1 14 0.001 0.001 0001 0.004 0.007 0.009 0.009 0016 0024 0032 0.033 0.041 0.044 0.335
2 5 0.043 0.045 0087 0087 0.163 4 1 0.039 5 1 0.026 6 2 0.012 0.171 8 1 0.047 12 1 0.153
~
The salient features of the swellings are as follows:
1.
2.
3.
4.
5.
6.
There is a peak frequency of occurrence in April/May, with seven of 12 points registering swelling. Beyond that however there is no evident seasonal pattern in respect of summer/winter differences. There is no correspondence between frequency of occurrence and moisture state (recorded as wet/dry) of the rock surface. In the raw monthly data, 55 per cent of the swellings are greater than 0.01 mm after conservatively regarding smaller values as the possible result of instrument/operator error. Of the swellings above an initial base, the majority, 11 of 25, are of two months duration or more, including one of 12 months. The magnitude of the swellings above an initial base is commonly in the range 0.03-0.05 mm, and not infrequently greater than 0.1 mm. The values of duration and magnitude of swellings represent minimum values, for several occur in the first or last month of the data series and therefore may represent swellings which began prior to or terminated subsequent to the monthly observation period. The seasonal data identify a maximum (yet incomplete) duration of 48 months attaining a maximum elevation of 0.266 mm. The longest completed swelling identifiable persists for 16 months and attains 0.382 mm.
The overall picture presented by these data is of a rock surface lowering at the rapid rate of 0.6 mm a-', and considerably more during the summer. Superimposed on this general trend are spatially and temporally sporadic swellings of the surface. A recurrent pattern in the raw seasonal data (3-5 month observation interval) is of a moderate swelling ( > 0.01 mm) on one occasion, followed by a significant fall ( > 0.1 mm) on the next, as exemplified by the record of surface change at two representative points (Figure 2). This pattern is consistent with an interpretation of internal tensile stresses lifting the surface, followed by detachment of discrete rock particles.
DISCUSSION
In order further to explain the occurrence of strong seasonality and episodic swelling, they were investigated in relation to climatic variables. This is most appropriately done on the finest timescale available, employing the monthly data from Site 1. The MEM data for the 12 individual points are aggregated monthly in order to minimize stochastic effects. The net monthly change in surface elevation is segregated into values of total lowering and total swelling and plotted in Figure 5.
Climatic parameters were derived from the daily observations at Slapton, and may be regarded as representative of the synoptic conditions prevailing at the field site. The variables obtained for each of the monitoring intervals were: mean daily temperature, mean daily maximum temperature, mean daily minimum temperature, number of negative grass minimum readings, total precipitation, and total run of wind.

D. N. MOlTERSHEAD
1983 ___* t 1984 -+ epl Oct I Nov I Dec Jan 1 Feb I Mar 1 Apr 1 May 1 Jun I Jul I Aug I Sep 1
Days
Figure 5. Aggregated monthly changes in surface elevation, Site 1
Correlations were run separately for both monthly surface lowering values and monthly surface swelling values, against each of the climatic parameters, with non-normal variables logged. The results are tabulated in Table VII. Surface lowering is significantly positively correlated with all three temperature parameters, and strongly negatively correlated with negative grass minimum occurrences ( = frosts). A significant negative correlation occurs between surface lowering and run of wind, but this is not surprising in view of the inverse seasonal relationship between run of wind and monthly temperatures. Surface swelling shows no significant correlation with any single climatic parameter.
Since the data as a whole fail to provide a statistical explanation of swelling, evidence may be sought in the climatic conditions during the single period which provided an exceptional amount of swelling (April/May). This period together with the previous one experienced high values of frost occurrence, and it is not possible to rule this out as a contributory mechanism in surface swelling. Probably of greater importance, however, was that this period was extremely arid, with only 10 mm of precipitation and a high value of wind run, thus enhancing the desiccating conditions. This exceptional occurrence of swelling, in both frequency and magnitude, is associated with highly abnormal weather conditions, which are therefore presumed to be conducive to rock swelling.
The strong antipathetic relationship between surface lowering and negative minimum grass temperatures would appear to rule out the action of frost action as an effective mechanism in surface lowering at this site. The possibility that salt weathering is enhanced in conjunction with frost has been discussed by previous authors (Williams and Robinson, 1981; McGreevey, 1982; Robinson and Jerwood, 1987a, b). Fahey (1983) has

SALT SPRAY WEATHERING RATES AND PATTERNS 395
Table VII. Pearson correlation of monthly changes in surface elevation at Site 1 with climatic variables. Significance levels in
parentheses
3 4 5 6 log 7 log8
(001) (0.01) (0.01) (0.01) (n.s.) (0.02)
(n.s) (n.s) (ns) (n.s) (n.s) (n.s)
log 1 +0.859 +0'851 +0819 -0.843 -0156 -0.693
log 2 + 0'170 + 0.208 + 0.1 14 - 0'068 - 0.293 + 0.267
~
Variables: 1 Monthly aggregate surface lowering 2 Monthly aggregate surface swelling 3 Daily mean temperature 4 Daily maximum temperature 5 Daily minimum temperature 6 Monthly total of negative grass minimum temperatures 7 Monthly total of precipitation 8 Monthly total run of wind
demonstrated that hydration weathering of schist is enhanced by frost. Both of these combined mechanisms are excluded by the evidence in the present case. Also eliminated is the possibility of weathering by hydration pressure of sodium chloride which possesses a dihydrate form only in the temperature range + 0-15"C to - 21.2"C (Gmelin, 1928) within which no significant surface lowering takes place.
There is clear evidence that the mechanism responsible for rock surface lowering is positively related to temperature. As several authors have demonstrated (Peel, 1974; Whalley et al., 1984; McGreevey, 1985b) rock surface temperature can exceed considerably the ambient air temperature such that the latter is an inadequate guide to the former. This is particularly the case on 'clear radiation' days which are characteristic of the hottest summer weather. The maximum screen air temperature recorded at Slapton during the period of monthly readings was + 28°C; screen temperatures in excess of + 24°C were recorded on seven other occasions. Of the works cited, the data of McGreevey, gathered during August in Belfast, probably most closely approximate to conditions in Devon, and show that with a maximum air temperature of + 19°C rock surface temperatures are up to 10°C higher. On this basis it appears reasonable to estimate that the experimental surfaces may have attained a maximum temperature of 35 "C.
Several possible mechanisms can be postulated in order to explain increased rates of rock weathering by salts at higher temperatures (Sperling and Cooke, 1980, 1985). Davison (1986) has suggested on the basis of laboratory experiments that at higher temperatures, the penetration of saline solutions beneath rock surfaces is limited by increased evaporation, and that therefore salt precipitation becomes concentrated into a shallow near-surface zone. This supposedly increases the effectiveness of salt weathering at the rock surface. Whilst this hypothesis is seemingly well founded in relation to the laboratory procedures adopted by Davison, it seems not to replicate the present field conditions since inundation is more likely to occur in stormy conditions, while the high temperatures associated with evaporation and the observed rapid lowering occur under calm conditions. Thus the introduction of saline solutions into the rock, and the enhanced evaporation of these solutions are, under field conditions, likely to be widely separated events, and the concept of a high evaporation rate limiting the penetration of saline fluid therefore does not apply here.
Alternative expIanations for the relationship between high rock temperature and enhanced weathering can be sought in the salt crystallisation process (McGreevy, 1985a) and the thermal expansion of salt (Cooke and Smalley, 1968). The accumulation of salt in rock pores in the spray zone of a coastal environment is likely to be a function of several circumstances. First, a degree of storminess would appear to be an essential prerequisite in order to throw salt spray on to the rocky shore. Secondly, evaporation is required to cause the salt to crystallize out of the saline solution; and thirdly, an absence of rainfall is required in order that soluble salts do not dissolve and flush away. At the experimental site the stormy winter conditions may enhance the

396 D. N. MOTTERSHEAD
supply of salts, but also limit their effectiveness by limiting evaporation and producing regular flushing by rainfall. In contrast, warm dry evaporating summer conditions will maximize the effects of salts in rock pores by retaining the salts and producing more complete evaporation and salt crystallization. Previous experiments (Mottershead, 1982) indicated that of the salts present in seawater, sodium chloride was likely to be the most effective weathering agent in this case. If the force of crystallization of sodium chloride is the mechanism of weathering, then the warm dry summer conditions that occurred during the year of monthly monitoring (1983/4) provide the most effective circumstance for this process to occur. A further process to be considered is that of thermal expansion of entrapped salts. Cooke and Smalley (1968) have indicated that sodium chloride has a particularly high coefficient of thermal expansion in relation to common rock forming minerals and this effect also would be maximised under higher temperatures. On present evidence it is not possible to discriminate between these two processes and it seems likely that both operate in combination at the study site.
Explanation of rock surface swelling is more problematical, with its lack of statistical correlation with any of the expected meteorological parameters. Swelling is consistent with rock bursting by halociasty, but since the environmental conditions most favourable for haloclasty occur in summer, a summer dominance in surface expansion may reasonably be expected. However the association of swelling with strongly desiccating conditions is at least consistent with swelling caused by haloclasty. It may also be pertinent that the preceding period was characterized by frosts which may have expanded the rock fabric through tensile stresses. The simplest explanation of a lack of summer dominance in rock swelling may well be one of geometry. On the monthly observation interval employed little general lowering of the surface takes place in winter, and rock swellings stand out in the field data. In summer, by contrast, the rapid monthly lowering observed may actually be greater than an individual rock swelling, which would therefore pass subsumed and undetected within the data. It is possible, therefore, that the nature of the field observations may seriously underestimate summer rock swelling and present a very partial picture of this particular phenomenon.
CONCLUSIONS
The results presented here derive from an empirical study of a very restricted area (ca. 0 3 m2). Their significance lies in the distinctiveness of the particular weathering environment studied, and the duration and detail of the data set. Rock surface lowering presumed to be caused by haloclasty is shown to be an irregular process, characterized by episodic detachment of discrete rock particles, and punctuated by swelling of the rock surface.
1. Under the conditions studied some 30 individual measurement points are sufficient to gain a representative
2. Point values of annual surface lowering demonstrate a stong positive skewness; 3. There is considerable within-site variation in point lowering rates at the annual scale which contrasts with
4. Year to year variations in total lowering observed are not statistically significant; 5. There is a strong seasonality in the lowering rate, with a clear summer maximum; 6. Many points show episodic swelling of the rock surface of between one and several months duration,
consistent with rock bursting by haloclasty; 7. There is a limited consistency in lowering rate at individual points on a year to year basis. The limited relief
of the rock surface implies that observed spatial differences in lowering rate are compensated over a period estimated at ca. 11 years;
8. Rock breakdown is most probably effected by halite crystal growth within pore spaces by both crystallization and thermal expansion; and
9. Close observation of the field sites is required in the case of porous rocks, lest seepage of grease used in sealing the MEM studs takes place into the surrounding rock, affecting the denudation process.
Conclusions may be summarized as follows:
value of the annual rate of surface lowering;
the absence of significant between-site variation;

SALT SPRAY WEATHERING RATES AND PATTERNS 397
ACKNOWLEDGEMENTS
Throughout the long duration of this project support has been received from a range of individuals and bodies. The following are gratefully acknowledged. Assistance with field measurements was given in particular by Trevor Thorley who carried out the bulk of the monthly readings in 1983/4. Tony Thomas, then warden of Slapton Ley Field Centre provided generous field support in many ways. Keith Chell, his successor, provided access to the climatic data for Slapton. Janet Mottershead also assisted with field data collection. Petrological analyses were carried out by Colin Morey, of South London College, and Dr. Greg Power, of Portsmouth Polytechnic. Norah Ball drew the diagrams, and Judith Webster typed the paper from the original manuscript.
REFERENCES
Bartrum, J. A. 1936. ‘Honeycomb weathering of rocks near the shoreline’, New Zealand Journal ofscience and Technology, 18,593-600. Butler, P. R. and Mount, J. F. 1986. ‘Corroded cobbles in southern Death Valley; their relationship to honeycomb weathering and lake
Cooke, R. U. and Smalley I. J. 1968. ‘Salt weathering in deserts’, Nature, 220, 1226-1227. Davison, A. P. 1986. ‘An investigation into the relationship between salt weathering debris production and temperature’, Earth Surface
Fahey, B. D. 1983. ‘Frost action and hydration as rock weathering mechanisms on schist: a laboratory study’, Earth Surface Processes and
Gill, E. D. and Lang, J. G. 1983. ‘Micro-erosion meter measurements of rock wear on the Otway coast of Southeast Australia’, Marine
Gmelin, 1928. Gmelins Handbuch der anorganischen Chemie, System-Nummer 21, Natrium, Weinheim, Verlag Chemie, 1-992. High, C. and Hanna, F. K. 1970. ‘A method for the direct measurement of erosion of rock surfaces’, British Geomorphological Research
Kirk, R. M. 1977. ‘Rates and forms of erosion on intertidal platforms at Kaikoura Peninsula, South Island, New Zealand‘, N.Z. Journal of
McGreevey, J. P. 1982. ‘Frost and salt weathering: further experimental results’, Earth Surface Processes and Lundforms, 7(5), 475-488. McGreevey, J. P. 1985a. ‘A preliminary scanning electron microscope study of honeycomb weathering of sandstone in a coastal
McGreevey, J. P. 1985b. ‘Thermal properties as controls on rock surface temperature maxima, and possible implications for rock
Mottershead, D. N. 1981. ‘The duration of oil pollution on a rocky shore’, Applied Geography, 1, 297-304. Mottershead, D. N. 1982. ‘Coastal spray weathering of bedrock in the supratidal zone at East Prawle, South Devon’, Field Studies, 5,
Mottershead, D. N. 1983. ‘Rapid weathering of greenschist by coastal salt spray, East Prawle, South Devon: a preliminary report’,
Mottershead, D. N. 1986. Classic Landforms of the South Devon Coast, Sheffield, Geographical Association, 48 pp. Mustoe, G. E. 1982. ‘The origin of honeycomb weathering’, Geological Society of America Bulletin, 93, 108-115. Mustoe, G. E. 1983. ‘Cavernous weathering in the Capitol Reef Desert, Utah’, Earth Surface Processes and Landforms, 8, 517-526. Orme, A. R. 1960. ‘The raised beaches and strandlines of the South Devon coast’, Field Studies, 1(2), 109-130. Peel, R. F. 1974. ‘Insolation weathering some measurements of diurnal temperature changes in exposed rocks in the Tibesti region’,
Ratsey, S. 1975. ‘The climate at Slapton Ley’, Field Studies, 4(2), 191-206. Robinson, D. A. and Jerwood, L. C. 1987a. ‘Frost and salt weathering ofchalk shore platforms near Brighton, Sussex, U.K.’, Transactions
Robinson, D. A. and Jenvood, L. C. 1987b. ‘Sub-aerial weathering of chalk shore platforms during harsh winters in Southeast England’,
Robinson, L. A. 1976. ‘The micro-erosion meter technique in a littoral environment’, Marine Geology, 22, M51-M58. Robinson, L. A. 1977. ‘The morphology and development of the north east Yorkshire shore platform’, Marine Geology, 23, 237-255. Shakesby, R. A. and Walsh, R. P. D. 1986. ‘Micro-erosion meter measurements of erosion on limestone, Oxwich Point, Cower: some
Spate, A. P., Jennings, J. N., Smith, D. I., and Greenaway, M. A. 1985. ‘The micro-erosion meter: use and limitations’, Earth Surface
Swncer. T. 1981. ‘MicrotoDographic change on calcarenites, Grand Cayman Island, West Indies’, Earth Surface Processes and
shorelines’, Earth Surface Processes and Landforms, 11 (4), 377-388.
Processes and Landforms, 11 (3), 335-342.
Landforms, 1(5), 475488.
Geology, 52, 141-156.
Group, Technical Bulletin, 5, 24 pp.
Geology and Geophysics, 20 (3), 571-613.
environment’, Earth Surface Processes and Landforms, 10(5), 509-518.
weathering’, Earth Surface Processes and Landforms, 10(2), 125-1 36.
663-684.
Proceedings of the Ussher Society, 5, 347-353.
ZeitschriSfur Geomorphologie Supplementband, 21, 19-28.
Institute of British Geographers N.S., 12(2), 217-226.
Marine Geology, 11, 1-14.
technical considerations and preliminary results’, Cambria, 13(2), 213-224.
Processes and Landforms, 10(5), 427-440. _ - _
-Landforms, 6(1), 85-94. -
Soencer. T. 1985. ‘Weathering rates on a Caribbean reef limestone: results and imdications’. Marine Geoloav. 6911-2). 195-201. Sbrlin& C. H. B. and Cooke:R. U. 1980. ‘Salt weathering in arid environments. 1. ‘kheoretical consideration2 Bedjord’College London
Sperling, C. H. B. and Cooke, R. U. 1985. ‘Laboratory simulation of rock weathering by salt crystallisation and hydration processes in hot
Tilley, C. E. 1923. ‘The petrology of the metamorphosed rocks of the Start area (South Devon)’, Quarterly Journal of the Geological
papers in Geography, 8, 145.
arid environments’, Earth Surface Processess and Landforms, 10(6), 541-556.
Society of London, 19, 172-204.

398 D. N. MOITERSHEAD
Tricart, J. 1960. ‘Exp6riences de dbegregation de roches granitiques par la cristallisation du sel marin’, Zeitschrift f i r Geomorphologie
Trudgill, S. T. 1976a. ‘The marine erosion of limestones on Aldabra Atoll, Indian Ocean’, Zeitschriftfir Geomorphologie Supplementband,
Trudgill, S. T. 1976b. ‘The subaerial and subsoil erosion of limestones on Aldabra Atoll, Indian Ocean’, Zeitschriftjiir Geomorphologie
Trudgill, S . T., High, C. J., and Hanna, F. K. 1981. ‘Improvements to the micro-erosion meter’, British Geomorphological Research Group,
Ussher, W. A. E. 1904. The Geology ofthe Country around Kingsbridge and Salcombe, Memoir of the Geological Survey of Great Britain. Viles, H. A. and Trudgill, S. T. 1984. ‘Long term measurements of micro-erosion meter rates, Aldabra Atoll, Indian Ocean’, Earth Surface
Whalley, W. B., McGreevey, J. P. and Ferguson, R. I. 1984. ‘Rock temperature observations and chemical weathering’, in Miller, K. J.
Williams, R. B. G. and Robinson, D. A. 1981. ‘Weathering of sandstone by the combined action of frost and salt’, Earth Surface Processes
Supplementband, 1, 239-240.
26, 164-200.
Supplementband, 26,201-210.
Technical Bulletin, 29, 3-17.
Processes and Lundforms, 9(1), 89-94.
(Ed.), The Znternational Karakoram Project, ool. 2, Cambridge University Press, Cambridge, 616635.
and Landjorms, 6(1), 1-10.