Embed Size (px)
Citation preview

BioMed Central
International Journal of Health Geographics
ss
Open AcceResearchInequalities in neighbourhood socioeconomic characteristics: potential evidence-base for neighbourhood health planningAgricola Odoi*1,2, Ron Wray2,3, Marion Emo2, Stephen Birch4, Brian Hutchison4, John Eyles5 and Tom Abernathy1Address: 1Department of Clinical Epidemiology and Biostatistics, McMaster University, Hamilton, Ontario, Canada, 2Formerly with Hamilton District Health Council, Hamilton, Ontario, Canada, 3Canadian Institute for Health Information, Toronto, Ontario, Canada, 4Centre for Health Economics and Policy Analysis, McMaster University, Hamilton, Ontario, Canada and 5School of Geography and Geology, McMaster University & McMaster Institute of Environment & Health, Hamilton, Ontario, Canada
Email: Agricola Odoi* - [email protected]; Ron Wray - [email protected]; Marion Emo - [email protected]; Stephen Birch - [email protected]; Brian Hutchison - [email protected]; John Eyles - [email protected]; Tom Abernathy - [email protected]
* Corresponding author
AbstractBackground: Population health planning aims to improve the health of the entire population andto reduce health inequities among population groups. Socioeconomic factors are increasingly beingrecognized as major determinants of many aspects of health and causes of health inequities.Knowledge of socioeconomic characteristics of neighbourhoods is necessary to identify theirunique health needs and enhance identification of socioeconomically disadvantaged populations.Careful integration of this knowledge into health planning activities is necessary to ensure thathealth planning and service provision are tailored to unique neighbourhood population healthneeds. In this study, we identify unique neighbourhood socioeconomic characteristics and classifythe neighbourhoods based on these characteristics. Principal components analysis (PCA) of 18socioeconomic variables was used to identify the principal components explaining most of thevariation in socioeconomic characteristics across the neighbourhoods. Cluster analysis was usedto classify neighbourhoods based on their socioeconomic characteristics.
Results: Results of the PCA and cluster analysis were similar but the latter were more objectiveand easier to interpret. Five neighbourhood types with distinguishing socioeconomic anddemographic characteristics were identified. The methodology provides a more complete pictureof the neighbourhood socioeconomic characteristics than when a single variable (e.g. income) isused to classify neighbourhoods.
Conclusion: Cluster analysis is useful for generating neighbourhood population socioeconomicand demographic characteristics that can be useful in guiding neighbourhood health planning andservice provision. This study is the first of a series of studies designed to investigate healthinequalities at the neighbourhood level with a view to providing evidence-base for health planners,service providers and policy makers to help address health inequity issues at the neighbourhoodlevel. Subsequent studies will investigate inequalities in health outcomes both within and across theneighbourhood types identified in the current study.
Published: 10 August 2005
International Journal of Health Geographics 2005, 4:20 doi:10.1186/1476-072X-4-20
Received: 15 June 2005Accepted: 10 August 2005
This article is available from: http://www.ij-healthgeographics.com/content/4/1/20
© 2005 Odoi et al; licensee BioMed Central Ltd. This is an Open Access article distributed under the terms of the Creative Commons Attribution License (http://creativecommons.org/licenses/by/2.0), which permits unrestricted use, distribution, and reproduction in any medium, provided the original work is properly cited.
Page 1 of 15(page number not for citation purposes)

International Journal of Health Geographics 2005, 4:20 http://www.ij-healthgeographics.com/content/4/1/20
BackgroundTraditional health planning has typically focused on thepractice and delivery of health care services. Populationhealth planning, on the other hand, aims to improve thehealth of the entire population and to reduce health ineq-uities among population groups [1]. The health of a pop-ulation is influenced by several factors including but notlimited to socioeconomic status [2], social support net-works [3] education [4], ethnicity [5], employment [6],working conditions [7-10], physical environment [11],personal health behaviours [12,13], health care services[14] and individual coping skills [15,16]. Therefore,health planning, policy and interventions need to takeinto consideration not only the health care services, butalso these broad determinants of health.
Since socioeconomic and demographic characteristics areimportant determinants of population health, adopting apopulation health approach to health planning at theneighbourhood level requires improved knowledge of thedistribution of population socioeconomic and demo-graphic characteristics at this level. Globally, there is anincreasing interest in understanding the relationshipbetween neighbourhood of residence and health of thepopulation [17-19]. To this end, some researchers havesuggested that improving the health of those living in theworst areas calls for systematically exploring area differ-ences to inform social and health policy [20].
Currently, the lowest geographical level at which mosthealth-planning data in Canada are analyzed is themunicipal (city) level. Obviously, the use of such a largeunit of analysis limits the ability to identify specific popu-lation characteristics as well as health variations andneeds at the lower levels. The implication is that dispari-ties in health outcomes and access to health care servicesacross population sub-groups at these lower levels areunclear. Moreover, most large cities have diverse popula-tions [21-24]; therefore the neighbourhoods within themhave diverse socioeconomic and demographic characteris-tics that may influence neighbourhood population healthoutcomes and therefore health needs [25-27]. A numberof studies have shown the extent and causes of neighbour-hood socioeconomic inequalities [21-23,28-31]. In Can-ada, there is evidence that neighbourhood socioeconomicinequality has been rising since 1970 [32,33]. Moreover,numerous studies have reported associations betweenneighbourhood socioeconomic characteristics and vari-ous health outcomes [34-42]. Therefore, taking into con-sideration the diverse socioeconomic and demographiccharacteristics of the different neighbourhoods duringhealth planning would ensure that planning and healthservices are tailored to the unique needs of the local resi-dents of each neighbourhood.
Studies of geographical distribution of determinants ofhealth have mainly used one of three approaches. The firstinvolves either production of a single map showing thespatial distribution of a single variable (determinant ofhealth) or production of a series of maps each showingthe distribution of a single determinant of health [43-45].The limitations of this method are that only one determi-nant can be assessed at a time(if a single variable approachis used) and assumes each determinant is independent ofother determinants (if a series of maps is used). Moreover,when a series of maps is used, interpretation may be diffi-cult. In the second approach, a composite index is createdfrom combining two or more variables [46-48]. Althoughthis approach mitigates the limitations of approach 1 andis effective in highlighting areas considered to be "high-risk", its drawback is that specific population characteris-tics (e.g. education, ethnicity, income, etc) are rolled intoan index so that one cannot identify distinct characteris-tics (with respect to these variables) attributable to spe-cific geographical areas. A third analytical approach usesfactor analysis (or principal components analysis) toinvestigate several determinants [49,50]. This approach isa data reduction technique used to reduce the dimension-ality of the data from several variables to a few factors (orprincipal components) that explain most of the variabilityin the original data. The current study uses principal com-ponents analysis and cluster analysis and GeographicalInformation Systems (GIS) to mitigate the limitations ofthe above approaches.
The objectives of this study were to use multivariate statis-tical techniques to identify the socioeconomic and demo-graphic characteristics of neighbourhoods in the city ofHamilton, Ontario, Canada; and to classify the neigh-bourhoods based on similarities of these characteristics.Potential applications of the methodology in needs-basedneighbourhood population health planning, servicedelivery, and policy development are proposed.
MethodologyStudy area and geographical scale of analysisThe study was carried out in the city of Hamilton, Ontario,Canada. The city has a population of over 490,000 peopleand spans over 1,117 square kilometres [51]. A number offactors were considered in selecting the appropriate levelof geography for the study. These included homogeneityof socioeconomic variables within the geographical unit;large enough population size to minimize the "smallnumber problem"; data availability; acceptability byhealth planners and health service providers; and stabilityof the boundaries over time for maximum temporal datacomparability for future analyses.
Based on the above criteria, census tracts were chosen asthe most appropriate level of geography for the analysis. A
Page 2 of 15(page number not for citation purposes)
International Journal of Health Geographics 2005, 4:20 http://www.ij-healthgeographics.com/content/4/1/20
census tract (CT) is a small, relatively stable geographicunit usually having a population of 2,500 to 8,000 per-sons with an average of approximately 4,000 [52]. Thereare 132 CTs in the City of Hamilton. Census tracts areused in this study to represent neighbourhoods becauseCTs have 'neighbourhood-like' characteristics due to theirhomogeneity with respect to socioeconomic and demo-graphic characteristics [53]. Therefore, throughout thispaper, CTs and neighbourhoods are used interchangea-bly. There were several advantages of adopting this as thelevel of geography for analysis and future health planning:(i) Most census data are reported at this level of geogra-phy; (ii) Administrative health data can easily be aggre-gated to this level, if the postal codes of the health carerecipients are known (this is because, in Canada, thepostal code areas are smaller than CTs are so postal codedata can easily be aggregated to the CT level); (iii) Censustracts are homogeneous with respect to socioeconomicand demographic characteristics; (iv) Their populationsizes are large enough to allow calculation of relatively sta-ble rates of most health events; (v) The boundaries of theCTs follow permanent and easily recognizable physicalfeatures and changes to their boundaries are discouragedto maintain maximum data comparability over time [52].
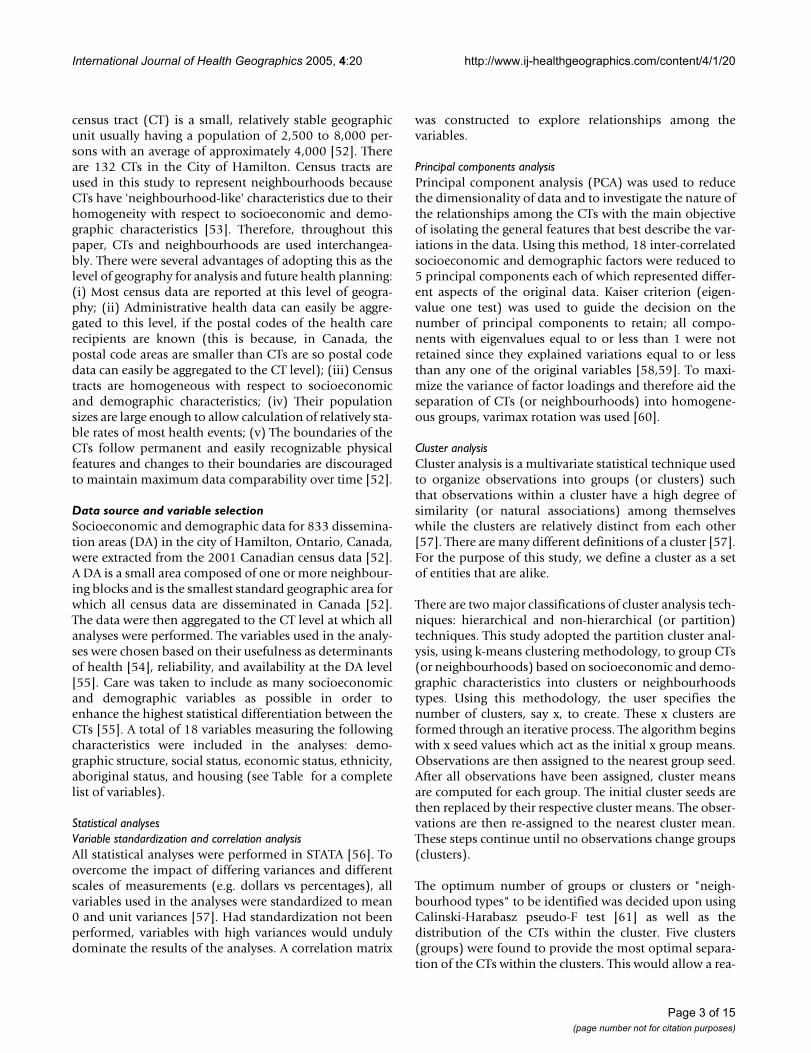
Data source and variable selectionSocioeconomic and demographic data for 833 dissemina-tion areas (DA) in the city of Hamilton, Ontario, Canada,were extracted from the 2001 Canadian census data [52].A DA is a small area composed of one or more neighbour-ing blocks and is the smallest standard geographic area forwhich all census data are disseminated in Canada [52].The data were then aggregated to the CT level at which allanalyses were performed. The variables used in the analy-ses were chosen based on their usefulness as determinantsof health [54], reliability, and availability at the DA level[55]. Care was taken to include as many socioeconomicand demographic variables as possible in order toenhance the highest statistical differentiation between theCTs [55]. A total of 18 variables measuring the followingcharacteristics were included in the analyses: demo-graphic structure, social status, economic status, ethnicity,aboriginal status, and housing (see Table for a completelist of variables).
Statistical analysesVariable standardization and correlation analysisAll statistical analyses were performed in STATA [56]. Toovercome the impact of differing variances and differentscales of measurements (e.g. dollars vs percentages), allvariables used in the analyses were standardized to mean0 and unit variances [57]. Had standardization not beenperformed, variables with high variances would undulydominate the results of the analyses. A correlation matrix
was constructed to explore relationships among thevariables.
Principal components analysisPrincipal component analysis (PCA) was used to reducethe dimensionality of data and to investigate the nature ofthe relationships among the CTs with the main objectiveof isolating the general features that best describe the var-iations in the data. Using this method, 18 inter-correlatedsocioeconomic and demographic factors were reduced to5 principal components each of which represented differ-ent aspects of the original data. Kaiser criterion (eigen-value one test) was used to guide the decision on thenumber of principal components to retain; all compo-nents with eigenvalues equal to or less than 1 were notretained since they explained variations equal to or lessthan any one of the original variables [58,59]. To maxi-mize the variance of factor loadings and therefore aid theseparation of CTs (or neighbourhoods) into homogene-ous groups, varimax rotation was used [60].
Cluster analysisCluster analysis is a multivariate statistical technique usedto organize observations into groups (or clusters) suchthat observations within a cluster have a high degree ofsimilarity (or natural associations) among themselveswhile the clusters are relatively distinct from each other[57]. There are many different definitions of a cluster [57].For the purpose of this study, we define a cluster as a setof entities that are alike.
There are two major classifications of cluster analysis tech-niques: hierarchical and non-hierarchical (or partition)techniques. This study adopted the partition cluster anal-ysis, using k-means clustering methodology, to group CTs(or neighbourhoods) based on socioeconomic and demo-graphic characteristics into clusters or neighbourhoodstypes. Using this methodology, the user specifies thenumber of clusters, say x, to create. These x clusters areformed through an iterative process. The algorithm beginswith x seed values which act as the initial x group means.Observations are then assigned to the nearest group seed.After all observations have been assigned, cluster meansare computed for each group. The initial cluster seeds arethen replaced by their respective cluster means. The obser-vations are then re-assigned to the nearest cluster mean.These steps continue until no observations change groups(clusters).
The optimum number of groups or clusters or "neigh-bourhood types" to be identified was decided upon usingCalinski-Harabasz pseudo-F test [61] as well as thedistribution of the CTs within the cluster. Five clusters(groups) were found to provide the most optimal separa-tion of the CTs within the clusters. This would allow a rea-
Page 3 of 15(page number not for citation purposes)
International Journal of Health Geographics 2005, 4:20 http://www.ij-healthgeographics.com/content/4/1/20
sonable number of relatively homogeneous CTs (orneighbourhoods) per group (or neighbourhood type).Formation of more groups (neighbourhood types)resulted in some with too few CTs whereas formation offewer groups resulted in loss of homogeneity within thegroups.
The similarity (or dissimilarity) measure (also known asdistance measure) used for the classification of the CTswas Minkowski distance metrics with argument 2 (L2)[57]. This measure, commonly known as euclidean dis-tance, was calculated as follows:
where: p (in this case 18) is the number of variablesincluded in the cluster analysis; xik and xjk are the values ofvariable k for CTs i and j respectively. The summations areover the p (or 18) variables involved in the cluster analy-sis. The 5 initial cluster centres were obtained randomlyfrom among the CTs or neighbourhoods in the study area.For reproducibility a random number seed was appliedbefore the 5 CTs were randomly chosen.
Since neighbourhoods belonging to the same group havecertain socioeconomic and demographics characteristics
Table 1: Variables included in the Hamilton neighbourhood analysis. Most definitions were adopted from Statistics Canada health region peer groups Study [55]. Those not adopted from the Statistics Canada study are: median income, married, live alone, population under 20 and non-official language population.
Variable name Definition
Persons with less than grade 9 education Percentage of the pop 20 years and over with less than grade 9 educationNew immigrants The percentage of immigrants who came to Canada from 1996 to 2001Visible minority Percentage of the population belonging to a visible minority group. As defined by the employment
equity act (1986), visible minorities are persons (other than Aboriginal people) who are non-Caucasian in race or non-white in colour.
Aboriginal persons Percentage of population reporting at least one Aboriginal origin (North American Indian, Métis or Inuit)
Median income Median personal income for persons aged 15 and over, from all sources.Government transfer income Percentage of all income that came from government transfers (e.g., Canadian pension plan (CPP),
guaranteed income supplement (GIS), old age security, etc.) for the population 15 years of age and older.
Incidence of low income (LICO) Percentage of persons in economic families and unattached individuals with 2000 incomes below the Statistics Canada low-income cut-off (LICO). The cut-offs represent levels of income where people spend disproportionate amounts of money for food, shelter, and clothing. LICOs are based on family size and degree of urbanization; cut-offs are updated to account for changes in the consumer price index.
Non-official language pop Percentage of the population not speaking any of the two official languages.Unemployment rate Total number of unemployed individuals 15 and older divided by the total number of individuals 15
and older participating in the labour force.Average dwelling value Average expected value of an owner-occupied, non-farm, non-reserve dwelling (including the value of
the land the dwelling is on) at the time of the censusOwner-occupied dwellings Percentage of dwellings in which the owner also lives. Band housing and collective dwellings (i.e.
rooming houses, nursing homes, military camps etc.) Are excluded from both numerator and denominator.
Population under 20 years old Percentage of the population under the age of 20 yearsPopulation 65 years or older Percentage of the population aged 65 years or olderSingle-parent Families Percentage of single-parent families among all census families living in private households. A census
family refers to a married or common-law couple or lone parent with at least one never-married son or daughter living in the same household.
Married Percent of legally married persons 15 & overLive alone Percent of persons living alone in private householdsInternal migrant mobility Percent of the population that lived in a different Canadian municipality at the time of the previous
census. Excludes Canadians in households outside Canada (military & government personnel)Population density Total population of a census tract divided by its area in Km2
L x xik jkk
p2
2
1
1 2
= −( )
=∑
/
Page 4 of 15(page number not for citation purposes)

International Journal of Health Geographics 2005, 4:20 http://www.ij-healthgeographics.com/content/4/1/20
in common, the resultant grouping provides usefulinsights into understanding the socioeconomic anddemographic characteristics of each group (or neighbour-hood type).
Cartographic manipulationsAll cartographic manipulations were performed inArcView GIS [62]. The principal components extractedduring the PCA and the identified cluster resulting fromthe cluster analysis were exported to ArcView GIS. Thegeographical distribution of principal components 1–4across the CTs was cartographically displayed in four dif-ferent maps, one map per principal component. The spa-tial distribution of the five identified clusters were alsodisplayed in one map. All CTs belonging to one clusterwere represented with the same colour resulting in a mapwith five different colours each representing CTs belong-ing to the same cluster.
ResultsCorrelationsAll the observed correlations were in the expected direc-tions (Table 2). For instance, neighbourhoods with highproportions of low-income earners were more likely tohave high percentages of non-official language popula-tion (r = 0.62), single-parent families (r = 0.8), populationliving alone (r = 0.6), and high population density (r =0.6). Moreover, neighbourhoods with high percentage ofvisible minority population also tended to have high pro-portions of new immigrants (r = 0.69), low-income per-sons (r = 0.61), and low percentage of owner-occupieddwellings (r = -0.61). Additionally, neighbourhoods withhigh percentage of population with less than Grade 9 edu-cation, tended to have low median income (r = -0.65),and a high percentage of population receiving govern-ment transfer income (r = 0.7).
Principal components analysisOnly the first five principal components, that had eigen-values greater than 1, were extracted (Table 3). The first PC
Table 2: Correlation matrix of variables used in multivariate analyses of socioeconomic and demographic variables in Hamilton neighbourhoods, 2004. Numbers not in brackets are pair-wise correlation coefficients whereas those in brackets are p-values. A: Persons with less than grade 9 education; B: New immigrants; C: Visible minority; D: Aboriginal persons; E: Median income; F: Government transfer income; G: Low-income persons; H: Non-official language population; I: Unemployment rate; J: Dwelling value; K: Owner-occupied dwellings; L: Population aged under 20 years; M: Population aged 65 years or older; N: Single-parent families; O: Married population; P: Population living alone; Q: Internal migrants R: Population Density
A B C D E F G H I J K L M N O P Q R
A 1.00B 0.12
(0.166)1.00
C 0.28 (0.001)
0.69 (<.001)
1.00
D 0.24 (0.006)
-0.04 (0.623)
0.12 (0.176)
1.00
E -0.65 (<.001)
-0.35 (<.001)
-0.48 (<.001)
-0.59 (<.001)
1.00
F 0.70 (<.001)
0.31 (<.001)
0.37 (<.001)
0.11 (0.229)
-0.68 (<.001)
1.00
G 0.52 (<.001)
0.50 (<.001)
0.61 (<.001)
0.22 (0.013)
-0.74 (<.001)
0.82 (<.001)
1.00
H 0.66 (<.001)
0.59 (<.001)
0.62 (<.001)
0.04 (0.660)
-0.51 (<.001)
0.56 (<.001)
0.60 (<.001)
1.00
I 0.49 (<.001)
0.34 (<.001)
0.44 (<.001)
0.11 (0.201)
-0.54 (<.001)
0.68 (<.001)
0.66 (<.001)
0.56 (<.001)
1.00
J -0.49 (<.001)
-0.45 (<.001)
-0.48 (<.001)
-0.19 (0.027)
0.68 (<.001)
-0.77 (<.001)
-0.82 (<.001)
-0.50 (<.001)
-0.54 (<.001)
1.00
K -0.25 (0.004)
-0.67 (<.001)
-0.61 (<.001)
-0.17 (0.054)
0.59 (<.001)
-0.62 (<.001)
-0.79 (<.001)
-0.50 (<.001)
-0.55 (<.001)
0.68 (<.001)
1.00
L -0.07 (0.426)
-0.12 (0.190)
0.10 (0.246)
0.09 (0.300)
0.14 (0.103)
-0.33 (<.001)
-0.16 (0.077)
-0.07 (0.413)
-0.12 (0.180)
0.28 (0.001)
0.38 (<.001)
1.00
M 0.13 (0.132)
-0.06 (0.485)
-0.26 (0.003)
-0.22 (0.010)
-0.02 (0.859)
0.38 (<.001)
0.01 (0.948)
-0.01 (0.906)
0.06 (0.484)
-0.16 (0.072)
-0.11 (0.195)
-0.76 (<.001)
1.00
N 0.46 (<.001)
0.31 (<.001)
0.43 (<.001)
0.18 (0.039)
-0.57 (<.001)
0.67 (<.001)
0.80 (<.001)
0.41 (<.001)
0.57 (<.001)
-0.75 (<.001)
-0.58 (<.001)
0.08 (0.394)
-0.12 (0.184)
1.00
O -0.32 (<.001)
-0.36 (<.001)
-0.44 (<.001)
-0.23 (0.007)
0.64 (<.001)
-0.67 (<.001)
-0.86 (<.001)
-0.39 (<.001)
-0.56 (<.001)
0.79 (<.001)
0.81 (<.001)
0.40 (<.001)
-0.10 (0.240)
-0.73 (<.001)
1.00
P 0.10 (0.252)
0.34 (<.001)
0.29 (0.001)
0.08 (0.344)
-0.42 (<.001)
0.58 (<.001)
0.62 (<.001)
0.27 (0.002)
0.41 (<.001)
-0.59 (<.001)
-0.77 (<.001)
-0.72 (<.001)
0.44 (<.001)
0.33 (<.001)
-0.80 (<.001)
1.00
Q -0.33 (<.001)
0.16 (0.071)
0.14 (0.103)
0.35 (<.001)
-0.03 (0.698)
-0.19 (0.032)
0.02 (0.791)
-0.04 (0.671)
0.00 (0.962)
0.10 (0.251)
-0.25 (0.004)
-0.03 (0.756)
-0.24 (0.005)
-0.11 (0.231)
-0.16 (0.076)
0.24 (0.006)
1.00
R 0.18 (0.038)
0.42 (<.001)
0.43 (<.001)
0.11 (0.219)
-0.41 (<.001)
0.44 (<.001)
0.60 (<.001)
0.32 (<.001)
0.36 (<.001)
-0.62 (<.001)
-0.67 (<.001)
-0.28 (0.002)
0.05 (0.553)
0.48 (<.001)
-0.64 (<.001)
0.59 (<.001)
-0.02 (0.821)
1.00
Page 5 of 15(page number not for citation purposes)

International Journal of Health Geographics 2005, 4:20 http://www.ij-healthgeographics.com/content/4/1/20
is associated with the largest eigenvalue. This PC is a linearcombination of the variables that account for the highestvariability (46.1%) in the data. The second PC explainsthe highest variability not accounted for by the first PCwhile the third PC explains the largest variability notaccounted for by the first two PC and so on. The first fivePCs together accounted for a total of 84.23% of the totalvariation in the data (Table 3).
The first Principal Component is the most important sincemost (12) of the variables loaded heavily on it (Table 3).The component loadings measure the relationships of thesocioeconomic and demographic variables with each ofthe PCs. The values of the loadings range from -1 to 1. Theuniqueness values of almost all the variables were rela-tively low with the highest being 0.437 and the lowest0.071. Uniqueness is the percentage of variance for a var-iable that is not explained by the PCs. For instance, almostall the variations for low-income, population under 20,percent married and percent living alone are explained bythe five PCs (Table 3).
Principal component 1 is mainly an economic status com-ponent but also had a social component. Neighbour-hoods (CTs) with high values of this PC had highproportions of aboriginal people, low median income,high percentage of low-income earners, relatively highpercentage of individuals receiving government transfer
income, high unemployment rates, low dwelling values, ahigh percentage of single-parent families, few owner-occupied dwellings, few married people, high percentageof persons living alone and high population density (Fig-ure 1 and Table 3). These neighbourhoods could bedescribed as high risk neighbourhoods because they hadhigh values of most of the undesirable socioeconomicdeterminants of health.
Principal component 2 was generally a demographic com-ponent. Neighbourhoods with high values of PC 2 hadhigh percentages of children less than 20 years of age, butlow percentages of seniors (Figure 2 and Table 3). Neigh-bourhoods with high values of PC 3 had high percentagesof population with less than grade 9 education but lowpercentages of internal migrants (Table 3 and Figure 3).Finally, neighbourhoods that had high values of thefourth PC, an immigration and aboriginal status compo-nent, had high percentage of new immigrants but lowpopulation of people of aboriginal origin (Figure 4 andTable 3). The last PC (PC 5) did not load highly on any ofthe variables but was extracted because its eigenvalue wasslightly higher than 1 (Table 3).
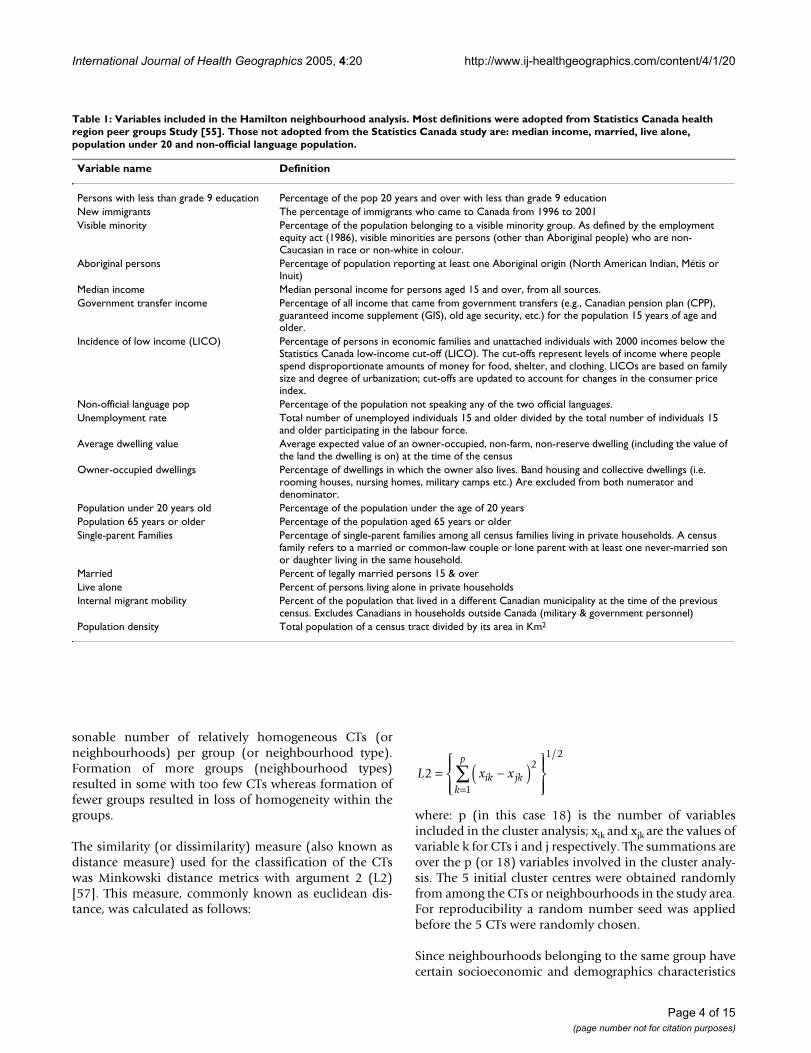
Cluster analysisFigure 5 shows the geographical distribution of the iden-tified neighbourhood types (clusters). The detaileddescriptive statistics of the socioeconomic and demo-
Table 3: Component loadings of socio-economic and demographic factors in the Hamilton, Ontario, Canada (2004)
Variable Principal component Uniqueness1 2 3 4 5
Persons with <grade 9 education 0.575 0.176 0.659 -0.128 0.292 0.103New immigrants 0.583 0.164 -0.337 0.539 0.243 0.171Visible minority 0.643 0.419 -0.236 0.361 0.159 0.200Aboriginal percentage 0.246 0.333 -0.165 -0.788 0.238 0.123Median income -0.790 -0.200 -0.125 0.378 -0.203 0.136Government transfer income 0.847 -0.153 0.372 -0.053 0.017 0.118Low income 0.941 0.110 0.018 -0.026 -0.144 0.081Non-official language pop 0.675 0.255 0.197 0.342 0.424 0.143Unemployment rate 0.721 0.103 0.165 0.036 0.064 0.437Average dwelling value -0.874 0.044 -0.103 0.042 0.203 0.181Owner-occupied dwellings -0.867 0.099 0.354 -0.096 0.000 0.104Population under 20 years old -0.324 0.867 0.089 0.045 -0.228 0.082Population 65 years or older 0.139 -0.861 0.282 0.014 0.217 0.113Single-parent families 0.759 0.252 0.160 -0.073 -0.437 0.138Married percent -0.875 0.148 0.190 0.172 0.251 0.084Percent living alone 0.711 -0.552 -0.337 -0.075 -0.010 0.071Percent of internal migrants 0.036 0.112 -0.790 -0.280 0.292 0.198Population density 0.681 -0.113 -0.225 0.101 -0.325 0.357
Eigenvalue 8.30 2.42 1.92 1.47 1.06 -Percentage of variation explained 46.10 13.42 10.69 8.14 5.88 -Cumulative % of variation explained 46.10 59.52 70.35 78.35 84.23 -
Page 6 of 15(page number not for citation purposes)

International Journal of Health Geographics 2005, 4:20 http://www.ij-healthgeographics.com/content/4/1/20
graphic factors for each of the neighbourhood types com-pared to the entire city of Hamilton is presented in Table4. Statistical significance tests were performed to comparethe characteristics of each of the neighbourhood typeswith the Hamilton average. Measures that were signifi-cantly different from the Hamilton average are describedas high or low otherwise they are described as medium.
Neighbourhood Type A is primarily located within aninner ring surrounding the downtown core. These neigh-bourhoods can be described as "mature" areas (i.e., manyseniors) with some indications of transition (i.e., neigh-bourhood turnover with arrival of new immigrants).Neighbourhood type A consists of 46 census tracts. A highpopulation density, percentage of seniors and low-
income earners, and a medium percentage of new immi-grants characterize this neighbourhood type. It also has ahigh percentage of single-parent families, low dwellingvalues and a medium percentage of persons not able tospeak English or French. Approximately 32.7% of Hamil-ton residents live in this neighbourhood type.
Neighbourhood Type B includes high economic statusneighbourhoods in low-density rural or suburban envi-ronments. Since it covers the largest geographical area, itslow population density has a great impact on the overallpopulation density of Hamilton. These areas constitutethe geographic periphery of the city, forming an outer ringfrom east to west. Neighbourhood type B is comprised of24 census tracts and has approximately 23% of Hamilton
Principal component 1Figure 1Principal component 1. Spatial distribution of first principal component extracted in the principal components analysis of socio-economic factors in Hamilton, Ontario, Canada (2004)
Flamborough
Ancaster
Glanbrook
Stoney Creek
Dundas
Old City of Hamilton
Principal Component 1LowMedium LowMediumMedium HighHigh
Former Municipality boundaries
7 0 7 14 Kilometers
N
Page 7 of 15(page number not for citation purposes)

International Journal of Health Geographics 2005, 4:20 http://www.ij-healthgeographics.com/content/4/1/20
residents. It has high median income, dwelling values,and percentage of owner-occupied dwellings and amedium percentage of seniors. This neighbourhood typealso has a low percentage of new immigrants, single-par-ent families, and individuals with less than grade 9education.
Neighbourhood Type C represents a relatively high eco-nomic status neighbourhoods within a more urban envi-ronment. Unlike Neighbourhood Type B, an area similarin income and dwelling value levels, this NT has a rela-tively high percentage of visible minority groups. It con-sists of 17 census tracts and is characterized by highmedian income, and dwelling values. In addition, this NThas few seniors and persons living alone, but a mediumpercentage of individuals who cannot speak either English
or French. It also has high dwelling values and populationdensity. Approximately 16.9% of Hamilton residents livein this type of neighbourhood.
Neighbourhood Type D depicts a "mature" urban areawith a high percentage of seniors and owned dwellings. Ithas a relatively low percentage of low-income earners anda high percentage of individuals with less than grade 9education. In addition, this neighbourhood type has fewrecent immigrants and internal migrants, low unemploy-ment rate, high percentage of owner-occupied dwellingsand medium percentage of persons not able to speak Eng-lish or French. It is composed of 20 census tracts and 9.6%of Hamilton residents live in this type of neighbourhood.
Principal component 2Figure 2Principal component 2. Spatial distribution of second principal component extracted in the principal components analysis of socio-economic factors in Hamilton, Ontario, Canada (2004)
Flamborough
Ancaster
Glanbrook
Stoney Creek
Dundas
Old City of Hamilton
Principal Component 2LowMedium LowMediumMedium HighHigh
Former Municipality boundaries
7 0 7 14 Kilometers
N
Page 8 of 15(page number not for citation purposes)

International Journal of Health Geographics 2005, 4:20 http://www.ij-healthgeographics.com/content/4/1/20
Neighbourhood Type E constitutes the inner city core anda few areas scattered in the inner ring around the core, andis comprised of 24 census tracts. It has a high prevalenceof low-income earners, new immigrants, visible minoritygroups, and persons with less than grade 9 education. Italso has many single-parent families, those receiving gov-ernment transfer income and high unemployment rate.Approximately 17.7% of Hamiltonians live in theseneighbourhoods. Note that the sum of the populationpercentages of the groups is not 100% because one censustract was not included in the analysis because of missingdata.
DiscussionThis study has used multivariate techniques to character-ize neighbourhoods based on differences and/or similari-ties of their socioeconomic and demographiccharacteristics. The positive correlation between single-parenthood and low-income is consistent with observa-tions from other studies that single-parents generally tendto spend more time in low-income neighbourhoods com-pared to childless couples and unattached individuals[63]. Moreover, it has also been reported that single-par-enthood is common among socially disadvantagedgroups and compounds social disadvantage [64]. In lowsocioeconomic neighbourhoods, people experience barri-ers in creating and benefiting from social capital, leadingto social exclusion. The societal costs of social exclusion
Principal component 3Figure 3Principal component 3. Spatial distribution of third principal component extracted in the principal components analysis of socio-economic factors in Hamilton, Ontario, Canada (2004)
Flamborough
Ancaster
Glanbrook
Stoney Creek
Dundas
Old City of Hamilton
Principal Component 3LowMedium LowMediumMedium HighHigh
Former Municipality boundaries
7 0 7 14 Kilometers
N
Page 9 of 15(page number not for citation purposes)

International Journal of Health Geographics 2005, 4:20 http://www.ij-healthgeographics.com/content/4/1/20
are lack of cohesion, higher crime rates, increased pressureon societal services and the stigma associated with partic-ular neighbourhoods. Social exclusion is especially aproblem in neighbourhoods with high unemploymentrates, low-incomes, poor housing, etc., all of which com-bine to create a vicious cycle of poverty, low social capitaland increased health risks [65].
The negative correlation between housing ownership andvisible minority has been reported in other studies [66]. Inaddition, the observed positive correlation between visi-ble minority and low-income has also been reported inother Canadian studies which reported that visibleminority Canadians (people of colour) experience persist-ent income gap, above average levels of living on low-
income and higher levels of unemployment [67]. Thehigh negative correlation of low-income and housingownership is not surprising and is in agreement withobservations by Anderson and co-workers [68] who notedinadequate supply of affordable housing for low-incomefamilies and the increasing spatial segregation of somehouseholds by income, race, ethnicity, or social class into"unsafe neighbourhoods". Moreover, when affordablehousing is not available to low-income households, fam-ily resources needed for food, medical or dental care, andother necessities are diverted to housing costs leading tothe concept of "concentrated poverty" in certain neigh-bourhoods [68].
Principal component 4Figure 4Principal component 4. Spatial distribution of fourth principal component extracted in the principal components analysis of socio-economic factors in Hamilton, Ontario, Canada (2004)
Flamborough
Ancaster
Glanbrook
Stoney Creek
Dundas
Old City of Hamilton
Principal Component 4LowMedium LowMediumMedium HighHigh
Former Municipality boundaries
7 0 7 14 Kilometers
N
Page 10 of 15(page number not for citation purposes)
International Journal of Health Geographics 2005, 4:20 http://www.ij-healthgeographics.com/content/4/1/20
The low uniqueness values of the PCA imply that the fivePCs appropriately represent the socioeconomic anddemographic variables included in the analysis. Unique-ness values higher than 0.6 are considered high [69]. Theadvantage of using either PCA or cluster analysis in thiskind of study is that they allow incorporation of manyvariables in the characterization of neighbourhoods.Therefore, from a population health planning perspective,they provide a better understanding of neighbourhoodcharacteristics compared to representations based on onlyone variable. This is because the health of a population isdetermined by several socioeconomic, demographic andhealth care service factors and therefore analyses that
incorporate only one variable would provide insufficientinformation for population health planning purposes.
Choice of the unit of analysis is critical in these kinds ofanalyses due to the modifiable areal unit problem(MAUP) since choice of a different and/or inappropriateunit could lead to quite different results [70,71]. As hasbeen pointed out by Ross and coworkers (2004) [72], it ismore meaningful to use 'naturally' defined neighbour-hoods, rather than arbitrary geostatistical or political unitssince the distribution of population characteristics orhealth outcomes may not necessarily follow these arbi-trary/political boundaries. Ross and co-workers compared
Neighbourhood typesFigure 5Neighbourhood types. Spatial distribution of identified neighbourhood types in Hamilton Ontario, Canada (2004)
Flambo
roug
h
Ancaster
Glanbrook
Stoney Creek
Old City of Hamilton
Dundas
Neighbourhoods TypesA (46 Census Tracts)B (24 Census Tracts)C (17 Census Tracts)D (20 Census Tracts)E (24 Census Tracts)
Former Municipality Boundaries
6 0 6 12 Kilometers
N
Page 11 of 15(page number not for citation purposes)

International Journal of Health Geographics 2005, 4:20 http://www.ij-healthgeographics.com/content/4/1/20
the performance of census tracts to more 'natural' neigh-bourhoods and found very similar results and concludedthat census tracts, used as proxies of neighbourhoods inour study, are good proxies for natural neighbourhoodboundaries [72].
In this study, the results of the PCA were generally similarto those of cluster analysis since the distribution of areasidentified as high risk by PC1 tended to follow similarspatial patterns as the high risk areas identified by clusteranalysis. Both methods are therefore useful in identifyingneighbourhood socioeconomic characteristics that wouldenhance health planning. However, as has been pointedout by Luginaah and co-workers [49], interpretation ofthe results of PCA is difficult due to its subjective natureand the fact that as many maps as number of principalcomponents have to be produced. This makes clusteranalysis methodology better for these purposes. Moreo-ver, cluster analysis allows computation of statistics foreach of the clusters (neighbourhood types) making themethodology much more objective than PCA.
Similar to the pattern seen in other industrial North Amer-ican cities [28,73-75] most of the high risk neighbour-hoods in this study (i.e. with high percentage of low-income earners, low educational attainment, etc), werelocated in the downtown core with the risk decreasingtowards the suburban environments. The observeddiverse neighbourhood socioeconomic characteristicsmay imply great variability in the health needs of the dif-ferent population subgroups living in the different neigh-bourhoods since the conditions in which people livestrongly influence their health. Health inequalities areproduced by the clustering of several of these socioeco-nomic risk factors [76]. Therefore, populations living indifferent neighbourhood types differ in the type andnumber of socioeconomic risk factors to which they areexposed [77,78]. Although it is obvious that neighbour-hood type E has the lowest socioeconomic status andhighest risk while neighbourhood type B has the higheststatus and lowest risk, the intent of this study was notmerely to classify the neighbourhoods based on economicstatus. Rather, this study was intended to generate neigh-bourhood socioeconomic information on which needs-based health planning and service delivery can be based.There is benefit in targeting improvement strategies tomaterially and socially deprived groups [79].
Future directions and potential applicationsThe current study is the first of a series of projects designedto investigate neighbourhood health inequalities and pro-vide information to foster health planning with a view toreducing health inequities. The identified neighbourhoodclusters will be used, in subsequent studies, as units ofanalyses in investigating equity in health status, access
and utilization of health services. Additionally, the identi-fied of neighbourhood characteristics are expected toprovide useful information on which health planningdecisions will be based in order to:
1) Identify population health needs at the neighbourhoodlevel
2) Assess health service utilization patterns across neigh-bourhoods and compare these with neighbourhood pop-ulation characteristics and needs
3) Create geographic boundaries for the integrated deliv-ery of social and community health care services
4) Allow for the development of strategies tailored andresponsive to the unique characteristics and needs of eachneighbourhood.
5) Enhance the use of empirical data for local advocacy formarginalized and under-served neighbourhoods andother populations in need.
Incorporation of the differences in neighbourhood socio-economic characteristics in population health planningdecisions such as decisions on funding allocation to com-munity health agencies will help ensure that health plan-ning strategies are best tailored to address the uniqueneeds of each population. This is because a "one-size-fits-all" planning approach is neither efficient nor practicaldue to the different socioeconomic and demographiccharacteristics of the different neighbourhoods. It isexpected that inclusion of neighbourhood socioeconomicand demographic characteristics in population healthplanning will provide health planners with more evidenceto guide needs-based decisions that would be moreappropriate for the socioeconomically diverse neighbour-hoods. Therefore, it is hoped that the results of these anal-yses will be useful in ensuring that planning is tailored tothe unique needs of the different neighbourhood popula-tion groups. For instance, neighbourhood types A and Dhave very similar median incomes and therefore if incomewas the only variable used to characterize the neighbour-hoods, they would be treated similarly. However, the restof the characteristics of these neighbourhood types aredifferent. For example, neighbourhood type D has a muchlower percentage of new immigrants, visible minoritypopulation and single-parent families than neighbour-hood type A. Moreover, there are significantly more owneroccupied dwellings in neighbourhood type D than A. Theimplication is that these neighbourhoods have potentiallydifferent challenges and health needs. If only medianincome was used (as is most often done) to classify theneighbourhoods, the two NTs would inevitably errone-ously be treated as similar. Planning strategies based on
Page 12 of 15(page number not for citation purposes)

International Journal of Health Geographics 2005, 4:20 http://www.ij-healthgeographics.com/content/4/1/20
such single variable analysis may not be appropriate sincethe strategies would not be tailored to the unique charac-teristics and therefore needs of the NTs.
ConclusionIn this study, we have used multivariate techniques toidentify unique neighbourhood characteristics and clas-sify the neighbourhoods into groups with similar charac-teristics. Since the identified neighbourhood types arehomogeneous with respect to the broad determinants ofhealth, they offer potentially excellent opportunities forhealth planners and service providers to understand thecharacteristics and potential health needs of the differentneighbourhoods and therefore better plan for them.Through continuous monitoring of health informationacross these neighbourhoods, health planners, serviceproviders and policy makers could better make decisionsbased on knowledge of the local communities.
Authors' contributionsAO was involved in the study design, execution and writ-ing up of the draft and final copies of the manuscript. RWconceived the need for the study, was involved in thestudy design and preparation of the manuscript. ME, SB,BH, JE, and TA participated in the study design, guidingimplementation and preparation of the draft of themanuscript.
AcknowledgementsWe thank all stakeholders who participated in the consultative meetings to discuss the study findings and appropriateness of findings for health planning.
References1. Kindig D, Stoddart G: What is population health? Am J Public
Health 2003, 93:380-383.2. Yu IT, Wong TW, Wong SL: Small area variations of cancer
mortality in Hong Kong – the roles of health care and socio-economic status. Neoplasma 2004, 51:144-149.
3. Singh GK, Miller BA: Health, life expectancy, and mortality pat-terns among immigrant populations in the United States.Can J Public Health 2004, 95:I14-I21.
4. Paulander J, Axelsson P, Lindhe J: Association between level ofeducation and oral health status in 35-, 50-, 65- and 75-year-olds. J Clin Periodontol 2003, 30:697-704.
5. Epstein AM: Health care in America – still too separate, notyet equal. N Engl J Med 2004, 351:603-605.
6. Hnizdo E, Sullivan PA, Bang KM, Wagner G: Association betweenchronic obstructive pulmonary disease and employment byindustry and occupation in the US population: a study of datafrom the Third National Health and Nutrition ExaminationSurvey. Am J Epidemiol 2002, 156:738-746.
7. Bartosinska M, Ejsmont J: [Health condition of employeesexposed to noise – extra auditory health effects] Stanzdrowia pracownikow narazonych na halas – skutki zdrow-otne pozasluchowe. Wiad Lek 2002, 55:20-25.
8. Blau G, Tatum DS, McCoy K, Dobria L, Ward-Cook K: Job loss,human capital job feature, and work condition job feature asdistinct job insecurity constructs. J Allied Health 2004, 33:31-41.
9. Garbarino S, De Carli F, Mascialino B, Beelke M, Nobili L, Squarcia S,Penco MA, Ferrillo F: Sleepiness in a population of Italian shift-work policemen. J Hum Ergol (Tokyo) 2001, 30:211-216.
10. Shields M: Shift work and health. Health Rep 2002, 13:11-33.
Table 4: Summary statistics of socio-economic and demographic features of identified neighbourhood types in Hamilton, 2004. Data source: Statistics Canada, 2001 census. NT = Neighbourhood type. The sum of the populations from the 5 neighbourhood types is not 490,268 due to missing data in one census tract.
Variable Means
Hamilton NT A NT B NT C NT D NT E
Persons with <grade 9 education (%) 10.3 11.3 4.7 9.2 13.7 16.9New immigrants (%) 3.2 3.4 0.9 2.7 1.2 6.6Visible minority (%) 10.9 9.4 4.2 14.4 5.6 20.7Aboriginal persons (%) 2.2 2.6 1.0 1.6 3.0 4.1Median income ($) 22927 22262 30351 25958 22837 16250Government transfer income (%) 12.1 15.9 7.3 8.3 13.4 23.2Low income (%) 19.8 21.7 5.6 12.7 10.7 42.4Persons not speaking English or French (%) 1.8 1.6 0.33 1.6 1.6 4.4Unemployment rate (%) 6.4 5.7 2.2 4.2 3.5 10.1Average dwelling value ($) 166783 125271 224342 173801 162157 89174Owner-occupied dwellings (%) 65.2 61.9 87.4 81.8 86.7 34.7Population under 20 years old (%) 26.1 23.5 27.5 33.6 21.2 23.6Population 65 years or older (%) 14.3 17.2 13.2 7.2 21.0 14.3Single-parent families (%) 16.6 19.9 9.5 15.4 10.7 25.7Married (%) 51.7 47.3 60.9 58.9 58.5 35.7Live alone (%) 10.3 13.3 5.4 2.9 8.7 21.1Internal migrants (%) 10.6 9.2 14.5 7.7 6.9 12.2Population Density (No. of persons per Km2) 438.9 3627.4 357.1 2543.2 2352.1 5706.0Population (count) 490268 160438 112875 82976 47137 86683
Page 13 of 15(page number not for citation purposes)

International Journal of Health Geographics 2005, 4:20 http://www.ij-healthgeographics.com/content/4/1/20
11. Dearry A: Impacts of our built environment on public health.Environ Health Perspect 2004, 112:A600-A601.
12. Kasmel A, Helasoja V, Lipand A, Prattala R, Klumbiene J, Pudule I:Association between health behaviour and self-reportedhealth in Estonia, Finland, Latvia and Lithuania. Eur J PublicHealth 2004, 14:32-36.
13. Ndubani P, Bond V, Liljestrom R, Hojer B: Understanding youngmen's sexual health and prospects for sexual behaviourchange in rural Zambia. Scand J Public Health 2003, 31:291-296.
14. Cree MW, Juby AG, Carriere KC: Effect of home care servicelevels on health outcomes in hip fracture patients in Alberta.Health 2004, 7:49-53.
15. Gerrard N, Kulig J, Nowatzki N: What doesn't kill you makesyou stronger: determinants of stress resiliency in rural peo-ple of Saskatchewan, Canada. J Rural Health 2004, 20:59-66.
16. Gil KM, Anthony KK, Carson JW, Redding-Lallinger R, DaeschnerCW, Ware RE: Daily coping practice predicts treatmenteffects in children with sickle cell disease. J Pediatr Psychol 2001,26:163-173.
17. Ellaway A, Macintyre S: Does where you live predict healthrelated behaviours?: a case study in Glasgow. Health Bull 1996,54:443-446.
18. Macintyre S, Ellaway A: Neighbourhood cohesion and health insocially contrasting neighbourhoods: implications for thesocial exclusion and public health agendas. Health Bull 2000,58:450-456.
19. Krueger PM, Bond Huie SA, Rogers RG, Hummer RA: Neighbour-hoods and homicide mortality: an analysis of race/ethnicdifferences. J Epidemiol Community Health 2004, 58:223-230.
20. Macintyre S, Maciver S, Sooman A: Area, class and health: shouldwe be focussing on places or people? Journal of Social Policy 1993,22:213-234.
21. Massey DS: American Apartheid: Segregation and the Makingof the Underclass. The American Journal of Sociology 1990,96:329-357.
22. Massey DS, Eggers ML: The Ecology of Inequality: Minoritiesand the Concentration of Poverty, 1970–1980. The AmericanJournal of Sociology 1990, 95:1153-1188.
23. Massey DS, Denton NA: Suburbanization and Segregation inU.S. Metropolitan Areas. The American Journal of Sociology 1988,94:592-626.
24. Myles J, Picot G, Pyper W: Neighbourhood inequality in Cana-dian cities. Ottawa, Ontario, Canada: Statistics Canada, AnalyticalStudies Branch; 2000.
25. Kirby JB, Kaneda T: Neighborhood socioeconomic disadvan-tage and access to health care. J Health Soc Behav 2005, 46:15-31.
26. Marmot M: Social determinants of health inequalities. Lancet2005, 365:1099-1104.
27. Arntzen A, Nybo Andersen AM: Social determinants for infantmortality in the Nordic countries, 1980–2001. Scand J PublicHealth 2004, 32:381-389.
28. Jargowsky PA: Poverty and Place: Ghettos, Barrios and theAmerican city. New York, USA: Rusell Sage Foundation; 1997.
29. Denton NA, Massey DS: Patterns of neighborhood transition ina multiethnic world: U.S. metropolitan areas, 1970–1980.Demography 1991, 28:41-63.
30. Massey DS, Denton NA: Hypersegregation in U.S. metropoli-tan areas: black and Hispanic segregation along fivedimensions. Demography 1989, 26:373-391.
31. Massey DS: The age of extremes: concentrated affluence andpoverty in the twenty-first century. Demography 1996,33:395-412.
32. MacLachlan I, Sawada R: Measures of inequality and social polar-ization in Canadian metropolitan areas. The CanadianGeographer 1997, 41:377-397.
33. Lee KK: Urban Poverty in Canada. Ottawa, Ontario, Canada:Canadian Council on Social Development; 2000.
34. Henderson C, Diez Roux AV, Jacobs DRJ, Kiefe CI, West D, WilliamsDR: Neighbourhood characteristics, individual level socioe-conomic factors, and depressive symptoms in young adults:the CARDIA study. J Epidemiol Community Health 2005,59:322-328.
35. Stafford M, Cummins S, Macintyre S, Ellaway A, Marmot M: Genderdifferences in the associations between health and neigh-bourhood environment. Soc Sci Med 2005, 60:1681-1692.
36. Drukker M, Kaplan C, van Os J: Residential instability in socio-economically deprived neighbourhoods, good or bad? HealthPlace 2005, 11:121-129.
37. Diez-Roux AV, Borrell LN, Haan M, Jackson SA, Schultz R: Neigh-bourhood environments and mortality in an elderly cohort:results from the cardiovascular health study. J Epidemiol Com-munity Health 2004, 58:917-923.
38. Stafford M, Martikainen P, Lahelma E, Marmot M: Neighbourhoodsand self rated health: a comparison of public sector employ-ees in London and Helsinki. J Epidemiol Community Health 2004,58:772-778.
39. Schneiders J, Drukker M, van der Ende J, Verhulst FC, van Os J, Nicol-son NA: Neighbourhood socioeconomic disadvantage andbehavioural problems from late childhood into earlyadolescence. J Epidemiol Community Health 2003, 57:699-703.
40. Stafford M, Marmot M: Neighbourhood deprivation and health:does it affect us all equally? Int J Epidemiol 2003, 32:357-366.
41. Winkleby MA, Cubbin C: Influence of individual and neighbour-hood socioeconomic status on mortality among black, Mex-ican-American, and white women and men in the UnitedStates. J Epidemiol Community Health 2003, 57:444-452.
42. Sundquist J, Malmstrom M, Johansson SE: Cardiovascular risk fac-tors and the neighbourhood environment: a multilevelanalysis. Int J Epidemiol 1999, 28:841-845.
43. Blake BJ, Bentov L: Geographical mapping of unmarried teenbirths and selected sociodemographic variables. Public HealthNurs 2001, 18:33-39.
44. Pettit KLS, Kingsley GT, Coulton CJ: Neighborhoods and Health:Building Evidence for Local Policy. Washington DC, USA: TheUrban Institute submitted to The Office of the Assistant Secretary forPlanning and Evaluation U.S. Department of Health and HumanServices; 2003.
45. Odoi A, Martin SW, Michel P, Middleton D, Holt J, Wilson J: Inves-tigation of clusters of giardiasis using GIS and a spatial scanstatistic. Int J Health Geogr 2004, 3:11.
46. Lorant V, Thomas I, Deliege D, Tonglet R: Deprivation and mor-tality: the implications of spatial autocorrelation for healthresources allocation. Soc Sci Med 2001, 53:1711-9.
47. Malmstrom M, Sundquist J, Johansson SE: Neighborhood environ-ment and selfreported health status: a multilevel analysis.Am J Public Health 1999, 89:1181-6.
48. Pampalon R, Raymond G: A deprivation index for health andwelfare planning in Quebec. Chronic Dis Can 2000, 21:104-13.
49. Luginaah I, Jerrett M, Elliott S, Eyles J, Parizeau K, Birch S, AbernathyT, Veenstra G, Hutchinson B, Giovis C: Health profiles of Hamil-ton: Spatial characterisation of neighbourhoods for healthinvestigations. GeoJournal 2001, 53:135-147.
50. Diez-Roux AV, Kiefe CI, Jacobs DR Jr, Haan M, Jackson SA, Nieto FJ,Paton CC, Schulz R: Area characteristics and individual-levelsocioeconomic position indicators in three population-basedepidemiologic studies. Ann Epidemiol 2001, 11:395-405.
51. Hamilton District Health Council: Hamilton Health System FactBook. Hamilton, Ontario, Canada: Hamilton District HealthCouncil; 2004.
52. Statistics Canada: 2001 Census Dictionary. Ottawa, Ontario, Can-ada. Ministry of Industry; 2003.
53. Frenette M, Picot G, Sceviour R: How long do people live in low-income neighbourhoods? Evidence for Toronto, Montrealand Vancouver. Ottawa, Canada: Statistics Canada; 2004.
54. Population Health Approach: What Determines Health?[http://www.phacaspc.gc.ca/ph-sp/phdd/determinants/index.html#What]
55. Statistics Canada: Health Region Peer Groups. Ottawa, Ontario,Canada. Statistics Canada; 2002.
56. Stata Corporation: STATA Version 8.2. 4905 Lakeway Drive, Col-lege Station, Texas, USA; 2004.
57. Everitt BS, Landau S, Leese M: Cluster Analysis. Oxford, UnitedKingdom: Oxford University Press; 2001.
58. Norman GR, Streiner DL: Biostatistics: The Bare Essentials. BC Decker Inc; 2000.
59. Dunteman GH: Principal components analysis. In QuantitativeApplications in the Social Sciences Series, No. 69 Thousand Oaks, Cali-fornia, USA: Sage Publications; 1989.
60. Kaiser HF: The varimax criterion for analytic rotation in fac-tor analysis. Psychometrika 1958, 23:187-200.
Page 14 of 15(page number not for citation purposes)
International Journal of Health Geographics 2005, 4:20 http://www.ij-healthgeographics.com/content/4/1/20
Publish with BioMed Central and every scientist can read your work free of charge
"BioMed Central will be the most significant development for disseminating the results of biomedical research in our lifetime."
Sir Paul Nurse, Cancer Research UK
Your research papers will be:
available free of charge to the entire biomedical community
peer reviewed and published immediately upon acceptance
cited in PubMed and archived on PubMed Central
yours — you keep the copyright
Submit your manuscript here:http://www.biomedcentral.com/info/publishing_adv.asp
BioMedcentral
61. Caliński T, Harabasz J: A dendrite method for cluster analysis.Communications in Statistics 1974, 3:1-27.
62. ESRI: ArcView GIS. Version 3.2. Redlands, California, USA: Envi-ronmental Systems Research Institute Inc; 1999.
63. Frenette M, Picot G, Sceviour R: How long do people live in low-income neighbourhoods? Evidence for Toronto, Montrealand Vancouver. Ottawa, Canada: Statistics Canada; 2004.
64. Martin SP: Delayed marriage and childbearing: implicationsand measurement of diverging trends in family timing. Mar-yland, USA: Department of Sociology and Maryland PopulationResearch Center, University of Maryland, College Park; 2002.
65. What is Social Exclusion? [http://www.socialexclusion.gov.uk/page.asp?id=213]
66. Krivo LJ, Kaufman RL: Housing and wealth inequality: racial-ethnic differences in home equity in the United States.Demography 2004, 41:585-605.
67. Galabuzi GE: Canada's creeping economic apartheid. Toronto,Ontario, Canada: CSJ Foundation for Research and Education; 2001.
68. Anderson LM, Charles JS, Fullilove MT, Scrimshaw SC, Fielding JE,Normand J: Providing affordable family housing and reducingresidential segregation by income. A systematic review. AmJ Prev Med 2003, 24:47-67.
69. Stata Corporation: Cluster Analysis. College Station, Texas, USA:Stata Press; 2003.
70. Openshaw: The modifiable areal unit problem. CATMOG No.38. Norwich: Geo Books; 1984.
71. Steel GG, Holt D: Rules for random aggregation. Environ PlanningA 1996, 28:957-978.
72. Ross NA, Tremblay SS, Graham K: Neighbourhood influences onhealth in Montréal, Canada. Soc Sci Med 2004, 59:1485-1484.
73. Allard SW: Access to social services: The Changing UrbanGeography of Poverty and Service Provision. Washington DC,USA: The Brookings Institute; 2004.
74. Wilson WJ: The Truly Disadvantaged. Chicago, USA: Universityof Chicago Press; 1987.
75. Wilson WJ: When Work Disappears: The World of the NewUrban Poor. New York, USA: Alfred A Knopf; 1996.
76. Shaw M, Dorling D, Gordon D, Davey SG: The widening gap:health inequalities and policy in Britain. Bristol, United King-dom: The Policy Press; 1999.
77. Shaw M, Dorling D, Davey SG: Poverty, social exclusion andminorities. In Social Determinants of Health edition Edited by: MarmotMG, Wilkinson RG. Oxford: Oxford University Press; 1999.
78. Kunst AE, Groenhof F, Mackenbach JP, Health EW: Occupationalclass and cause specific mortality in middle aged men in 11European countries: comparison of population based stud-ies. EU Working Group on Socioeconomic Inequalities inHealth. BMJ 1998, 316:1636-1642.
79. Martinez J, Pampalon R, Hamel D: Deprivation and stroke mor-tality in Quebec. Chronic Diseases in Canada. Ottawa,Ontario, Canada: Population and Public Health Branch, HealthCanada; 2003.
Page 15 of 15(page number not for citation purposes)


![[Geographical inequalities in mortality and incidence in larynx cancer in men: socioeconomic and environmental factors]](https://img.dokumen.tips/doc/110x75/6352989b0f35c933db00bbb5/geographical-inequalities-in-mortality-and-incidence-in-larynx-cancer-in-men-socioeconomic.jpg)

![[Physical activity levels among Colombian adults: Inequalities by gender and socioeconomic status]](https://img.dokumen.tips/doc/110x75/6345613c596bdb97a908e7e5/physical-activity-levels-among-colombian-adults-inequalities-by-gender-and-socioeconomic.jpg)