Embed Size (px)
Citation preview

1
Socioeconomic inequalities in alcohol related cancer mortality among men: to what extent do
they differ between Western European populations?
Short title: socioeconomic inequalities in alcohol related cancer mortality among European
men
Gwenn Menvielle1, Anton E Kunst
1, Irina Stirbu
1, Carme Borrell
2, Matthias Bopp
3, Enrique
Regidor4, Bjørn Heine Strand
5, Patrick Deboosere
6, Olle Lundberg
7, Annette Leclerc
8,
Giuseppe Costa9, Jean-Francois Chastang
8, Santiago Esnaola
10, Pekka Martikainen
11, Johan P
Mackenbach1
1: Department of Public Health, Erasmus MC, University Medical Center Rotterdam, Postbus
2040, 3000 CA Rotterdam, The Netherlands
2: Agency of Public Health of Barcelona, Barcelona, Spain
3: Institute of Social and Preventive Medicine, University of Zurich, Switzerland
4: Department of Preventive Medicine and Public health, Universidad Complutense de
Madrid, Madrid, Spain
5: Division of Epidemiology, Norwegian Institute of Public Health, Oslo, Norway
6: Interface Demography, Centrum voor Sociologie-VUB, Brussels, Belgium
7: CHESS, Stockholm University, Stockholm, Sweden
8: INSERM U687, Saint-Maurice, France
9: Department of Public Health, University of Turin, Turin, Italy
10: Research Unit, Department of Health, Basque Government, Vitoria-Gasteiz, Spain
11: Department of Sociology, University of Helsinki, Helsinki, Finland
Corresponding author information
inse
rm-0
0225
142,
ver
sion
1 -
4 Se
p 20
09Author manuscript, published in "International Journal of Cancer 2007;121(3):649-55"
DOI : 10.1002/ijc.22721

2
Gwenn Menvielle. Room AE-141, Department of Public Health, Erasmus MC, University
Medical Center Rotterdam, Postbus 2040, 3000 CA Rotterdam, The Netherlands
Fax: +31-10-463 8474
Email: [email protected]
Keywords: men, Europe, education, alcohol-related cancers, mortality
Key statements:
Inequalities in alcohol related cancers were larger in Southern Europe (Spain, France and
Switzerland) than in Northern Europe.
The contribution of alcohol-related cancers to socioeconomic inequalities in cancer mortality
was high in France, Madrid and Barcelona (35%) compared to small (less than 5-15%) in
Belgium and the Nordic countries.
inse
rm-0
0225
142,
ver
sion
1 -
4 Se
p 20
09

3
Abstract
We aim to study socioeconomic inequalities in alcohol related cancers mortality (upper aero-
digestive tract (UADT) (oral cavity, pharynx, larynx, oesophagus) and liver) in men and to
investigate whether the contribution of these cancers to socioeconomic inequalities in cancer
mortality differs within Western Europe. We used longitudinal mortality datasets including
causes of death. Data were collected during the 1990s among men aged 30-74 years in 13
European populations (Madrid, the Basque region, Barcelona, Turin, Switzerland (German
and Latin part), France, Belgium (Walloon and Flemish part, Brussels), Norway, Sweden,
Finland). Socioeconomic status was measured using the educational level declared at the
census at the beginning of the follow-up period. We conducted Poisson regression analyses
and used both relative (Relative index of inequality (RII)) and absolute (mortality rates
difference) measures of inequality. For UADT cancers, the RII’s were above 3.5 in France,
Switzerland (both parts) and Turin whereas for liver cancer they were the highest (around 2.5)
in Madrid, France and Turin. The contribution of alcohol related cancer to socioeconomic
inequalities in cancer mortality was 29-36% in France and the Spanish populations, 17-23%
in Switzerland and Turin, and 5-15% in Belgium and the Nordic countries. We did not
observe any correlation between mortality rates differences for lung and UADT cancers,
confirming that the pattern found for UADT cancers is not only due to smoking. This study
suggests that alcohol use substantially influences socioeconomic inequalities in male cancer
mortality in France, Spain and Switzerland but not in the Nordic countries and nor in
Belgium.
inse
rm-0
0225
142,
ver
sion
1 -
4 Se
p 20
09
4
Introduction
Alcohol drinking is an important determinant for many causes of death, including cancer 1, 2
.
In many populations, a strong association is observed between socioeconomic position and
alcohol related mortality with higher mortality among subjects with a low socioeconomic
position 3-5
. With regards to mortality from specific cancers related to alcohol use (liver,
larynx, oral cavity, pharynx, oesophagus), however, variations in the level of socioeconomic
inequalities among men are found between European populations. Large inequalities are
found in Spain and Italy and, especially, in France 6-10
. On the contrary, some studies have
suggested small socioeconomic inequalities in the Nordic countries and Switzerland 10-12
.
Nevertheless, the literature is rather scarce and a European overview of differences in
socioeconomic inequalities in alcohol related cancers is currently lacking. It would be of
interest to document the true extent of the problem within Europe. Contrary to smoking 13
, the
role of alcohol in socioeconomic inequalities in cancer mortality has not yet been evaluated
but may also be important. In addition, a comparison between European populations would
show whether different patterns in socioeconomic inequalities in alcohol-related cancers are
found within Europe and whether these patterns could be related to different drinking
cultures. Differences in national levels of alcohol related cancers mortality rates are found
between Western European countries, with substantially higher rates in Spain and Italy, and
especially in France 14
. In addition, different drinking cultures are observed in Western
Europe between countries but also within some countries. Daily wine consumption especially
during meal is more common in countries like Spain, Portugal, Italy or France or in the Latin
part of Switzerland whereas binge drinking and beer consumption is more widespread in the
UK, the Nordic countries and the German part of Switzerland 15-17
.
inse
rm-0
0225
142,
ver
sion
1 -
4 Se
p 20
09

5
The aim of this study was to investigate differences in socioeconomic inequalities in alcohol-
related cancers mortality between Western European populations. Our dataset included
longitudinal studies from 13 populations from South to North of Western Europe with
information on causes of death. We included populations with contrasted situations with
regards to overall levels of alcohol related cancers mortality rates and drinking cultures.
We will first investigate socioeconomic inequalities among men in alcohol related cancers
mortality, and thereby distinguish liver and upper aerodigestive tract (UADT) cancers. We
will then focus on the contribution of alcohol related cancers to socioeconomic inequalities in
mortality from all cancers types together. As UADT cancers are also smoking related, we will
finally study lung cancer as an indicator of the smoking situation in each population and
evaluate to which degree the international patterns of inequalities in UADT cancers are
correlated with those for lung cancer.
inse
rm-0
0225
142,
ver
sion
1 -
4 Se
p 20
09
6
Material and methods
Longitudinal data from 13 European populations were used, including Madrid, the Basque
region (Spanish part), Barcelona, Turin, Switzerland (Latin and German part), France,
Belgium (Brussels, Walloon and Flemish part), Sweden, Norway and Finland. Most datasets
covered the entire national population, except for France (a representative sample of 1% of
the population), Madrid and Basque region (regions), Barcelona and Turin (urban areas). In
Belgium and Switzerland, we distinguished regions with differences in alcohol consumption
and drinking patterns that could induce differences in socioeconomic inequalities in alcohol
related cancers. Men were selected at the time of the population census and followed up
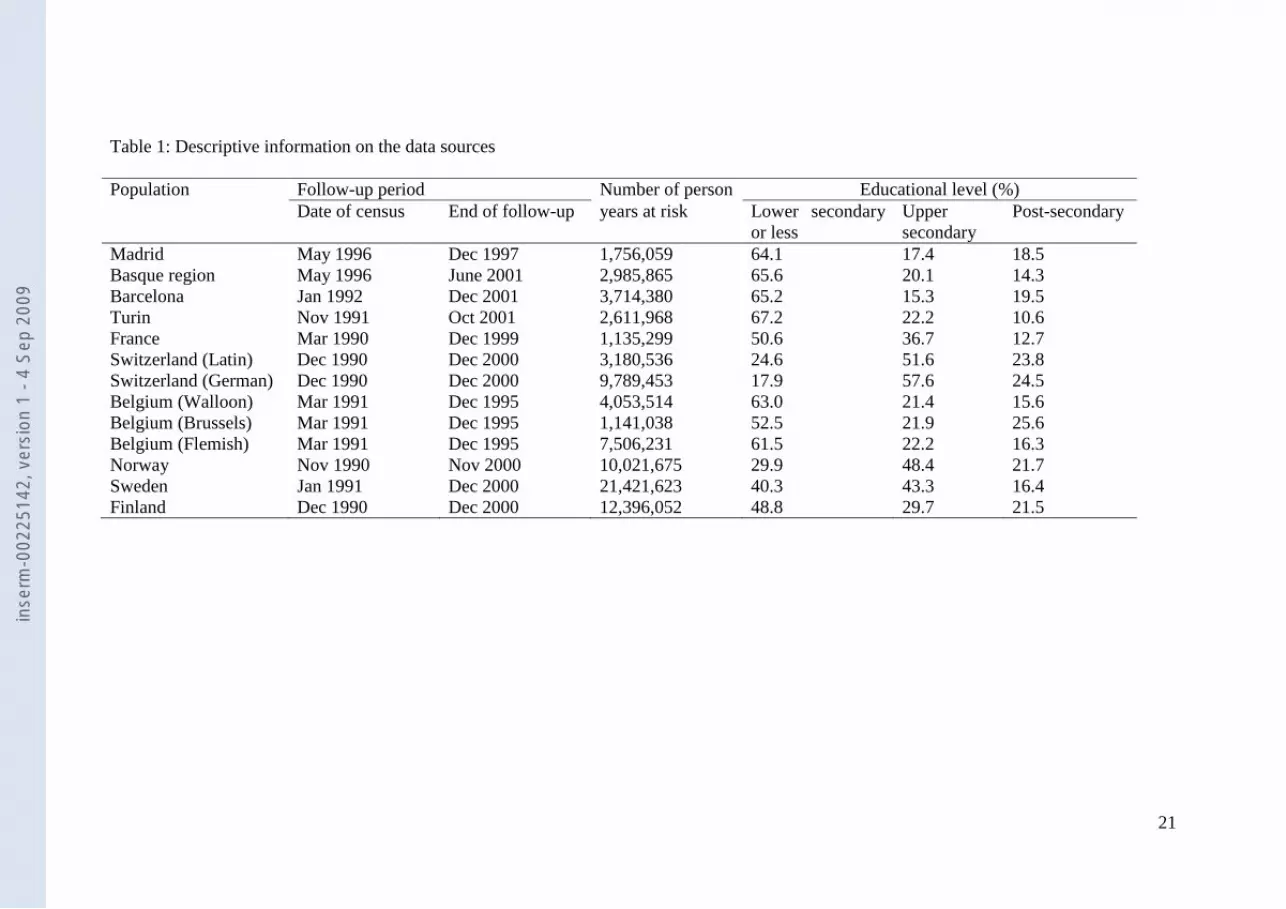
during the 1990s (Table 1).
Analyses included men aged 30-74 at the census. The follow-up period was shorter for
Belgium, Madrid and the Basque region. In order to have results on comparable ages in terms
of observed ages at death, analyses for these three populations were conducted on slightly
older age groups at baseline (35-79 for Madrid and 30-79 for Belgium and the Basque
region).
The linkage between census data and mortality registries was achieved for more than 96% of
all deceased persons in all populations except for Madrid (70%), the Basque region (93%) and
Barcelona (94.5%). In these latter populations, however, no variation in this percentage was
found according to age, sex or socioeconomic position (except in the Basque region for the
latter factor). In order to avoid an underestimation of absolute mortality rates in these three
populations, observed absolute mortality were increased by correction factors (1/0.70, 1/0.93
and 1/0.945 respectively).
inse
rm-0
0225
142,
ver
sion
1 -
4 Se
p 20
09
7
The socioeconomic position (SEP) was measured with education declared at the time of the
population census. This variable was categorized into three classes that corresponded to the
ISCED (International Standard Classification of Education) classification: 0-2 (lower
secondary education or less), 3-4 (upper secondary education), 5-6 (post-secondary
education). The percentage of missing values for education was of 17% in Brussels, 5% in the
Walloon and Flemish parts of Belgium and less than 3% for all other populations. These
subjects were excluded from the analysis.
The cause of death was obtained by linkage with death registries. Analyses were conducted
for all cancer mortality (ICD 9: 140-249), for lung cancer (ICD 9: 162-3, 165), and for
alcohol related cancers: UADT (that groups oral cavity, pharynx, esophagus and larynx (ICD
9: 140-50, 161)) and liver (ICD 9: 155). UADT and liver cancer were selected for analyses
because they are strongly associated with alcohol consumption 1, 18
and because they
presented a substantial population attributable fraction (PAF) for alcohol (20-40% for UADT
and 32% for liver 1, 19
). Lung cancer was selected as an indicator for the cumulative exposure
of the population to smoking. This approach is considered to be acceptable, although lung
cancer mortality is only an approximate indicator 20
.
The magnitude of socioeconomic inequalities in mortality was estimated in both absolute and
relative terms. To estimate relative inequalities, we computed relative indices of inequality
(RII) using Poisson regression. The calculation of the RII is based on a ranked variable, which
specifies for each educational group the mean proportion of the population with a higher level
of education. For instance, the rank of the lowest educational group is calculated as the
proportion of the population with middle or high education, plus half of the proportion of the
population with a lowest educational level. The RII is then computed by regressing the
inse
rm-0
0225
142,
ver
sion
1 -
4 Se
p 20
09

8
mortality on this ranked variable. Thus, the RII expresses inequality within the whole
socioeconomic continuum. It can be interpreted as the ratio of mortality rates between the two
extremes of the educational hierarchy. As it takes into account the size and relative position of
each educational group, it is well adapted to compare populations with different educational
distributions 21, 22
.
To estimate absolute socioeconomic inequalities we computed absolute rate differences
between the lowest and the highest educational level, both for all cancer mortality and for the
specific cancer types. Age-standardized mortality rates were computed, using the population
of EU-15 plus Norway of 1995 as the standard population. The contribution of these different
cancer types to socioeconomic inequalities in all cancer mortality was also calculated by
expressing the rate difference for this cancer type as a percentage of the rate difference for all
cancer mortality.
inse
rm-0
0225
142,
ver
sion
1 -
4 Se
p 20
09
9
Results
The educational distributions highly differed between the populations (Table 1). The
percentage of subjects with lower secondary education or less was the highest in the three
Spanish populations and Turin (around 65%) and the lowest in Norway (less than 30%) and
Switzerland (around 20%).
For UADT and liver cancers, we observed a regular inverse gradient in cancer mortality, with
higher cancer rates for lower educational levels (Graph 1). Differences were found between
populations and the situation is remarkable in France with the highest mortality rate among
men with lower secondary education or less and among the lowest mortality rate among men
with post-secondary education.
For UADT cancers, the largest RII’s (above 3.5) were observed in France, Switzerland
(German and Latin part), and Turin (Table 2). The RII was lower than 2 but still significant in
Belgium. For liver cancer, the largest RII’s (above 2.5) were found in Madrid, France and
Turin. In contrast, the RII was around 1 and non-significant in the Basque region, Belgium
and Norway. For lung cancer, the largest RII’s (around 3 or above) were observed in Finland,
Belgium and the German part of Switzerland. They were lower than 2 but still significant in
the Spanish populations and France.
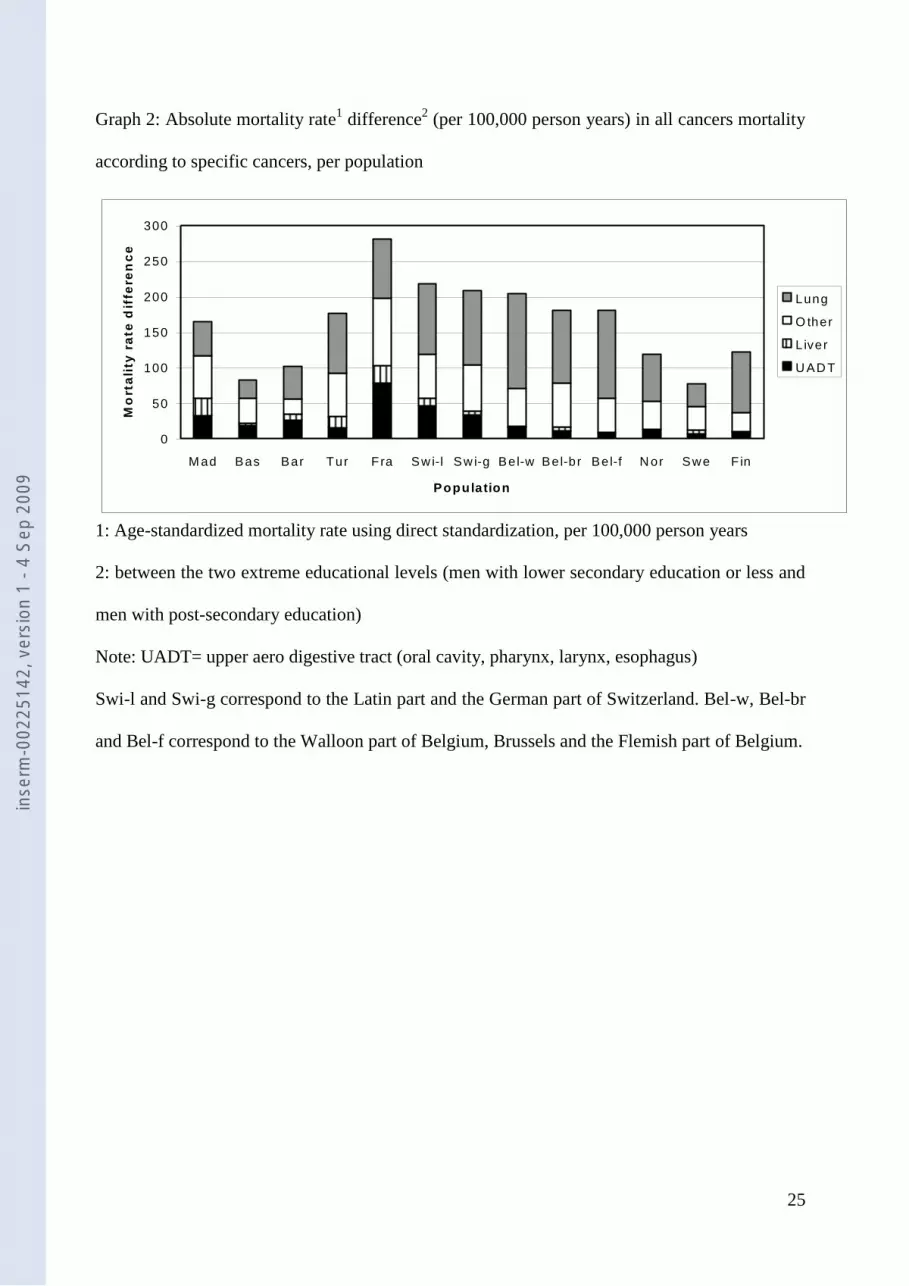
Absolute mortality rate differences by cancer site are presented in Graph 2. The most striking
result is the large range of mortality rates differences found for UADT cancers: from 7 in
Sweden to 78 per 100000 person years in France. It was between 20 and 40/100000 in the
Spanish populations and Switzerland (German part) and 46 in Switzerland (Latin part). The
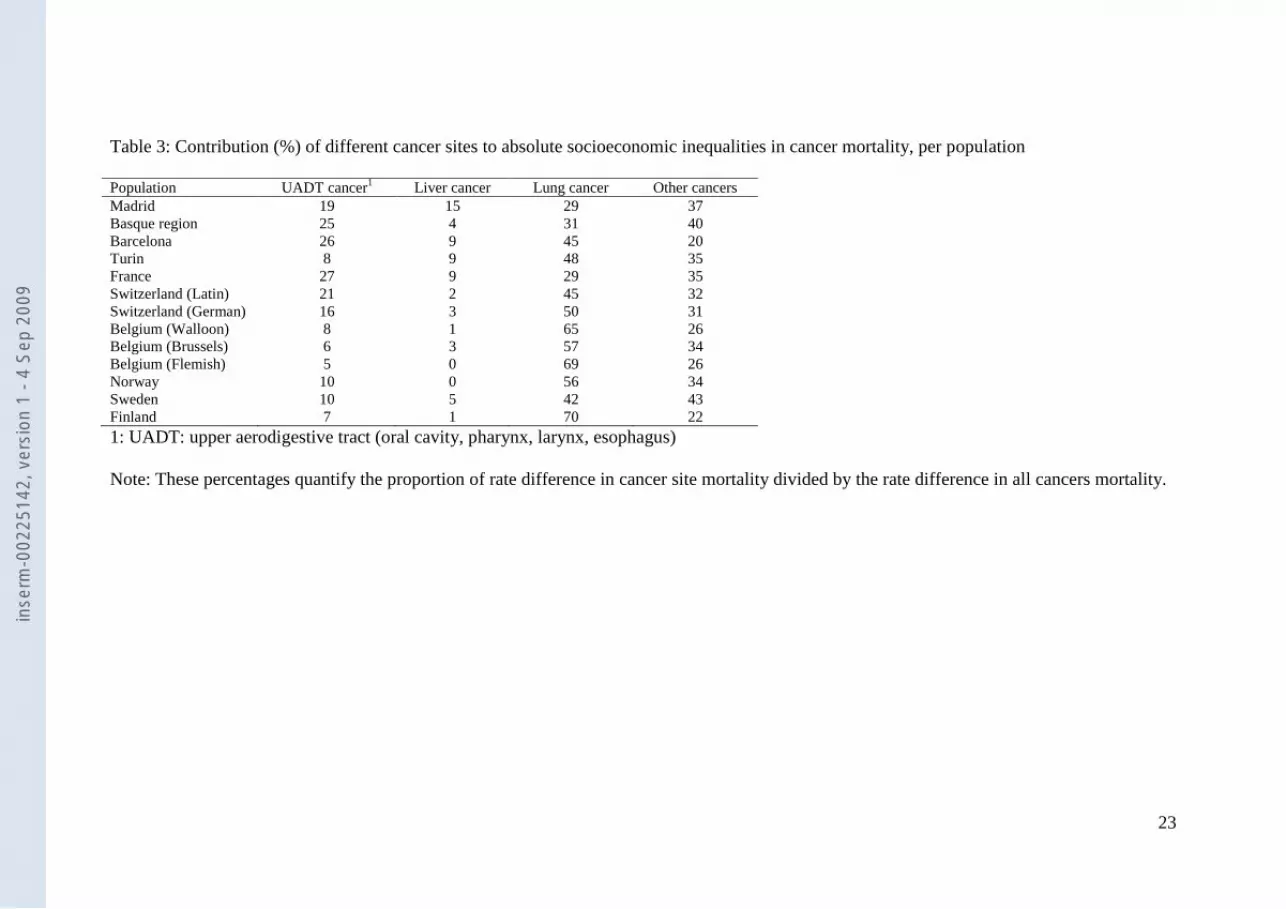
contribution of these cancer sites to socioeconomic inequalities is presented in Table 3. The
inse
rm-0
0225
142,
ver
sion
1 -
4 Se
p 20
09
10
contribution of UADT cancers was the highest in France, Barcelona and the Basque region,
(around 25%), followed by the Latin part of Switzerland and Madrid (20%). The contribution
of liver cancer was much lower. However, we observed differences between populations with
the largest contribution in Madrid (15%) and also a substantial contribution in France,
Barcelona and Turin (9%) whereas it was lower than 6% in all other populations. All in all,
the contribution of alcohol related cancer to socioeconomic inequalities in cancer mortality
was 29-36% in France and the Spanish populations, 17-23% in the Swiss regions, and Turin,
and 5-15% in Belgium and the Nordic countries.
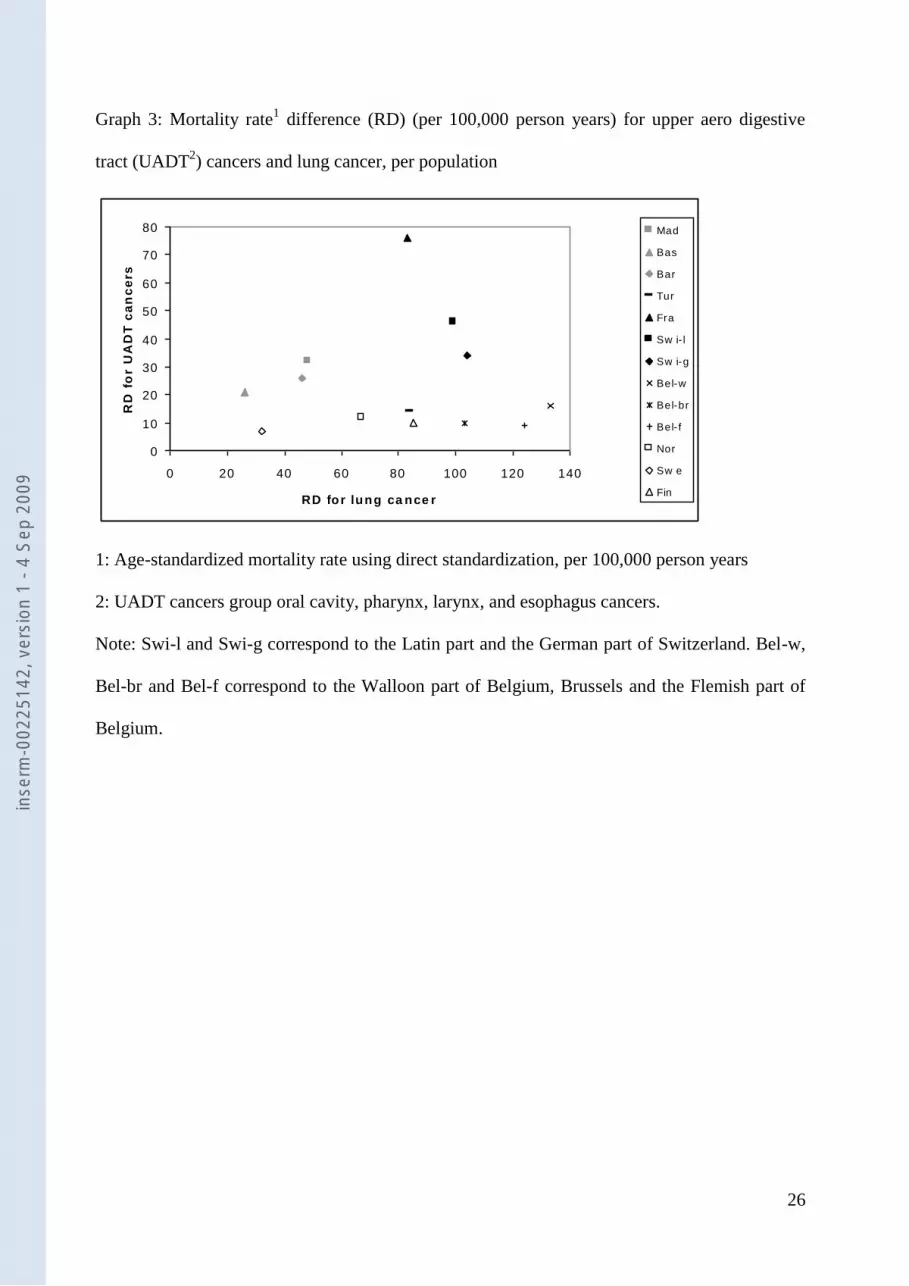
We do not observe a correlation between absolute inequalities for lung and UADT cancers
(graph 3). Populations with the largest inequalities in lung cancer are not those with the
largest inequalities in UADT cancers. Belgium shows large rate difference for lung cancer but
small difference for UADT cancers. The rate difference for UADT cancers is similar in
Madrid and the German part of Switzerland, whereas the rate difference for lung cancer is two
times lower in Madrid. France shows particularly high difference for UADT cancers but only
a medium rate difference for lung cancer. Also in terms of relative inequalities (RII’s), there is
no correlation between mortality rates differences for lung and UADT cancers (see Table 2). inse
rm-0
0225
142,
ver
sion
1 -
4 Se
p 20
09

11
Discussion
This study focused on differences between Western European populations with regards to
socioeconomic inequalities in alcohol related cancer mortality. Large differences were found.
Inequalities were largest in Spain, Switzerland and France and smallest in the Nordic
countries and Belgium. In France, socioeconomic inequalities were remarkably large for
UADT cancers. The contribution of alcohol-related cancers to socioeconomic inequalities in
cancer mortality was high in France, Madrid and Barcelona (35%) compared to small (less
than 5-15%) in Belgium and the Nordic countries. The lack of correlation between the
inequalities found for lung and UADT cancers suggested that, even though smoking is a
major risk factor for UADT cancers, large inequalities in UADT cancers were also due to
other factors, probably alcohol drinking.
Evaluation of data
There are differences in the follow-up periods. Given the shorter follow-up period in Madrid,
the Basque region and Belgium, we changed the age range at baseline for these populations
such that studies were similar in terms of average at death. However, subjects may be slightly
older or younger in these populations compared with others. This could have resulted in a
slight under-estimation of relative socioeconomic inequalities and over-estimation of absolute
inequalities for these populations. Nevertheless, these effects, if any, are likely to be small.
Some differences were found in the populations covered. In France and Switzerland,
foreigners were excluded and analyses were thus conducted for more homogeneous
populations. Perhaps the exclusion of foreigners has lead to underestimation of inequalities in
alcohol-related cancers mortality in these countries. A large part of migrants, at least in
France, come from Muslims countries and often do not drink alcohol for religious reasons 23
.
inse
rm-0
0225
142,
ver
sion
1 -
4 Se
p 20
09

12
In France, they generally have low levels of UADT cancers mortality. For liver cancer, on the
other hand, mortality rates among migrants are higher than in the native population but the
etiology is different (due to Hepatitis B or C infection) 24-26
.
Differences could occur between populations in the coding of causes of death. Even though
data came from countries with reliable cause-of-death registries, national diagnosing practices
may differ between countries. International comparisons revealed that more deaths were
classified as cancer deaths in France than in other countries, probably leading to an over-
estimation of the French cancer mortality rates 27, 28
. This bias could be a serious issue for
absolute measures of inequalities, especially if it occurs more for some cancer sites (for
instance UADT in France). With regards to relative measures of inequalities, our results
would be biased only if diagnosing practices differ by socioeconomic position of the
deceased, and if this applies especially to some cancer sites. There is no evidence to support
this hypothesis.
In addition, there is a specific problem related to liver cancer mortality rates because of
frequent misclassification of metastases as primary cancers. An American study suggested
that between 27 and 31% of liver cancer deaths were due to metastases or secondary cancers
instead of primary cancers 29
. The results relating to liver cancer should therefore be
considered cautiously. Unfortunately, no study investigated the potential association between
socioeconomic position and misclassification as well as possible variations between countries.
If the rate of misclassification does not differ by socioeconomic position, this problem would
impact on absolute inequalities but not on relative inequalities.
inse
rm-0
0225
142,
ver
sion
1 -
4 Se
p 20
09
13
Socioeconomic status was measured using information on educational level. We used a
common classification for all populations that should avoid problems with the comparability
between educational systems of different countries. However, large differences were observed
between populations in the educational distributions. Part of these differences may be due to
real differences in educational levels. But we cannot rule out the possibility that there are
differences in the way in which educational systems are being squeezed into this common
classification. However these differences probably have a weak influence on the results found
here. We evaluated the sensitivity of the results to alternative educational classifications. In
one type of analyses, for example, we used a classification into 4 educational levels by
distinguishing between men who completed lower secondary education from men with
primary education only. We also considered another classification in 3 educational levels in
order to get population distributions that were as similar as possible between populations. The
results obtained with these alternative classifications were quite similar to those presented
here.
Several European countries were not included in this analysis. We did not include any country
from Eastern Europe because of lack of longitudinal mortality studies. We also did not
include the UK since British data were not accessible for small causes of death because of
confidentiality rules. In the UK, a low contribution of non-lung cancers to socioeconomic
inequalities in all cancer mortality was found in the 1980s 30
whereas this contribution was
comparable to that of lung cancer in another study conducted in the 1990s 31
.
Possible explanations of the results
Socioeconomic inequalities in the distribution of risk factors may largely explain the results.
Smoking is a major risk factor for both lung and UADT cancers; the PAF for smoking for
inse
rm-0
0225
142,
ver
sion
1 -
4 Se
p 20
09
14
UADT cancers is indeed around 70%,. Therefore, smoking may potentially explain a large
part of the observed inequalities in UADT mortality. Nevertheless, smoking alone cannot
fully explain the international patterns in inequalities. The differences in inequalities in
UADT cancer between countries with comparable inequalities in lung cancer mortality,
especially between northern and southern countries, point to the effect of other factors. Given
the high PAF found for alcohol (between 20 and 40%) 1, 19
for UADT cancers, alcohol
consumption is certainly one of those factors.
Consequently, variations in drinking patterns between European populations may partly
explain our results. It is unlikely that the type of alcohol accounts for the differences observed
as the type of alcohol consumed does not seem to have an effect on risk of UADT cancers 32,
33. Differences in socioeconomic inequalities in the total amount of alcohol consumed may be
the critical factor. In general, excessive alcohol consumption is found to be higher in men
with low socioeconomic position, although results differ according to the country. No
inequalities in high alcohol consumption are observed in Belgium 34
and inequalities are
consistently reported for France 35, 36
. A European study suggested that France was the
country with the largest inequalities, but only for excessive consumption (more than 6 drinks
per day) 34
. Some studies do not report inequalities in Northern Italy 37
or Barcelona 38
,
whereas a European study observed inequalities in Spain, but only for excessive consumption
34. In Sweden, higher alcohol consumption was found among non-manual workers in the
1970s, but an equalization of the social differences in heavy drinking and a tendency to
reversal were observed in later years 39
. In Norway, higher alcohol consumption was observed
in the upper education and income groups 40
. Thus, even though the literature is not totally
consistent, it is globally in accordance with our findings.
inse
rm-0
0225
142,
ver
sion
1 -
4 Se
p 20
09
15
With regards to absolute inequalities, the absolute level of consumption has also to be taken
into account. It is higher in France, Spain, Switzerland, Italy followed by Belgium and lower
in Finland and especially low in Sweden and Norway 41
. France thus presents a combination
of both high level of alcohol consumption and relatively large inequalities in this
consumption, followed by Spain. This may explain the largest absolute inequalities found in
these populations.
We distinguished in Belgium and Switzerland different regions that could have relevant
differences in drinking cultures. Whereas alcohol related cancer mortality rates gave a
consistent “cultural” pattern with higher rates in the Walloon part of Belgium and especially
in the Latin part of Switzerland, we observed in these regions only a slightly higher
contribution of alcohol related cancers to inequalities in total cancer mortality. Few studies
have been conducted on drinking pattern by linguistic region. They found no clear variations
in Belgium 42
but higher daily and wine consumption in the Latin part of Switzerland
compared to the German part 17
. Our results for Belgium and Switzerland are thus globally
consistent with these studies and with our results found in the bordering countries. However,
we could have expected more pronounced differences between linguistic regions. It seems
that between regions within the same country, the pattern of socioeconomic inequalities in
cancer mortality only slightly differed around a global national pattern. These results suggest
that national factors, such as common national histories, socioeconomic policies and health
care systems, predominate over regional factors in determining socio-economic inequalities in
cancer mortality.
The situation in France is remarkable because the large socioeconomic inequalities in alcohol
related cancers, and especially in UADT cancers. The situation may not be homogeneous
inse
rm-0
0225
142,
ver
sion
1 -
4 Se
p 20
09
16
within France. Larger inequalities in all-cause mortality are found in French regions with a
higher alcohol consumption, in particular in the North 43, 44
. This result suggests that there
could be large regional disparities in France in inequalities in alcohol-related mortality in
general, and in alcohol-related cancer mortality in particular. The small size of our French
dataset and resulting the lack of statistical power however hampered an regional analyses for
France.
An important and consistent result in our study is that we do not observe large socioeconomic
inequalities in alcohol-related cancer mortality in Northern Europe (Belgium and the Nordic
countries). Some studies found a strong impact of alcohol drinking on health inequalities in
the Nordic countries, but mainly through violent deaths 4, 5
. Interestingly, it is also in those
countries that binge drinking is more widespread, whereas Spain and France are characterized
by higher levels of daily alcohol consumption. These results suggest that binge drinking is
mainly associated with inequalities in violent deaths whereas high levels of daily consumption
influences inequalities in mortality in part through specific cancers.
Other risk factors than alcohol drinking and smoking may also partly explain our results.
Liver cancer is related to infection from Hepatitis B or C, but mainly in countries with high
liver cancer incidence, which is not the case of Western Europe 45
. Diet 46
and occupational
exposures 47, 48
could also contribute to inequalities in mortality from UADT cancers, but their
impact is likely to be weaker than that of alcohol.
Socioeconomic inequalities in cancer survival may partly explain socioeconomic differences
in cancer mortality. Survival inequalities may be more important for cancers with a relatively
good prognosis compared to cancer with very low survival rates 49-51
. Thus, socioeconomic
inse
rm-0
0225
142,
ver
sion
1 -
4 Se
p 20
09
17
inequalities in cancer survival might be more important for UADT cancers, as these have a
better prognosis than liver or lung 52-55
. Unfortunately, no comparative study is available on
differences between European populations in socioeconomic inequalities in cancer survival.
Conclusion
Inequalities in alcohol use have an impact on health inequalities in Europe. This has been
shown by studies that found an impact of heavy drinking on socioeconomic inequalities in
Northern Europe through poisoning, accidents and suicides. Our study showed that high
alcohol consumption also impacts on health inequalities through cancer, but more so in
Southern Europe (such as in Spain, France and Switzerland) than in Northern Europe. Thus,
while heavy drinking is an important contributor to socioeconomic inequalities in mortality,
there are large differences between populations in the relevant consumption patterns and
associated causes of death.
Acknowledgements
G Menvielle received a funding from the Fondation pour la Recherche Médicale for this
analysis. The Swiss data are from the Swiss Federal Statistical Office. The construction of the
Swiss National Cohort has been supported by the Swiss National Science Foundation (grants
No 32-5884.98 and 32-63625.00) and the Swiss University Conference (Network Public
Health, Swiss School of Public Health). The project was in part funded by the European
Commission, through the Eurothine project (from the Public Health Program, grant agreement
2003125) and the Eurocadet project (from the commission of the European communities
research directorate-general, grant No SP23-CT-2005-006528).
inse
rm-0
0225
142,
ver
sion
1 -
4 Se
p 20
09

18
References
1. Boffetta P, Hashibe M, La Vecchia C, Zatonski W, Rehm J. The burden of cancer
attributable to alcohol drinking. Int J Cancer 2006.
2. Rehm J, Room R, Monteiro M, Gmel G, Graham K, Rehn N, Sempos CT, Jernigan
D. Alcohol as a risk factor for global burden of disease. Eur Addict Res 2003;9:157-64.
3. Makela P. Alcohol-related mortality as a function of socio-economic status.
Addiction 1999;94:867-86.
4. Makela P, Valkonen T, Martelin T. Contribution of deaths related to alcohol use of
socioeconomic variation in mortality: register based follow up study. BMJ 1997;315:211-16.
5. Hemstrom O. Alcohol-related deaths contribute to socioeconomic differentials in
mortality in Sweden. Eur J Public Health 2002;12:254-62.
6. Faggiano F, Lemma P, Costa G, Gnavi R, Pagnanelli F. Cancer mortality by
educational level in Italy. Cancer Causes Control 1995;6:311-20.
7. Fernandez E, Borrell C. Cancer mortality by educational level in the city of
Barcelona. Br J Cancer 1999;79:684-89.
8. Menvielle G, Luce D, Geoffroy-Perez B, Chastang JF, Leclerc A, Edisc group.
Social inequalities and cancer mortality in France. 1975-1990. Cancer Causes Control
2005;16:501-13.
9. Faggiano F, Partanen T, Kogevinas M, Boffetta P. Socioeconomic differences in
cancer incidence and mortality. IARC Sci Publ 1997;138:65-176.
10. Moller H, Tonnesen H. Alcohol drinking, social class and cancer. IARC Sci Publ
1997;138:251-64.
11. Davey Smith G, Leon D, Shipley MJ, Rose G. Socioeconomic differentials in
cancer among men. Int J Epidemiol 1991;20:339-45.
12. Rosengren A, Wilhelmsen L. Cancer incidence, mortality from cancer and survival
in men of different occupational classes. Eur J Epidemiol 2004;19:533-40.
13. Mackenbach JP, Huisman M, Andersen O, Bopp M, Borgan JK, Borrell C, Costa
G, Deboosere P, Donkin A, Gadeyne S, Minder C, Regidor E, et al. Inequalities in lung
cancer mortality by the educational level in 10 European populations. Eur J Cancer
2004;40:126-35.
14. Bray F, Sankila R, Ferlay J, Parkin DM. Estimates of cancer incidence and
mortality in Europe in 1995. Eur J Cancer 2002;38:99-166.
15. European Opinion Research Group EEIG. Health, food and alcohol and safety.
2003.
16. Sieri S, Agudo A, Kesse E, Klipstein-Grobusch K, San-Jose B, Welch AA, Krogh
V, Luben R, Allen N, Overvad K, Tjonneland A, Clavel-Chapelon F, et al. Patterns of alcohol
consumption in 10 European countries participating in the European Prospective Investigation
into Cancer and Nutrition (EPIC) project. Public Health Nutr 2002;5:1287-96.
17. Calmonte R, Galati-Petrecca M, Lieberherr R, Neuhaus M, Kahlmeier S. Santé et
comportement vis-à-vis de la santé en Suisse 1992-2002. [Health and health related
behaviours in Switzerland 1992-2002] Office Fédéral de la Statistique, 2005.
18. Boffetta P, Hashibe M. Alcohol and cancer. Lancet Oncol 2006;7:149-56.
19. Danaei G, Vander Hoorn S, Lopez AD, Murray CJ, Ezzati M. Causes of cancer in
the world: comparative risk assessment of nine behavioural and environmental risk factors.
Lancet 2005;366:1784-93.
20. Peto R, Lopez AD, Boreham J, Thun M, Heath C, Jr. Mortality from tobacco in
developed countries: indirect estimation from national vital statistics. Lancet 1992;339:1268-
78.
inse
rm-0
0225
142,
ver
sion
1 -
4 Se
p 20
09
19
21. Pamuk E. Social class inequality in mortality from 1921 to 1972 in England and
Wales. Popul Stud 1985;39:17-31.
22. Mackenbach JP, Kunst AE. Measuring the magnitude of socio-economic
inequalities in health: an overview of available measures illustrated with two examples from
Europe. Soc Sci Med 1997;44:757-71.
23. Brahimi M. La mortalité des étrangers en France. [Mortality of foreigners in
France] Population 1980;3:603-22.
24. Bouchardy C, Parkin DM, Khlat M. Cancer mortality among Chinese and South-
East Asian migrants in France. Int J Cancer 1994;58:638-43.
25. Bouchardy C, Wanner P, Parkin DM. Cancer mortality among sub-Saharan
African migrants in France. Cancer Causes Control 1995;6:539-44.
26. Bouchardy C, Parkin DM, Wanner P, Khlat M. Cancer mortality among north
African migrants in France. Int J Epidemiol 1996;25:5-13.
27. Percy C, Muir C. The international comparability of cancer mortality data. Results
of an international death certificate study. Am J Epidemiol 1989;129:934-46.
28. Jougla E, Pavillon G, Rossollin F, De Smedt M, Bonte J. Improvement of the
quality and comparability of causes-of-death statistics inside the European Community.
EUROSTAT Task Force on "causes of death statistics". Rev Epidemiol Sante Publique
1998;46:447-56.
29. Percy C, Ries LG, Van Holten VD. The accuracy of liver cancer as the underlying
cause of death on death certificates. Public Health Rep 1990;105:361-7.
30. Kunst AE, Groenhof F, Mackenbach JP, Health EW. Occupational class and cause
specific mortality in middle aged men in 11 European countries: comparison of population
based studies. EU Working Group on Socioeconomic Inequalities in Health. BMJ
1998;316:1636-42.
31. Huisman M, Kunst AE, Bopp M, Borgan JK, Borrell C, Costa G, Deboosere P,
Gadeyne S, Glickman M, Marinacci C, Minder C, Regidor E, et al. Educational inequalities in
cause-specific mortality in middle-aged and older men and women in eight western European
populations. Lancet 2005;365:493-500.
32. Schlecht NF, Pintos J, Kowalski LP, Franco EL. Effect of type of alcoholic
beverage on the risks of upper aerodigestive tract cancers in Brazil. Cancer Causes Control
2001;12:579-87.
33. Talamini R, Bosetti C, La Vecchia C, Dal Maso L, Levi F, Bidoli E, Negri E,
Pasche C, Vaccarella S, Barzan L, Franceschi S. Combined effect of tobacco and alcohol on
laryngeal cancer risk: a case-control study. Cancer Causes Control 2002;13:957-64.
34. Cavelaars AE, Kunst AE, Mackenbach JP. Socioeconomic differences in risk
factors for morbidity and mortality in the European Community: an international comparison.
Journal of Health Psychology 1997;2:353-72.
35. Le Laidier S. Quelques résultats sur les consommateurs de boissons alcooliques et
de tabac en France en 1980. [Results on alcohol drinkers and smokers in France in 1980]
SESI Informations rapides 1983;20.
36. Guignon N. Alcool et tabac [Alcohol and smoking]. in: Données sociales. ed.
Paris: INSEE, 1990:254-57.
37. De Vogli R, Gnesotto R, Goldstein M, Andersen R, Cornia GA. The lack of social
gradient of health behaviors and psychosocial factors in Northern Italy. Soz Praventivmed
2005;50:197-205.
38. Borrell C, Dominguez-Berjon F, Pasarin MI, Ferrando J, Rohlfs I, Nebot M. Social
inequalities in health related behaviours in Barcelona. J Epidemiol Community Health
2000;54:24-30.
inse
rm-0
0225
142,
ver
sion
1 -
4 Se
p 20
09
20
39. Romelsjo A, Lundberg M. The changes in the social class distribution of moderate
and high alcohol consumption and of alcohol-related disabilities over time in Stockholm
County and in Sweden. Addiction 1996;91:1307-23.
40. Strand BH, Steiro A. Alkoholbruk, inntekt og utdanning i Norge 1993-2000.
[Alcohol consumption, income and education in Norway, 1993-2000] Tidsskr Nor Laegeforen
2003;123:2849-53.
41. Faso B, Salvador A. Alcohol per capita consumption, patterns of drinking and
abstention worldwide after 1995. Eur Addict Res 2001;7:155-57.
42. Institut Scientifique de la Santé Publique. Enquête de santé par interview. [Health
survey] Belgique 2001, 2002.
43. Picheral H. Aspects régionaux de l'alcoolisme et de l'alcoolisation en France.
[Regional aspects of alcoholism and alcohol drinking in France] Paris: La Documentation
française, 1990.
44. Jougla E, Rican S, Péquignot F, Le Toullec A. La mortalité [Mortality]. In: Leclerc
A, Fassin D, Grandjean H, Kaminski M, Lang T. Les inégalités sociales de santé. Paris: La
Découverte, 2000:147-62.
45. Thomas London W, McGlynn K. Liver cancer. In: Schottenfeld D, Fraumeni JF,
Jr. Cancer epidemiology and prevention, Second edition. New York: Oxford University Press,
1996:772-93.
46. Bosetti C, Gallus S, Trichopoulou A, Talamini R, Franceschi S, Negri E, La
Vecchia C. Influence of the Mediterranean diet on the risk of cancers of the upper
aerodigestive tract. Cancer Epidemiol Biomarkers Prev 2003;12:1091-94.
47. Boffetta P, Kogevinas M, Westerholm P, Saracci R. Exposure to occupational
carcinogens and social class differences in cancer occurence. IARC Sci Publ 1997;138:331-
41.
48. Menvielle G, Luce D, Goldberg P, Leclerc A. Smoking, alcohol drinking,
occupational exposures and social inequalities in hypopharyngeal and laryngeal cancer. Int J
Epidemiol 2004;33:799-806.
49. Rosso S, Faggiano F, Zanetti R, Costa G. Social class and cancer survival in Turin,
Italy. J Epidemiol Community Health 1997;51:30-34.
50. Kogevinas M, Marmot MG, Fox AJ, Goldblatt PO. Socioeconomic differences in
cancer survival. J Epidemiol Community Health 1991;45:216-19.
51. Auvinen A, Karjalainen S, Pukkala E. Social class and cancer patient survival in
Finland. Am J Epidemiol 1995;142:1089-102.
52. Berrino F, Gatta G. Variation in survival of patients with head and neck cancer in
Europe by the site of origin of the tumours. Eur J Cancer 1998;34:2154-61.
53. Faivre J, Forman D, Esteve J, Obradovic M, Sant M. Survival of patients with
primary liver cancer, pancreatic cancer and biliary tract cancer in Europe. Eur J Cancer
1998;34:2184-90.
54. Faivre J, Forman D, Esteve J, Gatta G. Survival of patients with oesophageal and
gastric cancers in Europe. Eur J Cancer 1998;34:2167-75.
55. Janssen-Heijnen ML, Gatta G, Forman D, Capocaccia R, Coebergh JW. Variation
in survival of patients with lung cancer in Europe, 1985-1989. Eur J Cancer 1998;34:2191-96.
inse
rm-0
0225
142,
ver
sion
1 -
4 Se
p 20
09
21
Table 1: Descriptive information on the data sources
Population Follow-up period Number of person Educational level (%)
Date of census End of follow-up years at risk Lower secondary
or less
Upper
secondary
Post-secondary
Madrid May 1996 Dec 1997 1,756,059 64.1 17.4 18.5
Basque region May 1996 June 2001 2,985,865 65.6 20.1 14.3
Barcelona Jan 1992 Dec 2001 3,714,380 65.2 15.3 19.5
Turin Nov 1991 Oct 2001 2,611,968 67.2 22.2 10.6
France Mar 1990 Dec 1999 1,135,299 50.6 36.7 12.7
Switzerland (Latin) Dec 1990 Dec 2000 3,180,536 24.6 51.6 23.8
Switzerland (German) Dec 1990 Dec 2000 9,789,453 17.9 57.6 24.5
Belgium (Walloon) Mar 1991 Dec 1995 4,053,514 63.0 21.4 15.6
Belgium (Brussels) Mar 1991 Dec 1995 1,141,038 52.5 21.9 25.6
Belgium (Flemish) Mar 1991 Dec 1995 7,506,231 61.5 22.2 16.3
Norway Nov 1990 Nov 2000 10,021,675 29.9 48.4 21.7
Sweden Jan 1991 Dec 2000 21,421,623 40.3 43.3 16.4
Finland Dec 1990 Dec 2000 12,396,052 48.8 29.7 21.5
inse
rm-0
0225
142,
ver
sion
1 -
4 Se
p 20
09

22
Table 2: Mortality rates (MR) and relative indices of inequality (RII) with their 95% confidence intervals (CI) for all cancers and by cancer type,
per population
UADT cancers1 Liver cancer Lung cancer All cancers
Population N2 MR
3 RII (95% CI) N
2 MR
3 RII (95% CI) N
2 MR
3 RII (95% CI) N
2 MR
3 RII (95% CI)
Madrid 604 56 2.58 (1.71-3.89) 392 38 2.76 (1.61-4.74) 1,821 175 1.53 (1.22-1.92) 6,133 591 1.52 (1.34-1.72)
Basque region 1,519 59 2.04 (1.53-2.71) 543 22 1.16 (0.72-1.87) 3,133 125 1.31 (1.08-1.59) 11,737 473 1.29 (1.17-1.43)
Barcelona 1,974 52 3.12 (2.48-3.91) 1,357 37 1.56 (1.20-2.02) 6,254 169 1.80 (1.60-2.04) 20,253 553 1.57 (1.47-1.68)
Turin 735 33 3.61 (2.41-5.42) 742 36 2.49 (1.69-3.68) 3,895 179 2.53 (2.13-2.99) 11,294 532 1.88 (1.71-2.06)
France 816 78 4.30 (3.10-5.95) 361 36 2.59 (1.63-4.12) 1,462 147 1.64 (1.32-2.03) 5,375 555 1.89 (1.69-2.13)
Switzerland (Latin) 1,572 51 3.55 (2.92-4.31) 807 27 1.62 (1.24-2.10) 4,197 141 2.68 (2.38-3.01) 14,862 504 1.85 (1.73-1.96)
Switzerland (German) 2,893 32 3.99 (3.45-4.62) 1,281 15 1.49 (1.21-1.85) 10,681 123 2.96 (2.75-3.19) 38,817 452 1.80 (1.73-1.87)
Belgium (Walloon) 1,584 43 1.81 (1.44-2.29) 524 15 1.11 (0.74-1.66) 8,036 232 2.91 (2.58-3.28) 19,982 583 1.81 (1.69-1.95)
Belgium (Brussels) 429 47 1.48 (1.01-2.18) 132 15 1.65 (0.81-3.38) 1,590 175 2.97 (2.38-3.69) 4,788 529 1.82 (1.61-2.050
Belgium (Flemish) 2,262 34 1.87 (1.53-2.28) 557 9 0.98 (0.66-1.45) 13,446 214 3.14 (2.85-3.46) 33,990 544 1.79 (1.69-1.89)
Norway 1,861 21 2.27 (1.90-2.71) 384 4 1.00 (0.68-1.46) 9,211 107 2.45 (2.26-2.65) 38,722 449 1.45 (1.39-1.50)
Sweden 3,331 17 2.03 (1.77-2.33) 2,211 11 1.68 (1.42-1.98) 13,804 70 1.81 (1.69-1.93) 70,339 356 1.32 (1.28-1.35)
Finland 1,868 19 2.38 (1.94-2.94) 1,217 13 1.35 (1.05-1.73) 12,489 138 3.48 (3.18-3.81) 39,734 437 1.72 (1.64-1.80)
1: UADT: upper aerodigestive tract (oral cavity, pharynx, larynx, esophagus)
2: Number of cancer deaths
3: Age-standardized mortality rate using direct standardization, per 100,000 person years
inse
rm-0
0225
142,
ver
sion
1 -
4 Se
p 20
09
23
Table 3: Contribution (%) of different cancer sites to absolute socioeconomic inequalities in cancer mortality, per population
Population UADT cancer1 Liver cancer Lung cancer Other cancers
Madrid 19 15 29 37
Basque region 25 4 31 40
Barcelona 26 9 45 20
Turin 8 9 48 35
France 27 9 29 35
Switzerland (Latin) 21 2 45 32
Switzerland (German) 16 3 50 31
Belgium (Walloon) 8 1 65 26
Belgium (Brussels) 6 3 57 34
Belgium (Flemish) 5 0 69 26
Norway 10 0 56 34
Sweden 10 5 42 43
Finland 7 1 70 22
1: UADT: upper aerodigestive tract (oral cavity, pharynx, larynx, esophagus)
Note: These percentages quantify the proportion of rate difference in cancer site mortality divided by the rate difference in all cancers mortality.
inse
rm-0
0225
142,
ver
sion
1 -
4 Se
p 20
09

24
Graph 1: Alcohol related cancers mortality rates1 (per 100,000 person years) by education, per
population
U AD T cancers
0
20
40
60
80
100
Mad Bas Bar Tur Fra Sw i- l Sw i-g Bel-w Bel-br Bel- f Nor Sw e Fin
Po p u la tio n
Mo
rta
lity
ra
te
Low er s ec ondary or les s Upper s ec ondary Pos t-s ec ondary
L iver cancer
0
10
20
30
40
50
Mad Bas Bar Tur Fra Sw i- l Sw i-g Bel-w Bel-br Bel- f Nor Sw e Fin
Population
Mo
rta
lity
ra
te
Low er s ec ondary or les s Upper s ec ondary Pos t-s ec ondary
1: Age-standardized mortality rate using direct standardization, per 100,000 person years
Note: UADT cancers group cancers of oral cavity, pharynx, larynx and esophagus.
Swi-l and Swi-g correspond to the Latin part and the German part of Switzerland. Bel-w, Bel-br
and Bel-f correspond to the Walloon part of Belgium, Brussels and the Flemish part of Belgium.
inse
rm-0
0225
142,
ver
sion
1 -
4 Se
p 20
09
25
Graph 2: Absolute mortality rate1 difference
2 (per 100,000 person years) in all cancers mortality
according to specific cancers, per population
0
50
100
150
200
250
300
M ad Bas Bar Tur Fra Sw i-l Sw i-g Bel-w Bel-br Bel-f N or Swe Fin
Population
Mo
rta
lity
ra
te d
iffe
ren
ce
Lung
O ther
L iver
U AD T
1: Age-standardized mortality rate using direct standardization, per 100,000 person years
2: between the two extreme educational levels (men with lower secondary education or less and
men with post-secondary education)
Note: UADT= upper aero digestive tract (oral cavity, pharynx, larynx, esophagus)
Swi-l and Swi-g correspond to the Latin part and the German part of Switzerland. Bel-w, Bel-br
and Bel-f correspond to the Walloon part of Belgium, Brussels and the Flemish part of Belgium.
inse
rm-0
0225
142,
ver
sion
1 -
4 Se
p 20
09
26
Graph 3: Mortality rate1 difference (RD) (per 100,000 person years) for upper aero digestive
tract (UADT2) cancers and lung cancer, per population
0
10
20
30
40
50
60
70
80
0 20 40 60 80 100 120 140
RD for lung ca nce r
RD
fo
r U
AD
T c
an
ce
rs
Mad
Bas
Bar
Tur
Fra
Sw i- l
Sw i-g
Bel-w
Bel-br
Bel- f
Nor
Sw e
Fin
1: Age-standardized mortality rate using direct standardization, per 100,000 person years
2: UADT cancers group oral cavity, pharynx, larynx, and esophagus cancers.
Note: Swi-l and Swi-g correspond to the Latin part and the German part of Switzerland. Bel-w,
Bel-br and Bel-f correspond to the Walloon part of Belgium, Brussels and the Flemish part of
Belgium.
inse
rm-0
0225
142,
ver
sion
1 -
4 Se
p 20
09


